PDF Viewing archiving 300 dpi - Bitly
52
I ' :i ,1 I i t =·~ :=~ ·=~ :•:i (\~: :::; I ·=·~ J I
-
Upload
khangminh22 -
Category
Documents
-
view
0 -
download
0
Transcript of PDF Viewing archiving 300 dpi - Bitly

I ' :i ,1
I ~ ~ ~ ~ ~ ~ ~
i t =·~ :=~ ·=~ :•:i
(\~: ~~~
:::;
I ·=·~
J I

2
EUROPEAN GEOLOGIST is published by the
European Federation of Geologists C/o Service Geologique de Belgique
13, Rue Jenner B-1040 Bruxelles, Belgium
Tlf: +32 2 6270412 e-mail: [email protected]
web: www.eurogeologists.de
The board of EFG PRESIDENT
EurGeol Gareth Jones Conodate International Ltd. 7, Dundrum Business Park
Windy Arbour Dublin 14, Ireland
VICE-PRESIDENT Dr. Uros H erlec Dept. of Geology The University
Ljubljana, Slovenia Tel 00 3864 1256 633
Dept. fax. 00 386 14 704 560
SECRETARY-GENERAL EurGeol. Dr. Antoine Bouvier
1 rue Leon Migaux F-91341 Massy, France
tel: 00.33.1.39.54.07.49
TREASURER EurGeol. Dr. Carlo Enrico Bravi
Largo Ricl:lini, 8 20122 Milano, Italia
Tel: +39 02 58303527 Fax: +39 02 76007182
EU DELEGATE EurGeol Dr. Detlev Doherr Fachhochschule Offenburg
Badstr. 24 7.7652 Offenburg, Germany
fax 00.49: 781.205.333 fax 00.49 228.30 22 70 (BDG)
tel 00.49.781.205.281 e-mail: doherr@fh-offenburg.~e
EDITOR Maureen Mt Corry
e-mail: [email protected] ASSISTANT EDITORS
Antoine Bouvier Gilles Cuny
Isabel Fernandez Fuentes Steen Laursen
Printed by Tiskarna Koper
Graficno podjetje d.o.o. Ulica 15, Maja 19
6000 Koper, Slovenia Fax: 386 5 6631177
ISSN: 1028 - 267X
Foreword
Moving Onwards
by Gareth LI Jones President
For many years, most delegates from the national associations belonging to the Federation have recognised, argued and insisted that we should have an office in Brussels. Obviously this is so that we can more easily influence the European Union / Parliament/ Commission with regard to geological matters.
Up until now we have been based in our Paris office where the Union Fran9ais des Geologues kindly hosted us at a reduced rental. We continue to be grateful to them, and to Jean-Claude Vidal, for looking after us during this period. From that base we made isolated visits to Brussels to make presentations to the Parliament and to offices of Directorgenerates.
We also made extensive efforts to try to find a small serviced office in Brussels that we could use, but found that they were all beyond our financial means. In spite of this, during the last couple of years we have held our Board Meetings and our winter working meetings in Brussels. This has only been possible through the kind endeavours of EurGeol. Eric Groessens who arranged rooms forus in the Geological Survey of Belgium and in the National History Museum. Now, through the Union Belgo-Luxembourgeoise des Geologues we have been offered office space in the Geological Survey and we took possession of this in September this year.
In 2000 we contracted Dra. Isabel F emandez to undertake some research for us and this year we appointed her as the EFG 's Agency Chief in Brussels. Already she has made contacts for us and also helped us to present our views on the future regime for professional recogni ti{)n within the EU to the European Commis-
sion (Internal Market), where we have highlighted the importance of geology to society, the necessity to ensure that the profession is practised to the highest standard, and the need for an "international technical passport" to ensure mobility both within the EU and elsewhere.
Another benefit ofbeing based in Brussels is that we can more easily liase with other geological and professional European bodies. So where appropriate we hope that we can support each other.
Other changes taking place include:
* The replacement of our EU Delegate on the Board, EurGeol. Marianne Vasard Nielsen, Denmark by EurGeol. Detlev Doherr, Germany. Marianne started most of the work now being carried out with the EC and we sincerely thank her for this. I
* EurGeol. Eric Groessens, Belgium retires after two terms as Chair of the Registration Committee and is replaced by EurGeol. Richard Fox, UK. We also thank Eric for his hard work on the Committee.
We hope to have our new office functioning fully in the New Year, the access details are:
European Federation of Geologists
c/o Service Geologique Belgique
13 rue Jenner
1040 Brussels
tel 00.32.2.627 0412
email: [email protected]
EurGeol. Gareth LI. Jones PGeo President

I f;
f I
Table of Contents Modelling of Geomagnetic Field Moves Into a New Era Sustainable Mineral Resource Management in Karst Areas World Geologists When Geology Performs EFG Finance Progress Report Cartographic Visualisation Roasted Alive In The Carboniferous Introduction to CPD CPD and the Institute of Geologists of Ireland Book Review: The Map that Changed the World Book Review: The Dinosaur Hunters EurGeols 2001 A Review of a Proposed CPD Program for Certification of Professional Geologists in the 21st Century Public Reporting by Canadian Resource Companies EFG Council Meeting in Krakow June 2001 New and Oriented Core Evaluation Method: IMAGED Will Nisyros Volcano (GR) Become Active? Copyright 2001 The European Federaton of Geologists
4 8
12 14 17 18 23 26 27 30 31 32
36 38 39 40 44
All rights reserved. No reproduction, copy or transmission of this publication may be made without written permission. No responsibility is assumed
by the Publisher for any injury and/or damage to persons or property as a matter of products liability, negligence, or otherwise, or ftom any use or
operation of any methods, products, instructions or ideas contained in the material herein. Although all advertising material is expected to conform
to ethical (medical) standards, inclusion in this publication does not constitute a guarantee or endorsement of the quality or value of such product
or of the claims made by its manufacturer.
3
~:: r :::-
ii: c-: ( ;;:
iii i:: ii
!l

Modelling of Geomagnetic Field Moves Into a New Era
Data from two current satellite missions in low-Earth orbit, 0rsted and CHAMP, are providing a detailed picture of the Earth's internal magnetic field. The field models made from these measurements can be used in several ways to tell us about the Earth's interior. The long wavelength field can be used to make models of the magnetic field at the core-mantle boundary, the top of the geodynamo. These models can be used to map fluid flow at the top of the core, in turn a useful constraint for other studies. Field wavelengths less than 3000km probe the magnetic field of the lithosphere. Although the interpretation of this component of the field is difficult, it has potential to provide great insight into continental scale tectonic structure and processes. New satellite missions are planned which will further improve our understanding of the geomagnetic field.
4
Richard Holme is at GeoForschnugsZentrum Potsdam, Telegrafenberg, 14469 Potsdam, Germany. E-mail: [email protected]
Nils Olsen thanks Danish Space Research Institute, Juliane Maries Vej 30, DK-2100 Copenhagen 0, Denmark.
Richard Holme and Nils Olsen are responsible for field modelling for the CHAMP and 0rsted projects respectively.
by Richard Holme and Nils Olsen
Les donnees provenant de deux missions basse-orbite en cours, 0rsted et CHAMP, offrent une image detaillee du champ magnetique interne de la terre. Les modeles emanant de ces mesures peuvent etre utilises de diverses manieres pour interpreter l'interieur de la Terre. Les mesures de grandes longueurs d'ondes peuvent etre utilisees pour calculer des modeles du champ magnetique a la limite manteau-noyau, c'est-a-dire au sommet de la dynamo geomagnetique. Ces modeles peuvent etre utilises pour cartographier les mouvements de fluides au sommet du noyau, ce qui represente une contrainte interessante pour differents types d'etudes. Les mesures d'une longueur d'onde inferieur a 3000 km sonde le champ magnetique de la lithosphere . Bien que !'interpretation de cette composante du champ magnetique est difficile, ii possede un potentiel tres interessant pour comprendre les structures et processus tectoniques a l'echelle continentale. De nouvelles missions satellites sont prevues qui permettront une meilleure comprehension du champ geomagnetique terrestre.
The study of the Earth's geomagnetic field has a long history, arguably boasting the first truly modem scientific study (William Gilbert's De Magnete, published in 1600). The basic theory (that the magnetic field is a potential field) and methods of modelling were worked out by Gauss in the 1830s, and a considerable array of permanent observing stations, magnetic observatories, has been developed over the years. Over 100 stations are active, many with continuous or almost continu- ·
Datos procedentes de dos misiones de seguimiento en la orbita baja de la Tierra, Orsted y CHAMP dan una imagen detallada del campo magnetico interno de la Tierra. Los modelos de campo obtenidos con estas medidas pueden ser usados en distintos maneras para hablarnos del interior de la Tierra. La alta longitud de onda puede ser usada para obtener modelos de campo magnetico en el limite nucleo-manto, de interes en geodinamico. Estos modelos pueden ser usados como mapas de Hneas de flujo desde la superficie del nucleo, que a su vez es de interes para otros estudios. La baja longitud de onda de campo magnetico investiga por debajo de 3000 km que corresponde a la litosfera. Aunque la interpretaci6n de este componente en el campo es diffcil, tiene un alto potencial dentro de la teut6nica a escala continental y procesos. Son planificadas nuevas misiones por satelite que continuaran a mejorar nuestro conocimiento sabre el campo geomagnetico.
ous records over a century in duration. They provide a unique data set for deriving geomagnetic models and mathematical descriptions ( expansions of the magnetic potential into series of spherical harmonics) of the observations. A study of the geomagnetic field relies heavily on such models, and therefore their determination is a key research area. However, this determination has been hampered by data limitations, in particular large gaps in data coverage. While much can be done

with land surveys and shipboard measurements, a truly global data distribution only became possible with the advent of the satellite era. Early satellite missions measured only the magnetic field strength and not its direction. Unfortunately, the results from these missions were not encouraging, as the models produced from satellite data bore little resemblance to the field observed at ground level. The problem turned out to be that, unlike for the gravity field, or the magnetic field in a small regional survey, field intensity data alone is not enough to obtain a good field model. The direction of the field must also be measured. This was first achieved by the NASA Magsat satellite, which returned approximately six months of good data in 1979/1980. This data also
+O.lmT I I I I ! [: dlllllll4
Figure 1. The Danish 0rsted satellite launched in 1999.
stimulated great interest in magnetic field studies, leading to important studies of historical data.
New satellites launched Unfortunately, after this mission, no new data were forthcoming for some years. However, towards the end of the 1990's, several projects came to fruition. The first is the Danish 0rsted satellite. This was launched on 23rd February 1999, and has been returning high-quality data ever since. The satellite is shown in Figure 1. It is small, weighing 62kg, and measuring 34x43x72cm. It was placed in an orbit of radius 700-800km. An obvious feature is the 8m long boom, unfurled in orbit, on which the magnetometers are mounted. This minimises the influence of the magnetic field generated by the spacecraft itself. The second project is the German CHAMP satellite, launched on July 15th, 2000, and shown (being made ready for launch!) on next page. CHAMP is rather larger than 0rsted, with a weight of522kg, and a size of 4.3xl.6x0.75m. This greater size and its aerodynamic shape were chosen to allow the satellite to fly in a lower orbit ( 450km) for a longer time (the projected mission duration is 5 years). Again, the magnetometers are mounted on a boom ( seen folded over prior to launch in the picture). The satellites are positioned using GPS, and their pointing direction, necessary for measuring the direction of the magnetic field, is given by star imag-
Figure 2: Surface magnetic field, radial component, epoch 2001.
-0.lml
ers, one on 0rsted and four on CHAMP. Both satellites have multiple scientific objectives - CHAMP in particular was designed to measure the gravitational field as well as the geomagnetic field - but in this article we concentrate on the information they have provided about the internal magnetic field of the Earth.
Modelling the surface magnetic field Potential theory tells us that, if there are no sources of magnetic field between the satellite and the surface of the planet, we can use the measurements of the magnetic field to construct a map of the large scale surface magnetic field (wavelengths greater than order 1000km). In Figure 2, we show such a model of the Earth's surface field, calculated using data from the two satellites. Unfortunately, the same potential theory that allows us to generate this map also tells us that formally we can say little more about the origin of the field. All we can say for sure is that it originates within the Earth, but where in the Earth cannot be distinguished. However, by looking at the structure of the field - and making assumptions about its sources - we are able to make further inferences. Figure 3 shows a spectrum of the field, calculated from a detailed model using all the data from 0rsted . We have plotted the mean square field atthe Earth's surface as a function of the wavenumber of the field. It is clear that this spectrum has two parts, first a rapidly declining part down to wavelengths of approximately 3000km, with a much more gentle decline at shorter wavelengths. We use the slope of the different sections in this spectrum to interpret the depth to the sdurce of the field. The long-wavelength spectrum is consistent with a source at the do re-mantle boundary (CMB), located at a
1010
""
to'
10 27.000
Wavenumber,spherica1 harmonic degree
5 9 13 17
7,300 4200
Wavelength,km
3.000 2300
Figure 3: Magnetic field spectrum. The two parts of the spectrum are thought to be dominated by field sources in the Earth 's core and lithosphere respectively.
5
6
.,. ---/~;-··-. 1 · -:.;-;:~-~ .. .. ~- .. ··,t·· ,.,...,..."'<~of-"-,~
• ,, II.'" /• • -1~ .. .,. .. .., II.'" ~ .... ,c.1(...ti.,;
1- ... - .;,-.. : . • • . .. ...... .., " . .. -1, . ...,....,. ➔ "
._.,_ +- ..... -1~ ...... ., .... .. l .. ~ . ; " .. ➔ ...,.. ")I....,, .... ,. t II. ....
+- +- ... +- ......... '" f- f.. ... ~ . • ' . • ...... " • . . " '>I ..,. .... JI ... ..,.
+- +- ,.,. .. .._ +- +- +- I +-+-:+- '1 "' . . . .. .... ,. . • .._ +- ,,. • .. -,. ..... ..
~-+-4-+-~-+- - ---------~--- ➔-➔ .. ---+-
k-+-+-:-+-\~,.._~.,_ f.. ............ ,., ........ ~ ............. ➔ ..... ..
..,... ~+:+-\-...-.-+- ,._ ,c. ... t-"4-f..,..f,... .... +- f- .... --; .. . . , .......... ...
...- y+-+-+-+- f- "'- f-.lr"'""f-4'-h+-f- f-"' • • • •,..,•.~,rt"._.
........... ,-+-t(-t-'+- ... f.--t'-."-~ 1,. ......... .,..,~,.,.
- - • •• .. .,. ..... - .. • of -:r-.,. . ~/(',It!' ,... ➔
. ··1e--.\;~ ..... ;t r /,,-{f-;:; ~-::-~·"' 20km/year
-16 -14 ·12 -10 -8 -6 .4 -2 0 2 4 6 8 10 12 14 16
scalar anomaly [nT]
~ ~ ~ ~ ~ ~ ~ 0 1 2 3 4 5 6 Depth /Height in km
Figure 4: Magnetic field at the core-mantle bounda,y, radial component, epoch 2001.
Figure 5: Model of core flow, epoch 2001.
Figure 6: CHAMP scalar magnetic anomaly field map (courtesy ofStefan Maus, GFZPotsdam, Germany).
Figure 7: Effect of high and low bandpassing on a topographic map. The magnetic field anomaly map is even more difficult to . interpret!
The study of the Earth's geomagnetic field has a long history, arguably boasting the first truly modern scientific study (William Gilbert's De Magnete, published in I 600). The basic theory ( that the magnetic field is a potential field) and methods of modelling were worked out by Gauss in the I 830s, and a considerable array of permanent observing stations, magnetic observatories, has been developed over the years. Over I 00 stations are active, many with continuous or almost continuous records over a century in duration . They provide a unique data set for deriving geomagnetic models and mathematical descriptions ( expansions of the magnetic potential into series of spherical harmonics) of the observations. A study of the geomagnetic field relies heavily on such models, and therefore their determination is a key research area. However, this determination has been hampered by data limitations, in particular large gaps in data coverage. While much can be done with land surveys and shipboard measurements, a truly global data distribution only became possible with the advent of the satellite era. Early satellite missions measured only the magnetic field strength and not its direction. Unfortunately, the results from these missions were not encouraging, as the models produced from satellite data bore little resemblance to the field observed at ground level. The problem turned out to be that, unlike for the gravity field, or the magnetic field in a small regional survey, field intensity data alone is not enough to obtain a good field model. The direction of the field must also be measured. This w7s first achieved by the NASA Magsat satellite, which returned approximately six months of good data in 1979/1980. This data also stimulated great interest in magnetic field studies, leading to important studies of historical data.
New satellites launched Unfortunately, after this mission, no new data were forthcoming for some years. However, towards the end of the I 990's, several projects came to fruition. The first is the Danish 0rsted satellite. This was launched on 23rd February 1999, and has been returning high-quality data ever since. The satellite is shown in Figure I. It is small, weighing 62kg, and measuring 34x43x72cm. It was placed in an orbit of radius 700-800km. An obvious feature is the 8m long boom, unfurled in orbit, on which the magnetometers are mounted.

Figure 8. CHAMP satellite being prepared for transportation to launch site. (Picture courtesy R. Bock, GFZ Potsdam, Germany).
This minimises the influence of the magnetic field generated by the spacecraft itself. The second project is the German CHAMP satellite, launched on July 15th, 2000, and shown (being made ready for launch!) on next page. CHAMP is rather larger than 0rsted, with a weight of 522kg, and a size of 4.3x 1.6x0. 75m. This greater size and its aerodynamic shape were chosen to allow the satellite ·to fly in a lower orbit ( 450km) for a longer time (the projected mission duration is 5 years). Again, the magnetometers are mounted on a boom (seen folded overpriorto launch in the picture). The satellites are positioned using GPS, and their pointing direction, necessary for measuring the direction of the magnetic field, is given by star imagers, one on 0rsted and four on CHAMP. Both satellites have multiple scientific objectives - CHAMP in particular was designed to measure the gravitational field as well as the geomagnetic field - but in this article we concentrate on the information they have provided about the internal magnetic field of the Earth.
Modelling the surface magnetic field Potential theory tells us that, if there are no sources of magnetic field between the satellite and the surface of the planet, we can use the measurements of the magnetic field to construct a map of the large scale surface magnetic field (wavelengths greater than order 1000km). In Figure
2, we show such a model of the Earth's surface field, calculated using data from the two satellites. Unfortunately, the same potential theory that allows us to generate this map also tells us that formally we can say little more about the origin of the field. All we can say for sure is that it originates within the Earth, but where in the Earth cannot be distinguished. However, by looking at the structure of the field - and making assumptions about its sources - we are able to make further inferences. Figure 3 shows a spectrum of the field, calculated from a detailed model using all the data from 0rsted . We have plotted the mean square field at the Earth's surface as a function of the wavenumber of the field. It is clear that this spectrum has two parts, first a rapidly declining part down to wavelengths of approximately 3000km, with a much more gentle decline at shorter wavelengths. We use the slope of the different se.etions in this spectrum to interpret the·B:~pth to the source of the field. The long-wavelength spectrum is consistent with a source at the coremantle boundary (CMB), located at a depth of 2900km. The CMB is the top of the accepted region of generation of the Earth's field - a hydromagnetic dynamo in the electrically conductive, liquid iron Earth's outer core. The spectrum at shorter wavelengths is consistent with much shallower sources, within the Earth's lithosphere - a combination offield induced by
the core main field, and remnant magnetism from rocks that have cooled in the past, and have "frozen in" the ambient field at the time of their formation.
Using the magnetic field data With these assumptions, we use the geomagnetic field to probe the structure and dynamics of the Earth. Figure 4 shows a map of the long-wavelength field extrapolated to the CMB, on the assumption that the surface field with a wavelength longer than 3000 km is dominated by this source. The Earth's continents are su1-1erimposed to provide a geographical reference. Compared with the map of the field at the Earth's surface (Figure 2), the field is much stronger ( compare the different scales), and the detailed field structure becomes clear; at the Earth's surface, shorter wavelengths are attenuated by distance from the source. The map we produce is similar to maps produced previously (in particular using Magsat for 1980, but also using historical data for ear
Web sites for further information:
0rsted:http :/ /web.dmi.dk/fsweb/ projects/oersted/
CHAMP:http://op.gfz-potsdam.de/ champ/
7

Sustainable Mineral Resource Management in Karst Areas
Report on NATO Advanced Research Workshop
by Deborah J Shields and Slavko V. Solar
Society depends upon the services provided by mineral resources, and yet mineral extraction is often seen only as an unwelcome industry that causes environmental damage and negative social impact, especially on more sensitive areas, such as karst. The sustainable development paradigm provides a framework addressing problems that are characterized by interaction among biophysical and socio-economic systems. Therefore the workshop dealt with a wide range of science issues: (a) geologic, hydrogeologic and environmental karst features, (b) · mining and mineral resources management,- and ( c) economic and social dimensions of those activities. The four working-day workshop, with 47 attendees from all over the world, was sponsored by NATO and also supported by other national and international organizations and companies.
This NATO Advanced Research Workshop (ARW) was an outgrowth of a preceding NATO Advanced Study Institute (ASI), "Deposit and Geoenvironmental
8
Deborah J. Shields, USDA Forest ·Service -Research and Development, Rocky Mountain Research Station, USA. E mail: [email protected], [email protected]
Slavko V. Solar, contact author, Geological Survey of Slovenia, Slovenia. Email: [email protected]
Les societes dependent des services fournies par les ressources minerales, et pourtant !'extraction de ces ressources est souvent per~ue comme une deplaisante industrie qui cause des dommages a l'environnement et a un impact negatif sur la societe, surtout dans les zones sensibles, comme les karsts. Le paradigme du developpement durable offre un cadre dans lequel les problemes sont traites comme une interaction entre des systemes biophysiques et socio-economiques. Des lors, cette reunion de travail aborde un large eventail de problemes scientifiques:a) caracteres geologiques, hydrogeologiques et environnmentaux des karsts, b) gestion des activites minieres et des ressources minerales, et c) Dimension economique et sociale de ces activites. Cette reunion de travail de quatre jours, avec 47 participants venus du monde entier, a ete sponsorisee par l'OTAN, ainsi que d'autres organisations, nationales et internationales, et des compagnies privees.
Models for Resource Exploitation and Environmental Security," which was held in Matrahaza, Hungary, in Sept. 1998. The ASI Working Group on Resource Policy identified the need to extend the paradigm of sustainable development to the management of earth resources. The NATO Member Country and Partner Country heads of that Working Group (D. Shields (USA) and S. Solar (Slovenia)) undertook the organization of an ARW on the selected topic. They were joined on the Organizing Committee by Andrea Fabbri (Netherlands, Co-Director of the preceding ASI), Vyda Elena Gasiuniene (Lithua-
Las sociedades dependen de los servicios obtenidos de los recursos minerales, y a pesar de eso la extracci6n mineral es a menudo vista como una industria no bienvenida que causa dafios medio ambientales e impacto social negativo, especialmente en las areas mas sensibles, como por ejemplo las carsticas. El paradigma del desarrollo sostenible provee de problemas marco que caracterizados por una interacci6n entre sistemas biofisicos y sistemas socio-econ6micos. Por esta raz6n, en el seminario se abordo un gran espectro de aspectos cientfficos: (a) geol6gico, hidrogeol6gico y factores carsticos ambientales, (b) minerfa y administraci6n de recursos mineros, y (c) dimensiones econ6micas y sociales de estas actividades. Los cuatro dfas de trabajo del seminario, con 47 ponencias proce8entes de todo el mundo, fueron patrocinadas per la OTAN y tambien apoyadas por otras organizaciones nacionales e internacionales asf como empresas.

nia) and Sergio Olivero (Italy), both participants in the ASI, and Dragomir Skaberne (Slovenia).
The main objectives of the Advanced Research Workshop were to:
• Review the state of science with respect to the biophysical, geo-technical, economic, institutional and social aspects of extraction in karst areas;
• Investigate the applicability of sustainable development principles to mineral resource management in karst areas at multiple scales;
• Identify relevant research needs;
• Foster international cooperation.
The specific science areas to be addressed were:
• Geologic, hydrogeologic and environmental features ofkarst systems;
• Mining and mineral resource management in karst systems; and
• Economic and social dimensions of mining in karst systems.
Keynote speakers, participants and observers came from NATO countries: (Canada, Czech Republic, Greece, Hungary, Italy, Netherlands, Poland, Spain, Turkey, United Kingdom, United States), NATO partner countries (Albania, Croatia, Estonia, Lithuarµa, Russia, Slovak Republic, Slovenia, the former Yugoslav Republic of Macedonia and Ukraine) and 3 other countries (Australia, Bosnia and Herzegovina, and PR China). All together there were 47 attendees.
Committee members utilized their personal experience and professional contacts to identify leading scientists inARW research areas. Those individuals were personally invited to participate in the workshop. In addition, the ARW was widely publicized and other interested scientists were invited to submit applications.
As noted above, the main sponsor of the ARW was the NATO Science Programme. Major support was also provided by the United States Forest Service and the Geological Survey of Slovenia. The following organizations provided additional support and publicity: the United Nations Environmental Pro-
Active limestone aggregate quarry Crni Kal-Crnotice in the Karst region of Slovenia.
gramme (UNEP), the United Nations Educational Scientific and Cultural Organization Division of Earth Sciences (UNESCO), the World Conservation Union (IUCN), and the Slovenian Ministries for Science and Technology, Economic Affairs, Foreign Affairs, and Environment and Spatial Planning. Support was also provided by the Slovenian Chamber of Commerce and Industry and a few Slovenian companies.
Scientific programme The Scientific Programme comprised keynote science presentations, roundtable discussions, and three concurrent, discipline-specific working groups. Cross-discipline synthesis was discussed in Roundtable sessions. Working groups were asked to identify and prioritize open scientific issues in their discipline, recommend potential approaches for addressing these issues, and identify further steps, including future cooperation. Working group sessions also included time for additional participant contributions. In total there were 19 keynote science presentations (30 minutes long) and 18 participants' contributions (10 minutes), covering the topics/themes of the workshop.
The karst cave Skocijanske jame (UNESCO World Heritage site) with workshop participants.
The meeting began with a Welcoming Reception at which self-introductions and a discussion of participants' expectations took place. The next morning Opening Addresses and formal Welcomes were made in Plenary Session by the then incumbent Slovenian State Secretary for Science and State Secretary for Space and Waters, the ARW Co-Director (D. Shields) on behalf of the NATO Science Programme, and the Director of the Geological Survey of Slovenia (B. Ogorelec). The first Working Session followed the Opening Plenary Session. Topics relevant to the ARW were introduced: Sustainable development, mineral resources, mining, and karst systems.
The second Working Session took place during the morning of the second day and focussed on karst system features. In the afternoon, participants were taken on a half-day technical field trip:. Karst -Environment and Society. The purpose of the trip was to create a common understanding of science in k1mt among the representatives of the diverse disciplines present at tlJe ARW. Participants were taken by bus to: a) an active limestone aggregate quarry in the karst region of Slovenia (for an overview
9

of mining in karst); b) the karst cave Skocijanske jame - a UNESCO World Heritage Site (to observe the results of karst-water interactions in cave systems and to learn about the natural heritage aspects ofkarst); and c) the Idrija Mercury Museum Mine (to learn about the localscale cultural and social aspects of mining and mine closure). During travel time presentations were made on the geology, and the environmental and social characteristics of the karst region. Technical presentations and guided tours were provided at each stop by local experts. The day ended with a dinner of typical Slovenian foods, a concert of traditional songs, and displays oflocallymade lace.
The third Working Session focused on mining, Science presentations were supplemented by roundtable discussions and concurrent working group sessions. The final working day started with science presentations on economics and mineral policy. Much of the rest of the day was dedicated to on-going concurrent sessions. Working groups completed their assigned tasks and presented their conclusions during the final Plenary Session. The technical part of the ARW ended with a Summary of Accomplishments by the Co-Directors and final thoughts from each participant. A Closing Banquet was held that evening, during which each individual contribution was recognized.
Scientific content The purpose of this ARW was to bring together experts in a variety of fields to review the state of science with respect to the geo-technical, environmental, social, and economic aspects of karst processes and extraction in karst areas, to identify gaps in knowledge, and determine how science can support sustainable resource management in karst areas.
Because of the multi-disciplinary nature of the conference, it was necessary to provide an initial common basis of understanding. Therefore, the ARW started with introductory lectures on sus-
. tainable development principles, karst features and systems and mining-related issues. Workshop part1c1pants then focused on the state of science in three specific areas: I - Karst System Features (geology and hydrogeology), II - Sustainable Mining in Karst (mine design, management, environmental impacts, and reclamation), and III - Creating a Framework for Sustainable Development in Karst
10
Areas (sustainable economic and resource management policies). Examples from all over the world (Europe, Asia, the Pacific area, and North America) were presented.
Applying Sustainable Development Principles to Karst Systems Karst, originally a Slovenian word, denominates an area with water-soluble, mostly-carbonate rocks, and specific settings, landforms and hydrogeology. Karst areas can be found in all climate types and this reality, combined with karst's geological features, results in an enormous variety oflandscapes, hydrology, land use and grades of human impact. Karst areas are important sources ofboth minerals and water, but in many countries the character and functioning of karst systems are being altered due to the impacts of quarrying, ground water removal, settlement, agriculture, etc. The incidences of sinkhole creation, ground water resource losses, and ground water pollution due to hazardous waste disposal in active karst areas are increasing. To date it has been difficult to identify appropriate and publicly acceptable resource management policies, due to the multi-disciplinary nature of the problem. The sustainable development (SD) paradigm offers an effective framework for addressing these issues in a comprehensive manner.
The fundamental principles of SD are: economic prosperity, environmental integrity, and social equity. SD requires that economic, environmental and social issues be integrated in decision-making. In all decisions, the long-term effects on resources and capital, as well as the capacity for future creation of benefits, should be considered. Decision-making should be broad, participatory, and also interdisciplinary. Thus, commitment to SD principles necessitates integration ofresource management, environmental policies and development strategies so as to satisfy current and future human needs, improve the quality of life, and protect resources. Accomplishing the goals of SD will require public policies with sound scientific basis.
I Karst System Features Keynote speakers used case studies to
illustrate the relationships between human exploitation ofkarst, the auto-depuration of the karst aquifer capacity, and pollution in karst water systems. Other case. studies illustrated the result of excessive
human water extraction, karst acceleration, which in tum causes additional environmental damage (sinkholes and more agricultural pollution). It was agreed that the basic geologic and hydrogeologic conditions in karst systems are similar, suggesting that fundamental lessons learned in one area can be applied in others. Conversely, each karst system has unique features, and natural processes functioning in one area may not be present in others. While it is not appropriate to apply the details of one specific karst system to others, existing environmental indicators for karst can be adapted to most systems. International efforts should focus on what is similar and where differences could be significant. The group identified the following research need: More complete numerical ground water flow models for karst systems.
II Sustainable Mining in Karst Systems Mining or quarrying has the potential to cause immense damage to karst; therefore, it was agreed that methods are needed to facilitate exploitation while simultaneously protecting the natural heritage ofkarst areas. Management based on sound principles will be crucial to mitigating negative impacts, as well as optimizing economic benefits. Many useful tools have been developed to serve this purpose, including models of environmental systems and models that connect multiple systems (such as economic, social, technological). For example, hierarchical systems analysis (HSA) has been designed to characterize environmental system components, identify impacts on those systems and evaluate the extent of tiose systems. Spatial prediction modelling can be use to demonstrate the relations between exploration, development, environmental impacts and sustainability. Landform Replication can be used in reclamation efforts to assure that the post-mining landform-vegetation assemblages resemble natural areas in the vicinity of the quarry. There was agreement that mining in karst should follow Best Environmental Practices and that corporate management tools such as ISO 9000 and 14001 could support this effort. However, it was also agreed that some tools ( e.g., computerbased expert systems for karst management), data (e.g., interferometry and satellite), and standards ( e.g., international standards of best practice) are missing. Further, it will be necessary to develop methods to quantify the risk associated

Active natural stone quarry lipica II in the karst region of Slovenia.
with alternative management actions and find a way to communicate that information to the public. Finally, a coherent system to integrate available tools is badly needed, as is a way to share this information.
III Framework for Sustainable Development in Karst Areas As with karst systems, the social and political systems of the countries where karst is found have much in common, but each country has its own legal system and culture. This suggests the existence of a rich diversity of potential solutions to resource management issues in karst areas. The details of one country's sustainable resource management plan may not apply in other countries, but there are general concepts that can be applied broadly. It was agreed that information sharing and multi-stakeholder participation would be essential components of a successful management plan. The former requirement implies a need for indicators of social, economic, environmental and karst system conditions. The indicator set will need to be science-based, believable and acceptable to both decision makers and the public. For example, it is possible to develop monetary measures of
environmental values for use in the evaluation of anthropogenic impacts in karst. Given that resources are limited and populations continue to expand, there is a need for tools to support analysis of"tradeoffs" between utilizing karst to fulfill human needs (water, food, minerals) and protecting fragile karst systems. Further, participants identified a need for more detailed social assessments of communities in karst areas.
Recommendations Reviewing the state of science with respect to karst areas led the participants to several final conclusions. First, neither mineral demand, water use nor human activities in or near karst areas will decrease in the ~reseeable future. As a result, anthropofenic impacts on karst are expected to intensify. Second, although more needs to be learned about karst systems as noted above, the state of science is such that the management of karst could be greatly improved. Third, if negative human impacts are to be reduced, a multidisciplinary approach will be needed. Fourth, participants agreed that an effective approach would be based on the principles ofSD, a paradigm accepted by societies, governments and industries wmld-
wide. Finally, science can contribute to this process by communicating current and emerging knowledge and understanding to all segments of society, including policy and decision makers, stakeholders, and mineral resource professionals. One aspect of their contribution should be the development of valid, relevant, unbiased, science-based indicators of sustainability.
Suggestions for worksho~ follow-up included: a) production of a CD-ROM containing the abstracts, Pow6rPoint presentations, short versions of some papers, concurrent sessions group reports, photographs and other workshop materials; b) a book on workshop topics, which should be designed as a text on managing mining in karst; c) further networking among participants; d) a multi-discipline case study on social preferences with respect to mineral extraction in karst and sustainable development; and e) organization of a similar event focused on sustainable karst water management.
11
!lll
1111 ❖:
ii
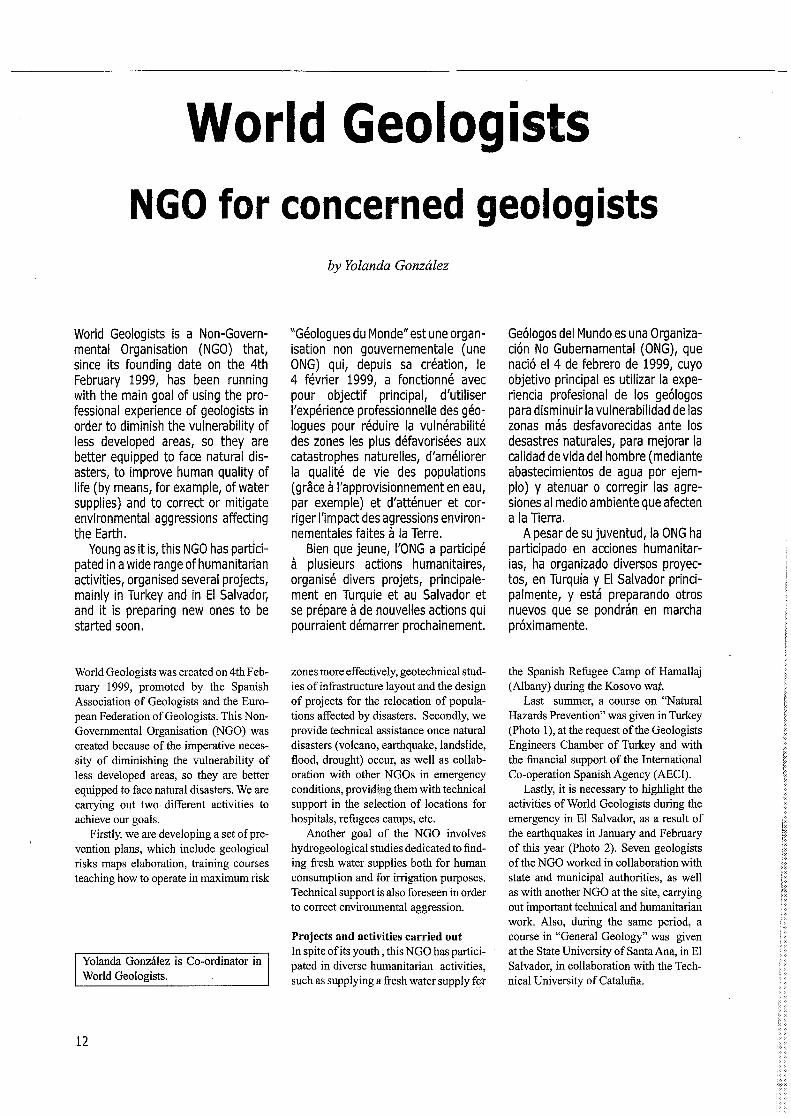
World Geologists NGO for concerned geologists
World Geologists is a Non-Governmental Organisation (NGO) that, since its founding date on the 4th February 1999, has been running with the main goal of using the professional experience of geologists in order to diminish the vulnerability of less developed areas, so they are better equipped to face natural disasters, to improve human quality of life (by means, for example, of water supplies) and to correct or mitigate environmental aggressions affecting the Earth.
Young as it is, this NGO has participated in a wide range of humanitarian activities, organised several projects, mainly in Turkey and in El Salvador, and it is preparing new ones to be started soon.
World Geologists was created on 4th February 1999, promoted by the Spanish Association of Geologists and the European Federation of Geologists. This NonGovernmental Organisation (NGO) was created because of the imperative necessity of diminishing the vulnerability of less developed areas, so they are better equipped to face natural disasters. We are carrying out two different activities to achieve our goals.
Firstly, we are developing a set of prevention plans, which include geological risks maps elaboration, training courses teaching how to operate in maximum risk
Yolanda Gonzalez is Co-ordinator in World Geologists.
12
by Yolanda Gonzalez
"Geologues du Monde" est une organisation non gouvernementale (une ONG) qui, depuis sa creation, le 4 fevrier 1999, a fonctionne avec pour objectif principal, d'utiliser !'experience professionnelle des geologues pour reduire la vulnerabilite des zones les plus defavorisees aux catastrophes naturelles, d'ameliorer la qualite de vie des populations (grace a l'approvisionnement en eau, par exemple) et d'attenuer et corriger !'impact des agressions environnementales faites a la Terre.
Bien que jeune, l'ONG a participe a plusieurs actions humanitaires, organise divers projets, principalement en Turquie et au Salvador et se prepare a de nouvelles actions qui pourraient demarrer prochainement.
zones more effectively, geotechnical studies of infrastructure layout and the design of projects for the relocation of populations affected by disasters. Secondly, we provide technical assistance once natural disasters (volcano, earthquake, landslide, flood, drought) occur, as well as collaboration with other NGOs in emergency conditions, providing them with technical support in the selection of locations for hospitals, refugees camps, etc.
Another goal of the NGO involves hydrogeological studies dedicated to finding fresh water supplies both for human consumption and for irrigation purposes. Technical support is also foreseen in order to correct environmental aggression.
Projects and activities carried out In spite ofits youth, this NGO has participated in diverse humanitarian activities, such as supplying a fresh water supply for
Ge61ogos del Mundo es una Organizaci6n No Gubernamental (ONG), que naci6 el 4 de febrero de 1999, cuyo objetivo principal es utilizar la experiencia profesional de los ge61ogos para disminuir la vulnerabilidad de las zonas mas desfavorecidas ante los desastres naturales, para mejorar la calidad de vida del hombre (mediante abastecimientos de agua por ejemplo) y atenuar o corregir las agresiones al medio ambiente que afecten a la Tierra.
A pesar de su juventud, la ONG ha participado en acciones humanitarias, ha organizado diversos proyectos, en Turqufa y El Salvador principalmente, y esta preparando otros nuevos que se pondran en marcha pr6ximamente.
the Spanish Refugee Camp of Hamallaj (Albany) during the Kosovo wat.
Last summer, a course on "Natural Hazards Prevention" was given in Turkey (Photo 1 ), at the request of the Geologists Engineers Chamber of Turkey and with the financial support of the International Co-operation Spanish Agency (AECI).
Lastly, it is necessary to highlight the activities of World Geologists during the emergency in El Salvador, as a result of the earthquakes in January and February of this year (Photo 2). Seven geologists of the NGO worked in collaboration with state and municipal authorities, as well as with another NGO at the site, carrying out important technical and humanitarian work. Also, during the same period, a course in "General Geology" was given at the State University of Santa Ana, in El Salvador, in collaboration with the Technical University of Catalufia.

Future projects and activities A study on "Geological Hazards and Vulnerability at the San Miguel Volcano in El Salvador" (Photo 3), financed by the DIPECHO program of the European Union. It began in February of this year (200 I) and it is foreseen that it will be finished next year.
The project "Diagnosis and Inventory of Landslides in El Salvador", which has the financial support of the Generalitat of Catalufia, will start early in the year 2002.
Continuation of the "Course in General Geology" at the State Universities of Santa Ana and of San Salvador, that will be enlarged with new modules on Geological Risks.
Furthermore, we have put together other projects for which we are seeking finance from a number of bodies.
Central office Av. Reina Victoria 8, 4°B 28003 Madrid (Spain) Tel.: +34 91 553 24 03 Fax: +34 91 553 03 43 E-mail: [email protected] web: www.geologosdelmundo.org
Delegation of Aragon Av. Tenor Fleta, 42 1 ° 4• 50007 Zaragoza Tel./fax: 976 37 35 02 E-mail: [email protected]
Photo 1. Course on Natural Hazards Prevention organised by World Geologists in Turkey
Delegation of Catalufia Cl. Suissa n° 34 B 08211 Castellar de! Valles Tel.: 93 714 46 99 Fax: 93 747 30 09 E-mail: [email protected]
Delegation of El Salvador Av. Monsefior Romero y s• calle poniente. Edificio Catastro San Miguel Tel./fax: (503) 6614182 E-mail: [email protected]
Photo 2. Earthquake at Las Colinas, El Salvador
Photo 3. San Miguel Volcano, El Salvador
13

When Geology Performs Etna's eruption was worth seeing
by EurGeol Carlo Enrico Bravi1 and Stefano Signorelli2
Every so often geology - a science unfamiliar to most people - makes new headlines and when it does so, it is normally because of earthquakes, storms, landslides and floods. Last summer geology performed when the Etna volcano erupted, focusing the attention of thousands of people, directly and indirectly, both at the foot of the volcano and through newspapers, magazines and television.
Once kept under control to reduce risks and damage, the eruption was well worth seeing and could be observed close up. This is a brief history of the volcano, describing its biggest eruptions during the last centuries and giving some details of the last one (July - August 2001) that offered an amazing view of the power of nature.
Mount Etna, Sicily (37.73° N, 15.00° E; summit elevation 3,315m) is the highest and most voluminous basaltic stratovolcano in Europe and, at the same time, the most active one. It has one of the world's longest documented records of historical volcanism, dating back several centuries.
1. Idromin SRL-Whole Earth Service Consulting Group, Via Ugo Foscolo 8, 20121 Milan, Italy.
2. Volcanologist, c/o Institut de Ciencies de la Terra, 'AumeAlmero', 08028 Barcelona, Spain
14
Chaque fois que la Geologie - une Science peu connue de la majorite des gens- fait la une des journaux, c'est que l'on est en presence d'un tremblement de terre, d'une tempete, d'un glissement de terrain et d'inondations. L'ete dernier, la geologie fut en premiere page lors de !'eruption de l'Etna, cristallisant !'attention de milliers de personnes, directement ou indirectement, aussi bien au pied du volcan que par l'intermediaire des journaux, des revues et de la television.
Une fois le controle etabli pour limiter les risques et dommages potentiels,le spectacle de !'eruption avec images de tres pres, en valait la peine.Cet article raconte brievement l'histoire du volcan, decrit les eruptions les plus violentes des siecles derniers et detaille la derniere manifestation (juillet-ao0t 2001) qui a demontre de fa~on impressionnante la force de la nature.
Two styles of eruptive activity typically occur at Etna. Persistent explosive eruptions, sometimes with minor lava emissions, take place from one or more of the three prominent craters: Central Crater, Northeast Crater and Southeast Crater (the latter formed in 1978). Flank eruptions, typically with higher effusion rates, occur less frequently and originate from fissures that open progressively downwards from near the summit (usually accompanied by Strombolian eruptions at the upper end). Cinder cones are commonly constructed over the vents of lower flank lava flows. Lava flows extend to the foot of the volcano on all sides and
No muy a menudo la geologia, ciencia desconocida para la mayoria de la gente, esta en primera plana en los medics informativos y normalmente esto ocurre cuando succden desastres naturales tales como terremotos, huracanos, deslizamientos e inundaciones. El pasado verano la geologia fue centre de atencion gracias a la ultima erupcion del volcan Etna que afecto directamente e indirectament a muchas personas. En aquel memento los differentes medics de informacion se interesaron por la geologia mostrando fotos e imagenes erpectaculares de la erupcion. Junios a algunos detalles de la ultima erupcion del volcan Etna (Julio - Augosto 2001) dames un breve resumen de la actividad historica del volcan.
have reached the sea over a broad area on the SE flank.
Mount Etna, towering above Catania, Sicily's second largest city, is important to the economy of Eastern Sicily, with agriculture and summer and winter tourism providing employment for a thousand people. Although the villages at the foot of the volcano appear to be far from the vents and there are few buildings within 10km of the summit of the crater, human activity on the upper slopes of the volcano is proliferating and the risks from an eruption, however small, are consequently magnified. The last time Etna posed a threat to villages on its slopes was in

Etna's great eruptions up to 2001 475 B.C. · The first !mown Etna eruption.
1614 - 24 A long period with different eruptions during which more than 1000m3 of fluid lava was extruded on a surface of 30 km3 • The lava produced several caves and grottoes that still exist today.
1669 The lava flowed from at least seven different mouths. The estimated volume oflava was 900 million m3 over a surface of35km3 and several villages were damaged. The lava flow reached the town of Catania (several houses were damaged) and the sea.
1763 After a rather long period of quiet, this three-month eruption of 100 million m3 oflava and pyroclastics, formed the Montagnola slopes, where winter sports are practised today.
1809 The lava flow, starting at 2300m reached low altitudes, around 700m. A great quantity of pyroclastic material was produced and a large volume of ash reached the town of Messina.
1832 This eruption was preceded by several earthquakes. A long fracture between altitudes of2900m and 1700m
. produced a very wide lava flow which destroyed several hectares of cultivated land and damaged the village of Bronte.
1843 A rather short eruption lasting 11 days during which about 55 million m3
of lava reached an altitude of 540m. A sudden explosion in the lava flow killed around 70 people who had been struggling to save their crops.
1865 This is remembered as a very fast eruption. The lava flowed 8km in three days and reached a depth of 15m.
1892 This eruption lasted 173 days with a reduced volume of lava. A 35m deep cave was formed which still exists today.
1928 Over a period of28 days, 40 million m3 of lava was erupted. The town of Mascali was completely destroyed. ·
1971 This eruption lasted 69 days and occurred\between 3000m and 2200m above sea-level. The cableway and Etna
observatory were destroyed and the lava reached to within 7km of the sea.
1974 Great explosive activity with pyroclasts launched at an altitude of more than 700m. The pyroclastic cones Monte Fiore I and II were formed.
1981 Side flank eruptions lasted six days (17 - 23 March). Several houses were damaged and cultivated areas affected. Additionally, damage to three roads and two railway lines caust;d interruptions to . traffic for several days.
1983 This eruption followed several strong earthquakes. It lasted 131 days during which a volume of more than 100 million m3 of lava was erupted. An attempt was made to divert the lava flow by creating barriers and an artificial bed. The road between Nicolosi and Sapienza was affected at several points and skiing structures were destroyed.
1989 Nine separate eruptions during the year, some of which were the most violent of the two previous centuries. Lava fountains were formed and ash reached the town of Catania. The road between Zafferana and Sapienza was seriously damaged along a 7km length .
1991 - 93 One of the longest recorded eruptions, lasting 4 73 days and producing more than 300 million m3 of lava. A lot of work was necessary to protect the village of Zafferana and many km2 of cultivated land (mainly fruit trees) were destroyed. One of the most antique Etna refuges was buried by the lava flow
1995-98 During this period, the volcano was moderately but continuously active. Eruptions from-different altitudes (several new 4s were opened), gas-ash explosions, strombolian explosions and lava fountains were among the phenomena experienced. Damage was strictly controlled.
1999 With sh.ort, quiet intervals, the eruption lasted from January to October with several explosions, lava fountains and very high ash columns. Ash reached all the surrounding villages, as far as Catania. Winter skiing centres were cl°,)ed
and great damage was done to cultivated areas as well as the road system.
2000 New vents opened and frequent eruptions occurred in March, June and September as well as frequent strombolian eruptions throughout the year. In September, an aircraft was damaged by pyroclasts.
2001 A large flank eruption began on 1 7 July and produced several lava flows that were emitted from four new fissures on the SE flank as well as strong explosive activity at a fifth fissure on the NE flank. There were rears that lava flows from two of the fissures would reach the town of Nicolosi (15km SSE of the volcano) and a nearby popular tourist area. This period of eruptive activity was characterised by powerful Strombolian blasts that sent incandescent volcanic bombs as high as 200m and produced ash columns that rose several kilometres. The entire area between the town of Giarre (17km E of the volcano) and Catania (25km SSE of the volcano) was covered by a thin layer of ash; according to news reports, there was an especially large amount of ash in Catania. The Fontanarossa International Airport of Catania was closed repeatedly between 22 and 23 July, the 29 - 30 July anclj2- 5 August, because of fine, black ash that showered the runways and because pf persistent ash clouds in the area.
Whilst Strombolian activity occurred from the fissures, lava flows extended along the flanks of the volcano. The lava flows progressed towards the Refugio Sapienza tourist complex and there destroyed a small tourist shop and a cable car base-station. To stop the lava flows, earth barriers were constructed. The activity diminished from 13 August with low activity (small earthquakes, slight degassing at fissures on the volcano's flanks) during the rest of August. Volcanic activity was relatively low during the first few days of September, with degassing and seismic activity at Etna's summit craters.
15

Etna during eruption, Italy, 200 I.
Satellite picture of Sicily , Italy, and Etna during eruption
1991-1992, when the volcano started the most voluminous eruption since 1669. The lava flows were 8km long and threatened Zafferana Etnea, a town of 7000 people, before being successfully diverted using controlled explosions in a spectacular operation by Italian and US military. The eruption ended on March 31, after 473 days and surely must be remembered as one of the longest periods of eruption in the volcano's history.
The historical records of Etna eruptions date back several centuries. Volcanologists and scientists from all over the world have visited and studied the volcano and a large volume of literature on the subject has subsequently built up. It is of some interest to draw up a list of the most important eruptions over the centuries, illustrating them with comments on the type of eruption, the damage caused and subsequent problems.
The awakening of a volcano is always somewhat spectacular and frightening at the same time. This is especially true
The authors thanks the Smithsonian. Insti- Volcanism Program - as source of infonnatution (U.S. Geological Survey) - Global tion about the recent Etna Eruption
16
of Etna with its peculiar geographical position, its massive dimensions and the picturesque surroundings. Volcanic eruptions are among the most powerful displays of the force of nature. Volcanoes, distributed along certain structural lines on the Earth's surface, are the surface manifestations of deep Earth processes, governed by plate tectonics. They demonstrate that the Earth is not a dead planet. Every year many volcanoes throughout the world are active and images of their spectacular activity enter our homes via the media, even when the activity does not threaten human lives and property. Last summer, Etna, with its long-lasting spectacular eruption, captured the attention of thousands of people, directly because of a huge human presence at the foot of the volcano and indirectly through detailed news reports. The example of Etna shows that geology, when visible, can make news headlines and can touch the lives of the many non-geologists in the world.

EFG Finance Progress Report
A complete and detailed report on the EFG financial situation was presented to and approved by the last Council meeting in Krakow, Poland on 15 - 17 June 2001. The budget for 2002 (see below) was also approved.
All National Association members of EFG have paid their 2001 association fee. Income from EurGeol titles is increasing. All running expenses have, therefore, been regulated according to the 200 I Budget. Some saving on expenses, such as travel, secretarial work, accounting etc. have enabled the Board to increase its investment in activities in Brussels (the office was officially opened in September 2001) and in preparing an updated EurGeol directory.
All invoices ("Call for fees") for the year 2002 have already been prepared in accordance with proposals approved in Krakow, and sent to the National Associations. This was done in advance so that arrangements for payment can be made in good time.
Costs connected with issue Nos 11 and 12 of European Geologist Magazine have been kept to the amount stated in the Budget.
A detailed Financial Report for 200 I will appear in issue No 13 (June 2002 -Bern Council Meeting).
by C.E. Bravi EFG Treasurer
·Budget 2002 Office in Brussels and Paris
Bank+ cash from 31-12-2001 Fees from National Associations EurGeol title
.· New members (25 x 150 Euros) Renewals (25x 75 Euros) Web page Bank interest Total income
Debts brought forward . Brussels Office
Rent Activities connected with EU Commission Secretarial work Accounting Running expenses Telecom Stationery Mailing
Income, Euros
2,000 27,500
3,750 1,500
100 20
34,870
Brussels extra travelling expenses (meetings and conferences) EurGeol title 25 new merriJJers x 20 20 renewa~ 10 European Geologist Magazine contribution Registration Committee expenses Board travel and accomodation (3 meetings + council) PARIS: legal seat administration costs Bank charges Web pages Contingencies Total expenses
Result of the year +220
!
Expenses, Euros
0
5,000 4,500 1,500 3,000
900 500 600
2,000
500 200
1,500 200
12,000 500 650 100
1,000 34,650
17
Cartographic Visualisation The Geotechnical Atlas of Switzerland
by R. Kuendig, A. Baumeler, R. Giger, S. Neuenschwander and V. Dietrich
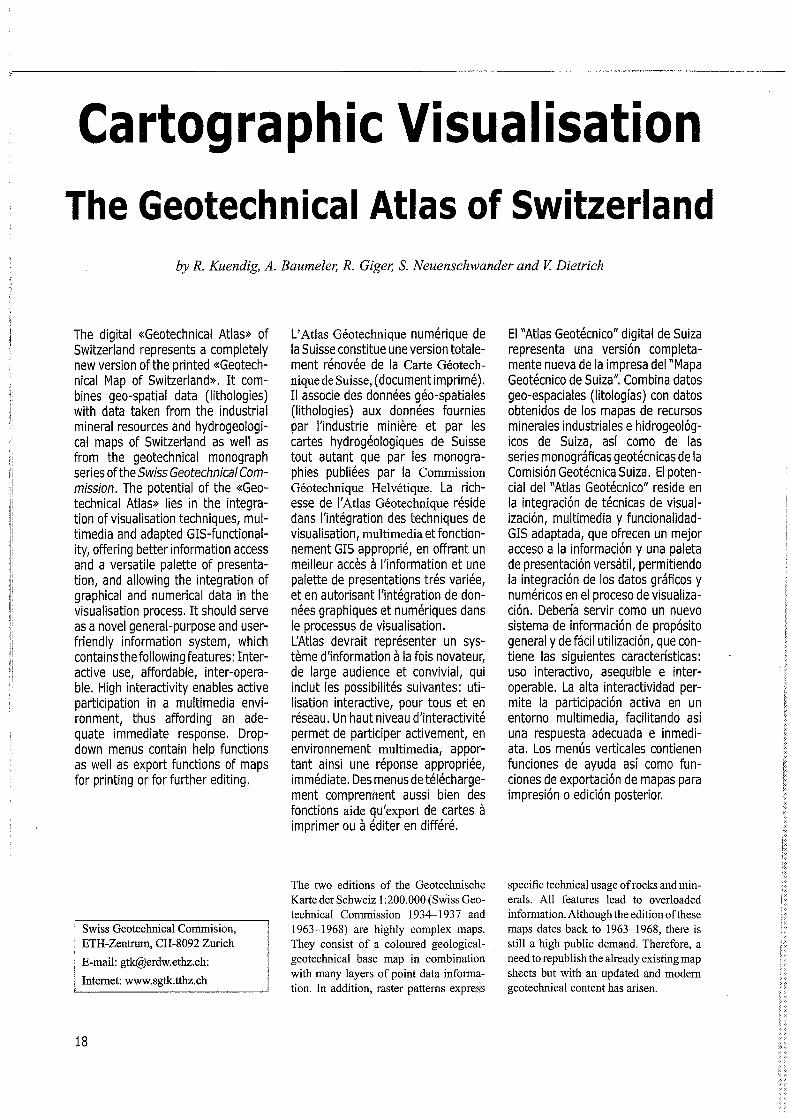
The digital «Geotechnical Atlas» of Switzerland represents a completely new version of the printed «Geotechnical Map of Switzerland». It combines geo-spatial data (lithologies) with data taken from the industrial mineral resources and hydrogeological maps of Switzerland as well as from the geotechnical monograph series of the Swiss Geotechnical Commission. The potential of the «Geotechnical Atlas» lies in the integration of visualisation techniques, multimedia and adapted GIS-functionality, offering better information access and a versatile palette of presentation, and allowing the integration of graphical and numerical data in the visualisation process. It should serve as a novel general-purpose and userfriendly information system, which contains the following features: Interactive use, affordable, inter-operable. High interactivity enables active participation in a multimedia environment, thus affording an adequate immediate response. Dropdown menus contain help functions as well as export functions of maps for printing or for further editing.
Swiss Geotechnical Commision, ETH-Zentrum, CH-8092 Zurich
E-mail: [email protected]:
Internet: www.sgtk.tthz.ch
18
L'Atlas Geotechnique numerique de la Suisse constitue une version totalement renovee de la Carte Geotechnique de Suisse, (documentimprime). II associe des donnees geo-spatiales (lithologies) aux donnees fournies par l'industrie miniere et par les cartes hydrogeologiques de Suisse tout autant que par les monographies publiees par la Commission Geotechnique Helvetique. La richesse de !'Atlas Geotechnique reside dans !'integration des techniques de visualisation, multimedia et fonctionnement GIS approprie, en offrant un meilleur acces a !'information et une palette de presentations tres variee, et en autorisant !'integration de donnees graphiques et numeriques dans le processus de visualisation. L'Atlas devrait representer un systeme d'information a la fois novateur, de large audience et convivial, qui inclut les possibilites suivantes: utilisation interactive, pour tous et en reseau. Un haut niveau d'interactivite permet de participer activement, en environnement multimedia, apportant ainsi une reponse appropriee, immediate. Des menus de telechargement comprennent aussi bien des fonctions aide qu'export de cartes a imprimer OU a editer en differe.
The two editions of the Geotechnische Karte der Scl:iweiz 1 :200.000 (Swiss Geotechnical Commission 1934--1937 and 1963-1968) are highly complex maps. They consist of a coloured geologicalgeotechnical base map in combination with many layers of point data informa7
tion. In addition, raster patterns exprei::s
El "Atlas Geotecnico" digital de Suiza representa una version completamente nueva de la impresa del "Mapa Geotecnico de Suiza". Combina datos geo-espaciales (litologias) con datos obtenidos de los mapas de recursos minerales industriales e hidrogeol6gicos de Suiza, asi como de las series monograficas geotecnicas de la Comisi6n Geotecnica Suiza. El potencial del "Atlas Geotecnico" reside en la integraci6n de tecnicas de visualizaci6n, multimedia y funcionalidadGIS adaptada, que ofrecen un mejor acceso a la informaci6n y una paleta de presentaci6n versatil, permitiendo la integraci6n de los datos graficos y numericos en el proceso de visualizaci6n. Deberia servir como un nuevo sistema de informaci6n de prop6sito general y de facil utilizaci6n, que contiene las siguientes caracteristicas: uso interactivo, asequible e interoperable. La alta interactiviclad permite la participaci6n activa en un entorno multimedia, facilitando asi una respuesta adecuada e inmediata. Los menus verticales contienen funciones de ayuda as[ como funciones de exportaci6n de mapas para impresi6n o edici6n posterior.
specific technical usage of rocks and minerals. All features lead to overloaded information. Although the edition of these maps dates back to 1963-1968, there is still a high public demand. Therefore, a need to republish the already existing map sheets but with an updated and modem geotechnical content has arisen.

The following objectives were specified fora new generation of the Geotechnical Atlas:
widespread public availability
- digital data management
dynamic visualisation of all data-sets on a geographic referenced database
- user-friendly and interactive, applying multimedia technologies
links to extended digital information in geotechnical domains
- dynamic upgrading of the information content with respect to future applications and further developments.
The concept of the interactive Atlas Information System (AIS) of the Atlas of Switzerland developed mainly by the Institute of Cartography at the Federal Institute ofTechnology, ETH-Zurich (Atlas of Switzerland - interactive, 2000) has been chosen as the most suitable tool in order to achieve the above-mentioned goals.
The new geotechnical and environmental Geotechnical Atlas can be characterised as an Atlas Information System, an interactive multimedia tool for cartographic visualisation and analysis of geospatial data. It comprises GIS-based data sets, which will be integrated within a graphic visualisation process and will allow the user to create a variety of applied geological maps from a data base system. The AIS will allow the use of incorporated geotechnical information of different types (maps, tables, charts, text explanations, graphics and databases) without specific expert GIS knowledge. GIS specific functions, so far only accessible to a limited user group, will be incorporated within theAIS. Such a new technique has been demonstrated recently by Schneider (2001). These features and on-line capabilities increase the adaptability to fields of potential application of the AIS.
The GeotechnicalAtlas is an integrated part of a medium-term project, which involves updating existing archives and building up new digital archives of many different geological, geotechnical and geo-environmental data sets. A team from the Swiss Geotechnical Commission will gather and update the geotechnical records in an information system. This data set will serve as a foundation for the present and future releases of the atlas. A schematic overview is displayed in Figure 2.
Structure and contents of the atlas The development of the Geotechnical Atlas system can be subdivided into two
Figure I Representation of the basic geotechnical polygons with selected (highlighted) lithology (data group I).
Internal External
-jfdi data base s ystem
~ dlg\taldata:
Figure 2 Data base
co.ROM ~ub-data bare c,cp!anauon~ projector
AIS {Atla~ Information System)
~----~-l}-1-----.-,-,;;;.;;----------------i system of the Geo- .,,..,.., ,/! ;nput . !l techni_cal Atlas. EL.Ill] , j I 61,."'008"'1 ! Data input sources '-- [ ===
flrewa1~! \ ==:=c;:i
l]i dataqu,c;e, and the three main ;;,;,;;,~~-inquiry levels ,ontrol
sub-database
"internal", "external" and "www ". exp~rt!!ystem
{ArcView, Arclnfo) WWW
main parts: a general geotechnical section providing the master data system (GIS and data base areas) and a multimediabased visualisation and production part. The software used as well as the need for data integration, data maintenance and data security are substantially different in the two parts.
In the first part of the atlas development, existin~ printed and digitally produced geoteclmical and related applied geological maps are processed and edited (Figure 2, central part). Starting from a GIS database of a digital geological map, an independent database system is built up. The whole data set will be combined with further information according to the structure shown in Figure 2. During this stage the acquisition and integration of supplementary external data is performed. Revision of existing maps and integration of new records takes place simu!tahe-
ously. The master database.will be completed by references and links to data sets from relevant geotechnical publications. Most of the geotechnical d&ta is thereby obtained from scientific publications. To keep the data standards within individual applications is crucial to accomplish a data base system where data can be used equivalently in a multimedia environment. Data relationships (GIS-DB, DBdiagrams, DB-text/pictures etc.) have to be adaptable and unequivocal with respect to database maintenance.
The data content of the Geotechnical Atlas is structured into three major data groups: The graphic input data on the scale of I: I 00.000 comprise soil and rock formations in terms of their lithologies, geological structures, hydrographic and hydrogeological data (data group one; Figure I). Within the numerical data set ( data group two; Figure 3), physical, geo-
19

Petrogr~BesctTei.btrnQ: Geoloq,sdh!Uqt:Ob.....:.,.M,mhdkolk.Hautcri,..., M•~k,,,t, "·6m fatlHI: 9r611td,,,.ar.
me<Glcrirumner1<.ollitti~bta:tt,nrT"OIR• kn114'C,ne-Gn,ndmaJ&e;~O<no:nporenton
KC,mQ"Oue, K41Ut""ll<'nenten0.4.,..,, Q:uer~on~M o.u ·0.17 rr,n
i:,i...,._alhl!J<\O:Sehrlo:linPII,!;
i:::.:n'7'"' :=:n~.:: Tfchusche Param~ter (Wertebere,ch}
Orudde<tiQl=eit: 2000•2700k~e,nZ Ra~wjcl\t: 2,6Z·Z,674(d<t,,l si,e.ufi,d'les G6",cht; 2,66 • Z,73 kllf6<ni w.au.,1ijfnahrM o,04•2,&"-Ge<amtePoro5it.lt< 0,6·Z.O'I. Otnd>l~<.,QkM.: to·S m/1
~,..:.•~·, ... : t.:.-.:~=1~
technical, geochemical, and hydrological parameters are given: grain-size, hardness, density, porosity, permeability, compressibility, wave velocities, electric and magnetic conductivity and chemical composition. Industrial mineral resource data such as quarries, mines, boreholes, wells, springs and mineralisation appear as point data. Additional geotechnical information (data group three; Figure 5) such as the newly edited book: Die mineralischen Rohstoffe der Schweiz (Kuendig et al. 1997) and the highly useful content of the monographs of the "Geotechnical Series", released during the last I 00 years by the Swiss Geotechnical Commission, can be added in various proportions using HTML-techniques as· well as platformindependent PDP-formats.
The user-friendly concept The interactive multimedia environment contains the following features: general functions, thematic navigation, spatial navigation and orientation, visualisation functions and GIS-functions.
The multimedia visualisation and production part (Figure 4) is based on a concentrated data set generated from the master data system. The main database together with descriptive text blocks and illustrations are arranged within an AIS on a CD-ROM. A self-executing program (projector) steers the visualisation of the digital data sets and the multimedia functionality. Much importance has been placed on the intuitive guidance for the user in the presentation of the data. Prerequisites within the Geotechnical Atlas prevent the user from unfavourable or
20
Figure 3 Representation of physical and geotechnical overview parameters of a selected lithology (data group I and 2).
wrong map presentations. Map interactions include adding topographic or thematic information, changing colour or classification schemes, choosing different views, and querying additional information on map elements.
In addition to the basic data records, functionality to manage the users own data sets will be provided. Within the multimedia part of the atlas information system, different cartographic modules developed by the Federal Institute of Cartography (ETH-Zurich) shall be available in addition to the functionalities provided by standard multimedia programs (e.g. Macromedia Director). The restriction of possible data reclassification functions or queries prevents falsification of the existing data. Thus, the original data status
remains equivalently available and obligatory for different users at any time (Schneider, 2000).
High interactivity enables active participation in a multimedia environment thus affording an adequate immediate response. Dropdown menus contain help functions as well as export functions of maps for printing or for further editing. Additionally, active menus and buttons are highlighted and/or the cursor changes its shape depending on different actions. The status of running background processes such as sorting, classification or offscreen drawing is continuously displayed. Also, running processes can immediately be interrupted.
Conclusions and products The main potential of this system lies in the integration of visualisation techniques, multimedia and adapted GIS-functionality. The term multimedia implies not only the multisensorial component and a nonsequential access to the Atlas, but especially the criteria of interactivity. This modem approach in handling chemical, physical and geotechnical parameters of rocks and soil, makes it possible to select and combine the data of interest and/or to take into account specific reliability ranges of the geotechnical information. The latter is a widespread need in applied geology as underlined by many recent publications. The possibility of comparing different data sets from different disciplines meets the demand from a broad public when dealing with environmental topics.
Geotechnical Environmental Atlas
Figure 4 Geotechnical Atlas, schematic view of the multimedia visualisation and production part.
representation
projector representation analysis
data level data acquisition and management
data access
records {spatial numeric and graphic data)
explanations (texts.tables, diagrams, pictures)
data flow (graphic and numeric data, texts, tables, pictures)
! !
0 user data bases

Figure 5 Additional geoteclmical information for a selected lithology or point of interest (data group I, 2 and 3).
ic1 .. nlkaU1: Qoo!od>ntsche !lor~motcr · m~«t "IM~•O ·fe"'~~,rug • On,~f.,~~<,t· WCO • WJO ~,v'cm? · ~i1UIT>401>1d\t: 2,6t · 2,f.1 ~;J'dm3 · Sce::,!isCMs Gow.ol>t· ~.~6 . 2,73 ~'lidmZ
Waue,aufnahm~ 0,04 · t,! "'-• Gesa<>'t~ Porvl>t~!- 0.6 • .?.C ':-. •O<:rthl!iss-o~•>t 10-S m/s
AHoemc,n" !'l<o«/'lrew""~ F01n b•• qcob!P~l>Qc, .,.,~«T l~,ct:e ~"'Hkge l<olkmerv~, b,clktuti1tlle watJ,c1>acl<<t~Ms. m-e, ic,n:uidig,fu,,mmorGl~ul:ONl· ...,.dP,ntl<ihrend. i..ao•n @d 11no1Jon ·,on Chort (Scl-acn'!>aroHd). Im fano<bereJ'C11 h.!uiiQ K~~r.>um~~ Sd>r.!-gsch,cti!
~--------------, w,rl<t,.,ctmb,crt.
Kieselkalk Steinbruch Kehrsiten gena fwil
Technische Welte: g:!~;::::::z ::: ~~:;::" ~:::!:~~~:. Raumgewicht: SpezifischesGewicht: Wasseraufnahme: Scheinbare Poros1tat: Absolute Porositat: Druckfestigkeit nass:
trodcen:
Petrogr.aph1sche Beschreibung: j Geologische Lage: Oberster Muschelkalk, Hau~ Miicht;igkeit: 4 - 6 m • Farbe: grauschwarz i Struktur: mesol<rista!liner Kalzit emg1
kristalline Grundmasse; Quj Korngr0sse: Kalkkomponenten 0A mm !
Quarzkomponenten 0.12 • ~
;~:i::::~:~~ng: :~~~~::~~er ~aukonit i
kloulk~Steinbrucht:ehrsit.,nQena11rWl!rtll:
TectTiisdlewerte: _, S;,,:,:if~sG-•cht VloU,fr,iufr,"1,m~:
'SthetnbattPa-osatll; Al::ll>lutol'!>r,,s-ot.!:t
Cn,,:!.fc<UQhll~=.::..,
z.~l?•Wdml ;.i.i~Crr.l oc,o-,.
13Bil~'l-'.:t'l'I! Z357lQ/cml
O:e ~,o;:sel~.ce s<Md sehr drudiesre GuN>M ,:nd Desit2.!ln dad der \IE!!hesetuno e<11e fu• l(a!lste:ne sehr genn:ie A:;1nui:1ung. s,o gehoren ru oqn Ha."'t(leste,mm 01e Zi!-'>lreu;lwn
tectmtschlJT!t<'.,T!;i;(htenProbenergabenetwafoloendeWefU'•Rcum..ew·cht:?,63·:!,67
l.g/dmJ, ab$0l:.tte Porosit.1t !2%, Yl..isseraufr,ahme 0,0l • 0,08% A!;,nutzu~ ,m
Sa.ndstra!tl 0.0l - 0,04 an, Atinuoung durct, Aeseh~den nacn !!iKJsd"l,r,ger, tro-J.en
0,0110.;i cm, nass 0,17 - O,J cm, On.:o;fescoi.en:trc:m.en 2000 • 2700 t.wan:! me,s:; :!JOO -2600J,n,1ssundnachFro51:ru,,rwon,ggenr.1,1er
Der >:1es!"!ll:allJ..mnp1c,; (•:t-r--<"<'l;,;.,.-•,'._;_J ha~e.ne "';:u::r.til;l.e!!.d"J ITTdm- Santrsdod.c um
100 m tetraQt, ,n der On.,sllen;idecu bis tu SOO m er.-e,cnen l.a.'ll"l: ,m kltneran Fatl
werdend,eoller@nl..!genfu1denAbba1Jbe•or1uQ!.Er,"Stvo,zugsw&,.sedz$ingeb;ir,J:.1,,..a:
&anl.m,lc:N,,;~e,ten •,t,n ~twa 15 dm, ;,ft sehr couc11ch (deshalb auch a!s [email protected]::
beze•chMt),oft.ru,:,,wenu;;erauff;itlond.O•eLagen1a:dienSlll(l!a:go:,,...e,s,;:aua>'!!tn-as
,;ie...-ei.t. was e,M 1,nc!~ge Abscnd@rurt';) @r,:;,bt lnnamaf!i der Banle rst das Go,te-.n massv:1. ae, ,>!l,en VQrl.ommer. belinden ~•eh zw,scher. den a,ml.en chmne La;ien lmm DJ'S ,;;,
Porositat: - ! Fossi\reste: Echinodcrmenbruch:stticke ~-----,c--;;------,,--,--,0---~-----s Verwendung:
References
1 Mergelschlefer 2 Kleselkalkschlefer 3 UntererKJesetka!kdOnnbanklg 4 KnoUlgerKlese!k.alk z.T. spatlg 6 Kiesel!calkbank 7 Glauk.onltbank und Mergellageo 8 ObererKlesetkalk 9 Echlnodermenbre.kZk:
10 Glaukon!tbank
f
! ?unitk !
In the next version of the Atlas of Switzerland - interactive, which is planned for release in 2003, a first Geotechnical Atlas with a limited functionality will be integrated. It will be based on a map scale of 1 :500.000. The geotechnical datebase will be linked to a more extensive information input whose level of detail corresponds approximately to a classical map scale 1 :200.000. Under way is an extended version of a Geotechnical Atlas with more detailed information.
Atlas ofSwitzerland- interactive (2000): CD-ROM with accompanying textbook. Swiss Federal Office of Topography, CH-3084 Wabem, ISBN 3-302-09520-1.
sis for Everyone, Proc. 20th ICA/ACI International Cartographic Conference, Bejing.
,,,;/ Kuendig, 'R., Mumenthaler, Th., Eck-ardt, P., Keusen, H.R., Schindler, C., Hofmann, F., Vogler, R., Guntli, P. (1997): Die mineralischen Rohstoffe der Schweiz. Hrsg. Schweizerische Geotechnische Kommission, ETH-Zentrum, 8092 Zurich, 536 p., ISBN 3-907997-X.
Schneider, B. (2001 ): GIS Functionality in Multimedia Atlases: Spatial An)ly-
Schneider, B. (2000): GIS-Funktionen in Multimedia-Atlanten, in: Vermessung, Photogrammetrie und Kulturtechnik, 10, 2000.
Swiss Geotechnical Commission (1934-1937 and 1963-1968): Geotechnische Karte der Schweiz, 1 :200'000, 4 Blatter mit Erlauterungen, Hrsg. Schweizerische Geotechnische Kommission, ETH-Zentrum, 8092 Zurich.
21

.T.Cullen & Co. Ltd.
nal 1rEnvironm n al
ro I
Consultancy
Employing the skills of 50 experienced staff

Roasted Alive In The Carboniferous
by Andrew C. Scott
Over 50 Late Carboniferous fossil forests are preserved within a thick succession of sediments exposed along the Bay of Fundy, Nova Scotia, Canada. Vertebrate-filled tree trunks occur at a few horizons while major wildfires probably hollowed out some of these trunks. An investigation of the classic Joggins outcrops has revealed new data on the sedimentology of the sequence together with new information on the occurrence of invertebrate, vertebrate and plant fossils as well as associated trackways which are providing a true 'window to the past'. Highly diverse animal and plant communities occupied low-lying forested swamps while the air was thick with insects. Periodic lightning strikes generated forest fires and many animals hid in hollow tree trunks only to succumb to suffocation.
Plus de 50 forets fossiles datant du Carbonifere superieur sont preserves dans une epaisse serie de sediment affleurant le long de la baie de Fundy au Canada (Nova Scotia). Des troncs d'arbres remplis de vertebres ont ete trouves dans quelques niveaux. Ces troncs furent probablement evides !ors de feux de forets. Une etude de l'affieurement classique de Joggins a fourni de nouvelles donnees sur la sedimentologie du site ainsi que des informations supplementaires sur les invertebres, les vertebres, les pistes et les plantes qui s'y trouvent. Cela nous permet de reconstituer une veritable "fenetre sur le passe". Des communautes animales et vegetales tres diverses occupaient des marais boises de basse altitude tandis que les airs etaient remplis d'insectes. La foudre generait periodiquement des feux de forets et de nombreux animaux trouvaient refuge dans les troncs creux, mais seulement pour y perir asphyxies.
Upper Carboniferous rocks exposed along the Bay of Fundy, Nova Scotia, Canada, preserve a succession of over 50 fossil forests in a sediment pile nearly 4km thick. Sir Charles Lyell and Sir William Dawson, visiting a site near Joggins, Nova Scotia in September 1852, made the remarkable discovery of early vertebrate remains that seemed to be concentrated within the boles of the massive lycopsid tree trunks that could be seen standing where they grew 315 million years ago. More curiously still, the tree trunks appeared to be charred. What were the reptiles doing there?
Recent re-investigations of the sequence during the last six years, involving geologists from Nova Scotia and Royal Holloway (University of London), have thrown new light on the significance
Andrew C. Scott is Professor of palaeobotany in the Geology Dept., Royal Holloway, University of London
of the Joggins plant and animals. We now know that vertebrate-filled trunks are restricted to only a few horizons, and that major wildfires raging through equatorial tropical lowland swamps were probably responsible for hollowing out some of the trees in which the animals are found. Some hollows may also have been subsequently used by animals fleeing later fires - where they were suffocated, and preserved.
However there is much more to the story. The occurrence of invertebrates, including gian:t millipede-like arthropleurids, vertebrates" trackways and plant fossils, at Joggin,s"'has offered us the opportunity to reconstruct the terrestrial ecosystem and open a true 'window to the past'.
A little history The cliffs along the Bay ofFundy expose nearly 40km of Upper Carboniferous coal-bearing strata. Upright tree trnnks were discovered there in the early part of the 19th Century. The sequence was mapped by Sir William Logan in l 841
and was visited by Sir Charles Lyell in the summer of 1842. He wrote:
"Just returned from an expedition of 3 days to the strait which divides Nova Scotia from New Brunswick, whither I went to see a forest of fossil coal - trees -the most wonderful phenome,hon perhaps that I have seen, so upright do the trees stand, or so perpendicular ,to the strata, in the ever-wasting cliffs, every year a new crop being brought into view, as the violent tides of the Bay ofFundy, and the intense frost of the winters here, combine to destroy, undermine, and sweep away the old one - trees twenty~five feet high and some have been seen of forty feet, piercing the beds of sandstone and terminating downwards in the same beds, usually coal. This subterranean forest exceeds in extent and quality of timber all that has been discovered in Europe put together".
Lyell's excitement at seeing such wellexposed forests led to him revisiting the sequence in September 1852 with the Canadian geologist Sir William Dawson. Their discovery of vertebrates within one
23

.:1 I ,,
Artists impression of an Upper Carboniferous landscape, Joggins, Nova Scotia (artist: James McGraw). The small Temnospondyl Dendrerpeton is running to escape the fire and sheltering inside a hollowed out stump from a previous fire. A large Arthropleura is shown in the background with its characteristic trail. The vegetation is dominated by large arborescent lycophytes, ferns and seed ferns.
of the sediment-filled tree trunks revolutionised our understanding of past ecosystems. Lyell and Dawson believed that they had found the world's oldest reptile and named it Dendrerpeton. It later was shown to be an amphibian - although Dawson himself later discovered a true reptile, Hylonomus, within another trunk. In addition to the vertebrates, Lyell and Dawson discovered millipedes and the world's oldest terrestrial snails.
Over the next 40 years the Joggins sequence was studied intensely by Dawson, who discovered more than forty successive fossil forests (trees c. Im in diameter and up to I Orn tall).
The Joggins sequence The Joggins sequence, all 4km of it, consists of "Westphalian A" age, grey coalbearing strata with upright trees and reddened horizons. It was deposited, in the rapidly subsiding Cumberland Basin, at a rate of more than I km every million years. The sequence has yielded a wide variety of plant and animal fossils including more than five groups of tetrapods. The
24
low cliffs and extensive rock platforms of South Joggins expose gently dipping strata. Continuous erosion here exposes fresh sediments for geological investigation, though the stratigraphic sequences drawn up by Logan, Lyell and Dawson can still be used as a template for modem studies.
These studies - mainly of grey coalbearing sequences with upright trees - by the author, John Calder, Martin Gibling and Howard Falcon-Lang, have unravelled the fossilisation history of the trunks and at last answered - we think - the question of why some trees contain fossil reptiles and amphibians.
Sedimentological setting Coal-bearing strata were laid down in lowlying fluvial floodplains with extensive peat-forming areas, in a tropicalequatorial landscape. The sediment source of the rivers was largely from the Central Appalachian Mountains, 900km to the southeast, as well as from local upland areas. Studies of sand-filled channels within the sequence suggest that anastomosing and
meandering channels dominated the Joggins floodplain. The climate was predominantly humid and non-seasonal; although at some periods conditions appear to have been drier.
The finer-grained mudstones were mostly formed as flood-plain bverbank deposits with occasional extensive shallow lakes where a diverse non-marine fauna thrived. Peat-forming areas ( swamp forests with through-flowing water) were at times extensive and may have persisted for tens to hundreds of thousands of years. Studies of fossil pollen and spores from the coals have shown that various extinct tree groups belonging to the lycopsids (giant club-mosses) dominated these forest swamps.
Occasional dry periods punctuated the predominantly wet conditions, during which forest fires began - leaving traces of charcoal within the coals. The swamps were also frequently invaded by riverborne sediments, which entombed the forest horizons many times.
Lycopsid trees were not woody like most modem trees. In place of a resistant

secondary wood, these ancient trees had secondary spongy internal cortical tissues that rotted easily. Sediment often filled these hollow tubes - which is why the trees are mostly preserved as sand-filled casts. Continued rapid subsidence within the basin gave rise to successive forests, all preserved in the same way.
Fire and charcoal Fossil charcoal (fusain) is commoninJoggins sediments and coals and represents the traces left by frequent wildfires that affected several ecosystems at this time in the equatorial tropics. Indeed, fires may have been more frequent in Carboniferous time, because the atmosphere was richer in oxygen than it is today. Depending on the level of the water table, these fires might have been ground fires, surface fires, or crown fires affecting only the topmost canopy.
Charcoal from woody trees called Cordaites - which grew on higher, drier ground - is also common in some of the river channel sandstones. The charcoal fragments are usually associated with incised, poorly sorted, chaotically bedded channel facies, which are interpreted as flood deposits. Fires in upland forests may have caused increased runoff from those areas, washing the cordaite trees down to the floodplain in soupy, sediment-charged rivers. Charcoal is also found within the bases of some lycopsid sediment-filled trunks, and this has led researchers to think that fire may have hollowed them out.
Animals Fossilised aquatic animals (such as bivalves and fish) are common in some of the lake horizons, though the terrestrial vertebrates and invertebrates are of more particular interest. Rare insects have also been reported, as well as the earliest land snails, millipedes and - most recently -scorpions and aquatic eurypterids. The largest invertebrate animal is known most vividly from its trackway. Arthropleura was a two-metre long millipede-like animal. Its distinctive parallel spoor is commonly seen traversing the bedding planes.
Since Lyell and Dawson made their first discovery in 1852, many hundreds of tetrapod specimens have been found, belonging to a wide range of genera and species. Most were found inside of sediment-filled trunks. Dawson recalls:
"I remember how, after we had disinterred the bones of Dendrerpeton from the interior of a large tree on the Joggins shore, [Lyell's] thoughts ran rapidly over all the strange circumstances of the burial of the animal; its geological age, and the possible relations to reptiles and other animals, and he enlarged enthusiastically on these points, till suddenly observing the astonishment of i>. man who accompanied us, he abruptly turned to me and whispered, 'the man will think us mad if I run on in this way"'.
The Joggins vertebrates remain world famous, and Hylonomous lyelli has even appeared on a Canadian stamp. Recent research has distinguished at least twelve species in ten genera, belonging to five major groups: temnospondyls, microsaurs, anthracosaurs, captorhinomorphs and pelycosaurs.
Preservation So, how did the vertebrates get inside the trees? An analysis of all previous records and material in museums has revealed:
- most vertebrate skeletons are found in the bases of the trunks
- most vertebrate-bearing trunks (and some others) have a charcoal layer at the base.
From this it appears that at least some of the trees were hollowed by fire. Why the tetrapods are present is another matter. There seem to be at least four possibilities:
1 trunks acted as pitfall traps
2 animals used the hollowed trunk as a den
3 animals used the hollowed trunk as a refuge
4 animals were washed into the hollowed trunk.
Since Dawson 's time it has been generally assumed that hypothesis I was correct and the trunks acted as pitfalls. However, comparing the sediment fill with the sediment outside shows that this cannot be so. Evidence for the other three hypotheses has been equivocal until now. Calder clearly favours the den hypothesis 2 whereas I favour either 3 or 4.
During fires today, many animals that are unable to run away from fast-spreading flames may burrow or find refuge. There is no evidence that any of the Carboniferous terrestrial tetrapods could burrow, and the hollow trunks would certainly have provided a good refuge. However, some animals may have been suffocated where they sought to shelter, turning their supposed safe haven into their burial place.
We also know that storms often follow major fires, with increased erosion and sediment transport. Sediment may be washed into the trunks, covering the animals and, in some cases perhaps, bringing in more carcasses. (Most of these animals were quite small - usually less than 30cm long.)
Further reading Beerling, D.J., & Bemer, R.A. 2000. Impact of a PermoCarboniferous high 02 event on the terrestrial carbon cycle. Proceedings of the National Academy of Sciences 97, 23, pp12428-12432
Calder, J. H. 1998. Tue Carboniferous evolution of Nova Scotia. pp.261-302. In: Blundell, D.J. & Scott,A.C. (eds.) The Past is the Key to the Present. Geological Society of London Special Publication 143, 261-302
Dawson, J. W.!S53. On the coal measures of the South Joggins, Nova Scotia. Quarterly Journal of the Geological Society 10, 1-51. ✓-·
1,'>fj_,'Y
Dawson, J.W. 1882. On the results of recent explorations of erect trees containjng animal remains in the coal fonnation of Nova Scotia. Philosophical Transactions of the Royal Society of London. 173, 621-659.
Dawson, R. ( ed). 1901. Fifty years of work in Canada, scientific and educational, being the autobiographical notes by Sir William Dawson. Ballentine, Hanson and Company, London.
Falcon-Lang, H.J. 1999. Fire ecology ofa Late Carboniferous flood plain: Joggins, Nova Scotia. Journal of the Geological Society of London, 156, 137-148.
Falcon-Lang, H.J. & Scott, A.C. 2000. Upland ecology of some Late Carboniferous Cordaitalean.Trees from Eastern Canada. Palaeogeography, Palaeocl!matology, Palaeoecology 156, 225-242.
Logan, W.E. 1845. Section ofNova Scotia Coal Measures, as developed at Joggins, on the Bay ofFundy, in descending order, from the neighbourhood of West Ragged Reef to Minudie. Proceedings and Transactions of the Nova Scotia Institute of Science 11, 419-199.
Lyell, C. I 855. Travels in North America, Canada and Nova Scotia, etc. Val 2.
Lyell,C.&Dawson,J.W.1853.Ontheremainsofareptile (Dendrerpeton acadianum Wyman and Owen) and of a land shell discovered in the interior of an erect fossil tree in the coal measures of Nova Scotia. Quarterly Journal of tl1e Geological Society 9, 58-63
Scott, A.C. & Jones, T.P. I 994. The nature and influence of fire in Carboniferous ecosystems. Palaeogeography, Palaeoclimatology, Palaeoecology 106, 91-112.
Scott, A.C. 1998: The legacy of Charles Lyell: advances in our understanding of coal and coal-bearing strata. In Blundell, D.J. & Scott, A.C. Lyell: the past is the key to the present. Geological Society Special Publication No. 143, 243-260.
25

These data and interpretations have predictive value and have proved useful in a geoconservation context. Most vertebrates are found in trunks with charcoal in their base, and recently, new vertebratebearing trunks have been found using this correlation as the basis for a "search strategy". This should save countless trunks being needlessly broken up in the search for vertebrate fossils at a sensitive heritage site.
A window on the past Joggins is a unique site in the fossil record. It would be remarkable for its succession of fossil forests alone; but the occurrence of vertebrate fossils within some of the trunks adds another dimension.
We can imagine low-lying forested swamps teeming with plant and animal life. Stands of tree-like lycophytes, quite different in growth habit from modern
trees, shaded an under-storey of ferns, seed-ferns and small tree-like horsetails. Large arthropleurids and millipedes fed on the rotting vegetation while small terrestrial vertebrates fed on the smaller insects. Large terrestrial scorpions were among the predators at the top of the foodchain.
The air was vibrant with flying insects, some of which grew very large - much larger than insects can be today, and which only the oxygen-enriched atmosphere of the Carboniferous could support. Gently flowing rivers crossed the floodplain, and small freshwater lakes teemed with diverse animal life.
During drier intervals, lightning strikes started fires - even on low-lying areas, where they may have spread through the crowns of the trees. Some trees were completely destroyed, while others were hollowed out. Animals tried to escape
this catastrophe by hiding in previously hollowed trunks; only to be suffocated.
Forests of large cordaite trees, some up to 45m high, clothed the surrounding upland areas. But these upland areas were susceptible to lightning strike and crown fires may have spread rapidly. Destruction of the vegetation and subsequent rainfall caused increased erosion. Sedimentladen water flowed down the river system, clogging it with sediment, logs and charcoal.
Far from being a quiet, tranquil environment, the story from Joggins is one of periods of calm interspersed by periods of terror and catastrophe: a true window to the past!
Amended and reproduced with permission of The Geological Society.
Introduction to CPD
Geologists have traditionally been strong proponents of lifelong learning. Since modem geology was first founded, learned societies have been established as fora for geoscientific discussion and debate. Field trips to study outcrop, quarry and mine are a standard part of every geologist's life. In all of this the geologist strives to expand his horizon and knowledge, in the belief that you are only as good as what you have seen.
Today geologists, and geoscientific associations, are at the forefront of <level-
EurGeolJohnA CliffordPGeo, FIMM, FAusIMM, CEng.
26
by John Clifford
oping the lifelong learning concept or, as it is now widely known, the Continuing Professional Development ("CPD") process.
Since the geoscientific discipline covers such a wide spectrum, and individual geologists often live and work in areas remote from formal learning institutions, CPD systems, if they are to work, must include a range of mechanisms that allows the individual to enhance their knowledge. This is recognised in the fact that CPD programmes are not packaged or imposed from above. Instead, each individual is responsible for developing and implementing his own unique programme. This usually follows a review by individual, of what knowledge they possess, if that knowledge is appropri~te
for their current geoscientific activity, how the individual wishes to develop his career, and what further knowledge is required to implement that personal development plan. Each individual will have different learning requirements, and those requirements will change over the course of the years.
Within the EFG family, different associations are at different stages of developing their CPD policies and practices. The two articles that follow describe some systems, which are being implemented. It is intended that these articles be a means of exchanging ideas, and be a catalyst for further improvement. Further systems will be described in the next issue of the Magazine.

l
CPD and the Institute of Geologists of Ireland
by EurGeol Christian Schaffalitzky de Muckadell PGeo FIMM CEng
The IGI has developed a CPD scheme in an early stage of the development of the Institute. The purpose of the scheme is to help members develop their career in a systematic manner while making the administration both formal and user-friendly. The IGI believes that a properly organised and structured CPD scheme will be an essential part of every professional's working life, raising standards while helping members to strengthen their expertise and skills. The IGI expects CPD to improve the perception of the geosciences both inside and outside the profession in the future.
The nature of professionalism at work is going through major changes as we move into the 21st century. Major changes are taking place in the nature of our jobs, the work we are doing, the responsibility we carry and the effect our work has on other professions in multi-disciplinary teams. This article reviews the role of CPD and how it is being developed in the Institute of Geologists of Ireland.
Background Towards the end of the last century the quickening pace of technological advances in the sciences began to pose questions for professionals working in their own areas of expertise. Was it good enough to base one's career on an initial primary degree, often followed by a Masters level post-graduate course? Was 6-7 years of training, followed by on the job experience over at least 5 years, producing fully formed professionals in a world .where well known tasks were being transformed by modem technology? Computers were removing much of the drudge and making interpretation and analysis
L'IGI a developpe le programme CPD des le debut du developpement de cet institut. Le but de ce programme est d'aider ses membres a developper leurs carrieres tout en rendant !'administration a 1-3 fois formel et facile a utiliser. L'IGI est persuade qu'un programme CPD convenablement organise et structure representera une partie essentielle de la vie professionnelle de chacun, augmentant la qualite de nos standarts tout en aidant nos membres a renforcer leur expertise et leur savoirfaire. L'IGI espere que le CPD ameliorera la perception des geosciences a la fois a l'interieur et a l'exterieur de la profession.
easier. Equipment was becoming automated so that data acquisition was becoming remote from the operator.
In parallel, the working environment was being monitored and controlled by regulatory bodies and scrutinised by insurance assessors. Professional errors were being punished under contractual interpretations of responsibility and duty of care. Professional bodies examined the role they played in protecting and supporting their members and it is in this context that the concept of Continuing Professional Development (CPD) was born.
What does 91'D mean? CPD is the systematic maintenance, improvement and broadening of knowledge and skill and the development of personal qualities necessary for the execution of professional and technical duties throughout a practitioner's working life (Geological Society, 1998). Put more simply, CPD aims to keep professionals up to date in their existing areas of expertise. It also provides a structure under which one's experience can be broad$ed.
El IGI ha desarrollado un esquema CPD desde el comienzo del desarrollo del Instituto. El prop6sito del esquema es el de ayudar a los miembros a desarrollar su carrera de manera sistematica a la vez que haciendo la administraci6n tanto formal como facil de utilizar. El IGI cree que un esquema CPD adecuadamente organizado y estructurado sera una parte esencial de cualquier vida profesional, elevando los niveles a la vez que se ayuda a los miembros a fortalecer su especialidad y habilidades. El IGI espera que el CPD aumente en el futuro la percepci6n que de las ciencias geol6gicas se tiene tanto dentro como fuera de la profesi6n.
A recent article in Eurogeologist (Fails, 2000) provides a good introduction to many of the issues affecting the need for CPD.
CPD has become a priority in Europe because of an ageing workforce and the decline in numbers studying the geosciences. CPD also addresses the pace of technological change in tl;te geosciences, as well as the danger of skills obsolescence and over-specialisation. To maintain the competitiveness of geoscientists, it must be a major priority for the professional bodies to persuade their membership to stay up to date and maintain a high standard of work. Equally, companies and organisations that are leaders in their field view CPD as a priority and make it an intrinsic part of their overall business strategy. They believe that the investment in the ongoing training and education of their professional and technical staff is justified commercially while leading to better career planning, greater job satisfaction and personal confidence.
To take an example in economic geology, understanding the controls on the for-
27

Summary and
Assessment Form4
Individual Profiles
and Needs Form 1
THE CPD
CYCLE
Professional Development
Record Forms 3A-F
Personal Development
Plan Forms land 2
Figure 1. Institute of Geologists of Ireland - The Continuing Professional Development Cycle (Derived from CPD framework provided by EUSCCCIP, I997, as reported by the Institution of Civil Engineers, 1998).
mation ofpolymetallic base metal deposits in volcanic rocks changed markedly during the 1970s. Understanding of the alteration caused by mineralising fluids, through the recognition of changes to the mineralogy and chemistry of the host rocks has proved a valuable guide to exploration in areas believed to host such orebodies. Many new deposits have been discovered through the careful logging of mineralogy and lithogeochemistry of drillholes and outcrops to guide more detailed exploration. If an exploration geologist working in this area failed to keep abreast of such developments and techniques, the value of his work would be fatally diminished. It is obvious that this risk is minimised through reading the relevant literature, attending conferences and field trips and reassessing exploration data armed with new ideas.
Good professionals have always recognised the importance of maintaining high standards. In theory, all of us spend time studying the science we work in and keeping abreast of new developments. We also try and add to our skills by attending courses, for example, in computer skills training, a modem language or even first
28
aid. The concept ofTotal Quality Management (TQM), a 'buzz' phrase in management circles, sums up this idea. For products and services the European standard ISO 9000 is an example of this type of scheme. It is designed to provide consumers with confidence that high standards are maintained while providing the suppliers and producers with a scheme to help them achieve these standards. For professionals, CPD provides a model for achieving these goals.
The main problem with CPD is its introduction. No professional who has worked well in his or her job without CPD appreciates having to report to a third party. Many people have objected that CPD schemes are intrusive, take too much time to complete and believe they do not need to prove to anyone that they are good at their job. This perception arises because it is based on a misunderstanding - CPD is not 'checking up' on the individual. It is providing a basis for career development that will benefit the individual throughout his or her working life. The 'checking' is there to provide a formal motivation and attempt to set a standard. of which the profession can be proud.
Certainly CPD is a challenge to those of us who have not set out our career development path clearly in advance. However it is never too late to improve our vision of our jobs and CPD provides one way of achieving this, to the benefit of all.
CPD and Professional Geoscience As in many professions, the geosciences have begun to implement CPD schemes for their members. The type of schemes being proposed or used vary but are mostly undertaken by the individual and administered by the professional body. Some schemes are relatively simple while others require more detailed work. For example, one body requires only a signed annual affirmation, sent in with a subscription payment, for renewal of membership. Others request a detailed log of CPD during a specified period, setting out courses and lectures attended, papers read, etc., all recorded and assessed using a points system.
Whatever the method, the underlying idea is to encourage the membership to make a conscious effort to ensure a minimum level of CPD activity throughout the year or over a set period. However this raises the most important aspect of CPD - it really makes most sense if done according to a pre-meditated plan. As will be seen below, the IGI has used the concept of the 'CPD Cycle' to help its members with their plans.
The IGI scheme In Europe and in the EFG the emphasis on CPD varies greatly. The older organisations can have difficulties introducing CPD because it cannot be imJosed on members who entered their professional bodies under regulations which did not include any CPD requirement. However the IGI is fortunate in that it was established in 1999 with the objective of modernising and promoting the geosciences in Ireland. CPD was made a priority and all members have agreed to be bound by the IGI scheme. This article sets out the details of the current system which has been underway since 2000. It is expected that refinements and changes will occur in the coming years as the membership gets used to the scheme.
The I GI scheme is based on the concept of the CPD Cycle (Figure I). It demonstrates that CPD is an ongoing process, developing in parallel with the member's career. The concept is simple:

Set out who you are and what you are good at;
- Identify areas where you are weaker or where you would like to expand or improve your capabilities;
Draw up a Personal Development Plan ( over a 3 year period);
Attend courses, attend lectures, develop skills within the workplace;
- Record this activity on an annual basis;
- Complete a summary record and submit to IGI;
- Review progress and reassess the Personal Development plan for the next year.
The IGI provides members with the materials needed to organise their CPD, which can be downloaded from the institute 's web-site ( www.igi.ie ). This consists of a 'How to' handbook, a spreadsheet workbook (in Excel) with a step-by-step guide for constructing a Personal Development Plan and recording CPD activities, as well as detailed guidelines designed to address all aspects of the CPD scheme. The idea of the spreadsheet system is to make the process user-friendly, while attempting to impose a certain discipline on the process of recording activities claimed for CPD. From experience, users report that the entire process, completed on an annual basis, can be done in two hours. However a bit more thought should be put into the Personal Development Plan, which is after all the most important pa1t of the process.
The Personal Development Plan, which consists of two forms in the IGI scheme, allows members to set down who they are - qualifications, experience and expertise. From this starting point, they identify their training needs and set out their priorities over a three year period. Ideally they should try to set measurable goals for themselves so that they can monitor their progress and achievements.
At the end of each year, members submit a summary record of CPD activities they completed. This is based on the concept of a 'PROFESSIONAL DEVELOPMENT HOUR' (PDH). A PDH is earned by spending time on training and development, but different activities will earn PDHs at different rates. For example, an hour attending a lecture is worth less than an hour spent on a formal training course. These activities are divided into six areas:
Professional Practice
Formal Training Informal Activity
Participation - Presentations
Contributions to Knowledge
The most important category is the first one. This is a record of the number of hours spent at work or in professional practice working in a creative manner. Here we are not talking of work which requires little intellectual input. The focus is on those hours spent actually using one's skills to best effect. These hours are the best kind of self-development and are entirely up to the member's judgement. It is difficult to define what work qualifies but using one's skills in an active way rather than 'free-wheelin;f is the distinction sought. Twenty hours of professional work will earn l PDH.
If a person claims 40 PDHs it means that they believe they have spent 800 hours ( about 20 weeks) in the year working in a manner which led to an improvement in the quality of their work or knowledge.
In the workbook provided by the IGI, the six areas are reported on separate forms. The hours worked are entered into the column provided beside a short description of the activity and the time the work was carried out. The corresponding PDHs are calculated automatically.
Similarly, the other five categories are reported on the forms provided.
- 'Formal Training' refers to courses where attendance is obligatory and during or on completion of which assessment may occur.
- 'Informal Activity' includes lectures and conferences attended which did not require any direct involvement.
- 'Participation' records time in which the member was active on bodies additional to their work duties, for example organising a conference or working on a committee of a geoscience association.
- 'Presentations' refers to any lectures given or conference sessions chaired which do not form part of routine work.
- Finally, 'Contributions to Knowledge' includes writing articles and papers or reviewing papers written by others.
These detailed forms transfer the PD Hs into the summary form which is submitted annually to the IGI. The detailed forms
are not submitted but are retained by the members.
At meetings held in 2000, IGI members strongly expressed the view that some mechanism must be established to monitor compliance with the CPD scheme. To this end, an Audit Committee will examine the CPD returns of a proportion of members selected at random each year and may seek additional detail from them in support of their submitted CPD forms. The IGI believes that with time the strength of this CPD scheme will serve the membership well.
Conclusions CPD provides a mechanism whereby professionals can continually improve and develop their skills throughout their careers. Furthermore, it provides the world outside the geosciences with tangible evidence that we endeavour to do a good job and have the commitment and means to maintain high standards. A more specific objective of the IGI is to persuade Irish regulatory authorities to require geological input from Professional Members of the IGI, or from equivalent professional organisations, in all appropriate work. CPD is one of the cornerstones of the IGI's case for such recognition of professional geologists; IGI Professional Members must not only be proficient and up to date in their areas of professional expertise but must also have the means to demonstrate that they have made this commitment. The IGI expects that the fruits of this scheme will be apparent over the coming decade.
References Fails, T. 2000. Continuing Professional Development: What is it? Is it important? European Geologist 10, 114-116.
Acknowledgements The author would like to thank Julian Menuge and Gareth Jones for reviewing this article. The IGI acknowledges with gratitude many other professional bodies which have contributed directly or indirectly to this scheme. Much work has been achieved in the UK and Canada and the IGI scheme has built on that experience.
29

Book Review: The Map that Changed the World
William "Strata" Smith's name occurs in introductory geology books and his name, probably because of his nickname, is remembered by most geologists. But until reading Simon Winchester's The Map that Changed the World: William Smith and the birth of modem geology, I failed to really appreciate the singular contributions that Smith made to geology. He not only "invented" stratigraphy, he single-handedly created the first modem geological map-of England, Wales, and part of Scotland no less. This is the map that changed the world.
Smith, the orphaned son of an Oxfordshire blacksmith, became a self-educated surveyor. His first "professional" job involved surveying coalmines near Bath where the miners soon taught him the local succession of rock layers containing the coals. The word "stratigraphy" used to describe such successions would not be used until several decades later. In fact, Smith appears to have been one of the first to use the term "stratification" in its geological sense and was the first to use "stratigraphical" in I 817. While miners had long learnt to recognize the individual characteristics of each coal seam and of the various rock layers in which they were found, Smith was the first to recognize that fossils could be used to differentiate between and thus correlate similar looking layers of limestone, sandstone, and other sedimentary rocks.
The italicized part of the last sentence summarizes Smith's initial, radical, and fundamental insight for the foundation of modem geology. As Smith put it on January 5, 1796, "Fossils have long been studied as great curiosities, collected with great pains, treasured with great care and at great expense, and showed and admired with as much pleasure as a child's rattle or hobby-horse is shown and admired by himself and his playfellows, because it
30
by David M. Abbott, Jr
is pretty; and this has been done by thousands who have never paid the least regard to that wonderful order and regularity which Nature has disposed of these singular productions, and assigned each class to its particular stratum" (underline in the original). Today this insight is an accepted world-view and seems obvious, even to those taking Geology 101. After all, most ofus learned about dinosaurs, extinctions, the evolution of life forms, and such in second grade. At the end of the Eighteenth Century this was not obvious. Genesis described the creation of the earth and all living things thereon and that was that. Only a few independent thinkers were beginning to have heretical thoughts that the 6 days of creation might be metaphorical rather than literal. Even 10-15 years later, when George Bellas Greenough, the first Chairman and later President of the Geological Society of London, began his
MAP THAT CHANGED THE
WORLD THE 1'Al8· bf
WILLIAM SMITH ·
AND
THE BIRTH OF ,I SCIENCE
project to create the first "accredited" geological map of England (plagiarizing Smith's work-there is much more on this in the book), Greenough wanted to create the map free of all theoretical concepts like using fossils to distinguish one layer from another. Without using Smith's insight, Greenough was unable to get anywhere.
Smith's first stratigraphic "publication" was a chart, "The Order of the STRATA and their embedded ORGANIC REMAINS, in the vicinity of BATH, examined and proved prior to 1799." Copies of this stratigraphic column were distributed to friends and by them to others, and soon became known around the world to those who were interested. Also in 1799, Smith produced the first modem geological map, which showed the geology around Bath, then the second city of England-remember your Jane Austin. Two years later, Smith prepared a "General Map of STRATA in England and Wales," which, although an early sketch, contains remarkable insight and accuracy. This map was the first draft of Smith's greatest undertaking and publiqttion, the "Delineation of the Strata of England and Wales, with part of Scotland; exhibiting the collieries and mines, the marshes and fen lands originally overflowed by the sea, and the varieties of soil according to the variations in the substrata illustrated in the most descriptive names," which was finally published on August I, 1815. The hand-coloured map is over 8 feet by 6 feet
The Map that Changed the World: William Smith and the birth of modern geology, By Simon Wincheste1; 2001, Penguin Viking, 338 p., ST£12.99. ISBN 0-670-88407-3

in size. Compared with modern maps, it is remarkably accurate-the book contains a colour plate with Smith's map and a modern map on opposite sides to prove the point. (The unusual dust jacket on the book folds out into a smaller scale copy of the map, so get the hard copy version.) This map was the map that changed the world. Unlike other maps oflarge regions, let alone countries ( even European ones), it was the sole work of Smith. Its creation was a truly remarkable achievement.
The title of Smith's great map hints at what Smith had been doing for much of the past 20 years, draining bogs, marshes, and fens (and building canals). Fired from an early position with a canal company near Bath, possibly overa conflict ofinterest involving his purchase of a house along a proposed canal route, Smith became a consultant, essentially the world's first consulting engineering geologist. His extensive travels around England on these commissions provided first the confirmation of Smith's hypothesis about the utility of fossils in identifying rocks and then the fieldwork required to make the map. Appropriately, the Geological Society's William Smith Medal is given for applied geology.
There is a great deal more to the story. Smith's lack of business sense resulted in a term in debtor's prison as his map was being published. Smith's humble birth and lack of formal education caused Greenough and other early members of the Geological Society of London to blackball him from membership and to plagiarize Smith's map in preparing their own version. Fortunately, like J. Harlan Bretz, Smith lived long enough to see such shunning reversed. Sir Roderick Murchison, Adam Sedgwick, William Buckland, and other true field geologists rose to power in the Geological Society and displaced the dilettante Greenough and his cronies. Smith was awarded the first Wollaston Medal by the Geological Society in 1831 and the Geological Society's geologic map of England and Wales was amended to acknowledge that it was based on Smith's great map. These aspects of the story, and many others, are well-told by Winchester, whose previous book, The Professor and the Madman, the story of the Oxford English Dictionary's creation, was a best seller.
Book Review: The Dinos r
Hunter by Gareth Jones, President
I started reading this well-illustrated paperback as a micropalreontologist with a general interest in larger fossils. However I very soon became totally enthralled by the story of fossil discoveries in Lyme Regis and elsewhere in the UK, which were inextricably linked with the birth of the science of geology in the nineteenth century.
Cadbury portrays the characters with great sympathy and amazingly interesting detail, derived from her very thorough research. These include Mary Anning, the impoverished local fossil collector, who found the first Ichthyosaur and Gideon Mantell, the doctor who became obsessed with collecting and understanding the meaning of these giant bones interred in solid rock.
She shows how the new "undergroundology" of the Rev. William Buckland evolved as he and his fellow enthusiasts unravelled the sequence of the rocks. At the same time they were also trying to reconcile their discoveries with the words of the Bible, but the more they discovered, the more difficult it became! Their understanding advanced until it finally culminated in Charles Darwin 's Theory of Evolution, which w,is thrust upon a Society whose minds were constantly being prised open in many new ways.
Interwoven:✓i'th the story of scientific progress is the picture of a class-ridden society and of bitter rivalries. None was
The Dinosaur Hunters. Deborah Cadbwy, Fourth Estate, London, 374pp. ST£7.99
greater than those of Richard Owen, the anatomist, zoologist and advisor of the Prince Consort, in his relentless upward progress. His cunning and vicious campaigns were especially directed against Gideon Mantell, in spite of the support of friends such as Charles Lyell and Prof. Silliman ofYale University.
This is a thoroughly absorbing and fascinating read, which combines good science and sympathetic character portraits. I highly recommend it and I have no caveats.
31

I
Name
Abbott, David Akerman, Christer Allen, Robert Gordon Alonso Lopez, Jose Antonio Anderson, Iain Antao, Ana Maria Archambault, Christian Arnal-Almendros, Jose Ramon Arthurs, John Ashton, John H. Ball, Timothy G. Baltuille Martin, Jose Manuel Barragne-Bigot, Philippe Barry, John Peter Bausch, Wolfgang Beck, Jochen Beckett, David Berczi, Istvan Betton, Regis Blanchere, Hughes Boissavy, Christian Boland, Michael Bonham, Oliver Bourges, Fran,;:ois Bouvier, Antoine Bowles, John Frederick Brassington, Frederick Bravi, Carlo Enrico Bruck, Peter Buchanan,. Kelvin Buchanan, Donald Burn, Robin G. Burnotte, Etienne L Busser, Wouter Butty, Dominique-Louis Cantrell, Becci Carbray, Alexander Carserud, Leif Carvalho, Jose Martins Casartelli, Alessandro Ceuppens, Jean-Claude Chabot, Andre Chin-a-Lien, Marcel Ciavola, Paolo Clifford, John A.
Cockerton, David George Collins, Fionnuala Brigid Colthuri;t, John Cook, Arthur William Copper, Jacob Cosma,Radu Cox, Christopher M. Cruise, Mark Csernussi, Gabor Cullen, Kevin Th. Cunningham, Mark
32
EurGeols 2001 Speciality
Geol Min EngGeol Min, 0th (exploration) Min Eng Geol, Min Hydro Oil Geol, Min, Educ, 0th Min, Geol, Comp
Rocks & Ind Min, Min, Geol Hydro
Hydro, Env Min,Geol Oil, Sediment Oil Nat Hazard, Modelling Min Hydro Geol, Min, Env, Ind Rocks & Min Min Env,Geol Geophys Min. Hydro,Env Eng Geol, Env, Geophys, hydro Educ, Geol Min, Geol, Ind Rocks & Min
Ind Rocks & Min Geol, Ind Rocks & Min, Educ Oil
Organisation
AIPG SN GS ICOG IGI APG UFG ICOG IGI IGI GS ICOG UFG IGI BDG BDG GS MFT UFG UFG UFG IGI IGI UFG UFG GS GS GS IGI AIPG GS IGI UBLG KNGMG
Geol, Geoph, Comp, Ind Rock & Min, Min CHGEOL Hydro IGI
Comp,Eduo Hydro Eng Geol, Env Hydro Hydro, Env Cons Geol, Geophys, Min, Oil
Geol, Min, Ind Rocks & min Eng Geol, Hydro Hydro, Env Geol EngGeol Oil Env
GS SN APG GS UBLG UBLG KNGMG GS IGI GS
)GI IGI GS KNGMG BDG GS
Min IGI Eng Geol, Env, Geol, Geophys, Hydro,Nat Haz MFT Hydro IGI EngGeol GS
Company
Sveriges Geologiska Undersiikning Costain-Taylor Woodrow J. V. Asturiana de Zinc SA Navan Resources PLC Instituto Politecnico da Guarda Archambault Conseil Repsol Exploracion SA Geological Survey ofN Ireland Outokumpu Zinc Tara Mines Ltd Soil Mechanics Ltd Instituto Tecnologic6 Geominero
Ingenieure & Geologen Outokumpu Minera Espafiola SA British Gas E&P MOL, Exploration and Production Division GIA lngenierie Comurhex Gaudriot Geotherma Ennex International Pie Rio Algom Exploration Inc Geologie Environnement Conseil
Mineral Science Ltd
ldromin SRL University college HB Engineering Group Conoco (UK) Ltd
Groupe Lhoist Nederlandse Aardolie Maatschappij Bureau Technique Butty Butty Herinckx & Partners BV Environmental Protection Agency I Sir Alexander Gibb & partners
TARH-Terra, Ambiente e Recursos Hidricos, Lda ERM Italia HYDRO-R&D Geobel Conseil Gaz de France Production Nederland BV Dipartimento di Geologia
Edmund Nuttall Ltd Eugene Daly Associates
Buro Rappold Nederlandse Aardolie Maatschappij Heildelberg Zement Management Roman.
Minorco Services (IRL) Ltd IMSYS Ltd KT Cullen Ltd Geotechnical Engineering Ltd

::..-----------------------------------------------------
EurGeols 2001 Speciality Organisation
EngGeol GS Geophys, Oil UFG Geol, Geophys,Oil, Env IGI Hydro IGI
Oil KNGMG Env,Geol IGI Min IGI Hydro, Comp, Env GS Geol,Hydro MFT
Comp BDG
Comp, Geol, Min, IGI
Hydr~,Env, ICOG
IGI Cons, Eng Geol GS
BDG
Oii AIPG
Ind ),locks & Min ICOG
GS
Oil, Eng Geol, Nat haz GS
Educ, Env, Hydro, Sediment UFG
E11g_Geol UFG
Min GS Cons, Iud Rocks & Mill GS
Oil KNGMG
Env IGI
GS .Oth ICOG
ICOG
ICOG
Min ICOG
Min IGI
Min, En:y IGI
Strati, palaeo, Ind Rocks & M41, Cons, Educ UBLG . Env, Hydro; Min, Nat Haz, Geol GS
Cons, :E:duc, Eng Geol, Env, Hydro UFG
Hydrp IGI
Geoph Min
Min, Env, Educ
Min, Eng Geol
Geol, Eng Geol, Hydro
Geol
EngGeol
Hydro
Min
Geol, geophys
GS
GS
IGI
IGI
IGI BDG
GS
UFG
ICOG
ICOG
IGI
Cons,Env GS
Geol, Sediment, Strati, oth GS
Geophys, Hydro UBLG
Eng Geo~ Env, Hydro GS
Strati (Biostratigraphy, Ind Rocks & Min, Karst) IGI
Min, IGI
Oil GS
Hydro, Env
Geol
GS
IGI
Company
Golder Associates (UK) Ltd
Exxon Mobil Development Co.
CSA
Geological Survey of Ireland
Nederlandse Aardolie Maatschappij
Environmental Protection Agency
Rio Algom Exploration Inc
MJ Carter Associates
FH Offenburg
Geological Survey of Ireland
lnstituto Tecnologic6 Geominero
CSA
Sandberg Consulting Engineers
Transportbeton Siidniedersachsen GmbH &Co KG
Geoscience Data Management
FUTUREtec
Halliburton/Security DBS
Richard Fox & Associates Ltd
Shell Deepwater Development Inc
KT Cullen Ltd O'Brien & Gere Engineers Inc
Baker Atlas Geoscience
SAMCA
CSA
Service Geologique de. Belgique
GES
Soleautec
KT Cullen Ltd
Stag Geological Services Ltd
CSA
Colorado School of Mine
South Crofty Ltd
Institut filr Geotechnik Dr. Jochen Zirfas
Hydrocarbon Geoscience Consulting Ltd
Solen
Geomecanica y Aguas
WEU/UEO
Geological Survey of Ireland
Quarry Products Association
Carnoc Services SPA Monopole
UKAEA
Conodate International Ltd
Glendower International Ltd
JBJ - Environment
Geological Survey of Ireland
33

Name
Keegan, Margaret Kelling, Gilbert Kelly, John G. Khan, Anwar H Riyasat Kissane, Stephen Knight, William Kong, Chi Seng Lambert, Andre C. Landrau, Eric Larkin, Peter David Lauwers, Alain Lechosa Estrada, Roberto Lehmann, Ernest Lemaire, Dominique Lewis, Deirdre Lilljequist, Robert Longden, Richard J. Lueg, Mathias Lyness, Lucien Stanley Maliphant, Paul Christopher Marron, Donal Marten, Brian McArdle, Peadar McCullough, Hugh McDaniel, Roy Thornton McHugh, John J. Mcinnes, Robin Meldrum, Andy H. Milne, Christopher Adam Moore, James Timothy Moran, Sean Morg!lll, Clare Morris, John Mouthier, Bernard Murphy, Bernard Naylor, David Nettleton, Ian Norbury, David R.
Norris, Simon Odinga, Marten O'Keefe, Noel O'Liathain, Micheal O'Neill, Joseph O'Neill, Shane Owen, Mark Lyndhurst Paproth, Eva Parkes, Matthew Alastair Patel, Madhusudan Peretti, Adolf Maria Persson, Lars Plotto, Pierre Poncela Poncela, Roberto Poulter, Stephen Roy Privett, Kevin D. Pyne, John F. Quenardel, Jean-Michel
34
EurGeols 2001 Speciality
Env Educ, Geol, Seel, Strati Comp, Env, Geol, Hydro, Ind rocks & Min, Min, Sed, Strati Eng Geol Geophys Hydro,Min Oil, Nat Haz, Eng Geol, Env, Hydro, Strati,Struct Geol Eng Geol, Min Min Hydro Eng geol, Env Sed, Ind Rocks & Min, min Eng geol, Min Min, Ind Rocks & Min, Geol Struct Geol, hydro, Educ Min, Sed, Strati, Env, 0th Geol EngGeol
Hydro Eng Geol, Min, Nat Haz
Geol, Struct Geol, Min Min Geol,Min Geol Min Eng Geol, Env, Geol, Nat haz Geol,Min Eng Geol, Hydro Env Env, Hydro Oil, Geophys, Geol
Env, Hydro, Min
Oil Eng Geol, Nat Haz Eng Geol, Hydro, Geophys Env,
Min Env,Palaeo Geol,Oil Hydro Min Palaeo, Sediment, Strati, Struct Geol Palaeo, Strati, Educ Eng Geol, Hydro, Geol Ind Rocks & Min, Educ, Geol, Min, 0th (Gemology) Cons, Eng Geol, Geol, Ind Rocks & Min EngGeol Hydro, Env, Eng Geol Hydro Eng Geol, Env Min Educ, Struct Geol
Organisation Company
lGI GS IGI GS GS GS GS UBLG UFG GS UBLG ICOG AIPG UFG IGI SN GS BDG GS GS IGI IGI IGI IGI GS IGI GS IGI GS GS IGI IGI IGI UFG IGI IGI GS GS GS GS IGI GS IGI IGI GS BDG IGI,
AIPG CHGEOL SN UFG ICOG GS GS IGI UFG
Environmental Protection Agency School Earth Sciences & Geography CSA Al-Hoty-Stanger Ltd Knight Piesold Ltd
Sysmin Coordination Unit Hydra Consultores s.l. Costain Civil Engineering Groupe Lhoist Inytram Geologos Consultores SL North Central mineral Ventures Inc IGAL CSA Ecominas Owen Williams Railways
Komex International Ltd Halcrow Group Ltd KT Cullen Ltd Rio Tinto Mining & Exploration Ltd Geological Survey of Ireland Glencar Mining Pie
Sampo Resources (T) Ltd Isle ofWight Center for the Coastal Environment GleniffExploration and Mining (Irl) Ltd Hyder consulting Ltd Roy F. Weston, fuc O'Callaghan Moran & Associates Department of the Marine and Natural ResQurces Geological Survey oflrelahd
BMA
Transport Research Laboratory Soil Mechanics Ltd UKNirexLtd M.O. Geological consulting Ltd Ormond mining plc Environmental Protection Agency CSA O'Neill Ground Water Engineering South Crofty Ltd
Geological Survey of Ireland AMEC Earth and Environmental, Inc. GRS Gemresearch Swisslab AG Sveriges Geologiska Undersokning IMS RN
5RK Consulting Department of the Marine and Natural Resources Univ. Franche Comte

EurGeols 2001 Name Speciality Organisation Company
Regueiro y Gonzales-Barros, Manuel Ind Rocks & Min ICOG Instituto Tecnologic6 Geominero Reid-Green, John GS Reynolds, Neal A. Min IGI Reynolds, John Michael Geohys GS Reynolds Geo-Sciences Ltd Rhoden, Henry Neville Min,Oth GS Richards, Brian Anthony GS GPB Gypsum Ltd Robert, Jean-Fran9ois Ind. Rocks & Min. UFG Talc de Luzenac Roberts, Martin John Oil GS Roch, Antoine Geol, Comp UFG Geograph Saenz de Santa Maria Benedet, Jose Antonio Min ICOG Hunosa Sagar, Karen EngGeol GS Corns Rail Consultancy Ltd Sanson Cerrato, Jose Nat Haz, Env, Hydro ICOG Unidad de Protecci6n Civil Sapalsky Rosello, Cristina Diana Ind Rocks & Min ICOG Savage, Norman Palaeo, Strati GS University of Oregon Schaffalitsky de Mukadell, Christian Min IGI Ennex International Pie Scharek, Peter Env,Geol MFT Hungarian Geological Survey Schittekat, Jacques Eng Geol, Hydro, Env UBLG Tractebel Development Seebold Imbert, Iguacio Min ICOG Asturiana de Zinc SA Shanklin, John GS Sides, Edmund Min IGI ITC Slowey, Edward IGI Sommers, David A. Hydro,Env GS Remedial Action Corp Soriano Carrillo, Jesµs Cons, Ind Rocks & Min ICOG Cedex Speehnan, Hessel Geol KNGMG TNO Institute of Applied Geosciences Speksnijder, Arie Oil, Geol, Educ KNGMG Shell Leaming Center Spencer, David Anthony StructGeol GS Saga petroleum Stanley, Gerard Comp, Geol, Min IGI Geological Survey of Ireland Stephenson, John EngGeol GS Soil Mechanics Stevenson, Christopher John Oil, Geophys GS Elf Exploration UK Pie Stokes, Robert B. Educ, Palaeo, Cons GS School of Geological Sciences Styles, Peter Geophys GS University of Liverpool Suaiez Ordonez, Luis Eng· Geol, Law ICOG ICOG Swales, Jonathan Mark EngGeol GS Soil Mechanics Ltd Tear, Simon J. Min IGI Teel, Derick Brem GS American International Group Inc. Testa, Stephen M. Env, Eng Geol, Nat haz AIPG Testa Environmental Corp. Tomasek, Pavel Eng Geol, Hydro, Geophys BDG Ecce Geo
j Van Calster, Paul G. Geol, E~g Geol UBLG Geologica SA Van Moerkerken, Bruno Comp KNGMG Geodisq Van Stuijvenberg, Johannes Eng Geol, Env, Geol, Hydro, Sed KNGMG Vasard Nielsen, Marianne Palaeo IGI Verbruggen, Koenraad Min IGI Ormonde Mining Vercruysse de Solart, Jacques Env UBLG WatcoR.S. Vernet, Alain Jean EngGeol ,. UFG Cabinet d' Expertise Vernet Verriere, Herve Eng Geol, Env, Geol, Geophys, H~ Nat Haz UFG Hydro.Geo.Consult Villa, Floriano IGI Angi Villeger, Marc Oil UFG Peyto Explo & Dev. Corp. Vining, Bernard Adrian Oil GS Walbe, Kim Arthur Oil IGI Walbe &Associates Ltd Ward, Mary-Claire Geol, Min, Ind Rocks & Min, 0th IGI . Watts, Griffis & McOuat Westerhof, A.B. Phil Educ, Ind. Rocks & Min., Min KNGMG ITC Winfield, Guy Matthew Cons GS Sandberg Wong, Chik-Hai Francis Eng Geol, Educ, Cons, Geol, Hydro, Nat Haz GS Campus Development Office Woolfson, Peter J. Oil GS TerraCom Consultancy Ltd Zwahlen, Peter Geol, Eng Geol, Nat Haz CHGEOL Geotechnisches Institut AG
I
35

A Review of a Proposed CPD Program for Certification of Professional Geol
ogists in the 21st Century
AIPG's Continuing Professional Development program is a "Certification Advancement and Maintenance Program" (CAMP) based upon Continuing Education and Professional Participation. CAMP provides a framework for self-determined, continuing professional development plans for participating Certified Professional Geologists (CPGs). Participation is voluntary for existing CPGs, but mandatory for CPGs certified after adoption of the CAMP Bylaws.
Annual CAMP activities in three areas - Continuing Education (CE), Professional Participation (PP) and Technical Contributions (TC) - are recorded in annual logbooks. Points based upon time and activity values are calculated and recorded. Each CAMP year goal is 20 points, equally divided between CE and PP activities, with TC points substitutable for either. After six years, an Advancement application, with six logbooks, is submitted to AIPG. Applications are reviewed at the Section (i.e. State) and National levels.
Applications with 120 or more points will advance to Certified Master Professional Geologist (CMPG) for the coming six-year CAMP period. Voluntary participants with less-than 120 points remain CPGs. Mandatory participants who do not advance in two consecutive CAMP periods are sanctioned.
Tom Fails, Chair, Task Force for Continuing Professional Development, AIPG
36
by Tom Fails
Le programme de Formation Continue des Geologues de l'AIPG est un Programme de Certification professionnelle et de maintien des connaissances (CAMP), base sur une remise a niveau, continue des connaissances avec participation effective sur les plans academique et professionnel. Le CAMP
represente un cadre de travail personnel pour les Geologues Professionnels Certifies (CPGs) qui desirent suivre une formation continue. Cette formation sous forme de volontariat pour les geologues certifies est obligatoire pour les geologues certifies qui ont adopte les statuts du CAMP.
Les activites annuelles du CAMP dans les trois domaines: academique (CE), professionnel (PP) et contributions techniques (TC) sont consignees dans des registres. Une evaluation sous forme de points est faite en fonction de la duree et du contenu de la formation. L'objectif est d'atteindre 20 points par an et un equilibre entre les activites CE ou PP avec un apport TC eventuel dans l'un ou l'autre de ces deux domaines. Au bout de six ans, une demande de Certification, au vu des six registres, est soumise a l'AIPG. Les demandes sont examinees aux niveau Etat( Section) et National.
Les demandes soumises avec un minimum de 120 points conduisent au titre de Geologue Professionnel Certifie, Ma1tre et ce pour une duree de six ans. Les geologues avec moins de 120 points restent CPGs.
Les Geologues certifies avec obligation de formation continue mais une progression insuffisante pendant deux periodes de CAMP sont sane- · tionnes.
El programa Desarrollo Continua Profesional de la AIPG es un Programa de Avance y Mantenimiento (PAM) que se basa en una Educaci6n Continuada y una Participaci6n Profesional. PAM proporciona un marco para planes autoprogramados de desarrollo profesional continua para Ge61ogos Profesionales Titulados (GPTs). La participaci6n es voluntaria para los GPTs actuales, pero obligatoria para los GPTs titulados tras la adopci6n de las Leyes PAM.
Las actividades anuales de la PAM en tres areas - Educaci6n Continua (EC), Participaci6n Profesional (PP) y Contribuciones Tecnicas (CT) - se recogen en cuadernos de trabajo anuafes. Se calculan y registran unos puntos que se basan en los valores de tiempo y actividad. El objetivo de cada ano PAM son 20 puntos, repartidos en partes iguales entre actividades CE y PP, con los puntos TC substituibles por cualquiera;de los dos. Tras 6 anos, se somete al AIPG una Solicitud de Avance (SA), con seis en cuadernos de trabajo. Las solicitudes son revisadas a nivel de Secci6n ( es decir Estado) y Nacional.
Las solicitudes con 120 puntos o mas pasaran a Ge61ogos Profesionales con Tftulo Master (GPTM) para el siguiente periodo PAM de 6 anos. Los participantes voluntarios con menos de 120 puntos continuan como GPT. Los participantes obligados por ley, que no avancen en dos periodos PAM consecutivos son sancionados.

The Program Proposal for a Certification Advancement and Maintenance Program (CAMP) is the most recent response to a 1997 national AIPG Executive Committee Charges-"to study and report on the feasibility and desirability of introducing requirements for I) Continuing Education for renewal of CPG, 2) for Examinations for granting of Certification, and 3) for requiring periodic re-certification." The current Program Proposal responds to the first and third of the 1997 Charges. A certification renewal program based upon Continuing Education and Professional Participation is proposed as a CERTIFICATION ADVANCEMENT AND MAINTENANCE PROGRAM, or CAMP, which is described below. Charge 2 for an AIPG examination remains partly satisfied, as a recommendation for an examination requirement was tabled by the I 999 Executive Committee to allow additional discussion and consideration. Exams remain on the Task Force agenda and will be reconsidered after a broader investigation of examination alternatives has been completed and the current Program Proposal has been accepted. While CAMP will not by itself bring AIPG to a level competitive with our professional engineer peers, it goes most of the way, with an examination requirement bringingAIPG to parity. With both an examination requirement and the CAMP in effect, CMPG and CPG would exceed the most stringent state registration requirements as marks of geological professionalism.
The CAMP Proposal and accompanying CAMP Logbook are the end result of a two-and-a-half year effort by the I 8-CPGmember Task Force for Continuing Professional Development. Task Force members have worked long and hard on this project-they deserve the thanks of all CPGs.
Certification Advancement and Maintenance Program Proposal The Proposal and Logbook published in the June 2000 TPG are the documents recommended by the Task Force to the 200 I Executive Committee for consideration and adoption. They contain a great deal ofnecessary detail, including implementation and operation of the Certification Advancement and Maintenance Program. A brief discussion of the main program parts follows.
The CAMP provides a guide and framework for a continuing, self-determined, personal development plan that
includes continuing education, professional practice, and participation in the affairs and activities of professional geoscience organizations. All are integral parts of Continuing Professional Development (CPD). Many CPGs have been involved in these activities throughout our careers. CAMP involves setting rational and meaningful annual personal goals, which as they are met, are recorded and point-valued in an annual written record or Logbook. There are two categories of activities under CPD, Continuing Education and Professional Participation. Points based upon time and activity value would be assigned to each activity using Logbook guidelines. The goal is to obtain I 0 points each in Continuing Education and Professional Participation in each year of the 6-year CAMP period, but considerable flexibility will be available. Points also can be earned for authoring talks and publishing peer-reviewed papers, posters, monographs, and books on geoscience subjects. Teaching short courses and leading field trips earn points as well, if on a non-paid basis.
At six-year intervals, the Logbooks, supporting data and an Application for Certification Advancement would be submitted to the Certification Renewal Director at Headquarters. As with CPG applications, they would be screened, first at the Section level and then by a National CAMP Screening Committee. Applicants who had accumulated 120 or more approved points during the 6-year CAMP period, half each in Continuing Education and Professional Participation, would be recognized and rewarded with advancement to or maintenance as Certified Master Professional Geologist (CMPG) for the coming new 6-year CAMP period. CPGs who had accumulated 80 to I 19 points would maintain their CPG rank for the new CAMP period. Up to 10 points (in excess of 60 points in each category) could be carried forward into the first year of this new CAMP period. ··· i
It is difficult for some participants to attend short courses and Section activities due to distance, continuous travel, graduate school, etc. They lack opportunities to earn CE and/or PP points. Flexibility has been built into the CAMP to help affected CPGs earn substitute points in the CAMP.
The whole idea is to help CPGs con• tinue, maintain, and improve their technical education, training, competen;;:e,
and competitiveness, and to participate actively in the activities, affairs, and leadership of AIPG and their nationaV regional geoscience technical societies. In exchange for six years of participation in CE and PP activities, recorded in a Logbook, AIPG will renew most participant's certification for six years as CMPG or CPG for every 6-year CAMP cycle. Further, AIPG will provide upon request of CMPGs and CPGs a written credential verifying their participation for one or more six-year periods in an individual program of continuing professional development, based upon continuing education and participation in professional affairs.
Qualifying Activities A wide variety of educational activities can earn points for the Continuing Education requirement. Personal taste and flexibility are maximized. They include:
B.S./post-B.S. Formal Education for academic credits, CEUs, or in company training courses:
in geosciences, other physical sciences, engineering, math, and computer sciences;
or in other relevant disciplines, including business, management, law, accounting, etc.;
points are awarded on a contact hour and discipline basis;
classroom and internet courses for credits or CEU s are equally acceptable if completed successfully.
Supplemental Education, not for academic credit, including:
auditing of formal educatiqh courses, as above;
geoscience short courses/fj'eld seminars;
auditing of geoscience talks or papers, especially at geoscience conventions/ conferences;
in-house company geoscience courses;
points are awarded on a contact hour and discipline basis.
Courses taken as requirements of other geoscience organizations, state boards will earn points as well, and state regulated review and update course.
Similarly, a very wide variety of activities, many designed to increase participation by CPGs in the affairs, activities, and leadership of· AIPG and the geoscience technical societies or in corn-
37

munity affairs, will earn points for the Professional Participation requirement of CAMP. They include:
professional practice, defined-as "fulltime" employment or personal practice in a geoscience discipline or associated/dependent work;
participation in the activities and leadership of AIPG (Sections and National) and national, regional, and state geoscience technical organizations, State Boards, and ASBOG;
active volunteer work in geologyrelated outreach activities and/or nontechnical community service activities;
Professional Participation points may be earned for a wide variety of service activities, making the CAMP very flexible.
Points can be earned for Technical Contribution activities such as:
presentation of non-peer reviewed talks or publication of peer-reviewed papers, monographs and books;
preparation and presentation on an unpaid basis of geological courses or field trip planning and leadership on a non-paid basis by both academics and non-academics;
point allocations, up to 25, are generous as these activities represent the ultimate in geologic professionalism;
TC points may be applied against
either Continuing Education or Professional Participation point requirements in any given year, and can be carried forward until totally used.
How Camp Will Affect Currently-Existing CPGs and "New" CPGs
The CAMP process, requirements, and Logbook described above would be the same for all participating CPGs and CMPGs. However:
"Existing" CPGs (those certified prior to the adoption date of the new Bylaws establishing the CAMP) may participate in CAMP voluntarily and apply for advancement to CMPG. Those not voluntarily participating will remain CPGs in good standing.
"New" CPGs (those certified after the adoption date, as above) will be required to participate in the CAMP for so long as they hold CPG or CMPG rank.
CAMP Outcomes:
"existing" CPGs or CMPGs voluntarily participating in the CAMP will advance to or maintain CMPG providing the 120-point requirement is fulfilled for a 6-year CAMP period. Those not meeting the 120-point requirement will maintain their CPG rank, no matter how few points are earned. CAMP participation in a second 6-year CAMP period will be voluntary, except to maintain CMPG.
"new"CPGs:
End, first mandatory 6-year CAMP period:
120 or more acceptable points -advance to CMPG for new 6-year period in CAMP;
less than 120 acceptable points - maintain CPG for new 6-year period in CAMP.
End, subsequent mandatory 6-yearCAMP periods:
120 or more acceptable points -advance to or
maintain CMPG fornew 6-yearCAMP period.
119-80 acceptable points - CMPGs reclassified to CPG for new 6-year CAMP period; - CPGs maintain CPG for new 6-year CAMP period.
less than 80 acceptable points - CMPGs and CPGs reclassified to Member for 3 years, then eligible to re-apply for CPG subject to mandatory CAMP.
Summary The programs, process, and requirements discussed above describe in outline the initial proposal for the CAMP. This is a work in progress that will remain subject to adjustment and change in the future, especially during the first few years of operation.
I
Public Reporting by Canadian Resource Companies
Public disclosure of scientific and technical information about mineral projects held by Canadian companies is governed by NI 43-10 I. Disclosure, which includes oral statements as well as written documents and websites, must be based on infonnation provided by a "qualified person" (as defined in NI 43-101). NI 43-101 requires a company to file a technical report at certain times, prepared in a prescribed format. In some circumstances, the qualified person is to be independent of the company and the property. A Company is required to use specified terminology when disclosing resources and
38
by EurGeol John A Clifford PGeo
reserves. The terminology used in the Reporting Code adopted by the EFG/ IGI/IMM meets these requirements.
One of the conditions to be a qualified person is membership in a "professional association" as defined in section 1.2 of NI 43-101. The Canadian Securities Administrators (CSA) have now announced that for the purpose of being a "member of a professional association" CSA staff will accept a person who holds the title European Geologist from the European Federa•
tion of Geologists (EFG). This highlights the international recognition of the EFG standards and the value of holding the EurGeol title.
Further details on NI 43-10 I, together with its Companion Policy 43-10 I CP and Form 43-I0IF!Technical Report, can be found on the following websites:
BC: www.bcsc.bc.ca Ontario: www.osc.gov.on.ca Quebec: www.cvmq.com Alberta: www.albertasecurities.com

EFG Council Meeting in Krakow June 2001
The EFG Council Meeting in Krakow, Poland in June 2001 was hosted by Polskie Towarzystwo Geologiczne, Polish delegate Andrzej Slaczka and the Director of the Geological Institute of Krakow, Prof Dr. Hab. Tadeusz Peryt. They were all thanked for a very pleasant and successful meeting in a lovely setting.
New members Applications for membership were received from Jan Schrofel of the Unie Geologickych Associaci of the Czech Republic and Helgi Torfason of the Geological Society of Iceland and both national associations were elected as full members with acclamation.
Board The election ofDetlev Doherr, BOG, Germany to the EFG Board as the new EU Delegate was welcomed. He is in charge of formal contacts with EuroMPs, the European Commission and other EU representatives. He is working with Isabel Fernandez on lobbying and other EU/EC activities. Detlev replaced Marianne Vasard Nielsen of Denmark who was thanked for the important, ground-breaking work that she carried out to establish contacts in Brussels.
EuroGeoSurveys Present as a guest at the meeting was Emile Elewaut, the Executive Director of the EuroGeoSurveys, who explained the kind of work that he was doing for them. It is hoped that EuroGeoSurveys and EFG can support each other when this is appropriate.
Brussels Progress with the Brussels office at the Geological Survey of Belgium was reported (now open), as well as the work being carried out by the EFG Brussels Agency Chieflsabel Fernandez.
CPD The Council decided that it would become mandatory for holders of our professional
by Antoine Bouvier & Gareth Ll. Jones
title of European Geologist (EurGeol.) to adopt CPD (Continuous Professional Development).This will apply whether the
. geolog:3t holds his title through one of the new Licensed Bodies or through the traditional National Association Vetting Committee route to the EFG Registration Authority. It is vital for the EurGeol. title to keep pace·with the requirements for professional development around the world and to bring about mutual recognition of professional titles.
EurGeol title The EurGeol title is to be relaunched through the setting up of a Registration Authority ( to replace the Registration Committee) and Licensed Bodies (National Associations) able to nominate EurGeols directly. At present only Ireland, UK and Spain can qualify as a Licensed Body. However both procedures for awarding EurGeol are kept valid.
Richard Fox was accepted as the new Chair of the Registering Committee/ Authority, replacing Eric Groessens, who was thanked for the work carried out over the 6 years of his two terms as Chair.
New Code A new Code for Reporting of Mineral Exploration Results, Mineral Resources and Ore Reserves was adopted, to work in
The Board of the EFG meets with Minister for Mines D,: Tadeusz Bachleda-Curus. 4th from right.
parallel with that being developed by the UN task force.
A second guest speaker was Norman Miskelly, Deputy Chairman, International Relations-JORC, who rated the Code as an excellent Document. The Code is intended to educate first, to promulgate and to be a common framework in the mineral industry. It will be a model for the World Code to be elaborated during the incoming years by experts from Europe, USA, Canada, South Africa, Australia & UK who have already discussed the terms of references.
World Geologists Manuel Regueira, Secretary ofWorld Geologists reported that WG has recently acquired the status of ECHO contractor, after gaining a DIPECHO project in San Salvador. The NGO is growing rapidly with an increasing membership and new branches in Sweden and in Turkey.
Magazine The European Geologist magazine N° 11 is now under the new editorship of Steen Laursen and Maureen McCorry in Denmark. It has just been published after its printing in Slovenia and the future support of delegates was promised. i
The meeting closed with some delegates taking an excursion to the nearby salt mines.
39

New and Oriented Core Evaluation Method: IMAGEO
A new field instrument has been developed by Hungarian experts with the aim of orienting geological features visible on core surfaces. It is a very old geological problem, that the cores lose their orientation due to the drilling process. The real space orientation of geological features is essential for tectonic, neotectonic analysis. We have developed a complex core evaluation system, that solves this problem and so a new generation of core logging process is born.
ImaGeo mobile corescanner creates an optical image of the core surface with 10 pixels/mm resolution and the linked softwares orient the cores with the help of acoustic borehole televiewer images. With CoreDump software one can evaluate the scanned images, orient the evaluated planar features that are stored as vectoric objects in a GIS database, as well as make statistical analyses in the form of stereogram, rose diagram, pole distribution diagram and maximum wandering diagram. This latter is a new method for showing the changes in the distribution maxima with depth. As a result of the method, fracture zones, lineations, layers, etc. can be distinguished and placed into real space. With CoreTime software one can evaluate the time succession of the vectoric objects throughout the borehole or the exploration region. The third software module is PetCore which is an image processing software. The user can teach the software to classify the pixels of the image. With this process the module automatically evaluates the whole image and displays the results. During the scanning process, a time and cost saving analysis of the cores can be done with the help of LIPS. It is a laser induced plasma spectroscope connected to the ImaGeo system. It can also measure on-site.
A short case history is given from the field of low and intermediate level radioactive waste disposal in Hungary.
Geological Institute of Hungary, Eotvos Lorand University Space Research Group.
E-mail: [email protected] [email protected]
40
by Gy Maras and Sz Pasztor
Un nouvel instrument de terrain a ete developpe par des experts hongrois dans le but d'orienter les caracteristiques geologiques visibles a la surface des carottes. Le fait que les carottes perdent leur orientation en raison du processus de forage est un tres ancien probleme geologique. La veritable orientation spatiale des caracteristiques geologiques est essentielle pour !'analyse tectonique et neotectonique. Nous avons developpe un systeme complexe d'evaluation de la carotte permettant de resoudre ce probleme, faisant apparaitre une nouvelle generation de processus de diagraphie de la carotte. Le scanner mobile ImaGeo cree une image optique de la surface de la carotte avec une resolution de 10 pixels/mm et les logiciels associes orientent les carottes avec !'aide des images acoustiques du trou de forage sur l'ecran de visualisation. Avec le lo~iciel CoreDump on peut evaluer les images numerisees, orienter les caracteristiques planes evaluees stockees comme des objets vectoriels dans une base de donnees GIS (Systemes d'informations geographiques), et aussi faire des analyses statistiques sous forme de stereogrammes, de diagramme en rose, de diagramme de distribution polaire, et de diagramme wandering. Cette derniere est une nouvelle methode permettant de montrer les changements dans les maxima de la distribution avec la profondeur. On pourra alors distinguer les zones de fracture, les lineations, les couches etc. et les replacer dans l'espace reel. Avec le logiciel CoreTime on peut evaluer la succession temporelle des objets vectoriels dans le trou de sondage ou la region de !'exploration. Le troisieme module est PetCore, un logiciel de traitement d'images. L'utilisateur peut parametrer le logiciel pour classer les pixels de !'image. Avec ce processus le module evalue automatiquement !'image entiere et affiche le resultat. Pendant le processus de numerisation, une analyse econome en temps et en cout des carottes peut etre faite avec !'aide de LIPS. C'i;stun spectroscope a plasma produit par laser, connecte au systeme ImaGeo. II peut mesurer aussi sur le terrain. Nous exposons une courte etude de cas de terrain d'enfouissement de dechets hautement et moyennement radioactifs en Hongrie.
In the late nineties we began the development of the ImaGeo mobile corescan system (Fig. 1). The main purpose of this development was the proper evaluation of the boreholes drilled during the geological exploration of a radwaste disposal site in Hungary. It was constructed to solve a classical geological problem, namely
Un nuevo instrumento de campo ha sido desarrollado par expertos de Hungria con el animo de orientar sabre los rasgos geol6gicos en la superficie de los testigos. Es un viejo problema geol6gico, que los testigos pierdan su orientaci6n debido a los procesos de perforaci6n. La orientaci6n. real de los rasgos geol6gicos es esencial para la tect6nica, analisis neotect6nico. Nosotros hemos desarrollado un sistema de evaluaci6n de testigos complejo, que solventa este problema y par tanto un nuevo proceso de registro de testificaci6n ha nacido.
ImaGeo mobile corescanner crea una imagen 6ptica de los testigos con resoluci6n de 10 pixels/mm y el programa de enlace orienta los testigos con ayuda de imagenes televisadas de sondeos acusticos. Con el programa informatico CoreDump se puede evaluar la imagen escaneada, orientar los rasgos con una evaluaci6n par pianos que son almacenados con puntos vectoriales de base de datos GIS, asi coma analisis estadistico en forma de esterograma, diagrama de rosa, diagrama de distribuci6n polar y diagrama de maxima. Este ultimo es un nuevo metodo que muestra los cambios de distribuci6n maxima con la profundidad. Como resultado de este metodo, las zonas de fractura, alineaci6n, capas, etc. pueden diferenciarse y emplazarse en el espacio real.
Con el programa CoreTime se puede evaluar la sucesi6n temporal de los puntos vectoriales en el sondeo o en la region explorada. El tercer modulo del programa es PetCore que es una imc1gen del procesado informatico. El uso del progran-fa puede ensefiar a la clasificaci6n de pixels de la imagen escaneada en las distintas imagenes geol6gicas usadas y definidas, en base al color de la imagen. Con este proceso el modelo automaticamente evalua el conjunto de la imagen y la salida de los resultados. Durante el proceso de escaneado , tiempo y costo del analisis de los testigos puede ser dado con la ayuda de LIPS. El cual es un laser inductor de un espectroscopio conectado al sistema ImaGeo.
Se expone un ejemplo corto de campo procedente de residuos radiactivos de bajo e intermedia nivel en Hungria.
that the cores lose their orientation due to the drilling process. We intended to add a detailed database of different types of oriented fractures, infillings and other geological features to a fracture model and/or a hydrodynamic model. This oriented database was and could be set up with the help of the ImaGeo system.

Hardware features of the system Digitizing and evaluation of the data begins immediately at the drilling site with the help of the corescanner and the computers installed in the equipment van. The corescanner feeds the rastered image recorded in the optical range by a digital camera unit into the evaluating computer. The 254 DPI resolution images (1 pixel information in each 0.1 mm) are analysed after setting, saving and archiving them with the help of the evaluating software modules. Since during scanning, the surface of the whole core is digitized (maximum 80 cm in length and 20 cm in diameter), the planar elements (such as fractures, veins, etc.) appear as sinuous lines (Fig. 2).
Software The images obtained by scanning are evaluated by CoreDump software. As the first stage of the evaluation, the geological features are drawn in vectorial form onto the images: fractures, petrological borders,
Fig. 1. An ImaGeo scanned image demonstrating microlayering; a listric synsediment microfault and an infilled desiccation crack with turned-up layers, Boda Siltstone Formation. The vertical edge of the image represents 2 cm.
layers, crossbeddings, carbonate veins, quartz veins, microgranite veins, shear zones, foliation, limonitic infillings, argil-
51.4
321 planes
0.0
Fig. 3. Pole distribution and maximum wandering diagram compiled from foliation data (Borehole Uh-23). The slightly folded foliation seems to be symmetric on the pole distribution diagram, but on the maximum wandering diagram it is clearly seen that the distribution of the foliation is not uniform, but depends on the depth. (Maros and Palotas, 2000b)
laceous infillings, altered zones, etc. These evaluated elements will forthwith be called objects. The individual object types are collected in a database on a user-defined layer system. The software gives the dip, azimuth and depth of the evaluated object in relation to a chosen marker, as a local coordinate system fixed to the core.
The next stage of the evaluation is the orientation of the marker-zones into the real coordinate system. For this purpose, the acoustic borehole televiewer (BHTV) image is used. This image can be visualized in CoreDump as well as the evaluated objects.
Once the cores are orientated, a very sophisticated object selection can be made and several statistical programme modules aiming at tectonic analysis can be run to produce stereograms, rose diagrams, tadpole diagrams, pole distribution diagrams and maximum wandering diagrams (Fig. 3). The calculation of the pole dis-
tribution diagram uses a new basis. The maximum wandering diagram is a completely new method (Maros and Palotas, 2000b) that we introduced to be able to show the changes of distribution maxima with depth. It is difficult to plot the depthdependency of the distributions on stereograms, pole distribution diagrams and rose diagrams, and plotting a large number of diagrams after each other can be uninterpretable and confusing. As a solution to this problem, we developed the maximum-wandering diagram, which is azimuth- and dip-correct, similar to the poledistribution diagram and the stereogram, as well as showing the depth-dependency of the density maximums. The distribution has one or more maxima in a given section of the borehole. If this section is shifted along the borehole, the distribution as well as the maxima will change. The length of the section arid the steps can be changed. The maximum points are plotted in succession in! the maxi-
Fig. 2. An ImaGeo scanned image showing the main evaluation tools. Aplite veins and carbonate infillings, J,-actures and all other planar features look sinusoid due to scanning the whole rock surface.
41
200.om
180.Dm
1so.om
140.om
120.om
100.0m

Fig 4. Part of a scanned image ji-om granitoid rocks. Left: original image with patches and polygons of the learning phase, right: automatically evaluated image.
mum-wandering diagram .and the maximum points of succeeding sections are linked with a line showing their connection, in case they fall close to one another. Maximum points derived from one pole are not indicated in the diagram. The diagram shows information about the depth with the help of colours. The colour of a dot refers to the depth of the pole distribution maximum. Here the colour scale is in linear connection with the depth.
The different features are separated in a database after evaluating the images; in this way it becomes possible to analyze their distribution separately. First, the spatial differences of the phenomena are examined, that shows in the nature of the distribution of the azimuths and dips as well as in their change in depth. The different objects enter the database separately and occupy their final position after rotation and adjustment to the borehole televiewer image. The different object-types correspond to the properties of the rock, so their uniform or chaotic distribution is characteristic of the history of the rock.
It is, therefore, clear that the main advantage of the ImaGeo system over BHTV is the 50+ times better resolution as well as the visually separable feature types that can be individually evaluated.
Another software module is CoreTime, which is developed for time succession analysis (Maros and Palotas, 2000a). During the CoreDump evaluation of the
42
objects, the time-sequence of the individual objects can be fixed with the help of CoreTime. This can be done by reason of certain geological considerations. An object, for example, is younger than another if it changes the spatial position of the other in any way (moves it along a fault, changes it in a ductile way), if its texture overprints the other's or if an infilled object has a sharp border and is situated closer to the middle line of a fracture. The time-rank always applies to two objects at a time and the relative ranking can be "younger", "older" or "simultaneous". The software ranks the objects of identical type into timesets. The ageclassification can be direct, which is determined by the user on the basis of his/her direct observation or indirect, which is generated automatically by the software. At the end of the evaluation the user prepares a contradiction-free age-classification among the timesets with the help of the already automatically contradictionfree time-relations of the objects.
The third module is PetCore (petrology of cores), which is an effective image processing software. It uses 10 pixel/mm resolution and makes petrologic evaluation of the scanned images. It is assumed that the identical or similarly coloured pixels of the image belong to an identical geologic phenomenon. First the user makes a geological classification of the image, distinguishes the separable geo•
logical phenomena and establishes the pixel classes based on this. After that the user can teach the software to classify the pixels into the previously defined geological image classes. After this iterative process the module automatically evaluates the whole image and displays the results (Fig. 4) or figures in varied diagrams.
Since the programme can distinguish the different mineral grains because of their different colours it can also count their grain size orientation. Optionally, all mineral grains can get an individual orientation mark. This statistical distribution of grainsize orientation can be displayed. If any planar distribution can be observed on the image, it can be incorporated into the CoreDump evaluation. Otherwise the programme uses the database of CoreDump so even the intervals of different boreholes can be evaluated and compared.
During the scanning process a time and cost saving analysis of the cores can be done with the help of LIPS (developed by ELGI and Oplab Ltd. in Hungary, Andrassy et al 1995). It is a laser induced plasma spectroscope connected to the ImaGeo system. It can also measure on the spot. This equipment can make inexpensive, fast, oriented field measurements available. During the scanning process in the field the user can define, on the displayed scanned image, the points of the core surface to be measured. The LIPS moves to that point of the core surface and shoots the given point. The results are partly qualitative, partly quantitative depending on the measurable elements, and can be incorporated into thy CoreDump database and displayed with all its refined methods. The calibration of this method is under development now.
Tectonic examples Tectonic studies play an important role in research into final disposal of low and intermediate radioactive waste, particularly in the understanding and modelling of the geological environment of the disposal site. The exploration of the site using boreholes is in progress in Hungary (Balla, 2000). About 3000 m of core are being evaluated in slightly metamorphosed granitoid rocks near Dveghuta (Mecsek Mts, Southern Hungary). The following results on the mesotectonic features are based on corescanning evaluation.
In the 340-350 Ma old Variscan granite, four main types of rocks can be dis-
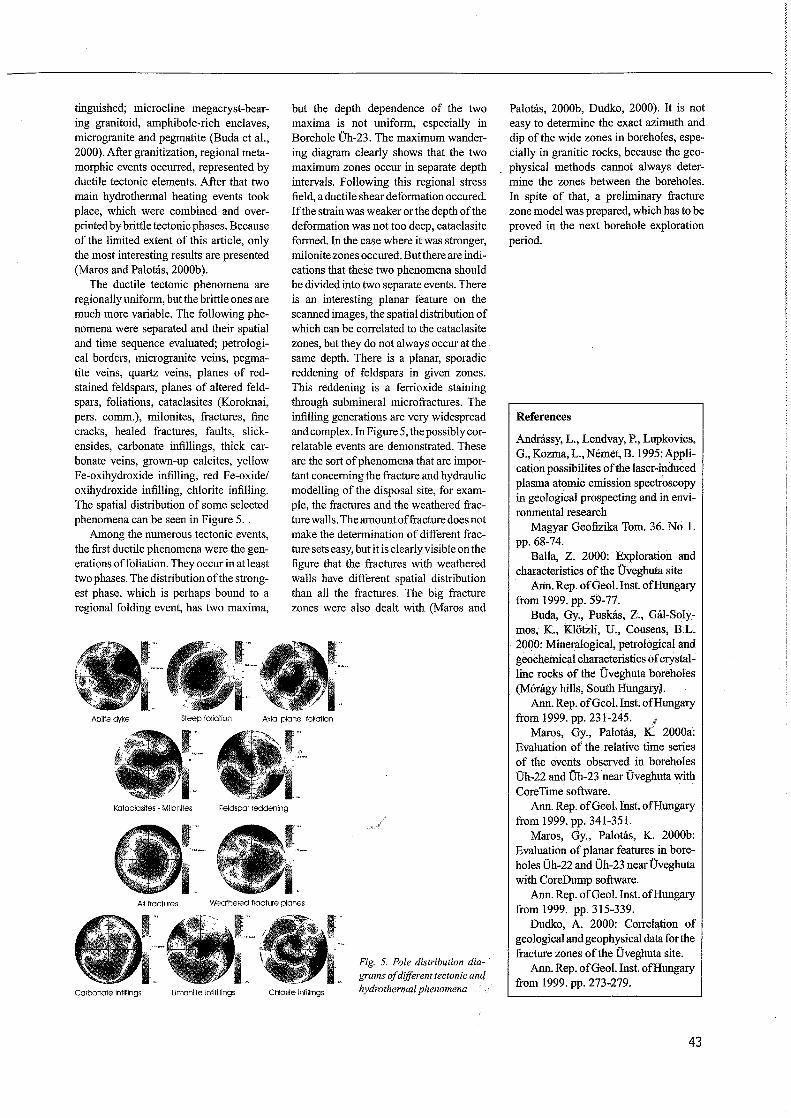
tinguished; microcline megacryst-bearing granitoid, amphibole-rich enclaves, microgranite and pegmatite (Buda et al., 2000). After granitization, regional metamorphic events occurred, represented by ductile tectonic elements. After that two main hydrothermal heating events took place, which were combined and overprinted by brittle tectonic phases. Because of the limited extent of this article, only the most interesting results are presented (Maros and Palotas, 2000b ).
The ductile tectonic phenomena are regionally uniform, but the brittle ones are much more variable. The following phenomena were separated and their spatial and time sequence e,valuated; petrological borders, microgranite veins, pegmatite veins, quartz veins, planes of redstained feldspars, planes of altered feldspars, foliations, cataclasites (Koroknai, pers. comm.), milonites, fractures, fine cracks, healed fractures, faults, slickensides, carbonate infillings, thick carbonate veins, grown-up calcites, yellow Fe-oxihydroxide infilling, red Fe-oxide/ oxihydroxide infilling, chlorite infilling. The spatial distribution of some selected phenomena can be seen in Figure 5.
Among the numerous tectonic events, the first ductile phenomena were the generations of foliation. They occur in at least two phases. The distribution of the strongest phase, which is perhaps bound to a regional folding event, has two maxima,
but the depth dependence of the two maxima is not uniform, especially in Borehole Uh-23. The maximum wandering diagram clearly shows that the two maximum zones occur in separate depth intervals. Following this regional stress field, a ductile shear deformation occured. If the strain was weakeror the depth of the deformation was not too deep, cataclasite formed. In the case when~ it was stronger, milonite zones occured. But there are indications that these two phenomena should be divided into two separate events. There is an interesting planar feature on the scanned images, the spatial distribution of which can be correlated to the cataclasite zones, but they do not always occur at the same depth. There is a planar, sporadic reddening of feldspars in given zones. This reddening is a ferrioxide staining through submineral microfractures. The infilling generations are very widespread and complex. In Figure 5, the possibly correlatable events are demonstrated. These are the sort of phenomena that are important concerning the fracture and hydraulic modelling of the disposal site, for example, the fractures and the weathered fracture walls. The amount of fracture does not make the determination of different fracture sets easy, but it is clearly visible on the figure that the fractures with weathered walls have different spatial distribution than all the fractures. The big fracture zones were also dealt with (Maros and
Aplife dyke Steep foliation Axial plane foliation
Kataclasltes · Milonites Feldspar reddening
All fractures Weathered fracture planes
Carbonate lnfillings Limonlite infifillings Chlorlte infillings
Fig. 5. Pole distribution diagrams of different tectonic anq hydrothermal phenomena
Palotas, 2000b, Dudko, 2000). It is not easy to determine the exact azimuth and dip of the wide zones in boreholes, especially in granitic rocks, because the geophysical methods cannot always determine the zones between the boreholes. In spite of that, a preliminary fracture zone model was prepared, which has to be proved in the next borehole exploration period.
References
Andrassy, L., Lendvay, P., Lupkovics, G., Kozma, L., Nemet, B. 1995: Application possibilites of the laser-induced plasma atomic emission spectroscopy in geological prospecting and in environmental research
Magyar Geofizika Tom. 36. No I. pp. 68-74.
Balla, Z. 2000: Exploration and characteristics of the 0-veghuta site
Ann. Rep. ofGeol. Inst. ofHungary from 1999. pp. 59-77.
Buda, Gy., Puskas, Z., Gal-Solymos, K., Klotzli, U., Cousens, B.L. 2000: Mineralogical, petrological and geochemical characteristics of crystalline rocks of the 0-veghuta boreholes (M6ragy hills, South Hungaryl.
Ann. Rep. ofGeol. Inst. ofHungary from 1999. pp. 231-245. p
Maros, Gy., Palotas, K. 2000a: Evaluation of the relative time series of the events observed in boreholes Uh-22 and Uh-23 near -Oveghuta with CoreTime software.
Ann. Rep. ofGeol. Inst. ofHungary from 1999. pp. 341-351.
Maros, Gy., Palotas, K. 2000b: Evaluation of planar features in boreholes Uh-22 and Uh-23 near 0-veghuta with CoreDump software.
Ann. Rep. ofGeol. Inst. ofHungary from 1999. pp. 315-339.
Dudko, A. 2000: Correlation of geological and geophysical data for the fracture zones of the 0-veghuta site.
Ann. Rep. ofGeol. Inst. ofHungary from 1999. pp. 273-279.
43

Will Nisyros Volcano (GR) Become Active?
Seismic unrest and crustal deformation by Lagios, E. 1, Dietrich, V. 2
, Stavrakakis, G. 3, Parcharides, l 1
, Sakkas V. 1, Vassilopoulou Sp. 1
Major tasks of the three-year European IST (Information Societies Technology) project "GEOWARN - Geospatial Warning Systems - Nisyros Volcano (Greece), an emergency case study" are identification of precursors of volcanic reactivation, as well as volcanic and seismic hazard assessment. The final product will represent an earlywarning system suitable for emergency planning and adaptable to other dormant volcanoes.
At the end of the first year of monitoring within the Kos-Yali-Nisyros-Tilos volcanic field ( eastern sector of the South Aegean Volcanic Island Arc), the datasets representing seismic, geodetic, and chemical parameters show significant changes, indicating a possible reactivation of the dormant Nisyros Volcano.
The spatial distribution of the earthquakes since the 1995-1997 seismic crisis and surface deformation ranging from 27 to 53mm registered by DGPS and Differential Radar Interferometry, between 1997 and 2000, shows that the entire area is undergoing a continuous crustal movement. This represents a high stage of geodynamic activity.
Crustal extension during the seismic crisis may have initiated, to a certain extent, emplacement of magma into an intermediate crustal reservoir. The slowdown of surface deformation since 1999 coincides with a decrease in seismic activity after the crisis, indicating that no further magma ascent can be expected at present.
1 Space Applications in Geosciences, Laboratory of Geophysics, University of Athens, Panepistimiopolis, Ilissia, 157 84 Athens, Greece
44
Les objectives principaux du projet "GEOWARN - Geospatial Warning Systems - Nisyros Volcano (Greece), an emergence case-study" developpe dans le cadre du programme europeen IST (Information Societies Technology) en durant trois annees, sont !'identification des precurseurs d'une nouvelle activite volcanique ainsi que !'evaluation des risques volcaniques et sismiques. Le produit final sera un systeme d'avertissement rapide, utile en cas d'urgence et adaptable pour d'autres volcans dormants.
A la fin de la premiere annee de monitoring sur la region volcanique de Kos - Yali - Nisyros - Tilos (le secteur Est de l'arc Sud - Egeen des iles volcaniques), les collections des parametres sismiques, geodesiques et chimiques ont enregistre des changements significatifs qui indique une nouvelle eventuelle activite du volcan dormant Nisyros.
La distribution spatiale des tremblements de terre en temps de la crise sismique du 1997-1998, reliee aux deplacements de surface entre 27 et 53 mm enregistre entre 1997 et 2000 et mesures en utilisant DGPS et l'interferometrie, montre le mouvement continue! de l'ecorce terrestre. Cet effet signifie une etape de haut activite geodynamique.
Le phenomene d'emplacement de magma vers un reservoir intermediaire pendant la crise sismique, pourrais explique !'extension de l'ecorce terrestre. Le ralentissement des deformations de surface a partir de 1999 co"incide avec la diminution de l'activite sismiques. Ceci indique que actuellement on ne peut pas s'attendre a un phenomene d'ascension de magma.
2 Swiss Federal Institute of Technology, Institute ofMineralogy and Petrography, ETH-Zentrum, CH-8092 Zurich, Switzerland
Las tareas principales de los proyectos europeos trianuales SIT (Sociedades de Informaci6n Tecnol6gica) "GEOWARN - Sistemas de aviso Geoespaciales -Volcan Nisyros (Grecia), un ejemplo de emergencia" son la identificaci6n de la reactivaci6n volcanica, asf como estimaci6n de los riesgos volcanicos y sfsmicos. El producto final representara un sistema de aviso temprano adecuado para planear la emergencias y adaptable a otros volcanes dormidos.
Al final del primer ano de control en el campo volcanico Kos-Yali-NisyrosTilos (sector oriental del Arco de Islas Volcanicas del Egeo Sur), los conjuntos de datos representando los parametros sf smicos, geodesicos y quf mi cos muestran cambios significativos, que indican una posible reactivaci6n del dormido Volcan Nisyros.
La distribuci6n espacial de los terremotos desde la crisis sismica 1995-1997 y la deformaci6n superficial entre 27 y 53 mm registrada por DGPS y1Interferometrfa de Radar Diferencial, entre 1997 y 2000, muestra que el area esta experimentando un movimiento cortical continuo. Este representa un estadio elevado de actividad geodinamica.
La extension cortical durante la crisis sfsmica puede haber iniciado, hasta un cierto punto, el emplazamiento de magma en un reservorio cortical intermedio. La disminuci6n de la deformaci6n superficial desde 1999 coincide con una disminuci6n de la actividad sfsmica tras la crisis, lo que indica que no puede esperarse en la actualidad el ascenso de mas magma.
3 National Observatory of Athens, Institute ofGeodynamics, P.O. Box 20048, GR-118 10 Athens, Greece
--i

Quiescent but active volcanoes in regions of high geodynamic unrest represent a severe hazard and risk potential and require integrated monitoring, satellite surveying and modelling. Monitored geodetic, seismic and geochemical data together with satellite images are transferred and unified in a coherent way to allow integration into a geo-spatial information system (GIS) and to detect dynamic processes such as reactivation of quiescent volcanoes and earthquakes.
The volcanic islands of the South Aegean Sea Aegina, Methana, Poros, Milos, Santorini, Yali Nisyros, and Kos define a volcanic island arc, which extends over a distance of approximately 600 km from Corinth in the Saronic Gulf bordering Attica and the Peloponnese to the islands of Kos and Nisyros near the Turkish coast. The arc is regarded as a magmatic expression of the still-active northeastward-directed subduction of the African Plate beneath the Aegean micro-plate, which started around 4 Ma at the beginning of the Pliocene (McKenzie 1972; Le Pichon & Angelier 1979; Jackson 1994).
The eastern sector of the island arc, including the islands of Kos, Yali and Nisyros, seems to be geodynamically very active, since it comprises the largest volumes of volcanic products, which were emitted during the past 160,000 years. It is at present a region of high tectonic unrest (DrakopoulosandDelimbasis 1982;Makropoulos and Burton 1984).
Reactivation of magmatic and volcanic activity in quiescent volcanic areas is indicated by an increase in geodynamic activity. This is expressed by earthquake activity followed by changes in chemical and isotopic compositions as well as temperature increases in hot springs and in gases and waters in fumarolic fields. In most cases large tectonic earthquakes are precursors and predate in terms of weeks and months the beginning of volcanic activity ( e.g. Santorini 3640 years BP, Vesuvius 79 AD, Columbos Volcano NE of Santorini 1650, Krakatao 1883, Mt. St. Helens 1980 and Pinatubo 1990).
In this respect, the Kos-Yali-Nisyros volcanic field represents a severe hazard and risk potential and requires integrated monitoring, satellite surveying and modelling. Recognition of the spatial distribution of fault patterns and earthquake hypocenters and their focal mechanisms as well as of surface deformation are of paramount interest.
A ~~ravfmelrlc
_" Baselines ofGPS Network
- - Major Fault System (F1,F2)
Figure I. The Kos - Yali - Nisyros - Tilos volcanic field within the frame of the South Aegean Volcanic Island Arc. The bathymetric digital elevation model (BDEM) has been established using data from all available nautical charts.
Geotectonic Setting and Volcanic History 160,000 years ago several hundreds of cubic kilometres of magma were emplaced in the NE region striking "Kos horstgraben system" from the upper mantle into low crustal levels, which led to the largest eruption in the Eastern Mediterranean, emitting more than I 00 km3
of pyroclastic material, the Kos Plateau Tuff. Ashes, pumice and pyroclastic flows ("glowing avalanches" of 600° to I 000°C temperatures) devastated an area of more than 3000 km2 (Keller 1969; Smith et al. 1996; Allen et al. 1999). Deposits occur on Kalymnos, on the peninsula of Datc;:a and Tilos. The centre of this catastrophic eruption was probably located north to north-east ofYali.
•' As the result of such a voluminous
magma deficit, a c,dera of a diameter of 15-20 km mustAiave been formed, now covered with volcano-sedimentary products from younger eruptions and debris of still unknown thickness. Over a period of 140,000 years the volcanic edifices of Nisyros, Yali, Pergousa, Pachia and Strongyli have grown in its inferred central part and rim (Papanikolaou et al. 1991 ; Vougioukalakis 1993).
The volcanic history ofNisyros Island can be divided into three major volcanic . phases:
l The Pre-Caldera Stratovolcano ( ea. 160,000 to 40,000 years): Along the major NE-SW tending "Kos horst-graben system" between Kondeliousa and the Turkish coast basaltic and andesitic lavas erupted building up the volcanic base of Nisyros. On top of these partly submarine lavas a 500-700m high stratovolcano grew over a period of more than 100,000 years. Its basaltic, andesitic, dacitic and rhyodacitic lavas, pyroclastics aµd tuffs form the northwestern, southJrn and northeastern slopes of the island.
2 The Caldera Formations {40,000 to 15,000 years): A huge volume of pyroclastic flows and pumice ("the lower pumice") covered the entire island. Rhyolitic lavas erupted towards the SE slopes of Nikia. Subsequently, a major collapse of the volcano followed leaving a large caldera of 4 to 5 km in diameter and a depth of a few hundred meters. Two large pumice deposits document these two major eruptive phases (the lower and upper pumice) divided by a layer of soil marking a long time-span of rest and erosion.
3 Post-Caldera Domes and Lava Flows (20,000 to <15,000 years?): Inprehistorical times large effusive masses of rhyolite to rhyodacite extruded along a SE-NW fault system building up domes
45

Figure 2. Fault pattem, location of hydrothermal explosion craters and hot springs deduced from. the digital elevation model (DEM) ofNisyros Island, derived by digitising the 1:5000 scale topographic map sheets of Nisyros Island, published by the Hellenic Milital)' Geographical Service 1983, andjivm the orthorectified IKONOS-2 multispectral ( 4m resolution) satellite image.
Abbreviations of localities: Av=Avlald,Af=Afionas, CA=Cape Akrotiri, CK=Cape Katszmi, Al=Agia lrini, Le=Lejlws, o=Loutra, LP=Lakld plain,
• GPS Station
Ma=Mandrald, ME= Monastery Evangelistra, N=Nilda, Pa=Pali, PI= Profitis /lias, PK=Monaste,y Panagia Kyra, Th=Thermiani
A Micro-Gravity Station
'i" Hot Springs
1st Order Fault System __ _.:-= Ft NNE-NE/SSW-SW ___ - F2 NW-NNW/ SE-SSE
13 Fumaroles and Hat Steam ---- 2nd Order Fault Systems F3 E/W
C) Hydrothermal Explosion Craters ---- F4 N/S F5 ESE/WNW
- .,,, Crater Rim 1 Km
and thick lava flows in the central and south-eastern part of the island.
These bodies at present are responsible for conductive and convective heat transfer and the generation of the hydrothermal system.
Volcano-Tectonic Structures Three major directions of fault systems can be distinguished within the volcanic edifices of the Kos-Yali-Nisyros-Tilos volcanic field. The results agree with previous structural and geological investigation (Papanikolaou et al. 1991; Vougioukalakis 1993).
F 1 N30E faults with local changes to NE directions
F2 N30W faults with changes between N20° and N40°
F3 E-W faults
F4 N-S faults
F5 WNW-ESE (approx. 120°)
The NE-SW (Fl) System The NE fault system (Figs I and 2) is responsible for the formation of the large horst-graben system between the islands of Kondeliousa, Kos and the peninsula ofDat9a. A down-faulting of several hundred meters of the central parts must be assumed since the early Pleistocene (Geological Map ofKos Island, 1972 and 1998).
46
and local Faults
In addition, a series of FI faults crosscut the entire island ofNisyros bordering the Lakki plain and causing down-faulting of the western part of the Agia Irini block in the south. All hydrothermal explosion craters are located in the intersections between the conjugate fault system FI and F2. At the northern and southern extensions of the FI system, hot springs occur at sea level (Cape Katsuni and Thermiani in the north, and Lefkos in the south).
The NW-SE (F2) System These faults run more or less perpendicular to FI (Fig. I) with steep inclinations of 70° to 80° at the surface changing the direction of dips between NE artd NW. Characteristics of this fault system are extensional features and down-faulting up to 70m. They extend from the northwestern parts ofl'ilos Island into Nisyros Island in the area of Avlaki, crosscut the entire island, run along the western part ofYali and merge into Kos Island at the "Paradise bubble beach".
A series of NW-SE parallel faults cut the Nisyros Island in the area of Avlaki and Agia Irini (Fig. 2). Best evidence for down faulting of the Agia Irini block can be taken from the offset of the southern caldera rim. The fault system runs through the hydrothermal eruption craters (Brombach, et al: Geochemical evidence of an. ongoing volcanic unrest at Nisyros Island next issue ofEGM).
High geodynamic activity is presently associated with this system indicating its origin at deeper crustal levels: the occurrence ofhot springs atAvlaki and Loutra; a zone of alteration in the Spiliani rock west ofMandraki, the hydrothermal crater and furnarolic field, i.e. the large Stefanos Crater, CO2 gas emanations and fumaroles at Yali and at Kos. During the 1873 hydrothermal explosion and formation of the Polibotis craters, fire and gas emanations were reported along the coast west of the town ofMandraki (Gorceix 1873 a,b,c). During the seismic crisis between 1995 and 1997 several shallow tectonic earthquakes with magnitudes up to M=5.5 occurred along this fault system between Tilos and Kos (Fig. 3). Major damage occurred in the western part of Mandraki.
The E-W (F3) System The E-W oriented fault system seems to occur at present only on a local scale (Fig. 2) and might represent a result of the deep reaching conjugate fault system FI and F2. Surface expressions are visible along the north coast of Nisyros at the town ofMandraki, between the harbours Mandraki and Loutra, between Pali and Cape Katsuni, as well as in the Karaviotis lava flows bordering the Kateros cove and on the western slopes of the Pangia Kyra monastery. The hot spring of Afionas at sea level might also be a result of this fault system. Similar east-west striking faults occur in the Neogene sediments and Pleistocene Kos Plateau Tuff in Kos Island (Fig. I).
The N-S (F4) System A subordinate N-S fault system can be locally established in the volcanic edifice of Nisyros Island (Fig. 2): Along the northwest coast, between the dacitic domes of Karaviotis and Trapezina and at Cape Akrotiri. According to the bathymetric map (BDEM) the latter fault seems to extend into a small N-S graben between Yali and Strongyli. An equivalent system seems also to be present in the peninsula ofKefalos at Kos Island. Similar to the F3 system the N-S might also be a result of the dominant conjugate FI and F2 systems.
The Caldera Rim The Caldera rim and its accompanying cone-shaped local faults are entirely volcanic structures; which are a result of magma emplacement from shallow crustal reservoirs and its mass deficiency collapse after the Plinian eruptions. Neither

Seismicity around Nisyros Vulcano
January to Julj 2001
• 3-3,6 8 _1.6-1,9
Q_ <ei-
<si / ... \~:
Figure 3. The seismic activity in the KosYali-Nisyros-Tilos volcanic field (earthquakes with su,face magnitudes MS>4) during the period I 900 - 2000.
0 2,6-2,9 0 0-1,5
9 2-2,5 • allothers
Aegean Sea
•
• .····(.
0 • Astipa~~ ,':i)i ~ iv,.
, • 0 r ~ , .. ,,, ..•. 'i;\_.cf; •• ' ·A
• • •• • •
• C)
Figure 4. Distribution of micro-earthquakes and magnitudes up to M=3.6 in the Kos-Yali-Nisyros-Tilos volcanic field during the period January to July 2001. The numbers in brackets represent the total number of events with this range of magnitudes.
geodynamic nor hydrothermal activities have been recognised within the caldera rim and along these local faults.
Volcanic and Seismic Hazards Although the last volcanic activity on Nisyros Island dates back at least 15,000 to 20,000 years, the present geodynamic activity encompasses high seismic unrest, widespread fumarolic activity, and numerous hot springs close to sea level all around the island (Fig. 2). Violent earthquakes and steam blasts accompanied the most recent hydrothermal eruptions in 1871-1873 and 1887 (Gorceix 1873 a,b,c). Mudflows and hydrothermal vapours rich in CO
2 and H
2S were emitted from fracture
zones, which cut the caldera of the volcano and extend NNW through the vicinity of Mandraki into the island of Yali and even towards Kos. This feature indicates the existence of deep reaching zones of crustal weakness, which will probably act as zones of ascent of magma-batches coming from the upper mantle and lower crust, upon volcanic unrest.
The most recent seismic activity started in early 1995 with earthquake magnitudes between M=4 and M=5 on the Richter scale, which in July 1996 damaged about
30 houses in M3?draki. From June to September 1997, high-seismic activity (magnitude of earthquakes up to M=5.5 and with hypocenters down to 10 km depth) occurred again on Nisyros and was accompanied by increased tectonic and fumarolic activity along the western edge of the hydrothermal crater field.
Four different kinds of natural hazards are predicted in the Kos-Yali-Nisyros-Tilos volcanic field when considering the geothermal and hydrothermal parameters, together with the historical tectonic, volcanic and seismic regime of the area:
I Gas and steam hydrothermal eruptions within the Nisyros crater field;
2 Seismic activity due to the regional tectonic movefuents;
3 Magmato-tectonic seismic activity related to magmatic unrest in the crust;
4 Landslides and tsunami hazards as secondary effects due to earthquakes and magmatic and volcanic activity.
Seismic Activity and Monitoring The seismic activity in the southeastem most part of the Aegean Volcanic Arc is very high, both at shallow and at interrne, diate focal depths. Figure 3 shows the
.. \-: .. .. .:,
.. .,
• 8 ..
" r3s " ..
$ ..
" ..
"
epicenter distribution of the earthquakes with surface magnitude Ms>4.0 for the time period 1901-2000; data are taken from Makropoulos et al. (1989) and from the monthly Bulletin of the Institute of Geodynamics of the National Observatory of Athens.
In 1995, significant seismic activity started in the area surrounding Nisyros Island. Specifically, on August 22, 1995, a moderate offshore earthqmy<:e of magnitude M=5.3 occurred at a distance of about 40 km west of the island, at a focal depth of 165 km. Almost two months later, on November 30, 1995, a second event of the same magnitude took place very close to the volcano, at a focal depth of 136 km. On April 12, 1996 a stronger earthquake of Ms=5.5 occurred in the same focal region between Nisyros and Yali islands and at a focal depth of 156 km. After that event, the seismic activity migrated to the SE of Nisyros, where a strong offshore earthquake ofMs=6.6 took place west of Rhodes Island.
The results of seismic monitoring during the period January to July 200 I are shown in Figure 4. At first glance, it appears that the seismicity in the KosYali-Nisyros-Tilos volcanic field has
47
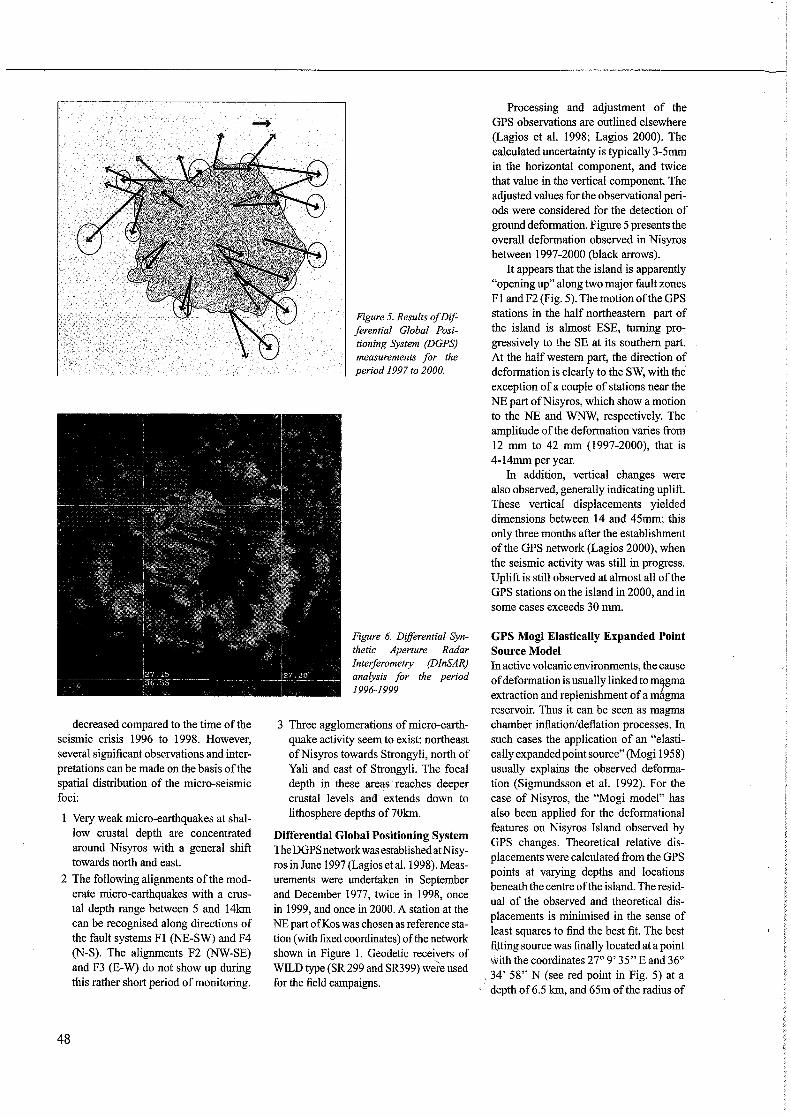
-+
decreased compared to the time of the seismic crisis 1996 to 1998. However, several significant observations and interpretations can be made on the basis of the spatial distribution of the micro-seismic foci:
Very weak micro-earthquakes at shallow crustal depth are concentrated around Nisyros with a general shift towards north and east.
2 The following alignments of the moderate micro-earthquakes with a crustal depth range between 5 and 14km can be recognised along directions of the fault systems Fl (NE-SW) and F4 (N-S). The alignments F2 (NW-SE) and F3 (E-W) do not show up during this rather short period of monitoring.
48
Figure 5. Results of Differential Global Positioning System (DGPS) measurements for the period 1997 to 2000.
Figure 6. Differential Synthetic Aperture Radar Interferometry (DlnSAR) analysis for the period 1996-1999
3 Three agglomerations of micro-earthquake activity seem to exist: northeast ofNisyros towards Strongyli, north of Yali and east of Strongyli. The focal depth in these areas reaches deeper crustal levels and extends down to lithosphere depths of 70km.
Differential Global Positioning System The DGPS network was established at Nisyros in June 1997 (Lagios et al. 1998). Measurements were undertaken in September and December 1977, twice in 1998, once in 1999, and once in 2000. A station at the NE part of Kos was chosen as reference station ( with fixed coordinates) of the network shown in Figure 1. Geodetic receivers of WILD type (SR 299 and SR399) were used for the field campaigns.
Processing and adjustment of the GPS observations are outlined elsewhere (Lagios et al. 1998; Lagios 2000). The calculated uncertainty is typically 3-5mm in the horizontal component, and twice that value in the vertical component. The adjusted values for the observational periods were considered for the detection of ground deformation. Figure 5 presents the overall deformation observed in Nisyros between 1997-2000 (black arrows).
It appears that the island is apparently "opening up" along two major fault zones Fl andF2 (Fig. 5). The motion of the GPS stations in the half northeastern part of the island is almost ESE, turning progressively to the SE at its southern part. At the half western part, the direction of deformation is clearly to the SW, with the exception of a couple of stations near the NE part ofNisyros, which show a motion to the NE and WNW, respectively. The amplitude of the deformation varies from 12 mm to 42 mm (1997-2000), that is 4- l 4mm per year.
In addition, vertical changes were also observed, generally indicating uplift. These vertical displacements yielded dimensions between 14 and 45mm; this only three months after the establishment of the GPS network (Lagios 2000), when the seismic activity was still in progress. Uplift is still observed at almost all of the GPS stations on the island in 2000, and in some cases exceeds 30 mm.
GPS Mogi Elastically Expanded Point Source Model In active volcanic environments, the cause of deformation is usually linked to m,gma extraction and replenishment of a magma reservoir. Thus it can be seen as magma chamber inflation/deflation processes. In such cases the application of an "elastically expanded point source" (Mogi 1958) usually explains the observed deformation (Sigmundsson et al. 1992). For the case of Nisyros, the "Mogi model" has also been applied for the deformational features on Nisyros Island observed by GPS changes. Theoretical relative displacements were calculated from the GPS points at varying depths and locations beneath the centre of the island. The residual of the observed and theoretical displacements is minimised in the sense of least squares to find the best fit. The best fiJting source was finally located at a point with the coordinates 27° 9' 35" E and 36°
. 34' 58" N (see red point in Fig. 5) at a depth of 6.5 km, and 65m of the radius of

the expanding sphere i:issociated with the "source strength parameter" (Sigmundsson 1995) of the Mogi model. The calculated Mogi displacements (Fig. 5, red arrows) seem to generally fit the observed ones (black arrows, Fig. 5), except for the two stations in NW Nisyros, and a few more in the NE. That would suggest that the deformation at those parts of the island for the period 1997-2000 be not only controlled by an elastically expanded point source, but also by extensional tectonic movements, as discussed below.
The observed uplift for the period 1997 to 2000 seems to be consistent with the theoretically estimated uplift of approximately 50mm, predicted by the Mogi model with maximum amplitude over the "expanding magmatic source".
Differential Interferometry In order to detect surface movements due to low crustal magma displacements, visualisation of satellite images depicting infrared thermal pattern and performing interferometric analysis is of paramount interest. Differential synthetic aperture radar interferometry (DinSAR) is the most interesting technique of SAR Interferometry (Massonnet and Rabaute 1993) in the two-dimensional mapping of deformation with very high accuracy at mm to cm level.
Differential radar interferometry was applied to study the regional deformation of the area in conjunction with the GPS observations in the area since June 1997. The output of the GPS results is used as the control on the produced interferograms.
Suitable interferometric pairs of SAR images have been selected after searching European's Space Agency FRINGE according to the following criteria: baseline separation (Bp) <100 m, acquisitions of the same season to avoid seasonal land-use changes and temporal separation between the scenes of the same pair covering the period 1996-1999.
The more specific "two-pass differential interferometric method" or "DEMelimination method" has been chosen, using two SAR images, in order to produce one interferogram. A second interferogram had to be created or synthesised to perform the differential analysis. The synthesized interferogram is generated from an existing digital elevation model (DEM) and subsequently subtracted from the original interferogram. After removing all fringes that relate to ground elevation, only the fringes repre-
senting surface displacements remained. The phase differences, which remain as fringes in the differential interferogram, are the result of a range of changes of any displaced point on the ground from one interferogram to the next. In the differential interferogram, each fringe is directly related to the radar wavelength (56mm for ERS satellites) and represents a displacement relative to the satellite of only half the above wavelength (28mm). The detailed procedure of DinSAR processing is described by Pacharidis and Lagios (2001).
In the interferogram of the interferometric pair, 1996-1999 (Fig. 6) almost two fringes in the eastern part of the island and two full fringes in the southwestern part could be recognised. The coherence between these two is good. The rest of the image is covered by "rumor" or fringes related to the topography. In this case the deformation is about 56 mm along the line of sight. The phase increases from the inner to the outer part, which means that in both cases the deformation is higher in the outer part. According to the Mogi model (Mogi 1958), this happens in the case of horizontal movement for the first 4km in distance from the centre of the volcano and is consistent with the picture resulting from the DGPS measurements (Fig. 5, black arrows).
Spatial Distribution of Fault Systems and Crustal Deformation At present, the Kos-Yali-Nisyros-Tilos volcanic field exhibits all the tectonic features of an extensional lithospheric regime. Dextral strike slip motion of the F l system accompanied with SE/NW extension has been deduced from focal mechanism of major earthquakes. This seems to be the case at intermediate and deeper lithospheric levels down to approximately 70 km depth (Drakopoulos and Delimbasis 1982).
A second major fault system (F2) runs perpendicular to the K9s horst-graben crosscutting the entire, v;clcanic field. This is the predominant direction of compression at deeper lithosphere levels due to subduction of the African Plate beneath the Aegean microplate. This fault pattern is present in the island ofNisyros and to a lesser extent in the island ofKos. At sea floor its direction is indicated by the bathymetry and by the spatial distribution of the micro-earthquake epicentres (Fig. 4).
In addition, two other fault systems may also play an important geodynamicc
role: The E-W (F4) and N-S (F 5) systems. According to the sea floor morphology, they seem to be more obvious on the sea floor between the volcanic islands then on the islands (Fig. l ). The spatial distribution and the distinct alignment of earthquake foci indicate an extension of these faults to intermediate crustal levels.
Special attention will be paid to the intersections of the four dominant fault systems since they indicate zones of major crustal weakness, which could favour emplacement of magmas through the crust from deeper levels to the surface. Such features arise in the areas of earthquake foci agglomeration, that is north of Nisyros, west and north ofYali, and east of the volcanic cone of Strongyli.
The Nisyros Seismic Crisis 1996 -1997 Comparison of the spatial distribution of the larger earthquakes with the surface magnitudes Ms>4 during the past hundred years, the micro-seismicity 1997 /98 within the Kos-Yali-Nisyros-Tilos volcanic field (Makris and Chonia 1999), and the general seismicity picture during the past hundred years, shows that most of the foci are aligned along the principal active fault systems Fl to F4 at shallow levels extending to 10km depth.
However, the random distribution of the microseismic foci (up to Ms=4) during the 1997 /98 seismic crisis around Nisyros, Yali and Strongyli also permits the interpretation of a magmatic origin. These seismic events may be generated by ascending magma through the crust opening fissures and plains, volume changes of the magma during emplacement and coolin~ as well as magma degassing accompanied by immediate volume expansion of the gas.
During the recent major seismic activity that occurred in Nisyros in 1996 and 1997, the reactivation of the F2 fault system (SSE to NNW and most probably extending into the sea, reaching the Yali coast to the north) passing through Mandraki was clearly noticed. This particular fault system caused much damage to the houses of the small town, as it was passing through the narrow streets, cutting off house floors, walls and yards.
Summary At the end of the first year of monitoring procedures two independent sets of precursor parameters indicated significant changes in the chemical and geodynamic activity within the Nisyros volcanic and hydrothermal system.
49

On the basis of the above aspects of natural hazards expected in Nisyros and the newly obtained evidence of seismic unrest and crustal deformation, it becomes evident that Nisyros is no longer a dormant volcano, but in a stage of high geodynamic activity. The following evidence can be summarised:
I) From the comparison between the spatial distribution of the larger earthquakes with surface magnitudes Ms>4 within the Kos-Yali-Nisyros-Tilos volcanic field during the past hundred years, and the micro-earthquakes during the 1996/98 seismic crisis on Nisyros Island, it is obvious that most of the earthquake foci are aligned along the principal active fault systems at shallow levels extending to I O km depth.
2) DGPS monitoring between 1997 and the end of 2000, as well as DinSAR data on Nisyros showed an E-W outward horizontal extension, ranging from 27 to 53mm between 1997 and 1999.
3) It appears that the determined Mogi source model is in agreement with the fault pattern observed on the islands and inferred from the sea floor, as well as with the deformation in Nisyros resulting from DGPS measurements. The emplacement of magma from deep crustal levels into a magma chamber between 6 to 8 km depth has most probably been triggered by the 1995/96 intermediate to deep earthquakes of strong magnitudes, which led to a weakening of the crust. Detailed seismic tomographic studies (Makris and Chonia 1999) in Nisyros and the wider area around the island clearly suggest a low velocity zone beneath Nisyros Island, associated with the geometry of the magma chamber at depths consistent with the location and depth of the Mogi model.
4) DinSAR analysis using satellite images between 1996 and 1999 confirmed the deformation observed by the DGPS measurements. About two fringes of defo1mation of approx. 50-60mm at the ESE and WSW parts of the island could be inferred from the interferogram.
5) Earlier magnetotelluric investigations in the high enthalpy geothermal field ofNisyros Island detected a deep-crustal conductive magmatic body (Dawes & Lagios 199 I).
Will Nisyros Volcano become active? The slowdown of surface deformation coincides with the decrease of seismic activity after the 1996 and 1997 crisis indi-
50
eating that no further magma ascent can be expected at present. However, a prediction ofreactivation of magmatic activity, magma ascent and subsequent volcanic activity cannot be excluded. From the crustal configuration and from petrologic evidence it is possible to postulate a magma ascent from deep crustal levels within a short time, announced only by early seismic precursors of a few weeks before eruption. This process is valid for smaller volumes of magmas, which do not lead to large explosive (magmatophreatic) eruptions, but to the formation of very limited local volcanic cones, flows or domes. Emplacement oflarge volumes of magmas of the order of several cubic kilometres needs a strong weakening of the crust a long time prior to eruption, indicated by a preceding phase of large tectonic earthquakes. In addition, storage of such magma volumes in shallow crustal reservoirs is accompanied by a significant surface deformation, a drastic increase in water and surface temperatures and continuous chemical compositional changes in fumarolic gas and water.
The crustal extension during the seismic crisis 1995-1997 may have initiated, to a certain extent, emplacement of magma into an intermediate crustal reservoir. Since then cooling, degassing and heat transfer has occurred leading to an increase in temperature and pressure in the overlying hydrothermal system, but decreasing slowly in the future.
Geophysical and geodetic monitoring cannot be used alone to give the definite answer to a possible reactivation of a dormant volcano. It is absolutely vital to compare these data sets with changes in temperature, geochemical and isotopic composition of the hydrothermal fumarolic gases and waters.
The changes in gas chemistry are presented in the following article about Nisyros: Brombach, T., Calir, S., Cardellini, C., Chiodini, G., Dietrich (2001): Geochemical evidence of an ongoing volcanic unrest at Nisyros Island (Greece). European Geologist (No 13).
Acknowledgements This article contains parts of the results obtained during the three years European IST (Infonnation Societies Technology) DG XIII project (1999-12310) "GEOWARN - Geospatial Warning Systems - Nisyros Volcano (Greece), an emergency case study".
The authors are indebted for scientific input and help provided by Freysteinn Sigmundsson (Iceland), Jannis Makris (Hamburg), Dimitrios Papanikolaou (Athens). Gogu Radu, Bernhard Jenny and Andreas Baumeler (Zurich) spent a lot of time in designing the figures.
References Allen, S.R., Stadelbauer, E., Keller, J. (I 999): Stratigraphy of the Kos Plateau Tuff: product ofa major Quaternary explosive rhyolitic eruption in the eastern Aegean, Greece. Int. Joum. Earth Sciences 88, 132-156.
Dawes, G.J.K. & Lagios, E. (1991): A Magnetotelluric Survey of the Nissyros Geothennal Field (Greece). Geothennics, 20/4, 225-235.
Drakopoulos, J., Delimbasis, N. (1982): The focal mechanism of earthquakes in the major area of Greece for the period 1947-1981. Univ. of Athens, Seismological Laboratory No. 2.
Gorceix, M.H. (1873a): Sur l'etat du volcan de Nisyros au mois de mars 1873. C.R. Acad. Sci. Paris 77, 597-601.
Gorceix, M.H. (1873b ): Sur la recente eruption de Nisyros. C.R. Acad. Sci. Paris 77, 1039.
Gorceix, M.H. (1873c ): Sur I' eruption boueuse de Nisyros. C.R. Acad. Sci. Paris 77, 1474-1477.
Jackson, J.J. (1994): Active tectonics of the Aegeap region. Annual Rev. Earth Planet. Sci., 22, 239-271.
Keller, J. (l 969): Origin of rhyolites by anatectic melting of granite and crustal rocks. The example of rhyolitic pumice from the island of Kos (Aegean Sea): Bull. Volcano!. 33, 942-959.
Lagios, E. (2000): Intense crustal defonnation rates on Nissyros Island (Greece), deduced from GPS studies, may foreshadow a forthcoming volcanic event. Proc. 2nd Intern. Conf. On Earthquake Hazarrl and Seismic Risk Reduction (S. Balassaoian et al, eds.), Kluwer Academic Publishers, p. 249-259.
Lagios, E., Chailas, S., Giaunopoulos, J. Sotiropoulos, P. (1998): Surveillance ofNissyros Volcano: Establishment and remeasurement of GPS and Radon Networks. Bull. Geol. Soc. Greece, vol. 32/4, 215-227.
Le Pichon, X., Angelier, J. (1979): The Hellenic arc and trench system: A key to the evolution of the Eastern Mediterranean Area. Tectoniphysics 60, l-42.
Makris, J., Chonia, T. (1999): Active and Passive Seismic studies of Nisyros Volcano, East Aegean Sea. Proceedings of the 1999 CCSS Workshop held in Dublin, Ireland. "Active and Passive Seismic Techniques Reviewed", Edts. A.W.Brian Jacob, Chr.J. Bean, Stephen T.F. Jacob, 9-12.
Makropoulos, K. C., Burton, P. W. (1984): Greek tectonics and seismicity. Tectonophysics. 106 (3-4): 275-304.
Makropoulos, K., Drakopoulos, J., Latoussakis, J. ( 1989): A revised earthquake catalogue for Greece since 1900. Pub!. No 2, Geophys. J. Int., 98, 391-3j)4.
Massonnet, D., Rabaute, T. (1993): Radli'r interferometry: limits and potential, IEEE Trans. Geosc. and Remote Sensing, 31, 455-464.
McKenzie, D. (1972): Active tectonics of the Mediterranean region. Geophys. J. R. Astron. Sci. 30, 109-185.
Mogi, K. (1958): Relations between the eruptions of various volcanoes and the defonnations of ground surfaces around them. Bull. Earthquake Res. Inst. Univ. Tokyo, 36, 99-134.
Papanikolaou, D.J., Lekkas, E.L., Sakelariou, D.T. (1991): Geological structure and evolution of Nisyros volcano. Bull. Geol. Soc. Greece 25/1, 405-419.
Parcharidis Is. & Lagios E. (2001 ). Defonnation in Nisyros Volcano (Greece) using Differential Radar Interferometry. Bull. Geol. Soc. Greece, XXXIV /No 4, 1587-1594.
Sigmundsson, F. (1995): GPS Monitoring ofVolcanic Defonnation in Iceland. Cahiers du Centre Europeen et de Seismologie, Vol. 8, 79-98.
Sigmundsson, F., Einarsson, P., Bilham, R. (1992): Magma chamber deflation recorded by the Global Positioning System: The Hekla 1991 eruption. Geophys. Res. Letters, 19, 1483-1486.
Smith, P. E., York, D., Chen, Y., Evensen, N.M. ( 1996): Single crystal 40Ar/39Ar dating of a late Quaternary paroxysm ou Kos, Greece; concordance of terrestrial and marine ages. Geophysical Research Letters 23 (21 ): 3047-3050.
Vougioukalakis, G. ( 1993): Volcanic Stratigraphy and Evolution of Nisyros Island. Bull. Geol. Soc. Greece, XXVIIl/2, 239-258.

European Federation of Geologists (EFG) The European Federation of Geologists was established in Paris in I 980 during the 26th International Congress of Geology. In the same year the Statutes were presented to the European Economic Community in Brussels.
The Council of the EFG is composed of the representatives of the national associations of geologists of Belgium-Luxembourg (UBLG), Czech Republic (CAEG), Finland (YKL), France (UFG), Germany (BDG), Hungary (MFT), Iceland (GSI), Ireland (IGI), Italy (ANGI), Netherlands (KNGMG), Poland (PTG), Portugal (APG), Slovakia (SGS), Slovenia (SGD), Spain (ICOG/ AGE), Sweden (SN), Switzerland (CHGEOL), United Kingdom (GS), whilst the American institute is an Associate Member. There are observer associations from Austria, Bulgaria, Greece, Norway, Romania, Turkey and Canada. The EFG currently represents about 75,000 geologists across Europe.
Mission To promote the profession and practice of geology and its relevance.
Objectives
I. To promote and facilitate the establishment and implementation of national arrangements for recognising geologists who, through academic training and appropriate periods of relevant experience in the profession and practice of geology, are qualified to be designated as EurGeol.
2. To organise meetings and conferences to discuss issues related to the profession and practice of geology.
3. To co-ordinate the activities of member national organisations in preparing briefing papers on geological issues and presenting these to European bodies, national governments and other relevant organisations.
4. To maintain contact with the European Commission and respond in timely manner to requests for information.
5. To communicate, through meetings and other means, the relevance of geology to the resolution of issues of concern to society.
6. To promote the establishment of best practice for training of geologists.
7. To safeguard and promote the present and future interests of the geological profession in Europe, including:
- to guarantee the free movement of geologists in Europe, with the mutual recognition of their academic and professional qualifications by the adoption of the title of European Geologist (EurGeol.).
- to promote the harmonisation of education and training.
- to define and protect the title of geologist and related professional titles.
- to promote the code of professional ethics of the EFG.
- to provide advice and assistance to constituent member National Associations.
Submission of articles to European Geologist Magazine The EFG calls for quality articles for future issues of European Geologist. Submissions should be in English and between I 000 and 3000 words, although longer articles may be considered. An abstract of between 100 and 150 words should be included in English, French and Spanish. Articles should be sent via e-mail to the Editor at [email protected] or on disc to Kaplevej 7, 2830 Virum, Denmark. Photographs or graphics are very welcome and should be sent to the Editor as tif or jpg files.
Deadline for submission 30 March and 30 September.
Advertisements Prices for advertisements Insertions Full page (colour) Half page (colour) Quarter page ( colour) Full page (black and white) Half page (black and white) Quarter page (black and white) Preferential location Inserts
Price for special pages: Outside back cover ( colour) Second page ( colour) Second last page ( colour)
Data for European Geologist Magazine Number of issues printed: Periodicity: Print mode: Size: Deadline: Published: Advertisement delivered as computer file: For graphics remember to include fonts.
One Insertion 820 Euro 420 Euro 220 Euro 420 Euro 220 Euro 120 Euro 25% plus
Contact Editor
1200 Euro 1000 Euro 1000 Euro
Two Insertions 1320 Euro 670 Euro 350 Euro 670 Euro 350 Euro 200 Euro
1900 Euro 1600 Euro 1600 Euro
6000 2 times a year
Offset A4 (210 mm x 297 mm)
30 March, 30 Septembei:. 30 May, 30 November
EPS, TffF
I 6000 issues of European Geologist are distributed among professional geologists all over Europe. They are sent to thi European countries National Federations of Geologists, and these national organisations distribute them to their members. These include geologists working in companies as well as at universities.
Layout of the magazine is made in Adobe PageMaker for PC.
Method of payment:
By bank transfer to Bank account: 5073 126 7014 SWIFT Code: JY BA DK KK
Subscription Rates: Annual subscription tothe Magazine: 13 Euro
Contact: Maureen Mc Corry Kaplevej 7 2830 Virum, Denmark e-mail: [email protected]
51

Worldwide Geoservices
CARBOPREE®
Carbonfiber bar for permanent soil nails
CSA Group
CSA House, 6 & 7 Dundrum Business Park WindyArbour, Dublin 14, Ireland
Tel: +353 1 296 4667 Fax: +353 1 296 4676 email: [email protected]
www.csa.ie
Carbon fi~ bars are used for nailing in permanent applications because of their high tensile strength, good corrosion resistance, low specific weight and long durability.
20043 ARCORE (MI) -I- Via del Bruno. 12 _.., ~ .;,.,; !et. -t-j, Uj,.o..e.7u.i1 - t·ax +j, Uj,.01.:,,.,11