pdf - Canadian Center of Science and Education
184
-
Upload
khangminh22 -
Category
Documents
-
view
1 -
download
0
Transcript of pdf - Canadian Center of Science and Education


Editorial Board
Balakrishnan Parasuraman Universiti Malaysia Sabah, Malaysia
Benjamin James. Inyang University of Calabar, Nigeria
Cyril Foropon University of Manitoba, Canada
David H. Kent Golden Gate University, USA
Donald Henry Ah Pak Xi’an Jiaotong-Liverpool University, China
Fulford Richard Edith Cowan University, Australia
Goi Chai Lee Curtin University of Technology, Malaysia
Hafizi Muhamad Ali Universiti Utara Malaysia, Malaysia
Kevin James Daly University of Western Sydney, Australia
K. G. Viswanadhan NSS College of Engineering, India
Lisa Wang Canadian Center of Science and Education, Canada
Mahdi Salehi Zanjan University, Iran
Matthew M.Chew Hong Kong Baptist University, Hong Kong
Muhammad Aslam Khan HITEC University Taxila, Pakistan
Muhammad Madi Bin Abdullah Universiti Teknologi Malaysia, Malaysia
Roberto Bergami Vitoria University, Australia
Sam C. Okoroafo University of Toledo, USA
Sathya Swaroop Debasish Fakir Mohan University, India
Tobias Basse FHDW Hannover University of Applied Sciences, Germany
Wen-Hsien Tsai National Central University, TAIWAN

International Journal of Business and Management November, 2009
1
Contents
REITs and the Financial Crisis: Empirical Evidence from the U.S. 3
Tobias Basse, Meik Friedrich & Eduardo Vazquez Bea
The Differences in Job Characteristics, Job Satisfaction, and Organizational Commitment of Taiwanese
Expatriates Working in Mainland China
11
Sheng Wen Liu, Ralph Norcio & Jung Tsung Tu
A Study on Difficulty Applicability and Teaching Forms of Management Case Teaching in Undergraduates 18
Liqin Chen, Henghai Zhao & Cong Ding
Tourism Cross-cultural Propagation and the Corresponding Requirements for Foreign Language-speaking
Tour Guides
24
Yongqiu Xie
Paths to Innovate Business Models in an Economic Downturn
Fernando Almeida, Jose Oliveira & Jose Cruz
29
Research on an Optimization Model for Logistics Nodes System Layout and Its Solution Algorithm 38
Dezhi Zhang & Shuangyan Li
Risks in China’s Financial Market for Derivatives at the Post-Sub-prime Mortgage Period and the
Prevention
50
Mengchun Ding & Hongxin Li
Malaysian Chinese Consumers: Their Ethnic Attitudes and Shopping Orientations 53
Safiek Mokhlis
A Study of on the Job Training Effectiveness: Empirical Evidence of Iran 63
Mehrdad Alipour, Mahdi Salehi & Ali Shahnavaz
Review of Ecology-Based Strategy Change Theories
Dan Su
69
A Study of the Performance of Public Transport Company in Niger State, Nigeria 73
AWOREMI, JOSHUA REMI, ABDUL-AZEEZ, IBRAHEEM ADEGOKE & OLAOGUN, O. B.
Research on Risk Pre-Warning Mechanism under Financial Crisis
Jingting Ma, Shumei Wang & Jian Gui
81
A Study of Customer Loyalty Management in Chinese Retail Supermarket 85
Wang,Wen-Cheng, Chen, Ying-Chang & Chu, Ying-Chien
Exploring on Chinese Foreign Trade Issues Based on E-Business 96
Shuqing Li
Innovativeness: Its Antecedents and Impact on SME Business Performance 100
Mohamammad Ziaul Hoq & Norbani Che Ha
Management Elements for Interpretation Placard System in Mountain Scenic Resort 111
Hongmei Dong
Foreign Banks are More Efficient–a Myth or Fact?
Saadat Wahid & Dr. Kashif ur Rehman
116

Vol. 4, No. 11 International Journal of Business and Management
2
Contents
A Study on Foreign Direct Investment Agriculture in China
Lixin Tang
127
Human Resource Management: A Central Business Concern in Today’s Economy
Kodjo Ezane Joseph & Changjun Dai
130
Study on the Function of XBRL and the Enhancement of the Accounting Information Quality under the
Background of Informationization
Xin Yuan & Yanyan Wang
137
Study on the Maturity Evaluation System of the County Economy Cooperative Development
Su Zhang
140
Forensic Accounting: Public Acceptance towards Occurrence of Fraud Detection
Adrian Nicholas Koh, Lawrence Arokiasamy & Cristal Lee Ah Suat
145
In-Depth Analysis of PC Industry in China
Xiaojun Cui
150
A Study on the Bifurcation of the Proceeds from Convertible Bonds Issuance and Its Policy Significance for
Chinese Accounting Standards
Jinghua Wang & Liqiong Yao
158
A Research Survey of Behavioral Biases of Investment Finance
Xiaofeng Wu
164
The Influence of Psychological Empowerment on Overall Job Satisfaction of Front Office Receptionists 167
Mohd Onn Rashdi Abd Patah, Salleh Mohd Radzi, Rahman Abdullah, Azahar Adzmy, Razlan Adli Zain &
Nazarudin Derani
Total Reward Strategy: A Human Resources Management Strategy Going with the Trend of the Times
Zhou Jiang, Qian Xiao, Henan Qi & Lei Xiao
177
Women Entrepreneurial Innovative Behaviour: The Role of Psychological Capital 184
Sunday Samson BABALOLA

International Journal of Business and Management November, 2009
3
REITs and the Financial Crisis: Empirical Evidence from the U.S.
Tobias Basse (Corresponding author)
Norddeutsche Landesbank (NORD/LB) and FHDW Hannover (University of Applied Sciences)
Norddeutsche Landesbank (NORD/LB), Friedrichswall 10, 30159 Hannover, Germany
Tel: 49-511-361-9473 E-mail: [email protected]
Meik Friedrich
Norddeutsche Landesbank (NORD/LB) and NORD/Advisors
Friedrichswall 10, 30159 Hannover, Germany
Eduardo Vazquez Bea
Norddeutsche Landesbank (NORD/LB)
Friedrichswall 10, 30159 Hannover, Germany
Abstract
REITs are often seen to be very similar to utility stocks. However, the current financial crisis – which has its roots in the U.S. housing market – has raised some doubts regarding this classification. We re-examine the relationship between REITs and utility stocks analyzing data from the United States and document the existence of a massive structural break in February 2007. Our results indicate that investing in U.S. REITs recently has become more risky relative to investments in utility stocks. This change coincides with the current economic and financial crisis.
Keywords: REITs, Financial crisis, Structural change
1. Introduction
By definition, real estate investment trusts (REITs) invest their funds primarily in real estate assets. While being a relatively new asset class in Europe, REITs already do have a long history in the U.S.. In fact, Congress already created the legislative framework for REITs in the 1960s. This legislative framework, for example, forces U.S. REITs to designate at least 90% of their taxable income to shareholders via dividend payments.
It appears to be quite challenging to adequately classify REITs either as stock market or real estate investments. As a matter of fact, many econometricians have analysed the relationship between REITs, the aggregate stock market and “more traditional” real estate assets. Mueller and Pauley (1995), for example, have argued that REITs are often seen to be very similar to utility stocks which are traditionally assumed to be one of the most defensive sectors of the equity market due to their non-cyclical business activities. The rationale behind this classification is understandable given the usually high dividend payments and the strong relative performance of U.S. REITs in the aftermath of the bursting of the dot-com bubble in 2001.
However, some doubts on the point of view that REITs and utility stocks are similar may be reasonable because of the current financial crises - which obviously has its roots in the U.S. housing market. Therefore, this paper aims to re-examine the relationship between REITs and utility stocks analyzing data from the United States. More specifically, the objective of this study is to examine whether the relationship between U.S. utility stocks and REITs, which have commonly been regarded to be close substitutes, has changed due to the financial crisis. In section 2 we review the literature on linkages between REITs, house prices, and the stock market. Section 3 discusses origins and consequences of the global financial crisis. Section 4 provides information about the data sets analyzed. In section 5 we address methodological issues and then present the results of our empirical investigations before concluding in section 6.
2. Literature review
For the U.S. there is mixed empirical evidence as to whether REITs have or have not a systematic link to either the aggregate stock market or the real estate market. Accordingly, there remains severe uncertainty among professional asset managers in the assessment of this asset class as, for example, has been confirmed by a survey conducted by

Vol. 4, No. 11 International Journal of Business and Management
4
Worzala and Bajtelsmit (1997). However, the question whether REITs are stocks or real estate investments has been discussed and analyzed quite extensively. As early as 1987 Kuhle (1987) has reported empirical evidence indicating that, to a certain extend, REITs could offer benefits of diversification for investors holding equities. Those well recognised findings triggered a number of follow up research papers. Mull and Soenen (1997), for example, questioned this diversification potential and found positive correlations between the yields of REITs and traditional stock investments. Similar empirical evidence has also been reported by Bharati and Gupta (1993), Mueller and Pauley (1995), Chandrashekaran (1999) and He, Webb and Myer (2003). Chandrashekaran (1999) has pointed towards significant instabilities in the correlations between the returns of the two asset classes. Similar results have also been presented by Ghosh, Miles and Sirmans (1996) as well as Liang and McIntosh (1998). Corgel, Mcintosh and Ott (1995) have published a very comprehensive overview on the topic in the mid-1990s. Therefore, this paper concentrates on more recent research.
Oppenheimer and Grissom (1998) delivered more evidence for a positive correlation between stocks and REITs using techniques of cross-spectral time series analysis. Moreover, Han and Liang (1995) have shown that the relationship between REITs and the US stock market is more pronounced for the CRSP Index than the S&P 500. This finding could be explained by the small cap effect as REITs in general have a rather low market capitalization. Lee and Stevenson (2005) have confirmed the existence of a rather strong relationship between REITs and small caps. Stevenson (2002) has investigated the transmission of volatility between REITs and traditional stock investments employing a GARCH-model and has confirmed the existence of a tight link between REITs on the one hand and small caps as well as value stocks on the other.
There is also mixed evidence for cointegration between the two asset classes. Wilson and Okunev (1999) have not been able to show that cointegration exists, whereas Glascock, Lu and So (2000) have reported empirical evidence indicating that cointegration has become a relevant phenomenon in recent years.
Looking at the relationship between REITs and the real estate market the empirical evidence is also mixed. Pagliari and Webb (1995) have only found a weak statistical link. Giliberto (1990) as well as Stevenson (2001) have even stated that there is no positive correlation between the returns of the two asset classes at all. However, employing multifactor models, Giliberto (1990) has reported that both asset classes feature a common real estate specific factor. Cointegration between REITs and house prices was found by He (2000), which implies tight co-movements and the existence of a stable long-term equilibrium relationship between the respective time series. These findings have been confirmed by Glascock, Lu and So (2000) as well as by Nishigaki (2007).
Apparently, the question whether REITs are stocks or real estate investments is hard to answer. Myer and Webb (1993) have used a number of different econometric techniques (i.a. Granger causality tests) and – depending on the method used – have found evidence that supports both, the hypothesis that REITs are more closely linked to the stock as well as to the real estate market. Therefore, they have concluded that there is no clear picture. Clayton and MacKinnon (2001) have shown that REITs indeed are similar to both asset classes but that the relationship varies over time. Their study seems to indicate that up to 1992 REITs have been linked closer to the equity market (more precisely to small caps) whereas in the period after that, the relationship to the real estate market has become more predominant.
Given the question examined here one of the most important studies found in the literature has been published by Mueller and Pauley (1995). They have argued that only utilities have a stronger negative correlation to interest rate changes than REITs discussing the bond-like qualities of utility stocks. Ghosh, Miles and Sirmans (1996) have also noted that REITs are often compared to utility stocks. Their empirical findings, however, do not support this commonly held assumption.
3. The global financial crisis
The current financial crisis has culminated in one of the most severe economic downturns in modern history – probably even the worst since the Great Depression. The causes for the breakdown are manifold. Still, systematically underestimated risks can be seen as major cause for the almost collapse of the global financial system. The roots of the current financial crisis lie in the U.S. housing and mortgage market. A surplus of available funds from abroad generated by the macroeconomic imbalances in the U.S.-centric global economy combined with a sustained decrease of U.S. interest rates at the beginning of the new millennium induced a housing boom in the U.S. until spring 2007. This boom was heated by a rapid and careless expansion of mortgage lending with an unusually low compensation for risk-taking. Lending decisions were taken under the faulty assumption of ever rising real estate prices.
At the same time, after the burst of the dot-com bubble in 2001, investors around the world searched for investment alternatives that were both, presumed to be safe and profitable. This was also a consequence of declining returns on many traditional safe long-term investments (e.g., government bonds). The financial industry reacted to this new environment and designed capital market instruments which derived their value from mortgage payments and house prices (e.g., mortgage-backed securities (MBS) and collateralized debt obligations (CDO)). In other words, relatively

International Journal of Business and Management November, 2009
5
illiquid financial assets were transformed into liquid and tradable capital market instruments. In doing so, market participants all around the world were enabled to participate in the booming U.S. housing market. Furthermore, by distributing (e.g. selling) the originated mortgages the financial institutions regained liquidity, which could then be used for additional mortgage activities. As a result, the amount of these financial innovations increased massively in the years leading up to the start of the crisis in 2007 – a boom in the mortgage market was unleashed.
However, such securitized products combined many individual loans in complex, to some extent even abstruse, ways. These new products became so complicated that market participants – even the firms that designed the securities – were not able to entirely comprehend the risks inherent to these financial innovations. Even authorities (e.g. policy-makers, regulators, supervisors) and rating agencies did not fully understand all aspects of these products.
The credit boom began to unravel in early 2007 when signs of economic weakness started to appear and a downward spiral was triggered that continues up to now (see, for example, Wheelock (2008)). The rise of interest rates pressurized mortgaging and suppressed real estate demand. House prices in parts of the U.S. began to fall, (sub prime) mortgage delinquencies and defaults rose, forced sales of collaterals increased and the downturn in house prices intensified. Global financial institutions that had borrowed and invested heavily in the financial innovations described above started to experience major problems due to significant losses.
The crisis deepened in September 2008 when the failure or near-failure of several major financial institutions caused market participants to panic (see, for example, Bullard (2009)). As a consequence, financial and credit markets froze up. The gloomy economic prospects and the loss of confidence in the financial sector had a huge negative impact on share prices all over the world. Falling stock markets, a swaying financial system, and an emerging credit crunch triggered an extremely rapid and deep contraction in global economy which persisted through the first months of 2009.
4. Data
Our empirical investigations are based on two time series: the Dow Jones Composite REIT Total Return Index and the S&P 500 Utilities Total Return Index. The Dow Jones Composite REIT Total Return Index is a common measure for U.S. REITs containing all publicly traded REITs in the Dow Jones universe. The S&P 500 Utilities Total Return Index includes the members of the S&P 500 that are involved in the utility sector. Trying to avoid problems with heteroscedasticity we analyse data with monthly periodicity. Due to the dramatic growth of market capitalization of U.S. REITs since the mid-1990s we chose the sample interval January 1999 to June 2009.
5. Methodology and results
ADF- and PP-tests (not reported) seem to indicate quite clearly that the two time series are nonstationary and integrated of order 1. Therefore, we have tested for cointegration between REITs (REIT) and utility stock prices (UTIL) both on levels and logarithms of levels using the technique suggested by Johansen (1991). Applying the Johansen procedure we at first assume that a linear deterministic trend exists. The tests performed do not indicate that there exists a cointegration relationship between the two variables (see notes table 1 and 2). This result is quite robust to different trend assumptions (see notes table 3 and 4). Given that the variables examined are integrated of order 1 differencing once leads to stationary. Without the existence of a cointegration relationship differencing integrated time series does not result in the loss of valuable information. Thus, we have estimated a simple linear regression model in first differences of logarithms which can be interpreted as monthly returns. The regression equation is (t-statistics in parenthesis):
(1)
Where is the difference operator. This regression equation can be regarded as a special version of the market model with the return of the utilities sector index as benchmark and the return of the REIT index as dependent variable. As suspected the market model beta is a statistically significant positive variable. However, the R2 of the regression is quite low. This might be a surprise.
Given that some econometricians have documented a close link between U.S. REITs and house prices in the United States it might be reasonable to suspect that the financial crises has caused structural change affecting the relationship between REITs and utility stocks. Therefore, we use the Quandt-Andrews breakpoint test (Andrews (1993)) for structural change with unknown timing (see notes table 5) to test for the stability of the estimated parameters. Using this test requires to remove a number of observations from the beginning and the end of the estimation sample in order for EViews to report valid p-values. Symmetrically trimming 15% of the observations by excluding the first and last 7,5% of the data points reduces the test sample to the period August 2000 to November 2007. Hence, there are 87 possible break points. Examining the results the test does suggest quite clearly that there exists a massive structural break. The
ln(REIT) = 0.003 + 0.602 ln(UTIL)
(0.72) (6.65)
R2: 0.265, AIC: -3.104, DW: 1.486

Vol. 4, No. 11 International Journal of Business and Management
6
most likely breakpoint date is February 2007. This result is interesting because the breakpoint identified by the Quandt-Andrews breakpoint test seems to coincide with the first obvious signs indicating an overheating of U.S. house prices.
Given the clear evidence for a massive structural break in February 2007 reported above we have re-estimated equation (1) for the two samples February 1999 to January 2007 (equation (2)) and February 2007 to June 2009 (equation (3)).
(2)
(3)
There are just enough data points to estimate equation (3). The results of the two regressions signal an indubitable increase of the market model beta indicating that during the crisis the risk of REITs investments has increased considerably relative to the utility sector.
6. Conclusion
The empirical evidence found above quite clearly indicates that the relationship between the monthly return on the utilities sector equity index and the return on the REIT index has changed dramatically. Investing in REITs seems to have become more risky relative to investments in utility stocks. This change coincides with the current economic and financial crisis - which, of course, has its roots in the U.S. housing market. Therefore, this structural break is most probably directly related to the current crisis. Our findings do have a number of implications. Most importantly, we have shown that a major macroeconomic crisis can also have additional - and more microeconomic - effects on the relationship between financial assets that have been thought to be quite similar. More specifically, Reddemann et al. (2009) have argued that structural breaks in linear regressions of the type displayed in equation (1) can be a sign of instability and time variation of the correlations between the returns of the asset classes examined. Therefore, the empirical evidence reported above is also a reminder of the fact that the correlation matrices of returns on different financial assets regularly used in financial optimizations are not necessarily stable over time. In fact, financial markets are always on the move.
References
Andrews, D. W. K. (1993). Tests for parameter instability and structural change with unknown change point. Econometrica, 61, 821-856.
Bharati, R. & Gupta, M. (1993). Asset allocation and predictability of real estate returns. Journal of Real Estate
Research, 7, 469-484.
Bullard, J. (2009). Three funerals and a wedding. Federal Reserve Bank of St. Louis Review, 91, 1-12.
Chandrashekaran, V. (1999). Time-series properties and diversification benefits of REIT returns. Journal of Real Estate
Research, 17, 91-112.
Clayton, J. & MacKinnon, G. (2001). The time-varying nature of the link between REIT, real estate and financial asset returns. Journal of Real Estate Portfolio Management, 7, 43-54.
Corgel, J. B., Mcintosh, W. & Ott, S. H. (1995). Real estate investment trusts: A review of the financial economics literature. Journal of Real Estate Literature, 3, 13-33.
Giliberto, S. M. (1990). Equity real estate investment trusts and real estate returns. Journal of Real Estate Research, 5, 259-264.
Glascock, J. L., Lu, C. & So, R. W. (2000). Further evidence on the integration of REIT, bond, and stock returns. Journal of Real Estate Finance and Economics, 20, 177-194.
Ghosh, C., Miles, M. & Sirmans, C. F. (1996). Are REITs stocks?, Real Estate Finance, 13, (1996), 46-53.
Han, J. & Liang, Y. (1995). The historical performance of real estate investment trusts. Journal of Real Estate Research,10, 235-262.
He, L. T. (2000). Causal relationships between apartment REIT stock returns and unsecuritized residential real estate. Journal of Real Estate Portfolio Management, 6, 365-372.
ln(REIT) = 0.013 + 0.351 ln(UTIL)
(4.20) (5.74)
R2: 0.260, AIC: -4.221, DW: 1,674
ln(REIT) = -0.020 + 1.156 ln(UTIL)
(-1,33) (4,29)
R2: 0.405, AIC: -2.159, DW: 1.606

International Journal of Business and Management November, 2009
7
He, L. T., Webb, J. R. & Myer, F. C. N. (2003). Interest rate sensitivities of REIT returns. International Real Estate
Review, 6, 1-21.
Johansen, S. (1991). Estimation and hypothesis testing of cointegration vectors in gaussian vector autoregressive models. Econometrica, 59, 1551-1580.
Kuhle, J. (1987). Portfolio diversification and returns benefits - common stock vs. real estate investment trusts. Journal
of Real Estate Research, 2, 1-9.
Lee, S. & Stevenson, S. (2005). The case for REITs in the mixed-asset portfolio in the short and long run. Journal of
Real Estate Portfolio Management, 11, 55-80.
Liang, Y. & McIntosh, W. (1998). REIT style and performance. Journal of Real Estate Portfolio Management, 4, 69-78.
Mueller, G. R. & Pauley, K. R. (1995). The effect of interest-rate movements on real estate investment trusts. Journal of
Real Estate Research, 10, 319-326.
Mull, S. R. & Soenen, L. A. (1997). U.S. REITs as an asset class in international investment portfolios. Financial
Analysts Journal, 53, 55-61.
Myer, F. C. N. & Webb, J. R. (1993). Return properties of equity REITs, common stocks, and commercial real estate: A comparison. Journal of Real Estate Research, 8, 87-106.
Nishigaki, H. (2007). An analysis of the relationship between US REIT returns. Economcis Bulletin, 13, 1 – 7.
Reddemann, S., Basse, T., Friedrich, M. & Schulenburg, & J.-M. v. d. (2009). Hedge-Fonds als Asset-Klasse: Betrachtungen aus der Perspektive der deutschen Versicherungswirtschaft, Zeitschrift für die gesamte
Versicherungswissenschaft, 98, 273-281.
Oppenheimer, P. & Grissom, T. V. (1998). Frequency space correlation between REITs and capital market indices. Journal of Real Estate Research, 16, 291-310.
Pagliari, J. L. & Webb, J. R. (1995). A fundamental examination of securitized and unsecuritized real estate. Journal of
Real Estate Research, 10, 381-426.
Stevenson, S. (2001). The long-term advantages to incorporating indirect securities in direct real estate portfolios. Journal of Real Estate Portfolio Management, 7, 5-16.
Stevenson, S. (2002). An examination of volatility spillovers in REIT returns. Journal of Real Estate Portfolio
Management, 7, 229-238.
Wheelock, D. C. (2008). The federal response to home mortgage distress: Lessons from the great depression. Federal
Reserve Bank of St. Louis Review, 89, 133-148.
Wilson, P. J. & Okunev, J. (1999). Long-term dependencies and long run non-periodic co-cycles: Real estate and stock markets. Journal of Real Estate Research, 18, 257-278.
Worzala, E. M. & Bajtelsmit V. L. (1997). Real estate asset allocation and the decisionmaking framework used by pension fund managers. Journal of Real Estate Portfolio Management, 3, 47-56.

Vol. 4, No. 11 International Journal of Business and Management
8
Notes
Table 1. Cointegration between REITs and utilities
Lags interval (in first differences): 1 to 4
Unrestricted Cointegration Rank Test (Trace)
Hypothesized Trace 0.05
No. of CE(s) Eigenvalue Statistic Critical Value Prob.**
None 0.070031 12.71190 25.87211 0.7604
At most 1 0.031933 3.926870 12.51798 0.7527
Trace test indicates no cointegration at the 0.05 level
* denotes rejection of the hypothesis at the 0.05 level
**Critical values from EViews
Unrestricted Cointegration Rank Test (Maximum Eigenvalue)
Hypothesized Max-Eigen 0.05
No. of CE(s) Eigenvalue Statistic Critical Value Prob.**
None 0.070031 8.785033 19.38704 0.7463
At most 1 0.031933 3.926870 12.51798 0.7527
Max-eigenvalue test indicates no cointegration at the 0.05 level
* denotes rejection of the hypothesis at the 0.05 level
** Critical values from EViews

International Journal of Business and Management November, 2009
9
Table 2. Cointegration between REITs and utilities (in logarithms)
Lags interval (in first differences): 1 to 4
Unrestricted Cointegration Rank Test (Trace)
Hypothesized Trace 0.05
No. of CE(s) Eigenvalue Statistic Critical Value Prob.**
None 0.039828 7.413438 15.49471 0.5301
At most 1 0.020414 2.495695 3.841466 0.1142
Trace test indicates no cointegration at the 0.05 level
* denotes rejection of the hypothesis at the 0.05 level
** Critical values from EViews
Unrestricted Cointegration Rank Test (Maximum Eigenvalue)
Hypothesized Max-Eigen 0.05
No. of CE(s) Eigenvalue Statistic Critical Value Prob.**
None 0.039828 4.917743 14.26460 0.7522
At most 1 0.020414 2.495695 3.841466 0.1142
Max-eigenvalue test indicates no cointegration at the 0.05 level
* denotes rejection of the hypothesis at the 0.05 level
** Critical values from EViews

Vol. 4, No. 11 International Journal of Business and Management
10
Table 3. Cointegration between REITs and utilities with different trend assumptions
Number of Cointegrating
Relations
Data Trend: None None Linear Linear
Test Type No Intercept Intercept Intercept Intercept
No Trend No Trend No Trend Trend
Trace 0 0 0 0
Max-Eig 0 0 0 0
Critical values (0.05 level) from EViews
Table 4. Cointegration between REITs and utilities with different trend assumptions (in logarithms)
Number of Cointegrating
Relations
Data Trend: None None Linear Linear
Test Type No Intercept Intercept Intercept Intercept
No Trend No Trend No Trend Trend
Trace 0 0 0 0
Max-Eig 0 0 0 0
Critical values (0.05 level) from EViews
Table 5. Quandt-Andrews breakpoint test
Quandt-Andrews unknown breakpoint test
Null Hypothesis: No breakpoints within trimmed data
Varying regressors: All equation variables
Equation Sample: 1999M02 2009M06
Test Sample: 2000M09 2007M11
Number of breaks compared: 87
Statistic Value Prob.
Maximum LR F-statistic (2007M02) 16.46953 0.0059
Maximum Wald F-statistic (2007M02) 16.46953 0.0059
Exp LR F-statistic 6.791876 0.0016
Exp Wald F-statistic 6.791876 0.0016
Ave LR F-statistic 10.32026 0.0012
Ave Wald F-statistic 10.32026 0.0012

International Journal of Business and Management November, 2009
11
The Differences in Job Characteristics, Job Satisfaction, and Organizational Commitment of Taiwanese Expatriates Working
in Mainland China
Sheng Wen Liu
Assistant Professor, Department of Marketing Management, Trasworld Institute of Technology
1221, Jen-Nang Rd., Chia-Tong Li, Douliou, Yunlin, Taiwan R.O.C.
E-mail: [email protected]
Ralph Norcio (Corresponding author)
Professor and Associate Dean, College of Business and Management, Lynn University
3601 N. Military Trail, Boca Raton, FL 33431, USA
Tel: 561-237-7010 E-mail: [email protected]
Jung Tsung Tu
Assistant Professor, Department of Business Administration, Chungyu Institute of Technology
40, Yi 7th Rd., Keelung, Taiwan 201, R.O.C.
E-mail: [email protected]
Abstract
With a population of 1.2 billion, mainland China has become a major target country for many foreign companies looking to expand their businesses because of its inexpensive labor and large market. In 2009, there were 77,642 companies from Taiwan operating in mainland China with fiscal expenditures exceeding US $47.77 billion dollars. If Taiwan’s foreign direct investment (FDI) and offshore investment expenditures were included, Taiwan would have had the second largest FDI in mainland China. The purpose of this study is to investigate the difference in job characteristics, job satisfaction, and organizational commitment depending on family location of Taiwanese expatriates working in mainland China. The entire accessible population of 6,156 Taiwanese expatriates was invited to participate by e-mail - resulting in a valid sample of 389 responses. The methods of data analysis used in this study consisted of exploratory data analysis (EDA), exploratory factor analysis (EFA), internal consistency reliability, and two-tailed independent t-tests. Findings indicated that variety and autonomy, intrinsic job satisfaction, affective commitment, and normative commitment were identified as having positive significant differences between Taiwanese expatriates who were living with family in China and those not living with family in China. Further study to replicate the research in different countries in order to explore the relationships among job characteristics, job satisfaction, and organizational commitment of expatriates was recommended.
Keywords: Organizational commitment, Job characteristics, Job satisfaction, Expatriates, Mainland China, Family location
1. Introduction and Background
Before 1991, there were only 3,884 Taiwanese companies with fiscal expenditures exceeding US $0.86 billion. However, more Taiwanese manufacturers are expanding to mainland China for less expensive labor. In 2009, there were 77,642 companies from Taiwan operating in mainland China with fiscal expenditures exceeding US $47.77 billion (Ministry of Commerce of the People’s Republic of China, 2009). Moreover, Taiwanese companies provide the seventh largest foreign direct investment (FDI) in mainland China. Hong Kong ranks first, followed by the United Kingdom, Japan, Korea, Germany, and the United States. If Taiwan’s FDI offshore investment expenditures were included, Taiwan would have the second largest FDI in mainland China (Department of Investment Services Ministry of Economic Affairs, 2009). Based on this, it is important for Taiwanese human resource management scholars to

Vol. 4, No. 11 International Journal of Business and Management
12
undertake a study to not only determine the factors, which may cause expatriate employees to be willing to live and work in mainland China, but also to have a staff that identifies closely with, and supports the organization. Therefore, the purpose of this comparative (exploratory) study was to investigate the difference among job characteristics, job satisfaction, and organizational commitment of Taiwanese expatriates working in mainland China depending on family location.
1.1 Expatriate Employees
Expatriates are international assignees and employees who are sent by a firm from the home country to work in a foreign location. Most expatriate employees are managerial employees who go to work abroad and are assigned significant responsibilities. With the growth in the globalization of business, expatriate employees are becoming very important and their numbers are expected to continue to increase. Hence, expatriate employees have an important role as representatives of the home office and as bearers of organizational culture (Ali, Krishnan, & Azim, 1997; Guzzo, 1996).
Expatriate failures, such as lost business or suppliers, the potential damage to customers, and the negative effects on staff members and employees in the local market (Frank E. Allen & Associates, n.d.), could be costly to both the corporation involved and the individual expatriate. Consequences include financial failures, caused by increased direct costs, indirect costs, replacement costs, reduced productivity, or unstable corporate image, and lost sales (Ashamalla, 1998).
1.2 Meyer and Allen’s Three-Component Model of Organizational Commitment
Meyer and Allen (1984) conducted two studies with two-group samples of 64 introductory psychology students and 130 employees from several administrative departments of a large university and additionally testing the side-bet theory. From their research findings, they proposed a model of organizational commitment (Meyer, & Allen, 1991). Furthermore, Powell and Meyer (2004) conducted a study to test Becker’s (1960) side-bet conceptualization of commitment within the context of Meyer and Allen’s (1991) three-component model of organizational commitment. Their findings provided strong support for Becker’s theory. The three-component model of organizational commitment reflected a psychological state of employees as the basis for maintaining employment in an organization, that includes a desire (affective commitment), an obligation (normative commitment), and a need (continuance commitment).
Affective commitment is a feeling of attachment and belonging to an organization, that includes the structure of the organization, the type of work experiences, and personal characteristics (Hartmann & Bambacas, 2000). Affective commitment links employees’ emotional involvement and identification with attachment to the organization (Tan & Akhtar, 1998).
Normative commitment is the obligation an employee feels for remaining with the organization (Tan & Akhtar, 1998). Normative commitment could increase by receiving such benefits as advance payment for continuing education, and consideration of special needs and training (Hartmann & Bambacas, 2000).
Continuance commitment refers to the awareness of the consequences associated with leaving an organization, or the awareness of a lack of alternatives. Employees choose to remain in an organization based on continuance commitment because they need to do so (Meyer & Allen, 1991). Lost benefits include accrued pensions, promotions based on tenure, loss of values, future opportunities, or lost efforts if skills or systems are not transferable (Hartmann & Bambacas, 2000).
1.3 Job Satisfaction
Job satisfaction has been conceptualized in many ways. It is not a unidimensional concept, and is of wide interest to people employed in organizations, and also to those who study organizations (Zangaro & Soeken, 2005). One of the popular conceptualizations is proposed by Locke (1976), the intrinsic, extrinsic, and general job satisfaction model that is based on Herzberg’s motivation-hygiene theory (Locke, 1976; Namann, 1993b). Intrinsic job satisfaction is obtained from performing the work and experiencing feelings of accomplishment, self-actualization, and identity with the job. Extrinsic job satisfaction is obtained from the reward bestowed on an individual by superiors, colleagues or the organization, and can take the form of compensation, recognition, or advancement. General satisfaction is an aggregate of satisfaction with various job activities or a combination of several measures of overall satisfaction. No prominent conceptualizations of job satisfaction have been found in the literature, but the use of the intrinsic, extrinsic, and general distinction seems to be the most appropriate concept for international research (Naumann, 1993a; Naumann, 1993b; Zangaro & Soeken, 2005).
1.4 Job Characteristics
Job characteristics have been tested in many studies and have shown a positive influence on expatriates’ success (Bhuian & Menguc, 2002; Morley & Flynn, 2004; Naumann, 1993a; Bhuian, Al-Shammari, & Jerfri, 2001; Nauman, Widmier, & Jackson, Jr., 2000). The Job Characteristics Inventory (JCI) developed by Sims, Szilagyi, and Keller (1976)

International Journal of Business and Management November, 2009
13
was an extension of the job characteristics scales that were developed by Hackman and Lawler (1971). The six dimensions included in the JCI were segregated into two categories: 1) variety, autonomy, task identity, and feedback (refer to job satisfaction), and 2) dealing with others and friendship opportunities (not related to job satisfaction, but were included to determine the impact of the interpersonal characteristics of job design). In order to demonstrate reliability, construct validity, discriminant validity and convergent validity of the JCI, Sims, Szilagyi, and Keller (1976) tested two highly divergent samples: 1,161 medical center personnel and 192 supervisors and managers from a southwestern U.S. manufacturing firm with approximate sales of $120 million as reported in 1973.
2. Research Question
Are there significant differences in job characteristics, job satisfaction, and organizational commitment depending on family location of Taiwanese expatriates working in mainland China?
3. Research Methodology
3.1 Research Design
A quantitative, comparative (exploratory) online survey research design was used to explain the relationships among job characteristics, job satisfaction, and organizational commitment according to family location. The data was collected by an online survey from Taiwanese expatriates working in mainland China.
A self-report survey consisting of three parts was used in this study. The first three questions in Part 1 (Job Characteristics) are filter questions, developed by the researcher to identify a participant’s qualifications (at least 18 years old, and not an owner or a significant shareholder who had decision making responsibility for the company), and family location (Family is living with you in China, Family is not living with you in China). Part 1 is Job
Characteristics, uses the Job Characteristics Inventory (JCI) as developed by Sims, Szilagyi, and Keller (1976) , which includes six dimensions: variety, autonomy, feedback, task identity, dealing with others, and friendship opportunities. Part 2, Job Satisfaction, uses the Minnesota Satisfaction Questionnaire (MSQ) as developed by Weiss et al. (1967), which includes three dimensions: intrinsic job satisfaction, extrinsic job satisfaction, and general job satisfaction. Part 3, Organizational Commitment, uses the Three-Component Model (TCM) Employee Survey as developed by Meyer and Allen (1991; 1997), which includes three dimensions: affective commitment, normative commitment, and continuance commitment.
In order to answer the research question and describe all variables, frequency distributions, measures of central tendency, and variability tests were performed. To determine whether there were significant differences in job characteristics, job satisfaction, and organizational commitment depending on family location of Taiwanese expatriates working in mainland China, two-tailed t-tests were utilized.
4. Data Analyses and Results
4.1 Exploratory Factor Analysis
Exploratory factor analysis (EFA) is a technique to help an investigator to understand the relationships among variables, represent the validity of constructs, extract common factors, and reproduce or explain the correlation matrix by examining the correlation of large sets of items among interval-level variables (Leech et al., 2005). Three instruments (job characteristics, job satisfaction, and organizational commitment) used in this study were reproduced from previous studies. Their construct validity had already been established by their developers and other researchers in different studies. However, to establish construct validity in this study, EFA was conducted to contrast with previous studies and further validate the instrument and examine the underlying structure for the total items of each variable.
The original job characteristics instrument included six dimensions, variety (5 items), autonomy (7 items), friendship opportunity (6 items), feedback (4 items), task identity (4 items), and dealing with others (4 items). Job satisfaction included three dimensions, intrinsic job satisfaction (12 items), extrinsic job satisfaction (6 items) and general satisfaction (20 items). Organizational commitment included three dimensions, affective commitment, normative commitment, and continuance commitment with each dimension having six items. To examine the underling structure for these variables, principal axis factor analysis with varimax rotation was executed.
Before employing EFA, the Kaiser-Meyer-Olkin (KMO) test and Bartlett’s test were conducted. KMO was conducted to determine if there were enough items to predict for each factor. The KMO value of each variable, job characteristics, job satisfaction (intrinsic and extrinsic), general job satisfaction, and organization commitment was greater than .70, which means there were sufficient items for each factor. In addition, the Bartlett value has to be significant (p < .05) in order for EFA to be used. In this study, the significance value for each variable was .000, which means the variables correlated highly enough to give logical support for factor analysis (Leech et al., 2005).
After the KMO and Bartlett tests were conducted, principal axis factor analysis with varimax rotation was executed for each variable. For job characteristics, based on the scree plot test and using an eigenvalue greater than one, after rotation, five factors were extracted with 59.12% of the variance accounted for by the five factors. This result was

Vol. 4, No. 11 International Journal of Business and Management
14
different from the original instrument which contained six factors. According to the results of the new factor loading for job characteristics (JC), the new five factors were renamed. The eigenvalues for these five factors (variety and autonomy, friendship opportunity, feedback, task identity, and dealing with others) were 9.726, 19.673% of the variance; 2.986, 13.791% of the variance; 2.149, 12.324% of the variance; 1.608, 7.398% of the variance; and 1.268, 5.983% of the variance, respectively. On the other hand, all items and factor loadings for the rotated factors were greater than .40, which means that each item has absolute value (Leech et al., 2005).
4.2 Reliability Analysis
To assess the reliability of the instrument in a study, Cronbach’s coefficient alpha is the most commonly used method to compute the internal consistency reliability (Leech et al., 2005). In this study, Cronbach’s alpha was used to assess consistency of three constructs and their sub-constructs. Job characteristics had five sub-constructs (variety and autonomy, friendship opportunity, feedback, task identity, and dealing with others), job satisfaction had three-constructs (intrinsic, extrinsic, and general satisfaction), and organizational commitment had three sub-constructs (affective, normative, and continuance commitment).
As shown in Table 1, the coefficients of all the variables were greater than .70 (ranging from .734 to .934) which indicates the item construct scale for each variable has rational consistency reliability.
4.3 The Mean and Standard Deviations of All Variables
Of the 389 participants, 94 (24.2%) subjects were living with their family in China, and 295 (75.8%) were living in China without their family. Table 2 shows the summary of means, standard deviations, skewness and kurtosis of all variables. Organizational commitment was calculated by 18 items used to measure three constructs, affective commitment, normative commitment, and continuance commitment. Job satisfaction was calculated by 20 items which included 18 items used to measure two constructs, intrinsic job satisfaction and extrinsic job satisfaction. Job characteristics were calculated by 30 items used to measure five constructs, variety and autonomy, friendship opportunity, feedback, dealing with others, and task identity. As shown in Table 2, the skewness of all variables was more than -1.0. Once the skewness is less than -1.0 or more than 1.0, it means the frequency distribution for all variables was nearly normal (Leech et al., 2005).
4.4 Two-Tailed Independent t-Test -Family Location
In order to identify whether there were significant differences in job characteristics, job satisfaction and organizational commitment depending on family location, a two-tailed independent t-test was conducted. An independent t-test was utilized to examine each variable’s two group means to determine if they were significantly different from each other (Leech, et al., 2005). For family location, equality of variances between yes (they are living with family in China) and no (they are not living with family in China) must be identified before adopting a two-tailed t-test to assess if there were significant difference in job characteristics, job satisfaction, and organizational commitment with their sub-constructs depending on family location. To examine the equality of variances for these variables across two or more groups, Levene’s test was utilized.
As shown in Table 3, Levene’s test found equality of variances across the Taiwanese expatriates living with family in China and those that are not living with family in China samples in variety and autonomy, friendship opportunity, task identity, dealing with others, general job characteristics, extrinsic job satisfaction, affective commitment, normative commitment, and continuance commitment. On the other hand, intrinsic job satisfaction, affective commitment, and continuance commitment displayed unequal variables across samples. A two-tailed independent t-test was also utilized to examine whether there were significant difference in job characteristics, job satisfaction, and organizational commitment with their sub-constructs. As shown in Table 3, the results of two-tailed independent t-test found that variety and autonomy (t = 3.040, p = .003), intrinsic job satisfaction (t = 3.174, p = .002), affective commitment (t =2.554, p = .012), and normative commitment (t = 3.216, p = .001) were identified as having positive significant differences between two groups of Taiwanese expatriates who were living with family in China and those not living with family in China. Based on the results provided in Tables 3, the research question was answered.
5. Discussion
5.1 Descriptive and Comparative Analysis of Family Location, Job Characteristics, Job Satisfaction, and
Organizational Commitment of Sample
Based on the data collection of 389 valid responses 94 (24.2%) subjects were living with family in China, and 295 (75.8%) were living in China without family. Based on the analysis of the means and standard deviations of all variables in organizational commitment, affective commitment (4.40) was the highest rated dimension, followed by normative commitment (4.28), and continuance commitment (3.86). The mean for general organizational commitment was 4.01. For job satisfaction, the means were general job satisfaction 3.54, intrinsic job satisfaction 3.63, and extrinsic job satisfaction 3.39. For job characteristics, the mean of general job characteristics was 3.62. The highest rating of the

International Journal of Business and Management November, 2009
15
five dimensions of job characteristics was variety and autonomy (3.80), followed by friendship opportunity (3.73), dealing with others (3.57), feedback (3.41), and task identity (3.29). The research question examined the difference in job characteristics, job satisfaction, and organizational commitment depending on family location of Taiwanese expatriates working in mainland China. Through an independent two-tailed t-test, the results found there were significant differences in the perception of job characteristics, job satisfaction, and organizational commitment according to family location. Moreover, family location not only had a strong correlation with normative commitment using the Pearson correlation analysis, but also was a positive significant explanatory variable of normative commitment.
6. Recommendations for Future Study
To further explore the relationships among job characteristics, job satisfaction, and organizational commitment, future study should be based on the interpretations and conclusions in this study. In addition, further study should explore the impact of job characteristics on job satisfaction and organizational commitment in order to obtain an in-depth understanding of their relationships. This study provided overall research to determine the difference in job characteristics, job satisfaction, and organizational commitment of Taiwanese expatriates working in mainland China depending on family location. Further studies should undertake an in-depth examination of the relationships with different target populations based on the findings of this study in order to gain better understandings about their relationships. Finally, observations or interviews combined with surveys should be considered for future studies to examine the relationships among job characteristics, job satisfaction, and organizational commitment.
References
Ali, A. J., Krishnan, K., & Azim, A. (1997). Expatriate and indigenous managers’ work loyalty and attitude toward risk. The Journal of Psychology, 131, 260-270.
Ashamalla, M. H. (1998). International human resource management practices: The challenge of expatriation. Competitiveness Review, 8, 54-65.
Becker, H.S. (1960). Notes on the concept of commitment. American Journal of Sociology, 66, 32-40.
Bhuian, S. N., Al-Shammari, E. S., & Jefri, O. A. (2001). Work-related attitudes and job characteristics of expatriates in Saudi Arabia. Thunderbird International Business Review, 43, 21-31.
Bhuian, S. N., & Menguc, B. (2002). An extension and evaluation of job characteristics, organizational commitment and job satisfaction in an expatriate, guest worker, sales setting. The Journal of Personal Selling & Sales Management,
22. 1-11.
Department of Investment Services Ministry of Economic Affairs. (2009). The Situation of Taiwanese Corporation in
China. [Online] Available: http://twbusiness.nat.gov.tw/analy/a02-5.htm (Retrieved from January 20, 2009)
Frank E. Allen & Associates. (n.d.). Too many, too much cost, too little planning. [Online]Available: http://www.frankallen.com/Executive_Reports/Expatriate/Expatriate_Failures/expatriate_failures.html (Retrieved from June 1, 2006)
Guzzo, R. A. (1996). The expatriate employee. Journal of Organizational Behavior, 123-137.
Hackman, J. R., & Lawler, E. E. (1971). Employee reactions to job characteristics. Journal of Applied Psychology
Monographs, 55, 259-286.
Hartmann, L. C., & Bambacas, M. (2000). Organizational commitment: A multi method scale analysis and test of effects. International Journal of Organization Analysis, 8, 89-108.
Leech, N. L., Barrett, K. C., & Morgan, G. A. (2005). SPSS for intermediate statistics use and interpretation. Mahwah, NJ: Lawrence Erlbaum.
Locke, E. A. (1976). The nature and consequences of job satisfaction. In M.D.
Meyer, J. P., & Allen, N. J. (1984). Testing the “side-bet theory” of organizational commitment: Some methodological considerations. Journal of Applied Psychology, 69. 372-378.
Meyer, J. P., & Allen, N. J. (1991). A three-component conceptualization of organizational commitment. Human
Resource Management Review, 1. 61-89.
Meyer, J. P., & Allen, N. J. (1997). Commitment in the Workplace: Theory, Research, and application. Thousand Oaks, CA: Sage Publications.
Ministry of Commerce of the People’s Republic of China (2009). China’s overseas direct investment statistics 2009.[Online] Available: http://www.mofcom.gov.cn/static/v/tongjiziliao/v.html/1(Retrieved from January 20, 2009).

Vol. 4, No. 11 International Journal of Business and Management
16
Morley, M. J., & Flynn, M. (2004). The relationship between work-role characteristics and intercultural transitional adjustment domain patterns among a sample of US and Canadian expatriates on assignment in Ireland. Cross Cultural
Management, 10, 42-57.
Naumann, E. (1993a). Antecedents and consequences of satisfaction and commitment among expatriate managers. Group & Organizational Studies, 18, 153-187.
Naumann, E. (1993b). Organizational predictors of expatriate job satisfaction. Journal of International Business Studies,
24, 61-80.
Naumann, E., Widmier, S. M., & Jackson, Jr, D. W. (2000). Examining the relationship between work attitudes and propensity to leave among expatriate salespeople. The Journal of Personal Selling & Sales Management, 20, 227-241.
Powell, D. M., & Meyer J. P. (2004). Side-bet theory and the three-component model of organizational commitment. Journal of Vocational Behavior, 65, 157-168.
Sims, H. P., Szilagyi, A. D., & Keller, R. T. (1976). The measurement of job characteristics. Academy of Management
Journal, 19, 195-212.
Tan, D. S. K., & Akhtar, S. (1998). Organizational commitment and experienced burnout: An exploratory study from a Chinese cultural perspective. International Journal of Organizational Analysis, 6, 310-333.
Weiss, D. J., Dawis, R. V., England, G. W., & Lofquist, L. H. (1967). Manual for the Minnesota satisfaction questionnaire. Minnesota Studies in Vocational Rehabilitation, 22. Mineapolis: Industrial Relations Center, University of Minnesota.
Zangaro, G. A., & Soeken, K. L. (2005). Meta-analysis of the reliability and validity of part of the index of work satisfaction across studies. Journal of Nursing Measurement, 13, 7-22.
Table 1. Reliability Statistics
Variable Item Cronbach’s Alpha ( )
Variety and autonomy 10 .885
Friendship opportunity 7 .872
Feedback 7 .822
Task identity 3 .791
Dealing with others 3 .734
General job characteristics 30 .911
Intrinsic job satisfaction 9 .891
Extrinsic job satisfaction 9 .881
General satisfaction 20 .934
Affective commitment 4 .894
Normative commitment 9 .893
Continuance commitment 5 .812
General organizational commitment 18 .742

International Journal of Business and Management November, 2009
17
Table 2. Descriptive Analysis of All Variables
Variable (Number of Items) Mean Std.deviation Skewness
Organizational commitment (18) 4.0081 .63443 -.005
Affective commitment (4) 4.4044 1.29020 -.165
Normative commitment (9) 4.2751 1.05293 -.146
Continuance commitment (5) 3.8576 1.15624 .027
Job satisfaction (20) 3.54 .57608 -.810
Intrinsic job satisfaction (9) 3.6347 .60789 -.892
Extrinsic job satisfaction (9) 3.3867 .64437 -.792
Job characteristics (30) 3.6170 .45076 -.239
Variety and autonomy (10) 3.7956 .53188 -.193
Friendship opportunity (7) 3.733 .64999 -.489
Feedback (7) 3.4065 .6312 -.259
Dealing with others (3) 3.5733 .52499 -.091
Task identity (3) 3.2853 .71715 -.061
Table 3. Two-tailed Independent t-Test of Job Characteristics, Job Satisfaction, and Organizational Commitment According to Family Location
Variable/Family Location Levene’s test for equality of variances
t-test for equality of means
F Sig. (p) T Sig. (p)
Variety and autonomy .013 .910 3.040 .003
Friendship opportunity 4.044 .045 1.328 a .184
Feedback .498 .481 -.013 .989
Task identity .177 .675 -1.848 .065
Dealing with others .161 .689 1.684 .093
General job characteristics .684 .409 1.519 .130
Intrinsic job satisfaction 8.648 .003 3.174 a .002
Extrinsic job satisfaction .000 .999 .874 .383
General satisfaction 2.201 .139 1.875 .061
Affective commitment 5.025 .026 2.554 a .012
Normative commitment .369 .545 3.216 .001
Continuance commitment 8.208 .004 -.001 a .999
General organizational commitment
.364 .547 1.383 .167
Note 1. a - Adjusted t-test formula for unequal variances

Vol. 4, No. 11 International Journal of Business and Management
18
A Study on Difficulty Applicability and Teaching Forms of Management Case Teaching in Undergraduates
Liqin Chen
School of Humanities and Economic Management, China University of Geosciences
Beijing 100083, China
E-mail: [email protected]
Henghai Zhao
School of Humanities and Economic Management, China University of Geosciences
Beijing 100083, China
Cong Ding
School of Humanities and Economic Management, China University of Geosciences
Beijing 100083, China
Abstract
Management, a basic course, calls for improvement in its teaching methods. Case teaching is being extensively employed since real management practice is simulated in it.
In spite of some existing researches on “how to divide cases in difficulty” and “the objectives of case teaching”, only a few of them are on the relations between the difficulty of case teaching and the reception of teaching objects. We are lacking in studies on class scale, class time allocation and the number of participants in this field, not to mention those on undergraduates. Based on the three-dimensional cubic model of case difficulty, this paper conducts an empirical research on undergraduates in questionnaire surveys and semi-structured interviews. It is shown in this research that complex cases with multi perspectives involving low difficulty in information collection and analysis are more suitable for students at this stage. In addition, the time allocated for case teaching should be nearly 50% and major and minor cases can be mixed in each chapter. It is also better to have case teaching with a two-class scale.
Keywords: Management, Case teaching, Undergraduate, Difficulty applicability
To manage means to achieve goals by comprehensively exploiting a variety of resources in an organization, hence indispensable for any organization. Based on economics, behavioral science and mathematics, management covers a wide range including branches of basic theories, branches of techniques and practical branches. In addition, the management of all organizations, including global, national, regional corporate, nor-profit and family ones, is divided into three levels (basic management, functional management and strategic management). Due to its fundamental role, management needs to be improved in its teaching contents and methods. Therefore, case teaching seems particularly effective to equip students with both basic management theories and practical ability and quality in solving problems.
Currently, case teaching is widely adopted in China’s management teaching. However, due to insufficient researches on case difficulty and forms of students’ participation, students’ participation and enthusiasm for class are suffering. The present researches are mainly focused on how to organize class (Chen liqin & Zhao henghai, 2006). For example, it is widely accepted by scholars that a complete case is made up of six parts including introduction, background, specific field, specific items for decision, choices and conclusion. In spite of some existing researches on “how to divide cases in difficulty” and “the objectives of case teaching”, only a few of them are on the relations between the difficulty of case teaching and the reception of teaching objects (Wang, Shujuan & Wang, Xiaotian, 2008). According to some scholars, this method is accepted by postgraduates (Jimmy Chang, 2005) but few importance has been put on the researches on case quantity, class time and the number of participants, not to mention those on undergraduates. Therefore, it is particularly important to offer a model reflecting students’ degree of acceptance of case difficulty, class scale as well as class time for teachers in undergraduate management teaching.
Based on some theories including the three-dimensional cubic model of case difficulty and applying them to some aspects such as class time, case quantity and class scale, this paper conducts an empirical research on undergraduates in questionnaire surveys and semi-structured interviews.

International Journal of Business and Management November, 2009
19
1. Literature Review
1.1 Business Administration Cases and Its Case Teaching
Cases are generally some issues recorded during business operation as well as some relevant facts, advice and suggestions for executives to rely on to make their decisions, which provide some practical circumstances on which students are expected to analyze, discuss and make their decisions. According to some scholars, a case, the description of certain factual situations in an organization, often involves a decision, a challenge, an opportunity, a problem or an issue for one or some members in it. Merseth (1996) claims that cases are narrative documents about real teaching situations and events; they reveal the background and something about the characters of a story from different perspectives; cases for discussion must have enough details and necessary information for users to interpret and analyze.
It is generally assumed that cases are based on some real events and are authorized to be publicized by some enterprises instead of fabricating ones. Stake (2000) defines case study as the course to interpret behavior (in a single event) under specific circumstances or in specific conditions. According to Yin (1981,1989), case study for teaching does not necessarily give a complete or exact description of real events because it mainly prepares a framework for students’ discussion and argument. Therefore, standards for a teaching-oriented case are quite different from those for a research-oriented one. However, it is the very purpose of case teaching to achieve better teaching effect with real cases and contents since students’ disbelief in the authenticity of cases will influence the given purposes as well as consequent teaching effects. What is more important is it is difficult to guarantee students’ experience in solving similar problems with such inauthentic problems.
Case teaching, forming cases for students to think, analyze and make decisions by typifying some real situations, helps to improve students’ abilities in analyzing and solving problems by encouraging them to have profound analysis on enterprises’ operation and find out the source of their problems and figure out solutions to them. Such participation-oriented method helps to deepen former theoretical teaching, to enhance students’ understanding of knowledge, to exert their thinking capacity, to cultivate students’ creativity and to improve their practical management ability, hence being widely adopted by many business schools all over the world.
Ever since it was introduced to corporate management teaching in Harvard Business School in 1908, both teachers and students benefit a lot from case teaching. With this method, American teaching institutes have cultivated a lot of first-class managers to create their prosperous economy. According to statistics, MBA students in some world-famous universities have to finish 7-9 cases every day, which sets solid foundation for their later capacity in dealing with complicated business.
Even if students have grasped modern management ideas, the basic methods of management organization and patterns during their study, these are useless because they have not gone through any practice. As a result, practice seems particularly significant to test students’ grasp of basic knowledge, to detect and make up their shortcomings, to improve their flexible use of knowledge and therefore to prepare them for future management innovation. In addition, since these selected cases involve some relatively complete events (especially comprehensive ones) in business operation, great convenience is provided for students to have overall management practice and have their innovative abilities cultivated. In order to analyze cases or answer questions in them, students have to go through every stage in analyzing and solving problems with every possible method, hence cultivating their own abilities in collecting, analyzing and employing information, cultivating their abilities in assessing the solutions in cases, cultivating their abilities in proposing creativesolutions based on their reasons, cultivating their persuasive abilities and their abilities in writing analysis reports as well as composing cases themselves (mainly students for Master’s Degree or MBA). All these reflect their innovative management capacity.
1.2 Objectives of Case Teaching and the Three-Dimensional Cubic Model of Case Difficulty
With the conduction of case teaching, researches on it are booming, most of which are about its class organization and its teaching objectives.
Scholars including Romm and Mahler (1991)and Osigweh (1989) have conducted quite a lot of researches on the objectives of case teaching, forming different opinions about different issues, ranging from the acquisition of professional knowledge to the improvement of communicative abilities, from the acquisition of specialized knowledge to the recognition of and solution to problems from a strategic perspective.
Different cases reflect different characteristics, forming different types of cases for different teaching purposes. Reynolds (1978) divides case characteristics into three dimensions including data, analysis method and value. The data dimension can be regarded as a universal continuum, whose complexity degree depends on teaching purposes. The same is true for the analysis method dimension, ranging from cases for getting familiar with analysis methods to cases with few or no signal about analysis methods. The value dimension continuum has some single value systems such as efficiency, profit-earning capacity and long-term profit maximization at one end and some complex value systems such

Vol. 4, No. 11 International Journal of Business and Management
20
as those of profit, environmental protection, morality and social responsibility at the other. All these are related to analysis methods and decision-making standards.
Mauffette-leenders et al (2001) claim that cases differ in dimensions of formulation, analysis and theory. According to his model, the difficulty of a case for students can be assessed and analyzed at three dimensions, each of which can be divided into three levels (1 means “easy”, 2 means “with intermediate difficulty” and 3 means “very difficult”). Accordingly, as is shown in Figure 1, a cubic model is formed, which is the three-dimensional cubic model of case difficulty.
Among the three axes in the three-dimensional cubic model of case difficulty, x means the analysis dimension: 1 stands for cases giving not only the description of situations but problems and solutions ; 2 stands for cases giving situations and problems but having not solutions; 3 stands for those only giving situations, leaving problems or solutions untouched.
y means the concept and method dimension: 1 stands for cases in which simple, basic or exploratory methods are employed to solve problems with concepts or branches belonging to the same branch or field; 2 stands for cases at least partly employing complex concepts or methods which are from different branches or fields; 3 stands for cases with profound and complicated concepts and high comprehensive degree in which a variety of branches or fields are mixed together.
z means the information dimension: 1 stands for cases providing a little but complete and concentrated information which is delivered in a direct, systematic and clear way; 2 stands for cases with more information which is given in a dispersed and disordered way, some of which has to be obtained through calculation and even some decisions are made based on assumption due to the lack of some important information; 3 stands for cases with complicated, disordered and sometimes indirect, irrelevant or even wrong information and without some key information.
27 different difficulty combinations are included in such a cube, in which the combination of “111” is the easiest one and “333” is the most difficult one at all three dimensions.
The data dimension defined by Reynolds is the same at the formulation dimension given by Mauffette-Leenders et al. Although it provides a clearer division at the analysis dimension, the latter covers a narrower range at its theory dimension than the value dimension of the former because cases in a specific branch of study only involve one-fold value system while almost all real decisions have to be made based on comprehensive consideration.
2. A Study on Difficulty Applicability and Teaching Forms of Management Case Teaching in Undergraduates
Questionnaires are designed according to the three-dimensional cubic model of case difficulty. In addition, taking the characteristics and demands of undergraduates’ learning of management into consideration, we add another three-dimensional frame into our study, which includes the time allocated to case teaching, the number of cases and the number of participants. From the perspective of students’ cognition of case teaching, we conducted a questionnaire survey with the method of random sampling on the undergraduates learning management in a Beijing university, in which 100 questionnaires were distributed, 92 were returned (the recorery rate of 92%) and 87 were valid (the validity rate of 87%).
2.1 Difficulty Applicability of Management Case Teaching in Undergraduates
In order to make our study more representative, we pick out the item chosen by the greatest number of students, as is shown in Table 1.
It is shown that 47 undergraduates, more than 50% of all, choose the combination of “121”, which means that most of them hope to have detailed information and solutions in given cases instead of exploring the answer by themselves due to the influences of China’s traditional education pattern. In addition, in order to be trained in their ability in comprehensively employing different management functions, more students tend to chose at least a part of complex concepts or methods involved in cases. Because undergraduates are lacking in practical management experience, understanding capacity of management theories, reading and understanding capacity of cases as well as ability in analyzing cases with the theories they have learnt, it is quite all right that most of them choose this combination. Therefore, it is assumed that the teaching objectives based on this difficulty combination will satisfy these investigated undergraduates’ demands.
2.2 The Three-Dimensional Combination of the Number of Cases, Time and Scale
According to the principle of the cubic model of case difficulty, we set up another cubic model with the number of cases, time and the number of participants. x means the number of cases, in which 1 stands for the possibly greatest number of cases, 2 stands for one major case and several minor cases in each chapter and 3 means one major case in each chapter. y is the time allocated to case teaching, in which 1 is almost 100%, 2 is about 50% and 3 means around 30%. z is the number of participants, in which 1 means a single class, 2 means two classes together and 3 means over two classes. The result is shown in Table 2.

International Journal of Business and Management November, 2009
21
It is revealed that 50 students, 57.47% of all, choose the “222” combination, reflecting a greater intensity than that in the survey on difficulty combination. More students tend to choose the pattern in which major and minor cases can be combined in each chapter and about half class time is arranged for case teaching with two classes learning the course together. It is obvious that they have deep interest in case teaching with the hope to be trained in their ability of solving real cases as well as learning theories along with other students.
2.3 Empirical Study in Case Selection and Class Organization
It is shown in our investigation on case selection that students tend to be interested in some hot cases in their discussion and teaching course in order to have their knowledge and the real cases combined. The relevant statistics are shown in Figure 2.
It is also shown that a majority of undergraduates hope to participate in teams in case selection in order to discuss and study those issues appealing to them at class. The statistics are given in Figure 3 and Figure 4.
3. Conclusions
The following conclusions can be reached based on the above research:
In undergraduates’ management teaching, complex cases with multi perspectives and lower difficulty in information collection and analysis are more suitable for students at this stage. Some cases giving the problems and solutions as well as the situations are quite easy for students while some with a larger store of information as well as at least one part of complex concepts and methods coming from different branches of study or fields have to be solved with a group’s joint efforts. Certain objectives, such as cultivating students comprehensive abilities and teamwork abilities as well as their abilities in assessment, decision making and taking actions and their learning, understanding and employment of concepts, can be achieved during the course. Such case difficulty is fit for these undergraduates.
In addition, more students tend to choose the pattern in which major and minor cases can be combined in each chapter and about half class time is arranged for case teaching with two classes learning the course together. This pattern will enable students to quickly learn about the application of management knowledge to practical cases in a more rich and interesting way. Besides, students’ teamwork spirit can be enhanced during their discussions and efforts to solve cases.
In case teaching, it is up to the teacher to select cases while students should also participate in it in order to have more effective teaching and learning course. Meanwhile, a reasonable use of hot cases and group discussions will enhance the effect of case teaching. It is quite interest that these students show their lack of interest in current affairs and some complicated major cases and therefore the selection of cases for their class in our semi-structured interviews in spite of their great passion for hot cases. In order to solve this problem, on one hand, teachers should have more communication with students; on the other hand, teachers may guide them by intensifying class organization and management, which is also a new perspective for further study in this filed.
Note
One of accomplishments of elaborate course constructon of management in China University of Geosciences (in the charge of Henghai Zhao).
References
Chang, Jimmy. et al. (2005). Students’ View on the Use of Case Method in China. Developments in Business Simulation
and Experiential Learning, Vol. 32, Pp. 86-90.
Chen, Liqin, & Zhao, Henghai. (2006). Methods and Implementation of Management Case Teaching. Journal of
Capital Unviesity of Economicis and Business. January
Gragg, C. I. (1940/1982). Because Wisdom Can’t Be Told. Harvard Alumni Bulletin. October 19. 1040. Reissued by Harvard Business School, Report 9-451-005, Rev. November 30, 1982. McGraw-Hill Companies, 2001.
Mauffette-leenders, Louise A, James A. Erskine & Michiel R. leenders. (2001). Learning with Cases (2nd ed.), Richard Ivey School of Business, Ivey Publising.
Osigweh, C. A.B. (1989). Casing the Case Approach in Management Development. Journal of Management
Development, Vol. 8, No.2, pp. 41-57.
Reynolds, J.I. (1978). There is Method in Cases, Academy of Management Review, 3(1): pp. 129-133.
Romm, T. and Mahler, S. (1991). The Case Study Challenge: A New Approach to an Old Method. Management.
Stake, R.E. (2000). Case studies. In N.K.Denzin & Y.S.Lincoln (Eds.). Handbook of Qualitative Research (2nd ed.): pp 435-454 Thousand Oaks. CA: Sage Publications.
Wang, Shujuan, & Wang, Xiaotian. (2008). Study on Difficulty Applicability of Cases Employed in Management Teaching. Journal of Management Case Studies, 1 (2), pp. 84-88.

Vol. 4, No. 11 International Journal of Business and Management
22
xy
z
Yin, R. (1981). The Case Study Crisis:Some Answers. Administrative Science Quarterly, 26, pp. 58-65.
Yin, Robert K. (1989). Case Study Research: Design and Methods (Rev.ed). Beverly Hill. Calif.
Yu, Jing. (2004). Case Studies and Methods. Economic Management: New Management, 20.
Table 1. Difficulty combination of cases chosen by undergraduates
Object Chosen difficulty
combination Number of students
choosing it Percentage
Undergraduates 121 47 54.02%
Table 2. The combination of the number of cases, time and scale chosen by undergraduates
Object Chosen combination Number of students
choosing it Percentage
Undergraduates 222 50 57.47%
Figure 1. Three-Dimensional Cubic Model of Case Difficulty
Figure 2. Undergraduates’ Selection of Management Cases
333133
331131

International Journal of Business and Management November, 2009
23
Figure 3. the Method of case selection
Figure 4. Class organization of management cases

Vol. 4, No. 11 International Journal of Business and Management
24
Tourism Cross-cultural Propagation and the Corresponding Requirements for Foreign Language-speaking Tour Guides
Yongqiu Xie
College of Business Administration, Capital University of Economics and Business
Beijing 100026, China
Tel: 86-10-8272-3913 E-mail: [email protected]
Abstract
Overseas tourist usually comes from different cultural backgrounds. On arrival of the traveling destination in China, they find themselves already in an entirely new environment. Besides sightseeing, leisure relaxation, shopping, entertainment and other enjoyments, they receive, more or less, edification from traditional Chinese culture. Actually, China's tour guide is spreading his native culture to the foreign guests. In this sense, guiding service for visitors from abroad is greatly different form that for domestic travelers, which poses a number of specific requirements for tour guides. To have a definite clarification of the requirements,, this dissertation makes some exploration on the special professional qualities that a foreign language-speaking tour guide should possess.
Keywords: Cross-cultural propagation, Foreign guest service, Special requirements
With special properties and requirements, foreign cultural propagation is different from that within a single ethnic cultural model. Such cultural differences require the relevant practitioners and scholars apply the opinions of cross-cultural psychology to the researches on the cultural commonality and difference between China and other nationalities so as to detect the compatibility of two different cultures. This is essential to the global propagation of the splendid Chinese culture. As an overseas guest-serving career, tour guiding performs the function of foreign propagation. Therefore, China’s tour guides should develop special qualities for cross-cultural communication and become competent enough for the communication. Tourism cross-cultural communication concerns many aspects of the industry and this dissertation cannot present perspectives in every detail. So the present author only explores primarily on the following three issues:
1. Characteristics and nature of tourism cross-cultural propagation
1.1 Nature
Chinese culture goes back to ancient times. But, for quite a long period, only a small part of this treasury is opened to the world. To help the culture become understandable and appealing to the peoples of most countries, thus brilliant inheritance should be carried on with creativity and enthusiasm. As a channel of cultural propagation, tourism activity actualizes the movement of tourists through the economic operation of the industry.
This movement bears two properties. First, it does not constrain from the social system and cultural level of the travelers. Second, it is conducted across different regions and countries. This extensive trans-area movement contributes greatly to the frequent contacts and communications between different societies, economies and cultures, for on one hand, the visitor’s cultural model is observed and adopted by the people of the destination regions and countries, and on the other hand, the visitors also directly observe the destination’s historical sites of cultural interests, traditional customsand conventions and present cultural life of the native people. From the explanation and commentary by the tour guides, the visitors acquire their personal experience and perception and, furthermore, adopt the cultural merits of the destination people. In nature, such an in-the-tour humanity movement and the mutual influences on the peoples from different cultural backgrounds is a phenomenon of culture propagation and communication. Foreign cultural propagation is different from that between different areas within the same cultural model. Under the latter circumstance, successively inherited cultural traditions of the same ethnic group make factors of cultural assimilation produce effect more powerfully than those of cultural conflicts although the cultural propagation within an ethnic group triggers conflicts also. But the foreign cultural propagation works in a quite different way. Different life styles and norms of behavior, and different cultural values and psychological patterns produce more non-affinitive factors than affinitive factors. Therefore, it is necessary to shorten the cultural mental disparity which derives from the special properties of two different cultures. As an achievement, the two cultures become understandable and respectable

International Journal of Business and Management November, 2009
25
to each other and learn from each other to make up deficiencies respectively. China’s tourism industry attracts great numbers of foreign travelers to the country, which offers convenience for the visitors to learn about and take close looks at China and the Chinese culture in a more direct and imaginative way. Consciously or not, China’s tour guides are spreading their country’ s national culture to the outside world.
Attracting foreign visitors to promote the excellent culture of one’s own nation is not a unique creation of China. It is a commonly adopted strategy by a large number of countries. In Europe it is a common sight that experts, professors, doctors and scholars take part-time jobs as tour guides. Such a usual practice not only upgrades a nation’s culture propagation, but also improves the publicity’s effect. A large majority of countries in the world attach great importance to the social effects of the culture spreading by tourism practitioners, which is highly valued as an important strategy to improve the overall strength of a country.
1.2 Characteristics
Most Occidental travelers may have only one opportunity during his life to come to China due to far distance and large expenses. He or she needs to acquire nice and direct impressions on China and the people there as much s possible just in a few days during their life time. So the quality of the direct impression is unidirectional, which means that the impression can be merely positive, but not negative. Further, Chinese tour guides should put the time constraint into account and help their guests take a most possible successful tour so that they can go back to their home country with beautiful impressions on Chinese culture. This is the first characteristic of tourism cross-cultural propagation. Tourism cross-cultural propagation is different from the propagation of other types of cultural knowledge, such as the education programs for the foreign students who come to China for further study. This is because, for most people living in modern society, traveling is a means of self-relaxation which removes the mental and physical burdens caused by the fast life pace, hence, it can be regarded as a consumption which combines vocation, leisure and entertainment. To meet such consumer’s needs, cross-cultural propagation of tourism should be conducted in an atmosphere of lightness and pleasantness. Chinese culture can be explained to foreigners in simple and tasteful terms and cultural propagation be merged into the activities of leisure and entertainment. This is the second characteristic of cross-cultural propagation of tourism.
Tourism industry creates good opportunities for friendly communication and mutual understanding between peoples of different regions and countries. Cross-cultural propagation of tourism has constructed a bridge of communication and mutual understanding between different cultural communities. It improves opportunities for peoples from different cultural backgrounds to perfect their cultures with the civilization cream of other nations. This is because culture can be communicated and understood by peoples of different nations in nature. In this sense peoples with similar cultural interests can become intimate friends. When cultural conflicts occur a tour guide should respect the cultural values and customs of the guests and reduce negative effects of a cultural collision. Patiently and gradually the tour guide can exchange feelings and ideas with the visitors and stimulate them to learn about and understand Chinese people’s life style, pattern of logical thinking, norms of behavior, morality, sentiment, ascetic interest, life philosophy as well as customs and conventions. As a result, friendship will be enhanced and deepened. This is the third characteristic of tourism cross-cultural propagation.
2. Requirements for Foreign Language-speaking Tour Guides
Mainly, tourism cross-cultural propagation is represented in guest-receiving process and the process has to be completed by foreign language-speaking tour guides. Without highly professional quality, the guides cannot achieve any success in tourism cross-cultural propagation. Quality is a stable competence acquired by assimilating and sublimating knowledge. And skills are learned and accumulated through long term practice. To be successful in cross-cultural propagation, the tour guide is required to develop the following qualities:
2.1 Rich cultural knowledge about Chinese nation and the people
Generally, travelers choose natural landscapes and famous historical sites as the objects to visit. Understood on the surface, a tour guide’s work is only navigating the visitors form one scenic spot to another. From this assumption, it is concluded that tour-guiding is merely leading the way for visitors. This is only a shallow misunderstanding. The assumption has depreciated the profound cultural connotation of the scenery and sightseeing. Besides, it ignores the traveler’s needs to participate in various activities and underrates the roles that a tour guide performs in the cultural propagation during a tour. To be competent for the cultural propagation, a foreign language-speaking tour guide must equip himself with a rationally structured knowledge preserve.
First, he needs to possess extensive knowledge about Chinese traditional culture. Often, tourists of different age, career and education background require the guide offer large spans of cultural knowledge, which ranges from magnificent wars and famous historical events to mental and physical cultivation, musical instrument playing, flower-growing and fish, insets and birds raising, etc. Academically, the knowledge involves not only historical relics, archaeology, literature, art, religion, medicine, architecture, park design and building, gardening, folk customs and conventions, but dress and

Vol. 4, No. 11 International Journal of Business and Management
26
personal adornment, weaponry and entertainments as well. When presented vertically, Chinese culture carries the features of the historic inheritance, but horizontally, it includes not only the culture of the Han ethnic group but also that of other nationalities. It is a combination of native and external cultural works of art. As for appreciative taste, a tour guide’s speech should be both elegant and popular. When preparing a speech a tour guide may need only a countable amount of knowledge, but he must possess a large store of diversified knowledge. Such a rich storage means a wide spectrum of material selection to him. To give wonderful explanation about scenic spots and landscapes, the tour guide needs to absorb fine and important material from historical data, anecdotes, legends, events and well-known figures, etc. Only when well grounded and highly adaptable to various situations can he make his speech fascinating to the audience.
In addition, he should explore the knowledge about a particular subject, for example, when the present architectural style and feature of a sightseeing building are being studied, the previous and post features and styles must be put into account so that the building evolution process can be studied and the comprehensive architectural culture of China be grasped as a whole. Meanwhile, a comparative study needs to be made between China's ancient architectural styles and features and those of ancient European building, which will be helpful for the visitors to learn about the difference of the two and deeply realize the cultural connotation of the visited scenic spot. Furthermore, the guide should make profound studies on the Chinese culture in extensive horizons, for instance, Confucianism, Buddhism and Taoism respectively exert specific influences on varieties of cultural arts of ancient China. A thorough and comprehensive knowledge of the three fields will enable the tour guide to master the traditional culture in general. Such mastery serves as a solid foundation for the guide to explain briefly and clearly the particularities of a certain area of the traditional Chinese culture. Then, his cross-cultural propagation will be upgraded to a higher level.
2.2 Rich cultural knowledge about the guest country and the people
A qualified foreign language-speaking tour guide should not only possess plenty of the cultural knowledge of his native land but also that of the guest country. He must be familiar well enough with the guest country's fresh and modern culture in dynamic condition as well as its historic and traditional culture in static condition and acquaint himself with the highly tasted main stream culture and the regional and popular minor stream culture as well. That is the only solution to finding out the commonality and compatibility between the two.
The most important ability to become acquainted with two particular cultures is being good at making comparisons between them and obtaining referential findings. For instance, in Europe the gardening art is regarded as an art of planting, which is to symmitrize flower forums, lawns and plants in palaces and castles. The effect is to build a comfortable ecologic environment for people's social contact and art appreciation. On the contrary, the principle of the classical Chinese garden art is to re-create nature. It is to add poetic quality to natural sceneries in accordance with man's ideal. The aim is to create an ideal ecological condition of tranquility and coziness. The designing philosophy is different, one gives more highlights to vegetation planting art, and the other emphasizes scenery recreation. But both aim at creating an ecological environment of social life. This is the common features of the two types of gardens. Between them, there is no difference of being superior or minor, but only the compatibility to each other. If a foreign language-speaking tour guide take this feature as the initial tone for his speech, it will be easier for him explain clearly and precisely the unique style and art charm of the classical Chinese garden design and decoration to the visitors and reveal the cultural connotation and aesthetic value to them.
With extensive and profound cultural knowledge, a tour guide is able to capture the thread of his communication with the visitors. For example, German attaches great importance to logic reasoning and philosophic presentation. They are keen on exploring the essence of anything in the discussion. When explaining "Buddhism suffering" of "The Four Noble Truths", the guide is frequently interrupted by such instant questions as what the suffering really is in Buddhism. A resourceful guide would make comparisons between the Buddhism suffering with the saying "the nature of man's will is suffering.", the perspective of Arthur Schopenhauer, a German philosopher in 19th century. Summarizing the comparison, he concluded that both pessimistic views are essentially different from the initiative spirit of modern people. Such an explanation gave the audience an unexpected pleasure. To the visitors, this pleasant surprise means not only a reward to the guide for his wittiness, but also an excitement of suddenly finding out the passage of communication between Chinese and European cultures by themselves.
In making cross-cultural propagation, a tour guide should be good at finding best turning point of topic and in which area the guests are interested. For example, most of Austrian like to enjoy music and take John Strauss and Mozart as their national pride. The majority of them know well about jasmine, a piece of Chinese folk music work. But quite a few of them have a bit of knowledge about A Moonlit Night On The Spring River, The Moon Over a Fountain and the
Butterfly Lover and other famous Chinese music works. If the guide can catch the opportunity and make appropriate introduction immediately to arouse the interest of the visitors, the latter will be stimulated and become fascinated in the music, just like making a discovery of a new continent. This is the musical commonality, in essence, a kind of cultural compatibility which has to be realized by the guide's skillfully applying his tour guiding art.

International Journal of Business and Management November, 2009
27
2.3 Proficiency in English or other foreign languages
A foreign language works as a linguistic equipment of cultural propagation. For a tour guide the foreign language he speaks is just the native tongue that his receiving object uses. People who speaks a certain language belongs to a particular (or just a few) race, or a community whose physical features are somewhat different from those of another. This is one of the features that a cultural community bears. With these features people who speak the same language feels affinities to each other and shares psychological intimacies. Why are travelers willing to follow the guide's advice abroad or in a remote area? They speak the same language and feel intimate to each other. This explains why contacts and communication occur between the guide and visitors promptly on arrival of the destination.
To understand the unfamiliar environment and new cultural phenomena, visitors need the guide's assistance to deepen the contacts and communication. Also, they rely on him to clear up doubts. Only when the guide's language proficiency and competence of cultural communication are adequate enough to meet the traveler's need to learn about and understand the fresh world and have been recognized by the travelers can the contacts and communication be thorough and comprehensive.
The tour guide has to breakthrough the psychological constraints from different cultures. In delivering a speech, his presentation in a foreign language is often affected by his native culture, or vice versa, his interpretation on Chinese culture is occasionally blocked by the foreign culture. If his thinking pattern in mother tongue affects the expression in a foreign language, the normal communication process will be disturbed even broken. Conversely, when the cultural connotation interpretation in the native tongue is confined by the mode of thinking in the foreign language, the presentation about the native culture will lose fidelity. This is the tough nut in cross-cultural communication. Such a challenge indicates the power to overcome cultural barriers is of great importance to a foreign language-speaking tour guide. He must take a perfect command of the foreign language by comparative studies on cross-cultural psychology, which will enable the foreign language competence equally matches the native speakers. This is an ideal state of language proficiency, which is magnificently useful in smooth cross- cultural communication.
2.4 Flexible and constantly improved art of guiding
One of the most important art of guiding is to attract the visitors' attention by offering them the most suitable and timely explanation about what they are thirsty to know. The key is to make full use of the guide's individuality to comprehend visitors' psychological needs. As a mental activity, attention exerts external influences on the traveler. Attention stimulating is a basic skill of guiding service. Only through the emotional and ideological system of the audience can the external influence produce psychological effect. Therefore, the technique to arouse the visitor's attention must suit the visitor's "established emotional and ideological system". In this way cultural propagation is making impacts on the visitor's mind and the visitors are deeply impressed by the splendid Chinese culture.
Mostly, the guide depends on his speech to attract and keep the audience's attention, but the speech must be adaptable to constantly changing situation. Often, the negligence of the visitor’s needs and a fixed package of speeches will make visitors feel dull and boring and cause the guide himself become insensitive to different needs of the visitors. So the value of a speech lies in creation and original ideas. The present theme of a speech needs to be deeply excavated, which is the source of vigor and charm that helps the guide keep the audience keen on a particular topic. Usually, the creation is promptly completed on the spot, a situation the guide can draw on to demonstrate his talents to the guests. With repeated practices he gradually endows himself with a cognitive power to detect and catch the visitor's mentality at the right moment so as to arouse a shared emotional resonance between the speaker and the listeners and attract their attention. Gradually, this personal experience will become the power to offer excellent speeches and commentaries.
Stylistic uniqueness is an important factor of attention attraction which requires the tour guide possess an excellent discerning power. He should be adept in organizing fragmentary source material into consistent literary pieces so that his speeches will sound brief, precise, lucid, lively and coherent to the listeners and be adaptable to specific time, place, audience and situation. Whether the presentation is natural or passionate, plain or poetic, its unique style, distinct theme and rich and colorful content should be able to enlighten the audience's ponderation and imagination and bring them ascetic association. Without the visitor's enthusiasm of beauty appreciation, tourism cross-cultural propagation cannot produce desirable effect.
2.5 Patriotic consciousness and self respect
In conducting the cross-cultural propagation, a foreign language-speaking tour guide is essentially required to be patriotic and passionate with the culture of his home nation. Primarily, the guide's patriotic feeling is represented in his love and dedication to the present job. This spirit encourages him make pains-taking efforts to overcome various difficulties in his work. With such a spirit, he will constantly improve his serving skills and contribute greatly to spreading the Chinese culture in most parts of the world.
The patriotic awareness is also represented in his mental outlook and cultural cultivation. Both Oriental and Occidental peoples take the cultural cultivation level as the dimension to measure a man's personality. What personality does a tour

Vol. 4, No. 11 International Journal of Business and Management
28
guide demonstrates in his work is normally regarded, by foreign guests, as the embodiment of a country's national image and its cultural spirit. So he is often reputed as "the mirror of the motherland".
Actually, the tour guide is propagating the Chinese culture in a linguistic context of interacting with the visitors on political, economic and cultural affairs and he is talking with the world. While introducing the brilliant Chinese culture to foreign friends, the tour guide is obligated to keep the national secret, such as scientific, technological and business information from being released and protect rare animal, plants and cultural relics from being smuggled abroad.
3. The Basic Significance of Tourism Cross-cultural Propagation
Briefing the above, some conclusive perspectives can be drawn out:
3.1 Further exploration on the theory and practice of cross cultural propagation is helpful for training and producing great numbers of foreign language-speaking tour guides with excellent professional qualities and cultural taste. The work in this regard is of great realistic significance to tourist economic growth and the industrial prosperity.
3.2 It will facilitate establishing an effective mechanism to learn, absorb and draw on all of the cultural achievements created by the entire human being, especially those of modern society. Tourism industry, as a bridge of cultural communication, serves well to strengthen the country's contact with other excellent cultures. It will contribute to promoting the splendid Chinese culture in most parts of the world and enables the culture become a common cultural wealth of the whole mankind.
3.3 The exploration will improve the friendship and mutual understanding between different nationalities and promote the peaceful development of most countries of the earth.
References
Liu, Yin. (2008). The Influences of Foreign Language-speaking Tour Guides on Trans-cultural Propagation, Science. Technology and Education, 7.
Wang, Weihua. (2006). Analysis and Consideration on Tourism Cross-cultural Propagation. Journal of Post Graduates
of Huazhong Normal University, 3.
Wu, Xiaoyi & Lin, Derong. (2008). A Summary of the Research Achievements on Tourists' Consumption Behaviour. Tourism Science, 3.

International Journal of Business and Management November, 2009
29
Paths to Innovate Business Models in an Economic Downturn
Fernando Almeida (Corresponding author)
Faculty of Engineering, University of Porto
Rua Dr. Roberto Frias s/n, 4200-465 Porto, Portugal
Tel: 351-22 -508-1400 E-mail: [email protected]
Jose Oliveira
Faculty of Economics, University of Porto and INESC Porto
Rua Dr. Roberto Frias 378, 4200-465 Porto, Portugal
Tel: 351-22-209-4000 E-mail: [email protected]
Jose Cruz
Faculty of Engineering, University of Porto
Rua Dr. Roberto Frias s/n, 4200-465 Porto, Portugal
Tel: 351-22-557-4103 E-mail: [email protected]
Abstract
Innovation is critical in sustaining business competitiveness and in improving productivity. In today’s fast-changing business environment, constant innovation is the key to survival. The long-term viability and prosperity of an organization has a great dependence on its ability to innovate. The current scenario of economic downturn can be seen as the right moment to implement an innovation strategy and to reformulate the business strategy of a company. This article presents nine ways to change the actual business models of companies in order to attend new business opportunities and to increase their flexibility to market changes. The role of innovation in the business model framework is explored, revealing that the business model component will be a greater source of competitive advantage compared to products and services. Additionally, the role of technology on these changes is analyzed, and the increased importance of information technology in the enterprise’s organization is explored.
Keywords: Innovation, Business model, Competitiveness, Technology
1. Crisis: an opportunity to innovate
The idea of innovation, both in methods of procedure and in product design, has been one of the key drivers of new businesses and, therefore, the key for profit growth. Innovation can be seen as the process of introducing and exploiting a new idea, or the process of developing and exploiting new products and services on the market. Innovations may be technical, institutional, or cognitive, and may induce changes ranging from incremental to radical (Freeman, 1988).
Innovation during an economic downturn might seem counter intuitive at first sight. However, it is precisely the right moment to implement an innovation strategy. The establishment of a business model innovation is difficult to achieve because it affects so many parts of an organization and also because it needs the support of so many different people. In addition, it requires the right organizational structures and a sense of urgency to make it happen. All of these conditions are, unfortunately, easier to achieve during an economic crisis scenario. According to Osterwalder, in an economic crisis, complacency is gone and everybody feels a sense of urgency to act. He defends that people resist to change much less when the survival of their company and ultimately their jobs are at stake (Osterwalder, 2009).
Not all companies are being affected equally by economic crisis, but regardless of that, all organizations are facing a wealth of challenges and unpredictability as a result of the dynamic market environment that lies ahead 2009. Many organizations struggle to control costs, increase revenue, and maintain their competitive status following mainly a strategy to cut their future investments and operational costs. During down economic times, the focus may change from growth and innovation to downsizing and efficiency. However, this “cut blindly” strategy, without an eye on the future, blinds many organizations to the opportunities that do exist to selectively expand and enhance their ability to meet future challenges.

Vol. 4, No. 11 International Journal of Business and Management
30
Innovation and efficiency are not mutually exclusive. Innovation leads to new ways of thinking which, in turn, can lead to controlling costs by creating more efficient ways to develop products, fostering creative ways to collaborate with outside resources, or improving business processes in ways that reduce spending while also improving performance and outcomes. The secret is in knowing what to focus on, making the right decisions with the right information, and continuing looking forward (Mooney, 2009).
2. The role of innovation in a business model
2.1 The business model concept
There are a lot of authors that give a definition of a business model and propose a brief list of components that should be included to describe it. There are many scholars naming components to the business model, but Osterwalder and Pigneur (2005) version is one of the most complete and comprehensive work. First of all, they build their main blocks out from well accepted strategy literature, such as Hagel and Singer (1999) and Markides (1999), and second, they have gone through all other scholars lists of components to reveal the total amount of nine components (Hager, 2006). Besides, whatever method is considered to identify components in the business model, there seems to be a fair similarity between the results. Often components vary in its degree of abstraction leading to different numbers of components, but they basically describe the same. A comparison of the components of Osterwalder and Pigneur (2005) and two of the most cited and distinguished research groups on business models, Afuah and Tucci (2000) and Chesbrough and Rosenbloom (2002) is illustrated in Table 1.
Based in Table 1, we can confirm that there are many similarities. There are differences in how the components are named, such as Customer Value and Value Proposition or Target Customer and Scope. The Customer Relationship and Distribution Channels are components included only by Osterwalder and Pigneur. Another component that differs is the Chesbrough and Rosenbloom component called Competitive Strategy, the same component that Afuah and Tucci calls Sustainability. This component can however be defined as a summary of the competitive advantages hidden in the rest of components.
In fact, all conceptualizations of a business model try to formalize informal descriptions into building blocks and describe their relationships. While many conceptualizations exist, Ostwerwalder proposed a synthetization of different conceptualizations into a single reference model based on similarities of a large range of models, which constitutes a business model design template that allows enterprises to describe their business models.
2.2 The evaluation process
Clearly, as identified before by Osterwalder, Afuah and Chesbrough, the identification of the “who”, “what” and “how” forms the core elements of a business model. After we have described the business model in detail, we have elements to start assessing it.
One common tool used to evaluate a business model is the SWOT methodology. SWOT analysis entails portraying a business’ internal context in terms of strengths and weaknesses and scouring its external context for opportunities and threats.
SWOT analysis has been a framework of choice among many managers for a long time because of its simplicity and concise depictions of the strategic landscape. Yet, despite its popularity and longevity, the SWOT approach for situation assessment is, sometimes, ineffective. Firstly, due to its simplicity, some managers have the tendency to use it without a great deal of thought, conducing to useless results. Secondly, typical SWOT guidelines promote superficial scanning and improper categorizing. They leave the false impression that noteworthy particulars can be spotted at a glance and their likely impact (favorable or unfavorable, major or minor) is obvious and independent of context (Valentin, 2005). Finally, SWOT analysis does not cope very well with some of the subtler aspects of modern strategic theory, such as trade-offs (De Witt and Meyer, 1998).
To address these problems, the SWOT analysis can be complemented with a Defensive/Offensive Evaluation (DOE) analysis. Like SWOT analysis, DOE requires delving into a business’ internal and external contexts. However, DOE is much more focused and theory-driven than SWOT analysis (Valentin, 2005). It is grounded in the premise that a business venture’s ultimate purpose is creating shareholder value, which requires generating profits by creating customer value and controlling costs. The defensive evaluation involves probing an extant venture’s vulnerability and looking for ways of strengthening the business. On the other side, the offensive evaluation applies to startups and extensions of existing businesses. Offensive evaluation of an apparent pioneering opportunity entails subjecting a contemplated pioneering venture to vulnerability probing as if it has been launched. If pioneered turf cannot be defended or affords insufficient profit potential, then the venture’s attractiveness is in doubt. Offensive evaluation of an apparent poaching opportunity entails subjecting rivals whose turf is coveted to vulnerability probing with the intent of discovering their disadvantages and exploitable weaknesses.

International Journal of Business and Management November, 2009
31
2.3 The innovation role
After being assessed and described, the challenge of a business model remains in its renewal. The most important steps towards business model improvement and innovation are already made once a clear picture of the current business model has been drawn. Besides that, innovation scenarios and improvement proposals can be built on the conclusions of the previous considered business model evaluation. Therefore, a business model innovation can be seen as a strategic initiative to configure or reconfigure various elements of the nine components of the business model ontology presented by Osterwalder to enhance value creation potential of the firm and sustain it over a longer time.
One of the crucial factors for market success of a new product is referring to the level of innovation that the product incorporates. Typically, the product or service innovation involves the introduction of a new good or service that differs from others in terms of functional characteristics, such as technical abilities, easiness of use, durability or reliability. However, besides product innovation, other three dimensions of innovation must be considered when a new product is going to be developed. These other three dimensions of innovation include the production process innovation, the marketing innovation and the organizational innovation. Brad proposes a conceptual model of comprehensive innovation that integrates the four dimensions of innovation: product innovation, marketing innovation, production process innovation and business model innovation, within an aggregated model called “comprehensive innovation”, depicted on Figure 1.
In this model, dynamics of each type of innovation, as well as the coupled effects of these dynamics, should be considered in the equation of commercial success. Thus, life-cycle model of the aggregated innovation should also be taken into account when developing new products, especially for those in the category of high technology.
Any successful business model innovation requires three important ingredients: recognizing the need to migrate the business model to the next cycle as value shrinkage occurs, exploiting new value creation opportunities for crafting the next business model and sustaining the innovation sufficiently long to appropriate value ahead of the competition through careful choices of the business model components (Mahadevan, 2004). The process is repetitive as diffusion of innovation happens over time.
3. Innovation challenges
3.1 Changing the business model
Currently, business models are under constant pressure to change. Innovations in technology, changes in the laws, competitive moves, or shifts in consumer tastes can sap an operating model’s profitability. The Economist Intelligence Unit, a worldwide research and advisory company, conducted in 2005 a survey to estimate what would be the greater source of competitive advantage during the next five years. In that survey, 55% of executives said new business models will be a greater source of competitive advantage than new products and services. In the public sector survey, 54% of respondents said success in 2010 will hinge more on the ability to innovate with delivery channels than with services themselves. There are sectoral variations: new business models will be keenly important for financial services, while the majority of manufacturing firms will seek advantage through new products and services (EIU, 2005). Despite these differences in some activity sectors, we can consider that the overall message is clear: the way that companies do business will often be as or more important than what they really do.
The rising importance of business models is a logical reaction to too many choices in the market. For consumers and companies alike, it’s getting harder to distinguish between many products and services in a purely functional basis. The task will get tougher still as local companies in emerging markets get smarter, faster and more aggressive. In the future, companies in many sectors will distinguish themselves by innovative business models, such as their new pricing models, a shift to selling products as services or another model that will differentiate their offering from those of global competitors.
There is no evidence that one type of change or another inherently improves profit. However, we can easily see a difference between firms that appear to change frantically and without direction and those who are on a charted course of change. It’s precisely in this point where innovation models come in, attending that the innovation model is the core logic for how a firm will change over time to remain profitable in a dynamic environment
3.2 Guidelines for change
In response to the environment changes, some firms are totally reformulating their business models in a wide variety of ways. Some of the most predominant and emerging ways are presented below.
3.2.1 Increase adaptability
Firms can establish a single generic capability that lets them easily plug in new models and retire old ones. It operates like a personal computer’s bus architecture, allowing any of a range of components to be added, even those that were not initially foreseen (Linder and Cantrell, 2000). Some examples of companies that already implemented this strategy are Nike and GAP. Nike has a plug and play architecture that enables it to effortlessly add new product and service lines;

Vol. 4, No. 11 International Journal of Business and Management
32
GAP uses the same approach, but its platform involves retail store management, format innovation, mall real estate management, and merchandising expertise (Linder and Cantrell, 2000).
3.2.2 Establish partnerships
Rather than inventing and investing in developing all the parts of a working model, firms can establish alliances and partnerships with other companies. This approach isn’t new, but the current number of well succeeded established partnerships deserves to be mentioned and has conducted firms to very successful worldwide strategies. The idea is not let the company do it all on its own, but define a business model in which partners help with innovation and growth. The intention is to create an environment that is more like an open-source model. This doesn’t mean that innovation in business models can’t still be proprietary, but it should involve creating a community of interest in which companies support each other’s businesses.
Partners aren’t just organizational units that can be seen isolatedly. The partners’ organizations also bring business model components to the business model of a firm. The business model of a firm should incorporate their unique timing and pace, their cost structure, the way they collaborate, their hiring practices, and the flexibility to shift gears.
3.2.3 Create spin-offs or joint-ventures
Firms can reach out to new business domains by building a new model around the seed of an existing product, set of customer relationships, acquisition or special capability. They can establish a separate unit, either by carving it out or by acquiring it, and give it the latitude to chart an independent course. Two popular ways to implement this concept are through a spin-off or a joint venture.
The spin-off involves the creation of an independent company through the sale or distribution of new shares of an existing division of a parent company. Newly independent companies are no longer constrained by the overall strategic direction of their former parent, which gives them forces to develop their own roadmap for success. Spin-offs often result in a higher aggregate value for the constituent pieces (Buenstorf, 2007). The joint venture involves two or more businesses pooling their resources and expertise to achieve a particular goal. The risks and rewards of the enterprise are also shared. A joint venture can typically bring more resources to the participated companies, increase their capacity, technical expertise and access to established markets and distributions channels.
As an example of this implemented approach, Critical Software launched in early of 2006, a new spin-off company called Critical Links. This new company has successfully become a global player with edgeBOX solution, a converged multi-function device that consolidates data, voice and IT services for small and medium sized businesses. The edgeBOX is distributed through channel partners (Value-added resellers, system integrators and service providers) worldwide in countries such as UK, USA, Spain, Portugal, South Africa, China and India (CLK, 2009).
3.2.4 Establish a convergence
Firms with multiple business units operating with different models can merge these to drive mindset change. This step goes beyond the initial concept of cooperation between the units of a company that intends to break down the divisional form of its formal organization. The intention is to force business units to consolidate products and services and reframe the value they offer to customers. For example, DuPont brought together three independent divisions to form a market-focused textile group. The three previous units called on many of the same customers, but each had been measured on the profits it generated from its own proprietary textile fiber, such as Lycra, Dacron or Nylon. The new organization can more easily offer customers options that combine all three types of products. In addition, the combination takes better advantage of DuPont’s global brand franchise, its operational scale, and its market knowledge (Linder and Cantrell, 2000).
3.2.5 Shift from products to services, services to solutions and experiences
Firms can avoid commoditization by shifting from selling products to offering customer-management services or total solutions. Boeing and Pratt & Whitney are two examples. Their products must continue to perform at competitive standards, but the firms now make their money on the services they wrap around their products. Boeing even attracts airline customers with a total solution that implements the concept “do whatever it takes to keep planes in the air” (Carson, 2005).
Nowadays, the next competitive battle-ground lies in staging experiences. Instead of an amorphous construct, an experience is so real as an offering, as any service, product or commodity (Silveman, 2004). In today’s service economy, many companies simply wrap experiences around their traditional offerings to sell them better. An example is the iPod created by Apple. In reality, what customers buy is not just a product, but a total experience. In fact, what turns exceptional the experience in iPod is its holistic marketing, its total experience perspective that becomes part of the customer’s lifestyle and its great service after purchase (Kingdom, 2005).

International Journal of Business and Management November, 2009
33
3.2.6 Expand geographically
One of the fastest ways to accelerate profitable growth is by expanding into new geographies. It allows companies to introduce their most successful product lines in other countries after they have fully developed their home markets. Developing countries often are the typical geography of choice because of their relatively high population growth and un-addressed market needs, although local business practices in these countries are typically less well understood. Geographic expansion comes with both significant rewards and certain risks. Corporate executives find they need to navigate unfamiliar territory, establish business partnerships that have the right connections, and tailor their product lines to the country’s culture and market dynamics. A successful expansion requires in-depth knowledge and know-how in several key areas: the regulatory environment, political climate, business opportunities, potential risks, prospective customer base, among others. Besides that, speed to market is also critical, so companies need to select channel partners and establish distribution networks that will give them access to the right markets.
SAP is one of the biggest software companies in the word that is expanding its presence in the world’s emerging markets, especially in Eastern Europe, Africa and Asia. They follow this strategy to be less dependent of matured technologic markets, such as North America and Central Europe, and to face the new opportunities provided by high-grow markets in Asia and Africa. SAP has more than 3000 software installations and more than 2000 local customers in Greater China, including such prominent businesses as Lenovo, China Telecom and Shangai Power. To support those customers, SAP decided to open a new SAP Global Support Center (GSC) in Dalian, China. Staffed with native speakers in a number of languages, GSC China has becoming the primary hub for delivering services and support to SAP customers in Asia-Pacific countries (IBT, 2008).
3.2.7 Redefine channel concept
Firms can redefine their channel concept, creating or deleting intermediate channels. We can see that the establishment of new sales or service channels on the Internet is quite common today. Many of the biggest worldwide banks already have online banking, which attracts customers by making their products widely available.
Another emergent concept is the introduction of a multi-channel service. The idea is that different channels will be used to provide high quality and cost-effective services for customers. Different channels can be used for distinct niches and each channel is physically separated. However, it should always be possible to develop synergies between the channels. For example, the Salford City Council’s services are designed to be multi-channel with different channels serving different market niches, where a key concern is to decide upon the appropriateness of each channel for an identified niche (CO, 2009).
3.2.8 Change price mechanisms
Pricing is one of the four major elements of the marketing mix and also an important strategic issue because it is related with product positioning. Furthermore, pricing affects other marketing mix elements, such as product features, channel decision, and promotion. The most typical pricing methods consists in setting the price at the production cost plus a certain profit margin, setting the price to achieve a target return-on-investment or base the price on the effective value to the customer relative to alternative products.
Independently of the previous considered price method, the firm may seek price stabilization in order to avoid price wars and maintain a moderate but stable level of profit (Benveniste, 1996). In addition to setting the price level, managers should be able to design innovative pricing models that better meet the needs of both: the firm and its customers. For example, software traditionally was purchased as a product in which customers made a one-time payment and then owned a perpetual license to the software. Many software suppliers have changed their pricing to a subscription model in which the customer subscribes for a set period of time, such as one year. Afterwards, the subscription must be renewed or the software no longer will work (Kelly, 2007). This model offers stability to both the supplier and the customer since it reduces the large swings in software investment cycles.
3.2.9 Expand research network
In the search of innovative products and services, companies can expand their research network to include collaborative contributions from customers and partners. At the present time, with technology, any product can be made in a collaborative way on a global basis. In fact, a large amount of top executives expect that one of their company’s critical business priorities for the next years will be involving customers in upstream activities, such as product design (Kostecki, 2006).
The present challenge is to bring government agencies and industry to a collaboration pool with the intention to stimulate new research directions, partnerships and training opportunities. As an example, Eli Lily has established a “research without walls” strategy of partnering with bio-tech companies, academic institutions and others to strengthen their innovation pipeline. In this case, relying solely on internal R&D would likely have been more expensive and slower (Giesen, 2009).

Vol. 4, No. 11 International Journal of Business and Management
34
4. The role of technology
4.1 Major drivers
All organizations must always consider the fundamental question of why they exist. And once the why (purpose) is answered; a corporate strategy can be formulated that enables an organization to set the direction in which it will go. Where an organization is made up of many businesses operating in different markets, corporate level strategy is also concerned with how resources are to be allocated across the business units.
Another question at the forefront of corporate strategy is how an organization adds value across the businesses that make up the organization. This is the role of corporate parenting. A corporate parent refers to all those levels of management that are not part of customer-facing and profit-run businesses within the multi-business organization. Corporate parent has no external customers and as such it cannot generate any direct revenues. Given that it incurs corporate overhead costs, the corporate parent must demonstrate that these costs are offset by the tangible benefits it provides to the business units in the portfolio (Henry, 2007).
One of the key elements of a corporate parent strategy is the technology. In fact, technology has dramatically changed the way businesses operate in the last few decades. The Internet, in particular, has changed many business rules and reduced the entry barriers for many industries. In this new technologic world, the customers are kings in an almost transparent market place. At the same time, the birth of Web 2.0 has made communication and collaboration in the Internet an instant reality for all people around the world.
Information Technology (IT) will increasingly play a starring role and will determine deeply how a company innovates, interacts with customers, shapes its business models or governs itself. Senior managers of companies will also come to see IT in a different light. In the past, companies have tended to view IT primarily as a driver of cost-efficiency. However, nowadays companies’ top executives look to IT as a key strategic role to boost the company’s competitive advantage (EIU, 2005). IT will have a crucial role in achieving two overriding objectives: improving the firm’s knowledge of customers and their ability to predict customer behavior and, using networks, help bring collaboration with customers to a new level.
There is already ample evidence that the creative use of infrastructure has helped leading companies to make themselves more efficient, redefine their business models, and improve the customer experience. As an example, insurance companies in Britain and the United States use GPS devices and sensors to record the speed of cars and even their damage in case of accidents. In manufacturing, Radio Frequency Identification (RFID) tags now provide insights into the way goods move through supply chains and thus reduce inventory levels (Hughes and Kaplan, 2009). In both cases, infrastructure supports and manages the sensors and other devices needed to capture information reliably and inexpensively.
Essentially, IT will have the following broad roles in the innovation of the services provided by companies:
• Provide, change and improve the service delivery platform – presently many services are underpinned by a technological platform. The Internet has given rise to a new generation of web-based services with business models very different from the traditional industries. Google is a classic example of a new business model enabled by Internet. In fact, the Google’s business model of Internet-search-driven advertising has become so dominant that incumbent competitors, such as Microsoft and Yahoo, can hardly compete (Mitchell, 2008);
• Facilitating communication and knowledge exchange – information sharing is crucial to the success of any business in a fast changing marketplace. Indeed, mass collaboration, both inside and/or outside an organization, is rapidly becoming a source of innovation for many companies. Grid technologies allow shared diagnosis and analysis of data by teams working in different locations. Rolls Royce, for instance, uses grid technologies extensively to tap on the expertise of a number of university research centers around the world (Innofoco, 2008);
• Adding value to a product – commoditization is eroding the profit margin of many manufacturing companies. To create more value for their offering, more and more product companies are investing in and capturing more value through their service offerings. At the same time, today’s customers are spoiled by choice. They want to be in charge of the right place to shape and influence the product or service offering. Technology has enabled the development of mass-customization and co-creation with its customers as the tool to combat commoditization and create more value for the customers and the product. Dell gets the advantages of mass production but also has a high product variety, which let each user to individually configure his/her computer. This is only possible due to its information technology that tightly control activities and achieve a high degree of coordination with suppliers (Klinker, 2006);
• Developing customer relationship – technology enables businesses to segment their customers as individuals through sophisticated customer relationship management (CRM) systems. The loyalty programs widely used by credit cards, airlines and retail businesses are classic examples. For example, Tesco, the UK supermarket chain, runs one of the most successful loyalty programmes. Its Clubcard serves two purposes: first, it is a vehicle for rewarding Tesco shoppers and

International Journal of Business and Management November, 2009
35
encouraging them to increase their purchases; second, it is a rich source of data on the shopping habits and preferences of cardholders that enable the company to manage its supply chain, market its products and develop new offerings (Innofoco, 2008).
4.2 Implications for management
Until recently, the fundamental role of the Chief Information Officer (CIO) in a company was to manage the technology infrastructure for the enterprise, lowering costs and improving productivity along the way. New technologies were acquired as needed to support business activities. But as enterprise IT technology has matured, the CIO’s responsibilities also changed, letting today’s CIOs focused on transforming business outcomes. Chief Executive Officer (CEO) and other business leaders have learned the enormous impact that IT can have on an organization’s strategic decisions and its ability to prosper. As such, many are looking to their IT organizations to fuel innovation efforts and to their CIOs to lead the change. Today’s CIO is expected to provide the technology insight to develop corporate strategy, drive innovation and stimulate growth.
In the Global CEO Study conducted by IBM, the majority of CEOs interviewed recognize that innovative ideas cannot be put into play without technology (IBM, 2006). Technology not only enables innovations that benefit the business, but it also enables the business to spot emerging trends that competitors miss. It is also enabling companies to create new distribution channels, integrating customers and partners into larger business ecosystems and uncovering hidden profits.
Nowadays, the CIO is a critical player in a company’s business model innovation efforts, becoming an active part of the company’s strategy and vision. Toward that end, there are key steps the CIO can take to enable and drive business model innovation within the organization. Firstly, IT automation cannot take place without business understanding. IT managers should systematically break down the business into its component processes and focus on the business value of those individual processes to understand the needs and objectives of the business at a desired depth level. Secondly, IT needs to be viewed as a strategic partner to the rest of the business, and that requires rethinking IT’s current business model and managing IT like a business. Finally, IT managers should implement a flexible and responsive infrastructure. By simplifying the infrastructure through technology consolidation and the implementation of open architectures, CIOs can make the infrastructure easier and less costly to manage, but they can also enable innovation. An efficient infrastructure is more adaptable to change, and so, better able to accommodate changes required by innovation. Moreover, the savings realized from lower operations and maintenance costs can be used to fund innovation that truly matters to the business, such as the development of IT-enabled business services.
5. Final thoughts
Innovative practices enable organizations to reorganize themselves, to adapt, to discover new value opportunities and to relate better to other players. The actual financial crisis can, at a first glance, be seen as a bad moment to make investments in an innovation policy, attending to the lack of financial resources available. However, the firm should have a distinct positioning in the market to survive to the strong competition, and innovation is the only way to meet this challenge. The firm should always consider new ways to develop products, to collaborate with its partners and to improve its business models in order to increase its overall performance.
At the present time, fundamental business models changes will be needed in the majority of organizations, attending to the intensified competition, globalization and escalating customer expectations. The way that companies make business will be an increased differentiator because such innovation does not invite imitation or commoditization while product and service innovations do. Some guidelines for the change of business models may include the increase of adaptability to attend the customer needs, the establishment of partnerships with other companies and universities/R&D centers, the extension of their business proposition, the geographically expansion to new emergent markets and redefinition of their supply and customer channel concept.
In all circumstances, the technology will have an important role in the innovation process. Firstly, the business model innovation is often dependent upon information technology, where a flexible and agile infrastructure is key to a dynamic business model. Secondly, CIOs and the IT organization are an integral part of the enterprise business models. Therefore, any changes to the enterprise business model encompass the IT organization as well. Successful CIOs must be able to respond quickly to the needs of the business by providing the technology foundation necessary to drive rapid delivery of products and services. They must act as visionaries, totally committed with the business strategy and critical domain experts to provide the solutions and business processes necessary in a 24/7 world.
References
Afuah, A., & Tucci, L. (2000). Internet business models and strategies: text and cases. McGraw-Hill Irwin.
Benveniste, L., Busaba, W., & Wilhelm, J. (1996). Price stabilization as a bonding mechanism in new equity issues. Journal of Financial Economics, 42(2), 223-255.
Brad, S. (2007). Comprehensive innovation and its implications on new high-tech product development. Informatica

Vol. 4, No. 11 International Journal of Business and Management
36
Economica, 42(2), 18-25.
Buenstorf, G. (2007). Opportunity spin-offs and necessity spin-offs. Max Planck Institute of Economics Press.
Carson, S. (2005). The commercial aviation business environment and Boeing market strategy. Proceedings of ISTAT 22nd Annual Conference, Scottsdate, USA, 188-196.
Chesbrough, H., & Rosenbloom, R. (2002). The role of the business model in capturing value from innovation: evidence from Xerox corporation’s technology spin-off companies. Industrial and Corporate Change, 11(3), 529-555.
CLK (2009). Critical Links launches edgeBOX dedicated network appliances. [Online] Available: http://www.edgebox.net/opencms/opencms/xmlcontent/inthenews/07/inthenews_0019.html(March 7, 2009).
CO. (2009). Multi-channel analysis and design module. [Online] Available: http://www.sprint.gov.uk/index.php?option=com_content&view=article&id=58&Itemid=66 (March 17, 2009).
De Witt, B., & Meyer, R. (1998). Strategy: process, content and context (2nd ed.). Oxford: International Thomson Business Press.
EIU (2005). Business 2010: embracing the challenge of change. Economist Intelligence Unit Press.
Freeman, C., & Perez, C. (1988). Structural crises of adjustment, business cycles and investment behaviour. In G. Dosi, C. Freeman & L. Soete (Eds.), Technical change and economic theory (pp. 38-66), London, Frances Pinter.
Giesen, E. et al. (2009). Paths to success: three ways to innovate your business model. IBM Institute for Business Press.
Hagel, J., & Singer, M. (1999). Unbundling the corporation. Harvard Business Review, March-April edition, 45-54.
Hager, C. (2006). Determining degree of innovation in business models by applying product innovation theory. MSc in Innovation and Entrepreneurship, University of Oslo.
Henry, A. (2007). Understanding strategic management. OUP Oxford.
Hughes, J. & Kaplan, J. (2009). Where IT infrastructure and business strategy meet. Business Technology Office of McKinsey & Company.
IBM. (2006). Business model innovation – the new route to competitive advantage. IBM Global Services Press.
IBT. (2008). Expansion of ecosystems drives global SAP Business by design (TM) Solution Momentum. [Online] Available: http://www.gus-group.com/cms/pdf/080304_ibb_expansion.pdf(March 17, 2009).
InnoFoco. (2008). Role of technology in service innovation. [Online] Available: http://www.innofoco.com/InnoRTV4.pdf(March 23, 2009).
Kelly, T. (2007). Managing software licenses – a buy-side perspective. Proceedings of SIFMA 2007, New York, USA, 88-96.
Kingdon, M. (2005). Sell experiences not products. [Online] Available: http://www.clickz.com/3489736(March 16, 2009).
Klinker, S., Terrell, R., & Mahfouz, A. (2006). Dell’s use of CRM-SCM integration strategy to dominate the PC market. Communications of the IIMA, 6(3), 87-90.
Kostecki, P. et al. (2006). Expanding the capacity for research and innovation. University of Massachusetts Amherst.
Linder, J., & Cantrell, S. (2000). Carved in water: changing business models fluidly. Accenture Institute for Strategic Change.
Mahadevan, B. (2004). A framework for business model innovation. Proceedings of IMRC 2004 Conference, Bangalore, India, 125-131.
Markides, C. (1999). A dynamic view of strategy. Sloan Management Review, 40(3), 55-63.
Mitchell, R. (2008). Search Mission. [Online] Available: http://www.portfolio.com/executives/features/2008/03/14/Google-CEO-Eric-Schmidt-Interview(March 27, 2009).
Mooney, L. (2009). Beyond survival – thriving on innovation in a down economy. BP Trends, March edition, 13-18.
Osterwalder, A., Pigneur Y., & Tucci, C. (2005). Clarifying business models: origins, present and future of the concept. Communications of the Association for Information Systems, 15(1), 751-775.
Osterwalder, A. (2009). Financial crisis – an opportunity for business model innovation. [Online] Available: http://blog.futurelab.net/2009/01/financial_crisis_an_opportunit.html(April 11, 2009).
Silveman, C. (2004). Undercover marketing: selling an experience. The New Canadian Magazine, winter 2004/2005 edition, 35-37.
Valentin, E. (2005). Away with SWOT analysis: use defensive/offensive evaluation instead. Journal of Applied Business Research, 21(2), 91-104.

International Journal of Business and Management November, 2009
37
Table 1. Comparing components of business models (Hager, 2006)
Chesbrough and Rosenbloom Afuah and Tucci Osterwalder and Pigneur
Value Proposition
Market Segmentation
Revenue Mechanism(s)
Value Chain
Cost Structure
Value Network
Competitive Strategy
Customer Value
Scope
Revenue Source
Implementation
Pricing
Connected activities
Sustainability
Capabilities
Customer Segments
Value Proposition
Communication Channels
Distribution Channels
Customer Relationships
Key Resources
Key Activities
Revenue Streams and Cost Structure
Partner Network
The table presents and compares the components of the most relevant business models referred in the literature.
Figure 1. Conceptual model of comprehensive innovation (Brad, 2007)
The figure presents the conceptual model of comprehensive innovation proposed by Brad. This model integrates the four dimensions of innovation: product innovation, marketing innovation, production innovation and business model innovation.

Vol. 4, No. 11 International Journal of Business and Management
38
Research on an Optimization Model for Logistics Nodes
System Layout and Its Solution Algorithm
Dezhi Zhang1,2 & Shuangyan Li 1
1. School of Transportation Engineering, Central South University, Changsha 410075, China
2. Wasion Group Limited, Changsha 410205, China
E-mail: [email protected], [email protected]
Abstract
Based on the logistics nodes system consisting of first-degree logistics node (logistics park) secondary logistics nodes (including logistics center and distribution center), a dynamic logistics nodes location model of multi-period , multi-type cargo flow and multiple logistics nodes is given. The optimization model considers the factors including fixed cost for logistics opening, handling cost and economic of scale of different type logistics nodes. An effective algorithm based on the improved minimum cost-maximal flow algorithm and genetic algorithm is presented according to the characteristic of optimization problem. Finally, a numerical example is provided to validate the proposed model and solution algorithm. The findings indicate that the model proposed in this paper is a useful tool for the investigation of the Multi-period and Multiple Logistics Node Dynamic Location Problem.
Keywords: Logistics nodes, System layout, Optimization model, Heuristic rules, Hybrid genetic algorithm
1. Introduction
The logistics network design of a city is very important to reduce the social distribution costs and improve the efficiency of distribution. The literature on the city logistics network design problem is extensive with a wide variety of solution methods. Ballou (1968) was the first to address the dynamic location problem and suggested a heuristic algorithm for its solution. Geoffrion and Graves (1974) provided a solution procedure based on Bender's decomposition and applied it to a real situation for a major food company. Denis (1976) investigated the multi-commodity and multi-period e facility location problem, and gave the heuristics algorithm based on dynamic programming. Alexander (1991) studied the multi-period and multi-stages location problem, and solves the model by the Lagrangian heuristics combined with dynamic programming. John (1997) proposed a dynamic location model with uncertain quantity facilities by applying the heuristics based on decision criteria: the minimization of expected opportunity loss and the minimization of maximum regret. Nozick (2001) presents a combined location model considering facility costs, inventory costs, transportation costs, and customer’s responsiveness. A comprehensive review on the facility location model can be found in Andreas Klose et al. (2005).
In this paper, we present an optimization model to solve the capacitated, multi-commodity, multi-period, multi-class logistics node location problem. And an effective algorithm is given which is based on hybrid algorithm and heuristic rules.
The rest of this paper is organized as follows. In Section 2 we present an optimal mathematical model of the capacitated, multi-stage, multi-commodity dynamic logistics nodes location problem. Section 3 provides the development of the algorithm for solving this problem. The fourth section presents an illustrated application, while the last section presents conclusions and suggestions for further research.
2. Model formulation
In this paper, we consider a city long-term logistics nodes system planning according to its logistics need changes in the future 2 years. The logistics nodes systems planning consists of three stages, taking from 1 to 5 as stage 1, from 5 to 10 as stage 2, and from 10 to 20 as stage 3. The logistics nodes are made up of the first class logistics nodes and the second class logistics nodes. The first class logistics nodes have the logistics hub function, such as Logistics Park. While the second class logistics nodes have the distribution function, such as Logistics Center and Distribution Centers. We denote the first class logistics nodes as LN (I), the second logistics nodes as LN (II). The planning aim is to enhance distribution efficiency and cut down the society logistics cost by optimizing the layout logistics nodes step by step.
The assumptions to the model are as follows.

International Journal of Business and Management November, 2009
39
(1) There are n1 candidate locations of LN(I), n2 candidate locations of LN(II) and m customer demand spots, where LN(I), LN(II) represents the first class logistics nodes.
(2) The candidate logistics nodes are satisfied on traffic conditions and others necessary location conditions.
(3) The design parameters and relative construction cost of each potential logistics nodes are known in advance.
(4) The transportation costs among LN (I) nodes, LN (II) nodes and customers are given.
(5) The demand of customer zones is obtained in advance.
Inputs and Sets
I : set of the candidate locations of first class logistics nodes, indexed by i
J: set of the candidate locations of second class logistics nodes, indexed by j
N: set of customer locations, indexed by n
M: set of the commodities, indexed by m
T : set of the planning time, indexed by t
)(tFk : the fixed cost of operating logistics nodes k in time t; JIk
)(tC m
ij: the unit shipment cost of commodity m from LN(I) i to LN(II) j in period t
)(tC m
jn: the unit shipment cost of commodity m from LN(II) j to customer n in period t
)(tCe
k : the expanding cost of logistics nodes k in time t; JIk
)(1 tU i: the initialization design capacity of LN(I) i for commodity m in time t, Ii
)(2 tU j: the initialization design capacity of LN(II) j in time t, Jj
)(max tU i : the maximal capacity of LN(I) i by expanding in time t, Ii
)(max tU j: the maximal capacity of LN(II) j by expanding in time t, Jj
)(tD m
n: the demand of customer n for commodity m in time t,
)(1 ti , )(2 tj : the unit cost of process of LN(I) i and LN(II) j in time t respectively.
)(1 ti , )(2 tj :the relative agglomeration factors in LN(I) i and LN(II) j in time t respectively.
(generally speaking, 1)()(0 1 tt t
ji , and the less the value of agglomeration factors, the more the benefit of
scale economy )
)(1 tRi , )(2 tR j : the total shipment of LN(I) i and LN(II) j in time t respectively, Ii , Jj
t
ia , t
jb : the expanding cost of LN(I) i and LN(II) j in time t respectively, Ii , Jj
)(tAk : the equal instalment system
00 0)(1)1(
)1()( 0
0
kkkN
N
kk nttAntr
rrFtA
k
k where, 0kn : the investment recovery period
of logistics node k; r : the capital discount rate;
t
kS : the salvage value of the closed logistics nodes k in time t tN
k
t
k
k
rAS1
)1(
)( fDec : sign function, if f>0, Dec(f)=1, otherwise Dec(f)=0;

Vol. 4, No. 11 International Journal of Business and Management
40
Decision variables:
)(tX m
ij: the quantity of commodity m shipped from LN(I) i to LN(II) j in time t
)(tX m
jn: the quantity of commodity m shipped from LN(II) j to customer n in time t, )(tYk
:the indicator variable for logistics node k building status (0=closed, 1=open)
)(tEk : the indicator variable for logistics node k expanding status (0=closed, 1=open)
The capacitated, multi-stage, multi-commodity, dynamic logistics nodes location problem (CMDLNLP) can be formulated as follows:
})1(*)],,(),,(),,({[),,( )1(t
Tt
rtYXACtYXOCtYXTCEYXNPVMin (1)
where
))()(()((),(Jj Nn
m
jn
m
jn
Mm Ii Jj
m
ij
m
ij tXtCtXCYXTC
)()()()()())((),( 0)(22)(1121
k
Tt JIk
kk
Jj
t
jj
t
Ii
ii ntDectYtAtRttRYXOC ji
)()(),( tKbtKaKYAC j
Jj
t
j
Ii
i
t
i))()1((( tYtYS k
JIk
k
t
k
subject to
TtIitUtX i
Jj
m
ij
Mm
,)()( max (2)
TtJjtUtXMm Nn
j
m
jn ,)()( max (3)
TtMmJjtXtXIi Nn
m
jn
m
ij ,,)()( (4)
TtMmNntDtX m
n
Jj
m
jn ,,)()( (5)
TtIitRtXJj
i
m
ij
Mm
,)()( 1 (6)
TtJjtRtXMm Nn
j
m
jn ,)()( 2 (7)
TtIitUtRDectE iii ,))(1)(()( 1 (8)
TtJjtUtRDectE jjj ,))(2)(()( 2 (9)
TtMmJjIitX m
ij ,,,0)( (10)
TtMmNnIitX m
in ,,,0)( (11)
TtMmNnJjtX m
jn ,,,0)( (12)
TtJIktYk ,}1,0{)( (13)
In the above formulation, the objective function involves three types of costs: transport costs, handle and fixed costs, and the transitional costs related to the dynamic nature of the problem. It aims to minimize the sum of the costs including: the costs of transport commodity from LN (I) to LN (II) and from LN (II) to customer; the fixed cost associated with locating and operating logistics nodes; the transitional costs of logistics nodes due to expanding and closing.
Constraint set (2) stipulates that all shipments from LN (I) to LN (II) must not exceed its capacity. The capacity restriction of LN (II) is ensured by constraint set (3). Constraint set (4) indicates a conservation of flow at each logistics node, while (5) requires that all customer demands must be met. Constraint sets (6), (7) indicate that the total shipment processed by LN (I) nodes and LN (II) nodes respectively. Constraint set (8), (9) imply the LN (I) nodes and LN (II) nodes to be expanded or not respectively. The non-negativity on each shipment is imposed by constraint sets (10)-(12). Constraint set (13) on )(tYk restricts every logistics node to be either open or closed.

International Journal of Business and Management November, 2009
41
3. Solution algorithm
The above model is a nonlinear optimization model extended from the static location problem. Thus, to this optimization model, it is hard to obtain the optimization solution by classical optimization methods. An effective heuristic algorithm is given which is based on genetic algorithm and heuristic rules in the paper.
The proposed algorithm is segmented into two phases. In phase I, the optimal static solution for the first planning period is obtained by hybrid genetic algorithm. In phase II, based on the above optimal solution, the optimal solutions for the second and third planning period can be acquired by heuristic rules.
(1) the description of heuristic rule
In the following discussion, )(tKo and
)(tKC stand for the set of logistics nodes that are open and closed in period t
respectively.))(( tKZ o denotes the optimal objective function value for the static problem of DMLNLP in period t,
with )(tKo being the set of open facilities in the optimal static solution.
Let)(,)( t
j
t
j ZZbe the sum of transport costs and operator costs in the objective function value (i.e. the sum of TC
and OC in the objective function) before the logistics node i expanding and after expanding in period t, respectively.
Let)(tDD j ,
)(tDO j and)(tDE j be the change value of the sum of transport costs and operator costs in the objective
function due to logistics node j opening ,closing and expanding in period t, respectively.
heuristic rules
(1) opening rule: if the savings in opening logistics node j at time t is more than additional investment with opening, it is rational to open logistics node j. It can be expressed as:
)())](())(([)( 0 tKjFtKZjtKZtDD Cjoj (14)
(2) closing rule: if the savings in closing logistics node j at time t is more than additional costs of transporting and operating with closing, it is rational to close logistics node j. It can be expressed as:
)())(())(()( 0 tKjSjtKZtKZtDO O
t
joj (15)
(3) expanding rule: if the savings in expanding logistics node j at time t is more than extra costs with closing, it is rational to expand logistics node j. It can be expressed as:
)(tDE j )()()( 0 tKjaZZ t
j
t
j
t
j (16)
(2) solution algorithm
Step 1: sorting by the capacity of logistics nodes and calculating the upper bound of the number of logistics nodes needed.
Step 2: Constructing the virtual network based on the above logistics nodes needed.
Step 3: Applying the hybrid genetic algorithm based on revised ford-fakon algorithm to obtain the static optima solution under T=1(i.e.in the first period planning), and denoting its optimal objective value ),( **
1 ji nnZ ,where ** , ji nn is the number of LN(I) nodes and LN(II) nodes needed opening respectively.
Step 4: loading the flow of the second planning period into the optimal network of the first planning period, if the capacity of network can be meet the flow demand completely, goto Setp8 ;otherwise goto Step 5.
Step 5: Estimating the logistics nodes closed to the customers without fully satisfied according the above expanding rule, and calculating the minimum costs of expanding for all unsatisfied customers, denoting the extra expanding cost )(2 EZ .
Step 6: Estimating the logistics nodes closed to the customers without fully satisfied according the above opening rule, and calculating the minimum costs of opening for all unsatisfied customers, denoting the extra opening cost )(2 OZ .

Vol. 4, No. 11 International Journal of Business and Management
42
Step 7: Comparing )(2 EZ with )(2 OZ , if )()( 22 OZEZ , it is reasonable to expand; otherwise,
it should take the plan of opening. By this method, the optimal solution under T=2 (i.e.in the first period planning) can be obtained. Go to Step9.
Step 8: Calculating and sorting ascend the ratio of the using of all logistics nodes opening of the optimal solution under T=1, and closing the logistics nodes with less ratio of the using according to the above opening rule. By this method, the optimal solution in T=2 (i.e.in the first period planning) can be obtained. Go to Step9.
Step 9: Loading the flow of the second planning period into the optimal network of the first planning period, and by imitating the operations of Step4-Setp8, the optimal network of the third planning period can be obtained.
Step 10: Getting the finally optimal dynamic solution.
(3) Transformation of virtual network
Insert Figure 1 here
As Fig.1 shown, if there are m candidate nodes of LN(I), n nodes of LN(II) and p customer zones, a virtual network can be constructed by adding a original node s and destination node t.
Denoting },,2,1{ mI , },,2,1{ nJ , },,2,1{ pM
ijd : the distance of node I and node j, where MJIji,
ijcap : the throughput limit of the arc ij (from node i to j)
In the above virtual network, there exist the following rules:
(1) Iicapd sisi ;;0(2) JjIiUcapcd ijsiijij ,;; where Cij denotes the transport costs between node i and j, Uij denotes the maximum of the design capacity of node i and j.
(3) MKJjUcapcd jksijkjk ,;; where Cjk denotes the transport costs between node j and k, Ujk
denotes the maximum between the design capacity of node j and the demand of customer zone k.
(4) Mkcapd ktkt ;;0(4) the description of coding and genetic operator s
It is very important on how to represent the solution of the investigating problem as chromosome and to design genetic operator. In general, the binary code is a good alternative. The representation of chromosome is denoted as ],,,|,,[ 2121 nm vvvuuu .
It indicates that the candidate LN(I) i will be opened if ui is equal to 1 and the candidate LN(I) i will be opened if vj is equal to 1.
Based on the revised fork-fankson algorithm, the whole network flow assignment can be obtained and the objective function value is used to calculate the fitness of the associated chromosome.
Crossover operator is applied to the method of partially matched crossover (PMC). In order to ensure the feasibility of the offspring chromosome, it is necessary to fulfill remedy strategy. Zhao (2001) has given a detail description on the remedy strategy. The inversion operator is adopted for mutation operator in this paper.
4. A Numerical example
Suppose a city logistics nodes system planning is made according to its intending 20 years logistics demand changes, consisting of 3 stages: stage1 is from the first year to fifth year, stage 2 is from the sixth year to tenth year, and stage 3 is from the eleventh year to the twentieth year.
There are 6 potential LN (I) nodes (I), 22 LN (II) nodes (J) and 40 customer demand zones. Other input data is shown in the table1-5.
Insert Table 1 here
Insert Table 2 here
Insert Table 3 here
Insert Figure 2 here
The figure2 shows the change curve of objective function in the evolvement of GA algorithm.
According to the heuristics rules, the optimal result of the second period (T=2) is shown in table 7, and the optimal result of the third period (T=3) is shown in table 8.

International Journal of Business and Management November, 2009
43
Insert Table 7 here
Insert Table 8 here
5. Conclusions
In this paper, a dynamic logistics nodes layout optimal model is proposed to investigate the distribution network design problem with multi-period , multi-commodity and multiple logistics nodes An effective algorithm based on the hybrid genetic algorithm and heuristic rules is presented according to the characteristic of optimization problem. Finally, a numerical example is provided to validate the proposed model and solution algorithm. The findings indicate the following rules:
(1) The ratio of the distribution cost and the sum of fixed cost and handling cost will take great influence on the optimal configuration of logistics nodes. The logistics nodes opening become more if the ratio increases.
(2) The relative relation between unit expanding cost and open cost takes great effective on dynamic optimal solution. The measure of expanding is adopted when the supply capacity is deficiency, when the unit expanding cost is less than unit open cost.
(3) The genetic operator Pm influences on optimal solution and the speed of convergence while the PC will takes mild effective. The ideal parameters of the hybrid GA is as follows:
popsize=30, Pc=0.8, Pm=0.2,gen=150
Acknowledgements
This research was supported by Philosophy and Social Science Foundation of Central South University. NO.CSU0833
References
Cem Canel. (2001). An algorithm for the capacitated, multi-commodity multi-period facility location problem. Computers & Operations Research, 28, 411-427.
Geo!rion AM, & Graves GW. (1974). Multicommodity distribution system design by Bender's decomposition. Management Science, 20:822-44.
Goldman A. J. (1971). Optimal center location in simple networks. Transportation Science, (5):212-221.
Hakimi S. L. (1986). p-median theorems for competitive location. Annals of Operation Research, 5(1):79-88.
Hakimi, S. L. (1964). Optimum locations of switching centers and the absolute centers and medians of a graph. Operations Research, 12:450-459.
John Current, Samuel Ratick, & Charles Revelle. (1997). Dynamic facility location when the total number of facilities is uncertain: A decision analysis approach. European Journal of Operational Research, 110:597-609.
Klose, A., & Drexl, A. (2005). Facility location models for distribution system design. European Journal of Operational
Research, Vol.162, No.1, 4-29.
Management Science, 28(10): 1091-1105.
Nozick, L.K. (2001) The fixed charge facility location problem with coverage restriction. Transportation Research,Vol.37E, No.4, 281–296.
R. H. Ballou. (1968). Dynamic warehouse location analysis. Journal of Marketing Research, 5: 271-276.
S. Alexander. (1991). An algorithm for solving dynamic capacity plant location with discrete expansion sizes. Operations Research, 39:423-436.
Sweeney D. J., & Tatham RL. (1976). An improved long- run model for multiple warehouse location. Management
Science, 22(7):748-758.
T. J. VanRoy, & Erlenkotter D. (1982). A dual-based procedure for dynamic facility location.
Wang Z T. (2005). New Editor for Modern Logistics. Beijing: Capital Economic and Business University Press.
Zhao, X.Y. (2001). Research on bi-level distribution network optimization design in supply chain management. Ph.D. Thesis. North East University, Sheng Yang, China.

Vol. 4, No. 11 International Journal of Business and Management
44
Table 1. The design parameter of potential LN(I)
No. )(tFk
(10,000 yuan)
)(1 tU i
(10,000t/year)
)(1 ti
( yuan/t)
)(max tU i)
(10,000t/year)
)(tCe
k
(10,000 yuan)
t
kS
(10,000 yuan)
)(tAk
(10,000 yuan)
1 40000 4000 0.9 500 8000 120000 6510
2 46000 4600 0.8 500 8000 138000 7486
3 44000 4400 0.85 500 8000 132000 7161
4 38000 3800 1.0 500 8000 114000 6184
5 46000 4600 0.8 500 8000 138000 7486
6 32000 3200 1.1 500 8000 96000 5208
Note: suppose the investment recovery period of LN(I) is 10 years
Table 2. The design parameter of potential LN(II)
No. )(tFk
(10,000 yuan)
investment recoveryperiod (year)
)(2 tU j
(10,000t/year)
)(tj
( yuan/t)
)(max tU j
(10,000t/year))(tCe
k
(10,000 yuan)
t
kS
(10,000 yuan)
)(tAk
(10,000 yuan)
1 8400 5 700 1.6 200 3500 3500 2216
2 8400 5 700 1.6 200 3500 3500 2216
3 4800 3 400 1.8 100 2000 2000 1930
4 6000 5 500 1.6 125 2500 2500 1583
5 6600 5 550 1.6 150 2750 2750 1741
6 6600 5 550 1.6 150 2750 2750 1741
7 4200 3 350 1.8 80 1750 1750 1689
8 7800 5 650 1.6 170 3250 3250 2058
9 4200 3 350 1.8 80 1750 1750 1689
10 4200 3 350 1.8 80 1750 1750 1689
11 6600 5 550 1.6 150 2750 2750 1741
12 4800 3 400 1.8 100 2000 2000 1930
13 7800 5 650 1.6 170 3250 3250 2058
14 7200 5 600 1.6 150 3000 3000 1899
15 4200 3 350 1.8 80 1750 1750 1689
16 6000 5 500 1.6 125 2500 2500 1583
17 4800 3 400 1.8 100 2000 2000 1930
18 5400 5 450 1.6 110 2250 2250 2171
19 4800 3 400 1.8 100 2000 2000 1425
20 4800 3 400 1.8 100 2000 2000 1930
21 4200 3 350 1.8 80 1750 1750 1689
22 7200 5 600 1.6 150 3000 3000 1899

International Journal of Business and Management November, 2009
45
Table 3. The demand of customer zones (10,000t/year)
No. 1 2 3 4 5 6 7 8 9 10 11 12 13 14
T=1 264 240 256 248 208 264 272 216 170 190 150 140 130 110
T=2 314 290 306 298 258 314 322 266 200 220 180 170 160 140
T=3 414 390 406 398 358 414 422 366 270 290 250 240 230 210
No. 15 16 17 18 19 20 21 22 23 24 25 26 27 28
T=1 120 130 130 140 110 110 65 90 85 70 60 85 85 95
T=2 150 160 160 170 140 140 75 100 95 80 70 95 95 105
T=3 220 230 230 240 210 210 115 140 135 120 110 135 135 145
No. 29 30 31 32 33 34 35 36 37 38 39 40
T=1 65 55 95 90 80 75 50 60 90 80 50 60
T=2 75 65 105 100 90 85 60 70 100 90 60 70
T=3 115 105 145 140 130 125 100 110 140 130 100 110
Notes: T=1 represents the first planning period; from 1 to 5; T=2 represents the second planning period, from 6 to10;
T=3 represents the third planning period, from 10 to 20. Table 4. The unit transport cost from LN (I) to LN(II) (yuan/t)
Cij 1 2 3 4 5 6 Cij 1 2 3 4 5 6
1 7 12 17 4 3 6 12 11 8 9 17 9 5
2 16 12 10 13 14 7 13 12 7 8 7 5 11
3 14 14 3 15 15 4 14 11 6 5 11 8 16
4 3 16 12 14 8 12 15 12 12 3 14 4 6
5 8 5 5 10 13 11 16 7 3 7 6 14 16
6 12 16 6 15 17 7 17 9 15 14 5 17 5
7 13 11 15 10 12 6 18 8 14 10 4 13 9
8 8 15 15 5 5 11 19 4 11 8 14 9 3
9 9 12 4 6 11 3 20 14 9 13 13 9 5
10 9 14 3 6 6 11 21 14 14 9 6 6 16
11 6 6 14 8 13 10 22 16 8 7 11 12 7

Vol. 4, No. 11 International Journal of Business and Management
46
Table 5. The unit transport cost from LN(II) to customer zones(yuan/t)
LN(II) No. the transport cost from LN(II) to 1-40 customer zones ,respectively.
1 10, 7, 6, 2, 1, 10, 10, 7, 9, 4, 5, 9, 5, 10, 10, 3, 6, 6, 4, 4, 4, 8, 5, 4, 9, 1, 9, 9, 1, 7, 9, 2, 10, 9, 10, 8, 3, 3, 9, 3
2 9, 10, 1, 8, 9, 2, 6, 9, 7, 2, 3, 5, 3, 6, 9, 7, 3, 7, 6, 4, 10, 3, 5, 7, 2, 9, 3, 2, 2, 10, 8, 7, 3, 10, 6, 3, 1, 1, 4, 10
3 2, 9, 2, 10, 6, 4, 3, 6, 3, 6, 9, 7, 8, 8, 3, 3, 10, 5, 2, 10, 7, 10, 9, 3, 6, 6, 5, 10, 2, 3, 6, 1, 9, 4, 10, 4, 10, 7, 8, 10
4 10, 8, 7, 10, 4, 6, 8, 7, 7, 6, 9, 3, 6, 5, 5, 2, 7, 2, 7, 4, 4, 6, 6, 4, 3, 9, 3, 6, 4, 7, 2, 9, 7, 3, 2, 5, 7, 3, 10, 2
5 6, 1, 4, 7, 5, 10, 3, 10, 4, 5, 5, 1, 6, 10, 7, 4, 5, 3, 9, 9, 8, 6, 9, 2, 3, 6, 8, 5, 5, 5, 5, 5, 3, 10, 4, 1, 8, 8, 9, 8
6 4, 1, 4, 9, 3, 6, 3, 1, 4, 8, 3, 10, 8, 6, 4, 5, 4, 3, 2, 2, 4, 3, 6, 4, 6, 2, 3, 3, 3, 7, 5, 1, 8, 1, 4, 5, 1, 1, 6, 4
7 2, 1, 7, 8, 6, 1, 1, 5, 6, 5, 10, 6, 7, 5, 9, 3, 2, 7, 9, 4, 2, 5, 9, 5, 10, 3, 1, 8, 1, 7, 1, 8, 1, 6, 7, 8, 4, 9, 5, 10
8 3, 7, 6, 8, 8, 5, 6, 8, 10, 9, 4, 1, 3, 3, 4, 7, 8, 2, 6, 6, 5, 1, 3, 7, 1, 7, 2, 2, 2, 8, 4, 1, 1, 5, 9, 4, 1, 2, 3, 10
9 1, 4, 9, 9, 6, 8, 8, 1, 9, 10, 4, 1, 8, 5, 8, 9, 4, 8, 2, 1, 1, 9, 4, 5, 6, 1, 2, 5, 6, 7, 3, 1, 4, 6, 7, 7, 7, 8, 7, 8
10 8, 2, 10, 2, 7, 3, 8, 3, 8, 7, 6, 2, 4, 10, 10, 6, 10, 3, 7, 6, 4, 3, 5, 5, 5, 3, 8, 10, 3, 4, 8, 4, 2, 6, 8, 9, 6, 9, 4, 3
11 5, 2, 2, 6, 10, 6, 2, 1, 7, 5, 6, 4, 1, 9, 10, 2, 4, 5, 8, 5, 7, 4, 7, 6, 3, 9, 2, 1, 4, 2, 6, 6, 3, 3, 2, 8, 5, 9, 3, 4
12 7, 4, 1, 4, 6, 3, 9, 1, 8, 3, 3, 6, 10, 2, 1, 9, 6, 1, 8, 10, 1, 6, 4, 5, 2, 1, 5, 9, 6, 10, 3, 6, 5, 2, 4, 10, 6, 9, 3, 8
13 10, 7, 2, 8, 8, 2, 10, 1, 4, 5, 2, 8, 6, 4, 4, 3, 5, 2, 3, 10, 1, 9, 8, 5, 6, 7, 9, 1, 8, 8, 5, 4, 2, 4, 7, 4, 1, 2, 10, 1
14 5, 3, 10, 4, 2, 5, 9, 3, 1, 6, 6, 10, 4, 3, 9, 8, 5, 9, 2, 5, 4, 6, 6, 3, 7, 9, 10, 3, 10, 6, 10, 5, 6, 1, 6, 9, 9, 1, 2, 4
15 3, 3, 3, 8, 1, 4, 2, 4, 4, 8, 1, 10, 6, 6, 9, 4, 8, 9, 4, 8, 10, 4, 10, 2, 9, 3, 9, 1, 2, 9, 5, 9, 7, 1, 10, 4, 1, 1, 9, 8
16 7, 4, 6, 7, 6, 9, 4, 10, 5, 9, 4, 10, 8, 7, 5, 6, 9, 7, 2, 6, 6, 2, 10, 7, 5, 6, 5, 3, 6, 4, 3, 7, 9, 3, 7, 7, 4, 10, 5, 6
17 7, 3, 6, 4, 6, 7, 7, 2, 5, 5, 7, 3, 7, 9, 3, 6, 6, 2, 1, 2, 6, 2, 8, 7, 1, 1, 3, 5, 4, 4, 7, 3, 9, 3, 4, 5, 4, 5, 4, 7
18 9, 5, 8, 4, 10, 9, 1, 1, 9, 9, 1, 6, 2, 5, 4, 7, 4, 10, 3, 2, 10, 9, 3, 4, 5, 1, 3, 4, 2, 10, 9, 10, 9, 10, 2, 4, 6, 2, 5, 3
19 6, 4, 9, 10, 3, 9, 8, 1, 2, 5, 9, 2, 10, 4, 6, 10, 8, 10, 9, 1, 2, 5, 8, 6, 6, 6, 1, 10, 3, 9, 3, 5, 6, 1, 5, 5, 1, 6, 2, 2
20 6, 10, 1, 9, 4, 9, 8, 3, 7, 10, 4, 9, 2, 1, 4, 4, 9, 5, 9, 1, 2, 6, 5, 2, 4, 8, 4, 6, 9, 6, 7, 10, 1, 9, 10, 4, 7, 1, 7, 10
21 8, 9, 10, 5, 2, 6, 7, 7, 7, 7, 7, 8, 2, 5, 1, 7, 2, 3, 2, 5, 10, 6, 3, 4, 5, 2, 6, 3, 4, 2, 7, 9, 9, 3, 8, 8, 2, 3, 7, 1
22 5, 10, 5, 7, 1, 4, 7, 3, 5, 6, 9, 9, 2, 3, 2, 5, 10, 9, 3, 5, 6, 3, 10, 10, 9, 4, 9, 7, 10, 9, 7, 7, 3, 4, 9, 3, 7, 3, 8, 6
According to the above algorithm and given data, the simulation result is as follows.

International Journal of Business and Management November, 2009
47
Table 6. The optimization configure of logistics nodes in the first period (T=1)
Logistics nodes opening Flow Assignment Total flow
LN(I) LP3 DC2(700), DC5(532), DC99(350), DC14(595) 2177
LP4 DC1(606) , DC8(650) , DC11(550) , DC13(650) , DC18(450) 2906
LN(II)
DC1 C4(248) , C5(208) , C26(85) , C29(65) 606
DC2 C3(256) , C6(34),C10(190) , C17(130),C37(90) 700
DC5 C2(240),C12(140),C18(22),C24(70),C36(60) 532
DC8 C15(116),C18(34),C22(90),C23(85),C25(60),C31(95)
C32(90),C33(80)
650
DC9 C1(264),C20(86) 350
DC11 C8(5),C13(130),C16(130),C27(85),C28(95),
C30(55),C35(50)
550
DC13 C6(230),C8(211),C18(84),C21(65),C40(60) 650
DC14 C9(170),C14(110),C19(110),C34(75),C38(80),C39(50) 595
DC18 C7(272),C11(150),C15(4),C20(24) 450
Costs (1) total cost every year=79751 ten thousand; where distribution cost=36502 ten thousand, fixed cost=32152 ten thousand, operator cost=11097 ten thousand
(2)Total cost =332555.44 ten thousand in T=1
Notes: (1) iLP denotes the logistics node i belonging to the type of LN(I); jDC denotes the logistics node j belonging
to the type of LN(II); kc denotes the customer zone k(2)the unit of flow is ten thousand ton/ per year.
Table 7. The optimization configure of logistics nodes in the second period (T=2)
Logistics nodes opening Flow Assignment Total flow
LN(I) LP3 DC2(700), DC4(493),DC5(550), DC9(350), DC14(600) 2693
LP4 DC1(700), DC8(650), DC11(550), DC13(650), DC18(450)
DC21(350)
3350
LN(II)
DC1 C4(248), C5(258), C26(95), C29(49) 700
DC2 C3(306), C10(220), C29(26), C38(75), C37(73) 700
DC4 C16(196), C18(204), C35(100) 493
DC5 C2(115), C12(205), C24(120), C36(110) 550
DC8 C1(64), C12(35), C18(36), C23(135), C25(110)
C32(140), C33(130)
650
DC9 C1(210), C20(140) 350
DC11 C7(52), C18(75), C13(160), C27(93), C28(105),
C30(65)
600
DC13 C6(314), C8(191), C21(75), C40(70) 650
DC14 C9(200), C14(140), C19(100), C34(85), C38(15), C39(60) 600
DC18 C7(270), C11(180) 450
DC21 C15(150), C17(160), C19(40) 350
Costs (1) total cost every year=75934 ten thousand; where distribution cost =46129 ten thousand, fixed cost=13344 ten thousand, operator cost=13401 ten thousand, the cost of
logistics nodes changing=3060 ten thousand
(2)Total cost=316634 ten thousand in T=2
notes The logistics node configure changes of the second period is to add the DC4 and DC21, comparing with that of the first period.

Vol. 4, No. 11 International Journal of Business and Management
48
Table 8. The optimization configure of logistics nodes in the third period (T=3)
Logistics nodes openning Flow Assignment Total flow
LN(I) LP3 DC2(850), DC4(664), DC5(550)DC9(350), DC14(750)DC16(495), DC22(600)
4259
LP4 DC1(688), DC8(650), DC6(550),DC11(550), DC13(639), DC18(450), DC21(330)
4207
LN(II)
DC1 C4(398), C5(6), C6(258), C26(95), C29(49) 688
DC2 C3(406), C10(290), C17(4), C8(150) 850
DC4 C8(70), C16(196), C18(204), C20(90), C27(10),C35(100) 664
DC5 C2(115), C12(205), C24(120), C36(110) 550
DC6 C2(275), C8(135), C37(140) 550
DC7 C7(124),C17(226) 350
DC8 C1(64), C12(35), C18(36),C23(135),C25(110)
C32(140),C33(130)
650
DC9 C1(350) 350
DC11 C7(98),C13(202),C28(145),C30(105) 550
DC13 C6(414),C21(115),C40(110) 639
DC14 C9(270),C34(125), C38(130),C39(100),C27(125) 750
DC16 C19(210),C22(140), C31(145) 495
DC18 C7(200),C11(250) 450
DC21 C14(210),C20(120) 330
DC22 C5(352),C13(28),C15(220) 600
costs (1) total cost every year=86002 ten thousand; where distribution cost =58214 ten thousand, fixed cost=6910 ten thousand, operator cost=16218 ten thousand, the cost of logistics nodes changing=4660 ten
thousand,
(2)Total cost=3,586,160,000.8 yuan ten thousand in T=3
notes The logistics node configure changes of the second period is to expand the capacity of the DC2, DC4, DC14; DC21, LP4; to add new nodes DC6, DC7, DC16, DC22.

International Journal of Business and Management November, 2009
49
Figure 1. Virtual logistics network
Figure 2. The change curve of objective function
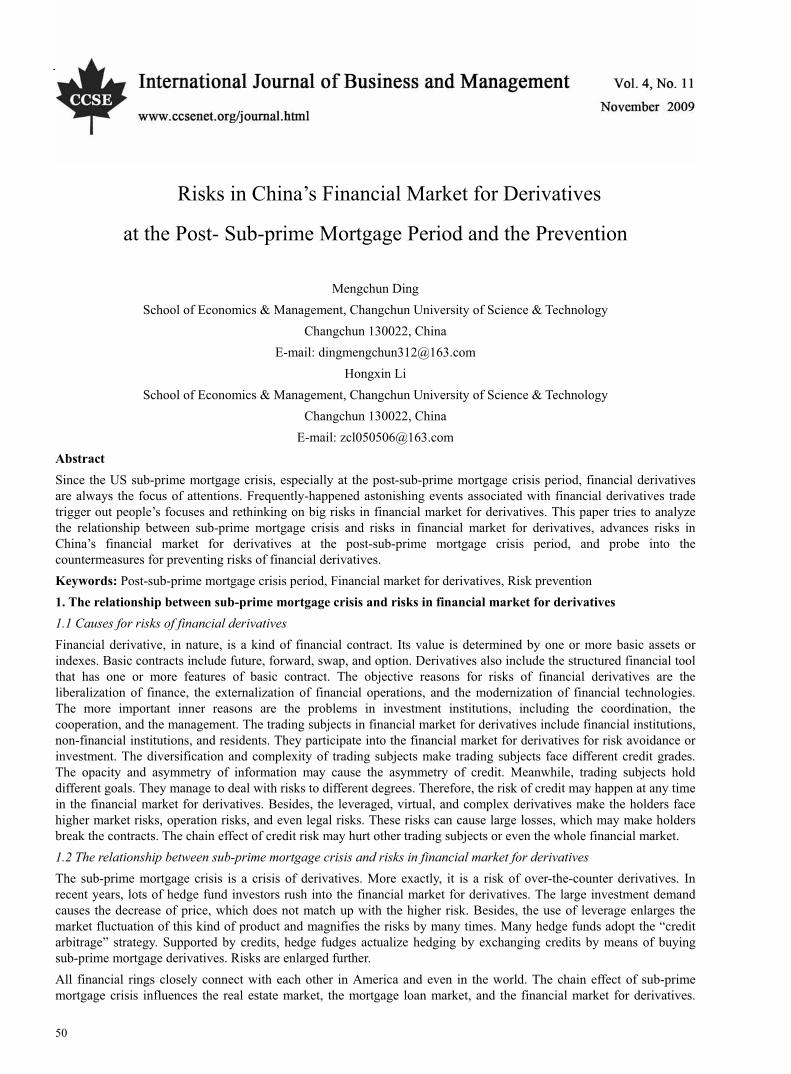
Vol. 4, No. 11 International Journal of Business and Management
50
Risks in China’s Financial Market for Derivatives
at the Post- Sub-prime Mortgage Period and the Prevention
Mengchun Ding
School of Economics & Management, Changchun University of Science & Technology
Changchun 130022, China
E-mail: [email protected]
Hongxin Li
School of Economics & Management, Changchun University of Science & Technology
Changchun 130022, China
E-mail: [email protected]
Abstract
Since the US sub-prime mortgage crisis, especially at the post-sub-prime mortgage crisis period, financial derivatives are always the focus of attentions. Frequently-happened astonishing events associated with financial derivatives trade trigger out people’s focuses and rethinking on big risks in financial market for derivatives. This paper tries to analyze the relationship between sub-prime mortgage crisis and risks in financial market for derivatives, advances risks in China’s financial market for derivatives at the post-sub-prime mortgage crisis period, and probe into the countermeasures for preventing risks of financial derivatives.
Keywords: Post-sub-prime mortgage crisis period, Financial market for derivatives, Risk prevention
1. The relationship between sub-prime mortgage crisis and risks in financial market for derivatives
1.1 Causes for risks of financial derivatives
Financial derivative, in nature, is a kind of financial contract. Its value is determined by one or more basic assets or indexes. Basic contracts include future, forward, swap, and option. Derivatives also include the structured financial tool that has one or more features of basic contract. The objective reasons for risks of financial derivatives are the liberalization of finance, the externalization of financial operations, and the modernization of financial technologies. The more important inner reasons are the problems in investment institutions, including the coordination, the cooperation, and the management. The trading subjects in financial market for derivatives include financial institutions, non-financial institutions, and residents. They participate into the financial market for derivatives for risk avoidance or investment. The diversification and complexity of trading subjects make trading subjects face different credit grades. The opacity and asymmetry of information may cause the asymmetry of credit. Meanwhile, trading subjects hold different goals. They manage to deal with risks to different degrees. Therefore, the risk of credit may happen at any time in the financial market for derivatives. Besides, the leveraged, virtual, and complex derivatives make the holders face higher market risks, operation risks, and even legal risks. These risks can cause large losses, which may make holders break the contracts. The chain effect of credit risk may hurt other trading subjects or even the whole financial market.
1.2 The relationship between sub-prime mortgage crisis and risks in financial market for derivatives
The sub-prime mortgage crisis is a crisis of derivatives. More exactly, it is a risk of over-the-counter derivatives. In recent years, lots of hedge fund investors rush into the financial market for derivatives. The large investment demand causes the decrease of price, which does not match up with the higher risk. Besides, the use of leverage enlarges the market fluctuation of this kind of product and magnifies the risks by many times. Many hedge funds adopt the “credit arbitrage” strategy. Supported by credits, hedge fudges actualize hedging by exchanging credits by means of buying sub-prime mortgage derivatives. Risks are enlarged further.
All financial rings closely connect with each other in America and even in the world. The chain effect of sub-prime mortgage crisis influences the real estate market, the mortgage loan market, and the financial market for derivatives.

International Journal of Business and Management November, 2009
51
The sub-prime mortgage crisis decreases market’s ability of bearing risks. It popularizes in the whole credit market quickly. As a result, the credit spread rises sharply. Re- financing in market tends to be more difficult. A vicious circle comes into being. Recently, the RMB appreciation and the universal fluidity dominated by high trade balance cause the rise of domestic asset price and the possibility of bubble risks. The weak supervision over domestic financial market for derivatives may lead to a national financial crisis, similar to the sub-prime mortgage crisis. On one hand, derivatives investors share profits from sub-prime mortgages. On the other hand, they are the ultimate bearer on the risk chain.
2. The risks in China’s financial market for derivatives at the post-sub-prime mortgage crisis period
Since Mar. 2009, a series events, including Dow-Jones Index falling below 7000, and worsening eastern European economy, cause new discussions about the sub-prime mortgage crisis in the world. This paper agrees that present conditions are not similar to the Asian financial crisis in 1997. So, here we adopt the “post-sub-prime mortgage crisis period” to describe present economic conditions.
2.1 Risks caused by the complicated design of financial derivatives
Many people agree that the sub-prime mortgage crisis is caused partly by complicated product design, which can satisfy market needs on one hand. On the other hand, it can cause complex pricing. Financial derivatives are mainly over-the-counter. Complicated product design creates spaces for pricing, which makes supervision more difficult. In general, transaction on exchange is regulated by the exchange. Over-the-counter transaction is non-standard and non-transparency, which is free from regulatory system. In emerging market where regulations are weak, complicated products turn into institutions’ tools for robbing more profits. In addition, complicated product design enhances the information asymmetry between shareholders and corporate employees, which causes the more serious agency problem. It means higher requirements for corporate governance. Complex pricing and manipulating may increase the costs of supervision. Meanwhile, transaction directions and quantities in the financial market are unclear. As a result, the supervision is an absence.
2.2 Risks caused by financial derivatives’ transaction way
Financial derivative transaction adopts the leverage way in general. Transaction amount is far larger than the delivery amount, enlarging the credit risk. Meanwhile, trans-period transaction and high market fluidity enhance the uncertainty of future asset price. Risks are greater than traditional financial product. In a speculation transaction, once the trader fails to judge the market rightly, plus the imperfect internal risk management measures, it will lead to considerable losses. In perspective of exterior environment, financial derivatives are products from financial liberalization. Its creative speed should be faster than financial market development and financial supervision improvement. The structure of financial derivatives is more complicated. It is more difficult to distinguish all financial tools clearly.
2.3 Risks caused by the invalidation of financial institutions’ incentive restraint mechanism
Because financial derivatives belong to out-the-balance business, they are not displayed in banks’ balance sheet. Banks merely disclose limited information. Regulatory institutions can not get sufficient and exact information about financial institutions’ operations and investments in derivatives. Once problems appear, it is hard to adopt effective countermeasures in time. Because there is not a common liquidity system for financial derivatives and transactions are not transparent, the government can not know the transaction scale and position distribution of financial derivatives. Once a crisis happens, the government will not estimate the influences of crisis for a long period.
2.4 Risks caused by over-speculation and lagged-behind supervision
The government almost does not interfere with the design of financial derivatives. The government supposes transaction parties can understand the structure and the risks of financial derivatives. So, the transaction is market behavior. It is not necessary to participate in for the government. Under this circumstance, innovations of financial derivatives stray away from fundamental economic principles. Firstly, underlying products for credit derivatives betray the principle of “repayable” banks’ loans. It does not emphasize on the payment in the cash flow but pay more attentions to the appreciation of mortgages. Secondly, the structure of derivatives is too complicated. Underlying products’ risks tend to be hidden in designs. It betrays the principle of “informing customers about financial risks completely”. Thirdly, regulatory institutions do not set limits on derivatives’ leverage rates. It amplifies risks to a great degree, surpassing market participators’ bearing.
3. Measures for preventing risks in China’s financial market for derivatives at the post-sub-prime mortgage
period
3.1 Financial derivatives’ design innovation should be step by step
First of all, the structure of derivatives should be developed from simple to complex, and the risks from lower to higher. Combine the world universal mode with China’s special market environment. Product innovation serves for market’s general development. All designs should be demonstrated completely and follow legal regulations. Technologically, designed products can be controlled. In operation, timely supervision is necessary. In emergency, there is preparedness.

Vol. 4, No. 11 International Journal of Business and Management
52
Then, it can ensure the safe and orderly development of financial market for derivatives. Secondly, in order to promote the healthy development of financial market for derivatives, we should perfect relevant laws and regulations and build a favorable legal environment on one hand. On the other hand, we should make up transaction rules and standards for financial derivatives. Educate market investors and popularize relevant specialized knowledge concerning financial derivatives. Build a transaction regulatory mechanism for financial derivatives and prevent financial risks.
3.2 Financial institutions build perfect internal control mechanism and improve the risk-management ability
Because financial derivatives have complex operations and hidden cash flow, the key for controlling derivatives’ transaction risks lies in financial institutions building a perfect internal control mechanism and risk-management system. The fundamental reason for the bankruptcy of England Barings Banks is that there are serious defects in its internal control mechanism for derivatives transaction. Therefore, regulatory institutions should ask commercial banks build a perfect internal control mechanism and risk-management system, emphasizing on self-risk-management. Help, guide, and supervise financial institutions to build perfect business operation standards, risk management system, and report and information disclosure system in order to prevent credit risks, market risks, fluidity risks, operation risks, and legal risks. By this way, it can control risks of derivatives under a reasonable limit, which is in accordance with the world trend that all countries’ regulatory institutions emphasize on financial institutions’ self risk-management system and procedures.
3.3 Build and perfect a trinity regulatory management system including government regulation, industrial
self-discipline, and exchange supervision
First of all, the top management level should understand that transactions aim at decreasing and separating risks, enlarging profitability, improving business efficiency, and deepening financial development. Build a “from macro to micro” control system properly. Regulate the type of transaction, transaction amount, and limits on principals. Select and use financial derivatives’ type carefully. Secondly, strengthen the internal control and control transaction procedures strictly. Separate the operational right, the settlement right, and the regulatory right. Empower businesses clearly. Punish illegal transactions seriously. Thirdly, set special risk-management and regulatory department and record, confirm, and evaluate traders’ transactions. Evaluate, estimate, and prevent financial derivatives’ credit risks, market risks, fluidity risks, liquidity risks, operational risks, and legal risks in transactions. The department should report to the decision-making level directly, informing relevant market conditions and corporate transactions.
3.4 Emphasize on international cooperation of financial supervision and strengthen trans-national supervision on
financial institutions
Financial globalization is equal to financial risks’ globalization. The continuous fluctuation of world financial market impacts people’s expects for domestic financial market, increasing domestic financial market’s risks. China’s financial institutions and regulatory agencies should prevent world financial risks carefully, enhance the supervision over the flow of trans-national capitals, and promote the financial opening-up steadily and orderly. In order to prevent and solve world financial risks, it is necessary to strengthen world cooperation of financial supervision. The financial supervision’s world coordination and cooperation mechanism mainly includes information exchange, policy integration, crisis management, cooperation targets, and associated actions. For example, in order to control the popularization of sub-prime mortgage crisis, the Federal Reserve associates with main national central banks to invest in financial system, improving the market fluidity, and resulting in a positive adjustment of world stock market. China has already joined International Monetary Fund (IMF), World Bank, International Organization of Securities Commissions (IOSCO), and International Association of Insurance Supervisors (IAIS) and signed memorandum of understanding finance with many countries and regions, which turn into a positive basis for strengthening the world cooperation of financial supervision.
References
Gu, Xiujun. (2009). Perfect the risk-prevention system and drive the healthy development of financial market for derivatives. Financial News. 18th, Mar.
Institute of Urban Finance, Industrial and Commercial Bank of China. (2009). Rethinking on financial supervision in sub-prime mortgage crisis. China Economy, No. 3.
Jing, Naiquan. (2009). Financial crisis’ inspirations for Chinese commercial banks developing credit derivatives. Financial News. 7th, Apr.
Ma, Weihua. (2009). Probe into financial crisis’ effects on Chinese commercial banks dialectically. Shanghai Securities
News. 2nd, Feb.
Strengthen market supervision and drive the healthy development of financial market for derivatives. [Online] Available: http://gygov.gov.cn2009.6.10.

International Journal of Business and Management November, 2009
53
Malaysian Chinese Consumers:
Their Ethnic Attitudes and Shopping Orientations
Safiek Mokhlis
Faculty of Management and Economics, Universiti Malaysia Terengganu
21030 Kuala Terengganu, Malaysia
Tel: 60-9-6683-164 E-mail: [email protected]
Abstract
The influence of cultural values on human behavior has been well documented. However, very limited research has been reported on the linkages between cultural values of the Chinese people and their behaviors as consumers. The exploratory study investigated (a) ethnic attitudes of Chinese consumers, (b) their shopping orientations and (c) relationships between their ethnic attitudes and shopping orientations. Subjects in a Chinese society were divided into high and low attitudes toward Chinese cultural values. Results of t-tests showed statistically significant differences in responses to two shopping orientation subscales (recreational shopping and confused by overchoice) between high and low groups. These findings suggest that certain shopping orientation constructs are more closely linked with ethnic attitude of Chinese consumers than other shopping orientation constructs.
Keywords: Ethnicity, Shopping orientations, Chinese, Malaysia
1. Introduction
Culture is defined as “the norms, beliefs and customs that are learned from society and lead to common patterns of behavior” (Assael, 1992, p. 319). McCraken (1986) argues that culture is the lens through which people see their world, and as a blueprint, it determines the coordinates of social action and productive activity. Central to any culture is a common set of values, ideals and assumptions about life which determine what is considered socially acceptable behavior. The values are transmitted from one generation to the next through the process of learning and interacting with one’s environment, rather than through the genetic process (De Mooij, 2004). These learned values influence the members of the society to behave and act in a particular way considered socially acceptable by the other members in the group. These values also determine forms of social organization (such as the family, education and social class system), habits and conventions, the communication system and roles and status positions for members of that society (Slowikowski & Jarratt, 1997).
One important element of a cultural phenomenon that has considerable influence on people’s values, habits and attitudes is ethnicity. The term “ethnicity” is generally agreed to refer to “people who perceive themselves as constituting a community because of common culture, ancestry, language, history, religion, or customs” (Riggins, 1992, p. 1). Thus ethnicity is both an automatic characteristic of racial group membership and a process of group identification (Rossiter & Chan, 1998). In the consumer behavior literature, ethnicity is recognized as a powerful force shaping consumers’ behavior. Ethnicity provides a vehicle for examination of culture difference in a systematic fashion across national boundaries by identifying similar subgroups in a variety of countries rather than by describing specific groups in selected environments (McCullough, Tan & Wong, 1986). Research in the USA, which has predominantly focused on retailing, has demonstrated that ethnicity is a significant predictor of various aspects of consumer behaviors, including how advertising is perceived; brand loyalty; consumer values; consumption patterns; family decision-making; word-of-mouth behavior and perceived risk, among others (Shaffer & O’Hara, 1995).
Researching the relationship between ethnicity and consumer behavior is a complex undertaking because of the uncertainty about how ethnic groups should be defined. The common assumption in most consumer behavior studies on ethnicity is that members of an ethnic group are alike in their cultural values and orientations and that they are different from the subjects of another ethnic group. However, the acculturation process through which members of an ethnic group learn about other cultures poses a challenge to this over simplistic assumption. As a result of cross-cultural influences, many ethnic groups are changing their cultural heritage, resulting in varying values, attitudes and beliefs among members of a society. Hence, it would be valuable for researchers interested in ethnicity to first study the within

Vol. 4, No. 11 International Journal of Business and Management
54
group differences then the between groups differences (cf. Tan & McCullough, 1985).
Although numerous consumer behavior studies on ethnicity were done in the past, the evidence specifically pertaining to purchasing behavior-related aspects comes from studies conducted in the American context. With some notable exceptions, consumer behavior in developing countries with traditional value structures has received scanty attention from researchers. The overall purpose of this study was to investigate (a) ethnic attitudes of Chinese consumers in Malaysia, (b) their shopping orientations and (c) relationships between their ethnic attitudes and shopping orientations.
2. The Chinese Culture in Malaysia
In an Asian context, and even in an international context, Malaysia is unique. The outstanding characteristic of Malaysia is its highly variegated ethnic mix which makes it one of the classic examples of a multicultural society in the world (Ooi, 1999). Among examples of plural societies, Malaysia shows an unusually balanced ethnic structure of two dominant groups, the Malays who make up 53.4 per cent and the Chinese who make up 26 per cent. As well there are 7.7 per cent Malaysians of Indian ethnic origin (Department of Statistics Malaysia, 2005). Due to the cultural differences that exist in the origins of different communities, there is a noticeable absence of homogeneity in the behavior of consumers in Malaysia where the nature of its domestic market is highly characterized by the “ethnically segmented consumer markets” (Mohd. Salleh, Teo & Pecotich 1998, p. 481).
The Chinese is the second most dominant ethnic group in Malaysia. Numbering about 6 million, Malaysian Chinese are a unique breed of overseas Chinese who migrated to Peninsular Malaya in the 19th century during the British colonial administration. The Chinese were derived largely from South China and include Hakka, Teochew, Fuchow and Hainanese with the Cantonese and Hokkein forming the largest dialect groups (Abdullah & Pedersen, 2003). From the early days, they were mainly found in the urban areas, dominated the economic power and controlled the tin mining and rubber industries, which were the country’s main sectors.
Malaysian Chinese culture is derived from that of China from which their forefathers had migrated long before independence. The Chinese brought with them their distinctive identity and culture with its amalgam of Confucian, Taoist and Buddhist elements and various dialects with Mandarin as the language of the educated groups. To this day, they sponsor their own cultural and social activities, and hold on to their primary ties to the family and associations based on their dialectical or geographical origins in China. According to Wong (2007):
“The Chinese, who first settled in this country [Malaysia] many generations ago, though not well schooled in the Confucian classics, still live under the influence of Confucianism as their forefathers did for more than two thousand years. This influence has left its deep imprints at every level of Chinese society today and in the conduct of their daily life. In essence, the special traits of the spirit and character of the Chinese are largely shaped by the exposure to the teachings of Confucius and his disciples. Throughout its extended history, Confucianism has also been enriched by contributions from Chinese philosophers at different times.”
Living in a multi-ethnic society means exposure to other cultural values, besides the Chinese traditional culture. Generations of Chinese have infused Malaysian life with aspects of Chinese culture in a manner that is both spontaneous and dynamic. At the same time, elements of local culture have fused with the culture of Malaysian Chinese (Voon, 2007). In addition, the colonial rule expounded strong influence on the Chinese. In discussing the value orientation of the Chinese in Malaysia, Abdullah and Pedersen (2003, p. 118) explained:
“In general, the overseas Chinese in Southeast Asian countries were subjected to a variety of influences, directing them in a different and sometimes conflicting ways. The first of these influences has been towards adaptation, accommodation and even assimilation into local host society and culture. A second shift is the re-emphasis of a common Chinese culture while a third shift has been towards a more modern westernized model due to their exposure to an English type education.”
As a result, the Malaysian Chinese were characterized by an oriental focus as well as traces of Western values. The Chinese who have adopted strong Western values and lifestyle are regarded as having a weak identification with traditional Chinese cultural values. Conversely, the Chinese who remain very traditional and adhere strongly to the Chinese culture are considered to be strong in ethnic identification.
3. The Literature
3.1 Chinese cultural values
The Chinese exist as ethnic subgroups in most countries and as the dominant group in many parts of Asia. Although the Chinese are culturally diverse, comprising a wide variety of dialectically defined groups, there are some unique cultural characteristics to describe the values and behavior of the Chinese in general. According to Yau (1988), the Chinese cultural values are formed and created from interpersonal relationships and social orientations. Based on the value-orientation model, the Chinese cultural values can be described as follows (Yau, 1988):
1) Man-Nature Orientation: Man is part of nature and as such, man should not try to overcome or master nature but

International Journal of Business and Management November, 2009
55
has to learn how to adapt to it. In other words, the emphasis is on harmony.
2) Man-Himself Orientation: The Chinese are situation oriented and they regard circumstances as an important element which bear upon what is right and what is wrong. Compromise is inevitable.
3) Relational Orientation: History has great meaning to the Chinese. They tend to emphasize continuity. That is to say once a relationship is established, it is hard to break.
4) Activity Orientation: Based on the Confucian doctrine of the mean, a person has to impose moral self-control, at least in public.
A fundamentally important feature of traditional Chinese culture that shapes attitudes and behaviors is the notion of Confucian values, which derives from Confucius, Mencius, Lao Zi, and their followers (Walstedt, 1978). Confucianism is more of a philosophy than a religion. Chinese are deeply influenced by these codified values in the adoption of appropriate forms of conduct. Benevolence, propriety, wisdom and obedience are Confucian norms of human beings (Nivison & Wright, 1966). Central to Confucianism are human relationships: parent-child relations, sibling relations, marriage relations, clan relations and finally community relations and friendship. These five cardinal relations effectively control social behavior in society. Correct observance of these human relationships is regarded as integral to the proper functioning of society.
Face consciousness has been identified as one of the most robust cultural values that affect Chinese consumer behaviors (Wong, 1986; Wong & Ahuvia, 1998; Yau, 1988). The term refers to the emphasis on prestige, recognition, and status. The concept of “face” points to an inner sense of worth which is experienced by the ego (Wong, 1986; Wong & Ahuvia, 1998). According to Hu (1944), the emotional impact of the loss of “face” could constitute a real dread affecting the psyche of the ego more strongly than physical fear. Hence, the Chinese tend to place great importance on the protection of “face”.
3.2 Shopping orientation research
Shopping orientation is one of the most axiomatic concepts in consumer behaviour literature which has been widely used to classify consumers based on their shopping habits and styles. Past researchers have reached a consensus agreement that shopping orientation is a multi-dimensional concept that reflects a consumer’s view of shopping as a social, recreational or economic phenomenon, as well as individual’s motivations for shopping (Shim & Mahoney, 1992). The basic premise of this concept is that people take many different approaches to the act of shopping based on their past shopping experiences and personal-value systems (Darden & Dorsch, 1990). Thus, shopping orientations can be thought of as characterizing an individual’s general predisposition toward acts of shopping. It is a specific attitude structure about shopping as which has cognitive and affective characteristics (Sproles & Kendall, 1986).
Moschis (1992) defined shopping orientation as “mental states that result in various general shopping patterns” (p. 374). This includes consumer “activities, interests and opinions concerning the shopping process” (Moschis, 1992, p. 231). Shim and Kotsiopulos (1993) define shopping orientations as categories of shopper styles with particular emphasis on certain activities. They note that shopping orientations also represents consumers’ needs for products and services. Visser and du Preez (2001) suggest that the concept of shopping orientation consists of a personal dimension (e.g. activities, interests, opinions, motives, needs and preferences) and a market behaviour dimension reflects the personal dimension and indicates needs and preferences for, inter alia, information sources, stores per se (patronage behavior) and store image (including store attributes).
Scholarly research into shopping orientation began in the mid-1950s with some early pioneers in patronage behavior research who attempted to explain shopping behaviour in terms of social-psychological concepts. Stone (1954) is the first researcher who pioneered the research on shopping orientation. In his seminal article, Stone suggests that as consumers gain experience in the marketplace, a fractionization of shopping orientation evolves. Stone interviewed 150 housewives in Chicago to determine their orientations towards shopping with local department merchants and large chain department stores. Stone categorised responses based on the question “why would you rather do business with local independent merchants or large chain stores?” (p. 38). His grouping resulted in four categories of shoppers: economic shoppers (35%), personalizing shoppers (29%), ethical shoppers (18%) and apathetic shoppers (18%).
Since Stone’s seminal work, numerous empirical studies have been conducted and many of these studies have attempted to develop typologies by using various products and consumer groups. Stephenson and Willett (1969) developed a four-way topology for six product categories. Consumers were classified into store-loyal, compulsive and recreational, convenience and price-bargain shoppers based on shopping processes. Darden and Ashton (1971) confirmed Stone’s propositions of shopper types for health and personal care products. William et al. (1978) classified grocery shoppers into apathetic, convenience, price or involved shoppers and found significant differences across groups in demographics and media usage. Lumpkin (1985) identified three groups of elderly shoppers (65 years and older) in general shopping orientations: active, economic and apathetic shoppers. Lumpkin et al. (1986) examined rural consumers in relation to outshopping orientations and identified three types of shoppers: inactive, in-shoppers, active out-shoppers and thrifty

Vol. 4, No. 11 International Journal of Business and Management
56
innovators.
Other researchers have incorporated psychographics into shopping orientations and identified additional shopper types such as social shopper, quality shopper, problem-solving shopper, psycho-socializing shopper and brand-name shopper (Darden & Reynolds, 1971; Darden & Ashton, 1974-75; Moschis, 1976). Shopping orientations were further examined in relation to product usage rate, consumer information usage, in-home and outshopping, electronic shopping, lifestyle and self-concept, socialization effects of work experiences and store patronage (Darden & Reynolds, 1971; Moschis, 1976; Lumpkin et al. 1985; Darden & Howell, 1987; Gehrt & Shim, 1998; Vijayasarathy, 2003; Shamdasani et al. 2001; Moye & Kincade, 2003).
3.3 Previous research on Chinese shopping orientations
Previous studies on Chinese shopping orientations are limited but recently they have been increasing in number. Fan and Xiao (1998) reported a study on the applicability of Consumer Style Inventory (CSI) to Chinese consumers and identified the following shopping orientations: brand conscious, time conscious, quality conscious, price conscious, and information utilization. The results are similar to American and Korean college student sample reference of those studies. The application of the CSI in a Chinese context was further refined and validated by the findings of Hiu et al. (2001), which confirmed five shopping orientations of Chinese consumers: perfectionist, novelty-fashion conscious, recreational, price conscious and confused by overchoice. More recently, Radder et al. (2006) examined the cross-cultural applicability of the CSI using samples of Chinese, Motswana and Caucasian undergraduate students in South Africa. As a result of factor analysis, five decision-making characteristics of young Chinese consumers were identified: perfectionist shopper, hedonistic/recreational shopper, impulsive/confused shopper, image/quality conscious shopper and habitual shopper.
To date, no major studies are reported in the scholarly literature that investigate the relationships between ethnic values and shopping orientations of Chinese consumers. In an unpublished doctoral dissertation, Ownbey (1991) reported a study of personal values and shopping orientations of Chinese-Americans in California. Hai (2008) investigated the relationships between dimensions of personal values and shopping orientation of working adults in Shanghai, Taipei, and Hong Kong. Clearly, the lack of quantifiable research data related to shopping orientations of Chinese consumers in general and Malaysia in particular, the rapid growth of the Chinese population segment worldwide and the logic of possible relationships between consumers’ cultural values and shopping orientations all provide justification for the current study.
4. Methods
4.1 Measurements
A survey format was employed and, following the directives of Churchill (1995) and others in the marketing arena, multi-item measures were developed. The questions were organized into three sections as follows:
Chinese cultural values. The Chineseness construct was conceptualized according to the method proposed by Tan and McCullough (1985). Respondents were asked to respond to 20 statements reflective of one’s attitudes toward tradition and Confucian norms. All scales were measured on a 5-point Likert-type scales ranging from 1 (strongly disagree) to 5 (strongly agree). The inventory parallels the AIO inventory; a research measure commonly used in lifestyle research (Wells, 1975).
Shopping orientations. A total of 40 shopping orientation statements was adopted from Consumer Style Inventory (CSI) developed by Sproles and Kendall (1986). This scale was employed in this study because: (1) it was developed with young consumers in mind and (2) it effectively reconciles and summarizes much of the extant research. Respondents were asked to indicate the degree to which they agreed with each statement as a description of themselves as consumers. The statements were measured on a 5-point Likert-type scale (1 = strongly disagree; 5 = strongly agree). The reliabilities of the CSI Scale, according to Sproles and Kendall (1986), ranged from 0.48 to 0.76.
Respondents’ background. To obtain personal background of the respondents, questions regarding their gender, age, religion, faculties and course studied were included in the last part of the questionnaire.
Following the recommendation of Churchill (1995), the survey instrument was pre-tested with 20 undergraduate students to check for possible problems with statement clarity and respondent understanding as well as ability to complete the survey instrument. Participants were encouraged to be very free with their responses, make suggestions for improvement and delineate any difficulties they found. The pilots indicated no serious problems with the survey instrument and minor amendments were made to the questions based on the feedback received.
4.2 Sampling and data collection
The sample for the study comprised of Chinese undergraduate students from one public university at the northeast of Malaysia, majoring in various field of studies. Given the nature of the study, a non-probability (convenience) sampling was chosen. Data collection was conducted in classrooms at the beginning of the class period. Of 150 questionnaires

International Journal of Business and Management November, 2009
57
distributed, a total of 115 responses deemed valid for data analysis, yielding a response rate of 76.7 per cent. This relatively high response rate was attributed to the self-administered approach undertaken in distributing the questionnaires. Table 1 shows the profile of respondents included in the study.
5. Results and Discussion
5.1 Shopping orientation factors
In the first instance, factor analysis (principal components followed by varimax rotation) was conducted on the shopping orientation scale items to reduce the numerous variables to a manageable number of components. Factor analysis is a technique which is used to “reduce a large number of variables to some smaller number by telling us which belong together and which seem to say the same thing” (Emory & Cooper, 1991). Such factors are not single measurable entities but are constructs of a number of other directly observable variables. By factor analysis, these observable variables can be clustered into factors, each reflecting an underlying property, which is commonly shared by a certain group of variables (De Vaus, 2002). It also helps to validate that respondents are able to distinguish between the various variables despite the similarity of the items questioned.
To test the appropriateness of factor analysis, Keiser-Meyer-Olkin (KMO) Measure of Sampling Adequacy and Bartlett’s Test of Sphericity were assessed while the factor analysis was run. The value of KMO statistic was higher than the acceptable limit of 0.50 (Hair, Anderson, Tatham & Black, 1998) and Bartlett’s test was significant, indicating the suitability of data for factor analysis. Items that had a factor loading less than 0.4 on its primary factor and items thathad substantial cross-loading(s) were removed. This resulted in the removal of 11 items. The remaining 29 items were then factor analyzed again. The result shows that the items included in the questionnaire can be grouped in eight factors with eigenvalues ranging from 1.11 to 5.24. The eight-factor solution extracted 62.7 percent of the variance, which satisfies the percentage of variance criterion for social science research (Hair et al. 1998). Table 2 presents the eight retained shopping orientation factors, which are labeled: (a) brand conscious, (b) shopping enjoyment, (c) confused by overchoice, (d) novelty-fashion conscious, (e) quality conscious, (f) shopping avoidance, (g) price conscious, and (h) impulse shopping.
5.2 Reliability of shopping orientation subscales
As documented in Table 2, the shopping orientation subscales generating scores with the highest alpha coefficients were (a) brand conscious (0.77), (b) shopping enjoyment (0.61), (c) confused by overchoice (0.76), (d) novelty-fashion conscious (0.74), (e) quality conscious (0.58) and (f) shopping avoidance (0.66). According to Kerlinger and Lee (2000), these reliability levels are acceptable for the type of research conducted in this study.
5.3 Shopping orientation differences between low- and high-ethnicity groups
To investigate relationships between ethnicity levels and shopping orientations, t-tests were employed. Low- and high-ethnic value groups were established based on the respondents’ Chineseness scores. Chineseness scores were divided into three groups; the middle group was dropped, leaving lowest and highest scores for use in conducting t-tests. t-tests were run to identify differences in shopping orientations between low- and high-ethnicity groups.
The six shopping orientation factors meeting the reliability test (Cronbach’s alpha > 0.5) were included in the t-test analyses (Table 2). Significant differences (p < 0.05) were shown for two shopping orientations, recreational and confused by overchoice, between the low and high attitude groups (Table 3). For both factors, responses of the high attitude group generated low means than responses of the low attitude group. A lower means represents less of the shopping orientation characteristic, whereas a higher mean represents more of the shopping orientation characteristic. These findings suggest that certain shopping orientation constructs are more closely linked with ethnic attitude of Chinese consumers than other shopping orientation constructs.
Consistent with the expectation, it is found that the Chinese who scored highest mean on Chineseness scale (as such they tend to place greater emphasis on traditional values) are less likely to enjoy shopping than those who scored lowest mean on Chineseness scale. One plausible explanation for this finding may come from the view that the Chinese tend to be past-orientated and place greater value on tradition (Yau, 1988). The doctrine of “mean” may also influence the Chinese consumers’ attitudes towards shopping activity. The concept stresses that the Chinese believe in the importance of exercising self-control and not letting oneself go to the extremes. In addition, the concept of “abasement” is also likely to reinforce this more conservative consumption behavior, since this concept tends to make the Chinese perceive “modesty” to be important (Yau, 1988).
The findings that indicate a significant difference in confused by overchoice orientation between high and low attitude groups may be explained in terms of relationship between face consciousness, risk aversion and information search. According to Yau (1988), the Chinese tend to be risk averse and as such they would conduct extensive information acquisition to decrease uncertainty associated with purchases. In addition, making a mistake in purchasing due to confusion by overchoice can be regarded as a loss of “face” to the Chinese consumers and is to be avoided (Kindel,

Vol. 4, No. 11 International Journal of Business and Management
58
1982).
6. Conclusions and Recommendations
Consumers of different ethnic attitude were studied in this research. Of interest here is the traditional attitude of Chinese consumers in Malaysia and its influence on their shopping orientations. The findings suggested that differences in ethnic attitude were found to bring about differences in certain aspects of shopping orientations. The Chinese with high ethnic attitude is less likely to enjoy shopping activities and less likely to experience confusion by overchoice compared to those with low ethnic attitude. This finding tentatively suggests that within the same culture, ethnic attitude segmentation may be useful as the means towards more effective marketing strategies.
As with most studies, this study has limitations that call for caveats in generalizing the findings to a wider context. First, the survey was conducted in a university setting, using a student population sample selected on a convenience basis rather than a probabilistic-based sample. Researchers have raised concerns about the generalizability of student-based findings across the consumer population (Burnett & Dunne, 1986; Park & Lessig, 1977; Szymanski & Henard, 2001). In general, responses of college student subjects tend to be slightly more homogeneous than those of non-student subjects (Peterson, 2001). These sampling issues may influence how students evaluate each construct, and the relationships among constructs. As research with a theoretical nature, the use of college students is supported (Calder, Philips & Tybout, 1981; Peterson, 2001) but caution must be exercised when generalizing findings from this study to the whole population of consumers.
Because this study was an initial effort to link ethnic cultural values and shopping orientations, further investigation of the ethnicity issue as it relates to shopping orientations may be warranted. In addition, there may be other shopping orientations not addressed in the current study that are influenced by ethnicity level; these orientations should be identified and investigated in the future studies. The concept of market segmentation by ethnicity level for ethnic population provides interesting potential for future study because ethnicity is a unique phenomenon believed to be composed of and influenced by various demographic and psychographic traits.
References
Abdullah, A. & Pedersen, P. B. (2003). Understanding multicultural Malaysia: Delights, puzzles and irritations.Petaling Jaya, Malaysia: Pearson Prentice-Hall.
Assael, H. (1992). Consumer behaviour and marketing action (4th ed.). Boston: PWA-Kent.
Burnett, J. J. & Dunne, P. M. (1986). An appraisal of the use of student subjects in marketing Research. Journal of
Business Research, 14(6), 329-343.
Calder, B. J., Philips, L. W. & Tybout, A. M. (1981). Designing research for application. Journal of Consumer Research,
8(4), 197-207.
Churchill, G. A. (1995). Marketing research: Methodological foundations (6th ed.). Texas: The Dryden Press.
Darden, W. R. & Ashton, D. (1974-75). Psychographic profiles of patronage preference groups. Journal of Retailing,
50(Winter), 99-112.
Darden, W. R. & Dorsch, M. J. (1990). An action strategy approach to examining shopping behavior. Journal of
Business Research, 21(3), 289-308.
Darden, W. R. & Howell, R. D. (1987). Socialization effects of work experience on shopping orientations. Journal of
the Academy of Marketing Science, 15(3), 52-63.
Darden, W. R. & Reynolds, F. D. (1971). Shopping orientations and product usage rates. Journal of Marketing Research,
8(November), 505-508.
Department of Statistics Malaysia (2005). General Report of the Population and Housing Census 2000. Kuala Lumpur: Department of Statistics Malaysia.
Durvasula, S., Lysonski, S. & Andrews, J. C. (1993). Cross-cultural generalizability of a scale for profiling consumers’ decision-making styles. Journal of Consumer Affairs, 27(1), 55-65.
De Mooij, M. (2004). Consumer behavior and culture: Consequences for global marketing and advertising. Thousand Oaks, CA: Sage.
De Vaus, D. (2002). Analyzing social science data. London: Sage Publications.
Emory, C. W. & Cooper, D. R. (1991). Business research methods. Burr Ridge, Illinois: Irwin.
Fan, J. X. & Xio, J. J. (1998). Consumer decision-making styles of young-adult Chinese. Journal of Consumer Affairs,
32(2), 275-294.
Gehrt, K. C. & Shim, S. (1998). A shopping orientation segmentation of French consumers: Implications for catalogue

International Journal of Business and Management November, 2009
59
marketing. Journal of Interactive Marketing, 12(4), 34-46.
Hafstrom, J. L., Chae, L. S. & Chung, Y. S. (1992). Consumer decision-making styles: Comparison between United States and Korean young consumers. Journal of Consumer Affairs, 26(1), 146-158.
Hai, S. H. C. (2008). Relationship between the personal values and shopping orientation of Chinese consumers. Asia
Pacific Journal of Marketing and Logistics, 20(4), 381-395.
Hiu, A. S. Y., Siu, N. Y. M., Wang, C. C. L. & Chang, L. M. K. (2001). An investigation of decision-making styles of consumers in China. Journal of Consumer Affairs, 35(2), 326-345.
Hu, X. (1944). The Chinese Concept of Face. American Anthropologist, 46, 45-64.
Kerlinger, F. M. & Lee, H. (2000). Foundations of behavioral research (4th ed.). Stamford: Wadsworth.
Kindel, T. I. (1982). A partial theory of Chinese consumer behaviour: Marketing strategy implications. Hong Kong
Journal of Business Management, 1, 97-109.
Lumpkin, J. R. (1985). Shopping orientation segmentation of elderly consumer. Journal of the Academy of Marketing
Science, 13(2), 271-289.
Lumpkin, J. R., Hawes, J. M. & Darden, W. R. (1986). Shopping patterns of the rural consumer: Exploring the relationship between shopping orientations and outshopping. Journal of Business Research, 14(1), 63-81.
McCraken, G. (1986). Culture and consumption: A Theoretical account of the structure and movement of the cultural meaning of consumer goods. Journal of Consumer Research, 13(June), 71-81.
McCullough, J., Tan, C. T. & Wong, J. (1986). Effects of stereotyping in cross cultural research: Are the Chinese really Chinese? In R. J. Lutz (Ed.), Advances in Consumer Research, 13, 576-578.
Mohd. Salleh, A. H., Teo, B. & Pecotich, A. (1998). Malaysia: Consumer behaviour and the future. In A. Pecotich & C. J. Schultz (Eds.), Marketing and consumer behaviour in East and Southeast Asia. McGraw-Hill Book Co. Australia Pty Ltd.
Moschis, G. P. (1976). Shopping orientations and consumer uses of information. Journal of Retailing, 52(2), 61-70, 93.
Moschis, G. P. (1992). Marketing to older consumers: A handbook of information for strategy development. Westport, Connecticut: Quorum Books.
Moye, L. N. & Kincade, D. H. (2003). Shopping orientation segments: Exploring differences in store patronage and attitudes toward retail store environments among female apparel consumers. International Journal of Consumer Studies,
27(1), 58-71.
Nivision, D. C. & Wright, A. F. (Eds.), (1966). Confucianism in action. Stanford, CA: Stanford University Press.
Ooi, K. G. (1999). Malaysia: World bibliographical series Vol. 12. Oxford: Clio Press.
Park, C. W. & Lessig, V. P. (1977). Students and housewives: Differences in susceptibility to reference group influence. Journal of Consumer Research, 4(4), 102-10.
Peterson, R. A. (2001). On the use of college students in social science research: Insights from a second-order meta-analysis. Journal of Consumer Research, 28(3), 450-461.
Radder, L., Li, Y. & Pietersen, J. J. (2006). Decision-making styles of young Chinese, Motswana and Caucasian consumers in South Africa: An exploratory study. Journal of Family Ecology and Consumer Science, 34, 20-31.
Riggins, S. H. (Ed.). (1992), Ethnic minority media: An international perspective. Newbury Park, CA: Sage.
Rossiter, J. R. & Chan, A. M. (1998). Ethnicity in Business and Consumer Behavior. Journal of Business Research,
42(2), 127-134.
Shaffer, T. R. & O’Hara, B. S. (1995). The effects of country of origin on trust and ethical perceptions of legal services. Service Industries Journal, 15(2), 162-185.
Shamdasani, P. N., Hean, T. K. & Lee, E. Z. C. (2001). Influences on store patronage behavior: A comparison of department and discount stores in Singapore. Journal of Asian Business, 17(2), 63-84.
Shim, S. & Kotsiopulos, A. (1993). A typology of apparel shopping orientation segments among female consumers. Clothing and Textiles Research Journal, 12(1), 73-85.
Shim, S. & Mahoney, M. Y. (1992). The elderly mail-order catalog user of fashion products: A profile of heavy purchaser. Journal of Direct Marketing, 6(1), 49-58.
Siu, N. Y. M., Wang, C. C. M., Chang, L. M. K. & Hui, A. S. Y. (2001). Adapting Consumer Style Inventory to Chinese consumers: A confirmatory factor analysis approach. Journal of International Consumer Marketing, 13(2), 29-47.

Vol. 4, No. 11 International Journal of Business and Management
60
Slowikowski, S. & Jarratt, D. G. (1997). The impact of culture on the adoption of high technology products. Marketing
Intelligence & Planning, 15(2), 97-105.
Sproles, G. B. (1985). From perfectionism to fadism: Measuring consumers’ decision-making styles. Proceedings,
American Council on Consumer Interests, 79-85.
Sproles G. B. & Kendall, E. L. (1986). A methodology for profiling consumers’ decision-making styles. Journal of
Consumer Affairs, 20(2), 267-279.
Stephenson, R. P. & Willett, R. P. (1969). Analysis of consumer’s retail patronage strategies. In P. R. McDonald (Ed.), Marketing Involvement in Society and Economy (pp. 316-322). Chicago: American Marketing Association.
Stone, G. P. (1954). City shoppers and urban identification: Observations on the social psychology of city life. The
American Journal of Sociology, 60(July), 36-45.
Szymanski, D. M. & Henard, D. H. (2001). Customer Satisfaction: A meta-analysis of the empirical evidence. Journal
of the Academy of Marketing Science, 29(1), 16-35.
Tan, C. T. & McCullough, J. (1985). Relating ethnic attitudes and consumption values in an Asian context. In E. Hirschman & M. B. Holbrook (Eds.), Advances in Consumer Research, 12. Provo, Utah: Association for Consumer Research, 122-125.
Vijayasarathy, L. (2003). Psychographic profiling of the online shopper. Journal of Electronic Commerce in
Organizations, 1(3), 48-72.
Visser, E. M. & Du Preez, R. (2001). Apparel shopping orientation: Two decades of research. Journal of Family
Ecology and Consumer Sciences, 29, 72-81.
Voon, P. K. (2007). Education and culture: The “soft” contributions to nation-building. In. P. K. Voon (Ed.), Malaysian
Chinese and nation-building: Before merdeka and fifty years after (Volume 2). Kuala Lumpur: Center for Malaysian Chinese Studies.
Walstedt, J. J. (1978). Reform of women’s roles and family structures in the recent history of China. Journal of Marriage and the Family, 40(2), 379-392.
Wells, W. D. (1975). Psychographics: A critical review. Journal of Marketing Research, 12, 196-213.
Williams, R. H., Painter, J. J. & Nicholas, H. R. (1978). A policy-oriented typology of grocery shoppers. Journal of
Retailing, 54(1), 27-42.
Wong, J. (1986). The concept of ‘face’ in Asian culture: Its implications to marketing. In C. T. Tan, W. Lazer & V. H. Kirpalani (Eds.), Proceedings of the American Marketing Association, June, 183-186.
Wong, W. B. (2007). Nation-building in Malaysia: Lessons from Confucian humanism. In. P. K. Voon (Ed.), Malaysian
Chinese and nation-building: Before Merdeka and fifty years after (Volume 2). Kuala Lumpur: Center for Malaysian Chinese Studies.
Wong, N. Y. & Ahuvia, A. C. (1998). Personal taste and family face: Luxury consumption in Confucian and Western societies. Psychology & Marketing, 15(5), 423-441.
Yau, O. H. M. (1988). Chinese cultural values: Their dimensions and marketing implications. European Journal of Marketing, 22(5), 44-57.
Table 1. The profile of respondents
Characteristics Category n %
Gender Male 45 39.1
Female 70 60.9
Religion Buddhist 95 82.6
Christian 13 11.3
Others 7 6.1
Faculty Management and Economics 45 39.1
Science and Technology 24 20.9
Agro-Technology and Food Science 35 30.4
Maritime and Marine Science 11 9.6
Age Mean 21.37
Standard deviation 0.977

International Journal of Business and Management November, 2009
61
Table 2. Factor analysis of the shopping orientation scale
Items Factor
Loadings
Eigen-
value % of
variance
Factor 1 – Brand conscious ( = 0.77)
The well-known national brands are best for me .691 5.24 9.91%
I prefer buying the best selling brands .669
The higher the price the better its quality .667
The most advertised brands are usually very good choices .652
The more expensive brands are usually my choices .584
Nice department and specialty stores offer me the best products .547
Factor 2 – Shopping enjoyment ( = 0.61)
Shopping is not a pleasant activity to me -.833 2.89 9.57%
Shopping the stores wastes my time -.741
Going shopping is one of the enjoyable activities of my life .707
Its fun to buy something new and exciting .585
I enjoy shopping just for the fun of it .510
Factor 3 – Confused by overchoice ( = 0.76)
The more I learn about products, the harder it seems to choose the best
.795 2.37 9.19%
There are so many brands to choose from that often I feel confused .681
Sometimes its hard to choose which stores to shop .672
All the information I get on different products confuses me .671
Factor 4 – Novelty-fashion conscious ( = 0.74)
I keep my wardrobes up to date with the changing fashions .824 2.14 8.76%
Fashionable attractive styling is very important to me .707
I usually have one or more outfits of the very newest style .703
Factor 5 – Quality conscious ( = 0.58)
Getting very good quality is very important to me .713 1.71 7.46%
I make special effort to choose the very best quality products .611
In general I usually try to buy the best overall quality .587
I take time to shop carefully for best buys .528
I carefully watch how much I spend .504
Factor 6 – Shopping avoidance ( = 0.66)
I shop quickly, buying the first products or brand I find that seems good enough
.852 1.44 5.84%
I make shopping trips fast .744
Factor 7 – Price conscious ( = 0.38)
The lower the price products are usually my choice .776 1.29 5.65%
I look carefully to find the best value for the money .522
Factor 8 – Impulse shopping ( = 0.29)
Often I make careless purchases I later wish I had not .697 1.11 5.28%
I should plan my shopping more carefully than I do .622

Vol. 4, No. 11 International Journal of Business and Management
62
Table 3. Differences in shopping orientation between high- and low-ethnic value groups
Low ethnic valuea High ethnic valueb
t-value pShopping orientations M SD M SD
Brand conscious 2.98 0.87 3.02 0.63 –0.23 0.818
Shopping enjoyment 3.36 0.46 3.04 0.42 2.94 0.004*
Confused by overchoice 3.39 0.52 3.09 0.75 2.16 0.038*
Novelty-fashion conscious 3.14 0.95 2.88 0.72 1.15 0.264
Quality conscious 4.03 0.44 3.83 0.53 1.15 0.124
Shopping avoidance 3.00 0.97 2.96 0.92 1.64 0.870
aRespondents who scored lowest on the Chineseness scale bRespondents who scored highest on the Chineseness scale
*p < 0.05

International Journal of Business and Management November, 2009
63
A Study of on the Job Training Effectiveness: Empirical
Evidence of Iran
Mehrdad Alipour
Assistant Prof. Management Department, Zanjan Branch, Islamic Azad University
Mahdi Salehi (Corresponding author)
Assistant Prof. Department of Accounting and Management, Zanjan University, Iran
Tel: 98-9121-425-323 E-mail: [email protected]
Ali Shahnavaz
Faculty member of Statistic Department, Zanjan Branch, Islamic Azad University
Abstract
Training is essential to the growth and economic well-being of a nation. This need for training pervades all levels of industry, for a national level where a country’s well being in enhanced by training, to each company where productivity is improved, down to the individual whose skills are enhanced and as a result improve their position in the workplace. In other words, Training is one of the most pervasive methods for enhancing individual productivity and improving job performance in the work environment (Goldstein and Ford 2002; Gupta and Bostrom 2006). Training effectiveness must cause behavior change (i.e. skill transfer for job performance), thereby resulting in organizational performance (Goldstein and Ford 2002). The results of this study shows that on the job training is strongly affects to more creativity, achieving organizational objectives and improves work quality.
Keywords: Job training, Effectiveness, Creativity, Iran
1. Introduction
Any organization that wants to succeed, and to continue to succeed, has to maintain workforce consisting of people who are willing to learn and develop continuously. Training and developing human capital is tremendously important in the effective management and maintenance of a skilled workforce. Training is one of the ways of improving organization’s effectiveness. In order to implement right training methods, organization should be aware of the training methods and their effectiveness. Study provides conceptual framework of determining which methods to use when developing training program. Training is widely understood as communication directed at a defined population for the purpose of developing skills, modifying behavior, and increasing competence. Generally, training focuses exclusively on what needs to be known. Education is a longer-term process that incorporates the goals of training and explains why certain information must be known. Education emphasizes the scientific foundation of the material presented. Both training and education induce learning, a process that modifies knowledge and behavior through teaching and experience. The research model described here pertains to both training and education. Therefore, in this document, “training” refers to both processes.
Training is a part of the human resource development, along with the other human resources activities, such as recruitment, selection and compensation. The role of human resource department is to improve the organization’s effectiveness by providing employees with knowledge, skills and attitudes that will improve their current or future job performance. In order to implement the right training methods, the training specialist should be aware of the pros and cons and effectiveness of each training method. Besides, for evaluating training effectiveness, measurement should be done according to the models.
2. Training
The verb “to train” is derived from the old French word trainer, meaning “to drag”. Hence such English definitions may be found as; to draw along; to allure; to cause; to grow in the desired manner; to prepare for performance by instruction, practice exercise, etc. Training can be described as “providing the conditions in which people can learn effectively”. To learn is “to gain knowledge, skill, ability” (King, 1968:125). In view of the sense knowledge refers to the information

Vol. 4, No. 11 International Journal of Business and Management
64
we acquire and place into memory, how it is organized into the structure of what we already know and to our understanding of how and when it is used. Thus knowledge can be seen as three district types; declarative, procedural and strategic (Kraiger and Salas, 1993:311). Declarative Knowledge is a person’s store of factual information about a subject matter. Procedural knowledge is the person’s understandings about how and when to apply the facts hat has been learned. Strategic Knowledge consists of the person’s awareness of what he knows and the internal rules for accessing relevant facts and procedures to be applied toward some goal. Strategic knowledge is used for planning, monitoring, and revising goal-directed activity (Blanchard and Thacker, 1998:6).
Skill is the capacities needed to perform a set of tasks that are developed as a result of training and experience (Dunette, 1976:8). A skill is a proficiency at doing something beyond just knowing what something is about. Abilities have been defined as general capacities related to performing a set of tasks that are developed over time as a result of heredity and experience (Flesihman, 1972:28).
To understand the function of training in a company, it is needed to ask the question of what training is state for the company. Training is an “opportunity” for learning and it is accomplished by providing employees with opportunities to learn how to perform more effectively and by preparing them for any changes in their job. Training focuses on the acquisition of knowledge, skills and attitudes needed to perform more effectively on one’s current job.
Role of training may be seen as “ensuring that the organization has the people with the correct mix of attributes, through providing appropriate learning opportunities and motivating people to learn, and thus enabling them to perform to the highest levels of quality and service” (Bentley, 1990:25). Training must be therefore managed as a frontline business activity. The investment in people, both in developing and maintaining the appropriate skills, becomes a vital part of the organization’s strategy for the future. Like any investment, investment in training should produce an effective and measurable payback. Effective training enhances the knowledge, skills, attitudes and behavior of people and hence their performance.
Training activities and businesses objectives are related to each other as links. Effective training program helps organizations to achieve their objectives. General objectives of training activities are; orienting new employees to the organization and their job, helping employees perform their current jobs well, helping employees qualify for the future jobs, keeping employees informed of changes within the organization, providing opportunities for personal development (Drummond, 1989:165). Here the authors going to briefly explain on the job training.
3. Training methods
Many training techniques are created almost every year by the rapid development in technology. Deciding among methods usually depends on the type of training intended, the trainees selected, the objectives of the training program and the training method. Training is a situational process that is why no single method is right for every situation. While some objectives could be easily achieved through one method, other objectives could necessitate other methods. Many training programs have learning objective in more than one area. When they do, they need to combine several training methods into an integrated whole.
Training methods could be classified as cognitive and behavioral approaches. Cognitive methods provide verbal or written information, demonstrate relationships among concepts, or provide the rules for how to do something. These types of methods can also be called as off the job training methods. On the other hand, behavioral methods allow trainee to practice behavior in real or simulated fashion. They stimulate learning through behavior which is best for skill development and attitude change. These methods can be called as on-the-job training methods. Thus; either behavioral or cognitive learning methods can effectively be used to change attitudes, though they do so through different means. Cognitive methods are best for knowledge development and behavioral methods for skills (Blanchard and Thacker, 1998:277). The decision about what approach to take to training depends on several factors that include the amount of funding available for training, specificity and complexity of the knowledge and skills needed, timeliness of training needed, and the capacity and motivation of the learner.
To be effective, training method should; motivate the trainee to improve his or her performance, clearly demonstrate desired skills, provide an opportunity for active participation by the trainee, provide an opportunity to practice, provide timely feedback on the trainee’s performance, provide some means for reinforcement while the trainee learns, be structured from simple to complex tasks, be adaptable to specific problems, encourage positive transfer from training to the job (Woods, 1995:180).
3.1 Off-The-Job Training Methods
Training which takes place in environment other than actual workplace is called off-the job training. Off-the-job training is usually designed to meet the shared learning needs of a group rather than a particular individual’s needs. Lectures, computer-based training, games and simulations are the common forms of off-the-job training methods.

International Journal of Business and Management November, 2009
65
3.2 On-The-Job Training Methods
The purpose of the on-the-job training session is to provide employee with task-specific knowledge and skills in work area. The knowledge and skills presented during on-the-job are directly related to job requirements. Job instruction technique, job rotation, coaching and apprenticeship training are the common forms of on-the job training methods. Fully on-the-job training theoretically does not involve any off-the-job training. However, it is very rare for 100% of training to take place as part of the productive work of the learner.
Job instruction training is a structured approach to training, which requires trainees to proceed through a series of steps in sequential pattern. The technique uses behavioral strategy with a focus on skill development, but there are usually some factual and procedural knowledge objectives as well. This type of training is good for task oriented duties such as operating equipment. The instructor or supervisor prepares a job breakdown on the job, while watching an experienced worker perform each step of the job. Job instruction technique consists of four steps, preparation, present, try out and follow up (Blandchard and Thacker, 1999:306).
Job rotation is the systematic movement of employees from job to job or project to project within an organization, as a way to achieve various different human resources objectives such as: simply staffing jobs, orienting new employees, preventing job boredom or burnout, rewarding employees, enhancing career development, exposing employees to diverse environments (Woods, 1995:188). Excellent job rotation program can decrease the training costs while increases the impact of training, because job rotation is a hand on experience. Job rotation makes individuals more self-motivated, flexible, adaptable, innovative, eager to learn and able to communicate effectively. One of the possible problems with the rotation programs is the cost, because job rotation increases the amount of management time to spend on lower level employees. It may increase the workload and decrease the productivity for the rotating employee’s manager and for other employees. Job rotation may be especially valuable for organizations that require firm-specific skills because it provides an incentive to organizations to promote from within (Jerris, 1999:329).
Coaching is the process of one-on-one guidance and instruction to improve knowledge, skills and work performance. Coaching is becoming a very popular means of development, and often includes working one-on-one with the learner to conduct a needs assessment, set major goals to accomplish, develop an action plan, and support the learner to accomplish the plan. The learner drives these activities and the coach provides continuing feedback and support. Usually coaching is directed at employees with performance deficiencies, but also used as a motivational tool for those performing well. Coaching methods solve precise problems such as communication, time management and social skills. Executive coaching generally takes place on a monthly basis and continues over a period of several years. Often, coaches are brought in where there is a change in the structure of the company, when a team or individual is not performing well or where new skills are required. Coaching assumes that you are fine but could be even better (Kirwan, 2000).
Apprenticeship is one of the oldest forms of training which is designed to provide planned, practical instruction over a significant time span. Apprenticeship was the major approach to learning a craft. The apprentice worked with a recognized master craft person (McNamara, 2000).
4. Training methods
Bostrom et al. (1988) have identified two specific training methods called the conceptual models and motivational planning and management. Conceptual models are the frameworks for conveying the basic concepts of the system to be learned. They provide a basis for forming mental models. Mental models are mental or internal conceptual representations of the software package (Foley, 1980; Bentley, 1994). They aid users in making inferences about the system, reasoning about it, and guiding actions.
Conceptual models can be classified as the analogical and abstract models. Analogical representations present the system to be learned in terms of another system. For example, a spreadsheet serves as an analogy for a modeling language. Abstract models are synthetic representations of a system. A mathematical model is an example of an abstract model. Structural conceptual models are aimed at developing knowledge about the structure of the system to be learned, while functional conceptual models provide information about how a command can be used.
Motivational planning and management is the recognition of the ways that a trainee can be motivated to learn the system, and to have a high motivation to continue to learn the system after training. The objectives of a motivational planning approach include developing the confidence of success, managing reinforcement, connecting the instruction to important needs and motives, and arousing and maintaining curiosity and attention. This approach should be used before, during and after the training process. Before training, instructors can assess the needs and experiences of trainees, and use this information for motivational management. During training, the goal is to design learning materials and tasks to generate the outcomes proposed. Two broad approaches to the overall design of the training session are called syntactical (traditional) and application training. The syntactical training emphasizes syntax through a specific language related examples and general exercises. The application training focuses on giving the trainees a view of how

Vol. 4, No. 11 International Journal of Business and Management
66
they can solve their own problems using the relevant software. Trainees are asked to bring their problems to work on during training. These approaches may be integrated. For example, application training could be utilized early in training to demonstrate the usefulness of the software for solving trainees' problems.
5. Research objectives, questions and hypotheses
Since the main objective of this study is the degree of effectiveness of on the job training on Iranian managers the below questions were postulated in this study:
Q1: is on the job training improves the degree of managers’ creativity?
Q2: who much on the job training fits with companies’ policy?
Q3: how much caused on the job training to improve personal managers’ ability?
Q4: how much caused on the job training to achieve organizational goals?
Q5: how much caused on the job training to work improvement in company?
According to above questions the research hypotheses are as below:
H1: from managers’ viewpoint training can increase managers’ creativity.
H2: from managers’ view point, training can economical benefits with accord to company policy.
H3: from managers’ view point, training can increase abilities and creativity of managers.
H4: from manager's point of view, training can be very effective in achieving organizational objectives.
H5: from manager's point of view, training can improve work quality.
6. Research methodology
So far, for finding accurate answers to the research questions, Five point Likert’s scale questionnaire was designed and developed among the 120 top managers in Tehran province. Out of 120 questionnaires only 80 usable questionnaires were return. At first time the authors analyses the bio data of participants which shows in Table 1. Out of 80 participants 52 were male and 28 were female. Regarding the age of participants, the majority age of participant stood at 36-45 years old (55 participants, 69 per cent).
Insert Table 1
Regarding experience, least number of participants had lee than 5 years experience (14 per cent); majority of participants had experience between 6-10 years (60 per cent of participants. With reference to educational background in Table 1, 55 per cent of participants had got B.S and associate diploma and master holders stood equal.
The field of the study of participants was another interesting area in this study. As table 1 showed 40 per cent of participants had management field. In is very interesting to note that majority of participants (managers) had field of science and the least per cent of participants had humanities field.
Result analyses
In order to giving correct answers to research questions, the hypotheses of the study are tested in Table 2.
Regarding to the first hypothesis as table showed the null hypothesis strongly rejected and 1H is accepted. In other words, from managers’ viewpoint training with 95% confidence level can increase creativity.
Testing results of the second hypothesis
With regard to above table the second hypothesis is also accepted and null hypothesis is rejected. So according to these results it can say from managers’ view point, training with 95% confidence level can effect on economic accord with company policy.
Insert Table 2
About testing the third hypothesis, as the results of table 2 showed this hypothesis also accepted and it can concluded the rejection of null hypothesis.
So, from manager's point of view, training with 95% confidence level can increase abilities and creativity of managers.
As before claimed the fourth hypothesis is: from manager's point of view, training can be very effective in achieving organizational objectives.
With reference to the results of Table 2 it shown that this hypothesis is also accepted and null hypothesis is rejected; so, from manager's point of view, training with 95% confidence level can be very effective to achieving organizational objectives.

International Journal of Business and Management November, 2009
67
Regarding the testing of the last hypothesis, as it clear in the above table this hypothesis also strongly accepted and null hypothesis is rejected, so it can concluded that from manager's point of view, training with 95% confidence level can be improve work quality.
7. Conclusion
Training is a substantial organizational investment getting a satisfactory return on investment means linking the training function and activities to the company’s overall business activity. The investment in people, both in developing and maintaining the appropriate skills, is vital part of the organization’s strategy for the future. Like any investment, investment in training should produce an effective and measurable payback. Effective training enhances the knowledge, skills, attitudes and behavior of people and hence their performance. The improved performance of individuals leads directly to profit. Such a payback can be rapid and significant, yet it is rarely measured or presented in financial terms.
If an organization wants highly motivated, up to date, creative and productive workforce, they need to start and build a strategy for the future. This strategy has to recognize that corporate performance is totally dependent upon the performance of the organization’s people. This leads to a clear commitment to invest in these people through training. The results of this study showed that on the job training has positive affect on managers’ creativity, achieving organizational objectives, economical benefits. With such advantages that training dedicates to organizations, any organization those have high ambitions, have to conduct such training for achieving those benefits.
Organization which implements training gives emphasis on; what percentage of employees have individual challenge, growth and learning plans, the number of hours of training that the average worker gets each year.
A training program is not complete until you have evaluated methods and results. A key to obtaining consistent success with training programs is to have a systematic approach to measurement and evaluation. Recognition of the training methods and measurement techniques are crucial for the organization’s training success.
References
Bentley T. (1990). The Business of Training, 2nd edition, McGraw Hill Book Company, New Jersey.
Bentley, T. (1994). Facilitation: Providing Opportunities for Learning. London: McGraw Hill.
Blanchard P.N and j. W Thacker. (1998). Effective Training: Systems, Strategies and Practices, Prentice Hall, New Jersey.
Bostrom, R. P and C, Brown. (1994). Organizational designs for the management of end-user computing: Reexamining the contingencies. Journal of Management Information Systems. Spring, 10 (4), pp.183-211.
Drummond K. E. (1989). Human Resource Management for the Hospitality Industry, Van Nostrand Reinhold, NY.
Dunette M. (1976). Aptitudes, Abilities and Skills, Randy Macnally, Chicago.
Fleishman E. (1972). On The Relation between Abilities, Learning and Human Performance. American Psychologist,Vol. 27, p. 1017
Foley, J. R. and R. A. Clifton. (1990). Locus of control, organization climate, and participation in staff development: A study of college instructors. The Canadian Journal of Higher Education, 20 (2), 45- 59.
Goldstein, I.L., and J.K. Ford. (2002). Training in Organizations: Need Assessment, Development, and Evaluation,(fourth ed.). Wadsworth.
Gupta, S., and R.P. Bostrom. (2006). End-User Training Methods: What We Know, Need to Know, ACM.
Jerris, L. A. (1999). Human Resources Management for Hospitality, Prentice Hall, New Jersey.
Kind, D. (1968). Training within the Organization, Cox & Wyman Ltd.
Kirwan, T. H. (2000). Coaching Champion, Management Today, November.
Kraiger, F and E. Salas. (1993). Application of Cognitive, Skill based and Affective Theories of learning Outcomes to New Methods of Training Evaluation. Journal of Applied Psychology, Vol. 78, No. 2, pp. 42-56.
Mcnamara, C. (2000). Various Ideas for Learning Activities and Documentation Results. [Online] Available: www.mapnp.com
Woods, R. (1995). Human Resources Management, AHMA, Michigan.

Vol. 4, No. 11 International Journal of Business and Management
68
Table 1. Bio data of participants
Variable Item Frequency Percentage
Gender Male 52 65%
Female 28 35%
Age
Below 35 12 15%
Between 36-45 55 69%
Above 46 13 16%
Experience
Less than 5 years 11 14%
Between 6-10 years 48 60%
More than 11 years 21 26%
Educational Background
Associate diploma 18 22.5%
B.S 44 55%
M.S 18 22.5%
Field of the study
Management 32 40%
Science 40 50%
Humanities 8 10%
Table 2. Results of testing hypotheses
Hypotheses Average Mode S.D T- Test Sig. Result
First hypothesis 3.86 4 0.808 7.523 0.000 Accepted
Second hypothesis 3.60 4 1.06 3.969 0.000 Accepted
Third hypothesis 3.80 4 0.904 6.261 0.000 Accepted
Fourth hypothesis 3.61 4 0.857 4.95 0.000 Accepted
Fifth hypothesis 3.74 4 0.751 6.97 0.000 Accepted

International Journal of Business and Management November, 2009
69
Review of Ecology-Based Strategy Change Theories
Dan Su
School of Business Administration, Southwestern University of Finance and Economics
Chengdu 611130, China
E-mail: [email protected]
Abstract
Researches on strategy change theories are sorted into two schools, namely the content school and the process school. Research methods include the organization adaptability method and the ecology method. In perspective of organizational ecology, this paper reviews representative literatures about strategy change theories and summarizes relevant research methods in this field, with the hope of evaluating the advantages and disadvantages of different research methods. In order to perfect the theory, this paper suggests an integrated research on complexity theory and ecology strategy change theory. Finally, this paper advances two development trends for the research on strategy change, with the hope of supplying a direction for management scholars’ future research.
Keywords: Strategy change, Ecology, Complexity theory
1. The concept of strategy change
Strategy management scholars usually sort strategy change into tow schools, namely the content school and the process school (Amburgey, Kelly & Barnett, 1993; Ginsberg, 1988; Meyer, Brooks & Goes, 1990; Rajagopalan & Spreitzer, 1996; Shortell, 1989). The content school chiefly studies strategy change’s motives and results. The analyses are based on amounts of corporation samples and statistical data. The process school takes strategy change as a process of strategy constitution. They focus on the role of leaders in the process of strategy change (Rajagopalan & Spreitzer, 1996).
Traditionally, most scholars think that strategy change happens frequently. It is triggered in a simple and flexible manner. They suppose the enterprise strategy is always in accordance with industrial environment. In other words, once environment changes, strategy must change in time (Smith & Grimm, 1987; Zajac & Shortell, 1989). In traditional strategy management, it is widely accepted that if enterprise strategy does not change along with the change of environment, the effect of organization will suffer from losses. As environment changes, the enterprise that adopts strategy change performs better than that not (Smith & Grimm, 1987). There is an implicit assumption: strategy change will improve corporate performance by all means. So, we think that traditional strategy management holds an optimistic attitude to strategy change. However, is it the truth?
By researches we find that there are more failure cases than success cases in strategy change field in recent years. It indicates that strategy change’s motives and results, differing from the traditional idea, are not easier. Significant changes of environment re-shape the industry and the border of enterprises. Driven by consumers’ needs and technological progresses, the globalization has great impacts on all industries. Managers and scholars name the sharp change as “hypercompetitive” (Ilinitch, D’Aveni & Lewin, 1996). In a hypercompetitive environment, we should study strategy change from a new perspective.
2. The strategy change theory in perspective of ecology
In late 70s, a new management study perspective, organizational ecology view, appears (Aldrich, 1979; Carroll, 1984; Hannan & Freeman, 1977). Strategy management scholars introduce this view into researches on strategy change. Compared with traditional researches on strategy change, the ecology- based theory emphasizes on the effects of environmental changes on strategy change. Hannan and Freeman (1977) think that traditional organizational theory exaggerates the possibility degree of individual organization’s basic evolvement. They argue to emphasize on similar organizations, namely “population”, instead of one organization. In biology, Darwin (1859) tells us that the evolvement process is based on species or population. In evolvement process, the gene diversity in one population will be adjusted by popularization and procreation. And gene frequency changes accordingly. Therefore, along with changes of environment, all units in one population must adapt to new environment. Here, the “adaptability” is a repetitive evolvement process. So, the organizational ecology-based strategy change theory mainly discusses how species and population adapt to new environment. In other words, it studies how organizations evolve and survive from a “hypercompetitive” environment.

Vol. 4, No. 11 International Journal of Business and Management
70
This paper argues that the core of strategy change theory based on sharp environmental changes can be described by the “niche” concept. The niche is a set of environmental conditions in which a population can live and multiply. In other words, the niche includes a series of environmental conditions that make a population grow or survive. In organizational ecology, the niche means the set of relative conditions including the society, economy, and politics that are necessary for organizations’ survival and growth (Min Luo, 2001).
In ecology-based strategy change theories, the most representative theory is the structural inertia model advanced by Hannan and Freeman (1984). This theory agrees that an organization’s strategy is the “core competence” of the organization. The primary principle of the model is: an enterprise’s internal pressure tends to prevent sharp changes of present strategy. In other words, organizational ecology scholars regard strategy as a stubborn tradition with inertia (Freeman and Boeker, 1984). They think that once the strategy is established, organizational leaders would not like to deviate from it (Robbins, 1990). Under this environment, corporate leaders are usually taken as being negative or symbolic (Pfeffer and Salancik, 1978). Because an enterprise’s top managers often face internal enterprise pressures and external environment pressures, these pressures restrict their abilities of reforming the strategy. However, Weick and Starbuck think that no matter how sharp the external environment changes are, changes are reflected by managers’ recognition. They lay stresses on managers’ initiative behaviors in perspective of managers performing environment analysis. Here, we should not think that the ecology theory completely denies the influences of organizational top leaders and top managers on the strategy. Lots of enterprise cases show that organizational leaders and top managers have stronger initiatives for the execution of stategy as they determine to start a new commercial activity (such as develop new business) (Freeman and Boeker, 1984).
As for the effect of strategy change, organizational ecology scholars think that although corporate managers can make strategy change sometimes, and maintain the adaptability to environment, the strategy change is usually slower than environmental change. Then, in the process of strategy change, the risk for the die of enterprise is higher (Amburgey et al., 1993; Hannan & Freeman, 1984, 1989; Haveman, 1992). According to the structural inertia theory, any change (such as strategy change) related with the core competence is extremely difficult. Therefore, in the process of strategy change, it may destroy the original organization system, disturb the connections of former interest-related parties, and decrease the efficiency and effect of the organization. Furthermore, it may lead to the decline of organizational performance, which will affect the survival of the organization in a short period at least (Baum and Amburgey, 2002, p310; Hannan and Freeman, 1984, 1989; Haveman, 1992, p48).
Although the change of core competence, such as strategy change, means higher risks, the reform of enterprise is necessary under the “hypercompetitive” environment (Baum & Aburgey, 2002; Haveman, 1992; Haveman, Russo, and Meyer, 2001). Organizational ecology scholars also regard ecological density as important factors influencing strategy change. They think that the high-density industry can worsen the competition and the fierce competition will enhance all enterprises’ strategy differentiation (Hannan and Freeman, 1989). Scholars think that it is difficult for enterprises development their products and services (change traditional strategy, develop new strategy and new business) in high- density industries. In contrast, in a low-density environment, it is more possible for organizations occupying higher market shares by adjusting strategy (Boeker, 1991).
Besides, Hannan and Freeman (1984, 1989) think that according to the structural inertia model, the influencing factors of strategy change associate with not only the environment but also organizations’ internal factors. For example, organization’s age, size, and structural complexity connect with barriers of organizational strategy change.
As for organizational age, some scholars think that an organization can form an inherent institution and tradition in a long-term management and build a stable relationship with interest-related parties. Therefore, they think there is a monotone increasing relationship between strategy inertia and organization age (Ginsberg and Buchholtz, 1990; Hannan and Freeman, 1984). Therefore, as for adjusting competition strategy to adapt to environment needs, aged enterprises suffer from more restrictions. That is the age rigid assumption. However, some researchers point that aged, large-sized, and more complicated organizations may perform strategy change with higher possibilities. Just what is said by Boeker, because environmental changes need time, aged organizations have more experiences in dealing with environmental changes. “Aged” organizations will face more pressures as they change the original strategies. So, they prefer to adjust their strategies continuously in order to adapt to the changeable environment needs (Carroll, 1983). That is the so-called age flexibility assumption.
Researches on organization size result in a contrary conclusion either. In lots of researches, there is a positive correlation between organizational size and strategy change (Chatterjee and Wernerfelt, 1991; Haveman, 1993; Zajac and Kraatz, 1993; Barker and Duhaime, 1997; Zajac, et al., 2000; McDonald and Westphal, 2003; Washington and Ventresca, 2005). Therefore, these empirical studies serve as basis for size flexibility assumption (similar to the age flexibility assumption mentioned above). However, in other studies, there is a negative correlation between size and strategy change (Mitchell, 1989; Zúñiga- Vicente, et al., 2005). These empirical studies serve as basis for the size rigid assumption. Furthermore, some studies support both assumptions at the same time (Baum and Korn, 1996). Surely,

International Journal of Business and Management November, 2009
71
some researches show that there is not a strong relationship between organizational size and strategy change (Ginsberg and Buchhloltz, 1990; Kelly and Amburgey, 1991; Aldrich, et al., 1994; Amburgey and Dancin, 1994; Haveman, et al., 2001).
Finally, Baum and Aburgey (2002) think that a complete organization change concept must take the organization’s “history of change” into consideration because an organization tends to repeat its former change mode. In a sense, as an organization repeats its former change mode, we name this influencing factor as “organizational momentum” (Amburgey et al., 1993; Baum, 1996; Baum and Amburgey, 2002; Kelly and Amburgey, 1991; Miller and Friesen, 1984).
3. The complexity theory
Although this paper agrees that the strategy change theory that is based on organizational ecology is more practical than traditional theories, this theory has its defects. Organizational ecology is based on the natural selection theory, which is from Charles Robert Darwin’s evolutionism. The evolutionism regards natural selection as the only engine for biological evolution, neglecting the possibility of complex system generating orders spontaneously. Therefore, this paper argues to introduce the complexity theory to complement the organizational ecology-based strategy change theory.
The complexity system theory regards the organization system as a swarm system. The so-called swarm system is an organic system that has life and can think. The system is self-organized (Bonabeau and Meyer, 2001). The complexity pattern thinks that evolvement of an organization and its operational model is under the influences of external environment, which is a natural selection process and associates with organizational biological system’s internal components and factors’ mutual relationship and interaction. The evolvement of an organization and its operational model is the result of natural selection and self-organization (Min Luo, 2006).
So we agree that enterprise’s strategy change is a complex organizational behavior. Organizational strategy change is driven by the self-organization power generated by the interaction of external organization sources and organization’s internal learning. The so-called “self-organize” refers to a process in which things become organized or ordered spontaneously. In other words, the self-organized system organizes, survives, evolves, innovates, and develops by itself without depending on external orders. It is a process from disorder to order. Under this circumstance, strategy change behavior includes not only transformation of enterprise’s resource capabilities but also changes of organizational learning (Ancheng Pan, 2007). Macintosh and Maclean use the complexity theory to re-explain the motives for corporate strategy change. Robertson thinks that the self-organized process can help enterprise to improve the strategy change and adapt to changes of internal and external environment. Apparently, the complexity theory and the self-organize concept consider the influences of “hypercompetitive” environment and the initiative evolvement of organization. Therefore, to introduce the complexity theory into the research on strategy change theory is a right theoretical complement.
4. Conclusion and prospect
Today, the border of organizations tends to be fuzzier in the “hypercompetitive”. The high failure rate of corporate strategy change arouses more thoughts on present strategy change theories. From analyses above, we know that there are also some paradoxes in the ecology-based strategy change theory. That is a difficulty in the research on strategy change. Here we should treat these paradoxes in perspective of contingency. We can classify enterprises according to different environments and backgrounds in researches. Then, the paradox becomes classification. Some scholars have already sorted the strategy change based on two dimensions, namely “mission prospect” and “industrial environment”, and advanced a dominant logic matrix for strategy change (Xu Huang, 2004).
Besides, researches on the complexity of strategy change are short of support from empirical data. Therefore, we can predict that considerable empirical research methods and cases will appear in this field. For developing countries and regions, the empirical research on Chinese enterprises’ strategy change since the reform and opening-up policy is valuable. Compared with conditions in developed countries, the market environment and relevant laws in developing countries change frequently, so do enterprises’ strategy change and adjustment, especially for small and medium-sized enterprises. It will be a hot in the empirical researches on strategy change in the future.
References
Amburgey, T. L., Kelly, D. & Barnett, W. P. (1993). Resetting the clock: The dynamics of organizational change and failure. Administrative Science Quarterly, 38, 1.
Baum, J.A.C. & Amburgey, T. L. (2002). Organizational Ecology. In Baum, J. A. C. (Ed.). Companion to Organizations.
Freeman, J. & Boeker, W. (1984). The ecological analysis of business strategy. California Management Review, 26, 3.
Ginsberg, A. & Buchholtz, A. (1990). Converting to for-profit status: Corporate responsiveness to radical change.

Vol. 4, No. 11 International Journal of Business and Management
72
Academy of Management Journal, 33, 3.
Hannan, M. T. & Freeman, J. (1977). The population ecology of organization. American Journal of Sociology, 82, 5.
Hannan, M. T. & Freeman, J. (1989). Organizational Ecology. Cambridge, MA: Harvard University Press.
Haveman, H. A. (1992). Between a rock and a hard place: Organizational change and performance under conditions of fundamental environmental transformation. Administrative Science Quarterly, 37, 1.
Huang, Xu. (2004). Framework of dominant logic analysis for business strategic transformation under uncertainty environment. China Industrial Economy, No.11.
Ilinitch, A. I., D’Aveni, R. A. & Lewin, A. Y. (1996). New organizational forms and strategies for managing in hypercompetitive environments. Organization Science, 7, 3.
José David Vicente-Lorente & José Ángel Zúñiga-Vicente. (2008). Global Management: Strategy, Challenges, and
Uncertainties. Nova Science Publishers.
Kauffman S A. (1995). At Home in the Universe: the Search for the Laws of Self2Organization and Comp Lexity [M].New York: Oxford University Press.
Luo, Min. (2001). Population ecology: population adaptability organization theory. Foreign Economics & Management,No.10.
Luo, Min. (2006). On new pattern of organizational theory. Science Research Management, No.3.
Meyer, A. D., Brooks, G. R. & Goes, J. B. (1990). Environmental jolts and industry revolutions: Organizational responses to discontinuous change. Strategic Management Journal. No.11. special issue. summer,
Pan, Ancheng. (2007). Effects of strategic choice, organizational adaptation on firm growth: An empirical study in China. Journal of Management Sciences, No.20.
Rajagopalan, N. & Spreitzer, G. M. (1996). Toward a theory of strategic change: A multilens- perspective and integrative framework. Academy of Management Review, 22, 1.
Robertson A. (2004). The comp lexity of the corporation. Human Systems Management, 23.
Smith, K. G. & Grimm, C. M. (1987). Environmental variation, strategic change and firm performance: A study of railroad deregulation. Strategic Management Journal, 8, 4.
Zajac, E. J. & Shortell, S. M. (1989). Changing generic strategies: Likelihood, direction, and performance implications. Strategic Management Journal, 10, 5.

International Journal of Business and Management November, 2009
73
A Study of the Performance of Public Transport Company
in Niger State, Nigeria
AWOREMI, JOSHUA REMI
Department of Management Science, Ladoke Akintola University of Technology
P.M.B. 4000, Ogbomoso, Nigeria
Tel: 234-8033-967-307 E-mail: [email protected]
ABDUL-AZEEZ, IBRAHEEM ADEGOKE
Department of Business Administration and Management Technology, Lagos State University
P.M.B. 0001, Lasu Post Office Ojo, Lagos, Nigeria
Tel: 234-7036-555-582 E-mail: [email protected]
OLAOGUN, O. B.
Department Of Management Science, Ladoke Akintola University of Technology
P.M.B. 4000, Ogbomoso, Nigeria
Tel: 234-8035-244-446
Abstract
This paper evaluates the variables that tend to determine the level of performance of Public (Government – owned) transport companies in Niger state of Nigeria. It identifies the variables that are influencing and/or determining the performance of public transport company in the study area. This study was carried out in Minna, the administrative seat of Niger State, Nigeria. The selection of this state is based on the preponderance of Public Transport Company in the area. For the purpose of this study, the entire management and/or operators of public transport company in Niger State, Nigeria constituted the population of the study. The public (government- owned) transport company in the study area was selected and some key officials both senior and junior spectra were purposively selected for data collection. Structured questionnaires and interview techniques were adopted for data collection. A total of forty six (46) out of sixty (60) questionnaires (that is, about 77 percent response rate) were collected and found analyzable: The result of the findings showed that, of the three functional forms of Ordinary Least Square (OLS) method of regression analysis fitted, linear function was chosen as the lead equation based on the R², t and f- values. It was found out that cost of maintenance had coefficient of 1.999 and the coefficient is significant at 5% level while organization structure is also significant at 10% level.
Keywords: Mileage, Peak Demand, Profitability, Public transport, Mass transit
1. Introduction
Public sector bus enterprises in Nigeria are either owned by Federal, State or Local government. Prior to the introduction of the Mass Transit Programme in 1988, public sector involvement in urban passenger transport services was very negligible. The first generation of public sector bus operators came into existence shortly after Nigeria’s political independence. These include the Ibadan City Bus Service, which collapsed in 1976 (Adeniji, 1983). Many more of state-owned bus transport undertakings established in early 1970s collapsed in the second half of 1970s and early 1980s. These included Kano State Transport Corporation (operating then as Kano Line), Kwara Line and Plateau State Transport Corporations among others. Some of the reasons identified for their collapse included; financial impropriety, inadequate government financial support, lack of qualified staff to man their operations, political interference, and uncontrolled competition from paratransit operators (Adeniji, 1983). The few municipal bus undertakings that survived until 1988, when the mass transit programme was introduced, included Water Line, Bendel Line, Borno Express, Kaduna State Transport Authority and the Lagos State Transport Corporation (LSTC), although many of them were actually running skeletal service at that time (Adesanya, 2002.a).

Vol. 4, No. 11 International Journal of Business and Management
74
The public sector involvement in public transport is not strictly restricted to the provision of road passenger services; the Nigerian Railway Corporation provides rail services while the Lagos State Ferry Corporation and the Federal Inland Waterways Department (IWD) of the Federal Ministry of Transport were involved in the provision of ferry services. The ferry operations of the IWD were later transferred to the Federal government owned Central Water Transport introduced since 1988 have either shrunk considerably or are no longer available. For example, the Ibadan Metropolis rail service has completely collapsed and even the mass transit rail service in the Lagos metropolis is only managing to survive.
Since 1988, virtually every state government in Nigeria has established its own transit undertaking. Local governments are also increasingly involved in the provision of public transport services. While, state and local government public transport undertakings are relatively more organized, the most of the private sector operators are largely unorganized and depend more on fare revenues and financial supports from informal sources such as friends, relatives, money lenders in order to finance their operations (Adesanya, 2002.b).
Many governments owned mass transit companies in Nigeria have better trained staff, workshops and maintenance facilities than most of private sector operators. Their services are often provided on fixed routes, and are usually cheaper than those provided by private sector operators. Most government owned bus undertakings have bus service schedules or time tables, but in practice they are seldom followed because of the inadequacy of vehicles, declining fleet utilization rates, growing competition with private and paratransit operators, poor traffic management, congestion problems especially during peak travel periods and other problems associated with the operating environment (Umar, 2003).
2. Literature review
State’s Involvement in Transport Development in Nigeria
Prior to the advent of motorized means of transport in Nigeria for the purpose of inland transportation, at the eve of the twentieth century, most movements were made along footpaths and bush tracks. In the savanna region, people were able to tame horses and donkeys for their movement needs, while those in the forest region relied more on human porter age, in the movement of freight. Logs, rafts, calabash and small dug out boats were also used across rivers, creeks and lagoons for moving passengers and freight (Walker, 1959 and Mabogunje, 1968). The Trans-Saharan trade routes also provided the links between Nigeria and the Mediterranean region for several centuries and the network footpaths that connected the urban centres of Yoruba land (Mabogunje, 1968). The sea voyages and explorations of the West African coastline, starting from the fifteenth century, made it possible for the Portuguese explorers to reach the Bight of Benin in 1485 (Burns, 1942). Since then, direct contact between Nigeria and other parts of the world by the sea route had widened, while the trans-Saharan trade routes declined in importance, to the point of total disappearance.
When the colonialists took up the reins of government in Nigeria, inadequate transportation facilities constituted a serious handicap. This was in spite of the fact that the colonial administration required a fast and efficient transport system to traverse a territory, whose Northern boundary was about 1200 kilometers away from the Atlantic coast and about 1400 kilometers across at its widest area, in order to establish effective occupation of the territory (Mabogunje, 1968). Consequently, the colonial government began the construction of the western rail line, from Lagos, in 1898. The eastern line was also constructed, starting from Port Harcourt, through Enugu to Kaduna, while branch lines were later laid to Kaura Namoda, Baro, Nguru and Idogo (Jakpa, 1981). The development of the railways accentuated the expansion of the city along sector pattern. A notable development at this stage was that of special nuclei along the hedges, which is the result of the decentralization of the functions of the Central Business District (CBD) and the creation of minor ones such as state and / or local governments. Hence, impact of the state has been felt more in the area of bus service delivery, rather than freight haulage. However, when compared with private sector involvement, public sector involvement in the direct provision of urban bus services still remains insignificant. The public involvement dates back to the easily 1930s when the native authority in Kano provided bus services around the city. Later on, the Lagos City Council set up the Lagos Municipal Transport Service (LMTS) in 1958, while the Ibadan City Council started the City Bus Service in 1964. This was later operated as a joint venture with the Oyo State Government (Adeniji, 1983a and Adeniji, 1983b). In the early 1970s, there was, for the first time, more public sector involvement in the running of both intra-urban and inter-urban bus services. Several state governments established their own bus undertaking, which included Bendel Line, Kaduna State Transport Authority, Kwara Line, Water Line, Lagos State Transport Corporation, North East Line, Plateau State Transport Corporation, among others (Adeniji, 1983a; Filani, 1991 and Adesanya, 1994). Unfortunately, most of them collapsed by the late 1970s or early 1980s.
The introduction of the Urban Mass Transit Programme in 1988 by the Federal Government due to the serious urban mobility crisis, occasioned largely by the depressed Nigerian economy, created a situation in which virtually all state governments established their own bus undertaking for direct bus service delivery (Bolade, 1989 and Adesanya, 1994). With respect to road freight services, the road haulage industry is entirely dominated by the private sector. Although in

International Journal of Business and Management November, 2009
75
the early 1980s, the Federal Government established the National Freight Company, to compete with private haulers. Unfortunately, its operating and financial performance led to its dissolution in the mid 1980s.
The involvement of the state in direct transport service delivery is not limited to the road transport sector. The state got involved even in Air transport. For example the Nigeria Airways limited was establishment in 1958 in partnership with Elder Dampster Lines, and British Overseas Airways Corporation (BOAC) in 1961, made the Nigeria Airways a wholly state owned corporation (Ogunjumo, 1992 and Fejoku, 1996). However, the Federal, State, Local Governments of Nigeria was much involved in road transport than in other modes.
2.1 Urban Mass Transport Operations in Nigeria
The urban transportation problem arises principally because of high concentration of population, economic activities, and educational and social facilities in relatively small areas, particularly with poor land use planning. These activities generate demand for transport services far in excess of supply of such services (Bolade, 1993). Arising from this, the Federal Urban Mass Transit Agency (FUMTA) was established in 1988 as Government response to the mobility crisis arising from the gross inadequacy of the various modes of public transportation in virtually all the urban centres in the country. With the adoption of Structural Adjustment Programme in 1986, the cost of procuring vehicles, spare parts and fuel rose astronomically, to the extent that many car owners abandoned their cars and the demand for public transportation increased (World Bank, 1990). On the side of the transport operators, there was an equally rapid decline in the acquisition of new buses and the few buses that were available could not cope with the demand problem above. The rail system could not help much because the NRC was ill equipped for urban mass transportation. Ferry services in the riverine areas could not help because it only existed in Lagos and Port Harcourt. It is sad to note that none of the major cities had an effective traffic management system, thus, the Task Force on Urban Mass Transit was therefore established in January 1988 to ameliorate the frustrations and hardships being experienced by workers and communities in all the major cities. This was backed up by a proposed budget of N700 million for implementation of various urban mass transit projects. The report of the task force, which was presented on March 4, 1988, contained recommendation on programs and projects designed to relieve the situation and institutional machinery for implementation. A Mass Transit Implementation committee was formed on late March under the chairmanship of the then Minister of Transport. The committee was dissolved in September 1988 and a sole Administrator was appointed to continue with the implementation process under the Federal Urban Mass Transit Programme (FUMTP, 1989).
The 1988 Federal Government intervention further drew inspirations from such federally organized nations like Federal Republic of Germany and the United State of America. In these later countries, the development of strategic urban heavy transit system such as the metro lines, bus ways, and public transport improvement measures in the bigger metropolis are often financed with Federal grants (Bolade, 1993).
Similarly, operating subsidies on some of the systems are granted annually by the Federal, State and Local Government equipment on the basis of some defined parameters.
Suffice it to say that the Federal Government interventionist activities over some time and through FUMTA were categorized into four groups as follows:
(i) Facility Support and Infrastructural Improvement Project
At the commencement of the FUMTA’s programme, the State-owned transit companies formed in the then 21 States and Abuja, and later 30 States with the creation of 9 additional states in 1991, and 6 more states in 1996, were the target groups for improving the public transport at the State and Local levels. Thus for the smooth take-off and/or growth, FUMTA has been offering grant-aided facilities in the form of maintenance; workshop equipments; mobile workshop and tools; traffic improvement measures. In the case of Lagos; construction of coastal jetties and inter-state terminus at some regional urban centres; and institutional support and training were also supported.
(ii) State-owned Mass Transit Schemes
This involved a programme of injecting of over 2000 Federal Assisted Buses into the public transport service network. About 85% of those buses were given to the state-owned companies under concessionary loan conditions (including no payment of advanced deposit, payment of cost of buses over 3-5 years of 3-6% gross interest rates). The balance of 15% was allocated in the form of grants to Federal Colleges, Universities and other Tertiary Institutions and specialized Agencies, (Filani and Abumere, 1993).
2.2 Operational Costs of Public Transport
The operational costs of public transport are determined by a number of variables. In the bus industry, operating cost can be related to three main variables.
(a) Time: Interest payments on capital, depreciation. Management and wage payments are related to the passage of time rather than mileage operated or seats provided.

Vol. 4, No. 11 International Journal of Business and Management
76
(b) Mileage: Fuel, tyres and some maintenance cost are related to mileage directly
(c) Peak Demand: Changes in peak provision created needs for changes in the number of vehicles, crews etc. these in turn affect depreciation, depot costs, wages and salaries.
It is necessary for revenue and costs to be apportioned to individual routes in order to establish route profitability and thereby facilitate optimum vehicle utilization. The allocation of cash revenue to individual routes is generally straight forward, being derived from waybill analysis. However, the increasing use of journey tickets does present a problem in the allocation of revenue and number of passengers carried on such tickets Electronic Monitoring equipment is a viable, but such a level of sophistication in not always appropriate in developing countries and the revenue from journey tickets can usually be allocated with acceptable accuracy using sampling methods. The allocated of costs is less straightforward than the allocated of revenue following traditional practices. Even today it is not uncommon for route profitability to be assessed on the basis of comparing average revenue per kilometer with the average total cost per kilometer. This crude approach takes no account of the fact that in the short term certain costs are fixed and that others are variable in relation to factors other than kilometers.
For route costing purposes, it is necessary to split total cost between those costs that are related to the number of kilometers operated (e.g. capital costs and licensing) and overheads. In those organizations where crews are paid on the basis of hours worked, there will be a fourth category of costs, that is those related to hours operated.
Costs are not a function of only one factor. Maintenance costs, for example, although principally related to kilometers operated, are to a lesser extent also a function of vehicles owned and have to be apportioned accordingly, often on the basis of best estimates. Analysis of route revenue and costs as described enables the traffic department to plan the utilization of vehicles so as to maximize the contribution to fixed costs and to obtain short run profit maximization only in the long run. When all costs become variable, it does become appropriate to consider profitability in terms of total revenue against total costs.
Finally, in Nigeria, it is very difficult for some public transport operators to acquire spare parts for operational use. Also the prices of other operational inputs like tyres, tubes, fuel and lubricants have risen so rapidly over the years that some private public transport companies had difficulty in coping. The prices of some of these inputs have risen above 5000% within a period of ten years. For example, tyres for midi-buses rose by 913% from 1991-2000, while prices of petrol, diesel and engine oil (drum) rose by 3142.9%; 5714.3% and 1050% respectively, over the same period of 1991 to year 2000 (Aworemi and Ogunsiji, 2004).
3. Research methodology
This study was carried out in Minna, the administrative seat of Niger State, Nigeria. The selection of this state is based on the preponderance of Public Transport Company in the study area. For the purpose of this study, the management and/or operators of public transport company in the State constituted the population of the study. The public (government owned) transport company in the area and some Key officials, both senior and junior staff were purposively selected for questionnaire administration. A total of sixty (60) copies of questionnaire (that is, 77 % response rate) were analyzable.
For the purpose of this study, the collected data were analyzed using multiple regression technique whereby the variance in the independent variables is explained by a set of predictors at the same time, gives which of the set of predictors is the most important in explain the variance.
The research involved working with the independent variables of years of establishment of the corporation (X1), Cost of maintenance (X2) government policies on importation of spare parts (X3), total number functioning vehicles (X4), state of the roads and its networks (X5) effect of exchange rate (X6), effect of paratransit (X7), staff strength (X8) and organizational structure/managerial factors (X9).
The performance function model was estimated using three functional forms of linear, semi – log and exponential equations.
The equations are stated below as:
Linear function:
Y= a0 +b1 X1 + b2 X2 + b3X3 ……… bnXn + U1………………. (i)
Exponential function:
Y = uxbxbxbxbxbxbxbbe 14146655443322110 ...................... ………….….………..(ii)
Semi-Log function:
Log Y= ao + b1InX1 + b2InX2 + b3InX3 ….bn InXn + Ui….. (iii)

International Journal of Business and Management November, 2009
77
Where
Y= dependent variable (turnover)
Xi – Xn = Independent variables
ao= constant term/slope or intercept
bi – bn = parameters estimated.
Ui = Error term
Ordinary Least Square (OLS) was used to derive estimates of the parameters of explanatory variables in the equations. The best-fit equation was selected based on the value of R², t – test and F – test of overall equation.
4. Results and discussion
The following regression results were obtained from the three-fitted function forms (Table 1). The linear function was chosen as the lead equation based on the R², t and f – values.
The linear regression results obtained is as follows:
Y = - 13.578 + 0.742 X1 + 1.999 X2 + 1.480 X3 + 1.230 X4 + 0.776 X5 - 0.331 X6
(0.30) (2.12) (1.67) (1.10) (0.82) (-0.32)
- 0.304 X7 + 0.115 X8 + 2.06 X9
(-0.32) (0.11) (1.76)
t – ratio values are in parenthesis.
*Significant at 5%
**Significant at 10%
The regression results showed that, if the coefficient of X1 (B1=0.742), that is year of establishment of the corporation is increased by one unit, the performance would increase by 0.742 units. This indicates that the older the public transport company is, the more the performance in terms of turnover expected of her. Meanwhile, cost of maintenance (X2) had a coefficient of 1.999 (B2= 1.999) which implies that increase or improvement in the cost maintenance of the vehicles possessed would influence or improve the performance or turnover by 1.999 units. This size of coefficient is significant at 5% level meaning that the cost of maintenance would have significant influence on the turnover. Most often, maintenance use to play vital importance on the performance of public transport companies. This corroborates the earlier findings of Ogunsiji and Aworemi (2004) that preventive maintenance has significant influence on the output of small scale transporters in selected towns of Osun State, Nigeria.
In addition, the coefficient (B3=1.480) of X3, though nor significant, showed that if the government policies on importation of vehicles and auto spare parts is improved by a unit, the performance would increase by 1.480 units. However, the insignificant of the coefficient is an indication of the abysmally low levels or negative impact of the policies on the selling prices of the vehicles and of auto spare parts.
Trailing behind this, total number of functioning vehicles (X4) has a coefficient of 1.230 (B4=11.230). This implies that, if the total number of functioning vehicles is increased by a unit, the performance (that is, the turnover) is increased by 1.230 units. However, the value is insignificant at both 95% and 90% confidence limits. The insignificance in this study showed that, there is need for most of the companies to acquire more functioning vehicles in order to improve their performances.
Whereas, the coefficient (B5=0.776) of X5 indicates that a unit increases in the provision of road facilities, the performance (that is, turnover) will be increase by 0.776 units. The value is however insignificant at both 5% and 10% levels. The insignificant of this variable to the performance is an indication of inadequacy of these facilities in the study area. The respondents operations interviewed confirms that the state of the road was very poor in all the states..
Furthermore, exchange rate is an important variable and it is expected to contribute positively and significant to the nation’s economy at large. However, this variable has a coefficient of – 0.331which means that for every measure of increase in the rate of exchange, there is a decrease of 0.331 units in the performance (i.e. turnover) of public transport companies.
The coefficient of paratransit and non-motorized modes of transportation (X7) that is (B7 = -0.304) showed that, if paratransit increase by unit, the public transport earnings decrease by 0.305 units. The explanation for the above result is that, many people have preference for paratransit, such as motorcycles popularly known as Okada, express etc. thus make less use of public transport.

Vol. 4, No. 11 International Journal of Business and Management
78
The variable X8, staff strength, has a coefficient of –0.115 (B8 – 0.115). Thus for every increase in the strength of the staff with the public transport companies, there is an increase of 0.114 unit in the performance. This means that increase in the number of employee lead to a slight increase in the performance (turnover), which is not significant at 5% levels. This is also an indication that, unnecessary increases in the staff strength do lead to redundancy.
Finally, the coefficient (B9=2.06) of X9 shows that for every improvement on the organization structure, the performance of public transport companies increase by 2.06 units. The value is also significant at 10% level.
5. Conclusion
The result of the findings showed that, of the three functional forms of Ordinary Least Square (OLS) method of regression analysis fitted, linear function was chosen as the lead equation based on the R², t and f- values. It was found out that cost of maintenance had coefficient of 1.999 and is significant at 5% level while organization structure is also significant at 10% level. Thus, it was concluded that cost of maintenance and organizational structure play prominent role in the performance of private transport companies in Niger State. This is line with the findings of Adesanya (2002) which established that the success of transport companies in third world nations is based on management concepts notably organizational structure and effective cost optimization.
References
Adeniji, K. (1983). Public Transportation and Urban Development in Nigeria. Institute of Town Planners, 111 (1).
Adeniji, K. (1983a). Public Transportation and Urban Development in Nigeria. Institute of Town Planners, 111 (1).
Adeniji, K. (1983b). Urban Development and Public Transport in Nigeria. Third World Planning Review, 5 (4): 383-394.
Adesanya, A. O. (1994). Financing Public Transport Services: The Experience of Nigeria. Unpublished PhD Thesis
submitted to the Department of City and Regional Planning, University of Wales College of Cardiff.
Adesanya, A. O. (1996). The Constraints of urban transport expansion: Case Study of Owerri in Journal of the NITP XI: 6-7.
Adesanya, A. O. (2002). Public Transport Operations in Nigeria in Bolade, T. and Adeyemi, E. O. (Ed.) Enhancing the Efficiency of Mass Transit Operations in Nigeria. Rex Charles and Connell Publication, Ibadan, 31-39.
Aworemi, J.R. and Ogunsiji, A.S. (2004). Impact of Road Transport Developmenton Small Scale Farmers’ Output in Ogbomoso Area of Oyo State. Journal of Agricultural Management and Rural Development, 1(I), 104-106.
Bolade, A. T. (1989). The National Urban Mass Transit Programme’: Review and Reflections’ in Bolade, T. (ed) Urban Mass Transit System in Nigeria. Ibadan University Press, 17-34.
Bolade, A. T. (1993). Introduction to Transport Planning (3rd Ed), London University College; London Press p. 61.
Burns, A. C. (1942). History of Nigeria. George Allen and Union Ltd, London.
Fejioku, P.K. (1996). The influence of metropolitan spatial structure on community time. Journal of urban Economics,26: 138-151.
Filani, M. O. and Abumere, S. I. (1993). Operational Efficiency in the Provision of Mass Transit Services by
State-owned Transit Companies in Nigeria. Urban Passenger Transportation in Nigeria, Edited by S. G. Ikya, Ibadan.Heinemann Educational Books (Nig.) Plc.
Filani, M.O. (1991). Emerging experience of state-owned mass transit operation: Case studies from Oyo and Ondo States. Paper presented at a seminar organised by FUMTA AUTMANIA Nigeria, September 25.
FUMTA (1989). Federal Urban Mass Transit Agency: Monograh Number One, March.
Jakpa, F. E. (1981). Travel Behaviour and Travel patterns. East Lakes Geographers, Vol. 7, 36-40.
Mabogunje, A. L. (1968). Urbanization in Nigeria. London: University Press Ltd, London.
Ogunjumo, A. (1992). The pattern of trip generation in Ile-Ife. NITP VI & VII.
Ogunsiji, A.S. and J. R. Aworemi. (2004). Effect of Socio-economic factors on transporters demand for credit in Trade-Bank, Ilorin, Nigeria. An International Journal of Biological and Physical Sciences – Science Focus, LAUTECH, Vol. 7, pp. 25 – 28.
Umar, T.J. (2005). Empirical studies of work trip distribution models. Transportation Research A, 15: 233-243.
Walker, G. (1959). Traffic and Transport in Nigeria: The Example of an Underdeveloped Tropical. Colonial Research
Studies, No. 27, London, Her Majesty’s Stationary Office.
World Bank. (1990a). Nigeria Urban Transport Crisis (Findings of the Urban Sector Mission which visited Nigeria in 1990), World Bank Report No. 8974 UNI World Bank Washington D C, February, 1.

International Journal of Business and Management November, 2009
79

Vol. 4, No. 11 International Journal of Business and Management
80

International Journal of Business and Management November, 2009
81
Research on Risk Pre-Warning Mechanism under Financial Crisis
Jingting Ma
School of Business Administration, Shenyang University
Shenyang 110044, China
E-mail: [email protected]
Shumei Wang
International Business College, Shenyang University
Shenyang 110044, China
E-mail: [email protected]
Jian Gui
School of Economics, Shenyang University
Shenyang 110044, China
E-mail: [email protected]
Abstract
Since 2007, the effects of US sub-prime mortgage crisis are deepening further. The international conductive effect enlarges the global economic risk. World economic conditions tend to be more complicated. At present, the financial crisis is caused by borrowers defaulting contracts, which causes the depression of financial market. Financial crisis turns into a considerable issue in the world. Therefore, based on fully recognizing the importance of financial crisis, we can build a risk pre-warning mechanism to reduce financial crisis, avoiding more losses caused by financial crisis.
Keywords: Financial crisis, Risk system, Risk pre-warning
1. The concept of financial crisis
1.1 The definition of financial crisis and the causes
Financial crisis means the possibilities of capitals, properties, and credits suffering from losses, because of decision mistakes, changes of objective conditions, or other reasons, in the operations of financial institutions. The risk happened in one financial institution may influence more than itself. The financial institution’s risk in financial transactions may threat the existence of this financial institution. One financial institution may face the risk caused by bad operations, which can turn into a threat for the stable operation of the whole financial system. Once a systematic risk happens and the financial system is disabled, the whole economic order will in a mess, which even causes serious political crisis.
Main causes of financial crisis include: (1) Borrowers can not fulfill the signed contract for loans; (2) Financial institutions are incapable of paying off; (3) Changes of rates of interests in market; (4) Changes of exchange rate; (5) Improper state macro economic and financial decisions or mistakes; (6) The default operations of top managers in financial institutions; (7) Other countries or regions’ political and economic changes; (8) Over use of financial derivatives; (9) Fast development of financial institutions.
1.2 The characteristics of financial risks in China
(1) The imbalanced financial structure and the abnormal development of financing make risks center in banks. In China, the development of capital market and small and medium financial institutions lags behind. State-owned banks hold the absolute dominating advantage in capital distribution for a long period.
(2) Financial risks and fiscal risks are enlarged due to the mutual effects. During the gradual reform process, the risk separation mechanism between fiscal and finance is always an absence.
(3) The large-sized informal finance turns into a threat for financial safety. For many years, small and medium enterprises can not get funds for development from formal financial channels. They are forced to seek for informal financial channels. At present, informal finance accounts for one third of formal finance in China.

Vol. 4, No. 11 International Journal of Business and Management
82
(4) In the transformation of mechanism, financial institutions face serious risks. The banking industry is full of risks. The asset quality deserves more cares. Great financial risks lie in the industry of securities. Insurance companies’ risks should not be neglected either.
(5) The regulation on capital projects is weak. It may cause abnormal capital flow at a large scale.
(6) Defects in RMB exchange rate mechanism hurt citizens’ welfare. It results in that China’s traditional opening-up mode and policies fall in non-sustainable development.
(7) Risks of rates of interests are prominent. The marketization of rates of interests is a double-edged sword. Risks of rates of interests are the two sides of same issue in the process of marketization of rates of interests. In China, the marketization process is slow and regulations are very strict. Commercial banks can not adjust the rate of interests by themselves. They face serious systematic risks of rate of interests. Meanwhile, along with the marketization of rates of interests in China, rates of interests fluctuate heavily. However, financial institutions are incapable of managing risks of rates of interests, which may cause higher risks.
(8) Financial risks in real estate industry needs to be noticed, plus the risks, similar to that in Latin America (It refers toa phenomenon: domestic financial activities depend more on international capitals; domestic financial market is gradually taken by foreign funds; domestic asset pricing right, securities service industry, and investment return are mostly controlled or dominated by international investors and foreign financial service institutions), in the opening-up process of finance.
2. The importance of financial risk issue
In market economy, all activities face certain risks. Financial risks are more prominent. Based on the most abstract analysis, economic operation system can be divided into two sectors: real economy sector and financial sector. Under modern economic conditions, contradictions in real economy sector may turn into financial risks. Besides, finance may face kinds of risks in operations. Especially as the securitization of assets and the popularization of derivatives become a trend, the independent operations of virtual products may generate more financial risks. Therefore, in a market economy system, financial risks are normal and reasonable.
Financial risks are common. The financial risk issue is extremely important, because:
Firstly, according to lessons from six East Asian countries, Russia, and Brazil, financial risks and instability are based on long-term accumulated financial risks. Once financial risks become financial crises, it will cause economic depression, and trigger social crisis and even political crisis.
Secondly, in China during the economic transition process, state-owned commercial banks’ funds are used as “semi-fiscal capitals” for a long period, which are used to support state-owned enterprises. The operation from “budget soft constraint” to “credit soft constraint” turns state-owned enterprises’ debts into state-owned commercial banks’ bad assets. The large amount of stock bad assets and increasing bad assets turn into “time bombs” that influence economic development.
Thirdly, China economy’s external dependence is improving. Under this circumstance, to deal with financial risks may affect two fields. The first is the capability of resisting external financial impacts. The second is the trust of world financial market. Only when we perform structural adjustment, solve and decrease financial risks effectively, can we avoid financial crisis and attract more foreign investors.
3. Pre-warning for financial risks
Facing serious financial risks, we can adopt two methods. Firstly, we can prevent risks by building a pre- warning mechanism. Secondly, we can reduce losses after risks are coming. By comparing the two methods, we conclude that the first can defend financial risks better, and the losses will be less.
The so-called financial risk pre-warning means to supply countermeasures and suggestions for financial safety by analyzing and predicting the possibilities in financial operations. Financial risk pre-warning system is an organic body composed by the form, the index system, the prediction methods which are used to reflect financial risks and relevant changes. It is based on economic and financial statistical data, and information technologies. It serves as an important part of state macro control system and financial risk prevention system.
3.1 Build the financial risk pre-warning system
(1) Build an internal safety net in financial system
International Monetary Fund (IMF) has applied the “Financial Sector Assessment Program” since May, 1999, by which it can evaluate the stability of financial system in member countries. China can adopt this system to evaluate the stability of financial system. In Nov. 2003, China Banking Regulatory Commission publicizes a pressure test for commercial banks, which is a component of “Financial Sector Assessment Program”. The pressure test means to evaluate financial institutions’ risks and potential vulnerability by analyzing the influences of changes of macro

International Journal of Business and Management November, 2009
83
economic variables on the stability of financial system.
(2) Build a hierarchical pre-warning system
In America, the pre-warning system is hold by independent subjects. According to this mode, in China the financial pre-warning system should take China Banking Regulatory Commission as the subject. China Banking Regulatory Commission can check financial institutions’ operational conditions and ask them to supply financial materials. With this basis, we can apply a vertical supervising pre-warning system at the macro, middle, and micro aspects. In detail, China Banking Regulatory Commission and central banks of commercial banks form the macro pre-warning system. Trans-provincial banking regulatory commissions and commercial banks’ branches form the regional middle pre-warning system. Commercial banks and local financial institutions form the micro pre-warning system. In detail, the macro pre-warning system is mainly in charge of supervising and pre-warning national and regional financial institutions, managing and directing the middle and macro pre-warning systems, collecting sorts of information from middle and micro pre-warning systems, and offering relevant decisions and measures for preventing financial risks after processing the information. The middle pre-warning system is a regional system that connects with central banks. It is responsible for supervising local financial institutions, accepting China Banking Regulatory Commission’s macro pre-warning system’s guidance and management, offering supervision and consultation for local financial institutions, and conveying central banks’ decisions and measures. The micro pre-warning system is to follow China Banking Regulatory Commission’s pre-warning directions, and offer scientific pre-warning information for branches of banks. The three-level pre-warning system constitutes a net system, actualizing a vertical risk supervising and pre-warning.
(3) Perfect the scientific financial pre-warning index system
Assess commercial banks’ capital adequacy rate, rate of overdue loans, return of loan interests, capital efficiency, funds efficiency, and general expense rate. The dynamic changes of indexes can reflect commercial banks’ assets distribution and risks separation. We can trace possible elements of risks changes, identify pre-warning signals for bad changes, make up practical program for depressing risks, and avoid the emergence and worsen of risks.
3.2 The difficulties for building a financial risk pre-warning mechanism
Firstly, an information share mechanism for economy and finance is still an absence. It is hard to start the risk pre-warning without any basis.
The construction of pre-warning mechanism concerns not only the relationship between People’s Bank of China and financial regulatory institutions, but also the relationship between People’s Bank of China and relevant official economic sectors, such as National Development and Reform Commission, Ministry of Finance, Pricing Agency, and Statistical Agency. However, because functions are different, People’s Bank of China and regulatory institutions, People’s Bank of China and official agencies can not share information effectively. It can be solved by the information share mechanism. At present, the information share mechanism is still an absence. People’s Bank of China can not make full of economical data from regulatory institutions and official agencies. It is hard to communicate financial risk pre-warning information, collect relevant index data, and actualize the supervision and pre-warning for financial risks.
Secondly, financial index data has poor comparability.
The pre-warning task needs to collect index data for several years or even decades of years. And the definition of index and calculation should not be changed. China is at the transition period. Recent economic and financial indexes change a lot comparing with that in middle and late 90s in 20th century. For example, commercial banks sort bad assets into five grades. Rural Credit Cooperation sorts bad assets into four grades. For same index, different financial institutions name it differently. Besides, they may adopt different standards. The poor comparability of indexes makes it hard to process data for pre- warning.
3.3 The countermeasures and suggestions for speeding up the construction of financial risk pre-warning mechanism
Firstly, speed up the construction and the perfect of economic and financial information share mechanism and insure to collect relevant data in time. In practice, the content of information share mechanism includes financial statistical information, analysis materials, regulatory reports, files, financial notices, information communication, conference communication, and financial information materials retrieve. Besides, we should perfect the information communication mechanism for People’s Bank of China and official economic agencies.
Secondly, build a perfect financial data collection system and study and develop a financial risk pre-warning mode. People’s Bank of China should make up strict standards for data collection, including the contents, the forms, the ways, the methods, and the channels according to China’s conditions, in order to insure the authenticity of data. With this base, use computer technologies to develop the risk pre-warning mode, finding potential financial risks effectively, and realizing the exact, scientific, and effective pre-warning for financial risks.
Thirdly, insure the information safety for financial risk pre-warning. At present, social public are sensitive to the finance industry. People are incapable of facing financial risks. Grapevines way cause a psychological panic among the public,

Vol. 4, No. 11 International Journal of Business and Management
84
which may result in a financial turbulence.
References
Bai, Shichun. (2004). How the People’s Bank of China prevents and settles down systematic financial risks. China
Finance, No. 8.
Dong, Xiaojun. (2004). Build an effective financial risk pre-warning mechanism. Financial News. 17th, Nov.
Dong, Xiaojun. (2004). Research on Financial Risk Pre-warning Mechanism. Beijing: Economy and Management Publishing House.
Financial Stability Project Team, Nanning Central Branch, The People’s Bank of China. (2005). Ideas for building financial risk pre-warning mechanism. South China Finance, No.2.
Jiang, Boke. (2005). International Finance (3rd edition). Shanghai: Fudan University Press.

International Journal of Business and Management November, 2009
85
A Study of Customer Loyalty Management
in Chinese Retail Supermarket
Wang,Wen-Cheng
Department of Business Management,
Hwa Hsia Institute of Technology, Taiwan
111 Gong Jhuan Rd., Chung Ho, Taipei, Taiwan, R.O.C
E-mail: [email protected]
Chen, Ying-Chang
Department of Hotel and Restaurant Management
Ching Kuo Institute of Management and Health, Taiwan
336 Fu Hsin Rd., Keelung, Taiwan, R.O.C
E-mail: [email protected]
Chu, Ying-Chien
Department of Tourism and Leisure
National Penghu University, Taiwan
300 Liu-Ho Rd., Makung city, Penghu, Taiwan, R.O.C
E-mail: [email protected]
Abstract
The retailer style includes department store, hypermarket, supermarkets, convenience stores, cooperative union, traditional markets and shopping mall in Taiwan and China. This thesis wants from the supermarkets to make the further discussion. The study of customer loyalty, particularly customer loyalty research on Chinese retail supermarket--Wumart Group has some significance. With the increasingly furious competition, the profit margins constantly decline and it needs to find new profit growth points through customer loyalty resources mastered by the retail enterprise. At the same time, the different management strategies were to avoid brutal price wars among major retail enterprises in China. The customer loyalty provides support for differentiated strategies, such support is not only reflected in materials of the purchase information provided by the customer information, but also reflected in the learn-type relationship between the retail business and customer loyalty. Therefore, the research on customer loyalty is a required course for modern retail enterprises, especially for supermarkets.
Research will focus mainly on surveys to get data and the interviews. The second objective of the research is to identify the determinants of service loyalty in Wumart Group. Apart from assessing the extent of customer churn in the supermarket, primary research is carried out to test the proposed model of customer loyalty. This study seeks not only to examine the relationship between customer satisfaction and customer loyalty, but also to include the analysis on the areas of customer loyalty and switching behaviours influenced by loyalty club cards.
Keywords: Customer loyalty, Customer satisfaction, Loyalty club cards, Supermarket
1. Introduction
China has a growing number of large-scale chain stores, launching the so-called “loyalty programs”. There are many national chains of supermarkets which introduce such loyalty cards, such as Wumart Group and Dia Tiantian. Wumart Group is the first supermarket chain to launch loyalty card system; in the short period of two years after the launch there are over 10 million customers to apply for its loyalty card members. In the fierce competition of consumer market in China, the loyalty system has become marketing tools for retailers to use. Such a system can help them, according to

Vol. 4, No. 11 International Journal of Business and Management
86
these consumers’ information got from the system, more accurately target consumer groups, with a view to increase sales.
Meanwhile, with the continuous improvement of people's living standards, the customer’s needs have also undergone great changes. Berry (2005) says “Today's shoppers want all of the customer experience: super programs that meet their demand, respect, emotional relation, fair prices and convenience, only providing four of the five elements is not enough, retailers must provide all the elements” in the journal of Harvard Business Review. Moreover, as the extensive application of information technology, channels for customers to get access to information are more and more, when customers make purchase decisions they will take into full account of their acquired information, and they become increasingly intellectual.
Between August to October, 2007, the “supermarket customers’ trend survey” was initiated by the China Chain Store and Beijing Association, and Zero Pointer information consulting firm of Chinese participated. This survey relied on 14 large chain enterprises in the China, and in 12 major cities to conduct “The trend survey of supermarkets”. “the investigation report of the purchasing behaviors of Chinese supermarket customers in 2007” summarized in the survey shows that in the supermarket industry in China, customers loyalty presents low, only 18% of customers say that under normal circumstances, they only go to a supermarket regularly, and the number of customers that go to 2-3 supermarkets regularly accounts for 44.4% (Sweeney and Swait, 2007).
2. Related theories review
2.1 The meaning of the customer loyalty
Customer loyalty is the forefront area of international research of marketing theory, especially in the mid-1990s of the 20th century, the research on customer loyalty becomes another hot point after customer satisfaction. Academia has done a great deal of research on customer loyalty, scholars at home and abroad through theoretical research and empirical analyses consider enterprises’ customer loyalty program.
The United States marketing consultant and expert Griffin (2002) defines that customer loyalty means customers will resist discounts provided by its competitors, and regularly purchase the company's products and services, and even will recommend to friends and peers. He raises two quantify indicators of customer loyalty: Customer maintaining degree and customer appropriation rate. Customer maintaining degree measures customer loyalty from the two dimensions of time and frequency of purchase, and the customer appropriation rate is the budget percentage rate that customers spend to this company (Smith, Sparks, Hart and Tzokas 2003). But he also points out that customer maintaining degree and customer appropriation rate are the necessary but not sufficient conditions of customer loyalty.
Customer loyalty degree is a quantifiable indicator, and customer loyalty is a rather abstract concept, not a pointer system can be adopted by this abstract concept model to specific decomposition, and then apply to retail enterprises. How to measure the psychological and customers acts to be a customer loyalty? Through the indicators to measure customers’ loyalty to a product or a brand, and analyze horizontally and vertically, so it has a certain practicality and operational significance.
2.2 Study variables measurement
This study uses structural and enclosed questionnaire survey when collecting data, each answer of each question is divided into five items, the respondents according to corresponding 1-5 points of the current international Likert 5 points scale to score. The higher score means that it’s more affirmation correspondingly to the research objects (Sweat, 2005). This study will mainly explore the factors that impact Chinese large supermarket- Wumart Group customer loyalty and the variables are measured as follows:
2.2.1 Measure dependent variables
Wumart Group’s customer loyalty is the dependent variable of this study, measurement indicators of large supermarket customer loyalty are from the predecessors’ measurement of customer loyalty. Measure by using three projects: the repeating wishes to purchase of customers, mouth-to-mouth recommendations and switching intention.
2.2.2 Dependent variables measurement
Since most of the variables measurement are based on previous studies, in light of Wumart Group to set up the actual and specific contents.
2.2.3 The theory hypothesis
Referring to the previous study on customer satisfaction, customer loyalty and loyalty cards and their relationship, the author introduces his own views and the theory structure of this study is as follows
According to research aims and the literature, this paper studies service quality, customer satisfaction and the link between customer loyalties, followed by the relevant assumptions. We discuss customer loyalty may exist direct relations between customer satisfaction and customer loyalty. Therefore, this study assumes that the loyalty cards

International Journal of Business and Management November, 2009
87
program is the main impacting factor of customer loyalty, and loyalty cards and customer loyalty have a direct relationship. According to the former study, the author thinks that the tangible, reliability, responsiveness, assurance and empathy these five latitudes to measure loyalty cards programs, and therefore assume:
H1: loyalty cards and customer loyalty has a positive impact.
Hla: loyalty cards tangible factor has a positive effect on customer loyalty;
Hlb: loyalty cards reliability factor has a positive effect on customer loyalty;
Hlc: loyalty cards and respond has a positive effect on customer loyalty;
Hld: the assurance of the loyalty cards has a positive effect on customer loyalty;
Hle: Empathy of loyalty cards has a positive effect on customer loyalty;
According to the summary of the previous parts, customer satisfaction and customer loyalty doesn’t connect with the degree of relations (Mägi, 2003). Although satisfaction and loyalty indeed have a certain degree of positive relations, which means that customers who are highly satisfied with the product or service may have high loyalty, but in some cases, customer satisfaction and customer loyalty may also be independent or even have negative relationship, that is to say a high degree of customer satisfaction may lead to low loyalty even without loyalty (Allaway, 2003). Therefore, combination of the actual aims of the study, the author’s view is, customer satisfaction is an important impact factor on customer loyalty, customer satisfaction factors have significant effect on customer loyalty, but the relationship between the two is not necessarily positive. Therefore:
H2: customer satisfaction has a significant impact on customer loyalty.
It must be pointed out that the study of this study focuses on consumers’ experience and feelings in the large supermarket and evaluates the impact of customer loyalty, but consumers’ age, gender, supermarkets’ geographical distribution, population and their impact on customer loyalty are not considered (Cortiñas, Elorz and Múgica, 2008).
3. Case study
3.1 Sample survey
In this research, the author chooses 150 people at random for questionnaire, and asks them some questions on Wumart Group supermarket customers’ purchase, such as the factors for them to consider when they want to buy something, among which is the most important factor, etc. As for general research 100 or above 100 samples is appropriate for study and research, too many or too few are not appropriate.
The sample for this research was defined as the residents of Beijing over 18 years of age. Because the mainly loyalty program was require the participant must be 18 years old above. The survey questionnaires were sent out 150 copies of questionnaires and recoveries 126, after excluding invalid questionnaire the valid questionnaires are 100 copies, the response rate is 84% (126/150), and the questionnaire recovery efficiency is 79.4% (100/126)
As Table 3-1 shows, the sample’s proportion distribution of the attributes is more reasonable, and sample structure is more reasonable, the whole objects have considerable research representation. The target objects of this investigation are mostly male, a total of 53, accounting for 53%; the age distribution of the samples is mainly concentrated in the 21-30-year-old and 31-40-year-old range, a total of the two parts are 65, accounting for 65 percent. Overall objects of research on supermarket’s consumers are male, age is mainly concentrated at young and middle-aged levels of 21 to 30-year-old and 31 to 40-year-old range, this study samples is comparative appropriate.
3.2 Questionnaire validity and reliability testing
The questionnaire reliability and validity testing is a key step for empirical research, only testing the survey data’s reliability and validity, subsequent empirical research can be meaningful. Meanwhile, according to the behavior measurement’s requirements, in order to ensure the reliability and validity of the questionnaire and the rationality of the questionnaire structure, it is necessary to test questionnaire survey data’s reliability and validity. This study’s questionnaire data and research results’ reliability and validity test results are as follows:
3.2.1 Reliability Analysis
Reliability refers to the credibility of the test, and it mainly tests measurements result and measurement tools’ stability and consistency. Reliability analysis is an effective analytical method in the social studies’ testing questionnaire; this paper will test study data’s reliability.
Cronbach’ coefficient is the most extensive measurement method of reliability. a coefficient is distributed between 0-1, on the minimum acceptable reliability coefficient, scholars are not unanimously. According to scholar Gay (1992), any test or scale’s reliability coefficient is above 0.90, which shows that scale’s reliability is very well; 0.80 is the minimum acceptable reliability coefficient. Other scholars, such as Nunnally (1978) and DeVellis (1991) believe that above 0.7 is acceptable reliability, if the research tools’ reliability is too low, below 0.6, which should be reconsidered

Vol. 4, No. 11 International Journal of Business and Management
88
amending research tools. Here we use the theoretical more common practice, namely under general circumstances, if Cronbach’ coefficient ranges between 0.80-0.90 and it is considered very good, ranges between 0.700-0.80 it is relatively good, and between 0.65-0.70 is acceptable, 0.60-0.65 is unacceptable. For not yet proven variables, as long as Cronbach’ is above 0.60, then it can be accepted.
This study is on Wumart Group’s customer loyalty factors, the author uses Analyze—Scale—Reliability Analysis of SPSS14.0 statistical software, selects the Alpha Model, analyzes reliability of dependent variables and independent variables measurement indicators one by one, getting Cronbach’ values. Its internal reliability test results can be seen from Table 3-2:
From the above Table 3-2, the tangible of loyalty cards, reliability, responsiveness, assurance and empathy, customer satisfaction, customer loyalty questionnaire’s reliability Cronbach’ Coefficients are 0.898,0.839,0.881, 0.858,0.834,0.866,0.836, all seven dimensions’ Cronbach’ coefficients are greater than 0.8. As a result, overall, the study’s variables internal stability and consistency are better, reliability is higher, which shows the study’s variables corresponding measure indicators have strong relationship, that is to say the questionnaire in this study has good reliability.
3.2.2 Validity analysis
Validity refers to correctness; it means the measurement tool can correctly measure the characteristics and functions. Here we mainly test constructive validity. The factors of customer loyalty in the Wumart Group can not be directly got from the questionnaire and accordingly the questionnaire is designed different variables on the measurement indicators of these factors (research variable). To illustrate these different variables (variables measured indicator) is to explain the same factor, this study uses SPSS14.0’s confirmatory component Analysis, and with Varimax to do orthogonal rotation, using menu Analyze-Data Reduction-Factor respectively on service quality, customer satisfaction, customer loyalty to do factor analysis, calculate each variable indicators’ Factor Loading, thereby construct validity test, examine whether this study measuring tools (questionnaires) reflects the concepts and propositions’ internal structure or not, which then measures the constructive validity of the questionnaire. Table 3-3 shows the concrete results.
Before conducting factor analysis, in order to confirm the observation variables’ correlation, this study uses Bartlett spherical test that produced in 1950, and KMO (Kaiser-Meeyer-Olkin) sampling proper volume testing the various variables observed correlation. According to Kaiser (1974) study, if KMO value is less than 0.50, then it is not appropriate for factor analysis. The variables’ KMO value of this study are not less than 0.70, and Bartlett spherical test’s significant probability is 0.000, less than 0.001 and meets scholars’ research standards, factor analysis can be carried out.
Under normal circumstances, the social behavior scientific researches think that if loading of factor is greater than 0.4 then it is considered to be Validity. From Table 3-3 research variables and measurement indicators’ validity of test results, the tangible of loyalty cards, the first indicator is 0.717, whose loading factor is relatively small, but the factor loading value is greater than 0.7, far greater than 0.4, so meets the validity of the test requirements.
4. Conclusion
In the above case study, this thesis analyzes the various indicators of measure variables on the interpretation of variable degree. General speaking, in the social sciences, when the variables (variables measured indicators) of the studied variables explanation achieves more than 30 percent, on the view, these variables is effective. Table 3-3 of the test results show that with the except for the tangible of loyalty cards’ explanation is blowing a low level (62.35), other indicators’ interpretation degrees are greater than 70%, we can see that the design of variables’ indicators’ interpretation of this research is higher degree, then the validity of the questionnaire that is better, and the set research variables indicators are reasonable, the study’s variables are also effective.
References
Allaway, A. W., Berkowitz, D. & Giles D’Souza. (2003). Spatial diffusion of a new loyalty program through a retail market. Journal of Retailing, 79(3), 137-151.
Berry, (2005). Brand marketing, economic management press. Journal of Harvard Business Review, p. 86.
Cortiñas, M., Elorz, M., & Múgica, J. M. (2008). The use of loyalty-cards databases: Differences in regular price and discount sensitivity in the brand choice decision between card and non-card holders. Journal of Retailing and Consumer
Services, 15(1), 52-62.
De Vellis, R. F. (1991). Scale development theory and applications. London: SAGE.
Gay, L. R. (1992). Educational research: Competencies for analysis and application, (4th ed). New York: Macmillan.
Griffin, D. (2002). Research on the customer loyalty program. Cambridge University Press
Kaiser, F. G. (1974). System Analysis by Digital Computer. New York: Wiley.

International Journal of Business and Management November, 2009
89
Lin, H. H., & Wang Y. S. (2006). An examination of the determinants of customer loyalty in mobile commerce contexts. Information & Management, 43(3), 271-282.
Mägi, A. W. (2003). Share of wallet in retailing: the effects of customer satisfaction, loyalty cards and shopper characteristics. Journal of Retailing, 79(2), 97-106.
Nunnally, J. C. (1978). Psychometric theory (2nded.). New York: McGraw-Hill.
Sharp, B., & Sharp, A. (1997). Loyalty programs and their impact on repeat-purchase loyalty patterns. International
Journal of Research in Marketing, 14(5), 473-486.
Smith, A., Sparks, L., Hart, S., & Tzokas, N. (2003). Retail loyalty schemes: results from a consumer diary study. Journal of Retailing and Consumer Services, 10(2), 109-119.
Sweeney, J., & Swait, J. (2007). The effects of brand credibility on customer loyalty. Journal of Retailing and
Consumer Services, 15(3), 179-193.
Appendix
This questionnaire is designed for a research project of my study. I would appreciate your help by filling this questionnaire. It is an anonymous survey, so you don’t need to fill out your name, and it will be used for my study project only. This is not a test. There are no “right” answers and no “wrong” answers. I would like you to give your own, honest opinion.
Do you often go to the same supermarket? ( )
A. yes B. No
1. Basic information
You are: ( ) A. male B. female
How old are you: ( ) A. <20 B.21-30 C. 31-40 D. 41-50 E.>51
2. Please answer the following questions when you often go to a supermarket.
(1). The decoration of the loyalty cards can satisfy you:
A. very disagree B. not agree C. general D. agree E. very agree
(2). You feel the applying conditions of cards are not rigor
A. very disagree B. not agree C. general D. agree E. very agree
(3). Prices are lower enough to satisfy you
A. very disagree B. not agree C. general D. agree E. very agree
(4). Staffs’ attitude is good when you apply for loyalty cards
A. very disagree B. not agree C. general D. agree E. very agree
(5). There are many favorable goods for card members and non membership can no enjoy it
A. very disagree B. not agree C. general D. agree E. very agree
(6) The design of acceleration marks and exchange methods are various and abundant
A. very disagree B. not agree C. general D. agree E. very agree
(7) Supermarket has free bus and parking lots for members
A. very disagree B. not agree C. general D. agree E. very agree
(8) Supermarket can perform its commitments of promotions for members
A. very disagree B. not agree C. general D. agree E. very agree
(9) Supermarkets will not deprive of customers’ interests using the term of “ultimate explaining power”.
A. very disagree B. not agree C. general D. agree E. very agree
(10) The cards’ information can be rightly protected and can not be used improperly
A. very disagree B. not agree C. general D. agree E. very agree
(11) The queue time for customers to wait when you apply for loyalty cards is short
A. very disagree B. not agree C. general D. agree E. very agree
(12) When customers face problems, staffs deal with them on time
A. very disagree B. not agree C. general D. agree E. very agree

Vol. 4, No. 11 International Journal of Business and Management
90
(13) Staff can provide service to customers quickly
A. very disagree B. not agree C. general D. agree E. very agree
(14) There are detailed tips and clues for membership customers such as promotions, lower prices
A. very disagree B. not agree C. general D. agree E. very agree
(15) Staffs are polite to membership customers
A. very disagree B. not agree C. general D. agree E. very agree
(16) Staffs are well knowledge and can answer membership customers’ questions
A. very disagree B. not agree C. general D. agree E. very agree
(17) Staffs can give personalized suggestions to members
A. very disagree B. not agree C. general D. agree E. very agree
(18) When conflicts happen, staffs can deal with them to satisfy membership customers
A. very disagree B. not agree C. general D. agree E. very agree
(19) Members can be provided added-value services
A. very disagree B. not agree C. general D. agree E. very agree
(20) I think loyalty card can bring many benefits and it is a very important factor for me to choose supermarket
A. very disagree B. not agree C. general D. agree E. very agree
(21) My experience in the supermarket is happy
A. very disagree B. not agree C. general D. agree E. very agree
(22) Services provided by the supermarket is better than my expectations
A. very disagree B. not agree C. general D. agree E. very agree
(23) Contrast on other supermarkets, I am satisfied with this
A. very disagree B. not agree C. general D. agree E. very agree
(24) This supermarket’s goods are cheap and good, I am very satisfied with it
A. very disagree B. not agree C. general D. agree E. very agree
(25) If next time I will go to supermarket, my intention to choose this
A. very low B. low C. general. D. high E. very high
(26) The possibility for me to recommend the supermarket
A. totally impossible B. impossible C. general. D. possible E. very possible
(27) If there is new chance, I will choose this supermarket
A. totally impossible B. impossible C. general. D. possible E. very possible
Table 2.1 Independent variables’ measurement indicator
Table 2.2 Dependent variables indicatorsTable 3.1 Samples’ individual characteristics (N=100)
Table 3-2 Research variables and their measurement indicators’ reliability testTable 3-3 The variables and their measurement validity of the test
figure 2-3

International Journal of Business and Management November, 2009
91
Table 2.1 Independent variables’ measurement indicator
Variables Question items Answer score explanation
Customer loyalty
Repeating purchase intention: the intention degree whether customers will constantly go the same supermarket.
The higher the scores are, the stronger the repeating purchase intention will be.
Mouth-to-mouth recommendation: the possibility that customers recommend the supermarket to others.
The higher the scores are, the more impossible the mouth-to-mouth recommendation will be.
Switching intention: given the new choice to customers, whether they will still choose this supermarket.
The higher the scores are, the stronger the repeating purchase intention will be.
Table 2.2 Dependent variables indicators
Variables dimensionality Question items Answer scores explanations
Loyalty Cards Programs
Tangible of LC Whether internal and external decoration of cards can satisfy customers.
The higher scores are, the tangible factors’ impact is larger
Whether the applying conditions of cards are not rigor for customers.
Whether prices are lower enough to satisfy customers.
Whether Staffs’ attitude is good when customers apply for cards.
Whether there are many favorable goods for card members and non membership can not enjoy it.
Whether the design of acceleration of marks and exchange methods are various and abundant.
Whether there is free bus and parking lots for card members.
Reliability of LC
Whether Supermarket can fulfill promotional promises on time.
The higher scores are, the reliable factors’ impact is larger
Whether supermarkets will not deprive of customers’ interests using the term of “ultimate explaining power”.
Whether the cards’ information can be rightly protected and can not be used improperly.
Responsiveness of LC
The queue time for customers to wait when they apply for loyalty cards is not long and customers can endure it.
The higher scores are, the response factors’ impact is larger Can salespeople deal with the problems
membership customers face on time?
Can salespeople provide service to membership customers quickly?
Whether there are detailed and indicative clues for members’ prices and promotions.
Assurance of Whether salespeople are polite to The higher

Vol. 4, No. 11 International Journal of Business and Management
92
LC membership customers. scores are, the assurance factors’ impact is larger
Whether salespeople have rich knowledge to answer customers’ questions
Whether salespeople can give personalized service to membership customers.
Empathy of LC When there are some conflicts on membership, can staffs deal with them to satisfy customers?
The higher scores are, the empathy factors’ impact is larger Can supermarket provide added value
services (such as delivering goods freely or giving souvenirs) to membership customers.
Can membership settle with credit cards?
Customer satisfaction
Whether the customers’ shopping experience is happy
The higher scores are, the satisfied factors’ impact is larger
Whether the service provided by supermarket is better than customers’ expectations
Contrast to other supermarket, whether customers are satisfied with this supermarket
Whether this supermarket’s goods are cheap and good to let customers satisfy
Table 3.1 Samples’ individual characteristics (N=100)
Population statistical variables
Types Population number Percentage (%)
Gender male 53 53%
female 47 47%
Age
18-20 19 19%
21-30 31 31%
31-40 34 34%
41-50 13 13%
Above 50 3 3%

International Journal of Business and Management November, 2009
93
Table 3.2 Research variables and their measurement indicators’ reliability test
Researchvariables
Measurement indicators
Expected values of measurement
indicators Standard Cronbach’
loyalty cards Tangible (LCT)
LCT1 3.2500 82112
0.898
LCT2 3.1200 76910
LCT3 3.3900 82749
LCT4 3.3200 78993
LCT5 3.4600 78393
LCT6 3.3700 78695
LCT7 3.3000 75879
loyalty cards reliability (LCRL)
LCRL1 3.3700 88369
0.839 LCRL2 3.2600 73333
LCRL3 3.3300 76614
loyalty cards Responsiveness
(LCRS)
LCRS1 3.4400 84471
0.881 LCRS2 3.4200 83097
LCRS3 3.4400 86830
LCRS4 3.3300 72551
loyalty cards assurance (LCA)
LCA1 3.3800 74914
0.858 LCA2 3.2600 81178
LCA3 3.3900 79003
loyalty cards empathy (LCE)
LCE1 3.3500 82112
0.834 LCE2 3.3100 80019
LCE3 3.2900 80773
loyalty cards 0967
Customer satisfaction (CS)
CS1 3.3000 87039
0.866 CS2 3.2800 76647
CS3 3.2900 80773
CS4 3.1600 81029
Customer loyalty (CL)
CL1 3.1600 82536
0.836 CL2 3.4300 76877
CL3 3.1700 87681

Vol. 4, No. 11 International Journal of Business and Management
94
Table 3.3 The variables and their measurement validity of the test
Researchvariables
Measurement indicators
Factor loading volume
Explanation degree of
variance (%)
KMO values
Bartlettball
checkupsalience
loyalty cards Tangible (LCT)
LCT1 0.717
62.354 .880 .000
LCT2 0.794
LCT3 0.772
LCT4 0.856
LCT5 0.772
LCT6 0.856.
LCT7 0.795
loyalty cards reliability (LCRL)
LCRL1 0.798
75.943 .704 .000 LCRL2 0.789
LCRL3 0.882
loyalty cards Responsiveness
(LCRS)
LCRS1 0.828
73.817 .833 .000 LCRS2 0.903
LCRS3 0.844
LCRS4 0.875
loyalty cards assurance (LCA)
LCA1 0.860
78.214 .701 .000 LCA2 0.874
LCA3 0.827
loyalty cards empathy (LCE)
LCE1 0.922
73.137 .715 .000 LCE2 0.922
LCE3 0.864
Customer satisfaction (CS)
CS1 0.866
71.586 .807 .000 CS2 0.861
CS3 0.848
CS4 0.892
Customer loyalty (CL)
CL1 0.870
75.529 .718 .000 CL2 0.842
CL3 0.893

International Journal of Business and Management November, 2009
95
H1a
H1b
H1
H1c
H1d
H1e H2
Figure 2.3
Loyalty Cards tangible
(LCT)
Loyalty Cards reliability
(LCRL)
Loyalty Cards (LC) Loyalty Cards
responsiveness (LCRS)
Loyalty Cards assurance
(LCA)
Loyalty Cards Empathy
(LCE)
Customer satisfaction (CS)
Customer loyalty (CL)

Vol. 4, No. 11 International Journal of Business and Management
96
Exploring on Chinese Foreign Trade Issues Based on E-Business
Shuqing Li
School of Business, North China Electricity Power University
Beijing 100089, China
E-mail: [email protected]
Abstract
Vigorous development of e-business in the world has produced profound influences upon foreign trade. While China’s e-business has started late, its application in foreign trade has certain distance from that in developed countries. If China intends to be a strong country in the aspect of trade in the 21st century, e-business must be greatly developed in the field of foreign trade. In this paper, the author anatomizes the application status quo of e-business in Chinese foreign trade and some existing problems through analyzing the effects of e-business on the international trade, that is, safety and conceptual issues for e-business, construction issue for information infrastructure, and legal system establishment issue. Finally, the author puts forward solutions and suggestions for promoting the application of e-business in Chinese foreign trade, such as changing concept and realizing importance of e-business, strengthening of network safety management, establishing and perfecting Chinese legal regulations for e-business, and continual strengthening of information infrastructure construction, etc..
Keywords: E-business, Foreign trade, International trade
In the 1940s-50s, the combination of computer technology and optical fiber based on micro-electronics technology opened the history of information and technology revolution. In 1970s, with the appearance of Electronic Data Interchange, people began to try to conduct automatic interchange of commercial data among different computers, which was an early form of e-business. After 1990s when e-business underwent a hard time, it still has obtained fast development in general.
MEANINGS OF E-BUSINESS AND ITS EFFECTS ON INTERNATIONAL TRADE
Meaning of e-business
In 1997, in “Economic and Social Effects of E-business”, the Organization for Economic Co-operation and Development of United Nations (OECD) defined e-business as commodity trade that happens on the Internet between enterprises and enterprises, and between enterprises and consumers, including forms of text, audio and video images. In November of the same year, the International Chamber of Commerce pointed out in the e-business memo of Paris Conference, that e-business is a computerization for realizing the entire trade activities.
Effects of e-business on international trade
E-business is an approach to handing information, which can be applied into many fields, including international trade field. Especially, the development of Internet created premises and laid foundations for developing e-business for enterprises of different scales and made trade and information exchange among enterprises easier and cheaper.
Since the appearance and prevalence of e-business in the world, its effects on international trade have been embodied in all aspects, and extended towards deep levels from simple to complicated aspects. It has brought profound influences upon such aspects as international trade theory, international trade manner, international trade operating mechanism, marketing, macro-management, and trade policy, etc..
Firstly, e-business struck the traditional international trade theories. The traditional international free trade theories include the comparative advantage theory and the theory of endowment, which were both stricken by e-business. According to the comparative advantage theory, the traditional comparative advantages include differences among natural resources, capital, labor force and human resources, etc.. However, in the era of e-business, information flow runs through the whole proceeding of e-business. Information is a key inscape of e-business, and it has become an important production element and resource, so information comparative advantage is gradually turning into one of determinants of international trade; while the theory of endowment mainly analyzes the origin of supply trade from the aspect of supply, namely, different abundant degrees of elements in different countries lead to different element price. One country may

International Journal of Business and Management November, 2009
97
make use of relatively low price elements in the production and international trade, which might bring comparative benefits to them. However, e-business lays more emphasis on satisfaction of customer demands provided by an enterprise, since demand plays a more and more indispensable part in the production and flow of products in the international trade.
Secondly, e-business has changed the traditional international trade manner. The international trade manner of e-business and that of tradition are different, mainly embodied in the followings: the first difference is the application of e-business and new mode of the international trade operating. E-business is a new international trade operating mode with information network as a carrier. In international e-business, all parties achieved international trade dealing by an electronic means, not by direct interview or face-to-face exchange. The second difference is the application of e-business and new types of the international trade mode. New types of international trade manner produced under the influence of e-business can be classified into complete international e-business and incomplete international e-business. The former is capable of fully excavating potential of the global e-business market; while the latter needs to rely on some external factors, because some material and non-digital commodities can not be delivered through Internet. Therefore, its dealing needs to rely on other activities and methods in addition to e-business. The third difference is the application of e-business and flow reformation of the international trade. Development and application of e-business will also further promote the flow reformation of the international trade, realize the reformation of the traditional trade flow and dealing which is based on transferring of paper trade bills (documents) as the principal part, and, therefore, form the new flow method of international trade.
Thirdly, e-business has changed the traditional marketing. In the era of e-business, a new marketing -virtual market emerges as the times require. According to statistics, at present, Internet has already covered almost 200 countries and regions in the world, and terminal users increase by degrees of 30% each year. The number of online computers has attained 70 million in China by now, that of Internet users have exceeded 172 million, and that of websites have already exceeded 1.31 million. E-business based upon Internet has become the global unified virtual dealing market. The virtual market opened another running space for commercial business. Although it has some common market essence with the traditional market, yet the difference between these two lies in: the virtual market breaks through the premise of the traditional market whose existence is based on the definite regional existence, and connects the world into a unified large “market” linked by information network. In this market, such information as commodity and service can flow in a sufficient and correct way in the whole world, indicating the features of publicity, integrity and real time, reducing information asymmetry of the importing and exporting parties, avoiding or lessening the distortion caused by the incompletion of market information, and therefore, ensuring the full functioning of the law of value.
Fourthly, e-business affects adopting direction of the international trade policy, since e-business has called for brand-new requirements for the international trade policy. Development of e-business has led to a series of policy propositions of the international trade: issues of demarcating the basic property of e-business, security, duty, and developing countries. E-business calls for human to fully take into account the ascription of its regulation inhibition and its behavior handling procedures in the future establishment of trade policy. E-business also enables economic safety of a country to be up against challenges. There is no last word whether promise made by members of WTO that tax would not be levied contemporarily on e-business will get continual recognition from each country with the further development of e-business. In the future establishment of e-business policy, whether the international society should establish feasible technological assistance system to help the developing countries make use of e-business and change from passive to active? All the previous issues put forward new challenges for the policy establishment of the global trade.
APPLICATION STATUS QUO OF E-BUSINESS IN CHINESE FOREIGN TRADE
Since earlier 1990s, the concept of e-business began to spread in China. In March 1998, the first Internet online deal was made, and since then, China’s e-business has displayed a tendency of fast development from conceptual discussion to practical development.
Law and humanity-oriented environment increasingly improved
Relative regulations and laws of e-business have developed towards maturity, and fast development of e-business education and training has brought into shape an all-around and multi-level professional education and training system of e-business.
Achievement of construction of network infrastructure
After long-term construction of Chinese communications network, a network structure is formed with a combination of electronic network, data network, mobile network, image network, and multimedia network, technically realizing upgrading from man-computer network to automatic network, from simulating network to digital network, and from simplification network to diversification network. The period from 1990 to 2000 was a peak time of Chinese e-business investment, from 2001 to 2003 a foam period, and after 2003, Internet went through the lowest point period. Thereafter, venture investment focused on Internet and e-business again.

Vol. 4, No. 11 International Journal of Business and Management
98
Improvement of payment environment
Payment gets improved, and a nationwide bank card information exchange network is primarily established across banks and regions. Approximately 60 security certification institutions for e-business have been built around the country, and operating quality of Chinese interbank payment system gets effective enhancement.
Rapid development of foreign trade
E-business for the foreign trade evolves rapidly, so the trade volume continues to mount up. Such industries as electric power, textile and traffic all have their own industrial network, on which they release product information, conduct online negotiation and contract signing, and unfold network sale. According to CCID consulting statistics, trade volume in 2004 totaled RMB 480 billion, 73.7% more than that in 2003.
EXISTING PROBLEMS OF APPLICATION OF E-BUSINESS IN CHINESE FOREIGN TRADE
Since 1990s with the application of EDI, e-business has evolved fast in China and has got delightful achievement, but there still exists some issues in the development of Chinese e-business.
Safety issue of e-business
Due to the fact that e-business is based upon Internet, the electronic currency is invisible, a great deal of economic information is transmitted on the Internet, and the capital is transferred on the Internet, the authoritative authentication ofonline trade requires no risk at all. However, as a matter of fact, safety of e-business is still worrisome internationally or domestically. Hidden safety trouble and risks are still prominent in terms of data transmission, handling and exchange between terminals. Particularly, with rapid development and prevalence of Internet, safety issues it faces more probably become a hotspot for human. In recent years, incidents about illegal invasion into computer network at home and abroad have emerged in endlessly, resulting in great economic damages to all countries. How to guarantee the safety of e-business activities will remain the core research area for e-business.
Conceptual issues for e-business
A large majority of Chinese enterprises have not had profound understanding in e-business. They still position competition focus on the real market, not fully convinced of necessity and urgency of occupying the network information virtual market in an economic era. According to the survey, at present only 10% of 15,000 state-owned large and medium-sized enterprises have basically implemented informationization, and cultural degree of medium and small-sized enterprises are even lower. Therefore, developing foreign trade by means of e-business has not aroused general attention from the huge Chinese enterprises. Even those enterprises which have already used e-business also have not really understood e-business of at all.
Construction issue for information infrastructure
Through several years’ construction, our information infrastructure has acquired great progress, but still lags a lot behind the developed countries. Informationization and electronification degree of most Chinese enterprises are extremely low, and many enterprises even have not had any computers. Even though some enterprises have computers, they are mostly used to type and compute, while management of some important resources have not ever implemented electronification, such as production, supply, marketing, human resource, financing, and materials, etc.. Financial institutions still haven’t realized electroni-fication, a nationwide financial network hasn’t come into being, and in addition, commercial electronifica-tion lags behind financial electronification, some institutions even having not started. Furthermore, because of the fact that, network layout of all industries is not reasonable in China, separated and each in its own way, together with slow online speed, the enthusiasm for purchasing online is also affected.
Legal system establishment issue
In comparison with such western countries as US and EU, our legislation for e-business stills drops behind. Our government has already gradually realized the importance and urgency for this legislation, made modifications successively on relative laws, added articles for e-business development, and has continually released a series of Internet regulations. However, in one word, our current laws and regulations still display an overall blankness for e-business trade activities. Lagging in terms of legislation will cause domestic enterprises to be passive in the global e-business competition. Furthermore, disputes in the foreign trade are unavoidable, among which e-business dispute has its particularity. Due to the regional disparity, two trade parties respectively have their own legal system, and if no mature and unified legal system is established, disputes are not going to be perfectly resolved. Therefore, legislation for e-business is rather urgent.
SOLUTIONS AND SUGGESTIONS FOR PROMOTING APPLICATION OF E-BUSINESS IN CHINESE FOREIGN TRADE
Changing concept towards e-business
As what has been mentioned above, e-business has brought huge and profound effects upon the whole modern economic life, and has accelerated development of the international trade to a great extent. Therefore, we should change concept,

International Journal of Business and Management November, 2009
99
and enhance understanding in e-business. That is to say, the entire society should put more efforts on propaganda, enhance the recognition of government and foreign trade enterprises on e-business, enable the huge foreign trade enterprises to understand, familiarize them with e-business, and adopt e-business. Especially for Chinese medium and small-sized enterprises, e-business provides an extremely convenient channel for them to enter the international market. So we should grasp opportunities to develop e-business. Only by this means, can we better participate in operating of the global economy, and share benefits of the international labor division.
Enhancing network safety management
Development of e-business calls for the resolution of safety and reliability issues. Network safety is connected to vital interests of every one. In e-business, unsafe network may bring direct economic damage, which will cause extremely disadvantageous impacts on the promotion of e-business, and make the public hesitate to move forward towards e-business. The government ought to exert all it can to establish a multi-level and exoteric network system that can guarantee information safety and integrality, reinforce establishment of a basic network, and build a safe, rigorous and reliable individual credit card and electronic currency payment system in the global sphere. The government should also set up and make sound safety authentication system, work out safety authentication management means for e-business, further control management of secret-key, certificates, and authentication institutions, and establish rationally distributed safety authentication system so as to provide reliable safety authentication service for the society. Finally, the government should continue to perfect and promote establishment of e-business payment system and make perfect online payment means.
Establishing and perfecting Chinese legal regulations for e-business
Our existing trade laws were constituted based on the traditional paper trade, so a lot of regulations don’t fit into e-business, and might bring a great many unconquerable obstacles for the development of e-business. In order to ensure the development of e-business, and considering relative network management, information safety, financial settlement, and intellectual property rights protection, etc., we should quick the steps for modifying the existing laws, establish and perfect a whole set of policy statutes and regulations. That is to say, the legal system for e-business should not only accord with China’s characteristics, but also be geared with the international standards.
Strengthening construction of information infrastructure
In terms of strengthening the information infrastructure construction, we should bring into the competition mechanism, cut down on charge from the network users, and improve the service quality and level to increase the utilization rate of network. Besides, traffic transportation and financial service play a fundamental part in the utilization of e-business, so we should positively promote the electronification of traffic transportation medium and financial medium, and form the e-business logistic and capital network. Furthermore, we should also break the industrial separated management system and increase the resource benefits.
References
Cao, Jie, and Liu, Ning. (2005). A Research on Application of E-business in International Trade. Journal of Nanjing
University of Finance and Economics, Nanjing University of Finance and Economics, Nanjing, Jiangsu Province, January , pp. 48-54.
Ma, Jian. (2008). Impact and Strategy Study of E-business on International Trade. Northern Economy, Inner Mongolia Development and Reform Commission, Hohhot, Inner Mongolia, July, pp.33-34.
Zhang, Xu. (2007). Impact of E-business on International Trade. Finance and Economics, Southwestern University of Finance and Economics, Chengdu, Sichuan Province, July, pp. 112-117.

International Journal of Business and Management November, 2009
111
Management Elements for Interpretation Placard System
in Mountain Scenic Resort
Hongmei Dong
School of Management, Xi’an University of Sciences and Technology
Xi’an 710054, China
Tel: 86-29-8558-3906 E-mail: [email protected]
This work was funded by Shaanxi Education Department (No: 07JK79)
Abstract
Tourism interpretation placard system is an important carrier conveying information about scenic resort, which can not only serve tourists but also benefit the management. At present, lots of problems exist in mountain scenic resorts’ tourism interpretation placard system, which influences the resorts’ images and sustainable development. Considering the requirements for interpreting mountain scenic resorts, this paper probes into the management elements for interpretation placard system: establish interpretation placards’ locations, contents, and ways in display, and advance to improve the interpretations for natural landscapes, form scientific interpretation views, actualize standardization and characterization of tourism interpretation placard system, and strengthen tourists’ safety, with the hope for improving the quality and the utility of constructing mountain scenic resorts’ interpretation placard system.
Keywords: Mountain scenic resort, Interpretation placard system, Basic element
1. Introduction
The word “interpretation” was firstly used in 1871 by John Muir who had lived and worked near Yosemite National Park in USA. In 1957, the father of interpretation Freeman Tilden published Interpreting Our Heritage (Freeman T., 1957), which made interpretation be accepted by the academic field widely. Till after 1964, tourism interpretation got widely recognition and further development (Cho K J., 2005; Ham S H., 2002; Ham S H., 1992). At present, researches and applications concerning tourism interpretation tend to be mature, not only forming a relative perfect specialized system, but also growing into a special interpretation industry that offers services, such as studying, planning, consulting, and training, for tourism interpretation. The service objects cover regions, national parks, history legacies, resorts, geological parks, museums, and institutions (Cho K J., 2005; Ham S H., 2002; Ham S H., 1992; Stewart E J, Hayward B M, Devlin P J, et al., 1998, p257-266; Metro-Roland M., 2009, p270-279). In China researches on tourism interpretation are still at the starting stage (Yongde Zhong & Fen Luo, 2006, p87-93; Bihu Wu, Xiangping Gao & Bing Deng, 2003, p326-334), mainly concerning tourism interpretation system’s concept, type, theoretical base, relationship of tourism products, tourists behavior, and interpretation service, and discussions on planning of national forest parks, geological parks, and urban parks’ tourism interpretation system by cases. All these researches serve as scientific bases for the design and the development of tourism interpretation system in China. However, few researches focus on certain interpretation mode in special.
Placard is an effective tool that can convey tourism information to tourists rapidly and conveniently. It is a popular interpretation mode in tourism interpretation system (Geva A, Goldman A., 1991, p177-185; Zeppel H, Muloin S., 2008, p215-227). An effective interpretation placard system is the best way for scenic resorts without tour guides. But how do we build an effective interpretation placard system? This paper argues that to build a perfect interpretation placard system in mountain scenic resorts is more feasible. China has many mountains. Mountain scenic resorts are tourism hotspots at present in China. However, in many mountain scenic resorts the placard system is imperfect, and interpretation information is incomplete. Besides, the interpretation contents and signals are not in accordance with standards. Furthermore, there is not placard at all. All these problems are rooted in the management of placard system. Therefore, to enhance the management on the interpretation placard system in mountain scenic resorts is extremely important. This paper advances some basic elements for the interpretation placard system in mountain scenic resorts, and puts forward several problems in management, with the hope of supplying valuable references for the construction of tourism interpretation placard system.

Vol. 4, No. 11 International Journal of Business and Management
112
2. Basic requirements for tourism interpretation system in mountain scenic resorts
2.1 Give prominence to the geological and seasonal beauty of mountain scenic resorts
Tourism interpretation should give prominence to the aesthetic value of landscapes. The unique feature of mountain scenic resorts is the geological and seasonal beauty. Generally speaking, human activities are mostly in valleys, piedmonts, and low mountains, where the agriculture and livestock industries are relatively developed, displaying an agricultural and livestock culture. Go upward and human activities are less. Many rare animals and plants live there, displaying a typical natural scene. If the mountain is high, it will show an evident vertical zonality view. All these scenes display the geological beauty of mountain scenic resorts. Besides, waters, weathers, and biology in mountain scenic resorts change seasonally. Tourism interpretation should emphasize this point, which can help tourists understand and appreciate the beauty of mountain scenic resorts completely.
2.2 Combine mountain scenic resorts’ normal interpretation and special interpretation together
Mountain scenic resorts include geological appearance, weather and climate, waters, animals and plants, where the tourism development needs normal comprehensive projects and lines, and special tourism projects. Therefore, in designing specific tourism interpretation, both normal comprehensive interpretation and special scientific interpretation are necessary in order to satisfy all tourists’ needs and choices.
2.3 Give prominence to the interpretation of ecological value
Mountains in China are important water sources, where many wild animals and plants live. However, most mountain ecological systems are incapable of self-adjustment. Any over- or irrational exploration will destroy the scenic resorts: the living spaces for animals and plants are ruined, which may cause the decline of mountain ecological system, or even make it collapse completely. Therefore, at the typical ecological scenic zone, the environment-sensitive zone, and ecology-fragile zone, it is necessary to build placards with clear ecological interpretation contents and environment protection, which can mention tourists to behave themselves as they appreciate mountains’ natural and cultural scenes.
3. Management elements for mountain scenic resorts’ tourism interpretation placard system
3.1 Collect relevant basic data
To manage the tourism interpretation placard system, we should collect some basic data concerning tourism resources, ecological system, infrastructure, and tourist management. Besides, pay attention to the latest researches on relevant fields and update related data in time. However, due to the complexity of mountain resources and environment, relevant data or information may separate at different levels. In detain, see to Table 1 as follow.
In addition, mountains at different climate zones have unique seasonal scenes. However, at present the descriptions about seasonal environment in mountain scenic resorts are rough and even similar, such as “distinct seasons, pleasant climate, prosperous flowers in spring, heavy shadow in summer, red leafage in autumn, and white trees in winter”. These seasonal descriptions can not help tourists understand the unique seasonal differences at various mountain scenic resorts. Besides, mountain climate changes vertically. The so-called “four seasons in one mountain and different weathers in ten miles” is a typical summarization. Therefore, as for what seasonal scenes appear at what time and where, a relevant interpretation system is necessary (see Table 2).
3.2 Establish the location of placards
Landscapes in mountain scenic resorts change along with the contour line. At different altitudes, climate landscapes, vegetation landscapes, geological landscapes are different sharply. At the same altitude, climate landscapes and vegetation landscapes are similar. Therefore, in mountain scenic resorts, we can select interpretation locations and build sightseeing stands and interpretation placards according to changes of landscapes vertically. Following the contour line, construct circular touring lines at the same forest belt and climate zone and build sightseeing stands and interpretation placards. Build circular touring lines and interpretation placards in virgin forest. Select sightseeing stands with rare animals and plants and build interpretation placards. Build sightseeing stands and interpretation placards in alpine meadow or wild flowers areas. Construct touring lines, sightseeing stands and interpretation placards in special geological sightseeing belts.
Establish locations that need to be protected in special, such as some ecological environment place, special landscapes, areas with rare animals and plants. Set placards and use simple words or signals to mention tourists to behave themselves, in case of disturbing animals’ activities, or destroying plants, or affecting the environments in landscapes. Set safety marks for dangerous roads, waters, animals, weathers, and plants, and make explanations for prevention. Set warning marks for roads where the traffic is terrible in order to call attention to potential dangers. In the area with potential threats, put clear warnings for real conditions and forbid tourists to enter.
3.3 Establish the contents of placards
In designing the contents of placards, the management of infrastructure and tourists safety is relatively easy. According

International Journal of Business and Management November, 2009
113
to China’s Graphical Symbols for Use on Public Information Signs (GB/T10001.1-2000), design placards with legal signals, styles, and colors. But concerning the attractive environment, the contents of placards should be scientific and complete. Too much or too less is unsatisfied. As build interpretation placards in mountain scenic resorts and landscapes, we can integrate the interpretation of sources and that of environment together in order to help tourists form a general recognition to the resorts or landscapes. The placards should be larger and contents should be general. In these landscapes, basic types of resources (exclude comprehensive resorts) consume most time of tourists, which is the key in designing interpretation placards. However, at present the interpretation for this part is poor. Most placards merely present the names, which can not help tourists appreciate the value of resorts. Therefore, on one hand we should set independent interpretation placards, presenting scientific names and explanations. On the other hand, we should make further studies on the specific contents and lengths of interpretation.
3.4 Choose the display manner of placards
At present, placards are mainly displayed statistically, not matter what it concerns content or form. This paper suggests new display manners, such as noiseless circular ads placards used frequently by outdoor ads and electric ads placards with sounds and colors. We can apply these new manners to the design of tourism interpretation placards, which can effectively improve the attractiveness of interpretation placards. However, the costs for these new tourism placards are higher. At present, we can make experiments in areas with developed tourism and economy or world legacy areas.
4. Problems for building tourism interpretation placard system in mountain scenic resorts
4.1 Reform traditional tourism interpretation that neglects natural touring landscape but emphasizes on humanism
landscape
Traditional tourism managers hold an idea that humanism landscape has rich cultural meanings and deserves to be interpreted but natural landscape has no deep meanings and tourists can appreciate natural landscape by themselves. As a result, we seldom see perfect interpretation placards in natural landscapes. Surely, humanism landscape has rich cultural meanings. But natural landscape also has rich scientific meanings. To interpret the natural landscape is not easier than the humanism landscape. Especially in ecological tourism resorts, an interpretation system is inevitable in order to help tourists appreciate the secrets of the nature really. Therefore, it is urgent to change the traditional bias to tourism interpretation that neglects the interpretation for natural tourism landscapes and emphasizes on the interpretation for humanism landscapes.
4.2 Build a scientific interpretation view for natural landscape, instead of the so-called “fairy tales” or “stories”.
Presently, many interpretations for mountain scenic resorts in China, especially for the water landscape and geological landscape, are about stories and fairy tales. They seldom concern the scientific meanings. It is not in accordance with the aim of ecological tourism and may affect the sustainable development of tourism industry in an area. Therefore, we must build a scientific interpretation view for natural landscape, instead of the so-called “fairy tale” or “stories”.
4.3 Actualize the standardization and characterization of tourism interpretation placard system
The design of interpretation placard system for resorts’ infrastructure includes materials, forms, colors, and words. Maintain the standardization as much as possible. Tourists can recognize them easily. The design of interpretation placard system for resorts and landscapes should reflect local features, which can deepen the memory of tourists. In order to actualize the characterization, we can use local materials for placards. And the shape and color of placards should be in accordance with the resorts. In other words, the shape and the color of placards match with the target in interpretation. For example, man-made stones far away from landscape can adopt “micro” landscape as patterns in placards. By this way, tourists can appreciate the landscape in a short distance. Besides, it increases the experience value of placard system.
4.4 Strengthen the construction of interpretation placards for the safety of tourists
The diversity of mountain scenic resorts makes it turn into the best place for ecological tour and exploration tour. However, because mountains are full of horizontal zones and vertical belts, geology, climate, soil, and biological group change significantly in a short distance or a narrow space. Mountains are dangerous, where accidents happen frequently. Therefore, we should strengthen the interpretation for the safety of tourists.
References
Cho K J. (2005). Developing all interpretive planning model for a national park system: stakeholder-based needs
assessment study for Korea. Columbus: The Ohio State University.
Freeman T. (1957). Interpreting Our Heritage. Chapel Hill, NC: University of North Carolina Press.
Geva A, Goldman A. (1991). Satisfaction measurement in guided tours. Annals of Tourism Research, No.18(2), p.177-185.
Ham S H. (1992). Environmental interpretation-A practical guide for people with big ideas and small budgets. Golden,

Vol. 4, No. 11 International Journal of Business and Management
114
Colorado: North American Press.
Ham S H. (2002). A Perspective on the Evolution of Interpretive Research. Taiwan, US, and Australia International Symposium on Environmental Interpretation and Ecotourism Taichung,Taiwan.
Metro-Roland M. (2009). Interpreting Meaning: An application of Peircean Semiotics to Tourism. Tourism Geographies,No.11, p. 270-279.
Stewart E J, Hayward B M, Devlin P J, et al. (1998). The ''place'' of interpretation: a new approach to the evaluation of interpretation. Tourism Management, No. 19. P. 257-266.
Wu, Bihu. Gao, Xiangping & Deng, Bing. (2003). Progress in environmental interpretation: A literature review. Progress in Geography, No. 22(3), p. 326-334.
Zeppel H, Muloin S. (2008). Conservation and education benefits of interpretation on Marine Wildlife Tours. Tourism in
Marine Environments, No. 5, p. 215-227.
Zhong, Yongde & Luo, Fen. (2006). A literature review of tourism interpretation. World Regional Studies, No. 15(4), p. 87-93.
Table 1. The basic data of tourism interpretation in Mountain Scenic Resort
Basic data
Large spatial scope Middle spatial scope Small spatial scope
Interpretation for tourism resources
Tourism resorts’ main class, subclass, features, distribution, main scenic areas’ distribution, features, and travel lines’ type and features
Subclass resorts’ types, distribution and features, causes, internal nature, scientific values and meanings, entertainment values, medical values, ecological values, main tourism sights and projects
Resource unit’s aesthetic features and appreciation values, including beauty of shape, beauty of colors, beauty of rareness, beauty of uniqueness, beauty of smell, beauty of sound, and beauty of change
Interpretation for ecological system
Ecological feature: climate, geology, water, community, type of ecological system, and the spatial distribution
Environment feature: spatial distribution of soil erosion, garbage pollution, water quality, soil pollution, air pollution, noise pollution, biodiversity, sorts of pollutants
Ecological feature: climate and micro climate, topography and micro topography, water condition, biological population, the spatial distribution and the mutual relationship
Environment feature: garbage pollution, water pollution, soil pollution, air pollution, noise pollution, and soil erosion
Typical micro climate, micro topography, stone, soil, water, biological individual and population’s physiological and ecological features
Interpretation for infrastructure
Facilities for transportation, board and lodging, and emergency
Interpretation for tourist management
Conditions for ecological frangibility and environmental sensitiveness, and the distribution, threats and the distribution in mountain scenic resorts

International Journal of Business and Management November, 2009
115
Table 2. The basic data of season environment interpretation in Mountain Scenic Resort
Season Climate data Landscapes’ seasonal features and data for symbolizing seasonal landscape
Goals of interpreting environments at different seasons
Spring
Summer
Autumn
Winter
Every season’s time period, air temperature, precipitation, humidity, wind, snow, and fog
Interpret the environmental features of resorts at different seasons, point out the symbolizing landscapes at different seasons, including typical trees and grasses, and their germination period, green leaves period, florescence, fruit period, maturity period, leaves changing period, and abscission period. Biological stage indicates certain season.
Establish symbolizing locations for different seasons and build interpretation placard system

Vol. 4, No. 11 International Journal of Business and Management
116
Foreign Banks are More Efficient – a Myth or Fact?
Saadat Wahid
SZABIST (Shaheed Zulfikar Ali Bhutto Institute of Science & Technology)
Islamabad, Pakistan
Tel: 92-333- 4217-283 E-mail: [email protected]
Dr. Kashif ur Rehman
Associate Professor, Iqra University, Islamabad, Pakistan
Tel: 92-321-5374-723 E-mail: [email protected]
The article is based on the Findings of Independent Study Course through Research - 3 credits – of PhD (Finance)
Program of SZABIST.
Abstract
The study was conducted to explore the myth that foreign controlled banks were supposed to be more profitable and efficient than local controlled ones. Two out of three financial indicators, understudy, pointed out that the overall performance of the foreign commercial banks, operating in Pakistan, was 24.44% better than the local controlled banks.
At the end of Year 2007, foreign investors were controlling 58.22% of the outstanding shares in the commercial banks, in Pakistan. Despite the fact that 40% of the foreign controlled commercial banks were running into deficit, the bank and the capital efficiency of the foreign controlled banks running into profit was better than locally controlled commercial banks. CEOs & directors are having substantial control on the financial affairs of the banks and have a direct relationship with the earning per share and bank efficiency but less control on the profit before tax. The executives-shareholders seem to have lesser liaisons with CEOs & directors but have more impact on the earning per share and bank efficiency.
Keywords: Foreign controlled banks, Local controlled banks, Banks efficiency, Capital efficiency
1. Introduction
The commencement of the current decade witnessed a dramatic change in the economic scenario of Pakistan when the Pak economy shows paradigm shift from mixed economy to service oriented economy. One of the most prominent economic events of the decade was the flourishing banking industry, resulting into entrance of many new private & foreign banks into the Pakistani financial market, privatization of many commercial banks, previously nationalized during the seventh decade of 20th century, and many acquisitions and mergers of local and multinational commercial banks. Out of many common prevailing myths the foreign oriented financial institutions, the one is that they perform better as a whole. This is typically assumed to be true about the multinational commercial banks operating in Pakistan. One widely written part of the literature points out that ‘Change’ in the pattern of shareholdings and top management, generally, cause the enhancement in profitability of commercial banks. Megginson & Netter (2001) in their empirical research consistently shows that privatization had a positive impact on firm profitability. On the other hand, Firth et al,. (2006); Kato & Long (2006) and Gibson (2003) typically, discovered that the profitability of the firm is negatively related to the change in controlling top slot of the firm as the top managers are usually held responsible for the profitable operation of the firm. La Porta et al., (1999) and Claessens et al,. (2000) found that controlling shareholders in business groups can maintain their control with the help of indirect ownership and these controlling shareholders, therefore, have greater incentives and means to expropriate firm resources than their counterparts in private firms. Taboado (2007) is of the view that large domestic block-holders ownership of banks is associated with improved performance while the foreign controlled commercial banks and institutions perform better than their peers despite the fact that this performance is not limited to developing and evolving markets.

International Journal of Business and Management November, 2009
117
1.1 Initial investigation
Before the decision to take research, preliminary investigations conducted, revealed a different story, explained quantitatively, in Table I, displaying the profit after tax and the total capital employed ratio; also called capital efficiency or return on equity.
The resulting ratios disclosed that 10/24 (41.66%) commercial banks, operating in Pakistan, and registered with Karachi Stock Exchange, are foreign controlled ones. Further, 6/24 (25%) commercial banks, registered with Karachi Stock Exchange, were running into loss as on December 31, 2007 out of which 4 were foreign controlled banks. Mean capital efficiency ratios of 24 commercial banks, foreign and local controlled commercial banks were '0.158', '0.171' and '0.150' respectively. Initial investigations further described that, National Bank of Pakistan, a commercial bank controlled by the Federal Government of Pakistan, reported the highest total capital employed and the profit after tax but its capital efficiency / return on equity was '0.164'; the 8th highest among the 24 commercial banks. The MCB Bank Ltd. with the 2nd highest total capital employed and the 3rd highest profit after tax had the highest capital efficiency of '0.286'. Bank Al-Habib Ltd.; a privately controlled bank with 7th highest profit after tax and total capital employed, had capital efficiency of '0.266'; the 2nd highest among 24 commercial banks, registered with KSE. Habib Bank Ltd.; a previously nationalized and recently denationalized one and handed over to a foreign institution, had 2nd highest profit after tax and the 3rd highest total capital employed, stood at the 3rd highest rank with '0.247' of capital efficiency. Chart I displays the Capital Efficiency (After Tax Profit / Total Capital Employed):
The confusing rather perplexing trend, displayed graphically in Table I, persuaded the Researcher to focus on the affairs.
1.2 Objective and delimitations of the study
The scenario, partially, supports the myth and forced the Researcher to go further into extensive literature review to search the logic to expose the myth which met with considerable success but the quest persuaded the Researcher to try to bust the myth that the foreign controlled banks do better, operationally, than domestic controlled banks. So, the decision to conduct the study on the topic; 'Foreign Banks are More Efficient – a Myth or Fact?’ was taken. For the study, objectives kept before sight, were; to investigate into the shareholding pattern of the commercial banks of Pakistan, to explore the profitability and efficiency of the foreign controlled banks in Pakistan, and to study the impact of ownership on the profitability & efficiency of the commercial banks in Pakistan. The study was delimited to the exploration of shareholding pattern of the commercial banks registered with Karachi stock Exchange and to remain confined to the data available in the annual reports of Year 2007.
1.3 Significance of the Study
Kunt & Huizinga (2000) are of the view that financial systems of some countries are bank-based and the same for the other countries is market-based. For example, the financial systems of Germany and Japan can be termed as the bank-based as the banks play a leading role in saving mobilization, resource allocation, monitoring of investment-decisions of corporate managers and providing risk management vehicles to the corporate sector while the systems of United States and United Kingdom are more market-based. Further findings of Kunt & Huizinga (2000) show that in developing countries, the banking and financial systems are less developed but more bank-based and the role played by the banks in allocating the resources is particularly great as the resource and funds are scarce and nascent industry and enterprises have fewer sources of capital. How the banks play a crucial role, as the intermediaries among the different sectors of national economy, is evident from 'Figure 1':
Emphasizing on the importance of the interest rates and spread of the bank, Focus Report (2007) of CBSI describes that the interest, financial institution pays on the deposits & loans and the spread (difference between income from interest and costs on liabilities) are particularly important as it shows the efficiency of the intermediary. With the above statement in view, this study becomes of prime importance for the bank shareholders, investors, chief operating officers, directors, depositors and scholars at large.
1.4 Source of data and research procedure
Consolidated and audited annual reports of 24 commercial banks, presented to statutory bodies, were the source of data. The shareholding pattern of National Bank of Pakistan was taken as pattern to be followed and all the 24 significant shareholding classes of the subject commercial banks were tabulated. Means & ratios between different classes of the shareholders and total outstanding shares were calculated in order to analyze the current ownership structure. Then the shareholding classification was manipulated and bifurcated in order to separate classes having foreign shareholders and the correlations between different classes of the shareholders, and capital efficiency, bank efficiency, earnings per share and duration of operations were calculated.

Vol. 4, No. 11 International Journal of Business and Management
118
2. Presentation of data and discussion
2.1 Percentage of different classes (categories) of shareholders to the total outstanding shares
The pattern of shareholding, of 24 subject commercial banks, explored, manipulated and tabulated in 24 categories (Table II, Column I and Chart II) displayed that the foreign investors (ordinary and companies) were holding 58.22% shares of the subject commercial banks, out of which foreign shareholding companies were holding 55.45% shares. Foreign associated companies, related parties and undertakings were having 40.46% shares as against, local associated companies, related parties and undertakings holding only 12.28% shares of outstanding shares. Federal government was holding a total of 0.10% shares in the commercial banks while the State Bank of Pakistan was holding 5.38% shares in the commercial banks. Kunt & Huizinga (2000) describes that comparatively strong bank-based financial systems of developing countries favor industrial establishment and capital allocation.
Initial investigations and the general scenario of financial markets, displaying split of controlling shares in the hands of foreign and local investors, is a healthy sign. On the other hand, a study by Gerschenkron (1962) that government controlled banks can help to avoid failures of financial markets, diverting the scarce domestic savings and funding to the strategically important national projects in which foreign banks may be reluctant to invest is also a considerable point of view. With a convincing argument that the strong government controlled banks support the national economy and the general public, one must keep in view the drawback, as well, pin pointed by Kwan (2004) that government controlled banks are normally less profitable than privately controlled ones. But, the huge profitability of National Bank of Pakistan Ltd. and excellent efficiency of The Bank of Punjab Ltd., are negating, to some extent, the findings of Tian (2000) that firms under government control are valued less than those under non-government control. They further explained their theory that a firm with a lower government stake in ownership is less valued than the one under government control. When the government stake increases (government assumes the control of the firm) in the firm, the value of the firm increases substantially.
2.2 Separation of ownership and control
The theory that societies with heterogeneous preferences and civil divisions reduce growth and public goods provision, presented by the Alesina, Baqir & Easterly (1999) and Banerjee, Iyer & Somanathan (2005) persuaded the Researcher to look into the relationship between the class of CEOs & directors, holding the 3.69% shares in 18 commercial banks and the class of executives, holding 0.02% shares in 10 subject commercial banks. Findings in the Table III appears to be alarming that correlation between class of CEOs & directors and class of executives is '-.022' as the Berle and Means (1932) are of the view that separation of ownership and corporate control may create a scenario in which the interests of the owner and the manager may move away from each other toward the opposite side and the system of check and balance may disappear. One must look into the prevailing financial scenario of commercial banks in the light of agency theory, developed and presented by Jensen and Meckling (1976), pointing out that the costs of deviation from maxim of profit maximization is reversely related to the stake of managers in ownership and resultantly, ownership may scatter.
Further, correlation between the class of CEOs & directors and profit before tax, EPS, bank efficiency and duration of operations is '-0.098', '0.007', '0.302' and '-0.007' respectively, which is self explanatory. CEOs and directors do not have shares in large quantity in which executives generally hold the shares. CEOs and directors seem to have no control on the profit before tax but to have control on the earnings per share and bank efficiency. Holding of posts of chief operating officer and the chairman of the board of directors, simultaneously, is not treated as typical for the bank's performance as is explained by Fogelberg and Griffith (2000). Two out of four correlations, related to earning per share and bank efficiency, calculated in Table III, seems to be of higher relevance to the class of CEOs & directors, informing one that financial affairs of the commercial banks are directly affected by the CEOs & directors as the CEOs and/or directors, generally, holds the managerial positions of the company as well. Announcement of the earning per shares and the administration of financial affairs are directly in the jurisdiction of the board of directors and ownership & control are not in the separate hands. Reflections of such situations should be viewed in the light of findings of Fogelberg and Grifith (2000) that more control of management in the hands of ownership creates the problems. Fogelberg and Grifith (2000) demonstrated, graphically, in Figure: 2 that bank performance goes up to some extent and then moves downward with the passage of time if the control of the banks is in hands of ownership.
Numerical findings of the Table III, regarding the correlation between the class of executives and profit before tax, EPS and bank efficiency ('0.156', '0.367' and ‘-0.022’) point out that they have substantial but negative/inverse control on bank efficiency. Such phenomenon was reported by the Saunders, Strock & Travlos (1990) that bank risk had declined between 1978 and 1985 which was inversely related to the increase in the managerial ownership. Similar situation is explained by Jensen and Meckling (1976) with reference to their agency theory that executives seems to have negative control on the bank efficiency which is extremely worrying situation. But, the findings are rational one and only Bliss and Flannary (2002) examined this question by studying the publicly held banking companies and did not find any evidence that the stock and bond holders influenced the management decisions and this created the doubts about the effectiveness of the financial market in influencing the business strategies, adopted by managers.

International Journal of Business and Management November, 2009
119
Deep investigations at the individual level reveal that only 10 banks reported to have the executive shareholding class, with mean shares of 489142. Only three banks; Habib Metro Bank Ltd. Arif Habib Bank Ltd. and Habib Bank Ltd., reporting to have more than mean shares in this class, are having bank efficiency of '0.327', '0.540' and '0.412' respectively which is not a bad sign as the bank efficiency near or below ‘0.50’ is considered to have an excellent one (King – 2009). The findings that the commercial banks with higher than normal executives shareholding class are more efficient; whether they are smaller units (Arif Habib Bank Ltd.) or bigger one (Habib Bank Ltd.), appears to be correlated with the findings of Kwan (2003) that management ownership appears to play a crucial role in firm performance. Berger et al, (2000) claim that if the ownership and control in a professionally controlled firm is separated, managers may lose interest in the management, resulting in insufficient work effort by them, choosing the working style suitable to their own choice, involving struggle for the perquisites or failing to maximize the profitability of the firm. Such a situation is prevailing in National Bank of Pakistan Ltd., today, where executives are taking least interested in the affairs of the bank and indulging in other negative practices. Similarly, Bearle and Means (1932) point out that the separation of ownership and control may create a conflict of interests between owners and managers. All the discussion in the section regarding the executive / managerial ownership relationship with bank efficiency and performance, verifies the literature. But, the policy of some banks, to keep the ownership and management separate, seems to reflect the theory of Berger et al (2000) and Bearle and Means (1932). The graphical position of the relationship between executives and different indicators of the financial position of commercial banks is presented in the Chart III:
2.3 General public(local & foreign) class of shareholders
As displayed in Table II, general public (local and ordinary foreign) classes of shareholders hold 9.71% & 2.48% shares, respectively, in the subject commercial banks. The correlation between the ‘general public (local & ordinary foreign) shareholders’ and ‘profit before tax’ is '0.158' and '-0.53' respectively. Logic behind the fact seems to be that the public decisions are instant and not long lasting. General shareholders decisions in favor of the highest profitable stock seem less logical and without any strong background. General shareholders typically ask for the EPS. The general public (local & foreign) is usually irrational one without caring about other factors and focusing mainly on EPS.
2.4 Bank efficiency
Bank efficiency formula followed, is proposed by King (2009) which says that the ratio measuring the efficiency and productivity of commercial banks is bank efficiency. It means it is the cost the bank has to incur, to earn return (revenue). The formula applied is:
Efficiency ratio = non interest expenses / net interest income + non-interest income
Non interest expenses and non-interest income are more “controllable” than net interest income. The average bank associate has little influence over what the bank pays on depositors’ account or earns from the debtor but can influence the expenses and other sources of income. King (2009) is of the view that if a bank's efficiency ratio is 50% or below, all is well; if the ratio is 70% or more, it needs to be better. Bank efficiency ratios do not suit to every situation. If banksare providing the highest quality service costing higher than normal, the ratio may be significantly higher. Usually, the banks prefer lower one (king - 2009).
2.4.1 Analysis of findings about bank efficiency of subject commercial banks
As displayed in the Table IV, the mean bank efficiency of the 24 subject commercial banks is '0.67' which is, fortunately, still below dangerous level (see King – 2009). Bank efficiency of the foreign controlled banks is '0.43' while the same for the local controlled banks is ‘0.50’, which is 14% higher than the foreign controlled banks and the bank efficiency of the foreign controlled banks is 35.83% more than the mean working of commercial banks while the local banks are working 25.37% more efficiently than the mean of 24 commercial banks. In the other words, one can say that the foreign controlled banks are working 14% more efficiently than the local controlled banks.
The scenario reflects the prevailing global one that as a whole, foreign banks perform better. But, surprisingly, the best bank efficiency ratio, '0.254', is of The Bank of Punjab Ltd.; a provincial government controlled bank and the 2nd best figure, '0.305', is for the government controlled bank, i.e. National Bank of Pakistan Ltd. The two best bank efficiency figures, maintained by the government controlled banks, arises many questions about the logic behind the scene, audit reports (reporting procedure and auditing companies) and the annual reports (window dressing etc.). The 3rd best bank efficiency, '0.327' is of Habib Metro Bank Ltd. with 60.34% shares in the hands of foreign investors. Two more prominent examples come from the Royal Bank of Scotland Ltd. and NIB Bank Ltd. (both foreign controlled banks with 99.22% and 90.06%, of shares in the hands of foreign investors) have bank efficiency of '0.703' and '0.771' respectively despite the fact that both the banks are reporting a loss for the year ending December 2007 and are passing through recent take over / merger) and still are in transition. Apparently recent foreign takeover/merger of local operations, the high cost service and recent rapid expansions may be the cause of high bank efficiency ratios and operating loss in these two foreign banks, reporting loss at the end of Year 2007. Still one more example of transition

Vol. 4, No. 11 International Journal of Business and Management
120
and loss, is of Saudi Pak Bank Ltd. and Atlas Bank Ltd.; both reporting loss at the end of Year 2007, have entered into merger in the mid of June 2009 transforming into Silk Bank Ltd. The over all bank efficiency, calculated, of the foreign controlled banks is verifying the literature that foreign banks are more efficient as a whole.
2.4.2 Correlation between different classes of shareholders and profit before Tax & bank efficiency
As displayed in the Table III, the correlation calculated to be negative between the shareholders classes, with high percentage of foreign shareholders, and profit before tax. The most significant class of shareholders displaying the higher correlation ‘0.171’ with profit before tax, is class of others (misc.), followed by the shareholders class of the general public (local) with a correlation of '0.158' with profit before tax.
The best correlation '1.000' score found is between State Bank of Pakistan and bank efficiency, followed by shareholders class of joint stock companies with a correlation of '0.422'. The 3rd best correlation '0.333' is found between the investment companies and the bank efficiency. A bulk of literature, including studies by Bonin et al,. (2005), Claessens, et al., (2004), Mico, et al., (2004), Claessens et al,. (2001) and Micco et al,. (2004) about the foreign controlled banks report that ownership, particularly in the developing countries, have positive correlation with bank performance and foreign controlled banks also cause the enhancement of competitiveness of local controlled banks.
2.5 Analysis of EPS of subject commercial banks
Table IV displays that the mean earning per share, declared by the 24 commercial banks, is Rs. 5.59 and that of foreign and local shareholders' controlled commercial banks is Rs. 6.02 and Rs. 7.47 respectively which means that local controlled commercial banks are distributing 19.41% more money as a whole to the shareholders as earnings per share than the foreign controlled commercial banks. Fifty percent of the foreign controlled banks, with a mean EPS of Rs. 6.03, are distributing 7.29% higher dividend than mean EPS. On the other hand, 50% of local controlled banks with mean EPS of Rs. 7.47 are distributing 25.17% more than the mean EPS. Four (all foreign controlled banks) out of six commercial banks reporting loss for the year, also distributed the dividend to the shareholders which may shows their financial strength and accumulated previous earnings. But, as a whole, EPS of the local controlled banks is better.
2.6 Analysis of capital efficiency of the subject commercial banks
Mean of the capital efficiency of the 18/24 subject commercial banks (six commercial banks running into losses) is '0.157' while the same for the foreign controlled commercial banks is '0.171' which is 8.18% higher than the mean. On the other hand, mean capital efficiency of the local controlled banks is ‘0.151’ which is 3.97% lower than mean for the 24 subject commercial banks and is 11.69% lower than foreign controlled commercial banks. One may say that foreign controlled banks are employing their capital 11.69% more efficiently than their local controlled competitors or their return on equity is 11.69% better than local controlled banks.
2.7 Analysis of duration of operations of subject commercial banks
The mean duration of operations (years) of subject commercial banks in Pakistan is 20.54 years while the same for the foreign and local controlled banks in Pakistan is 24.17 and 23 years, respectively. The mean of duration of operations (years) of commercial banks, reporting loss, at the end of year 2007 is 12.00. Foreign controlled banks have been operating in Pakistan 4.84% longer than the local controlled banks. Mean duration of operations of the commercial banks reporting loss at the end of Year 2007 is shortest. Empirical findings of the Table III did not support that longer the duration of operations, higher the bank efficiency, capital efficiency but the EPS. Rather, the negative correlation between duration of operations and profit before tax & bank efficiency is ‘-0.116’ and ‘-0.285’ respectively, exhibits the reverse relationship between them, i.e. the profitability of new commercial banks operating in Pakistan, as a whole, is better.
3. Conclusions
The findings of the study, regarding the bank efficiency, capital efficiency and EPS, summarized in Table V, mentions that according to two out of three financial indicators, the performance of the foreign commercial banks is 24.44% better than the local controlled banks in Pakistan.
Local controlled commercial banks in Pakistan are more profitable than foreign controlled ones as far as the volume of the profit is concerned which is reflected in their earnings per share but the foreign controlled commercial banks in Pakistan, as a whole are more capital efficient as compared to the local controlled commercial banks subject to few exceptions. The bank efficiency of the foreign controlled commercial banks in Pakistan is much better than local controlled commercial banks. Foreign shareholders are controlling more than fifty-five percent share in the subject commercial banks. The cause may be that; as their policies and practices are extra vigilant and cautious in relatively new and unfamiliar environment, the foreign controlled banks have better asset management and better operational efficiency which converts them to the more profitable and/or efficient banks than locally controlled ones. General public shareholders (local and foreign) are having minimal control on the commercial banks as they are controlling less

International Journal of Business and Management November, 2009
121
than ten percent of the shares of the commercial banks. The shareholders' class of CEOs & directors is having substantial control in the financial affairs of the banks and has a direct relationship with the earning per share and bank efficiency but less control on the profit before tax. The executives-shareholders seem to have fewer liaisons with class CEOs, directors and their spouses' but the executives have higher impact on the earning per share and bank efficiency.
References
Alesina, Alberto, R. Baqir, and William Easterly. (1999). Public goods and ethnic divisions. Quarterly Journal of
Economics, 114 (4), 1243-1284.
Banerjee, Abhijit, Lakshmi, Iyer, and Rohini, Somanathan. (2005). History, social divisions and public goods in rural India. Journal of the European Economic Association, 3 (2-3), 639-647.
Berle, A. A. Jr., and G. C. Means. (1932). The Modern Corporation and Private Property. New York: Macmillan.
Bliss, R. R., and M. J. Flannery. (2002). Market Discipline in the Governance of U.S. Bank Holding Companies:
Monitoring versus Influencing. European Finance Review, 6, No. 3, 361-95.
Berger, Allen N., Hasan, Iftikhar, and Zhou, Mingming. (2006). Bank Ownership and Efficiency in China: What Will
Happen in the World’s Largest Nation? Philadelphia: Wharton Financial Institutions Center.
Berger, Allen N. and di Patti, Emilia Bonaccorsi. (2000). Capital Structure and Firm Performance: A New Approach to
Testing Agency Theory and an Application to the Banking Industry. Philadelphia: Wharton Financial Institutions Center.
Bonin, John P., Iftekhar Hasan, and Paul Wachtel. (2005). Bank performance, efficiency and ownership in transition countries. Journal of Banking & Finance, 29, 31-53.
Claessens, Stijn, Asli Demirgüç-Kunt, and Harry Huizinga. (2001). How does foreign banking entry affect domestic banking markets? Journal of Banking and Finance, 25, 891-911.
Firth, M., Chen, G., and Xu, L. (2008). Control transfers, privatization and corporate performance: Efficiency gain in the China’s listed companies. Journal of Financial and Quantitative Analysis, 43: 161-190.
Focus Report. (2007). Understanding the Interest Rate Spread in Solomon Islands. Central Banks of Solomon Islands Quarterly Review.
[Online] Available: http://www.cbsi.com.sb/fileadmin/PDF/reports/Qtly2007/JunQrt2007.pdf
Fogelberg, Lawrence and Griffith, John M. (2000). Control and Bank Performance. Journal of Financial and Strategic
Decisions, Vol. 13, No. 3, Fall 2000, 63.
Gerschenkron, A. (1962). Economic Backwardness in Historical Perspective, A Book of Essays. Cambridge: Harvard University Press.
Gibson, M. (2003). Is corporate governance ineffective in emerging markets? Journal of Financial and Quantitative
Analysis, 38: 231-250.
Jensen, M., and W. Meckling. (1976). Theory of the Firm: Managerial Behavior, Agency Costs, and Ownership Structure. Journal of Financial Economics, 3, no. 4 (October): 305-60.
Kato, T. and Long, C. (2006). CEO turnover, firm performance, and enterprise reform in China: Evidence from micro data. Journal of Comparative Economics, 34: 796-817.
King, Brian. (2009). Efficiency Ratio – a Focal Point for Change. Atlanta: BenchMark Consulting International
[Online] Available: www.benchmarkinternational.com
Kwan, Simon H. (2004). Risk and Return of Publicly Held versus Privately Owned Banks. FRBNY: Economic Policy
Review, 107.
La Porta, R., Lopez-de-Silanes, F., Shleifer, A., & Vishny, R. (1997). Legal determinants of external finance. Journal of
Finance, 52, 1131–1150.
La, Porta, R., Lopez-de-Silanes, F., & Shleifer, A. (1999). Corporate Ownership Around the World. Journal of Finance,54: 471-517.
Megginson, W. and Netter, J. N. (2001). From state to market: a survey of empirical studies. Journal of Economic
Literature, 39: 321-389.
Micco, Alejandro, Ugo Panizza, and Monica Yañez. (2004). Bank ownership and performance. Inter-American Development Bank Working Paper.
Saunders, A., E. Strock, and N. G. Travlos. (1990). Ownership Structure, Deregulation, and Bank Risk Taking. Journal
of Finance, 45, no. 2 (June):643-54.

Vol. 4, No. 11 International Journal of Business and Management
122
Taboada, Alvaro. (2007). Does Presence of Large Domestic Block Holders around the World Affect Bank Performance?Ohio: The Ohio State University, Fisher College of Business.
Tian, George Lihui. (2000). Government Shareholding and the Value of China's Modern Firms, William Davidson Working Paper Number 395. London: London Business School.
[Online] Available: http://www.bus.umich.edu/KresgeLibrary/Collections/Workingpapers/wdi/wp395.pdf
Table I. Capital Efficiency/Return on Equity (‘Profit after Tax’ to ‘Total Capital Employed’) Ratio of Commercial Banks Registered with Karachi Stock Exchange
S.
No
Commercial Bank Profit after
Taxes
Ranking
Column
Total Capital
Employed
Rank
Column
Capital
Efficiency
Ranking
Column 3
(Rs. ‘000’) (Rs.‘000’)
1. MCB Bank Ltd. 57 547 322 16 16 441 670 17 .286 18
2. Bank Al Habib Ltd. 8 325 318 7 2 211 333 7 .266 17
3. Habib Bank Ltd. 63 237 429 17 15 614 020 16 .247 16
4. The Bank of Punjab Ltd. 18 995 794 12 4 445 619 14 .234 15
5. Askari Bank Ltd. 12 265 987 8 2 681 012 9 .219 14
6. Habib Metro Bank Ltd. 13 519 908 9 2 797 408 11 .207 13
7. Allied Bank Ltd. 19 878 242 13 4 076 158 13 .205 12
8. United Bank Ltd. 42 421 404 14 8 402 590 15 .198 11
9. Bank Al Falah Ltd. 16 219 844 11 3 130 229 12 .193 10
10. Meezan Bank Ltd. 5 706 656 3 963 501 6 .169 9
11. National Bank of Pakistan Ltd. 116 337 654 18 19 033 773 18 .164 8
12. Faisal Bank Ltd. 16 156 503 10 2 272 108 8 .141 7
13. Soneri Bank Ltd. 7 113 047 6 701 041 5 .099 6
14. Standard Chartered Bank Ltd. 43 066 310 15 2 764 039 10 .064 5
15. MyBank Ltd. 5 942 320 4 340 319 4 .057 4
16. KASB Bank Ltd. 4 283 992 1 197 693 2 .046 3
17. Arif Habib Bank Ltd. 6 301 576 5 230 165 3 .037 2
18. JS Bank Ltd. 5 193 807 2 35 431 1 .007 1
Mean 3323246 21732604 .158
Commercial Banks reporting Loss
19. Saudi Pak Bank Ltd. 2 180 439 -3 040 907 .
20. Royal Bank of Scotland Ltd. 5 065 795 -1 564 764 .
21. SAMBA Bank Ltd. 6 202 158 -1 322 892 .
22. Atlas Bank Ltd. 5 184 240 -309 044 .
23. NIB Bank Ltd. 36 592 034 -305 557 .
24. BankIslami Ltd. 3 844 726 -37 023 .

International Journal of Business and Management November, 2009
123
Table II. Kendall’s tau_b Correlation Test (1-tailed) between ‘Different Classes (Categories) of Shareholders’, ‘Profit before Tax’ and ‘Bank Efficiency’
Categories of Shareholders N %age to
Total
Profit before Tax
(Correlation)
Ranking of Col. 4
Bank Efficiency
(Correlation)
Ranking of Col. 6
1 2 3 4 5 6 7 1. Total Foreign Investors 24 58.22 -.072 14 -.098 11 2. Foreign Shareholding Companies 19 55.45 -.240 20 -.106 12 3. Associated Companies 18 50.96 -.399 22 -.341 19 4. Foreign Associated Companies 9 40.46 -.167 18 .141 6 5. Local Associated companies 18 12.28 -.098 15 -.059 9 6. Banks, DFIs, Financial inst 20 9.81 -.147 17 -.216 15 7. General Public (Locals) 20 9.71 .158 7 -.121 13 8. State Bank of Pakistan 20 5.38 1.000 1 1.000 1 9. CEOS, directors and their spouses 18 3.69 -.098 16 .302 4 10. Others 21 2.78 .171 6 -.138 14 11. Ordinary Foreign Shareholders 20 2.48 -.053 12 .142 5 12. Investment Companies 24 1.56 .156 8 .333 3 13. Joint Stock Comp[any 24 0.86 -.067 13 .422 2 14. Charitable Trusts 18 0.81 .400 3 -.400 20 15. Insurance Companies 19 0.77 .064 10 -.059 9 16. Modarbas and Mutual Funds 15 0.67 .276 5 .038 7 17. Public Sector Companies 4 0.66 .000 11 .000 8 18. NIT & ICP 13 0.55 -.205 19 -.219 16 19. NBP and IDBP Benevolent Funds 5 0.58 .527 2 -.316 17 20. Privatization Commission of Pak 24 0.21 . . 21. Federal Government 4 0.10 -.333 4 -.333 18 22. SECP 2 0.00 -1.000 23 -1.000 21 23. Executives 10 0.02 .156 9 -.090 10 24. Cooperative Societies 9 0.01 .333 21 -.333 18
Table III. Kendall’s tau_b Correlation (1-tailed) between ‘CEOs, Directors & their Spouses’ and Executives’ Classes of Shareholders and ‘Profit before Tax’, ‘EPS’, ‘Bank Efficiency’ & Duration of Operations
CEOs &
Directors
Executives Profit
Before
Tax
EPS Bank
Efficiency
Duration of
Operations
1. CEOs, directors and their
spouses
1 -.022 -.098 .007 .302 -.007
2. Executives -.022 1 .156 .367 -.022 -.046
3. Profit Before Tax -.098 .156 1 .261 .207 -.116
4. Earning Per Share .007 -.022 .261 1 -.149 .264
5. Bank Efficiency .302 -.090 .207 -.149 1 -..285
6. Duration of Operations (Years) -.007 -.046 -.116 .264 -.285 1
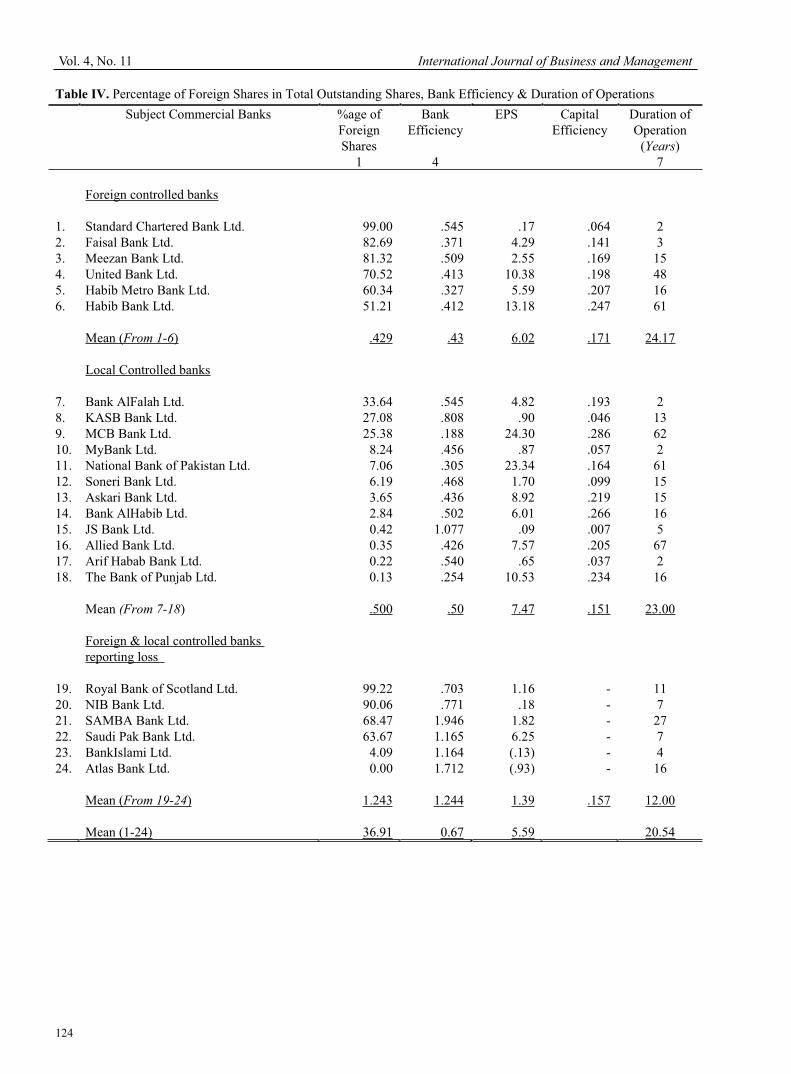
Vol. 4, No. 11 International Journal of Business and Management
124
Table IV. Percentage of Foreign Shares in Total Outstanding Shares, Bank Efficiency & Duration of Operations
Subject Commercial Banks %age of ForeignShares
Bank Efficiency
EPS Capital Efficiency
Duration of Operation
(Years) 1 4 7 Foreign controlled banks 1. Standard Chartered Bank Ltd. 99.00 .545 .17 .064 2 2. Faisal Bank Ltd. 82.69 .371 4.29 .141 3 3. Meezan Bank Ltd. 81.32 .509 2.55 .169 15 4. United Bank Ltd. 70.52 .413 10.38 .198 48 5. Habib Metro Bank Ltd. 60.34 .327 5.59 .207 16 6. Habib Bank Ltd. 51.21 .412 13.18 .247 61 Mean (From 1-6) .429 .43 6.02 .171 24.17 Local Controlled banks 7. Bank AlFalah Ltd. 33.64 .545 4.82 .193 2 8. KASB Bank Ltd. 27.08 .808 .90 .046 13 9. MCB Bank Ltd. 25.38 .188 24.30 .286 62 10. MyBank Ltd. 8.24 .456 .87 .057 2 11. National Bank of Pakistan Ltd. 7.06 .305 23.34 .164 61 12. Soneri Bank Ltd. 6.19 .468 1.70 .099 15 13. Askari Bank Ltd. 3.65 .436 8.92 .219 15 14. Bank AlHabib Ltd. 2.84 .502 6.01 .266 16 15. JS Bank Ltd. 0.42 1.077 .09 .007 5 16. Allied Bank Ltd. 0.35 .426 7.57 .205 67 17. Arif Habab Bank Ltd. 0.22 .540 .65 .037 2 18. The Bank of Punjab Ltd. 0.13 .254 10.53 .234 16 Mean (From 7-18) .500 .50 7.47 .151 23.00 Foreign & local controlled banks
reporting loss
19. Royal Bank of Scotland Ltd. 99.22 .703 1.16 - 11 20. NIB Bank Ltd. 90.06 .771 .18 - 7 21. SAMBA Bank Ltd. 68.47 1.946 1.82 - 27 22. Saudi Pak Bank Ltd. 63.67 1.165 6.25 - 7 23. BankIslami Ltd. 4.09 1.164 (.13) - 4 24. Atlas Bank Ltd. 0.00 1.712 (.93) - 16
Mean (From 19-24) 1.243 1.244 1.39 .157 12.00
Mean (1-24) 36.91 0.67 5.59 20.54

International Journal of Business and Management November, 2009
125
Table V. Summary of Findings of the Study
Subject commercial banks
Foreign Controlled Local Controlled Better Performance Percentage
Bank efficiency .430 .500 Foreign controlled 14.00%
Capital Efficiency .151 .171 Foreign controlled 11.69%
EPS Rs. 6.02 Rs. 7.47 Local Controlled 19.41%
Sum 25.69% 19.41%
%age of foreign banks performance to local controlled banks’ performance 24.44%
(Adopted, with thanks and minor modifications).
Source: Valentino, Piana (2002). Internet Rates. http://www.economicswebinstitute.org

Vol. 4, No. 11 International Journal of Business and Management
126
(Adopted with thanks and minor modifications)
Source: Fogelberg, Lawrence and Griffith, John M. (2000), Control and Bank Performance. Journal of Financial and
Strategic Decisions, Volume 13, Number 3, Fall 2000, 63.

International Journal of Business and Management November, 2009
127
A Study on Foreign Direct Investment Agriculture in China
Lixin Tang
School of Management, Yangtze University
Jingzhou 434023, China
E-mail: [email protected]
Abstract
This paper describes the existing statement of foreign direct investment in agriculture in China firstly, and then analyzes some possible limiting factors about the shortage of FDI in agriculture in China. Finally, some measures and suggestions are presented.
Keywords: Agricultural, Foreign direct, Investment, Limiting factors
In recent years, foreign direct investment in the agricultural utilization of foreign capital has become the main channel. By the end of 2005, Chinese direct investment in the agricultural utilization of foreign capital amount has more than 32.9 billion U.S. dollars. China's agricultural use of foreign investment funds to make up for the domestic shortage of agricultural inputs, and the introduction of foreign advanced technology and equipment, and fine varieties and advanced management experience, which promoted the development of agricultural product processing industry, improved the level of industrialization of agriculture and promoted rural and agricultural reform. But at the same time, the objective situation such as the structure is not quite reasonable can not be ignored.
1. China's foreign direct investment in the agricultural use of the status quo
1) Foreign direct investment in the agricultural utilization of foreign capital has become the main channel. "85" In the past, China's agricultural use of foreign investment to indirect investments, Major international organizations are non-reimbursable assistance and a variety of financial loans, Funds are subject to provide the United Nations system, international organizations and international agencies, Foreign direct investment share of less than 20%.Entered the last century 90's, the This situation changed dramatically. "Eighth Five-Year Plan" period, Foreign investment has gradually become the main peasant forms the use of foreign capital, Accounted for 62.8%."Ninth Five-Year Plan" period, Increase foreign investment, In 1995 accounted for 95.6%,In recent years, virtually 100% of all foreign direct investment in agriculture.
2) Agricultural use of foreign direct investment in small scale. With China's reform and opening-up continues to expand, Agricultural use of foreign capital has been relatively rapid growth, From 1999 to 2006 of 8 years, Agriculture 4130 projects utilizing foreign capital, Amount of contracted foreign investment 8.388 billion U.S. dollars. 5 years the number of projects were 456, 484, 536, 571, 674, 518, 433 and 458. Amount of contracted foreign investment of 761 million U.S. dollars, 692 million U.S. dollars, 962 million U.S. dollars, 794 million U.S. dollars, 1.389 billion U.S. dollars, 1.208 billion U.S. dollars, 1.147 billion U.S. dollars and 1.435 billion U.S. dollars. Over the same period, the country of foreign direct investment amounts to 40.319 billion U.S. dollars, respectively, 40.715 billion U.S. dollars, 46.878 billion U.S. dollars, 52.743 billion U.S. dollars, 53.505 billion U.S. dollars, 60.63 billion U.S. dollars, 72.406 billion U.S. dollars, 69.47 billion U.S. dollars. According to statistics, the agricultural use of foreign capital utilization of foreign capital in the country the proportion of the total amount of less than 4%,As of April 2006, foreign direct investment in agriculture in the amount of foreign direct investment accounted for only 1.93% of total (Source: China Investment Guide website http://www.gov.cn). With China's foreign direct investment compared to the agricultural use of foreign direct investment scale is still a big gap.
3) Industry and regional distribution unbalanced. China's agricultural areas and the use of foreign capital continue to broaden the scope of the project cover all provinces, municipalities and autonomous regions, including the agriculture, forestry, water, livestock, fisheries in all aspects of the industry. But by 2005 the industrial structure of foreign direct investment in distribution as follows: the primary industry accounted for 1.96%, secondary industry accounted for 68.69%, the tertiary industry accounted for 29.36%.As of 2005, the eastern, central, western region for foreign direct investment: the eastern region accounted for 84.85 percent, the central region accounted for 8.87%, 4.37% accounted for the western region, the relevant departments accounted for 1.09%.(Source: China Investment Guide website: http://www.gov.cn)Agricultural use of foreign direct investment and the geographical distribution of China's overall foreign direct investment is basically the same geographical distribution, with marked regional agglomeration effects

Vol. 4, No. 11 International Journal of Business and Management
128
4) Direct investment of transnational corporations begin production aspect of agriculture in China. Breaking the previous foreign investment concentrated in China's agricultural processing and marketing aspect of the program .The new trend that from "vendors" to "farmer" means it will have a strong impact on the traditional Chinese agricultural plant model, organizations and so on.
Japan's top brewers, "Asahi" beer company with the "Itochu" and "Sumitomo" chemical industry ', Ltd. "together at Shandong Laiyang rented 1300 acres of land plan to adopt organic farming methods to engage greenhouse and dairy farming. China gave 500 acres dairy farm which the rent is to be free for three years and set up electricity and built a road leading to the field.The Japanese side to pay the other land lease fees, the first five years of 800 yuan per mu each year, and thereafter every five years an increase of 200 million, the contract period of 20 years. Asahi Breweries PRESIDENT Yuzo Seto repeatedly said after the success of the "model" in China, they will clone twenty or thirty of the same items.
Macao henghe fruit industry in the Mainland, mainly engaged in fruit, after March 2003 it began to change the "sell" to "species", engaged in Chongqing Jiangjin 10 million mu of citrus production base, the use of "company to provide seeds, technical services + peasant farmers association management + plant + company unified acquisition" mode of operation.
French prestige Universal are one of the global top 500 enterprises, it's Tropicana orange juice industry in the world's leading. Zhong County, Chongqing is the world's citrus production on the most suitable one of the three lots in 1997, beginning at the prestigious Universal Zhongxian and farmers partnership to build a base of citrus orchards, a few short years, the project investment of 6 billion yuan (With China's investment and Farmer investment and labor investment), including 150,000 Al-acre orchards, world-class technology center.
5) Growing form of investment diversification. General there is a joint venture, cooperation and sole proprietorship in three forms, one of Hong Kong businessmen largest selection of joint ventures, followed by Chinese and foreign cooperation, sole proprietorship at least. Because Hong Kong businessmen can invest in the use of forms of cooperation on behalf of Mainland enterprises to obtain loans, tax also have concessions. Hong Kong businessmen operating in agriculture are generally integrated operation, such a comprehensive construction industry as far as possible, operators are related, such as species' dependent binding, feed, processing and marketing of connected vertical and horizontal contact-related, this is an industry-oriented business policy.
2. China's agricultural sector use of foreign direct investment constraints
1) China's current agricultural production to home-based small-scale farmers decentralized mode of production
also accounted for a large proportion. Farmers do not have a strong concept of market-oriented agricultural production specialization, scale and operation of the low level of organization, together with many people will be less, backward agricultural plant production technology, coupled with large-scale agricultural investment, and long cycle by natural conditions and many Variable factors affecting large, capital-output scale effects, etc., it is difficult to effectivelyattract foreign investment in the modernization of large-scale.
2) Although agriculture has been included in the country to encourage foreign investment in industry, but in the
policy has not been effective on the embodiment. Such as foreign investment in comprehensive agricultural development and eco-tourism on agriculture in the use of rural collective land on the long duration of the examination and approval procedures cumbersome and not reflect the corresponding incentive measures; We encourage foreign investment to improve the barren hills, flood, etc., to encourage foreign investment in comprehensive agricultural development in central and western regions, but did not introduce differentiated preferential treatment; In addition, foreign investment in agriculture and investment in the general processing and manufacturing in the examination and approval management, tax breaks and financing conditions, there is no difference between an objective impact on the enthusiasm of foreign capital to enter.
3) Our country is lagging behind the legislative work. Agricultural areas, especially agricultural use of foreign capital flow of the service sector the lack of corresponding laws and regulations guide. In accordance with China's accession to the WTO commitments, China's accession to the WTO will be at 2-4 years after the permit foreign enterprises established in China engaged in agriculture, forestry, animal husbandry, fisheries-related services, joint ventures;. Permit the establishment of a joint venture warehousing services; Permiti foreign service enterprises engaged in chemical fertilizer, agriculture, plastic sheeting and other agricultural means of production, wholesale and retail business. However, the current relevant laws and regulations have not yet introduced, foreign investment in the above-mentioned areas of agricultural services are still no laws.
4) China's agricultural management system in agricultural products between the production and marketing,
between domestic and foreign trade, production, between production and investment management exist mutual
disjiont. Regional blockade, industry segmentation and monopoly as well as the Department irregular trading practices, agricultural products, storage, transport, domestic sales, exports and so there is a foreign trade monopoly franchise and export licensing and quota requirements, not only on a much greater extent, bound by our country agricultural production, circulation and import and export, while foreign investment in China's agriculture and agricultural products to enter the field of operation also constitutes a major obstacle.

International Journal of Business and Management November, 2009
129
3. China's agricultural sector to expand the use of foreign direct investment measures and recommendations
1) Continue to intensify our country in the agricultural infrastructure and scientific research on the input.Strengthen national agricultural industrialization and modernization of the guide, and strive to enhance the capacity of agricultural scientific and technological innovation, vigorously develop industrial management of agriculture, increase agricultural enterprises of various ownership, including the processing, circulation, import and export support for enterprises, the establishment of an international agricultural information release mechanism, actively promote international agricultural cooperation, vigorously develop the characteristics of agriculture, ecological agriculture, precision agriculture and water-saving energy-saving high-efficiency agriculture, improve agricultural productivity and the quality of agricultural producers, and enhance cooperation with foreign competition in the capacity for attracting foreign investment to create a good the basic conditions and external environment.
2) Speed up the legislative work in the field of agriculture, the agricultural sector for foreign investment to be
effective guidance and supervision. After China's accession to the WTO for agriculture and especially the commitment of opening up service sectors in agriculture. We must actively organize relevant experts and scholars in related fields to speed up research on the job, fully draw on foreign experience in the agricultural utilization of foreign capital and combined with the current world trend of agricultural development and national conditions of China's agricultural development characteristics, speed up the introduction is in line with the WTO rules can effectively protect and promote our country's agricultural development-related laws and regulations, foreign investment in agriculture on the Service to be effective guidance and management.
3) The agricultural sector to attract foreign investment to do indirect investment and direct investment in both.
Agricultural production affected by natural conditions, relatively large, many uncertainties, and the scale of agricultural production and high investment, long-term, objective constraints on the private sector and corporate investment enthusiasm and the World Bank and other international financial organizations to provide agricultural loans, has been the financing of agriculture in developing countries are the main channel. This requires that government agencies must be in the agricultural finance to play an active role. Relevant government agencies, therefore our country should continue to intensify our work, active use of foreign non-interest bearing and low-interest agricultural loans, increase our country agro-ecological environment and agricultural infrastructure inputs. At the same time, combined with our country's current economic development characteristics and trends of international capital flows, speed up the implementation of the existing well on the foreign direct investment in the field of China's agricultural policies, an appropriate adjustment of agricultural production, processing, circulation, marketing and foreign trade related taxes and fees, especially in agricultural products to further enhance the export tax rebate rate, increase the foreign tax, land use, financing and other aspects related to the encouragement and incentives, and further expand the scale and scope of agriculture and opening to the outside world, continue to devolve authority for approval, to simplify procedures reflect the country really effective to encourage foreign direct investment policies favoring agriculture.
4) Deepening of China's agricultural management and agricultural products circulation system. Agricultural products in the region to break up the blockade and trade restrictions, as soon as possible open, unified, competitive and orderly market system, and accelerate the establishment of more liberal, in favor of expanding exports of foreign trade system. On agricultural production, processing and circulation of the industry's domestic enterprises and foreign-invested enterprises equal treatment given to foreign-invested enterprises in agricultural production and operation and at the right to operate import and export and quota management on the basis of equal treatment, and further relaxed restrictions on foreign investment in the processing of agricultural products export enterprises, foreign trade rights for foreign investment in agriculture to create a more convenient and efficient market environment and the flow of supporting service system.
5) Combination of different countries and regions, foreign investment in agriculture and the characteristics of
our country to strengthen and guide the direction of foreign investment. For instance: For Japan and Korea, because of the domestic market is highly developed, the cost of production higher, while our country is relatively far from its domestic market with a near, low labor cost advantages, and actively guide the two countries to invest in our country agricultural product processing industry, such as production and processing of vegetables and fruit juice processing projects, will be our country as part of its agricultural products processing base. For Europe and the United States and other developed countries, in view of their investment in Chinese agriculture are optimistic about China's huge potential consumer market characteristics, and actively guide the investors in Britain and the United States and other developed countries to invest in our country's advanced technology-based agricultural projects, to give impetus to our country related to agricultural production and agricultural products processing technologies improve the level of.
References
Feng, Xuguang. (2003). The impact and the status quo of China's agriculture in attracting foreign direct investment. The world economy, 10:25-29.
Huang, Zhuhui, & Lv, Lica. (2005). China's agricultural use of foreign direct investment (FDI) Research. Journal of China Agricultural University, (Social Sciences), 2:12-16.
Lv, Licai, Gao, Yurong, & Huang, Zhuhui. (2007). China's agricultural direct utilization of foreign direct investment in the status quo, Problems and Solutions. Economic issues, 1:76-78.

Vol. 4, No. 11 International Journal of Business and Management
130
Human Resource Management: A Central Business Concern
in Today’s Economy
Kodjo Ezane Joseph (Corresponding author) & Changjun Dai
Glorious Sun School of Business and Management, Donghua University
Shanghai 200051, China
E-mail: [email protected]
Abstract
This paper highlights a theoretical framework for the value and importance of human resource management (HRM) in today’s economy, that is, globalization that has been having a noteworthy influence on the field of HRM. As the old economy was based on physical assets, today’s economy is based on knowledge and information and is characterized by electronic communication, computer, network systems, and satellite communication. A qualitative research design was employed. Questionnaire was conducted using Lawshe’s technique through an evaluation panel which was comprised of 14 participants. The various ratios of our results were higher than the content validity ratio (CVR) value of 0.51 for a total number of 14 panelists. The determination of the content validity index (CVI) was calculated through the mean of the CVR values. The CVI was 0.84 and this result indicated that our model is reliable and acceptable.
Keywords: Human resource management, Globalization, Knowledge economy, Lawshe’s technique
1. Introduction
Globalization is more and more impacting upon the management of human resources (HR). Coping with the international intensity of competition brought about by the “new economy”, a knowledge-based economy (KBE) has emerged to replace the old economy that focused on physical assets instead of the hearts and mind of the HR. This KBE utilizes the skills of the HR to the full, which created a new way of thinking about HRM and demands responses on behalf of HR managers. The driving forces of today’s economy have impacted upon the management of HR in a variety of ways: the penetration of technology and particularly the use of the internet in business environment has demanded different skills and competencies on behalf of employees and also had effects on education and training needs. Given the driving forces of today’s economy, it is clear that the nature of the management of HR is changing.
The thrust of this article is to look into the value and importance of the management of HR in today’s economy using a schematic diagram that depicts this value and scope of the management of HR within globalization (New Economy). To reach this objective, Lawshe’s (1975) technique was utilized to scrutinize the reliability of our results and validate the model that was presented to the evaluation panel.
This paper is organized as follows: The first section discusses the enterprises in today’s economy; the second section visits the management of HR within enterprises through the practices of staffing (recruitment and selection); placement and orientation; and training and development. The third and last section reads the drivers and tools (Internet; Today’s economy (Globalization); and Electronic or E-commerce) of today’s economy.
2. Literature Review
2.1 The Enterprises in Today’s Economy
Today’s economy is driven by the needs of customers for products and services that are alike throughout the world. In comparison to the old economy characterized by knowledge; financial capital; and the commitment of HR, today’s economy brings about knowledge; ideas; and information sharing. Today’s economy is global as different countries become increasingly interdependent thanks to the dynamics of trade in goods and services and flows of capital and digital. In its being global, the new economy is appreciably interrelated and gives room to business opportunities. It is based on knowledge sharing as knowledge management (KM) focuses on ‘doing the right thing’ instead of ‘doing things right’. Gates (1999) posits that KM is a fancy term for a simple idea. We manage data, documents, and people’s efforts. KM is necessary for enterprises as what worked yesterday may or may not work tomorrow. To remain aligned with the dynamically changing needs of the business environment, enterprises or organizations in today’s business atmosphere need to continuously assess their theories of business for ongoing effectiveness. As the new economy is a

International Journal of Business and Management November, 2009
131
knowledge society, the HR need to be facile in the application of new technologies to do their business contexts. Such understanding is indispensable so that they can assign “programmable” tasks to technologies to concentrate their time and efforts on value-adding activities that require inventiveness and originality. Moreover, in this globalization, information sharing and communication are conducive to organizational performance as studies (See for instance Argote, 1999) posit that knowledge sharing is a critical team process because if knowledge is not shared, the cognitive resources available within a team remain underutilized. Gunnigle et al. (1997) hold that employees are the lifeblood of organizations; that organizations’ workforce is one of its most potent and valuable resources. An employee managed effectively is a vital ingredient for the improvement and also for the sustaining of organizational performance. From this, we posit that in today’s economy, human resources as essential resources to organizations need to be respected and be given a reason for being in for instance helping them to understand the enterprise’s mission statement, vision, and values, and how these apply to their day-to-day working; engendering pride and commitment through the enterprise’s culture. Organizations or enterprises must respect their human resources by empowering them; caring and having a concern for their employees. Trust in employees; provide on-going training and personal development growth opportunities as the new economy requires.
The new economy will favor the rise of the knowledge worker. Knowledge workers are workers who use their intellect to convert their ideas into products, services, or processes. The main value of the knowledge workers to an enterprise in the new economy is their ability to gather and analyze information and make decisions that will benefit the enterprise. They (Knowledge workers) are capable of working collaboratively with and learn from each other; they are willing to take risks, expecting to learn from mistakes rather then be criticized (Rogoski, 1999). Knowledge workers are continually learning, aware that knowledge has a limited shelf life (Allee, 1997). In this new economy brains have become more valuable. Table 1 illustrates the characteristics and the influence of the drivers of the old economy and today’s economy.
(Insert Table 1 about Here)
2.2 The Management of Employees within Enterprises
HRM is to support and steer HRM throughout the enterprise or organization. HRM is the effective management of workers at workplace and examines what can or should be done to make working human resources more productive and satisfied. Treating a worker as a human being in their own right is all part of embedding humanist values within the enterprise or organization. But it is also about preparing for prospective success. Employees are seen as the most outstanding resource of the organization and strategic importance of HRM is acknowledged. The ultimate role of HRM is to support the enterprise and its workers (human resources) to achieve their goals and objectives as the role of HRM is changing with the change in the competitive market or business environment and the realization that HRM must play a more crucial or strategic role in the effectiveness of success of an enterprise. The strategic importance of HRM means that a certain number of significant element or concepts need to be addressed and applied. We are not going to give detailed or exhaustive elements of these concepts but we should rather address the following:
Analysis of problems that need to be solved for a profit-oriented objective;
Addressing issues like HRM as staffing (recruitment and selection); Placement and Orientation; Training and Development…
Train the human resources staff in focusing on the strategic value of the management of human resources and the importance of contributing to the enterprise’s profits.
As highlighted previously, today’s economy is characterized by knowledge and information as compared to the old economy (OE) characterized by financial capital; knowledge; the dedication of the employees. And what makes it different from today’s economy is the fact that this turbulent and aggressive business environment has favored a shift on the OE from physical assets to the value of human capital. Therefore, surviving in the new global business market, calls for improved productivity and increased competition. Due to the market becoming worldwide, enterprises in different industries have or need to upgrade their products and use technology skillfully in order to face increased competition. The most characteristic feature of today’s economy is that it can impact upon any phenomenon in any part of the globe (world). HRM is one of those phenomena that possess property to change under the influence of today’s organizations. It is based on the notion (as stated earlier) that human resources are humans, and they need to be treated as a basic business resource. The management of workers should be seen as understanding of the human aspect of an enterprise and its strategic role or value. From this approach, human resources have proficient responsibilities but also to prove themselves in other activities that are apt to bring revenue to the enterprises. This will allow enterprises to focus on staffing (recruitment and selection) and retention of employees in reducing turnover that disrupts work and negatively impacts enterprise performance. In their will of recruiting and retaining key human resources, enterprises in today’s economy can hire temporary workers through employee leasing network and resort to outsourcing as well, as outsourcing permits an enterprise or organization that contracts with another enterprise or organization to provide

Vol. 4, No. 11 International Journal of Business and Management
132
services that might otherwise be performed by in-house workers (human resources). Many reasons motivate enterprises or organizations to outsource different jobs, but the most important and significant advantage seems to be the fact that it often permits to save money. Countless of the enterprises that provide outsourcing services are able to do the work for considerably less money, as they do not have to provide benefits to their workers, and also have fewer overhead (indirect) expenses to worry about.
Given the structural making of the world characterized by the flow of technology and human resources across national boundaries, today’s economy will influence the different human resource function, namely, staffing (recruitment and selection) because recruiting, selecting and retaining high-quality and skillful applicants are advantageous for enterprises to be competitive in this challenging business environment. The ensuing section of this article highlights the following; Outsourcing; Temporary or contingent human resources and leasing of human resources issues.
2.2.1 Outsourcing
Outsourcing allows enterprises or organizations to focus on other business issues while having the details taken care of by external professionals or experts. This implies that a large amount of resources and attention that might fall on the shoulders of versed people (experts) in management can be utilized for more essential, broader issues within the enterprise. Though outsourcing is profitable for enterprises because it often helps them save money, many disadvantages are effective as well. Consequently, outsourcing often eliminates straight (direct) face-to-face communication between an enterprise and its customers. This fact implies that it impedes the enterprises to build up a noteworthy ‘partnership’ with their customers. And this is often conducive to disappointing results which bring discontent on one or both sides. Any susceptible information is more defenseless (vulnerable), and an enterprise may become a ‘slave’, that is, a very reliant on its outsource providers, which could cause problems, should the outsource supplier back out on their contract unexpectedly. Though outsourcing may prove highly beneficial for many enterprises, it also has some drawbacks. Therefore, it is important that each individual enterprise truthfully weigh up their want to find out if outsourcing is a practicable panacea.
2.2.2 Temporary Human Resources
As employers seek new ways to make the employment relationship more flexible, they have increasingly relied on a variety of arrangements popularly known as "temporary work." The use of autonomous contractors and part-time, temporary, seasonal, and leased workers has expanded tremendously in recent years. We view this change both as a healthy development and a cause for concern. On the positive side, contingent employment relationships are in many respects a sensible response to today's competitive global marketplace. The benefits are clear that various forms of temporary or contingent work can offer to both some management and some workers. Temporary arrangements let a number of enterprises or organizations make best use of employees’ flexibility in the face of seasonal and cyclical forces and the demands of modern methods such as just-in-time production. This same flexibility helps some human resources, more of whom must balance the demands of family and work. On the other hand, the temporary deals may be introduced merely to trim down the amount of payment paid by the enterprise or organization for the identical amount and value of work, which raises some serious social issues. This is particularly true because temporary human recourses or contingent workers are drawn disproportionately from the most vulnerable sectors of the workforce.
2.2.3 Leasing Human Resources
Human resources leasing is an arrangement in which an enterprise (called subscribing enterprise or firm) transfers its employees to another enterprise (called leasing firm) which specializes in HRM, payroll accounting, and risk administration to name a few. The subscribing enterprise leases their human resources back as employees of the leasing firm and usually pay more for their services than their salaries at the time of transfer. This way the payroll and associated expenses and taxes of the leased employees become the leasing firm's liabilities. An employee leasing company is a business, which by agreement and for a fee, places employees of a client company on the leasing company's payroll. In turn, the leasing company "leases" these employees back to their original employer, usually for limitless period of time. In a nutshell, employee leasing is a way for enterprises to provide a body of well-trained and long-term human resources who are capable of expanding as today’s business environment requires.
We cannot deny that today’s economy is characterized by the free flow of technology and human resources across national boundaries as well as the spread of information technology presenting an ever-changing competitive business environment. This will require the use of Internet; Electronic or E-commerce which are part of the drivers and tools of today’s economy. Therefore, the next section reads: The drivers and tools of today’s economy. Those drivers and tools are discussed in the section that follows.
2.3 The Drivers and Tools of Today’s Economy
The drivers and tools of today’s economy call for the Internet; Globalization; and the Electronic or E-commerce.

International Journal of Business and Management November, 2009
133
2.3.1 The Internet
The main characteristic of today’s economy is that the Internet is a means of getting and sharing information for people to use those knowledge and information for enterprises’ objectives and goals attainment. Korper and Ellis (2000) posits that the most widely part of the Internet that is used is the World Wide Web (WWW). The Internet has brought a new type of lifestyle and it represents a key ingredient in the new economy as the sharing of information and the effectiveness of communication are essential for business opportunities and for people around the globe.
2.3.2 Globalization
Globalization is an umbrella term for a complex series of economic, social technological, cultural and political changes seen as increasing interdependence, integration and interaction between people and companies in disparate locations. The most characteristic feature of globalization is that it can influence any process or phenomenon in any part of the world. Rapid development of international trade and growing concernment of information transfer have made even most conservative countries follow the rules of global processes. Human resource management (HRM) is one of those phenomena that possess property to change under the influence of globalization. HRM is both an academic theory and a business practice. It is based on the notion that employees are firstly human, and secondly should be treated as a basic business resource. HRM is also seen as an understanding of the human aspect of a company and its strategic importance. According to this approach employee has an ability not only to perform his professional duties but also to prove himself/herself in other activity that can bring profit for the company. This way employee has a sensation of being an important part of the company and gives the best return through his work.
2.3.3 Electronic-Commerce (E-Commerce)
The Internet has brought a new-fangled economic ecosystem (environment), the E-commerce marketplace, and it has turned out to be the practical most important street of the world. Providing a rapid and suitable way of exchanging commodities and services both nationally and globally, E-commerce has boomed. E-Commerce refers to consumer and business transactions that occur over the Internet, giving room to the speedy exchange of commodities (goods) and services worldwide. It is the electronic transmission of funds, goods, services and/or data between two businesses or a business and a client. E-commerce's key strengths are access to worldwide business environments (markets) as a result of the aptitude to process commercial transactions from approximately whichever setting in the world, and increased output through the creation of more efficient sales processes and the lessening in a company's expenses.
3. Methodology
3.1 Research design and method
We used a qualitative research design for this current study. To achieve the objective of our research, this research design was important to get data that would bring about a clear understanding of the value and importance of the management of human resources in today’s economy. To measure the different variables identified for this present research, the technique of Lawshe (1975) was utilized. Lawshe’s technique is essentially a method to gauge agreement among raters or judges regarding how essential a particular item is. Lawshe (1975) proposed that each of the subject matter expert (SME) raters on the judging panel respond to the following question for each item: “Is the skill or knowledge measured by this item “essential,” “useful, but not essential,” or “not necessary” to the performance of the construct?” According to Lawshe (1975), if more than half the panelists indicate that an item is essential, that item has at least some content validity (CV). Greater levels of CV exist as larger numbers of panelists agree that a particular item is essential. Our objective in referring to Lawshe’s technique for our inquiry is to determine the reliability and validity of the findings for the model to be developed to pinpoint the value and importance of HRM in today’s economy. This research was conducted in two phases. Phase one consisted in data gathering and phase two in data analysis.
3.1.1 Data gathering
3.1.1.1 Population and sampling
As Lawshe’s technique requires that panelist have a sound expertise in a specific field, our sample is comprised of fourteen (14) respondents who are deemed to be experts in the management of human resources. These participants form the evaluation panel for us to obtain the required data to draw conclusions.
3.1.1.2 Questionnaire distribution
The model was presented to the evaluation panel (N=14). Questionnaires was structured and the participants were instructed to evaluate the model of the study with regard to their expertise using a 3-point likert scale (Likert, 1932) (1= Essential; 2= Necessary but not essential; and 3=Unnecessary).The questionnaire comprised the following: The schematic presentation of the model; The enterprises in today’s economy; the management of human resources within enterprises; the drivers and tools of today’s economy; the value of human resource management in today’s economy through staffing (recruitment and selection); placement and orientation of human resources; training and development

Vol. 4, No. 11 International Journal of Business and Management
134
of human resources. We utilized the commercial software package for social sciences (SPSS, Version 11.0) to perform the calculation.
3.2 Data analysis
Lawshe’s technique was utilized for data analysis. Lawshe’s (1975) Content Validity Ratio (CVR) can be utilized to assess the content expert judgment. Lawshe’s (1975) specified a formula for determining a minimum CVR for different panel sizes. According to this formula, a minimum CVR value of 0.51 is required for fourteen (14) panel members. Lawshe developed a formula termed the content validity ratio (CVR):
CVR = (Ne - N/2)/(N-2)
CVR= content validity ratio, Ne= number of subject matter expert (SME) panelists indicating “essential”, N= total number of SME panelists. This formula yields values which range from -1 to +1. The CVR value ranges from -1.00 and +1.00, where a CVR of 0.00 means that 50% of the experts in the panel believe that a measurement item is “essential” and, therefore, content valid; positive values indicate that at least half the subject matter expert (SME) raters rated the item as essential, that experts are in agreement that the item is essential to content validity (CV). To determine content validity (in relation to our paper), a panel of SMEs examined a set of items indicating whether the items are essential, useful, not necessary. The CVR is calculated to indicate whether the item is pertinent to the content validity (CV). The mean CVR across items may be used as an indicator of overall test for CV. The scope of the CVR can be derived from the following:
When fewer than half say “very important”, the content validity ratio (CVR) is negative.
When half say “essential” and half do not, the CVR is zero (0).
When the entire panelist says “very important”, the CVR is computed to be 1.00 (It is adjusted to 0.99) for manipulation.
When the number saying “essential” is more than half but less than all, the CVR is somewhere 0 and 0.99.
4. Results and discussion
The schematic presentation of the model has a CVR value of 0.7 as 12 panelists say “essential”. The ensuing variables: the enterprises in today’s economy; the drivers and tools of today’s economy and the value of the management of human resources in today’s economy all have a CVR value of 1% as 14 panelists chose “1” indicating “essential”. The variables “the management of human resources in today’s economy”; “staffing (recruiting and selection)”; “outsourcing”; “temporary human resources” and “leasing human resources”, have a CVR value of 0.8 as 13 panelists say “essential”. These results are noteworthy and within acceptable limits, which require that our model be validated as the CVR value of this current research are in line with the characteristics of the CVR and according to Lawshe (1975: 568), a total number of 14 panelists have a minimum acceptable CVR Value of 0.51. From the results of our findings,we notice that the various ratios of our results are higher than the CVR value of 0.51 for a total number of 14 panelists,which implies the validity and acceptance of the model and its components. It was then imperative to determine the content validity index (CVI) and the determination of the CVI brought us to calculate this CVI subsequent to the identification of the items which were to be included in the concluding outline. Therefore, the CVI was calculated through the mean of the CVR values of the different variables of the model mentioned previously. This was done by the sum total of the CVR divided by the total number of the variables identified for the study. The CVI for this study is 0.84 which is between the ranges of -1.00 to +1.00 as suggested by Lawshe’s technique (1975). The results of our different findings are noteworthy and significant and they imply that our model (See Table 2) is reliable and acceptable.
(Insert Table 2 about here)
The value of the management of human resources in today’s economy is to integrate the elements of that economy into the diverse processes and policies strategies of the enterprises by putting the human resources on their balance sheet as they are fundamental pillars for enterprises to be healthy and competitive. The incorporation of the aspects of that economy into the different processes and policies of the enterprises is to be done through the issues of staffing (recruitment and selection); placement and orientation; and the development of human resources (training and development). Embracing the drivers and tools of today’s economy will bring about competitive advantage to the enterprises. With the emergence of this global village (New Economy), enterprises that do not want to lag behind others will have to adopt a people-focused policy that puts their people first, that is, at the center of their corporate strategy. Intoday’s economy impacted by this technological revolution that requires information and communication technologies, the management of human resources is essential as it should be related to the drivers and tools (Internet, Globalization, E-commerce) of the enterprises as human resources are the most important assets of an enterprise; a business cannot be successful without effectively managing this resource.
5. Conclusion
The scope of this paper was to build up a model that describes the value and importance of human resource management (HRM) in today’s economy. To reach this objective, we utilized Lawshe’s (1975) technique that is

International Journal of Business and Management November, 2009
135
essentially a method to gauge agreement among raters or judges regarding how essential a specific item is. This technique allowed us to determine the content validity (CV) of the model through an evaluation panel. The results of the CV (0.84) indicated that the result is significant. Therefore, the model was noteworthy and within acceptable limits. The findings of this paper provide a piece of jigsaw of the value and importance of the management of human resources in the new economy. Our findings imply that in today’s economy, human resources within enterprises should be treated as a basic resource. They should be at the heart of enterprises, that is, on their balance sheet as they (human resources) are the pillars of those enterprises for them (enterprises) to move from mediocrity to excellence. As the intent of this paper is to develop a model that highlights the value of HRM in today’s economy, the validation of the model should be done through a significant number of data. Ideally, data from various fields could help in determining if the measure is indeed generalizable. Collecting data across a variety of fields and expertise could be of great help to the management of human resources in today’s economy. Such data could identify individuals that may or may not possess expert-like skills in those areas.
References
Allee, V. (1997). 12 Principles of Knowledge Management. Training and Development, (51), No.11, November, pp.71-75.
Argote, L. (1999). Organizational Learning: Creating, Retaining, and Transferring knowledge, Boston: Kluwer Academic cited in Abhishek S., Kathryn M. B., and Edwin A. (2006). Empowering Leadership in Management Teams: Effects on Knowledge Sharing, Efficacy, and Performance. Academy of Management Journal (49), No.6, 1239-1251.
Gates, B. (1999). Business The Speed of Thought-Succeeding in the Digital Economy, Penguin Books Ltd.
Gunnigle, P., Heraty, N., and Morely, M. (1997). Personnel and human resource management: Theory and Practice in Ireland, Gill and Macmillan Limited.
Lawshe, C. H. (1975). A quantitative Approach to Content Validity. Personnel Psychology, (28): 563-575.
Likert, R. (1932). A Technique for the Measurement of Attitudes. NY: Archives of Psychology, 140.
Korper, S and Ellis, J. (2000). The E-Commerce Book-Building the E-Empire, Academic Press.
McGregor, J., and Tweed, D., and Pech, R. (2004). Human Capital in the New Economy. Emerald (5); No. 1, pp. 153-164. [Online] Available: http://www.emeraldinsight.com (Retrieved from June 2009)
Rogoski, R.R. (1999). Knowledge Workers Top Company Assets. Triangle Business Journal, 14, No. 19, (January 8: 21).
Table 1. Transitional Model of Human Capital in Today’s Economy
Drivers/Influence Old Economy New Economy
Attachment Factors
Long tenure-the Career Employee Short-term Involvement contract; Self-employment Shareholder
Dependence/Dependability Adaptation/Adaptability
Motivation Factors
Psychological Contract of a job for life-security
Intellectual Commitment-stimulation of Job
Regular salary Lure of Increased Monetary Rewards
Work Practices Factors
Regular; Continuing Factors and Processes
Consecutive and Sequential Projects
Reward Factors Stable Reward Structure Volatile Reward Structure
Internal, Vertical Promotion Cross-Boundary Advancement
Development Factors
Training Education
Career Related to Training to further Self-actualization in Company and Improve Company Capacity
Self-Actualization through Professional Development within and without Company
Company Specific Skills Transferrable Knowledge
Cultural Factors More Control of Individuals Greater Autonomy of Individuals
Organizationally Driven Individual and Team Driven
Organizational Factors
Single Employer Certainty Multiple Employers Ambiguity
Adapted from McGregor et al. (2004)

Vol. 4, No. 11 International Journal of Business and Management
136
Table 2. The Schematic Model of The Value and Importance of HRM in Today’s Economy
Enterprises in Today’s
Economy
The Management of Human Resources within Enterprises
Placement and Orientation of
Human Resources
The Drivers and Tools of Today’s
Economy
Globalization or Today’s Economy Electronic-C
Internet
Staffing (Recruitment and Selection)
of Human Resources
Training and Development
of Human Resources

International Journal of Business and Management November, 2009
137
Study on the Function of XBRL and the Enhancement of the Accounting
Information Quality under the Background of Informationization
Xin Yuan & Yanyan Wang
Shandong Economic University
Jinan 250014, China
E-mail: [email protected]
Abstract
As a new information standard and technology supporting the accounting internationalization and the globalization of financial report, XBRL (eXtensible Business Reporting Language) has not been concerned by Chinese enterprises and accounting personnel in the time that the informationization develops so quickly. Under the background of informationization, the functions of XBRL are discussed in the article to enhance the accounting information quality, which indicates that China should well grasp the demands of the economic development and the promotion function of the accounting information processing technology to the accounting.
Keywords: Informationization, XBRL, Accounting information quality
1. Definition of XBRL
According to the definition of XBRL international organization, XBRL is a kind of language used in the electric communication of enterprise financial data, and it is thought to be changing the financial reporting mode of the world now. XBRL was developed to compile and issue network financial reports for the corporation, basing on the XML (eXtensible Markup Language) framework. It adds the marks to relative financial information to make the collection, processing and conversion of interior and exterior financial information become more convenient and effective. The biggest difficulty in the R&D of XBRL is to establish the XBRL classification system according with the rules of the financial report to make XBRL suit for the current financial reports.
2. Characters of XBRL
XBRL is the technical standard which is opening and free, and can be widely acquired. It can offer only identifiable mark for each meta-code, and these marks can be read by the computer. For example, after the only mark of the retained profits is set up, the computer can automatically process the information of the report forms of the company, which can largely reduce many manual works such as repetitively inputting, comparing and analyzing. The computer can “intelligentize” the data of XBRL, and identify, pick up, analyze and store the information of the XBRL documents, and exchange information with other computers, and automatically report according to users’ required forms. XBRL can quicken the processing speed of financial data, reduce the mistakes, and automatically check information. The present report form of the enterprise reporting to the supervision department is the information format based on text or natural text expressed by commercial language. But the reports with XBRL form adopt the information based on document expressed by the computer language, which can translate the present text information into the information which can be automatically picked, searched and analyzed, and realize automatic exchange of data on different software platforms including internet, and reduce or avoided inconveniences and mistakes.
In recent years, XBRL has been widely applied all over the worlds, and many national securities supervision institutions and exchanges such as SEC, CSA, Toronto Stock Exchange, Korea Exchange, Tokyo Exchange, Shanghai Exchange and Shenzhen Exchange all have participated in the application of XBRL. The application of XBRL has gradually been embodied in various parts of the financial report chain.
3. Influences and functions of XBRL in the enhancement of the accounting information quality
The influences and functions of XBRL in the enhancement of the accounting information quality are mainly embodied in following aspects.

Vol. 4, No. 11 International Journal of Business and Management
138
3.1 Enhancing the relativity, reliability and in-time feature of the accounting information
On the layer of system, the accounting rules standardize the accounting information quality standards, but it still adopts the traditional financial report mode which could offer highly comprehensive and general financial information to information users, but ignore the differences of different information users’ demands, lack in non-coin information descriptions for the enterprise management activities, inevitably lose the meanings of many accounting data in the processes such as classifying, manufacturing and collecting and increase the difficulty to distinguish information for users. The traditional financial report mode adopts the reporting mode on the appointed time and position, which is difficult to fulfill information users’ requirements for the time-sensitivity of the information in the information economic time.
XBRL offers a new financial report mode in the internet environment, which takes the XML as the technical base. Because XML is a kind of “meta tag language”, it can divide the contents and the report format, and allow users to define corresponding data marks (tags) according to their own demands. The technical frame of XBRL includes XBRL Specification, XBRL Laxonomy, XBRL Instance and XBRL Stylesheets. The classification standard of XBRL financial report is the total appellation of various tags on each information element attached the financial report, and it is used to define the data elements in the instance documents and the relations among these elements, and its main intention is to offer a standard which can present the financial information of different industries and enterprise by same form. The instance document is the set of data elements which corresponds with the original codes in the financial report of the enterprise. The Stylesheet of XBRL is mainly used to define the display format of the financial report, and for the XBRL instance documents in same financial report, it can output various report forms by different stylesheets.
The application of the XBRL technical principle on the layer of the financial report is to classify a kind of non-structured information texts (such as the Word format or the PDF format) of the financial report according to standard financial information meaning, and make it to become standard “information material” of financial report with tags, i.e. translate the electric non-structured financial report texts of the enterprise into the structured XBRL instance documents with tags, convenient for further processing of information technologies such as structured text searching technology and the information analysis in the internet environment. Therefore, by adopting the financial report of XBRL format, information users need not seeking required “information materials” from deep financial report texts, and because these “information materials” all possess standard format with uniform tags, which can fully utilize the computer software technology to compare, and largely enhance the decision pertinence of the accounting information by exporting useful accounting information by different stylesheets.
The XBRL disclosing technology requires the enterprise to explain the standards such as the accounting rules and policies followed by the financial report (such as adopting the historical cost or the fair value), and store the promissory explanation documents with clear concepts on the information platform of the enterprise, and make them in the state of checking, which can increase the intelligibility of “information materials”, and help information users to comprehensively understand the financial report, and enhance the reliability of the accounting information.
In addition, the financial report of XBRL format can be disclosed in the website of the company, and can be issued on the appointed website, which can fully exert the advantages of the internet and the computer information processing technology and the enhance the in-time feature of the accounting information.
3.2 Developing and utilizing the financial information resources to enhance the applied values of the accounting
information
The development and utilization of the financial information resources means the process separating, collecting and reprocessing financial information in the financial report and generating new and more valuable economic information. The quick development of the computer network and information technology offers the support for the development and utilization of financial information resources. And the present financial reports issued by PDF or WORD or HTML format are just the electric paper financial reports which can be read only the read software. If the financial report data of relative enterprises or certain enterprise in past years need to be collects, the costs and risks of data acquirement will be increased largely, which can not fulfill the development of the potential application of the network technology.
XBRL will change the compiling mode and the reporting mode of financial information radically, and it could offer a new technical system about standards and specifications for enterprises to compile, store and issue financial reports and other information on internet, and it can the essential problem about the integration of financial information disclosing and financial data acquirement and the trans-platform use, and the information users all over the world can quickly search, collect and analyze the enterprise financial information according to their own demands by internet. For example, Shanghai Exchange and Shenzhen Exchange could convert the electric general financial reports referred by enterprises into structured instance documents with uniform tags and XBRL format by the XBRL format converter for storage. The information users can directly enter into the application software to analyze and process the data of financial reports on the website, and generate various reports by relative tool software, which can help users to make

International Journal of Business and Management November, 2009
139
optimal decisions, and further enhance the application values of the accounting information.
3.3 Improving the interior management information system platform of the enterprise and utilizing the accounting
information in time to enhance the management performance
XBRL can strengthen the communication among information systems in the enterprise and the repetitive utilization of trans-platform data, help to compile the interior management accounting reports and enhance the comprehensive utilization level of the management accounting information. For the large-scale enterprises especially for the group enterprises, the networking management information system is the platform for the enterprise to implement the management and operation. But the information systems of these large-scale enterprises or group enterprises are established and perfected gradually. Generally, the application platforms of the information systems among different sub-companies or departments, and especially for the group enterprises which engages in the productions and managements of different industries, the interior different databases or different management information systems will induce the obstacles of data exchange and data sharing among interior information systems in the enterprise, which can not fulfill the senior managers’ information demands. The technical principle of XBRL platform independent can offer solutions with low cost and high quality for the data exchange among different information systems. It can design the I/O conversion interface with uniform format and function based on XBRL for original information system, which can combine and collect information generated in different information systems in the enterprise and fulfill the comprehensive application demands of the enterprise group for the interior management information, and enhance the quality of the interior control. The application of XBRL bottom classification standard can help the management layer of the enterprise to inquire relative detailed information at any moment when reading the management accounting report, but not only collect the numbers, which obviously could enhance the managers’ comprehensions to the data of the report form, and help them to make effective management decisions.
3.4 Financial report of XBRL can enhance the transparence of the accounting information
XBRL allows the financial information to keep the original context, which can enhance the transparence of the accounting information. For example, for one foreign exchange contract, many details such as unit, sum and time can be associated with each factor of the contract. XBRL could add the bar code for each factor in the contract materially, so the users can easily understand and dig the items of the transaction, which can largely enhance the adjustment between the report numbers and the actual cash fluxes.
In addition, large issuance quantity of the financial report can also enhance the transparence of the accounting information. It is very important to offer timely and reliable management performance materials, and XBRL can use public financial materials with any formats to generate financial reports by the application program. The issuance on internet could not only help the investors to make decisions, but help the auditing institution to supervise the financial reports real time.
References
Pan, Yan. (2003). XBRL and Its Influences on the Accounting. Accounting Research, No.1.
Shen, Yingling. (2002). Research of Network Financial Report. Thesis for Doctor’s Degree of Shanghai University of Finance and Economics.
Shen, Yingling. (2004). The Technical View on Accounting Globalization. Accounting Research, No. 4.
Yao, Zhenghai. (2005). XBRL and Its Applications in China. Communication of Finance and Accounting, No.4.
Zhang, Tianxi. (2006). On Internet Financial Reporting: the Theoretical Basis of XBRL. Accounting Research, No. 9.

Vol. 4, No. 11 International Journal of Business and Management
140
Study on the Maturity Evaluation System of the County Economy Cooperative Development
Su Zhang
School of Economics and Management, Changchun University of Science and Technology
Changchun 130022, China
E-mail: [email protected]
Abstract
It is a systematic project to evaluation the cooperative development of certain county economy. Based on the meanings of the county economy cooperative development, the maturity of the county economy cooperative development based on the recycle economy is introduced, and the principles to establish the maturity evaluation index system of the county economy cooperative development are proposed, and a reasonable evaluation index system is established in the article.
Keywords: County economy, Cooperation, Maturity
1. Meanings of the county economy cooperative development
Since reforming and opening up, the local economic and social developments in China have achieved great achievements, and people’s living levels in various regions have been largely improved. However, the problem of the inconsistent regional developments is more and more prominent, and the gap of the GDP per capita among regions are expanding, and so is the gap of the public service levels enjoyed by different regions. If the situation continually develops, it is hard to ensure the harmony of the society, the stability of the politics and the sustainable development of the economy, and the historical mission to build a well-off society in an all-round way will not be completed, so it is important and urgent to improve the harmonious development among regions.
The regional harmonious development has not been defined scientifically and admittedly up to the present, and its concept should be studied comprehensively. To describe the good mutual relationships among factors in the system, some scholars thought that the original meaning of the harmony was “to harmonize identically and cooperate expediently”. That was the early description and definition about the harmony in China, and it only proposed and emphasized the interior harmony in the system. Subsequently, other scholars developed its meaning, and they took the region as a PRED system, and pointed out that the harmony should mainly describe the situation about mutual function and cooperation among systems, and begun to pay attention to the association between the harmony and the system. At the same time, there were other scholars who begun to study the harmony in another meaning, i.e. to realize the mutual development by establishing the cooperative relationships among regions, which emphasized the association and good cooperation among regions, so the regional harmonious development begun to be understood and defined more completely and broadly, but the relative studies have not be developed in an all-round way.
Making a comprehensive view on scholars’ discussions about the definition of the regional harmonious development, the course of the study about the regional economy cooperative development can be simply summarized. It extended from the harmony among counties (or systems) to the harmony between interiors and exteriors and to the emphasized exterior harmony, and this course is consistent with the direction of the economic development, and shows obvious feature of stage and development tendency. In the day that the economy develops quickly, the harmony among interiors and exteriors of the county is very important for the development. The meaning of the county economy cooperative development should be generalized, and the word of “harmony” in existing researches often occurred with “reducing the regional gap”, and with the continual development of the economy, the researches about the competition and cooperation among counties, the county cooperation, the county association, the county integration will enrich and develop the meanings and connotation of the harmony, so if one of above concepts is understood as the definition of the county economy cooperative development, it will take a part for the whole, and in existing researches, above words were often crossing to be used, which shows that different scholars would differently understand the county economy based on different development bases, and all above concepts will be listed in the category of the county economy cooperative development (Wang, 2006, P.125-138).
Thus it can be seen that the county economy cooperative development can be defined by the interior harmony of the

International Journal of Business and Management November, 2009
141
county and the exterior intergrowth of the county. The county economy cooperative development integrates the whole feature, the inherence and the comprehensive feature to form an organic integer with mutual cooperation and improvement in the interior of the county, and create optimal total benefit by good competition and close cooperation, and form the sustainable development situation including economy, society, culture and ecology with mutual supplements of advantages and linkages, and achieve a kind of super stage with highly harmonious development in the interior and exterior of the county.
2. The maturity of the country economy cooperative development based on the recycle economy
As viewed from the influences of the resource flow and the economic growth on the resources and environment, the growth pattern has two modes. One mode is the traditional mode, i.e. the single-directional beeline process of “resources-products-castoffs”, under which mode more resources are consumed, the negative influences on the resources and environment are larger. The other mode is the feedback-recycle process of “resources-products-castoffs-renewable resources”, which can more effectively utilize the resources and protect the environment, and acquire possible large economic benefits and social benefits by possible small resource consumption. Generally speaking, the recycle economy takes the highly effective utilization and recycle utilization of resources as the core, and takes “reduction, recycle and resources” as the principles, and it is the essential reform of the traditional growth mode with “mass production, mass consumption and mass disuse” (Wu, 2005, P.9-198).
The recycle economy is a new development concept, and it embodies the development direction of the environment protection, reflects the essential contents of the sustainable development, and is the guarantee to realize the county economy cooperative development (Qing, 2006, P.119-127), which is embodied in following aspects.
(1) The recycle use of resources can ensure the developments of the economy and the society.
To guarantee the developments of the economy and the society is the basic principle to realize the industrial cooperative development of the county economy. Before the knowledge economy is realized, the utilization of natural resources still is the decisive factor of the economic development. Starting form the concept of big system analysis, the recycle economy controls the gross to solve the problem of resource shortage by the resource recycle, which is the best method obviously.
(2) The recycle economy guarantees the cooperative development of economy, society, environment and ecology.
The cooperative development of economy, society, environment and ecology is the basic principle to realize the industrial cooperative development of the county economy. The recycle economy minimizes the discharge of castoffs to furthest protect the environment. Starting from the opinion of the balance of the ecological system, the recycle economy intervenes in the ecological system as little as possible to protect the balance of the ecological system, and it reduces the developments of natural resources and maintains it in the carrying capacity of the ecological system. At the same time, the recycle economy takes the ecological construction as the infrastructure construction to largely promote the harmonious development of economy and ecology.
(3) The recycle economy guarantees the generation balance of the resource utilization.
The principle followed by the recycle economy is to utilize the renewable resources as more as possible, guarantee the renewable ability of the renewable resources, leave more renewable resources for next generation, and realize the generation balance of the resource utilization.
(4) The recycle economy can promote the regional cooperative development in the region.
When the industrialization is completed, the difference of the possession of natural resources will be most important factor to influence the balance of the regional development. The recycle economy advocates the recycle utilization of resources, so it can largely reduce the unbalance of regional development induced by the difference of the possession of natural resources. In the production, the recycle economy utilizes the principle of high science and technology as more as possible to eliminate the regional differences. From above two aspects, the recycle economy can promote eliminating the poverty with deficient resources.
In above analysis, when human production mainly depends on the utilization of natural resources, the guarantee to realize the industrial cooperative development of county economy is to largely develop the recycle economy.
3. Principles to establish the maturity evaluation index system of the county economy cooperative development
To establish the maturity evaluation index system of the county economy cooperative development, following principles should be followed.
3.1 Principle of identical target
First, the evaluated objects and evaluation target should be confirmed, and the evaluation target is mainly embodied by the evaluation system, so it must ensure the identity of the evaluation system and the evaluation target.

Vol. 4, No. 11 International Journal of Business and Management
142
3.2 Principle of science
To establish the index system should persist in the principle of science. Following the rule of affair development can help to apply modern scientific management technology to ensure the reasonability of the content and structure of the index system.
3.3 Principle of combining the complete feature with the pertinence
When selecting evaluation indexes, except that comprehensively considering the research target and the functions of different indexes, the basic character of the industry and the basic natural conditions about the existence and development should be reviewed also. For any one industry, the basic conditions of its existence and development depend on the investment guarantee, the output efficiency and the market acceptation ability. Therefore, to evaluate the regional industry, the establishment of relative indexes should reflect not only the basic character of the regional industry, but also the basic conditions of the existence and development of regional industry.
3.4 Principle of validity and principle of feasibility
When following the complete feature, the establishment of the index system should not pursue perfection and exaction, but pursue simple and effective. Those indexes which don’t influence the target evaluation largely or don’t show difference among evaluated objects should be deleted. Except for that, the establishment of the index system should start from the practice and combine demand with possibility, i.e. accord with the principle of validity and principle of feasibility. For the selection and evaluation of the regional industry, there are so many side-statistical data should be studied, but for some indexes, the relative data in real statistical materials can not be collect or exist. Therefore, startingfrom practical situation, this article can only collect relative data and materials from various yearbooks issued publicly to establish the index system of the regional industry evaluation.
3.5 Principle of independence
The indexes on the same level in the index system should be independent each other, which can ensure that same target can not be computed repeatedly, and the independence of each index is the premise of various weight methods. But the relationships among different indexes can be affiliation, and can be dependent (Li, 2003).
4. The maturity evaluation index system of the county economy cooperative development
According to the idea of the multilevel hierarchical structure of the big system, as the big social economic system, Chinese county economy is an organic integer including society, economy, science and technology, and environment, and taking human activities as the center. Except for general characters of the big system such as large scale, complex structure, comprehensive function and numerous factors, it still has its own characters and possesses obvious opening feature. Figure 1 is the sketch map of its structure.
As seen in Figure 1, the low level (the first level) is the local control level of various subsystems (society, economy, science and technology, environment) in the big system of county economy, and it directly controls various controlled factors (i.e. the indexes in various subsystems in the cooperative development evaluation index system) in the subsystems. The middle level (the second level) is the hierarchical cooperative development control level, which uses the cooperative control model to analyze the associations among various subsystems, controls cooperatively various subsystems by the optimal measure, and offers the optimal strategic schemes and comprehensive data information for the cooperative development. The super level (the third level) is the comprehensive evaluation control level, which establishes corresponding comprehensive indexes and implementation schemes by the hierarchical structure and cooperative development index model to realize the total target of the county industrial cooperative development. These three hierarchical control levels are integrated each other, and they can put forward corresponding industrial cooperative development evaluation index system through qualitative analysis (including the policies and guidelines of the party and government, the social development theory, leaders and experts’ opinions), establish a set of practical method, and compute concrete result by proper quantitative model description.
In recent years, for the research about the cooperative development and the cooperative development strategy of various subsystems in the social economic system in China, the “four-division method (the cooperative development of economy, science and technology, society and environment)” was generally adopted, which highly emphasized the basic natural and material status of the ecological environment in the modernization construction. According to the basic ideas that the economy is the base, the science and technology is the power, and the environment is the guarantee, and the principles of science, simple and system, various indexes matching with the county economy development are selected to design the index system of the county economy cooperative development.
4.1 The subsystem of society
(1) The total population (X11): it is the index to reflect the total amount of the population in the county;
(2) The proportion of the rural population in the total employment population (X21): it reflects the employment situation

International Journal of Business and Management November, 2009
143
of rural farmers;
(3) The bed capacity of social welfare homes per ten thousand people (X31): it reflects the social welfare condition and
level;
(4) The bed capacity of hospitals and health centers per ten thousand people (X41): it reflects the medical condition and
level;
(5) The telephone popularization rate (X51);
(6) The year-end unit employment number (X61);
(7) The total power of rural mechanisms (X71).
4.2 The subsystem of economy
(1) The balance of the rural and urban resident savings (X12): it reflects the index of savings of rural and urban
residents;
(2) The far products offered by ten thousands farm people (X22): it reflects the marketization degree of farm products
and the development degree of the rural market economy;
(3) The scale-above gross industrial output (present price) (X32): it reflects the development situation of scale-above
enterprises, and it is the important index that the social production develops to depth and extent;
(4) The balances of various loans of the financial institutions in the year-end (X42): it is the important index to reflect the
investment situation;
(5) The accomplishment amount of the fixed asset investment (X52): it is the important index to reflect the after effects
of the county economy and the social development;
(6) The local finance payout (X62): it is the important index to reflect the payout degree of the county economy;
(7) The first industrial increment (X72): it is the important index to reflect the development of the first industry;
(8) The second industrial increment (X82): it is the important index to reflect the development of the second industry.
4.3 The subsystem of science and technology
(1) The scale-above industrial amount per ten thousand people (X13): it is the important index to reflect the population
quality of science-technology;
(2) The student amount in common high schools per ten thousand people (X23): it is the important index to reflect the
population quality of culture;
(3) The student amount in common schools per ten thousand people (X33): it is the important index to reflect the
popularization degree of the basic education;
(4) The trading quantum of the technical market per capita (X43): it is the important index to reflect the marketization of
the technology;
(5) The proportion of the science-technology payout in the local finance payout (X53): it is the important index to reflect
the investment degrees in education, science-technology and culture.
4.4 The subsystem of environment
(1) The target hitting rate of the industrial waste water disposal and discharge (X14);
(2) The disposal rate of industrial waste gas (X24);
(3) The comprehensive utilization rate of industrial solid wastes (X34);
(4) The using rate of green resources (X44): it reflects the recycle feature of the resource utilization (Wang, 2006).
Above four indexes reflect the degree of economic development to the environment pollution and the ability of the development of environment protection science and industry to the pollution treatment.
References
Li, Peng. (2003). Study on the Cooperative Development of County Economy. Beijing: Economic Management Press.Oct of 2003.
Qing, Lidong. (2006). Study on the County Cooperative Development. Beijing: CPC Central Party School Press.P.119-127.
Wang, Chuanmin. (2006). Study on the County Economy Industrial Development Mode. Beijing: China Economy Press.P.125-138.
Wang, Chuanmin. (2006). Study on the Industrial Cooperative Development of County Economy. Beijing: Doctor’s

Vol. 4, No. 11 International Journal of Business and Management
144
Thesis of Beijing Jiaotong University.
Wu, Jisong. (2005). New Recycle Economics. Beijing: Tsinghua University Press. P.9-198.
Figure 1. Multilevel Hierarchical Structure of the County Economy Cooperative Development

International Journal of Business and Management November, 2009
145
Forensic Accounting: Public Acceptance
towards Occurrence of Fraud Detection
Adrian Nicholas Koh
KBU International College, Malaysia
E-mail: [email protected]
Lawrence Arokiasamy
Universiti Tunku Abdul Rahman, Malaysia
E-mail: [email protected]
Cristal Lee Ah Suat
KBU International College, Malaysia
E-mail: [email protected]
Abstract
In recent years, accounting fraud has occurred widely throughout the globalised business sector. This does not exclude Malaysia as it is emerging as one of the many countries with high expanding rates of business deals. Due to the fact that Malaysian companies are still new and inexperience in managing business and its accounts, this has created undetected loopholes for accounting fraud committers. This has also created bad perceptions by the public regarding the various fraudulent activities that emerge in the country. Therefore this article examines the public acceptance towards occurrence of fraud detection which plays a vital role in business growth. The uniqueness of this paper focuses on the literature review on the public acceptance on fraud detection. This article maps out the importance of fraud detection to strengthen and be competitive in the business.
Keywords: Forensic accounting, Public acceptance, Fraud and fraud detection
1. Introduction
The increasing demand of forensic accounting is a recognized feature of most companies. Forensic accounting arises from the cause and effect of fraud and technical error made by human. It is fairly new in Malaysia as companies have realized that this service is needed in recent times as fraud cases have substantially increased in number. Forensic and investigative accounting is the application of financial skills and investigative mentality to unresolved issues, conducted within the context of the rules of evidence. As a discipline, it encompasses fraud knowledge, financial expertise, and a sound knowledge and understanding of business reality and the working of the legal system (Bologna & Lindquist, 1987).
As at this time, the issue of forensic accounting and fraud a continuingly being debated for the past few years as companies in developed countries such as Enron Corp, WorldCom Inc, and Kmart Corp have been detected and proved of fraudulent conduct (Shaikh & Talha, 2003). These still an issue to be addressed in the business sector as fraud cases have only been detected after massive funds have disappeared from the coffer. Forensic accounting may be one of the most effective and efficient way to reduce and prevent accounting fraud.
As forensic accounting is getting popular in these recent years, it has been provided as a course by many educational institutions in their respective countries. Forensic accounting is defined as a science dealing with the application of accounting facts gathered through auditing methods and procedures to resolve legal problems. It also requires the integration of investigative, accounting, and auditing skills. These forensic accountants draw conclusions and calculate values and identify irregular patterns or suspicious transactions by critically analyzing the financial data. It provides an accounting analysis to the court for dispute resolution in certain cases and it also provides the court with explanation to the fraud that has been committed. That is why forensic accounting may play a vital role in detecting and reducing

Vol. 4, No. 11 International Journal of Business and Management
146
accounting frauds in the business sector. Malaysia is in no particular exclusion to introduce and popularize this forensic accounting service.
This literature-based paper begins by defining the research problem, defining the accounting fraud, reviewing the current literatures and acceptance level of forensic accounting. In the final section we develop the model and conclude the significance of accounting fraud in businesses.
2. Research Problems
Problems arise from the fact that forensic accounting service is still new to most of the businesses and even to the public in Malaysia. This leads to confusion among public and some may even be unaware of the existence of the system. Therefore, the importance of the service is ignored. Therefore this study focus on forensic accounting is conducted to improve the understanding in detecting and reducing accounting fraud cases in Malaysian companies. For example there are several empirical studies such as Cain (1999) and the KPMG, Australia fraud survey (KPMG), (2002) each indicate that over 50 per cent of all respondents surveyed believed that fraud is a major business problem. Moreover, similar reviews of fraud cases by Rezaee (2004) revealed that financial statement fraud has cost market participation more that USD$500 billion during recent years, with serious litigation consequences.
Similarly fraud has increasingly become a major problem in Malaysia. The evidence from the “New Straits Times”
(Management Time, 2001) reported that
“more than 60 per cent of the Malaysian listed companies surveyed had experienced some form of fraud of the
companies surveyed, almost a quarter were fraud more than RM1 million each to fraud”.
It will also give a view towards companies who wish to educate and increase awareness among of the public regarding the seriousness of the fraud in Malaysia. This research will lead to the awareness and acceptance level of forensic accounting. Furthermore, the result of this research would give understanding and awareness of the role of forensic accounting. Ultimately this study hopes to protect the interest of shareholder.
3. Definition of Accounting Fraud
Fraud is a legal term that refers to the intentional misrepresentation of the truth in order to manipulate or deceive a company or individual. When companies undergo severe financial problems and end up in bankruptcy, fraud by senior management may be involved. Accounting fraud is an act of knowingly falsifying accounting records, such as sales or cost records, in order to boost the net income or sales figures. Accounting fraud is illegal and subjects the company and the executives involved to civil lawsuits. Company officials may resort to accounting fraud to reverse loss or to ensure that they meet earning expectations from shareholders or the public.
David (2005) states that fraud is not a possibility but a probability. It also explains that fraud can be better prevented if decisions are made by a group and not an individual. However, this is not the case if the group has the same interest in mind. Then fraud may not be prevented. Conversely, the group is influence by the dominant decision maker who ends up deciding everything. The authors also state that the paper-based system is the reason why fraud is being committed in a certain company. The authors deduce that a computerized system for all the transactional activities would reduce fraud. However, in the practical world, even a large company such as Enron had been found involved in fraud. This is because it is always possible for high level management to access data and change the information, paper-based system or a computerized system alike. It all relates back to human nature high level management. The only way to solve this issue is that the public should be educated and informed of the use and function of forensic accounting to prevent fraud occurrences. When the public is made known of the concept, then they could actually demand for the service in the company which they invest in.
Albrecht, (2005) argued that fraud is rarely seen. However, the symptoms of fraud are usually observed. The symptoms do not necessarily mean fraud is being undergone as it may be caused by mistakes. The writer advices are mainly to be cautious when fraud is reported as it may be false allegations. Fraud is not easily proven since frauds have themselves at a safe line where authority could not convict them. This shows that the author is explaining that the fraud defaulters are getting smarter due to the possible mistakes human can cause. And this mistakes and errors can be justified by the defaulter as the reason for such fraudulent symptom. It is agreeable with this statement, but till how far could one justify it?This has made detecting and proving fraud a hard work for a forensic accountant. There is a need for deeper understanding on how these defaulters work their fraudulent act. Without constant involvement of the public and improvement in forensic accounting, fraud cases will be hard to detect and thus lead to greater success in financial fraud, which also translates into the failure to meet the expectations of the public, shareholders or even other stakeholders.
Ramaswamy (2005) states that poor corporate governance and accounting failure is one of the reasons why fraud cases emerge. This is because poor corporate governance will lead to the ability of certain individual or a group of people with the same interest to act upon it to commit fraudulent activities in the company. The author also states that the problems within the corporate reporting system as a reason because of lack of well implemented policy of corporate governance. This can be reinforced by the fact that top level management should follow the policies of the firm which will help the

International Journal of Business and Management November, 2009
147
company to perform better. The problem comes from the fact that certain corporate leaders do not have positive attitude regarding the policies. Therefore, lack of honesty and transparency in reporting financial statement is another problem. It is agreeable that an auditor does not have the absolute duty to uncover fraud, but they should practice fair and true reporting to ensure that the interests of the public as well as the employees are protected. With the use of forensic accounting guidelines, auditors can act as forensic accountants in cases of suspicious fraud or criminal activities in a company. Ineffective and inefficient system of internal control which is stated by the author points out that a weak management cannot be changed with internal control system. Even if a company applies good internal control systems, the management will still be the major factor influencing the implementation. Companies should look towards new approaches rather than follow the traditional approach as forensic accounting may be the next best alternative in resolving problems.
Loebbecke & Willingham (1998) conclude that the probability of material financial statement misstatement due to fraud as a function of three factors. There are the degree to which those in authority in an entity have reason to commit management fraud, the degree to which conditions allow management fraud to be committed, and the extent to which those in authority have an attitude or set of ethical values that would facilitate their commission of fraud. These three factors show that the management could simply commit fraudulent activities since the knowledge of the public which includes shareholders are limited regarding the option they could take to ensure that financial crime could be prevented. There should be a set of guidelines created for the public and also the management to ensure that actions could be taken in the financial fraudulent activities.
4. Literature review
4.1 Forensic Accounting’s Function
According to Moncliff (2005) in the article ‘Forensic Accounting’, it states that Forensic accountants work in two primary areas, investigative accounting and litigation support. Investigative accounting encompasses not just the numbers and documents of a company, but the business environment as well. Forensic accountants investigate the financial operations of an enterprise and prepare information that may be used in a criminal or civil court case. Forensic accountants provide investigative services or provide support for litigation. This shows the role of a forensic accountant. It clearly elaborates on the many purposes of forensic accounting. It should be accepted that forensic accounting process is a form of auditing with investigative skills with an in-depth knowledge and experience. Forensic accounting should be introduced into a company as a service which can be acquired when fraud investigation is needed to be carried out. It should also be used as the ultimate source of fraud investigation. As it is an independent service which is not in conflict of interest, it can be used to act towards the entire company. It should be used as a system to monitor the daily activities of the company to ensure that fraud can be reduced. Fraud is an ever growing problem in Malaysia as this country is still in the developing stage in the business sector. This has increased the necessity of adopting forensic accounting practices, may it be medium or large companies alike. Forensic accounting should be taken in as the ultimate precaution towards financial fraud. The public should be given the opportunity to be educated by organizations or even government agencies on what forensic accounting functions mainly are.
Moreover, the European Federation of Accountants (FEE) (2002), illustrated the role of accounting and auditing in Europe. As a representative organization of the accountancy profession in Europe, they understand that the unexpected collapse of an important company listed on a stock exchange will undermine the credibility and reliability of the information and the regulatory system, which is put in place to protect investors. This shows that even a well established company such as Enron would also collapse because the company was involved in corporate scandals which cost billions. They also believe that there is a need to strengthen the corporate governance arrangements to provide the highest quality of financial information to the capital markets. The financial information is then required to be prepared by well established accounting and auditing company. But even so, with strong corporate governance, and financial information prepared by well established accounting and auditing companies, these corporate scandals still persists. The understanding of the issue that these scandals would not be able to be totally eliminated causes the public to continue to doubt the management and even the company itself. That is why forensic accounting should be introduced as a main tool to investigate companies of fraud occurrence. With this, the interest of the public can be taken care of without them fearing of losing everything.
4.2 Expectation Gap
The audit expectation gap debate consistently centres on a number of perennial issues, which are: (1) the role and responsibilities of the auditors, (2) the nature and meaning of audit report messages, (3) the quality of the audit function, and (4) the structure and regulation of the profession (Humphrey, Mozier & Turley, 1993). The main problem or issue is the constant misunderstanding on the role and responsibility of the auditor as the public expects auditors to detect financial asset misstatement or even fraudulent activities from the financial statements. This has been the long perception of what an auditor’s responsibilities are. Therefore, this perception should be regenerated and corrected. Auditors with forensic accounting background would be assigned as a forensic accountant specifically to investigate the

Vol. 4, No. 11 International Journal of Business and Management
148
company’s financial statement. These people are the ones whose roles are to detect financial misstatements. With the right education given to the public, this perception on auditors could be regenerated or even eliminated.
4.3 Forensic Accounting Education
Forensic accounting education has been limited primarily to continuing professional education sessions for practicing accountants and currently only a few universities teach forensic accounting (Rezaee & Burton, 1997). Given the demand for forensic accounting practice at this certain time and the need for more education in this area, it is just acceptable that college or university accounting departments provide and include forensic accounting as one of the options in the course. This is to ensure that not only auditors who has the in-depth experience knows of the process the fresh graduates will be able to perform as efficient and as effective, or at least meet the criteria of a practicing forensic accountant. Other wise the persons who do not attend any professional accounting courses should also be given the opportunity to learn and understand forensic accounting better. This will create awareness among the students and public on the importance of forensic accounting as one of the main tool in the investigation of company financial statements of fraudulent activities.
Survey conducted among auditors and undergraduate business students show responses from the students were collected before and after they completed coursework. In auditing, the students’ perceptions were closer to auditors after they completed the coursework, particularly about the roles and responsibilities of auditors, but signs of the expectation gap remained in areas pertaining to fraud. However, the extent of the gap was lower than before the students were about to start the audit coursework (Gramlin & Schatzberg, 1996). Hence, audit education could still be considered as an effective way to reduce the expectation gap. This is a concept where one would use the education system to increase understanding and perception of a concept. It is certain that if forensic accounting’s perception is to be surveyed before and after the coursework of forensic accounting, then the result will be that education could be considered as one of the effective ways to improve the perception on the use of forensic accounting service.
Education process would be a major part of any campaign aimed at closing the expectation gap (Smithers, 1992). That is why it is important to educate the public to reduce misunderstanding. Auditing students’ beliefs about auditors’ responsibilities, the reliability of audited financial information and future prospects changed significantly over the semester. Smither’s concluded that education is an effective approach addressing the expectation gap (Woodliff & Monroe, 1994). This actually explains why there is a need to indicate the perception and the understanding of the general public on forensic accountings’ function in the business sector to actually know how to improve it better.
5. Research Framework
The framework above indicates the two variables that affect the acceptance levels of the public with the practice of forensic accounting as the main tool in investigating a company’s account to detect fraud. The variables include the public’s understanding level on forensic accounting functions and the perception on the implementation of forensic accounting in the investigation. The understanding level of the public the functioning of forensic accountings will determine whether the public in Malaysia will accept it as the main tool in investigating a company’s account as to a means fraud. The perception of the public on the implementation of forensic accounting in the investigation of a company’s financial statement also determines the acceptance level of forensic accounting in the country.
Insert Figure 1 here
6. Conclusion
This article has set a context and rationale for further research on the importance of forensic accounting in the country as a tool used by the government agency, the Malaysian Anti-Corruption Commission, to investigate on the possible fraud occurrence and even companies alleged of conducting illegal or criminal activities. It has also been practiced by audit firms as one of the tool to investigate a company’s financial statement for fraudulent activities as requested by certain parties. This does not mean that the public should be ignorant towards this service and its function. The perception, understanding, and acceptance of the public also plays very important role in determining the future of forensic accounting in the country.
In a nutshell, this research study has focused on public’s perception, understanding and acceptance on the role of forensic accounting in Malaysia. This research discusses the acceptance level by the public with the practice of forensic accounting as the main tool in investigating company’s account to detect fraud in Malaysia.
In ensure, the forensic accounting activities are essential for all kinds of businesses long term survival. Forensic accounting activities such as investigative accounting and litigation support will enrich the organizational performance. It is encouraged that all businesses should put in place forensic accounting as a tool to enhance transparency, credibility and accountability. In the term of forensic accounting, these have led to better performance and encouraged individuals to commitment to the organizational performance. Forensic accounting a important for all organization sizes and not limited to for small firms.

International Journal of Business and Management November, 2009
149
This study provides insights into definition, research problem, literature review on the field of forensic accounting such as forensic accounting functions, expectation gap and forensic accounting education, and research framework. In today’s society, organizations have begun to consider forensic accounting as a component towards their survival. It is not due to legal requirements but also for the reasons of preparing the organizations in the long run domestically and internationally.
References
Albrecht, W.S. (2005). Identifying Fraudulent Financial Transactions: A Framework for Detecting Financial
Statement Fraud. Brigham Young University.
Bologna, G.J. and Lindquist R.J. (1987). “Fraud Auditing and Forensic Accounting: New Tools and Techniques”,
Hoboken, New Jervey: Wiley Publication.
Cain, S. (1999). Fraud in the workplace. Orange County Business Journal, Vol. 22, No, 16, pp.78.
David, A. (2005). Low Level Fraud is a High Level Issue, Supply Management. [Online] Available: http://www.highbeam.com/doc/1P3-821992191.html. (Retrieved from 26th November 2008)
European Federation of Accountants. (2002). The Role of Accounting and Auditing in Europe. [Online] Available: www.farse/doc/FEEposition.com
Gramling, A.A., & Schatzberg, J.W. (1996). The role of undergraduate auditing coursework in reducing the expectation gap. Issues in Accounting Education, Vol. 11, No.1, pp.131-60.
Humphrey, C., Mozier, P., & Turley, S. (1993). The audit expectation gap in Britain: an empirical investigation. Accounting and Business Research, Vol. 23, No.91A, pp. 395-411.
Junaid M. Shaikh, & Mohammad Talha. (2003). Credibility and expectation gap in reporting on uncertainties. Managerial Auditing Journal, 18/6/7, pp. 517-529.
KPMG. (2002), Fraud Survey 2002, KPMG, Darwin.
Loebbecke, J.K, Eining, M.M. and Willingham, J.J. (1989). Auditor’s experience with material irregularities: frequency, nature, and delectability. Auditing: a Journal of Practice &Theory, Fall, pp. 1-28.
Management Times. (2001). Fraud hits 62 per cent of listed firms, New Straits Times, June, Kuala Lumpur.
Moncliff, J. (2005). Forensic Accounting-CSI of Accounting Jobs. [Online] Available: http://www.articlecity.com/articles/business_and_finance/article_3847.shtml. (Retrieved from 29th November 2008)
Ramaswamy, V. (2005). Corporate Governance and the Forensic Accountant. [Online] Available:http://www.nysscpa.org/cpajournal/2005/305/essentials/p68.htm. (Retrieved from26th November 2008)
Rezaee, Z. & Burton, E.J. (1997). Forensic Accounting education: insight from academiciansand certified fraud
examiner practioners, MCB University Press. Vol12/9, pp. 479-489.
Rezaee, Z. (2004). Causes, consequences and deterrence of financial statement fraud. Critical Perspective on Accounting. (In Press).
Smithers. (1992). Legislative Session: 1st Session, 35th Parliament. Hansard, Vol. 3/5.
Woodliff, D.R. and Monroe, G. (1994). An Empirical Investigation of the Audit Expectation Gap: Australian Evidence.Accounting and Finance, 34:1, pp. 47-74.
Independent variables Dependent variable
Figure 1. Research framework
Public’s understanding level on forensic accounting’s function in the business sector
Public’s perception on the implementation of forensic accounting in the investigation of company’s financial statement
Acceptance level of the public with the practice of forensic accounting as the main tool in investigating company’s account to detect fraud

Vol. 4, No. 11 International Journal of Business and Management
150
In-Depth Analysis of PC Industry in China
Xiaojun Cui
Department of Business Administration, Guangdong Radio and TV University
Guangzhou 510091, China
E-mail: [email protected]
Abstract
Personal Computer (PC) industry in China has experienced a rapid growth in China in recent years, and has played a more and more important role in the national economy. This motivates us to analyze the business environment and strategic situation of the PC industry in depth. A PEST analysis is carried on to analyze the business environment of the PC industry, and Porter's five forces analysis is used to analyze the competitive nature of PC industry in China.
Keywords: China’s PC industry, PEST Analysis, Porter’s Five Forces Analysis
1. Introduction
The aim of this paper is to analyze the business environment and strategic situation of personal computer (PC) industry in China. The motivation of an in-depth analysis of PC industry in China stems from the fact that PC industry has played a more and more important role in national economy of China, and has an important effect on the society. Since the emergence, PC has become a necessary tool in daily life in the society. Moreover, with the advances of technology, PC carries more and more functions and attracts more and more users. Now the PC market is mature and close to saturation in the developed countries, while the development of PC industry is still experiencing a rapid growth in the developing countries such as China.
Formed in the early period of 1990s, China's PC industry has only a short history. But the PC industry has been experiencing a rapid growth in the past fifteen years in China. Now PCs are common in families located in big cities of China, such as Beijing and Guangzhou. Even in small cities and rural districts, PCs are becoming more and more popular, and are more accessible. China has become an important PC market in the Asia Pacific area and even in the world. China's PC industry not only attracts many foreign PC makers to enter the market of China, but also fosters the world-class local companies to enter the global PC markets. The rapid development of PC industry also brings along the development of relevant industries, and PC industry has high impacts on the national economy.
This paper is devoted to analyzing the business environment and strategic situation of the PC industry in China. In particular, a PEST analysis and Porter's five forces analysis are used in the paper. The rest of the paper is organized as follows. In Section 2, the background, size, developments of the PC industry in China over the past few years are reviewed, and a PEST analysis is used to analyze the political, economic, social and technological issues in the PC industry of China considering both the moment and future implications. In Section 3, Porter's five forces analysis is used to analyze the competitive nature of PC industry in China, and the competitors within the PC industry in China and their strategies are identified. Findings of the paper are summarized in Section 4, and based on the findings, the strength of the PC industry in China at the present time and thoughts for the future success are analyzed.
2. Analysis of industry sector
2.1 Introduction of the PC industry in China
In this section, the analysis is focused on the status quos of China's PC industry including size, development and background over past few years and the prospects in the future.
In the recent years, the PC market in China kept a rapid growth especially from 2002 to 2006. The growth of global PC market has been slowed down in the recent years but the growth in Asia especially in China is still very rapid. The PC market in China has experienced an average growth rate about 15% annually compared with that the growth of global PC market. The center of the development of PC market has been gradually transferred from the developed countries with mature market to the developing countries with great growth potentiality like China.
According to the report of IDC in 2006, the sales quantity of PC in China's market is 21.9 million sets and increased 15% than that of last year. With several years' development and growth, the size of China's PC industry increases continuously and rapidly. According to the report of IDC, China's PC market has become the biggest market in the
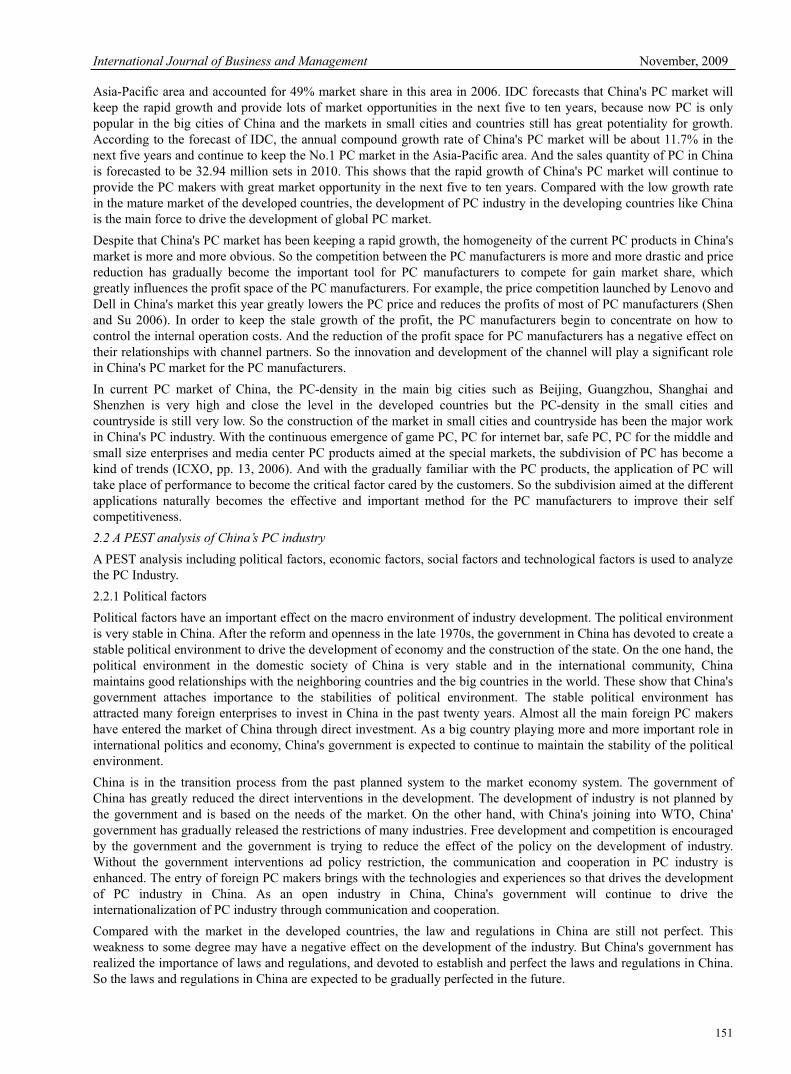
International Journal of Business and Management November, 2009
151
Asia-Pacific area and accounted for 49% market share in this area in 2006. IDC forecasts that China's PC market will keep the rapid growth and provide lots of market opportunities in the next five to ten years, because now PC is only popular in the big cities of China and the markets in small cities and countries still has great potentiality for growth. According to the forecast of IDC, the annual compound growth rate of China's PC market will be about 11.7% in the next five years and continue to keep the No.1 PC market in the Asia-Pacific area. And the sales quantity of PC in China is forecasted to be 32.94 million sets in 2010. This shows that the rapid growth of China's PC market will continue to provide the PC makers with great market opportunity in the next five to ten years. Compared with the low growth rate in the mature market of the developed countries, the development of PC industry in the developing countries like China is the main force to drive the development of global PC market.
Despite that China's PC market has been keeping a rapid growth, the homogeneity of the current PC products in China's market is more and more obvious. So the competition between the PC manufacturers is more and more drastic and price reduction has gradually become the important tool for PC manufacturers to compete for gain market share, which greatly influences the profit space of the PC manufacturers. For example, the price competition launched by Lenovo and Dell in China's market this year greatly lowers the PC price and reduces the profits of most of PC manufacturers (Shen and Su 2006). In order to keep the stale growth of the profit, the PC manufacturers begin to concentrate on how to control the internal operation costs. And the reduction of the profit space for PC manufacturers has a negative effect on their relationships with channel partners. So the innovation and development of the channel will play a significant role in China's PC market for the PC manufacturers.
In current PC market of China, the PC-density in the main big cities such as Beijing, Guangzhou, Shanghai and Shenzhen is very high and close the level in the developed countries but the PC-density in the small cities and countryside is still very low. So the construction of the market in small cities and countryside has been the major work in China's PC industry. With the continuous emergence of game PC, PC for internet bar, safe PC, PC for the middle and small size enterprises and media center PC products aimed at the special markets, the subdivision of PC has become a kind of trends (ICXO, pp. 13, 2006). And with the gradually familiar with the PC products, the application of PC will take place of performance to become the critical factor cared by the customers. So the subdivision aimed at the different applications naturally becomes the effective and important method for the PC manufacturers to improve their self competitiveness.
2.2 A PEST analysis of China’s PC industry
A PEST analysis including political factors, economic factors, social factors and technological factors is used to analyze the PC Industry.
2.2.1 Political factors
Political factors have an important effect on the macro environment of industry development. The political environment is very stable in China. After the reform and openness in the late 1970s, the government in China has devoted to create a stable political environment to drive the development of economy and the construction of the state. On the one hand, the political environment in the domestic society of China is very stable and in the international community, China maintains good relationships with the neighboring countries and the big countries in the world. These show that China's government attaches importance to the stabilities of political environment. The stable political environment has attracted many foreign enterprises to invest in China in the past twenty years. Almost all the main foreign PC makers have entered the market of China through direct investment. As a big country playing more and more important role in international politics and economy, China's government is expected to continue to maintain the stability of the political environment.
China is in the transition process from the past planned system to the market economy system. The government of China has greatly reduced the direct interventions in the development. The development of industry is not planned by the government and is based on the needs of the market. On the other hand, with China's joining into WTO, China' government has gradually released the restrictions of many industries. Free development and competition is encouraged by the government and the government is trying to reduce the effect of the policy on the development of industry. Without the government interventions ad policy restriction, the communication and cooperation in PC industry is enhanced. The entry of foreign PC makers brings with the technologies and experiences so that drives the development of PC industry in China. As an open industry in China, China's government will continue to drive the internationalization of PC industry through communication and cooperation.
Compared with the market in the developed countries, the law and regulations in China are still not perfect. This weakness to some degree may have a negative effect on the development of the industry. But China's government has realized the importance of laws and regulations, and devoted to establish and perfect the laws and regulations in China. So the laws and regulations in China are expected to be gradually perfected in the future.

Vol. 4, No. 11 International Journal of Business and Management
152
2.2.2 Economic factors
Economic environment has an important effect on the development of industries and companies, and economic development can drive the development of industry. In the past few years, China's economy has been keeping a rapid growth and China has become the sixth biggest country in the world measured by GDP. Foreign trade and foreign direct investment are the forces to drive the development of economy in China. And the rapid growth of China's economy has driven the development of the industries in China. It has been mentioned in the previous sections that the PC industry in China is experiencing rapid development in China resulted from the rapid growth of China's economy.
Resources and low-cost labor forces are the advantages of China to develop the economy. So the manufacturing industry is the emphasis in China's economy development and plays an important role in national economy of China. More and more foreign enterprises transfer their production to China and invest in China to set up factories. With the increase of foreign direct investment and development of foreign trade, China's economy is expected to continue to keep rapid growth in the future. And the good economic environment will lead to the continuous development of the industries in China, especially the manufacturing industry. PC industry is expected to keep growing in the future influenced by the good economy development prospects in China.
On the other hand, the rapid development of economy in China has greatly improved the living standard and consumptive power of people in China. China not only has been the large product base in the world, but also has been a big consumptive market in the world. More and more foreign enterprises are entering the market of China not only for the low-cost labor forces but also for the big market. The increasing consumptive power of the people in China also drives the development of economy and industry.
2.2.3 Social factors
Social and cultural factors also have an important effect. In the early periods of the development of PC industry in China, PC was only used in the companies and was looked as a tool in the work. But with the development of economy and society, PC began to enter the life and home of people. PC has been more and more used in the home of China for study, entertainment and communication.
The development of the internet also drives the development of PC industry. In China, PC industry is related to the development of internet. The emergence of the internet changes the whole society and people's lives. Newspaper, radio and television are the main tools used by the people in the past of China. In the traditional culture of China, these traditional media are more likely to be accepted by the people in China. People are accustomed to know the news through reading newspaper and listening to the radio, and rest for leisure and fun through watching TV. But the emergence of PC and internet completely changes people's lives. All the information and news can be easily understood through the internet and people can use PC and internet for work and entertainment. So PC and internet make the world smaller.
As PC is gradually accepted by the social culture in China, PC begins to be used by more and more people in China and has an important effect the society and people's lives in China. PC has become a necessary tool to the people in China. So people have strong interest in the products of PC and more and more home user and enterprise users buy PC in China. Now PC-density in big cities of China is very high, but the growth of PC industry is still very rapid. On the one hand, the market in the small cities and countryside has big potentiality, because the people in small cities and countryside in China began to realize the use and importance of PC and have the potentiality to buy PC products. On other hand, young people and children in China are growing under the influence of PC and internet, so they also have the potentiality to buy PC in the future. PC is expected to play a more and more important role in the society and people's lives in the future.
2.2.4 Technological factors
PC is a kind of technological products and technological innovations have an important effect on the development of PC industry. When PC emerged in the market, the price is very high and it costs much for people to buy a PC. So the high cost in the early periods restricted the development and popularity of PC in China. But with the development and innovation of the technology, the cost of PC has been greatly reduced. PC has been a normal commodity in China that can be afforded by most of people. On the other hand, the quality of PC products is continuously enhanced by technological innovations. The technologies of PC develop very fast that generally faster and stronger PC is promoted to the market every year. The development of technologies leads to the fast update of PC products and the consumers can use the PC with newest technologies soon. So the technological development and innovation makes the price of PC cheaper and the quality of PC better. Technological development and innovation is an important factor to drive the development of PC industry.
Now PC has been the important part of people's work and life. PC is not a simple product and will be endowed with more and more functions to meet the individual needs of the consumers in China. In the next five to ten years, the Digital Home will experience rapid growth and home PC will become the management center for many tasks including

International Journal of Business and Management November, 2009
153
entertainment, calculation, office, communications and management. The continuous emergence and application of new technologies will offer the consumers in China more innovative PC products. So in the next five to ten years, with the rapid growth, PC market in China will show the trend for diversified development. The new technologies and new product ideas will be the development trend in the future PC industry of China.
Moreover, the sell and distribution is changed by the technological innovations. In the past, PC only can be sold to the consumers in the shop through a face-to-face way. But the emergence of internet has changed this mode that the consumers can directly buy the PC products via internet or phone. Although this mode is not popular and extensively accepted by the consumers in China, this mode renovates the sell and distribution mode of PC and provides the consumers with more choices to buy PC products. This new mode of distribution is expected to be adopted by more and more consumers in China and drives the development of PC industry in the future, because this technological innovation not only provides an easier way for the consumers to buy PC, but also reduces the cost of PC makers.
3. Evaluation of the competition in China’s PC industry
In this section, the competition in China's PC industry is evaluated including the competitive nature of the industry, and the competitors and their strategies to face competition.
3.1 Porter’s five forces analysis
Michael Porter has identified five forces that are widely used to analyze the structure of any industry, and these five forces include bargaining power of suppliers, bargaining power of buyers, threat of new entrants, threat of new entrants, threat of substitutes and rivalry among competitors (Porter, 1980).2.3.1 International investment The foreign non-life insurance companies could provide Chinese and foreigners with any non-life insurance service in two years since the China’s WTO accession. The foreign life insurance companies are authorized to provide the Chinese and foreigners with individual (non-group) life insurance service since the WTO accession. In three years they are permitted to provide health insurance, group insurance and premium or annuity service for Chinese and foreigners.
3.1.1 Bargaining power of suppliers
PC is a special product and the bargaining power of suppliers is very strong. Generally the PC makers don't have the core technologies of the input like CPU. The input of CPU decides the quality and functions of the PC, and the cost of CPU to a large extent determines the price of PC and has a significant effect on the profitability of PC products. CPU is the core input of PC and it is the high-tech product that there are only two providers of CPU in the world including Intel and AMD and. The production of PC is based on the CPU, and the innovation of CPU determines the upgrade of the PC. In fact, the biggest profit in this industry is earned by the CPU provider and the PC makers have to increase their profits by expanding the scale because the profitability of PC is low.
So the bargaining power of CPU providers is very strong to the PC makers. PC makers must cooperate with the CPU providers and obtain the supports from the providers. Without CPU, PC makers can not produce any type of PC. Based on the core input of CPU, they can endow the PC with different designs and increase the additional functions of the PC. The cost of CPU determines the price of PC. Generally the innovation and upgrade of CPU will cut down the cost of CPU and then reduce the price of PC. Although other inputs providers have a weak bargaining power with PC makers, the providers of CPU - the core input of PC have a very strong bargaining power.
3.1.2 Bargaining power of buyers
The bargaining power of buyers is also very strong in the PC market of China. In the early period, PC is a kind of unique products and produced by few PC makers. With many years' development, PC has been a normal product and there are many PC makers in China including both local PC makers such as Lenovo and Founder and foreign makers such as Dell, HP and IBM. So in China, the consumers have many choices. Although the PC makers can endow their products with different designs and different functions, it is evitable that all the PC products are similar to the consumers. The price and brand are the most important factors to affect the purchase behavior of the consumers.
In China, the PC market is not monopolized by few big PC makers and there are many PC makers that provide PC products to the consumers. PC products of different makers are homogeneous to the customers in the market. Price has been the most important tool for the PC makers to compete for the consumers in China's PC market. PC makers in China don't have bargaining power to negotiate the price with the consumers. In fact, the drastic competition has leaded to the great decline of PC price in the market of China. Price has been the most important for PC makers to attract the consumers in China. So the bargaining power of buyers in China's PC industry is very strong and the PC makers in China have to face the drastic price competition.
3.1.3 Threats of new entrants
The threats of new entrants in China's PC industry are small. There are few barriers for new companies to enter PC industry in China. The government of China does not restrict the new entrants of PC industry for both local and foreign companies. The PC is not unique and the production of PC is easy to learn for the new entrants. The start-up cost of PC

Vol. 4, No. 11 International Journal of Business and Management
154
production is not very high. If a company has enough funds and obtains the support from input providers, they can easily enter the PC industry in China. And the simple PC products don't have high requirements on the technologies, so there are not technological barrier for new entrants of PC industry. And in PC industry of China, the consumers of PC products have little brand loyalty that it is easy for the consumers to know the brands and products of new entrants through lots of advertisements.
But it should be noted that economies of scale plays a very important role in PC industry of China and distribution channel is another important factor. The competition is very drastic for the PC makers in the PC market of China. Price competition has greatly reduced the profitability of PC makers in China and they have to survive in the competition depending on the scale. The current PC market has been dominated by some big PC makers of Lenovo, Dell, HP and Founder with big scale. So it is difficult for the new entrants to survive in the competition without the scale. On the other hand, it is difficult for the new entrants to access to the consumers in China' PC market, because the new entrants have to establish their own distribution channel in China. Channel is the critical factors to achieve the success in the market of China. The top PC makers in China have established their mature distribution channel and it is easy for them to sell their products to the consumers. For example, Lenovo has established its own distribution channel all over the China including the main big cities and other small cities and countryside. Therefore, although there are few barriers for new entrants in PC industry of China, economies of scale and distribution channel determines that it is very difficult for the new entrants to successfully enter the PC market of China and quickly hold a certain market share. So the threat of new entrants is small in the PC industry of China.
3.1.4 Threats of substitutes
The development of PC is greatly influenced by the technological development and innovation. PC has to face the big threat from substitutes with the development of technologies. Generally the technological products are more likely to be taken place by substitutes if they no longer have the unique functions to the customers. The emergence of PC completely changes the society and people's lives. But with the development of new technologies, some products have had the functions of PC and can be the substitutes for PC. With the development of digital television, the television is endowed with the functions of PC. Digital television combines the functions of both PC and TV that people can use the functions of PC through the television. Every home in China has the television and using digital television to enjoy the function of PC seems to be easily accepted by the customers in China. Moreover, the intelligent mobile phone also begins to have the functions of PC and it has the advantages of smaller size and convenience for carrying compared with the PC. So with the development of the technologies, many other products begin to have the functions of PC and become the potential substitutes for PC, and PC can not provide the unique functions to the customers in China. So the threat of substitutes to PC is big in China. But in order to reduce the threat of substitutes, PC makers have tried to enrich the functions of PC and provide the innovative PC products to the customers.
3.1.5 Rivalry among competitors
The rivalry among competitors in China's PC industry is very intense. Firstly, China's PC market is experiencing the rapid growth and the history of China's PC industry is short. Although Lenovo is current market leader, but many other firms in China including local firms and foreign firms are competing for the market leader. There are not rules of game in the PC industry of China and free competition is encouraged. The big PC makers don't try to control the market through the cooperation. With the rapid growth of the PC industry in China, every PC maker has the desire to become the market leader in this market.
Secondly, the PC products have become homogenous for all the PC makers in China. And there are high fixed costs of production for PC products. The large percentage of the cost to produce PC products is independent of the number of units produced so that PC makers are pressured to produce and sell larger volumes of products. According to these two factors, the PC makers in China have to compete in the market through cutting the price, which leads to the intense rivalry among the competitors in China's PC market.
Thirdly, customers can easily switch between the PC products in China. There are so many PC makers to provide PC products to the customers in China and the customers have many choices of PC provided by different firms. The brand loyalty of PC product in China is very low and it is easy for the customers to switch between the different PC products. So the PC makers in China have to try hard to compete for the customers and market share and the rivalry is very intense in China's PC industry. In the current PC market of China, other factors of brand and quality are not the critical factors because the development of PC industry is in the process of establishing brand and fostering the brand loyalty of the customers. So the price competition decides the intense rivalry in this industry of China.
3.2 Main competitors and their strategies in China’s PC industry
There are many PC makers in the PC industry of China including the local firms and foreign firms. And among these PC makers, four main competitors exist in this market including Lenovo, Dell, HP and Founder: two local firms and two foreign firms. These four competitors have different strategies to compete and maintain their market share in the PC

International Journal of Business and Management November, 2009
155
market of China.
3.2.1 Lenovo
As the biggest local PC maker in China, Lenovo has maintained the status of market leader for many years in the drastic market competition. The strategies of Lenovo are low price and brand.
On the one hand, low price is an important strategy for Lenovo to compete in the market. Low price helped Lenovo to become the market leader in China when Lenovo was still a small firm several years ago. In the past many years, Lenovo has been keeping up the strategy of low price. The strategy of low price made Lenovo easily to be known and accepted by the customers in China and rapidly increases the market share of Lenovo. The strategy of Lenovo is to expand the scale through low price, and then cut down the costs of production and reduce the price of PC through the economies of scale. Based on the biggest market share in China's PC market, Lenovo often presses its competitors and enhances its status of market leader through the price competition.
On the other hand, brand is another important strategy for Lenovo to attract the customers. As the no.1 PC brand in China, many people in China are proud of the rise of Lenovo. So the brand of Lenovo has an effect on the purchase behavior of the customers in China. Many customers in China buy the PC products of Lenovo to support the own brand of China. A strong brand has been established by Lenovo among the PC consumers in China. And Lenovo also has many orders from the governmental departments. Based on its national brand in China, government purchasing is an important market for Lenovo in China and the government purchases a great number of PC from Lenovo every year.
Moreover, Lenovo attaches importance to the markets in small cities and countryside. Based on its perfect distribution channel all over China, Lenovo can sell their products to any place in China. Lenovo has paid attention to the development of small cities and countryside when the PC makers are competing for the market share in main big cities in China. The perfect channel helps Lenovo to account for a large part of the market in small cities and countryside of China.
3.2.2 Dell
Different from other PC makers in China, Dell adopts its special direct distribution mode in China and this mode has helped Dell to succeed in the markets of many countries. Dell does not invest in establishing its own traditional distribution channel in China and it does not sell the PC through the traditional channel like shops. The strategy of Dell is to sell their PC products directly to the customers through the direct contacts with the customers via the internet or phone (Li and Shi 2005). Dell expects to reduce the cost of PC products and provide a more convenient way for the customers in China to buy its products.
This strategy has helped Dell to achieve a certain success in the market of commercial PC in China, but this mode has faced many problems in the market of home PC, because this mode to some degree is contradicted to the consumer culture in China. The customers in China are more likely to purchase the products like PC in a traditional face-to-face way, and most of the customers are not willing to accept the direct distribution mode via internet or phone. So Dell's strategy is not successful in the home PC market of China. From last year, Dell also began to adopt the traditional distribution channel to combine with its direct distribution mode.
3.2.3 Founder
Founder is also a local PC maker in China, but the strategy of Founder is very different from Lenovo in the market. Founder does not have the support from the government purchasing and does not have a strong brand influencing power in the customers of China. So according to its self advantages, Founder focused on the development of enterprise clients. In terms of the various needs of the enterprise clients, Founder designs and develops different kinds of PC for the commercial use such as the PC for the special use of finance and invoice. PC is a large market in China and it is very important to develop the diversified markets. Founder is very clear about its strength and its strategy is to become the leader in the diversified market of enterprise clients. This strategy makes it not necessary for Founder to participate in the drastic price competition in the PC market and Founder can concentrate their resources on serving the diversified market of enterprise clients. Designing and developing the PC products according to the practical needs of the enterprises endows Founder with the competitive advantages with other PC makers in the market of enterprise enterprises. And this strategy has helped Founder to become the leader in this diversified market of enterprise clients.
3.2.3 HP
HP entered the PC market of PC relatively relate compared with other main foreign PC makers, but its market share increases fast and HP has achieved an important market position in China. HP adopts the different strategies in the different markets of high-end users and low-end users.
In the market of high-end users, the strategy of HP is to provide the PC products with high quality. HP has a good reputation in the international market and this reputation also makes the local users in China to believe in the quality of the products of HP. In HP provides the PC with high quality and good stability to its high-end clients, because HP

Vol. 4, No. 11 International Journal of Business and Management
156
knows that quality and stability, rather than price, are the most important factors to influence the purchase behavior of high-end users. This strategy has HP to achieve a big market share in the market of high-end PC users.
In the market of low-end users, HP adopts the strategy as follows. In this market, the market leader, Lenovo, has the absolute influencing power and HP follows all the strategies and activities of Lenovo in this market. When Lenovo cuts the price to promote its products, HP also follows Lenovo to cut the price of its products. This following strategy reduces the profitability of HP's PC products, but greatly increases the market share of HP. This strategy leads to the rapid increase of its market share in China's PC market, though HP entered the PC market of China later.
4. Conclusions
Based on the analysis in the report, it is founded that PC industry in China has experienced fast development in the past five years and the size of the market continues to increase. Compared with the low growth rate in the mature markets of the developed countries, China's PC industry is forecasted to keep rapid growth in the future and China's PC market has accounted for the biggest market share in the Asia-Pacific area.
The stable political environment and good economic environment in China have a good effect on the development of PC industry in China. And PC is more and more accepted by the people in China and PC has played a more and more important role in the society and people's lives of China. This also drives the development of PC industry and the potentiality to buy PC products in China. Moreover, the development of technologies also drives the development of PC industry in China, because the technological development and innovation in PC gradually reduces the price of PC and provides more innovative products to the customers in China, and the innovation in the distribution channel enriches the ways for the customers in China to buy PC.
The Porter's five forces analysis shows that the bargaining power of suppliers and bargaining power of buyers in China's PC market is both very strong. The threat of new entrants is small but the threat of substitutes is big. The rivalry among the competitors in China's PC industry is very intense because of the short history of China's PC industry, the homogeneity of PC products and the low brand loyalty of the PC consumers in China. The analysis shows that the competitive force in the PC industry of China is very strong, which has a positive effect on the long-term development of China's PC industry.
Lastly, there are four main competitors in the PC industry of China. These four competitors adopt different strategies in the market and drive the development of PC industry in China. As the biggest local PC maker in China, Lenovo has become the market leader in China's PC industry based on the strategy of low price and local brand. Dell has the strategy of adopting its special direct distribution mode in China. This strategy has helped Dell to succeed in the commercial PC market of China but not in the home PC market of China. As a small local PC maker, Founder just focused on the diversified market of enterprise clients and concentrates all their resources on designing and developing the PC products according to the needs of enterprise clients. This strategy has helped Founder to achieve the status of leader in this diversified market of China. Lastly, HP adopts different strategies in the market of high-end users and the market of low-end users. In the market of high-end users, the strategy of HP is to provide PC with high quality and good stability to the users, while in the market of low-end users, the strategy of HP is to follow the strategies and activities adopted by Lenovo, the market leader in the PC industry of China.
References
Burt, G., R. Bradfield, G. Cairns, K. Heijden, and G. Wright. (2006). The Role of Scenario Planning in Exploring the Environment in View of the Limitations of PEST and Its Derivatives. Int. Studies of Mgt. & Org, 36 (3):50-76.
Burt, G., R. Bradfield, G. Cairns, K. Heijden, and G. Wright. (2002). The Sixth Sense: Accelerating Organizational
Learning with Scenarios. Wiley, Chichester.
Haberberg, A., and A. Rieple. (2001). The Strategic Management of Organizations. Pearson Education Limited, Essex.
ICXO. (2006). The Analysis Report of PC Market in China. The Information Center of World Managers, Vol. 5, pp. 12-16.
Kippenberger, T. (1998). Strategy according to Michael Porter. The Antidote, 3 (6): 24-25.
Li, Y., and D. D. Shi. (2005). The Local Research of Dell's Direct Selling Mode. Commercial Economy and
Management, 8: 23-25.
Luffman, G., E. Lea, S. Sanderson, and B. Kenny. (1996). Strategic Management. Blackwell, Oxford.
Paul, F. (2000). Strategic Management: An Introduction to Business and Corporate Strategy. FT Prentice Hall
Porter, M. E. (1980). Competitive Strategy: Techniques forAnalyzing Industries and Competitors. MacMillan, London.
Porter, M. E. (1998). The Competitive Advantage of Nations. London: MacMillan, London.
Shen, J., and M. Y. (2006). The Price Competition between Dell and Lenovo in China. Newspaper of International

International Journal of Business and Management November, 2009
157
Finance, July 29, 2007.
[Online] Available: www.IDC.com.cn (Retrieved from 22 May 2007)
0
500
1000
1500
2000
2500
0%
5%
10%
15%
20%
25%
Figure 1. Statistics of PC Sales in China (2002-2006) (Data Source: IDC)
Figure 2. Market Share of China’s PC Market in Asia-Pacific Area (Data Source: IDC)
Figure 3. Market Share in the PC Market of China (2006) (Data Source: IDC)

Vol. 4, No. 11 International Journal of Business and Management
158
A Study on the Bifurcation of the Proceeds from Convertible Bonds
Issuance and Its Policy Significance for Chinese Accounting Standards
Jinghua Wang
School of Economics and Management, Ningbo University of Technology
Ningbo 315211, China
Doctoral student, School of Management, Huazhong University of Science & Technology
PO box 430074, Wuhan, China
Tel: 86-574-8761-6109 E-mail: [email protected]
Liqiong Yao
School of Economics and Management, Ningbo University of Technology
Ningbo 315211, China
Tel: 86-574-8761-6107 E-mail: [email protected]
Abstract
It is difficult to separate the proceeds from a convertible bonds issue into debt and equity components. Based on some previous different approaches, there is a focus on the improved approach whose views are convertible bond issue proceeds can be separated into accrual debt value, accrual equity value and accrual option value according to the characteristics of debt, equity and hybrid securities with embedded option of convertible bonds. It is concluded that the improved approach can be more in accord with modern financial theory and provide a more accurate evaluation of capital structure. And there are some policy significances for Chinese Accounting Standards.
Keywords: Proceeds from convertible bonds issue, Bifurcation, Policy significance
1. Introduction
Around the world, the issue size of the Convertible Bond has been increased to more than US$600 billion since New York and Erie RailRoad in USA issued the first convertible bonds in 1843. The convertibles market collapsed last September after Lehman Brothers filed for bankruptcy protection. Recently, with a rising market in American, new issues have begun to make a comeback, with 9 listed companies and a combined capitalisation of more than 3.2 billion dollars after more than one year extended lull.
In China, Since China Baoan Group Co.,Ltd issued the first convertible bonds in 1992 (so far), 40 or so convertible bonds are being traded on the Shanghai and Shenzhen stock exchanges, with a combined capitalisation of more than 50 billion Yuan. Chinese firms, spurred by a rebounding domestic share market in financial crisis, are poised to launch a boom in convertible bond issuance. In fact, convertible market trading volume hits near 6-year high. Turnover in the fledgling market reached 5.37 billion Yuan in February 2009, the highest since December 2003, and remained relatively high at 3.33 billion Yuan in March 2009. China convertible bond issuance set to surge again.
Convertible bonds can be swapped for equity when the stock rises to a preset level, and if the shares don’t perform, holders are protected by the security’s value as a bond. So they are very attractive. However, a convertible bond is a special financial product without a reciprocal obligation for both sides which is embedded options, having the characteristics of both debt and equity. So it is difficult to recognize and measure its potential value. So the primary purpose of this paper is to research the bifurcation method of the proceeds from convertible bonds issuance and its policy significance for current Chinese Accounting Standards.
2. Former Studies on the Division of Convertible Bond Issue Proceeds
According to current accounting standards APB Opinion No.14 which is still effective in US today, the issuing company maintain rigid and simplified classification throughout the life of the convertible debt even as the value of the option to convert changes subsequent to issuance. The International Accounting Standards Board issued International Accounting

International Journal of Business and Management November, 2009
159
Standard No. 32 in 1998 requiring the division of convertible bonds into debt and equity but without specific rules on how to calculate the debt and equity values. Instead, this standard offers only suggestions. One is to value the debt component as the present value of the interest payments and the principal and then subtract this amount from the total value of the debt issue to arrive at the value of the equity portion. The other suggestion is from Black-Scholes model, which directly gets the future value, and then gets the debt value by subtracting future value from total issue proceeds.
Before 2006, Chinese current accounting standards also view convertible bonds as debt. The Chinese Finance Minister issued Accounting Standard for Business Enterprises No.22, No. 34, No. 37 in 2006, which was carried out on January 1, 2007. These new accounting standards require the initial issue price to be spilt between debt and equity.
In addition, in China, according to Zhu (2006, p.69), convertible bond value equals straight bond value and conversion option value, which is in fact a finally hybrid security. Si (2004, p.15) viewed the value of convertible bonds as portfolios of straight bond and embedded options.
All over the world, before Marcelle and Ann (2005, p.44) brought forward the expected value, most studies focused on the effect on convertible bonds by Modern Option Pricing Theory. Vigeland (1982, p.348) was an earlier researcher who noted that the option theory could be applied to the probability and timing of conversions. King (1984, p.419) actually calculated the option values for many convertible bond issues and regarded as equity.
The current accounting practice and theory has offered a useful framework for applying the current accounting standards for the initial value recognition of convertible bonds. However, as a derivative financial instrument, the option of being converted or not being converted for convertible bonds has not been embodied in the earlier accounting practice and research. But the last excepted value method brought forward by Marcelle and Ann (2005) has made significant contributions in these developments.
The Expected Value Method believes that the embedded option of convertible bonds is neither debt nor equity, but with the change of the underlying price, it can produce both debt and equity. If the bond is converted, the bond principal does not need to be repaid. The only payments will be the coupons that were paid prior to conversion. If the bond is not converted, all principal and coupons will be paid. So the expected value of the convertible bond is built on the probabilities of conversion. In certain convertible probability, the expected value of debt is the weighted average of straight bond value and present coupon value, and the weight is the probability of conversion. Accordingly, the expected value of equity can be obtained by subtracting expect debt value from total price of bond issued, which can also obtained from Black-Scholes model.
That is to say, if n is potential number of shares, p is conversion probability, the expected number of shares is n (p). The probability of conversion (p) is the key factor which can be calculated by the Black-Scholes model.
So the formula about the expected value of the debt and the expected equity value are as follows:
The expected value of the debt = (1-p)(value of the straight bond)+ p (value of the coupons)
The expected equity value = total value-the expected value of the debt
The above methodology also called the separating method, dynamically separates and recognizes the debt and equity value of the total convertible bond issued on the basis of convertible probability, other than IAS32 viewing the value of straight bonds as the value of debt, whether on the date of issuance or right after.
3. Improved Approach
The potential value for convertible bonds varies with the market price of the underlying stock and the probability of conversion, which is new dynamic notion. The expected value method has used this notion.
For convertible bonds, sometimes it is equity, sometimes debt, and sometimes both of them. No matter what the situation is, it always has the feature of option before it is converted. And these probabilities shall be embodied on the way of recognition and measurement of the potential share value of conversion for convertible bonds.
Firstly, if there is no conversion at maturity, convertible bonds are characterized as debt, but there is still option compared with vanilla bond. So bond issue proceeds should be divided into the straight bonds value and the option value.
Convertible bond issue proceeds = accrual debt value + accrual option value
Accrual debt value = straight bond value = present value of principal and coupons
Accrual option value = convertible bond issue proceeds- accrual debt value
Secondly, if it is converted completely at maturity, convertible bond is characterized as equity. The bond holder can end up as equivalent stocks at maturity. So convertible bond issue proceeds is the summation of conversion shares value and conversion option value.
Convertible bond issue proceeds = accrual equity value + accrual option value

Vol. 4, No. 11 International Journal of Business and Management
160
Accrual equity value = straight equity value = present value of conversion shares value
Accrual option value = convertible bond issue proceeds - accrual equity value
Eventually, if conversion probability is p, convertibles have “p” probability of ending up as stock and “1-p” probability of ending up as debt. So convertible bond issue proceeds can be recorded the summation of debt value, equity value and conversion option value.
Convertible bond issue proceeds = accrual debt value + accrual equity value + accrual option value
Accrual debt value = (1-p) * straight bond value
Accrual equity value = p * present value of straight equity
Accrual option value = convertible bond issue proceeds-(accrual debt value + accrual equity value)
The method analyzed above is the improved approach. It suggests that if convertible bonds are entirely converted, convertible bond issue proceeds is the summation of option value inherent in a convertible bond and straight equity value which here is a counterpoint of present value of the coupons in the excepted value method.
Therefore different understanding of economic reality of convertible bonds above results in different ways to bifurcate issue yield. Then different approaches will influence accurate estimates of debt, equity, diluted EPS and capital structure.
4. Test of Different Methods
Next, we will test and analyze the differences among methods above taking China Merchants Bank’s convertible bonds as an example.
China Merchants Bank founded in 1987, with the stockholding reorganization in May, 1994, has become the first joint stock commercial banks in China and the largest among listed banks based on total asset size. On November 10th, 2004, it issued a 5-year convertible bond with a face value of 6.5 billion Yuan and a coupon rate of 1.75%, which is 3.75% below the straight bond’s 5.5% because of embedded option. Each 1000 Yuan convertible bond can be converted into 107.066381 shares of common stock at the bond’s maturity, i.e. conversion price is 9.34 Yuan. The issuer cannot call the bonds back. The current price of the stock is 9.1 Yuan. The stock pays no dividend. The expected price volatility is 17.52% based on the last year’s (250 working days) closing price of convertible bonds of China Merchants Bank. The risk-free interest rate of 2.25% is from the bank’s 5-year loan interest rates of the same term. The income tax rate is 33%. The net income is 3.144 billion Yuan.
We have purposely simplified the example by assuming that: 1) The issuer cannot call the bonds back;2) There are no embedded options except for the call options represented by the conversion feature; 3) The call is European style; 4) The exercise date is the same as the bond's maturity date. Based on these assumptions Black-Scholes model can be used.
Tab.1, Tab.2 and Tab.3 details the company’s convertible bond issue, its embedded option and initial capital structure. The company issued a 5-year convertible bond with a face value of 6.5 billion Yuan and a coupon rate of 1.75%, which contain 695.93 million options and valued at 0.55 Yuan each calculated by using the Black-Scholes model based on the parameters shown in the second column-total option value 0.38 billion Yuan. The present value of 6.5 billion Yuan straight bond without embedded option is 5.46 billion Yuan based on its principal and coupons, which is displayed in the first column. To the calculation of expected numbers of shares, expected value of debt and equity, the conversion probability is a key ingredient. If the bond has no other embedded options, such as issuer calls, and can be converted only at maturity, in the meanwhile the stock does not pay dividends, investors can be assumed to be rational, N(d2) in the Black-Scholes model-the probability of the option being in the money at the exercise date-is the conversion probability in the case of a convertible bond.
Therefore Chinese practice now requires bifurcation of convertible bonds into debt and equity and earnings per share after dilution-the separating method following international accounting standard. Therefore there are four methods including straight debt method, separating method, expected value method and improved approach in this paper which are analyzed in Tab.4 to show how the calculation of diluted shares and EPS are affected. Because the straight debt method and the separating debt method have not considered the conversion probability while expected value method and improved approach have done, four methods are divided into two kinds in Tab.4: No.1 is the straight debt method and the separating debt method without consideration of conversion probability and No.2 is expected value method and the improved approach with consideration of conversion probability.
Tab.4 shows that owing to the conversion probability p 0.864 results in the expected conversion shares of stock 601284797 shares in No.2 method other than 695931477.52 conversion shares of stock in No.1 method. Conversion probability is not considered and assumed it is converted completely so that No.1 method’s percentage dilution is 10.16%, which is higher than the percentage dilution 8.78% with the consideration of conversion probability 0.864. To

International Journal of Business and Management November, 2009
161
illustrate the impact on diluted EPS, net income is firstly recalculated by adding the interest associated with the convertible issue, after taxes, to net income. That is to say, in No.2 method, only the portion of the after-tax interest associated with the probability of conversion is added back while all the after-tax interest is added back in No.1 method. The result is a diluted EPS of 0.427 (3.22/7.54) for No.1 method. In contrast, diluted EPS under the second kind method is 0.431(3.21/7.45). Apparently, the diluted EPS of No.1 method is less relatively and is understated. Besides, compared to the Basic EPS 0.46, both EPS are lowered and the effect of dilution is very obvious.
From the above analysis we can see that No.1 method is based on the assumption of “converted entirely”. Especially in straight debt method, convertible bonds are totally treated as debt, which obviously can not portray economic reality of “converted entirely”. In contrast with them, No.2 method can do it well.
Tab.5 illustrates how the leverage calculation is affected by four methods-the straight debt method (No.1), the separating debt method (No.2), the expected value approach (No.3) and the improved approach (No.4). The calculation of most data is figured in Tab.1,2 ,3, but two data will be especially explained as follows:
Firstly, in the expected value method, the expected debt value = (1-0.864)×5.46+0.864×0.49 =1.16 billion yuan.
Secondly, in the improved method, accrual debt value= (1-0.864)×5.46=0.74 billion yuan,accrual equity value=0.864×6.50×0.765134=4.30 billion yuan,accrual option value=6.50-0.74-4.30=1.46 billion Yuan.
Namrly, in the improved approach, convertible bond issue proceeds 6.5 billion is divided into three parts of debt, equity and option, 0.74, 4.30 and 1.46 billion yuan respectively. However, both equity and option increase in owner’s equity, which must be credited to owner’s equity accounts and may affect the leverage and profitability.
In Tab.5, the debt to equity after issue becomes 9.44, 9.27, 8.62 and 8.56 respectively because of the different methods while the debt to equity before issue is the same. It is because with the straight debt method, the convertible bonds are totally viewed as debt, without reflecting the shares and embedded option value. And the separating debt method regards the straight bond value as the debt value while the expected value method regards the expected debt value as debt value. Because the straight debt value is always higher than the expected debt value, the debt value in separating debt method is always higher than that in expected value. With the improved approach, the separated debt value 0.74 billion Yuan is the smallest among the four methods, which make the highest equity value 5.76 billion Yuan, so the ratio of debt and equity is also smallest. The straight debt method overrates the ratio of debt and equity, but separating debt method, the expected value method and the improved approach portray the economic reality by the conversion probability gradually.
5. Conclusion and its policy significances
There is a focus on the improved approach whose views are convertible bond issue proceeds can be separated into accrual debt value, accrual equity value and accrual option value according to the characteristics of debt, equity and hybrid securities with embedded option of convertible bonds. It is concluded that the improved approach is a more accurate evaluation method of capital structure so that it can reflect more fully the economic reality of convertible bonds. Therefore there are some policy significances for Chinese Accounting Standards.
5.1 Current accounting rules must reflect more fully the economic reality of convertible bonds
Just like The International Accounting Standards, Chinese Accounting Standard for Business Enterprises No.37 requires the division of convertible bonds into debt and equity. But it doesn’t value the option so that it doesn’t reflect fully the economic reality of convertible bonds.
5.2 The definition of liability must include convertible bonds
Chinese Enterprise Accounting Basic Standards defines a liability as probable future sacrifices of economic benefits arising from present obligations of a particular entity to transfer assets or provide services to other entities in the future as a result of past transactions or events. But convertible bonds , viewed as an equity transantion and unissued stock, are not considered an asset and economic benefits. Then convertible bonds can not be “future sacrifices of economic benefits” to redeem debt. So there is a conflict between the definition of liability and convertible bonds characteristias.
5.3 The diluted EPS must be computed based on the probabilities of conversion
The potential shares are included in calculating diluted EPS according to Chinese Accounting Standard for Business Enterprises No.34. This is a big step forward. But it is much better if the probabilities of conversion are its reasoning.
References
King, Raymond. (1984). The effect of convertible bond equity values on dilution and leverage. Accounting Review, Vol. 59, 3, 419-431.
Marcelle Arak, & L Ann Martin. (2005).Convertible bonds: how much equity, how much debt?. Financial Analysts
Journal, 2, 44-52.

Vol. 4, No. 11 International Journal of Business and Management
162
Si, Zhenqiang, & Zhao, Xia. (2004). Research on accounting for convertible bonds in China. Modern Accounting, 1, 15~17.
Vigeland, Robert L. (1982). Dilution of earnings per share in an option pricing framework. Accounting Review, Vol. 58, 2, 348-359.
Zhu, Naiping, Kong, Yushen, & Xu, Xizheng. (2006). A bifurcation approach and a case study for debt and equity inherent in a convertible bond. Accounting Research, 3, 69-74.
Table 1. CMB’s convertible bond issue
Convertible Bond Issue (billion Yuan)
Issue size 6.50
Coupon 1.75%
Maturity 5
Numbers of potential shares in issue 695931477.52
Implicit strike price 9.34
Yield on vanilla bond 5.50%
value of straight bond 5.46
Value of options 0.38
Table 2. CMB’s previous debt and equity issues
Prior Debt and Equity (billion Yuan)
Debt 581.88
Numbers of shares 6.85
Equity Value 62.32
Table 3. CMB’s Conversion Option
Conversion Option
Current stock price 9.1
Strike price 9.34
Volatility 0.01752
Risk-free rate 2.25%
Dividend 0
Value of each option 0.55
Conversion probability, p 0.864
Table 4. Effect of convertible bond issue on CMB’s EPS(billion Yuan)
Measure calculated No. 1 No. 2
Preexisting shares (Numbers of shares) 6848181636 6848181636
Additional shares from convertible issue 695931477.52 601284797
Total shares after issue = + 7544113114 7449466433
Percentage dilution = / 0.1016 0.087
Net income after tax(NIAT) 3.14 3.14
Basic EPS = / 0.46 0.46
NIAT of diluted EPS 3.22a 3.21b
Diluted EPS = / 0.427 0.431
Note: (a) Net income is recalculated by adding the interest associated with the convertible issue [6500000000.×1.75%×(1-33%)=76212500] to net income. (b) Only conversion portion of bond’s coupons (76212500*0.864=65847600) is added.

International Journal of Business and Management November, 2009
163
Table 5. Leverage measures for CMB (billion Yuan)
Measure Calculated No. 1 No. 2 No. 3 No. 4
Debt prior to new issue(1) 581.88 581.88 581.88 581.88
convertible bond issue proceeds (2) 6.50 6.50 6.50 6.50
Value of equity prior to issue of convertible bonds(3) 62.32 62.32 62.32 62.32
Equity part of new bond issue(4)=(2)-(9) 0 1.04 5.34 5.76
Total equity value(5)=(3)+(4) 62.32 63.36 67.66 68.08
PV of convertible bond face(6) 4.97 4.97 4.97 4.97
PV of bond’s coupons(7) 0.49 0.49 0.49 0.49
Value of straight bond(8)=(6)+(7) 5.46 5.46 5.46 5.46
Value of “debt”in issue(9) 6.50 5.46 1.16 0.74
Total debt after issue(10)=(1)+(9) 588.38 587.34 583.05 582.63
Debt to equity before issue(11)=(1)/(3) 9.34 9.34 9.34 9.34
Debt to equity after issue(12)=(10)/(5) 9.44 9.27 8.62 8.56

Vol. 4, No. 11 International Journal of Business and Management
164
A Research Survey of Behavioral Biases of Investment Finance
Xiaofeng Wu
College of Economics and Management, Huaiyin Normal University
Huaian 223300, China
E-mail: [email protected]
Abstract
Because psychology systematically explores human judgment, behavior, and well-being, it can teach us important facts about how humans differ from traditional economic assumptions. In this essay I discuss a selection of psychological findings relevant to economics. Standard economics assumes that each person has stable, well-defined preferences, and that she rationally maximizes those preferences. Even if we are willing to modify our familiar assumptions about preferences, or allow that people make systematic errors in their attempts to maximize those preferences, it is sometimes misleading to conceptualize people as attempting to maximize well-defined, coherent, or stable preferences.
Keywords: Traditional economics, Systematic errors, Standard economics, Behavioral biases
1. Introduction
Because psychology systematically explores human judgment, behavior, and well-being, it can teach us important facts about how humans differ from traditional economic assumptions. In this essay I discuss a selection of psychological findings relevant to economics. There are two basic components of the standard economics model of the individual: That she has stable, well-defined preferences, and that she rationally maximizes those preferences. Given some choice set X, a person is assumed to “Max x X U(x).”Psychological research can be roughly categorized by how radically it challenges this model, and by the nature of the modifications implied.
2. Biases in judgment
Economists have traditionally assumed that, when faced with uncertainty, people correctly form their subjective probabilistic assessments according to the laws of probability. But researchers have documented many systematic departures from rationality in judgment under uncertainty. A feel for this research is well expressed in Tversky and Kahneman (1974), which serves as a de facto introduction to Kahneman, Slovic and Tversky (1982), an influential volume containing many of the major contributions to behavioral research on heuristics and biases: How do people assess the probability of an uncertain event or the value of an uncertain quantity? This article shows that people rely on a limited number of heuristic principles which reduce the complex tasks of assessing probabilities and predicting values to simpler judgmental operations. In general, these heuristics are quite useful, but sometimes they lead to severe and systematic errors. The subjective assessment of probability resembles the subjective assessment of physical quantities such as distance or size. These judgments are all based on data of limited validity, which are processed according to heuristic rules. For example, the apparent distance of an objects determined in part by its clarity. The more sharply the object is seen, the closer it appears to be. This rule has some validity, because in any given scene the more distant objects are seen less sharply than nearer objects. However, the reliance on this rule leads to systematic errors in the estimation of distance. Specifically, distances are often overestimated when visibility is poor, because the contours of objects are blurred. On the other hand, distances are often underestimated when visibility is good because the objects are seen sharply. Thus, the reliance on clarity as an indication of distance leads to common biases. Such biases are also found in the intuitive judgment of probability. Behavioral research on judgment under uncertainty teaches us that people are not nearly as rational as economists assume. But it teaches us much more. In this passage, the word “error” does not appear without the word “systematic”. This literature does not merely teach us that people aren’t perfectly rational; it proposes specific ways that judgment departs from the rational model. While research on heuristics and biases is not as amenable to incorporation into mainstream formal economics as the material presented in the previous section, this literature already contains some clear and general insights. For the remainder of this section, I describe some of this research. I concentrate on just a few particular heuristics and biases, and then more quickly outline some others. I conclude by discussing briefly some of the evidence for how people do and don’t learn to correct biases.
3. The Representativeness Heuristic
We think a person is more likely to be a member of some group if that person is similar to the typical member of that

International Journal of Business and Management November, 2009
165
group. If a man behaves more like a criminal (shifty eyes, etc.), then we think it is more likely he is a criminal. This simple intuition is, of course, captured by Bayes Law.
Research on the representativeness heuristic, however, demonstrates that people tend to over-use “representativeness” in assessing probabilities. Bayes’ Law tells us that our assessment of likelihoods should combine representativeness with base rates (the percentage of the population falling into various groups). Yet people under-use base-rate information in forming their judgments. If we see somebody who looks like a criminal, our assessment of the probability that he is a criminal tends to under-use knowledge about the percentage of people who are criminals. Similarly, if a certain medical test always comes out positive among people with a rare disease, and only occasionally among people without the disease, people will tend to exaggerate the likelihood of having the disease given a positive result. Given the rarity of the disease, the total number of false positives may be far greater than the number of true positives.
4. The Law of Small Numbers
A phenomenon related to the under-use of base rates is “the law of small numbers”: People exaggerate how often to which a small group will closely resemble the parent population or underlying probability distribution that generates the group. We expect even small classes of students to contain very close to the typical distribution of smart ones and personable ones. Likewise, we underestimate how often a good financial analyst will be wrong a few times in a row, and how often a clueless analyst will be right a few times in a row. By the law of small numbers, people expect close to the same probability distribution of types in small groups as they do in large groups. For example, it is much less likely that at least 80% of 20 coin flips will come up heads than that at least 80% of 5 coin flips will come up heads (about 1% and 19%, respectively); however, people tend to view these as comparably likely. For example, Kahneman and Tversky asked undergraduates the following question: A certain town is served by two hospitals. In the larger hospital about 45 babies are born each day, and in the smaller hospital about 15 babies are born each day. As you know, about 50 percent of all babies are boys. However, the exact percentage varies from day to day. Sometimes it may be higher than 50 percent, sometimes lower. For a period of 1 year, each hospital recorded the days on which more than 60 percent of the babies born were boys. Which hospital do you think recorded more such days? Twenty-two percent of the subjects said that they thought that it was more likely that the larger hospital recorded more such days, and 56% said that they thought the number of days would be about the same. Only 22% of subjects answered correctly that the smaller hospital would report more such days. This is the same fraction as guessed exactly wrong. Apparently, the subjects simply did not see the relevance of the number of child births per day. While people believe in the law of small numbers, they apparently don’t believe in the law of large numbers: While we exaggerate the resemblance of small samples to the overall population, we underestimate the resemblance that large samples will have to the overall population.
The law of small numbers implies that people exaggerate the likelihood that a short sequence of flips of a fair coin will yield roughly the same number of heads as tails. What is commonly known as “the gambler’s fallacy” is a manifestation of this bias: If a fair coin has not come up tails for a while, then on the next flip it is “due” for a tails, because a sequence of flips of a fair coin ought to include about as many tails as heads. When the underlying probability distribution generating observed sequences is uncertain, the fallacy leads people to over-infer the probability distribution from short sequences. Because we exaggerate how likely it is that a bad financial analyst making three predictions will be wrong at least once, we exaggerate the likelihood that an analyst is good if she is right three times in a row.
5. Belief Perseverance and Confirmatory Bias
Once forming strong hypotheses, people often are less attentive to relevant new information supporting or contradicting their hypotheses. For instance, once you become convinced that one investment strategy is more lucrative than another, you may simply stop paying attention to the feedback you get. This can often lead people to maintain a hypothesis formed on weak evidence, even if later evidence should lead them to reject earlier beliefs. A particularly elegant demonstration of “anchoring” is found in Bruner and Potter. About 90 subjects were shown blurred pictures that were gradually brought into sharper focus. Different subjects began viewing the pictures at different points in the focusing process, but the pace of the focusing process and final degree of focus were identical for all subjects. Strikingly, of those subjects who began their viewing at a severe-blur stage, less than a quarter eventually identified the pictures correctly, whereas over half of those who began viewing at a light-blur stage were able to correctly identify the pictures. Bruner and Potter (1964, p. 424) conclude that “Interference may be accounted for partly by the difficulty of rejecting incorrect hypotheses based on substandard cues.” That is, people who use weak evidence to form initial hypotheses have difficulty correctly interpreting subsequent, better information that contradicts those initial hypotheses. This form of anchoring does not necessarily imply that people misinterpret additional evidence, only that they ignore additional evidence. While such anchoring is potentially quite important, psychological evidence reveals a stronger and more provocative phenomenon: People tend to misread evidence as additional support for initial hypotheses.

Vol. 4, No. 11 International Journal of Business and Management
166
6. Conclusions
Mainstream economics employs a powerful combination of methods: methodological individualism, mathematical formalization of assumptions, logical analysis of what conclusions follow from those assumptions, and sophisticated empirical field testing. I believe these methods are tremendously useful, and should not be abandoned. But these methods often raise a barrier to incorporating psychological insights into economics: While psychology investigates humans in all their richness, economics requires models that are not so rich as to retard the process of drawing out their economic implications. For a discipline such as economics that places a high premium on the logic and precision of arguments and the quantification of evidence, incorporating all facets of human nature is neither attainable nor desirable.
As messy as complicating our familiar model of humans will be, however, it is not legitimate for economics to continue to ignore psychological research. Many psychological findings are robust enough, tractable enough, and of enough potential economic importance that we ought begin to integrate them into economics. Other findings raise more fundamental challenges, and incorporating them into economic research will take longer. But even in these cases, economists ought to become aware of the shortcomings of our models, regret these shortcomings, and keep our eyes open for ways to remedy them. Most importantly, we must abandon meta-arguments about whether it is “possible” that psychologists have identified economically relevant departures from rationality, self interest, and other familiar assumptions. Of course it is possible, and in fact it is true. In this essay, I review what research shows some of those departures to be.
References
Adams, J. S. (1963). Wage Inequities, Productivity and Work Quality. Industrial Relations, 3: 9-16.
Ainslie, G.. (2005). Specious reward: A behavioral theory of impulsiveness and impulse control. Psychological Bulletin,82(4): 463-496.
Battalio, R. C., J. H. Kagel and K. Jiranyakul. (1990). Testing between Alternative Models of Choice under Uncertainty: Some Initial Results. Journal of Risk and Uncertainty, 3(1): 25-50.
Baumann, A. O., R. B. Deber and G. G. Thompson. (2007). Overconfidence among physicians and nurses: The "micro-certainty, macro-uncertainty" phenomenon. Social Science & Medicine, 32(2): 167-174.
Fehr, E. and P. Zych. (2004). The Power of Temptation: Irrationally Myopic Excess Consumption in an Addiction Experiment. Mimeo (September).
Fellner, W. (1961). Distortion of subjective probabilities as a reaction to uncertainty. Quarterly Journal of Economics,75: 670-694.
Kagel, J. and A. Roth, Eds. (2006). Handbook of Experimental Economics. Princeton, Princeton University Press.
Kahn, A. and T. Tice (2003). Returning a Favor and Retaliating Harm: The Effects of Stated Intentions and Actual Behavior. Journal of Experimental Social Psychology, 9: 43-56.
Kahneman, D. (1974). Reference points, anchors, norms, and mixed feelings. Special Issue: Decision processes in negotiation. Organizational Behavior & Human Decision Processes, 51(2): 296-312.
Kahneman, D. (1982). Judgment and decision making: A personal view. Psychological Science, 2(3): 142-145.

International Journal of Business and Management November, 2009
167
The Influence of Psychological Empowerment
on Overall Job Satisfaction of Front Office Receptionists
Mohd Onn Rashdi Abd Patah (Corresponding author)
Faculty of Hotel & Tourism Management, Universiti Teknologi MARA (UiTM)
23000 Dungun, Terengganu, Malaysia
Tel: 60-13–934-2148 E-mail: [email protected]
Salleh Mohd Radzi
Coordinator, Graduate Coursework Program,
Faculty of Hotel & Tourism Management, Universiti Teknologi MARA (UiTM)
40450 Shah Alam, Selangor, Malaysia
Tel: 60-13–342-8781 E-mail: [email protected]
Rahman Abdullah
Industry Linkage Unit, Universiti Teknologi MARA (UiTM)
23000 Dungun, Terengganu, Malaysia
Tel: 60-19–741- 6820 E-mail: [email protected]
Azahar Adzmy
Faculty of Hotel & Tourism Management, Universiti Teknologi MARA (UiTM)
23000 Dungun, Terengganu, Malaysia
Tel: 60-12–323-0192 E-mail: [email protected]
Razlan Adli Zain
Faculty of Hotel & Tourism Management, Universiti Teknologi MARA (UiTM)
23000 Dungun, Terengganu, Malaysia
Tel: 60-12 – 517-3527 E-mail: [email protected]
Nazarudin Derani
Faculty of Hotel & Tourism Management, Universiti Teknologi MARA (UiTM)
23000 Dungun, Terengganu, Malaysia
Tel: 60-13 – 937-9232 E-mail: [email protected]
Abstract
The highly competitive business environment has encouraged the hotel sector to be more practical in its employees’ performance so as to provide a high standard of quality services to the customers. With that, their role of upholding a satisfactory service level is vital and at the same instant, depends on their satisfaction level too. Empowering employees are among the factors that might influence positive employee outcomes such as job satisfaction. This study was conducted to examine the influences of psychological empowerment on overall job satisfaction of Front Office Receptionists in Kuala Lumpur 5-star hotels. A total of 210 questionnaires were distributed at 21 hotels in Kuala Lumpur, Malaysia. Results showed that psychological empowerment does have significant influences (through the dimensions of meaningfulness, competence and influence) on overall job satisfaction of the receptionists. The findings also suggested that receptionists’ age and tenure affected their sense of overall job satisfaction. Hotel managers should include this in their effort and consideration to enhance employees’ performance and competencies. More competitive solutions such as enhancing participation by the departmental decision making process, encouraging creativity, implementing better work environment and employment packages may harmonize work relationships and outcomes.
Keywords: Psychological empowerment, Overall job satisfaction, Receptionists

Vol. 4, No. 11 International Journal of Business and Management
168
1. Background of the study
It is undeniable that the contributions of the hotel sector to the national economy are numerous in providing employment opportunities, provision of alternative and added income for the rural population, supporting the growth of secondary activities such as material and equipment suppliers, and the sector also complements the expansion of both domestic and inbound tourism (Awang, Ishak, Radzi & Taha, 2008). The tourism industry contributed a total of RM 47.5 billion from foreign earnings and the total Gross Domestic Product (GDP) in 2007 was RM 641.9 billion (Tourism Malaysia, 2008). The industry has expanded at the rate of 7.1% and accounted for 54.3% of the nation’s GDP, as compared to previous year’s rate at 53.6% (Ministry of Finance [MOF], 2008). The hotel industry is expected to retain its share of 2.4% GDP in 2008, supported by higher consumer spending, sustained domestic investment and higher tourist arrivals (MOF, 2008). The hotel industry has the responsibility and role of increasing guest satisfaction with its services and products. This can be carried out through efficient service by frontline employees, particularly the Front Office receptionists. The Front Office is known to be the nerve centre of a hotel, although its strengths are only supported by 11.0 % of the total workforce by departments in Malaysia (MAH, 2008). Maintaining the appropriate level of services from frontline employees has become a critical issue for the hotel industry because a service firm’s success depends on the frontline employees’ performance (Chebat, Babin & Kollias, 2002).
As explained by Kemp & Dwyer (2001), employees are likely to be more motivated and more productive if they feel they can make a valuable contribution to the organization through either contributing new ideas, better ways of doing things and participation in decision-making. Kemp and Dwyer (2001) further stressed that employees are more receptive to change in the organization if they feel they have had their views taken into consideration, even if the organization does not implement employees' preferred options. In response to this, hotel managers have sought possible solutions and strategies that will increase frontline employees’ performance and job satisfaction. Successful service firms have invested resources into programs in order to increase their employees’ performance and job satisfaction (George & Weimerskirch, 1994). Empowering employees may be one of the approaches to a better organizational strategy in harmonizing employees’ performance and job satisfaction. Empowerment and job satisfaction have been raised as important issues and emphasized as ways to reduce employee turnover, improve workplace environments, and help organizations function effectively in the hospitality industry (Erstad, 1997). By identifying and exploring the relationship, it is hoped that implementation of such concepts and strategy will help management to reduce sense of dissatisfaction among employees towards their employers. Given the extent to which strategies designed to foster employee empowerment are being implemented in the hospitality industry, research on its outcomes (job satisfaction) is clearly warranted (Sparrowe, 1994). Therefore this study has been carried out to examine the relationship between employee psychological empowerment on overall job satisfaction focusing on the Front Office receptionists of 5-star hotels in Kuala Lumpur, Malaysia.
2. Literature review
2.1 Employee psychological empowerment
Employee empowerment is not a new management concept since it has been implemented for more than a decade. Employee empowerment which involves employee participation is a complex management tool that over 50 years of research has proved, when applied properly, can be effective in improving performance, productivity and job satisfaction (Sashkin, 1984). Numerous studies have defined empowerment as intrinsic task motivation (e.g, Conger & Kanungo, 1988; Thomas & Velthouse, 1990) or motivation reflecting the person-environment fit (Zimmerman, 1990). Brymer (1991) on the other hand defined empowerment as the process of decentralizing decision-making in an organization, by means of which managers give more discretion and autonomy to the frontline employees. Although empowerment has been defined in numerous ways, most authors agree that the core element of empowerment involves giving employee discretion (or latitude) over certain task related activities without neglecting the responsibilities that come along with it (Bowen and Lawler, 1992; Conger and Kanungo, 1988; Schlessinger and Heskett, 1991). Early use of the construct of empowerment tended to revolve around issues of power and control where empowerment was considered a management technique used to motivate employees, by delegating or sharing power with them (Kanter, 1983). Investigation of the use of empowerment in service sector organizations however reveals a number of different forms of empowerment being applied in practice (e.g. Conger & Kanungo, 1988; Thomas & Velthouse, 1990; Spreitzer, 1992, 1995; Zimmerman, 1995).
This study focused on the early work of Spreitzer (1992; 1995) and Fulford and Enz (1995) on psychological empowerment. Spreitzer (1992) focused on the psychological empowerment construct and validation of empowerment. According to Spreitzer (1995) empowerment is a continuous variable; people can be viewed as more or less empowered, rather than empowered or not empowered. Outcomes from the implementation of empowerment at work will result in an organization reaching its desired goals and expectations. Therefore, successful implementation of such a work concept is intended to have a significant positive effect on the organizational and employee outcome variables such as motivation and job satisfaction. The four dimensions of empowerment outlined by Spreitzer (1995) were developed and

International Journal of Business and Management November, 2009
169
evaluated by research conducted in a manufacturing environment. The dimensions, therefore, may not fully apply effectively in a service organization. Fulford and Enz (1995) assessed the effects of perceived empowerment on employees in an empirical study of a number of service organizations, where data were collected from service employees in a number of American private clubs. They argued that in a service environment an employee’s ability to influence his or her own work duties is not separate from the ability to influence organizational goals because a significant proportion of organizational outcomes in a service context rely on employee behaviours. As the delivery of services by service employees involves interacting with customers, the dimension of self-determination captures the degree to which employees are able to control the customers’ experiences of service. Therefore, Fulford and Enz (1995) suggested the three dimensional construct of psychological empowerment to be more suitable in the service industry setting. They are meaningfulness, competence and influence which are the earlier constructs developed and validated by Spreitzer (1995) and Thomas and Velthouse (1990).
2.2 Job satisfaction
Locke (1976) defined job satisfaction as a pleasurable or positive emotional state resulting from the appraisal of one's job or job experiences. Edward and Scullion (1982) identified the meaning of job satisfaction as the overall measurement of working attitudes of the reception, happiness, and pleasure in the job. Employees’ job satisfaction is also concerned with supervision quality, working conditions, intrinsic compensation, benefits, and company policies (Hoffman & Ingram, 1992). Robbins and Coulter (1996) stated that job satisfaction is an employee's general attitude towards his or her job. Meanwhile Cranny, Smith, and Stone (1992) defined job satisfaction as whether employees find their employment sufficiently satisfactory to continue in it, either permanently or until they have prepared for greater responsibilities. Susskind, Borchgrevink, Kacmar, and Brymer (2000) explained that job satisfaction represents the workplace and employees’ perceptions of their job. Job satisfaction can be predicted by employees’ evaluation of the work climate, levels of organizational support and the employment situation. In the hospitality industry, not much of a difference was discovered. According to Lam, Zhang, & Baum (2001) the hotel’s goal rests on the employees’ belief that their efforts can lead to the satisfaction of employees’ needs.
2.3 Employee psychological empowerment and overall job satisfaction
The successful implementation of an empowerment concept in the workplace does have its own unique feedback and results. The purpose of employee empowerment is not only to ensure that effective decisions are made by the right employees but to provide a mechanism by which responsibility for those decisions is vested in individuals and teams (Ford & Fottler, 1995). These additional responsibilities must be viewed as a positive means to enhance productivity and creativity among employees. The outcome expected from this is the ability of employees themselves to experience a higher sense of job satisfaction in their work and performance. Some hospitality and tourism employers have been quick to adopt the construct of employee empowerment as one discriminating element of job satisfaction in the hope of increasing job satisfaction (Salazar, 2000). It is also thought to contribute significantly to reducing service failures. In the1990s, the employee empowerment approach to service was being touted as the remedy for problems of poor customer service and inefficient operations (Bowen & Lawler, 1995). Previous researchers have also highlighted the significant relationship between empowerment and job satisfaction (e.g. Spreitzer, 1996; Fulford & Enz, 1995; Hancer & George, 2003). Fulford and Enz (1995) had several findings in their study; they suggested that perceiving oneself as empowered is positively linked to the emotional states of workers and their overall attachment to the work environment, but is not as strongly linked to service delivery and performance. Empowerment may contribute to an employee's job satisfaction, but may not shape work effort and performance as profoundly (Fulford & Enz, 1995). This is not surprising, since attitudes are not perfectly linked to behaviours (Schneider, 1988). Nevertheless, the importance of perceived empowerment in enhancing employee job satisfaction should not be ignored, since the unsatisfied employee is more likely to provide poor service, leave, or be absent more frequently (Heskett, Jones, Loveman, Sasser & Schlesinger, 1994). Based on the literature reviews highlighted above, the following hypotheses were proposed:
H1: Employee psychological empowerment positively influences overall job satisfaction.
H1a: The employee psychological empowerment dimension of meaningfulness positively influences overall job
satisfaction.
H1b: The employee psychological empowerment dimension of competence positively influences overall job satisfaction.
H1c: The employee psychological empowerment dimension of influence positively influences overall job satisfaction.
H2: Employees’ psychological empowerment scores differ significantly based on their demographic and work profile information.
H3: Employees’ overall job satisfaction scores differ significantly based on their demographic and work profile information.

Vol. 4, No. 11 International Journal of Business and Management
170
2.4 Theoretical framework
Figure 1 illustrates the theoretical framework for this study. The independent variable was employee psychological empowerment and the dependent variable was overall job satisfaction. The dimensions of psychological empowerment used were based on the work of Fulford and Enz (1995). For overall job satisfaction, a three items construct was used adopted from Salazar (2000) and Di Xie (2005).
3. Sample of the study & data collection method
Front Office receptionists working at 5 star hotels located in Kuala Lumpur are the sample of the study. Tourism Malaysia (2007) listed 23 hotels categorized as 5 star rated hotels, or large-sized hotels with 100 rooms and above in Kuala Lumpur. Meanwhile, after cover letters were sent to the 23 hotels involved, only 21 hotels agreed to participate. The sample size was amounted to a total of 210 receptionists and mailed questionnaire method was employed. At the end of the time frame, a total of 91 questionnaires were gathered, usable and finally coded. This represents 43 percent of the total questionnaires distributed earlier.
4. Results & analysis
4.1 Reliability & validity analysis
The Cronbach’s alpha coefficient value for all variables in the study revealed a range of coefficient value from .68 to .91 accordingly. The dependent variable of overall job satisfaction had a high reliability coefficient of .91 despite the low number of scale items (three items). The independent variable of psychological empowerment showed that its dimensions of meaningfulness had a coefficient value of .87, competence a value of .68 and influence had a reliability coefficient value of .84. The overall coefficient value of psychological empowerment had a reliability coefficient value of .86. The results also indicated that the reliabilities of the scales used in this study were high and aligned with previous researchers’ findings (Fulford & Enz, 1995; Salazar, 2000; Di Xie, 2005; Lee, 2008; Coughlan, 2005). It also demonstrates the internal consistency of a reliable scale. (Table 2)
4.2 Descriptive statistics & analysis
Table 3 shows that the distribution of gender was higher for females with a total of 49 female respondents (53.8%). On the other hand, there were 42 male respondents or 46.2 percent out of the total respondents. The age range of the respondents showed that most of them were between 18 and 29 years of age. Specifically, there were 30 respondents (33.0%) between the ages of 18 to 23 years, followed by those with an age range between 24 to 29 years, with the frequency of 31 or 34.1% of the total respondents and, finally 17 of the respondents or 18.7 percent were between the ages of 30 to 34 years. Another 9 or 9.9 percent of them in the range of 35 to 40 years and four of them (4.4%) were aged more than 40 years. In terms of hotel or organizational tenure, 11 percent of the total respondents had fewer than six months of work experience in hotel, followed by 34.1 percent with experience between six months and one year, 30.8 percent with experience of two to three years, 14.3 percent with four to five years of experience and 9.9 percent had more than five years of experience. (Table 3)
4.3 Pearson correlations matrix among study variables
There was a significant correlation between dimension of meaningfulness and competence with r=.32 (p<0.01). This was followed by a correlation between meaningfulness and influence with r=.44 (p<0.01) which was also significant. There was also significant correlation between competence and influence with r=.38 (p<0.01). The results concluded that the three dimensions of employee psychological empowerment were significantly related and correlated with each other and were moving in the same direction as one variable or construct. The correlations between psychological empowerment dimensions and overall job satisfaction showed that there were significant positive correlations between overall job satisfaction and meaningfulness (r=.49, p<0.05), competence (r=.48, p<0.01) and influence (r=.51, p<0.01). (Table 4)
5. Hypothesis testing
5.1 Employee psychological empowerment positively influences overall job satisfaction
The influences of the three dimensions of employees’ psychological empowerment on overall job satisfaction were explored and examined by using multiple regression analysis (as shown in Table 5) and after considering that there was no violation of multiple regression underlying assumptions. The coefficient of relationship (R²) of 0.416 showed that 41.6% of the variance in overall job satisfaction was explained by the three sub dimensions of employee psychological empowerment. From the three dimensions of psychological empowerment, all three sub scales of employee psychological empowerment significantly influenced respondents’ state of overall job satisfaction; the factor of meaningfulness (p=0.00), competence (p=0.00) and influence (p=0.00). Conclusively, all three sub dimensions of employee psychological empowerment were the predictors of receptionists’ overall state of job satisfaction. Therefore, Hypothesis 1 (H1) was supported.

International Journal of Business and Management November, 2009
171
5.2 Employees’ psychological empowerment scores differ significantly based on their demographic and work profile
information
An independent t-test was conducted to find any differences between genders on employee psychological empowerment. After assessing the significance value of the variables on both genders, there were no significant differences in the scores of both genders when compared, with the employee psychological empowerment of males (M=5.92, SD=0.58) and females with M=5.90, SD=0.45; with t = 0.186 (equal variances assumed), p=0.85 (two-tailed). One way ANOVA was computed to explore the impact of age (in range), and hotel tenure on levels of employee psychological empowerment. There was no statistical significant difference at the 0.05 level in employee psychological empowerment scores based on the profile information of the respondents. Therefore, hypothesis 2 (H2) was not supported.
5.3 Employees’ overall job satisfaction scores differ significantly based on their demographic and work profile
information
On the other hand, in assessing the differences between demographic and work profiles of respondents with overall job satisfaction, there were also no significant differences with males (M=6.02, SD=0.95) and females with M=5.89, SD=0.81; with t = 0.676 (equal variances assumed), p=0.50 (two-tailed). However, there were significant differences in overall job satisfaction scores based on respondents’ age and hotel tenure. The result revealed that the details of the differences with p<0.05 level in overall job satisfaction scores based on age (in range) were F (4, 86) =1.91, p=0.00 and hotel tenure of the respondents with F (4, 86) =1.68, p=0.00. The results were based on Welch and Brown-Forsythe’s robust tests of equality of mean. From the Games-Howell post hoc test, as respondents became older, they were more satisfied with their job, organization and job positions. The results also indicated that the longer the respondents worked with the hotel; the more they experienced an overall state of job satisfaction as compared to those who had less working experience in the hotel. Therefore, hypothesis 3 (H3) was supported.
6. Discussion
6.1 The relationship between employee psychological empowerment and overall job satisfaction
The results previously mentioned stated that there were positive and significant influences between the three dimensions of employee psychological empowerment and overall job satisfaction. This means that receptionists whose job has a higher level of meaningfulness, developed work skills and confidence and those who were influential in the workplace would be most likely to experience a higher level of job satisfaction. They were more satisfied with their current job position, current employer and the type of job that they were doing if they were given more meaningful jobs, given more room to exercise their abilities and skills and allowed more opportunities to participate actively in the work-group decision making process. This result was also aligned and congruent with the findings made by Spreitzer (1996). She found that the dimension of meaningfulness was the strongest contributor to overall job satisfaction. This finding was also parallel to Fulford and Enz’s (1995) findings that perceived empowerment did have an influence on the job satisfaction level of employees particularly in the hospitality industry. However, Fulford and Enz (1995) stressed that although employee empowerment may contribute to employee’s job satisfaction, it does not profoundly shape work effort and performance. This is not surprising, since attitudes are not perfectly linked to behaviors (Schneider, 1988), and supervisory styles may confuse the degree to which empowerment is actively supported (Fulford & Enz, 1995).
According to the effects of psychological sub dimensions revealed through a study by Fulford and Enz (1995) the dimensions of meaningful and influence were the two strongest influences on job satisfaction. When employees find a fit between their values and the organization's goals and delivering meaningful jobs, they are more likely to be loyal, service oriented, concerned with others, and high performers. Employees perceiving themselves as having influence over others is also a critical factor in shaping job satisfaction as liking the work and being able to influence what happens at work are critical (Fulford & Enz, 1995). It is likely that self-efficacy (mastery), particularly in relatively routine, simple, and repetitive tasks, does not have the motivational potential that perceived meaning as well as influence over the work setting are likely to elicit (Fulford & Enz, 1995). This is consistent with the findings made by Collins (2007) on employees of a limited-service restaurant in the U.S. Most empirical research has also shown a stronger link between meaning and work satisfaction (Hackman & Oldham, 1980; Thomas & Tymon, 1994; Salazar, 2000). An important precondition of work satisfaction is the degree to which an individual finds their work to be personally meaningful (Herzberg, 1966). In contrast, low levels of meaning have been linked to apathy at work and, hence, lower levels of work satisfaction (Thomas & Velthouse, 1990). A study by Hancer and George (2003) also found that all three dimensions of employee psychological empowerment were the significant contributors to employees’ increased job related satisfaction. Perceptions of empowerment can enhance the value of work for individuals, increase job satisfaction and contribute to work productivity and effectiveness (Spreitzer, 1995). Nevertheless, the findings in this study revealed the need to seek the potential of the sub dimension of competence thoroughly in determining the employee outcome variable, such as job satisfaction, especially in the hospitality industry.

Vol. 4, No. 11 International Journal of Business and Management
172
6.2 The differences of overall job satisfaction scores based on demographic and work profile information
The findings in this study showed that there were significant differences in the scores of the overall job satisfaction of the respondents. Based on findings previously stated, the significant differences in the overall job satisfaction scores were found in respondents’ age and hotel tenure. It showed that just as their age increases, so does their job satisfaction level. A study by Chang (2003) justified the findings in this study as he also found that age did have a significant effect on overall job satisfaction. An employee's satisfaction with an organization is also closely related to length of service. Smith (1996) stated that there was a significant differences in overall job satisfaction based on tenure in companies in the hospitality industry. Similarly, as the years and experience of receptionists working in the hotel increased, they were actually having more satisfaction at work. This is also aligned with the study by Vondrasek (2000) who found that the degree of tenure had a significant effect on the level of general satisfaction. Salazar (2000) in his study found that race differences existed when evaluating overall job satisfaction. Several other researchers also found that age and tenure were positively related to job satisfaction and they differ significantly among their respective groups (e.g. Smith, 1996; Denton & Kleiman, 2001).
7. Limitations & recommendations for future research
Several limitations faced throughout the process of this study are worth highlighting as these limitations would be the points to consider in future research of similar interest. The first limitation relates to the selection of hotel category and location in this study. Instead of only looking at the responses of receptionists in 5-star rated hotels in Kuala Lumpur alone, it is also recommended that further investigation be carried out into other significant categories of hotel as well (3 & 4-star rated hotels) in the rest of the country. This would certainly give variation to the findings and the study can be further classified and compared based on the distinctive star rating category and location (by city, state or island). Next, the limitation identified through the study was the limited scope of the study. This study targeted employees at the operational level, but the participation of managerial level employees might give different perspectives to the research area due to the role of managerial level employees as employers and department leaders. Input from managers would certainly provide insights and valuable information as to how certain relationships and influences could be established.
8. Conclusion
The study has certainly achieved its objectives in answering the research questions where hypotheses support or otherwise was elaborated. However, the influence of employees’ psychological empowerment on their level of job satisfaction proved to be valid and significant in this study. It showed that psychological empowerment was perceived as a medium to enhance overall job satisfaction. In conclusion, it is hoped that the study findings can be used as a basis for Malaysian hotel managers in understanding their workforce’s ability, self-efficacy, control and influence over work groups. Specifically, it is hoped that managers will be able to understand the effect of the empowerment concept on their employees. Considering the labour-intensive nature of the hotel industry, coping with turnover trends is relatively significant and a priority for them. From the findings in this study, it can be concluded that the significant effect of employee psychological empowerment and overall job satisfaction were established. Managers certainly need to ensure that employees are satisfied and enjoy what they do at work. More focus should be on developing creativity and rooms for employees to exercise empowerment in order to enhance their job satisfaction level and performance thus providing quality service to customers.
References
Awang, K. W., Ishak, N. K., Radzi, S. M., & Taha, A. Z. (2008). Environmental variables and performance: Evidence from the hotel industry in Malaysia. International Journal of Economics and Management, 2(1), 59-80.
Bowen, D. E., & Lawler III, E. E. (1992). The empowerment of service workers: what, why, how and when. Sloan
Management Review, Spring, 31-39.
Bowen, D. E., & Lawler III, E. E. (1995). Empowering service employees. Sloan Management Review, Summer, 73-84.
Brymer, R. (1991). Empowerment: A guest-driven leadership strategy. Cornell Hotel and Restaurant Administration
Quarterly, 32, 58-68.
Chang, L. (2003). A study of diversified hospitality workers affecting employee job satisfaction and its relationship to employee retention in the lodging industry. Doctoral Dissertation, Oklahoma State University, Oklahoma. Dissertation
Abstract International, 64(09) (UMI No: AAT 3105777).
Chebat, J. C., Babin, B., & Kollias, P. (2002). What makes contact employees perform? Reactions to employee perceptions of managerial practices. Journal of Bank Marketing, 20(7), 325-332.
Collins, M. D. (2007). Understanding the relationships between leader-member exchange (LMX), psychological empowerment, job satisfaction and turnover intent in a limited-service restaurant environment. Doctoral Dissertation, Ohio State University, Ohio. Dissertation Abstract International, 68(04) (UMI No: AAT 3260704).

International Journal of Business and Management November, 2009
173
Conger, J. A., & Kanungo, R. N. (1988). The empowerment process: integrating theory and practice. Academy of
Management Review, 13(July), 471-482.
Coughlan, R. (2005). Employee loyalty as adherence to shared moral values. Journal of Managerial Issues, XVII(1), 43-57.
Cranny, C. J., Smith, P. C., & Stone, M. (1992). Job satisfaction: How People Feel About Their Jobs and How It Affects
Their Performance. New York: Lexington.
Denton, D. W., & Kleiman, L. S. (2001). Job tenure as a moderator of the relationship between autonomy and satisfaction. Applied HRM Research, 6(2), 105-114.
Di Xie, M. S. (2005). Exploring organizational learning culture, job satisfaction, motivation to learn, organizational commitment and internal service quality in a sport organization. Doctoral Dissertation, Ohio State University, Ohio. Dissertation Abstract International, 66(06) (UMI No: AAT 3180630).
Edward, P. K., & Scullion, H. (1982). The Social Organization of Industrial Conflict: Control and Resistance in the
Workplace. Oxford: Basil Blackwell.
Erstad, M. (1997). Empowerment and Organisational Change. International Journal of Contemporary Hospitality
Management, 9(7), 325-333.
Ford, R., & Fottler, M. (1995). Empowerment: a matter of degree. Academy of Management Executive, 9(3), 21-31.
Fulford, M. D., & Enz, C. A. (1995). The impact of empowerment on service employees. Journal of Managerial Issues,
7(2), 161-175.
George, S., & Weimerskirch, A. (1994). Total quality management: Strategies and techniques proven at today’s most
successful companies. New York: Wiley.
Hackman, J. R., & Oldham, G. R. (1980). Work redesign. Reading, MA: Addison-Wesley.
Hancer, M., & George, R. T. (2003). Psychological empowerment of non-supervisory employees working in full-service restaurants. International Journal of Hospitality Management, 22(1), 3-16.
Herzberg, F. (1966). Work and the nature of man. Cleveland: World Publishing.
Heskett, J. L., Jones, T. O., Loveman, G. W., Sasser, W. E., & Schlesinger, L. A. (1994). Putting the Service-Profit Chain to Work. Harvard Business Review, 72(2), 164-174.
Hoffman, K. D., & Ingram, T. N. (1992). Service provider job satisfaction and customer-oriented performance. The
Journal of Services Marketing, 6(2), 68-78.
Kanter, R. M. (1983). The change masters: Innovations for productivity in the American corporation. New York: Simon and Schuster.
Kemp, S. & Dwyer, L. (2001). An examination of organizational culture – The Regent Hotel, Sydney. International
Journal of Hospitality Management, 20, 77-93.
Lam, T., Zhang, H., & Baum, T. (2001). An investigation of employees’ job satisfaction: the case of hotels in Hong Kong. Tourism Management, 22(2), 157-165.
Lee, S. S. (2008). Relationships among leadership empowerment, job satisfaction, and employee loyalty in university dining student workers. Doctoral Dissertation, Iowa State University, Iowa. Dissertation Abstract International, 69(04) (UMI No: AAT 3307092).
Locke, E. A. (1976). The nature and consequences of job satisfaction. In M. D. Dunnetter (Ed.), Handbook of industrial
and organizational psychology (pp. 1297-1349 ). Chicago: Rand-McNally.
Malaysian Association of Hotels. (2008). Annual Secretariat Report: June 2007 – May 2008. Kuala Lumpur, Malaysia: Malaysian Association of Hotels (MAH).
Ministry of Finance. (2008). Economic Report 2008 / 2009. Kuala Lumpur, Malaysia: Percetakan Nasional Malaysia Berhad.
Robbins, S. P., & Coulter, M. (1996). Management. Upper Saddle River, NJ: Prentice Hall.
Rogers, J. D., Clow, K. E., & Kash, T. J. (1994). Increasing job satisfaction of service personnel. Journal of Services
Marketing, 8, 14-26.
Salazar, J. P. (2000). The relationships between hospitality employee empowerment, overall job satisfaction and organizational commitment: A study of race and gender differences. Doctoral Dissertation, Auburn University, Alabama. Dissertation Abstract International, 61(03) (UMI No: AAT 9965765).
Sashkin, M. (1984). Participative Management is an Ethical Imperative. Organizational Dynamics, 12, 5-22.

Vol. 4, No. 11 International Journal of Business and Management
174
Schlessinger, L. A., & Heskett, J. L. (1991). Breaking the cycle of failure in services. Sloan Management Review,17-28.
Schneider, D. J. (1988). Introduction to Social Psychology. San Diego: Harcourt, Brace, Jovanovich.
Smith, D. (1996). Increasing Employee Productivity, Job Satisfaction, and Organizational Commitment. Hospital
Health Services Administration, 41, 160-174.
Sparrowe, R. T. (1994). Empowerment in the hospitality industry: An exploration of antecedents and outcomes. Journal
of Hospitality & Tourism Research, 17(3), 51-73.
Spreitzer, G. M. (1992). When organizations dare: The dynamics of psychological empowerment in the workplace.Doctoral dissertation, University of Michigan, Ann Arbor, Michigan. Dissertation Abstract International, 53(11) (UMI No: AAT 9308456).
Spreitzer, G. M. (1995). Psychological empowerment in the workplace: Dimensions, measurement and validation. Academy of Management Journal, 38(5), 1442-1465.
Spreitzer, G. M. (1996). Social structural characteristics of psychological empowerment. Academy of Management
Journal, 39, 483–504.
Spreitzer, G. M. (1997). Toward a common ground in defining empowerment. Research in Organizational Change and
Development, 10, 31-62.
Susskind, A. M., Borchgrevink, C. P., Kacmar, K. M., & Brymer, R. A. (2000). Customer service employees’ behavior intentions and attitudes: An examination of construct validity and a path model. International Journal of Hospitality
Management, 19, 53-77.
Thomas, K. & Tymon, W. (1994). Does empowerment always work: Understanding the role of intrinsic motivation and personal interpretation. Journal of Management Systems, 6(3).
Thomas, K. W., & Velthouse, B. A. (1990). Cognitive elements of empowerment: an ‘interpretive’ model of intrinsic task motivation. Academy of Management Review, 15(4), 666-681.
Tourism Malaysia. (2007). Accommodation guide. Kuala Lumpur, Malaysia: Tourism Malaysia.
Tourism Malaysia. (2008). Tourism Statistics in Brief – 2007. Kuala Lumpur, Malaysia: Tourism Malaysia.
Vondrasek, D. A. (2000). A study of relationships between job satisfaction and organizational commitment among restaurant employees. Masters Dissertation. University of Nevada, Las Vegas. Dissertation Abstract International,
39(02) (UMI No: AAT 1401772).
Zimmerman, M. A. (1990). Taking aim on empowerment research: on the distinction between individual and psychological conceptions. American Journal of Community Psychology, 18(1), 169-177.
Zimmerman, M. A. (1995). Psychological empowerment: Issues and illustrations. American Journal of Community
Psychology, 18, 169-177.
Table 1. Measures of the study variables
Study Variables No.
of Items
Sources of Scale Type of Scale Quest
ions
Number
Employee Psychological Empowerment
Meaningfulness
Competence
Influence
3
3
6
Fulford & Enz (1995)
A seven-point Likert-scale from (1) “ Strongly Disagree” to (7) “Strongly Agree”
1-12
Overall Job Satisfaction
3 Di Xie (2005) &
Salazar (2000)
A seven-point Likert-scale from (1) “ Strongly Disagree” to (7) “Strongly Agree”
13-15
The instrumentation used in the study for each of the variables adopted from Fulford & Enz (1995), Di Xie (2005) & Salazar (2000).

International Journal of Business and Management November, 2009
175
Table 2. Reliability coefficient values of study variables
Variables Number of Scale
Items
Cronbach’s Alpha
Coefficient ( )
Employee Psychological Empowerment
Meaningfulness
Competence
Influence
3
3
6
.86
.87
.68
.84
Overall Job Satisfaction 3 .91
The above table showed the reliability of the scale for each of the dimensions and variables involved.
Table 3. Respondents’ demographic and work profiles
Profiles Categories Frequencies Percentage (%)
Gender Male
Female
42
49
46.2
53.8
Age Between 18 – 23 years old
24 – 29 years old
30 – 34 years old
35 – 40 years old
More than 40 years old
30
31
17
9
4
33.0
34.1
18.7
9.9
4.4
Hotel Tenure Less than 6 months
6 months – 1 year
2 – 3 years
4 – 5 years
More than 5 years
10
31
28
13
9
11.0
34.1
30.8
14.3
9.9
The above table showed respondents’ demographic and work profile distribution and percentage.
Table 4. Pearson correlations matrix among psychological empowerment and overall job satisfaction
Scales 1 2 3 4 Mean SD
1. Meaningfulness - 5.89 0.80
2. Competence .32** - 6.02 0.53
3. Influence .44** .38** - 5.85 0.64
4. Overall Job Satisfaction .49** .48** .51** - 5.95 0.88
The table outlined the correlation strength among the variables, its average mean and standard deviation. Note: N=91
**p<0.01
Table 5. Multiple regressions of employee psychological empowerment dimensions and overall job satisfaction
Independent variable
in the equation
B t p R²
(F)
constant -0.903 -0.993 0.323
0.416
(20.70)*
Meaningfulness 0.294 0.270 2.922 0.00*
Competence 0.465 0.284 3.159 0.00*
Influence 0.397 0.290 3.064 0.00*
The table showed the beta, significance and regression values between psychological empowerment and overall job satisfaction.
*p<0.05
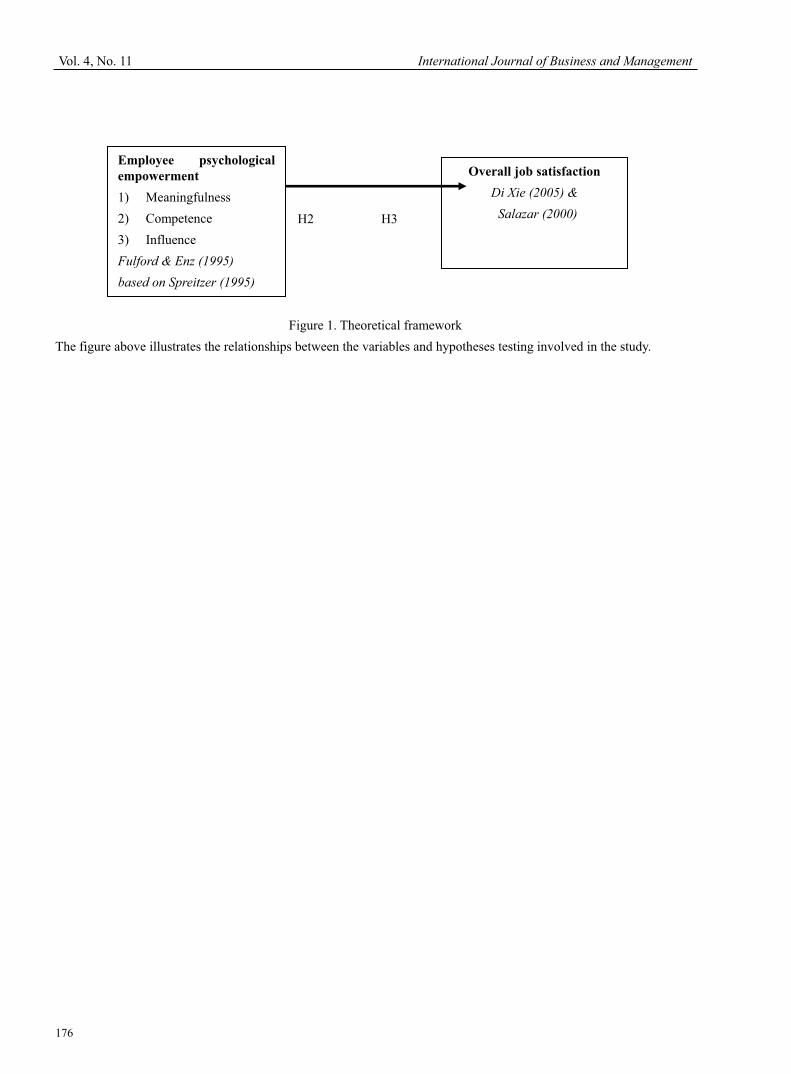
Vol. 4, No. 11 International Journal of Business and Management
176
H2 H3
Figure 1. Theoretical framework
The figure above illustrates the relationships between the variables and hypotheses testing involved in the study.
Overall job satisfaction
Di Xie (2005) &
Salazar (2000) H1 (+)
Employee psychological
empowerment
1) Meaningfulness
2) Competence
3) Influence
Fulford & Enz (1995)
based on Spreitzer (1995)

International Journal of Business and Management November, 2009
177
Total Reward Strategy: A Human Resources Management Strategy Going with the Trend of the Times
Zhou Jiang (Corresponding author)
Department of Management Administration, Yeungnam University
Office of International Programs, 214-1 Dae-dong, Gyeongsan, Gyeongbuk 712-749, South Korea
Tel: 82-10-8442-0420 E-mail: [email protected]
Qian Xiao
Department of Management Administration, Yeungnam University
Office of International Programs, 214-1 Dae-dong, Gyeongsan, Gyeongbuk 712-749, South Korea
Tel: 82-10-5895-0219 E-mail: [email protected]
Henan Qi
Department of Management Administration, Yeungnam University
Office of International Programs, 214-1 Dae-dong, Gyeongsan, Gyeongbuk 712-749, South Korea
Tel: 82-10-3143-3538 E-mail: [email protected]
Lei Xiao
College of Science, Northwest A&F University
Shaanxi 712100, China
E-mail: [email protected]
Abstract
As a modern reward management method, total reward strategy has been used more and more by managers and scholars. Like all the other mature human resources management approaches and strategies, total reward strategy need to be analyzed and practiced throughout the time to make it work effectively and perfectly. In this article, the dimensionalities of total reward strategy which varies at all times has been summarized through the trend of times and redefined. Managers would gain remarkable profits for the organization they governed if they use the integrated total reward strategy properly. The strategy will not only improve the performance of staffs, act important role of decision making process of an organization, but also solve existing and potential compensation problems as well.
Keywords: Total reward strategy, Human resource management, Modern management, Motivation
1. Introduction
Among all kinds of budgets in an organization, remuneration cost remains a part of great importance. With the speedy update of the modern world, however, the traditional remuneration management has been facing great challenges both in public and private sectors under the current economic and business circumstance, and then come a lot of problems which can affect the performance of an organization and even cause existential threats. Survey has demonstrated that the cash reward which was paid most attention to is not as important as in the past. Based on a 2002 survey of 1,500 employees (of all ages) conducted by Nelson Motivation, Inc., San Diego, California, the ranks of employee motivators in descending order are as follows: a learning activity, flexible working hours, verbal praise, increased authority, autonomy, time with their manager, time off from work, public praise, choice of assignment and written praise. What is noteworthy is that the cash reward ranks 15th in importance (Reynolds, 2005). In recent years, some other reward-related glossaries also spring up as the progress of new-fashioned market economics, for example, salary management, salary administration, payment (or pay) management, compensation management, reward management etc. However, the common ground is that all of them focus on how to redound employees, simply in slightly different approaches.
Modern Rewards Management appears and develops in the context of managing transformation; it not simply acknowledges and redounds upon what the members have contributed to the organization, in fact, it’s a specific action

Vol. 4, No. 11 International Journal of Business and Management
178
scheme of company strategic objective and values outlook conversion. To some extent, Modern Rewards Management breaks through the categories of “Money” and substance, which indicates that indirect income and some no-monetary compensation have been playing parts of increasing importance in Reward Structure Design. Generally, Modern Rewards Management is carried out through Total Reward Management which matches with the work ethic and pursuit of the present employees, and it is an important reflection of emphasizing the relationship between enjoyment of reward elements and performance.
2. Reward Systems
2.1 Interpretation of Reward
Reward is the compensation which an employee receives from an organization (mainly refer to enterprises) for his or her service. It not simply contains direct currencies and other forms which can convert to currencies, but also a comfortable office, favorable interpersonal relationship inside the organization, having access to decision-making involvement, the challenge and sense of achievement, preferable growth opportunities and so forth these kinds of forms which is difficult to measure in various currencies.
From marketing communication, reward is the market form of human resources value and form the distribution point which is the return of respective contribution of human capital. Reward has compensatory function; it is an exchange of the service one employee has offered or the retribution for the done work. In addition, motivation is another function of reward, for working quality, the degree of focusing on customers and enthusiasm of learning new skills will be influenced by the decision-making of reward and the ways in which employees get their rewards. Regulatory function of reward is embodied in several aspects which include reasonably allocating labor force and modulating the configuration of quality of labor force. And it is obvious that reasonable reward system can help bring effectual income far beyond the cost.
2.2 Development of Reward System
The concepts concerned with reward have experienced five phases through summing up the relevant records (Refer to table.1). Here “Total Compensation” and “Total Reward” are listed separately, however, they are often counted as the different expressive forms of one management approach, even though some admit the slight difference between them.
It’s obvious that nowadays the reward system will not only focus on the employee’s payment but take more attractive non-financial benefits into account in the motivation management. And out of question, it is the certain uptrend that modern total reward strategy will be popular in varieties of companies and get its rigid status in this highly developing world.
2.3 Modern Reward Management-Total Reward Strategy
Fernandes (1998) describes total reward as “The sum of the values of each element of an employee’s reward package.”Total Reward begins with total remuneration, the subset of Total Rewards, which compromises all the elements of rewards that can be valued in dollar terms. And it is a plan for allocating rewards resources in a manner that directs the business to the successful execution of its objectives (Manas & Graham, 2002).Total reward is the term that has been adopted to describe a reward strategy that brings additional components such as learning and development, together with aspects of the working environment, into the benefits package. (Armstrong & Brown, 2001) Worldatwork, the Total Rewards Association of U.S., defines total rewards as all of the tools available to the employer that may be used to attract, motivate and retain employees. It also indicates that total rewards include everything the employee perceives to be of value resulting from the employment relationship (Worldatwork, 2006).
It goes beyond standard remuneration by embracing the company culture, and is aimed at giving all employees a voice in the operation, with the employer in return receiving an engaged employee performance. In other words, total reward provides a broader view to treat everything what an enterprise can offer to its staff and everything what the employees can promise to their companies, which embodies the fundamental change of management thinking model of company high-level superintendents.
In recent years, total reward has been becoming a more and more popular facet which has caught many scholars’ attention. As a part of human resources management practice, total reward has also been introduced into varieties of enterprises to improve their competitiveness so that they will have the abilities to survive in the global marketing warfare.
Now, total reward is an advanced model of human resources management which microscopically accelerates enterprise development and macroscopically boosts the advancement of social economic environment. Compared with traditional rewards system, total reward much more deeply reflects in what ways enterprises can attract, motivate and retain talents, in what ways employee performances which accord with corporate goal will appear and in what ways the excellent employees should be motivated and praised.

International Journal of Business and Management November, 2009
179
3. Theory Basis of Total Reward Strategy
Maslow’s need hierarchy theory (1943), supposed to be a motivation basis has been used to interpret the entire spectrum of human behavior. Maslow proposed that motivation is a function of five basic needs-physiological, safety, love, esteem and self-actualization-which are arranged in the predictable stair-step fashion (refer to Figure 1), and he explained that a person’s physiological needs must be firstly met followed by safety needs, and so on up the need hierarchy (Kreitner & Kinicki, 2007). When designing total reward strategy, employees’ multifarious needs must be well considered, Maslow’s points will help the organization reach its expectation.
Alderfer’s ERG theory assumes that people have three types of needs: existence, relatedness and growth, and it is partly based on some of Maslow’s thinking. These three categories are also arranged orderly, being from existence needs to relatedness needs and then to growth needs from lowest-level to highest-level. Unlike Maslow’ ideas, ERG theory demonstrates that a higher-level need can be a motivator even if a lower-level need is not fully satisfied, and needs at more than one level can be motivators at any time (George & Jones, 2002). Total reward strategy also follows Alderfer’s thought, and the different components might be used in the mean time, which depends on the organizations’ goals and strategies.
The two-factor theory put forward by (1966) divides job-related factors into hygiene factors and motivators. Hygiene factors are those led by work but not involve work itself while motivators are those carry out relevant work-related behaviors, and motivation will not be significant unless both of the two kinds of factors are present. For instance, sometimes several elements of total reward strategy must be synchronously provided by organizations to meet the employees’ needs so as to produce motivation bringing back more behalf.
Focused on the ways in which workers decide which specific behaviors to perform and how much effort to exert, Expectancy Theory predicts one’s level of motivation depends on the attractiveness of the rewards sought and the probability of obtaining those rewards (Vroom, 1994; Bohlander & Snell, 2004). If employees perceive that they may get valued rewards from the organization, they tend to put greater effort into work. Expectancy Theory includes three dimensions, say, expectancy, instrumentality and valence, the level of all of which must be high if desired behaviors are looked forward to in employees’ work. The position of Expectancy Theory in total reward strategy can be inferred from Figure 2 (Bohlander & Snell, 2004) showing the relationship between pay-for-performance and the expectancy theory of motivation.
It’s certain that the staff want their needs satisfied, however, they also would like to be treated fairly by the organization.Adams’ Equity Theory concentrates on the concept of fairness in the workplace. Employees are probable to compare the inputs they devote to the work with the outputs they receive from the organization. The equity theory of motivation assumes a balance of employee inputs and outputs as compared to others are illustrated in the form of picture in Figure 3 (Drafke & Kossen, 2002). Once they feel they get less outputs than inputs, which means there isn’t a balance, employees are tend to be unsatisfied and not motivated. Thus, when total reward strategy is brought to bear it must assure the employees realize the justice of the corporation, for example the procedural justice of performance management.
4. Dimensionalities of Total Reward Strategy
As a burgeoning reward-package pattern, researchers have given various subsets of total reward strategy, although in general this modern management methodology can be divided into material and immaterial components.
Francis and Fernandes (1998) outlined the principal elements of total reward which include basic salary, variable pay, pension benefits, death-in-service benefits, long-term disability benefits, private medical insurance, vacation entitlement, company car schemes, share schemes, mortgage subsidies etc. Patricia and Jay (2000a) made an analysis of total reward components which refer to individual growth, compelling future, total pay and positive workplaces. They hold that people work for more than just pay, they are also looking for an organization which has a powerful vision of where it is going and how it plans to get there, and they want to get individual growth in acquiring skills that prepare them to add value to the business. Thus, combinations of base pay, variable pay, recognition and celebration and benefits are essential to providing a complete total reward package (Patricia & Jay, 2000b) Lyons and Ben-Ora (2002) indicate that total reward strategy is the best foundation of pay for performance. They define total reward strategy to include following: base salary, variable pay (containing short-term incentives and long-term incentives), other compensation, perquisites, benefits and performance management. Moreover, a total strategy may also include training, career development, coaching and other employee-related policies.
Tropman (2001) suggested that the concept of total compensation which he considered as “new new pay” be expressed in terms of an equation with ten variables. TC = (BP + AP + IP) + (WP + PP) + (OA + OG) + (PI + QL) + X, where TC = total compensation; BP = base pay, or salary; AP = augmented pay, that is, any one-time payment, even if received at regular intervals; IP = indirect pay; WP = works-pay, that is, employer-subsidized equipment, uniforms, and so on; PP = perks-pay, that is, special benefits—anything from accessories to employee discounts on company products; OA =

Vol. 4, No. 11 International Journal of Business and Management
180
opportunity for advancement and increased responsibility; OG = opportunity for growth, both through on-the-job training and through off-site training and degree attainment; PI = psychic income, the emotional enhancements provided by the job itself and the setting; QL = quality of life, that is, opportunity to express other important aspects of life; X = any unique element that an employee wants that the workplace can facilitate.
In addition, in 2001, the Total Rewards Association introduced a relatively new framework of total rewards in order to explain the concept of total rewards more clearly. There are three elements in this framework: compensation, benefits and work experience (including recognition, work/life balance, company culture, employee development and environment are involved in this element.) However, Worldatwork afterwards thought that “the work experience” aspect of the model put forward in 2001 included aspects of employment that might be some components of the overall working experience. In 2005, the Worldatwork Public Policy Staff excogitated another more specific outline of total reward which contained four elements: pay (base salary, variable pay, recognition and stock are included), benefits (health care, retirement, savings and time off are included), learning &development (career development, performance management, succession planning and training are included), work environment (organization climate, leadership, performance support and work/life balance are included).
As what has been mentioned, nowadays people do not work simply for pay, they also want get chances for individual development through which they’re able to obtain new knowledge and apply their own talent and valuable skills. As well, the compelling future and positive workplace may be other facets employees are pursuing. Based on this temporized trend, Patricia and Jay (2003) constructed a four-component module of Total Reward which is shown in table 2.
Another sample total reward strategy framework, which was built by JLARC/Commonwealth of Virginia in 2008, contains three main segments that are compensation, benefits (health) and work/life environment. Specifically, compensation provides competitive base salary levels necessary to attract and retain talent and compensates for day-to-day responsibilities performed at fully acceptable level and above; Benefits provides flexible and market competitive health benefits to support employment brand and support attraction and retention; And work/life environment provides elastic work practices, telecommuting and support to promote the appropriate balance of productivity and employee engagement. Furthermore, Commonwealth also suggested options to consider, for example, base pay, total cash compensation, benefits, retirement and work/life etc.
5. Management Role of Total Reward Strategy
The performances of the staff in an organization adopting total reward strategy become of more statistical generalization, which attracts an increasing number of companies. Introducing total reward strategy probably improves not only employees’ work efficiencies, job satisfaction and job performances but their psychological contract and organizational citizenship behaviors. Because of this effective management method, organizations have more channels to acquaint with employees’ work life and other needs; in other way round, the personnel can keep positive attitude towards the organizations, might being less stressful or fairly treated or some else.
Ittner and Larcker (1995) found that among less extensive users of formal quality improvement practices, greater reliance on nontraditional information and reward systems is associated with higher performance. Organizations that focus on developing an integrated rewards program that helps to improve accountability, flexibility, attraction, and retention excellence; is well communicated; and provides technology tools can add significant shareholder value. What’s more, the development of a total rewards program in support of the global rewards philosophy warrants a strategic approach (White, 2005). Total Reward is also an important aspect to be considered when some decision processes happen in an organization.
As Total Reward is put forward on the basis of total compensation which has been using in a large number of companies these years, therefore the researches on total compensation and some other reward theories also provide the development of total reward with potent backgrounds. Total compensation could have an effect on attendance if, as in efficiency wage theories, directors who are paid more attend more meetings because they care more about keeping their jobs (Adams & Ferreira, 2008). The relationship between total compensation (not including meeting fees) and attendance problems is negative, but not always statistically significant (Jensen & Murphy, 1990; Adams & Ferreira, 2008). Elements of recognition and reward can be as important as structure in achieving the desired synergism that accompanies cross-functional cooperation (Appeldorn, 2008).
6. Some Conclusions
Total reward strategy is a holistic approach aligning with business strategy and people strategy; it encompasses everything employees value in their employment relationship like compensation, benefits, development and the work environment (Kaplan, 2007). This newly coming management approach acts according to the circumstance, helps with costing savings, brings about maximum return on the rewards strategy adoption, and builds up employment brand, all of which are likely to contribute to both short-term and long-term goals of an organization. As a reward strategy of

International Journal of Business and Management November, 2009
181
effectiveness, it’s able to gain enough good information of employees and conduct objective analysis, so that the organization can make wise decisions and assess their influences internal and external. In spite of diverse definitions, structures and functions mentioned by academicians and administrators, there still is a trend that Total reward strategy will move along because of the standards which have not been unified and have been improving and perfecting.
References
Adams, R. B. & Ferreira, D. (2008). Do directors perform for pay? Journal of Accounting and Economics, Vol.46 , pp. 154–171.
Appeldorn, R. H. (2008). Technology Transfer in a Diversified, Global Manufacturing Company. Journal of Technology
Transfer, Vol. 22 (3): 57-64.
Armstrong, M. & Brown, D. (2001). New Dimensions in Pay Management, Chartered Institute of Personnel and Development.
Bohlander, G. & Snell, S. (2004). Managing human resources, 13th Edition.
Drafke, M. W. & Kossen, S. (2002). The human side of organizations, 8th Edition, pp. 287.
Fernandes, F. N. (1998). Total Reward-An Actuarial Perspective. Actuarial Research Paper, No.116.
George, J. M. & Jones, G. R. (2002). Organizational Behavior, 3rd Edition, pp. 191.
Herzberg, F. (1966). Work and the nature of man. Cleveland: World.
Ittner, C. D. & Larcker, D. F. (1995). Total Quality Management and the Choice of Information and Reward Systems. Journal of Accounting Research, Vol. 33, Studies on Managerial Accounting, pp. 1-34.
Jensen, M.C. & Murphy, K.J., (1990). Performance pay and top-management incentives. Journal of Political Economy,Vol.98, pp. 225–264.
JLARC/Commonwealth of Virginia. (2008). Total Rewards Assessment Observations and Suggested Alternetives.
Kaplan, S. L. (2007). Business Strategy, People Strategy and Total Rewards. Benefits & Compensation Digest, Vol. 44, No. 9, pp. 12-19.
Kreitner, R. & Kinicki, A. (2007). Organizational Behavior, 17th Edition, pp. 237.
Lyons, F. H. & Ben-Ora, D. (2002) Total Rewards Strategy: The Best Foundation of Pay for Performance. Compensation & Benefits Review, Vol. 34, No. 2, pp. 34-40.
Manas, T. M., & Graham, M. D. (2002). Creating a total rewards strategy: a toolkit for designing business-based plans.Publisher: AMACOM Div American Mgmt Assn.
Maslow, A. H. (1943). A theory of human motivation. Psychological Review, pp. 310-396.
Patricia, K. Z. & Jay, R. S. (2003). Bring Practical Total Rewards to Your Organization. PIHRAScope, Vol. XLXVII, No. 11, pp. 8-9, 20-21.
Patricia, K. Z., & Jay R. S. (2000b). Total Rewards for New and Old Economy Companies. Compensation & Benefits
Review, Vol. 32, No. 6, pp. 20-23.
Patricia, K. Z., & Jay, R. S. (2000a). Pay People Right! Breakthrough Reward Strategies to Create Great Companies,San Francisco: Jossey-Bass Publishers.
Reynolds, L. A. (2005). Communicating Total Rewards to the Generations. Benefits Quarterly, Second Quarter.
Tropman, J. E. (2001) The compensation solution: how to develop an employee-driven rewards system. University of Michigan Business School and management series. Publisher: John Wiley and Sons.
White, R. (2005). A Strategic Approach to Building a Consistent Global Rewards Program. Compensation & Benefits
Review, Vol. 37, No. 4, pp. 23-40.
Vroom, V. H. (1994). Work and motivation (San Francisco: Jossey-Bass).

Vol. 4, No. 11 International Journal of Business and Management
182
Table 1. The five phases of reward
The Modalities of Reward Specific Descriptions
Wage A wage is usually a financial compensation, received by a worker in exchange for their labor.
Salary A salary is a form of periodic payment from an employer to an employee, which may be specified in an employment contract. It is contrasted with piece wages, where each job, hour or other unit
is paid separately, rather than on a periodic basis.
Compensation Compensation is something similar with pay or salary, typically a monetary payment for services rendered, as in an employment.
Some benefits may be concluded.
Total Compensation Total compensation includes pay, benefits, flexible schedules, education assistance, training courses, and workplace
opportunities to help you get the most out of your career and personal life.
Total Reward Total reward covers all the elements that employees value in working for their employer. It emphasizes the integrity of
remuneration and is put forward in contrast to total compensation. Although at most times it is thought as the same as total
compensation, total reward remains the most new word in the category of remuneration or reward.
Table 2. A Four-component Module (Patricia & Jay, 2003)
TOTAL REWARD COMPONENTS
Individual Growth Compelling Future
Total Pay Positive Workplace

International Journal of Business and Management November, 2009
183
Figure 1. Maslow’s Need Hierarchy
Figure 2. Pay-for-Performance and Expectancy Theory
Figure 3. The equity theory of motivation assumes a balance of employee inputs
and outputs as compared to others
Organization
Employee
Inputs:
Skill
Effort
Performance
Education
Others
Outputs:
Pay and Benefits
Recognition
Job Satisfaction
Opportunities
Others

Vol. 4, No. 11 International Journal of Business and Management
184
Women Entrepreneurial Innovative Behaviour: The Role of
Psychological Capital
Sunday Samson BABALOLA
Department of Psychology, Faculty of the Social Sciences, University of Ibadan
Ibadan, Nigeria
E-mail: [email protected]; [email protected]
Abstract
This study investigated the influence of psychological capital on women entrepreneurs’ innovative behaviour with 405 female entrepreneurs from Ibadan, Nigeria. The result indicates that women with high self-efficacy and internal locus of control scored higher on entrepreneurial innovative behaviour than women with low self-efficacy and external locus of control. There was also a significant relationship between highly educated women and lowly educated women. Women are encouraged to belief in themselves while their acquisition of higher education will provide impetus for growth and achievement in entrepreneurial innovative activities. Further studies in relation to task specifics are recommended.
Keywords: Innovative behaviour, self-efficacy, Women entrepreneurs, Psychological capital
1. Introduction
The tremendous significance growth of small firms towards the end of 20th century has robed on women‘s employment status (Loveman & Sengenberger, 1991; Acs & Audretsch, 1999; Quince & Whittaker, 2003). Initially, women’s work has been centered in the home, whereas, these days women are now involved in income generating ventures that contribute economically to the family and community growth. Although, entrepreneurship is perceived as a “male” domain because its task are often associated with masculine behaviour (Dickerson & Taylor, 2000; Verheul, Uhlaner & Thurik, 2005). Females are however, now involved in entrepreneurial activities possibly not only as a means for economic survival but also as a means of positive social repercussions for themselves and their social environment (UNIDO, 2001). Thus, according to Lee and Venkataraman (2006), the involvement of females entrepreneurship may have arose from the disequilibrium between their aspirations and the perceived valuation of the labour market offers.
Despite many shortcomings and constraints, contemporary women are setting up their own enterprises, even in countries where economic decisions would normally be taken by the male head of the households. According to World Bank (1995) report, Nigeria is a good example of this phenomenon. This is because according to Hoffman (1974), women employment has some effect upon her domestic roles and her personality factors. Although, many of the problems reported for American women are common to those faced by Nigerian business women (Parikh, 1987). Nigerian female entrepreneurs, however face problems attributable to socio-cultural factors (Ehigie & Idemudia, 2000; Ehigie & Umoren, 2003; Kitching & Woldie, 2004; World Bank, 1995). This is because some cultures and social traditions (like Yoruba, Ibo, Hausa, Bini) play a significant role in determining who becomes an entrepreneur. For instance, women are not expected to be involved in occupations that will take them outside their matrimonial home; rather they are expected to manage the family and “be submissive to their husbands” (Ehigie & Idemudia, 2000). Nevertheless, women are increasingly expected to work due to completion of educational careers and decline of domestic work as an occupation (Ehigie, 2000). In addition, small-scale businesses are perceived as ventures that require less demand (Babalola, 1998). Possibly, this is why Berger and Byvinie (1989) found that female entrepreneurs are higher in informal sector than male entrepreneurs in Nigeria. Although, Kitching and Woldie (2004) opined that female entrepreneurs in Nigeria are hindered by a variety of barriers despite having made considerable advances. However, not all women that are involved in entrepreneurial venture turn out to be successful as possibility to make poor decisions regarding the factors relating to little or no innovative behaviour abound.
Innovation is the generation of ideas, its acceptance and the implementation of such ideas, which are either novel, or modification of existing processes, products or services (Babalola, 2006). Studies showed that it is one of the most critical capabilities that successful entrepreneurs should possess because it relates to the production or adoption of useful ideas and idea implementation (Kanter, 1988; Van de Ven, 1986) including re-structuring of existing or old products or ideas. Significant innovations allow companies to establish dominant competitive positions and afford newcomer companies an opportunity to gain an edge in the market (Erdil, Erdil & Keskin, 2004). Researchers were of the view that innovative behaviour is related to the ability to generate ideas and the willingness and skill to work with these ideas (Scott and Bruce,

International Journal of Business and Management November, 2009
185
1994; West and Farr, 1989). To Scott and Bruce (1994), individual innovation begins with problem recognition and the generation of ideas or solutions, either novel or adopted, as such, making entrepreneurial innovation results in creative expression of individuals. Similarly, West and Farr (1989) defined innovative behaviour as ‘all individual actions directed at the generation, introduction and application of beneficial novelty at any organizational level’.
Some studies on innovation collapsed the suggestion and implementation of ideas into single-measure (Scott & Bruce, 1994) as opposed to those that separate them into two-measures (de Jong & den Hartog, 2003). The use of two-measures is because the factors that influence successful implementation tend to differ from those that influence the initiation of ideas (de Jong & den Hartog, 2003). As the foundation of innovation is ideas, the study of innovative behaviour among women entrepreneurs should be of importance as ‘there has been scanty attention on innovation at the individual and group levels’ (West & Farr, 1989). In addition, since there is little or no systematic empirical research on the level of innovativeness among women entrepreneurs’, relying on generalized conclusion may lead to systemic error regarding the specific nature of women entrepreneurs.
2. Literature Review
In his theory of expectancy, Vroom (1964) proposed that a person’s behaviour is motivated by the expectation that her behaviour will lead to certain outcomes, together with the values she places on those outcomes. He situated his theory on the notion that behaviour is a function of interaction of personality and the environment. Vroom’s theory built on the concepts of valence, instrumentality and expectancy. Applying this to women entrepreneurs, it is expected that the level at which women will engage in entrepreneurial innovative behaviour is dependent on how well they desire growth (valence), their perceived probability that their efforts will lead to achievement of their goal (their enterprise growth) and that their innovativeness will have a positive effect on their enterprise. Nevertheless, a study by Cliff (1998) showed that women value personal considerations as more important than economic considerations for business expansion decisions. It can therefore be argued that the different approaches to venture creation and involvement among women entrepreneurs may lead to their enterprise expectancies (Brush, 1992; Cliff, 1998; Orser & Hogarth-Scott, 2003).
To Weiner (1974) ability, effort, task difficulty, and luck are the most important factors affecting attributions for achievement. Attribution is classified along three causal dimensions of locus of control, stability and controllability. Locus of control is concerned with confidence in being able to control outcomes, which can be either internal or external. It is a personality predisposition, which describes an individual’s perception of their ability to change a situation. McNairn and Mitchell (1992) refer it as a set of beliefs about behaviour. A belief in external control means a person believes an event is largely the product of forces beyond her control. A belief in internal control means a person believes an event is dependent upon her behaviour (Craig, Franklin & Andrews, 1984). An individual with strong internally locus of control may tend to believe that she can influence and alter situation through the exercise of her skills and knowledge. Strong internal control tends to bring in self-confident. Hence, women entrepreneur with strong internal control is likely to seek opportunities to improve her enterprise by trying new techniques and technologies that will enhance its growth. The opposite is likely for the strong externally control individuals. Research has however demonstrated strong linkages between locus of control and behaviour in areas as diverse as physical and mental health, intellectual achievement, and entrepreneurship (Lefcourt 1981; Rauch & Frese 2000; Sia, Hungerford & Tomera, 1985; Van Kooten, Schoney & Hayward, 1986). According to Rauch and Frese (2000), business owners have a slightly higher internal locus of control than other populations.
Other personal variable that is being assumed to influence women entrepreneurial innovative behaviour is self-efficacy. Self-efficacy has to do with how competent one feels in what one is doing. It is a person’s belief on one’s ability to successfully reach an expected goal as a result of one’s actions (Bandura, 1997). It is also a motivational construct that has been shown to influence an individual’s choice of activities, goal levels, persistence, and performance in a range of contexts (Zhao, Scott & Hills, 2005). Thus, self-efficacy is assumed to have been accumulated through the development of complex cognitive, social, linguistic and/or physical skills that are obtained through experience (Bandura, 1982; Gist, 1987). Studies showed that high self-efficacy is essential to most human performance (Bandura, 1997; Bandura, Pastorelli, Barbaranelli & Caprara, 1999; Sequeira, Mueller & Mcgee, 2007). Thus, without a strong sense of self-efficacy, an individual has little incentive to act or to persevere in the face of difficulties (Bandura, 2002).
As Covin and Slevin (1991) and DTI (2001), studies identified self-efficacy and innovativeness as part of behaviour that are important in both policy and organizational contexts. So also, Cooper and Gascon (1992) found that individual variables (personality traits and demographic characteristics) were relatively poor predictors of survival and success let alone of specific organizational behaviour such as innovativeness. In contrast, Mumford and Gustafson’s (1988) study suggested that education is important to innovation, while Schiller and Crewson, (1997) stated that education and experience were positively correlated with entrepreneurial performance. The present study is therefore designed to clarify the factors that influence women entrepreneurial innovative behaviour.
Women’s socialization experiences have been used by social learning theorist (Hackett & Betz, 1981) to explain women’s lack of strong expectations of personal efficacy in relationship to many career related behaviours, thereby limiting the full

Vol. 4, No. 11 International Journal of Business and Management
186
attainment of their potential. To Bussey and Bandura (1999), a variety of factors may influence gender development (educational practices, occupational systems) while confirming that the differences in women and men are due to socialization practices. Thus, the reliance on the notion that enterprise creation is a male domain may make gender role pressures to influence perceived efficacy. For instance, Kalleberg and Leicht (1991) hypothesized that women were thought to engage in innovative behaviour less frequently whereas their study revealed that women were as likely to report business innovations as men were. It is possible therefore that with high self-efficacy women entrepreneurs are likely to excel and engage in innovative behaviour. Just as Wood and Bandura (1989) noted, high self-efficacy expectations regarding performance in a specific behavioural setting lead individuals to approach that setting, whereas low self-efficacy expectations lead individuals to avoid such setting. Bandura (1995) and Eden (1992) pointed out that individuals with low self-efficacy think and behave differently than people with high self-efficacy. All these attest the empirical findings (De Noble, Jung & Ehrlich, 1999; Sequeira, et al., 2007; Zhao, Scott & Hills, 2005) which concluded that individuals with high self-efficacy are more likely to engage in observable behaviour such as establishing a strong motivational link between self-confidence in performing entrepreneurial tasks and explicit behaviour regarding an enterprise venture. In this study, therefore the following hypotheses will be examined:
1. Women entrepreneurs with internal locus of control will significantly scored higher on innovative behaviour than women entrepreneurs with external locus of control. 2. Women entrepreneurs with high self-efficacy will significantly scored higher on innovative behaviour than women entrepreneurs with low self-efficacy. 3. Women entrepreneurs with high self-efficacy and internal locus of control will significantly scored higher on innovative behaviour than others in combined categories of locus of control and self-efficacy. 4. Highly educated women entrepreneurs will significantly scored higher on innovative behaviour than lowly educated women entrepreneurs. 3. Methods
3.1 Research design
The independent variables in this study are age, educational status, self-efficacy and locus of control while the dependent variable is entrepreneurial innovative behaviour. All the variables were measured using a questionnaire. The statistical tools used for analysis were t-test for independent measures and 2 by 2 ANOVA.
3.2 Participants
Four hundred and five (405) women entrepreneurs with age range 20-60 years and mean age of 38.39 years participated in the study. The women entrepreneurs were systematically selected from the population of women business owners in service cum product sector in Ibadan using the Business Premises Registration Record, which was obtained from Oyo State Ministry of Commerce and Industry, Nigeria. Ibadan is the capital city of Oyo state and has a population of 3 million. It is the largest indigenous city in Sub-Sahara Africa dominated by Yoruba speaking people, and is not different from what is obtainable in other Africa cities. (Mabogunje, 1967; NPC unpublished manuscript, 2004).
This category comprises of women designers, interior decorators, and producer and decorator of bridal materials, school proprietors and fashion designers. About sixty three percent of the participants (254 {62.72%}) were highly educated (above secondary education- diploma, degree and postgraduate certificates) while lowly educated (primary and secondary certificates) comprised 151 (37.28%).
3.3 Instruments
Survey questionnaire was in the data collection for this research. It involved both nominal and continuous measures. Strong support was achieved for the instruments with reliability alpha levels above the .60 threshold (Nunnally, 1970). The questionnaires contained the demographic variables of age and education, in addition to the measures of psychological capital (locus of control and self-efficacy) and innovative behaviour.
Locus of control scale which consisted of 10-item developed by Paulhus (1983) was used for this study. It originally had a mean of 51.8 for male and 52.2 for females with SD of 6 for both females and males. With a 5-point Likert response format ranging from (1) strongly disagree to (5) strongly agree, the scale indicates the higher the score above average, the more internal and the lower the score below average the more the external. The scale had a Cronbach alpha coefficient of .96. For Self-efficacy scale, Schwarzer and Jerusalem’s (1993, 2000) 10-item modified measure of self-efficacy regarding entrepreneurial tasks was adopted. This measure of self-efficacy was significantly and moderately related to general self-efficacy. A 5-point Likert scale was used, ranging from 1 (no confidence) to 5 (complete confidence). It has a Cronbach alpha of .89. The individual innovative behaviour scale, was originally developed by Scott and Bruce (1994) as a 9-item scale and increased as 12-items, was modified for use in this study. It is a self-rated measure of individual intentional efforts directed towards creativity as well as introducing and applying new ideas within an enterprise role. Finally, a 10-item with a 5-point Likert response format ranging from 1 (never) to 5 (always) was used. It also has a Cronbach alpha of 0.87.

International Journal of Business and Management November, 2009
187
3.4 Procedure
Questionnaires were administered to the respondent at their organizational site within Ibadan, Southwestern Nigeria with a letter of introduction. Participation was voluntary and confidentiality of responses was assured. The participants had the choice of responding to the questionnaires immediately or later; however, while some filled and returned the questionnaire the same day, others gave appointment for days to come for the questionnaire. The questionnaire administration took about eight-week. Not returning and incomplete questionnaires reduced the usable responses to 405.
4. Results
The raw data obtained from the field by questionnaires were subjected to statistical analysis to confirm or discard the stated hypotheses. The detailed result of the statistical analysis is presented according to the stated hypothesis. First, the means, standard deviations, and correlations for all variables are shown in Table 4.1. In the table, locus of control and self-efficacy were significant correlated with each other and with entrepreneurial innovative behaviour.
(Insert table 4.1)
The first, second and third hypothesis examined the main and interaction effect of the psychological capital (locus of control and self-efficacy) on entrepreneurial innovative behaviour. The results in table 4.2 showed the mean values of all the factors as table 4.3 showed the summary results of 2 by 2 ANOVA. The tables of results (4.2 and 4.3) showed that women with internal locus of control ( = 72.79) significantly scored higher on entrepreneurial innovative behaviour than women with external locus of control ( = 34. 58), F (1,401) = 403.00 p < 0.05.
(Insert table 4.2)
Similarly, there was significant mean difference between women with high self-efficacy ( = 71.3) and those with low self-efficacy ( = 48. 94) on entrepreneurial innovative behaviour (F (1,401) = 41.71 p < 0.05). While there was statistically significant two-way interaction effects between locus of control and self-efficacy on innovative behaviour among the women entrepreneurs (F (1,401) =78.49 < .05).
(Insert table 4.3)
Figure 4.1 illustrates the pattern of the two-way interaction effects between locus of control and self-efficacy on entrepreneurial innovative behaviour. Women under the conditions of internal locus of control and low self-efficacy ( = 75. 07) were the highest scorer on entrepreneurial innovative behaviour whereas the score of women under the condition of external locus of control and low self-efficacy ( = 34. 01) were the lowest on entrepreneurial innovative behaviour. It implies therefore that individual differences tend to be more pronounced on internal locus of control in terms of these psychological capitals on entrepreneurial innovative behaviour than high self-efficacy dispersion.
(Insert Figure 4.1)
Table 4.4 showed that there was significant difference between the educational status of lowly educated certificate holders ( = 36.02) and the highly educated certificate holders ( = 71.94) on entrepreneurial innovative behaviour (t = -40.34, p < .000), indicating that education influences entrepreneurial innovative behaviour.
(Insert table 4.4)
5. Discussion
In this study, all the tested variables were statistically significant on entrepreneurial innovative behaviour among women entrepreneurs. First, the finding from this study provides evidence that there are strong relationship between the psychological capitals of self-efficacy, locus of control and entrepreneurial innovative behaviour. Linking this findings to Vroom’s (1964) expectancy theory, it implied that the women entrepreneurs could have been influenced by the desire to grow (valence), with the perceived probability that entrepreneur innovative behaviour would lead to achievement of enterprise growth (instrumentality) and that innovativeness would have a desired effect on their business venture (expectance).
The findings also clearly showed that being internally controlled influenced entrepreneurial innovative behaviour among women entrepreneurs. Thus, confirming previous research that demonstrated strong linkages between locus of control and behaviour in areas such as entrepreneurship (Lefcourt 1981; Rauch & Frese 2000; Sia et al., 1985; Van Kooten, et.al., 1986). Probably the findings came out like this because as (Rauch & Frese, 2000) stated business owners have a slightly higher internal locus of control than others. It may be that being internally control makes it possible for thewomen to engage in entrepreneurial activities and may have subsequent empower them to be innovative. For according to Gist (1989), individuals with a strong internal locus of control tend to see opportunities to improve their skill base and have the confidence to try new techniques and technologies. It can be presumed therefore that being internally controlled might have contributed towards women’s high score entrepreneurial innovative behaviour. Thus, it means that internal locus of control could be a significant when considering innovativeness among women entrepreneurs.
The findings of hypothesis, which sought to find difference in the level of self-efficacy, revealed that high self-efficacy is

Vol. 4, No. 11 International Journal of Business and Management
188
a significant factor on women entrepreneurial innovative behaviour. Hence, it confirms the studies such of Bandura (1997), Bandura, et al. (1999) and Sequeira, et al., (2007) that high self-efficacy is essential to most human performance. It also led credence to Wood and Bandura, (1989) assertion that high self-efficacy expectations regarding performance in a specific behavioural setting lead individuals to approach a situation such as entrepreneurial innovativeness. The significant effect of interaction between locus of control and self-efficacy suggests a further confirmation of previous research, which indicated that individuals with strong internal locus of control tend to be self-confident and will tend to exhibit high self-efficacy or mastery (Bandura 1997; Pearlin & Schooler 1978). Other findings from this study showed that education is one of the significant factors that lead to entrepreneurial innovative behaviour. A possible explanation for this finding is that higher educational attainment (Bussey & Bandura, 1999) could have played a significant influence on women entrepreneurs’ social learning. Thus making them to overcome what Hackett and Betz (1981), called the limiting factors to full attainment of one’s potentials.
6. Conclusion
Considering the result of the study, it could be construed that internal locus of control is the most significant factor in entrepreneurial innovative behaviour. In addition the study also highlighted the significant roles of possession of higher education and high self-efficacy among women entrepreneurs. These attributes might have propelled the women’s belief in their ability to make things work and try out new styles and strategies on their enterprises without fear of failure.
With most empirical research, our study has a number of limitations. First, studying individual innovative behaviour in a natural work context is a complex and difficult task because the criterion is often difficult to validate, and researcher is often limited to the use of perceptual measures. Perhaps this is why there has been little research done in this area. Secondly, the current study relies on survey data, and thus, it is not as rigorous testing an experiment in a pure laboratory setting. Thirdly, this study did not separate the two-stages, which capture innovative behaviour (that is, initiation and implementation of ideas). Nevertheless, future studies should separate them into measures reflecting the task specific problems each poses. For a fuller understanding of this phenomenon, in-depth qualitative and quantitative research is required in addition to also incorporate other kinds of cognitive and behavioural factors that may affect women entrepreneurial innovative behaviour.
Although the findings reported here provide some guidance to practicing entrepreneurs, they also pose a completely new set of questions for researchers. Is there a threshold level at which additional factors no longer improve innovative behaviour? Is this effect common to all entrepreneurs in different sectors? Answers to these questions also await further study. Limitations notwithstanding, our findings suggest that there are significant differences in factors determining women entrepreneurial innovative behaviour. It also draws attention to the need, that women entrepreneurs should continually assess their level of innovativeness to seek for knowledge where there are deficiencies. Finally, it is expected that this study will further aid policy makers and women entrepreneurial training programs to stimulate ability, which are intrinsic in individuals for the exhibition of entrepreneurial innovative behaviour.
References
Acs, Z. J., & Audretsch, D. B. (1999). Small firms and entrepreneurship: An East-West perspective. Cambridge: Cambridge University Press.
Babalola, S. S. (1998). Psychosocial determinants of self-employment behavior and perceived business success. An unpublished Ph.D Thesis in Department of Psychology, University of Ibadan, Ibadan.
Babalola, S. S. (2006). Managing innovation, product development and entrepreneurship. In S. Balogun, B. Ehigie, & A. Sunmola (Eds.), Managerial psychology: An overview. Nigeria: University of Ibadan, Department of Psychology Publication. pp. 352–387.
Bandura, A. (1982). Self-efficacy mechanism in human agency. American Psychologist, 37 (2), 122–147.
Bandura, A. (1995). Self-efficacy in changing societies. New York: Cambridge University Press.
Bandura, A. (1997). Self-efficacy: The exercise of control. New York: Freeman.
Bandura, A. (2002). Social cognitive theory in cultural context. Journal of Applied Psychology: An International
Review, 51, 269–290.
Bandura, A., Pastorelli, C., Barbaranelli, C., & Caprara, G.. (1999). Self-efficacy pathways to childhood depression. Journal of Personality and Social Psychology, 76, 258–269.
Berger, M., & Byvinie, M. (1989). Women’s ventures. West Hartford, CT: Kumarian Press.
Brush, C. G. (1992). Research on women business owners: Past trends, a new perspective and future directions. Entrepreneurship Theory and Practice, 16 (4), 5-30.
Bussey, K., & Bandura, A. (1999). Social cognitive theory of gender development and differentiation. Psychological
Review, 106, 676-713

International Journal of Business and Management November, 2009
189
Cliff, J. E. (1998). Does one size fit all? Exploring the relationship between attitudes towards growth, gender, and business size. Journal of Business Venturing, 13 (6), 523-542.
Cooper, A. C., & Gascon, F. (1992). Entrepreneurs, processes of founding and new-firm performance. In D. Sexton, & J. Kasarda (Eds.), The state of the art of entrepreneurship. Boston: PWS-Kent.
Covin, J. G., & Slevin, D. P. (1991). A conceptual model of entrepreneurship as firm behaviour. Entrepreneurship
Theory and Practice, 16 (1), 7-25.
Craig, A. R., Franklin, J. A., & Andrew, S. C. (1984). A scale to measure locus of control of behaviour. British Journal of
Medical Psychology, 57, 173-180.
de Jong, J., & den Hartog, D. (2003). Leadership as a determinant of innovative behaviour: A conceptual framework.
Report published under the Scientific AnaLyses of Entrepreneurship SMEs (SCALES) initiative, Research Report H200303, Zoetermeer, EIM.
de Noble, A., Jung, D., & Ehrlich, S. (1999). Entrepreneurial self-efficacy: The development of a measure and its relationship to entrepreneurial action. In Frontiers of entrepreneurship research. Boston, MA: Babson College.
Dickerson, A., & Taylor, A. (2000). Self-limiting behaviour in women: Self esteem and self efficacy as predictors. Group
and Organization Management, 25 (2), 191-210.
DTI, (2001). UK competitiveness indicators. (2nd ed.). London: HMSO.
Eden, D. (1992). Leadership and expectations: Pygmalion effects and other self–fulfilling prophecies in organizations. Leadership Quarterly, 3 (4), 271–305.
Ehigie, B. O., & Idemudia, V.O. (2000). Working women and exclusive breastfeeding in Oyo State, Nigeria. African
Journal of Business and Economic Research, 1(1), 49-57.
Ehigie, B. O., & Umoren, U. E. (2003). Psychological factors influencing perceived entrepreneurial success among Nigerian women in small-scale businesses. Journal of International Women’s Studies, 5(1), 78-95.
Ehigie, B. O. (2000). Gender differences in career orientation and influence on marital satisfaction, Ilorin Journal of
Business and social Sciences, 6(2), 1 – 13.
Erdil. S., Erdil, O., & Keskin, H. (2004). The Relationship between market orientation, firm innovativeness and innovation performance. Journal of Global Business and Technology, 1(1), 1-11.
Gist, M. (1989). The influence of training method on self-efficacy and idea generation among managers. Personnel
Psychology, 42, 787-805.
Gist, M. E. (1987). Self-efficacy: Implications for organizational behaviour and human resource management. Academy
of Management Review, 12, 472–485.
Hackett, G., & Betz, N. E. (1981). A self-efficacy approach to the career development of women. Journal of Applied
Social Psychology, 30, 2137-2157.
Hoffman, R. R. (1974). Perceived obligations for career development: A comparison of responses of individuals who
differ in managerial status and locus of control beliefs. Unpublished Doctoral Dissertation, The George Washington University.
Kalleberg, A. L., & Leicht, K. T. (1991). Gender and organizational performance: Determinants of small business survival and success. Academy of Management Journal, 34 (1), 136-161.
Kanter, R. (1988). When a thousand flowers bloom: Structural, collective, and social conditions for innovation in organizations. In B. M. Staw, & L. L. Cummings (Eds.), Research in organizational behaviour. Greenwich, CT: JAI Press. Vol. 10, pp. 169-211.
Kitching, B., & Woldie, A. (2004). Female entrepreneurs in transitional economies: A comparative study of businesswomen in Nigeria and China. In Proceedings Hawaii international conference on business, Honolulu, Hawaii.
Lee, J-H., & Venkataraman, S. (2006). Aspirations, market offerings, and the pursuit of entrepreneurial opportunities. Journal of Business Venturing, 21(1), 107-124.
Lefcourt, H. M. (Ed.). (1981). Research with the locus of control constructs Vol. 1: Assessment methods. London:
Academic Press.
Loveman, G., & Sengenberger, W. (1991). The re-emergence of small-scale production: An international comparison. Small Business Economics, 3 (1), 1-39.
Mabogunje, A. L. (1967). The morphology of Ibadan. In P. C. Lloyd, A. L. Mabogunje and B. Awe, (Eds.), The city of
Ibadan. London: Cambridge University Press.

Vol. 4, No. 11 International Journal of Business and Management
190
McNairn, J. B., & Mitchell, B. (1992). Locus of control and farmer orientation: Effects on soil conservation adoption. Journal of Agricultural and Environmental Ethics, 5, 87-101.
Mumford, M. D., & Gustafson, S. B. (1988). Creativity syndrome: Integration, application, and innovation. Psychological Bulleting, 103, 27-43.
National Planning Commission. (NPC, 2004). National economic empowerment and development strategy (NEEDS), National Planning Commission, Abuja, Nigeria.
Nunnally, J. C. (1970). Introduction to psychological measurement. New York: McGraw Hill.
Orser, B., & Hogarth-Scott, S. (2003). Opting for growth: Gender dimensions of choosing enterprise development. Canadian Journal of Administrative Sciences, 19 (3), 284-300.
Parikh, I. (1987). Women in management: An annotated bibliography with emphasis on commonwealth sources. London, Commonwealth Secretariat.
Paulhus, D. L. (1983). Sphere specific measures of perceived control. Journal of Personality and Social Psychology, 44, 1253-1265.
Pearlin, L. I., & Schooler, C. (1978). The structure of coping. Journal of Health and Social Behaviour, 19, 2-21.
Quince, T., & Whittaker, H. (2003). Entrepreneurial orientation and entrepreneurs’ intensions and objectives. A CBR research program 3 on small and medium-sized enterprises, Working Paper No. 271, ESRC Centre for Business Research, University of Cambridge.
Rauch, A., & Frese, M. (2000). Psychological approaches to entrepreneurial success: A general model and an overview of findings. In C. L. Cooper, & I. T. Robertson, (Eds.), International review of industrial and organizational psychology.
Chichester: Wiley. pp. 101-142.
Schiller, B. R., & Crewson, P. E. (1997). Entrepreneurial origins: A longitudinal inquiry. Economic Inquiry, 35 (3), 523-531.
Schwarzer, R., & Jerusalem, M. (1993). The general self-efficacy scale (GSE). [Online] Available: http://userpage.fu-berlin.de/~health/engscal.htm.
Schwarzer, R., & Jerusalem, M. (2000). Generalized self-efficacy scale. [Online] Available: http://www.fu-berlin.de/gesund/skalen/procop_engl.htm.
Scott, S. G., & Bruce, R. A. (1994). Determinants of innovative behaviour: A path model of individual innovation in the workplace. The Academy of Management Journal, 37 (3), 580 - 607.
Sequeira, J., Mueller, S. L., & Mcgee, J. E. (2007). The influence of social ties and self-efficacy in forming entrepreneurial intentions and motivating nascent behaviour. Journal of Developmental Entrepreneurship, 12 (3), 275–293
Sia, A. P., Hungerford, H. R., & Tomera, A. N. (1985). Selected predictors of responsible environmental behaviour: An analysis. Journal of Environmental Education, 17, 31-40.
UNIDO (2001). Women entrepreneurship development in selected African Countries. Working paper, No.7.
Van de Ven, A. (1986). Central problems in the management of innovation. Management Science, 32, 590-607.
Van Kooten, G. C., Schoney, R. A., & Hayward, K. A. (1986). An alternative approach to the evaluation of goal hierarchies among farmers. Western Journal of Agricultural Economics, 11, 40-49.
Verheul, I., Uhlaner, L., & Thurik, R. (2005). Business accomplishments, gender and entrepreneurial self-image. Journal of Business Venturing, 20, 483-528.
Vroom, V. H. (1964). Work and motivation. New York: Wiley.
Weiner, B. (1974). Achievement motivation and attribution theory. Morristown, N.J: General Learning Press.
West, M., & Farr, J. (1989). Innovation at work: Psychological perspectives. Social Behaviour, 4, 15-30.
Wood, R., & Bandura, A. (1989). Social cognitive theory of organizational management, Academy of Management
Review, 14, 361–381.
World Bank. (1995). Enhancing women’s participation in economic development. Washington, DC.
Zhao, H., Scott, E. S., & Hills, G. E. (2005). The mediating role of self-efficacy in the development of entrepreneurial intentions. Journal of Applied Psychology, 90 (6), 1265–1272.

International Journal of Business and Management November, 2009
191
Table 1. Showing the correction matrix between the psychological capitals and women entrepreneurial innovative behaviour
N Locus of control Self-efficacy EIB
Locus of control 405 38.39 - - -
Self-efficacy 405 29.09 .166(**) - -
EIB 405 43.59 .268(**) .858(**) -
NOTE: ** = P < 0.01; * = P < 0.05; EIB = Entrepreneurial innovative behaviour.
Table 2. Summary table showing the means of the psychological capitals on women entrepreneurial innovative behaviour
Locus of control Self-efficacy SD N
External Low 34.01 6.65 147
High 55.75 8.13 004
Total 34.59 7.52 151
Internal Low 75.07 4.08 84
High 71.66 4.69 170
Total 72.79 4.77 254
Total Low 48.94 20.63 231
High 71.29 5.32 174
Total 58.54 19.42 405
Table 3. Summary of 2 X 2 ANOVA showing the main and interaction effect of psychological capitals on women entrepreneurial innovative behaviour
Source SS Df MS F P
Locus 11820.79 1 11820.79 403.00 < .001
Efficacy 1223.56 1 1223.56 41.71 < .001
Locus and Efficacy 2302.26 1 2302.26 78.49 <.001
Error 11762.18 401 29.33
Total 1540755.00 405
Table 4. Showing the t-test analysis the educational differences on women entrepreneurial innovative behaviour
Education N SD df t Sig.
Innovative
behaviour
Primary/Secondary 151 36.02 10.30 403 -40.34 .000
Tertiary 254 71.94 7.53

Vol. 4, No. 11 International Journal of Business and Management
192
Figure 1. Graphical representation of the interaction effect of psychological capitals
on women entrepreneurial innovative behaviour