Internationalisation dans le champ éducatif (18e - Université ...
Upload
independentCategory
view
0download
0
Ž .Research Policy 28 1999 145–155
Patterns of internationalisation of corporate technology: locationvs. home country advantages 1
Pari Patel ), Modesto VegaScience Policy Research Unit, UniÕersity of Sussex, Brighton BN1 9RF, England, UK
Abstract
Given the trends towards increasing globalisation of markets and of production, the globalisation of technology remains asubject of considerable interest to analysts and policy makers in the 1990s. This paper provides some new empiricalobservations for debate and discussion on the patterns of technological activities of large firms outside their home countries.It is based on a systematic analysis of the US patenting activities of 220 of the most internationalised firms in terms of their
Žtechnology in the 1990s. Although firms are active outside their home countries in the ‘high technology’ fields such as.Computers, Pharmaceuticals, Telecommunications, Image and Sound and Materials , quite a sizeable proportion of their
foreign activities are concerned with process and machinery technologies. Moreover, a comparison of the technologicaladvantage of the company at home and the advantage of the location shows that in a large majority of cases, firms tend tolocate their technology abroad in their core areas where they are strong at home. These results suggest that adapting productsand processes and materials to suit foreign markets and providing technical support to off-shore manufacturing plants remainmajor factors underlying the internationalisation of technology. They are also consistent with the notion that firms areincreasingly engaging in small scale activities to monitor and scan new technological developments in centres of excellencein foreign countries within their areas of existing strength. However there is little evidence to suggest that even these mostinternationalised firms routinely go abroad to compensate for their weakness at home. q 1999 Elsevier Science B.V. Allrights reserved.
Keywords: Corporate technology; Location advantage; Home country advantage
) Corresponding author. Tel.: q44-1273-686758; Fax: q44-1273-685865; E-mail: [email protected]
1 The paper is based on research at the Centre for Science,Ž .Technology and Energy and Environment Policy STEEP within
the Science Policy Research Unit, funded by the UK EconomicŽ .and Social Research Council ESRC and EC TSER programme.
It has benefited greatly from comments by Keith Pavitt, partici-pants at the seminar on ‘The Internationalisation of CorporateR&D’ in Montreal in August 1997, and an anonymous referee ofthis journal.
1. Introduction
The purpose of this paper is to throw new empiri-cal light on the nature of the technological activitiescarried out by large firms outside their home coun-tries. The subject of internationalisation of technol-ogy has received increasing interest among national
Žand international policy makers OECD, 1992, 1993;.National Academy of Engineering, 1993 as well as
Žacademics Dunning, 1992; Granstrand et al., 1992;Pearce and Singh, 1992; Cantwell, 1992, 1995; Dun-
0048-7333r99r$ - see front matter q 1999 Elsevier Science B.V. All rights reserved.Ž .PII: S0048-7333 98 00117-6

( )P. Patel, M. VegarResearch Policy 28 1999 145–155146
ning and Narula, 1995; Florida, 1997; Kummerle,.1997 . For example, the introduction to a recent
special issue of IEEE Transactions on EngineeringŽ .Management 1996, Vol. 43, No. 1 began with the
words:
R&D is going global. Firms in deÕeloped countrieswith adÕanced technologies are setting up R&Dfacilities around the world
At the same time there appears to be a lack ofsystematic evidence to enable a proper examinationof the subject. As one thorough review of the subjectŽ .Granstrand et al., 1992 put it
. . . internationalisation of R&D and technology is aphenomenon with many dimensions but with— afterall— few aÕailable obserÕations so far, . . . leaÕingample room for uncertainty and speculation. p. 233
ŽThis paper, in line with our earlier work Patel.and Pavitt, 1991; Patel, 1995, 1996 , is a modest
attempt at providing some new empirical observa-tions for debate and discussion on one dimension 2
of the subject, namely, the nature of technologicalactivities undertaken by large firms outside theirhome base. Our previous analyses, together with
Ž .studies reported by Granstrand et al. 1992 , showedthat the technological activities of the world’s largestfirms continue to be firmly embedded in, and influ-enced by, the conditions in their home countries.This work also showed that there have been in-creases in foreign technological activities especiallyamongst some European firms in the late 1980s andearly 1990s. The purpose of the present study is to
Žexamine at a more detailed level by company and.technical field the patterns of foreign technological
activities for a subset of companies that are at theforefront of internationalising their technology in themid-1990s and the extent to which these patternsreflect advantages created at ‘home’ or those createdin the ‘host’ country.
The literature on the internationalisation of busi-ness suggests a number of different reasons forundertaking technological activities outside the home
2 For a review of other dimensions of the debate concerning theŽ .globalisation of technology, see Archibugi and Michie 1995 .
Ž .country. For example, Vernon 1966 argued thathaving established a new product or a new produc-tion process in the home market, firms would subse-quently export andror locate production facilities inforeign locations. This process would inevitably in-volve some foreign R&D activity mainly concerned
Žwith adapting the products e.g., to account for dif-.ferences in consumer tastes and the production pro-
Žcesses e.g., to account for differences in the labour.market to suit the local market conditions. Thus the
main purpose of foreign technological activitieswould be to support foreign production and to ser-vice the foreign market. In such a scenario, compa-nies would be mainly exploiting technological ad-vantage created within the home country.
ŽHowever, more recent analyses Cantwell, 1992,1995; Chesnais, 1992; Hakanson, 1992; Pearce andSingh, 1992; Granstrand and Sjolander, 1992; Dun-
.ning and Narula, 1995 suggest that two other factorshave become increasingly important: the need tomonitor new technological developments and theability to generate entirely new technologies andproducts from foreign locations. Both of these havebeen attributed to increasing complexity of technol-ogy and the resulting rise in the cost of R&D. In theformer case a company would be active abroad intechnologies where there is complementarity be-tween the strength of the host country and its owndomestic strength. In the latter case a company issimply interested in exploiting the technological ad-vantage of the host country in order to alleviatetechnological weakness at home.
Table 1 provides a summary of these three mainfunctions of foreign R&D, together with an indica-tion of the scale of activity involved and whether thisis based on exploiting advantages created at home orthose present in the host country. Our previous re-
Ž .search Patel, 1995 has shown that one of the mainmechanisms by which firms establish such foreignR&D is mergers and acquisitions. 3 However, theaim of this paper is to empirically distinguish be-tween different patterns of foreign technological ac-tivities at the firm level rather than the different
3 Between the early and the late 1980s more than half theincreases in internationalisation of R&D amongst large European
Ž .companies came from mergers and acquisitions Patel, 1995 .

( )P. Patel, M. VegarResearch Policy 28 1999 145–155 147
Table 1Purpose, scale and major determinant of foreign technological activities
Purpose Scale Exploitation of home or Major determinanthost country advantage of location
Adapting products, Small Ø Company Advantage at Home Scale of Host Marketprocesses and materials tosuit foreign markets andproviding technical supportto off-shore manufacturingplants
Monitoring scientific and Small Ø Company Advantage at Home, Quality and Scale oftechnological developments Ø Host Country Advantage Science and Technology ofin foreign countries both the Host Country
and the Home Country
Generating entirely new Large Ø Company Weak at Home, Quality and Scale ofproducts and core Ø Host Country Advantage Science and Technology oftechnologies outside the both the Host Countryhome countries and the Home Country
Cost Advantages
mechanisms by which such activities are established.It is based on a detailed examination of informationon the US patenting activities of the world’s largest
Ž .firms described in more detail in Section 2 . Inparticular by analysing the country address of theinventor of patents granted to a particular company,we are able to address the following questions:
q What are the technical fields in which firmsundertake foreign technological actiÕities?q What are the most important geographic loca-tions of foreign technological actiÕities?q Do companies locate their technological actiÕi-ties in a foreign location purely on the basis oftechnological adÕantage of that location or on thebasis of such adÕantage created at home?We shall show that:Ž .1 Although firms are active outside their home
Žcountries in the ‘high technology’ fields such asComputers, Pharmaceuticals, Telecommunications,
.Image and Sound and Materials , quite a sizeableproportion of their foreign activities are concernedwith process and machinery technologies.
Ž .2 USA, Germany and the UK continue to be themost important locations and Japan the least impor-tant.
Ž .3 In majority of cases, companies are active inforeign locations in technical fields where they arerelatively strong at home. The largest increases have
been in technical fields where there are complemen-tary strengths between the ’domestic’ activity of acompany and the ’host’ country.
Before turning to the results in Section 3, Section2 outlines the main elements of the data set compiledto analyse these issues.
2. Data set
The data set has been compiled from information,supplied by the US Patent Office, on the name of thecompany, the technical class, and country of originof the inventor, for each patent granted in the USAfrom 1969 to 1996. Additionally we have collected,for each firm data on its sales, principal sector ofactivity, country of origin from the Fortune lists ofthe world’s largest firms and Disclosure Worldscope.The main difficulty with the primary data is thatmany patents are granted under the names of sub-sidiaries and divisions that are different from thoseof the parent companies, and are therefore listedseparately. In addition the names of companies arenot unified, in the sense that the same company mayappear several times in the data, with a slightlydifferent name in each case. Consolidating patentingunder the names of parent companies can only bedone manually on the basis of publications like
( )P. Patel, M. VegarResearch Policy 28 1999 145–155148
‘Who Owns Whom’. In the SPRU Large Firms’Database, we have unified the names and consoli-dated the data for more than 500 of the world’slargest firms in terms of sales for the late 1980s andearly 1990s.
There is one caveat that need to be borne in mindwhen interpreting the results of the analysis in Sec-tion 3 below. As our firms are consolidated for 1year only: 1992, the time-trend analyses of patentingby firms between 1980 and 1996, reflects the firm asconstituted in that year, and does not include any ofthe changes resulting from purchases or sales ofsubsidiaries or divisions since then. Thus, measuredchanges over time are composed of changes in thoseparts of the firm retained up to 1992, together withthose resulting from acquisitions made up to 1992: inother words, what the firm kept and what it bought,up to 1992.
For each patent granted, we have the followinginformation which we use in our analysis for thecurrent study:Ø The technical field. We have developed and used
a 34 field classification based on aggregations ofŽUS patent classes see Table 4 for a list of some
.these classes .Ø The country of residence of the inÕentor. 4 This is
not necessarily the country from which their patentapplication was filed, and is a more accuratereflection of the country in which the technologi-cal activity was performed.The advantages and drawbacks of patenting statis-
tics as indicators of technological activities havebeen discussed extensively elsewhere. 5 For the pur-
Ž .poses of our analysis, the main drawbacks are: athat US patenting does not fully reflect improve-ments in software technology, since the practice inthe USA of protecting software technology through
Ž .patents is of recent origin and b using US patentdata for US companies and for US subsidiaries ofnon-US companies means that there will be an over-estimation of the role of domestic R&D for theformer and foreign R&D for the latter. On the other
4 More accurately the first named inventor. The number of USpatents with inventors from different countries is around 1%.
5 Ž .See, for example, Griliches 1990 , and Pavitt and PatelŽ .1995 .
Table 2Distribution of the 220 firms in the sample by nationality andprincipal product group
Product group North Japan Europe TotalaAmerica
Aerospace 2 0 1 3Automotive 4 0 6 10Chemicals 9 2 17 28Pharmaceuticals 9 1 18 28Electronics 20 12 20 52Food, Drink and Tobacco 3 0 6 9Machinery and Equipment 13 2 33 48Materials 0 1 7 8Metals 3 2 8 13Mining and Petroleum 2 0 7 9Paper 1 0 2 3Photography And Photocopy 3 1 0 4Printing and Publishing 1 0 1 2Rubber 1 1 1 3Total 71 22 127 220
aSixty-five US firms and six Canadian firms.Source: SPRU Large Firms Database.
hand, our patenting database offers greater coverage,comparability and detail than any other availablemeasure of technological activities. It also yieldsresults that are mainly consistent with those derived
Ž .from other measures like R&D activities , when thetwo can be compared. 6
For the current study we have chosen 220 firmswith the highest volume of patenting outside thehome country in the period 1990 to 1996. Togetherthey account for 30% of all US patenting in thisperiod and on average they undertake about 20% oftheir total patenting from outside the home country.In Table 2, we list the numbers of firms in oursample according to their home country 7 and princi-pal product group. Thus amongst the most interna-
6 Ž .For example, in Patel 1996 we showed that the geographicdistribution of US firms’ foreign R&D expenditures as reportedby the NSF is very highly correlated with the geographic origin of
Žthe US patents granted to the US based firms correlation coeffi-.cient 0.97 .
7 There are certain bi-national companies such as ABB, Shell,Unilever and SmithKline Beecham that have been assigned asingle country in the aggregate analyses. However when consider-ing their ‘foreign’ technological activities in Section 3 we havetreated both countries as ‘home’.

( )P. Patel, M. VegarResearch Policy 28 1999 145–155 149
Ž .tionalised firms, well over half 58% are European,one-third are North American and only 10% areJapanese. This confirms the results of previous anal-
Ž .ysis Patel, 1996 which showed that European firmsare amongst the most internationalised and Japanesefirms amongst the least. Within Europe the largest
Ž .contributors were the UK 39 firms , followed byŽ . Ž . Ž .Germany 22 , Switzerland 107 , France 15 and
Ž .Sweden 13 . In terms of the industrial distribution,26% had machinery and metal goods as their princi-pal product group, 25% had chemicals and pharma-
Žceuticals, and 24% electricalrelectronics including.computing machinery .
3. Patterns of international location of technologi-cal activities
The analysis in Sections 3.1, 3.2 and 3.3 is basedon the number of US patents granted for the period1990–1996 by technical field and by inventor coun-try to each of the 220 companies. In order to elimi-nate very low levels of activity we only considertechnical fieldrinventor country combinations withmore than six patents. This means that the resultsbelow are biased against process and machineryrelated technologies which typically account for asmall proportion of a company’s patenting portfolio.
For each technical fieldrinventor country combi-nation we analyse three sets of distributions in Sec-tions 3.1, 3.2 and 3.3.
Ž .1 The distribution by technical field and productgroup to examine the main technologies in whichfirms from different product groups go outside thehome country.
Ž .2 The distribution by technical field and nation-ality of firm to examine the main technologies inwhich firms of different nationalities go outside the
Ž .home country. 3 The distribution by technical fieldand inventor country to examine the main foreignlocations within each technology.
3.1. Main fields of actiÕity in foreign locations byproduct group of firm
Table 3 lists the main technical fields of activityŽ .in foreign locations for firms in seven principal
product groups. 8 As may be expected, Chemicals,Pharmaceuticals and ElectricalrElectronics firmsdominate this list, accounting for more than 60% ofthe inventorrtechnical field combinations. At theaggregate level, the analysis shows the importance ofthe ‘high technology areas’ such as pharmaceuticalsŽ .including biotechnology , computers, telecommuni-cations, image and sound and materials in foreigntechnological activities. However, it also shows thatboth, in aggregate and for individual product groups,a substantial part of these activities are concernedwith improvements in process technology and ma-chinery. 9 For each product group, companies areactive abroad in their ‘core’ technologies: organicchemicals and pharmaceuticals for chemical andpharmaceutical firms, computers and telecommunica-tions for electronic firms. As we have shown else-
Ž .where, Granstrand et al., 1997 these are preciselythe technologies in which companies have a highproportion of their activities and have a high techno-logical advantage.
3.2. Main fields of actiÕity in foreign locations bynationality of firm
Table 4 analyses the importance of different tech-nical fields in the foreign technological activities ofthe 220 firms aggregated according their nationality.It shows that process and machinery related tech-nologies are important for firms of all nationalities,accounting for 31% of cases for US and Germanfirms and 67% for Swedish firms. There is someevidence here to suggest that firms tend to go abroadin their areas of strength: US firms in computers;German, UK and Swiss firms in organic chemicalsand pharmaceuticals; and Japanese firms in comput-ers, image and sound. In Section 3.4, we examinemore systematically whether companies go abroad intheir areas of strength or weakness and how theserelate to the strengths and weaknesses of the loca-tion.
8 There were too few observations for meaningful analysis inAerospace, Paper, Printing and Publishing, and Rubber.
9 These we have defined as chemical processes, metallurgicalprocesses, chemical apparatus, non-electrical machinery, spe-cialised machinery, metal-working equipment, assembling andmaterial handling, instruments, miscellaneous metal products.

()
P.P
atel,M.V
egar
Research
Policy
281999
145–
155150
Table 3Technical fields of activity outside the home country by product group: 1990–1996
Product group All firms Chemicals Pharmaceuticals ElectricalrElectronics
No. of cases 1130 207 102 379Ž . Ž . Ž . Ž . Ž .Technical field % cases Process and Machinery 36.2 Process and Machiner 27.5 Pharmaceuticals 38.2 Process and Machinery 26.1
Ž . Ž . Ž . Ž .Organic Chemicals 9.7 Organic Chemicals 24.6 Organic Chemicals 22.5 Computers 18.2Ž . Ž . Ž . Ž .Pharmaceuticals 7.5 Pharmaceuticals 16.9 Process and Machinery 19.6 Telecoms 15.8
Ž . Ž . Ž .Computers 7.3 Medical 14.7 Electrical Devices 10.8Ž . Ž .Telecoms 5.8 Image and Sound 9.8
Ž .Electrical Devices 4.4Ž .Image and sound 4.0
Ž .Materials 3.7Ž .Electrical equipment 3.5
Ž .Medical 3.3
Machinery Motor vehicles Food, Drink and Tobacco Mining and Petroleum
No. of cases 166 49 37 64Ž . Ž . Ž . Ž . Ž .Technical field % cases Process and Machinery 67.5 Process and Machinery 65.3 Process and Machinery 40.5 Process and Machinery 34.4
Ž . Ž . Ž .Vehicle Engineering 10.2 Food and Tobacco 29.7 Organic Chemicals 23.4Ž . Ž .Organic Chemicals 8.1 Hydroc 9.4
Ž . Ž .Pharmaceuticals 8.1 Mining 7.8

( )P. Patel, M. VegarResearch Policy 28 1999 145–155 151
Table 4Main fields of activity in foreign locations by nationality of firm: 1990–1996
Percentage shares Nationality
USA UK Germany Switzerland France Netherlands Japan Sweden Canada
Technical fieldNumber of cases 336 155 132 112 106 89 78 48 24
Process and Machinery 31.3 43.2 31.8 40.2 34.9 31.5 32.1 66.7 45.8Organic Chemicals 12.5 9.0 9.1 12.5 5.7 0.0 3.8 2.1 4.2Pharmaceuticals 5.7 6.5 13.6 13.4 5.7 2.2 1.3 6.3 0.0Computers 11.0 1.9 3.8 0.9 9.4 4.5 16.7 8.3 4.2Telecommunications 6.3 3.9 5.3 1.8 9.4 0.0 9.0 4.2 8.3Electrical Devices 6.5 2.6 1.5 0.9 8.5 5.6 5.1 2.1 4.2Image and Sound 3.9 0.6 3.8 0.0 5.7 5.6 12.8 0.0 4.2Materials 3.3 5.8 4.5 2.7 5.7 4.5 2.6 0.0 8.3Electrical Machinery 1.8 3.2 4.5 4.5 5.7 0.0 3.8 2.1 8.3Medical 4.2 4.5 4.5 3.6 0.0 3.4 0.0 4.2 0.0
3.3. Importance of locations for technical fields
Table 5 lists the main foreign locations of activitywithin technical fields amongst the 220 firms. Inaggregate, it shows that the US, Germany and theUK are the most prominent locations accounting formore than two thirds of all cases. Within Europe,
Germany is a more favoured location in most areasof machinery and in instrumentation, and the UK inpharmaceuticals and some areas of electronics tech-
Žnologies computers, image and sound, and telecom-.munications . Japan is the least favoured location in
aggregate amongst these leading R&D spendingcountries.
Table 5Distribution of cases by location and technical field: 1990–1996
Percentage Shares Location
Number of Cases USA Germany UK France Japan
Technical field
Organic Chemicals 110 32.7 10.9 14.5 7.3 9.1Pharmaceuticals 85 31.8 11.8 18.8 9.4 7.1Computers 83 31.3 12.0 15.7 7.2 8.4Instruments 79 41.8 21.5 11.4 7.6 3.8Chemical Processes 75 48.0 12.0 13.3 6.7 6.7Telecommunications 65 33.8 10.8 15.4 6.2 1.5Specialised Machinery 61 39.3 27.9 8.2 8.2 0.0Non-Electrical Machinery 53 49.1 18.9 7.5 7.5 1.9Electrical Devices 50 36.0 16.0 10.0 6.0 14.0Image and Sound 45 35.6 13.3 15.6 2.2 6.7Chemical Apparatus 44 52.3 15.9 4.5 6.8 0.0Materials 42 47.6 11.9 7.1 2.4 4.8Electrical Machinery 40 57.5 17.5 7.5 5.0 2.5Medical 37 48.6 16.2 8.1 5.4 0.0Miscellaneous Metal Products 36 41.7 27.8 8.3 8.3 2.8Metalworking Machinery 35 31.4 34.3 8.6 11.4 5.7
All Fields 1130 40.9 16.8 11.6 6.9 5.0

( )P. Patel, M. VegarResearch Policy 28 1999 145–155152
3.4. Host country and company adÕantages createdat home
The central question addressed in this section iswhen a company locates its activities in a particulartechnical field in a foreign location, is this a reflec-tion of the strength of that company at home in thattechnology or the strength of the location? Thisanalysis is based on constructing the following indi-cators.
HostRTA: An index of ‘Revealed Technology Ad-Ž .vantage’ which is defined as the ‘host’ inventor
country’s share of all US patenting in that technicalfield, divided by its share of all US patenting in allfields. An RTA of more than one therefore shows acountry’s relative strength in a technology, and lessthan one its relative weakness. This measure corre-sponds broadly to the measure of comparative advan-tage used in international trade analyses.
CompHomeRTA which is an ‘RTA Index basedŽon the company’s patenting at home’ i.e., country of
.the headquarters in a technical field, and indicates aŽ .company’s relative strength or weakness in that
field on the basis of its domestic activity.On the basis of these two indicators we divide the
inventor countryrtechnical field combinations intothe following categories.
q Type 1, where HostRTA)1 and CompHome-RTA-1. These are technologies in which a com-pany is relatively weak at home and the location isrelatively strong, i.e., where a company is simplyexploiting host country advantages in areas of do-mestic weakness.
q Type 2, where CompHomeRTA) 1 andHostRTA-1. These are technologies in which acompany is relatively strong at home and the loca-tion is relatively weak, i.e., where a company ismainly exploiting advantages created at home. Thiscategory is closest to the adaptationrtechnical sup-
Ž .port function described by early Vernon 1966 andlabelled as ‘Home-Base Exploiting’ activity in Kum-
Ž .merle 1997 .q Type 3, where CompHomeRTA ) 1 and
HostRTA)1. These are technologies in which acompany has a relative advantage at home and thelocation is also relatively strong. The closest parallelhere is to the ‘Home-Base Augmenting’ activities in
Ž .Kummerle 1997 . These involve some element of
the ‘strategic asset seeking’ behaviour described byŽ .Dunning and Narula 1995 , i.e., where companies
seek out foreign locations that have complementarystrengths to their own in a particular technology.
q Type 4, where CompHomeRTA- 1 andHostRTA-1. In these technical fields there is nei-ther a home advantage nor a locational advantageand are probably the result of mergers and acquisi-tion activities where the motives are not technologyrelated.
3.4.1. Differences by nationalityTable 6 presents the proportion of cases in each
category both in aggregate and by nationality of thecompany. In aggregate more than 75% of the casesinvolve technical fields in which a company has
Ž .relative advantage at home Type 2 and Type 3 , andthis proportion rises to more than 80% in the case ofAmerican, Japanese, Swiss and Swedish firms. Inaround 40% of the cases, companies have locatedtechnology abroad in areas of their relative advan-tage and where the location has got an advantage.Both in aggregate and for US, German and Japanese
Ž .firms exploiting advantage created at home Type 2is a more important motive than the simple exploita-tion of locational advantage to alleviate domestic
Ž .weakness Type 1 . Only the Dutch firms have arelatively high proportion of cases in Type 1 cate-gory.
One of the unique characteristic of our data set isthat it allows us to examine changes in the impor-tance of the various categories over time. Fig. 1shows that, for all the companies combined therehave been small changes in the relative importance
Table 6Distribution of cases by nationality and category: 1990–1996
Nationality Type 1 Type 2 Type 3 Type 4 Total
USA 8.3 38.4 44.0 9.2 100.0Japan 11.5 53.8 26.9 7.7 100.0Germany 7.6 39.4 34.8 18.2 100.0France 4.7 41.5 34.0 19.8 100.0UK 14.2 29.7 35.4 20.6 100.0Netherlands 19.1 37.1 29.2 14.6 100.0Switzerland 9.8 27.7 53.6 8.9 100.0Sweden 8.3 39.6 41.7 10.4 100.0
All Firms 10.5 36.9 39.2 13.4 100.0
( )P. Patel, M. VegarResearch Policy 28 1999 145–155 153
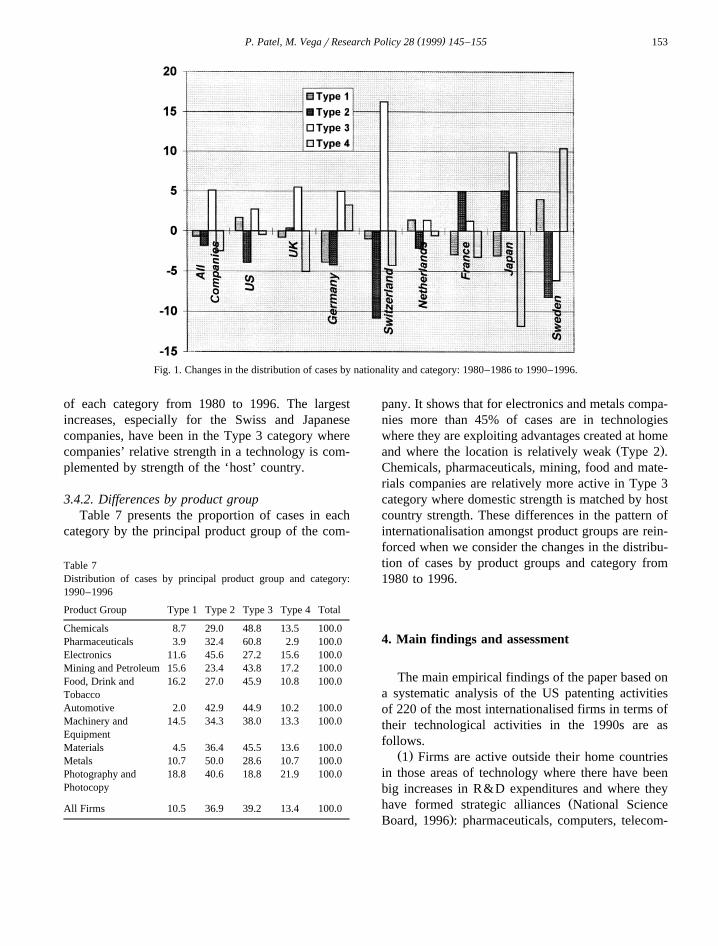
Fig. 1. Changes in the distribution of cases by nationality and category: 1980–1986 to 1990–1996.
of each category from 1980 to 1996. The largestincreases, especially for the Swiss and Japanesecompanies, have been in the Type 3 category wherecompanies’ relative strength in a technology is com-plemented by strength of the ‘host’ country.
3.4.2. Differences by product groupTable 7 presents the proportion of cases in each
category by the principal product group of the com-
Table 7Distribution of cases by principal product group and category:1990–1996
Product Group Type 1 Type 2 Type 3 Type 4 Total
Chemicals 8.7 29.0 48.8 13.5 100.0Pharmaceuticals 3.9 32.4 60.8 2.9 100.0Electronics 11.6 45.6 27.2 15.6 100.0Mining and Petroleum 15.6 23.4 43.8 17.2 100.0Food, Drink and 16.2 27.0 45.9 10.8 100.0TobaccoAutomotive 2.0 42.9 44.9 10.2 100.0Machinery and 14.5 34.3 38.0 13.3 100.0EquipmentMaterials 4.5 36.4 45.5 13.6 100.0Metals 10.7 50.0 28.6 10.7 100.0Photography and 18.8 40.6 18.8 21.9 100.0Photocopy
All Firms 10.5 36.9 39.2 13.4 100.0
pany. It shows that for electronics and metals compa-nies more than 45% of cases are in technologieswhere they are exploiting advantages created at home
Ž .and where the location is relatively weak Type 2 .Chemicals, pharmaceuticals, mining, food and mate-rials companies are relatively more active in Type 3category where domestic strength is matched by hostcountry strength. These differences in the pattern ofinternationalisation amongst product groups are rein-forced when we consider the changes in the distribu-tion of cases by product groups and category from1980 to 1996.
4. Main findings and assessment
The main empirical findings of the paper based ona systematic analysis of the US patenting activitiesof 220 of the most internationalised firms in terms oftheir technological activities in the 1990s are asfollows.
Ž .1 Firms are active outside their home countriesin those areas of technology where there have beenbig increases in R&D expenditures and where they
Žhave formed strategic alliances National Science.Board, 1996 : pharmaceuticals, computers, telecom-

( )P. Patel, M. VegarResearch Policy 28 1999 145–155154
munications, and materials. However quite a sizeablepart of their foreign activities, regardless of productgroup and nationality, are concerned with improve-ments in process technology and machinery.
Ž .2 The most important location of activity is theUS followed by Germany and the UK.
Ž . Ž .3 In a large majority more than 75% of cases,firms tend to locate their technology abroad in theircore areas where they are strong at home. In a small
Ž .minority of cases 10% , firms go abroad in theirareas of weakness at home to exploit the technologi-cal advantage of the host country.
Ž .4 The largest increases, especially for chemicaland pharmaceutical companies, have been in techni-cal fields where there are complementary strengthsbetween the domestic activity of a company and thehost country.
In relation to the motives for foreign technologi-cal activities outlined in Table 1, our results suggestthat adapting products and processes and materials tosuit foreign markets and providing technical supportto off-shore manufacturing plants remains a majorfactor. They are also consistent with the notion thatfirms are increasingly engaging in small scale activi-ties to monitor and scan new technological develop-ments in centres of excellence in foreign countrieswithin their areas of existing strength. However wefind very little evidence to suggest that firms rou-tinely go abroad to compensate for their weakness athome.
Thus our findings support the analyses of earlyŽ . Ž .Vernon 1966 , Porter 1990 and the more recent
literature on the ‘national systems of innovation’Ž .Lundvall, 1992; Nelson, 1992 , in that, far frombeing irrelevant, what happens in home countries isstill very important in the creation of global techno-logical advantage for even these most internation-alised firms. Thus for policy analysis it becomesimportant to understand the nature of the country-specific factors that have an influence in creatingnational technological advantage, including the com-petitive climate, the financial system, and education,
Žtraining and basic research institutions Pavitt and.Patel, 1995 .
Finally, it also becomes important to improve ourunderstanding of the reasons why firms involved inproducing for a world market may keep most of theirtechnology production close to the home base. Two
key features related to the launching of major inno-vations may help explain the advantages of geo-graphic concentration: the involvement of inputs ofknowledge and information that are essentially ’per-son-embodied’, and a high degree of uncertaintysurrounding outputs. Both of these are best handledthrough intense and frequent personal communica-tions and rapid decision making, i.e., through geo-graphic concentration. Thus it may be most efficientfor firms to concentrate the core of their technologi-cal activities in the home base with international‘listening posts’ and small foreign laboratories foradaptive R&D.
References
Archibugi, D., Michie, J., 1995. Myths and realities of globalisa-tion of technology: a re-examination of the evidence. Cam-
Ž .bridge Journal of Economics 19 1 , 121–140.Cantwell, J., 1992. The internationalisation of technological activ-
ity and its implications for competitiveness. In: Granstrand,Ž .O., Hakanson, L., Sjolander, S. Eds. , Technology Manage-
ment and International Business: Internationalisation of R&Dand Technology, Chap. 4, Wiley, Chichester.
Cantwell, J., 1995. The globalisation of technology: what remainsof the product cycle model. Cambridge Journal of Economics
Ž .19 1 , 155–174.Chesnais, F., 1992. National systems of innovation, foreign direct
investment and the operations of multinational enterprises. In:Ž .Lundvall, B.A. Ed. , National Systems of Innovation. Pinter,
London.Dunning, J., 1992. Multinational enterprises and the globalisation
of innovatory capacity. In: Granstrand, O., Hakanson, L.,Ž .Sjolander, S. Eds. , Technology Management and Interna-
tional Business: Internationalisation of R&D and Technology.Chap. 2, Wiley, Chichester.
Dunning, J., Narula, R., 1995. The R&D Activities of foreignfirms in the United States. International Studies of Manage-
Ž .ment and Organisation 25 1–2 , 39–73.Florida, R., 1997. Foreign direct R&D investment in the United
Ž .States. Research Policy 26 1 , 85–103.Granstrand, O., Sjolander, S., 1992. Internationalisation and diver-
sification of multi-technology corporations. In: Granstrand, O.,Ž .Hakanson, L., Sjolander, S. Eds. , Technology Management
and International Business: Internationalisation of R&D andTechnology. Chap. 9, Wiley, Chichester.
Ž .Granstrand, O., Hakanson, L., Sjolander, S. Eds. , 1992. Tech-nology Management and International Business: Internationali-sation of R&D and Technology. Wiley, Chichester.
Granstrand, O., Patel, P., Pavitt, K., 1997. Multi-technology cor-porations: why they have ‘distributed’ rather than ‘distinctivecore’ competencies. California Management Review 39.

( )P. Patel, M. VegarResearch Policy 28 1999 145–155 155
Griliches, Z., 1990. Patent statistics as economic indicators. Jour-nal of Economic Literature 28, 1661–1707.
Hakanson, L., 1992. Locational determinants of foreign R&D inSwedish multinationals. In: Granstrand, O., Hakanson, L.,
Ž .Sjolander, S. Eds. , Technology Management and Interna-tional Business: Internationalisation of R&D and Technology.Chap. 5, Wiley, Chichester.
Kummerle, W., 1997. Building Effective Capabilities Abroad.Harvard Business Review, March–April, pp. 61–70.
˚ Ž .Lundvall, B-A. Ed. , 1992. National Systems of Innovation:Towards a Theory of Innovation and Interactive Learning.Pinter, London.
National Academy of Engineering, 1993. Mastering a new Role:Shaping Technology Policy for National Economic Perfor-mance. National Academy Press, Washington, DC.
National Science Board, 1996. Science and Engineering Indica-tors. National Science Foundation, Washington, DC.
Ž .Nelson, R. Ed. , 1992. National Innovation Systems: a Compara-tive Analysis. Oxford Univ. Press, New York.
OECD, 1993. Special Issue on Globalisation. OECD STI ReviewNumber 13, Dec. 1993.
OECD, 1992. Technology and the Economy: The Key Relation-ships, OECD, Paris.
Patel, P., 1995. Localised production of technology for globalŽ .markets. Cambridge Journal of Economics 19 1 , 141–154.
Patel, P., 1996. Are large firms internationalizing the generationof technology? Some new evidence. IEEE Transactions onEngineering Management 43, 41–47.
Patel, P., Pavitt, K., 1991. Large firms in the production of theworld’s technology: an important case of ‘non-globalisation’.
Ž .Journal of International Business Studies 22 1 , 1–22.Pavitt, K., Patel, P., 1995. Corporate technology strategies and
national systems of innovation. In: Pogorel, G., Allouche, J.Ž .Eds. , Technology Management in the Nineties: A Triconti-nental View, Chap. 9. Elsevier, Amsterdam.
Pearce, R., Singh, S., 1992. Globalising Research and Develop-ment. Macmillan, London.
Porter, M., 1990. The Competitive Advantage of Nations. London,Macmillan.
Vernon, R., 1966. International investment and international tradeŽ .in the product cycle. Quarterly Journal of Economics 80 2 ,
190–207.
Copyright © 2022 FDOKUMEN