Patterns in relative size differences in some major brain structures among haplorrhine primates...
14
1 Patterns in relative size differences in some major brain structures among haplorrhine primates. Brigitte Norman INTRODUCTION The relative size of the brain in human and non-human primates has been under much scrutiny in recent decades. Apart from its obvious research interest (why do humans have such large brains?), the allometric relationship between brain and body size is a fascinating field of study that has led to many different avenues of enquiry. It has revealed a number of consistent patterns, linked regularities and inter- connected factors with far reaching consequences. The greatest brain differences within the primate order have been found between the Prosimians and Anthropoids, but this survey will focus specifically on the haplorrhine primates (all anthropoid primates and Tarsius). Patterns in size variations within this group are considered in relation to the whole brain, the main structural areas (neocortex, cerebellum, midbrain), and some specialised structures (visual cortex and main olfactory bulbs). METHODS The size of the brain is highly dependent on that of the body (large animals have proportionately large brains), but the scaling of the brain relative to the body is not a linear relationship. For example, it has been consistently observed that across the mammalian order, brain size increases by a factor of 0.75 to the size of the body. That is to say, the brain to body ratio gets increasingly smaller as the animals get larger. In primates, the exponent is even smaller, between 0.66 and 0.80 depending on the species (Harvey & Krebbs 1990; Deacon 1995; 1997). This is a serious problem when straight ratios of brain to body size - encephalization quotients (EQ) - are used as a basis for inference (Passingham 1981). Regression analyses. Because of the non-linear relationship between the size of the brain to that of the body, statistical 'regression analyses', which can take into account the effect of absolute body size, are now generally used. The size of the brain for each species is plotted against each body weight along the Y and X axes respectively - the axes scale are generally logarithmically transformed to adjust the data at the large end of the spectrum. A line, describing the average derived from all the values on both axes, is fitted to give the trend for that particular group. Each point on this trendline represents the predicted Y value (brain) given a particular X value (body size). Thus, each species has either a. the same amount, b. more, or c. less brain tissue than would be expected for their body size. The amount by which they deviate from the trend (the differential) provides the basis for comparative analyses of variations in a selected group. A major problem in regression analyses is determining the best way to describe the trend, or the 'best line of fit', since different equations result in different trends. (Clutton-Brock & Harvey 1980; Martin & Barbour 1989; Harvey & Krebbs 1990). A coefficient of determination (r 2 ) is therefore included to indicate how closely the line fits the data. It compares the estimated value and actual values and ranges from 1 (perfect correlation) to 0 (no correlation). There are other problems. In the most commonly used regression method, Least-Squares, there is the assumption that Y (e.g. brain size) is dependent on X (e.g. body size), and that X was measured without error. But, Martin & Barbour (1989:67) observe, "in any biological context, it is usually difficult to argue for a direct dependence of Y upon X, especially when interspecific allometric relationships are involved". The size of animal bodies is not necessarily an absolute value since it is subject to a number of factors, all of which can differ from individual to individual within a given species. Furthermore, differential values ought to reflect potential measurement errors such as can occur in both variables (Clutton-Brock & Harvey 1980; Martin & Barbour 1989; Harvey & Krebbs 1990; Ebert & Russel 1994; Steele 1996). There are statistical methods which take into consideration basic relationships between variables and potential errors in both axes. The best and most commonly used are the Reduced Major Axis, and Major Axis approaches(Clutton-Brock & Harvey 1980; Martin & Barbour 1989; Harvey & Krebbs 1990; Ebert & Russel 1994; Steele 1996). However, these are not as easily derived as the Least-Squares regression. So, for the purpose of this preliminary analysis, because of its greater ease of calculation the Least-Squares method has been used instead. Source data. All the data used in these analyses are derived from Stephan et al. (1981), additional data have not been incorporated. There are two reasons for this. Firstly, this is the most complete data set in the primate literature, having 41 variables (not including body and total brain measures). These data have been measured for a total number of 76 species, including 48 primates species, including Homo (although some structures have not been measured for all the species). Secondly, the data were measured by the researchers themselves. They explain how, and under what conditions the measurements were made. Information from other sources would not have been derived in comparable circumstances, thereby introducing an unnecessary bias. Although no biological measures can be taken as absolute, the use of this single data set has, at least, the advantage of consistency. Because, phylogenetic patterns are looked for, the data has been adapted from species to genus. However, only two genera (Saguinus and Cercopithecus)
Transcript of Patterns in relative size differences in some major brain structures among haplorrhine primates...
1
Patterns in relative size
differences in some major brain
structures among haplorrhine
primates.
Brigitte Norman
INTRODUCTION
The relative size of the brain in human and non-human
primates has been under much scrutiny in recent
decades. Apart from its obvious research interest (why
do humans have such large brains?), the allometric
relationship between brain and body size is a
fascinating field of study that has led to many different
avenues of enquiry. It has revealed a number of
consistent patterns, linked regularities and inter-
connected factors with far reaching consequences.
The greatest brain differences within the primate order
have been found between the Prosimians and
Anthropoids, but this survey will focus specifically on
the haplorrhine primates (all anthropoid primates and
Tarsius). Patterns in size variations within this group
are considered in relation to the whole brain, the main
structural areas (neocortex, cerebellum, midbrain), and
some specialised structures (visual cortex and main
olfactory bulbs).
METHODS
The size of the brain is highly dependent on that of the
body (large animals have proportionately large brains),
but the scaling of the brain relative to the body is not a
linear relationship. For example, it has been
consistently observed that across the mammalian order,
brain size increases by a factor of 0.75 to the size of
the body. That is to say, the brain to body ratio gets
increasingly smaller as the animals get larger. In
primates, the exponent is even smaller, between 0.66
and 0.80 depending on the species (Harvey & Krebbs
1990; Deacon 1995; 1997). This is a serious problem
when straight ratios of brain to body size -
encephalization quotients (EQ) - are used as a basis for
inference (Passingham 1981).
Regression analyses. Because of the non-linear
relationship between the size of the brain to that of the
body, statistical 'regression analyses', which can take
into account the effect of absolute body size, are now
generally used. The size of the brain for each species is
plotted against each body weight along the Y and X
axes respectively - the axes scale are generally
logarithmically transformed to adjust the data at the
large end of the spectrum. A line, describing the
average derived from all the values on both axes, is
fitted to give the trend for that particular group. Each
point on this trendline represents the predicted Y value
(brain) given a particular X value (body size). Thus,
each species has either a. the same amount, b. more, or
c. less brain tissue than would be expected for their
body size. The amount by which they deviate from the
trend (the differential) provides the basis for
comparative analyses of variations in a selected group.
A major problem in regression analyses is determining
the best way to describe the trend, or the 'best line of
fit', since different equations result in different trends.
(Clutton-Brock & Harvey 1980; Martin & Barbour
1989; Harvey & Krebbs 1990). A coefficient of
determination (r2) is therefore included to indicate how
closely the line fits the data. It compares the estimated
value and actual values and ranges from 1 (perfect
correlation) to 0 (no correlation).
There are other problems. In the most commonly used
regression method, Least-Squares, there is the
assumption that Y (e.g. brain size) is dependent on X
(e.g. body size), and that X was measured without
error. But, Martin & Barbour (1989:67) observe, "in
any biological context, it is usually difficult to argue
for a direct dependence of Y upon X, especially when
interspecific allometric relationships are involved".
The size of animal bodies is not necessarily an absolute
value since it is subject to a number of factors, all of
which can differ from individual to individual within a
given species. Furthermore, differential values ought to
reflect potential measurement errors such as can occur
in both variables (Clutton-Brock & Harvey 1980;
Martin & Barbour 1989; Harvey & Krebbs 1990; Ebert
& Russel 1994; Steele 1996).
There are statistical methods which take into
consideration basic relationships between variables and
potential errors in both axes. The best and most
commonly used are the Reduced Major Axis, and
Major Axis approaches(Clutton-Brock & Harvey 1980;
Martin & Barbour 1989; Harvey & Krebbs 1990; Ebert
& Russel 1994; Steele 1996). However, these are not
as easily derived as the Least-Squares regression. So,
for the purpose of this preliminary analysis, because of
its greater ease of calculation the Least-Squares
method has been used instead.
Source data. All the data used in these analyses are
derived from Stephan et al. (1981), additional data
have not been incorporated. There are two reasons for
this. Firstly, this is the most complete data set in the
primate literature, having 41 variables (not including
body and total brain measures). These data have been
measured for a total number of 76 species, including
48 primates species, including Homo (although some
structures have not been measured for all the species).
Secondly, the data were measured by the researchers
themselves. They explain how, and under what
conditions the measurements were made. Information
from other sources would not have been derived in
comparable circumstances, thereby introducing an
unnecessary bias. Although no biological measures can
be taken as absolute, the use of this single data set has,
at least, the advantage of consistency.
Because, phylogenetic patterns are looked for, the data
has been adapted from species to genus. However,
only two genera (Saguinus and Cercopithecus)
2
consisted of more than one species, so, the information
is also essentially valid at species level, but reduces the
value of phylogenetic inferences. The summary table
(see appendix) lists the genera involved, together with
their common names, phylogenetic grouping, and
influential characteristics.
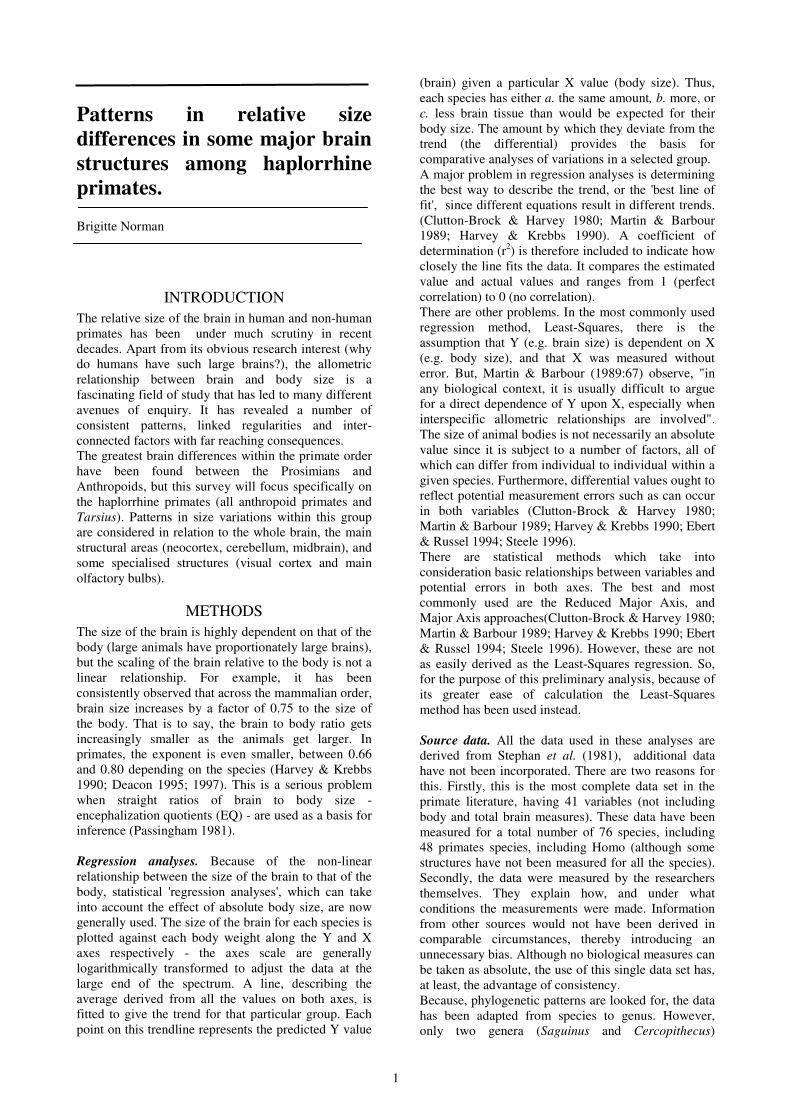
N.B. The body weight measurement for Lagothrix was increased
from 5,200 g to 7,300 g., as all other published data indicate that
this genus is much larger (data from Smith & Jungers 1997).
TOTAL BRAIN SIZE
There is a growing body of literature dealing with the
allometric relationships between brain and body size in
primates and other mammal orders. The reason why
this relationship is so scrutinised is, of course, that
primate brains are proportionately larger than in most
other mammals, and larger in humans than would be
expected in primates of a similar size.
Different authors have considered a whole range of
factors which appear determinant or influential in the
relatively large size of primate brains. Primates’
special visual and manual abilities have been a major
focus of research. But a whole range of other factors
appear to be involved, although in what degrees is
difficult to determine. They include the energetics of
dietary quality and metabolic rate (Clutton-Brock &
Harvey 1980; Aiello & Wheeler 1995); cognitively
complex foraging (Gibson 1986), activity timing,
vertical distribution, home range size, mating systems
(Clutton-Brock & Harvey 1980), social complexity
(Aiello & Dunbar 1993; Dunbar 1995); life history
parameters (Harvey et al. 1987; Harvey & Krebbs
1990). Alternatively, as Deacon argues (1997), it may
also be that primates do not have especially enlarged
brains, but instead evolved relatively smaller bodies.
Total brain weight to body weight. A regression plot
of the haplorrhine taxa included in Stephan et al.
(Figure 1.0), shows that Homo, Erythrocebus,
Miopithecus, Cebus and Saimiri are significantly above
the predicted average for their body size. In contrast,
Gorilla, Nasalis and Alouatta are less encephalized.
Except for Papio and Tarsius, all the genera that have
noticeably smaller brains are classed as folivorous, and
all except Gorilla are non-extractive foragers. In
contrast, apart for Pithecia and Miopithecus, all the
significantly above-average taxa are either
omnivorous, extractive foragers, or both. Although
Miopithecus has been classed as neither, its dietary
quality (262.5) is in the same range as that of Cebus
(266) and Saimiri (284) (Sailer et al. 1985). It appears,
therefore, that ecological adaptations (diet and
foraging complexity) play a significant role in the
overall relative size of the brain, but there are
exceptions to this trend.
Despite an extremely high quality diet (335) Tarsius'
small brain can be related to the fact that the brains of
insectivores are smaller than animals that include a
proportion fruit in their diet This is consistently the
case in all mammalian orders (Clutton-Brock &
Harvey 1980; Harvey et al. 1987).
3
There are two contradictions to the ecological trend.
Pithecia is a non-extractive forager and has a dietary
quality of 197.5, very close to Papio (198.6) which is
omnivorous and an extractive forager. Yet the former
has an above-average, and the latter a below-average,
brain size. So either there is some error in the data or
other factors are also involved.
In terms of phylogenetic patterns, all the New World
genera except for Alouatta are very close to the
predicted brain size or are above it. In contrast, the Old
World primates show more variation: 6 out 14 are well
below-average, 5 are close to the mean, and 3 above-
average. So, in this particular sample of Haplorrhines,
the New World Monkeys, as a group, have above-
average brain sizes relative to body weights.
Total brain measurements, however, cannot reveal any
of the structural changes that occur within the brain
itself.
Vertebrate brain evolution. Like the human brain, all
vertebrate brains are subdivided into three main areas:
the hindbrain, midbrain, and forebrain. But the relative
development of these areas and their constituent parts
vary widely across the evolutionary scale.
In early vertebrates, the sense of smell is most
important and their brains have extremely large
olfactory tracts. In fish the cerebrum is very small
being, essentially, a processing centre for input from
the senses. The cerebrum becomes more important
among amphibians and reptiles. In birds, smell is far
less important than vision, so they have small olfactory
tracts but highly enlarged optic lobes which have
further increased the size of the cerebrum. In
mammals, because of their increased cognitive
abilities, the cortical areas have become increasingly
important. In primates, the cerebrum is so much larger,
that it dominates the rest of the brain (Wooldridge
1963; Passingham 1981; Deacon 1995, 1997).
Thus, the cerebrum (overlaid by the neocortex), is the
largest of the three main brain areas in mammals,
primates and, in particular, humans. The other two
being the brainstem, in the lower centre (connecting
the cerebrum to the spinal cord), and the cerebellum at
the lower back of the brain (connecting to both the
brainstem and the neocortex). Variations in the relative
size of each these areas can, therefore, affect the
overall size the brain. However, the brain cannot
increase indefinitely, its relative growth is ultimately
limited by its body size. So, enlargements in certain
areas of the brain are generally accompanied by
reductions in other areas. These relative changes are
indicative of functional shifts within the brain and,
therefore, more informative than size measurements
(Deacon 1997).
NEOCORTEX
The greater size of primate brains is primarily due to
the enlargement of the neocortex. The neocortex is the
part of the cerebral cortex that is unique to mammals
because it is the most recently evolved part of the
brain, where the higher thought-functions are located
(Wooldridge 1963; Passingham 1981; Deacon 1995,
1997). Because the neocortex overlies the cerebral
hemisphere and is made up of deep, convoluted folds,
4
it has been responsible for the greater part of primates’
brain expansion in evolutionary time.
In primates and humans the relative size of the
neocortex has been linked specifically to social group
size (i.e. social complexity), cognitively complex
foraging (Gibson 1986; Aiello & Dunbar 1993) and to
life history variables such as life span and the length of
the juvenile period (Joffe 1997).
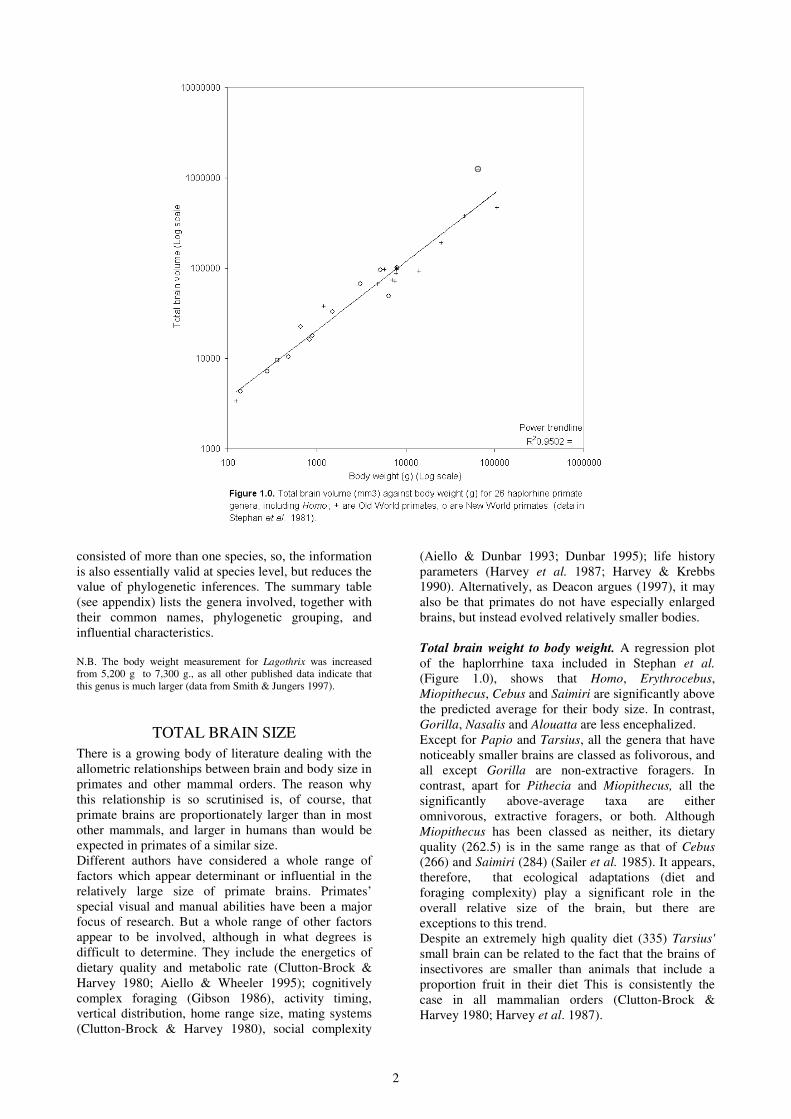
The size of the neocortex has been observed to
increase with the size of the brain. As Passingham
(1981) comments, "the neocortex forms a smaller
percentage of the total brain in prosimians than in other
primates, and in monkeys than in apes. In general, the
proportion of neocortex to total brain increases in
primates as brain size increases". Figure 2.0 describes
this trend among the Haplorrhines and shows a very
strong correlation between the two (r2 = 0.9934).
Neocortex volume against rest of the brain. If the size
of the neocortex is highly correlated to the overall size
of the brain, one should expect to see a similar
distribution to the one in Figure 1.0. Overall, 13 out of
26 genera are above the average. Of these,
Erythrocebus, Macaca, Miopithecus and Saimiri are
measurably above the line. Homo, Pan, Papio, Cebus,
Cercopithecus and all the Callitrichines are also above-
average but much closer to the mean. Thus, although
above-average, Homo does not have a particular large
neocortex size for the size of its brain.
All the other taxa are either average or just below it,
except for Gorilla and Tarsius which are more
markedly so. The latter's deviation could be related to
the general prosimian trend mentioned above and to a
characteristic of insectivores. However, despite a
smaller overall brain size, as apes, the Gorilla should
have more neocortex than they exhibit.
Many of the genera that are above the predicted
average are predominantly omnivorous and, to a lesser
extent frugivorous, (high-quality diets), while all the
average taxa are folivorous and/or frugivorous. All
those that fall below the average (except Tarsius) are
almost exclusively folivorous (low-quality diets).
There is also a degree of correlation with foraging
strategies, as the vast majority of extractive foragers
are over the average; one, Lagothrix, is average, and
one, Gorilla, is below.
Vertical distribution is another characteristic which
could be linked to this trend, as the genera that exhibit
a greater degree of terrestriality have, in the great
majority of cases, larger than predicted neocortex, or
(as in Colobus) are average. Again, only Gorilla
(terrestrial) have a smaller neocortex size.

5
In terms of taxonomic groups, the primates that
conform to the predicted size of the neocortex are:
The lesser apes
Lophocebus
All the Colobines (except Pygathrix)
All the Atelines
The primates that are above the predicted value are:
The Hominoids (except Gorilla)
All the Cercopithecines (except Lophocebus)
All the Cebides (except Alouatta)
All the Callitrichines
The primates that are most significantly below
predicted size are:
Gorilla
Pygathrix
Alouatta
Tarsius
From these lists it can be seen that among these
Haplorrhines the overall trend is for average to above-
average neocortex sizes and that most related genera
share a particular tendency either to the average or
above-average. In contrast, all the significantly below-
average taxa are lone representatives of their greater
phylogenetic group and therefore appear as exceptions.
They are 2 Catarrhines, 1 Platyrrhine, and 1 Prosimian.
They are also the same genera that, for ecological
reasons, had smaller overall brain sizes.
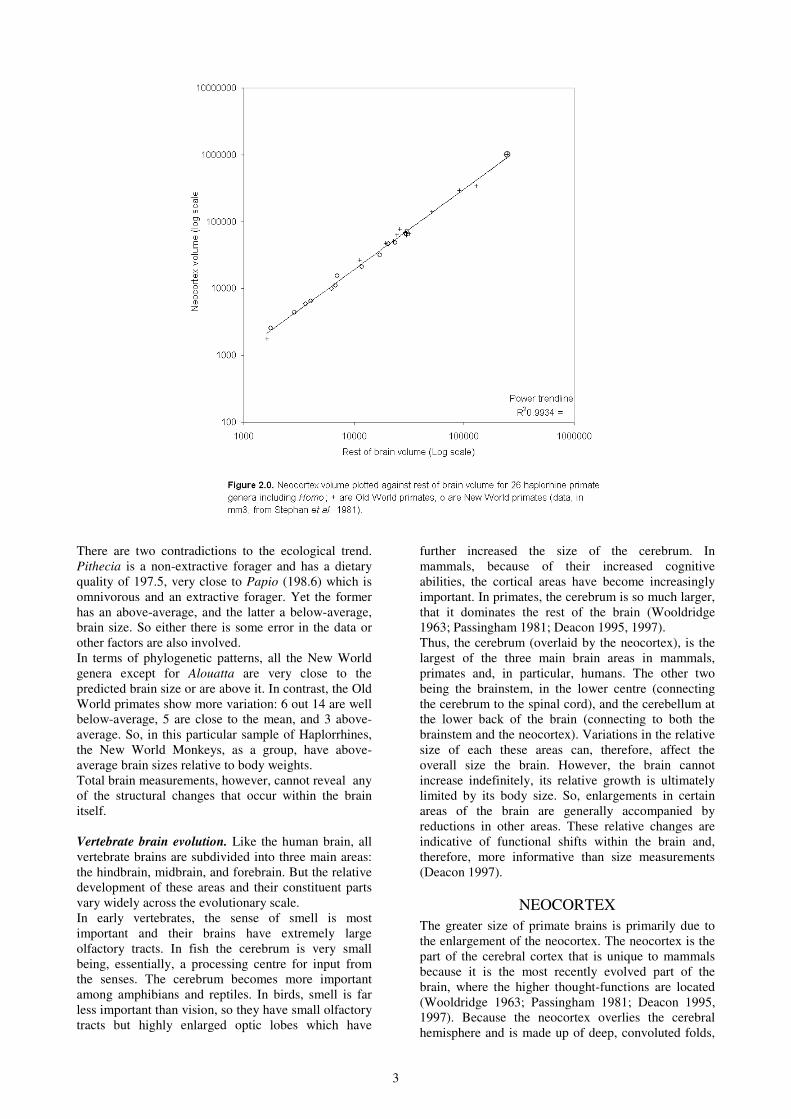
Neocortex ratio against body weight. Figure 2.1 shows
the neocortex ratios plotted against body weight. The
coefficient of determination has dropped to 0.7374,
indicating a greater range of variation from the
predicted values. At first glance, the obvious pattern to
emerge is that the Callitrichines are very close to the
predicted average; either on the line or just above. The
larger New World taxa are predominantly below, with
Alouatta significantly below-average. The highest is
Ateles which sits on the line. But the two Cebines,
Cebus and Saimiri are exceptions, as they are well
above-average, especially the latter. These patterns are
consistent with the trend in overall brain to body size,
discussed above, with one exception being Pithecia,
which is well above average in total brain size but
slightly below-average in neocortex volume in relation
to the rest of the brain.
Among the Old World, all the Cercopithecines have
significantly more neocortex in relation to their body
size (excpet for Papio which is on the line), but they
vary in the degree. The folivorous apes (Hylobates and
Gorilla) are below-average, notably Gorilla. Pan has
more and Homo drematically more neocortex than
predicted for itheir body sizes.
The broad pattern of variations in the relative size of
the neocortex indicates that, as phylogenetic groups,
the New World primates are more homogenous than
the Old World, and the Old World species display
more variations. This has also been commented upon
in relation to their respective ecological and
morphological adaptations and has much to do with the
greater variety of environmental niches available in the
6
Old World and the long isolation of the South
American species during their 30 million years of
independent (and at times convergent) evolution
(Napier & Napier 1986; Fleagle 1988).
The distribution of Old World taxa shows the same
trend discussed above: omnivorous and/or extractive
foragers have higher than average neocortex size
(Miopithecus, Erythrocebus, Macaca, Pan and Homo).
Again, Papio is average for a primate of this size. So
the reason why it has a smaller brain size than
expected must be looked for elsewhere.
In conclusion, there is a high correlation between
neocortex size and overall brain size. Deviations from
the mean appear related to ecological adaptations:
dietary quality, foraging strategy and vertical
distribution, rather than to phylogenetically derived
differences between Old World and New World
species. Within taxonomic families and sub-families
there are consistent trends. However, these may be due
to the similar nature of the generic adaptations, which
may be phylogenetically derived traits representing
general tendencies within the groups. Generic and
species variations occur in most families, and in these
cases, neocortex variation is accounted for by
ecological factors.
There are, however, two exceptional cases Tarsius and
Gorilla. The former is the more easily accounted
because it is both nocturnal and insectivorous. Gorilla,
on the other hand appears to defy all the trends.
We need, therefore, to look at other brain structures
which may account for the peculiarities exhibited by
some species, notably Pithecia's above-average brain
size and below-average neocortex size, Papio's smaller
than predicted brain size, but average, neocortex size
and Gorilla’s smaller brain and neocortex sizes.
CEREBELLUM
After the neocortex the cerebellum is the second
largest area in the human brain. It is the principal
component of the hindbrain. As in the cerebrum the
cerebellum is divided into two hemispheres. This
structure is older, in evolutionary terms, than the
neocortex. It is particularly well developed in higher
vertebrates and in humans still largely retains the
functions it does in other animals. The cerebellum is
the centre for the coordination of skilled muscular
movements, such as locomotion and the maintenance
of posture and balance (Wooldridge 1963; A.B.T.A.
1991; Deacon 1997). However, in humans the
cerebellum is also closely connected to the neocortex
and involved in learning abilities (Passingham 1981;
Deacon 1997). Because of its evolutionary importance,
the size of the cerebellum may be a significant factor
in the overall brain size of other primates.
7
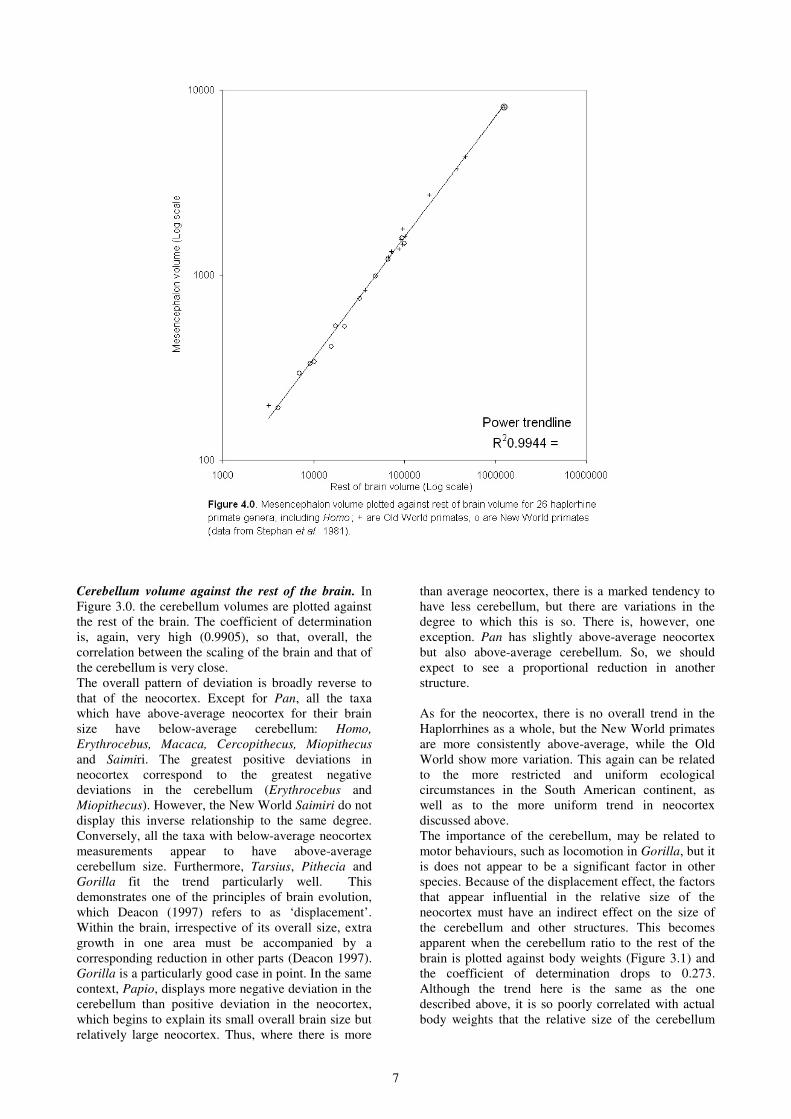
Cerebellum volume against the rest of the brain. In
Figure 3.0. the cerebellum volumes are plotted against
the rest of the brain. The coefficient of determination
is, again, very high (0.9905), so that, overall, the
correlation between the scaling of the brain and that of
the cerebellum is very close.
The overall pattern of deviation is broadly reverse to
that of the neocortex. Except for Pan, all the taxa
which have above-average neocortex for their brain
size have below-average cerebellum: Homo,
Erythrocebus, Macaca, Cercopithecus, Miopithecus
and Saimiri. The greatest positive deviations in
neocortex correspond to the greatest negative
deviations in the cerebellum (Erythrocebus and
Miopithecus). However, the New World Saimiri do not
display this inverse relationship to the same degree.
Conversely, all the taxa with below-average neocortex
measurements appear to have above-average
cerebellum size. Furthermore, Tarsius, Pithecia and
Gorilla fit the trend particularly well. This
demonstrates one of the principles of brain evolution,
which Deacon (1997) refers to as ‘displacement’.
Within the brain, irrespective of its overall size, extra
growth in one area must be accompanied by a
corresponding reduction in other parts (Deacon 1997).
Gorilla is a particularly good case in point. In the same
context, Papio, displays more negative deviation in the
cerebellum than positive deviation in the neocortex,
which begins to explain its small overall brain size but
relatively large neocortex. Thus, where there is more
than average neocortex, there is a marked tendency to
have less cerebellum, but there are variations in the
degree to which this is so. There is, however, one
exception. Pan has slightly above-average neocortex
but also above-average cerebellum. So, we should
expect to see a proportional reduction in another
structure.
As for the neocortex, there is no overall trend in the
Haplorrhines as a whole, but the New World primates
are more consistently above-average, while the Old
World show more variation. This again can be related
to the more restricted and uniform ecological
circumstances in the South American continent, as
well as to the more uniform trend in neocortex
discussed above.
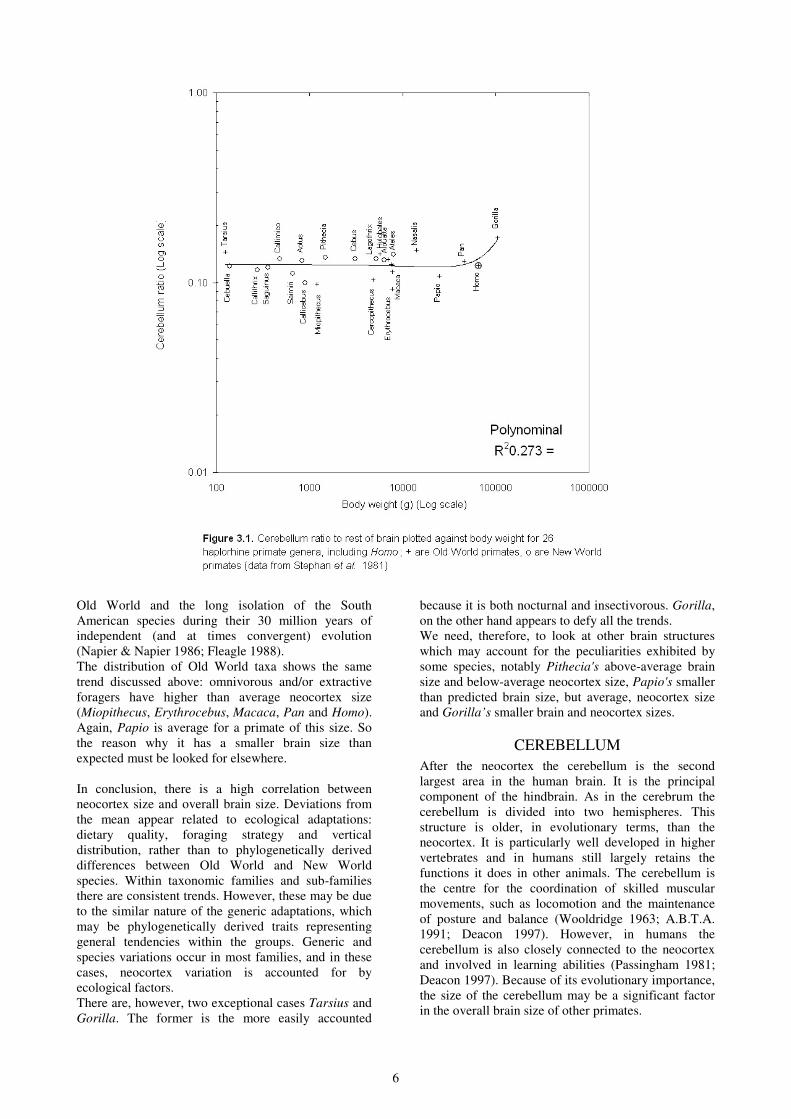
The importance of the cerebellum, may be related to
motor behaviours, such as locomotion in Gorilla, but it
is does not appear to be a significant factor in other
species. Because of the displacement effect, the factors
that appear influential in the relative size of the
neocortex must have an indirect effect on the size of
the cerebellum and other structures. This becomes
apparent when the cerebellum ratio to the rest of the
brain is plotted against body weights (Figure 3.1) and
the coefficient of determination drops to 0.273.
Although the trend here is the same as the one
described above, it is so poorly correlated with actual
body weights that the relative size of the cerebellum

8
does not appear particularly influenced by the size of
the body as such.
MESENCEPHALON
The third major area of the brain, the midbrain
(mesencephalon), is a particularly important area in
primates. It acts as the relay centre for the senses input
to the cerebral hemispheres and contains, for instance,
the origins of the 3rd and 4th cranial nerves
responsible for eye movements (A.B.T.A. 1991). As
Deacon explains (1997:230), "the midbrain is the first
point, ascending from the spinal cord, where the long-
distance senses, vision and hearing, are integrated with
information about touch and movement". The input for
these senses (eyes and ears) are located in the head.
The midbrain is also related to primate vocalisations,
which are an important part of their behaviours, and in
humans has developed into full-scale language. In
many vertebrates, the midbrain is specifically involved
in the automatic expression of arousal and emotional
states. In primates, many emotional states are
expressed vocally, and involve both oral and
respiratory control. The automatic regulation of these
actions occurs in the midbrain (Deacon 1995; 1997).
Midbrain volume against rest of the brain. Figure 4.0
reveals a very close correlation between the size of the
midbrain to that of the overall size of the brain (r2 =
0.9944). Strong positive deviations occur only in
Papio , Lophocebus and Tarsius, and to much lesser
extent in Procolobus, Pygathrix, Lagothrix, Cebus and
Callicebus. Negative deviations are only evident in
Saimiri and Aotus and to a lesser extent in Hylobates,
Macaca, Ateles, and Callimico.
The marked increase in midbrain areas in Papio, is
consistent with the reduced importance of the
cerebellum. Lophocebus, on the other hand, is
otherwise average in overall brain, neocortex and
cerebellum size. This is, therefore, a departure which
should have a correspondence in the reduction of one
or other areas. For Tarsius, there is a marked negative
deviation from the mean in neocortex size. This is
partly accounted for by an above-average cerebellum
size and by significantly larger midbrain areas.
The Macaca deviation is particularly interesting, as the
macaques are well known to have particularly
sophisticated visual and vocal communicative
behaviours; both in terms of output (calls and facial
expressions) and in the processing of this information.
This slight reduction, in the midbrain areas, suggests
that the control of these functions may have been
slightly shifted to other areas of the brain. Indeed, there
is much evidence to suggest that several non-human
primate species have specialised cortical areas for the
processing of species-specific auditory information and
the macaques are one of the best examples. Several
studies have also revealed that, not only are they adept
at social sound recognition (communicative calls), but
9
that, like humans, they process this information in the
left cerebral hemisphere (Zimmermann 1995; Deacon
1995)
A similar process may be responsible for Saimiri’s
much more pronounced negative deviation in midbrain
areas. As in Macaca, this suggests a more ‘conscious’
level of sound information processing. In Saimiri
sciureus (the species which supplies the measures used
in this analysis), Zimmermann explains, “the same
subcortical areas of the brain are involved in the motor
control of the production of certain sounds in this
highly vocal primates species as in humans”
(1995:126).
The strong negative deviation in Aotus may also be
related to specific and specialised vocal
communication requirements in this nocturnal species,
such as the importance of individual call patterns for
mate attraction and recognition at long-distance, and
for maintaining spacing between non-group individuals
(they live in monogamous groups) (Zimmermann
1995).
In contrast, Tarsius, which is also nocturnal but does
not live in groups, does not require more sophisticated
auditory mechanisms.
Mesencephalon ratio against body weight. The ratio
of midbrain to total brain volume is strongly correlated
with bodyweights (r2 = 0.9134). Figure 4.1 shows that
this trend, however, is a negative one. The larger the
body the smaller the ratio. This slope may be related to
the midbrain function as a relay station for input from
the long-range senses. As Deacon (1997:211)explains, The eyes, for example, are not proportionally larger
in large animals, in fact, they get proportionally
smaller as the body increases in size. Eyes are
therefore negatively allometric with body size, and
their corresponding projections in the brain are
proportionally reduced in larger animals.
BULBUS OLFACTORIUS
The olfactory bulbs which relay smell information are
extensions of the primitive cortex present in all
vertebrates and they have dramatically changed in size
during the course of vertebrate evolution. The shift to a
diurnal lifestyle in anthropoid primates has resulted in
the greater importance and specialisation of the visual
apparatus, and in a reduction in the sense of smell. All
diurnal species (including the prosimians) have smaller
olfactory bulbs than nocturnal. All haplorrhine
primates have smaller olfactory bulbs than the
prosimians and have lost the rhinarium (damp nasal
skin). And, of all the primate species, humans have the
smallest olfactory bulbs (Deacon 1995:114).
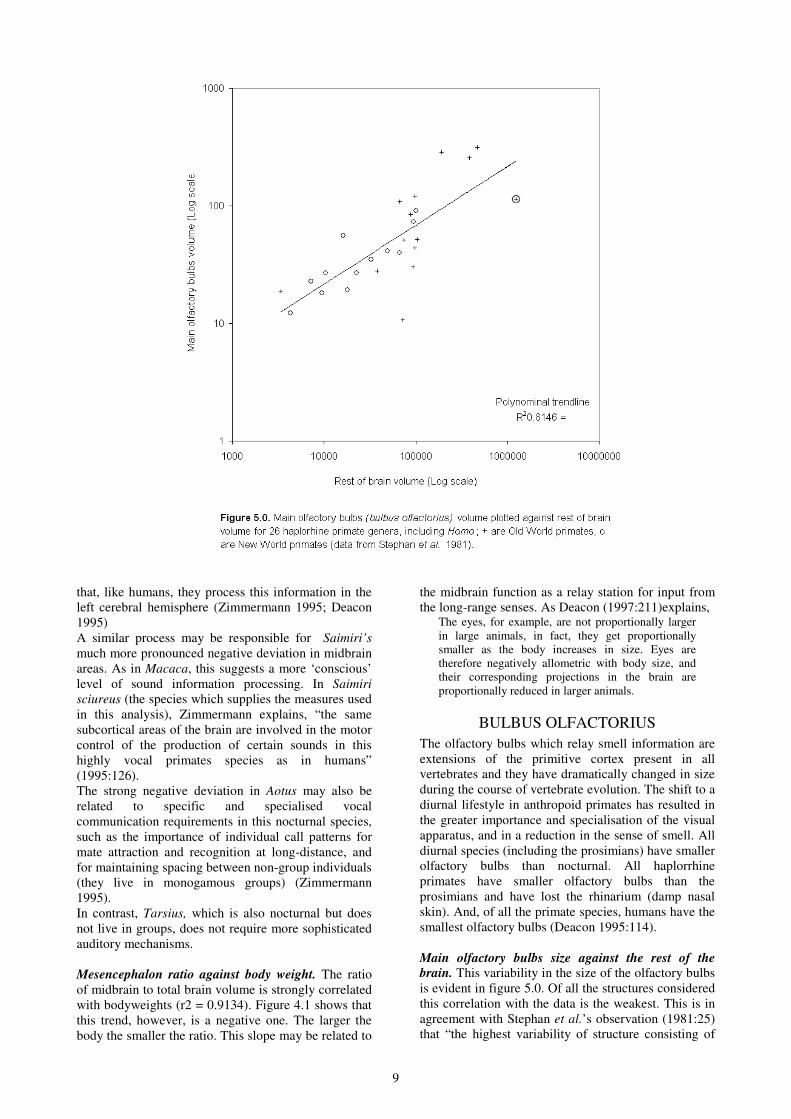
Main olfactory bulbs size against the rest of the
brain. This variability in the size of the olfactory bulbs
is evident in figure 5.0. Of all the structures considered
this correlation with the data is the weakest. This is in
agreement with Stephan et al.’s observation (1981:25)
that “the highest variability of structure consisting of

10
true brain tissue is found in the olfactory bulbs (main
and accessory bulbs).” But this variability has led to an
analytical problem. When a polynomial trendline is
used the coefficient of determination is 0.8146, with a
power trendline it drops to 0.588. Thus, the former fits
the data better but appears to ‘accommodate’, or else
deviate strongly in favour of Homo. Because power
trendlines were used in all the other analyses of
structure size in relation to the rest of the brain, it will
be used here too. Incidentally, when the same graph is
plotted without Homo, the coefficient of determination
increases to 0.6094, but the general pattern remains
essentially the same.
The greatest deviations occur negatively in Pygathrix,
Nasalis and Homo, and positively in Tarsius, Aotus,
Cercopithecus, Hylobates, Papio, Pan and Gorilla.
Except for Hylobates, the negative deviations occur in
all the folivorous species, but some omnivores also
have smaller olfactory bulbs (Cebus, Miopithecus,
Erythrocebus, Lophocebus, Homo). The other
omnivores are above-average. Except for Homo, all
extractive foragers are above the line. Thus, diet is less
clearly a factor a factor, while complex foraging result
in greater sizes in the olfactory bulbs in relation to the
size of the brain.
In terms of phylogenetic patterns, The New World taxa
are tend to be grouped below the line. Exceptions are
Ateles and Lagothrix, which are the two heaviest in
this group, and Lagothrix is extractive. The New
World exception is Aotus, which also nocturnal
therefore requiring a more developed sense of smell.
The small-bodied Callithrix and Callimico are also
above-average, but less significantly so.
The Old World taxa do not follow as clear a pattern.
The nocturnal Tarsius is clearly above-average, which
is expected. All the Colobines have small olfactory
bulbs, ecpecially Pygathrix, and Nasalis, but Colobus
is closer to the mean. The Cercopithecines range from
well below the line (Miopithecus, Lophocebus,
Erythrocebus), to well above it (Papio, Cercopithecus
and Macaca). All the apes, however are well over the
average, especially Gorilla.. Homo deviates from the
Hominoid pattern and has extremely small olfactory
bulbs in relation to brain size.
Main olfactory bulbs ratio against body weights.
When the ratios of main olfactory bulbs are plotted
against body weights (Figure 5.1.), again the
correlation is weak (r2 = 0.5114) but is shows a an
overall reduction trend as body sizes increase.
Essentially the pattern of deviation is the same as
above. But their are slight differences. Except for some
Saguinus, Alouatta and Ateles, all the New World
genera fall below the line, and all the folivorous Old
World taxa, including Hylobates, are below-average.
Lophocebus is now above-average.
The overall trend indicates that except for Homo, all
the larger-bodied species (Atelines, Cercopithecines
and great apes) have larger ratios to body weights than
the mean.
11
AREA STRIATA
If the neocortex is the most important part of primate
brains, the primary visual cortex, (area striata, striate
cortex, V1 or Area 17) is most developed in primates
in comparison to other mammals.
The brain areas most liable to change in size are the
sensory and motor regions of the cortex because, as
Deacon comments, they are "among the most
appropriate in size to their peripheral connections and
the most reduced with respect to typical predictions for
brain size”.
All primates have sophisticated stereoscopic vision.
This feature appears ancestral to all and probably
developed as an adaptation to nocturnal life, as it has in
other mammals (e.g. owls, bats and cats). However, the
processing of that information lies in the superior
collicus of the brainstem, not in the cortex itself
(Deacon 1995). The visual cortical areas of primate
brains, however, have become of greater importance
because they process colour information, which is rare
in mammals, but common to all anthropoid primates
except for the nocturnal Aotus. This ability to see a
whole range of colours is an adaptation to the diurnal
lifestyle adopted by the 'higher' primates. Unlike 3-
dimentional vision, the processing of colour
information is located in the cerebral cortex.
However, all visual analysis is not located in any one
cortical area. Instead the retina has correspondences in
multiple visual areas outside of the primary visual
cortex (Zeki 1993). As Deacon observes (1995:113), The primate visual cortices are the most complex
visual-processing system ever evolved. Nearly half
the cerebral cortex in macaques is directly involved
in visual processing and there are around two dozen
cortical visual areas in its brain, each receiving and
analysing different aspects of the visual world.
One of the principal functions of the primary visual
cortex is to process colour and pattern information and
to relay it to other cortical areas, but it does not appear
directly involved in visual learning (Zeki 1993;
Deacon 1995).
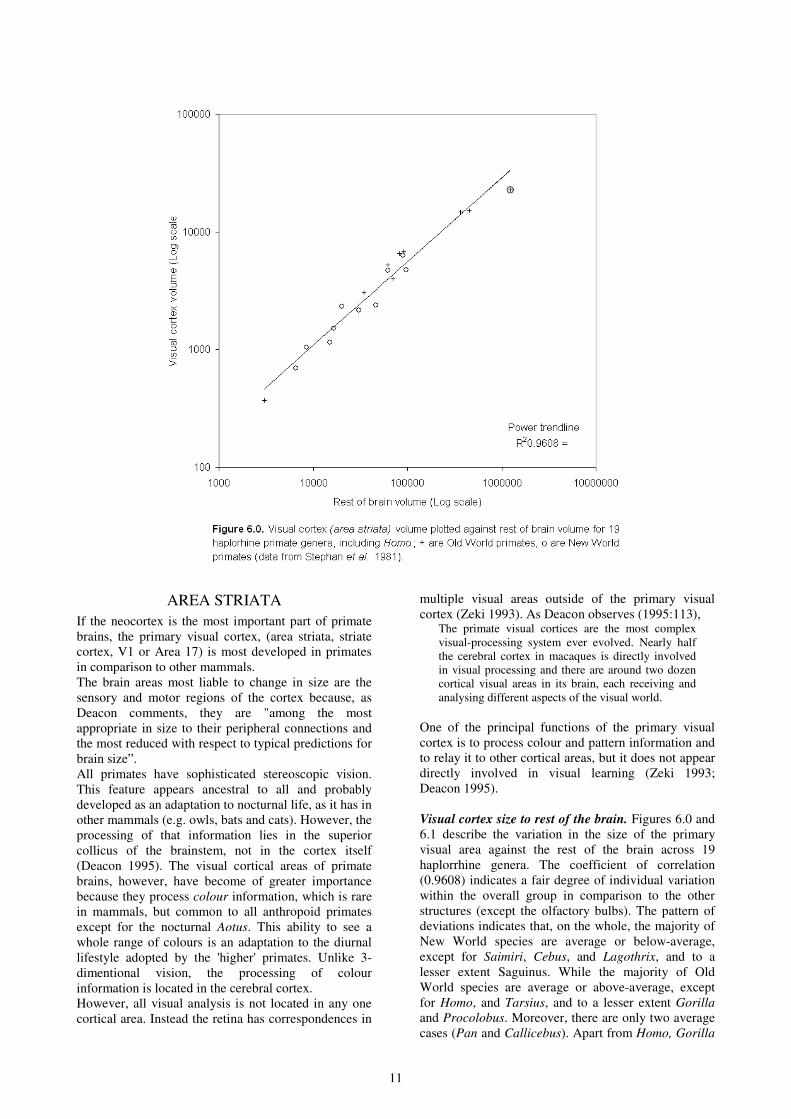
Visual cortex size to rest of the brain. Figures 6.0 and
6.1 describe the variation in the size of the primary
visual area against the rest of the brain across 19
haplorrhine genera. The coefficient of correlation
(0.9608) indicates a fair degree of individual variation
within the overall group in comparison to the other
structures (except the olfactory bulbs). The pattern of
deviations indicates that, on the whole, the majority of
New World species are average or below-average,
except for Saimiri, Cebus, and Lagothrix, and to a
lesser extent Saguinus. While the majority of Old
World species are average or above-average, except
for Homo, and Tarsius, and to a lesser extent Gorilla
and Procolobus. Moreover, there are only two average
cases (Pan and Callicebus). Apart from Homo, Gorilla
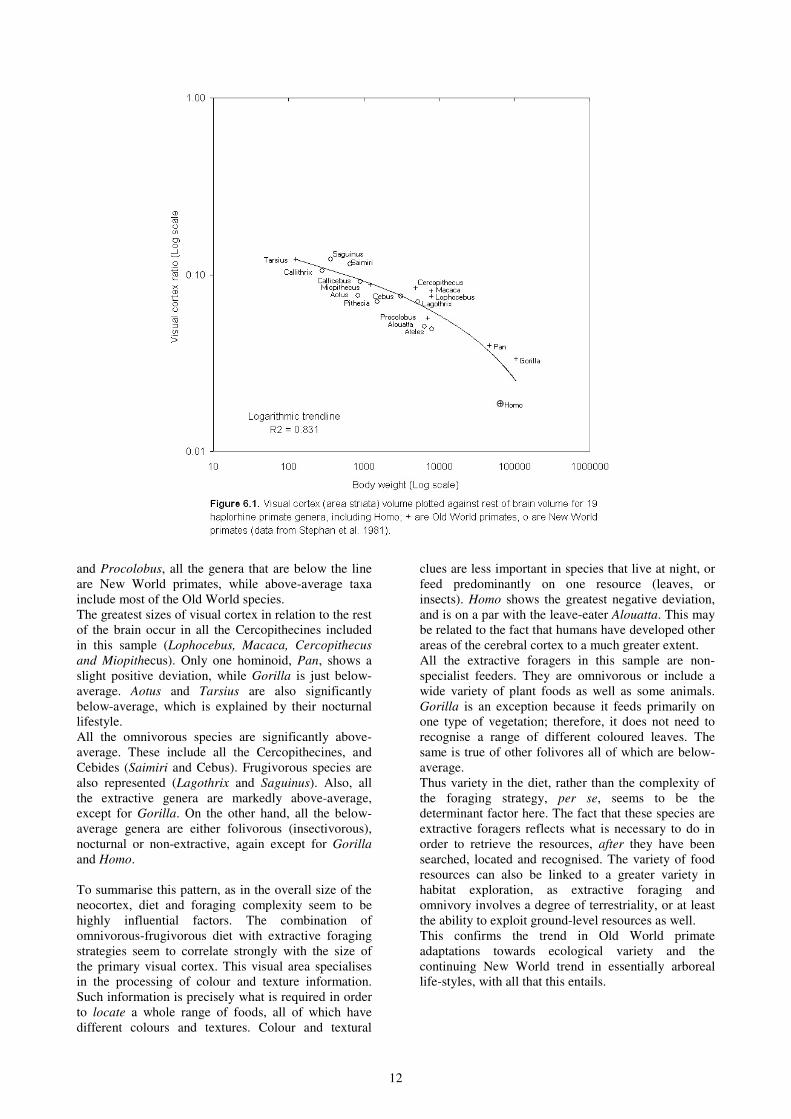
12
and Procolobus, all the genera that are below the line
are New World primates, while above-average taxa
include most of the Old World species.
The greatest sizes of visual cortex in relation to the rest
of the brain occur in all the Cercopithecines included
in this sample (Lophocebus, Macaca, Cercopithecus
and Miopithecus). Only one hominoid, Pan, shows a
slight positive deviation, while Gorilla is just below-
average. Aotus and Tarsius are also significantly
below-average, which is explained by their nocturnal
lifestyle.
All the omnivorous species are significantly above-
average. These include all the Cercopithecines, and
Cebides (Saimiri and Cebus). Frugivorous species are
also represented (Lagothrix and Saguinus). Also, all
the extractive genera are markedly above-average,
except for Gorilla. On the other hand, all the below-
average genera are either folivorous (insectivorous),
nocturnal or non-extractive, again except for Gorilla
and Homo.
To summarise this pattern, as in the overall size of the
neocortex, diet and foraging complexity seem to be
highly influential factors. The combination of
omnivorous-frugivorous diet with extractive foraging
strategies seem to correlate strongly with the size of
the primary visual cortex. This visual area specialises
in the processing of colour and texture information.
Such information is precisely what is required in order
to locate a whole range of foods, all of which have
different colours and textures. Colour and textural
clues are less important in species that live at night, or
feed predominantly on one resource (leaves, or
insects). Homo shows the greatest negative deviation,
and is on a par with the leave-eater Alouatta. This may
be related to the fact that humans have developed other
areas of the cerebral cortex to a much greater extent.
All the extractive foragers in this sample are non-
specialist feeders. They are omnivorous or include a
wide variety of plant foods as well as some animals.
Gorilla is an exception because it feeds primarily on
one type of vegetation; therefore, it does not need to
recognise a range of different coloured leaves. The
same is true of other folivores all of which are below-
average.
Thus variety in the diet, rather than the complexity of
the foraging strategy, per se, seems to be the
determinant factor here. The fact that these species are
extractive foragers reflects what is necessary to do in
order to retrieve the resources, after they have been
searched, located and recognised. The variety of food
resources can also be linked to a greater variety in
habitat exploration, as extractive foraging and
omnivory involves a degree of terrestriality, or at least
the ability to exploit ground-level resources as well.
This confirms the trend in Old World primate
adaptations towards ecological variety and the
continuing New World trend in essentially arboreal
life-styles, with all that this entails.
13
SUMMARY OF TRENDS
Overall, the poorest correlations in terms of structural
areas plotted against the rest of the brain (i.e. the
greatest range of deviations from the predicted values)
were, in decreasing order:
The main olfactory bulbs 0.8156
The visual cortex 0.9608
The cerebellum 0.9905
The neocortex 0.9934
The midbrain 0.9944
When plotted against body weights, the structures
under consideration showed much greater deviations
from the expected mean.
The cerebellum 0.273
The olfactory bulbs 0.5114
The neocortex 0.7374
The visual cortex 0.831
The midbrain 0.9134
On the whole, there does not appear to be a single
trend among the Haplorrhines, phylogeny appears less
important than ecological adaptations. But there are
some trends at family level.
The Callitrichines appear to be a homogenous group.
All are small-bodied and fit the predicted values for
brain size. In a range of brain structures they also fall
close to the mean expected for their total brain size.
Larger-bodied New World genera are more diverse
but, overall, show less variability than the Old World
primates. The Cebines Saimiri share the same patterns.
They have larger brains and neocortex ratios to the rest
of the brain than expected for their small body sizes.
Within the neocortex they have significantly more
primary visual cortex than expected for their brain size.
Both species share the same ecological characteristics.
The larger Atelines show the greatest variability,
which can be accounted for by their greater body size
and different foraging strategies; in this respect they
more closely resemble the ape patterns.
As a group the Old World genera display considerable
variation in all the structures. They are fairly equally
distributed below and above the mean predicted, but
whether they have more or less than the mean appears
dependent not on phylogeny but on environmental
adaptation.
The prosimian Tarsius is a consistent and expected
exception. It has a small overall relative brain size,
neocortex and visual neocortex ratio to brain size, but
average visual cortex relative to the body, large
cerebellum and midbrain ratios and olfactory bulbs.
The Colobines are medium-bodied and folivorous and
non-extractive; therefore they tend to have relatively
small overall brains, neocortex and visual neocortex
ratios, above-average cerebellum and midbrains, and
reduced olfactory bulbs. The Cercopithecines tend to
have above-average neocortex and visual cortex ratios,
below-average cerebellum, and average or above-
average midbrain ratios. But they display variety in the
size of the olfactory bulbs.
There is no consistent pattern among the hominoids.
Hylobates and Gorilla have very different patterns,
although both are folivorous. Hylobates in some ways
are closer to the Colobine patterns (neocortex size,
cerebellum and midbrain) except that they have larger
olfactory bulbs. Gorilla, on the other hand, displays
characteristics which are not easily accounted for by its
ecological or social circumstances. It has a very small
brain and neocortex size relative to body size, below-
average neocortex and visual neocortex ratios to the
rest of the brain, an average midbrain area, but
significantly larger than expected olfactory bulbs ratios
to the rest of the brain. But it also has the largest
cerebellum in this haplorrhine sample be it relative to
the body or the whole brain. This last feature may well
be related to another exceptional feature in Gorilla: its
enormous size, since the cerebellum is important in the
control of body movements. Pan also follows a pattern
of its own . It has an average brain size relative to its
body, slightly above-average neocortex and visual
cortex ratios to the rest of the brain (but above-average
in relation to body size), average cerebellum and
midbrain and olfactory bulbs (although the latter are
above-average in relation to body size). Homo have
very large brains for their body size and a very large
neocortex ratio in relation to body size. But when the
main constituent parts are considered within the brain,
they do have a larger neocortex, cerebellum or
midbrain than expected for their particular brain size.
However, they have less primary visual cortex and
significantly smaller olfactory bulbs than the
haplorrhine trend predicts.
These patterns might be partially explained by the
evolutionary trend in body size increase, leading to
more potential variation in behavioural adaptations.
The more homogenous groups are the most ‘archaic’
groups, and the smallest. Groups which include
relatively large primates, the Atelines and
Cercopithecines, show a higher degree of variety in
adaptive behaviours. The most varied of all, the apes,
are the largest and were also the last to evolve. Within
this trend, Homo, does not seem particular distinctive,
merely an aspect of the variety which characterises the
Old World primates, and the apes in particular.
CONCLUSION
This small survey only gives a very broad indication of
some of the trends in this selected group of primates.
However, it does show the potential in such allometric
analyses when more structures are analysed, more
refined analytical methods and a larger sample are
used.
Such investigations are also interesting when focusing
on the haplorrhine primates alone, (there is a much
greater variation when the prosimians are included)
since this group includes only the more recently
derived evolutionary characteristics in the primate
order, and the ones resulting in the most successful
adaptations.
The patterns that have emerged are often in accordance
with known trends, but not always. This may be a
consequence of using the Least Squares method, but it
may reflect specific haplorrhine trends, from which
14
humans, for instance are not especially different. The
analysis of the structural areas relative to each other
may, therefore, be more telling if functional
differences are looked for, rather than a simple analysis
of brain size relative to body weights.
REFERENCES
American Brain Tumor Association. 1991. A Primer
of brain tumors. A patient's reference manual
(5thedition). neurosurgery.mgh.harvard.edu/abata/
primer.htm
Aiello, L. & P. Wheeler. 1995. The Expensive Tissue
Hypothesis: the brain and the digestive system in
human and primate evolution. Current
Anthropology 36(2):199-221.
Ailello, L. & R.I.M. Dunbar. 1993. Neocortex size,
group size, and the evolution of language. Current
Anthropology 34:184-193.
Clutton-Brock, T.H. & P.H. Harvey. 1980. Primates,
brains and ecology. Journal of Zoology London
190:309-323.
Deacon, T.M. 1995. The human brain. In, S. Jones, R.
Martin & D. Pilbeam. The Cambridge
Encyclopedia of human evolution:115-23.
Cambridge: Cambridge University Press.
Deacon, T.W. 1997. The Symbolic Species. The co-
evolution of language and the human brain.
London: Penguin Books.
Dunbar, R.I.M. 1995. Neocortex size and group size in
primates: a test of the hypothesis. Journal of
Human evolution 28:287-296.
Ebert, T.A. & M.P.Russel. 1994. Allometry and model
II non-linear regression. Journal of Theoretical
Biology 168:367-372
Fleagle, J.C. 1988. Primate adaptation and evolution.
Academic Press, Inc. San Diego: Harcourt Brace
Jovanovich.
Gibson, K. R. 1986. Cognition, brain size and the
extraction of embedded food resources. In, J.G.
Else and P.C. Lee (eds.). Primate ontogeny,
cognition and social behaviour, pp. 93-103.
Cambridge: Cambridge University Press.
Harvey, P.H., Martin, R.D. and Clutton-Brock, T.H.
1987. Life histories in comparative perspective. In
Primate Societies. B.B. Smuts, D.L. Cheney, R.M.
Seyfarth, R.W. Wrangham and T.T. Struhsaker
(eds.). Chicago: Chicago University Press, pp. 181-
196.
Harvey, P.H. & J.R. Krebbs. 1990. Comparing brains.
Science 249:140-46.
Joffe, T.H. 1997. Social pressures have selected for an
extended juvenile period in primates. Journal of
human evolution 32:593-605.
Martin, R. D. & A.D. Barbour. 1989. Aspects of line-
fitting in bivariate allometric analyses. Folia
primatologica 53:65-81.
Napier, J.R. & P.H. Napier. 1985. The natural history
of the primates. British Museum (Natural History),
Cambridge University Press.
Passingham, R.E. 1982. The human primate. Oxford:
W.H. Freeman and Company.
Salier, L.D., S.J.C. Gaulin, J.S. Boster & J.A. Kurland.
1985. Measuring the relationship between dietary
quality and body size in primates. Primates 26(1):
14-27.
Smith, R.J. & W.L. Jungers. 1997. Body mass in
comparative primatology. Journal of Human
Evolution 32:523-559.
Steele, J.S. 1996. On predicting group sizes. In, J.S.
Steele & S. Shennan (eds.). The archaeology of
human ancestry. Power, sex and tradition, pp.230-
252. London: Routledge.
Stephan, H. H. Frahm & G. Baron. 1981. New and
revised data on volumes of brain structures in
insectivores and primates. Folia Primatologica
35:1-29.
Wooldgridge, D.E. 1963. The machinery of the brain.
New York: Hill Book Company I.N.C.
Zeki, S. 1993. A vision of the brain. Oxford:
Blackwell Scientific Publications
Zimmermann, E. ocal communication by non-human
primates. In, S. Jones, R. Martin & D. Pilbeam.
The Cambridge encyclopedia of human evolution, pp. 124-127. Cambridge: Cambridge University
Press.