PART I: - Bộ Xây dựng
199
1 PART I: VIETNAM URBAN SITUATION ASSESSMENT FOLLOWING 9 SELECTED FIELDS
-
Upload
khangminh22 -
Category
Documents
-
view
1 -
download
0
Transcript of PART I: - Bộ Xây dựng

1
PART I:
VIETNAM URBAN SITUATION
ASSESSMENT FOLLOWING
9 SELECTED FIELDS

2
TABLE OF CONTENTS
I. INTRODUCTION .............................................................................................................. 13
II. ASSESSMENT ON CURRENT SITUATION UNDER SELECTED 9 FIELDS ...... 15
2.0. Overview of Vietnam urban system ............................................................................. 15
2.0.1. Introduction to Vietnam's urban system ................................................................ 15 a) Introduction to Vietnam .......................................................................................... 15 b) Current allocation of Vietnam urban system .......................................................... 16
2.0.2. Urban growth rate in Vietnam is not in respect to the quality of the urban area ... 18 2.0.3. Urban decentralization and classification impact on urban structure and spatial
shape ................................................................................................................................ 21 2.0.4. Urbanization ratio and implementation of National urban development Strategies
......................................................................................................................................... 26
2.1. Urban population .......................................................................................................... 33
2.1.1. Population of urban areas ...................................................................................... 33 2.1.2. Migration ............................................................................................................... 34 2.1.3. Urbanization growth .............................................................................................. 36 2.1.4. Migration to big cities. ........................................................................................... 38
2.2. Housing ......................................................................................................................... 42
2.2.1. Characteristics of status of housing development in urban areas of Vietnam. ...... 42 2.2.2. Frame of institutions and policies on housing ....................................................... 43 2.2.3. Lack of urban housing ........................................................................................... 45 2.2.4. Ability to access to housing with appropriate price............................................... 48 2.2.5. Importance of informal housing: ........................................................................... 50 2.2.6. Upgrade and reduction of slums ............................................................................ 51
2.3. Urban land .................................................................................................................... 53
2.3.1. Overview of urban land ......................................................................................... 53 2.3.2. Legal framework .................................................................................................... 54 2.3.3. The pressure on land and urban development and expansion of the suburbs. ....... 54 2.3.4. Land prices and urban construction land. .............................................................. 55 2.3.5. Land Management under construction planning ................................................... 56 2.3.6. The challenges for urban land ............................................................................... 58
2.4. Urban technical infrastructure ...................................................................................... 60
2.4.1. Extensive transportation infrastructure. ................................................................. 60 2.4.2. Urban transport and urban public transport ........................................................... 62
a) Urban transport ....................................................................................................... 62 b) Current situation of public transport in large metropolitans in Vietnam ............... 64
2.4.3. Water supply. ......................................................................................................... 67 a) Current water supply ............................................................................................... 67 b) Difficulties ............................................................................................................... 69
2.4.4. Drainage and sewage treatment. ............................................................................ 70 a) Storm water drainage: ............................................................................................ 70 b) Construction and upgrading of waste water drainage system: ............................... 71 c) Shortcomings in planning implementation .............................................................. 72
2.4.5. Solid waste ............................................................................................................. 74 a) Implementation situation of Solid waste management planning in localities ......... 75

3
b) Shortcomings in planning implementation .............................................................. 78 2.4.6. Cemeteries. ............................................................................................................ 79
a) Cemetery management as planned. ......................................................................... 79 b) Actual situation of using urban cemeteries ............................................................. 79 c) Main existing problems: .......................................................................................... 81
2.5. Urban economic ............................................................................................................ 82
2.5.1. Transition from a centralized to socialist-oriented market economy in Vietnam . 82 2.5.2. Role of industrial parks, export processing zones, economic zones ..................... 87 2.5.3. Informal economic zones in Vietnam .................................................................... 88 2.5.4. New appearance of economic sector in urban creativity ....................................... 90 2.5.5. Urban Finance ........................................................................................................ 91
a) Overview .................................................................................................................. 91 b) The urban financial resources ................................................................................. 93 c) Mobilization of extra-budgetary funds for urban development ............................... 97
2.6. Social services in urban areas ....................................................................................... 99
2.6.1. The concept of basic social services in urban areas. ............................................. 99 2.6.2. Economic - social movement effecting the provision of social services ............. 100 2.6.3. Current status of basic social services in urban areas .......................................... 102 2.6.4. Accessibility of the people to social services in urban areas ............................... 104
a) Accessibility to social housing .............................................................................. 104 b) Accessibility to health services .............................................................................. 105 c) Educational services .............................................................................................. 108 d) Cultural services, sports and entertainment, and community activities ............... 111 d) Information accessibility ....................................................................................... 114 e) Access to clean water and sanitation .................................................................... 117 g) Accessibility to transport ....................................................................................... 119 h) Accessibility to domestic energy. .......................................................................... 120 i) To assess the satisfaction of the people with basic social services in urban areas 121
2.6.5. The problem exists ............................................................................................... 122 a) In terms of policies ................................................................................................ 122 b) The affordability of the people .............................................................................. 123
2.7. Labor, Employment and Income ................................................................................ 124
2.7.1. Overview of labor, employment and income in urban areas ............................... 124 2.7.2. Unemployment rate ............................................................................................. 125 2.7.3. Urban poverty reduction ...................................................................................... 126 2.7.4. The income gap between urban area and rural area ............................................ 128 2.7.5. Child labor in urban areas .................................................................................... 130 2.7.6. Un- efficiently use of the human resources with high quality ............................. 132
2.8. Urban management capacity....................................................................................... 135
2.8.1. Introduction ......................................................................................................... 135 2.8.2. Urban Administration .......................................................................................... 136
a) Urban administration decentralization ................................................................. 136 b) Effectiveness and efficiency of urban government machinery .............................. 137
b1) Civil servants and staff of urban government machinery ....................................................................... 137 b2) Capacity of leaders, civil servants in cities ................................................................................................. 139 b3) Forming electronic government to meet transparency, accountability. ............................................. 140
2.8.3. Management of efficient resource use ................................................................. 142 a) Management of Budget .......................................................................................... 142 b) Land Management. ................................................................................................ 144

4
2.8.4. Development Management .................................................................................. 146 a) Management of Planning ...................................................................................... 146
a1) Vision of urban governments in urban construction planning ............................................................. 146 a2) Making planning and zoning planning. ........................................................................................................ 147 a3) Granting construction license ........................................................................................................................... 151
b) City’s making plans for development .................................................................... 152 b1) Plan for house development ............................................................................................................................. 152 b2) Solving urban poor areas ................................................................................................................................... 153
2.8.5. Management of basic urban services ................................................................... 155 a) For Municipalities ................................................................................................. 155 b) For provincial cities, towns ................................................................................... 157
2.8.6. Challenges of Vietnam sustainable urban governance ........................................ 157 a) Management of big cities in Vietnam .................................................................... 157 b) Mobilization of social resources for urban development ...................................... 158 c) Build urban brand to create development motivation ........................................... 158 d) Innovation of urban planning to create a flexible and effective legal framework 159
2.9. Environmental pollution, coping with floods and natural disasters due to climate
change ................................................................................................................................ 160
A. Urban environmental pollution in Vietnam .................................................................. 160
2.9.1. Urbanization pressures on the urban environment in Vietnam ........................... 160 2.9.2. Main issues on urban environment ...................................................................... 161
a) Water pollution in rivers flowing through urban areas, industrial zones and
handicraft villages ..................................................................................................... 161 b) Water pollution of inner-city lakes and canals ..................................................... 165 c) Local pollution of underground water .................................................................. 169 d) Coastal water pollution in urban areas ................................................................ 172 e) Air and noise pollution .......................................................................................... 174 g) Urban soil pollution .............................................................................................. 177 h) Decline in water level in urban areas ................................................................... 178 i) Unforeseen losses due to pollution, incidents and environmental disasters .......... 180
2.9.3. Policy and organization of management urban environmental protection .......... 181 a) Urban environmental protection policy ................................................................ 181 b) System of organization and management of urban environmental protection ...... 185
2.9.4. The challenge of urban environmental protection in Vietnam in the future........ 187
B. Natural disasters and the impact of climate change on Vietnam's urban system .......... 188
2.9.5. Overview of climate change on Vietnam's urban system .................................... 188 2.9.6. Overview of some issues on the risk of natural disasters and climate change in
urban areas ..................................................................................................................... 190 a) Climate change increases the risk of flooding in urban areas, especially coastal
and riverside urban areas .......................................................................................... 190 b) Climate change increases the risk of flooding, flash flood and landslides in
mountain areas of the North, Central and Central Highlands .................................. 192 c) Climate change impacts on technical infrastructure and urban environment ...... 193 d) Climate change impacts on housing, livelihood and urban migration ................. 194
2.9.7. Management of natural disaster risk mitigation and response to climate change 195 2.9.8. The challenges of natural disaster risk mitigation and adaptation to climate change
in urban areas ................................................................................................................. 198

5
FIGURES Figure 1 1: Administration Map of Vietnam ........................................................................................................ 15
Figure 1 2: Distribution scheme of Vietnam urban system under economic partitions ....................................... 17
Figure 1 3: Urban system chart by decentralization ............................................................................................ 23
Figure 1 4: Urban system chart by classification ................................................................................................ 25
Figure 1 5: Map of urban habitant percentage in 2014 by the Provinces ........................................................... 28
Figure 1 6: Population density chart by province in 2014 ................................................................................... 30
Figure 1 7: Traffic jam in Hanoi .......................................................................................................................... 65
Figure 1 8: Traffic congestion in Ho Chi Minh city ............................................................................................. 66
Figure 1 9: Power allocation for local authorities under the Laws of Local Authority Organization in 2015 . 137
Figure 1 10: Huge urban area land in comparative with the population .......................................................... 145
Figure 1 11: Urban capital and urban multi-aspects poverty ............................................................................ 154
Figure 1 12: Upgrading the poor area along Tan An City canals by the means of Community Development Fund
(CDF)........................................................................................................................................................ 154
Figure 1 13. Locations warned about decline in water level in the northern delta in first 6 months of 2013 .......... 178
Figure 1 14. Locations warned about decline in water level in the South ............................................................. 179
Figure 1 15. Chart of state management organization regarding environmental protection in special type city
.................................................................................................................................................................. 186
Figure 1 16. Chart of state management organization regarding environmental protection in Dangng city ... 186
CHART Chart 1 1: Number of urban areas and urbanization rate ................................................................................... 16
Chart 1 2: Number of urban areas distributed under 6 socioeconomic regions .................................................. 16
Chart 1 3: Chart of urbanization and economic growth in Vietnam .................................................................... 19
Chart 1 4: Statistics of increase in the urban number and urban space expansion in period of 1990-2004........ 19
Chart 1 5: Comparison of urban distribution in 06 economic zones in Vietnam in 2009 and 2015 .................... 24
Chart 1 6: Chart of population and urban population on the period of 1990-2014 ............................................. 27
Chart 1 7: Urban population rate and population growth rate per year in the period of 2009-2014 by
socioeconomic regions. ............................................................................................................................... 27
Chart 1 8: Population and population density by socio-economic regions in 2014 ............................................. 29
Chart 1 9: Urban population change of the whole country and 5 centrally-run cities ........................................ 33
Chart 1 10: Total population of urban area and inner city of 39 urban areas (not Hanoi and HCMC) in 2014 34
Chart 1 11: Number of migrants at the age of 5 or higher divided by migration status in period of 1999, 2009
and 2014. .................................................................................................................................................... 35
Chart 1 12: Migration rate in the 5 years preceding the survey divided by 6 socioeconomic regions, 2009-2014
.................................................................................................................................................................... 35
Chart 1 13: Migration flows between urban and rural areas, 2014 .................................................................... 36
Chart 1 14: Number of population in 2014, urbanization rate divided by socioeconomic regions (1999-2009-
2014) ........................................................................................................................................................... 36
Chart 1 15: Chart of population growth in government center cities 2009-2014 (%) ......................................... 38
Chart 1 16: Chart of immigration and migration and net migration in Government center cities (%o) ............. 38
Chart 1 17: Actual status of housing .................................................................................................................... 42

6
Chart 1 18: Changes on construction of housing in Vietnam ............................................................................... 43
Chart 1 19 Table on an average number of housing in each year in the urban areas ......................................... 43
Chart 1 20: Table on a number of urban households under the year and 6 socio-economic zones ..................... 45
Chart 1 21: Table on shortage of housing quality under urban areas ................................................................. 46
Chart 1 22: Table on poverty in urban areas according to the classification of urban and rural areas in 2012 47
Chart 1 23: Analysis the expense capacity based on Quintile of city household income ..................................... 49
Chart 1 24: Table proportion of urban residents living in slums. ........................................................................ 50
Chart 1 25: Chart of land for urban construction (divided by 6 economic regions and by urban grade
classification)Compared to national standards and regulations on construction. ..................................... 56
Chart 1 26: Chart of area of land for urban construction in Centrally-run 4 cities ............................................ 56
Chart 1 27: Chart of residential land per capita (divided by 6 economic regions and by urban grade
classification) .............................................................................................................................................. 57
Chart 1 28: Urban construction land area under planning ................................................................................. 59
Chart 1 29: Urban construction land area under planning in 4 centrally-run cities ........................................... 59
Chart 1 30: Chart of main roads in urban areas (building line >11.5m) ............................................................ 63
Chart 1 31: Minimum public transport use targeted for each municipality according to Circular 34. ............... 65
Chart 1 32: Public transport percentage in three cities of type I under central management ............................. 66
Chart 1 33: Public Transport Percentage in cities and towns in each region of Vietnam in 2011 ...................... 66
Chart 1 34: Percentage of public transport in some cities of type I and type II in the province .......................... 66
Chart 1 35: Chart of indicator of domestic water supply in urban areas ............................................................ 68
Chart 1 36: Chart of ratio of household provided with clean water from the centralized water supply system .. 69
Chart 1 37: Chart of the water loss rate .............................................................................................................. 69
Chart 1 38: Chart of main drain density in urban areas ...................................................................................... 71
Chart 1 39: Chart on ratio of production facilities applying recently clean technologies or pollution reduction
equipment .................................................................................................................................................... 72
Chart 1 40: Chart of solid waste in urban areas collected and treated ............................................................... 76
Chart 1 41: Chart of hazardous solid waste ratio (from industrial parks and hospitals) collected and treated .. 77
Chart 1 42: Selected Economic Indicators (1985-2015) ...................................................................................... 83
Chart 1 43: Values added to GDP by sector (1985-2013). .................................................................................. 83
Chart 1 44: Table of total register foreign investment capital (million USD) period 2005-2013. ....................... 84
Chart 1 45: Table of total register foreign investment capital (million USD) in 2014 ........................................ 84
Chart 1 46: Table of total register foreign investment capital (million USD) in 2014 ........................................ 84
Chart 1 47: Chart of number of commercial centers in whole country period 2009-2014 ................................. 85
Chart 1 48: Number of commercial centers in 2014 between central cities in whole country ............................. 85
Chart 1 49: Chart of per capita income ............................................................................................................... 86
Chart 1 50: Chart of economic growth rate in the last three years (%) ............................................................... 87
Chart 1 51: Synthesis of data on IPs and EPZs, EZs as of 3/2015 ....................................................................... 87
Chart 1 52: Number of informal and formal non-agricultural workers in 2007 .................................................. 88
Chart 1 53: Employment by the formal/informal/agricultural sectors and by rural / urban areas in Vietnam in
2009. ........................................................................................................................................................... 89
Chart 1 54: Overall relations of urban financial system ...................................................................................... 91
Chart 1 55: Total budgets of provincial cities ...................................................................................................... 94
Chart 1 56: Total budgets of central cities ........................................................................................................... 95

7
Chart 1 57: Chart of total expenditure ................................................................................................................. 95
Chart 1 58: The total budget capital for capital construction investment in centrally-run urban areas ............. 96
Chart 1 59: Budget for investment and construction of urban infrastructure ...................................................... 96
Chart 1 60: Total budget for capital construction investment in provincial cities and towns (billion VND) ....... 97
Chart 1 61: The total budget capital for capital construction investment in centrally-run urban areas (billion
dong) ........................................................................................................................................................... 97
Chart 1 62: Gross domestic product per capita in Vietnam (year 2010-2014). ................................................. 100
Chart 1 63: Gross domestic product at comparative price in 2010 classified business sectors in 2010-2014. . 101
Chart 1 64: Migration rate by province ............................................................................................................. 101
Chart 1 65: Forecast of Vietnam’s population: Rapid growth of the "oldest” .................................................. 102
Chart 1 66: Chart of proportion of land to build urban public works ............................................................... 103
Chart 1 67: Number of bed in specialized healthcare facilities (bed/ 1000 people) .......................................... 106
Chart 1 68: Number of medical works (compared to 6 economic zones and urban classifications) .................. 107
Chart 1 69: Synthesis of statistics on the medical service system in some years ............................................... 108
Chart 1 70: Chart of school attendance % (in comparison with 6 economic areas and urban classification) .. 109
Chart 1 71: Chart on the number of education establishments from elementary stages and higher (compared to 6
economic regions and urban classification) ............................................................................................. 109
Chart 1 72: Distribution of population aged 5 and over by the school attendance in the 1989- 2013 period
.................................................................................................................................................................. 110
Chart 1 73: Chart on the number of cultural centers (compared with 6 economic areas and urban classification)
.................................................................................................................................................................. 112
Chart 1 74: Chart of Sport centers (comparation of 6 economic zones and urban classification) .................... 112
Chart 1 75: Chart of number public spaces (in comparation with 6 economic zones and urban classification) 113
Chart 1 76 The growth rate of service groups (%) (including cultural and sport services) ........................ 113
Chart 1 77: Chart on the number of Internet subscribers .................................................................................. 116
Chart 1 78: Chart on the number of telephune subcribers ................................................................................. 117
Chart 1 79: Table on Access to clean water and environmental sanitation of urban and rural residents’.. ...... 117
Chart 1 80: Water use structure in the period (1990-2015) ............................................................................... 118
Chart 1 81: Use structure of sanitation facilities of urban residents in the period 1990-2015 .......................... 119
Chart 1 82: Table on the opinions of people towards 3 public services in 5 cities under the Central Government
(% ............................................................................................................................................................. 121
Chart 1 83: Chart about employed workers rate in 41 cities surveyed (%) ....................................................... 124
Chart 1 84: Chart of non-agricultural labor in 41 cities surveyed (% ............................................................... 124
Chart 1 85: Chart of unemployment rate in 41 urban areas surveyed (%) ........................................................ 125
Chart 1 86: Table of number and age structure of the unemployed in 2014. ..................................................... 126
Chart 1 87: Poverty rate by urban and rural areas and by region (%) ............................................................. 126
Chart 1 88: Chart about poverty rate in 41 cities surveyed (%) ........................................................................ 127
Chart 1 89: Table of household's average income (per month) in 2014 (thousand dong) ................................. 128
Chart 1 90: Average income of households 41cities surveyed (million VND) ................................................... 129
Chart 1 91: Table of per capita income per month divided by urban area - rural area .................................... 129
Chart 1 92: The proportion of workers employed in 2014 and the ratio of employment to population by quarter
.................................................................................................................................................................. 130
Chart 1 93: Chart of child labor in 41 surveyed cities/towns (%) ..................................................................... 131

8
Chart 1 94: Table of proportion of the trained workforce in 2014 .................................................................... 133
Chart 1 95: Chart of trained employee rate in 41 cities surveyed (%) ............................................................... 133
Chart 1 96: Table of structure of the unemployed divided by the highest education levels achieved in 2014 ... 134
Chart 1 97: Number of city public servants and staff per 10,000 people ........................................................... 137
Chart 1 98: Number of staff of the urban management department in 10 urban areas surveyed ...................... 138
Chart 1 99: People use which information channels for information [PAPI indicator in 2015] ...................... 141
Chart 1 100: Proportion of public administrative procedure publication on websites ...................................... 142
Chart 1 101: Combined GDP of 4 cities compared with national GDP ........................................................... 143
Chart 1 102: Four Cities’ contribution to the state budget [4] ......................................................................... 143
Chart 1 103: Budget expenditure of 4 cities ....................................................................................................... 143
Chart 1 104: Economic growth in the last 3 years (%) ...................................................................................... 144
Chart 1 105: Balancing revenues and expenditures by type of city ................................................................... 144
Chart 1 106: Coverage of zoning planning ........................................................................................................ 147
Chart 1 107: Coverage of detailed planning ...................................................................................................... 148
Chart 1 108: Cities with regulation on architecture planning management ...................................................... 149
Chart 1 109: The cities have approved urban development programme ........................................................... 149
Chart 1 110: Rate of cities with urban development program by region ........................................................... 150
Chart 1 111: Rate of cities with urban development program by city type ........................................................ 151
Chart 1 112: Rate of unlicensed construction of cities ....................................................................................... 151
Chart 1 113: Evaluation of waste collection by people in 5 cities ..................................................................... 155
Chart 1 114: Evaluation of clean water supply by people in 5 cities ................................................................. 155
Chart 1 115: Evaluation of public bus service by people in 5 cities .................................................................. 156
Chart 1 116: Family’s waste collected, transported by which organization (%) ............................................... 156
Chart 1 117: Use domestic water from which source (%) ................................................................................. 157
Chart 1 118: Development of BOD 5 concentration on some inner rivers of Nhue - Day River Basin over the
year ........................................................................................................................................................... 161
Chart 1 119: BOD5 in some rivers inner cities in the basin of Nhue - Day - 2007-2011 .................................. 162
Chart 1 120: COD in some rivers in the basin of Nhue Day - 2006-2011 ......................................................... 162
Chart 1 121. COD in some rivers inner Hanoi - 2011 - 2015 ............................................................................ 162
Chart 1 122. NH4+ concentration in section flowing through Thai Nguyen ....................................................... 163
Chart 1 123. Development of COD concentration in Dong Nai River, period 2011 - 2015 .............................. 163
Chart 1 124: Development of BOD5 concentration in Sai Gon River over the years ........................................ 164
Chart 1 125: Development of BOD5 concentration in lakes over the years ....................................................... 165
Chart 1 126: Development of COD concentration in lakes over the years ........................................................ 165
Chart 1 127. Development of COD concentration in inner city canal water in Ho Chi Minh City ................... 166
Chart 1 128. Development of BOD5 concentration in lakes in the Central over the years ............................... 166
Chart 1 129. Development of COD concentration in lakes in the Central over the years ................................. 167
Chart 1 130. Development of TSS concentration in lakes in the Central over the years ................................... 168
Chart 1 131. COD process in some river 2011 – 2015 ...................................................................................... 168
Chart 1 132. BOD5 and COD concentration in some lakes in Lai Chau in 2011 .............................................. 169
Chart 1 133. Development of BOD5 and COD concentration in Nui Coc Lake (Thai Nguyen) ........................ 169
Chart 1 134. Highest TDS concentration recorded in some areas in 2013 ......................................................... 170

9
Chart 1 135. Highest Ammonium concentration recorded in some areas in 2013 .............................................. 170
Chart 1 136. Ammonium concentration in groundwater in some areas in 2011-2015 ....................................... 171
Chart 1 137. Fe concentration in groundwater in some areas, period 2011-2015 .............................................. 171
Chart 1 138. Highest Mn concentration recorded in some areas in 2013........................................................... 171
Chart 1 139. Development of average TSS concentration in coastal water in some coastal areas, period 2011 -
2015 .......................................................................................................................................................... 172
Chart 1 140. Development of average COD concentration in coastal water in some coastal areas, period 2011 -
2015 .......................................................................................................................................................... 173
Chart 1 141. Development of air quality indicator AQI in 5 automatic and continuous monitoring stations,
period 2011-2015 ...................................................................................................................................... 174
Chart 1 142. NO2 and Benzen surveyed in Hanoi through the years................................................................. 176
Chart 1 143. Cu concentrations in soil in some suburban areas in the North .................................................. 177
Chart 1 144. Urban areas at flooding risk ......................................................................................................... 191
Chart 1 145. Urban areas at risk of being affected by flash floods and landslides ............................................ 192
LEGEND BOX Box 1 1: Socio-economic zoning in Vietnam ........................................................................................................ 16
Box 1 2: Urban decentralization and classification impact on urban structure and spatial shape ..................... 21
Box 1 3: The development of the housing policy of Vietnam .............................................................................. 45
Box 1 4: Box of Concept of the informal economic sector): ................................................................................. 88
Box 1 5. Results of testing program of lake water pollution treatment in Hanoi city ..................................... 166
Box 1 6. Arsenic pollution in groundwater ........................................................................................................ 172
Box 1 7. Current status of groundwater salinized in some provinces ................................................................ 172
Box 1 8. Red tide phenomenon occurred in south central coast ......................................................................... 173
Box 1 9. Mineral oil pollution in coastal areas of Ha Long Bay ........................................................................ 174
Box 1 10. Soil pollution around some industrial zones in Dong Nai .................................................................. 177
Box 1 11. Three hotspots of dioxin in some urban areas in the South of Vietnam ............................................. 178
Box 1 12. Decline in groundwater level in Hanoi ............................................................................................... 178
Box 1 13. Tourists and craft village tourism in Hanoi ....................................................................................... 180
Box 1 14. People put up a tent to protest landfill construction .......................................................................... 180

10
REFFERENCES
1) Report on assessment and orientation of social service system development to 2020, UDA, MOC, Oct
2015.
2) Social service supporting for human development/ Nation report on Human Development in 2011 -
UNDP.
3) The presentation "Social services for human development" in the workshop “Situation and solutions to
develop social services in urban Vietnam, UNDP.
4) Presentation "Spatial organization of urban public services - identification and solutions (Hanoi as
object illustration), Dr. Nguyen Hong Thuc, Research Institute of settlements.
5) Presentation "The international rules guiding access to basic services for all people," Dr. Nguyen
Quang, Director of Human Settlements Programme, UN-HABITAT Vietnam.
6) The results of the literature review and data base of Social security for the informal sector and informal
workers/laborers - Academy of society and Labor in 2012.
7) Ensure access to basic social services in the social security laws of Vietnam, Dr. Nguyen Hien Phuong;
Deputy Chairman of the Department of Labour Law - Social Security, Hanoi Law University
8) Some issues about management innovation of public service in Vietnam/Dr. Dang Duc Dam, Deputy
Head of Research Department of the Prime Minister.
9) Legislation on public services in Vietnam today.
10) Develop a social security system in Vietnam by 2020.
11) Project to build socio-economic development strategy in Vietnam 2011-2020 / LABOR AND
EMPLOYMENT APPROACH 2010. MPI / UNDP.
12) Labor Survey Report 2014. Employment GSO, MPI
13) Report on Urbanization in Vietnam – Technical Assistance Report –WB November 2001
14) Report of Vietnam Chamber of Commerce and Industry - 2015
15) 2015 SIPAS indicator publication - Measuring Citizens' satisfaction on 27th
April 2016.
16) . Project for upgrading Mekong Delta urban area – Code: MOC 01 .July 2015
17) Survey project of Vietnam Cities Association in 2014 financed by CA
18) Vietnam Urban Areas – Planning unstability 7/6/2016 - VNA
19) Plan for developing houses in Hanoi City - December 2014
20) Result of survey of 41 cities of NUDS Project - 2015-2016.
21) How to do so that urban planning in Vietnam becomes more effective - Ho Chi Minh City Case”
(March 2012)
22) Law on organization of local government – issued in 2015 by the National Assembly
23) Improving the efficiency of urban development management as planning – Dr. Pham Si Liem
1/3/2014.
24) Challenges to sustainable development of Vietnam urban areas – A look from big cities 2/12/2015 -
Nguyen Huu Nguyen – Construction Magazine
25) Thinking about Vietnam‟s urbanization strategy on 23/02/2015 - Dr. Ngo Doan Vinh - Former Director
of Development Strategy Institute of Ministry of Planning & Investment -and Dr. Ngo Thuy Quynh
26) Challenges for future cities and territoties planning - 2015
27) Organizing for service supply of environmental sanitation, water supply, bus traffic of 5 centre Cities
2014.
28) Overview of housing development in HCM City September 2015 – Report to DOC
29) Poverty Rate is the lowest in the Region - ADB 31st Oct 2015
30) Ministry of Natural Resources and Environment, 2012. Climate change scenarios and sea level rise for
Vietnam. Environment and Natural Resources Publisher and Vietnam Map.

11
31) Ministry of Natural Resources and Environment, 2008. National Environmental Report - Environment
of craft villages
32) Ministry of Natural Resources and Environment, 2011. National Strategy on Climate Change
33) Ministry of Natural Resources and Environment (2010). National Environmental Report 2009 -
Environment of Vietnam Industrial Zone.
34) Ministry of Natural Resources and Environment (2011). National Environmental Report 2010 –
Vietnam Environment Overview.
35) Ministry of Natural Resources and Environment (2012). National Environmental Report 2011 – Solid
waste.
36) Ministry of Natural Resources and Environment (2013). National Environmental Report 2012 - Air
environment.
37) Ministry of Natural Resources and Environment (2013). Final Report of 8 years for implementation of
the Law on Environmental Protection in 2005 (2006 - 2013).
38) Ministry of Natural Resources and Environment (2016). Draft of report on the national environment in
2011-2015, May 2016.
39) Ministry of Construction (2013). Scheme of Vietnam urban development coping with climate change
in period 2013 - 2020.
40) Government, 2015. Report on the work of environmental protection No. 231/BC-CP of the
Government dated 22.05.2015 sent parliamentary deputies.
41) Nguyen Phuong Nam, Tran Thi Thu Trang, Stephen Tyler, Nguyen Quynh Anh, Bach Tan
Sinh, Nguyen Ngoc Huy, Pham Khanh, Dang Thi Huong, 2015. Local Planning for climate adaptation:
Vietnam‟s experience. http://pubs.iied.org/10741IIED.html?c=climate.
42) Nguyen Huu Tan, 2010. Irrigation planning against flooding in the Mekong Delta cities.
http://www.siwrp.org.vn/?id_pnewsv=503&lg=vn&start=0
43) Hoang Duong Tung, 2015. Air pollution in Vietnam. Is it really worrying? Journal of Environment No.
3/2015.
44) World Bank and (2010). Weathering the storm: Options for disaster risk financing in Vietnam.
http://wwwwds.worldbank.org/external/default/WDSContentServer/WDSP/IB/2015/06/18/090224b082f49
029/2_0/Rendered/PDF/Vietnam000Weat0financing0in0Vietnam.pdf
45) World Bank, 2014. The report of "Changing East Asia Urban Landscape”
46) Germanwatch, 2015. Global Climate Risk Index 2015.
https://germanwatch.org/de/download/10333.pdf
47) The People's Committee of Hanoi City, 2012. The action plan to respond to climate change in
Hanoi
48) UNDP (2010), Domestic migration: Opportunities and challenges for economic - social
development in Vietnam
49) Resolution No. 03/2013 / NQ-HDND of the People's Council of Hanoi on the prioritizing
development of the system of public passenger transport in large volumes; encourage investment
in the construction and exploitation of the bus station, car parks and other motor vehicles;
application of high technology in the management and administration of the transportation sys tem
50) Resolution No. 853/NQ-UBTVQH13 of Standing Committee of the National Assembly on the
results of monitoring and promoting the implementation of policies and laws on coping with climate
change in the Mekong Delta, December 5, 2014
51) https://urbanclimatevn.com/2016/03/29/cbdrm-vietnam/
52) http://www.undp.org/content/dam/vietnam/docs/Publications/Chuong%209.pdf
53) http://luanvan.net.vn/luan-van/de-tai-tro-gia-xe-buyt-tren-dia-ban-tphcm-va-thuc-trang-va-giai-phap-
19734/
54) http://vtv.vn/chuyen-dong-24h/17-trieu-nguoi-viet-co-nguy-co-mat-cho-o-neu-bien-dang-cao-
20151216185834406.htm

12
55) http://www.moitruong.com.vn/Upload/48/Nam_2015/Tai%20lieu/TinhhinhthientaiVietNam.pdf
56) Decision No. 3980/QD-SGTVT dated 10/12/2012 Director of Transport Department of Ho Chi Minh
City on the announcement of the bus price on the bus lines subsidized applied from 01.01.2013.
57) The relevant policies, documents and laws on environmental protection, disaster risk prevention and
response to climate change in Vietnam.
INTERNATIONAL REFFERENCES
1) Housing Profile in Vietnam - UNHABITAT 2011.
2) L ist of Indicators and Definitions of Cities Alliance – CA 2014
3) Municipal Government in Vietnam – Case studies of Ho Chi Minh city and Da Nang – the Asian
Foundation October 2013
4) Overview of the Cities Prosperity Initiative – Dr Robert Ndugwwa - UNHABITAT
5) UNDP Internet Conference Forum on "Public Private Interface in Urban Environmental Management"
1996
6) World Bank "Governance and Development". -1992

13
I. INTRODUCTION
Context of urbanization in Vietnam
Since 1986, Vietnam has transferred into market economy to warding social republic
direction. The Open Policy has attracted the foreign investor, the local enterprises has
developed in producing, commerce, construction, agri-land using serving for urban
demand and local economic growth. And it makes increasing the demand of urban space
expansion and encouraging the population flow from rural areas to the city for seeking
jobs.
After 30 years of “Doi moi”, the achievements of urbanization in Vietnam has recognized
strongly in term of administration, space, economic, population and social welfare 1 .
Urban system has developed rapidly with equal allocation entire of country, and forming
2 city Regions i.e. Hanoi and Ho Chi Minh City to be growing keys of the North and the
South. Danang, Cantho and Haiphong also become regional Centers. In 1986,
urbanization ratio in whole country achieves under 20 per cent and to be 35.7 per cent in
2015; there are one million people2 more in the cities and increasing nearly 3 new cities
every month. By 6/20153 the country had 787 urban areas, of which there were 2 special
urban areas, 15 urban areas grade I, 25 urban areas grade II, 42 urban areas grade III and
75 urban areas grade IV and 628 urban areas grade V, the urbanization rate reached
35.7%. Urban systems have contributed over 70% of GDP, contributed significantly to
bring Vietnam over the poverty line to become a country with low middle-income.
Urban appearance gradually prospered with urban and inter-urban infrastructure
improved. Many roads, bridges, water and electricity systems, and public lighting have
been operated; many new urban areas have been built. Despite much progress, the current
state of Vietnam urban areas also revealed many weaknesses, especially in great urban
areas. For example, urban architecture had not been respected, there were lack of the
modern and civilized streets, lack of housing and public space; property market was weak
and disordered; there were traffic congestion, environmental pollution of water and air,
local flooding when heavy rains or high tides; the coverage of public services remained
low at small and medium urban areas; the poverty rate decreased but wealth disparity
level increased; order and security situation was deteriorating. The weaknesses mentioned
above had negative impact on the quality of life of citizens and the business environment
in urban areas, adversely affected national competitiveness.
Awareness of this transition, the State planned the macroeconomic policies to manage
and facilitate the localities in urban development. In 2008, Prime Minister issued
Decision 445 on Adjustment of national urban orientation; issued Decree No.
42/2009/ND-CP on urban classification in 2009; in 2012, issued Decision No. 1659/QD-
TTg on Program of National Urban Development to 2020. In recent years, the rapid
growth on population and land in urban areas in Vietnam, while awareness of
urbanization lacked the comprehensive, policies and laws has been limited, urban
planning and management has been slow to reform and has not mastered the new
situation arising, investment resources have been not commensurate with the need to
develop urban infrastructure ... has revealed many uncertainties in the urbanization
process in Vietnam.
1 Dean Cira and nnk. Assessment on urbanization in Vietnam. Technical support Report. WB. Hà Nội.
November 2011. 2 Report on number of housing midterm of 2014. 3 Source: Ministry of Construction.

14
Impact of Climate change into urban areas of Vietnam.
Vietnam was rated as one of the countries most severely affected by climate change (CC).
Mekong Delta will be one of three deltas in the world, which were most vulnerable due to
sea level rise. Vietnam ranked 23 out of 30 countries most affected by climate change.
Under Vietnam climate change scenarios, updated in 2012, the sea level will rise from 0.5
to 1 meter at the end of the XXI century. In the worst case, there will be about 39% of the
area, 35% of the population in the Mekong Delta; over 10% of the area, 9% of the
population of the Red River Delta and Quang Ninh; over 2.5% of the area, 9% of the
population of the Central coastal provinces at risk of being influenced. The key economic
regions, large urban areas, the general economic zones acting as major growth pole at
national and regional are invested in production facilities, infrastructure and housing...,
which are alerted to be severely affected by climate change.
Urban Development in Vietnam was facing major challenges on climate change; the
provinces of Ca Mau (55.9%), Kien Giang (74.8%), Hau Giang (79.4%) were the
provinces with the largest flooded area. The cities of Ho Chi Minh City, Can Tho and Ca
Mau,... were seriously flooded and attenuated water resources, the large cities in the
Northern coast area, South Central and Central Coast were severely affected by storms
and floods. Mountainous and highland urban areas are under drought, flash floods,
landslides, groundwater attenuated. If the coastal urban areas do not timely cope with
climate change, it is estimated that 10-12% of Vietnam's population will be affected4 .
Recognizing the serious impacts of climate change on the development of the country, in
2008 the Government approved the National Target Program to Respond to Climate
Change. The Ministry of Construction as the state management of urban development,
has implemented the plan of "Project of Vietnam urban development coping with climate
change in the period of 2013 - 2020" in order to update additional requirement of
response to climate change in the adjustment process, new construction and
implementation of orientation, urban development programs in Vietnam to 2020, take
advantage of opportunities and minimize the damage and risks caused by climate change
in the process of urban construction and development.
Towards sustainable urban development
Vietnam urban development strategy in the future should not only develop on population,
land, economy, but also should develop on quality, have a better living environment, less
wealth disparity, capable competitiveness towards sustainable urban development in all 3
aspects: Economy - Society - Environment, place man at the center of every stage of
development, ensure social justice and harmony between man and nature, harmony of
interests between regions, benefits between the current generation to future generation.
On the other hand, the globalization requires countries around the world to join together
to jointly develop the commitments or strategies with global significance on adaptation to
climate change, green growth and sustainable urban development5.
4 Source: “Project of Vietnam coastal urban development coping with climate change” Urban Development
Department, 2013-MOC 5 Assoc. Prof. Dr. Architect Tran Trong Hanh, Construction and sustainable development of mega urban areas
in Vietnam in the transition period.

15
II. ASSESSMENT ON CURRENT SITUATION UNDER SELECTED 9
FIELDS
2.0. Overview of Vietnam urban system
2.0.1. Introduction to Vietnam's urban system
a) Introduction to Vietnam
The Socialist Republic of Vietnam is a country located on the Indochina Peninsula in
Southeast Asia. The North borders by China, the west borders by Laos and Cambodia,
the southwest borders by the Gulf of Thailand and the east and south border by the
South China Sea. There are over 4000 islands in Vietnam.
In 20146, the country had a total area of 330,967km2, a population of 90.729 million
people, the average population density is 274 people / km2, consists of 64 provinces
and centrally-run cities (49 districts, 47 townships, 548 districts, 1545 wards, 615
towns and 9001 communes)
Vietnam has 54 ethnic groups, of which there are 53 ethnic minorities, accounting for
about 14% of the total population of the country. Viet people (also known as Kinh
people) account for nearly 86%, concentrated in the delta and coastal plain.
Figure 1 1: Administration Map of Vietnam
Source: Vietnam Institute for Urban and Rural Planning, VIUP, MOC
6 Source: GSO 2014

16
b) Current allocation of Vietnam urban system
Since 1990, Vietnam urban area system began to thrive both in the number of urban
areas and urban population. Prior to time, all country had about 500 urban areas
(urbanization rate was about 19.51%), and urban areas in 1999 was 604 (urbanization
rate is about 23.61%), and urban areas in 2009 was 731 (urbanization rate was about
29.6%). By December in 2015, there were 787 urban areas (urbanization rate was
about 35.2%), with 63 centrally-run cities/provinces. In which, 2 large national
developing pioneers were Hanoi and Ho Chi Minh City.
Chart 1 1: Number of urban areas and urbanization rate
Year Number of urban
areas
Urbanization rate Urban
population
(1000 person)
Population
(1000 person)
1990 500 19,51 12.880 66.016
1999 604 23,61 18.081 76.597
2009 731 29,6 25.584 86.025
2014 774 33,1 30.035 90.728
2015 787 35,2 no data no data (Source: Pham Thi Nham, Vietnam Institute for Urban and Rural Planning - Ministry of Construction)
Chart 1 2: Number of urban areas distributed under 6 socioeconomic regions
Total Total
2009 2015
Mountainous area and Northern
Midlands
167
Red river delta 147
North Central/ Central Coast 183
Highlands 63
South East 55
Mekong Delta 166
Total 731 787 (Source: UDA, MOC)
Box 1 1: Socio-economic zoning in Vietnam
Vietnam has launched the different economic areas, such as system of 7 agricultural and forestry regions in the late 1975-
1977, then the system of 8 regions in the period of 1978-1980; the system of 4 large regions and 7 sub-regions in the period
of 1981-1985; the system of 8 regions and 3 key economic regions since 1986. Under the Decree No. 92/2006/NĐ/CP of
Government dated 7th September 2006, Vietnam is divided into 6 main economic Regions:
(1) Midlands and Northern mountainous areas (Northwest and Northeast), including the provinces: Cao Bang, Lang Son,
Bac Giang, Phu Tho, Bac Kan, Thai Nguyen, Ha Giang, Tuyen Quang, Lao Cai, Yen Bai, Lai Chau, Dien Bien, Son La and
Hoa Binh;
(2) Red River Delta, including the provinces and cities: Hanoi, Hai Phong, Hai Duong, Hung Yen, Thai Binh, Nam Dinh,
Ha Nam, Ninh Binh, Bac Ninh, Vinh Phuc and Quang Ninh;
(3) North Central, South Central Coast, including the provinces and cities: Thanh Hoa, Nghe An, Ha Tinh, Quang Binh,
Quang Tri, Thua Thien - Hue, Da Nang, Quang Nam, Quang Ngai, Binh Dinh, Phu Yen, Khanh Hoa, Ninh Thuan and Binh
Thuan;
(4) Central Highlands including the provinces of Kon Tum, Gia Lai, Dak Lak, Dak Nong and Lam Dong;
(5) Southeast region, including the provinces and cities: Ho Chi Minh City, Dong Nai, Ba Ria - Vung Tau, Binh Duong,
Binh Phuoc, Tay Ninh, Long An and Tien Giang;
(6) Mekong Delta including provinces and cities of Can Tho, Hau Giang, Ben Tre, Tra Vinh, Vinh Long, An Giang, Dong
Thap, Kien Giang, Soc Trang, Bac Lieu and Ca Mau.
Along with that there are four key economic regions, including: (1) The Northern Key Economic Region, including 8
provinces and cities: Hanoi, Hai Phong, Hai Duong, Hung Yen, Ha Tay, Vinh Phuc, Bac Ninh and Quang Ninh, Vinh Phuc,
Bac Ninh; (2) The Southern Economic Region including 8 provinces and cities: Ho Chi Minh City, Dong Nai, Ba Ria -

17
Vung Tau, Binh Duong, Binh Phuoc, Tay Ninh, Long An, Tien Giang; (3) The Central Key Economic Region including 5
provinces and cities: Thua Thien - Hue, Da Nang, Quang Nam, Quang Ngai, Binh Dinh; (4) Mekong Delta Key Economic
Region, including 4 provinces and cities: Can Tho, An Giang, Ca Mau and Kien Giang.
Figure 1 2: Distribution scheme of Vietnam urban system under economic partitions
Source: Vietnam Institute for Urban and Rural Planning, VIUP, MOC

18
Vietnam Urban System Structure has two north-south pole happening urbanization
processes significantly. The Northern region with northern key economic region
includes important major urban areas such as Hanoi, Hai Phong and Ha Long. The
Southern region with key economic regions includes southern key economic region
includes Ho Chi Minh City and the nearby cities such as Binh Duong, Bien Hoa and
Vung Tau.
The Central economic region with Da Nang City that is thriving motivates the Central
development associated with large urban areas along the central coast as Thanh Hoa,
Hue, Tam Ky, Quang Ngai, Quy Nhon, Nha Trang and creates North - South chain
link as fulcrum of regional links with Central Highlands.
Mekong Delta with Can Tho City is rapidly urbanizing and becoming major national
and regional centers.
The framework of the national urban system is relatively balanced, however, the
urbanization speed of midlands northern mountainous is still slow; so to have the
motivated urban areas for northern border mountains, it is necessary to arouse the
potential urban areas associated with border trade policies and trans-Asian corridor as
Lao Cai and Lang Son; urban areas adjacent to the northern key economic region as
Thai Nguyen and Viet Tri.
Vietnam is in the process of urbanization and economic development. Vietnam has
gained many benefits from urbanization in the past few decades, but it is time for
Vietnam to reassess the situation of urban development and the dominant factors of
urbanization in Vietnam: market; the factors of production (land, labor, and human
resources); public finance; adjusting strategies, methods for urban development and
providing services for compatibility with the demands of a growing market economy.
The structural transformation of Vietnam economy from an agricultural country into a
modern industrial one after 2020 is indispensable to develop a strategy and plan for
the urbanization process. This process is an important part of Vietnam in the future to
ensure livable cities, and being able to compete regionally as well as globally. It will
become an essential part of the economic development strategy of Vietnam.
2.0.2. Urban growth rate in Vietnam is not in respect to the quality of the urban
area
As mentioned above, the urban area system of Vietnam is strongly developed for
quantity and the scale of urban population, in 1990, there were about 500 urban areas
(urbanization ratio was about 19.51%), 604 urban areas in 1999 (urbanization ratio
was about 23.61%), 731 urban areas (urbanization ratio was 29.6%), 774 urban areas
in 2014 (urbanization ratio was 33.1%).

19
Chart 1 3: Chart of urbanization and economic growth in Vietnam
!
Giai đoạn 1 Giai đoạn 2
(Source: Architect Pham Thi Nham - Vietnam Institute for Urban and Rural Planning, BXD/refer to data from
Statistic Agency)
Urban outbreak
Some urban planners say that:
- The first outbreak phase of urbanization in Vietnam (1986 - 1997) lasted from
early innovation in 1986 until the start of the Asian economic crisis in 1997;
- The second outbreak phase of urbanization (2000 – 2010) started from 2000 to
the end of 2010. The year of 2011 marked the decline of the second outbreak
phase of urbanization and real estate market went into freeze.
The present is the best time to assess overall quality and speed of urbanization and
problems related to urban development ... to prepare for the more successfulness of
the next third outbreak phase of urbanization. It also needed to study conservation and
development of urban and rural settlement patterns in Vietnam in condition of
urbanization, climate change and sustainable development requirements in order to
contribute to developing Vietnam urban system modern and unique.
Chart 1 4: Statistics of increase in the urban number and urban space expansion in period of
1990-2004 Urban type 1990 1999 2009 2014 Number of
urban areas
raised the type in
1999-2009
Number of
urban areas
raised the type
in 2009-2014
Special type 0 2 2 2 0
Type I 2 5 15 5 10
Type II 8 12 21 9 19
Type III 12 40 42 37 21
Type IV 64 47 67 20 41
Type V 518 625 627 127 43
Number of urban
areas
500 604 731 774 200 134
Urbanization rate 19.51 23.61 29.6 33.1
Source: Pham Thi Nham - Urban Planning Institute of the National Rural, BXD

20
According to statistics above, in the first outbreak phase of urbanization, Vietnam was
in the startup phase, the urbanization rate was not fast. In the period of 1990-1999,
there were more 104 urban areas. In the second outbreak phase of urbanization, the
urbanization speed of Vietnam was faster. There were more 200 urban areas in the
period of 1999-2009. Many urban areas were expanded, the cities is getting more
crowded. The report of World Bank said that in the period of 2000 - 2010, Vietnam
reached the 5th
position of large urban area in 2010 (2.900 km2) from the 7th
position
in 2000 (2,200 km2) in the urban hierarchy, beyond Thailand and Korea. In spatial
terms, urban areas of Vietnam increased by 2.8% annually, among the countries with
the fastest growth rate of the region. Vietnam has the sixth largest urban population in
East Asia. In the period of 2000 - 2010, the urban population increased by 7.5 million
people. During this period, the urban population of Vietnam changed from 19% to
26%. Vietnam does not have the huge cities with 10 million people or more, but Ho
Chi Minh City (7.8 million people) and Hanoi (5.6 million people) are among the
largest cities in the region. These two cities dominate the attraction, spread to the
nearby urban areas to make up the two large urban areas, as key dynamic urban areas
of Vietnam, affect Northeast Asia and East South Asia in the region.
Urbanization quality not keeping face with the socioeconomic development
level
The advancement of science and technology in the field of construction has created
many large span bridges, tunnels crossing high mountains, deep rivers and large
seaports to connect large urban areas previously separated by the nature. A series of
big cities such as Hanoi, Ho Chi Minh, Can Tho, Ha Long and Da Nang... are
expanding urban space gradually to form the super cities. In large urban areas, the rate
of population growth and motor vehicles is several times larger than the growth rate of
green space and traffic space. Many large scale urban areas with the risk of breaking
the urban space appear on the avenues and highways. Currently, the towers, highways,
cars and information highways... are being considered as symbols of the modern urban
areas, but their downside makes up the negative effects harming growth of urban
development.
Developing rapidly in scale and number, but the quality of Vietnam urban areas is
low. In particular, the technical infrastructure and social infrastructure are not
synchronized; the qualification and capacity management and urban development are
still low compared to the requirements; the speed of infrastructural construction in
most Vietnam urban areas is slow compared to the socio-economic development.
Current urban development status is not corresponding with the rules, perception,
thinking about urbanization in the context of the market economy, international
integration, sustainable development and green growth.
Vietnam urbanization has not demonstrated local identities and characteristics of
regional climate and creates disparities between urban and rural areas. The urban
landscape architecture is in confusion and lacking of aesthetics. Land resource is fully
exploited for urban construction, green area and water area are reduced; demand for
production and services is increasing resulting in degradation of natural resources of
the country. Social infrastructure system and urban engineering are unfinished and
unsynchronized and often overloaded leading to the phenomenon of traffic

21
congestion, flooding and environmental hygiene...Housing in large urban areas is
inadequate, especially housing for workers, students, people with low income and
social housing ... Many urban areas lack of greenery, parks, water, schools, health
centers, playgrounds for children, elderly and other objects. The urban expansion not
on the needs of development results in agricultural land waste and tenure affecting
national food safety and livelihoods of the people. The collection and treatment of
solid waste, especially hazardous solid waste, has not been done properly regulated.
Urban governance is weak and many shortcomings exist.
2.0.3. Urban decentralization and classification impact on urban structure and
spatial shape
Box 1 2: Urban decentralization and classification impact on urban structure and spatial
shape
In 1990, the Council of Ministers issued Decision No. 132/HĐBT dated 05/5/1990 about urban classification and urban management
decentralization. In which, identifying for urban classification based 5 elements and urban areas were divided into 5 type (type 1 to type 5). Type 1 and type 2 urban areas were mainly managed by the Central, type 3 and type 4 urban areas were mainly managed by the provinces
and type 5 urban areas were mainly managed by the districts.
In 2001, the Government issued Decree No. 72/2001/NĐ-Cp dated 10/05/2001 on urban classification, urban classification under 5 criteria with 6 types of urban areas: Special type and type 1 to type 5.
In 2009, the Government issued Decree No. 42/2009/ NĐ--CP dated 05/01/2009 on urban classification. In which, determining that urban
areas include 6 types: special type, type I, II, III, IV, V with 6 criteria for classification. Compared to Decree 72/2001, there were supplements of criteria for landscape architecture.
Urban Planning Law took effect from 01/01/2010 providing that urban areas classified into 6 grades: special type, type I to type V
according to fundamental criteria: location, function, level of development; Population size; Population density; non-agricultural worker rate; infrastructural development level.
The decentralization of urban administrative management is determined:
- Centrally-run cities are special urban areas or type I urban areas.
- Provincially-run cities are type I or II, III urban areas.
- County towns are type III, IV urban areas.
- Towns are type IV, V urban areas.
Law on Organization of the local government approved by the National Assembly in 6/2015 and taking from 01.01.2016, Article 140
amended and supplemented the provisions of the Law on Urban Planning. Accordingly, the urban area was divided into 6 types: Special
type, Type I, II, III, IV, V under 5 criteria for defining administrative units including:
- Centrally-run provinces and cities.
- Provincially-run districts, towns or cities and centrally-run cities (new regulations).
- Communes, wards, towns.
- Special economic administrative units.
This law also stipulated that: classification of administrative units shall be based on the criteria of population, natural area, number of
subordinate administrative units, socioeconomic development level and special factors of each administrative unit in rural areas, urban areas and islands.
About urban administrative decentralization7:
- 7 5 centrally-run cities: Hanoi, Ho Chi Minh, Da Nang, Hai Phong and Can Tho.
- 67 provincially-run cities:
- 14 Grade I cities: Bien Hoa, Buon Me Thuot, Da Lat, Ha Long, Hue, My Tho, Nam Dinh, Nha Trang,
Quy Nhon City, Thai Nguyen, Thanh Hoa, Vietnam Tri, Vinh, and Vung Tau.
- 24 Grade II cities: Ba Ria, Bac Lieu, Bac Giang, Bac Ninh, Ca Mau, Cam Pha, Chau Doc, Dong Hoi,
Hai Duong, Lao Cai, Long Xuyen, Ninh Binh, Phan Rang - Thap Cham, Phan Thiet, Pleiku, Quang
Ngai, Rach, Tam Ky, Thai Binh, Thu Dau Mot, Tra Vinh, Tuy Hoa, Uong Bi and Vinh Yen.
- 29 Grade III cities: Bac Kan, Ben Tre, Bao Loc, Cam Ranh, Cao Bang, Cao Lanh, Dong Ha, Dien
Bien, Ha Giang, Ha Tinh, Hoa Binh, Hoi An, Hung Yen, Kon Tum, Lai Chau, Lang Son, Mong Cai,
Phu Ly, Sa Dec, Soc Trang, Son La, Song Cong, Tam Diep, Tan An, Tay Ninh, Tuyen Quang, Vi
Thanh, Vinh Long and Yen Bai.

22
There are two types of city:
- Centrally-run cities are administrative units being equivalent to the province,
under the management of the Central.
- Provincially-run cities are administrative units being equivalent to the district,
under the management of the district, basically urban areas grade III or higher
are the cities.
Townships are administrative units being equivalent to the district. If being under the
centrally-run cities, they are equivalent of the urban district (inner city) or suburban
district (outskirt). Provincially-run townships are equivalent to cities under the
province or district. The townships are urban areas grade III or grade IV.
Towns are administrative units being equivalent to the commune; are urban areas
grade IV or grade V.
By December 2015, there were 787 urban areas nationally, including:
- 51 county towns7 including (12 Grade III urban areas and 39 Grade IV urban areas): An Khe, An Nhon,
Ayunpa, Ba Don, Ben Cat, Bim Son, Binh Long, Binh Minh, Buon Ho, Cai Lay, Chi Linh, Cua Lo, Di
An, Duyen Hai, Dien Ban, Dong Trieu, Dong Xoai, Gia Nghia, Gia Rai, Go Cong, Ha Tien, Hoang
Mai, Hong Linh, Hong Ngu, Huong Thuy, Huong Tra, Kien Tuong, Ky Anh, La Gi, Long Khanh,
Long My, Muong Lay, Nga Bay, Nga Nam , Nghia Lo, Ninh Hoa, Pho Yen, Phu Tho, Phuc Yen,
Phuoc Long, Quang Tri, Quang Yen, Sam Son, Song Cau, Son Tay, Tan Chau, Tan Uyen, Thai Hoa,
Thuan An, Tu Son and Vinh Chau.
- and 664 towns (in which including 34 Grade IV towns and urban areas).

23
Figure 1 3: Urban system chart by decentralization
Source: Vietnam Institute for Urban and rural Planning, VIUP, MOC

24
About urban classification:
By 12/20158 the country had 787 urban areas, of which 2 special urban areas, 16 grade
I urban areas, 24 type II urban areas, 41 type III urban areas and 73 type IV urban
areas and 631 type V urban areas. Under Decision 445/QD-TTg dated 07/4/2009
approving the overall planning orientations of urban system development in Vietnam
to 2025 and vision to 2050, the Vietnam urban system developed with lightning speed,
specifically, under the plan to 2015, total national urban areas will be 870, in 2025,
there will be 1,000 urban areas nationwide. Statistics above indicate that although
Vietnam urban areas thrive, they have not reached the expected plan (2015). The
period of 2015 - 2025 (for 10 years), Vietnam will have more 213 urban areas (1000
urban areas - 787 urban areas), the speed is equivalent to about 1.8 urban areas/ 01
month. With such rapid growth speed, the legal requirements on urban classification
must be closely, united and ensure practical requirements as well as the scientific
criteria for an administrative unit becoming an urban area.
Chart 1 5: Comparison of urban distribution in 06 economic zones in Vietnam in 2009 and 2015
Regions
Special type Type I Type II Type III Type IV Type V Total
2009 2015 2009 2015 2009 2015 2009 2015 2009 2015 2009 2015 2009 2015
Midlands
and the
Northern
Mountains
0 0 0 2 2 2 7 12 10 7 144 167
Red river
delta
1 1 1 4 2 6 11 6 3 8 111 147
North
Central/
Central
Coast
0 0 3 8 3 2 9 9 6 18 146 183
Central
Highlands
0 0 0 2 2 1 2 3 4 10 47 63
South East 1 1 0 1 2 3 3 2 3 8 40 55
Mekong
Delta
0 0 1 1 1 7 9 10 8 22 126 166
Total 2 2 5 18 12 21 40 42 47 73 625 614 731 787
(Source: Urban Development Agency – MOC in 2015)
The practice shows that the urban classification and management decentralization
have contributed to promoting the development of Vietnam urban system. The Decree
42/2009/ND-CP showed some exists inconsistent with the laws issued thereafter
(especially compared to the Law on Local Administration Organization). Therefore, it
is required a replacing and adjusting decree. However, should identify 5 criteria as
stipulated in the Law on Local Administration Organization (Article 140) but should
comprehensively unify criteria and quantify each criterion corresponding to each type
of urban area.
8 Source: MOC.

25
Figure 1 4: Urban system chart by classification
Source: Vietnam Institute for Urban and rural Planning, VIUP, MOC
Identification of urban structure change
Many studies suggest that, morphologically, Vietnam urban area is like a transition
lasting from village to urban area under popular concept. Essentially, they are towns
including streets with tube houses, are the places for both living and production and

26
consumption of products... The old wards in Hanoi, Hoi An and Hue quite fully reflect
the social characteristics and structural morphology of Vietnamese traditional urban
structure.
The general trends of current Vietnam urban areas are rapid development, expansion
both in terms of land area scale and population size in other forms:
- Firstly, inner urban areas thrive off peripheral areas leading to adjusting the
boundaries of the urban areas (county towns, cities). This extension method
usually focus on urban areas grade IV when upgrading to urban areas grade III
and continuing upgrading to type II such as Bac Ninh, Bac Giang, Hung Yen,
Mong Cai, Lang Son and Lao Cai...
- Secondly, urban expansion on the basis of merging the administrative units
within the boundaries of a centrally-run province or city, or relating to the 2, 3
provinces... such as Do Son, Kien An merged into Hai Phong inner urban area;
Ngu Hanh Son and Hoa Vang merged into Danang inner urban area; merging
entire Ha Tay Province, Me Linh District (Vinh Phuc), 4 communes of Dong
Xuan, Tien Xuan, Yen Binh and Yen Trung (Luong Son District, Hoa Binh
Province) into Hanoi (with natural area of above 3.328 km2)...
Methods or trends taking place in the extensive margin on a national scale, even are
the ways to research urban development by merging a number of small urban areas
into a large attractive and central urban area to become an urban area with clear
boundaries, natures, functions and scale. The Projects such as constructing Vinh Phuc
urban area, expanding the boundaries of Dalat City or constructing Thua Thien Hue
becoming the provincial city/ urban area (under the model of "Urban sets or clusters")
are typical examples. The architecture and morphology of Vietnam urban areas
whereby change in space and component parts...
Basic urban forms in conversion process
Today, in addition to administrative factors, most Vietnam urban areas became urban
areas with aggregate functions in economy, culture, health, education, science and
technology. In particular, many urban areas became major economic centers of the
country, the region such as Ho Chi Minh City, Hanoi Capital, Hai Phong and Da
Nang... Urban areas are towards multi-center structure that is more flexible with
vitality and high competition. In particular, urban economy has contributed much to
the nation's overall growth. Economic opportunities in urban areas have been created
urban attraction, attract migratory and migrant flows and promote the growth of the
urban population. In contrast, the process of urbanization stimulates economic growth.
These are two mutual and closely related sides of the development process.
2.0.4. Urbanization ratio and implementation of National urban development
Strategies
Urban Population Ratio

27
According to the national Statistical Yearbook in 2014, the Vietnam's population was
90,728,900 people, of which the urban population of 30,035,400 people. The chart
below shows that Vietnam's urban population increased rapidly, 12.888 million people
in 1990 and 30.035 million people in 2014. Thus the urban population increased by an
average> 1.2 million people/ year.
Chart 1 6: Chart of population and urban population on the period of 1990-2014
(*)Population in 2010-2013 adjusted by Census and Housing in the midterm of 01/4/2014. Pham Thi Nham -
VIUP
In 2009, urbanization rate accounted for 29.6% and this was 33,1% in 2014; the
period 2009 - 2014, the average urban population growth was 3.26% / year, higher
than the population growth rate in rural areas (0.05% / year). Thus, for last over 15
years, the urban population of Vietnam has had clear growth in both the number and
percentage. Overall, the provinces and cities have the urban population growth, in
both the number and percentage, or some places increase in number, but not increase
in percentage due to too quick growth of rural population.
Chart 1 7: Urban population rate and population growth rate per year in the period of 2009-
2014 by socioeconomic regions.
Unit: %
Socioeconomic regions Population rate in the city Population growth rate per year in
period of 2009-2014
2009 2014 City Sub-urban
Whole country 29.6 33.1 3.26 0.05
Midlands and Northern mountains 15.9 17 2.46 0.74
Red River Delta 29.3 33.8 3.88 -0.24
North Central and Central Coast 24 27.1 3.06 -0.14
Central Highlands 28.2 29.1 2.05 1.23
South East 57.2 62.3 3.92 -0.3
Mekong Delta 22.8 24.7 1.92 -0.13
Source: Census of population and housing in Vietnam 4/2014

28
The urban population is unevenly distributed, concentrated mainly in two special type
urban areas and 15 Type I urban areas (about 14.8 million people) accounted for 49%
of the population in urban centers nationally. Urbanization concentrated highest in the
Southeast region (62.3%), lowest in Midlands and Northern mountainous region
(17%). Of centrally-run provinces with cities had high rate of urban population, the
highest one was Ho Chi Minh City, accounting for 83%, Binh Duong accounted for
71.6%, Quang Ninh accounted for 68.86%, ... The provinces with lowest urban
population rate nationwide included: Thai Binh accounted for 10.7%, Tuyen Quang
accounted for 12.41%, Son La accounted for 13.7%, Bac Giang accounted for 13.05%
... This was a great challenge for urban areas on housing, labor and employment,
social infrastructure, technical infrastructure and environment.
Figure 1 5: Map of urban habitant percentage in 2014 by the Provinces
Source: Vietnam Institute for Urban and rural Planning, VIUP, MOC
Population density

29
Chart 1 8: Population and population density by socio-economic regions in 2014
Socioeconomic regions Territory
(%)
Population
(%)
Population density
(people/km2)
Difference
2009-2014
(people)
Whole country 100 100 273 14
Midlands and Northern mountains 28.8 12.9 122 6
Red River Delta 6.4 22.8 981 51
North Central and Central Coast 44.9 21.5 203 7
Central Highlands 16.5 6.1 101 8
South East 7.1 17.4 666 72
Mekong Delta 12.3 19.3 432 9
Source: Data on area (km2) taken from “GSO Yearbook 2013”, Statistics Publisher, 6-2014
Census data in 2014 shows that the whole country's average population density 9
is
273 people/ km2 compared to 259 people/km2 in 2009. After 15 years, the national
population density has increased by 14 people / km2. If population density in 2009
was 1.0 time in 2009, then it was 1.4 time in 2014. The data showed that Vietnam's
population was unevenly distributed and there were large differences by region. Red
River Delta and Mekong Delta were places with fertile soil and favorable agricultural
conditions, the infrastructure was quite complete and up to 42.1% of the country's
population living here, while the area of these two regions accounted for only 17% of
the country. In contrast, the Midlands and northern mountainous and Central
Highlands, are the difficult upland areas, where the ethnic minority live, accounted for
only 19% of the population of the country, while the area accounted for 47%.
9 Population density is average pupolation in per square kilometer of the territory, calculated by dividing the
population (time or average time) of a certain residential area by territorial area of that region. The calculation
formula: population density (people / km2) = Number of population (people) territorial area (km2) - GSO

30
Figure 1 6: Population density chart by province in 2014
Source: Vietnam Institute for Urban and rural Planning, VIUP, MOC
Population density among localities had many changes caused by the growing
naturally and mechanically in population scale. In 2014, out of 63 administrative
units, there were 61 provinces and cities had increased density, only 2 provinces
decreased the density (compared with figures in 2009) as Thai Binh and Vinh Long.
Calculating absolute quantity, Ho Chi Minh City had highest population density
increase of 3.796 people/ km2, within 15 years has increased 397 people/ km2.
Localities with high increase level were Hanoi (2126 people/ km2, increasing
compared to 2009 as 200 people/ km2), Lao Cai (increasing 8 people/ km2), Thai
Nguyen (increasing 13 people / km2), Bac Giang (increasing 15 people / km2), Hai
Phong (increasing 67 people/ km2), Bac Ninh (increasing 122 people / km2), Hai
Duong (increasing 139 people/ km2), Hung Yen (increasing 27 people / km2), Binh
Duong (increasing 689 people / km2), Can Tho (increasing 33 people / km2) or Dong
Nai (increasing 57 people / km2), Vung Tau (increasing 29 people / km2) ... Localities
with higher density than the national average number related to the strong mechanical
increase process for 15 recent years. The largest immigration regions in our country in

31
the last 15 years have been South East and Central Highlands. Southeast Economic
Region has 6 administrative units, then the 5 provinces and cities have the higher
population density growth rate than national average number and only Tay Ninh
province has the lower average growth rate than national average number.
In the last 15 years (2009- 2014), under the impact of the market economy, our
country's population had redistributed on a large scale and with strong intensity within
the country. The localities of the Red River Delta and the South East had the highest
increase, and population density increase of these regions was due to mechanical
increase. This indicates that, compared with 2009, the population distribution was
more complicated: the difference between regions fell, but the difference between the
provinces and cities increased. Thus, the change in density and population distribution
influenced the population structure of each region as well as the rational use of natural
resources and human resources. The state should have policies to control the
mechanical increase in the South East region and the Central Highlands in order to
limit the negative impact caused by the mechanical increase.
Development under orientations/ strategies and plannings
Of two phases of urban outbreak in Vietnam, the modes of urban development in the
second outbreak phases have had more strategic orientation (development framework)
basically. It is expressed in the decisions of Vietnam government as Decision No. 10/
QD - TTg in 1998 approving the overall relations of Vietnam urban system to 2020,
and Decision No. 445/ QD - TTg dated 07/4/2009 approving adjustments of overall
relation orientation of Vietnam urban system to 2025, vision to 2050. With Decision
No. 10, Vietnam has developed small and medium urban areas, and controlled the
growth of large cities. The Decision No. 445 encouraged development capabilities of
large urban areas, as growth pole of a concentrated urbanization area. The current
view is to develop a system of cohesive urban network in which each urban plays a
role in the urban economy of a region and the whole country. However, the legality of
above-mentioned decision is not high, not binding and can only be regarded as the
strategically oriented declarations... The urban development under projects (different
scale from several investors with different capacities and experiences and operated
under different mechanisms) without specifying the actual development needs of
urban areas in the regional relationship and multispectral interests... has left urban
system and urbanization quality in Vietnam many shortcomings.
Spontaneous and uncontrolled development
Former Prime Minister Nguyen Sinh Hung (previous Chairman of National Assembly
of the Socialist Republic of Vietnam) said that: “Vietnam will have a unique
opportunity for urbanization in the right direction. In case of failure in urbanization,
we will fail in industrialization and modernization” (The speech at the National Urban
Conference, dated 6 -7/11/2009)… That partly proved that in thirty years of
innovation, although Vietnam has obtained a certain number of achievements,
accomplished some Millennium goals proposed by the United Nations such as the
average growth rate and poverty reduction… consequences left for Vietnam were
unsustainable development, wasteful use of natural resources, increase of
environmental pollution ... and a society lacking of transparency (corruption, loss and
confidence declining…). Accordingly urban development is impatient, spontaneous
and uncontrolled ... (Urban development along the roads, suburban areas and

32
urbanized villages). The appearance of urban and rural architecture is lacking of
regional identities and particularities. The urban living quality has not kept pace with
new development requirements.

33
2.1. Urban population
2.1.1. Population of urban areas
According to Decree 42/ND-CP, the urban population is the population of the administrative boundaries of the urban areas, including inner city, suburban, urban areas and towns. Full-scale urban population includes resident population and temporary population converted. The population residing temporarily from 6 months or older is counted as resident population. The population residing temporarily under 6 months is not under the urban population living in urban areas converted into urban population.
According to Decree 42 on urban classification, population norms played an important role in deciding the urban scale and 21/49 indicators were related to the population, accounting for 50/ 100 points upon urban classification. Centrally-run cities (Hanoi, Ho Chi Minh City, Can Tho, Da Nang and Hai Phong) accounted for 21.24% of the urban population nationwide.
Chart 1 9: Urban population change of the whole country and 5 centrally-run cities
(1,000 people)
Tổng số Thành thị
1999 2009 Sơ bộ 2014 1999 2009 Sơ bộ 2014
CẢ NƯỚC 76.596,7 86.025,0 90.728,9 18.081,6 25.584,7 30.035,4
Hà Nội 2.685,0 6.472,0 7.095,9 1.552,1 2.652,8 3.156,0
Hải Phòng 1.676,7 1.840,4 1.946,0 571,8 848,5 909,1
Ðà Nẵng 687,3 894,5 1.007,7 541,5 777,0 879,5
TP.Hồ Chí Minh 5.073,1 7.196,1 7.981,9 4.244,9 6.020,8 6.554,7
Cần Thơ 1.816,8 1.188,6 1.238,3 387,3 783,2 825,9
Note: The period of 1995 - 2003, the data of Lai Chau province includes one of Dien Bien province, the data of
Dak Lak province includes one of Dak Nong province, the data of Can Tho city includes one of Hau Giang
province. From 2008 to now, the data of Hanoi city includes one of Ha Tay province. (*) Population in 2010-
2013 adjusted by Census and Housing in the midterm of 01/4/2014.
Compared the Decree 42 on urban classification of urban areas 10 under
10
The Decree No. 42 on urban classification: Cities Grade I with population scale from: 500 thousand
people and over; Cities Grade II with population: from 300 thousand people and over; Cities Grade III with
population: from 150 thousand people and over; Cities Grade II with population: from 50 thousand people
and over.
Under the investigation of Proect NUDS.
- Cities Grade I: Population from 196,008 – 354,544 people: Thanh Hóa (349,681 people) ; Hạ Long
(232,005 people); Việt Trì (196,008 people) ; Thái Nguyên (296,000 people); Nam Định (249,865
people); Vũng Tàu (314,919 people); Đà Lạt (217,720 people); Huế (354,544 people);
- Cities Grade II Population from 116,903 – 236,068 people: Bắc Giang(151,383 people); Bắc Ninh
(186,017people); Thái Bình(199,261people); Đồng Hới (116,903people); Phan Rang - Tháp Chàm
(170,720people); Bà Rịa (100,698people); Pleiku (224,664people); Bạc Liêu (153,266 people); Rạch Giá
(236,068people); Cà Mau (222,425 people)
- Cities Grade III Population from 31,605 – 130,044 people: Lai Châu (36,247people); Sông Công (52,056
people); Hà Giang ( 53,097 people); Tam Điệp (57,765 people) Phúc Yên (96,459 people); Cửa Lò
(54,614 people); Gia Nghĩa (54,494 people) Tây Ninh (130,044 people); Đồng Xoài (100,100 people); Vị
Thanh (75,017 people); Lấp Vò (31,605people);

34
investigation of NUDS project, most urban areas grade I to IV reached the maximum 75% of the population under the provisions.
Chart 1 10: Total population of urban area and inner city of 39 urban areas (not Hanoi and
HCMC) in 2014
Source: Investigation data of 41 urban areas of NUDS project
After 7 years of implementation, the Decree 42 on urban classification, indicator population are no longer consistent with reality. Many localities, because of the purpose of urban upgrading, used administrative measures to expand urban boundaries in order to increase the population norms, this has created many problems in urban management later in land management, public investment, labor and employment supply and basic social infrastructure for the population from rural areas to the urban environment.
2.1.2. Migration
Reduced migration.
Under the mid-term census program in 2014, the number of migrants in the period of
2009-2014 decreased compared to the period of 2004-2009 following the types of
migration in and between the districts, and in and between provinces (Table of
migration situation).
- Cities grade IV with Population Scale from 11,409 – 453,389 people: Sa Pa (58,214 people); Mỹ Hào
(152,605 people); Chũ (22,925 people); Phú Phong (31,367 people); (Chư Sê (29,475 people); Đăk Mil
(11,409 people); Thuận An ( 453,389 people); Núi Sập (19,363 people);

35
Chart 1 11: Number of migrants at the age of 5 or higher divided by migration status in
period of 1999, 2009 and 2014.
South East Region continued attracting immigrants
In 2009, there were only 2 immigration areas as Central Highlands and South East
(number of immigrants was larger number of migrants), the remaining 4 regions were
migration areas. By 2014, in addition to 2 immigration areas like in 2009, the Red
River Delta became the region with quite low immigration rate. After 5 years, the
South East continued to be a place attracting immigrants, of which, the economic
leading of HCM City was still an attractive destination of whole country labor.
Among immigrants to the South East, many people may come to study, improve
skills, mainly in HCMC.
Chart 1 12: Migration rate in the 5 years preceding the survey divided by 6 socioeconomic
regions, 2009-2014
Socioeconomic regions Immigration rate in 5 years
before the survey (%)
Emigration rate in 5 years
before the survey (%)
Net migration rate in 5 years
before the survey (%)
2009 2014 2009 2014 2009 2014
Whole country 30.1 19.6 30.1 19.6 0 0
Midlands and Northern
mountains
9.1 6.2 27.0 14.3 -17.9 -8.1
Red River Delta 16.1 10.4 18.5 10.1 -2.3 0.3
North Central and
Central Coast
6.4 10.0 44.8 24.9 -38.4 -15.0
Central Highlands 36.3 18.8 27.4 17.8 8.9 1.0
South East 126.7 70.8 9.7 13.9 117.0 56.9
Mekong Delta 4.4 4.5 46.5 34.3 -42.1 -29.7
Sources: Population and housing investigation in 2009, 2014
In 2014, there were 14 in 63 provinces with net migration rate (+), the rest had net
migration rate (-). There were 4 in 6 provinces in the Southeast region achieving (+)
except for Binh Phuoc and Tay Ninh, of which, the highest number was in Binh
Duong (+52 migrants/ 1000 people). In Central Highlands, the Dak Nong was (+36),
these provinces should have appropriate policies for ensuring living conditions for
immigrants such as housing, employment and schools ... The provinces with net
migration rate (-) in the Mekong Delta were Bac Lieu, Ca Mau, Hau Giang (-14), Soc
Trang (-9), An Giang (-8); the provinces in Midlands and Northern mountains were (-)
except for Dien Bien.

36
2.1.3. Urbanization growth
Continuing the trend of rapidly urban population increase.
On 1/4/2014, Vietnam had about 33.1% of the population living in urban areas,
increased by 3.5% compared to 2009. In the period of 2009-2014, the urban
population increased rapidly with the average rate of 3.26% / year. The proportion of
urban population in Vietnam was lower than the Southeast Asian countries, such as
Brunei (76%), Malaysia (71%), Philippines (63%), Indonesia (50%), Thailand (47 %),
Laos (34%), Cambodia (20%), East Timor (30%) and Myanmar (31%). The process
of urbanization not only took place in terms of quantity such as urban population
growth, territorial expansion, growth on production, but also expressed in terms of
quality and raising standards of living, enriching stereotypes and cultural needs. There
are two opposite forms of urbanization process in the world; for developed countries,
urbanization form is diffusion. This means that urban people tend to return to live in
the peripheral areas; for developing country such as Vietnam, the rural people flock
into urban areas for working and living.
Chart 1 13: Migration flows between urban and rural areas, 2014
No. of people and migration direction (thousand
people
Effect of rural-urban migration on
population growth rate (%)
Rural to urban
area Urban to rural
area Rural to urban
area Urban to rural area Rural to urban area
1,837 785 1,025 -0.35 0.7
The rate of urbanization in Vietnam increased continuously from 19.2% in 1979,
19.4% in 1989, 23.61% in 1999, 29.6% in 2009, 33.1% in 2014, if it remains this
speed to 2020 of 40% each year, Vietnam will increase 1 million people more living
in urban areas. There were three main reasons for urban areas population growth: (1)
re-dividing the administrative boundaries (suburban districts transferred into districts
and communes transferred into wards), (2) immigration, (3) natural urban population
growth; there is currently no statistical survey to determine how much of % every
reason stated accounting for. This showed that a large migration flow from rural to
urban areas taking part in urbanization process and changing administrative
boundaries lead many rural areas to become urban areas.
The distribution of the urban population is relatively equal proportional to
the population size of each region in the country.
Period 1999-2009: in South East and Central Highlands, the urbanization rate did not
change; but in the Red River Delta, Central and the Mekong Delta, the urbanization
rate increased higher. Period 2009-2014, in all 6 socioeconomic regions, the
urbanization rate increased relatively equal. The South East was the region with the
highest urbanization rate of 62.3%, nearly 2 times more than Red River Delta.
Chart 1 14: Number of population in 2014, urbanization rate divided by socioeconomic
regions (1999-2009-2014)
Socioeconomic
regions
Population
in 2014
(thousand
people)
Urban
population
in 2014
(thousand
people)
Urbanization rate (%)
1999 2009
Growth
1999-
2009 2014
Growth
2009-
2014
Midlands and 11.634 1.983 13,8 16 +16% 17

37
northern mountains Red River Delta 20.650 6.970 21,1 29,2 +38% 33,8
Central 19.482 5.277 18,4 24,1 +31% 27,1
Central Highlands 5.505 1.601 26,7 27,8 +4% 29,1
South East 15.721 9.787 55,1 57,1 +4% 62,3
Mekong Delta 17.502 4.321 17,1 22,8 33% 24,7
Total 90.493 29.939 23,5 29,6 26% 33,1
Source: Pham Thi Nham, Vietnam Institute for Urban and Rural Planning - Ministry of Construction
Migration trend from rural to urban areas transferred from small into large
distance.
Urban growth took place in all regions in proportion corresponding with the size of
the urban areas. This growth did not reverse imbalances but reinforce the urban
population distribution balanced by socio-economic regions.
In 1990, Vietnam's urban areas accounted for about 5% of the area and <20% of the
population. At this time, Ho Chi Minh City is the only urban area with the population
>1 million population, Hanoi under the threshold of 50 ten thousand to 1 million
people, there were 18 urban areas with the population of 10-50 ten thousand people,
remaining 42 urban areas with the population <10 ten thousand people.
In 2009 (after 20 years), Vietnam's urban population was estimated to account for
<30% of the population. However, in Mekong Delta, Can Tho City had low
population growth rate generally.
The population in 2015 (after 6 years thereafter) accounted for 35%. So far, there are
7.1 million people in HCM City (the highest level in the country), followed by Hanoi
with 6.5 million people (of which 3.8 million are rural residents). This population of
the two cities accounted for 1/3 of the total urban population and 1/10 of the national
population.
In the period of 1999-2009, the migration from rural to urban areas took place in a
narrow radius; rural people moved out the countryside to live in the inner provincial
neighboring urban areas, so the total population of the province was almost
unchanged. People did not completely leave their countryside to the city; they went to
the cities and back home in the same day. This was a buffer step to move gradually to
urban areas for living without facing too many risks. Only when there was a stable
job, they were formally decided. The small cities were places with jobs, modern life
and new habits and from that center, spreading to the peripheral areas, but maintaining
the suburb areas.
Thus, the data shows that 1/3 of the urban population lived in the two large cities, 1/3
of them lived in about 100 medium and large urban areas (population from 50 ten
thousand to 1 million people), the remain 1/3 of them lived in small urban areas (<5
ten thousand people). There was an urban area each 30 km in Red River Delta and
South East, and the urban areas in Midlands and Northern mountains and Central
Highlands were sparser.
From 2009 onwards, Vietnamese people began to tend to migrate from rural to urban
areas with large distances, i.e. migrating in one go from the countryside to the large
cities without going through intermediate level of adjacent small cities. So one of the
challenges in the near future is that: In the coming years, Vietnam's urban population
will increase by about 1 million people each year, so it is necessary to strengthen the

38
network of intermediate cities. Getting this done will be an opportunity for Vietnam to
regulate the population distribution, limit the urban disease of big head, especially two
big heads; and an additional benefit is that: Large urban areas can rely on the satellite
urban areas, they are not the suburbs but really qualified urban areas to participate in
the economic growth of large urban areas. These urban areas also have their own
suburbs and such suburbs play an independent role and help urban areas to benefit
from large urban areas. The traffic plays an important role in regional connection.
2.1.4. Migration to big cities.
The immigration is the migration flow from rural to urban areas occurred mainly in
large cities, especially Hanoi and HCMC. There are 2 forms of immigration:
Spontaneous immigration derived from the demand of employment or family
reunification or seasonally temporary residence to earn extra income at agricultural
leisure; Immigrants often find jobs in the informal economic area. Organized
immigration form occurs in urban areas with large service centers, rapidly developed
industrial parks, where needs the number of young and healthy employees, mostly
trained at the secondary level or higher...
For immigrants: Due to difficult access to jobs and living in new and unusual urban
environment with precarious life, the urban poor areas or "daredevil hamlet" and
"slum" zones encroaching from farmland, ponds and marshes are usually primary
residence of immigrants. For urban authorities: The massive migration helped urban
areas have further cheap workforce. However, urban areas face pressures in order
management and urban safety, difficulties in funds to provide basic public services
and address the increase of social evils and environmental pollution. The Vietnam
urban areas continue being on the strong momentum, attracting migrants from rural to
urban areas. It is needed to build a fair, comprehensive and complete immigration
policy in order immigrants become a good opportunity for sustainable urban
development.
Chart 1 15: Chart of population growth in government center cities 2009-2014 (%)
2009 2010 2011 2012 2013 Basic 2014
WHOLE country 1.06 1.07 1.05 1.08 1.07 1.08
Hà Nội 1.41 2.50 1.93 1.54 1.63 1.70
Hải Phòng 0.89 0.94 1.19 1.29 1.11 1.08
Đà Nẵng 2.96 3.15 2.53 2.14 2.12 2.11
HCM City 3.61 2.09 2.07 2.16 2.08 2.07
Cantho 0.65 0.78 0.84 0.85 0.83 0.80
Source: GSO
Chart 1 16: Chart of immigration and migration and net migration in Government center
cities (%o)
Tỷ suất nhập cư Tỷ suất xuất cư Tỷ suất di cư thuần
2009 2010 2011 2012 2013
Sơ
bộ
2014 2009 2010 2011 2012 2013
Sơ
bộ
2014 2009 2010 2011 2012 2013
Sơ
bộ
2014
Hà
Nội 13,1 10,8 11,0 6,1 7,7 7,5 3,2 4,9 6,4 3,3 7,4 7,8 9,9 5,9 4,7 2,7 0,3 -0,4

39
Tỷ suất nhập cư Tỷ suất xuất cư Tỷ suất di cư thuần
2009 2010 2011 2012 2013
Sơ
bộ
2014 2009 2010 2011 2012 2013
Sơ
bộ
2014 2009 2010 2011 2012 2013
Sơ
bộ
2014
Hải
Phòng 5,6 7,0 7,1 6,0 6,6 4,0 3,8 3,8 5,0 2,1 4,0 3,4 1,8 3,2 2,1 3,9 2,5 0,6
Đà
Nẵng 20,1 29,8 22,8 17,5 15,5 14,0 4,8 3,4 7,9 6,3 9,7 13,8 15,3 26,4 14,9 11,2 5,8 0,2
TP. Hồ
Chí Minh 31,3 26,2 25,0 14,8 16,5 16,9 4,2 7,8 13,5 7,2 10,3 11,4 27,1 18,3 11,5 7,6 6,2 5,5
Cần Thơ 10,2 9,8 6,9 8,9 9,6 8,2 9,5 11,5 11,0 7,1 13,6 11,4 0,6 -1,7 -4,1 1,7 -4,0 -3,2
Sources: GOS
Hanoi solves immigration problems and the uneven distribution of population
in districts
Since 1990, after a long period to focus development within the urban districts, Hanoi
has grown strongly. The rapid growth of urban and industrial projects contributed to
the process of urban expansion to the suburban areas with areal density. In 2008,
Hanoi was merged together with entire Ha Tay province and some communes of Long
Son district, Hoa Binh province, Me Linh district of Vinh Phuc province. This aimed
to better control of urban development and looked forward to the becoming a major
urban area of Hanoi. Capital construction planning are mounted with Construction
planning of the regions with efficiently public transport network to connect satellite
urban areas to central urban areas and form the new centers on the principles of TOD.
The population size increased constantly, this number in 2013 reached 6,933,940
people. Considering the population density of the total natural area (expanded Hanoi),
the concentration of population indicators of Hanoi had no serious problem compared
to urban areas in the region. Currently, compared with other ASEAN countries,
Vietnam is a country with 3rd largest population, Hanoi is also the capital ranking 3rd
in population but the proportion of citizens of the capital compared with the national
population only ranked 5th with 7.81%, lower than Cambodia (16.4%) and Laos
(11.5%).
Hanoi concentrated overloaded in the old urban districts: Of the population
density, in 2013, Hanoi reached 2,086 people / km2, much lower than Tokyo (Japan):
5,940 people/km2; but Hanoi encountered problems such as traffic congestion,
environmental pollution (2 of 10 most polluted cities in the world and many other
social issues). Due to uneven population distribution in Hanoi, concentrated in the
urban districts and repressed many works for administrative activities, training, health
care at central and regional level; while transport infrastructure and green space area
were not commensurate with the population size and urban activities. For example, the
density of Dong Da District was 38, 936 people / km2, Hai Ba Truing: 30, 842 people
/ km2; Thanh Xian, Ba Dinh, Hogan Kym, Cau Gay had a population density of 20,
000 people / km2. While in many districts, the population density was about 1, 000
people / km2.
The too large population gathering in some core districts of Hanoi Capital
caused many "urban issues", causing difficulties for policy makers and citizens.
Tokyo is a great urban area with over 13 million people, the average density is almost

40
3 times higher than Hanoi, with 23 special zones, and 26 cities in the west of Tokyo;
but the population is "spread out", so there is no high-density area like central districts
of Hanoi; there are 12 of 23 special urban areas with the density of about 15,000
people/ km2 such as: Macao is an area with the highest population density of 20,130
people/ km2, only by over half of the density of Dong Da district (Hanoi), this means
that the population distribution in Tokyo Hanoi is much more evenly than in Hanoi.
At the same time, Tokyo is well supported by a modern public transport system.
Thus, besides the issue of resolving immigration, Hanoi must concern the issue
of "population conditioning”. The general planning of the construction of Hanoi
Capital expanded mentioned this issue: "historically reducing urban population from
1.2 million to 0.8 million people"; however, this policy is at risk of bankruptcy, due to
policies to encourage investment and urban reconstruction in the renovation of old
apartments and relocation plans of universities, central health facilities and offices of
the central ministries.
Ho Chi Minh City
Transformation of the economy to be achieved the ambition of becoming one of the
largest urbanized areas in the Asia Pacific make Ho Chi Minh City resolve many
challenges. The expansion of urban space associates with the migration from rural to
urban areas; the increase of the spontaneous residential areas and modern construction
works meet a very dynamic real estate market.
From 1970 until now 11
a number of immigrants have accounted for 1/3 of population
at the age of 18 or more. The majority of immigrants are at a young age. According to
population survey results, of 1 million people to Ho Chi Minh City, there are 66% at
the age of 18-29 years old. This young labor source changes the population structure
towards rejuvenation and bringd the potential benefits of labor and human resources
of the city.
Population in HCMC is distributed unevenly across regions, from 1999 until now, the
population in the inner city districts has decreased, while in suburban districts and new
districts, the population has developed rapidly. Mechanical growth of population in
the city occurs strongly, which is very difficult to control. For example, in Binh Chanh
district, in some years, its population has increased over 30,000 people, equivalent to
population of one commune.
The rapid population growth leads to spreading urban development, land and real
estate speculation in the city center and suburbs. On the other hand, Ho Chi Minh City
is one of the heavily influenced cities in the world for flooding (under the report
published by Christian Aid); despite being protected by a system of dikes and
drainage projects.
The major challenges in terms of infrastructure and urban services were the
construction of housing for the elimination of temporary housing, reduction of road
system and public transport development; ensured that people can access to clean
water, build waste water treatment systems and treat solid waste.
11
Under the researched content of Dr. Trần Hữu Quang- City Development Intitute

41
Thus 12
, in the conversion process of economy, there were many urban areas expanded
rapidly on the scale of space and population, population density in inner urban areas
was increasing. However this process of expansion and growth did not occur evenly
throughout the urban system which mainly takes place in big cities such as Hanoi and
Ho Chi Minh City, in many small and medium-sized urban areas, the process of
population declines due to migration to large urban centers. In the period of 2000-
2010, the population of Ho Chi Minh City rose to 2.5 million people (3.9% annually),
and this number in Hanoi was 2.1 million people (4.8% annually).
12
Urban Development Agency.

42
2.2. Housing
2.2.1. Characteristics of status of housing development in urban areas of
Vietnam.
Vietnam has gone through many different phases of housing policies. From 1975 to
1994, the official housing of Vietnam was managed through concentrated planning
regimes, the state implemented construction of all official housing but they met only
about 5% of total housings, the rest is self-built housing of the public.
Since the Renovation, the housing sector has changed the orientation of the market
and developed strongly, but only focused on providing and getting middle-level and
senior commercial housing for people with average and high income, the poor has not
access to housing. In 1994, the state applied a policy of land use rights, commercial
housing model began to appear on the market. In the period of 1994 and 1998, the
supply of housing was performed by the state-owned enterprises, since 1998, supply
of commercial housing for the private construction contractors has mainly made. The
status of real estate bubble in the period of 2009 and 2012 helped make the market
price more reasonable. Housing price reduced the most in the high and intermediate
segments. Real estate bubble shifted from the speculative senior market to the housing
sector with reasonable price. The 30-tribillion stimulus package initiated by the
Ministry of Construction helped reorient the market, which made real estate
investment enterprise shift to average income housing with reasonable prices for
people who had real needs for housing ownership. Time after years of crisis, it will be
an opportunity for Vietnam to move to a new phase of housing policy, focus on
overcoming the weaknesses of the market, affordability problems of people with the
lowest income, as well as improve the efficiency of public expenditure.
In recent years, a number and indicator of housing area per capita have always had a
high growth rate. Before issuing the Housing Law in 2005, in the whole country, there
was more than 709 million m2 of housing, until at the end of 2012, there was about
1,685 million m2 of housing. The average housing area increased from more than 9m2
/ person to about 19m2 / person. (Report on the implementation of the Housing Law in
2005 of the Ministry of Construction - 2014).
Chart 1 17: Actual status of housing
Area/year Total number of
households
A number of households
With housing % Without
housing
%
2009
The whole
country
22,198,922 22,186,275 99,94 12,647 0.06
Urban areas 6,761,476 6,756,726 99,93 4,750 0.07
Rural areas 15,437,446 15,429,549 99,95 7,897 0.05
2014
The whole
country
24,265,000 24,022,350 99,9 242,650 0.1
Urban areas 8,233,724 8,233,724 100 x x
Rural areas 16,031,266 16,031,266 100 x x
(Source: Survey of population and housing in the middle period on April 01, 2014 – General Statistic
Office of Vietnam)
The quantity and quality of housing were increasingly high. Besides, the development

43
of low-rise housing models such as villas, town-lot housings, adjacent housing, in
many regions focused on developing the high-rise condominiums (condominium ratio
in the whole country reached approximately 3.72%, where the condominium ratio was
the highest and reached 16.64% in Hanoi). The apartments were designed with
comfortable space and modern furniture.
Chart 1 18: Changes on construction of housing in Vietnam
Source: Reasonable housing price in Vietnam (WB)
Currently, the ratio of commercial housing and housing with government support was
estimated to account for between 20 and 25% of the total number of built housing, the
rest was built by the public. According to the statistics of population and housing in
the middle of the period in 2014, an average number of housing in 2009 reached
320,000 housing and 500,000 housings in 2014; the average housing area increased
from 70.3m2 (2009) up to 84 m2 (2014) and total average floor area in each year
reached 23 million m2 (2009) to 35 million m2 (2014); area per capita reached
19.2m2 (2009) to 23m2 (2014).
Chart 1 19 Table on an average number of housing in each year in the urban areas
Housing indicators in urban areas 2009 2014
Housing supply source (m2) 476 689
Per capita (m2) 19.2 23.0
An average number of people in each
household
3.66 3.64
Average housing area (m2) 70.3 83.7
An average number of area as built in each
year (million m2)
23 35
An average number of housing as built in
each year (housing)
about 320,000 about 500,000
Source: General Statistic Office of Vietnam
2.2.2. Frame of institutions and policies on housing
Frame of institutions
Role of Central Government and Ministries:
In 2008, the Government established the Central Steering Committee on housing
and issued policies of real estate market for the purpose of assessing the activities,
market trends and guiding the formulation of laws and policies related to housing
and real estate markets.
Ministry of Construction advised the government to develop the national housing
policies, strategies and programs and to supervise and guide the implementation of
the programs, and enforce regulations; direct the preparation of the database in the
field of housing and collect data about the performance of the housing sector from
local authorities and other parties. Due to the characteristic nature in the field of

44
housing, preparing the policies should require the participation of the central
ministries such as the Ministry of Finance, Ministry of Planning and Investment,
the Ministry of Natural Resources and Environment, State Bank of Vietnam, Bank
for Social policies of Vietnam and the Ministry of Transport. Currently, the
government agencies still operate relatively independently in the field of housing
in collaboration with the reporting system in the identifiable situations, which has
limited the Ministry of Construction in promoting cooperation and preparation of
saving and integrated housing programs. As results, many programs have been
fragmented and faced difficulties in monitoring and evaluating the results.
In addition, current information and data relating to housing was sporadic and
unstable to prepare public policies and perform investment decisions. In the private
market, the international real estate companies collected data on housing supply.
Fir local government agencies, Hanoi and HCM City Ministries of Construction
began preparing the report of housing price changes on apartment segment of the
investors in the districts. The Ministry of Construction was also in the process of
developing a housing and real estate information collection system as the Housing
Law in 2015 and the Decision 134 of the Prime Minister.
Roles of local regions:
The building housing resources were in troubles because the budget was limited,
and local government agencies were still embarrassed due to not giving specific
guidance from the national level agencies on implementing the national programs
in local regions. Establishing a Fund for Local Housing Development in recent
years has not been appropriate with goals of the national policies and
implementation at the local level13
.
Housing policies
Along with the transition of the economy, as transition from public housing policy
- a form of social welfare and mainly provided freely by the government
organizations into housing policy to be regulated by market mechanisms. Reform
of housing policy development as follows:
Housing Ordinance in 1991 established the legal framework for housing rights,
allowing ownership of private houses on land owned by the state. In 1994, the
Government issued the Decree No. 61/1994 / ND-CP on firstly allowing to
purchase housing and enabling the beginning of the real estate sector in accordance
with the market mechanism. The Housing Law in 2005 provided the legal
framework for the construction of commercial housing, self-built housing, public
offices and social housing. The Housing Law in 2015 supplemented provisions on
social housing, foreign ownership; housing transactions, housing data and
information systems; referring to housing for people with low income with
appropriate price.
13 According to the Decree No 90/2006/ND-CP, the Fund of Local Housing Development in local regions was established in the provincial
level and funded via sales of public offices, rental of housing, land use fees and distribution of the local budget. After 8 years of
implementation, there were 9 established Funds of Local Housing Development, only two of them performed main activities due to the
limited budget from the local government agencies. In 2014, Ministry of Finance proposed consolidation of Funds of Local Housing Development into Fund of Local Development Investment, and then it became local performance agencies which was improved and funded
more. In comparison, Funds of Local Development Investment obtained a specific legal responsibility; exempted income taxes, managed via
close coordination between People‟s Committee of the province, Ministry of Planning and Investment and Ministry of Finance on standards
of purchase, financial plans and performing the projects. Some Funds of Local Development Investment participated in the social housing
projects such as dormitories for students.

45
Currently, the housing distribution system of Vietnam had three main forms:
commercial, leased housing and self-built housing.
Box 1 3: The development of the housing policy of Vietnam
2.2.3. Lack of urban housing
There are two main reasons leading to lack of housing including 14
:
- Generate approximately 37.4 thousand housing/ year due to increased
households living in urban areas;
- Replace about 320.000-1 million housings due to renovation or demolition for
new construction because of low quality;
Population growth trends and the formation of new families are the main causes of the
shortage in the number of houses. A number of urban households are forecasted to
increase by 1.9 million, from 8.3 million in 2015 to 10.1 million in 2020. This leads to
lack of 37.4 thousand housings in each year in the next 5 years. The increase is mainly
because the growth rate of urban population is predicted to be> 3% / year and a
reduction in the scale of urban households by 1.09% / year.
Chart 1 20: Table on a number of urban households under the year and 6 socio-economic
zones Year Total
number
of
househo
lds in
urban
areas
Hanoi HCMC Red
river
delta
Norther
n
Midlan
d and
mounta
inous
region
Central
region
Highla
nd
region
Southe
ast
region
Mekong
river
delta
2009 6,470 715 1,441 1,572 521 1,155 362 1,952 932
Expected in 8,269 911 1,766 2,026 642 1,429 440 2,619 1,143
14
Source: Appropriate housing price of Vietnam–WB.

46
2015
Forecasted in
2020
10,138 1,123 2,084 2,507 759 1,698 515 3,358 1,350
Average annual
increase (%)
374 42 64 96 23 54 15 148 41
Annual increase
(total%)
100% 11% 17% 26% 6% 14% 4% 40% 11%
Source: Appropriate housing price of Vietnam – WB
Urban areas will account for the majority of new housing demands in the period of
2015 and 2020. The ratio of immigrants in urban areas is forecasted to reach 23.7%.
The South East and the Red River Delta Regions where Hanoi City and HCMC are
expected to account for 66% of the total housing shortage in the period of 2015 and
2020. Specially, the Southeast region has a very high rate of immigration in the past 5
years due to rapid economic growth and concentration of industrial zones in 4 of 6
provinces (Binh Duong, Dong Nai, Vung Tau and Ho Chi Minh City). A similar
situation is in the Red River delta, a high labor demand makes it become a destination
for immigrants in the past 5 years.
Vietnam will need to make maintenance and upgrade or reconstruction of housing to
solve the shortage of quality. On an annualized basis, 32 thousand-1 million housings
/ year should be added, housing shortage is due to the lack of access to basic
infrastructure, the old and overcrowded housing and the unsatisfactory building
materials as used.
The deficit on housing quality is mainly due to two main types of housing: (i) the non-
permanent housing, and (ii) housing lacking basic services. The non-permanent
housing accounts for 46% of the total shortage and is defined as the housing which is
missing one or all three permanent components (frame structure, ceiling and walls)
made from solid materials. The housing lacking of basic services such as clean water,
sanitation services accounts for 35% of the total shortage. The non-permanent housing
is mainly located at the Southeast region and the Mekong river Delta where the solid
materials are not routinely used. This classification is consistent with international
standards set by the UN Habitat organization, the lack of permanent roofing materials
(3.7 million housings) is not seemed to be a priority issue because of temperate
climate in the southern. On the other hand, the lack of basic services such as clean
water and sanitation services is common in the regions and the main concern.
Chart 1 21: Table on shortage of housing quality under urban areas
Điều tra dân số năm 2009 Khu vực thành thị (100%)
Đông đúc <6m2/người
Nhà chia sẻ
4%
8%
Chất lượng Không vĩnh cửu
Trước năm 1975
46%
7%
Dịch vụ cơ bản Không nước sạch
Không vệ sinh
23%
12%
Source: General Statistic Office of Vietnam
Special priorities in order to solve shortage on the quality 15
, including:
Install infrastructure and utilities with low costs to resolve the problems with 2
million housings lacking of access to basic services such as clean water and
15
Source: Department of Housing, Ministry of Construction.

47
sanitation facilities.
Renovate housing built by substandard materials, accounting for 46% of the total
shortage.
Upgrade and gradually expand housings built before 1975, accounting for about
643,000 housings to solve overcrowding and substandard building materials.
Expand or newly provide for overcrowded housings, accounting for 12% of the
total shortage.
Make resettlement of housings in unsafe areas which should be considered in
consultation with the community.
Thus, despite continuous economic growth, Vietnam is still facing shortage of housing
quality. Today, approximately 20% (nearly 4.8 million households) of the total 24.2
million households of Vietnam still live in poverty. Population growth and
urbanization has exceeded the ability of the Government to ensure that all citizens
have access to safe housing at the right price. The proportion of the urban population
is estimated to account for 50% in 2020, it means that Vietnam should have about
374,000 apartments in the cities, with the number of urban households which is
estimated to increase by 10.1 million households by 2020 (from 8.3 million in 2015).
Chart 1 22: Table on poverty in urban areas according to the classification of urban
and rural areas in 2012 Special
city
City
type 1
City
type 2
City
type 3
Urban
area
types 4
and 5
Rural
areas
A number of urban areas 2 7 14 45 634
Average population
(thousand people)
4,075 467 225 86 11
% of the total population 9.5 3.8 3.7 4.5 8.1 70.4
% of urban population 32.1 12.9 12.4 12.3 27.3
Percentage of poor
households (%)
1.9 3.8 4.2 5.8 11.2 25.6
Poverty gap (%) 0.4 0.6 0.7 1.1 2.4 6.8
Ratio of the urban poor 11.0 8.8 9.2 5.9 55.0
Source: Assessment of poverty of Vietnam in 2012
Demand for new housing has been and will continue to focus on a few large cities and
industrial zones. Hanoi City and Ho Chi Minh City will lead the urban development
with more than 50% of the urban area of the whole country which is concentrated in
two cities, and 75% growth in new urban space is concentrated in here. The Red River
Delta region (including Hanoi) and Southeast region (including Ho Chi Minh City)
accounts for about 2/3 of the annual housing demand, equivalent to 244,000 of a total
374,000 departments.
The too big and too fast focus and enlargement of population density while planning
of renovation and development of urban technical infrastructure, outdated living space
is the general problem of current Vietnam urban areas (collectively referred to as
"urban big head disease"). It has been causing serious consequences proved by Hanoi
and Ho Chi Minh City.

48
1. Cannot manage the situation of massive and arbitrary construction development
resulting in larger number of housing built without license.
2. Cannot meet the housing needs of all classes of the population, especially the poor.
3. Architectural landscape is unsystematic and variegated.
4. Cannot forecast and manage the stability of population size.
Demand for renting housing is still high and continues to increase in urban areas.
According to the total population survey in 2014, the leased housing accounts for
about 8.7% of Vietnam's housing fund. Demand for renting housing is concentrated in
urban areas (up to 26% in HCMC), mainly among immigrants (64% of immigrants
live in HCMC and Hanoi City in leased housings), young families and households
with low income. The proportion of households in the house rented and borrowed
from urban areas was 4 times higher in rural areas, respectively 18.1% and 3.9%.
Demand for temporary housing or leased housing solutions is estimated to increase as
Vietnam is increasingly more urbanized, a number of students and migrant workers
increase, a number of people at the age of marriage increase, and many young people
later want to live in the cities. Leased housing at the right price in Vietnam is largely
informal with small-scale and does not meet the standards. The fact that many
households do not obtain stable and official use rights which causes a significant
impact on their livelihood opportunities and increases the risk of poverty, especially
immigrants. Although demand continues to increase, but sources of proving leased
housing with appropriate housing are also limited due to low affordability, many legal
barriers, and the difficulties for the private sector in setting up projects with good
financial possibility, impeding their participation and that the landlords cannot change
their informal status.
Workers in industrial zones account for a large proportion of the demand for leased
housing. In the third quarter of 2014, of 15.8 total million people working in urban
areas, 3.05 million people was working in the manufacturing sector with 2.25 million
workers in 295 industrial parks and 15 economic zones in the whole country16
. Of
the total number of workers in the industrial parks, around 40% people were at the age
of 15 to 29 and about 78% equivalent to1.6 million people renting housing. According
to estimates, official supply sources only met 10% of demand for leased housing, it
showed that most people shall rent informal housings, and a large amount of demand
was not met in industrial zones on renting housing with appropriate price and basic
housing for beginning working.
2.2.4. Ability to access to housing with appropriate price
Despite high demand as mentioned above, but the formal housing solutions are still
outside the affordability of people with low income. Analysis of affordability is based
on income groups shows that only people in the highest income group can pay for
commercial apartments built by the project owners. The 30 trillion stimulus package
has expanded affordability for households with average incomes significantly
reducing fixed interest rate down to below the market price, but also leading to high
costs for the State. However, according to Table 1, the standard apartments are still
outside the affordability of the lower income groups, especially with 40% of the
population in the lowest income segments and people with informal income and use
16
General Statistic Office of Vietnam. Report of surveying labor forces in the 3rd
quarter of 2014

49
rights. Chart 1 23: Analysis the expense capacity based on Quintile of city household income
Restriction on access to housing finance is a major obstacle in improving the
affordability of the people. The market has still many segments which do not satisfy
the conditions of financial capability and therefore cannot have access to housing
finance. 68% of the workforce is in the freelance group and therefore they are not
eligible for collateral. Informal housing owners, the poor and people with low
repayment capacity is similar to that. The initiatives on housing finance and lending
channels are essential to meet the needs of this market segment, with the support of
long-term financing. Moreover, the deterioration of the real estate market in 2009-
2012 revealed systemic weaknesses in the mortgage market. Hence, it is vital to
improve the system of collateral declaration, establish the tools of monitoring early
indicators for this area and strengthen the precautionary principles in order to help
maintain the stability of the market. These will be important measures to prevent risks
in accordance with the market cycles as growth and investment return to the real
estate.
Shortage of land supply sources is the major obstacle to the ability to build housing
with appropriate price. Every year, the demand for urban land is estimated to reach
11,500 hectares. Official supply source today is difficult to keep up with the demand,
making land price rise and restrict affordability of the people. The legal framework on
land is currently cumbersome, complex and inefficient. The major challenges in the
implementation of land with suitable infrastructure, including: (i) difficulties for the
government in mobilizing vacant and undeveloped land in cities; (Ii) the debate about
actual land recovery and compensation from the State; (Iii) the challenges of enforcing
and monitoring the implementation of regulations on 20% of land funds; (Iv) lack of
land valuation tools to deduct the value for new projects; and (v) lack of master
planning of land use and collaboration with key Ministries (Ministry of Construction,
Ministry of Natural Resources and Environment, Ministry of Transport, Ministry of
Planning and Investment).
Vietnam's land tax rates are currently very low, contributing to speculation and
increased land prices. Land tax accounts for only 2-3% of the total revenues of the
state due to the low tax rates and lower valuations than the market price of land by the
provincial people's committee in land prices. This significantly reduces the revenues
to provide services, infrastructure and funds for other public programs. Finally, the
implementation of the provision on spending 20% of land fund for social housing
development under the Decree No 188 is also difficult because of weak enforcement
capacity of local authorities, delay of the project owner and non-preparation of

50
procedures for the efficient management and utilization of this land fund.
The current housing program has some positive results, but most of these programs
are still in the implementation phase and unclear results. There are about a dozen of
housing programs which are being implemented. These programs are largely
successful in promoting privatization and supporting a large number of households,
especially the 30-trillion program, the program of reducing flood risks in Mekong
River Delta and rehabilitation programs to support housing for rural families with low
income. However, most of these programs are individually designed for different
target groups, using separate implementation channels which are not coordinated with
other programs in the same field and have no clear accounting mechanism to public
expenditure. Some programs are very difficult to access to financial resources
necessary for implementing, and other programs are implemented with high economic
costs for the government. In general, housing policy has not focused on the urban
poor. These programs need to be improved in order to achieve greater efficiency
through the consolidation of the system of implementing and focusing on developing
the broad market segment rather than just implementing a few separated groups.
2.2.5. Importance of informal housing:
Currently, there are many families living in urban areas which cannot afford to pay for
housing under private ownership, and also are not eligible for social housing property,
the number of informal settlement areas has increased rapidly in urban areas and
beside the urban areas over the years, mainly to meet the needs of the poor and
migrants - who have no permanent residence registration in the cities. Approximately
80% of housings in the urban areas are believed to be built by the owner, which are
mainly informal housings - often do not pay attention to the regulations on planning
and construction, as well as no supporting infrastructure accordingly. In Ho Chi Minh
City and Hanoi city, many people are living in unsuitable housing.
Chart 1 24: Table proportion of urban residents living in slums. Year Urban residents living in slums
% Total (million people)
1990 60.5 8.2
1995 54.6 8.85
2000 48.8 9.4
2005 41.3 9.5
2007 38.3 9.4
2009 35.2 9.22 Source: United Nations.
For informal housing, there are three following characteristics: (a) land for informal
housing is acquired from the informal land market, and come from the conversion of
agricultural land in the urban areas; (b) the informal housing is built by the owners
themselves, or by a developer for the purpose of sales or lease; and (c) the
governmental agencies often provide basic services for the areas of informal
development. People living in informal housing are workers in industrial zones,
because they are entitled to very low salary and most businesses do not provide
housing for them. Therefore, there are many leased housings with cheap price near
these areas; normally one-story house, divided into separate rooms, with common
bathroom and toilet; living conditions are not stable.

51
2.2.6. Upgrade and reduction of slums
In recent years, governmental agencies are converting the approach to the informal
housing areas, from the removal of informal housing, relocation of people living in the
informal areas into public housing for people with low income, the recognition of the
said housing, providing services and upgrading informal settlement areas.
In Ho Chi Minh City, the relocation of the population is not too common, excepting
for the informal housing along the canals in the city center. To increase the urban
landscape, the city has implemented two programs related to informal housing:
(a) Program "Cleaning the canals", relocation of thousands of families living along
this area; (b) Program "Replace Slums", the informal housing areas along the canals in
the city will be demolished for the construction of water and sewage systems; people
are moved to resettlement areas of the city.
In 2000, the government sought international assistance in upgrading informal
housing. Cities Alliance (CA) agreed to finance the in-depth studies, to evaluate the
limitations on housing and infrastructure that the urban poor are facing; review the
upcoming international and national urban upgrading programs, prepare an action plan
for Can Tho city; and prepare a national strategy to upgrade and provide housing and
services for the urban poor ... Ministry of Construction, based on previous studies has
prepared "Guidelines on preparation, management and implementation of the upgrade
projects in poor urban areas with the involvement of the community. "
In 2004, the World Bank agreed to finance the "urban upgrading project in Vietnam".
Based on a number of areas lacking of infrastructure, low income and the level of
enthusiasm of the cities participating in the project, the government selected Ho Chi
Minh City, Can Tho, Hai Phong and Nam Dinh to implement the project. This project
included the following components: upgrade infrastructure at the third level; Major
infrastructure, additional main infrastructure and the secondary infrastructure; the
resettlement housings; land and housing management; loans to upgrade housing; and
capacity development. The Bank contributed 382 million US dollars, while the
government contributed 140 million USD. The project was implemented in 2004, and
by the end of the project, 295 low-income areas were upgraded and the direct benefits
for 2.5 million people are gained, and indirectly benefit for 5 million people (Source:
World Bank, 2015: 1).
After the success of urban upgrading project in Vietnam, the government has decided
to improve the approach and through National Urban Upgrading Programme (NUUP)
in 2009. Through the NUUP, the World Bank continued to agree to fund the urban
upgrading project in the 2nd
stage, this project was launched in 2012. The project was
implemented in 8 cities in the Mekong River Delta. Although the project had a very
large scale, this was only the beginning. The need to do is to set out a methodical and
scientific approach to identify and classify the areas to be upgraded, figure out each
approach to each specific area, raise capital, raise active involvement of the
community, and help people see the positive results of the project.
"The National Urban Upgrading Programme until 2020" included the participation of
95 urban areas ranked Class IV or higher. The main objective of the program is to
serve the housing sector out of the planning, enable people to upgrade housing and
support for the legalization of land use. Due to high standards, the construction of low

52
cost housing for local people is impossible. The only solution is to strengthen the
existing housing both legally (through land ownership) and technically (through the
services, public facilities, quality of construction). With the formalization of the areas
out of the planning, the government will abandon land development planning in the
future, in the expanded urban areas.

53
2.3. Urban land
2.3.1. Overview of urban land
- Under QCXDVN 01: 2008/BXD:
Urban natural land includes urban land and suburban land. Urban land is the land in
cities, townships and towns. Suburban land is planned and approved by competent
state agencies to develop urban development managed as urban land.
The land area for urban construction is the construction land of urban functional areas
(including the system of urban infrastructure).
Residential land is in the residential zones, offices and schools not under the urban
administrative management, centers, public service areas, rest areas and, trees.
- According to Dr. Pham Si Liem:
Urban land includes land, water and a certain space above and below it in the urban
range. As the case that urban land could be interpreted as: 1/ land built in urban areas;
2/ land planned in urban areas and 3/ land in urban administrative boundaries, i.e.
including the suburban areas.
Overivew on urban land-use
The process of urban land development is associated with the process of urbanization;
urban land is used for many different purposes, meets the economic, social and
environmental interests. Currently, the state is managing urban land in the legal
framework with the Law on Land, Law on Construction, Law on Housing, Law on
Real Estate Business and Law on Urban Planning; all urban areas are overall planned.
The process of "Reform" so far, along with growing urbanization, urban construction
land has expanded and flourished, especially when Vietnam is striving to soon
become industrialized and modernized nation by 2020, at that time, the rate of
urbanization continues to increase up to 35-40%.
In the mechanism of market, urban land is of an important significance for the
development of the national economy. Currently, urban land and land in rural
residential areas and dedicated land account for> 7.5% of the whole country. Over 15-
20 next years, the rate of urbanization in the country continues to increase, very large
land is required to use for urban development.
Currently, the management of urban land and urban construction land in Vietnam is
inadequate. The norm of urban land use is not uniform, very low of 45-50m2/ person
in the center of big urban areas (Hanoi and HCMC). This norm is very large even>
20m2/ person in small urban areas or extension area. In urban residential areas with
about >1-2 million people, land use process is very complex and has many conflicts.
Effectiveness of land use is very low for 3 aspects of economic, social and
environmental protection.
In order to ensure sustainable development, the institutionalization of urban land
should continue to be strengthened further in the process of restructuring the economy
and transforming the growth model in Vietnam. There must be a reasonable policy in
the whole country in general and each area in particular to ensure the use of urban and
rural land for the purposes of socio-economic development. And also, urban areas

54
must have their own policies to manage and use land in a reasonable way in the
market mechanism for the management of the State.
2.3.2. Legal framework
Management of urban land in Vietnam in the past has mainly been based on the
construction plans as studied and a number of legal documents issued by the State.
Nevertheless, the planning has not been renewed; urban planning research has been
still largely based on the state budget resources. Therefore, in substance, urban
planning has not really come to life, not met the needs of socioeconomic development
towards innovation.
Previously, land policies and legal documents such as land law has not been fully
studied, therefore, management has faced many difficulties. In 1988, when the Land
Law was announced as a prerequisite for the launch of the directives, decrees and
circulars to guide management of land, including urban land. The 1992 Constitution
asserts that "Land is the property of the State, under public ownership. The State
agrees to manage the whole land. Organizations and individuals may transfer the
rights of land use in accordance with laws ".
Amended Land Law in 1993, firstly confirms in Article 11 of Chapter I of the
classification of land, urban land is considered one of 6 types of land managed by the
State (agricultural land, forest land, rural residential land, urban land, dedicated land,
unused land). Management and use of land use has been developed with the formation
of the cadastral agencies from the central to local levels and a series of new policies in
order to solve difficulties on land use in urban areas.
Land Law in 2013 has overcome avoidance of planning overlapping, stipulated
linkages between land use planning and urban planning in the districts in Paragraph 5
of Article 40, namely: "For the districts with urban planning approved by the
competent state agencies, it is not required to prepare land use planning but prepare
annual land use plan; if urban planning of the district is not in accordance with area as
distributed in the provincial level land use planning, the urban planning shall be
adjusted in accordance with provincial level land use planning”.
The main challenges for the legal framework in the field of land are the complexity
and inconsistency of the procedures, the implementation and enforcement. The
provisions set out in relevant codes and laws have inconsistency. Example: Ministry
of Construction is responsible for planning, housing construction and real estate
market, urban development and land use planning, while the Ministry of Natural
Resources and Environment guides policies on land and land management, the
Ministry of Home Affairs is responsible for setting the boundaries of the urban areas
and the Ministry of Finance is responsible for financial policies, including land tax
and other real estate related. The cases of inconsistency between laws and their
implementation, which is overlapping responsibility and the lack of coordination
causing inefficiencies in land management, are widely recognized, but difficult to
change.
2.3.3. The pressure on land and urban development and expansion of the
suburbs.
Urban land is a tool for urban development, budget revenues:

55
Land is seen as a development tool serving the process of industrialization and
urbanization in the country. The transition of economy, increased demand and open
policies to attract foreign investors has contributed to strong growth of construction
activities and land prices, especially in big cities in delta areas, which has more
limited land resources. Over the years, the land has become one of the investment
areas of interest, and most lucrative, thus creating many different investment
strategies. According to research results on state budget revenues (the state budget), if
the total income of the land in 2002 was just 5486 billion (accounting for 4.43% of
state budget revenues), the 2010 is 67,767 billion (accounting for 11.21%). In 2011,
despite the socio-economic situation facing many difficulties, the total revenues
(excluding registration fee of houses and land) has reached 60,633 billion (accounting
for 8.07%) and reached 53,952 billion in 2012 (accounting for 7.26%)17
.
Thus, although land is still considered jointly owned by the State, the transfer of land
use rights has become a huge source of income for the localities. The control of land,
tax regime tied to the land and investment in infrastructure projects in this field
become the major challenges that local governments have to deal with, that is: How to
create a land bank for large-scale projects? How to secure the land rights? How to use
the land fund for the efficiency of investment in infrastructure construction and urban
planning? Limited supply contribute to increasing real estate prices and reducing
affordability, particularly causing adverse impacts on the poverty reduction efforts of
urban governments. These are great pressures on local authorities in making decisions
to expand the boundaries of urban administration to peri-urban areas.
On the other hand, land use and urban planning efforts in the provinces are mostly
focused on the development of suburban areas with heterogeneous development in
terms of use, density and income. The development of large-scale, non-connectivity
and single-performance in the suburbs leads to the chaotic and inefficient urban
management in the cities; issues including distance and travel time between residential
areas and place of work or the access to other urban amenities, increases the
congestion, pollution and risks leading to social discontent of the lower income strata.
To solve this problem, there should be unified planning solutions and decision-making
in a transparent manner involving the mixed use, mixed-income and high-medium
density development - as well as linkage to public cheap transportation option to
support sustainable urban development.
2.3.4. Land prices and urban construction land.
The planning in Vietnam is asynchronous in management and execution time between
systems of construction planning - land planning, it is difficult to control the
movement of agricultural land in urban land into urban construction land. This leads
to the existence of two systems of price of land at the same time (the official price
frame and according to market prices), make the clearance process more difficult and
interest groups on land raise. The processes related to land (recovery, compensation,
etc...) between the State and the people is done on the basis of official land price
frame with the aim of regulating the price of land. Land price framework, the Ministry
of Finance determined on a national scale, the Departments of Finance determined at
the local level, but this price frame tends to gradually approach to the market price;
specific land price frame will affect the clearance.
17
Online Investment - 19/11/2013. Tu An. Each year the state budget will get 70.000 billion from land

56
There is currently no mechanism for determining the value of the conversion or real
estate investment; but in fact there are significant changes in land prices due to the
government's measures to convert the land use purpose from agricultural land into
land for urban construction18
. For example, in Binh Chanh District, land prices
increased 50 times since land was converted from agricultural land to residential land.
Thus the state management tools for the management of land and tax collection has
not kept pace with the growth of demand, real estate development, and urban
expansion and land transactions. The main reasons are: (i) the boundary for urban
development is limited due to being controlled by construction planning; (ii)
undeveloped and vacant land due to holding, speculation, and lack of enforcement of
state for the ongoing cases not building on their land; (iii) lack of investment in public
transport, particularly large public transport; (iv) the land tax rate is not appropriate to
create opportunities for land speculation and reduce the opportunity of the State
budget revenues from land in the process of urbanization.
2.3.5. Land Management under construction planning
The planning standards for the civil construction sector are generally appropriate,
but we need to tighten the management of allocation of land to delayed
investments.
The area of land for urban construction: According to current figures, many inner-
city/urban areas have 50-60% of unused or empty land agricultural for urban
development. Indicator of land for urban construction partly shows the development
of urban centers and waste in mining and developing land in urban areas. Chart 1 25: Chart of land for urban construction (divided by 6 economic regions and by
urban grade classification)Compared to national standards and regulations on construction.
0
500
1000
1500
2000
2500
3000
3500
4000
4500
5000
TP H
à G
iang
TP Bắc
Gia
ng
TP Thá
i Ngu
yên
TP việt
Trì
TP Lai
Châ
u
TX S
ông
Côn
g
TT Sa Pa
TT Chũ
TP H
à Nội
TP Bắc
Nin
h
TP Hạ Lon
g
TP Thá
i Bìn
h
TP N
am Địn
h
TX T
am Đ
iệp
TX P
húc Y
ên
TT Mỹ
Hào
TP Tha
nh H
óa
TP Đồn
g Hới
TP H
uế
Đà Nẵn
g
PR-T
háp
Chà
m
Tx cử
a Lò
TT Phú
Pho
ng
TP Ple
iku
TP Đ
à Lạ
t
TX G
ia N
ghĩa
TT Chư
Sê
TT Phước
An
TP H
CM
TP Bà Rịa
TP Vũn
g Tàu
TP Tây
Nin
h
TX Đồn
g X
oài
TX T
huận
An
Cần
Thơ
TP Vị T
hanh
TP Bạc
Liê
u
TP Cà M
au
TP Rạc
h G
iá
TT Cần
Đướ
c
TT Lấp
Vò
Diện tích đất xây dựng đô thị (ha)
Chart 1 26: Chart of area of land for urban construction in Centrally-run 4 cities
0
2000
4000
6000
8000
10000
12000
14000
16000
18000
20000
TP Hà Nội TP HCM Đà Nẵng Cần Thơ
Diện tích đất xây dựng đô thị (ha)
Civil land area per capita: Civil lands include construction land for housing, the
public service works, streets, squares etc... to serve the needs of housing, leisure,
18 World Bank. Qualitative research on self-provided housing. 2014.

57
recreation of the people of the cities. By nature of use, civil land the city is divided
into 4 main categories:
- Land for housing construction includes house construction land, roads, system of
buildings for public service, trees within the housing areas.
- Land for the construction of public service works: including construction land
serving trade, culture, health, education etc... beyond housing areas.
- Land for roads and squares, also known as domestic transport land.
- Land for urban trees includes land for building the parks, flower gardens of the cities
and residential areas.
This index shows the level of concentration of population in urban areas, the
quality, and the living conditions of residents partly reflected the culture and habits of
the people living in that area. By the standards of Decree 42, civil land area per capita
of urban grade IV, III is 61-78m2/ capita; grade I, II and special grade 54-61m2/
capita. If the index is too small, the living conditions of people will be crowded,
residential land or public land, land for trees or transport ... are missing. If the index is
too big, there is a waste in construction investment, leading to difficulty in intensive
investment to improve the quality of life of urban residents. However, some of the
mountainous urban areas, this indicator may be higher than other areas due to living
habits of urban residents.
In general, the index in 41 surveyed cities is at a higher level compared to the standard
(Decree 42). Considering the index compared with urban grade, Hue City is the urban
area with the highest residential land area per capita (112 m2/ capita). Ca Mau City
has the most similar index to urban classification criteria (55m2/ capita). This
indicator varies according to the development characteristics of each urban area. At
the urban economic, industrial centers, the land area per capita will be relatively close
to the standard, such as Thai Nguyen City, the index is 69m2/ capita, exceeding the
lowest of grade I is 18% or as Thuan An Town is 79m2/ capita, the lowest of grade IV
urban areas with 18%. In small towns, with a less developed economy (generally
distributed in the Northern mountainous region or Central Highlands), this indicator is
often much larger than the standards for classification of urban centers of the same
grade. Ha Giang City is of 106m2/ capita, exceeding the minimum threshold of grade
III - 45%. Pleiku City is of 109m2/ capita, the lowest threshold of grade II - 58%. Chart 1 27: Chart of residential land per capita (divided by 6 economic regions and by
urban grade classification)
0
20
40
60
80
100
120
140
TP Hà G
iang
TP Bắc
Gian
g
TP Thái
Nguyên
TP việt
Trì
TP Lai
Châu
TX S
ông Công
TT Sa P
a
TT Chũ
TP Hà N
ội
TP Bắc
Nin
h
TP Hạ L
ong
TP Thái
Bình
TP Nam
Địn
h
TX Tam
Điệp
TX Phúc Y
ên
TT Mỹ
Hào
TP Than
h Hóa
TP Đồn
g Hới
TP Huế
Đà Nẵn
g
PR-Tháp
Chàm
Tx cửa L
ò
TT Phú P
hong
TP Plei
ku
TP Đà L
ạt
TX Gia
Nghĩa
TT Chư
Sê
TT Phước
An
TP HCM
TP Bà R
ịa
TP Vũn
g Tàu
TP Tây
Nin
h
TX Đồn
g Xoài
TX Thuậ
n An
Cần T
hơ
TP Vị T
hanh
TP Bạc
Liêu
TP Cà M
au
TP Rạc
h Giá
TT Cần
Đướ
c
TT Lấp
Vò
Đất dân dụng bình quân đầu người(m2/người)
Compared with the previous periods, the use of urban land is efficiency and savings,
higher residential density and accounted by area unit has created economic benefits.
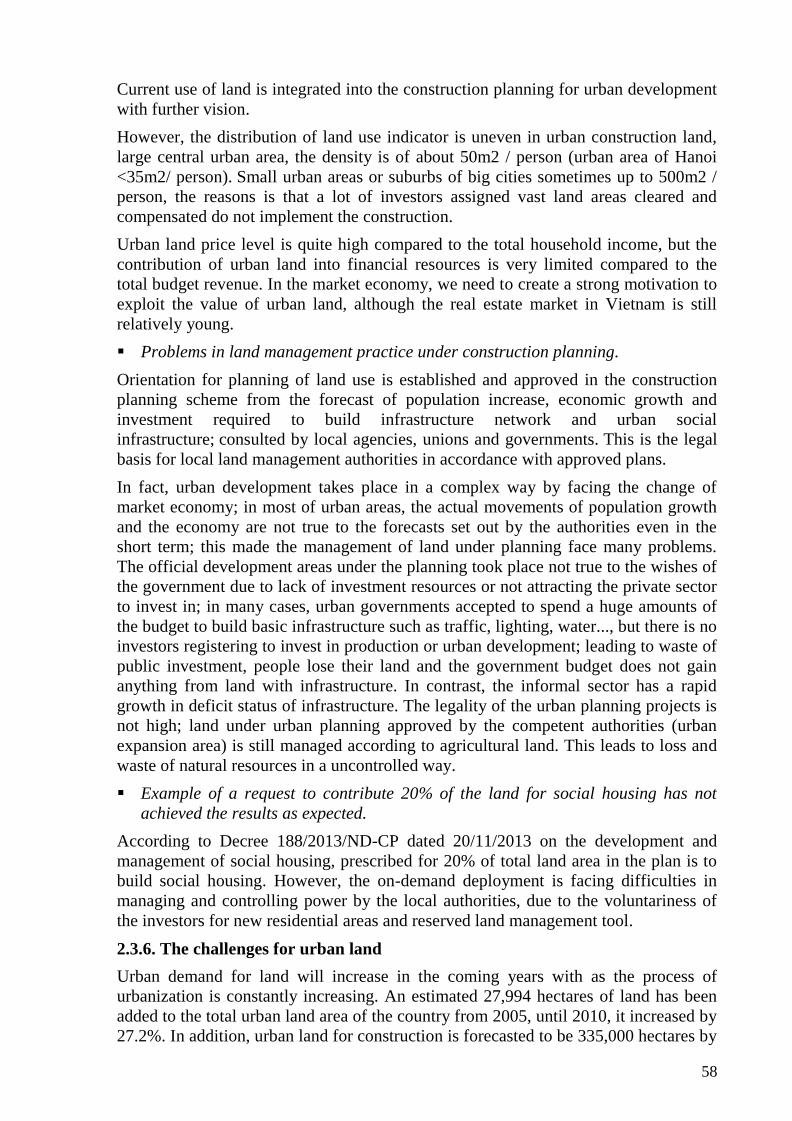
58
Current use of land is integrated into the construction planning for urban development
with further vision.
However, the distribution of land use indicator is uneven in urban construction land,
large central urban area, the density is of about 50m2 / person (urban area of Hanoi
<35m2/ person). Small urban areas or suburbs of big cities sometimes up to 500m2 /
person, the reasons is that a lot of investors assigned vast land areas cleared and
compensated do not implement the construction.
Urban land price level is quite high compared to the total household income, but the
contribution of urban land into financial resources is very limited compared to the
total budget revenue. In the market economy, we need to create a strong motivation to
exploit the value of urban land, although the real estate market in Vietnam is still
relatively young.
Problems in land management practice under construction planning.
Orientation for planning of land use is established and approved in the construction
planning scheme from the forecast of population increase, economic growth and
investment required to build infrastructure network and urban social
infrastructure; consulted by local agencies, unions and governments. This is the legal
basis for local land management authorities in accordance with approved plans.
In fact, urban development takes place in a complex way by facing the change of
market economy; in most of urban areas, the actual movements of population growth
and the economy are not true to the forecasts set out by the authorities even in the
short term; this made the management of land under planning face many problems.
The official development areas under the planning took place not true to the wishes of
the government due to lack of investment resources or not attracting the private sector
to invest in; in many cases, urban governments accepted to spend a huge amounts of
the budget to build basic infrastructure such as traffic, lighting, water..., but there is no
investors registering to invest in production or urban development; leading to waste of
public investment, people lose their land and the government budget does not gain
anything from land with infrastructure. In contrast, the informal sector has a rapid
growth in deficit status of infrastructure. The legality of the urban planning projects is
not high; land under urban planning approved by the competent authorities (urban
expansion area) is still managed according to agricultural land. This leads to loss and
waste of natural resources in a uncontrolled way.
Example of a request to contribute 20% of the land for social housing has not
achieved the results as expected.
According to Decree 188/2013/ND-CP dated 20/11/2013 on the development and
management of social housing, prescribed for 20% of total land area in the plan is to
build social housing. However, the on-demand deployment is facing difficulties in
managing and controlling power by the local authorities, due to the voluntariness of
the investors for new residential areas and reserved land management tool.
2.3.6. The challenges for urban land
Urban demand for land will increase in the coming years with as the process of
urbanization is constantly increasing. An estimated 27,994 hectares of land has been
added to the total urban land area of the country from 2005, until 2010, it increased by
27.2%. In addition, urban land for construction is forecasted to be 335,000 hectares by

59
the end of 2015 and 450,000 ha in 202519. This shows a significant increase of annual
growth rate of urban land and up to 11,500 ha / year.
Surveying land area reserved for development under long-term planning: Land area
reserved for development = construction land area forecasted development under
planning - land area for actual urban construction. For example, the actual civil land
area in Lai Chau city is 612ha, the urban construction land area under planning is
7077,4ha, so within the next 15-20 years, the construction land area will increase more
than 7 times.
Chart 1 28: Urban construction land area under planning
0.00
2000.00
4000.00
6000.00
8000.00
10000.00
12000.00
TP H
à G
iang
TP Bắc
Gia
ng
TP Thá
i Ngu
yên
TP việt
Trì
TP Lai
Châ
u
TX S
ông
Côn
g
TT Sa Pa
TT Chũ
TP H
à Nội
TP Bắc
Nin
h
TP Hạ Lon
g
TP Thá
i Bìn
h
TP N
am Địn
h
TX T
am Đ
iệp
TX P
húc Y
ên
TT Mỹ
Hào
TP Tha
nh H
óa
TP Đồn
g Hới
TP H
uế
Đà Nẵn
g
PR-T
háp
Chà
m
Tx cử
a Lò
TT Phú
Pho
ng
TP Ple
iku
TP Đ
à Lạ
t
TX G
ia N
ghĩa
TT Chư
Sê
TT Phước
An
TP H
CM
TP Bà Rịa
TP Vũn
g Tàu
TP Tây
Nin
h
TX Đồn
g X
oài
TX T
huận
An
Cần
Thơ
TP Vị T
hanh
TP Bạc
Liê
u
TP Cà M
au
TP Rạc
h G
iá
TT Cần
Đướ
c
TT Lấp
Vò
Diện tích đất XDĐT theo QH (ha)
Chart 1 29: Urban construction land area under planning in 4 centrally-run cities
0.00
10000.00
20000.00
30000.00
40000.00
50000.00
60000.00
TP Hà Nội TP HCM Đà Nẵng Cần Thơ
Diện tích đất xây dựng đô thị theo quy
hoạch dài hạn (ha)
Official supply not catching up with the needs of the market is pushing prices up. For
example, the price of land in central area of Hanoi at about 600-800 million/m220
This adversely affects the real estate sector in general and the self-built housing sector
in small scale for self-serving needs of low-income people in particular. This price
makes more households stand outside the formal market, increases the informal and
illegal construction status. The popularity of the appropriation, ownership, semiformal
and informal sales continue to make an unmanaged market, causing more difficulties
for the management and provision of land. So, for the management and sustainable
development of the market, we needs a comprehensive and unified land management
strategy.
19
Ministry of Natural Resources and Environment (2010) Report on Land Statistic, quoted in UNHabitat (2014:
81) „Dossier of Housing Region in Vietnam” Nairobi. 20
Purchasing power parity from 60,000 to 80,000 dollars, using purchasing power switching elements stylized
parity of 10,000, according to data extrapolated from the IMF in 2012

60
2.4. Urban technical infrastructure
2.4.1. Extensive transportation infrastructure.
In recent years, large-scale transport systems connect inter-urban (road, inland
waterways, sea, rail, aviation) has been invested in upgrading and maintenance. Road
density increases 0,66km a km2 in 2001 up to 0,77km a km2 in 2014. Seaport and
airport system is expanded, upgraded and new constructed that make transport
capacity increase up to 10 per cent a year. Many important works supporting for
industrialization and modernization such as expressways in key economic regions, the
north-south axis, urban ring roads, international airports, major sea ports have been in
constructed.
- Expressways: Hanoi - Hai Phong, Ha Noi - Thai Nguyen, Ha Noi - Lao Cai,
Saigon - Long Thanh - Dau Giay went into operation, preparing to construct the
expressway: Ben Luc - Long Thanh, Da Nang - Quang Ngai, Dau Giay - Phan
Thiet and is actively calling for the investment for: Ninh Binh - Thanh Hoa, Bien
Hoa - Vung Tau, Trung Luong - My Thuan - Can Tho ...
The time still remaining 6,000 km of road highway has not been on the level; there
are 566 bridges on the main national highway system; today has been the
construction of approximately 146 bridges replaced. 111 still very weak demand
should invest immediately, repairing 45 bridges need upgrading in 2012-2015 and
262 bridges in need of repair, upgrade and renovate the period 2016-2020.
- Railways have upgraded and shorten train (from 42 hours to 29 hours on the route
of North - South, from 10 hours to 8 hours on the route of Hanoi - Lao Cai).
However, the technical standard of almost routes are low, mainly due to build
during French colonial times with limited technical standards of narrow gauge of
1000mm (excluding new lines built in the north in the Cross 60-70 of 20th century
as Dong Anh - Luu Xa, Kep - Halong under the technical standard of 1,435mm
size, but also equivalent grade-3 rail way). The quality of infrastructure is weak
and out-dated in term of tunnels, station road, signal information, as well as
railway crossings, road and railway safety corridor. Consequently, the speed is
slow due to weak bridge and foundation, backward upstairs architecture, limited
traction locomotives due to short rain-lines approximately Ldd = 400m on routes
with high demand for transportation such as Yen Vien - Lao Cai, the North-South
route. Also, due to terrain conditions and extreme climates, it is often stormy
annual, erosion frequent landslides on the route Yen Vien - Lao Cai and central
railway North-South route.
- Waterway: Upgrading the route Ho Chi Minh City - Ca Mau and Ho Chi Minh
City - Kien Luong, water transport serving the Son La hydropower, the route Dong
Thap Muoi and Tu Giac Long Xuyen; The main rivers of Mekong Delta Region
and Red River Delta Region.
Currently inland waterways are still taking advantage of the natural conditions.
Due to large volume of dredging, lack of lead flow equipment, signal buoys
system, the biggest drawback is unequal-level on the major routes and curvature
radius makes limited clearance of river crossing equipments such as bridges,
culverts. Ports, terminals are in small-scale with low technical standards, low
mechanization of loading and unloading weak transportation system connecting

61
river ports with other modes of transport. Most of passengers ports are are
primitive like temporary terminals.
- Seaway: upgrading ports Cai Lan, Hai Phong, Cua Lo, Vung Ang, Tien Sa, Quy
Nhon, Nha Trang, Saigon, Can Tho and some local ports; meeting transportation
demand from 110 million tonnes in 2000 to 350 million tons in 2010. It is
resuming build international port of Cai Mep - Thi Vai, Lach Huyen port and flow
for large tonnage ships at the port of Can Tho.
Seaway: A current difficult is inadequacies asynchronous development between
the port and the port shipping lane of which limited stream depth is the main cause.
Lack of berths for large vessels, especially for container ships in the sea far lines:
Berth for over 5 thousand DWT vessels accounted for only 1.37% and mainly for
specialized goods, the vessel 1 ÷ 2 thousand DWT accounting for 21.43% (15.9%
general cargo); 1 ÷ 2 thousand DWT ships accounted for 39.72% DWT (general
cargo 24.31%); for less than 1 thousand DWT vessels accounted for 38.46%
(24.85% general cargo). Unless some new wharf was built and put into operation
after year 2006 are equipped with rather modern loading and unloading equipment;
but most still use the conventional unloading equipment, management and
administration of loading and unloading freight preserved with outdated
technology. The process of loading and unloading - management techniques -
outdated technology so productivity is low. Average loading capacity of general
goods is 3,000 ÷ 4,000 tons a meter of berth length, goods in container is 12 ÷ 25
barrels a crane in one hour occpying 50 – 60 per cent of the advanced ports in the
region.
- Airports: To renovate and upgrade the international airports as Noi Bai, Da Nang,
Tan Son Nhat, Can Tho, Cam Ranh, Phu Bai, Phu Quoc, inland airports as Phu
Cat, Con Son, Vinh, Dien Bien, Dong Hoi, Lien Khuong, Pleiku to meet the
demand of passenger transport capacity from 4.9 million passengers in 2000 up to
41.8 million passengers in 2010.
Carriage:
Passenger transport volume has increased from 821.8 million passenger turns in 2001
to 2201.3 million passenger turns in 2010 and its average growth rate get 11.6 per cent
a year; the carried passengers has increased from 35,624.2 million turns a kilometer
in 2001 to 98,079 million turns a kilometer in 2010, an average growth rate get 11.9%
a year.
Cargo volume increased from 254.7 million tonnes in 2001 to 826.3 million tons in
2010, an average growth rate reached 14.0% a year and the amount of stock
movement of goods has increased from 63,164.4 million tonnes a kilometer in 2001 to
218,787.7 million tonnes a kilometer in 2010, the average growth rate of 14.8% a
year.
The big difficulties are spreading investment without comprehensive and lack of key
focus, connectivity between modes of transport, even in the same method is not good.
Also the organizing transport is irrational, untapped advantage geographical location
and natural conditions of the country. Trend of "road-ization" is increasing. The

62
assume ratio of transport mode to passengers by roadway is 91.4%, by rain way is
0.5%, inland waterways is 7.2% and 1% for aviation and assumed rate of transport
mode to goods by roadway is 70.8%, by rain way 1%, inland waterways is 17.5%, sea
way id 10.7%, and airway is 0.06%.
Traffic density on the roads increase repidly, particularly on the main transport
corridors growing up 10 per cent a year between 2004 and 2011 such as some sections
on Highway 1: Dau Giay - Ho Chi Minh Cit:y 10.85 per cent; Phan Rang - Phan Thiet
is 12.53 per cent; Highway 5: 10.42 per cent; National way 10: 10.20 per cent;
Highway 91: 13.02 per cent; Highway 51: 11.22 per cent; Highway 32: 11.94 per cent.
Some have overloaded as Highway 1 with density of over 16,000 to 165,000 PCU a
day. Highway 5, Highway 2,18, 3, 37, 51, 53, 60. 80, 91 ... also have big traffic flow
of over 15,000 PCU a day, equivalent to the maximum flow for secondary roads,
while most of the new highway now are in level III. Therefore, it meet difficulties like
traffic jams, slow speeds, ...
Weak transport infrastructure will make low of quality of transport and transport
services, unreasonable fee, waek connection between these modes of transport,
multimodal transport services are premitive, undeveloped which has affected the
competitiveness of the economy and the negative impact on the living environment,
hinder the speed of socio-economic development of the country.
2.4.2. Urban transport and urban public transport
a) Urban transport
Until now, 100% of urban areas have prepared their own urban planning, in
which traffic planning has played an important role. In recent years, urban areas in the
whole country has prioritized all resources to make investment into urban
infrastructure, particularly urban traffic network has received investment for
construction, renovaiton and upgrade under the planning. However, due to limited
resources, traffic network inside and outside the urban areas has not been completed,
lacked of linkage in many places, hindering operations of the urban areas. In major
cities, public transport is being invested to upgrade and expand, however, service area
is low and traffic jam is still popular. Transport is still a main source to cause noise
pollution in urban areas. Ratio of motobikes in roads is very high, urban roads account
for about 80-85%, ring roads and national roads account for 70-75
%. Ratio of traffic land is very low, only accounting for about 10
% while requiried ratio of traffic land is 20-25% of urban construction land. Ratio of
land for transport, particularly for static transport reaches about 1%, while required
minimum ratio is from 3-3.5% of urban construction land.
According to NUDS, throught a survey of 41 urban areas, Vung Tau City has
the highest density of main roads in urban areas, 10.28 km/km2 and Rach Gia City has
the lowest density, 0.23km/km2. Of urban areas type II, Rach Gia City has the highest
main traffic density, 18.53 km/km2 and PleiCu City has the lowest has the lowest
main traffic density, 4.74 km/m2. Of urban areas type III, Tam Diep town has the
highest main traffic density, and Cua Lo Town has the lowest main traffic density,

63
3.60km/km2. Of urban areas type IV, Dac Mill has the highest main traffic desntiy
18.3 km/km2 and My Hao Two has the lowest main traffic density, 4.45km/km2.
Chart 1 30: Chart of main roads in urban areas (building line >11.5m)
In big urban areas, congestion is very serious. Congestion is associated with
vehicle flow change rules and urban traffic characteristics in the large scale,
particularly serious in peak hours, in the intersections of roads and railways,
encroachment of sidewalks, transit transport and etc making large traffic density,
vehicle flow velocity is low, only reaching from 15-23km/h at average. And only an
incident in vehicle flow or sudden change of circulation direction leads to congestion.
Even though, organization and control of transport gain remarkable result but not
solve thoroughly. Damages for health and lives of people caused by transport account
for about 65-70% of deaths. Of alive people, there are 70% of people without any
abilities, causing burdens for them and their families and the society.
In Hanoi and Ho Chi Minh City, urban traffic system is on the top to meet
urbanization demands and reduce congestion in urban areas. In Hanoi City, it is
prioritized to invest bridges through Hong river, Duong river. In the center axles and
main axles in the urban areas, complete ring roads around the urban areas and
important inter-provincial transport. In the period of 2011-2015, Hanoi City has
completed 22 key works, including important traffic axles such as: Ring Road 1
(Section from O Cho Dua – Hoang Cau), extended road 5, 7 light overpasses in the
important intersections connecting and promoting important traffic projects at the
central level in the region such as: Nhat Tan bridge, Nhat Tan – Noi Bai expressway,
T2 passenger terminal – Noi Bai International Airport and etc). In 2016, the city has
commenced 04 bridge projects, urban railway line No 1 for a section from Yen Vien –
Ngoc Hoi, overpass in Phu Thuong intersection with total expenses of about 39
thousand billion dong. In the period of 2016-2020, it is expected to commence 46 key
projects including 31 road projects, 06 railway lines, 04 BRT projects, 05 bus station
prpjects with total expenses of about 400 billion dong.
In Ho Chi Minh City, expand urban road system, regional transport and roads
connecting to gates of the City, many key traffic works and projects with large scale
for solving congestion are completed and put into use then gradually completing
traffic infrastructue of the city, contributing reduction of congestion, creating
convenient travelling conditions for people: constructing Vo Van Kiet – Mai Chi Tho
road, upgrade and expand Truong Sa- Hoang Sa road, Ring road in the east of the city
(from Inter-provincial road 25B to Rach Chiec), Road connecting Tan Son Nhat –

64
Binh Loi – External Ring Road; 08 bridges under the project on upgrading Provincial
Road 9, Le Van Sy bridge, Kieu bridge, Bong bridge, Hau Giang bridge, Ong Buong 1
bridge, Ong Buong 2 bridge and etc. In addition, the City is focusing on directing to
solve difficulties of financial plans and procedures, mobilizing and seeking capital
sources, boosting the progress of site clearance and constructing the works to continue
to complete important traffic infrastructure development projects such as projects for
closing ring road 2, Ha Huy Giap parallel road, Vuon Lai road, Binh Tien road bridge,
roads connecting to the ports, Bridges such as Rach Dia, Long Kieng, Rach Tom,
Bung, My Thuan under An Duong Vuong line, Rach Doi, Vuon lai, Nam Ly;
overhead road prpjevts; projects on upgrading and replacing existing bridges which do
not meet the scale on load resistance and capacity and etc.
Construction progress of urban transportation projects are slowly due to lack of
funding, especially in construction of urban rail and city – suburds rail. Currently,
Hanoi capital and Ho Chi Minh City have began to construct 2-3 new lines. The
undertaken percentage of public passenger transport in 2010 was only 10-12 per cent.
Urban traffic congestion in Hanoi and Ho Chi Minh occur frequently; narrow
infrastructure, unplanned development while iron wheel traffic has big volume but
slow deployment; public transport is mainly by bus that does not meet the demand for
travel, personal mean of transsport develop freedom without control,….
Local transport system was invested by the provinces and cities that better meet
the development needs. They have built 30,000 kilometers of newly GTĐP; have
upgraded 140,000 kilometers of roads in all level; 150,306md of reinforced concrete
bridges; 15,327md of conjugated bridge; 16,196md of iron bridge; 37,594 meter of
hanging bridge; 75,515 meters of wooden bridge; have replaced and new built 32,688
md footbridges; have constructed and renovated 36,672 meters underground overflow
all scale. However, main road density in urban areras (building line >1.15m) for large
urban areas is low, only reaching <2.2km/km2 compared to the regulation as
stipulated in Circular 34 stipulated minimum is 26km/km2. In recent years, the State
has paid special attention to the traffic system of the city and invested many roads,
renovated and expanded many roads but not meet travelling demands of people and
main road density is increasingly low becuase infrastructure does nto meet immigrants
to the urban areas, therefore, unlike other urban areas in the whole country, two of
these urban areas need to invest public transport system such as overhead trains,
subways and use public transport system such as buses in new urban areas to meet a
part of travelling demands of urban people.
b) Current situation of public transport in large metropolitans in Vietnam
As a report in Vietnam Urban Forum (November 04, 2015), by October, 2015, the
country has 788 cities, the urbanization rate reached 35.2% with 02 special-typed
municipalities, 15 of type I, 21 of type II, and more than 700 urban centers of types
V and III21
We do not have regulation on how population size of a city to be classified as large
cities. In case of cities of type II or higher, big cities are urban areas with the
populations of 300,000 people or more (under Decree no. 42 on urban classification,
21
Urban Development Agency, MOC.
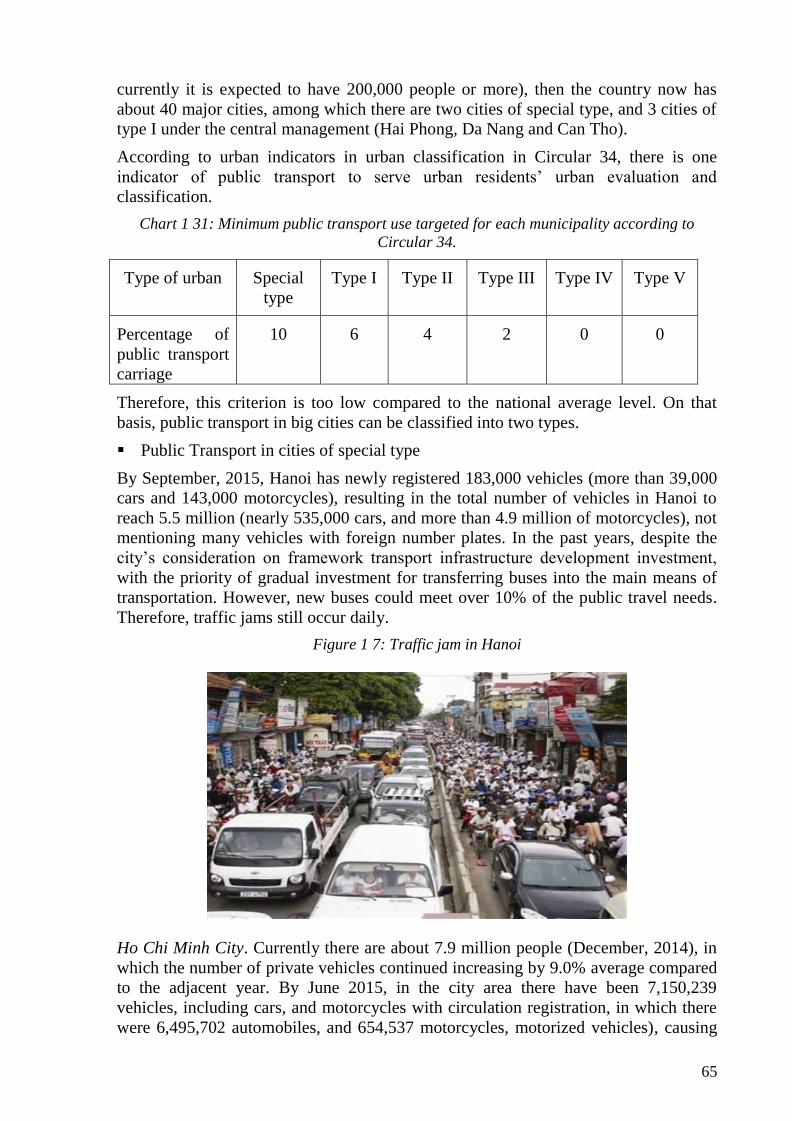
65
currently it is expected to have 200,000 people or more), then the country now has
about 40 major cities, among which there are two cities of special type, and 3 cities of
type I under the central management (Hai Phong, Da Nang and Can Tho).
According to urban indicators in urban classification in Circular 34, there is one
indicator of public transport to serve urban residents‟ urban evaluation and
classification.
Chart 1 31: Minimum public transport use targeted for each municipality according to
Circular 34.
Type of urban
Special
type
Type I Type II Type III Type IV Type V
Percentage of
public transport
carriage
10 6 4 2 0 0
Therefore, this criterion is too low compared to the national average level. On that
basis, public transport in big cities can be classified into two types.
Public Transport in cities of special type
By September, 2015, Hanoi has newly registered 183,000 vehicles (more than 39,000
cars and 143,000 motorcycles), resulting in the total number of vehicles in Hanoi to
reach 5.5 million (nearly 535,000 cars, and more than 4.9 million of motorcycles), not
mentioning many vehicles with foreign number plates. In the past years, despite the
city‟s consideration on framework transport infrastructure development investment,
with the priority of gradual investment for transferring buses into the main means of
transportation. However, new buses could meet over 10% of the public travel needs.
Therefore, traffic jams still occur daily.
Figure 1 7: Traffic jam in Hanoi
Ho Chi Minh City. Currently there are about 7.9 million people (December, 2014), in
which the number of private vehicles continued increasing by 9.0% average compared
to the adjacent year. By June 2015, in the city area there have been 7,150,239
vehicles, including cars, and motorcycles with circulation registration, in which there
were 6,495,702 automobiles, and 654,537 motorcycles, motorized vehicles), causing

66
overload for the urban transport system, leading to increase in traffic congestion and
traffic accidents for recent years. Public passenger transport by buses has yet met the
travel needs of the people (the coverage rate of public transport accounts for only
about 10%22
Figure 1 8: Traffic congestion in Ho Chi Minh city
Chart 1 32: Public transport percentage in three cities of type I under central management City Hai Phong Da Nang Can Tho
Population 2,103,500 persons 1,046,876 1,224,100 persons[
% public
transport 12% 15% 23%
Source: The information provided by Transport Departments of cities in 2015 [collected by the author]
Public Transport in Big Provincial Cities (Type I and Type II)
A survey from the urban area in 2011 by the Association of Vietnam Cities showed
that the rate of public transport uses in the regions was different but all are much
lower than required (Table 4)
Chart 1 33: Public Transport Percentage in cities and towns in each region of Vietnam in
2011 Indicators Northern
midland and
mountainous
region
Red river
delta region
North
Central area
and Central
coastal
region
Central
highlands
North East
South
Region
Mekong
river delta
region
Public transport use
%
5.66 %
12.32%
5.725% 10.25%
4.555% 8.72%
Source: Vietnam urban survey project sponsored by UN-HABITAT. (2012)
The data in Table 5 below shows the percentage of public passenger transport in urban
areas of types I and II under the province in 2015, on average of 15% and tends to be
upward trend compared to 2011, but still lower than the national average.
Chart 1 34: Percentage of public transport in some cities of type I and type II in the
province City Nam
Dinh
( I)
Ha
Long
( I)
Thai
Nguyen
(I)
Thanh
Hoa
(I)
Hue
(I)
Vung
Tau
(I)
Ba
Ria
(II)
Bac
Ninh
(II)
Thai
Binh
(II)
Dong
Hoi
(II)
Bac
Lieu
(II)
Public
transport
use %
20.4 25 23% 10.2 10.64 23 14 10 30 12 15%
22
Dissemination of the Ho Chi Minh City Transport Department on situation and orientation of smart transport
in Ho Chi Minh City dated July 14, 2015.

67
Source: Data collected from the urban survey in 2015
In cities, taxis occupy significant amount, which has helped increase Public Transport
rate, but in the future if public transport vehicles such as buses, or rapid bus cannot be
developed, cities may encounter major difficulties.
Urban areas type III and IV have not had public transport system such as buses in the
urban areas but only fixed buses from large urban areas to other urban areas in the
province. In addition, public transport is mainly taxis for travelling in the urban areas.
On the other hand, this types of urban areas are in the small scale, their distance is not
huge, people usually use their personal vehicles for travelling but not use public
transport vehicles such as buses.
2.4.3. Water supply.
Orientations for development of urban water supply and Vietnam industrial parks to
2025 and vision to 2050 approved by Prime Minister (under the Decision
No.1929/QD-TTg dated 20/11/2009), has effectively spplied water for urban areas in
Vietnam. After 5 years of implementation, the water supply system in localities has
been wel-invested. In 2014, there were nearly 100 water supply enterprises managing
over 500 large and small size water supply systems in cities nationwide with a total
water supply capacity of 7.5 million m3 a day; in comparative with year 2009, the
total capacity has increased over 1.1 million m3 a day; the proportion of urban
population supplied water through centralized water supply system reached 81% that
increasing by 8.0% in comparative with year 2009; average loss rate is about 25%
decreased 5% compared to 2009 (30%); average water usage reached 107 liters a day.
Current situation of urban water supply has reached the goal to 2015 (Decision No.
1929/QD-TTg dated 20/11/2009), such as the coverage of clean water supply services
in the urban areas grade III or higher was above 90%, the urban areas grade IV was
75%, the urban areas grade V reached 57% from concentrated water supply systems;
water quality meets prescribed standards. Water loss percentage per capita of urban
areas is below 25% and the urban areas grade IV or higher have continuous water
supply time of the day is 24 hours.
Capital mobilization for investment in the water supply field in recent 5 years reached
about 11.4 trillion dong (about 2.3 trillion a year). In particular, state funding
accounted for approximately 87% (including budget accounting for about 12%, ODA
accounting for about 66%, capital of state-owned enterprises accounting for about 9%)
and business capital of private sector accounting approximately 13%.
In terms of state management, MOC had formulated water supply planning of 4 key
economic regions as Northern, Central, Southern and Mekong Delta; while guiding
the localities to formulated water supply plannings for centrally-run cities and
provincial regional planning for management and development. To date, nearly 30
provinces/cities have water supply plannings and nearly 10 provinces/cities are
formulating theirs water supply plannings.
a) Current water supply
Indicator of domestic water supply in urban areas: Currently, urban areas in the whole
country have nearly 100 domestic water providers which are managing and operating

68
on 500 large and small water supply systems in urban areas in the whole country with
a total capacity of 7.5 million m3 of water / day and night, compared to 2009, the total
capacity has increased by 1.1 million m3/ day and night; proportion of urban
population supplied with water through centralized water supply system reaches 81%
and increases by 8.0%. Average water use level reaches 107 liters/day and night. The
actual status of the current water supply reaches or exceeds compared to specific
objectives and targets by 2015 of a specific water supply orientation, such as: The
coverage of water supply services in the urban areas grade III or higher is over 90%,
urban areas, grade IV is 75%, urban areas, grade V reaches 57% which are provided
with water from the centralized water supply system; the quality of the water meets
the given standards. The survey of 41 urban areas shows that the highest indicator of
domestic water supply in urban areas grade I is 243 litters/ day and night in Thai
Nguyen city and the lowest indicator of domestic water supply in Hue city is 100
litters/day and night. For urban areas grade II, the highest indicator of domestic water
supply in urban areas in Thai Binh is 210.5 litter/day and night and the lowest
indicator of domestic water supply in Pleiku city is 102.5 litters/day and night. For
the urban areas, grade III, the highest indicator of domestic water supply in Gia Nghia
town is 120 litters/ day and night and the lowest indicator of domestic water supply in
urban areas in Cua Lo town is 60 litters/day and night. For urban areas grade IV, the
highest indicator of domestic water supply in Chu town is 186 litters/ day and night
and the lowest indicator of domestic water supply in urban areas in My Hao town is
93.9 litters/day and night Chart 1 35: Chart of indicator of domestic water supply in urban areas
0.0
50.0
100.0
150.0
200.0
250.0
300.0
TP H
à G
iang
TP Bắc
Gia
ng
TP Thá
i Ngu
yên
TP việt
Trì
TP Lai
Châ
u
TX S
ông
Côn
g
TT Sa Pa
TT Chũ
TP H
à Nội
TP Bắc
Nin
h
TP Hạ Lon
g
TP Thá
i Bìn
h
TP N
am Địn
h
TX T
am Đ
iệp
TX P
húc Y
ên
TT Mỹ
Hào
TP Tha
nh H
óa
TP Đồn
g Hới
TP H
uế
Đà Nẵn
g
PR-T
háp
Chà
m
Tx cử
a Lò
TT Phú
Pho
ng
TP Ple
iku
TP Đ
à Lạ
t
TX G
ia N
ghĩa
TT Chư
Sê
TT Phước
An
TP H
CM
TP Bà Rịa
TP Vũn
g Tàu
TP Tây
Nin
h
TX Đồn
g X
oài
TX T
huận
An
Cần
Thơ
TP Vị T
hanh
TP Bạc
Liê
u
TP Cà M
au
TP Rạc
h G
iá
TT Cần
Đướ
c
TT Lấp
Vò
Chỉ tiêu cấp nước sinh hoạt khu vực nội thị (lít/người, ngđ)
The 41 surveyed urban area shows that the ratio of clean water supply in centralized
urban areas of the urban area with special grade reach over 90% such as Hanoi and Ho
Chi Minh city. Urban areas, grades I and II reaches over 75% and urban areas, grades
III and IV reach over 75% and urban areas grades III and IV reach over 60%. For
urban areas, grade II, the highest ratio of clean water supply in Phuc Yen town reaches
100% and the lowest ratioin Gia Nghia town reaches 20%. For urban areas, grade IV,
the highest ratio of clean water supply in centralized urban areas in Di An town
reaches 100.0% and the lowest ratio of clean water supply in Chu Se town reaches
23.85%. Currently, urban arreas from grade IV to special grade mostly have the
centralized fresh water supply system from the treatment station of urban areas.

69
Chart 1 36: Chart of ratio of household provided with clean water from the centralized water
supply system
0.0
20.0
40.0
60.0
80.0
100.0
120.0
TP H
à G
iang
TP Bắc
Gia
ng
TP Thá
i Ngu
yên
TP việt
Trì
TP Lai
Châ
u
TX S
ông
Côn
g
TT Sa Pa
TT Chũ
TP H
à Nội
TP Bắc
Nin
h
TP Hạ Lon
g
TP Thá
i Bìn
h
TP N
am Địn
h
TX T
am Đ
iệp
TX P
húc Y
ên
TT Mỹ
Hào
TP Tha
nh H
óa
TP Đồn
g Hới
TP H
uế
Đà Nẵn
g
PR-T
háp
Chà
m
Tx cử
a Lò
TT Phú
Pho
ng
TP Ple
iku
TP Đ
à Lạ
t
TX G
ia N
ghĩa
TT Chư
Sê
TT Phước
An
TP H
CM
TP Bà Rịa
TP Vũn
g Tàu
TP Tây
Nin
h
TX Đồn
g X
oài
TX T
huận
An
Cần
Thơ
TP Vị T
hanh
TP Bạc
Liê
u
TP Cà M
au
TP Rạc
h G
iá
TT Cần
Đướ
c
TT Lấp
Vò
Tỷ lệ hộ dân được cấp nước sạch từ hệ thống cấp nước tập trung (%)
In urban area, the average ratio of clean water loss is less than 25% and urban centers
of type IV or higher with the continuousity of water supply in 24 hours a day, it
exceeds targets set out. The survey on 41 cities showed that type I cities has high
water loss rate such as Nam Dinh City of about 28.7% and the lowest is Vung Tau
with 10 %. The grade II cities has the highest water loss rate with Ca Mau City of
30% and the unit with the lowest is Dong Hoi city of 16%. Type III urban with highest
water loss rate is Tam Diep town, Lai Chau city of 28% and the urban with the lowest
is Vi Thanh City with 17%. The IV type cities having the highest water loss rate is
Chu Se town with 24% and the lowest loss rate belongs to Di An which is about 10%.
Compared with urban regulations, basically urban is still ensuring the allowed water
loss rate. Chart 1 37: Chart of the water loss rate
0.0
5.0
10.0
15.0
20.0
25.0
30.0
35.0
TP H
à G
iang
TP Bắc
Gia
ng
TP Thá
i Ngu
yên
TP việt
Trì
TP Lai
Châ
u
TX S
ông
Côn
g
TT Sa Pa
TT Chũ
TP H
à Nội
TP Bắc
Nin
h
TP Hạ Lon
g
TP Thá
i Bìn
h
TP N
am Địn
h
TX T
am Đ
iệp
TX P
húc Y
ên
TT Mỹ
Hào
TP Tha
nh H
óa
TP Đồn
g Hới
TP H
uế
Đà Nẵn
g
PR-T
háp
Chà
m
Tx cử
a Lò
TT Phú
Pho
ng
TP Ple
iku
TP Đ
à Lạ
t
TX G
ia N
ghĩa
TT Chư
Sê
TT Phước
An
TP H
CM
TP Bà Rịa
TP Vũn
g Tàu
TP Tây
Nin
h
TX Đồn
g X
oài
TX T
huận
An
Cần
Thơ
TP Vị T
hanh
TP Bạc
Liê
u
TP Cà M
au
TP Rạc
h G
iá
TT Cần
Đướ
c
TT Lấp
Vò
Tỷ lệ thất thoát cấp nước(%)
b) Difficulties
- Water sources: have been degraded in both quality and volume. Surface water
sources have been polluted by waste, domestic and production waste water; in
addition, being affected by climate change and salt water intrusion, especially in
the dry season, salt water intrusion enroached the inland tens of kilometers;
heavily influenced areas are in the Mekong Delta and Central Coast regions. The
over exploitation of groundwater resource leads to water pollution and land
subsidence (some places in Hanoi City were infected ammonium, arsenic and
causing subsidence in Hanoi, Ho Chi Minh and Ca Mau City).

70
- Construction capital (according to Decision No. 1929/QD-TTg dated 20/11/2009)
in the period 2015-2020 needs about 60 trillion (10 trillion/ year) while ODA and
budget are limited. So we need to have policies to mobilize private, domestic and
foreign capital to be the main capital source for investment and development of
water supply.
- Quality of water supply services: the urbanization speed in Vietnam has increased
rapidly, this demands the higher capacity of water supply service quality than
previously, such as the time of constant water supply 24 hours a day, the quality of
safe water drinking at the tap...
2.4.4. Drainage and sewage treatment.
Orientations for drainage in urban areas and Vietnam industrial zones to 2025 and
vision to 2050 were approved by Prime Minister in Decision No. 1930/QD-TTg dated
20/11/2009. After 5 years of implementation, we achieved certain achievements. For
examples, drainage systems in urban areas are being invested in new construction and
restored the old system, in order to improve the capacity and efficiency of the
drainage, wastewater collection and treatment for urban areas; The waste water in
industrial zones have been collected and treated separately to reduce environmental
pollution. But the targets (under Decision No. 1930 / QD-TTg) for the period to 2015
are not achieved.
a) Storm water drainage:
In term of inundation: According to (Decision No. 1930/QD-TTg), by 2015, we
will eliminate frequent inundation during the rainy season in urban areas grade II or
higher. But in fact, frequent flooding situation in urban areas is not reduced, but also
tends to rise. In Hanoi23, in 2015, there were 23 flooded locations in 12 districts. In
Ho Chi Minh City24 although flooding was removed from 47 locations, but 33 points
re-flooded, new flood rose in 29 locations bringing the total flood up 62 locations. In
Bien Hoa25, there were 23 points regularly flooded when heavy rains, in addition
there are many residential areas and production areas were also submerged in deep
water, flooded locations were located close to or related to the uncleared flow system
in streams such as Linh stream, Ba Chua stream and Ba Lua stream... In Da Lat
City26, there were 25 flooded locations in the city, mainly in the central wards. Other
big cities such as Can Tho, Hue, Da Nang and Hai Phong..., urban inundation is
increasingly exacerbated under the impact of uncontrolled urbanization and climate
change.
The density of the drainage system is expected to reach between 70-80% by
2015, in fact, most urban areas reached only about <60%.
Through a survey of 41 urban areas, of urban areas type I, the City has the
highest main drain density in the urban area, reaching 12.18 km/km2 and Hue City has
the lowest main drain density, reaching 0.23 km/km2. Of urban areas type II, Rach
Gia City has the highest main drain density, reaching 18.53 km/km2 and Plei Cu City
has the lowest main drain density, reaching 4.74 km/km2. Of urban areas type III,
23
Source: Hanoi Department of Construction 24
Source: Steering center of the urban flood control program, figures in 7/2015 25
Source: Steering Committee for Flood and Storm Prevention in Dong Nai. 26
Source: According to the report of the Technical Infrastructure department - Lam Dong Department of
Construction.

71
Dong Xoai Town has the highest main drain density, reaching 11.2 km/km2 and Tam
Diep Town has the lowest main drain density, reaching 2.7 km/km2. Of urban areas
type IV, Lap Vo Town has the highest main drain density, reaching 10.3 km/km2 and
My Hao Town has the lowest main drain density, reaching 2.4 km/km2. Chart 1 38: Chart of main drain density in urban areas
In term of management and operation of the drainage system: The goals for 2015 were
the entire drainage system to be managed and operated, regularly and periodically
maintained. However, in fact, it has not done, many drainage culverts in urban areas
were damaged, the maintenance had not under process, management and operation of
the drainage system were mainly dependent on funding annually financed by the
People's Committee of provinces/cities through the Department of Finance and
allocated to the Department of Construction. This budget was not enough, greatly
influenced on the management and operation of urban drainage systems. According to
research by the Asian Development Bank (ADB), if the cost of sewerage services was
1% of the total spending cost of a household (4 persons) a month (this rate in countries
in the Region was over 3%), the cost of cover for sewer sercive and sewage collection
and treatment was around above 4.000 VND/ m3 of wastewater. However, in most
cities across the country, the current toll rate of sewer service only reaches around
10% of supply water price (less than 1,000 VND / m3). This fee may not be enough to
offset the cost of system management and operation.
b) Construction and upgrading of waste water drainage system:
Urban domestic waste water: Under target by 2015 (according to Decision No.
1930/QD-TTg), urban domestic waste water would be collected and treated up to 40-
50%; in fact, urban areas across the country has not achieved. So far, in 2015 there are
more than 33 concentrated wastewater treatment plants that went into operation with a
total design capacity of about 850 thousand m3 a day and about 40 plants being in the
process of design or construction with a total design capacity of about 1.6 million m3
a day. Thus, sewage collection rate reached only about 13% of domestic waste water
in urban areas (in the designed capacity) and less than 10% (calculated according to
the actual operating capacity).
Industrial zone waste water: Not achieved the target by 2015 (according to
Decision No. 1930/QD-TTg) i.e. industrial wastewater is collected and treated up to

72
100%. In fact, in 201427, of 214 industrial zones operating in the country, there are
166 industrial parks already built the concentrated wastewater treatment systems
(accounting for 78%), 24 industrial zones is building sewage treatment systems
(accounting for 12% ). In particularly, 95% of the industrial zones in the southern key
economic; 83% of the industrial zones in the Mekong Delta and 74.5% of the
industrial zones in the Red River Delta have been built and operated the concentrated
wastewater treatment stations. Up to 51 of 70 waste water treatment systems that
concentrated in the southern key economic install automatic monitoring equipment. In
the Midlands and northern mountains, Central Highlands, Central Coast, due to later
development of industrial zones and in the process of construction and investment
attraction, the waste water generated less.
Through a survey of 41 urban areas of NUDS project, of special urban areas,
type I, therera are water production facilities using clean technologies or pollution
reduction equipment, reaching 100%, particularly, Thai Binh City and Ca Mau City
reach over 80%. Urban areas type III and IV mostly reach over 80%, particularly,
urban areas in My Hao Town and Chu Town reach over 60%. Particularly, Thai
Nguyen City is known as urban area type I but its ratio of production facilities
applying recently clean technologies or pollution reduction equipment is the lowest,
reaching 5.3%.
Chart 1 39: Chart on ratio of production facilities applying recently clean technologies or
pollution reduction equipment
c) Shortcomings in planning implementation
Organization and management of water drainage systems
The provision of sewerage and waste water treatment, pollution control of water
resources was classified by administrative boundaries, so although the Basin
Environmental Protection Commissions have been established, the operation has not
been effective highly.
Industrial zones, industrial clusters and organizations investing in infrastructure
business are responsible for business and management of sewerage and wastewater
treatment systems. This model works relatively efficiently, however, the investment in
management and operation of systems for wastewater collection and treatment
27
Source: Report on environmental protection No. 231 / BC-CP of the Government dated 22.05.2015 sent
parliamentary deputies.

73
depends on the progress of development and filling in industrial zones.
The new urban areas establish a separate investment management board, a separate
unit responsible for management and operation of drainage systems and waste water
treatment plants. In some cases, this model has not gathered enough necessary
manpower, material and equipment, skills, knowledge and experience to manage the
investment and operation of the drainage systems and the wastewater treatment plants
efficiently.
The organizational model of management and operation of drainage systems are not
uniform in the localities. Currently, fewer than 10 businesses specialized in making
drainage tasks concentrating in a few big cities such as Hanoi, Hai Phong, Ho Chi
Minh City, Ba Ria - Vung Tau, Da Nang, Thai Nguyen. In which, 2 businesses having
just separated the function of water supply and sewerage are Bac Ninh and Da Lat).
According to the Vietnam Association of water supply, there are about 20 businesses
function in the field of water sewerage and supply; the other remaining businesses
operate in multiple industrial nature, including environment and construction. In
general, the organizational model of asset management and management and
operation of drainage and sewage treatment systems basically is usually public
enterprises (SOEs or One member limited liability companies). They are drainage
companies, water supply and sewerage companies, Urban construction companies,
Urban environmental companies,... are authorized asset management, as the investors
of the drainage and urban sanitation projects, being delivered directly or tendering
management and operation of drainage and sewage treatment works; Also, there are
some drainage systems and plants/wastewater treatment stations are invested by
private enterprises and managed and operated in the form of BT or BO.
Thus, depending on the type of project and local conditions to apply the organizational
model of drainage management. Since there is no uniform model, the different
organization of drainage businesses on each locality creates problems in the
organization and management of drainage and wastewater treatment across the
country.
Capital sources
Capital sources for construction and renovation of rainwater drainage systems, sewage
collection and connection and sewage treatment plants are mostly from the state
budget and ODA capital, but have not met the actual investment needs, because:
Mobilization of extra-budgetary capital sources is difficult, investors are not really
interested in this field due to low investment returns.
Water drainage charge is low and the problem, so calling the socialization of
investment in drainage field is still limited.
There are many projects with great ground compensation and clearance volume, many
projects get troubles in the work of clearance and require great capital sources for
ground clearance resulting in delays in investment schedule planned.
Capital sources: Vietnam annually requires about USD 800 million to USD 2 billion
to build wastewater treatment systems depending on technological and technical type
of collection, transfer and connection systems applied (source: ADB). According to
the decisions of Prime Minister: No. 1942/QD-TTg dated 29/10/2014 on planning
drainage and waste water treatment systems in residential areas and industrial zones in

74
Dong Nai River basin to 2030; No. 228/QD-TTg dated 25/01/2013 on planning
drainage and waste water treatment systems in residential areas and industrial zones of
Cau River basin to 2030 and No. 681/QD-TTg dated 03/5/2013 on planning drainage
and waste water treatment systems in residential areas and industrial zones of Nhue -
Day river basin to 2030, investment capital demand for waste water collection and
treatment of large cities under the third river basins is around 220,000 billion
(estimated to handle about 4 million m3 of wastewater a day). However, currently, it
is only identified capital sources for implementation of these projects in the period
2012-2015 of about 2,400 billion (of which the 570 billion of central budget and 1,600
billion of ODA capital for wastewater treatment for urban areas grade 2 or higher in 3
river basins). And currently, continuing to move to the next period 2016-2020
(according to the General Department of the Environment in 2015). Above figures
show that in the past period, the investment in developing drainage and wastewater
treatment systems primarily use the budget capital (in which, ODA capital is major),
while the capital sources of private economic zones participating in investment remain
modest and also both capital sources meet only a small part of need. Therefore, the
policies are needed to mobilize resources, especially the participation of private
economic zones in investment in developing drainage and waste water treatment
systems in order to reduce the burden on the state budget.
Human resource training
Vietnam has many training centers for operation and management of water plants, but
so far the issue of wastewater treatment virtually has not had quality training facilities
to implement systematic training of human resource with professional and technical
qualifications for this field. The connection between the enterprises operating in the
field of drainage with training institutions is not deep and regular; especially the
initiative of businesses and institutions in developing learning outcomes; developing
training program associated with the actual requirements, many training facilities have
not had or had insufficient infrastructure such as laboratories, model fields for
teaching and research of specialized students of environmental engineering. Specially,
currently, there is no training facility for professional technical workers specialized in
drainage in order to implement well the management, operation and maintenance of
urban drainage systems. Vietnam is approaching and using advanced technology in
the world in the field of drainage, therefore, it is needed high quality human resources
to be able to meet the today's actual demand.
Implementation of mechanisms and policies related to drainage
The implementation of mechanisms and policies on water drainage and waste water
treatment remains slow. The application of the mechanisms and policies of the State
still confused, there are many obstacles due to limited human resources and the
capacity and the qualifications of the staff in management agencies in localities still
limited. Many localities have not paid adequate attention to urban drainage field and
industrial zones.
2.4.5. Solid waste
The total amount of solid waste generated in the country in 201528
is approximately 29
million tons a year, of which domestic solid waste is about 23 million tons a year
28
Nguồn: Cục hạ tầng, BXD

75
(63.000 tons a day) accounting for 80% of arising solid waste, other common types of
solid waste are approximately 5 million tons a year accounting for 17% of arising
solid waste, others are harmful solid waste. Domestic solid waste in urban areas is
around 31.000-38.000 tons a day)
In order to strengthen the management solid waste, the Government issued legal
documents on management of solid waste and policies to encourage and advantage
investment in this field to help the management achieve certain results.
a) Implementation situation of Solid waste management planning in localities
Implementing Decree 59/2007/ND-CP in 2007 regulating and guiding planning and
management of solid waste, there are 55 of 63 cities/provinces completed solid waste
management planning, the 8 local remaining prepared planning approval.
The inter-regional solid waste management planning approved by the Prime Minister
includes: solid waste management planning in 3 basins of Cau River (Decision No.
2211/QD-TTg dated 14/11/2013), Nhue - Day River (Decision No. 223/QD-TTg
dated 12/02/2015), Dong Nai River (Decision No. 07/QD-TTg dated 06/01/2015);
Construction planning of solid waste treatment in 03 Northern key economic zones in
the process of submission for approval, Central and Southern key economic zones
(Decision No. 1440/QD-TTg dated 06/10/2008); Solid waste treatment planning in
key economic zones in Delta Mekong (Decision No. 1873/QD-TTg dated
11/10/2010).
Solid waste treatment planning in rural areas is mentioned in the planning and
construction of new rural areas, locate the transit points/ garbage collecting points or
small-scale landfills. The position and scale of large-scale solid waste treatment
facilities of commune or intercommune are identified in the solid waste treatment
planning of the province.
On the basis of these plannings, local authorities call on investors to participate in
collection, transportation and treatment of solid waste.
Collection and transportation of solid waste
Urban domesstic solid waste: Total solid waste arising in urban areas nationwide
about 31,000-38,000 tons a day, the average collection rate is about 84.5% - 85%
(achieving general management strategy of solid waste, by 2015, the collection rate
will reach 85%). Many urban areas implement collection, transport and treatment of
solid waste very well, creating a civilized and clean environment and landscape like
Da Nang, Hue, Ho Chi Minh City, Da Lat and Vung Tau,….
Through a survey of 41 urban areas, of urban areas type I, Vung Tau City, Thai
Nguyen City and Thanh Hoa City have the highest ratio of solid waste in urban areas
collected and treated, reaching 100%, Can Tho City has the lowest ratio of solid waste
in urban areas collected and treated, r3eaching 80%. Of urban areas type II, Bac Lieu
City has the highest ratio of solid waste in urban areas collected and treated, reaching
100%, in PleiCu City, this ratio is the lowest, reaching 80%. Of urban areas type III,
Tam Diep, Cua Lo Town and Vi Thanh City have the highest ratio of solid waste in

76
urban areas collected and treated, reaching 100% and in Dong Xoai Town, this ratio is
this lowest, reaching 84.53%. Of urban areas type IV, My Hao Town has the highest
ratio of solid waste in urban areas collected and treated, reaching 9%, in Dac Mill
Town, this ratio is the lowest, reaching 71.5% tỷ lệ CTR khu vực nội thị được thu gom
và xử lý thấp nhất là thị trấn Đắc Mill 71,5%.
Chart 1 40: Chart of solid waste in urban areas collected and treated
Rural domestic solid waste is over 31,500 tons a day, the solid waste collection rate is
low, about 40-55%, depending on regions and localities. Peri-urban areas or towns,
townships achieve higher rate of 60-80%, while in some remote regions, the collection
rate is only under 10 per cent.
Currently, in urban areas in Vietnam, there is hazardous solid waste from
industrial parks and hospitals, solid waste is collected and put to the waste treatment
stations in such urban areas, waste treatment stations mainly use burning technologies.
Hazardous solid waste: Through a survey of 41 urban areas, in urban areas, special
type, type I and type II, there are mostly hazardous waste treatment stations and their
treatment ratio reaches over 95%. In urban areas, type III in the provinces, there are
waste treatment stations with burning technologies and their treatment ratio reaches
over 85%. In urban areas, type IV, waste is collected and put to the hazardous waste
station of the province and its treatment ratio reaches over 80%. Hazardous waste
from industrial parks will be put to waste treatment stations of each local arera and
their treatment ratio reaches 100%.

77
Chart 1 41: Chart of hazardous solid waste ratio (from industrial parks and hospitals)
collected and treated
Solid waste treatment:
Measures to treat urban solid waste include 3 categories: landfill, fertilizer production
and combustion.
There are around 660 solid waste landfills 29
(above 1 hectare) is about 2,000 hectares.
Number of landfills, as well as area can be larger, because a lot of small-scale landfills
in the communes have not been fully listed. Of the 660 landfills, there are about 132
unhygienic landfills (20%) (such as temporary and open-cast landfills without system
to collect and treat leachate are polluting sources for atmosphere, land, water and
surrounding landscape) accounting a large area.
The mechanisms and policies aim at encourage investment, construction, land and
technology in the solid waste treatment were issued that facilitated to attract domestic
and foreign investors to invest. The solid waste treatment technologies are increasing
developed and diversified. We have about 35 concentrated solid waste investment
facilities invested in construction and put into operation with a total design capacity of
6,500 tons a day. They will reduce solid waste landfilled and environmental pollution.
Some plants are now built with a total capacity of about 2,500-3,000 tons a day and
they will go into operation in the near future.
The cost for the collection, transportation and treatment of solid waste
The Ministry of Construction issued Decision No. 322/QD-BXD dated 06/4/2012 on
announcing construction investment capital and the cost of solid watse treatment
activities, referring to the cost of urban solid watse treatment at support level for
average solid watse treatment between 240,000-400,000 dong a ton depending on the
technology, scale and capacity of treatment.
Funding for solid waste treatment activities is from State budget. Each locality will
have to pay its own norms for the treatment of urban and inconsistent domestic solid
waste across the country.
Annually, the local budgets are spent funds for the collection, transportation and
treatment of solid waste: Ho Chi Minh City and Hanoi City annually spend about
1,200-1,500 billion a year, accounting for about 3.5% on the city budget; other
locations spend average between 20-40 billion a year.
29
Nguồn: Tổng hợp báo cáo từ các địa phương gửi Cục hạ tầng, BXD.

78
b) Shortcomings in planning implementation
Many localities have done well in management, collection and treatment of solid
waste; social work has already been done in many places. However, there are still
many following shortcomings:
The management planning of solid watse is slow, overloaded landfills often does not
guarantee the standards and environmental pollution is increasing. Location selection
of new landfills is often difficult to implement due to lack of sympathy from the
community.
The treatment technologies of solid waste in Vietnam are increasingly diversified, but
the application of treatment technologies of solid waste (including foreign
technologies) has not been fully concluded and evaluated. A number of domestic
technologies are initially applied and given certain efficiency. The technologies being
studied domestically are mostly undertake by the private businesses, so the completion
of technologies as well as application deployment in practice also get many troubles
such as new technology that has just applied, just completed. Therefore, technology
chains and the technical specifications of the equipment are not complete; financial
capacity of the private businesses is limited, the financial institutions have not dared to
invest in loan because there is no assurances of the success of the project.
Investment capital for the field of solid waste management is huge and mostly from
the state budget (in the last 5 years, the total investment for solid treatment is average
4,300 billion / year, of which 80 % is the state capital, 20% invested by the private
businesses). The cost of operation and management is still high, many localities lack
of funding to pay for the treatment and operating costs (Ca Mau, Thua Thien - Hue ..).
Meanwhile, revenues for the collection, transportation and treatment of solid waste
from the waste source generators are limited, especially very low sanitation fee
ensures only part of the collection and transportation.
It is not fully aware of the specific provisions and costs for the collection,
transportation and treatment of domestic solid waste on the principle of "the users, the
polluter must pay". Accordingly, waste source generators of domestic solid waste
must pay for the services of collection, transportation and treatment of these domestic
solid waste. Thus, instead of the current sanitation fee payment, people are responsible
to pay more fees for solid waste treatment for environmental protection.
Mechanism of preferential policies on investment in solid waste treatment applied
remains many difficulties, not really encourage all economic sectors to participate and
the socialization is still low. In many places, the construction investment projects has
been slow in the implementation due to clearance activities, especially the access to
loans is limited because this is the type of public service with low economic
efficiency.
The consciousness and awareness of the community about reducing, sorting, and
treatment of solid waste is not high. In many places, people do not litter in prescribed
places, there is no agreement with the government in planning locations, as well as
gathering lines, transportation and treatment of solid waste.
The rural amount of solid waste not collected and treatmented is quite large and can
be seen in many places, polluting the environment, affecting the landscape and the

79
drinking water sources (while most rural people are using groundwater and surface
water not through centralized processing system), affecting the health of people.
Solid waste management in rural areas get difficulties because of very little or no
funding or lack of appropriate technical solutions. Low toll rate does not guarantee the
remuneration for waste collectors. Most of the new localities only provide document
on collection and use rate of garbage collection fee for urban areas. In rural areas,
because groups deal with people by themselves, and there is no regulation on limits to
assign public production and service plannings as urban areas.
Equipment for the collection and transportation of solid waste in many places were
damaged, degraded and improved suitably, especially in rural residential areas.
2.4.6. Cemeteries.
a) Cemetery management as planned.
Diện tích đất nghĩa trang cả nước năm 201530
có khoảng 101.000 ha; có 14/63 địa
Land area of cemeteries nationwide was about 101,000 hectares in 2015 there were
14 in 63 localities to formulate and approve the Provincial cemetery plannings to
assess and control the situation of land use, reasonably distribute cemetery locations
and to manage and attract investment projects of construction cemeteries, cremation
facilities and funeral homes.
Decree No. 35/2008/ND-CP dated 03/25/2008 on the construction, management and
use of cemeteries required the localities depending on the actual conditions issued
separate management regulations. At present, there are 30 localities decentralized
cemetery management, primarily assigned the Department of Construction.
Particularly, in Hanoi, assigned to the Department of Labor, Invalids and Social
Affairs, Department of Construction, Department of Planning and Architecture and
Department of Natural Resources and Environmental to manage by fields; In Ho Chi
Minh City, assigned to the Department of Environmental Resource to manage; some
provinces (such as Tuyen Quang) direct assigned the People's Committee of Districts
to manage…
In fact, most localities do not comply with the planning, the cemeteries are invested in
new construction primarily by socialized capital, due to the investment and business
of private businesses deriving from the demand of each locality. Due to not have a
plan or do not comply with the plan, so the new building cemeteries are scattered and
it is difficult to manage; environmental pollution incurred by solid waste, waste water
from untreated and uncontrolled land cemeteries... The old cemeteries intertwined in
most urban areas affect the environment and landscape. There is no guidance on the
management and use of the services at the cemeteries.
b) Actual situation of using urban cemeteries
Urban public cemetery is a system of essential social infrastructure mentioned in the
planning of urban construction. However, the results of actual survey in 15 urban
areas from special grade to grade V (Hanoi, Hai Phong, Ho Chi Minh City, Da Nang,
Nha Trang, ...) largely, the planning refers only to location and area of existing public
cemeteries and new built cemeteries under National technical regulations of public
30
Nguồn: Cục hạ tầng, BXD

80
utility (Vietnanmese standard) QCVN 07:2016, the Vietnam Construction regulations
QCXDVN 01: 2008; proposing to apply more funeral technology (cremation) without
explaining the basis of investment options to build cemeteries, not to mention
problems in the planning management of cemetery construction.
Situation of cemetery land use
Currently, the proportion of land in urban cemeteries is quite large. The public
cemeteries of wards, communes, villages, residential areas are still operating not under
the management of local government.
In the cemeteries surveyed, currently, the use rate of land area used for burial is
relatively high, accounting for 60% - 90% of the total land area of cemeteries, the land
area for local traffic accounting for 9.3% -20.1%; and land for greenery accounting for
around 16%. The land use area of first burial graves and once burial graves is about 4-
12 m2 and 16 m2 in some places. The area of final inhumation graves is sually about
3.7 m2 - 4,6 m2. The distance between two rows of graves is from 0.5-1m, and the
distance between two consecutive graves in the same row is from 0.4-0.6 m.
Current status of the burial technology
Currently, the burial technology is mainly burial in two forms: (1) burial in three years
then reburial is common in residantial areas of Kinh people from the 17th parallel to
the North and (2) burial once without reburial from 17th parallel into the South. In
addition to burial, cremation (manually or in the crematorium) is also a fairly common
form of burial in areas with many Khmer under Buddhist living, especially in
Southwest region.
Decree No. 35/2008/ND-CP has no regulations concerning the management of the
cremation facilities, although cremation activities closely linked with the management
and use of cemeteries. In fact, many cremation facilities were built in the cemeteries
(Van Dien cemetery in Hanoi; Hai Duong; Hai Phong; Ho Chi Minh City; Binh
Duong...) and the demand for cremation is increasing, especially in big cities like
Hanoi of about 63.2%, Ho Chi Minh City of about 70%, and Hai Phong of about 29%.
According to statistics, more than 17 provinces/cities curretly have 200 cremation
facilities with 230 crematorium. There are 8 concentrated large cremation facilities
with 39 crematorium (12 crematorium in Hanoi, nearly 20 crematorium in Ho Chi
Minh City...). Southern Region, where there are many Khmer people, have many
crematorium using firewood such as 45 crematorium in Kien Giang, 44 crematorium
in Tra Vinh... Recently, some localities have been constructed cremation facilities
such as Thai Nguyen and An Giang... Cremation technology is being applied: Using
electricity, gas and firewood.
Currently, local authorities are recommending to the Government on amending and
supplementing a number of provisions related to the management of cremation
facilities. Dated 26/11/2013, the Government issued Decision No. 2282/QD-TTg
approving the scheme to encourage the use of cremation form including requirements
on supplementing the cremation facilities in urban plannings, mechanisms and
policies for the users of cremation services, investing in construction of cremation
facilities and supplementing regulations on construction, management and use of
cremation facilities.
Situation of spatial organization and technical infrastructure

81
The demand on burial land is increasing, so there are more and more households
living surrounding the cemetery. Currently, the average closest distance from majority
public cemeteries to residential areas is only about 300-400m, particularly in some
places this distance is only 20-30 m. This safe distance is not guaranteed under the
provisions of the current regulations about safe distance of environmental sanitation.
In some cemeteries, the boundary between the burial areas and the residential areas is
hardly demarcated clearly, there is no fence separating systems, or tree lines but there
is only a few small trees concrete milestones or barbed wire... Therefore, many
households in the area almost reached the cemeteries, the ancillary works such as
toilets and water wells ... are burial adjacent areas. Because most households use
shallow groundwater contaminated as drinking and living water, this influences
certainly daily life and health of the people.
In many cemeteries, burial grounds arrangement of graves do not have general
regulations on size, style and building materials of graves, so it is confusing and
arbitrary on height, color and architecture of graves, affecting the general landscape of
the area (Hue, Phuoc An ...). Also there is no guide or management of architectural
forms of cemeteries, grave architecture, the service works, how to arrange and arrange
graves as well as tree and drainage infrastructure system, lighting and water supply....
Therefore, the cemetery architecture has not created separate identities of each region,
area, has not contributed to the creation of landscapes and scenery of the area. The
phenomenon of contention to build magnificent and superficial graves but lack of
management in terms of architecture and landscapes is happenning commonly (public
cemetery of Hue, My Tho, Thu Dau Mot City ....)
c) Main existing problems:
- The public cemeteries are interspersed among the urban population quarters. In
particular, all urban cemeteries do not have rainwater drainage systems, absorbent
water collection and treatment systems.
- Many cemeteries lack of the system of internal roads, even lack of the ancillary
works such as fences, spiritual house, cemetery management house, car park, and
water supply system,...
- The management of public cemeteries is still loose, cemetery management team is
too thin. They manage the cemeteries while looking after and protecting the
cemeteries, so the care and hygiene in cemeteries are not regular. This leads to
cemetery landscape is quite confusing.
Investment funding for cemetery management operations
Currently, the budget is primarily for cemetery management activities, and the
construction is not interested except for the localities with high burial demand such as
Hanoi, Ho Chi Minh City and other large urban areas. The use socialized capital in
cemetery construction such as Binh Duong, Tay Ninh, Ba Ria - Vung Tau has its
shortcomings. For examples, using cost of the service is calculated under business
plan approved by the investor, the area allocating land for social security cases is very
limited.
Shortcomings
Decree No. 35/ND-CP does not specify the content of tasks, planning content of
cemeteries/cemetery locations as well as the responsibility on preparation, evaluation

82
and approval of responsible planning leading to the confusion in the implementation
process of planning at the localities. Funeral homes, cremation facilities are important
elements, there has no specific provisions, so it is difficult to implement the
construction.
Decree No. 35/ND-CP mentioned a number of the provisions on land allocation of
land lease inconsistent with the Law on Land in 2014, currently, some projects met
difficulties in the process of land allocation and land lease (such as An Lac Vien
Cemetery park in Hoanh Bo, Quang Ninh province).
Decree No. 35/ND-CP have not regulated on management of cemetery land use, some
cemeteries have been constructed, but currently use the land ineffectively, such as the
area for the graves (depending on the local customs) is greater than current prescribed
standards, some cemeteries still arrange family cemetery area. The investors in
cemeteries under socialized form are given land by the state to build cemeteries
without collection of land use fees; however, inefficient land use still occurs in some
cemeteries such as generation of speculation, trading and exchange for reserving
graves…
Public cemeteries, religious cemeteries, family cemeteries, tombs is located in the
residential land portion of the family, not land saving, spontaneous in localities
(formed before Decree 35/ND-CP issued), the land use of the old ineffective
cemeteries depended on customs of local people. Use of land for interment activities,
the green area and infrastructure projects does not guarantee rate of land use in
accordance with current regulations.
Decision No. 2282/QD-TTg on the scheme to encourage the use of cremation form
has not mentioned mechanisms and policies on land allocation and land lease for
cremation facilities.
Cemeteries built in the budget are very limited, so technical infrastructure, greenery
and works for the cemeteries and outside the fence infrastructure have not yet invested
under planning. It lacked of support policies for poor households, close poor
households and families with contributions to the revolution...
2.5. Urban economic
2.5.1. Transition from a centralized to socialist-oriented market economy in
Vietnam
Transition to socialist-oriented market economy
Since 1986, Vietnam has transformed from a centralized to socialist-orientated market
economy. In 1987, the National Assembly passed the Foreign Investment Law to
formalize the receipt of foreign direct investments (FDI) in Vietnam. This is an
important historic event for Vietnam's economy; thereby, there were over 14,000
projects31
with foreign capital (over $200 billion is still valid). In 1999, the
introduction of the Enterprise Law created a favorable environment for private sector
development, thereby fostering the private sector role as a key driver for the economy
of Vietnam. In 2003, the Law on State Enterprises was published. In 2007, Vietnam
31
VNEconomy Press– Memory of Foreign Investment Law Establishment Process.

83
joined the World Trade Organization (WTO). The Enterprise Law was introduced in
2005 (replacing the 1999 Enterprise Law, the 2003 State Enterprise Law, and the 1987
Foreign Investment Law) that has set the legal framework for all enterprises,
regardless of public, private or foreign enterprises. This is an important milestone for
Vietnam's flourished economic development, with an increase in international trade,
foreign direct investments (FDI), employment in the industrial sector and services,
and per-capita income as well as a reduction in the poverty rate. In 2008, the World
Bank has ranked Vietnam in the group of middle income countries.
Chart 1 42: Selected Economic Indicators (1985-2015)
Year 1985 1995 2005 2015
GDP per capita (US $) 268 410 699 1,028
Poverty ratio (%) <1.25USD. 63.8 31.4 2.4
Actual FDI inflows (% of GDP) 0 8.6 3.4 5.2
Source: World Bank, 2015 Index (from the national reports by UNHABITAT)
According to data from the World Bank, Vietnam's annual average GDP increases
3.4% in the 1985-1987 period, followed by 7.4% in the 1990-1999 period, 6.6% in the
2000-2009 period, and 5,8% in the 2010-2013 period. Along with the strong process
of industrialization and urbanization, average annual GDP growth in urban areas is
12-15%.
Chart 1 43: Values added to GDP by sector (1985-2013).
Year 1985 1995 2005 2013
Values added to GDP by sector (%)
Agriculture 40.2 27.2 19.3 18.4
Construction 27.4 28.8 38.1 38.3
Services 32.5 44.1 42.6 43.3
Sectorial labor in the total labor force (%)
Agriculture 70.0 51.7 47.4
Construction 10.6 20.2 21.1
Services 9.4 28.2 31.5
Rate of urbanization throughout the
country (%)
19.9 20.75 26.9
Source: World Bank.
According to GSO, total foreign investment capital has been increasing strongly since 2007.
In 2014, total foreign investment capital was 22 billion USD in whole country, in which the
Middle South has the highest capital with 7,8 billion USD and Red Delta river is followed
with 7 billion USD, and the lowest region is High Land Region with some 34 mil. USD. The
Government Cities has occupied big ratio of 27.3 per cent of total register investment capital
in whole country.

84
Chart 1 44: Table of total register foreign investment capital (million USD) period 2005-
2013.
Chart 1 45: Table of total register foreign investment capital (million USD) in 2014
Between with 6 economic regions
Chart 1 46: Table of total register foreign investment capital (million USD) in 2014
Between Government Cities in whole country.
Total register foreign
investment capital (mil. USD) Ratio (%)
WHOLE
COUNTRY 21921.7 100
Government cities 5983.1 27.3
Hanoi 1402.8 6.4
Haiphong 1170.7 5.3
Danang 104.8 0.47
Hochiminh City 3269.1 15
Cantho 35.7 0.16

85
Together with integrated economic, the commercial activities has rapidly increased. In
2014, there are 139 commercial centers in whole country, in which, there are 70
centers located in government cities that occupying 50 per cent of total centers in
whole country.
Chart 1 47: Chart of number of commercial centers in whole country period 2009-2014
Chart 1 48: Number of commercial centers in 2014 between central cities in whole country
WHOLE
COUNTRY
5 central
cities Hanoi Haiphong Danang
Hociminh
city Cantho
139 70 19 9 5 33 4 Source: GSO
Some norms of economic development in urban areas
According to data from the General Statistics Office (GSO), GDP of Vietnam in 2014
calculated at current prices reached 3,937,856 billion VND, equivalent to US$184
billion. Based on a population of 90.73 million people by 2014 (also according to data
published by GSO), GDP per capita in Vietnam in 2014 reached US$2,028 equivalent
of US$169 per month.
Overall, the cities in the Southeast region and Mekong River Delta have relatively
uniform GDP per person. Ho Chi Minh City, economic center of the country, has the
highest per capita GDP and should not be compared with other cities. Vung Tau also
has high per capita GDP in the country (121 million VND per person). Up to nine
cities selected to survey within the Southeast region and Mekong River Delta have per
capita GDP of 40-48 million VND. For these cities, the rate is still average.
Other cities in the North Central Region and Central Highlands region have
considerably different and relatively low per-capita GDP. Large economic centers
such as Da Nang, Dong Hoi, and Thanh Hoa City have high GDP (compared to the

86
national average level, and compared to other cities), 60 million VND per person, 67,
5 million VND per person and 100 million VND per person, respectively. There are
two cities with per-capita GDP similar to the national average level. There are plenty
of cities having per-capita GDP much lower than the national average level. For
example, the type I city of Dalat has per-capita GDP of only 12,7 million VND per
person and Cua Lo town with 17.4 million VND per person. There are 6 cities with
per capita GDP lower than the national average level.
Cities in the Red River delta have relatively high per-capita GDP. With the exception
of Hanoi, three cities surveyed have per-capita GDP of 77-93 million VND per
person. The remaining four cities have per-capita GDP similar to the national average
level.
Cities in the Midlands and northern mountainous regions have the lowest per-capita
GDP throughout the country, except the cities of Bac Giang and Thai Nguyen with
per-capita GDP exceeding the national average by 1.5 times. The rest have per-capita
GDP below the national average level and much lower than the cities of the same
type.
Chart 1 49: Chart of per capita income
0.0
20.0
40.0
60.0
80.0
100.0
120.0
140.0
TP H
à G
iang
TP Bắc
Gia
ng
TP Thá
i Ngu
yên
TP việt
Trì
TP Lai
Châ
u
TX S
ông
Côn
g
TT Sa Pa
TT Chũ
TP H
à Nội
TP Bắc
Nin
h
TP Hạ Lon
g
TP Thá
i Bìn
h
TP N
am Địn
h
TX T
am Đ
iệp
TX P
húc Y
ên
TT Mỹ
Hào
TP Tha
nh H
óa
TP Đồn
g Hới
TP H
uế
Đà Nẵn
g
PR-T
háp
Chà
m
Tx cử
a Lò
TT Phú
Pho
ng
TP Ple
iku
TP Đ
à Lạ
t
TX G
ia N
ghĩa
TT Chư
Sê
TT Phước
An
TP H
CM
TP Bà Rịa
TP Vũn
g Tàu
TP Tây
Nin
h
TX Đồn
g X
oài
TX T
huận
An
Cần
Thơ
TP Vị T
hanh
TP Bạc
Liê
u
TP Cà M
au
TP Rạc
h G
iá
TT Cần
Đướ
c
TT Lấp
Vò
Thu nhập bình quân người (tr đồng/năm)
Average economic growth rate in the last three years: Total domestic product (GDP)
in 2014 increased 5.98% compared with that in 2013, 5.25% compared with that in
2012, and 5.42% compared with that in 2013. In the last three years, the average GDP
of 5.55% shows positive signs in the economy.
The nucleus of the national economy, cities surveyed also have impressive positive
growth. Hanoi and Ho Chi Minh City are the leading economic cities of the country.
Despite being the most affected by the global economic downturn, Hanoi and Ho Chi
Minh City still have positive growth in the last 3 years (Hanoi‟s GDP increased 8,06%
in 2012, 8.25% in 2013, and 8.8% in 2014 while Ho Chi Minh City‟s increased 8.1%
in 2012, 7.9% in 2013, and 8.2% in 2014). For small cities, because of less affected by
the recession, the average growth rates in the last 3 years are quite high.
Overall, the majority of the surveyed cities have the average growth in the last 3 years
at 13-20% (29 cities). Some cities have outstanding growth rates of above 20% such
as Tam Diep Town, Cua Lo Town, Go Vap Town, and Ba Ria City.

87
Chart 1 50: Chart of economic growth rate in the last three years (%)
0.00
5.00
10.00
15.00
20.00
25.00
30.00
TP H
à G
iang
TP Bắc
Gia
ng
TP Thá
i Ngu
yên
TP việt
Trì
TP Lai
Châ
u
TX S
ông
Côn
g
TT Sa Pa
TT Chũ
TP H
à Nội
TP Bắc
Nin
h
TP Hạ Lon
g
TP Thá
i Bìn
h
TP N
am Địn
h
TX T
am Đ
iệp
TX P
húc Y
ên
TT Mỹ
Hào
TP Tha
nh H
óa
TP Đồn
g Hới
TP H
uế
Đà Nẵn
g
PR-T
háp
Chà
m
Tx cử
a Lò
TT Phú
Pho
ng
TP Ple
iku
TP Đ
à Lạ
t
TX G
ia N
ghĩa
TT Chư
Sê
TT Phước
An
TP H
CM
TP Bà Rịa
TP Vũn
g Tàu
TP Tây
Nin
h
TX Đồn
g X
oài
TX T
huận
An
Cần
Thơ
TP Vị T
hanh
TP Bạc
Liê
u
TP Cà M
au
TP Rạc
h G
iá
TT Cần
Đướ
c
TT Lấp
Vò
Tốc độ tăng trưởng kinh tế trung bình 3 năm gần nhất (%)
2.5.2. Role of industrial parks, export processing zones, economic zones
In the process of restructuring of Vietnam‟s economy in the direction of
industrialization and modernization, the model of industrial parks, export processing
zones, and economic zones is the groundbreaking one to attract investment and foster
the industrial production and services. In the system of investment policies,
investment incentives for industrial parks and export processing zones is one of the
important aspects, a motivating factor, especially for foreign direct investment in
Vietnam.
Industrial and export processing zones have really motivated the country's economic
development and urbanization; that is an important contribution to job creation,
training of human resources, and improving incomes, life and workers' qualifications.
The industrial parks create the industrial production value of US$2 million per ha, the
export value is US$1.27 million per ha, with about 1.38 billion VND/ ha contributed
to the State budget. The growth in industrial production and annual exports is stronger
than the average national growth rate. By the end of 2011, Industrial and export
processing zones created jobs for more than 1.7 million workers, an average of 77
employees / ha of industrial land; 65% of the industrial parks put into operation have
concentrated wastewater treatment plants.
Besides the positive contributions, industrial and export processing zones also face
many constraints and environmental pollution as well as other issues such as income,
life, and workers' housing...
Chart 1 51: Synthesis of data on IPs and EPZs, EZs as of 3/2015
Type
Number of
projects Area (ha)
IPs in operation 212 60,000
IPs in the progress of site
clearance
83 24,000
Coastal EZs 15 698,211
EZs near border gates 26 -
(Source: Report to 2015 in term of Industrial Zones of Vietnam – Ministry of Investment of Plans)
According to a report of the Steering Committee for development of industrial parks
and economic zones on March 19, 2015, the whole country has 295 industrial parks
with a total area of 84,000 hectares, of which 212 ones are put into operation with

88
total natural land area of 60,000 hectares (compared with 62% in 2013) and 83 ones in
the period of compensation and site clearance with total natural land area of 24,000
hectares. Currently, the total area of industrial land leased by the IPs is 26,000
hectares; the occupancy rate of industrial parks already in operation is over 65%. The
number of established economic zones across the country is 15 coastal ones and 28
border gate ones. In 2014, the IZs and EZs attracted 752 projects with capital of
foreign direct investment (FDI) and a total registered capital of US$10.7 billion; an
adjusted capital increase for 515 projects is US$4 billion. The number of staffs and
workers in industrial parks and economic zones is estimated at about 2.7 million
people.
2.5.3. Informal economic zones in Vietnam
Informal economic activities are widespread in Vietnam
The informal economic sector is not recognized in public policies and in the economy
of Vietnam. However, in recent years, our country has begun to realize the informal
sector and informal employment as a popular economic phenomenon; its role and
importance has a positive impact on social security and socio-economic development.
Box 1 4: Box of Concept of the informal economic sector):
In the opinion of GSO, the informal economic sector refers to "all enterprises without legal personality,
producing at least one or several products and services to sold or exchange with no business registration
certificate (no business license) and not in agriculture, forestry and fisheries" (referred to as the agricultural
sector)32
. Such firms are called "informal household businesses", in line with the official term used for this type
of business. The types of business activities in the agricultural sector from the above definition are
characterized by differences in agricultural and non-agricultural activities, such as seasonality, labor
organization, income ... and survey instruments in two sectors. The formal household businesses (registered
business) are included in the formal economic sector.
Informal employment is defined as employment without social insurance (especially health insurance). In
Vietnam, all enterprises and household businesses with business registration business, no matter how the
business scale is, are required to register permanent employment (labor contract is valid for at least 3 months or
more) with the Social Insurance Agency of Vietnam. All jobs in the informal economic sector are considered
as informal jobs.
According to the Ministry of Labor, Invalids and Social Affairs33
, the number of
informal workers is an important component of the national production. The informal
economic sector generates at least 20% of the GDP of Vietnam. The national
production is valued much lower than the real fact because of not taking informal
employment into account. Manufacturing and construction accounts for about 43% of
informal labor, trade accounts for 31%, and services accounts for 26%. The informal
economic sector prevails in the field of economy and employment. In 2007, this sector
has contributed nearly 11 out of 22 million non-agricultural workers.
Chart 1 52: Number of informal and formal non-agricultural workers in 2007
Number of workers (million
people)
Percentage (%) Rate of
information
32 ILO definition leaves two open possibilities to identifying the informal economic sector: no business
registration and maximum business scale (the maximum number of people working in the household
businesses). In an effort to apply the recommendations by ILO, Delhi Group recommended to consider each
business household of less than 5 employees as an informal one, aimed mainly to compare countries with each
other. Unlike the Delhi group, the Statistic Science Institute does not take the scale of a business household to
determine the formal or informal economic sector. However, in Vietnam, only 3% of informal household
businesses have a scale of 5 workers or more. 33
Informal economic in developed countries

89
Formal Informal Total Formal Informal Total workers by
sector
Production 4.65 4.65 9.3 50 50 100 42.9
Commerce 2.2 3.35 5.55 39.4 60.6 100 30.9
Services 4.3 2.84 7.14 60.3 39.7 100 26.2
Total 11.15 10.84 21.99 50.7 49.3 100 Source: Cling et al, 2011:42
Chart 1 53: Employment by the formal/informal/agricultural sectors and by rural / urban
areas in Vietnam in 2009.34
Except for the informal agricultural sector, there are currently about 300,000 informal
household businesses in Hanoi and 750,000 ones in Ho Chi Minh City, with a total of
470,000 and 1 million workers, respectively (Cling et al , 2011: 18-19). In 2009,
annual sales of the informal non-agricultural sector reached 143,000 billion VND in
Hanoi and 138,000 VND in Ho Chi Minh City. In Ho Chi Minh City, the informal
household businesses created 72,000 billion VND in value of goods and services
40,000 billion in value added. It is estimated that the informal sector contributed
16.5% of GDP in Hanoi and 12.6% of GDP in Ho Chi Minh city (GSO, 2010: 8).
In developing countries, the informal economic sector plays a very important role in
reducing poverty, creating most new jobs, increasing income for poor people living in
rural and urban areas, contributing to political - social stability, and actively
supporting for the formal economic sector. In Vietnam, the informal sector is not
mentioned in socio-economic policies. The process of transforming Vietnam‟s
economy in the past three decades has seen a great movement of labor from
agriculture to the industrial and services sector and the sharp growth of the informal
sector. The global financial and economic crises over the years have demonstrated that
the informal sector is the source of the largest non-agricultural employment. However,
although the informal economic activities are common in Vietnam, the informal sector
is not only a single economic phenomenon but has a huge impact on the growth of the
national economy as well as on security society. Unfortunately, public policies have
yet to mention the state of the informal economy.
Impact of informal economic activities on management and development of urban
areas 35
:
34 Hanns Seidel Foundation – Social security for the informal sector and informal workers in Vietnam-2012. 35
Urban research- Dr. Pham Si Liem

90
The informal economic activities in the urban areas are diverse36
with small-sized and
individuals using the self-labor and/or family members and/or hired employees.
Working time is not specified, depending on the type of employment and place of
work. The work place is not fixed and it can be at bus stations, docks, sidewalks,
market alleys, roadways, or indoors. The informal economy used to account for 60%
of the urban workers including official population and immigrants. Urban authorities
approved several types of informal economic activities (house help, sales assistants
...), but are uncomfortable with several other activities because they are believed to
cause a negative view to the urban landscape (beggars, vagrants) impede traffic or
encroach on the roadways by street vendors, java plum markets...
In the space of the urban areas, the informal economic sector thrives and there is no
private space for this sector. Informal economic activities take place in homes
(household business), on the sidewalk (sidewalk business), next to fences of the
agencies, schools, hospitals, barracks ... (fence business), at the bus stations, market
lanes, and java plum markets. Urban authorities can hardly get rid of or shrink the
informal economic activities using just by an administrative orders voluntarism only
because this sector is tied to employment and income of a large number of urban
residents.
2.5.4. New appearance of economic sector in urban creativity
Globally, creative industry has become an important part of the global economy, has
been growing rapidly in the interface between culture, business and technology; the
commercial value of creative goods and services in the world reached 592 billion
dollars in 2008 (Report on Creative Economy of the United Nations, 2010).
In many Western countries such as Britain, the United States ..., creative industry is
one of the sectors with largest contributors to the economy including the sub-sectors
such as advertising, architecture and design, gaming software, film, television, radio,
publishing, music, performing arts, fine arts and crafts. Creative industry provided
labor and employment and national exports.
Vietnam is a country with large-scale domestic market, with 90 million people and a
rich culture, a young population loving the business and rapidly developed
information industry, Vietnam has great potential to develop creative economy.
Currently, the network of creative entrepreneurs in Hanoi and Ho Chi Minh City has
been formed, in the fields of fashion, film, design and film/ multimedia
communications. Especially big cities of Hanoi and Ho Chi Minh City will be a place
of best transmission of creative industries in order to become one of the key economic
sectors of the country in the strategy of restructuring macro economy of the country in
coming years.
36
Dr. Phạm Sĩ Liêm

91
2.5.5. Urban Finance
a) Overview
Currently the most common of the financial system is meant to be the convergence of
relationships reflecting the formation mechanism and the interaction of income and
expense of a certain entity (State, locality, administrative levels, businesses ...). Thus,
the urban financial system is not out of the urban convergence of such relationships
for a urban area.
Overall urban financial relations: (1) Relation with national finance; (2) the financial
relation within the urban (Financial relation in the urban areas); (3) the financial
relation with urban areas and other localities (financial relation outside urban areas).
In particular, the relation with national finance has a particularly important position.
This relationship represents the rights and obligations of a locality to national
finance... Currently in the process of renovation, restructuring of economic structure
and transformation of growth model, the other relations of urban financial system are
gradually occupy their rightful position... Because, financial resources for urban
development cannot be confined within the relation with the state budget (government
budget), but also including resources mobilized from urban areas and external
attraction urban.
Chart 1 54: Overall relations of urban financial system
Pursuant to the Law on Organization of People's Councils and People's Committee in
2003 and the Law on State Budget (the state budget) No. 01/2002/QH11, (Law on
State Budget No. 83/2015/QH13 issued on June 25, 2015, with effect from budget year
2017), on the principles, the local budget balanced with total expenditure not
exceeding the total revenues. The revenues of the local budgets consist of 18 revenues
that local budgets (with representatives of the provincial level) are entitled to 100%
and 6 revenues are divided in proportion between the central budget and local
budgets; and additional revenues from higher-level budgets. Actually, only the
provinces and centrally-run cities are decentralized most missions and powers:
TÀI CHÍNH ĐÔ THỊ
CHI
THU
TÀI CHÍNH BÊN NGOÀI ĐÔ THỊ
TÀI CHÍNH BÊN TRONG ĐÔ THỊ
TÀI CHÍNH QUỐC GIA

92
- The revenues of local budgets gathering to provinces, then provincial People's
Council decides to allocate specifically revenue sources and expenditure tasks for
each budget in districts and communes;
- Where provinces have expenditure needs in infrastructure construction of
provincial subject, they must ensure but beyond balance capacity, then they are
permitted to raise capital in the country and have to balance the budget for debt
repayment. The outstanding balance of mobilized capital does not exceed 30% of
annual investment capital for construction in the country of provinces;
- Be established financial reserves from the increased revenue and the budget
balance to meet expenditure needs when could not concentrate revenues.
For the budget of cities and provincial towns, the Law on State Budget stipulated only
to enjoy at least 50% registration fee revenues, not including land registration fee, and
is mobilized from the contribution of organizations and individuals to invest in urban
infrastructure construction on the principle of voluntary. In addition, it is no different
from districts with the agricultural economy.
The decentralization process has created quite spacious financial autonomy for
centrally-run province and cities, in which the local revenues contributed a lot for the
central budget (currently, only a few dozen of such localities).
Although the mechanism of urban budget collection under the State Budget Law has
strengths such as: (1) When the urban economic grows, then the revenue also
increases; (2) Encourage urban authorities to take all and prevent revenue loss.
However, the State Budget Law (public financial institution) has not yet paid due
attention to the role of provincial urban areas, making financial resources for the
development of these urban areas, including the city grade 1, grade 2 also dependent
on the provinces. In particular:
- Provinces determine the rate of revenue distribution for urban areas on the
basis of calculating income and expenditure tasks, in which the development and
investment expenditure areas are high schools at all levels, lighting, water supply,
urban transport, urban sanitation and other welfare facilities (unspecified including
works of public health, culture and society?). But in fact, ODA projects on
infrastructure such as water supply and urban sanitation etc... in urban areas are
managed by provinces, completed projects are also operated and supplied by
provinces; urban areas only involve as the beneficiaries and solely responsible for land
clearance and compensation. This means that the financial resources for development
are also dominated by provinces, then urban areas cannot promote positiveness and
autonomy in urban development.
- The percentage of revenues divided for the urban is not determined in
accordance with clear rules so it is volatile and unpredictable, making difficult for
urban areas in setting a target to strive for stable and solid financial resources.
- Revenues themselves mobilized in accordance with the law are not clear, so it
is difficult to exploit. (Even vulnerable to abuse to direct at other targets)
The process of rapid urbanization in Vietnam poses enormous challenges as
spontaneous migration, the overload of the infrastructure and housing system, the
existence of large number of "unofficial" citizens and "unofficial" economic sectors.
In this context, institutionally provincial urban areas are not different from to the

93
district, which is a major inadequacy. So it is time to renew strongly urban
administrative institutions, including the urban finance.
b) The urban financial resources
According to the State Budget Law, urban finance has two main sources of revenue
including revenue allocated by the provinces and self-mobilized revenue. Urban
budget revenue allocated by provinces is formed according to the decentralization
mechanism. Specifically, the provincial People's Council bases on in local revenues,
which the proportion assigned by the Prime Minister to be entitled by provinces, and
other revenues that the provinces are entitled to 100%, to decide the proportion of
reallocating such revenues for the urban budget. These revenues are divided into
several groups as follows:
(1) Revenues from natural resources, including: Housing and land tax ; Land use
right transfer tax; Agricultural land use tax; Land rents; Revenues from public land
funds and revenues brought in other products; Royalties (excluding tax revenues
from oil and gas resources).
(2) Revenues from property: Income from the lease and sale of houses
under state ownership; Urban budget payback in economic institutions; Income
from capital contributed by the urban areas.
(3) Revenues from production, business, public service: Excise tax; Value added
tax; Corporate income tax; Personal income tax; Tax on transfer of profits abroad;
Special consumption tax on goods and services in the country; Oil charge; Fees
collected from consumers of public services; Registration fees, fees and charges
from business activities; Revenues from lottery.
Total revenues in the locality
As of December 28, 2015, the total state budget revenues reached nearly 957 trillion
VND. Most localities met the target and exceeded assigned revenue estimates.
Among 41 cities surveyed, total budget revenues of four central cities reached
approximately 434,000 billion VND, accounting for more than 45% of national
budget revenue, including Ho Chi Minh City (266,776 billion VND) and Hanoi
(141,690 billion VND) which are national cities of great dynamics and are considered
exceptions, not comparable with other cities and provinces. In the remaining leading
urban areas such as Vung Tau (3,491 billion VND), Thanh Hoa (3,357 billion VND)
and Hue (2,871 billion VND), they are all large cities having developed economic
with very many industrial parks and tourism centers and a lot of national and regional
services.
In consideration of the economic and social areas in the Midlands and northern
mountainous regions, the budget revenues are the lowest in comparison with other
regions. The Chu Town (type IV) and Ha Giang City (type III) are the lowest revenues
of 21.8 billion VND and 135.6 billion VND, respectively. Cities such as Thai Nguyen
City, Viet Tri City or Sapa Town reached low revenue of nearly 1,000 billion VND;
despite the fact these cities have many industrial and economic facilities.
The Red River delta and the northern key economic Regions have seen relatively
uniform budget revenues. The big urban areas regarded as industrial centers in Hanoi
reached the rate of about 2.000 billion VND in budget. Small urban areas with less

94
economic impacts reached low revenues such as My Hao Town (823 billion VND) or
Tam Diep Town (347.7 billion VND).
In the remaining four socioeconomic areas, the difference in revenue in cities is
relatively clear. The revenue of the large cities such as Thanh Hoa, Hue, Vung Tau or
Thuan An are higher than the remaining Cities (2,000-3,500 billion VND). However,
some type II cities and towns such as Ca Mau, Bac Lieu, Vi Thanh have low income
of just less than 500 billion VND. The small urban areas with less favorable economic
conditions have a lower rate in comparison with other urban areas in the country, such
as Phu Phong or Chu Se towns (type IV) with the revenues of 25.2 billion VND and
12.7 billion VND, respectively. Cua Lo as a tourism hub of the region just has the
revenue of only 118 billion VND.
In aggregate, the urban areas with high budget revenues have developed industrial and
services sector. In contrast, despite not located in difficult areas and remote regions,
urban areas with industrial sector and services being undeveloped and the agriculture
still accounting for a large proportion of the economic structure, the revenues are
small and these areas still even receive subsidies from the State. One example of Nam
Dinh City, used to be the national industrial center, this city sees the lowest revenue of
about 1,000 billion VND, among the same-type urban areas along the Red River delta.
The relatively special case is Da Nang city which is considered as the third largest city
in the country, the total budget revenue in the province in 2015 was only 11,661
billion VND, equal to 10% of Hanoi‟s total budget revenue and 5% of Ho Chi Minh
City‟s. The similar city is Can Tho in the Mekong Delta. Both Da Nang and Can Tho
have low level of revenue, not corresponding to their role and status in the region and
the country. It can be explained that the scale of services and industrial sector in the
two cities is modest. It is clear that two cities do not have the industrial parks and key
economic zones with lack of the big FDI projects. Their services sector, despite the
outstanding potential, has yet to stand out of the region, unable to compete with Ho
Chi Minh City, Hanoi and other cities.
Chart 1 55: Total budgets of provincial cities
0.0
500.0
1,000.0
1,500.0
2,000.0
2,500.0
3,000.0
3,500.0
4,000.0
TP Hà Giang
TP Bắc
Giang
TP Thá
i Ngu
yên
TP việt Trì
TP Lai C
hâu
TX Sôn
g Côn
g
TT Sa Pa
TT C
hũ
TP Hà Nội
TP Bắc
Ninh
TP Hạ Lon
g
TP Thá
i Bình
TP Nam
Định
TX Tam
Điệp
TX Phú
c Yên
TT Mỹ Hào
TP Tha
nh H
óa
TP Đồn
g Hới
TP Huế
Đà Nẵn
g
PR-T
háp Chà
m
Tx cử
a Lò
TT Phú
Pho
ng
TP Pl
eiku
TP Đà Lạt
TX G
ia N
ghĩa
TT C
hư Sê
TT Phước
An
TP HCM
TP Bà Rịa
TP Vũn
g Tàu
TP Tây
Ninh
TX Đồn
g Xoà
i
TX T
huận
An
Cần
Thơ
TP Vị T
hanh
TP Bạc
Liêu
TP Cà M
au
TP Rạc
h Giá
TT Cần
Đướ
c
TT Lấp
Vò
Tổng thu ngân sách (tỷ đồng/năm)

95
Chart 1 56: Total budgets of central cities
0.0
50,000.0
100,000.0
150,000.0
200,000.0
250,000.0
300,000.0
TP Hà Nội TP HCM Đà Nẵng Cần Thơ
Tổng thu ngân sách (tỷ đồng/năm)
Fiscal balance
Budgets are spent on development and investment in socio-economic missions as well
as on reserves. Except for Ho Chi Minh City and Can Tho City with large expenses
(but their balances of income and expenditure are still higher), the remaining cities‟
expenditure is proportionate to revenues. Generally, the budget spending is fairly
correlated with classified urban sizes. According to statistics, the cities of the same
type have similar budget expenditures.
In terms of the balance of revenues and expenditures, 40 out of 41 cities surveyed
have positive balances, reaching 97.5%. Of these, the most prominent is Ho Chi Minh
City, followed by Vung Tau City (2,662 billion VND), Hue City (1,708 billion VND),
and Thanh Hoa (1,596 billion VND). The figure 97.5% shows that the cities are the
economic centers of the region and the province. However, Lai Chau City has a
negative balance of revenues and expenditures. It can be understood that this city is at
the time of capital construction investment and the budget is needed.
Chart 1 57: Chart of total expenditure
0.0
500.0
1,000.0
1,500.0
2,000.0
2,500.0
TP
Hà Giang
TP
Bắc
Giang
TP Thá
i Ngu
yên
TP
việt T
rì
TP Lai
Châ
u
TX S
ông Côn
g
TT Sa Pa
TT C
hũ
TP
Hà Nội
TP Bắc
Nin
h
TP
Hạ Lon
g
TP Thá
i Bìn
h
TP Nam
Địn
h
TX T
am Đ
iệp
TX P
húc Yên
TT M
ỹ Hào
TP
Tha
nh H
óa
TP Đồn
g Hới
TP Huế
Đà Nẵn
g
PR-T
háp Chà
m
Tx cử
a Lò
TT Phú
Pho
ng
TP
Pleiku
TP Đà Lạt
TX G
ia N
ghĩa
TT C
hư S
ê
TT P
hước
An
TP
HCM
TP Bà Rịa
TP Vũn
g Tàu
TP Tây
Nin
h
TX Đồn
g Xoà
i
TX T
huận
An
Cần
Thơ
TP
Vị T
hanh
TP
Bạc
Liêu
TP Cà M
au
TP
Rạc
h Giá
TT Cần
Đướ
c
TT Lấp
Vò
Tổng chi ngân sách trên địa bàn (tỷ đồng/năm)

96
Chart 1 58: The total budget capital for capital construction investment in centrally-run
urban areas
0.0
20,000.0
40,000.0
60,000.0
80,000.0
100,000.0
TP Hà Nội TP HCM Đà Nẵng Cần Thơ
Tổng chi ngân sách trên địa bàn(tỷđồng/
năm)
Total budget for construction of urban infrastructure
Overall, among 41 cities surveyed, total budget for investment and construction of
urban infrastructure is relatively correlated with classified urban scale. According to
statistics, the cities of the same type see less difference in budget expenditures.
However, there are some cities having outstanding urban capital expenditure for
construction of urban infrastructure such as Thai Nguyen City, Lai Chau City, and
Thai Binh City that are still growing, expanding, or attracting investments. Chart 1 59: Budget for investment and construction of urban infrastructure
0.0
20.0
40.0
60.0
80.0
100.0
120.0
140.0
160.0
180.0
200.0
TP H
à G
iang
TP Bắc
Gia
ng
TP Thá
i Ngu
yên
TP việt
Trì
TP Lai
Châ
u
TX S
ông
Côn
g
TT Sa Pa
TT Chũ
TP H
à G
iang
TP Bắc
Nin
h
TP Hạ Lon
g
TP Thá
i Bìn
h
TP N
am Địn
h
TX T
am Đ
iệp
TX P
húc Y
ên
TT Mỹ
Hào
TP Tha
nh H
óa
TP Đồn
g Hới
TP H
uế
TP Thá
i Ngu
yên
PR-T
háp
Chà
m
Tx cử
a Lò
TT Phú
Pho
ng
TP Ple
iku
TP Đ
à Lạ
t
TX G
ia N
ghĩa
TT Chư
Sê
TT Phước
An
TP Bắc
Gia
ng
TP Bà Rịa
TP Vũn
g Tàu
TP Tây
Nin
h
TX Đồn
g X
oài
TX T
huận
An
TP việt
Trì
TP Vị T
hanh
TP Bạc
Liê
u
TP Cà M
au
TP Rạc
h G
iá
TT Cần
Đướ
c
TT Lấp
Vò
Tổng vốn ngân sách dành đầu tư xây dựng hệ thống hạ tầng ĐT(tỷđồng)
Capital for construction and investment
The total capital of the cities for urban construction is an index showing its
development and appeal of the city. In the central cities of the Provinces, where
conditions of socio-economic development are favorable, investment funds for urban
construction are numerous such as Hanoi, Ho Chi Minh City, and Da Nang…

97
Chart 1 60: Total budget for capital construction investment in provincial cities and towns
(billion VND)
0.00
100.00
200.00
300.00
400.00
500.00
600.00
700.00
TP H
à G
iang
TP Bắc
Gia
ng
TP Thá
i Ngu
yên
TP việt
Trì
TP Lai
Châ
u
TX S
ông
Côn
g
TT Sa Pa
TT Chũ
TP H
à Nội
TP Bắc
Nin
h
TP Hạ Lon
g
TP Thá
i Bìn
h
TP N
am Địn
h
TX T
am Đ
iệp
TX P
húc Y
ên
TT Mỹ
Hào
TP Tha
nh H
óa
TP Đồn
g Hới
TP H
uế
Đà Nẵn
g
PR-T
háp
Chà
m
Tx cử
a Lò
TT Phú
Pho
ng
TP Ple
iku
TP Đ
à Lạ
t
TX G
ia N
ghĩa
TT Chư
Sê
TT Phước
An
TP H
CM
TP Bà Rịa
TP Vũn
g Tàu
TP Tây
Nin
h
TX Đồn
g X
oài
TX T
huận
An
Cần
Thơ
TP Vị T
hanh
TP Bạc
Liê
u
TP Cà M
au
TP Rạc
h G
iá
TT Cần
Đướ
c
TT Lấp
Vò
Tổng vốn ngân sách đầu tư xây dựng cơ bản (tỷ đồng)
Chart 1 61: The total budget capital for capital construction investment in centrally-run
urban areas (billion dong)
0.00
50000.00
100000.00
150000.00
TP Hà Nội TP HCM Đà Nẵng Cần Thơ
Tổng vốn ngân sách đầu tư xây dựng cơ bản(tỷđồng)
c) Mobilization of extra-budgetary funds for urban development
According to Dr. Pham Sy Liem, Municipal governments need to mobilize more
financial resources to invest in building infrastructure, addressing the problems of lack
of clean water, traffic congestion, flooding when heavy rains, rivers and lakes polluted
by urban waste water, air pollution and urban waste water... In fact, the financial
needs for the development of urban infrastructure are much bigger than the actual
budget. In the current situation, municipal governments must arrange the order of
priority for investment projects, and manage the implementation of such projects
effectively. There are two financial sources that can be mobilized including ODA
loans and the proceeds from the land. Currently, a number of projects in urban
infrastructure are relying on credit loans through State development investment funds
or loans from the state-owned commercial banks, or local bond issue if the
Government allow. However, the provincial debts must not be too huge. In recent
years, one of the central provinces and cities has applied the experience of HIFU Fund
and Ho Chi Minh City to set up local development investment funds. In 2007, there
were 15 local development investment funds established. The Government passed a
Decree to manage the operation of the funds.
In fact, urban finance of Vietnam is facing many challenges. The funding is not
enough for the operation and management of infrastructure systems. Financial power
is much more held by provincial authorities than city governments so that city
governments fail to be active in the development and management of infrastructure.
Revenues from the land is complex and lack transparency, especially no tax collection

98
(property tax) makes cities ignore this important source of revenue; the urban services
fee is too low, making the city budgets spent heavily; local development investment
funds have not been open to the provinces so that the funds should not become an
important financial tool for urban development.
d) Reform of tax and toll collection:
Budget revenues are associated with taxes and fees from land resources which have
not gained much because the exemption policies in many cases. This source of
revenue increases 5.4%, 8.1%, 4.3% and 11.2% from 2000 to 2003, respectively.
Current water supply services are chargeable. Garbage collection services are
chargeable, but not much, just enough to cover overhead management expenses. Many
urban areas apply additional 10% of charge of waste water collection into the water
supply charge. In the near future, the water supply charge will have to increase to
cover the due ODA loans.
The reform of the housing and the supply of urban public services have improved.
Since 1992, Vietnam has implemented the reform of urban housing, sold state housing
to existing tenants, and allowed the commercial housing which have made the
development of the housing market and reduced the burden on budget expenditure.
The supply of urban public services has been based on the Enterprise Law and the
Investment Law. The production and supply of products and public services have
moved to other stages.
The introduction of 1995 State Enterprise Law divided state enterprises into 2 categories: the ones do business
for profit and the other ones supply public utilities and public services for social interests, benefits and
environmental protection. The previous non-profit organizations in charge of water supply, transportation,
public lighting, garbage collection and disposal, parks etc. ... were equalized increase management autonomy,
but the corporate finance is entirely or largely based on urban budget.
2003 State Enterprise Law defines the rights and obligations of state-owned enterprises in the production and
supply of products and public services under the orders or plans assigned by the State. Accordingly, including
the State can invest the property in state-owned enterprises in corresponding to assigned tasks and urban
budgets can be used pay for part or whole the excessive costs. Decree No. 31/2005 providing for the
manufacture and supply of products and public services identifies that several types of urban services are public
service if they are unlikely to offset the costs according to market mechanisms such as drainage water, public
lighting, pavement maintenance, public transport, public toilets, parks, cemeteries, etc. ... For urban water
supply services, all fees must be collected
1996 Foreign Investment Law, promoting the attracting to foreign investment into the projects to build BOT
infrastructure, is almost ineffective.
2005 Business Law, replaced 1999 Business Law, applies to the private sector and state-owned enterprises.
2003 State-Owned Enterprises Law defines the rights and obligations of the enterprises in all economic sectors
for manufacturing and supplying the products and public services.
2005 Investment Law, unified 1996 Foreign Investment Law with 1987 Domestic Investment Encouragement
Law, paved the way to attract all the investment capital through BOT, BT and BTO projects for new
construction, expansion, modernization and operation of transportation, electricity, water supply and waste
treatment works.

99
2.6. Social services in urban areas
2.6.1. The concept of basic social services in urban areas.
According to the United Nations, the approaching from Human Rights and ensuring
human rights, the basic social services to ensure social security expressed in terms of:
(1) basic education, (2) basic health care, (3) the place of residence (housing), (4)
fresh water supply and (5) access to information.
According to UNHABITAT, basic services for the people include: (1) Water and
Sanitation, (2) Communications, (3) energy, (4) Collection and treatment of waste
water, (5) Telecommunications, (6) Health, (7) Education, (8) Public safety, (9) Social
Welfare.
According to UDA, basic social services meet basic and essential needs of the people
living and working in urban areas and are divided into 4 major categories: (1) Services
to meet the basic physical needs: Eating, hygiene, care, housing ... for every people
including vulnerable subjects as children, disabled persons without working capacity
to be met this demand for physical development; (2) Medical Services: Including all
forms of medical care, nursing and rehabilitation physically and mentally for the
people; (3) Educational services: Schools, training courses, life skills training, forms
of inclusive, integrated and specialized education... (4) Services on Entertainment,
community activities and information: This is type of social services linked to
recreational activities such as culture, arts, sports...
According to Assoc. Prof. Dr. Nguyen Hong Thuc, social services approach from the
distribution of public service system in urban areas, including: (1) energy network, (2)
transport, (3) water supply and drainage, (4) telecommunication, ( 5) scientific and
technological services, (6) education and training, (7) culture - constitution - spirit, (8)
health care and tourism, (9) essential life services, (10) natural ecological reserve, (11)
urban management, (12) environmental sanitation; public service system is an
important driving force for urban development.
According to Dr. Dang Duc Dam, Social services approach from management (public
services), including administrative areas (civil authority administration and public
administration) and career (public services and commonweal services). Thus social
services include (civil authority administration: legislation, execution, judice, security,
defense and diplomacy...); public administration services (licenses, civil status, residence,
registration, registry, notaries ...), public services or social services (education, health,
culture, sports, entertainment ...) public services and welfare services, economic services (public transport, environmental sanitation water supply and drainage, lighting, green
park...). In many Western countries, public services are used in a wide range including
civil authority administration. In Vietnam, the concept of public services is applied in
a narrower sense, including 3 groups: (1) public administrative services, (2) public
services and (3) commonweal services.
The objective is to invest in social services and social security to protect people from the
risks (e.g. environmental, social, economic or health, as well as improve resilience); high
quality social services with affordable prices and a system of comprehensive social
security are the basis for a stable and prosperous society, and are a prerequisite for
improving human development and life quality; rather than creating a protection network
for vulnerable and most marginalized populations. Worldwide, more and more people
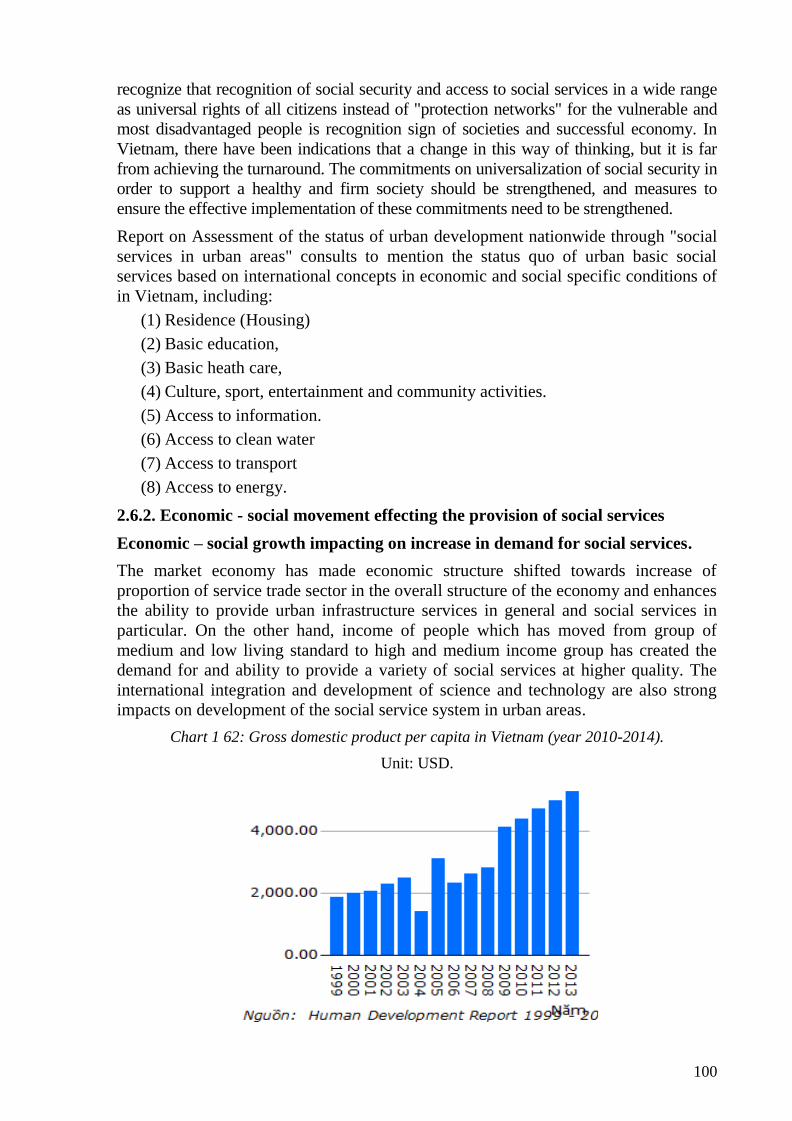
100
recognize that recognition of social security and access to social services in a wide range
as universal rights of all citizens instead of "protection networks" for the vulnerable and
most disadvantaged people is recognition sign of societies and successful economy. In
Vietnam, there have been indications that a change in this way of thinking, but it is far
from achieving the turnaround. The commitments on universalization of social security in
order to support a healthy and firm society should be strengthened, and measures to
ensure the effective implementation of these commitments need to be strengthened.
Report on Assessment of the status of urban development nationwide through "social
services in urban areas" consults to mention the status quo of urban basic social
services based on international concepts in economic and social specific conditions of
in Vietnam, including:
(1) Residence (Housing)
(2) Basic education,
(3) Basic heath care,
(4) Culture, sport, entertainment and community activities.
(5) Access to information.
(6) Access to clean water
(7) Access to transport
(8) Access to energy.
2.6.2. Economic - social movement effecting the provision of social services
Economic – social growth impacting on increase in demand for social services.
The market economy has made economic structure shifted towards increase of
proportion of service trade sector in the overall structure of the economy and enhances
the ability to provide urban infrastructure services in general and social services in
particular. On the other hand, income of people which has moved from group of
medium and low living standard to high and medium income group has created the
demand for and ability to provide a variety of social services at higher quality. The
international integration and development of science and technology are also strong
impacts on development of the social service system in urban areas.
Chart 1 62: Gross domestic product per capita in Vietnam (year 2010-2014).
Unit: USD.
!

101
Chart 1 63: Gross domestic product at comparative price in 2010 classified business sectors
in 2010-2014.
Unit: billion dongs)
Urbanization and demand for social services in urban areas.
The process of strong urbanization in the past 30 years has been posing major
challenges for the provision of urban housing and social services, especially in big
cities or urban areas in regions of Ho Chi Minh City where the immigration is at the
highest rate of the country. On the other hand, the expansion of urban space to suburbs
also requires adding additional basic social services. The statistics on migration rates
in some provinces and cities with rapid urbanization speed shows that the rate of
immigrant remains high from 2009 to 2014. Most of the immigrants are young people,
accounting for about 70%, between the ages of 15 -39, and they have more
opportunities to access to basic social services than indigenous people.
Chart 1 64: Migration rate by province
Tỷ suất nhập cư
2010 2011 2012 2013 Sơ bộ 2014
Hà Nội 10,8 11,0 6,1 7,7 7,5
Quảng Ninh 3,7 3,6 2,0 4,5 3,8
Hải Phòng 7,0 7,1 6,0 6,6 4,0
Đà Nẵng 29,8 22,8 17,5 15,5 14,0
Bình Dương 89,6 64,8 59,1 54,5 70,2
Đồng Nai 27,2 31,4 18,5 14,6 23,6
Bà Rịa - Vũng Tàu 13,3 16,5 10,5 10,8 15,0
TP. Hồ Chí Minh 26,2 25,0 14,8 16,5 16,9
Cần Thơ 9,8 6,9 8,9 9,6 8,2
Notes: From 2008 to date, data of Hanoi includes data of Ha Tay Province
Change in population structure affecting types of social services 37
.
37
Source: Conference report “Social service for human development" in Conference: Current and solutions of
social service development in Vietnam Cities, UNDP.

102
According to research by UNDP in the table below, aging index of Vietnam increased
from 1999 to 2009 and it is forecasted to continue to increase over the next years. This
index is higher than the average of 30% of other countries in Southeast Asia. While
immigrants are rejuvenating, the indigenous people tend to aging rapidly. Aging is
increasingly evident in Vietnam at a higher speed than other countries in the world
that poses an increasing pressure on health and social services.
Chart 1 65: Forecast of Vietnam’s population: Rapid growth of the "oldest”
Age groups (%) in the total
population
1979 1989 1999 2009 2019 2029 2039 2049
60-64 2.28 2.40 2.31 2.26 4.29 5.28 5.80 7.04
65-69 1.9 1.9 2.2 1.81 2.78 4.56 5.21 6.14
70-74 1.34 1.4 1.58 1.65 1.67 3.36 4.30 4.89
75-79 0.90 0.80 1.09 1.40 1.16 1.91 3.28 3.87
>80 0.54 0.70 0.93 1.47 1.48 1.55 2.78 4.16
Total 6.96 7.20 8.11 8.69 11.78 16.66 21.37 26.10
Source: Census of population and housing / Cited from the UNFPA report, 2011: Population aging in Vietnam:
current situation and forecasts, possible policies and responses
The development of national urban systems have become the driving force of social-
economic development, with an average economic growth in urban areas of 10-15%
(nearly two times higher than the whole country), income from economic activities of
the municipality, especially in big cities, is estimated to account 70-75% of the
national GDP. Our country's urban centers have been made significant contribution to
the economic development of the whole country, created a diverse job market for
employees, contribute to the national security, stability and development of society.
The scale of the relentless urban is continuously expanding that has created the
significant revenue for investment and in urban areas, however it also requires the
provision of infrastructure for economic and social development including social
service system.
2.6.3. Current status of basic social services in urban areas
Before 1986, the state is responsible for providing all the basic social services. During
the conversion from centralized planning to a market-orientation, the State has taken
socialization measures to mobilize all sectors of society to contribute and provide
social services. However, due to the small size and low economic capacity of the
private sector in Vietnam, socialization in Vietnam refers to more involvement of the
private sector in the provision of basic social services in urban areas and households in
paying for health care and education, as well as refers to the commercialization of
public education and health services.
Provision of basic social services is presented in some urban indicators, such as:
Proportion of land for construction of urban public works38
: Survey data in 41 urban
area selected for project of NUDS shows that most land funds for the construction of

103
basic social services such as health, education, culture, sports ... have meet
requirements as prescribed. Many urban centers exceeded the target specified in
Vietnam construction regulations such as DaLat, Thai Binh, ThanhHoa, Viet Tri ...
because these are provincial urban centers, the social services serve not only the
residents of such urban centers, but also the whole province. It means that the land for
construction of public works in urban areas = land fund for public works for urban
residents+ land fund for provincial public works. For example, Thai Nguyen city is a
regional center for training and education, whereby land fund for training and
education of Thai Nguyen city will make up a larger proportion than most of other
municipalities (at the same type and level).
Chart 1 66: Chart of proportion of land to build urban public works
(Compared with 6 economic zones and based on urban classification)
0.0
5.0
10.0
15.0
20.0
25.0
TP Hà
Gia
ng
TP Bắc
Gia
ng
TP Thá
i Ngu
yên
TP việ
t Trì
TP Lai
Châ
u
TX S
ông
Côn
g
TT Sa
Pa
TT Chũ
TP Hà
Nội
TP Bắc
Nin
h
TP Hạ
Long
TP Thá
i Bìn
h
TP Nam
Địn
h
TX T
am Đ
iệp
TX P
húc Y
ên
TT Mỹ
Hào
TP Tha
nh H
óa
TP Đồn
g Hới
TP Huế
Đà
Nẵn
g
PR-T
háp
Chà
m
Tx cử
a Lò
TT Phú
Pho
ng
TP Ple
iku
TP Đà
Lạt
TX G
ia N
ghĩa
TT Chư
Sê
TT Phước
An
TP HCM
TP Bà
Rịa
TP Vũn
g Tàu
TP Tây
Nin
h
TX Đồn
g X
oài
TX T
huận
An
Cần
Thơ
TP Vị T
hanh
TP Bạc
Liê
u
TP Cà
Mau
TP Rạc
h G
iá
TT Cần
Đướ
c
TT Lấp
Vò
Tỷ lệ đất XD CTCC cấp đô thị(%)
The proportion of the total land to build the urban public centers and works is
different significantly among urban areas, varying in the range of 4% -6%. The cause
may be that regional public works are distributed in urban areas in the north while
regional public works are evenly distributed within the province and not in urban
areas in the South.
Service costs compared to the average income
The cost of urban social services refers to a local person‟s spending for social services
in order to meet his/her basic needs for living and working in urban areas.
It can be understood that the ratio of the average service cost and average urban
income is equivalent to the comparison between GDP per person (gross domestic
product) and a per capita income of the national territory. This means that if the
average service cost of an urban area is regarded "GDP per capita" within the urban
territory for some types of urban services, you can use this indicator to assess urban
life, urban rich and poor gap, and urban poverty rates calculated by assessing the
residual amount of money per capita after the costs of basic services in order to serve
as a basis for policy-making on improving people's living standards and poverty
reduction.
Overall, in the big cities such as Hanoi, Ho Chi Minh City, Da Nang, and Vung Tau,
cost of services in urban areas is also higher than the rest but the per capita income is
much higher than other municipalities so that the index of service charges and average
income in the big cities is still higher than other urban areas and the national average
level.

104
In the transition to a market economy, there is a great change in terms of size, form
and quality a network of social service providers in urban areas in Vietnam.
According to the UDA, the quality of urban residents‟ lives is mainly determined by
the quality of basic social services. Through assessing the current situation of the
urban development of Vietnam, there is lack of directions for overall comprehensive
development of urban social services and there is no policy to encourage the
development and socialization of investing resources to enhance the competition
capacity of service providers in the country. In addition, there is lack of a transparent
legal framework closely to control the quality of services for ensuring the rights of the
local people.
Access to basic social services as specified in the social security legislation recently
has been improved to reach the humans-oriented goals. Because of extensive content
and involvement in many different sectors of society, it requires completing and
synchronizing provisions of law, minimizing overlaps and conflicts, ensuring the
feasibility. In the current socio-economic situation of the country, the efforts to
improve the social security legislation on access to basic social services over time, and
to further ensure human rights are recognized as success in the development
orientation of our Party and State.
2.6.4. Accessibility of the people to social services in urban areas
a) Accessibility to social housing39
The Universal Declaration of Human Rights (1948) stated that "everyone has the right
to freedom of movement and residence within the borders of each State." In Vietnam,
the first Constitution in 1946 and the Constitution 2013 stated that: "Everyone has
freedom of movement and residence within borders of the State, has the right to leave
any country, including his own, and to return to his country." Residence Act 2007 and
amended in 2013 are one of the important steps in creating a favorable legal basis for
citizens to exercise their right to freedom of residence and choice of residence40
.
Residence Management: In practice, the regulations on household registration in
Vietnam has affected the right of residence and other personal rights embodied in
some activities such as birth registration, schooling, medical care, issuance of
identification card, passport, application for construction permit. In spite of relatively
tight regulation of the Residence Law, the Law of Capital Hanoi, the population of
Hanoi still increases mechanically about 5 thousand people each year. There are
communes near industrial zones with only 2,000 permanent residents, but the number
39Source: Dr. Nguyen Hien Phuong; Deputy Chairman of the Department of Labour Law - Social Security,
Hanoi Law University
40Article 9 of Residence Law 2006, amended and supplemented in 2013 provides for the right of citizen to
reside as follows:
- Select and decide place of permanent and temporary residence in line with provisions of the Residence Law
and other provisions of the relevant legislation.
- Be granted, re-granted, change family record book or temporary residence book and other documents related to
residence.
- Be provided with information and documents related to exercise of the right of residence.
- Require the competent state agencies to take measures to protect its right of residence.
- Complaint, denounce and sue for violations of law on residence in accordance with the law.

105
of immigration inhabitants is up to 40,000 people41
. This situation has been putting
pressure on the social security system in securing right of access to social services. On
May 6/2013, the Prime Minister has approved the project on simplification of
administrative procedures and population management database from 2013 to 2020
with the aim of modernizing the population management. It is considered as an
important content to modernize residential management by encrypting the information
in the birth certificate, family record book, register of birth, identity card in citizen
card. It is time to focus on management of residential by address of residence instead
of by household to ensure the equal access of all people to basic social services during
implementing reform.
Accessibility to housing: Ensure the execution of rights to reside for policy
beneficiaries, poor families in buying house and having a stable accommodation. The
State has encouraged, supported and given several incentives for urban development
and investment projects which have the criteria of social housing construction,
resettlement housing and reconstruction, improvement of old residence or apartment
areas or investment in construction of housing for lease42
. .
Laws and policies 43
have been supported people who have difficulties in social
housing, to ensure the access to accommodation and in the most basic requirements to
ensure the rights of life. However, the demand for social housing keeps increasing.
Therefore, there should be long-term and closer strategies in implementation for the
purpose of enforcing right of residence, especially for disadvantaged groups in
society.
b) Accessibility to health services44
The Universal Declaration of Human Rights1948 stated that: “Everyone has the right
to a standard of living adequate for the health and well-being of himself and of his
family, including food, clothing, housing and medical care and necessary social
services, and the right to security in the event of unemployment, sickness, disability,
41
http://www.thanhnien.com.vn/chao-buoi-sang/quyen-tu-do-cu-tru-87702.html dated 18/02/2014
42Clause 1 Article 6 Decree No. 11/2013/NĐ-CP on management of investment in urban development 43
Clause 1 Article 6 Decree No. 188/2013/ND-CP on development and management of social housing during
preparation, verification and approval of urban planning, plan of land use, construction planning of rural
resident area, development planning of economic zones, industrial zone, export processing zones, high-tech
zone Provincial People's Committees are responsible for, based on the land of the localities, allocating sufficient
land and directing authorities to determine specific location, scale and area of individual social housing
development projects which are synchronous in technical infrastructure and social infrastructure for delivery to
the investors under the provisions to implement the construction work
Clause 2 Article 6 Decree No. 188/2013/ND-CP providing for land fund for social housing construction projects
as to development projects of commercial housing, new urban areas in order to ensure social housing project in
actual: "Investor of development projects of commercial houses, new urban areas, regardless of scale and area of
land (including construction investment projects in the form of BT and BOT) in the urban areas of level III or
higher and areas planned as urban from level III or higher, must spend 20% of the total resident land area in the
detailed plan or master plan approved by the competent authorities which has been invested in building
technical infrastructure,, to build social housing.
44Dr. Nguyen Hien Phuong; Deputy Chairman of the Department of Labour Law - Social Security, Hanoi Law
University.

106
widowhood, old age or other lack of livelihood in circumstances beyond his
control,…”45
.
In terms of healthcare: in Vietnam, the right to protection and health care, equality
in the use of medical services was officially recognized in the Constitution 2013 and is
guaranteed mainly through health insurance activities and other forms of health care
ass promulgated in the Law on Medical examination and treatment 2009 and Law on
Health Insurance amended in 2014. Therefore, with the provisions of fundamental
rights of patients in Law on Medical examination and treatment, the position and
rights of patients are protected that create a legal basis to prevent violations of rights,
and bring comfort to the patients so that they have the opportunity to wellness at
health facilities.
To ensure the equity in access to healthcare and medical treatment services, Law on
medical Examination and treatment defined priorities and support for vulnerable
groups of people such as children, the poor, farmer, ethnic minority, people living in
areas with extremely difficult socio-economic conditions, gave priority to the
development of human resources, facilities in difficult and remote regions... In
implementing the law on Health Insurance, currently there are about 64.6 million
people buying Health Insurance nationwide, increasing by 2.7 million in comparison
to the same period of 2014, equivalent to 71.4% of the population, this is significance
for public life. Currently, the Ministry of Health has been implementing Project
towards health insurance for all people in the period of 2012-2015 and 2020 to ensure
the right of basic healthcare with general system ensuring equality and sharing risk in
cost of healthcare.
In terms of infrastructure and health services in urban areas46:
Number of beds of specialized medical facilities, such as general hospitals, health centers at
urban level (number of beds / 1000 people) according to a survey in 41 municipals in the
NUDS project NUDS, mostly meet the requirements (According to Decree No.42 on urban
classification, the lowest number is 1.5 bed / 1000 people). Currently, the city of Vung Tau (2
bed / 1000 people), has > 85% of urban area qualified (4 to 7.5 beds / 1,000 people); Thai
Binh City (23.4 beds / 1000 people) or Ph.C. Yen Town (13 beds / 1,000 people). Thai Binh
City has extremely high number of hospital beds because in recent years, the city is focusing
on investment to become the leading medical city of Vietnam in 2020. Chart 1 67: Number of bed in specialized healthcare facilities (bed/ 1000 people)
(Comparison to 6 economic zones and urban classifications)
45The Universal Declaration of Human Rights (1948) stated that “Motherhood and childhood are entitled to
special care and assistance. All children, whether born in or out of wedlock, shall enjoy the same social
protection.” In the Convention 102 of the ILO 1952 providing for regulations on minimum social security, the
health care regime is also the first regime mentioned in the social security regime system of prescribed by ILO
46According to Decision No.153/2006/QD-TTg on planning of developing the medical system in Vietnam for
the period to 2010, with vision to 2020, the 3-line hospital system will be allocated under administrative level of
District, Province and Central46
Monthly newsletter on social insurance in 6/2015, Vietnam Social Insurance
The hospitals at different administrative levels must meet the respective hospital standards (line 1 District level -
standard hospital level III; line- 2. Provincial level- standard hospital level II; Line 3- National level -hospital
standard hospital Level I or special level). Such hospitals and healthcare facilities will have the number of beds
and their quality corresponding to the industry standards. Although the plan also provides allocation direction of
healthcare network regardless of administrative boundaries, but the fact shows that the medical facilities are
largely concentrated in urban areas (cities, towns).

107
0.0
5.0
10.0
15.0
20.0
25.0
TP H
à G
iang
TP Bắc
Gia
ng
TP Thá
i Ngu
yên
TP việt
Trì
TP Lai
Châ
u
TX S
ông
Côn
g
TT Sa Pa
TT Chũ
TP H
à Nội
TP Bắc
Nin
h
TP Hạ Lon
g
TP Thá
i Bìn
h
TP N
am Địn
h
TX T
am Đ
iệp
TX P
húc Y
ên
TT Mỹ
Hào
TP Tha
nh H
óa
TP Đồn
g Hới
TP H
uế
Đà Nẵn
g
PR-T
háp
Chà
m
Tx cử
a Lò
TT Phú
Pho
ng
TP Ple
iku
TP Đ
à Lạ
t
TX G
ia N
ghĩa
TT Chư
Sê
TT Phước
An
TP H
CM
TP Bà Rịa
TP Vũn
g Tàu
TP Tây
Nin
h
TX Đồn
g X
oài
TX T
huận
An
Cần
Thơ
TP Vị T
hanh
TP Bạc
Liê
u
TP Cà M
au
TP Rạc
h G
iá
TT Cần
Đướ
c
TT Lấp
Vò
Số giường bệnh của cơ sở y tế chuyên sâu: bệnh viện đa khoa, trung tâm y tế cấp đô thị (giườngbệnh/1.000dân)
The number of medical works is an important indicator to assess the level of providing
medical infrastructure in the municipality. If an urban area has many medical works, it means
that the urban residents can access to healthcare services (in terms of distance) more easily. In
the survey of 41 urban areas under NUDS, this index is relatively evenly between urban and
socio-economic areas. The municipalities in northern mountainous, in spite of undeveloped
socio-economic conditions, still have quite high indicator, which show the extent of the
government's interest in the field of healthcare development. The number of medical works is
also proportional to urban type and classification, particularly Hue City which is the urban
center of this region and has a high index (45 facilities).
Chart 1 68: Number of medical works (compared to 6 economic zones and urban
classifications)
0.0
20.0
40.0
60.0
80.0
100.0
120.0
140.0
TP Hà G
iang
TP Bắc
Gian
g
TP Thái
Nguyên
TP việt
Trì
TP Lai
Châu
TX Sông C
ông
TT Sa P
a
TT Chũ
TP Hà N
ội
TP Bắc
Nin
h
TP Hạ L
ong
TP Thái
Bình
TP Nam
Địn
h
TX Tam
Điệp
TX Phúc Y
ên
TT Mỹ
Hào
TP Than
h Hóa
TP Đồn
g Hới
TP Huế
Đà Nẵn
g
PR-Tháp
Chàm
Tx cửa L
ò
TT Phú P
hong
TP Plei
ku
TP Đà L
ạt
TX Gia
Nghĩa
TT Chư
Sê
TT Phước
An
TP HCM
TP Bà R
ịa
TP Vũn
g Tàu
TP Tây
Nin
h
TX Đồn
g Xoài
TX Thuậ
n An
Cần T
hơ
TP Vị T
hanh
TP Bạc
Liêu
TP Cà M
au
TP Rạc
h Giá
TT Cần
Đướ
c
TT Lấp
Vò
Số lượng công trình y tế
Policies and mechanisms for health sector development
In terms of healthcare, in recent years Vietnam has issued many large investment policies for
medical and healthcare services to the local people. In most urban areas, there is a grassroots
network of healthcare facilities (central and specialized hospitals mostly in big cities such as
Hanoi, Ho Chi Minh City, Hue, Da Nang…). As reported by the Ministry of Health in 2014,
Vietnam reached its target of 23 beds / 10,000 people (up from 15.2 beds / 1000 people in
2004) and 7.8 doctors / 10,000 people (whereas, according to the data in other countries in
the region, Japan was 134 beds / 10,000 people, South Korea 95.6 beds / 10,000 people, and
China 27.5). State budget expenditures on health care were 6.6% of total expenditure in 2008
and 7.5% of total expenditure in 2015. In addition, the proportion of expenditure on health
services by the local people themselves was also high compared with many countries in the
region47.
47 According to WHO data on national health accounts, if a person‟s health spending exceeds 40% of the
solvency of a household (after deduction of payments for accommodation, food and foodstuff), the cost is a
disaster. Currently, the average cost in the world does not exceed 20%. The cost in Vietnam is currently
about 240 thousand VND/ family / month.

108
Chart 1 69: Synthesis of statistics on the medical service system in some years
2005 2010 2011 2012 2013
Number of health facilities 13,243 13,467 13,506 13,239 13,120
Number of beds (one thousand beds) 197.3 246.3 266.7 275.1 283
Number of actual beds per ten thousand
people
17.7 22 24 24.9 25.5
(Source: Summary Report 2013- General Statistics Office of Vietnam (GSO)
Socialization of medical services is flourishing. There are 171 private hospitals
with around 10,960 beds, accounting for 11% of all hospitals nationwide. The
Government issued Resolution No. 93/NQ-CP dated December 15th
, 2014 on a
number of mechanisms and policies on health development to promote the public -
private model. Many private hospitals have spacious facility, modern equipment,
but lack high quality human resources, resulting in limited capacity. As reported by
106 private hospitals, only 5% of hospitals reach the full capacity of bed
occupation, 17.4% of them reach the capacity from 85% to less than 100%, 21.6%
of them reach the capacity from 60% to less than 85%, and 56% of them reach the
capacity of 20-60%.
In relation to the challenges in the public health services, district health centers are
not being used to full capacity, while the provincial and central hospitals are
severely overloaded. The reason is that provincial and central hospitals have higher
skilled staff and more expensive equipment. The fact that patients must go to the
central hospitals will increase fee of travel and accommodation much higher.
c) Educational services
International Declaration of Human Rights 1948 states: "Everyone has the right to
education. Education shall be free, at least in the elementary and fundamental stages.
Elementary education shall be compulsory. Technical and professional education
shall be made generally available and higher education shall be equally accessible to
all on the basis of merit”48
. Vietnam is one of countries active in ensuring human
rights in the field of education, constitutional rights in the Constitution of 2013.
General education
Education scale education and network of general education establishments in
Vietnam have been developed, meet the basic learning needs of citizens. There are
elementary schools in all communes, high schools in all districts, provinces including
boarding and semi-boarding ethnic high schools. The quality of general education has
made progress; Vietnam have completed literacy goals, meet national standards on
elementary and fundamental education, elementary education is done at right age.
Conditions for ensuring equality in accessing to education has improved clearly,
particularly for ethnic minorities, children of poor families, who have difficulties, girls
and other disadvantaged groups increasingly get interest.
According to the survey index of NUDS project, enrollment rate in urban areas is
calculated by the number of students aged 16 to 18 in high school / total population
aged 16-18, it can be seen that, the rate school students in urban areas is less different
48
Declaration on Human Rights in 1948 also emphasized on ensuring free, fair, respectful understanding in
education. Millennium Declaration consider the "Achieve universal primary education. Ensure that all children
are able to graduate primary education " as the 2nd
goal.

109
but it is proportional to the level of socio-economic development and the rationality in
planning and development of that urban area.
Chart 1 70: Chart of school attendance % (in comparison with 6 economic areas and urban
classification)
0.0
20.0
40.0
60.0
80.0
100.0
120.0
TP H
à G
iang
TP Bắc
Gia
ng
TP Thá
i Ngu
yên
TP việt
Trì
TP Lai
Châ
u
TX S
ông
Côn
g
TT Sa Pa
TT Chũ
TP H
à Nội
TP Bắc
Nin
h
TP Hạ Lon
g
TP Thá
i Bìn
h
TP N
am Địn
h
TX T
am Đ
iệp
TX P
húc Y
ên
TT Mỹ
Hào
TP Tha
nh H
óa
TP Đồn
g Hới
TP H
uế
Đà Nẵn
g
PR-T
háp
Chà
m
Tx cử
a Lò
TT Phú
Pho
ng
TP Ple
iku
TP Đ
à Lạ
t
TX G
ia N
ghĩa
TT Chư
Sê
TT Phước
An
TP H
CM
TP Bà Rịa
TP Vũn
g Tàu
TP Tây
Nin
h
TX Đồn
g X
oài
TX T
huận
An
Cần
Thơ
TP Vị T
hanh
TP Bạc
Liê
u
TP Cà M
au
TP Rạc
h G
iá
TT Cần
Đướ
c
TT Lấp
Vò
Tỷ lệ học sinh đi học (%)
Disability Law in 2010 marked a turning point in ensuring the right to education for
people with disability in awareness. Gender equality in access to general education is
appreciated thank to success in completely removing gender barriers in accessing
learning opportunities. The policies on school fee exemption, scholarships and other
support for poor students, those under policies, ethnic minorities have brought
practical results in the implementation of social justice. To ensure social security
rights in basic education, the annual state budget spent to invest in education is large,
reaching 20% of total budget expenditure.
Vocational training, higher education
The number of education and training establishments (from elementary stages and
higher) compared to a minimum degree for urban classification49
, in fact, training
establishments mainly concentrated in large urban areas, with the majority in Ha Noi,
HCM City, Da Nang, Hue, Thai Nguyen. The management and monitoring of training
facilities is difficult because the Ministry of Education and Training only manage
about <1/3 of schools in the country, the remaining are managed by many units (the
central ministries, provincial agencies, etc…))
Chart 1 71: Chart on the number of education establishments from elementary stages and
higher (compared to 6 economic regions and urban classification)
0.0
100.0
200.0
300.0
400.0
500.0
600.0
TP H
à G
iang
TP Bắc
Gia
ng
TP Thá
i Ngu
yên
TP việt
Trì
TP Lai
Châ
u
TX S
ông
Côn
g
TT Sa Pa
TT Chũ
TP H
à Nội
TP Bắc
Nin
h
TP Hạ Lon
g
TP Thá
i Bìn
h
TP N
am Địn
h
TX T
am Đ
iệp
TX P
húc Y
ên
TT Mỹ
Hào
TP Tha
nh H
óa
TP Đồn
g Hới
TP H
uế
Đà Nẵn
g
PR-T
háp
Chà
m
Tx cử
a Lò
TT Phú
Pho
ng
TP Ple
iku
TP Đ
à Lạ
t
TX G
ia N
ghĩa
TT Chư
Sê
TT Phước
An
TP H
CM
TP Bà Rịa
TP Vũn
g Tàu
TP Tây
Nin
h
TX Đồn
g X
oài
TX T
huận
An
Cần
Thơ
TP Vị T
hanh
TP Bạc
Liê
u
TP Cà M
au
TP Rạc
h G
iá
TT Cần
Đướ
c
TT Lấp
Vò
Số lượng cơ sở giáo dục đào tạo
Education development policies and mechanism
49
According to Decree 42 on urban classification number of educational establishments in special urban areas is
30 ; in the cities grade I is 20; Class II cities are 10 establishments; Grade III cities is 4 and Grade IV cities is 2.

110
Vietnam‟s national education system is relatively complete with the full range
of education levels from preschool to graduate. Educational services are
increasingly invested by both public and private providers. Currently, the State still
plays a leading role in the education sector. The number of students enrolling in
private schools is only about 15% of the total students nationwide. The majority of
primary and secondary schools are public-owned while the majority of pre-school,
college, university and vocational training schools are private-owned.
State budget expenditures for education increased from 15.5% in 2001 to 20%
in 2008 and this rate has been maintained in recent years. In Vietnam in general
and in the urban areas in particular, the tuition fee exemption is applied mainly for
elementary students: 14% of kindergarten students, 80% of elementary school
students, 26% of secondary school students, 17.5% high school students, and
12.5% of college students (2008 statistics). Household spending accounts for about
50% of overall spending, focusing mainly on primary and junior secondary
education. Education spending is still a burden for poor households. According to
data of the National Report on Human Development by UNDP (2011 report), the
percentage of expenditure on education per pupil in total per capita spending in
urban areas is 14,1% for the primary level, 16.7% for secondary school level, and
24.4% for high school level.
The school area index is usually lower than the prescribed standards, due to the
fact that the land in urban centers is scarce. The majority of the schools only can
offer a place to study for students while the physical training spaces (sports, arts,
social activities) are limited. The model of non-public education faces many
difficulties. Despite established and operated for the long years, some schools have
yet to invest in building standard facilities. Many new schools are investing in
spacious area, full equipment, but few students are enrolled. One of the basic
difficulties hindering enrollment in new private schools is high tuition fees.
Chart 1 72: Distribution of population aged 5 and over by the school attendance in the
1989- 2013 period
Unit: Percentage
School attendance 1989 1999 2009 2010 2012 2013
Total 100 100 100 100 100 100
Attending 23.6 27.6 24.7 24 23.4 23.3
Left 58.4 62.6 70.2 71.2 72.6 72.9
Never go to school 18 9.8 5.1 4.8 4 3.8
(Source: A report by GSO: Investigating population changes and family planning on April
1st, 2013 - key results)
Besides the success in ensuring the right to basic education, ensuring the right to
education is facing some limitations from the perspective of security. For example the
legal documents and policies systems on education was not really in sync, there are
still overlaps and inconsistencies in the implementation of many different localities,
quality and efficiency of education are not met the requirements of national
development demands, facilities, teaching equipment of schools are inadequate,
especially in remote areas, which prevent the access to basic education of children.

111
Vietnam Socio - Economic Development Strategy in the period of 2011 – 2020 and
especially, the Strategy for social welfare development period 2012 - 2020 has clearly
defined general education development objectives, to 2020 school attendance rate at
the right age at primary school to reach 99%, 70% of children with disabilities go to
schools, ensuring equity in education and lifelong learning opportunities for every
citizen.
Equality in access to basic education is required for the success of the development of
social security. Therefore, in access to basic education, it‟s necessary to give priority
to "vulnerable “groups as the poor, disabled, ethnic minorities who living in
particularly difficult areas.
d) Cultural services, sports and entertainment, and community activities
The fact shows that the system of works in sports, culture, and entertainment play
an important role in organizing the propaganda activities of political tasks, guiding
the grassroots cultural activities for improvement in the local people health. Under
Decision No. 2164/QD-TTg dated 11/11/2013 approving the master plan on
development of the system of cultural and sports institutions in the 2013-2020
period with orientations to 2030, the Prime Minister stipulated that the State budget
would be used to invest in infrastructure, equipment and facilities, staff training,
and maintenance for provincial/district cultural and sport centers, cultural houses,
and children cultural facilities…
Facilities, cultural institutions systems, sports, entertainment
Government‟s support for the provision of recreational and community activities is
primarily through planning the venues, organizing urban space, and developing
infrastructure projects where businesses and citizens can supply and access
services. This system of works - also known as the cultural institutions - is evenly
distributed according to the levels, from the urban to grassroots level, in urban
residential areas. Investments in development and distribution of services are often
mobilized from economic sectors outside the state to reduce the burden on the
budget as well as ensure the quality of services to the people.
Cultural Center: Through evaluation of 42 urban areas and in comparison with
Decree 4250
on urban classification it shows that, the urban areas have invested in
construction sufficient number of cultural centers, however infrastructure and
equipment in cultural centers do not meet the requirements compared with the
existing new requirements and quality of cultural activities to attract people to
participate in activities at the facility are poor and superficial in content.
50
Decree 42 on urban classification prescribed the number of cultural centers in urban areas at least as
follows: “14 centers in special cities ; 10 centers in Grade I cities; 6 center in Grade II cities; 4 cent ers in
Grade III Cities; and 2 centers in Grade IV cities ". The number of sport centers in urban areas stipulated
at minimum level as follow: “10 centers in special cities ; 7 centers in Grade I cities; 5 center in Grade II
cities; 3 centers in Grade III Cities; and 2 centers in Grade IV cities ". The number of public space in
urban are at minimum level as follow: “06 spaces in special cities ; 5 spaces in Grade I cities; 4 spaces in
Grade II cities; 3 spaces in Grade III Cities; and 2 spaces in Grade IV cities”

112
Chart 1 73: Chart on the number of cultural centers (compared with 6 economic areas and
urban classification)
0.0
20.0
40.0
60.0
80.0
100.0
120.0
140.0
TP Hà
Gia
ng
TP Bắc
Gia
ng
TP Thá
i Ngu
yên
TP việ
t Trì
TP Lai
Châ
u
TX S
ông C
ông
TT Sa
Pa
TT Chũ
TP Hà
Nội
TP Bắc
Nin
h
TP Hạ
Long
TP Thá
i Bìn
h
TP Nam
Địn
h
TX T
am Đ
iệp
TX P
húc Y
ên
TT Mỹ
Hào
TP Than
h H
óa
TP Đồn
g Hới
TP Huế
Đà
Nẵn
g
PR-Thá
p Chà
m
Tx cửa
Lò
TT Phú
Pho
ng
TP Ple
iku
TP Đà
Lạt
TX G
ia N
ghĩa
TT Chư
Sê
TT Phước
An
TP HCM
TP Bà
Rịa
TP Vũn
g Tàu
TP Tây
Nin
h
TX Đồn
g X
oài
TX T
huận
An
Cần T
hơ
TP Vị T
hanh
TP Bạc
Liê
u
TP Cà
Mau
TP Rạc
h G
iá
TT Cần
Đướ
c
TT Lấp
Vò
Số lượng trung tâm văn hóa
About sport centers, there are now some urban area has not fully construct sport
centers under the provisions of Decree 42, such as Ha Giang, Vietnam Tri City, Lai
Chau City, Chu Se TT, Lap Vo town. Divided by region, the Midlands and Northern
mountainous areas, the Central Highlands, the Mekong Delta, except the provincial
capital which construct sport center adequately, many other municipalities have not
mobilized resources to construct. Chart 1 74: Chart of Sport centers (comparation of 6 economic zones and urban
classification)
0.0
10.0
20.0
30.0
40.0
50.0
60.0
70.0
80.0
TP Hà G
iang
TP Bắc
Gian
g
TP Thái
Nguyên
TP việt
Trì
TP Lai
Châu
TX Sông C
ông
TT Sa P
a
TT Chũ
TP Hà N
ội
TP Bắc
Nin
h
TP Hạ L
ong
TP Thái
Bình
TP Nam
Địn
h
TX Tam
Điệp
TX Phúc Y
ên
TT Mỹ
Hào
TP Than
h Hóa
TP Đồn
g Hới
TP Huế
Đà Nẵn
g
PR-Tháp
Chàm
Tx cửa L
ò
TT Phú P
hong
TP Plei
ku
TP Đà L
ạt
TX Gia
Nghĩa
TT Chư
Sê
TT Phước
An
TP HCM
TP Bà R
ịa
TP Vũn
g Tàu
TP Tây
Nin
h
TX Đồn
g Xoài
TX Thuậ
n An
Cần T
hơ
TP Vị T
hanh
TP Bạc
Liêu
TP Cà M
au
TP Rạc
h Giá
TT Cần
Đướ
c
TT Lấp
Vò
Số lượng trung tâm TDTT
Urban public spaces
After the “Doi Moi” period, the urban areas see strong development. The urban
look is more spacious and the streets at night are bright and colorful. More park
gardens are built. Boulevards and squares and sometimes urban gateways have
been concerned. In general, the public spaces have now created a new face for the
urban areas, attracting tourists and investment, increasing green space. Besides,
there are a number of drawbacks such as:
- The new plantings are primarily interested in morphological aspects of public
space rather than its performance and efficiency, while the urban leaders are
paying much attention to economic benefits (around public space, property
values will be higher) and less attention to spiritual, cultural, social and
environmental interests.
- The construction of many public spaces are quite expensive but ineffective.
Many squares are equipped with rostrums, but little used and visited because of
a long distance to the administrative center from residential areas. Many parks,

113
including children parks, are not exploited and cared so that they are abandoned
and unsafe.
- Many public spaces such as sidewalks, unoccupied land, parks with the
potential to become a public space like waters, river banks and lakes, beaches,
foothills is shrinking or encroached by the real estate market.
Currently, public spaces has just care to construct in big cities, provincial cities/towns,
the towns and cities to be up-graded, tourism cities/towns; the remaining have not
been invested. Chart 1 75: Chart of number public spaces (in comparation with 6 economic zones and
urban classification)
0.0
5.0
10.0
15.0
20.0
25.0
30.0
TP Hà G
iang
TP Bắc
Gian
g
TP Thái
Nguyên
TP việt Trì
TP Lai
Châu
TX Sông Công
TT Sa Pa
TT Chũ
TP Hà N
ội
TP Bắc
Ninh
TP Hạ L
ong
TP Thái
Bình
TP Nam
Định
TX Tam Đ
iệp
TX Phúc Yên
TT Mỹ H
ào
TP Than
h Hóa
TP Đồn
g Hới
TP Huế
Đà Nẵn
g
PR-Tháp
Chàm
Tx cửa L
ò
TT Phú Phong
TP Pleiku
TP Đà L
ạt
TX Gia
Nghĩa
TT Chư
Sê
TT Phước A
n
TP HCM
TP Bà R
ịa
TP Vũn
g Tàu
TP Tây
Ninh
TX Đồn
g Xoài
TX Thuậ
n An
Cần T
hơ
TP Vị T
hanh
TP Bạc
Liêu
TP Cà M
au
TP Rạc
h Giá
TT Cần
Đướ
c
TT Lấp
Vò
Số lượng không gian công cộng (%)
Recreational and community activities in urban areas are associated with sports
and cultural activities and often account for nearly 2% of GDP from service sectors
annually. The annual growth rate of this group is quite high, nearly 7% (according
to the overall report on service sector development until 2020 with vision to 2025).
Chart 1 76 The growth rate of service groups (%) (including cultural and sport services) Average growth rate annually
1996-
2000
2001-
2005
2006 2007 2008 2009 1996-
2009
Service industry 5.7 6.96 8.29 8.68 7.18 6.63 7.73
Commerce 5.85 7.45 8.55 8.67 6.34 7.67 7.86
Hotels and restaurants 5.63 8.74 12.42 12.72 8.54 2.29 8.96
Transport, postal and tourism 6.45 7.38 10.13 10.42 13.84 8.48 10.78
Financial intermediation 7.48 7.73 8.18 8.82 6.63 8.69 8.08
Science and technology 5.69 8.55 7.38 7.67 6.14 6.4 6.89
Real estate and consulting 4.66 3.91 2.94 4.07 2.49 2.54 3
State Management 2.58 5.49 7.57 8.22 6.38 7.28 7.36
Education and training 5.63 7.46 8.42 8.68 8.04 6.56 7.94
Health and Social services 5.57 7.4 7.84 7.99 7.67 6.74 7.73
Sports and culture 7.8 6.2 7.68 7.98 7.83 7.21 7.38
Activities of organizations 12.49 5.94 7.42 8.05 6.92 6.72 7.28
Community, social and personal
activities
8.02 5.95 7.25 7.91 6.31 5.9 6.84
Households and home help 5.84 3.39 7.45 8.49 7.94 6.33 7.45
(Source: Vietnam socioeconomic Statistics in the 1975-2000 period / Vietnam: 20 years of reform and
development (1986-2005) / 2007Statistical Yearbook /2008 Annual Report, QI / 2009 report and mid-2009
report)
In practice, however, the system of cultural and sport institutions still has a number
of limitations. Namely, preparing venue as well as land for construction of the
cultural and sport facilities faces various challenges. Despite being invested,
several facilities cannot be put into operation because of equipment shortage and
degradation. Staff management and operation remains weak and improper.
Professional training has not been concerned. Management mechanisms are heavily
prone to administrative orientation and coordination has not been clearly

114
demarcated. Operation of the facility has not yet to closely consider the needs of
the people.
To overcome this issue, the Government has actively called for socialization and
accepted the involvement of the private sector and non-governmental organizations
in providing health, education and sports services with the aim of enhancing the
quality of services and reducing the burden on the State budget. The forms of
cooperation between the State and the private sector to provide public services
such as public-private partnership have been tested with the support of
international organizations. It is necessary for a comprehensive reform of the
management and organization of the operation of cultural, entertainment and sports
service providers for the purpose of attracting more investment and creating
favorable conditions for the local people to get better access to the cultural,
entertainment and sports services.
New manifestations of urban public spaces in Vietnam:
In the context of globalization, our country's urban space has started to feel the
strong impact of the ongoing revolution of science and technology worldwide,
especially information technology, construction technology, and modern transport
engineering. Development of information technology makes people less and less
get out of the houses. In social relationships, the indirect relations through the
media (secondary relations) gradually replace the direct relationship. This has a
direct impact on the activities and role of the CBD centers, including secondary
commercial areas. TV has reduced the amount of people to the stadia, gymnasiums,
cinemas. E-commerce has reduced the number of people to stores and
supermarkets. The number of people working at home has increased. The future
will see the seminars via videoconference and electronic portal that will reduce the
role of the exhibition and conference centers. However, the difference between
downtown and suburban areas will fade away.
d) Information accessibility51
The right of access to information or the right to information is a fundamental
human right, and now it is becoming a global concern. The right of access to
information is also mentioned in the "Universal Declaration of Human Rights" in
1948 and "International Covenant on Civil and Political Rights" in 1966. Up to
now the world has more than 80 nations issued legislation to ensure the right to
access public information. In general, the law on access to information of the
nations of the world is all in order to ensure the right of access to information of
the people, thereby promoting the purity and transparency of public information in
the public agencies.
Policies of the State
In Vietnam, the right of access to information or the right to be informed stipulated by
the Constitution in 2013 that: "The citizens have the rights to freedom of speech,
freedom of the press, access to information, meeting, association ... The
implementation of these rights prescribed by law "(Article 25). To specify provisions
of the Constitution, many laws have been enacted with the provisions on the right to
information such as the Press Law; Ordinance on the Protection of State Secrets, the
51
Ph.DNguyen Hien Phuong; Vice Dean of Law on Labor –Social Security, Hanoi Law University

115
Law on Promulgation of legal documents of the People's Council, People's Committee
in 2004, the Law on Anti-corruption etc. .. Through the issuance of the documents
with the provisions on the right to information of the people, the state was always
interested in the right to information of the people to implement the policy of "people
know, people discuss, people do and people check".
Orientation ensuring the access to information in Vietnam is determined in the fact
that all citizens are equal in access to information, the information must be provided in
the timely, accurate, complete, open and transparent manners. The State will create
conditions for people with disabilities, people living in the mountains areas, islands,
and areas with particularly difficult socio-economic conditions to exercise of the right
of access to information. Although the law does not stop perfecting regulations to
guarantee the right of access to information and has got certain successes in different
fields with public accountability and transparency of state agencies, but it still exist
many inadequacies. Such as the right of access to information is defined in many
different documents with multiple exercising guidelines causing difficulties in the
application of laws and regulations also do not cover all the areas required to provide
information in social life, lack of important regulations on the obligation to publicize
information and procedures required to provide information, complaints and
denunciations and sanctions for violations, ... From the perspective of security social,
the rights of access to information is ensured by taking into account the difficulties of
these vulnerable groups, especially people with disabilities. The launch of the
Disability Act 2010 is an important legal basis for ensuring the right of access to
information of persons with disabilities. On 05/8/2012 Prime Minister issued Decision
No. 1019 / QD-TTg approving the Disability assistance project in the period of 2012-
2020, with the goal that 30% of persons with disabilities get assistance in access and
use information technology and communications has also created a basis for the
disabled took a step forward in the implementation of access to information laws have
for them.
The completion of the law to ensure access to information in Vietnam is a prerequisite
to ensure the implementation of human rights and especially the rights of citizens in
the age of international integration and globalization. Therefore the current
requirements are quickly supplementing the existing legal provisions ensuring the
right of access to information; proceed to promulgate the Law on access to
information in Vietnam.
Providing access to telecommunications infrastructure
Assessment of Internet subscribers: According to the summary of the Ministry of
Information and Communications, the total number of telephone subscribers in
Vietnam reached more than 143 million subscribers, including internet subscribers,
mobile and telephone subscribers. Notably, telecom network and internet
infrastructure in Vietnam continued to be invested for strong growth, especially in the
3G mobile network. Specifically, there is a clear shift from 2G to 3G services with 2G
subscribers significantly reduced and the number of 3G subscribers continued to
increase (the first 6months was estimated to increase by 7.3 million subscribers). in
urban areas now highly Internet subscribers are highly developed.
The survey in 42 cities showed that in urban areas, in particular, Hanoi has internet
subscribers reached 16 subscribers/100 inhabitants which is higher than in Ho Chi

116
Minh City by 4 subscribers 100 inhabitants. The cities type I had the highest number
of Internet subscribers is Vung Tau city with 15.3 subscribers/100 inhabitants and
lowest city of Hue with 9 subscribers/100 inhabitants. The city type II with highest
internet subscribers cities is Ba Ria City which reached 32.32 subscribers / 100
inhabitants and the city of Bac Giang has the lowest rate of 7.66 subscribers / 100
inhabitants. The city type III has the highest number of Internet subscribers is Dong
Xoai Town with the rate of 51.24 subscribers/100 inhabitants and the city of Vi
Thanh has the lowest lowest rate of 2.9 subscribers / 100 inhabitants. City type IV has
the highest number of Internet subscribers is Chu Se town which reached 21.5
subscribers / 100 inhabitants and the lowest rate belongs to Sapa town which reached
6.02 subscribers / 100 inhabitants. Chart 1 77: Chart on the number of Internet subscribers
0.0
5.0
10.0
15.0
20.0
25.0
30.0
35.0
TP H
à G
iang
TP Bắc
Gia
ng
TP Thá
i Ngu
yên
TP việt
Trì
TP Lai
Châ
u
TX S
ông
Côn
g
TT Sa Pa
TT Chũ
TP H
à Nội
TP Bắc
Nin
h
TP Hạ Lon
g
TP Thá
i Bìn
h
TP N
am Địn
h
TX T
am Đ
iệp
TX P
húc Y
ên
TT Mỹ
Hào
TP Tha
nh H
óa
TP Đồn
g Hới
TP H
uế
Đà Nẵn
g
PR-T
háp
Chà
m
Tx cử
a Lò
TT Phú
Pho
ng
TP Ple
iku
TP Đ
à Lạ
t
TX G
ia N
ghĩa
TT Chư
Sê
TT Phước
An
TP H
CM
TP Bà Rịa
TP Vũn
g Tàu
TP Tây
Nin
h
TX Đồn
g X
oài
TX T
huận
An
Cần
Thơ
TP Vị T
hanh
TP Bạc
Liê
u
TP Cà M
au
TP Rạc
h G
iá
TT Cần
Đướ
c
TT Lấp
Vò
Số thuê bao Internet
Assessment of fixed telephone subscribers: in 2015, according to data compiled by the
Ministry of Information and Communications, the total number of telephone
subscribers reached 6.15 million telephones. The urban areas using telephone
subscribers have the trend ofdecrease and increase of mobile subscribers, intenert
subscriber. The survey 41 metropolitan cities showed that the special cities using
landline as Hanoi reached 17.0 subscribers / 100 inhabitants, which is higher than in
Ho Chi Minh City reached 15.0 subscribers / 100 inhabitants. The city Type I with the
highest telephone subscribers is Hue City which reached 110 Hue subscribers/100
inhabitants and the city having the lowest fixed-line telephone subscribers is Halong
City with 43.4 subscribers / 100 inhabitants. The city class II having the highest fixed-
line subscribers is Thai Binh City which reached 114 subscribers/100 inhabitants and
the lowest city is Phan Rang Thap Cham city which reached 31.29 subscribers/100
inhabitants. The City grade III having the highest fixed telephone subscribers is Dong
Xoai town with 142.71 subscribers / 100 inhabitants and the lowest one is Song Cong
town which reached 15.89 subscribers / 100 inhabitants. The city Grade IV having the
highest rate is Chu Se town which reached 80.2 subscribers / 100 inhabitants and the
one with the lowest rate is Thuan An town which reached 20.2 subscribers / 100
inhabitants.

117
Chart 1 78: Chart on the number of telephune subcribers
e) Access to clean water and sanitation
The right to water supply has important implications at the national and international
level. In July 2010, the UN General Assembly passed a resolution declaring clean and
safe water and sanitation is a basic right for people to enjoy life and all other human
rights.
State policies
In Vietnam, clean water is also a leading concern of our State. Currently, the issue of
clean water is specified in Decree No. 117/2000 / ND-CP on the production, supply
and consumption of clean water, focused on the poor and especially difficult areas
which are specified with policies on drinking water price, the water supply program,
with support from various sources. The quite specific and comprehensive regulation
on the rights of water users, as a basis for ensuring the right to safe water supply of the
people, at the same time, they also made it facilitate for them to proactively protect
their rights and learn water quality and to be compensated for damage caused by abuse
of process water supply. Law has created for users to actively enjoy the right
mentality to provide clean water fully. Together with the provisions on the right to
ensure the provision of clean water, the Decree also specifies water supply planning,
water supply development investment with the tasks of the agencies and units to
ensure water supply clean water sources to be with people.
Access to clean water and sanitation 52
Chart 1 79: Table on Access to clean water and environmental sanitation of urban and rural
residents’.53
.
52
Source: UNHABITAT 53
Source: UNHABITAT

118
Ensuring accessibility to clean water 54
: In urban areas, the percentage of people
accessing to "clean water" was 99% in 2015, but only 61% of urban dwellers were
connected to the water network, the remaining 38% accessed water through pipes and
common water wells. A study done in 2003 showed that the poor spend more income
in clean water than the rich do (2.8% compared to 1.3%). Poor households without
conditions for plumbing installation must buy water from the surrounding areas; the
private facilities sold water at a price as several times higher compared to the official
facilities. Therefore, the efforts of the government to control water price were not
effective, because the poor must buy water from informal areas.
Accessibility to clean water, the quantity and quality of water resources supplied in
each city was different, and tended to decrease as the size of the city. In 2009, 70% of
people in special urban areas and urban areas grade I accessed to clean water, this
figure in urban areas grade II, III were 45-55%, in the urban areas grade IV were 30-
35%, and grade V and towns were 10-15% (WHO, 2012: 6). In fact, a lot of small
towns in suburban areas have not had tap water. In these areas, a private facility,
which is not completely official, will be responsible for the installation of water
supply systems in small scale. In addition, the water after being processed from
factories to be supplied for urban areas must meet the standard of clean drinking
water, but currently, the water supplied for households do not meet this criteria.
Chart 1 80: Water use structure in the period (1990-2015)
Ensuring accessibility to basic sanitation services 55
: In 2015, 94% of urban dwellers
accessed to sanitation facilities ensured, while 5% of them used common sanitary
facilities (may be considered as not ensured) and the remaining 1% of them used
sanitary facilities not ensured in another form (Table 24). This figure was significantly
improved compared to 1990, during that period only 65% of urban dwellers accessed
to sanitation services ensured, 11% of them used sanitation facilities not ensured, and
54
Source: UNHABITAT 55
Source: UNHABITAT

119
24% of them still used open-cast toilets (JMP, 2015: 74). According to government
regulations, all households must have a wastewater treatment system. Approximately
90% of households in major urban areas meet the criteria; their toilet is connected to
septic tanks. However, many septic tanks are operating not guarantee requirements,
and some tanks are not connected to the sewer system. The result is that toilet and
septic tank systems in urban areas are contaminating the underground water sources
and the water supply systems; some cases of untreated waste water, or only partially
treated be taken directly drainage system.
Chart 1 81: Use structure of sanitation facilities of urban residents in the period 1990-2015
Weaknesses in the construction and management of septic tanks in most households
are creating problems in wastewater treatment. A septic tank needs to be cleaned
periodically, but due to some reasons, the households do not do that, they only carried
out upon overflowing. Therefore, many septic tanks fall into overload, unable to
operate or operate ineffectively. The ineffective wastewater treatment can lead to a
number of solid wastes being discharged into the sewer system, which is not
guaranteed in term of quality.
The ineffective implementation leads to problems in the construction and
maintenance. Typically, the septic tanks usually have the area of about 3-4 m2, and
built in home. Households not always build a sanitation meeting the standards,
although they can submit a standard design for construction license. A few new
houses do not even have septic tanks; the toilets are directly connected to the drainage
system, clog or overflow the pipes. In some highland small towns, a lot of tanks with
holes below in order waste water flow directly into the groundwater system.
g) Accessibility to transport
Aware of the role and importance of urban transport network, in recent years, most of
the provinces focused on investment resources to build the main urban traffic routes
meeting national standards, combined with synchronizing with the water supply
system, supply of living electricity, lighting, sidewalks and greenery. However, due to
limited resources, the provinces prioritized to invest in upgrading and expanding the
transportation system for the provincial towns or urban areas with a policy of urban
grade improvement.
Traffic congestion in 2 growing cities especially mainly occurs in the urban districts
and urban gateway, although the cities have attempted to build auxiliary structures
supporting transport system, such as overpasses, traffic turn-over buttons, storey-roads
and underground tunnels... Because high density of residents, the high-rise apartment
buildings, head offices of central agencies and international organizations, universities
and colleges, the central hospitals, the wholesale trade centers focus in the districts
within the city..., the congestion occurs only during working hours, and there are

120
almost no traffic jams in holidays. According to statistics, the total area of roads
within the city across the country reached about 16% of total building area, compared
with the standard rate of 20-25%. In border areas and urban outskirts, this ratio is even
lower.
Public traffic: In Hanoi, bus system upgraded through the project of "Development of
public buses in Hanoi in 2010 - oriented by 2020" has improved service quality,
further opening some new bus routes, increasing the number of buses, establishing bus
transit points. In Ho Chi Minh City, bus system subsidized by cities was improved;
however, the moving speed was still slower than motor traffic due to too large traffic
flow. In the coming time, the two cities continue to improve the traffic congestion
problem by the projects of rapid public transport system.
h) Accessibility to domestic energy.
Electricity:
From 1990 to present, the proportion of people supplied with electricity rise from 54%
to 98%. In more than two decades, there have been 10 million households (equivalent
to 40 million people) accessing to electricity, mainly through rural electrification
programs in national poverty reduction program. This is a result hard to achieve for
many countries in the world, in a short time and with difficult terrain such as
Vietnam56
. Power access has also paralleled with efficient improvement of service
operation and quality, "The main problem today is how to meet future needs, while
complying with Government's commitments on reducing greenhouse gas emissions in
the context of climate change"57
.
In subsequent years, urbanization speed in Vietnam continues to rise rapidly with the
demand of amenities of urban People, this lead to boom in electricity consumption in
cities. The cities account for about 48% -50% of total national electricity
consumption58
. Thus, the requirement to use electricity economically and efficiently is
being set forth in the cities especially.
Gas 59
: In Hanoi and Ho Chi Minh City, gas was mainly used for cooking (accounting
for 84% of households). The rate of the lowest gas use fell on the poorest group
(68.3%); the use increased with income level and reached 89.9% for the richest group.
Only 1.2% of households used electricity for cooking (group of Haughton, 2010: 78).
The use of solid fuels for cooking, who reached 78.9 in rural areas, this figure was
much lower in urban areas (26.4%). The use of solid fuels was not really popular in
the Southeast areas (29.3%), and much less popular in the affluent households (8.1%)
(UNICEF, 2007: 70-71).
Vietnam needs a diversified power structure because Vietnam has higher ratio of
renewable energy in the total structure of electricity generation, with hydropower
accounting for 42% of total electricity generation, than many countries in the world.
In addition, Vietnam can further develop the potential of wind and solar. In 2012, the
56
Nguồn: phát Chart của Phó Thủ tướng Chính phủ Hoàng Trung Hải tại Hội nghị “Định hướng phát triển bền
vững cho ngành Điện Việt Nam” ngày 4/11/2015, 57
Source: Statement by Mr. Axel van Trotsenburg, Vice President of the World Bank, in charge of East Asia
and Pacific Ocean at the conference "Sustainable development orientations for Vietnam Electricity Sector"
dated 04/11/2015, 58
Nguồn: Nguyễn Sơn Hải, nguyên phó viện trưởng Viện quy hoạch đô thị nông thôn, BXD 59
Source: UNHABITAT

121
government adopted the national target program on energy saving and efficiency in
the period 2012-2015 to mitigate climate change. With the objective of (a), saving 5-
8% of total energy consumption in the country in the period 2012-2015, on par with
the forecast for energy demand in national energy development planning (2011 -
2020), and (b), increasing awareness of the importance of efficiency and energy
saving, along with environmental protection. Energy saving can be achieved through
the replacement of old equipment, construction of more efficient transport
infrastructure.
i) To assess the satisfaction of the people with basic social services in urban areas
The overall state administration reform in 2011-2020 was approved by Prime Minister
in Decision No. 30c / NQ-CP dated 08/11/2011, stated: "Step by step improve the
quality of public service career, ensuring personal satisfaction for services provided by
the public service units provided in the areas of education, health care reached at over
60% in 2015. The personal satisfaction for services provided by the unit public service
providers in the fields of education, health care reached over 80% in 2020; the
satisfaction of citizens and businesses for the services of the state administrative
bodies reached 80% by 2020 ".
In fact, this expectation can hardly be realized. In 2014 and 2015, the WB pilot survey
in four provinces of BinhDinh, ThanhHoa, PhuTho, VinhPhuc on the assessment ò
people's satisfaction with basic social services in urban areas. In the field of health
services, the overloads due to overwhelming demand that the system of health care
facilities have not met (in VinhPhuc 32.2% of patients have to share beds, the rate in
ThanhHoa is 13, 6%, in BinhDinh is 29.3%).
According to the investigation report of public service in five major cities of the
Institute for State organizational sciences - the Ministry of Home Affairs in 2014 on
the satisfaction of the people for garbage collection services, water supply clean,
public buses, it shows that, the level of satisfaction of the people of Can Tho is
highest, and in Hanoi and HCMC is lowest.
Chart 1 82: Table on the opinions of people towards 3 public services in 5 cities under the
Central Government (% City Satisfied with waste
collection service
Clean water meets
family’s
requirements
Satisfied with bus
service
Hanoi 74% 22.6% 44.2%
Ho Chi Minh 55% 54.2% 52.4%
HaiPhong 69% 62.5% 35.5%
Da Nang 76% 72.4% 61.1%
Can Tho 83% 70.1% 72.9%
Source: Investigation report of public service in five major cities of the Institute for State organizational
sciences - the Ministry of Home Affairs 2014

122
2.6.5. The problem exists
An overall assessment of the development of the urban social services system in
Vietnam60
, as follows:
a) In terms of policies
Policies that ensure uniform and coordinated development and investment in the
system of social services in urban areas have not yet to be fully adhered to because of
the lack of tools to link the business investment, development and exploitation of the
service sector in urban society to ensure investment efficiency as well as improve the
quality of services.
There are not many effective policies to encourage development, socialization of
investment resources effectively and feasibly, resulting in the failure to reduce the
burden on the budget and improve the competitiveness of domestic service providers.
The roles of state agencies fail to be clearly demarcated in supporting and monitoring
the investors because of not directly working in delivery of services.
There is lack of a transparent legal framework closely to control the quality of
services, ensure the rights of the people using the services. Specific characteristics of
the various types of services are associated with the roles of the state agencies as well
as the monopoly of public establishments. Legal tools for monitoring of violations in
the provision of services are very much limited. This situation is one of the major
shortcomings degrading the quality of service as well as hindering the improvement of
the competitiveness of domestic enterprises.
Urban development program to develop urban social services has not yet been
implemented in many localities: Formulation of development programs at the
localities is not really effective, not associated with the plan of mobilization and
arrangement of investment capital for social service projects. Thus, providing services
to residents in new and existing urban areas is not asynchronous and not to meet all
the demand.
Spatial planning as well as allocation of land to ensure the technical and social
infrastructure always faces difficulties in large urban areas. Especially in the central
areas, the spontaneous development process as well as the loose management has led
to the fact that land fund for social service facilities is inadequate and cannot be
expanded.
Urban land prices are soaring, resulting in an increase in investment costs. Thus,
investment efficiency is lower or the cost of services is beyond the affordability of the
local people. The projects of investment in social service facilities require large capital
and long extraction, and are prone to incurring risks if the policies have changed. So
when there is no support from the State in accessing the very expensive land fund in
the urban areas, the businesses will be difficult to offer competitively priced services.
There is still inequality between public and private enterprises in the access to land.
This situation is also a major barrier to slow the process of socialization in providing
of social services.
60
Urban Agency- Evaluation and Development Orientation of the urban social service system to 2020

123
b) The affordability of the people
The level of living is low those impacts on the ability to pay for higher quality
services: Per capita GDP of Vietnam is still among the lowest groups in the ASEAN
region. People's living standards are relatively low and the ability to pay for high-
quality services is limited. Especially due to consumer habits over the years, many
types of services must be supplied freely or subsidized by the State. The right prices
for these services are hard to be accepted. The awareness of the local people must be
raised over time.
The models of delivery of services to urban areas are not diverse, failing to meet the
different needs of population groups. With the current state of the economy as well as
the indiscriminate distribution of social welfare for a long time, the system of social
services is not developed diversely to meet different demands. The socialization level
is not high and integration process is slow. The applications of new technologies and
techniques as well as advanced models of social service delivery have not been widely
developed.

124
2.7. Labor, Employment and Income
2.7.1. Overview of labor, employment and income in urban areas
According to the GSO, the national average labor force in 2014 was 53.748 million, of
which urban areas are 16.525 million, accounting for nearly 30.7%. Hanoi and HCM
City accounted for 7.1% of 7.8% respectively.
The city is the place attracting many workers, in 41 cities selected to survey, the
employees account for more than 80% of the population at working age. Percentage of
employees has no significant difference between regions, remarkably the cities in the
Central Highlands with high rate of over 95%, followed by the Red River Delta and
the Northern Key Economic Zone (over 90%) and the Mekong River Delta (89%).
The next is the urban centers of the North Central Region (85%), Southeast Region
(75%) and finally the Northern midland and mountain area (less 70%). We can most
clearly see the large cities, the cities under Central with labor rate that is not high
because this place attracts many students to study.
Chart 1 83: Chart about employed workers rate in 41 cities surveyed (%)
0.0
20.0
40.0
60.0
80.0
100.0
120.0
TP Hà Giang
TP Bắc
Giang
TP Thá
i Ngu
yên
TP việt T
rì
TP Lai
Châ
u
TX S
ông
Côn
g
TT Sa Pa
TT Chũ
TP Hà Nội
TP Bắc
Nin
h
TP Hạ Lon
g
TP Thá
i Bìn
h
TP Nam
Địn
h
TX T
am Đ
iệp
TX P
húc Yên
TT Mỹ
Hào
TP Tha
nh H
óa
TP Đồn
g Hới
TP Huế
Đà Nẵn
g
PR-T
háp
Chà
m
Tx cử
a Lò
TT Phú
Pho
ng
TP Ple
iku
TP Đà Lạ
t
TX G
ia N
ghĩa
TT Chư
Sê
TT Phước
An
TP HCM
TP Bà Rịa
TP Vũn
g Tàu
TP Tây
Nin
h
TX Đồn
g Xoà
i
TX T
huận
An
Cần
Thơ
TP Vị T
hanh
TP Bạc
Liêu
TP Cà M
au
TP Rạc
h Giá
TT Cần
Đướ
c
TT Lấp
Vò
Tỷ lệ lao động có việc làm(%)
Non-agricultural labor reflects the level of urbanization of the cities; this is also the
indexes for urban classification under Decree No. 42. If you choose the minimum
limitation of non-agricultural labour of the fourth grade city of over 70%, there are 5
in totals of 41 cities do not reach this threshold. Among those, the lowest is Chu Se
Town with 34%, Dong Xoai Town with 23%. Most of the remaining urban areas with
the rate of non-agricultural labor are greater than 80%. Particularly, there are 7 urban
areas reaching this rate of over 90% (not including the cities under the Central) -
getting the standard of special grade. The urban areas of Central Highlands have fewer
non-agricultural labor because it has a very rich source of agricultural products,
agricultural labor, but in urban areas. The remaining regions, this rate is relatively
equal.
Chart 1 84: Chart of non-agricultural labor in 41 cities surveyed (%
0.00
20.00
40.00
60.00
80.00
100.00
120.00
TP Hà
Gia
ng
TP Bắc
Gia
ng
TP Thá
i Ngu
yên
TP việ
t Trì
TP Lai
Châ
u
TX S
ông
Côn
g
TT Sa
Pa
TT Chũ
TP Hà
Nội
TP Bắc
Nin
h
TP Hạ Lon
g
TP Thá
i Bìn
h
TP Nam
Địn
h
TX T
am Đ
iệp
TX P
húc Y
ên
TT Mỹ
Hào
TP Tha
nh H
óa
TP Đồn
g Hới
TP Huế
Đà Nẵn
g
PR-T
háp
Chà
m
Tx cử
a Lò
TT Phú
Pho
ng
TP Ple
iku
TP Đà Lạ
t
TX G
ia N
ghĩa
TT Chư
Sê
TT Phước
An
TP HCM
TP Bà
Rịa
TP Vũn
g Tàu
TP Tây
Nin
h
TX Đồn
g X
oài
TX T
huận
An
Cần
Thơ
TP Vị T
hanh
TP Bạc
Liê
u
TP Cà
Mau
TP Rạc
h G
iá
TT Cần
Đướ
c
TT Lấp
Vò
Tỷ lệ lao động phi nông nghiệp (%)

125
2.7.2. Unemployment rate
The unemployment rate of employees at working age in 2014 is 2.10% (in 2013:
2.18%), of which urban area is 3.40% (in 2013: 3.59%); rural area is 1.49% (in 2013:
1.54%). According to the General Statistics Office, the thriving economy with the
vigorous development of the industrial sector and the service is one of the main
reasons that reduce the unemployment rate in urban areas. The unemployment rate of
employees at working age gradually decreased by quarters in 2015 (Q1 is 2.43%; Q2
is 2.42%; Q3 is 2.35%; Q4 is 2.12%) and decreased mainly in urban areas (Q1 is
3.43%; Q2 is 3.53%; Q3 is 3.38%, Q4 is 2.91%. Estimated in 2015, about 56% of
employees have unofficial jobs outside the households of agriculture, forestry and
fishery with unofficial jobs (59.3% in 2013; 56.6% in 2014), of which the urban area
is 47.1% (in 2013: 49.8%; in 2014: 46.7%) and 64.3% in rural areas (in 2013: 67.9%;
in 2014: 66.0%
The unemployment rate in the 41 cities surveyed also has different movements, only
0.2% of unemployment rate in this city, but in other city, unemployment rate is up to
25% such as Thai Nguyen City. Considering the unemployment rate under 6 social-
economic regions, we can see that the cities in Central Highlands have unemployment
rate of at least about 2.51%, compared with 3.4% of the country, followed by Mekong
Delta (4.12%), Northern midland and mountain area (4.17%). The cities in North
Central, Central Coast and the Southeast region have the unemployment rate of
4.77%, and 4.89% respectively. The surveyed cities of the Red River Delta with
highest unemployment rate of up to 5.35%, nearly 1.6 times higher than the country's
average rate.
Chart 1 85: Chart of unemployment rate in 41 urban areas surveyed (%)
0.0
5.0
10.0
15.0
20.0
25.0
30.0
TP Hà Giang
TP Bắc
Giang
TP Thá
i Ngu
yên
TP việt T
rì
TP Lai C
hâu
TX S
ông Côn
g
TT S
a Pa
TT C
hũ
TP Hà Nội
TP Bắc
Ninh
TP Hạ Lon
g
TP Thá
i Bình
TP Nam
Địn
h
TX Tam
Điệp
TX P
húc Yên
TT M
ỹ Hào
TP Tha
nh H
óa
TP Đồn
g Hới
TP Huế
Đà Nẵn
g
PR-T
háp Chà
m
Tx cử
a Lò
TT P
hú P
hong
TP Pl
eiku
TP Đà Lạt
TX G
ia N
ghĩa
TT C
hư S
ê
TT P
hước
An
TP HCM
TP Bà Rịa
TP Vũn
g Tàu
TP Tây
Ninh
TX Đồn
g Xoà
i
TX T
huận
An
Cần
Thơ
TP Vị T
hanh
TP Bạc
Liêu
TP Cà M
au
TP Rạc
h Giá
TT Cần
Đướ
c
TT Lấp
Vò
Tỷ lệ thất nghiệp (%)
In key economic areas with large-scale investment, higher growth, but the
unemployment rate, especially employees at the age of 15-24 is higher than the
national average rate and much higher than the least-developed economic regions. The
cause of high unemployment rate in these urban areas is due to the labor market's deep
development; it requires high quality of labor, while many training fields are not
consistent with requirements of the market. And, the untrained employees occupy a
large proportion so it is increasingly difficult to search job opportunities.
Group of young people accounts for the high unemployment rate
According to the GSO, in 2014 the youth labor force aged 15-24 accounted for 14.1%
of the total labor force (7.6 million), of which 422.8 thousand in Hanoi and 435.1
thousands of people in Ho Chi Minh City. In 2014, there were more than 1 million
unemployed, of which urban area is 516 thousand people, rural area 487 thousand. On

126
a national scale the number of unemployed men is higher than women and this is true
for urban areas, but in rural areas the opposite. The number of unemployed people
concentrated in the younger age groups, especially youth groups from 15-24 years of
age accounted for 47.3% of the unemployed in the country. Chart 1 86: Table of number and age structure of the unemployed in 2014
61.
Source: GSO
2.7.3. Urban poverty reduction
Poverty rate
From January 1, 2011 the new poverty standard is the per capita income of less
400,000 VND/person/month in rural area and 500,000 VND/person/month in urban
area. However, each locality has its own poverty standard according to local
characteristics, such as Hanoi, these indexes are 550,000 VND/person/month and
750,000 VND/person/month in rural area and urban area. Or Ho Chi Minh City took
the 1 million VND/person/month for both rural area and urban area. New poverty
standard has made a 2-fold increase compared to the poverty standard of period of
2006 and 2010 (only from 200,000 VND/person/month in urban area). According to
the old poverty standard, in 2009, our country had 13% of poor households, in 2010;
the poverty rate was 14.2% for the whole country. The following year, this ratio
declines steadily despite the increasing poverty line.
Chart 1 87: Poverty rate by urban and rural areas and by region (%)
1998 2002 2004 2006 2008 2010 2011 2012 2013
Primitive.
2014
General 37.4 28.9 18.1 15.5 13.4 14.2 12.6 11.1 9.8 8.4
Urban 9.0 6.6 8.6 7.7 6.7 6.9 5.1 4.3 3.7 3.0
Rural 44.9 35.6 21.2 18.0 16.1 17.4 15.9 14.1 12.7 10.8
Red Delta River Region 30.7 21.5 12.7 10.0 8.6 8.3 7.1 6.0 4.9 4.0
Middle and Northern Region 64.5 47.9 29.4 27.5 25.1 29.4 26.7 23.8 21.9 18.4
61 Source: Employment Survey Report 2014 General Statistics Office of Vietnam ,Ministry of Planning and Investment

127
1998 2002 2004 2006 2008 2010 2011 2012 2013
Primitive.
2014
Northern and Middle coastal
Region 42.5 35.7 25.3 22.2 19.2 20.4 18.5 16.1 14.0 11.8
High Land Region 52.4 51.8 29.2 24.0 21.0 22.2 20.3 17.8 16.2 13.8
South 7.6 8.2 4.6 3.1 2.5 2.3 1.7 1.3 1.1 1.0
Mekong Delta River Region 36.9 23.4 15.3 13.0 11.4 12.6 11.6 10.1 9.2 7.9
Source: GSO 62
It is one of the achievements of the National Target Programme (NTP) for Sustainable
Poverty Reduction has been stated in Result assessment report for the implementation
of the National Target Program for 2011-2015 period and the orientation for the
development of the National Target Program for 2016-2020 periods.
In term of distribution by regions, notably, the urban centers in mountainous region
and the Central Highlands are less poor households, such as in Northern midland and
mountain area and Central Highlands, the average poverty rate is at low level: Ha
Giang City 1.5% , Lai Chau City 1.3%, Chu Se Town 1.5%. It is understandable
partly that Poverty Alleviation Program focused on these areas by the government. In
contrast, there are more poor households in coastal and delta provinces such as Thanh
Hoa City, Cua Lo Town or Vung Tau City… are all the large urban centers or
regional-level economic, employment centers, with the poverty rate in the order of
3.2%, 8.1% and 5.3% respectively. Particularly, in the Mekong Delta region, the
poverty rate in 6 cities surveyed is at 2.5 to 2.9%, especially, Lap Vo Town, the
poverty rate accounts for 8.4%.
Chart 1 88: Chart about poverty rate in 41 cities surveyed (%)
0.0
1.0
2.0
3.0
4.0
5.0
6.0
7.0
8.0
9.0
TP Hà
Gia
ng
TP Bắc
Gia
ng
TP Thá
i Ngu
yên
TP việ
t Trì
TP Lai
Châu
TX S
ông
Công
TT Sa
Pa
TT Chũ
TP Hà
Nội
TP Bắc
Nin
h
TP Hạ
Long
TP Thái
Bìn
h
TP Nam
Địn
h
TX T
am Đ
iệp
TX P
húc Y
ên
TT Mỹ
Hào
TP Tha
nh H
óa
TP Đồn
g Hới
TP Huế
Đà
Nẵn
g
PR-Thá
p Chà
m
Tx cử
a Lò
TT Phú
Pho
ng
TP Ple
iku
TP Đà
Lạt
TX G
ia N
ghĩa
TT Chư
Sê
TT Phước
An
TP HCM
TP Bà
Rịa
TP Vũn
g Tàu
TP Tây
Nin
h
TX Đồn
g X
oài
TX T
huận
An
Cần
Thơ
TP Vị T
hanh
TP Bạc
Liê
u
TP Cà
Mau
TP Rạc
h G
iá
TT Cần
Đướ
c
TT Lấp
Vò
Tỷ lệ hộ nghèo(%)
The problems of urban poverty
Over the years, the living of the majority of the urban poor has improved. Better
infrastructure, more spacious homes, property fuller, children's education are more
concerned. Many households escape from poverty through livelihood conversion
efficiency and investment in their children's education.
Note (*) Percentage of poor households to be included under income per person a month in household: (1) In 2002 returned under the prior
standard: 1998: 149 thousand Dong; 2002: 160 thousand Dong; (2) 2004, 2006, 2008 The poverty rate was calculated under the
government's poverty line for 2006-2010 with adjustments according to the following non-skid price as follows: 2004: 170 thousand VND
for rural areas. 220 thousand VND for urban areas; 2006: 200 thousand VND for rural areas. 260 thousand VND for urban areas; 2008:
290 thousand VND for rural areas. 220 thousand VND for urban areas; (3) The poverty rate in 2010 and 2011 was calculated according to
the Government's poverty line in 2011-2015 as follows: 2010: 400 thousand VND for rural areas and 500 thousand VND for urban areas;
2011: 480 thousand VND for rural areas and 600 thousand VND for urban areas; 2012: 530 thousand VND for rural areas and 660
thousand VND for urban areas; 2013: 570 thousand VND for rural areas and 710 thousand VND for urban areas; 2014: 605 thousand
VND for rural areas and 750 thousand VND for urban areas.

128
Urban poverty rate in large cities of Vietnam were low considering the criteria merely
income or spending, even as poverty increases. However, when viewed from the
perspective of multi-dimensional poverty, urban poverty worse. Lack of education and
skills, lack of ability to change their livelihoods, lack of social capital, limited access
to public services, poor habitat and lack of safety facilities are limited, basic
disadvantage of the local poor. Immigrants into urban poor are also more specific
disadvantage of high cost of living in urban areas, difficulties in accessing public
services and social security system officially.
The poor in urban areas shall have many disadvantages in the face of multiple shocks.
The majority of the urban poor access to social security systems, because they often
work in small private enterprises and the informal sector. The insurance policy
support and cash assistance programs needs to be improved on the identification of
beneficiaries and level of support.
The cost of higher education is a major burden for the urban poor. There are
imbalances in quality of human resources (especially on technical skills) to the needs
of the labor market. Young people, who have completed the high school graduation,
are missing career information. The program supports short-term vocational training
for the urban poor are not effective. Workers employed in labor-intensive industries
less equipped skills can switch (when applying for jobs in other businesses). Many
young people have graduated from colleges; universities are difficult to search jobs
consistent with major.
More and more people interested in the aspect of inequality. Socialization policy has
helped mobilize the participation of the whole society to poverty reduction, education
and health. However, socialization is often understood inclined to contribute funds for
services, resulting in increased financial burden for the poor and contribute to
increased inequality in accessing to service.
New challenges. There has been no tool to measure, monitor and evaluate regularly to
properly identify the status of multidimensional poverty in urban areas. There should
be appropriate support policies and not discrimination between natives and
immigrants, regardless of the state of residence. The policy will help immigrants
seeking employment, access to social security systems and reduce the cost of living.
2.7.4. The income gap between urban area and rural area
Average income of households
In the recent 10 years, the life of the households has been improved, per capita income
increased rapidly. According to statistics, the average income of urban households is
of gets 13 million VND each month. Although the income of all strata of the
population, the localities, the territories and regions has increased, this increase took
place in accordance with the different speed and trends.
Chart 1 89: Table of household's average income (per month) in 2014 (thousand dong)
Cities Average income of
households
Classification of income of households Q5: Group with highest income (richest)
Q4: Group with good income
Q3: Group with average income
Q5 29,805
Q4 14,279
Q3 10,315
Q2 7,325

129
Q2: Group with average-below income
Q1: Group with lowest income (poorest) Q1 3,982
Total 13,141
Source: Reasonable housing prices in Vietnam (WB) - Survey of Household Living Standard
in 2014
In 41 cities surveyed under NUDS project, the average incomes within households are
significant differences between regions and urban centers. Chart 1 90: Average income of households 41cities surveyed (million VND)
0.0
2.0
4.0
6.0
8.0
10.0
12.0
14.0
16.0
18.0
20.0
TP Hà Giang
TP Bắc
Giang
TP Thá
i Ngu
yên
TP việt T
rì
TP Lai
Châ
u
TX S
ông
Côn
g
TT Sa Pa
TT Chũ
TP Hà Nội
TP Bắc
Nin
h
TP Hạ Lon
g
TP Thá
i Bìn
h
TP Nam
Địn
h
TX T
am Đ
iệp
TX P
húc Yên
TT Mỹ
Hào
TP Tha
nh H
óa
TP Đồn
g Hới
TP Huế
Đà Nẵn
g
PR-T
háp
Chà
m
Tx cử
a Lò
TT Phú
Pho
ng
TP Ple
iku
TP Đà Lạ
t
TX G
ia N
ghĩa
TT Chư
Sê
TT Phước
An
TP H
CM
TP Bà Rịa
TP Vũn
g Tàu
TP Tây
Nin
h
TX Đồn
g Xoà
i
TX T
huận
An
Cần
Thơ
TP Vị T
hanh
TP Bạc
Liêu
TP Cà M
au
TP Rạc
h Giá
TT Cần
Đướ
c
TT Lấp
Vò
Thu nhập trung bình (trđ/hộ gia đình)
The researches show63
: With increasing speed of the average rich-poor gap of 1.6% at
present, if no reasonable adjustment policies, Vietnam will quickly enter the threshold
of high inequality. This will not only cause the adverse economic growth, but also
negatively affect the process of sustainable development, especially in the context of
international integration as the current depth. Rich-poor gap between the urban area
and rural area of Vietnam is showed at the points: Coefficient of income difference
between rural area and urban area is currently being shortened, but the absolute gap is
growing again. Chart 1 91: Table of per capita income per month divided by urban area - rural area
in Vietnam during 2002-2012
The statistics in this period also indicate: 60% of the population with low income
(under 3 groups: poor, near poor and average) only accounting for 30% of the total
income of the whole society, but the majority of them live in rural area. The remaining
63
Rich and poor gap between the urban areas and rural areas in Vietnam in the context of international
integration - Assoc. Prof.-Dr. Pham Datong, National Economics University. Master. Nguyen Thi Hue, College
of Statistics. Proceedings of the Scientific Conference: Orientations and solutions for sustainable development
of Vietnam in the new context of international integration and climate change to 2020, Vision to 2030 -
Activities of the State-level key scientific and technological program KX.04/11-15

130
40% of high-income population mainly wealthy people living in urban areas to 70%
ownership of the country's total income. To narrow the gap between urban and rural
areas, in recent years, the government has built and regulatory policies aimed at rural
development and create favorable conditions for business activity in the
manufacturing business geographical areas such as industrialization - modernization
of rural areas, new rural construction, the preferential policies to attract investment,
build a legal framework for the development of open countryside ... So many local
restructuring of labor from agriculture to industry and services. This has helped create
jobs, increase income and improve the living conditions of rural people more; very
good support while reducing reduces emigration from rural areas to urban areas.
Employed workers in urban area are lower than in rural area
Chart 1 92: The proportion of workers employed in 2014 and the ratio of employment to
population by quarter 64
According to statistics, the proportion of workers employed in 2014 was much lower
in urban areas than in rural area. Two large cities, Hanoi and Ho Chi Minh City with
the proportion of employed workers are lower than average employed workers rate of
6 social - economic regions.
2.7.5. Child labor in urban areas
Not all children involving in economic activities are child laborers. Children, who
participate in light works, not included in the list of jobs that prohibiting the use of
child labor, working time is not too long that may influence the development of
children not considered to be child labor. Only jobs which theirs working conditions
affect the development of physical, mental and dignity of the child ... shall be
considered as child labor. So far no general and uniform concept on child labor; but it
is often identified by the countries that child labor as children used to do jobs
prohibited by national law, the worst forms of child labor under the Convention 182 of
64 Source: Report of Job and labour investigation in 2014. GOS, MPI

131
International Labour Organization, working in conditions that are harmful to children.
The rate of child labor
According to data from the National Survey on Child Labour, Vietnam has more than
2.83 million children engaged in economic activity, accounting for 15.5% of the child
population, 42.6% of which were children 57.4% are girls and boys. In urban areas,
there are about 400 thousand children participate in economic activity, accounting for
about 14.1% of the total group of children 5-17 years old. It can be seen that the level
of economic activity participation of children in urban areas is much lower than in
rural areas (Children 5-17 years of age in urban areas accounted for 28.8% of all
children this age group of the country). Thus, unlike other countries in the world,
mostly in Vietnam living child labor in rural areas, working in the field of agricultural
and household labor is unpaid.
According to statistics from 41 cities surveyed, only 6 cities have data on child labor
in the economic sector. Lai Chau City is highest (2.6%) is much lower average rate of
the whole country. Cities such as Thai Binh City, Dong Hoi City with a proportion of
working children in the economic sectors are 1%, the remaining three cities i.e. Hue
City, Chu Se Town, Dong Xoai Town are lower than 0.3 %.
Chart 1 93: Chart of child labor in 41 surveyed cities/towns (%)
0.0
0.5
1.0
1.5
2.0
2.5
3.0
TP H
à G
iang
TP Bắc
Gia
ng
TP Thá
i Ngu
yên
TP việt
Trì
TP Lai
Châ
u
TX S
ông
Côn
g
TT Sa Pa
TT Chũ
TP H
à Nội
TP Bắc
Nin
h
TP Hạ Lon
g
TP Thá
i Bìn
h
TP N
am Địn
h
TX T
am Đ
iệp
TX P
húc Y
ên
TT Mỹ
Hào
TP Tha
nh H
óa
TP Đồn
g Hới
TP H
uế
Đà Nẵn
g
PR-T
háp
Chà
m
Tx cử
a Lò
TT Phú
Pho
ng
TP Ple
iku
TP Đ
à Lạ
t
TX G
ia N
ghĩa
TT Chư
Sê
TT Phước
An
TP H
CM
TP Bà Rịa
TP Vũn
g Tàu
TP Tây
Nin
h
TX Đồn
g X
oài
TX T
huận
An
Cần
Thơ
TP Vị T
hanh
TP Bạc
Liê
u
TP Cà M
au
TP Rạc
h G
iá
TT Cần
Đướ
c
TT Lấp
Vò
Tỷ lệ lao động trẻ em (%)
Assessment
After nearly 30 years of renovation, Vietnam has made great achievements in
economic and social development and the protection and care of children education.
In fact, the negative effects of the market economy, poverty, the rapid population
growth in large cities, industrialization, urbanization, increased trade liberalization,
attitude families to education, poor quality of education and migration to urban
development are factors that lead to child labor are a growing trend in Vietnam..
With a size of about 2.83 million economically active children (accounting for 9.6%
of the child population), of which 1.75 million child laborers, with nearly one third of
those working on 42 hours per week that the issue of child labor in Vietnam needs to
be better addressed. Nearly 85% of child laborers live in rural areas, this is also the
region with the percentage of children is very high labor participation (representing
18.62% of the rural child population) and much higher compared with the rate of labor
force participation of children in urban areas (7.56%) showed the preventive measures
of child labor should focus on rural areas. Participation in labor force has negatively
affected the situation of children's going to school: the proportion of children not
enrolled in children's economic activity increased by 41.6% in the group nearly 55%

132
of child labor; especially for child labor has long working time, over 42 hours/week
non-attendance rate increasing to 96.4%
According to statistics from the International Labor Organization, the rate of child
labor in Vietnam is lower than average proportion of the world and very close to the
rate of the region65
Thus, the speed of urbanization in the market economy of Vietnam today, the risk of
child labor from the state of children from rural areas come to urban areas, industrial
zones to find are great for work; and are often vulnerable to exploitation in economic
terms because they are difficult to integrate into the urban context. Therefore, it is
necessary to minimize the migration from rural to urban areas for children by
supporting rural economic development, and improve the quality of education in rural
areas. At the same time, law enforcement mechanisms in urban areas need to be
tightened to effective inspection and timely intervention in the economic sector of
child labor.
2.7.6. Un- efficiently use of the human resources with high quality
In 2004, Vietnam's population is over 90 million people. This reflects the abundant
growth of Vietnam's human resource. Vietnam's human resource mainly consists of
farmers, workers, intellectuals, businessmen, service employees, human resource of
sectors. In particular, farmers are nearly 63 million people, accounting for over 70%
of the population; workers are 9.5 million people (nearly 10% of the population);
intellectuals who graduated from universities, colleges or more are over 2.5 million
people, accounting for 2.15% of the population; human resource from businesses is
about 2 million people, of which, the central business block is nearly 1 million
people.... The appearance of young businesses is deemed as a new factor in human
resource, if well exploited, fostered, used, it will solve many important problems in
social-economic development.
Currently, it is forming two types of workforce in Vietnam 66
popular workforce and
high-quality workforce. Popular workforce still account for the majority, while the
proportion of high-quality workforce account for a very low rate. What is lacking in
Vietnam today, it is not the popular workforce but high-quality workforce.
Percentage of trained employee
According to statistics, the proportion of the trained workforce in our country is still
low. From a total of 53.748 million people at the age of 15 years-old or more under
workforce of the whole country, only 9.99 million people have been trained,
accounting for 18.6% of the total workforce. In contrast, there are more than 43.76
million people (accounting for 81.4% of the workforce) who have not been trained to
reach any level of technical expertise. Thus, our country's human resources are
abundant and young but skill and technical expertise is low.
65
The latest report of the ILO on Global child labor trends estimated in 2012, about 168 million children at the
age of 5-17 are child laborers all over the world, accounting for about 10.6% of the population ofchildren. This
rate is 9.3% in the Asia - Pacific. 66
Vietnam Human resource - Currents and Solution/ A Chau education system Company.
http://asialeadership.edu.vn/vi/tham-khao/136-fusce-euismod-consequat-ante.html

133
Chart 1 94: Table of proportion of the trained workforce in 201467
The rate of trained employees is highest in Hanoi (39.0%) and lowest in the Mekong
Delta (10.4%). The proportion of the workforce with bachelor degree or higher is
significantly different between regions. The place with this highest proportion of is
Hanoi (21.2%) and Ho Chi Minh City (18.8%). In contrast, in Mekong Delta Region -
the largest granary, the region has the proportion of the labor force have college
degree or higher in the lowest (4.5%). The percentage of trained labor of women and
men is higher than in urban areas as well as rural areas have shown this trend.
The survey carried out in 41 urban areas, the percentage of trained employees to work
with the change in 6 socio-economic regions, there are only urban areas of 13.89% as
Tay Ninh City, or 30% as Cua Lo Town but this rate rises to over 65% as Hue City
(68%), Thanh Hoa (69%). However, based on zoning, the rate of untrained employees
is lowest in urban areas in the Mekong Delta region and the Central Highlands and the
second highest in the Southeast Region and the Red River Delta and the Northern key
economic zone, two regions focus large cities, is the largest social-economic center of
the country.
Chart 1 95: Chart of trained employee rate in 41 cities surveyed (%)
0.00
10.00
20.00
30.00
40.00
50.00
60.00
70.00
80.00
TP H
à G
iang
TP Bắc
Gia
ng
TP Thá
i Ngu
yên
TP việt T
rì
TP Lai
Châ
u
TX S
ông
Côn
g
TT Sa Pa
TT Chũ
TP Hà Nội
TP Bắc
Nin
h
TP Hạ Lon
g
TP Thá
i Bìn
h
TP Nam
Địn
h
TX T
am Đ
iệp
TX P
húc Yên
TT Mỹ
Hào
TP Tha
nh H
óa
TP Đồn
g Hới
TP H
uế
Đà Nẵn
g
PR-T
háp
Chà
m
Tx cử
a Lò
TT Phú
Pho
ng
TP Ple
iku
TP Đà Lạ
t
TX G
ia N
ghĩa
TT Chư
Sê
TT Phước
An
TP HCM
TP Bà Rịa
TP Vũn
g Tàu
TP Tây
Nin
h
TX Đồn
g X
oài
TX T
huận
An
Cần
Thơ
TP Vị T
hanh
TP Bạc
Liê
u
TP Cà M
au
TP Rạc
h Giá
TT Cần
Đướ
c
TT Lấp
Vò
Tỷ lệ lao động qua đào tạo(%)
67
Employment Survey Report 2014 General Statistics Office of Vietnam, Ministry of Planning and Investment

134
Effectively use of high-qualified human resource
Chart 1 96: Table of structure of the unemployed divided by the highest education levels
achieved in 201468
Source: Magazine of Employment 2014. GSO.
Training structure is also unreasonable that expressed by the rates: Higher education is
1, 1.3 Intermediate professional schools and technical vocational schools is 0.92;
while in the world, this rate is 1-4-10. According to the World Bank (WB), Vietnam is
lack of qualified and skilled employees, high-level technical workers and the quality
of human resource in Vietnam is also lower than in many other countries. If we use a
scale of 10, the human-resource quality of Vietnam is only 3.79 (ranking 11/12 in
Asian countries participating in the World Bank's ranking - 2010) while South Korea
is 6.91; India is 5.76; Malaysia is 5.59; Thailand is 4.94...
But in fact, the number of unemployed people has a Bachelor degree or higher is quite
high, this reflects a reality that more students graduate from the Universities more
difficult to search jobs. The data also shows that the unemployment proportion of
persons with vocational training such as vocational primary level, vocational
secondary level and vocational college and those who have never attended school or
have not completed primary education is very low. The reasons are the group of these
people are willing to do the simple jobs while persons with bachelor degree or higher
are trying to seek a stable job with high income and appropriate.
68
Employment Survey Report 2014 General Statistics Office of Vietnam, Ministry of Planning and Investment.

135
2.8. Urban management capacity
2.8.1. Introduction
If urban governance was mentioned a few decades ago by the world's developed
countries, it has just been mentioned in recent years in Vietnam. Thus, what is
difference between Urban Governance and Urban Management? According to the
World Bank (WB) : Urban governance is to exercise power to manage the economic
and social development of a city and Urban management is a process to ensure that a
city achieves its objectives and resources are used effectively and efficiently.69
.
-According to UNDP – Good governance includes participatory, transparency and
accountable, effective equitable, the rule of law. Good governance ensures that
political, social and economic priorities are based on broad consensus in society and
voices of the poorest and the most vulnerable are listened in making decision as well
as in allocation of development resources70
. With such objectives and significance,
assessing urban governance, many international organizations: have built criteria and
indicators to guide for assessment of governance capacity of a city, for example:
- Cities Association (CA) provides basic indicators to assess urban governance of 10
target cities in Vietnam National Program including 8 indicators:
1. The cost for the operation of the city per capita per year
2. Number of city employees per 1,000 people per year.
3. Proportion of female employees in the total number of employees of the city
4. Proportion of city officials who graduated from high school and post-secondary trained
5. Proportion of voters participating in the vote
6. The city has a website in order to receive the opinions of the people
7. The level of participatory planning process
8. The level of activity of the social organizations in urban areas
In the indicators UNHABITAT on "Urban Prosperity Initiatives", the indicators for
assessment of Urban management and legislation include 3 basic indicators: i) Participation
ii) Urban finance and institutional capacity iii) Urbanized management
Based on these three basic indicators, there are more detailed indicators to assess urban
management
I. Participation indicator
1. Percentage of voters
2. People conditioned to access the urban information
3. The participation of people in social organizations in urban areas
II Urban financial indicators and institutional capacity:
4. Self-revenues compared to total urban revenues
5. The number of days for business to make business registration procedures
6. Liabilities compared to total urban revenues
69
1992. World Bank "Governance and Development". 70
UNDP Internet Conference Forum on "Public Private Interface in Urban Environmental Management" 1996.

136
7. Effectiveness of urban expenditure (local real expenses compared to planned
expenditure)
III. Urbanized management.
8. Effectiveness of land use (land use rate compared with the rate of population growth).
- In the NUDS project 8 indicators is provided to assess the urban governance capacity
of urban government:
+ Latest general planning for urban construction approved
+ Urban civilization street rate
+ Zoning planning/Detailed planning coverage rate
+ Unlicensed construction works rate
+ Regulations on management of the architecture of entire city
+ Urban development program approved
+ Rate of public announcement of administrative procedures on the website of urban
government or website of professional management authority
+ Number of full-time staff working in the field of urban management
- In 2014, in a research topic of Dr. Nguyen Ngoc Hieu - National Academy of Public
Administration, 50 indicators were given to assess the quality of urban governance,
including the quality of urban infrastructures.
Because urban governance is a field related to many aspects, it has impact on the
lives of people and shows the results how a city is managed. Therefore, depending on
point of view and requirements, assessment degree is made. The NUDS project has
determined 78 indicators per 9 fields to comprehensively evaluate the aspects of a
city, in which, assessment of urban governance has 8 indicators. Thus, with 8
indicators, only the most basic features are reflected and urban governance issue can
not be reflected comprehensively. Therefore, the report will use more materials,
secondary data such as indicators of PAPI "Public Administration Performance Index
- Measuring Citizens' Experiences" financed by UNDP, or PCI "Provincial
Competitiveness Index"and many other documents. In this report, the urban
governance in Vietnam will be evaluated based on four important aspects.
1. Urban Administration
2. Efficient management and use of resources
3. Management of urban development
4. Management of quality of basic urban services
2.8.2. Urban Administration
a) Urban administration decentralization
On 19/6/2015, at the 9th session of the XIIIth National Assembly, law on local
government organization was passed. On 03/7/2015, the President of the Country
signed the order to declare the law. The 2015 law on local government organization
came into effect from 01/01/2016. The law stipulates administrative units and

137
organization, local government‟s activities. The administrative units of Socialist
Republic of Vietnam include provinces and municipalities (hereinafter collectively
referred to as provincial level); Districts, towns and provincial cities, cities under
municipalities (hereinafter collectively referred to as district level); Communes, wards
and townships (hereinafter collectively referred to as commune level); special
administrative - economic units. The structure of local government is presented in
chart 1 below:
Figure 1 9: Power allocation for local authorities under the Laws of Local Authority
Organization in 2015
Until now, there are 788 cities in the whole country, including 5 municipalities such as
Hanoi Capital, Ho Chi Minh City which are two cities of special type, Hai Phong City,
Da Nang City, Can Tho City and 116 provincial cities and townships and over 660
district towns. Although Vietnam‟s cities account for just over 35% of population but
contribute over 70% of GDP of the whole country, therefore, good urban management
will make performance of cities increase and positively affect the social and economic
development of the country. According to their organizational structure of the local
governments, municipalities are equal to provincial level, therefore it shall have more
powers and more proactive than provincial cities which are equal to district level and
different from towns such as wards and communes in a city. These are characteristics
which will govern governance at all levels of a city.
b) Effectiveness and efficiency of urban government machinery
b1) Civil servants and staff of urban government machinery
Number of civil servants and officials in cities.
Considering the number of staff and civil servants per 10,000 citizens is an indicator
to show actual use of staff compared to the requirements of job. If lack of human
resources, quality of job performance will be affected.
- Survey result in 10 cities by CA shows the number of city public servants and staff
per 10,000 people as (Table 1)71
.
Chart 1 97: Number of city public servants and staff per 10,000 people
71
Survey project of Vietnam cities association in 2014 financed by CA

138
Việt
Trì
Quy
Nhơn
Đồng
Hới
Hải
Dương
Bến
Tre
Cao
Lãnh
Hà
Tĩnh
Hưng
yên
Lao
Cai
Tam
Kỳ
0.53 49 22.4 1.3 6.2 0.97 4.35 1.9 16.6 2.43
The above data shows that there was a big difference between urban areas: Quy Nhơn
has 49, Đồng Hới has 22,4 and Lào Cai has 16.6 including staff and officials in
District and town level. In fact, the urban personnel were divided into three types:
Explanation: In fact, the urban personnel were divided into three types:
(1) Official staff and employees of departments of city People's Committee in the
fields of State management were on the payroll, this amount accounted was not much
(2) Civil servants and labor or short-term or long-term employees to ensure the
number of personnel to carry out tasks.
(3) Ward and commune civil servants not to be included in the city.
If calculated according to the number of Civil servants, this number was very small,
but if we include officials and contract employees, this number increased quite a lot.
In many urban areas, the number of contract employees accounted for nearly half of
the payroll workforce, so the fact is that manpower was lack compared with demand
and workload.
Human resources of urban management department
Urban Management Department was the professional body to advise the City/ Town
People's Committee of architecture; construction planning; urban development;
housing and offices; building materials; transport and urban infrastructure (water
supply and drainage, urban environmental sanitation, parks, trees, lighting, garbage).
Therefore, sufficient manpower and staff with good qualifications played a very
important role for good urban management.
- Through the data sent by 10 urban areas, there was 1 city as urban area grade I
(Thanh Hoa), 4 urban areas grade II and 5 urban areas grade III. This showed that the
number of staff of the Urban Management Department was different. For example,
Thanh Hoa city is the urban area grade I with a ratio of 1 urban manager/ 10,000
people while Song Cong town is the urban area grade III and this rate was 4.1/10.000
people. (See the chart below).
Besides the salaried staff from the state budget (on the payroll), all 10 urban areas had
staff working in the form of contract, which means too much work to supplement new
employees to meet job requirements. In some urban areas, the number of contract
employees was even more than employees on payroll. For example, there were 8
employees on payroll and 12 contracting employees in Thai Binh. This was also a
problem to be paid attention because it was difficult to arrange personnel retraining
for higher qualifications in case of lack of manpower.
Chart 1 98: Number of staff of the urban management department in 10 urban areas
surveyed

139
Nguồn: Phiếu điều tra khảo sát NUDS
b2) Capacity of leaders, civil servants in cities
Capacity of Urban government‟s officials is related to accountability in assessment
criteria. Good capacity will affect responsibilities to perform job well.
Many conferences of the industry and cities have identified that in the urban
management process, urban authorities always face and solve difficulties such as non-
compliance of construction with planning, housing shortage such as existence of
slums in some areas, traffic jams, environmental pollution, and social evils and so on.
Thus, urban management requires leaders or policy makers or administrative officers,
who execute specific duties, to understand their duties so that there are suitable and
effective management policies and solutions. Evaluation for capacity of leaders and
officers in urban areas in this report is analyzed on 3 following major aspects.
Satisfaction of people for services of urban officers.
One survey of three parties: the Ministry of Home Affairs, the Standing Committee of
Vietnam Fatherland Front Central Committee, the Vietnam War Veterans' Association
defines "Satisfaction Index of Public Administrative Services in 2015" - SIPAS in the
whole country from 01/01/2014 - 30/06/2015, for 6 administrative procedures (TTHC)
and implemented in 108 communes, wards and towns in 36 districts, townships, cities
in 10 provinces and cities nationwide such as Hanoi, Ho Chi Minh City, Quang Ninh
... SIPAS is surveyed based on 4 criteria: access to service, satisfaction about access
to services, administrative procedures, service of public servants and administrative
procedure settlement results which show that people are not satisfied about
professional ethics, service enthusiasm of civil servants (27% - 47%). The people
surveyed evaluated that communication, spirit of service and professional capacity of
civil servants was at normal and low level72
. Through SIPAS index, it is seen that
officials and public servants who do their duties in all urban authorities have a big role
in the administrative reform which is one of key tasks of cities.
72
Announcement of 2015SIPAS - Citizens‟ satisfaction scale on 27/4/2016.

140
Public – private conversation for responsibility and activeness of urban
governmental authorities.73
Public – private conversation is one of forms for direct connection between the
governmental authorities with economic components and local people. The quality of
activities for public – private conversation is one of important criteria reflecting
responsibility and activeness of the urban governmental authorities.
A survey on “roles of urban governmental authorities for local economic
development” conducted by ACVN in 2013 has recognized assessments for
improvement in economic development which has been a major cause of activeness of
governmental authorities at the levels. Of 33 urban areas in the survey, 70% of urban
areas have agreed about the idea of activeness of urban governmental authorities
which have had important impacts for local economic development, only 40% of them
have discuss with enterprises to solve difficulties.
In addition to results from the survey of ACVN, results for a survey of provincial
competitiveness index (PCI) of Vietnam Chamber of Industry and Trade are more
effective compared to the previous year (according to general assessment of over
8,000 enterprises in the survey), particularly in large urban areas such as Ho Chi Minh
City, Hanoi City, Da Nang City and some local areas with high PCI for many years
such as Lao Cai, Dong Thap. In fact, the logal governmental authorities are paying
special attention to conversation with enterprises to answer questions of enterprises
directly, “going together with” enterprises for development. However, public – private
conversation has faced many difficulties such as:
- In conversations, the enterprises are hesitant and do not offer their ideas.
- Cooperation of Departments and Sectors in the provinces is limited and mainly in the
form of direct discussion.
- Officers in the governmental authorities cause difficulties for enterprises;
therefore, any enterprises do not select public conversation for solving issues.
b3) Forming electronic government to meet transparency, accountability.
The electronic Government helps the State operate in an effective aspect for
benefits of people, reflecting in all aspects: Give notices to people; announce
operations of agencies in charge; apply information technology for renovating
administrative procedures and cooperate with agencies in a smooth way for benefits of
people and etc. The Electronic Government is being evaluated as a model bringing the
most optimal advantages when having huge contribution to reduction of costs,
improvement of effectiveness of services for enterprises and people. On the other
hand, it helps save travelling time and time for printing samples for people and also
with high transparency, it has a huge contribution to reduce unofficial costs of
enterprises as well as corruption of officers in duty.
In everyday life, people and companies must comply with many regulations on
administrative procedures. Administrative procedures in various fields are barriers to
73 Policy report "Improving local governance processes to support local economic development in the cities of
Vietnam," Cooperation between the Federation of Canadian Municipalities (FCM) and the Association of Cities
of Vietnam 2014

141
business operations and people‟s lives and costly, affecting competitiveness of each
city‟s economy in particular and the country in general.74
To solve the foresaid shortcomings, the Prime Minister issued Decision No. 30/QD-
TTg dated 10/01/2007 approving Project for simplification of administrative
procedures in the fields of State management in the 2007-2010 period (hereinafter
referred to as Project 30) and Decision No. 07/QD-TTg dated 04/01/2008
promulgating Plan for performing the Project 30, providing an overall public and
transparent solution system in order to statistic, review and simplify administrative
procedures.
Establishment, publicity and maintenance of national database on administrative
procedures (TTHC) are applying at (central, provincial, district and commune)
authorities on electronic websites of TCTCT.. Currently, National Assembly is
discussing the Law on “Right to access to information” as one of the basic human
rights. The Constitution 1946 and the Constitution 1992, the latest Constitution 2013
of our country are provided that the citizens have the right to be informed in order to
give citizens the right to know the guidelines and policies of the Party and State, to be
informed urgent matters, associated with daily life. Through the survey of "Effective
indicators of Management and Public Administration at provincial level in Vietnam -
Measurement from practical experience of the people in 2015 upon assessment of the
information received by the people mainly through TV channels accounting for 84%,
through meetings accounting for 30%, and on the site also accounting for more than
17%. However, this is the survey data at the provincial level including both urban and
rural areas. (See Figure and Chart below)
Chart 1 99: People use which information channels for information [PAPI indicator in
2015]
Also, the result of 2015 SIPAS shows that common information access form often
used by people for administrative procedures is through ward and commune
governments (62% - 76%), followed by asking relatives, friends informal questions
(11% - 17%), only 4% - 8% of people using online access form, which suggests, for e-
74
Report of Vietnam Chamber of Commerce and Industry - 2015
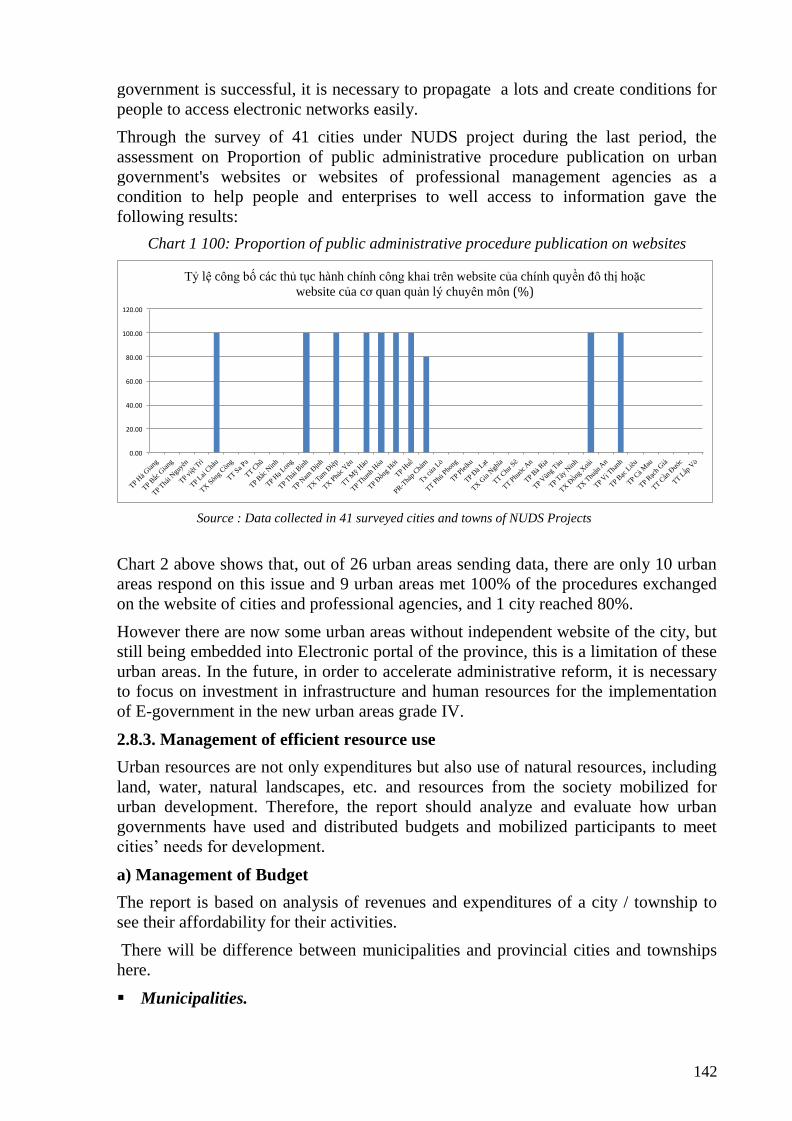
142
government is successful, it is necessary to propagate a lots and create conditions for
people to access electronic networks easily.
Through the survey of 41 cities under NUDS project during the last period, the
assessment on Proportion of public administrative procedure publication on urban
government's websites or websites of professional management agencies as a
condition to help people and enterprises to well access to information gave the
following results:
Chart 1 100: Proportion of public administrative procedure publication on websites
0.00
20.00
40.00
60.00
80.00
100.00
120.00
TP H
à G
iang
TP Bắc
Gia
ng
TP Thá
i Ngu
yên
TP việt
Trì
TP Lai
Châ
u
TX S
ông
Côn
g
TT Sa Pa
TT Chũ
TP Bắc
Nin
h
TP Hạ Lon
g
TP Thá
i Bìn
h
TP N
am Địn
h
TX T
am Đ
iệp
TX P
húc Y
ên
TT Mỹ
Hào
TP Tha
nh H
óa
TP Đồn
g Hới
TP H
uế
PR-T
háp
Chà
m
Tx cử
a Lò
TT Phú
Pho
ng
TP Ple
iku
TP Đ
à Lạ
t
TX G
ia N
ghĩa
TT Chư
Sê
TT Phước
An
TP Bà Rịa
TP Vũn
g Tàu
TP Tây
Nin
h
TX Đồn
g X
oài
TX T
huận
An
TP Vị T
hanh
TP Bạc
Liê
u
TP Cà M
au
TP Rạc
h G
iá
TT Cần
Đướ
c
TT Lấp
Vò
Tỷ lệ công bố các thủ tục hành chính công khai trên website của chính quyền đô thị hoặc
website của cơ quan quản lý chuyên môn(%)
Source : Data collected in 41 surveyed cities and towns of NUDS Projects
Chart 2 above shows that, out of 26 urban areas sending data, there are only 10 urban
areas respond on this issue and 9 urban areas met 100% of the procedures exchanged
on the website of cities and professional agencies, and 1 city reached 80%.
However there are now some urban areas without independent website of the city, but
still being embedded into Electronic portal of the province, this is a limitation of these
urban areas. In the future, in order to accelerate administrative reform, it is necessary
to focus on investment in infrastructure and human resources for the implementation
of E-government in the new urban areas grade IV.
2.8.3. Management of efficient resource use
Urban resources are not only expenditures but also use of natural resources, including
land, water, natural landscapes, etc. and resources from the society mobilized for
urban development. Therefore, the report should analyze and evaluate how urban
governments have used and distributed budgets and mobilized participants to meet
cities‟ needs for development.
a) Management of Budget
The report is based on analysis of revenues and expenditures of a city / township to
see their affordability for their activities.
There will be difference between municipalities and provincial cities and townships
here.
Municipalities.

143
Large cities play an important role in the national economy and contribute
significantly to GDP and national revenues. According to the research report of the
Asian Fund, the result of revenues and expenditures of 4 cities such as Hanoi, Ho Chi
Minh City, Can Tho City and Da Nang City is shown in the following chart)
For budget revenue
Chart 1 101: Combined GDP of 4 cities compared with national GDP
75
Chart 1 102: Four Cities’ contribution to the state budget [4]
For budget expenditures All 4 cities have less expenditure than revenues ( see the chart)
Chart 1 103: Budget expenditure of 4 cities
75
Municipal Government in Vietnam – Case studies of Ho Chi Minh city and Da Nang – the Asian Foundation
October 2013

144
Provincial Cities and towns
Although in recent years our country was also in crisis situation, but the urban
areas surveyed of NUDS showed average growth in the last 3 years at 13-20%
regularly (29 urban areas). Some urban areas have outstanding growth of above
20% as Tam Diep Town, Cua Lo Town, Go Vap Town and Ba Ria City (see Chart
below).
Chart 1 104: Economic growth in the last 3 years (%)
0.00
5.00
10.00
15.00
20.00
25.00
30.00
TP H
à G
iang
TP Bắc
Gia
ng
TP Thá
i Ngu
yên
TP việt
Trì
TP Lai
Châ
u
TX S
ông
Côn
g
TT Sa Pa
TT Chũ
TP H
à Nội
TP Bắc
Nin
h
TP Hạ Lon
g
TP Thá
i Bìn
h
TP N
am Địn
h
TX T
am Đ
iệp
TX P
húc Y
ên
TT Mỹ
Hào
TP Tha
nh H
óa
TP Đồn
g Hới
TP H
uế
Đà Nẵn
g
PR-T
háp
Chà
m
Tx cử
a Lò
TT Phú
Pho
ng
TP Ple
iku
TP Đ
à Lạ
t
TX G
ia N
ghĩa
TT Chư
Sê
TT Phước
An
TP H
CM
TP Bà Rịa
TP Vũn
g Tàu
TP Tây
Nin
h
TX Đồn
g X
oài
TX T
huận
An
Cần
Thơ
TP Vị T
hanh
TP Bạc
Liê
u
TP Cà M
au
TP Rạc
h G
iá
TT Cần
Đướ
c
TT Lấp
Vò
Tốc độ tăng trưởng kinh tế trung bình 3 năm gần nhất (%)
- The stage budget revenue and expense have been analyzed quite carefully in the
section of urban economy, but at the chart above confirms the role as the economic
driving force of our country's urban system. Because revenues are increased, urban
areas have revenues being greater than expenses and up to 40/41 urban areas surveyed
have a positive balance of income and expenditure, reaching 97.5%. This data has
shown the control capacity of the cities and towns effectively in collecting budget.
The survey by the Federation of Canadian Municipalities and Vietnam Cities
Association in 2012 on the role of urban governments in local economic development
in 33 cities has results as….:
Chart 1 105: Balancing revenues and expenditures by type of city
Type of city Number of cities having
more revenue than
expenditure ( Revenue >
Expenditure) %
Number of cities having
less revenue than
expenditure (Revenue <
Expenditure) %
Type I . 100 0
Type II. 50 50
Type III. 50 50
Type IV. 75 25 Source : Statistics from the survey of 33 cities in the FCM and ACVN 2012 topics
Thus the cities having more revenue than expediture still make up more in the survey
result.
b) Land Management.
Land is a complex, sensitive field. State management of land directly affects
economic - social development, security, national defense, environmental protection
and sustainable development. Good land management will contribute to increasing the
state budget revenue and ensure interests of investors and people's lives. In citiess,
people's production and business activities, services, living activities are associated
with land within limit of urban space, therefore, urban land is considered as urban

145
development foundation. It is formed from conversion of use purpose of other types of
land, which is mostly agricultural land. That's reason why the state management of
urban land use is specific.
Currently, legality of urban land is not clear and there is no separate regulation
on classification in current laws on land. Land classifications by use purpose in cities
are inappropriate to the nature that urban space is a unified body in construction and
management of economic development planning and land use planning of urban
government. According to the current classification of land in cities there are only 3
types of land: agricultural land, non-agricultural land and other land, which causes
use of land to become unclear. Actually, projects are being adjusted, split and
fragmented, broken their planning during implementation process. Therefore,
localities are required to have strong measures to make a change in land management
issue, gradually remove the image of "hanging" planning; abandoned project, etc. put
land into use for the right purposes, to establish order in land management.
In a survey on "Role of urban governments in local economic development" of
the Federation of Canadian Municipalities when evaluating what revenue of cities are,
33/33 cities have answered that it is mainly from land earned by auction of land use
rights and from land fund development. Dr. Pham Si Liem - Vice Chairman of
Federation of Civil Engineering Associations said - management of urban land has
many weaknesses. Quick increase in urban land prices makes costs for urban
development investment to become too expensive; Existing land is not fully exploited,
boundaries inside cities and towns has been quickly expanded; Land finance is used
wastefully and non-transparently.76
Because value of urban land is very significant therefore, there must be
effective urban land use management mechanism for the right purposes as shown and
controlled enforcement in economic- social development planning and land use
planning. Urban expansion with huge land area is not proportional to the size of
population, which is a big issue for many cities (See Figure)
Figure 1 10: Huge urban area land in comparative with the population
77
76
Improve the efficiency of urban development management as per planning – Dr. Pham Si Liem 1/3/2014. 77
Housing Profile 2011 - UNHABITAT

146
According to the survey data in 41 urbans, there are 17 in 41 urbans having ratio
of urban agricultural land in the lower 30% and 12 urban proportion of urban
agricultural land from 30-45%. It is said that: “the process of urbanization in our
country reveals a lot of instability. Numerous farmers become citizens, a lot of
agricultural land become urban land through administrative decisions. In other
words, the municipality had to "hug/include" too many farmers, countryside and
agriculture”78
. This is an issue that Ministry of Construction reviews scientifically and
practically regarding urban upgrading in the near future và to be approved by Standing
Committee of the National Assembly replacing for Decree No. 42 issued in 2009.
2.8.4. Development Management
a) Management of Planning
a1) Vision of urban governments in urban construction planning
In the report of Adetef - Lyon urban planning agency and Center for urban forecasting
and research (PADDI) - France in cooperation with the departments, industries of Ho
Chi Minh City have studied restrictions in urban planning and judged as follows79
:
Planning product becomes outdated quickly before continuous practical changes.
Approaches are still heavy top-down, imposed therefore, they cause planning to be
inflexible and limited ability to mobilize all resources in society. And there is
mismatch between urban planning and practice such as:
- Population size in districts in planning is different from that in practice ,
- A investor does not comply with construction permit and builds not in accordance
with permit in fact, and doesn’t comply with original planning (for large projects) and
build the infrastructures planned (not extending roads as expected in planning.),
- The infrastructures in planning are different from those performed in fact,
- Urban development in agricultural land, natural land or land able to be flooded
(areas can not be built): around industrial parks in environs, spontaneously urbanized
(there is no infrastructure).
The report also identifies causes of created mismatch including causes related to the
relationship between the parties: i.e.:
+ Interdisciplinary coordination is still very limited, resulting in an overlap with
industry planning,
+ Lack of '' social contract' between entities in the field of urban development,
although there are currently many improvements (2009 law on planning is aimed at
limiting violations).
+ Lack of consensus and "social contract" regarding concept of public interest ...
and therefore the regulations of the government are not fully complied.
The above restrictions are also general ones of urban planning in cities.
78
Thinking about urbanization strategies in Vietnam 23rd Feb 2015 - Dr. Ngo Doan Vinh – formal Director of
Institute for development Strategies- MIP - and Dr. Ngo Thuy Quynh. 79
How to do so that urban planning in Vietnam becomes more effective - Ho Chi Minh City Case” ( March
2012)

147
For vision in urban planning, the analysis of a group of expert of the World Bank
according to the report on assessment of urbanization in Vietnam announced in
November 2011 stated that development of Vietnam urban system is associated with 5
changes in: i) Administration; ii) Space; iii) Economics; iv) population; and v)
Welfare. These experts evaluate that urbanization in Vietnam has had many
achievements, but to ensure sustainability of growth, it is necessary to shift from
development relying on low-cost labor and exploitation of natural resources into
attaching special importance to increasing productivity and application of
technological progress, and increasing macroeconomic stability. They remarked "
urban planning and management in Vietnam is still largely based on static design
principles" and proposed "Vietnam should consider adding general planning by
updating strategic planning more often and adaptive management strategies, based on
current economic - socio data and actual market trends in order to support and lead
design oriented- development process”80
.
a2) Making planning and zoning planning.
Zoning planning/Detailed planning coverage rate
* Zoning planning
According to the 2009 Law on urban planning, zoning planning is the division and
determination of functions and norms on the use of planned urban land of land areas,
networks of social and technical infrastructure facilities within an urban area in order
to concretize a general plan. Zoning planning project approved is basis for
determining construction investment projects in cities and making detailed planning.
This is newly proposed indicator of NUDS indicators.
7 out of 41 cities have responses in which Thai Binh City, Lai Chau City, Phan
Rang- Thap Cham city and Vi Thanh City reached 100%, followed by Hue City
reaching 80% and Thai Nguyen reaching 65%. Thus, the cities reaching 100% are
cities type II and III. It is possible to say that for demand and resources, there is basis
for conducting zoning more quickly than cities with lower type. ( See Chart)
Chart 1 106: Coverage of zoning planning
80
Report on Urbanization in Vietnam – Technical Assistance Report –WB in November 2011

148
Source : Data from survey of 41 cities of NUDS project
*. Detailed planning
According to the 2009 Law on urban planning, detailed planning is made for region
based on demand for development, urban management or construction investment if
there is detailed planning, it will help governments manage urban construction well.
According to data collected from 26 cities, only 10 cities have information on
detailed planning coverage rate of which Lai Chau city and My Hao town reach
100% and followed by Thai Binh city reaching over 90 %, Phan Rang - Thap Cham
reaching 90%, Tam Diep Township reaching 80% and Vi Thanh City reaching over
60% (Chart)
Chart 1 107: Coverage of detailed planning
Source : Data from survey of 41 cities of NUDS project
50% of 10 cities are cities type III and type II
Thus, the cities which have made detailed planning at high rate will contribute very
significantly to urban governance

149
Regulation on architecture management of entire city
According to Circular No. 19/2010/TT-BXD dated 22/10/2010 by the Ministry of
Construction guiding for establishing regulations on planning management, urban
architecture, this Regulation will be basis for considering new construction license, or
rehabilitation, embellishment of architecture works, designing urban landscape; a
basis for defining planning tasks and urban design for unplanned areas, approved
urban design. Therefore, it is very important in urban governments „management as
well as other functional authorities. According to survey data of NUDS project by
region and city type as follows:
By 6 Economic – Social Regions
Consultancy has been collected from 39 cities and 33 cities have regulations on urban
planning architecture management. In terms of 6 socio-economic regions under Chart
7a and city type, see Chart 7b) it is showed that special type and type I municipalities
are full and other types of cities also make up more than 80% of this, indicating that
cities are aware that this is an important tool in urban management. (See Chart)
Chart 1 108: Cities with regulation on architecture planning
management
Data collected from 41 surveyed cities/towns under NUDS Project
Approved urban development program
Urban development program is one of 49 indicators of the indicators in Circular 34
on urban classification. This program helps cities to make plan and develop priority
projects to meet the requirements of urban development.
* Assessment by region and city type
Through data collected if assess by region and city type, develop
Chart 1 109: The cities have approved urban development programme

150
Source: Data collected from 41 surveyed cities and towns under NUDS
Project
According to Circular No. 12/2014/TT-BXD dated 25/08/2014 guiding for
establishment, appraisal and approval of urban development program which is the
document specifying criteria for urban development, list and roadmap for
implementing planning, building general urban planning approved by competent
authorities. Therefore, this is basis for cities to have plans for development and urban
management and is also an effective tool for long-term management.
Through data, over 80% of cities have built this program in Mekong Delta and 3
regions reach over 60% as the following table.
Chart 1 110: Rate of cities with urban development program by region
No. Region
City with
urban
development
program
City
with
data
City with
urban development
program
classified by
economic-
social region (%)
1 Northern Midlands and Mountains 2 7 28.6
2
Red River Delta & Northern Key
economic region 2 3 66.7
3 North Central & Central Coast Region 3 5 60.0
4 Highlands region 0 2 0.0
5 South-eastern region 3 5 60.0
6 Mekong Delta 4 5 80.0
14 27 51.9

151
Source : Data from survey of 41 cities of NUDS project
Chart 1 111: Rate of cities with urban development program by city type
No. City type
City with urban
development
program City with data
City with urban
development
program classified
by city type (%)
1 Type I 4 6 66,7
2 Type II 5 8 62,5
3 Type III 2 6 33,3
4 Type IV 3 7 42,9
Total 14 27
Source : Data from survey of 41 cities of NUDS project
According to the data given in the above table: type I and type II reached over 60%;
Types III and IV also reached on average over 35%. Although the urban development
program is of important for urban development, the above data shows that in fact
implementation in cities is still slow compared to the requirements and will affect
monitoring implementation by urban governments in this matter.
a3) Granting construction license
Detailed planning is the basis for urban planning management agencies to introduce
locations (Law on Planning and Investment, Article 70), granting planning license
(Article 71 of the Law on Planning and Investment) and construction license ( Section
1 of Chapter V of the Construction Law). Those are three administrative tools to
manage the implementation of planning, in which construction license is most
predominant, significantly affecting construction of houses for people and business
environment of investors.
Unlicensed construction is an indicator stating that discipline and compliance with the
laws is not assured, and also showing management capacity of urban governments at
all levels. Out of 26 cities sending data on indicator on rate of unlicensed construction
works, only nine cities have data and the city with high rate is Hue with 35%,
followed by Dong Xoai Town and Lai Chau City with above 20% and Thai Binh City,
Dong Hoi City, Tam Diep Township and Chu Se town with only less than 3%. (See
Chart 6)
Chart 1 112: Rate of unlicensed construction of cities

152
Source : Data from survey of 41 cities of NUDS project
Explaining why data on this indicator provided by cities is too little is untaught
management, data is not collected, and on the other hand, it is also due to penalty for
existence” data does not reflect the reality correctly One issue also judged by many
planning and urban management experts is that unlicensed construction is associated
with construction order management in the cities where planning is not associated
with implementation organization plan and loosen inspection and supervision result in
many arising in practice, causing management not keeping up with. This is a
shortcoming in cities, directly affecting management by urban government
b) City’s making plans for development
In the market mechanism, an urban government has four basic functions identified to
be derived from the goal of the State‟s urban management and on the principle of
"what people do not take care of, the State will take care of". Such four tasks are: (1)
Provide infrastructures, (2) create conditions for urban markets, (3) Protect the
environment, (4) Take care of the poor.
b1) Plan for house development
In National Housing Development Strategy until 2020 and vision to 2030 – No.:
2127/QD-TTg dated 30/11/2011 approved by Prime Minister with Circular No.
08/2014/TT-BXD dated 23 May 2014 by the Ministry of Construction guiding for
implementation of some contents of Decree No. 188/2013/ND-CP dated 20 November
2013 by the Government on development and management of social houses in recent
years. House matter has been cared about by the government and governments of
cities, but it is still a big challenge for cities, especially in big cities due to rapid
increase in urbanization.
For large cities
Demand for house is increasing due to urban migration but also for another reason that
is bigger and bigger urban rehabilitation and development such as construction of
industrial parks, construction of urban infrastructures which require relocation of
people‟s house and resettlement.
In Ho Chi Minh City in the period from now to 2020, the city will implement 462 key
projects for road infrastructure, social infrastructure, public works, dismantling old
apartment buildings with the demand of about 28,168 resettlement houses to arrange

153
accommodation for affected households. According to the general development
planning of the city up to 2025, it is forecasted that demand for resettlement house
will continue to go up. Program for clearance of houses along canals only, from now
to 2025, needs 20,000 resettlement houses.81
. Thus, the city demand for house is
extremely large.
In the 2016-2020 period, Hanoi Capital will develop more 4,676,330m2 of social
house floor (in which, from 2016 to 2019, 950,000m2 each year, 876,330m2 for 2020
only); 567,539m2 of house floor for workers to lease (in which from 2016 to 2019,
110,000 m2 each year and 127,539 m2 for 2020 only); 976,992 m2 of house floor for
students; 1,200,000 m2 of resettlement house floor and 20,418,000 m2 of commercial
house floor.82
The above data shows that demand for house development has been
made plans to promote development by the governments of large cities.
For Provincial Cities.
The demand for houses is not as stressful as in big cities, however, proactive role is
limited because as decentralized, the housing development program under the
authority of the Provincial People's Committee.
b2) Solving urban poor areas
Taking care of the poor is one of four duties of urban governments which have been
considered one of the important duties in the past years. Based on the 2015 Basic
Statistics report (basic statistical data) , Asian Development Bank (ADB) comments
that poverty reduction process in the Asia - Pacific region has made significant
progress, but its speed is not uniform. Employment rate - a key factor in helping many
people escape poverty, also remains low in many countries. Also according to the
report, the poverty rate in Vietnam is the lowest in the region, with only 9.8% while
rate of people with jobs is up to 75.5%.83
.
According to the MOC 01 report on "Reviewing the current status and trends of urban
poverty": Although income poverty line in Vietnam is no longer high, and
unconcentrated, rate of income poor households doesn‟t fully reflect the issue of urban
poor areas.
The actual poverty rate is much higher, if consider multi-aspects instead of single-
aspect. But, despite multi-aspects, in the end, poverty can be attributed to four main
fields:
a- Lack of capacity to participate in labor market:
b- Lack of social capital to access to services and ensure livelihood:
c- Lack of infrastructures
d- Lack of environment to ensure minimum living conditions: healthy environment to
ensure a safe and healthy life:
These four fields can be seen as four types of capital that if any household lacks one
of the 4 types severely, it will be classified as poor. 84
81
Tổng quan tình Figure phát triển nhà ở TPHCM 9 tháng năm 2015 – Báo cáo Sở Xây dựng 82
Plan for developing houses in Hanoi City - December 2014 83
Poverty rate of Vietnam is the lowest in the region - ADB 31/10/2015 84
Project for upgrading Mekong Delta urban area – Code: MOC 01 .July 2015

154
Figure 1 11: Urban capital and urban multi-aspects poverty
On 8 June 2009, The Prime Minister approved the national urban upgrading program
No. 758 / QD-TTg in the period from 2009 to 2020 with the targets:
- To contribute to implementing a comprehensive strategy for growth and hunger
eradication & poverty reduction; To directly support to perform the overall planning
orientation for Vietnam's urban development; To raise the living conditions of urban
residents through investments to improve technical infrastructure, social infrastructure
and urban environment services with total investment of 175,000 billion VND. Up to
now, nearly 7 years and the program have made a large turning point in cities. Urban
governments have solutions to mobilize people such as the policy "State and people
working together" at the rate of 60-50% of the state - 40-50% of people. And for poor
areas, urban governments have supported all materials; people have contributed labor
and land to build roads, drainage ditches when extended.
Figure 1 12: Upgrading the poor area along Tan An City canals by the means of Community
Development Fund (CDF)

155
2.8.5. Management of basic urban services
Infrastructures play a special role for the objective of stabile, sustainable development
of city. It is the most basic element to form a city. The urban government, at its
resources and by mobilizing all resources in society, takes care of supplying entire
technical, social and economic infrastructure system, in which it is particularly
important that provision of basic urban services such as water supply, water drainage,
traffic, waste management and environmental sanitation. Due to synchronous
requirement and requiring large investment capital but slow recovery, the State must
bear responsibility for organizing construction investment and taking care of operating
technical infrastructure. To ensure the stability and development of the economy and
people's living environment, infrastructures must be one step ahead. Being aware of
that, in recent years cities have focused investing and upgrading infrastructures and
strengthening basic urban services.
a) For Municipalities
The Institute on State Organizational Sciences of Ministry of Home Affairs has
conducted a survey on the topic: Organization situation of providing environmental
sanitation services, supplying water, bus transportation in 5 municipalities as the table
below:85
i) Environmental hygiene:
Chart 1 113: Evaluation of waste collection by people in 5 cities
City Collected
amount, ton/
day and night
Collection rate (%) Maximum
and
minimum
charge
Supported by
State budget
(billion dong)
Urban areas Outskirt
Hanoi 6.500 95 65 900
Ho Chi Minh 6.500 90 80 1.400
Hai Phong 1.171 97 70 75
Da Nang 700 90 45 5.000đ 75
Can Tho 838 70 10.000đ 72
ii) For clean water supply:
Chart 1 114: Evaluation of clean water supply by people in 5 cities
City Rate of water
loss (%)
Rate of people supplied
clean water (%)
Maximum/mini
mum clean
water price
(thousand dong)
Supported by
the state budget
(billion dong)
Urban areas Outskirt
Hanoi 36% 97 73 4 160
Ho Chi Minh 40% 87,27
Hai Phong 25% 76 6,5/13,5
Da Nang 20% 90 45 3,7/12,2 50
16. Organize provision of environmental sanitation, water supply, bus transportation services in 5 municipalities
in 2014.

156
Can Tho 27% 71 42 6
iii) Bus service:
Chart 1 115: Evaluation of public bus service by people in 5 cities
City Number of bus
routes
Quantity of
buses
volume of
passenger
transportatio
n/day
Maximum/mini
mum bus
price(dong)
Supported by
the state budget
(billion dong)
Hanoi 84 1,145 1,1 m 3/10,000 1,084
Ho Chi Minh 150 3,208 1,57 m 3/10,000 1,400
Hai Phong 16 90 389.000 8/15,000 6
Da Nang 5 98 76.000 4/10,000 0
Can Tho 5 57 178.000 4/10,000
The data collected in three above tables shows:
- Rate of waste collection is uneven between urban areas and outskirt in which
outskirt is fairly low.
- Rate of loss, loss of revenue is too large and supply of clean water between
urban areas and outskirt is much different from each other, showing degree of
provided services should be changed
- Rate of passenger transportation service by public bus is still low even in Hanoi
and Ho Chi Minh City also, it meets only about 15% therefore, and this is one
cause of creating serious traffic congestion in these 2 cities.
For public-private partners in providing public services
On the principle of reduction in performing service by the state to transfer to private
organizations. However, through the 2 tables below on waste collection and water
supply, the role of private sector is not apparent.
i) Service of waste collection
Chart 1 116: Family’s waste collected, transported by which organization (%)
State owned
company Private company Cooperative Other Unknown
Total
responses
Da Nang 92.6 2.1 0.0 2.1 3.2 94
Can Tho 90.4 5.5 1.4 2.7 0.0 73
Ho Chi Minh 20.2 51.6 12.9 4.8 10.5 124
Hai Phong 57.5 31.7 6.7 3.3 0.8 120
Hanoi 83.5 2.9 9.7 1.0 2.9 103
All 5 cities 64.8 21.6 6.8 2.9 3.9 514

157
In most cities, urban environment limited companies have been changed into joint
stock companies but the state‟s capital still accounts for over 50% and they are units
bearing main responsibility for waste collection and treatment.
ii) For water supply service
Chart 1 117: Use domestic water from which source (%)
City Water
Supply
Company
Water Supply
Company of
other enterprise
Family drilled
well water
Other
water
source
Cooperativ
e
Total
responses
Da Nang 95.1 0.0 11.7 0.0 0.0 103
Can Tho 57.5 7.5 29.2 6.7 0.8 120
Ho Chi Minh 59.7 9.3 17.8 13.2 0.0 129
Hai Phong 48.0 15.4 22.0 3.3 14.6 123
Hanoi 89.2 2.9 19.6 0.0 5.9 102
All 5 cities 68.3 7.5 20.3 5.0 4.3 577
Water supply services are mainly undertaken by clean water companies, which are all
state-owned enterprises, operating on the basis of public enterprises, directly under the
People's Committee of cities, under the state management of Department of
Construction
b) For provincial cities, towns
Based on the current mechanism, all 3 fields of waste management, water supply and
public passenger transportation are managed by the companies directly under
province. The role of urban governments in this field is very limited, such as water
supply and provision of public transport services, it is nothing and for waste collection
it plays only supervision role. Thus, when the role of urban governments is not fully
decentralized, provision of public services to the people will be restricted.
2.8.6. Challenges of Vietnam sustainable urban governance
Sustainable urban development is the goal of Vietnam cities in the coming years.
However, to develop sustainably, it is also necessary to look at challenges objectively,
to have strategies and solutions to overcome these challenges.
a) Management of big cities in Vietnam
As predicted by many world organizations, in 2050, average rate of urban population
of the world would be 70%, but this rate would reach 83% in cities of southern
countries. Urban growth takes place mainly in developing countries (accounting for
95% of urban growth rate) 86
. For Vietnam, of which urbanization rate reaches more
than 35%, therefore, urban development will be getting stronger. Urbanization process
increases rapidly which creates opportunities for cities to develop but major
challenges posed to big cities is how to meet urban residents‟ needs for house,
infrastructure, services , employment, etc. If immigration continues to concentrate on
big cities like the last years.
86
Challenges of future cities and territorial planning - 2015

158
b) Mobilization of social resources for urban development
Urban development requires infrastructures to be developed to meet people‟s
increasing needs. However, it is not possible to rely on the State budget, it is
imperative to mobilize resources. The experience of many developing countries, is
that nearly all state budget funds are used to spend on local governments‟ activities,
specially to pay salaries to cadres, therefore, there is no longer sufficient investment
funding for only urban development. Therefore, urban governments need to find
solutions to increase local revenues such as:
- Efficient use of land in order to increase land value and generate revenue from
land tax, house tax, real estate tax
- Promotion of the model of partnership between public sector and private sector in
fields where the private sector effectively implements through bidding.
- Loans from banks and efficient use of such loans.
c) Build urban brand to create development motivation
In the past years, the Government promoted decentralization for local governments,
however, there need be a system of documents and legal tools and full regulations. On
the other hand, even if there has been a detailed system of documents and tools,
localities also need to have full means to undertake their duties at local level. Local
governments must also make appropriate public policies for their localities as well as
ensuring to find sustainable solutions. Local governments must also organize the
relationship between various factors well in their localities, based on private sector
and people to put them into decision-making process. For each city, to promote its
strengths, it is necessary to build brand and promote image to create competitiveness
such as: Hoi An is a heritage city with "Festival of full moon night," Da Nang -
Environment friendly city - city worth living, Hue - Festival city or small as Sapa
town but it leaves many impression for visitors through the specific characteristics of
H‟mong people associated with majestic natural forests and mountains. And every
city‟s government also needs to avoid " defects in urban development and pay more
attention to structure, efficiency and competitiveness in order to create a breakthrough
for sustainable urban development, etc.
One of the most important factors to ensure sustainable urban development is the
consensus of people with all the government‟s policies and regulations. Therefore,
direct contact with people is one of the basic functions, responsibility of urban
governments. Strengthening dialogue with citizens and businesses to listen, and learn
about their aspirations and needs is leading style of respecting people and will create
higher social consensus.
In 2015, our country had the Law on Organization of Local Government. The articles
12 and 13 of the law stipulate decentralization and decentralization to local
governments. This is an important innovation to strengthen the responsibility and
authority of the government at all levels. However, cities have characteristics different
from rural areas, therefore, proceeding to development of Law on Organization of
urban government like countries have conducted is also a requirement for the urban
development of our country.

159
d) Innovation of urban planning to create a flexible and effective legal
framework
Legal framework related to urban development has made significant turning point
covering the fields from urban planning, implementation of urban planning, urban
classification, and management of urban development investment to sustainable urban
development, coping with climate change; from development to upgrading poor urban
areas; from urban infrastructure to house for people with low income in cities. From
2009 to present, we have built the Urban Development Orientations Programs and
Strategies which are a legal basis for urban development. However, facing the rapid
changes of society, requirements for international integration and challenges of
climate change, require to continuously be active to improve the legal framework and
relevant policies and such policies must be associated with life practice.

160
2.9. Environmental pollution, coping with floods and natural disasters due to
climate change
A. Urban environmental pollution in Vietnam
2.9.1. Urbanization pressures on the urban environment in Vietnam
Rapid urbanization process is an important highlight in the development process of
Vietnam in past decades. Rapid urbanization, industrial development is standards to
assess the growth of a country , making the country's economic life to prosper.
Apart from socio-economic benefits, rapid urbanization creates pressure on urban
infrastructure and has significant effects on the environment and natural resources,
and ecological imbalance. For the current status of urbanization in the past time, the
quality of Vietnam cities is not proportional to city type.
Traffic infrastructure mainly use roads, and public means of transport are restricted
therefore usage and growth rate of personal means of transport is very high. In Hanoi,
there are about 5 million motorcycles and 500,000 automobiles in operation. Every
day, add 1,000 automobiles and motorcycles registered. In Ho Chi Minh City there
are about 6.8 million motorcycles, 700,000 automobiles in operation and 1,200 new
automobiles and motorcycle are added every day. In addition, a lot of old
automobiles and motorbikes without good maintenance operate87
. The clean fuel such
as E5 petrol has been just recommended to be used. Subway, overhead tram system
starts to be built therefore; air pollution in the centers of large cities, especially Hanoi
and HCMC is getting serious.
For urban waste water treatment system in 2015 there are more than 33 concentrated
wastewater treatment plants nationwide, put into operation with total design capacity
of about 850 thousand m3/ day and night and about 40 plants are under design or
construction investment with total design capacity of 1.6 million m3 / day and night.
Waste water collection reaches only about 13% of domestic waste water in cities
(based on design capacity) and less than 10% (calculated based on actual operating
capacity)88
.
For Industrial wastewater treatment, at the end of 2009, 43.3% of industrial parks in
operation have concentrated wastewater treatment systems nationwide, wastewater
treatment of many works of which does not reach the standards89
. In 2014, out of
214 industrial parks (IPs) which are operating in the whole country, 166 industrial
parks have already built concentrated wastewater treatment systems (78%), 24
Industrial Parks are building wastewater treatment systems (accounting for 12%). At
many IPs, the quality of treated wastewater does not reach QCMT and is unstable90
.
In another fact, urban development follows land expansion trend, either urban areas
develop strongly to peripheral areas or urban expansion on the basis of merger of
administrative units within the boundaries of a city/province, resulting in urbanization
of rural areas, craft villages with many environmental issues not solved which make
87Hoang Duong Tung, 2015.Air pollution in Vietnam. Is it really worrying? Environment Magazine No. 3/2015. 88
Assessment of the current status of environmental sanitation management in Vietnamese cities 89Ministry of Natural Resources and Environment, 2009. National Environment Report - Environment of
Vietnam Industrial Parks 90
Report on environmental protection No. 231/BC-CP dated 22/5/2015 sent to National Assembly Delegates by
the government.

161
existing urban environment problems to be more serious. Hanoi after expansion has
255 craft villages with 6 different types of production (mainly concentrated in former
Ha Tay province), including 59 craft villages dyeing leather goods, accounting for
23%, 43 villages of processing food -16.9%, 135 handicraft villages accounting for
approximately 53%... Daily untreated wastewater contributes to polluting the surface
water environment of Nhue River and Day river more seriously. The CTR volume of
these 255 villages (excluding CTR raising livestock and poultry) is about 90
tons/day91
.
Thus, the consequences of urbanization with industrialization is that cities have been
facing many environmental problems, especially pollution of surface water, coastal
water pollution, air pollution, noise pollution, land pollution and groundwater decline.
These issues are discussed in details below.
2.9.2. Main issues on urban environment
a) Water pollution in rivers flowing through urban areas, industrial zones and
handicraft villages
Through consultation with officials of the Ministry of Natural Resources and
Environment, the total amount of annual average surface water in Vietnam was
approximately 830 billion m3 focused mainly on the 8 major river basins, including:
River Basin of Red-Thai Binh, Bang Giang - Ky Cung, Ma, Ca, Vu Gia - Thu Bon,
Ba, Dong Nai and Mekong (Cuu Long). In which, that amount in Mekong River
Basin was approximately 57%, in Red-Thai Binh River Basin was more than 16%, in
Dong Nai River Basin was over 4%, and the rest in other river basins. At the river
basins, the pollution and degradation of water quality continued to occur in many
stages, concentrated in the middle stream and downstream (especially river sections
flowing through urban areas, industrial zones and handicraft villages), many
places were polluted seriously level, such as in Nhue - Day River basin, Cau River
basin, the basin of Dong Nai river system.
Surface water quality was mainly affected by organic matter and microorganisms;
Organic pollution was common in many watersheds. Oil pollution problems normally
only occurred in the river sections with developing waterway activities, or river
sections receiving industrial waste water of the production facilities, or river ports…
Heavy metal pollution was localized, concentrated mainly in the tributaries near
mining or manufacturing facilities. Saltwater intrusion phenomenon in the
downstream and river mouth was quite popular in recent years in the South West,
South East and Central Coast. Other parameters still reached the NTR. Water
environment in Nhue and Day rivers were heavily polluted in the sections running
through Ha Dong (Ha Noi) and without improvement over the years92
Chart 1 118: Development of BOD 5 concentration on some inner rivers of Nhue - Day River
Basin over the year Source: VEA, 2012
91Ministry of Natural Resources and Environment, 2008. Report on Natural environment – Craft village
Environment. 92 MONRE, 2013, Report on Nation Environment in 2012 – Surface environment.

162
Inner rivers of Nhue - Day River Basin: Inner Rivers were reception and leading
places of domestic and industrial wastewater for the city, so the pollution level was
serious, varying depending on time. In the period 2007-2011, the parameters were
many times exceeded NTR 08: 2008 B1, even exceeded NTR 14: 2008 (Chart 2.3).
In the period 2011-2015, water often heavily polluted and without improvement over
the years. The concentration of organic matter in the water was always several times
exceeded the NTR threshold
Chart 1 119: BOD5 in some rivers inner cities in the basin of Nhue - Day - 2007-2011
Source: VEA, 2011
Chart 1 120: COD in some rivers in the basin of Nhue Day - 2006-2011
Source: VEA, 2011
Chart 1 121. COD in some rivers inner Hanoi - 2011 - 2015 Source: CEM, VEA, September 2015

163
Middle stream of Cau River from Thai Nguyen City to the end of Thai Nguyen
Province: Middle stream is the region with high development level and diverse
economic activities of various types and lines. According to statistics, this river
section has been received a large amount of waste water from industrial and
agricultural activities, daily life and services, therefore, water quality declined much
(Thai Nguyen province used about 300 million m3 / year for industrial activities)
Chart 1 122. NH4+ concentration in section flowing through Thai Nguyen
Source: VEA, 2012
In many places, in the dry season months, when less water upstream, there were
many indicators not reaching source grade B, the aquatic products currently are
barely habitable. In general, most of the monitored parameters of this section were
not reached NTR-A1, a number of places such as Cau Ta Vuon, parameter value of
NH4+ was exceeded NTR-B1. However, parameter concentration tended to decrease
over the years. Cau river water in the middle stream is generally not used for living.
Dong Nai River middle stream and downstream: has been received wastewater from
industrial and agricultural activities, living and aquaculture. Therefore, water quality
declined compared to upstream. For section flowing through Bien Hoa City and Binh
Duong Province, the water quality has not improved. Pollution problems are mainly
due to the increase exceeding NTR of the concentration of TSS, nutrients, organic
matter and microorganisms. In 2013 and 2014, the water quality has improved,
however, by 2015, some areas showed signs of re-polluted.
Chart 1 123. Development of COD concentration in Dong Nai River, period 2011 - 2015
Source: Environmental Monitoring Center, VEA, 2015

164
Saigon River water quality in recent years has tended to decline and the level of
pollution in the river expanded to upstream compared to the previous year. In some
positions, pollution parameters were always high such as An Loc bridge, An Ha
bridge and Y bridge.
Chart 1 124: Development of BOD5 concentration in Sai Gon River over the years
Source: National Environmental Monitoring Station (ĐL3), 2007-2011; Environmental Monitoring Centre-
VEA, 2007-2011, Local DoNRE, 2007-2011
Mekong Delta River water quality is relatively good, the pollution only takes place
in some particular areas. The locations with high concentration of pollutants are
concentrated in areas close to urban centers, agricultural areas and dense aquaculture
as Tien River upstream. Besides, the factories, aquatic product production and
processing facilities and farms almost have no sewage system or ineffective
processing system. Waste from waterway transport also contributes to impacts on
water quality.
The small rivers, canals in infield area have higher pollution level compared to main
streams, because self-cleaning capability on these streams is smaller. Due to the

165
large amount of water received from the Mekong River to help dilute pollutants,
especially in the flood season, the water quality of the mainstream in the Mekong
Delta only has local signs of pollution in concentrated agricultural and industrial
production areas.
b) Water pollution of inner-city lakes and canals
Inner-city lakes and canals in urban areas special grade t
In 2006-2010, the water in most of the lakes and canals was organically polluted. In
Hanoi, in the inner-city lakes monitored, only West Lake remained relatively clean
with most of the parameters achieving NTR 08: 2008/BTNMT grade B1 and it was
the only lake in Hanoi with self-cleaning capability. The remaining inner-city lakes
were polluted organically, parameter values were beyond NTR 08:2008/BTNMT
grade B2 (Chart 8, 9). In Ho Chi Minh City, the water quality in the canals in the inner
city in HCMC was at alarming level. The canals were sources receiving untreated
even preliminary wastewater from industrial zones, businesses and residential areas.
The monitoring values show high level of nutrient pollution concentrated in the
channel of Tham Luong - Vam Thuat and Tan Hoa - Lo Gom.
Chart 1 125: Development of BOD5 concentration in lakes over the years
Sources: Hanoi Department of Natural Resources and Environment; Centre for Science and Environmental
Engineering; VEA, 2011
Chart 1 126: Development of COD concentration in lakes over the years
Sources: Hanoi Department of Natural Resources and Environment; Centre for Science and Environmental
Engineering; VEA, 2011

166
Chart 1 127. Development of COD concentration in inner city canal water in Ho Chi Minh
City
Sources: HCM Department of Natural Resources and Environment, 2007-2011
In 2011-2015, by efforts to improve the quality of inner-city canals, ditches
and lakes within the Ho Chi Minh City and Hanoi City, the water quality has been
improved. Box 1 5. Results of testing program of lake water pollution treatment in Hanoi city Some lakes polluted during 2006-2010 were improved water quality after successful testing process and
delivered 11 lakes for management by Hanoi Sewerage and Drainage Limited Company including: Ngoc
Khanh, Xa Dan, Quynh, Hai Ba Trung, Kim Lien, Van Quan, Vo, Den Lu, Thanh Nhan 1, Thanh Nhan 2B
and Truc Bach. In 2011-2015, Linh Dam and Yen So Lakes were completed the renovation; the water
quality was improved significantly. For some remaining lakes such as Ba Mau, Bay Mau, Thu Le, Giang Vo,
Thanh Cong, water quality has improved compared to the previous period but organic matter concentration
still exceeded NTR.
Source: Hanoi Department of Natural Resources and Environment, 2015
Inner-city lakes and canals in some urban areas in the Central
In the period 2007-2011, the inner-city lakes in Vinh, Hue, Quy Nhon were organic
pollution and eutrophication, water quality exceeded NTR 08: 2008 grade B1. Bau
Tram Lake in Danang, Phu Hoa Lake and Bau Sen Lake in Binh Dinh had water
quality approximately reaching NTR 08: 2008 grade B2.
The irrigation lakes (Phu Ninh in Quang Nam) and natural lakes (Phu Hoa Lake, Thi
Nai Lagoon - Binh Dinh, Cam Ranh Lake - Khanh Hoa) had large water area; water
quality is good with most parameters meeting the surface standard grade A1 or A2
NTR 08: 2008.
Chart 1 128. Development of BOD5 concentration in lakes in the Central over the years
Source: Centre for Environmental Monitoring, National Environmental Monitoring Station (ĐL 1); Department
of Natural Resources and Environment of Binh Dinh, Khanh Hoa, 2011.
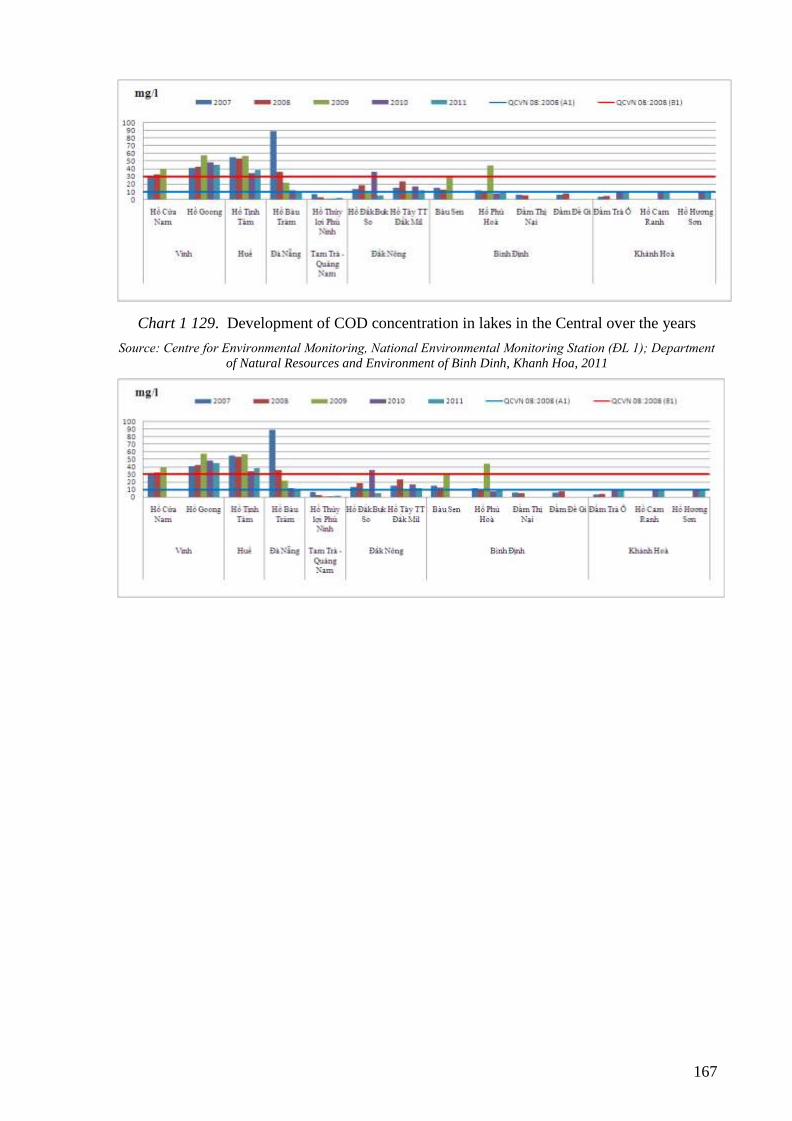
167
Chart 1 129. Development of COD concentration in lakes in the Central over the years
Source: Centre for Environmental Monitoring, National Environmental Monitoring Station (ĐL 1); Department
of Natural Resources and Environment of Binh Dinh, Khanh Hoa, 2011

168
Chart 1 130. Development of TSS concentration in lakes in the Central over the years
Source: Centre for Environmental Monitoring, National Environmental Monitoring Station (ĐL 1); Department
of Natural Resources and Environment of Binh Dinh, Khanh Hoa, 2011
Inner-city lakes and canals in some urban areas in the Northern
In the period 2011-2015, the water pollution in the inner-city lakes and canals was
still an emerging issue in some provinces and cities. Most parameters characterizing
pollution of organic matter (BOD5, COD), nutrients (Ammonium) exceeded
maximum allowable limits for water source grade B1. The main reason is because
these areas must receive a large amount of urban waste water untreated or treated
unsatisfactorily
Chart 1 131. COD process in some river 2011 – 2015
Source: DONRE of Nam Dinh, Ninh Bình; Center of Environmental and surveys, TCMT, 2015
The natural lake, Lake hydropower, irrigation reservoir in the North
Natural lakes and hydropower reservoirs and irrigation reservoirs in the north
are varied as estimated of more than 900 large and small lakes. Most of the lakes in
the north are the reservoirs, irrigation schemes or multi-purpose projects (reservoirs,
irrigation, hydropower...). Basically, the system of natural lakes where water quality
assurance, can be used very good for living. Environmental quality of water in
reservoirs, irrigation schemes or multi-purpose projects still basically meet the needs

169
of water used in daily life, however, the environmental quality of some lake water at a
certain number of times (especially after the rains flood) is not guaranteed to meet
QCVN (Vietnam Standard) type A1.
Chart 1 132. BOD5 and COD concentration in some lakes in Lai Chau in 2011
Source: Lai Chau DoNREs, 2011
Chart 1 133. Development of BOD5 and COD concentration in Nui Coc Lake (Thai Nguyen)
Source: VEA, 2011
c) Local pollution of underground water Depending on the geographic region that groundwater quality also differs. Most
groundwater sources in our country have a relatively good quality. Water with a pH ranging
from 6.0 to 8.0, soft water (hardness <1.5 mgdl/L), concentration of organic matter and small
microorganisms, most heavy metals have concentration smaller than NTR. The majority of
chemical compositions of groundwater in the rainy season have concentration lower than in
the dry season. However, the phenomenon of local pollution of groundwater has been
happening in some areas of the country. In each region, the pollution levels are different, in
which the northern delta has pollution level of groundwater higher than other regions. Central
Highlands and South Central Coast are regions with quite good groundwater quality.
Groundwater pollution is mainly due to the parameters of TDS, ammonium, heavy metals

170
(Mn, As, Cd, Pb) and saltwater intrusion. TDS concentration is higher than the NTR limit in
most regions, except for Central Highlands, in which the South is the region with the highest
value in the country (Chart 9.17). Ammonium concentration in groundwater recorded
the highest value was many times exceeded the NTR limit at some places some
regions of the country, in which the highest value was in North Delta (Chart 9.18 and
Chart 9.19). Particularly the Central Highlands did not record Ammonium pollution
phenomenon in groundwater. Most of the parameters of heavy metals in groundwater
in areas had the concentration smaller than NTR limit. However, the parameters of Fe,
Mn, As, Pb, Cd were detected in some groundwater monitoring points had the
concentration higher than the NTR threshold (Chart 9.20 and Chart 9.21). North
Delta is a region with high as concentration in groundwater due to the regional
geological structure. In addition, the Fe concentration higher NTR threshold also been
recorded in Cam Thach Commune, Cam Xuyen District, Thanh Hoa and Pham Van
Coi Commune, Cu Chi, Ho Chi Minh City. In the south, the Cd concentration was
higher than NTR threshold in Tan Tuc Town, Binh Chanh District, and Ho Chi Minh
City93.
Chart 1 134. Highest TDS concentration recorded in some areas in 2013
Source: National Center for Water Resources Planning and Investigation, 2013
Chart 1 135. Highest Ammonium concentration recorded in some areas in 2013
Source: National Center for Water Resources Planning and Investigation, 2013
93 Center of Planning and National water resources, 2013

171
Chart 1 136. Ammonium concentration in groundwater in some areas in 2011-2015 Sources: Department of Natural Resources and Environment of Quang Ninh, Thai Binh, Nam Dinh, Ninh
Binh, Quang Binh and Dong Nai, 2015
Chart 1 137. Fe concentration in groundwater in some areas, period 2011-2015 Sources: Department of Natural Resources and Environment of the provinces of Hoa Binh, Thai Binh, Nam
Dinh, Ninh Binh, Quang Binh and Vinh Long, 2015
Chart 1 138. Highest Mn concentration recorded in some areas in 2013
Source: National Center for Water Resources Planning and Investigation, 2013

172
Box 1 6. Arsenic pollution in groundwater According to survey results from nearly 323 thousand samples analyzed in 6938 communes in 660
districts of 63 provinces and cities across the country, there were 12.5% of the samples with arsenic
concentration from 0.05 mg/L or higher, the highest percentage was in Red River Delta (18.7%), and the
lowest percentage was in Northwest (0.1%). 1,385 communes of 54 provinces (accounting for 12.5%) were
detected at least one sample with arsenic concentration from 0.05 mg/L or higher. However, in areas where
the pollution detected, most people did not use directly water source, so the rate of using polluted water
source for domestic purposes was low.
Source: Water Resource Management Department, Ministry of Natural Resources and Environment, 11/2014
The phenomenon of salinized groundwater has been recorded in some regions of the
country, in which 3 regions with high risk of salinization were: the central coastal
provinces, Dong Nai River downstream and the provinces in MD coast. Box 1 7. Current status of groundwater salinized in some provinces
In Tra Vinh, chloride results recorded were higher than NTR limit and tended to increase over the years
from 251 mg/L to 287 mg/L. Groundwater sources had signs of salivation.
In Kien Giang Province, measured chloride concentration ranged from 58.49 to 5956 mg/L, in which 8/10
points exceeded NTR threshold. The maximum value measured in Chau Thanh District exceeded NTR by
3.66 times.
In Vinh Long Province, the average chloride concentration over the years ranged from 65.41 -
693,92mg/L. Most of the groundwater monitoring samples had chloride concentration exceeding NTR
threshold, concentrated in most districts, towns and cities in the province. Particularly, Long Ho District
had no signs of salination.
Sources: Department of Natural Resources and Environment of Tra Vinh, Kien Giang and Vinh Long, 2015
provincial cities
d) Coastal water pollution in urban areas
Coastal water quality in Vietnam was still pretty good for most concentration
of specific parameters for sea water quality within the limits allowed by NTR 10:
2008. However, due to the impact from the estuary and the receiving waste of coastal
economic development activities, some waters had high TSS concentration. Besides,
pollution by organic matter and grease was also the issue of concern for Vietnam
coastal water quality in recent years.
TSS concentration in coastal water was mainly affected by the sediment of
rivers, in which the coastal regions in the north often had high TSS concentration
exceeding NTR. Central coast had low TSS concentration. However, Tho Quang
dock (Da Nang) tended to increase TSS concentration due to receiving wastewater
from the fish landing area and operation of ships. Southern coastal areas had TSS
concentration decreasing in recent years.
Chart 1 139. Development of average TSS concentration in coastal water in some

173
coastal areas, period 2011 -2015 Source: Environmental Monitoring Center, VEA,
2015
Pollution by organic matter in coastal water has been fairly common in the
coastal provinces of Vietnam. The concentration of monitoring parameters such as
COD, NH4+ in the period 2011-2015 in most of the areas has exceeded NTR
threshold, especially in the Northern Sea. Tho Quang dock (Da Nang) was one of the
hot spots of pollution in the sea water in recent years. The level of organic pollution
in northern coastal areas was higher than in the central and the south, however,
tended to decrease.
Chart 1 140. Development of average COD concentration in coastal water in some
coastal areas, period 2011 -2015
Source: Environmental Monitoring Center, VEA, 2015
Box 1 8. Red tide phenomenon occurred in south central coast At the beaches along Khanh Hoa, Ninh Thuan, Binh Thuan, the red tide phenomenon appeared, and
caused serious consequences to biological resources and the environment.
It is caused by the development process of tourism, urbanization, agriculture, industry... bringing redundant
organic waste and nutrients in the water (eutrophication). Also, aquatic breed production and fish and lobster
cage culture discharged significantly nutrients, creating favorable conditions for algae growth.
Source: General VEA, 2015
Mineral oil concentration in seawater tending to increase in seaports was common
issues. Most of the seaports had mineral oil concentration exceeding NTR threshold.

174
Box 1 9. Mineral oil pollution in coastal areas of Ha Long Bay Cua Luc Bay Area - Bai Chay Bridge: oil concentration tended to increase during the 2011-2015 period,
reaching value from 0.012 mg/L to 0.826 mg/L, compared with standards of 0.2 mg/L.
The coastal area of Ha Long 1 market and coastal areas of column 5 and column 8 (Ha Long): Although
mineral oil concentration tended to fall in 2013 and 2014, it still exceeded the threshold allowed in all
monitoring phases.
Cua Van Fishing Village and Stream between Ha Long Bay - Hon 1 are located in the core zone of the World
Heritage Site of Ha Long Bay, the monitoring results in the last 5 years showed that oil concentration was not
detected or very low. However, according to the NTR 10: 2008/BTNMT, applied to aquatic conservation
areas, requirements for mineral oil were not found, therefore, mineral oil figures although at low level, it was
also considered pollution warning for this area.
Source: Centre for Monitoring and Environmental Analysis of Quang Ninh, 2015
In the period 2011-2015, Cyanide concentration in coastal water in the Central
tended to increase in 2012 and declined in recent years on reaching NTR threshold.
In the South, in 2015, Cyanide concentration was also discovered in seawater at low
level, and it was required further monitoring in the future.
e) Air and noise pollution
In the period 2011 - 2015, in urban areas of special grade and grade I, II, where
the activities of socio-economic development going strong, the air quality is not much
improved compared to the period 2006 - 2010. Urban areas like Hanoi or urban areas
with strong industrial activity like Viet Tri (Phu Tho), dust pollution tended to remain
at high level, especially in the areas close to the main traffic routes.
Results of air quality assessment through air quality indicator AQI 94
showed
that, in these urban areas, the number of days with poor (AQI = 101 ÷200) and weak
(AQI = 201 ÷ 300) AQI accounted for a sizeable proportion. Typically, in the Hanoi
capital, the number of days in 2014 with poor AQI accounted at less than 50% of the
total number of monitoring days in the year, even there were days with the air quality
day declining to weak and dangerous threshold (AQI> 300).
Chart 1 141. Development of air quality indicator AQI in 5 automatic and continuous
monitoring stations, period 2011-2015 Source: VEA, 2015
94 Indicator of air quality assessment AQI is calculated according to Decision No. 878/QD-VEA dated
01/07/2011 of the VEA on the issuance of the calculation manual of air quality indicator, is represented through
the scales:
AQI value Air quality Health effect Color
0 – 50 Good Do not affect to human health Green
51 – 100 Medium Sensitive groups should limit the time outside Yellow
101 – 200 Poor Sensitive groups should limit the time outside Orange
201 – 300 Weak Sensitive groups avoid the time outside.
Others limit the time outside
Red
Over 300 Dangerous People should stay indoors Brown
Note: Sensitive Groups include: children, the elders and people with respiratory diseases

175
Note: In 2015 - data updated until September 2015
Dust Through reviewing monitoring data and analyzing air environment quality of urban
areas in 2011-2015, it was found that dust pollution continued to be a growing
problem. The statistics showed that the number of days with AQI value that did not
guarantee recommended safety thresholds for public health due to the dust
concentration PM10 exceeding NTR still accounted for a large proportion. Urban
areas in the North had the much higher proportion of days polluted PM10 and
PM2,5 than other areas. Dust concentration also changed over the months of the year,
according to seasonal changes; this was clearly shown in the North. Monitoring data
at the Nguyen Van Cu station (Hanoi) showed that, dust pollution (especially fine
dust) often concentrates in the months of winter with little rain (November to March).
Unlike the northern areas, the South Central areas is located in the tropical monsoon
climate with stable temperature, less volatile all year round, so the difference in the
dust concentration PM measured between months is not clear. The data measured in
Da Nang and Nha Trang City showed the stability in the concentration of dust PM1-
PM2,5-PM10 between dry and rainy seasons. For localities in the south, the climate
in the year divided by season. The concentration of dust PM (PM10, PM2,5) had
significant differences between the two seasons, the rainy season (May to November)
and the dry season (December to April in the next year). Accordingly, the
concentration of dust in the air recorded in Dong Khoi station, Bien Hoa city, Dong
Nai province was generally higher in the dry season and lower in the rainy season.
The development of dust concentration in the air also changed daily and most evident
in areas near traffic routes. The dust concentration increased on the rush hours, and
decreased to the lowest at noon and night. Also in the construction sites (apartment
buildings, new urban areas, road repair, high ways construction ...), local dust
pollution continued taking place. The main reason was due to the lax implementation
of regulations on environmental protection and not proper attention in monitoring and
implementation activities. In residential areas, the dust concentration in the air was generally lower than
the in road sides and construction sites. However, the residential areas located in the
urban were influenced by activities of transport, industry. Therefore, in most
monitoring points, the pollution level TSP was still many times exceeded the NTR
05: 2013 / BTNMT allowed. The development over the years showed that, in 2011
and 2013, dust pollution was quite heavy in many areas. In 2012, pollution level

176
decreased significantly and in recent years (2014, 2015), the dust concentration in the
air continued tending to decrease. Except for the above-mentioned areas, in urban
areas in the mountainous provinces, urban areas with average socio-economic
development activities, the atmosphere was quite fresh. The dust concentration in the
air was mostly under the standard allowed.
Other gases of NO2, SO2, CO and Benzene
In urban areas, the sources for the gases of NO2, CO and benzene are mainly
from transport activities, SO2 emitted from burning coal and oil containing sulfur
(bus). These gases, if exceeding NTR, have adverse effects on human health. NO2
gas concentration in the atmosphere in some urban areas special grade and grade I
exceeded the allowed limit, such as Hanoi, Ho Chi Minh City and Ha Long. The
cause of this situation is that Hanoi and Ho Chi Minh City activities are affected by
traffic, industry from the areas; air quality in Ha Long City is greatly affected by coal
mining and thermal power.
The concentration of NOx 95
changing in the day in urban areas is similar to
dust parameter, increasing on rush hours (07:00 - 09:00, 18:00 - 19:00).
In urban areas, especially in the areas of traffic activities at high frequency,
the occurrence of benzene in the atmosphere shows that emission source of organic
compounds can be from vehicle emissions. In some localities such as Ha Noi, Dong
Nai, the concentration of benzene in the air monitored in the period 2011 - 2014
exceeded NTR.
Chart 1 142. NO2 and Benzen surveyed in Hanoi through the years
Năm 2011 2012 2013 2014
Parameter NO2 Benzen NO2 Benzen
NO2 Benzen NO2 Benzen
Over Vietnam standard
QCVN
56
56
56
57
55
57
19
30
Total observed points
57
57
57
57
57
57
30
30
Rate (%) 98 98 98 100 96 100 63 100
Source: Hanoi Centre for Monitoring of environmental resources, 2015.
For other gases such as SO2, CO..., they mostly remained within the limit
allowed by technical regulations.
Noise
In urban areas, the source of noise pollution is mainly caused by traffic
activities, so large noise level is normally on the main traffic routes. Noise threshold
measured in the main streets in 02 urban areas special grade and urban areas grade I
and II in Vietnam is mostly approximate or exceeded the threshold allowed by NTR
26: 2010/BTNMT prescribed for 14-hour frame from 6:00 to 21:00 (70 dBA). For
urban areas grade III, IV and V, the noise level measured at the roads in most urban
areas also changes similarly while the results do not guarantee allowed limit. For
measuring points in residential areas, noise level generally is still within the threshold
95 NOx is is mixed NO - NO2, showing the pollution level of them.

177
allowed by NTR 26: 2010/BTNMT.
g) Urban soil pollution
Soil pollution due to pollutants from industrial, construction and living
activities Soil environment is affected by pollutants from industrial, construction and
living activities. This is most evident in the outskirts of big cities like Hanoi City, Ho
Chi Minh City or concentrated areas of industrial production, mining, such as Thai
Nguyen, Dong Nai, ... The soil in the areas affected by the waste from industrial,
construction and living activities is facing heavy metal pollution increasingly. There
are two reasons: (i) Waste of industrial and residential areas; (ii) and waste of the craft
villages are untreated or treated unsatisfactorily and discharged directly into the
environment.
Box 1 10. Soil pollution around some industrial zones in Dong Nai
In the surroundings of solid waste landfill of Trang Dai Ward (Bien Hoa City), waste disposal a rea of
Vinh Tan Commune (Vinh Cuu District) and waste disposal area Tuc Trung Commune (Dinh Quan
District), the arsenic in soil exceeded norms by 1.05 times, 4.12 times and 1.27 times higher than allowed
respectively. Particularly in the surroundings of waste treatment area in Quang Trung, copper
concentration exceeded by 1.5 times; chromium and nitrogen concentration in soil was high, from 135 -
375mg/kg. The results of environmental monitoring of land at receiving locations of the waste sources of
Ho Nai Industrial Zone, Bien Hoa 1 Industrial Zone showed that the targets of heavy metals were many
times exceeded the standard allowed.
Source: Centre for Environmental Monitoring in Dong Nai, 2013
Chart 1 143. Cu concentrations in soil in some suburban areas in the North Source: Northern Soil Monitoring & Environmental Analysis Station, Institute of Agricultural Environment,
2014
Soil pollution by persistent toxic chemicals
Dioxin-contaminated areas are mainly concentrated in the south of Vietnam, and
are divided into two areas contaminated: the sprayed areas (about 2.63 million hectares,
distributed throughout the South) and the military airports. It is estimated that about
15% of the total soil area of the South also remain affected in different level from the
toxic substances used in the war, in which the area sprayed with the active substances

178
2,4,5-Tc accounts for 9.7% of total area. At some airports previously storing,
transporting toxic chemical / dioxin, the dioxin content in soil can be up to 365,000 ppt
TEQ in some places (Ministry of Natural Resources and Environment, 2015).
Box 1 11. Three hotspots of dioxin in some urban areas in the South of Vietnam
At Bien Hoa airport, the contaminated area is wide and scattered at the northern and southwest positions
of the airport. In which, the most notable location is the 5 areas with high dioxin content of above 1,000
ppt TEQ (standard of soil to be treated of Vietnam) with a total area contaminated of up to 163,000 m2
.
At Da Nang airport, 3 areas were discovered to have dioxin content in soil exceeding 1,000 ppt TEQ. The
areas are located in the north of the airport and have a total area of up to 88,000 m2. These are areas that need
to be handled thoroughly pollution because they are in Da Nang City and close to residential areas.
At Phu Cat airport, contaminated solid is only around 4000 m2 and concentrates at only one spot in the
airport.
Source: Office of the PSC 33, Ministry of Natural Resources and Environment, 2015
h) Decline in water level in urban areas
In the last decades, under the influence of natural factors and human, the
groundwater had quite strong fluctuations. Because of unreasonable exploitation and
use, groundwater resources have tended to decline in water level. Typically, the
northern delta and southern region, the water level of Pleistocene aquifer tended to
decrease in some regions with strong water exploitation. In North Delta, the risk of
decline in water level has been warned in the provinces of Vinh Phuc (Vinh Yen),
Hanoi City (Mai Dich, Trung Tu - Dong Da), Hai Duong (Thanh Mien Town), Thai
Binh (An Bai - Quynh Phu) and Nam Dinh (Truc Phu - Truc Ninh) (Figure 1). In the
South, the risk of decline in water level has been warned in Ho Chi Minh City
(District 12), Soc Trang Province (Soc Trang City) and Ca Mau (Nam Can District)
(Figure 2).
Box 1 12. Decline in groundwater level in Hanoi The results of monitoring the groundwater level from 1992 to present showed that in Hanoi, there was
hopper lowering water level formed with the center coinciding with the center area of Hanoi City.
Annual average lowering speed of water level in the aquifer for exploitation is in the range of 0.08 -
0,91m/ year, averaging 0.3 m/ year. This causes degradation of water resources leading to decline in
performance and catches, increasing pollution and ground subsidence.
Source: Department of Water Resources Management, Northern and Southern Federation of Water
Resources Planning and Investigation, 2013
Figure 1 13. Locations warned about decline in water level in the northern delta in first 6
months of 2013
Source: National Center for Water Resources Planning and Investigation,
Ministry of Natural Resources and Environment, 2013

179
Figure 1 14. Locations warned about decline in water level in the South
Source: National Center for Water Resources Planning and Investigation, Ministry
of Natural Resources and Environment, 2012

180
i) Unforeseen losses due to pollution, incidents and environmental disasters
Pollution, accidents and environmental disasters in Vietnam in general and
Vietnam‟s cities in particular have been having serious impact on public health,
causing huge economic losses such as increase in burden of illness, damages to
agriculture, forestry and fisheries and tourism, environmental improvement costs and
causing environmental conflicts. Some evidence is shown below and in interpretation
Box.
Box 1 13. Tourists and craft village tourism in Hanoi After expansion, Hanoi becomes a city with the most craft villages nationwide. Famous craft villages have been
known by local and foreign visitors and become craft village tourism spots attracting visitors such Bat Trang
pottery (Gia Lam), Van Phuc silk (Ha Dong), Quat Dong embroidery (Thuong Tin), Phu Nghia rattan, bamboo
weaving (Chuong My), etc.
Foreign visitors like discovering and learning about traditional craft villages, therefore, travel companies often
incorporate program for visiting craft villages into their tour journey design to make an impression on foreign
visitors. But, sadly, at the end of each craft village trip, when being asked , majority of foreign tourists say that
they will not return. One of the reasons why craft villages tourism development cannot be promoted is
environmental pollution in craft villages. Pollution makes tourists going to the craft villages once not to want to
go back there even if you find something interesting.
Source:VEA,2015
Box 1 14. People put up a tent to protest landfill construction
According to Division of Natural Resources and Environment of Trieu Son District (Thanh Hoa), sanitary
domestic waste landfill project for Trieu Son Town and surrounding communes at Moc hill was approved
investment on 28 April 2014 by the Thanh Hoa People‟s Committee. This project is built on area of
45,650m2,with total investment of more than 28.5 billion VND acted as investor by Trieu Son District
People‟s Committee with capacity of treating waste of 4,000ton/year.
However, due to worried about the fact that the landfill will affect health, living activities of the nearest
residential area less than 200m from the landfill. Primary school, Secondary school of Dan Luc Commune
is about more than 300m from there, the people of Dan Luc Commune (Thanh Hoa) go to Moc Hill to put
up tents to protest and prevent the contractor from construction
Source: VEA, 2015
General Report on overview on Health Industry in 2014 has pointed out the factors
affecting public health, including increase in risks from air pollution, water pollution
and food, pollution caused by waste ... Diseases caused mainly by environmental
contamination include diarrhea, lower respiratory infections, malaria, accidents and
injuries96
. As statistics in the past 4 years, the whole country has 6 million cases
related to lack of clean water. The estimated direct cost for examination and
treatment of cholera, typhoid, dysentery and malaria for health industry is about 400
billion dong, equivalent to around US $20 million 97
. In Vietnam, according to
incomplete statistical data, in the past years, the number of patients suffering from
diseases related to air pollution is increasing. The number of children hospitalized for
asthma, respiratory infections, cough at some hospitals in Hanoi and HCMC
increases many times. As predicted by medical experts, the number of cancer cases,
96
Public health sanitation of HCMC ,2015 97
Information at Conference of strengthening inter-industry coordination and international cooperation in
controlling drinking water domestic water quality on 25 March 2015 in Hanoi

181
including lung cancer in Vietnam will increase rapidly in the next 5 years98
.
Environmental pollution caused by industrial activity and craft villages is also the
cause of appearance of cancer villages in Vietnam: Thach Khe village, Thach Son
Commune, Lam thao District, Phu Tho province, Thong Nhat Village, Dong Lo
Commune, Ung Hoa District, Hanoi City, Lung Vy Village, Dong Phung Yen
Commune, Chuong My District, Hanoi City, etc.
Due to the incident / disaster of mass fish mortalities in four central provinces
in April 2016, Ha Tinh Formosa will compensate total US $500 million
(approximately 11,500 billion dong) 99
for economic losses for fishermen and marine
environment treatment. Due to polluting water of Thi Vai River, Vedan compensates
220 billion dong for economic losses for fishermen in Dong Nai, Ba Ria - Vung Tau
and HCMC100
.
In recent years, the Government has invested about US $ 500 million per year
in solving the problems related to environmental sanitation. However, for the field of
urban wastewater treatment alone, it is planned from now to 2025, Vietnam needs to
invest about US $ 8.3 billion101
2.9.3. Policy and organization of management urban environmental protection
a) Urban environmental protection policy
It can be said that the contents of current urban environmental protection
policies are included in the content of the State policy on environmental protection,
stipulated in Article 5 of the 2014 Law on Environmental Protection. The urban
environmental protection policy is expressed specifically as a set of relevant political
decisions of the Party and State on the environment in general and urban environment
in particular. 30 years after our country entered the period of economic renovation,
starting in 1986, environmental protection policies and urban environmental
protection policies have continuously been made, developed and implemented. It is
expressed by promulgation of many National Resolutions and Directives for
environmental protection policies, including urban environmental protection policies,
of which it is imperative to mention Directive No. 36/CT/TW by the Politburo in 1998
on "Strengthening environmental protection in the industrialization and modernization
period of the country"; Resolution No. 41. NQ/TW dated 15 November 2004 by the
Politburo on environmental protection in the period of accelerating industrialization
and modernization of the country; Directive 29-CT/TW dated 21 January 2009 by of
the Secretariat on continuing to promote implementation of Resolution No. 41-
NQ/TW by the IXth Politburo "On environmental protection in the period of
accelerating industrialization and modernization of the country"; and especially
Resolution No. 24-NQW dated 03/06/2013 by the Xith Central Committee of the
Communist Party of Vietnam at the 7th Conference on "Actively responding to
climate change, strengthening management of natural resources and environmental
protection “reflecting comprehensively views, guidelines and policies on
environmental protection activities including urban environmental protection.
98
Hoang Duong Tung, 2016. Is air pollution in Vietnam really worriying? Environment megazine No. 3/2016. 99
http://www.vtc.vn/toan-van-thong-bao-cua-chinh-phu-ve-ca-chet-hang-loat-o-mien-trung-d264363.html 100
http://www.baomoi.com/thiet-hai-do-o-nhiem-tren-song-thi-vai-chu-yeu-la-do-vedan-gay-ra/c/3593106.epi 101
Report“Assessment of urban wastewater management in Vietnam ”,WB,2014

182
In addition to general orientation policies, multi national strategies, programs
towards environmental protection have also been issued, including the 1991 - 2000
National Action Plan on Environment and Sustainable Development; National
environmental protection strategy till 2010 and orientation to 2020; National Strategy
for Environmental Protection until 2020 and vision to 2030; 2011 – 2020 Strategy on
socio-economic development; National Strategy on Green Growth; National strategy
on general management of CTR to 2025 and vision to 2050; National strategy on
biodiversity by 2020, vision to 2030; Resolution No. 35/NQ-CP dated 18/03/2013 by
the Government on some urgent issues in the field of environmental protection and
many other specialized programs, strategies and plans.
Especially, urban environmental protection is stipulated more and more strictly
in the system of different laws, most significantly, laws of natural resources and
environment industry and construction industry, which are the 1993, 2005 and 2015
Environmental Protection Laws, the 2003 and 2014 Construction Laws and the 2009
urban planning law. Specifically, in the 1993 environmental protection law, Article 15
stipulates "Organizations and individuals must protect water, water supply and
drainage systems, green space, sanitation works, implement regulations on public
sanitation in cities and rural areas, residential areas, tourist areas and production
areas", and the 2005 Law on environmental protection has Chapter VI (including 5
Articles from Article 50 to Article 54) on urban, residential area environmental
protection, and now, the 2014 Law on environmental protection has Chapter VIII
(including 5 Articles from Article 80 to Article 84) on urban, residential area
environmental protection. The 2003 Construction Law requires design of construction
works to be ensured the requirements for environmental protection (Article 52),
ensured environmental hygiene in construction and to compensate for damages if
violate hygiene environment and comply with other provisions of the law on
environmental protection (Article 79) . The 2014 law on construction provides
construction planning for specific functional areas (EZ; IZ, EPZ, HTZ, tourism areas;
ecological zones, protected areas, historic-cultural- revolutionary relics, research area,
training area, exercise and sport area, airports, seaports, technical infrastructure focal
point area and other specific functional area) to be carried out strategic environmental
assessment (Articles 26, 27, 28); Construction investment projects must meet
environmental protection requirements, responding to climate change, and ensure
environmental protection requirements in granting construction licenses and adjusting
construction licenses for the works in cities and separate houses, protect environment
during construction and compensate for damages caused by violations of
environmental protection (Articles 54, 79, 91, 98). The 2009 Law on Urban Planning
provides implementation of strategic environmental assessment (SEA) for the types of
urban planning including general planning, zoning planning, detailed planning and
infrastructure planning; and specific requirements for the content and SEA appraisal
for urban planning.
Current urban environment protection policies are oriented in the basic contents
identified in the above laws and some laws on resource protection (Law on Water
Resources, Biodiversity Law, Law on Forest protection and Development, Law on Sea
and Islands Environment, etc.) and legal documents under these laws issued by the
state management agencies at all levels (decrees, decisions, circulars, etc.). Many Sub-
law documents being in force have effect of preventing and mitigating adverse

183
impacts on urban environment. Some examples which can be mentioned are: 1-Decree
No. 18/2015/ND-CP dated 14 February 2015 on environmental protection planning,
strategic environmental assessment, environmental impact assessment; 2-Circular No.
27/2015/TT-BTNTM by the Minister of Natural Resources and Environment dated 29
May 2015 on strategic environmental assessment, environmental impact assessment
and environmental protection plan; 3-Circular No. 01/2011/TT-BXD dated 27 January
2011 guiding for strategic environmental assessment in urban construction planning
projects; 4-Circular No. 26/2015/TT-BTNTM by the Minister of Natural Resources
and Environment dated 28 May 2015 stipulating detailed environmental protection
projects, simple environmental protection projects; 5-Decree No. 80/2014/ND-CP
dated 06/8/2014 by the Government on water drainage and wastewater treatment; 6-
Decree No. 38/2015/ND-CP dated 24/04/2015 stipulating management of waste and
waste; 7-Decision No. 73/2014/QD-TTg by the Prime Minister providing list of scraps
allowed to be imported from overseas for use as production raw materials; 8-Decision
No. 16/2015/QD-TTg by the Prime Minister dated 22 May 2015 stipulating recovery,
treatment of waste products; 9-Circular No. 36/2015/TT-BTNMT dated June 30, 2015
by the Minister of Natural Resources and Environment stipulating hazardous waste
management; 10- Circular No. 41/2015/TT-BTNMT dated 9 September 2015 by the
Minister of Natural Resources and Environment on environmental protection in
import of scrap for use as raw production materials, etc.
Besides, urban environmental protection policies are also constantly built,
developed aiming at solving environmental problems caused by some main pollutants
in cities such as traffic and industry.
For urban environmental protection policies related to industrial activities:
expressed by decisions to prevent and limit negative impacts on the environment of
specific functional areas (industrial zones, export processing zones, HTP) and
agricultural, forestry and fishery products production and processing establishments.
In 2002, the Ministry of Science, Technology and Environment issued Decision
No.62/QD- BKHCNMT on regulations on environmental protection of industrial
parks. However, this decision has exposed some limitations, such not keeping up the
development of industrial parks. In 2009, the Ministry of Natural Resources and
Environment issued Circular No. 08/2009/TT-BTNMT stipulating environmental
management and protection of economic zones, high-tech zones, IP and IC to replace
Decision 62. In 2011, the Ministry of Natural Resources and environment issued
Circular No. 48/2011 / TT-BTNMT dated December 28, 2011 amending and adding
some articles of Circular No. 08/2009 / TT-BTNMT. In 2015, the Ministry of Natural
Resources and Environment issued Circular No. 35/2015/TT-BTNMT dated June 30,
2015 on environmental protection of economic zones, industrial parks, export
processing zones and high-tech zones to replacing Circular No. 08/2009 / TT-BTNMT
and Circular No. 48/2011 / TT-BTNMT. Currently, policies on controlling pollutant
generators from industrial activities continuously are concretized by developing and
promulgating national technical regulations on the environment, such as: 1-Circular
11/2015/TT-BTNMT dated 31 March 2015 by the Minister of Natural Resources and
Environment promulgating national technical regulations on environment (QCVN 01-
MT: 2015 / BTNMT - national technical regulation on wastewater from natural rubber
processing); 2-Circular No. 12/2015/TT-BTNMT dated 31 March 2015 by the
Minister of Natural Resources and Environment promulgating national technical

184
regulations on the environment (QCVN 12-MT: 2015/BTNMT - national technical
regulation on pulp and paper industrial wastewater); 3-Circular No. 13/2015/TT-
BTNMT dated 31/03/2015 by the Minister of Natural Resources and Environment
promulgating national technical regulation on the environment (QCVN 13-MT:
2015/BTNMT - national technical regulation on textile, dyeing industrial wastewater);
4-Circular No. 76/2015/ TT-BTNMT dated 31/12/2015 by the Minister of Natural
Resources and Environment promulgating national technical regulation on the
environment (QCVN 60-MT: 2015 / BTNMT – national technical regulation on
ethanol production wastewater); 5- Circular 77/2015 /TT-BTNMT dated 31/12/2015
by the Minister of Natural Resources and Environment promulgating national
technical regulation on environment (QCVN 11-MT: 2015/ BTNMT - national
technical regulation on seafood processing waste water) etc.
For urban environmental protection policies related to traffic activities: decisions
aiming at reducing urban air pollutants by decreasing personal means of transport and
controlling the quality of vehicles. Decision No. 04/2008/ QD-BXD dated 3 April
2008 promulgating Vietnam's construction code QCXDVN 01: 2008/BXD. This code
includes provisions on urban traffic planning, minimum rate of traffic land and static
traffic in urban construction land, development of modern public passenger transport
networks such as urban railways, express motorways, bus roads, etc for cities of type
III or higher. In the system of Vietnam standards, there are also standards on limiting
emissions, noise, vibration for means of transport: TCVN 5948:1999 Acoustics-Noise
emitted from means of transport when increasing speed – allowable maximum noise
level; TCVN 7210: 2002 Vibration and shock - Vibration emitted by roads traffic -
Maximum limits in the environment of public and residential areas; TCVN-6438-
2005- Road vehicles - Maximum permitted limits of exhaust gases, specially,
Decision No. 1659/QD-TTg dated 7 November 2012 on approving the national
program on urban development in 2012-2020, giving indicators of traffic land rate per
urban construction land area, rate of public passenger transport in cities for each
periods to 2015 and 2020.
Environmental protection policies are not only oriented on preventing and
limiting adverse impacts on urban environment as mentioned, but also aims at
handling environmental protection violations and defining finance in environmental
protection such as: Decree 179/2013/ND-CP dated November 14, 2013 by the
Government on the sanction of administrative violations in the domain of
environmental protection; 2015 Ordinance on Environmental Police; the 1999
Criminal Code, as amended and added on 16 September 2009 containing provisions
on environmental crime; Decree No. 03/2015/ND-CP determining damages to the
environment; EPT Law; Decree on environmental protection charges for waste water;
State Budget Law; law on corporate income tax…
In addition to national policies on environmental protection, ministries and
sectors that affects the entire national urban system, some cities facing serious
environmental problems as well as step by step being more active in building,
implementation of their own policies on urban environmental protection. Typically,
Hanoi and Ho Chi Minh City are two special type cities with high air pollution
therefore, they have policies on subsidies for public means of transport to reduce air

185
pollution102, 103
. Urban environmental protection is also required more stringently for
Hanoi Capital, expressed in Article 4 of the 2013 Law on the Capital " Ministry of
Natural Resources and Environment issued some more stringent environmental
regulations on waste water, waste gas and noise within the capital than the national
environmental standards as proposed by Hanoi people's Committee". It seems to
respond to the reasonable aspiration of the local/urban government and because
environmental protection human resources of the central government are limited,
Article 114 of the 2014 Environment Protection Law stipulates: local environmental
technical regulations promulgated by the provincial People's Committee must be more
stringent than national environmental technical regulations or meet the requirements
of special environmental management.
b) System of organization and management of urban environmental protection
For State management organization of environmental protection
The 2014 law on environmental protection, the Government agrees the State
management of environmental protection in the whole country. Minister of Natural
Resources and Environment is responsible to the Government for unifying state
management of environmental protection, ministers, heads of ministerial level
agencies assume the prime responsibility, coordinate with the Minister of Natural
Resources and environment, other ministers, and heads of ministerial-level agencies
and chairmen of provincial People's Committees to organize implementation of the
law on environmental protection in some activities in the managed field, competence
and scope. According to this law, and Decree No. 21/2013/ND-CP regulating
functions, duties, powers and organizational structure of the Ministry of Natural
Resources and Environment and Decree No. 62/2013/ND-CP stipulating functions
tasks, powers and organizational structure of the Ministry of Construction, the
Minister of Natural Resources and Environment is also responsible to the Government
for unifying the state management of urban environmental protection. Minister of
Construction shall assume the prime responsibility for implementing legislation on
environmental protection in construction of infrastructures for water supply, drainage,
urban solid waste and waste water treatment and concentrated service production
areas, building materials production facilities, craft villages and concentrated rural
residential areas and other activities in the field of management (management of urban
development, urban planning, economic zones, industrial parks, export processing
zones, high-tech industrial clusters.). In each city, it is the direct responsibility of the
urban People‟s Committee (city / town / township)for State management of
environmental protection. Organizations of state management of environmental
protection in different cities are different by city type or even different in the same
city type but they have specialized environmental protection departments to help
People's Committee with environmental management in the area, perhaps Department
of Natural Resources and Environment (for municipalities) or Division of Natural
102Resolution No. 03/2013 / NQ-HDND by the People's Council of Hanoi giving priority to development of
system of large volume public passenger transport; encouraging investment in construction and exploitation of
parking space, parking lots for automobiles and other motor vehicles; applying high technology to management
and administration of transportation system 103 Bus price subsidies topic in HCMC and current status and solutions. http://luanvan.net.vn/luan-van/de-tai-
tro-gia-xe-buyt-tren-dia-ban-tphcm-va-thuc-trang-va-giai-phap-19734/

186
Resources and Environment (for other cities / townships/towns). In addition, each city
also covers departments/divisions, and even state-owned enterprises which shall as
their functions and duties carry out urban environmental protection (see Figures 3 &
4). Thus, organization of state management of urban environmental protection is still
as the traditional state management model, in which the burden of implementing
environmental protection policies is placed on the State, on the basis of bureaucracy
administration machinery system. Environmental issues still tend to go up, showing
low efficiency of this management model and it should be changed in the near future.
Figure 1 15. Chart of state management organization regarding environmental
protection in special type city
Source: Nguyen Thi Thuy Hang, Environment Expert at VIUP, 2016
Figure 1 16. Chart of state management organization regarding environmental
protection in Dangng city
Source: Nguyen Thi Thuy Hang, Environment Expert at VIUP, 2016
For participation in environmental protection by social organizations and
communities
In recent years, environmental protection policies have changed in the better direction
to create conditions for organizations and communities involved in environmental
protection and inspection and supervision of implementation of environmental
protection activities. Article 43 of the 2013 Constitution stipulates that: Everyone has
the right to live in a healthy environment and environmental protection obligations.
UBND đô thị loại đặc
biệt (HN &HCM)
Công an
thành phố URENCO (HN)
hoặc CITENCO
(HCM)
Sở TNMT UBND quận,
huyện
Phòng CSMT Chi cục
BVMT
Phòng
TNMT
Các sở ngành
khác (Sở Kiến
trúc, Sở Xây
dựng, Công
thương, Sở
Giao thông, Y
tế….)
Quỹ
BVMT
BQL KCN-
KCX
Các
phòng
chức
năng
Công an
thành phố Sở TNMT UBND quận,
huyện
Phòng CSMT Chi cục
BVMT
Phòng
TNMT
Các sở ngành
khác (Sở Xây
dựng, Công
thương, Sở
Giao thông, Y
tế….) Công ty
thoát
nước và
xử lý
nước
thải
BQL KCN-
KCX
Các
phòng
chức
năng
UBND thành phố
Đà Nẵng

187
More advanced than the 2005 law on environmental protection, the 2014 Law on
Environmental Protection defines the environmental protection responsibilities of
political-social, social-occupational organizations and communities. Article 4 of the
2014 Law on Environmental Protection stipulates: environmental protection is the
responsibility and obligation of all agencies, organizations, households and
individuals. Participation in (performance of environmental protection obligations) of
social organizations and communities are expressed in the forms such as establishing
self-regulatory environmental protection organizations. Self-regulatory environmental
protection organizations are responsible for building and implementing environmental
protection conventions; propagating, mobilizing people to eliminate bad practices,
unhygienic habits, harmful to health and the environment. One of the completely new
contents is that political – social, social - professional organizations may recommend
competent state authorities to handle violations of laws on environmental protection
and community representatives have the right to participate in assessing
environmental protection results of production and business, service facilities; take
measures to protect the rights and interests of community in accordance with the laws.
In supervision, if self-regulatory organizations detect violations of environmental
protection laws, they have the right to participate in supervising the implementation of
environmental protection laws by production, business and service facilities in the
province. The political - social, social - professional organizations have the right to
participate in inspection of environmental protection at production, business and
service facilities related to their functions, duties and powers, and recommend
competent state agencies to handle violations of laws on environmental protection. To
ensure for political -social, social - professional organizations to implement their
environmental protection obligations, the Law also provides their right to access to
environmental information in Article 145 of the 2014 law on environmental protection
"to provide and ask to provide information on environmental protection in accordance
with the laws" and Article 146 provides the right to represent for the community
suffering from environmental impacts of production, business and service facilities in
the province have the right to request the owners of production, business and service
facilities to provide information on environmental protection through direct dialogue
or in writing; organize to learn about actual environmental protection activities of the
production, business and service facilities; collect and provide information to
competent authorities and is responsible for the information provided and may request
the State authorities concerned to provide the results of inspection, check, handling for
the facilities.
2.9.4. The challenge of urban environmental protection in Vietnam in the future
Towards the objectives of the country as green growth, sustainable
development, and ASEAN integration into TPP, the settlement of today's
environmental problems as well as improvement and enhancement of the quality of
the urban environment has become more urgent than ever. However, from the
assessment of the pressures of urbanization and industrialization on the urban
environment, the urban environment issues and current major policies, organization
and management of urban environmental protection above may sumary some
challenges of urban environmental protection in Vietnam in the coming time as below.
The first one is the industrialization. After a process of "calling" and
"prioritizing" the investment in industrial development for goals of industrialization of

188
the country, but not taking into account the environment, or if taking into account the
environment, it is not sufficient with formalistic style of "as long as existing" and
legal gap on technological control, finally, several industrial parks will be filled, a
variety of production facilities will go into operation while the environmental
protection infrastructure of industrial areas are not synchronized, the inspection and
monitoring of environmental protection measures proposed in the EIA report of
investment projects of urban government has not been close. As a consequence, the
environmental risks and incidents such as mass of dead fish in four central provinces
by caused by Formosa are always potential risks.
The second one is the rise of individual motorized transport. Individual
motorized transport continuing rising is an inevitable trend when the urban economy
thrives that public transport system has only been invested in construction in some big
cities such as Hanoi and Ho Chi Minh City.
The third one is the urbanization. The process of urbanization will increase
construction activity in urban areas and the putting the craft villages and focused
residential areas with more environmental issues in urban areas would make the urban
environment issues become worse, especially air and water pollution
The fourth one is the investment budget for the urban environment protection.
According to the Ministry of Natural Resources and Environment 104
, the investment
for environmental protection of around 1% of the total state budget expenditure at
present is too low compared to the actual requirements of environmental protection
tasks. Meanwhile, China and ASEAN countries invested in environmental protection
of 1% of annual GDP, in the developed countries of 3-4% of GDP. Besides, many
localities have not allocated enough 1% of budget for environmental protection. Total
funding from taxes, environmental protection fees is not enough to reinvest in
environmental treatment projects.
The sixth one is natural disasters and climate change. Natural disasters and
climate change will continue to cause unpredictable effects on Vietnam's urban system
and will cause extreme enhancement of the level of urban environmental issues. In
fact, the degree of devastation of natural disasters in the context of climate change in
recent years, especially storms, floods and landslides are enormous, causing severe
damage to people, property and environmental degradation in many coastal urban
areas in Vietnam.
B. Natural disasters and the impact of climate change on Vietnam's urban system
2.9.5. Overview of climate change on Vietnam's urban system
Vietnam's urban system today is not only under pressure from pollution,
accidents and environmental disasters but also strongly affected by natural disasters
and the impacts of global climate change. The expression of climate change in
Vietnam is the extreme and abnormal weather phenomena in temperature and
precipitation in different regions, different time periods of the year and rising sea
levels, from which increasing the intense level of natural disasters such as floods,
104 Ministry of Natural Resources and Environment, 2013. Final Report of 8 years implementing the Law on
Environmental Protection in 2005 (2006-2013).

189
thunderstorms, tornadoes, drought, salinity ... and these disasters are showing signs of
becoming more popular in recent times. Climate change and sea level rise affect
natural ecosystems, crops, livestock, increase the development of pests and diseases,
increase the pressure on people, increase the intense level when natural disaster occur.
According to the National Target Program to Respond to Climate Change and
special report of Vietnam on risk management of natural disasters and climate
extremes to promote adaptation to climate change (2015), some of the expressions of
climate change in Vietnam Men are as follows: The average temperature in Vietnam
in 50 years increased from 0.5 to 0.7 ° C. Winter temperature rises faster than summer
temperatures and the temperature in northern climates rises faster in southern climatic
zones. Number of hot days increased to 34 days / decade. The rainfall decreases in
northern climatic zones and increases in the southern climatic zones. On average in
the country, the annual rainfall in the past 50 years has decreased by about 2%.
Number of cold air affecting Vietnam decreased markedly in the past two decades.
However, the abnormal expressions often appear and the cold air can cause cold
weather extended to 38 days in 2008. In recent years, intense storms appear more. The
typhoon has signs of moving to the south and hurricane season ends later, many
storms have abnormal way. Extreme flood often occurs in the upper Red River and
Mekong Delta. They progress rapidly and dangerously in Central. Droughts are more
frequent, especially extremely harsh droughts. Sea level figures observed at
oceanographic stations along the Vietnam coast shows that the speed of average sea
level rise in Vietnam currently is about 3 mm/ yr (1993 - 2008), equivalent to the
average growth rate in the world. The highest sea level rise in the year tends to
increase.
Overheating urban development also is a cause contributing to the increase of
the impact of climate change. The overexploitation of land resources for the purpose
of urban growth and industrialization but disregarding requirements of sustainable
development, urban ecological problems impacts negatively on the vagaries of nature,
the increase of environmental incidents.
According to the Ministry of Natural Resources and Environment, sea level
rises 1 meter the 6.3% of Vietnam area, 39% of the Mekong Delta area, over 10% of
the Red River Delta and Quang Ninh area, over 2.5% of the area of the provinces of
Central coast and over 20% of Ho Chi Minh city area are in danger of being
flooded105,106
. Vietnam is one of the four largest countries affected by extreme climate
events in the past two decades, and ranks 3rd if only in 2008. Particularly in Vietnam,
each year, the natural disasters claimed the lives of 466 people, damaged more than
1.5 billion dollars equivalent to 1.5% of GDP. Disaster evolutions are increasingly
complex, not under the rule as before, the frequency increases significantly, especially
in the context of Vietnam heavily affected by climate change. This problem will
continue for many coming years and will increase the risk of flooding in coastal and
riverside urban areas; increase the risk of flood, flash floods and landslides in urban
areas in the Northern Mountains, Central and Central Highlands; negatively impact to
105
Bộ Tài nguyên và Môi trường, 2012. Kịch bản Biến đổi khí hậu, nước biển dâng cho Việt Nam. Nhà Xuất
bản Tài nguyên- Môi trường và Bản đồ Việt Nam. 106
http://vtv.vn/chuyen-dong-24h/17-trieu-nguoi-viet-co-nguy-co-mat-cho-o-neu-bien-dang-cao-
20151216185834406.htm

190
infrastructure system and urban environment; loss safe housing and livelihoods and
affect migration and resettlement in urban areas.
2.9.6. Overview of some issues on the risk of natural disasters and climate change
in urban areas
a) Climate change increases the risk of flooding in urban areas, especially coastal
and riverside urban areas
The survey in 41 urban areas showed that currently, urban areas with high
flooded area ratio are mainly urban areas in the Mekong Delta and the Red River
Delta. The examples for high flood level of the two regions are Can Tho City and Thai
Binh City with corresponding flooded proportion of 80% and 40%. Some cities had
many efforts and programs against flooding but flooding still occurs frequently. For
instance, in Hanoi in 2015 there were 23 flooding points on the roads of 12 districts
and Thanh Tri District; Ho Chi Minh City had 62 flooding points in 2015 flooded; Da
Lat City has about 25 flooding points in the city in 2015, mainly concentrated in the
central wards. Common cause of flooding is poor and asynchronous irrigation and
drainage infrastructure, combined with floods, high tides in the context of climate
change. There are also other causes such as development planning errors,
asynchronous enhancement of building background code, enhancement of road base
and natural river filling...
By reviewing Vietnam's urban system compared with climate change scenarios,
1-meter sea level rise is estimated that around 135 urban centers are in high risk of
flooding, including 46 large and medium cities of 40 provinces in the regions of the
Mekong Delta, Red River Delta , North Central and Central coast, the South East107
.
Specifically as below:
The Red River Delta had 27 urban areas with high and very high risk of
flooding including: 02 urban areas grade I as Hai Phong and Nam Dinh City; 01 urban
area grade II as Halong City; 03 urban areas grade III as the Thai Binh, Uong Bi and
Cam Pha City; and 21 urban areas grade V. Some big and medium cities had high
flood risk with the flooded area percentage as: Ha Long City of Quang Ninh Province
(20-25%), Uong Bi City of Quang Ninh Province (15-20%), Hai Phong City (5-10%),
Thai Binh City of Thai Binh Province (10-15%), Nam Dinh City of Nam Dinh
Province (5-10%).
The North Central Coast and Central Coast had 41 urban areas with high risk
of flooding including: 05 urban areas grade I as the cities of Vinh, Hue, Da Nang, Quy
Nhon, Nha Trang; 01 urban area grade II as Phan Thiet City; 10 urban areas grade III
as the cities and towns of Sam Son, Cua Lo, Ha Tinh, Dong Hoi, Dong Ha, Tam Ky,
Hoi An, Tuy Hoa, Cam Ranh, Phan Rang-Thap Cham; 08 urban areas grade IV as
Bim Son, Hong Linh, Huong Thuy, Song Cau, Ninh Hoa, Van Gia, Lagi, Phan Ri
Cua; and 17 urban areas grade V. Whole urban area is 4538.4 km2 in which the inner
city area is 1453.6 km2 and a whole urban population is 4.18 million including the
inner-city population of 3.4 million people. Some big and medium cities had high
flood risk with flooded area percentage as: Sam Son City of Thanh Hoa Province (25-
30%), Bim Son Town of Thanh Hoa Province (10-15%), Ha Tinh City of Ha Tinh
107 Bộ Xây dựng, 2013. Đề án phát triển các đô thị Việt Nam ứng phó với BĐKH giai đoạn 2013 – 2020

191
Province (10-15%), Hong Linh Town of Ha Tinh Province, Tam Ky City of Quang
Nam Province (10-15%), Hoi An City of Quang Nam Province (10-20%).
The South East had 3 urban areas with high risk of flooding including: 01
special urban area as Ho Chi Minh City; 01 urban area grade II as Vung Tau City; 01
urban area grade III as Ba Ria Town. All 3 these urban areas are large and medium
urban areas with flooded area percentage as: Vung Tau City of Ba Ria -Vung Tau
Province (40-50% of the flooded area), Ba Ria Town of Ba Ria - Vung Tau Province
(20-25%) and Ho Chi Minh City (20%).
The Mekong Delta had 63 urban areas with high risk of flooding including: 01
urban area grade I as Can Tho City; 01 urban area grade II as Ca Mau City; 04 urban
areas grade III as the cities of Rach Gia, Vi Thanh, Soc Trang, Bac Lieu; 07 urban
areas grade IV as the towns of Ben Luc, Hau Nghia, Go Cong, Ha Tien, Nga Bay, Nga
Nam, Vinh Chau; and 50 urban areas grade V. Whole urban area is 3236.5 km2 in
which the area the inner city, inner 1,552.4 km2 and the whole urban population was
2.97 million people including inner-city population of 2.12 million people. Some big
and medium cities had high flood risk with the flooded area percentage as Rach Gia
City of Kien Giang Province (85-90%), Ha Tien Town of Kien Giang Province (85-
90%), Vi Thanh City of Hau Giang Province (85-90%), Nga Bay Town of Hau Giang
Province (85-90%), Ca Mau City of Ca Mau Province (60-70%), Soc Trang City of
Soc Trang Province (10-20%), Can Tho City (5-10%), Go Cong Town of Tien Giang
Province (20-25%).
The majority of urban areas at flooding risk are coastal and riverside urban
areas.
Chart 1 144. Urban areas at flooding risk
No. Urban area Total
Urban grade
Spec
ial I II III IV
V and
equivale
nt to V
1 Seaside 26 4 2 9 5 6
2 Bayside 2 1 1
3 Riverside 11 1 2 2 1 5
4 Salt-march side 1 1
5 Near the sea 8 2 6
6 Near the bay 1 1
7 Near the river 5 5
8 Near the
seaport 4 4
9 Other areas at
flooding risk 64 2 1 5 7 49
10 Island urban
areas 13 13
Total Total 1 8 4 18 15 89 Source: Ministry of Construction, 2013

192
b) Climate change increases the risk of flooding, flash flood and landslides in
mountain areas of the North, Central and Central Highlands
According to the Central Steering Committee for Flood and Storm Control, in
recent years 108
, the natural disaster situation in the mountainous provinces of Vietnam
has been increasingly complex. Specially, the phenomenon of landslides, floods, flash
floods occur frequently causing serious damage to people, property and ecological
environment. According to statistics, from 2000 to 2014, 250 flash floods and
landslides occurred affecting residential areas, 646 people died and disappeared,
nearly 351 people injured; more than 9,700 houses collapsed; more than 100,000
houses were flooded and heavily damaged; more than 75,000 hectares of rice crops
were flooded; hundreds of hectares of farmland were buried; many works of traffic,
irrigation, economic livelihoods were severely damaged, the total damage was
estimated at over 3,300 billion. The flash floods, landslides often occur in: Lao Cai,
Ha Giang, Lai Chau, Son La, Cao Bang, Bac Can, Yen Bai, Nghe An, Ha Tinh, Quang
Nam, Kon Tum, Gia Lai , Dak Lak and Binh Thuan.
By reviewing Vietnam's urban system compared with climate change scenarios,
1-meter sea level rise estimated flood, flash flood and landslides increased due to
climate change affected about 143 cities of 29 provinces in the Midlands and Northern
mountain, North Central and Central coast, Central Highlands, Southeast, including 17
large and medium urban areas, specifically:
The Midlands and Northern Mountains: There are 13/14 provinces
affected with 74 urban areas including 01 urban area grade I as Viet Tri City; 7 urban
areas grade III as cities and towns of Bac Kan, Lao Cai, Yen Bai, Ha Giang, Hoa
Binh, Phu Tho, Son La; 01 urban area grade IV as Muong Lay Town; and 65 urban
areas grade V and equivalent grade V. Muong Lay Town, Lai Chau Town, Nam
Coong, Sin Ho (Lai Chau); Son La Town (Son La), Cao Bang City (Cao Bang), Yen
Minh (Ha Giang); Van Chan (Yen Bai) are strongly affected.
North Central and Central Coast: There are 11/14 provinces affected
with 42 urban areas including 01 urban area grade I as Hue City; 2 urban areas grade
IV as Huong Thuy Town and Tu Ha Town; 33 urban areas grade V. Song Ma Town
(Thanh Hoa), Huong Son (Ha Tinh); Truong Son (Quang Binh); Ham Tan (Binh
Thuan) are strongly affected.
Central Highlands: There are 3/5 affected provinces of Dak Lak, Dak
Nong and Lam Dong with 24 urban areas including 01 urban area grade I as Buon Ma
Thuot City; 01 urban area grade III as Bao Loc City; 03 urban areas grade IV as the
towns of Buon Ho, Eakar, Gia Nghia; and 19 urban areas grade V or equivalent to
type V. Krong Bong, Lien Son of Lak district (Dak Lak) are strongly affected.
The South East: There are 03 urban areas grade V.
Chart 1 145. Urban areas at risk of being affected by flash floods and landslides
No. Region Total Urban grade
108 Ban chỉ đạo phòng chống lụt bão TW, 2014. Tổng quan tình Figure thiệt hại do lũ, lũ quét, sạt lở đất và
công tác chỉ đạo phòng tránh trong những năm vừa qua. Tài liệu phục vụ Hội nghị trực tuyến ngày 20/8/2014.

193
Specia
l I II III IV
V and
equivalent
to V
1 Midlands and
Northern mountains 74 1 7 1 65
2 North Central and
Central Coast 42 1 2 39
3 Central Highlands 24 1 1 3 19
4 South East 3 3
Total Total 0 3 0 8 6 126
Source: Ministry of Construction, 2013
c) Climate change impacts on technical infrastructure and urban environment
The majority of urban areas in our country lies in the delta and coastal areas,
especially in big cities like Hanoi, Ho Chi Minh City, Hai Phong, Hue, Da Nang and
Can Tho ... The high population density, urban development towards center and ring-
styled expansion with outer ring higher inner ring, leveling of surrounding sunken areas
to build new urban areas, industrial parks... has greatly impeded the natural flows. Most
urban development planning have not include the impacts of climate change, not orient
ecological urban construction, the current state of technical infrastructure is limited and
very vulnerable under the impact of climate change.
Increased salinization affects water, soil environment and impacts on urban water
supply infrastructure: The salinization in recent times in the provinces is growing.
Especially in the Mekong Delta, the salinity on Hau River 8-10 km encroached the Dai
Ngai; Co Chien river's salinity of 1 g/l also passed beyond Vung Liem canal; on the Ham
Luong River in February and April in many years at the upstream position, 5-10 km of
Ben Tre canal has also been unable to use the water for living. Therefore, groundwater
sources in use for urban areas as Long Xuyen, Ho Chi Minh City, Can Tho, Ben Tre, Tan
An ... and some coastal provinces in South Central Coast as Quang Nam, Quang Ngai
have been contaminated with salt water. These effects impacted directly on the supply of
clean water to people in some urban areas, running water contaminated with salt water
was unusable (Hoi An City, Vinh Dien Town, Quang Nam). Highest salinity level is in
some freshwater rivers like Thu Bon River (Quang Nam), Ham Luong River (Ben Tre)…
Some urban water supply plants must stop working such as Phu Bai water plant (August,
2010). Due to the increased movements, some provinces have developed salinization
monitoring stations in the provinces and cities such as Ben Tre, Long An, Long Xuyen...
to regulate and calculate the building groundwater surface water water supply stations. In
the Red River Delta, there is controlling dyke system. Therefore, for this area, the salinity
is less intrusive into the infield, however, the dyke system also stalled the process of
taking water from the river, increasing the arid land area and degrading land environment.
Especially, sea level rise combining tides causes great damage to the landscape and
coastal ecosystems.
Impact on urban drainage: When sea level rise, both tidal regimes have negative
impacts on southern delta. Sea level rise also makes the scale of existing river dykes and
sea dykes may not be sufficient to ensure the task of preventing tidal highest water level.

194
There are dykes even to be deeper into the mainland due to erosion of the coastline. The
sluice - drainage gates will have to work with the tide rising higher than the original
design, so the capabiity of drainage will decrease significantly than expected. Sluice gates
along the West Sea have small amplitude due to the impact of tide, when the sea level
rises, drainage capacity greatly reduced and tasks of the project will no longer be
guaranteed. In general, most of the current projects in freshening southern delta will face
the risk of very serious broken under the impact of rising sea level in the future.
Impact on urban transport system: Climate change has continued to increase
in frequency and intensity of natural hazards such as heavy rains, floods, flooding,
storms, tropical depressions, floods, erosion/ sedimentation, cyclones. This hazard is
one of the causes of destruction and damage to the road surface, pavement and
ancillary works on the road. Forecasting under climate change scenario, 1m sea level
rise then about 4.3% ie 9200km local and national road system will be permanently
flooded. 90% of the transport infrastructure in Mekong Delta and nearly all of the
provinces of Soc Trang, Kien Giang, Bac Lieu and Tra Vinh are affected. Impacts on
traffic infrastructure have not been properly evaluated because not taking into account
the actual consequences of floods and tsunamis (Report of the Center for International
Environmental Management (ICEM), 2008).
Impact on the environment and solid waste management and waste disposal:
The collection and disposal of solid waste are an urgent environmental problems. Low
collection capacity. Unsorted garbage at source. Current treatment methods of mostly
buried in landfills are polluting the water, air and soil environment. The recycling
facilities are on small scale, outdated technology or not renewed. The environmental
pollution caused by the collection and processing increases the risk of disease and
generates greenhouse gas emissions and will become more serious in the context of
climate change.
d) Climate change impacts on housing, livelihood and urban migration
Climate change really made disasters, especially storms, floods and droughts
increasingly fierce. The consequences of climate change for Vietnam are very serious,
we cannot evade but adapt. One of the adaptation solutions is permanent or temporary
migration. The Intergovernmental Panel on Climate Change (IPCC) concluded that
the impacts of climate change combined with rapid population growth in areas
affected by climate hazards, then the possibility of migration in the future will be
higher, and the long-term resettlement becomes more necessary than (IPCC 2012).
Under the climate change scenarios of sea level rise, climate change can affect 10-
12% of Vietnam's population, especially the communities living along the coastal
areas and in the Red River Delta and Mekong Delta. They may lose building land and
loss of productive land due to flooding, erosion, salinization, and hence it is required
to migrate and find new shelter and business. Therefore, climate change can lead to
both permanent or temporary migration.
According to Veronique Marx and Katherine Fleischer 109
, the majority (70%)
of migrants in the country is due to economic reasons, including migration to find jobs
and improve living conditions. However, it should be noted that migration motives of
109
UNDP (2010), immigration in country: Opportunities and challenges to socio-economic development in
Vietnam

195
individuals and households are not one-way but incorporated with other factors. It can
be seen these "combined" motives in most cases of internal migration in Vietnam. For
example, migration due to climate change may be related to economic factors, in this
case, individuals, households and communities move due to their livelihood no longer
relevant, such as salf-marsh land, so the cultivation is no longer relevant.
Data from the population census in 1999 said that migration to urban areas
accounted for more than half of all migrants in the country of Vietnam with 53%,
while 27% of migrants from rural to urban areas and 26% of migrants between urban
areas. For migrants from rural to urban areas, the most popular destination are bid
cities such as Ho Chi Minh City, Hanoi, Hai Phong and Da Nang. This migration flow
to urban areas accounted for 1/3 of population growth of urban areas in 1994-1999. In
the case of Ho Chi Minh City and Hanoi, the number of migrants doubled the
population in these two cities. Recently, the migration has contributed to the
development of local cities such as Can Tho, Long Xuyen, Ca Mau in the Mekong
Delta and contributed to the development of economic centers such as Quang Ninh,
Binh Duong and Dong Nai.
Thus, urban systems, especially large urban areas with many opportunities on
livelihood or urban areas with high safety before the effects of climate change will be
the destination for migrants. This is an issue that should be considered in formulating
policies on urban housing, employment, and urban infrastructure development and
social infrastructure related.
2.9.7. Management of natural disaster risk mitigation and response to climate
change
Policies on response to climate change have been developed in two directions as
climate change mitigation and adaptation to climate change. About mitigation climate
change: reducing greenhouse gas emissions by encouraging efficient use and saving of
energy, clean energy development, renewable energy, implementation of the project
of Clean Development Mechanism (CDM), development of clean technologies, etc...
On adaptation to climate change: integrating climate change into development of
strategies, planning, construction and implementation of priority projects, the
implementation of strategies for disaster management, etc...
Policies on climate change have been more specific in the legal policy document on
climate change as the prime minister's decisions and resolutions of the Party Central
Committee, the ministries and departments' decision. The decisions of the Prime
Minister include Decision No 158/2008/QD-TTg dated 02/12/2008 approving the
National Target Program on respond to Climate Change (NTP-RCC), Decision No.
2139/QD-TTg dated 05/12/2011 approving the national strategy on climate change,
Decision No. 1393/QD-TTg dated 25/9/2012 approving the national strategy on green
growth period from 2011 to 2020 and vision to 2050, Decision No. 1474/QD-TTg
dated 05/10/2012 on the issuance of the national action plan on climate change in
period of 2012-2020. Especially, Resolution No. 24-NQ/TW dated 03/06/2013 in 7th
Conference of the Central Executive Committee (XIth Session) on actively respond to
climate change, enhancing resource management and environmental protection. The
ministerial policy documents continued to concretize policies on climate change,
providing the integration of action plan content into the regular planning and tasks of
locality, especially planning of economic and social development and urban planning,

196
such as Decision No. 1485/QD-BKH of the Ministry of Planning and Investment
dated October 17, 2013 issuing guides for preferences of climate change adaptation in
the planning for socio-economic development, and Decision No. 2623/QD-BXD of
the Ministry of Construction dated December 31, 2013 approving the Scheme of
Urban development of Vietnam to response to climate change in period of 2013 -
2020. Besides documents and policies on responding to climate change, the policies,
documents and legislation on natural disaster prevention have also continued to be
developed and issued such as the National Strategy on Prevention and Mitigation of
natural disasters to 2020 (2007), the Law on Disaster Prevention No. 33/2013/QH13,
Decree 66/2014/ND-CP guiding the Law on Disaster Prevention, Circular
05/2016/TT-BKH - guiding integration of disaster prevention content into economic
and social development plan... And most recently, the Meteorological Law No.
90/2015/QH13 promulgated on November 23, 2015, with effect from July 1, 2016 is
an important legal basis to support positively for activities responding to climate
change and disaster risk reduction.
According to the Standing Committee of the National Assembly 110
, the promulgation
and implementation of policies and laws to respond to climate change in recent years
have gradually met the requirements of economic - social development; have
developed and issued a number of policies, laws, strategies, planning, plans, national
target programs; built, updated scenarios of climate change and sea level rise as a
basis for ministries, sectors and localities, especially the provinces of the Mekong
Delta to implement; mobilized the support of the international community,
implemented international commitments that Vietnam has joined, initially
implemented a number of priority and urgent projects to respond to climate change in
the Mekong delta. Disaster forecasting and warning and response to climate change
have made a certain number of results. However, climate change is a new issue, thus
the formulation and promulgation of policies and laws have not been timely and
synchronized; lack of policies, mechanisms to encourage business and community to
participate in activities of effective response to of climate change, especially in the
Mekong delta. The regional master plan associated with factors of climate change has
not been adequately addressed; the awareness of climate change is limited; resources
for coping with climate change are in arrears; Investment projects to cope with climate
change are widespread, not focused, lack of inter-regional, inter-sectoral and long-
term, especially investment for coping with climate change in the delta Mekong.
Management
At the urban level, the People's Committee of city/ town/ township is responsible for
the implementation of policies and legislation on response to climate change and
natural disaster risk prevention and mitigation. The units under the People's
Committee jointly organize the tasks and activities to respond to climate change and
natural disaster risk mitigation. However, there is always an organization being
responsible for professional work in responding to climate change as division/ office
for Resources and Environment and an organization being responsible for professional
work in the prevention and mitigation of natural disaster risk as the division/ office for
110 Resolution No. 853/NQ-UBTVQH13 of the Standing Committee of the National Assembly on the results of
monitoring and promoting the implementation of policies and laws on response to climate change in the
Mekong Delta, December 5, 2014

197
Agriculture and Rural. The assessment of organization and management natural
disaster risk mitigation and response to climate change urban level were done by
assessing the building response plans as an action plan to respond to climate change
and the plan to respond to annual climate change, emergency response plans for
disasters related to climate change. The survey results confirmed that the majority of
the urban have not actively developed action plan responding climate change. Big
cities and urban areas of the sea, influenced by the effects of climate change of sea
level rise had more active in the development/ implementation of the action plan to
respond to climate change. Namely, only 7/41 (or 17%) of urban areas developed
action plans. This ratio decreased from 100% for special urban areas to 0% for urban
areas grade IV. This percentage was highest in the North Central and Central Coast
with the highest rates, reaching 42.9%. The next was the Mekong Delta region of
28.6%, the South East was 16.7%, the Red River Delta and the northern key economy
was 12.5%. The survey also showed that the urban areas developed action plans to
respond to climate change (special urban areas and urban areas grade I and II), then
always had annual plans to respond to climate change. It is the materialization of
active measures to respond to climate change for each year, is the basis for monitoring
the implementing and gaining experience for next year. Most of the urban areas grade
III (about 67%) and urban areas grade II (75%) only plan to deploy the solutions and
activities of response to climate change of the centrally-run provinces/ cities. In
addition to the climate change response plans, in order to take the initiative, prepare,
respond and overcome consequences and limit to the lowest level of damage caused
by natural disasters, some urban areas have prepared plans to prevent and respond to
natural disasters under natural disaster risk levels as Da Nang, Ho Chi Minh City,
Pleiku, Quy Nhon City, or pilot implement co-management model of flood and
riverside erosion controlling in Can Tho City…
Overall, the capacity to respond to climate change and natural disaster risk in urban
areas in Vietnam is lower because of some following reasons:
(1) The Good Practices of local governments in the world, mainly focused on
dveloping the action plans in urban areas that have not been applied in the
formulation and implementation of action plans. Significantly, the Good
Practices such as risk assessment and identification of vulnerable groups, the
coordination mechanism between the parties, local governments must actively
lead and plan, coordinate, monitor and implement the action plan that is not yet
paid attention adequately. In fact, the host institution developing and
implementing the action plan to respond to climate change of special urban
areas and grade 1 is usually the Department of Natural Resources and
Environment. Due to pressure of work and possibly "group interests", the
development and implementation of the action plan are not be fully consulted
at all relevant stakeholders, especially staff in charge of urban management.
Since the limited data and budgets, risk assessments and vulnerability are often
ignored or poorly.
(2) The ownership on action plan responding to climate change related of leaders
and professionals of urban management is not high. The testament is that for
the provincial cities, the majority has not developed its own action plan for
local response but to deploy response solutions according to the provincial
action plan. Management staff of the urban environment also hardly been

198
involved in the construction of the provincial action plan but only receive
passively part of the plan related to the State management tasks of their urban
areas for implementing and reporting. The majority of the urban departments,
urban infrastructure of the city/ town/ township do not know whether the
action plan to cope with climate change or not;
(3) The system of prevention policy, natural disaster risk mitigation and adaptation
to climate change in Vietnam is currently developed and implemented and
monitored relatively independently by Agriculture and Rural Development and
Natural Resources and Environment with the authority system under its at all
levels of provinces/ districts/ wards;
(4) The majority of funding for the construction and implementation of the action
plan responding to climate change in urban areas are counting on the state
budget and the assistance of international organizations such as World Bank,
ADB, USAID, the Rockefeller Foundation, AFD, GIZ , Seeds Asia.
2.9.8. The challenges of natural disaster risk mitigation and adaptation to climate
change in urban areas
The first challenge is people's perception: Awareness of the community on
climate change is generally one-sided, many people still concerned about the negative
impact cuased by climate change but has not paid adequate attention to the causes and
the role of man, to the need to move lifestyle, patterns of production and consumption-
oriented low-carbon, green and sustainable growth.
The second challenge is the urban leadership capacity: The effects of natural
disasters and climate change are inter-regional, inter-sectoral, thus requiring effective
coordination to minimize the damage. In fact, the legal policies on response to climate
change and prevention and mitigation of natural disaster risk in Vietnam also are the
basis for integration, alignment and coordination of activities of natural risk
management and adaption to climate change. Therefore, the actual demand is to have
a leader team, urban public servants not only must master the peculiarities of their
urban areas, but also to have a certain understanding to the specific problems of the
neighboring administrations to cooperate and coordinate in the formulation and
implementation of policies to reduce disaster risks and respond effectively to climate
change. However, actual urban management capacity is very limited after the
investment efforts improving the capacity of the government: after 5 years of
implementation of the project "Training and retraining of construction and
management and urban development capacity for the leadership and professionalsat
all levels in period of 2010 - 2015" nearly 50% of urban leadership and professionals
at all levels are trained, retrained according to program of Scheme 1961.
The third challenge is the public investment for the task implementation:
According to a global assessment report of 2011 - GAR11 for effective disaster
mitigation in countries with low and middle incomes as Vietnam, showed that public
investment should be around 3% - 15% of GDP. Meanwhile, the scale of public
investment in our country currently is only 0.5%, at very low level. Therefore, in the
financial conditions in our country, this is a major challenge111
111
http://www.sggp.org.vn/biendoikhihau/2014/12/368657/

199
In summary, the problems of environment and climate change as presented
above show the diversity and mix of many negative impacts of pollution and
environmental incidents and climate change on Vietnam's urban system. The poor on
adaptive capacity of urban systems demonstrated quite clearly have direct underlying
causes of weak urban infrastructure, limited response management capacity of urban
staff and leadership and the lack of financial resources for effective management. The
issues of climate change and interaction with urban environmental issues are
increasingly becoming the major obstacles for goals of urban sustainable
development. Therefore, it is necessary to analyze the root causes of the weaknesses
and limitations in order to give the views, goals and solutions to protect the
environment, respond to climate change in urban areas suitable for each subsequent
stage of development. Due to the limitations on financial resources, it is required
preferences of system-oriented solutions towards multiple targets simultaneously as
both reduce pollution and reduce disaster risk, increase response capacity of urban
areas for climate change, and at the same time increase its resistance to pressures and
other shocks that urban areas have to face. Due to environmental issues and climate
change characterized on regions and urban, thus it should also need to prioritize
system solutions suitable for each region and urban grade.