Ozone risk for vegetation in the future climate of Europe based on stomatal ozone uptake...
14
Tellus (2011), 63A, 174–187 C 2010 The Authors Tellus A C 2010 International Meteorological Institute in Stockholm Printed in Singapore. All rights reserved TELLUS Ozone risk for vegetation in the future climate of Europe based on stomatal ozone uptake calculations By J. KLINGBERG 1∗ ,M. ENGARDT 2 ,J. UDDLING 1 ,P.E. KARLSSON 3 andH. PLEIJEL 1 , 1 Department of Plant and Environmental Sciences, University of Gothenburg, P.O. Box 461, SE-40530 Gothenburg, Sweden; 2 Swedish Meteorological and Hydrological Institute, SE-60176 Norrk¨ oping, Sweden; 3 Swedish Environmental Research Institute,P.O. Box 5302, SE-40014 Gothenburg, Sweden (Manuscript received 18 September 2009; in final form 23 April 2010) ABSTRACT The negative impacts of surface ozone (O 3 ) on vegetation are determined by external exposure, leaf gas exchange and plant antioxidant defence capacity, all dependent on climate and CO 2 concentrations. In this study the influence of climate change on simulated stomatal O 3 uptake of a generic crop and a generic deciduous tree at ten European sites was investigated, using the LRTAP Mapping Manual stomatal flux model. O 3 concentrations are calculated by a chemistry transport model (MATCH) for three 30-yr time-windows (1961–1990, 2021–2050, 2071–2100), with constant precursor emissions and meteorology from a regional climate model (RCA3). Despite substantially increased modelled future O 3 concentrations in central and southern Europe, the flux-based risk for O 3 damage to vegetation is predicted to remain unchanged or decrease at most sites, mainly as a result of projected reductions in stomatal conductance under rising CO 2 concentrations. Drier conditions in southern Europe are also important for this result. At northern latitudes, the current parameterisation of the stomatal conductance model suggest O 3 uptake to be mainly limited by temperature. This study demonstrates the importance of accounting for the influences by climate and CO 2 on stomatal O 3 uptake, and of developing their representation in models, for risk assessment involving climate change. 1. Introduction Surface ozone (O 3 ) is an air pollutant of major concern, causing reduced crop yield and quality, impaired forest growth and neg- ative effects on human health (The Royal Society, 2008). Due to its strong dependence on meteorological conditions, surface O 3 is sensitive to climate change (Jacob and Winner, 2009). A number of studies have reported increasing background O 3 concentrations over the mid-latitudes of the Northern Hemi- sphere during the last decades (Vingarzan, 2004; Derwent et al., 2007) and modelling studies indicate a significant rise in global mean O 3 concentration in the future unless large emission re- ductions are implemented (Prather et al., 2003; Dentener et al., 2006; Stevenson et al., 2006). For Europe, regional air quality models, simulating the conditions during future climate, gener- ally show increasing O 3 concentrations despite constant anthro- pogenic precursor emissions (Langner et al., 2005; Meleux et al., 2007; Andersson and Engardt, 2010). The increase is mostly ex- plained by increased temperature, decreased cloudiness (Meleux ∗ Corresponding author. e-mail: [email protected] DOI: 10.1111/j.1600-0870.2010.00465.x et al., 2007) and reduced dry deposition (Andersson and Engardt, 2010). Thus, climate change has the potential to counteract emis- sion reductions aimed to limit surface O 3 concentrations. This is important to consider in future air quality and emission control policies (Meleux et al., 2007). Current global yield losses has been estimated to be in the range of 3–16% for four major food crops due to exposure to surface O 3 concentrations, with additional reductions under possible higher O 3 concentrations in the future, posing a serious threat to food security (Van Dingenen et al., 2009). However, the negative effects of O 3 on vegetation are more closely related to the uptake of O 3 through the stomata than to the concen- tration in the ambient air (Emberson et al., 2000b; Ashmore et al., 2004; Pleijel et al., 2004; Uddling et al., 2004; Karlsson et al., 2007a). Factors influencing the stomatal uptake of O 3 therefore have to be considered in risk assessment. A flux- based index (PODY, phytotoxic O 3 dose above a flux threshold Y, earlier called AF st Y, accumulated stomatal flux of O 3 ) has been developed, which takes into account the influence of tem- perature, solar radiation, water vapour pressure deficit (VPD), soil water potential (SWP), atmospheric O 3 concentration and plant development stage (phenology) on stomatal O 3 uptake (LRTAP Convention, 2004; Pleijel et al., 2007). For a given O 3 174 Tellus 63A (2011), 1 PUBLISHED BY THE INTERNATIONAL METEOROLOGICAL INSTITUTE IN STOCKHOLM SERIES A DYNAMIC METEOROLOGY AND OCEANOGRAPHY
-
Upload
independent -
Category
Documents
-
view
2 -
download
0
Transcript of Ozone risk for vegetation in the future climate of Europe based on stomatal ozone uptake...

Tellus (2011), 63A, 174–187 C© 2010 The AuthorsTellus A C© 2010 International Meteorological Institute in Stockholm
Printed in Singapore. All rights reserved
T E L L U S
Ozone risk for vegetation in the future climate ofEurope based on stomatal ozone uptake calculations
By J. K LIN G B ER G 1∗, M . EN G A R D T 2, J. U D D LIN G 1, P.E . K A R LSSO N 3 and H . PLEIJEL 1,1Department of Plant and Environmental Sciences, University of Gothenburg, P.O. Box 461, SE-40530
Gothenburg, Sweden; 2Swedish Meteorological and Hydrological Institute, SE-60176 Norrkoping, Sweden;3Swedish Environmental Research Institute, P.O. Box 5302, SE-40014 Gothenburg, Sweden
(Manuscript received 18 September 2009; in final form 23 April 2010)
A B S T R A C TThe negative impacts of surface ozone (O3) on vegetation are determined by external exposure, leaf gas exchange andplant antioxidant defence capacity, all dependent on climate and CO2 concentrations. In this study the influence ofclimate change on simulated stomatal O3 uptake of a generic crop and a generic deciduous tree at ten European sites wasinvestigated, using the LRTAP Mapping Manual stomatal flux model. O3 concentrations are calculated by a chemistrytransport model (MATCH) for three 30-yr time-windows (1961–1990, 2021–2050, 2071–2100), with constant precursoremissions and meteorology from a regional climate model (RCA3). Despite substantially increased modelled future O3
concentrations in central and southern Europe, the flux-based risk for O3 damage to vegetation is predicted to remainunchanged or decrease at most sites, mainly as a result of projected reductions in stomatal conductance under risingCO2 concentrations. Drier conditions in southern Europe are also important for this result. At northern latitudes, thecurrent parameterisation of the stomatal conductance model suggest O3 uptake to be mainly limited by temperature.This study demonstrates the importance of accounting for the influences by climate and CO2 on stomatal O3 uptake,and of developing their representation in models, for risk assessment involving climate change.
1. Introduction
Surface ozone (O3) is an air pollutant of major concern, causingreduced crop yield and quality, impaired forest growth and neg-ative effects on human health (The Royal Society, 2008). Dueto its strong dependence on meteorological conditions, surfaceO3 is sensitive to climate change (Jacob and Winner, 2009).A number of studies have reported increasing background O3
concentrations over the mid-latitudes of the Northern Hemi-sphere during the last decades (Vingarzan, 2004; Derwent et al.,2007) and modelling studies indicate a significant rise in globalmean O3 concentration in the future unless large emission re-ductions are implemented (Prather et al., 2003; Dentener et al.,2006; Stevenson et al., 2006). For Europe, regional air qualitymodels, simulating the conditions during future climate, gener-ally show increasing O3 concentrations despite constant anthro-pogenic precursor emissions (Langner et al., 2005; Meleux et al.,2007; Andersson and Engardt, 2010). The increase is mostly ex-plained by increased temperature, decreased cloudiness (Meleux
∗Corresponding author.e-mail: [email protected]: 10.1111/j.1600-0870.2010.00465.x
et al., 2007) and reduced dry deposition (Andersson and Engardt,2010). Thus, climate change has the potential to counteract emis-sion reductions aimed to limit surface O3 concentrations. This isimportant to consider in future air quality and emission controlpolicies (Meleux et al., 2007).
Current global yield losses has been estimated to be in therange of 3–16% for four major food crops due to exposureto surface O3 concentrations, with additional reductions underpossible higher O3 concentrations in the future, posing a seriousthreat to food security (Van Dingenen et al., 2009). However,the negative effects of O3 on vegetation are more closely relatedto the uptake of O3 through the stomata than to the concen-tration in the ambient air (Emberson et al., 2000b; Ashmoreet al., 2004; Pleijel et al., 2004; Uddling et al., 2004; Karlssonet al., 2007a). Factors influencing the stomatal uptake of O3
therefore have to be considered in risk assessment. A flux-based index (PODY, phytotoxic O3 dose above a flux thresholdY, earlier called AFstY, accumulated stomatal flux of O3) hasbeen developed, which takes into account the influence of tem-perature, solar radiation, water vapour pressure deficit (VPD),soil water potential (SWP), atmospheric O3 concentration andplant development stage (phenology) on stomatal O3 uptake(LRTAP Convention, 2004; Pleijel et al., 2007). For a given O3
174 Tellus 63A (2011), 1
P U B L I S H E D B Y T H E I N T E R N A T I O N A L M E T E O R O L O G I C A L I N S T I T U T E I N S T O C K H O L M
SERIES ADYNAMIC METEOROLOGYAND OCEANOGRAPHY
OZONE RISK FOR VEGETATION IN THE FUTURE CLIMATE OF EUROPE 175
concentration, the stomatal flux (O3 uptake) will be greater underhumid conditions since dry air and soil moisture deficit inducestomatal closure to minimize plant water loss through transpi-ration. Evaluations have shown the PODY index to be superiorto the concentration-based index AOT40 in explaining yield re-ductions for wheat and potato (Pleijel et al., 2004) as well asbiomass reductions and visible leaf injury for O3 sensitive treespecies (Uddling et al., 2004; Karlsson et al., 2007a). Unlikethe concentration-based index AOT40, the flux-based approachallows modification of O3 sensitivity by climatic conditions tobe incorporated into the risk assessment.
Models of stomatal conductance (gs) have been parametrizedfor a limited number of crop and tree species. Within the UNECELRTAP Convention, a simplified multiplicative gs model hasbeen developed and employed to quantify stomatal O3 flux andestimate the risk for O3 damage to a generic crop and generictree species across Europe (LRTAP Convention, 2004; Simpsonand Emberson, 2006) to be used in large-scale modelling. Mapsof modelled flux-based O3 risk for a generic crop have beenshown to better correspond with field-based evidence of adverseaffects compared to AOT40 (Hayes et al., 2007).
In assessing future O3 risk for vegetation it is important toconsider the reduction of gs in elevated CO2 concentrations(Ainsworth and Rogers, 2007). Plants do not maximise the CO2
uptake, but rather optimise the water use efficiency to looseas little water as possible per CO2 taken up (Jones, 1992). Inhigher CO2 concentrations, the optimum water use efficiencytends to be achieved with smaller stomatal opening. In a casestudy for winter wheat, Harmens et al. (2007) assumed a 35%reduction in gs due to elevated CO2 concentrations and modifiedcurrent (1997) meteorology and O3 concentrations input data toPOD6 calculations for five grid squares in the EMEP model.The results showed that with a 3◦C increase in temperature andconstant absolute humidity, the absorbed O3 dose decreased,despite an assumed 5 ppb increase in O3 concentrations. Theresult is however based on simplified assumptions of the futureclimate. Sitch et al. (2007) estimated the impact of projectedO3 concentrations on the land-carbon sink, by including theeffect of O3 deposition on photosynthesis and the interactionsbetween O3 and CO2 through stomatal closure in their globalland-carbon cycle model. Their results suggest a significant sup-pression of the global land-carbon sink due to negative effectsof O3 on plant productivity. CO2-induced stomatal closure wasfound to offset the O3 suppression of gross primary productionby more than one third. Hence, the combined effects of climaticconditions and elevated CO2 concentrations on future O3 riskfor vegetation are important for future crop and forest produc-tion and should be accounted for in coupled biosphere-climatemodels.
In this study, O3 concentrations from a regional chemistrytransport model (MATCH), driven by meteorological data froma regional climate model (RCA3), was used to estimate ref-erence (1961–1990), near future (2021–2050) and far future
(2071–2100) flux-based O3 risk (PODY) in Europe using theMapping Manual stomatal flux model (LRTAP Convention,2004). Anthropogenic precursor emissions and boundary con-centrations were held constant in the chemistry transport model,in order to limit the investigation to the influence of climatechange.
The aims of the study were:
• To assess the influence of climate change and elevated CO2
concentrations on the flux-based risk for O3 damage to a genericcrop and a generic deciduous tree in Europe. The hypotheseswere that even without changes in O3 precursor emissions, cli-mate change could significantly modify the flux-based O3 riskand that the plant stomatal response to elevated CO2 concen-trations would have the potential to significantly reduce the O3
risk.• To describe the spatial differences in the modelled refer-
ence and future flux-based risk at ten sites along a transect fromnortheast to southwest in Europe. The hypothesis was that dryair and high soil moisture deficit would substantially limit stom-atal flux of O3 in the south, while low temperatures would belimiting in the north.
• To compare the flux-based risk assessment with that basedon AOT40. The hypothesis was that AOT40 would predict arelatively smaller risk in the northern part of Europe and largerrisk in the southern part of Europe in both reference and futureclimate, compared to the flux-based risk assessment.
2. Methods
2.1. Stomatal O3 flux
The stomatal O3 flux was calculated using a multiplicative algo-rithm (an extension of the concepts presented in Jarvis (1976),Emberson et al. (2000a) and Emberson et al. (2000b)), whichincludes functions accounting for the limiting effects of vari-ous abiotic factors on stomatal conductance, thereby regulatingthe O3 flux into the plant leaf. The multiplicative algorithm is(LRTAP Convention, 2004)
gs = gmax × [min(fphen, fO3 )] × flight
× max{fmin, (ftemp × fVPD × fSWP)},(1)
where gs is the stomatal conductance [mmol O3 m−2 sunlit pro-jected leaf area (PLA) s−1] and gmax is the species-specific max-imum gs. The functions f phen, fO3 , f light, f temp, f VPD and f SWP areexpressed in relative terms (take values between 0 and 1) as aproportion of gmax. These parameters allow for the influence ofphenology and O3, and the environmental variables (irradiance,temperature, water VPD and SWP) on gs to be estimated. Thepart of eq. (1) related to f phen and fO3 is a most limiting factorapproach; i.e. gs is limited by either senescence due to normalaging or premature senescence induced by O3.
Tellus 63A (2011), 1

176 J. KLINGBERG ET AL.
The stomatal flux (Fst) of O3 to a plant leaf is calculated usinga resistance analogue
Fst = C(z) × 1
rb + rc
× gs
gs + gext. (2)
The O3 concentration at the top of the canopy [C(z)] is assumedto be a reasonable estimate of the concentration at the surfaceof the laminar leaf boundary layer near the sunlit upper canopyleaves. The 1/(rb + rc) term is the deposition rate to the leafdetermined by the quasi-laminar resistance (rb) and the leafsurface resistance (rc) gs/(gs + gext) represents the fraction of O3
taken up through the stomata, where 1/gext is the external leafresistance.
The POD accumulated per unit projected sunlit leaf area abovea threshold of Y nmol m−2 s−1 was calculated as
PODY =∫
max (Fst − Y , 0) dt . (3)
The PODY is accumulated over a period of time correspondingto the part of the growing season when the plant is consideredto be sensitive to O3.
In this study a simplified flux-based method, recommendedfor large-scale modelling (LRTAP Convention, 2004; Simpsonand Emberson, 2006) was used to indicate the risk for O3 dam-age to a generic crop (POD3crop) and a generic deciduous tree(POD1.6tree). Important simplifications were that O3-inducedpremature senescence was assumed to have no effect on gs (i.e.fO3 = 1) and that a lower threshold were used for the genericcrop than recommended by the LRTAP Convention (2004) forspecific crops (Y = 3 nmol m−2 PLA s−1 for a generic cropcompared to Y = 6 nmol m−2 PLA s−1 for wheat and potato),making the method numerically more robust (Tuovinen et al.,2007). The threshold for trees is Y = 1.6 nmol m−2 PLA s−1.For a generic crop a 3-month time-window for stomatal O3 fluxaccumulation based on latitude (LRTAP Convention, 2004), wasused to bypass the uncertainty in the timing of the relevant time-interval, which, especially for crops, is rather short. The start andlength of the generic deciduous tree stomatal O3 accumulationperiod was based on latitude and altitude (LRTAP Convention,2004). Due to uncertainties caused by difficulties in modelling aplant-relevant SWP, the potentially large variations in soil mois-ture within a model grid and possible irrigation practices, soilmoisture was assumed not to limit gs (i.e. f SWP = 1). In onePODY calculation for the generic deciduous tree, however, aSWP function was included to estimate the potential influenceof this factor on gs and the stomatal O3 flux. It was assumed thatwater was freely available from 0 to –0.05 MPa SWP with a lin-ear decrease in water availability (and gs) below –0.05 MPa downto a minimum at –1.5 MPa SWP (Hall et al., 1977). The stomatalflux algorithm and the parameterisation of the simplified flux-based method for a generic crop and a generic deciduous treeare further described in the LRTAP Convention (2004).
2.2. The CO2 function
Several studies have shown reduced gs (on average 0.66 of thatin 370 ppm CO2) for wheat grown in 550–570 ppm CO2 concen-trations (Wall et al., 2000, 2006). For wheat grown in 700 ppmCO2, the average gs ratio at elevated to ambient (∼350 ppm dur-ing daytime) CO2 was 0.56 (Bunce, 2000). In a meta-analysis,Ainsworth and Rogers (2007) found the reduction in stomatalconductance of C3 crops to be 25% in 567 ppm CO2 comparedto ambient (366 ppm) and Pleijel et al. (2002) found up to a 20%reduction in gs for potato grown in 680 ppm CO2 compared to360 ppm. Ainsworth and Rogers (2007) also found a 19% re-duction of gs in trees grown in elevated CO2 concentrations (567ppm on average) compared to ambient CO2 concentrations (366ppm on average). Medlyn et al. (2001) reported a 21% decreasein gs for trees in response to growth in 700 ppm CO2 comparedto 350 ppm CO2. Based on these studies, CO2 response func-tions (fCO2 ) for a generic crop and a generic deciduous tree wereparametrized and added to eq. (1). The influence of increasingCO2 on gs was, in this study, assumed to linearly decrease be-tween 360 and 560 ppm CO2 concentration from 1 to 0.66 fora generic crop and to 0.8 for a generic deciduous tree, with nofurther reductions in gs above 560 ppm CO2 (Fig. 1). However,there is a large uncertainty with respect to the effect of elevatedCO2 on gs in closed forest stands (Uddling et al., 2009 and refer-ences therein). Because of this uncertainty, the possible effect ofCO2 on PODY was explored as a sensitivity study, by perform-ing the calculations with and without inclusion of fCO2 . Thiswas done also for the generic crop in order to separate effects ofclimatic changes from effects of rising CO2 concentrations onstomatal O3 flux.
2.3. MATCH and RCA3 model set-up and PODYinput data
MATCH is a Eulerian, off-line, regional chemistry transportmodel. A detailed description of the model is available inRobertson et al. (1999). A number of previous studies havedemonstrated the ability of MATCH to realistically simulate O3
concentrations over Europe (e.g. Tilmes et al., 2002; Anders-son et al., 2007; van Loon et al., 2007). In order to investi-gate the effect of future climate change on surface O3, MATCHwas driven by meteorology from the Rossby Centre’s regionalclimate model (RCA3), described in Kjellstrom et al. (2005).In this study RCA3 was forced with climate data from theECHAM4/OPYC3 global model on its boundaries simulatingthe IPCC SRES A2 and B2 emission scenarios (Nakicenovicet al., 2000). A2 is one of the more pessimistic greenhouse gasemission scenarios. The two emission scenarios yield similarclimate change evolution for the first half of the 21st century,but in the second half of the 21st century there is an increas-ingly larger signal in the A2 scenario. The canopy-scale O3 drydeposition to vegetation in MATCH is a function of soil mois-ture, air humidity, temperature and irradiance. Also, emissions
Tellus 63A (2011), 1

OZONE RISK FOR VEGETATION IN THE FUTURE CLIMATE OF EUROPE 177
Fig. 1. The influence of atmospheric CO2
concentrations on stomatal conductance for ageneric crop (GEN-C) and for a genericdeciduous tree (GEN-DT). Relative stomatalconductance (fCO2 ) in relation to (a) CO2
concentration and (b) year using the A2emission scenario. The data points in (a) arethe observations on which the CO2 functionswere based, see Section 2.2 for references.
of biogenic isoprene are calculated online in MATCH. Naturalemissions of other VOCs, sulphur or nitrogen containing com-pounds are not included in the present set-up. Hence, modelledfuture O3 concentrations are affected by changes in photochem-istry, transport patterns, emissions and uptake by vegetation.Anthropogenic emissions and tracer boundary concentrationswere set constant in MATCH, representing the year 2000, inorder to isolate the influence of climate change and not changesin emission patterns. In MATCH three 30-yr periods were sim-ulated: reference (1961–1990), near future (2021–2050) and farfuture (2071–2100). The set-up of the model system is furtherdescribed in Andersson and Engardt (2010). To test if averagePODY for the far future (A2 emission scenario) was significantlydifferent compared the reference period, a two-sided Student’st-test was applied, assuming unequal variances, with 58 degreesof freedom (2 × N−2; N = 30 yr).
For risk assessment purposes it is the stomatal flux of O3
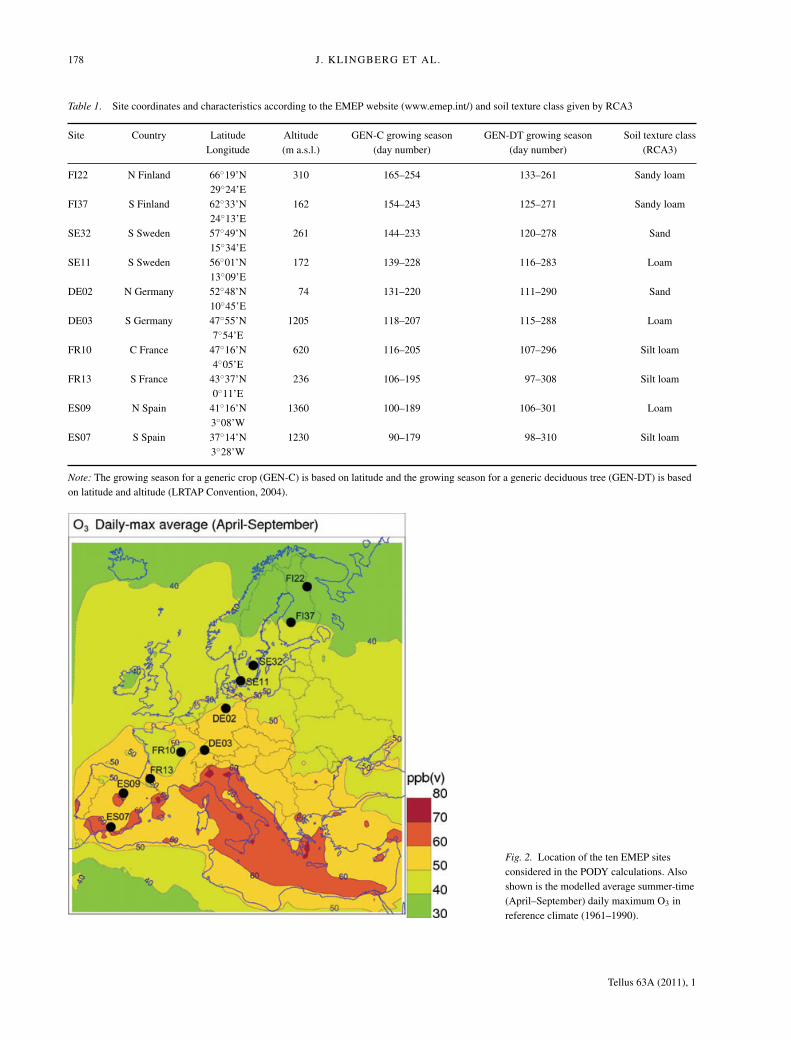
to the sunlit leaf level of specified vegetation types and not thecanopy-scale flux that is important. The PODY was, in this study,calculated off-line for a generic crop and a generic deciduoustree at 10 sites based on modelled data from the correspondinggrid-cell in MATCH (O3) and RCA3 (meteorology). The tenmonitoring sites within the European Monitoring and Evalua-tion Programme (EMEP) within CLRTAP were selected in atransect from northeast to southwest to represent different cli-matic conditions in Europe. Site characteristics and estimatedgrowing seasons can be found in Table 1 and site locations inFig. 2 which also shows the modelled April to September aver-age daily maximum O3 in reference climate (1961–1990). PODYwas calculated for both a generic crop and a generic deciduoustree at all sites although, for example, wheat is presently not a
suitable crop at the northernmost site. However, the distributionof crops and trees are likely to change in response to climatechanges.
O3 and meteorological input data for the PODY calculationsshould be valid for the height of the canopy which is assumedto be 1 m above ground level for a generic crop and 20 mfor a generic deciduous tree. In MATCH, the O3 concentra-tions representing the lowest model layer were downscaled to3 m at every time-step based on local stability and surface de-position velocity using similarity theory. To avoid systematicerrors, a further correction was applied to adjust the 3 m O3
concentrations from MATCH to canopy height. Since values ofu∗ and canopy-scale deposition to vegetation in MATCH werenot available (not saved as output data), the simplified methodin the Mapping Manual (LRTAP Convention, 2004) was used,assuming that the O3 concentration at 1 m was 93% of the 3 mconcentration and that the O3 concentration at 20 m was 105%of the 3 m concentration). Modelled wind speed (3 h resolution,from RCA3) at 10 m was adjusted to canopy height using thelogarithmic wind law, assuming neutral stability. Canopy heightwind speed was used to estimate the leaf boundary layer resis-tance required in the flux calculation. Modelled temperature andrelative humidity (from RCA3) corresponding to 2 m had 3 htemporal resolution. Linear interpolation was applied to receivethe hourly temporal resolution needed for the PODY calcula-tions. Incoming short-wave radiation data with 30 min resolutionwas recalculated to photosynthetic photon flux density (PPFD)by multiplying with a factor of 2 (Monteith and Unsworth,2008). Soil water content summed over the top two soil lay-ers in RCA3 (2.3 m) with six hour resolution was recalculatedto SWP using the Groenevelt-Grant soil water retention model
Tellus 63A (2011), 1
178 J. KLINGBERG ET AL.
Table 1. Site coordinates and characteristics according to the EMEP website (www.emep.int/) and soil texture class given by RCA3
Site Country Latitude Altitude GEN-C growing season GEN-DT growing season Soil texture classLongitude (m a.s.l.) (day number) (day number) (RCA3)
FI22 N Finland 66◦19’N29◦24’E
310 165–254 133–261 Sandy loam
FI37 S Finland 62◦33’N24◦13’E
162 154–243 125–271 Sandy loam
SE32 S Sweden 57◦49’N15◦34’E
261 144–233 120–278 Sand
SE11 S Sweden 56◦01’N13◦09’E
172 139–228 116–283 Loam
DE02 N Germany 52◦48’N10◦45’E
74 131–220 111–290 Sand
DE03 S Germany 47◦55’N7◦54’E
1205 118–207 115–288 Loam
FR10 C France 47◦16’N4◦05’E
620 116–205 107–296 Silt loam
FR13 S France 43◦37’N0◦11’E
236 106–195 97–308 Silt loam
ES09 N Spain 41◦16’N3◦08’W
1360 100–189 106–301 Loam
ES07 S Spain 37◦14’N3◦28’W
1230 90–179 98–310 Silt loam
Note: The growing season for a generic crop (GEN-C) is based on latitude and the growing season for a generic deciduous tree (GEN-DT) is basedon latitude and altitude (LRTAP Convention, 2004).
Fig. 2. Location of the ten EMEP sitesconsidered in the PODY calculations. Alsoshown is the modelled average summer-time(April–September) daily maximum O3 inreference climate (1961–1990).
Tellus 63A (2011), 1

OZONE RISK FOR VEGETATION IN THE FUTURE CLIMATE OF EUROPE 179
(Groenevelt and Grant, 2004) anchored in the point of saturation(Grant et al., 2010)
θ (h) = θs − k1
{exp
(k0
h
)n}, (4)
where θ is the relative water content (m3 m−3), θ s is the rel-ative water content at the point of saturation (m3 m−3) and his the matric suction (m). k0, k1 and n are freely adjustable fit-ting parameters. Values of the parameters used to fit 20 Dutchsoils to the Groenevelt-Grant model (Grant et al., 2010) wasused for the soil types most similar to those in RCA3 (seeTable 1).
2.4. Comparison of simulations and observations
The MATCH-RCA3 performance have earlier been evaluatedand shown good agreement with O3 concentrations measured atEMEP stations in Europe (Engardt et al., 2009; Andersson andEngardt, 2010). The bias for summer and yearly average anddaily maximum concentrations was within ±10% and correla-tions were 0.66–0.90. In this study, average and daily maximumO3 concentrations during the generic crop O3 accumulation pe-riod were used to estimate the performance of the MATCH-RCA3 modelling system for the ten selected EMEP monitoringsites. Modelled 3 m O3 concentrations from the last 10 yr ofthe reference period (i.e.1981–1990) were compared to O3 mea-surements during 1995–2006. The measurements were centredaround the year of precursor emissions used in MATCH (year2000). Only years with less than 10% missing data during thegeneric crop-growing season were included. The (spatial) cor-relations were high, 0.60 for average O3 and 0.85 for dailymaximum, and the average bias small (+1.5% bias of averageO3 and –3.7% bias of the daily maximum).
Hourly temperature and VPD from RCA3 (1981–1990) werecompared to the surface analysis (1998–2005) from a high res-olution (11 km) analysis system (MESAN, Haggmark et al.,2000). MESAN-data were only available for the five northern-most sites (FI22, FI37, SE32, SE11 and DE02). Comparisonof data from the generic crop O3 accumulation period showeda good agreement of average temperature from RCA3 (–2.5%bias in ◦C) but consistently smaller range and standard devia-tion. The 90-percentile temperature was 3.2◦C lower in RCA3compared to the surface analysis on average. Since high VPDoccurs at high temperatures, the underestimation in temperatureresults in a large VPD underestimation (–43% bias on average).An explanation could be smaller diurnal variation in the regionalscale RCA3 compared to the surface analysis with higher res-olution and a better capture of local scale processes. The largeunderestimation of VPD may cause overestimation of gs andstomatal O3 flux. The sensitivity of the calculation of POD3crop
due to underestimated VPD input data was analysed by the cal-culation of the percentage change in the POD3crop index causedby a 50% increase in the modelled VPD from RCA3. Modelled
temperature, VPD and O3 used for the PODY calculations areshown in Fig. 3.
3. Results
3.1. Concentration-based versus flux-based riskfor O3 damage to a generic crop
In general, model calculated O3 concentrations increase towardssouthern Europe (Fig. 2). The concentration-based AOT40 in-dex, calculated for daylight hours during the 3 months corre-sponding to the generic crop growing season (Fig. 4), indicatesa higher O3 risk in southern compared to northern Europe. Al-ready in the reference climate the current AOT40 critical level of3 ppm h (LRTAP Convention, 2004) is exceeded at many sites.Note, however, that the 3 month growing season depends on lat-itude in this study, which can differ from the May–July AOT40,used e.g. in EU directives for vegetation risk assessments. At6 of the 10 sites investigated, there is a large increase in fu-ture AOT40, especially in the 2071–2100 A2 emission scenario,where five sites (DE03, FR10, FR13, ES09 and ES07) will ex-perience more than a doubling of AOT40. The four Nordic sites(FI22, FI37, SE32 and SE11) exhibit small changes in AOT40.Since emissions were held constant during the simulations, theincrease in O3 concentration is entirely due to changes in theclimate. The increase in southern Europe O3 concentrations hasbeen explained by reduced dry deposition caused by a changedclimate affecting the uptake to vegetation, while increasing iso-prene emissions played a minor role (Andersson and Engardt,2010).
The geographical pattern of the generic crop POD3crop is con-siderably different compared to that of AOT40 (Fig. 5). Both inreference and future climate, the stomatal O3 flux is largest incentral Europe. The reduction in gs is 34% in the 2071–2100A2 period due to CO2 concentrations above 550 ppm (Fig. 1).As a result, the sites with the largest increase in AOT40 by2071–2100 in the A2 emission scenario show non-significantchanges in POD3crop (DE03 and FR10) or a large decrease inPOD3crop (statistically significant with p < 0.0001 for FR13,ES09 and ES07). In the same period, the two Swedish sitesshow a small but significant increase in POD3crop (p = 0.0119for SE32 and p = 0.0268 for SE11). The same geographicalpattern and direction of changes are found for POD0crop (datanot shown), indicating that the result is not dependent on thechoice of threshold.
At the northern sites the O3 concentration is low and thetemperature function significantly limits the gs (average f temp
substantially below 1, see Table 2). With no inclusion offCO2 , POD3crop increase significantly at the Nordic sites in the2071–2100 A2 period compared to the reference period (p <
0.0001 for FI22, FI37, SE32 and SE11). The increase can beexplained by higher temperatures and, for SE11, to some ex-tent higher O3 concentrations. For example, at the northernmost
Tellus 63A (2011), 1

180 J. KLINGBERG ET AL.
Fig. 3. Box- and whisker plots of the RCA3and MATCH data for the accumulationperiod of the generic crop used as input inthe stomatal conductance model during (a)1961–1990 and (b) 2171–2100 using theSRES A2 emission scenario.
site (FI22) the average f temp in reference climate is only 0.24but increase to 0.49 in 2071–2100 A2, while the average VPDinfluence on stomatal conductance does not change (averagef VPD does not fall below 1.00 in reference or future climate, seeTable 2). Without the influence of fCO2 , POD3crop more thandouble at FI22 while the average O3 concentration decrease byapproximately 1 ppb.
In central Europe, the O3 concentrations are high and climaticconditions favour stomatal O3 uptake. The large increase in O3
concentrations by 2071–2100 A2, together with considerablyhigher f temp, but only slightly lower f VPD (Table 2) result in asignificantly increased stomatal O3 flux compared to reference
climate (p < 0.0001 for DE02, DE03 and FR10), when fCO2 isnot included in the calculation.
As shown in Table 2, f VPD substantially limits the gs at thethree southernmost sites (FR13, ES09 and ES07) already in ref-erence climate. For example, average f VPD at the southernmostsite (ES07) is 0.75 compared to 1.00 at the site with largestPOD3crop (DE02). Even without the inclusion of fCO2 , the stom-atal O3 flux does not increase in the future climate, despite a largeincrease in O3 concentration (5 ppb on average) by 2071–2100A2, due to increased VPD.
The pattern is similar for the B2 emission scenario (see Ap-pendix S1 in the Supporting Information). The increase in O3
Tellus 63A (2011), 1

OZONE RISK FOR VEGETATION IN THE FUTURE CLIMATE OF EUROPE 181
Fig. 4. Average 3-month daylight AOT40(corresponding to the generic crop growingseason) at the different sites, based on O3
concentrations at 1 m. Error bars showstandard deviation (N = 30 yr). Currentcritical level is 3 ppm h, which is indicatedby the horizontal line.
Fig. 5. Average phytotoxic O3 dose for ageneric crop (POD3crop) during 1961–1990,2021–2050 and 2071–2100 following theSRES A2 emission scenario. The striped partof the bars show average POD3crop when thegs response function for CO2 (fCO2 ) isincluded in the calculation. Error bars showstandard deviation (N = 30 yr). Circles areaverage O3 concentration (scale on the right)for the same time periods as POD3crop isaccumulated.
Table 2. Average daylight f temp and f VPD for a generic crop duringthe 30-yr reference period and year 2071–2100 following the SRES A2emission scenario
1961–1990 2071–2100 A2
Site f temp f VPD f temp f VPD
FI22 0.24 1.00 0.49 1.00FI37 0.36 1.00 0.61 1.00SE32 0.34 1.00 0.65 0.99SE11 0.37 1.00 0.65 1.00DE02 0.48 1.00 0.73 0.96DE03 0.46 0.98 0.72 0.84FR10 0.46 0.99 0.74 0.87FR13 0.58 0.85 0.70 0.53ES09 0.47 0.88 0.72 0.56ES07 0.59 0.75 0.77 0.44
concentration at the five southernmost sites is smaller thanin the A2 emission scenario (2.7 ppb difference between the2071–2100 B2 and the reference period, compared to 5.3 ppbin A2). The f VPD does not limit gs at the southernmost sites
to the same extent, while the increase in gs due to increasingtemperature at the northernmost sites is not as large.
The effect of increasing the calculated VPD from RCA3 with50% on average daylight f VPD and POD3crop is shown in Table 3.The gs response to elevated CO2 was not included in this cal-culation. The average f VPD is mainly influenced at the southernsites in the reference period and the central and southern sitesin the 2071–2100 A2 period. The decrease in f VPD result in aconsiderable reduction of POD3crop compared to the base cal-culations at the southern sites. However, the temporal trend andgeographical pattern is not affected.
3.2. Concentration-based versus flux-based risk for O3
damage to a generic deciduous tree
The spatial pattern of AOT40 calculated over the generic de-ciduous tree growing season (data not shown) is very similarto that of the generic crop, with large increases in AOT40 atthe six southernmost sites, especially for the 2071–2100 A2 pe-riod. The spatial pattern of the generic deciduous tree POD1.6tree
following the A2 scenario (Fig. 6) is also similar to that for ageneric crop (POD3crop), with largest stomatal O3 flux in central
Tellus 63A (2011), 1

182 J. KLINGBERG ET AL.
Table 3. The effect of increasing the calculated VPD from RCA3with 50% on the average daylight f VPD and average POD3crop (fCO2
not included) for a generic crop during the 30-yr reference period andyear 2071–2100 following the SRES A2 emission scenario
1961–1990 (VPD×1.5) 2071–2100 A2 (VPD×1.5)
Site f VPD POD3crop %change f VPD POD3crop %change
FI22 0.99 2.2 −14 1.00 5.1 −3FI37 0.99 6.2 −7 0.99 11.7 −2SE32 0.99 7.9 −5 0.96 17.9 −8SE11 0.99 14.0 −2 0.98 27.3 −5DE02 0.98 19.7 −7 0.87 28.3 −18DE03 0.92 16.0 −20 0.70 21.0 −31FR10 0.96 13.6 −14 0.73 19.2 −28FR13 0.70 9.5 −42 0.37 8.4 −47ES09 0.73 7.2 −50 0.38 7.3 −54ES07 0.55 5.6 −61 0.26 5.0 −62
Note: % change refers to the change in POD3crop compared to thecalculation without the increase in VPD (shown in Fig. 5).
Europe. At all sites POD1.6tree was significantly reduced in the2071–2100 A2 period compared to the reference period (p <
0.0001) due to the assumed reduction of gs by 20% with CO2
concentrations above 550 ppm (Fig.1).Low and decreasing O3 concentrations as well as low av-
erage f temp (see Table 4) result in small POD1.6tree at the twonorthernmost sites (FI22 and FI37), and no significant changeby 2071–2100 A2 when the influence of fCO2 is not includedin the calculation. SE32, SE11 and DE02 experience increasedstomatal O3 flux in the 2071–2100 A2 period (p < 0.0001) com-pared to the reference period, due to climate changes, explainedby increases in O3 concentration and average f temp.
The gs of the generic deciduous tree has a lower temperatureoptimum compared to the generic crop (Topt = 21◦C instead of26◦C) and at the southernmost sites (FR13, ES09 and ES07)high temperatures limit gs in 2071–2100 A2. In addition to the
Table 4. Average daylight f temp, f VPD and f SWP for a genericdeciduous tree during the 30-yr reference period and year 2071–2100following the SRES A2 emission scenario
1961–1990 2071–2100 A2
Site f temp f VPD f SWP f temp f VPD f SWP
FI22 0.77 1.00 0.99 0.88 1.00 0.99FI37 0.82 1.00 0.99 0.91 1.00 0.99SE32 0.83 1.00 1.00 0.92 0.99 1.00SE11 0.84 1.00 1.00 0.94 1.00 0.98DE02 0.87 1.00 1.00 0.92 0.95 0.97DE03 0.88 0.97 0.96 0.84 0.78 0.83FR10 0.88 0.99 0.99 0.85 0.81 0.79FR13 0.86 0.81 0.45 0.66 0.53 0.22ES09 0.85 0.80 0.80 0.71 0.55 0.60ES07 0.84 0.64 0.38 0.64 0.44 0.20
dry air conditions (low average f VPD, see Table 4) this resultin a significantly reduced stomatal O3 flux (p < 0.0001) de-spite a large increase in average O3 concentration even withoutthe inclusion of fCO2 in the calculations. The result for the B2emission scenario can be seen in Appendix S2 in the supportinginformation
To estimate the potential influence of soil moisture, a SWPfunction was included in one POD1.6tree calculations (Fig. 7).The gs response to elevated CO2 was not included. The resultsindicate that f SWP mainly limit O3 uptake at the southern sites(Table 4). The SWP function is especially limiting at FR13 andES07.
4. Discussion
This study investigated how the changing climatic conditionsand elevated atmospheric CO2 concentrations may modify leafuptake of O3 and, hence, the risk for negative impacts on crops
Fig. 6. Average phytotoxic O3 dose for ageneric deciduous tree (POD1.6tree) during1961–1990, 2021–2050 and 2071–2100following the SRES A2 emission scenario.The striped part of the bars show averagePOD1.6tree when the gs response functionfor CO2 (fCO2 ) is included in the calculation.Error bars show standard deviation (N =30 yr). Circles are average O3 concentration(scale on the right) for the same time periodsas POD1.6tree is accumulated.
Tellus 63A (2011), 1

OZONE RISK FOR VEGETATION IN THE FUTURE CLIMATE OF EUROPE 183
Fig. 7. Average phytotoxic O3 dose for ageneric deciduous tree (POD1.6tree) during1961–1990, 2021–2050 and 2071–2100following the SRES A2 emission scenario.Included in the POD1.6tree calculation is thegs response function for SWP (f SWP), butnot for CO2 (fCO2 ). Error bars showstandard deviation (N = 30 yr).
and forest trees. In agreement with earlier studies (Simpson andEmberson, 2006; Emberson et al., 2007; Simpson et al., 2007)the spatial flux-based risk pattern for O3 damage differed sub-stantially from the AOT40-based risk, in the reference as well asfuture climate and irrespective of emission scenario (A2 or B2).It is important to take the influence of climate change into ac-count in future risk assessment of surface O3, since factors suchas warming, changes in amount and distribution of precipitation,shifts in growing season and elevated CO2 concentrations affectthe stomatal uptake of O3 into the leaves (Harmens et al., 2007).Flux-based models are generally considered to be more phys-iologically relevant compared to exposure-based indices suchas AOT40. The AOT40 index only reflects changes in the am-bient O3 concentration, while the flux-based PODY index alsoallows climatic conditions and the CO2 concentration to modifystomatal uptake rates of O3, in line with important physiologicalmechanisms.
The results in this study clearly showed that the expected re-duction in gs with rising atmospheric CO2 concentrations is oflarge importance for the decrease in projected future flux-basedO3 risk. Harmens et al. (2007) also showed that the reducedgs under higher CO2 concentrations has the potential to signifi-cantly reduce the risk for O3 damage. For crops, there seem to beconsensus among studies that plants growing under elevated CO2
concentrations have reduced gs (Bunce, 2000; Wall et al., 2000;Ainsworth and Rogers, 2007), but the magnitude of this effectunder realistic agronomic conditions is less certain. For forests,gs may not at all decrease with rising atmospheric CO2 concen-trations in many tree species. In four out of five free-air CO2
enrichments experiments in closed forests, gs was not signifi-cantly reduced under elevated CO2 concentrations (Ellsworth,1999; Bernacchi et al., 2003 (pre-coppice canopy closure); Keelet al., 2007; Maier et al., 2008; Uddling et al., 2009; but seeGunderson et al., 2002 and Domec et al., 2009). In the longterm, cumulative effects of elevated CO2 on plant growth andstand structure may be more important than the primary stomatal
closure response to increased CO2 in determining gs in closedforests (Uddling et al., 2008; Uddling et al., 2009).
In a flux-based risk assessment for pine, beech and oak duringone year at three sites in Europe, Emberson et al. (2007) foundphenology (f phen) and soil water (f SWP) to be the key driverslimiting the seasonal profile of O3 flux. Tuovinen et al. (2009)emphasised the urgent need to develop soil moisture status mod-elling and its effect on gs for forests (crops may be irrigated). Inthe base case of our results, soil moisture is assumed to neverlimit gs, mainly because of difficulties in estimating the plant-relevant soil water potential valid for the integrated rooting zoneof vegetation inside an entire model grid. The simulation in-cluding f SWP for the generic deciduous tree indicated, however,that soil water deficits have the potential to limit stomatal uptakeof O3 in southern Europe and that this limitation is likely toincrease in the future (Fig. 7). The conversion (based on avail-able data from RCA3) of mean soil water content to mean SWPacross a 2.3 m soil profile may represent an oversimplificationas it does not capture the vertical gradients in soil water statusand its integrated, non-linear, effect on plant water availability.Therefore, the assessment of the impact of geographical differ-ences and temporal changes in soil moisture on stomatal O3 fluxpresented here indicates directions rather than magnitudes of thelikely effects.
Several studies have reported an earlier onset of spring and aprolongation of the growing season in mid and high latitudes as-sociated with global warming (Linderholm, 2006; Menzel et al.,2006). Changes in the timing of the growing season were omit-ted in this study, which assumed a fixed growth interval basedon latitude. For specific crops, such as wheat, cumulative expo-sure may decline in a warmer climate due to accelerated plantdevelopment (Fuhrer, 2009). An earlier start of the growing sea-son for wheat could result in a reduced overlap between theO3 exposure accumulation period and the peak summer O3 lev-els (Harmens et al., 2007; Fuhrer, 2009). Conversely, an earliergrowing season may lead to more frequent co-occurrence of
Tellus 63A (2011), 1

184 J. KLINGBERG ET AL.
sensitive stages and spring-time peaks in O3 in the northern partof the Nordic countries (Karlsson et al., 2007b; Klingberg et al.,2009). For the generic crop, the 3 month growing season, muchlonger than the approximately 55-d period of high O3 sensitivityfor wheat (LRTAP Convention, 2004), allows the POD3crop in-dex to be less sensitive to changes in the timing of the growingseason and can be interpreted as maximum potential risk. Fortrees, the growth period, and thus the period of O3 uptake, islikely to be prolonged in a future warmer climate (Taylor et al.,2008), implying an underestimation of the future O3 risk in thisassessment.
There are large uncertainties in both climate projections andparameters in models for O3 risk assessment, as pointed outby Fuhrer (2009). Leaf properties determining the rate of O3
uptake and the biochemical defence capacity can be modifiedby changes in temperature, air humidity, soil moisture and in-creasing CO2 concentration. O3 uptake calculations may only beaccurate when applied under conditions representative of thoseunder which the parameterisation was performed, increasingthe uncertainty when extrapolating to future climatic conditions(Fuhrer, 2009). Ashmore (2005) requested the development ofnew models, linking stomatal flux and detoxification processesto carbon assimilation and allocation, to include the capacity ofspecies to adapt to changes in nutrient and water availability.Also, Musselman et al. (2006) emphasized the need to considerdetoxification mechanisms in flux-based models, but noted thelarge uncertainty in quantifying the various defence mechanismsin plants.
In this study, the current LRTAP Convention (2004) parame-terisation of the gs model indicated that f temp was considerablymore important than f VPD in limiting O3 uptake for the genericcrop (Table 2) as well as for the generic tree at the northern sites(Table 4). This large importance of f temp compared to f VPD inlimiting gs could be questioned, considering the fact that mini-mizing water loss is a main function of stomata. The bell shapedoptimum curve of the temperature function for crops seemsuncertain as it predicts complete stomatal closure at tempera-tures below 12◦C and above 40◦C, which is hardly realistic forthe Nordic and Mediterranean regions, respectively. Most phys-iological responses are known to acclimate to the prevailingtemperature (e.g. Larcher, 2003; Korner, 2006) and both spa-tial (cold north vs. warm south) and temporal (during climatechange) acclimation of the stomatal temperature response arethus likely. A certain degree of stomatal closure in response tolow temperatures can be expected in colder conditions, but fur-ther evaluation of the stomatal temperature response function isrequired to improve predictions of the effect of climate on stom-atal O3 flux. In addition, modelled stomatal O3 flux stronglydepends on the quality of the gmax value (Fuhrer, 2009), whichdiffers significantly between species and is likely to depend onclimatic region.
The PODY calculations are strongly dependent on the qual-ity of the input data. The coarse spatial resolution of regional
climate models (50 × 50 km2) limits the details of importantprocesses, such as diurnal range and extremes. Local scale char-acteristics, e.g. promoting nighttime air temperature inversions,may cause large diurnal O3 range deviating from the averageconditions of the model grid (Klingberg et al., 2008). The largeunderestimation of VPD in RCA3 (–43% bias on average for thefive northernmost sites) is of special concern for the stomatalO3 uptake calculations and may cause an overestimation of theflux-based O3 risk (Table 3). The importance of representativediurnal dynamics in temperature and VPD is emphasized whenregional scale modelled data are used for stomatal O3 uptakecalculations. Klingberg et al. (2008) estimated the sensitivity ofPOD0 and POD6 calculations for potato to small changes ininput data in more detail for a site in southwest Sweden. A 10%change in O3 and temperature resulted in approximately 20%and 34–40% change in POD6, respectively. Without the fluxthreshold (POD0), the change was smaller. The sensitivity to a10% change in VPD was much smaller (3–5% change in POD),but it was concluded that this factor presumably plays a muchgreater role in drier conditions. Other important simplificationsare that the land-cover does not change with changing climatein MATCH and that meteorology is only based on one set-up ofthe climate model.
The uncertainties discussed above result in considerably un-certainty in the exact value of the stomatal O3 fluxes reportedhere. The most important uncertainties are considered to be theprojections of future atmospheric changes and the parameter-isation of the stomatal O3 flux model, neglecting both spatialand temporal acclimation and adaptation. More research is re-quired to reduce the uncertainties before projected POD3crop andPOD1.6tree can be used to give reasonable estimates of Europeanyield or growth loss due to O3 damage. This study does there-fore not intend to predict European yield or growth losses dueto O3 damage in the future. The flux-based approach is, how-ever, an improvement compared to AOT40. Notwithstanding thementioned uncertainties we believe that there is high confidencein the general pattern and directions of change obtained in thisstudy of how future climatic conditions will influence the O3
risk for vegetation in Europe.
5. Conclusions
• The increase in modelled future surface O3 concentrationsis large in southern Europe, despite constant precursor emis-sions in MATCH. However, the future stomatal O3 uptake re-main unchanged or decrease at most sites for a generic cropand decrease at all sites for a generic deciduous tree, mainlyas a result of the modelled reduction in stomatal conductancewith rising atmospheric CO2. Drier air and high soil moisturedeficit as well as high temperatures are also important in southernEurope. However, if the CO2 gs response function is ex-cluded from the analysis, which may be realistic for foresttrees (Uddling et al., 2009 and references therein), the future
Tellus 63A (2011), 1

OZONE RISK FOR VEGETATION IN THE FUTURE CLIMATE OF EUROPE 185
stomatal O3 flux is reduced only in southern Europe for thegeneric deciduous tree.
• The largest flux-based O3 risk for a generic crop and ageneric deciduous tree is found at the central European sites,in both the reference and projected future climate. This patterndiffers substantially from the concentration-based AOT40 index,indicating largest O3 risk in southern Europe.
• According to the current gs model parameterisation, thetemperature function limits the stomatal O3 flux in northernEurope considerably, while the VPD and SWP functions areimportant mainly in southern Europe.
• This study demonstrates the importance to account for theclimatic and atmospheric CO2 influences on stomatal O3 uptakefor improved risk assessment in a changing atmosphere andclimate.
6. Acknowledgments
Thanks are due to Patrick Samuelsson and Barry Broman at theRossby Centre for providing climate data in a suitable format.Thanks are also due to the research programme Climate Changeand Environmental Objectives (CLEO), funded by the SwedishEnvironmental Protection Agency, for supporting the work byPer Erik Karlsson, Magnuz Engardt and Hakan Pleijel.
References
Ainsworth, E. A. and Rogers, A. 2007. The response of photosynthesisand stomatal conductance to rising [CO2]: mechanisms and environ-mental interactions. Plant Cell Environ. 30, 258–270.
Andersson, C. and Engardt, M. 2010. European ozone in a future climate:importance of changes in dry deposition and isoprene emissions. J.Geophys. Res.-Atmos. 115, D02303. doi: 10.1029/2008JD011690.
Andersson, C., Langner, J. and Bergstrom, R. 2007. Interannual variationand trends in air pollution over Europe due to climate variabilityduring 1958–2001 simulated with a regional CTM coupled to theERA40 reanalysis. Tellus 59B, 77–98.
Ashmore, M., Emberson, L., Karlsson, P. E. and Pleijel, H. 2004. Newdirections: a new generation of ozone critical levels for the protectionof vegetation in Europe. Atmos. Environ. 38, 2213–2214.
Ashmore, M. R. 2005. Assessing the future global impacts of ozone onvegetation. Plant Cell Environ. 28, 949–964.
Bernacchi, C. J., Calfapietra, C., Davey, P. A., Wittig, V. E., Scarascia-Mugnozza, G. E. and co-authors. 2003. Photosynthesis and stomatalconductance responses of poplars to free-air CO2 enrichment (Pop-FACE) during the first growth cycle and immediately following cop-pice. New Phytol. 159, 609–621.
Bunce, J. A. 2000. Responses of stomatal conductance to light, humidityand temperature in winter wheat and barley grown at three concentra-tions of carbon dioxide in the field. Global Chang. Biol. 6, 371–382.
Dentener, F., Stevenson, D., Ellingsen, K., van Noije, T., Schultz, M.and co-authors. 2006. The global atmospheric environment for thenext generation. Environ. Sci. Technol. 40, 3586–3594.
Derwent, R. G., Simmonds, P. G., Manning, A. J. and Spain, T. G. 2007.Trends over a 20-year period from 1987 to 2007 in surface ozone at
the atmospheric research station, Mace Head, Ireland. Atmos. Environ.
41, 9091–9098.Domec, J. C., Palmroth, S., Ward, E., Maier, C. A., Therezien, M. and
Oren, R. 2009. Acclimation of leaf hydraulic conductance and stom-atal conductance of Pinus taeda (loblolly pine) to long-term growthin elevated CO2 (free-air CO2 enrichment) and N-fertilization. Plant
Cell Environ. 32, 1500–1512.Ellsworth, D. S. 1999. CO2 enrichment in a maturing pine forest: are
CO2 exchange and water status in the canopy affected? Plant Cell
Environ. 22, 461–472.Emberson, L., Simpson, D., Tuovinen, J. P., Ashmore, M. and Cam-
bridge, H. M. 2000a. Towards a model of ozone deposition and stom-atal uptake over Europe. EMEP MSC-W Note 6/2000. NorwegianMeteorological Institute, Oslo, Norway. Available at: www.emep.int.
Emberson, L. D., Ashmore, M. R., Cambridge, H. M., Simpson, D. andTuovinen, J. P. 2000b. Modelling stomatal ozone flux across Europe.Environ. Pollut. 109, 403.
Emberson, L. D., Buker, P. and Ashmore, M. R. 2007. Assessing the riskcaused by ground level ozone to European forest trees: a case study inpine, beech and oak across different climate regions. Environ. Pollut.147, 454–466.
Engardt, M., Bergstrom, R. and Andersson, C. 2009. Climate and emis-sion changes contributing to changes in near-surface ozone in Europeover the coming decades—results from model studies. Ambio 38,452–458.
Fuhrer, J. 2009. Ozone risk for crops and pastures in present and futureclimates. Naturwissenschaften 96, 173–194.
Grant, C. D., Groenevelt, P. H. and Robinson, N. I. 2010. Applicationof the Groenevelt-Grant soil water retention model to predict thehydraulic conductivity. Aust. J. Soil Res. In press.
Groenevelt, P. H. and Grant, C. D. 2004. A new model for the soil-waterretention curve that solves the problem of residual water contents.Eur. J. Soil Sci. 55, 479–485.
Gunderson, C. A., Sholtis, J. D., Wullschleger, S. D., Tissue, D. T., Han-son, P. J. and co-authors. 2002. Environmental and stomatal controlof photosynthetic enhancement in the canopy of a sweetgum (Liq-
uidambar styraciflua L.) plantation during 3 years of CO2 enrichment.Plant Cell Environ. 25, 379–393.
Hall, D. G. M., Reeve, M. J., Thomson, A. J. and Wright, V. F. 1977. Wa-ter retention, porosity and density of field soils. Technical MonographNo 9. Soil Survey, Rothhamstead Experimental Station, UK.
Harmens, H., Mills, G., Emberson, L. D. and Ashmore, M. R. 2007.Implications of climate change for the stomatal flux of ozone: a casestudy for winter wheat. Environ. Pollut. 146, 763–770.
Hayes, F., Mills, G., Harmens, H. and Norris, D. 2007. Evi-dence of Widespread Ozone damage to Vegetation in Europe(1990–2006). Programme Coordination Centre for the ICP Vegeta-tion, Centre for Ecology and Hydrology, UK, pp. 58. Available at:http://icpvegetation.ceh.ac.uk.
Haggmark, L., Ivarsson, K. I., Gollvik, S. and Olofsson, R. O. 2000.MESAN, an operational mesoscale analysis system. Tellus 52A, 2–20.
Jacob, D. J. and Winner, D. A. 2009. Effect of climate change on airquality. Atmos. Environ. 43, 51–63.
Jarvis, P. G. 1976. The interpretation of the variations in leaf waterpotential and stomatal conductance found in canopies in the field.Phil. Trans. R. Soc., Lond., B 87, 593–610.
Tellus 63A (2011), 1
186 J. KLINGBERG ET AL.
Jones, H. G. 1992. Plants and Microclimate. A Quantitative Approach to
Environmental Plant Physiology. 2nd Edition. Cambridge UniversityPress, Cambridge, pp. 428.
Karlsson, P. E., Braun, S., Broadmeadow, M., Elvira, S., Emberson, L.and co-authors. 2007a. Risk assessments for forest trees: the perfor-mance of the ozone flux versus the AOT concepts. Environ. Pollut.
146, 608–616.Karlsson, P. E., Tang, L., Sundberg, J., Chen, D., Lindskog, A. and
co-authors. 2007b. Increasing risk for negative ozone impacts on veg-etation in northern Sweden. Environ. Pollut. 150, 96–106.
Keel, S. G., Pepin, S., Leuzinger, S. and Korner, C. 2007. Stomatalconductance in mature deciduous forest trees exposed to elevatedCO2. Trees 21, 151–159.
Kjellstrom, E., Barring, L., Gollvik, S., Hansson, U., Jones, C. and co-authors. 2005. A 140-year simulation of European climate with thenew version of the Rossby Centre regional atmospheric climate model(RCA3). In: SMHI Reports Meteorology and Climatology No. 108.SMHI, SE-60176 Norrkoping, Sweden, 54.
Klingberg, J., Danielsson, H., Simpson, D. and Pleijel, H. 2008. Com-parison of modelled and measured ozone concentrations and meteo-rology for a site in south-west Sweden: implications for ozone uptakecalculations. Environ. Pollut. 155, 99–111.
Klingberg, J., Bjorkman, M. P., Pihl Karlsson, G. and Pleijel, H. 2009.Observations of ground-level ozone and NO2 in northernmost Swe-den, including the Scandian Mountain Range. Ambio 38, 448–451.
Korner, C. 2006. Significance of temperature in plant life. In: PlantGrowth and Climate Change (eds J. I. L. Morison and M. D. More-craft), Blackwell Publishing, Oxford, UK, 48–69.
Langner, J., Bergstrom, R. and Foltescu, V. 2005. Impact of climatechange on surface ozone and deposition of sulphur and nitrogen inEurope. Atmos. Environ. 39, 1129–1141.
Larcher, W. 2003. Physiological Plant Ecology. 4th Edition, Springer-Verlag, Berlin, Germany, 513.
Linderholm, H. W. 2006. Growing season changes in the last century.Agric. Forest Meteorol. 137, 1–14.
LRTAP Convention 2004. Manual on methodologies and criteria for
Modelling and Mapping Critical Loads & Levels and Air PollutionEffects, Risks and Trends. Updated August 2008. Available and con-tinuously updated at: www.icpmapping.org.
Maier, C. A., Palmroth, S. and Ward, E.. 2001. Short-term effects offertilization on photosynthesis and leaf morphology of field-grownloblolly pine following long-term exposure to elevated CO2 concen-tration. Tree Physiol. 28, 597–606.
Medlyn, B. E., Barton, C. V. M., Broadmeadow, M. S. J., Ceulemans, R.,De Angelis, P. and co-authors. 2001. Stomatal conductance of forestspecies after long-term exposure to elevated CO2 concentration: asynthesis. New Phytol. 149, 247–264.
Meleux, F., Solmon, F. and Giorgi, F. 2007. Increase in summer Eu-ropean ozone amounts due to climate change. Atmos. Environ. 41,7577–7587.
Menzel, A., Sparks, T. H., Estrella, N., Koch, E., Aaasa, A. and co-authors. 2006. European phenological response to climate changematches the warming pattern. Global Chang. Biol. 12, 1969–1976.
Monteith, J. and Unsworth, M. H. 2008. Principles of Environmental
Physics. 3rd Edition. Academic Press, London, 418.Musselman, R. C., Lefohn, A. S., Massman, W. J. and Heath, R. L. 2006.
A critical review and analysis of the use of exposure- and flux-based
ozone indices for predicting vegetation effects. Atmos. Environ. 40,1869–1888.
Nakicenovic, N., Alcamo, J., Davis, G., Vries, B.d., Fenhann, J. andco-authors. 2000. Emission Scenarios: A special report of IPCC
Working Group III. Cambridge University Press, Cambridge, UK,599.
Pleijel, H., Danielsson, H., Vandermeiren, K., Blum, C., Colls, J. and co-authors. 2002. Stomatal conductance and ozone exposure in relationto potato tuber yield-results from the European CHIP programme.Eur. J. Agron. 17, 303–317.
Pleijel, H., Danielsson, H., Ojanpera, K., Temmerman, L. D., Hogy,P. and co-authors. 2004. Relationships between ozone exposureand yield loss in European wheat and potato—a comparison ofconcentration- and flux-based exposure indices. Atmos. Environ. 38,2259–2269.
Pleijel, H., Danielsson, H., Emberson, L., Ashmore, M. R. and Mills,G. 2007. Ozone risk assessment for agricultural crops in Europe:further development of stomatal flux and flux-response relationshipsfor European wheat and potato. Atmos. Environ. 41, 3002–3040.
Prather, M., Gauss, M., Berntsen, T., Isaksen, I., Sundet, J. and co-authors. 2003. Fresh air in the 21st century? Geophys. Res. Lett. 30,1100. doi: 10.1029/2002GL016285.
Robertson, L., Langner, J. and Engardt, M. 1999. An Eulerian limited-area atmospheric transport model. J. Appl. Meteorol. 38, 190–210.
Simpson, D. and Emberson, L. 2006. Ozone fluxes—updates, chapter 5in EMEP status report 1/2006, Transboundary acidification, eutrophi-cation and ground level ozone in Europe since 1990 to 2004. Availableat: www.emep.int.
Simpson, D., Ashmore, M. R., Emberson, L. and Tuovinen, J. P. 2007. Acomparison of two different approaches for mapping potential ozonedamage to vegetation. A model study. Environ. Pollut. 146, 715–725.
Sitch, S., Cox, P. M., Collins, W. J. and Huntingford, C. 2007. Indirectradiative forcing of climate change through ozone effects on the land-carbon sink. Nature 448, 791–794.
Stevenson, D. S., Dentener, F. J., Schultz, M. G., Ellingsen, K., van Noije,T. P. C. and co-authors. 2006. Multimodel ensemble simulations ofpresent-day and near-future tropospheric ozone. J. Geophys. Res.-
Atmos. 111, D08301. doi: 10.1029/2005JD006338.Taylor, G., Tallis, M. J., Giardina, C. P., Percy, K. E., Miglietta, F. and
co-authors. 2008. Future atmospheric CO2 leads to delayed autumnalsenescence. Global Change Biol. 14, 264–275.
The Royal Society 2008. Ground-level ozone in the 21st century:future trends, impacts and policy implications. RS Policy docu-ment 15/08, London, pp. 133. Available at: http://royalsociety.org/displaypagedoc.asp?id=31506.
Tilmes, S., Brandt, J., Flatoy, F., Bergstrom, R., Flemming, J. and co-authors. 2002. Comparison of five eulerian air pollution forecastingsystems for the summer of 1999 using the German ozone monitoringdata. J. Atmos. Chem. 42, 91–121.
Tuovinen, J. P., Simpson, D., Emberson, L., Ashmore, M. and Gerosa, G.2007. Robustness of modelled ozone exposures and doses. Environ.
Pollut. 146, 578–586.Tuovinen, J. P., Emberson, L. and Simpson, D. 2009. Modelling ozone
fluxes to forests for risk assessment: status and prospects. Ann. For.
Sci. 66, 401.
Tellus 63A (2011), 1
OZONE RISK FOR VEGETATION IN THE FUTURE CLIMATE OF EUROPE 187
Uddling, J., Gunthardt-Goerg, M. S., Matyssek, R., Oksanen, E., Pleijel,H. and co-authors. 2004. Biomass reduction of juvenile birch is morestrongly related to stomatal uptake of ozone than to indices based onexternal exposure. Atmos. Environ. 38, 4709–4719.
Uddling, J., Teclaw, R. M., Kubiske, M. E., Pregitzer, K. S. andEllsworth, D. S. 2008. Sap flux in pure aspen and mixed aspen-birch forests exposed to elevated concentrations of carbon dioxideand ozone. Tree Physiol. 28, 1231–1243.
Uddling, J., Teclaw, R. M., Pregitzer, K. S. and Ellsworth, D. S. 2009.Leaf and canopy conductance in aspen and aspen-birch forests underfree-air enrichment of carbon dioxide and ozone. Tree Physiol. 29,1367–1380.
Van Dingenen, R., Dentener, F. J., Raes, F., Krol, M. C., Emberson, L.and co-authors. 2009. The global impact of ozone on agricultural cropyields under current and future air quality legislation. Atmos. Environ.
43, 604–618.van Loon, M., Vautard, R., Schaap, M., Bergstrom, R., Bessagnet, B.
and co-authors. 2007. Evaluation of long-term ozone simulations fromseven regional air quality models and their ensemble. Atmos. Environ.
41, 2083–2097.Vingarzan, R. 2004. A review of surface ozone background levels and
trends. Atmos. Environ. 38, 3431–3442.
Wall, G. W., Adam, N. R., Brooks, T. J., Kimball, B. A., Pinter, P.J. and co-authors. 2000. Acclimation response of spring wheat in afree-air CO2 enrichment (FACE) atmosphere with variable soil nitro-gen regimes. 2. Net assimilation and stomatal conductance of leaves.Photosyn. Res. 66, 79–95.
Wall, G. W., Garcia, R. L., Kimball, B. A., Hunsaker, D. J., Pinter, P. J.and co-authors. 2006. Interactive effects of elevated carbon dioxideand drought on wheat. Agron. J. 98, 354–381.
Supporting Information
Additional supporting information may be found in the onlineversion of this article:
Appendix S1: POD3crop following the B2 scenario.Appendix S2: POD1.6tree following the B2 scenario.
Please note: Wiley-Blackwell are not responsible for the contentor functionality of any supporting materials supplied by theauthors. Any queries (other than missing material) should bedirected to the corresponding author for the article.
Tellus 63A (2011), 1