Overview of State Issues - Oklahoma Senate
272
OPE
-
Upload
khangminh22 -
Category
Documents
-
view
0 -
download
0
Transcript of Overview of State Issues - Oklahoma Senate

OPE


OKLAHOMA SENATE
Overview of
State Issues
October 2016
State Senate Staff
State Capitol Building
Suite 309
Oklahoma City, OK
73105
(405) 521-5692


INTRODUCTION
Oklahoma Senate Overview of State Issues is designed to provide a convenient
summary of policy, budget and taxation issues that face Oklahoma's Legislature.
Though full of factual groundwork, this book’s goal is also to put issues in
context.
Discussion begins with a brief overview of the state’s economic conditions and
population trends, since these dynamics so often serve as catalysts for change.
The state's tax structure is examined closely, beginning with an analysis of total
taxation and how it compares with other states. Each major tax type is then
presented in detail – how it is assessed, collected and spent under the law.
Regional and national rate analyses are provided for each major tax type.
Overall expenditures are presented in a chapter that details the emergence of
broad shifts in spending priorities. Recent bond issues for capital improvements
are also highlighted.
Next is a series of chapters, each of which is dedicated to a major policy area that
has been the subject of recent legislative deliberation and action. Subjects
discussed include the programs and budgets of almost all major state agencies.
Where relevant, descriptions of issues include historical context and state-by-
state comparisons. Programs and policies that at first may seem perplexing are
more easily understood when viewed in historical context.
The information is by no means comprehensive. More information on a particular topic can be
obtained by contacting the Senate staff analysts listed on the dividing page of each chapter.


STAFF CONTACTS
Randy Dowell (405) 521-5769 [email protected]
Director, Fiscal Staff
Caroline Dennis
Director, Committee Staff (405) 521-5685 [email protected]
Elizabeth Park-Capron (405) 521-5763 [email protected]
Director, Support Services
Editing
Compiling
Graphics
Jason Deal (405) 521-5766 [email protected]
Fiscal Analyst
Bonds
State Personnel Issues
Transportation
Quinten Dilbeck (405) 530-2384 [email protected]
Fiscal Analyst
State Economy and Demographics
Agriculture
Energy and Enviroment
Tourism and Oklahoma Historical Society
Erin Boeckman (405) 521-5671 [email protected]
Legislative Analyst
Common Education
Career and Technology Education
Postsecondary Education
Leigh Garrison (405) 521-5778 [email protected]
Fiscal Analyst
Common Education
Career and Technology Education
Post-Secondary Education


Joanie Raff (405) 521-5677 [email protected]
Legislative Analyst
Oklahoma Taxes
Anthony Sammons (405) 521-5696 [email protected]
Assistant Director, Fiscal Staff
State Department of Health
Medicaid
Mental Health and Substance Abuse Services
Department of Human Services
Juvenile Justice
Will Robinson (405) 521-5670 [email protected]
Fiscal Analyst
Public Safety and Corrections
Amy Dunaway
Special Projects (405) 521-5775 [email protected]
State Budget


TABLE OF CONTENTS
Overview
State Economy and Demographics ............................................................... 1
State Budget .................................................................................................. 7
Bonds .......................................................................................................... 19
Oklahoma Taxes ......................................................................................... 25
Agriculture ......................................................................................................... 59
Education
Common Education .................................................................................... 67
Career and Technology Education .............................................................. 93
Post-Secondary Education ........................................................................ 101
Energy and Environment ................................................................................. 119
Health and Social Services
State Department of Health ....................................................................... 131
Medicaid ................................................................................................... 141
Mental Health and Substance Abuse Services .......................................... 151
Human Services
Department of Human Services ................................................................ 163
Juvenile Justice ......................................................................................... 201
State Personnel Issues ...................................................................................... 213
Public Safety and Corrections .......................................................................... 223
Tourism and Oklahoma Historical Society ...................................................... 231
Transportation .................................................................................................. 245


OVERVIEW
State Economy and Demographics
Section Information Prepared By:
Quinten Dilbeck
Fiscal Analyst (405) 530-2384 [email protected]
State Budget
Section Information Prepared By:
Amy Dunaway
Special Projects (405) 521-5775 [email protected]
Bonds
Section Information Prepared By:
Jason Deal
Fiscal Analyst (405) 521-5766 [email protected]
Oklahoma Taxes
Section Information Prepared By:
Joanie Raff
Legislative Analyst (405) 521-5677 [email protected]


Oklahoma Senate Overview of State Issues 1
STATE ECONOMY AND DEMOGRAPHICS
Changes in the state marketplace and population are at the root of much of the
Legislature’s policy discussions. Shifts in these measures are often the catalyst
for efforts to change state policies relating to social services, economic
development, taxes and other areas.
THE OKLAHOMA ECONOMY
Oklahoma’s economy continues to struggle with the downturn in the oil and gas
sector. In 2015, Oklahoma had a real GDP growth rate of only 1.3%, after
several consecutive years of being one of the national leaders in economic
growth. Oklahoma has greatly diversified its economy since the 1986 oil bust,
but it is still heavily dependent on the oil and gas industry. A previous study by
OERB, in conjunction with Oklahoma City University, states that 1 out of every
5 jobs and 1 out of every 3 dollars of gross state product (GSP) is, directly and
indirectly, supported by the oil and gas sector.
Components of the 2015 Oklahoma Economy
2015 Dollar Amount Percent
in Millions of Total
Services $39,306 21.79%
Government $28,606 15.85%
Mining $20,083 11.14%
F.I.R.E. $24,679 13.68%
Trade $21,974 12.18%
Manufacturing $17,797 9.86%
Transport & Warehousing $7,836 4.34%
Utilities $4,686 2.60%
Information $4,152 2.30%
Construction $8,413 4.66%
Agriculture $2,893 1.60%
Total GDP $179,090 100.00%
Source: Bureau of Economic Analysis

State Economy and Demographics
2 Oklahoma Senate Overview of State Issues
The Finance, Insurance and Real Estate sector (F.I.R.E.), mining sector, and the
services sector are the largest private components of the Oklahoma economy.
Together they comprise 46.61 percent of total state output. While the services
sector is often perceived as paying low wages, it includes many of the high wage
and new economy jobs such as software consulting, management and health
professionals.
ECONOMIC OUTPUT
The state economy’s production – the gross state product or GSP – is the total
amount of goods and services produced by all industries within a state.
Oklahoma Real Gross State Product 2008 Through 2015 (In Billions; 2009 Dollars)
Source: BEA
The Real GSP, which is adjusted for price changes and is considered the most
appropriate measure of state output, increased by 1.34% percent in the year 2015,
which is the 34th
highest in the nation. The Real GSP increased 4.5 percent in the
year 2012, which was the 6th
highest in the nation.

State Economy and Demographics
Oklahoma Senate Overview of State Issues 3
Oklahoma Real Gross State Product Growth Rate 2003 Through 2015
Source: BEA
POPULATION
Oklahoma Population Trend and Projections 1990 Through 2030 (In Thousands)
Source: US Census Bureau

State Economy and Demographics
4 Oklahoma Senate Overview of State Issues
Census data for the year 2010 place Oklahoma as the 28th most populous state in
the nation, with 3.75 million residents. This compares to 1995, when
Oklahoma’s 3.27 million residents made it the 27th most populous state. The
decline in ranking between 1995 and 2010 is not due to a loss of population,
because the state gained over 521,000 residents over that period. Instead, the
ranking drop is due to the fact that certain states that were smaller than Oklahoma
are growing faster. The most recent American Community Survey estimates
Oklahoma’s current population is 3.91 million.
Projected Growth in Population The latest U.S. Census Bureau report projects that Oklahoma’s population will
increase by 162,000 people or 4.32 percent between 2010 and 2030. It must be
noted that the Census Bureau has not released updated state population
projections since 2005, and those projections seem to have underestimated
Oklahoma’s population growth.
The current population estimate of Oklahoma citizens aged 65 years and older is
576,250 or 14.7 percent of the population. That number is expected to increase
to 19.4 percent of the population by 2030, significantly higher than the expected
state population growth as a whole, but less than the national projection of 19.7
percent. In 2010, Oklahoma ranked 24th
as a state for the proportion of the
population aged 65 years and older. That ranking is expected to drop to 33rd
by
2030.
Working-Age Population The percentage of Oklahoma’s population that is in the prime working ages –
between 18 and 64 years of age – is expected to decrease from an estimated 60.7
percent in 2015 to 55.6 percent in 2030. Oklahoma has a larger percentage of
young and elderly compared to the nation.
The primary reason for Oklahoma’s projected decrease in the working-age
proportion of the population is the growth rate of elderly residents. While our
expected growth rate of elderly citizens is lower than the national average, the
state may still experience a profound impact to expected tax revenues and social-
service demands within the state.
The population of Oklahoma residents, aged 65 and older, is expected to top
800,000 by 2030.
EMPLOYMENT AND INCOME TRENDS
Oklahoma’s average wage per job in 2015 was $41,820 or 87 percent of the
national average. This wage represents a 4.71 percent growth in wages from the
2013 average wage.

State Economy and Demographics
Oklahoma Senate Overview of State Issues 5
The per capita personal income (PCPI) in 2015 for Oklahoma was $45,573 which
is 94.7 percent of the national average. Per capita personal income is a broad
measure of economic well-being that includes wages and salaries, proprietor
income, dividends and rents, and government transfer payments. PCPI grew by
26.9 percent between 2010 and 2015 in Oklahoma; the U.S. PCPI grew at a rate
of 19.5 percent. When adjusted for the cost of living index, Oklahoma’s PCPI is
5.4 percent higher than the national average.
Oklahoma Employment Growth Rate, by Sector 2013 – 2015
Source: Bureau of Labor Statistics
Oklahoma's overall employment growth rate from 2013 to 2015 was 2.04
percent, compared to the national rate of 4.02 percent.
Oklahoma’s unemployment rate of 5.1 percent in August 2014 was above the
national rate of 4.9 percent. Oklahoma has the 19th
highest unemployment rate in
the nation, due to the large downturn in the oil and gas sector.
Rank State Rate
1 South Dakota 2.9
2 New Hampshire 3
3 North Dakota 3.1
4 Nebraska 3.2
5 Vermont 3.3
6 Hawaii 3.4
7 Utah 3.7
8 Colorado 3.8
8 Idaho 3.8
10 Arkansas 3.9
10 Massachusetts 3.9
10 Virginia 3.9
13 Maine 4
13 Minnesota 4
15 Iowa 4.2
Top 15 Unemployment Rates
for States Seasonally Adjusted
September 2016


Oklahoma Senate Overview of State Issues 7
STATE BUDGET
Appropriation Checks and Balances In Oklahoma, projected revenues are certified by the Board of Equalization. This
Board is comprised of the Governor, Lt. Governor, State Auditor and Inspector,
Treasurer, Attorney General, Superintendent of Instruction and President of the
State Board of Agriculture.
The Oklahoma Constitution, Article X, Sec. 23, requires a balanced budget.
Appropriations are limited to 95 percent of projected revenues and cannot exceed
12 percent in growth.
Any revenue collected that exceeds the certified estimate is deposited into the
Constitutional Reserve (Rainy Day) Fund until it reaches a Constitutional cap of
15 percent of the prior year’s General Revenue Fund actual collections. The
Rainy Day Fund can be used under the following conditions:
3/8 of the fund can be used if General Revenue fails to meet the estimate in
the current fiscal year;
3/8 of the fund can be used if General Revenue is projected to decline from
one year to the next;
1/4 of the fund can be used if there is an emergency declaration by the
Governor and a 2/3 vote in both the Senate and House of Representatives, or
this same 1/4 can be used without the Governor’s declaration if there is a 3/4
vote by Senate and House of Representatives.
The Governor has line item veto authority over all appropriation bills. Vetoes
can be overridden by a super-majority vote by both the Senate and House of
Representatives.

State Budget
8 Oklahoma Senate Overview of State Issues
State Budget Cycle The state fiscal year begins on July 1 and ends on June 30 of the following year.
The following is a breakdown of the budget cycle throughout that year.
July 1 - The new fiscal year begins.
July through October – Agencies formulate their budget work program.
Budget limits may be set by the Legislature in the preceding legislative
session. Agencies begin formulating the budget request they will present for
the next legislative session. This is a good time for advocacy groups to
begin talking with state agencies about funding issues.
October 1 – Agencies submit their budget request to the Governor and
Legislature for the upcoming fiscal year.
November – Appropriation Subcommittees begin analysis of agency
program performance measures and begin filing related reports. No
appropriations can be made to an agency until these reports have been filed.
December – The Board of Equalization meets for initial certification of
revenues. This estimate is used for the Governor’s budget. This is the best
time for advocacy groups to contact the Governor about program budgets.
February – The Governor submits budget recommendations to the
Legislature on the first day of session. The Board of Equalization meets for
certification of revenues. This is the revenue estimate the Legislature is
bound by constitutionally unless it passes a bill to increase or decrease
revenue and that bill is signed by the Governor.
February through April – Supplemental appropriations are considered for
the current fiscal year. Subcommittees hold budget hearings for the up-
coming fiscal year and move substantive bills with fiscal impacts through the
process. This is the best time to talk to the Legislature about budget issues.
Late April to May – The Chairmen and Subcommittee Chairmen of the
Appropriations Committee negotiate subcommittee budgets with the House
of Representatives and Governor. The General Conference Committee on
Appropriations (GCCA) is convened for substantive legislation with fiscal
impacts to be considered.
May – The Legislature begins filing appropriation bills. During session, the
Governor has 5 days to sign or veto a bill or it becomes law without their
signature. If the bill is passed during the last week of session, the Governor
has 15 days to sign it or it becomes a pocket veto. Session ends on the last
Friday in May.

State Budget
Oklahoma Senate Overview of State Issues 9
June – The Board of Equalization meets to certify any changes to
certification as a result of legislation that was signed into law and to certify
that the Legislature did not exceed its appropriation authority.
June 30 – The current fiscal year ends. Agencies submit Budget Work
Programs to the Office of State Finance and the process starts over.
Legislative Appropriation Authority The Board of Equalization certifies funds for the Legislature to appropriate and
also provides estimates for some of the major agency revolving funds such as the
Common Education 1017 Fund. It does not provide estimates for every
revolving fund that the Legislature uses for appropriation. Revenues that were
included in the Board’s FY’17 certification packet totaled about $6.923 billion.
The total amount of money available to agencies from all funding sources is in
excess of $24 billion. The Legislature provided a detailed accounting of these
other funds in the General Appropriations bill for the first time in the 2015
session and then expanded it in the 2016 session to include non-appropriated
agency budgets. Summaries of the major expenditure categories appropriated by
the Legislature which totaled about $6.912 billion are as follows:
Authorized Expenditures by Major Category, FY’17
General Revenue
$4,990,583,93472%
State Transportation$154,958,361
2%
HB 1017$696,954,056
10%Educ. Lottery
Trust$51,995,017
1%
Special Cash$615,383,263
9%
Education Gross Prod.
$123,505,4342%
Constitutional Reserve
$144,444,7082%
Other$129,893,069
2%

State Budget
10 Oklahoma Senate Overview of State Issues
Total Estimate for General Revenue Fund by Major Category, FY’17
HB 1017 Fund by Major Category, FY’17

State Budget
Oklahoma Senate Overview of State Issues 11
State Expenditures
The FY'17 budget presented many difficulties for the Legislature. In order to maintain
spending levels amid declining revenues, the two previous budgets were based on
surplus cash from dozens of agency accounts. This created a structural deficit going
into FY’17. Trying to find revenue sources for on-going items that had previously
been paid for from a one-time source was further complicated when a revenue failure
for FY’16 and FY’17 was declared in December of 2015. By the time the February
certification occurred, the problem had only gotten worse. The FY’16 revenue
failure resulted in a 3% reduction of General Revenue allocations at the December
meeting and an additional 4% at the February meeting for a total FY'16 General
Revenue allocation reduction of 7% or $412,804,630. However, by the close of
FY’16, it was clear that a 7% reduction was higher than necessary and agencies
received 2.57% or $152,145,274 of their general revenue allocation back in the form
of a rebate. Since these funds were not returned until FY’17, these amounts are not
included in any final FY’16 funding figures.
In order to address the FY’17 deficit of over $1.3 billion (18%), the Legislature once
again transferred or appropriated from agency revolving funds. They also modified
or eliminated numerous tax credits and bonded a portion of the ROADS Fund. The
amount of funds transferred to the Special Cash Fund totaled $615,193,747, and the
amount appropriated out of agency revolving funds totaled $36,475,108. The
Legislature spent $144,444,708 out of the Constitutional Reserve/Rainy Day Fund.
The Legislature also consolidated various agencies: the Will Rogers Memorial
Commission was absorbed by the Historical Society, and the Scenic Rivers
Commission will now be a function of the Grand River Dam Authority. Finally, the
Insurance Department became a non-appropriated agency.
Although there were fewer funds available for FY’17, some agencies still received an
increase in appropriation, most notably within the Health and Human Services
subcommittee. The Oklahoma Health Care Authority received the highest increase in
order to counter the reduction in the Federal Medical Assistance Percentage (FMAP)
rate. The Department of Mental Health and Substance Abuse also received an
increase due to the cut in the FMAP rate. DHS once again needed additional funds for
the Court ordered Pinnacle Plan. A few agencies received no cuts, most notably being
the State Department of Education and the Department of Corrections.
Supplemental appropriations for FY’16 totaled $78,579,620. Agencies who received
a supplemental for FY’16 were the State Department of Education and the
Department of Corrections. The common education portion of the Ad Valorem
Reimbursement Fund shortfall was reimbursed with a $47,074,091 appropriation.
The following is a table of the top twelve agencies receiving an appropriation for
FY’17. This table does not include the $457 million or $517 million apportioned to
ODOT's ROADS Fund in FY'16 and FY'17 respectively, nor does it include $59
million in FY'16 and $67.8 million in FY'17 apportioned to the Oklahoma Higher
Learning Access Program (OHLAP). The FY’16 amounts are what the agencies
received after both revenue failures plus any supplemental.

State Budget
12 Oklahoma Senate Overview of State Issues
Top Twelve Agency Appropriation History, FY’16 to FY’17
FY'16 FY'17 Dollar Percent
Appropriation Appropriation Change Change
State Department of Education $2,426,721,434 $2,426,721,434 $0 0.0%
Oklahoma Health Care Authority $907,224,478 $991,050,514 $83,826,036 9.2%
State Regents for Higher Education $907,212,825 $810,022,109 -$97,190,716 -10.7%
Department of Human Services $635,200,261 $651,500,262 $16,300,001 2.6%
Department of Corrections $484,900,942 $484,900,942 $0 0.0%
Department of Mental Health & Substance Abuse $317,893,152 $324,823,085 $6,929,933 2.2%
Department of Transportation $184,901,463 $154,958,361 -$29,943,102 -16.2%
Department of Career & Technology Education $124,893,063 $118,276,325 -$6,616,739 -5.3%
Office of Juvenile Affairs $92,069,101 $92,069,101 $0 0.0%
Department of Public Safety $95,142,721 $89,004,563 -$6,138,158 -6.5%
District Courts $55,414,564 $55,000,000 -$414,564 -0.7%
Department of Health $56,388,203 $54,978,498 -$1,409,705 -2.5%
Subtotal (92% of Total) $6,287,962,206 $6,253,305,193 -$34,657,013 -0.6%
Other Agencies/Capital $603,032,636 $524,880,816 -$78,151,820 -13.0%
Total Appropriations $6,890,994,842 $6,778,186,009 -$112,808,833 -1.6%
State Department of Education
35.8%
Department of Health0.8%
Oklahoma Health Care Authority
14.6%
District Courts0.8%
State Regents for Higher Education
12.0%
Department of Public Safety
1.3%
Department of Human Services
9.6%
Office of Juvenile Affairs1.4%
Department of Corrections
7.2%
Department of Career & Technology
Education1.7%
Department of Mental Health & Substance Abuse
4.8%
Department of Transportation
2.3%
Other Agencies/Capital
7.7%
Share of All FY '17 Appropriations by Agency

State Budget
Oklahoma Senate Overview of State Issues 13
Appropriation History FY’08 to FY’17 Although the slowdown in the national economy began in 2007, Oklahoma was
initially insulated from its effects due to strong oil prices. However, by 2009, the
state was beginning to feel the effects of the national recession. At the onset of
FY'10, the Board of Equalization certified a decrease in revenues which
necessitated reductions to most state agency budgets. The Legislature and
Governor used federal stimulus dollars to backfill those cuts at Common
Education, Higher Education and for agencies that receive Medicaid funds. The
economic downturn fully hit during FY’10 which led the Office of State Finance
to reduce allocations by 7.5%. The next two years, FY'11 and FY'12, state
revenues continued to struggle to recover from the recession therefore stimulus
funds were used to minimize cuts to agencies. The following graph depicts the
FY’10 - FY’12 budgets with and without these stimulus funds and the final total
budget for FY’10 after the OSF cuts. There were no remaining stimulus funds in
FY’13, but state revenues had recovered enough so that final appropriations for
FY'13 showed an increase from the previous year. Revenues during FY’14
continued to increase allowing a significant amount of funds to be used for
FY’14 supplementals. FY'15 appropriations show a slight decrease attributed
mostly to the downturn in the oil and gas markets. By FY'16 a significant amount
of surplus cash was transferred or appropriated from dozens of agency accounts
to maintain appropriation levels. During FY'16 two revenue failures were
declared resulting in a 7% reduction in general revenue allocations. Although a
portion of the 7% cut was returned to the agencies, those amounts are not
reflected in the graph since the agencies did not receive it in FY’16. A significant
amount of one-time revenue sources were used to minimize the cuts to agencies
in FY’17. A significant structural deficit remains.
10-Year Appropriation History
* - Without Stimulus Funding ** - With Stimulus Funding ***-After OSF/OMES Reduction
$6,9
49.9
$7,0
89.3
$6,5
89.8
$7,2
30.8
$6,9
31.8
$6,1
47.8
$6,6
86.8
$6,3
95.0
$6,5
09.0
$6,8
28.4
$7,2
23.8
$7,2
13.2
$6,8
91.0
$6,7
78.2
08 09 10* 10** 10*** 11* 11** 12* 12** 13 14 15*** 16*** 17

State Budget
14 Oklahoma Senate Overview of State Issues
Summary of Appropriations
FY’16 – FY’17
FY'16 Final
Appropriation FY'17 Appropriation
$ Change from FY
'16
% Change
from FY '16
Education Subcommittee
State Department of Education $2,426,721,433.72 $2,426,721,433.72 $0.00 0.0%
State Regents for Higher Education $907,212,824.97 $810,022,108.97 -$97,190,716.00 -10.7%
Career & Technology Education $124,893,063.29 $118,276,324.29 -$6,616,739.00 -5.3%
Center for Adv. Of Science & Technology $14,852,779.35 $14,110,140.35 -$742,639.00 -5.0%
Educational Quality & Accountability $1,739,197.10 $1,677,237.10 -$61,960.00 -3.6%
Commissioner of the Land Office $8,538,600.00 $8,538,600.00 $0.00 0.0%
Oklahoma School of Science and Math $6,574,553.00 $6,425,146.00 -$149,407.00 -2.3%
Department of Libraries $4,854,086.38 $4,611,382.38 -$242,704.00 -5.0%
Physician Manpower Training Commission $3,680,244.80 $3,484,558.80 -$195,686.00 -5.3%
State Arts Council $3,264,769.80 $2,938,292.80 -$326,477.00 -10.0%
Oklahoma Educational Television Authority $3,153,848.22 $2,838,163.22 -$315,685.00 -10.0%
TOTAL EDUCATION $3,505,485,400.63 $3,399,643,387.63 -$105,842,013.00 -3.0%
General Government & Transportation Subcommittee
Department of Transportation $184,901,463.00 $154,958,361.00 -$29,943,102.00 -16.2%
Oklahoma Tax Commission $40,498,164.72 $44,335,999.72 $3,837,835.00 9.5%
Management and Enterprise Services $38,402,227.55 $35,271,207.55 -$3,131,020.00 -8.2%
House of Representatives $15,496,659.00 $12,497,306.00 -$2,999,353.00 -19.4%
Senate $11,576,027.00 $9,335,506.00 -$2,240,521.00 -19.4%
Oklahoma Military Department $10,499,678.69 $10,035,603.69 -$464,075.00 -4.4%
State Election Board $7,205,533.26 $7,893,267.26 $687,734.00 9.5%
Legislative Service Bureau $4,892,835.00 $13,892,835.00 $9,000,000.00 183.9%
State Auditor and Inspector $3,867,143.48 $3,640,536.48 -$226,607.00 -5.9%
Oklahoma State Treasurer $2,970,294.55 $2,815,462.55 -$154,832.00 -5.2%
Governor $1,815,843.40 $1,725,051.40 -$90,792.00 -5.0%
State Ethics Commission $782,991.19 $739,754.19 -$43,237.00 -5.5%
Office of Civil Emergency Management $530,150.38 $503,642.38 -$26,508.00 -5.0%
Lt. Governor $412,435.63 $391,813.63 -$20,622.00 -5.0%
Merit Protection Commission $399,715.94 $379,729.94 -$19,986.00 -5.0%
Space Industry Development Authority $321,251.07 $305,188.07 -$16,063.00 -5.0%
Office of the State Bond Advisor $116,512.54 $110,686.54 -$5,826.00 -5.0%
TOTAL GEN. GOV'T & TRANSPORATION $324,688,926.40 $298,831,951.40 -$25,856,975.00 -8.0%
Health & Human Services Subcommittee
Oklahoma Health Care Authority $907,224,477.61 $991,050,513.61 $83,826,036.00 9.2%
Department of Human Services $635,200,261.46 $651,500,262.46 $16,300,001.00 2.6%
Mental Health & Substance Abuse $317,893,152.14 $324,823,085.14 $6,929,933.00 2.2%
Office of Juvenile Affairs $92,069,101.01 $92,069,101.01 $0.00 0.0%
Department of Health $56,388,202.72 $54,978,497.72 -$1,409,705.00 -2.5%
University Hospitals Authority $36,722,868.35 $34,886,725.35 -$1,836,143.00 -5.0%
Department of Veteran Affairs $32,705,561.58 $31,057,286.58 -$1,648,275.00 -5.0%
Department of Rehabilitative Services $28,778,670.79 $27,452,295.79 -$1,326,375.00 -4.6%
OSU Medical Authority $10,697,923.68 $10,163,027.68 -$534,896.00 -5.0%
J.D. McCarty Center $4,023,153.84 $3,895,190.84 -$127,963.00 -3.2%
Commission on Children and Youth $1,834,762.11 $1,743,024.11 -$91,738.00 -5.0%
Office of Disability Concerns $258,575.82 $245,646.82 -$12,929.00 -5.0%
TOTAL HEALTH & HUMAN SERVICES $2,123,796,711.11 $2,223,864,657.11 $100,067,946.00 4.7%

State Budget
Oklahoma Senate Overview of State Issues 15
FY'16 Final
Appropriation FY'17 Appropriation
$ Change from FY
'16
% Change
from FY '16
Natural Resources & Regulatory Services Subcommittee
Department of Commerce $22,181,310.91 $21,611,249.91 -$570,061.00 -2.6%
Department of Agriculture $23,086,277.49 $22,059,218.49 -$1,027,059.00 -4.4%
Department of Tourism and Recreation $19,621,453.00 $17,335,553.00 -$2,285,900.00 -11.7%
Historical Society $10,767,552.58 $11,005,648.58 $238,096.00 2.2%
Oklahoma Corporation Commission $10,182,682.00 $10,182,682.00 $0.00 0.0%
Conservation Commission $9,261,038.82 $9,039,814.82 -$221,224.00 -2.4%
Department of Environmental Quality $6,776,896.00 $5,987,387.00 -$789,509.00 -11.7%
Oklahoma Water Resources Board $5,806,231.23 $5,515,919.23 -$290,312.00 -5.0%
Department of Labor $4,185,013.00 $3,697,459.00 -$487,554.00 -11.6%
Horse Racing Commission $1,835,614.63 $1,743,833.63 -$91,781.00 -5.0%
Insurance Commissioner $1,546,441.77 -$0.23 -$1,546,442.00 -100.0%
Department of Mines $816,601.99 $775,771.99 -$40,830.00 -5.0%
Will Rogers Memorial Commission $617,484.17 $0.17 -$617,484.00 -100.0%
J.M. Davis Memorial Commission $255,178.45 $242,419.45 -$12,759.00 -5.0%
Oklahoma Scenic Rivers Commission $252,015.48 $0.48 -$252,015.00 -100.0%
TOTAL NAT RESOURCES & REG SERVICES $117,191,791.52 $109,196,957.52 -$7,994,834.00 -6.8%
Public Safety & Judiciary Subcommittee
Department of Corrections $484,900,941.66 $484,900,942.00 $0.34 0.0%
Department of Public Safety $95,142,720.69 $89,004,562.69 -$6,138,158.00 -6.5%
District Courts $55,414,563.85 $54,999,999.85 -$414,564.00 -0.7%
District Attorneys and DAC $36,127,418.42 $34,468,685.42 -$1,658,733.00 -4.6%
Supreme Court $16,459,107.69 $15,336,266.69 -$1,122,841.00 -6.8%
Oklahoma Indigent Defense System $14,954,141.34 $14,954,141.34 $0.00 0.0%
Attorney General $12,930,542.73 $6,326,056.73 -$6,604,486.00 -51.1%
Oklahoma State Bureau of Investigation $12,991,627.45 $12,392,065.45 -$599,562.00 -4.6%
Office of the Chief Medical Examiner $9,018,249.71 $8,749,067.71 -$269,182.00 -3.0%
Narcotics and Dangerous Drugs $3,498,917.00 $3,091,293.00 -$407,624.00 -11.7%
Court of Criminal Appeals $3,376,085.03 $3,630,199.03 $254,114.00 7.5%
Law Enforcement Education and Training $3,296,354.00 $2,912,329.00 -$384,025.00 -11.6%
Alcoholic Beverage Laws Enforcement $2,631,907.76 $2,500,312.76 -$131,595.00 -5.0%
Pardon and Parole Board $2,294,013.57 $2,294,013.57 $0.00 0.0%
Office of the State Fire Marshall $1,520,259.01 $1,430,946.01 -$89,313.00 -5.9%
TOTAL PUBLIC SAFETY & JUDICIARY $754,556,849.91 $736,990,881.25 -$17,565,968.66 -2.3%
Capitol Debt Service $8,078,120.00 $0.00 -8,078,120 -100.0%
Ad Valorem Reimbursement Fund $47,074,091.00 $0.00 -47,074,091 -100.0%
Rural Economic Action Plan $10,122,951.00 $9,658,172.00 -464,779 -4.6%
Total Appropriation $6,890,994,841.56 $6,778,186,006.90 -$112,808,834.66 -1.6%
ODOT-The agency also received $457 million and $517 million from the ROADS Fund in FY '16 and FY '17 respectively.

State Budget
16 Oklahoma Senate Overview of State Issues
Summary of Appropriations
FY’09 – FY’17 FY'09 FY'17 Dollar Change Percent Change
Appropriation Appropriation FY'09 - FY'17 FY'09 - FY'17
Education Subcommittee
Arts Council $5,150,967 2,938,293 -$2,212,674 -42.96%
Career & Technology Education $158,269,736 $118,276,325 -$39,993,411 -25.27%
Education, St. Dept. of $2,531,702,553 $2,426,721,434 -$104,981,119 -4.15%
Educational Television Authority $8,394,383 $2,838,163 -$5,556,220 -66.19%
Higher Education, Regents for $1,039,886,280 $810,022,109 -$229,864,171 -22.10%
Land Office, Commissioners of $4,864,881 $8,538,600 $3,673,719 75.52%
Libraries, Dept. of $7,294,856 $4,611,382 -$2,683,474 -36.79%
Physician Manpower Training Comm. $5,523,502 $3,484,559 -$2,038,943 -36.91%
Science and Tech., Center for $22,456,507 $14,110,140 -$8,346,367 -37.17%
Science & Math, School of $7,985,737 $6,425,146 -$1,560,591 -19.54%
Teacher Preparation, Commission on $2,059,982 $0 -$2,059,982 -100.00%
Office of Educational Quality and Accountability $0 $1,677,237 $1,677,237 N/A
TOTAL EDUCATION $3,793,589,384 $3,399,643,388 -$393,945,996 -10.38%
General Government & Transportation Subcommittee
Auditor and Inspector $6,315,269 $3,640,536 -$2,674,733 -42.35%
State Bond Advisor $186,419 $110,687 -$75,732 -40.62%
Civil Emergency Mgmt. $1,156,604 $503,643 -$652,961 -56.46%
Election Board $6,805,988 $7,893,267 $1,087,279 15.98%
Ethics Commission $667,960 $739,754 $71,794 10.75%
OMES $46,686,354 $35,271,208 -$11,415,146 -24.45%
Governor $17,661,981 $1,725,051 -$15,936,930 -90.23%
House of Representatives $19,176,434 $12,497,306 -$6,679,128 -34.83%
Legis. Service Bureau $5,537,349 $13,892,835 $8,355,486 150.89%
Lieutenant Governor $659,597 $391,814 -$267,783 -40.60%
Merit Protection Comm. $613,684 $379,730 -$233,954 -38.12%
Military. Department of $13,132,301 $10,035,604 -$3,096,697 -23.58%
Secretary of State $380,517 $0 -$380,517 -100.00%
Senate $14,699,125 $9,335,506 -$5,363,619 -36.49%
Space Industry Development Authority $530,340 $305,189 -$225,151 -42.45%
Tax Commission $50,201,340 $44,336,000 -$5,865,340 -11.68%
Transportation, Department of $207,691,448 $154,958,361 -$52,733,087 -25.39%
Treasurer $4,668,673 $2,815,463 -$1,853,210 -39.69%
TOTAL GENERAL GOVERNMENT & TRANSPORTATION $396,771,383 $298,831,954 -$97,939,429 -24.68%
Health & Human Services Subcommittee
Children & Youth, Comm. On $2,608,473 $1,743,024 -$865,449 -33.18%
Disability Concerns $412,769 $245,647 -$167,122 -40.49%
Health, Dept. of $75,028,113 $54,978,498 -$20,049,615 -26.72%
Health Care Authority $842,122,261 $991,050,514 $148,928,253 17.68%
Human Services, Dept. of $559,107,190 $651,500,262 $92,393,072 16.53%
J. D. McCarty Center $4,452,961 $3,895,191 -$557,770 -12.53%
Juvenile Affairs $112,254,258 $92,069,101 -$20,185,157 -17.98%
OSUMA $10,163,028 $10,163,028 N/A
Mental Health & Substance Abuse $209,579,129 $324,823,085 $115,243,956 54.99%
Rehabilitation Services, Dept. of $30,053,770 $27,452,297 -$2,601,473 -8.66%
University Hospitals Authority $43,250,342 $34,886,725 -$8,363,617 -19.34%
Veterans Affairs, Dept. of $40,282,600 $31,057,287 -$9,225,313 -22.90%
TOTAL HEALTH & HUMAN SERVICES $1,919,151,866 $2,223,864,659 $304,712,793 15.88%

State Budget
Oklahoma Senate Overview of State Issues 17
FY'09 FY'17 Dollar Change Percent Change
Appropriation Appropriation FY'09 - FY'17 FY'09 - FY'17
Natural Resources & Regulatory Services Subcommittee
Agriculture, Dep't of $34,540,185 $22,059,218 -$12,480,967 -36.13%
Commerce, Dept. of $30,934,772 $21,611,249 -$9,323,523 -30.14%
Conservation Commission $10,292,962 $9,039,814 -$1,253,148 -12.17%
Corporation Commission $12,415,417 $10,182,682 -$2,232,735 -17.98%
Environmental Quality, Dept. of $9,728,096 $5,987,388 -$3,740,708 -38.45%
Historical Society $14,967,451 $11,005,649 -$3,961,802 -26.47%
Horse Racing Comm. $2,669,568 $1,743,834 -$925,734 -34.68%
Insurance Commissioner $2,515,943 $0 -$2,515,943 -100.00%
J. M. Davis Memorial Commission $385,403 $242,420 -$142,983 -37.10%
Labor Department $3,760,284 $3,697,459 -$62,825 -1.67%
Mines, Dept. of $1,013,586 $775,772 -$237,814 -23.46%
Scenic Rivers Commission $345,322 $0 -$345,322 -100.00%
Tourism & Recreation, Dept. of $28,041,991 $17,335,554 -$10,706,437 -38.18%
Water Resources Board $6,801,524 $5,515,920 -$1,285,604 -18.90%
Will Rogers Memorial Commission $933,702 $0 -$933,702 -100.00%
TOTAL NATURAL RESOURCES & REGULATORY SVCS. $159,346,206 $109,196,959 -$50,149,247 -31.47%
Public Safety & Judiciary Subcommittee
A.B.L.E. Commission $3,925,266 $2,500,312 -$1,424,954 -36.30%
Attorney General $14,781,704 $6,326,057 -$8,455,647 -57.20%
Corrections, Dept. of $503,000,000 $484,900,942 -$18,099,058 -3.60%
Court of Criminal Appeals $3,474,527 $3,630,199 $155,672 4.48%
District Attorneys and DAC $42,820,210 $34,468,685 -$8,351,525 -19.50%
District Courts $58,067,785 $55,000,000 -$3,067,785 -5.28%
Fire Marshal $2,270,855 $1,430,946 -$839,909 -36.99%
Indigent Defense System $16,734,008 $14,954,141 -$1,779,867 -10.64%
Investigation, State Bureau of $17,316,450 $12,392,064 -$4,924,386 -28.44%
Judicial Complains, Council on $283,729 $0 -$283,729 -100.00%
C.L.E.E.T $4,614,370 $2,912,329 -$1,702,041 -36.89%
Medicolegal Investigations, Board of $4,825,625 $8,749,068 $3,923,443 81.30%
Narcotics & Dangerous Drugs $6,773,895 $3,091,293 -$3,682,602 -54.36%
Pardon & Parole Board $2,577,581 $2,294,014 -$283,567 -11.00%
Public Safety, Dept. of $97,170,391 $89,004,563 -$8,165,828 -8.40%
Supreme Court $19,247,063 $15,336,267 -$3,910,796 -20.32%
Workers' Compensation Court $5,259,801 $0 -$5,259,801 -100.00%
Workers' Comp Court of Existing Claims $0 $0 $0 N/A
TOTAL PUBLIC SAFETY & JUDICIARY $803,143,260 $736,990,880 -$66,152,380 -8.24%
Rural Economic Action Plan $15,500,000 $9,658,172 -$5,841,828 -37.69%
TOTAL APPROPRIATION $7,087,502,099 $6,778,186,012 -$309,316,087 -4.36%


Oklahoma Senate Overview of State Issues 19
BONDS
General Obligation Bonds – Governmental Purpose The Oklahoma Constitution requires that general obligation bonds be approved
by a vote of the people and that the enabling law provide for the collection of a
direct annual tax sufficient to pay the debt as it comes due within twenty-five
years of issuance.
Voter-approved general obligation bonds are a full-faith and credit obligation of
the State and carry a pledge by the State to make repayment of principal and
interest from any legally available source of funds. The only outstanding
governmental-purpose general obligation bonds of the State have been issued by
the Oklahoma Building Bonds Commission.
The outstanding governmental-purpose, general obligations bonds of the State of
Oklahoma are secured initially by cigarette taxes. These are tax-supported
bonds.
Self-Supporting General Obligation Bonds –
Industrial Loans The Oklahoma Industrial Finance Authority operates a voter-approved general
obligation bond program under which the proceeds of the issues are used to make
industrial development loans. The State Constitution limits the amount of general
obligation debt that can be outstanding at any time for this purpose to
$90,000,000. If the borrower fails to make payment under this program, the
ODFA will issue State general obligation bonds and use the proceeds to pay off
the loan. General obligation bonds have never been issued to pay obligations due
under this program.
The outstanding OIFA general obligation bonds are secured initially by the loan
repayments and then by OIFA reserves. These are tax-backed, but not tax-
supported bonds.

Bonds
20 Oklahoma Senate Overview of State Issues
General Obligation Bonds – Credit Enhancement
Reserve Fund Program The Oklahoma Development Finance Authority (the “ODFA”) is constitutionally
authorized to incur general obligation indebtedness in an amount not to exceed
$100 million to provide credit support for the Credit Enhancement Reserve Fund
(“CERF”) Program. All or portions of issues approved for participation in the
program are guaranteed by CERF. The guarantee provides that general obligation
bonds will be sold, if needed, to make required debt service payments.
The $100 million Constitutional authorization has been divided by statute, with
$60 million dedicated to the Pooled Business Financing Program and the Public
Facilities Financing Program and $40 million reserved for the Quality Jobs
Investment Program.
This general obligation bonding authority represents a contingent liability and,
as such, do not require any expenditure of State funds unless general obligation
bonds are issued. These are tax-backed, but not tax-supported bonds.
Lease Revenue Bonds With statutory authorization, the Oklahoma Capitol Improvement Authority (the
“OCIA”) issues lease revenue bonds and notes to finance State capital facilities
and equipment. Security for the bonds is provided by a lease with the State entity
that occupies the facility or uses the equipment. The lease payments typically
come from appropriations made by the Oklahoma Legislature for that purpose.
The legal structure of these issues provides that the leases may be terminated in
the event sufficient appropriations are not received to make the required lease
payment. As a result, the Oklahoma Supreme Court has held that the OCIA lease
revenue bonds do not constitute a debt, as defined in the Oklahoma Constitution
and, therefore, do not require voter approval. The credit markets view OCIA
lease-backed obligations as slightly less secure than the State’s general
obligation.
Most outstanding OCIA bonds are secured by annual appropriations to the
agency lessees (although a few pay from other agency sources). Most of these are
tax-supported bonds.
Direct Agency and Higher Education Lease
Obligations In addition to the bonds sold by the OCIA, a number of other State agencies and
institutions of higher education have issued lease revenue obligations to meet
capital needs. Often, the annual lease payments are made by the State agencies
from the appropriation they receive for operations, without the need for an
increase in their budget to meet the lease requirement. In other cases, however,
the agency is given approval by the Legislature to enter into a lease purchase
agreement that requires an increase in the annual general revenue appropriation.

Bonds
Oklahoma Senate Overview of State Issues 21
In both cases, these leases may also be terminated in the event of non-
appropriation.
These lease obligations are secured by a variety of agency or campus sources.
Some require appropriation support. These are a mix of tax-backed and tax-
supported bonds.
Regents for Higher Education Master Lease
Programs In 2001, a master lease program was created to provide for the more efficient and
cost-effective financing of equipment acquisition by Oklahoma’s public
institutions of higher education. The Oklahoma Development Finance Authority
(the “ODFA”) issues bonds for this program that are secured by a lease with the
Oklahoma Regents for Higher Education and by sub-leases with the participating
campuses. In the event the lessees do not make their required lease payments
from other sources, the State Regents can divert that institution’s share of higher
education appropriations to ensure timely payment of principal and interest on
the bonds.
In most cases, the participants use a dedicated campus revenue stream, such as
fees, user charges, or other income to make their lease payments. In 2006, the
master lease program was expanded to include real property projects, resulting in
even greater savings for the campuses.
A list of projects to be funded through the master lease programs must be
submitted to the Oklahoma Legislature during the first week of the session each
year. The Legislature has 45 days to reject any or all projects on the list. If
projects are not disapproved within that period, they are deemed approved.
The outstanding ODFA master lease bonds are secured initially by various fees,
user chargers, and revenues. These are tax-backed, but not tax-supported bonds.
General Revenue Bonds – OU and OSU The University of Oklahoma and Oklahoma State University have statutory
authority to issue General Revenue Bonds, secured by any generally available
revenues, excluding only appropriated tax dollars and other specifically restricted
funds. This security pledge allows OU and OSU to access the credit markets at
very favorable interest rates. Any projects expected to be funded using this type
of debt must be submitted to the Legislature for review each year. If the
Legislature does not reject a project, it is deemed approved 45 days after the
submission.
These are revenue bonds secured by all general revenues of the universities,
except appropriated tax dollars and certain restricted funds. These are neither
tax-backed, nor tax-supported bonds.

Bonds
22 Oklahoma Senate Overview of State Issues
Revenue Bonds – Multiple Issuers
Many State entities generate revenues from their operations and can, with proper
statutory authority, issue bonds secured by their program or system cash-flows.
Examples of these are: the Oklahoma Turnpike Authority; Grand River Dam
Authority; Oklahoma Municipal Power Authority; Oklahoma Student Loan
Authority; Oklahoma Housing Finance Agency; and the Oklahoma Water
Resources Board.
While some of these entities issue bonds for capital purposes, others use bond
proceeds to make loans in keeping with their program purpose. In either case,
investors in these revenue bonds look to the cash flow of the operation rather
than the State general revenues, for security. The legal documents describing the
security behind these bonds make it clear that they are not an obligation of the
State of Oklahoma.
State Capitol Bonds In 2010, the condition of the Oklahoma State Capitol had deteriorated to the
point that scaffolding had to be erected over the south entrance to protect persons
entering and exiting the building from falling limestone and other building parts.
In 2013, the Legislature enacted a measure (HB 2032) which combined an
income tax rate reduction with earmarking of income tax revenues for repairs to
the Capitol. The Oklahoma Supreme Court ruled that this measure violated the
constitutional requirement that each bill embrace a single subject.
In 2014, the Legislature enacted a second measure (HJR 1033) which authorizes
the Oklahoma Capitol Improvement Authority to issue bonds in an amount up to
$120 million to renovate, repair and remodel the Capitol. The State Capitol
Repair Expenditure Oversight Committee, consisting of six legislators and three
gubernatorial appointees, was also created to prepare and approve a project
programming plan, with a preliminary plan to be delivered to the Director of the
Office of Management and Enterprise Services by December 31, 2014, and a
final plan by June 30, 2015.
In 2016, the Legislature enacted another measure to continue funding renovations
to the State Capitol. HB 3168 authorized the Oklahoma Capitol Improvement
Authority to issue an additional $125 million bond issue to continue the repair
and remodeling the Capitol. The State Capitol Repair Expenditure Oversight
Committee will continue to review all expenditures related to the renovation
project.

Bonds
Oklahoma Senate Overview of State Issues 23
GROSS DEBT SERVICE Fiscal Year ---> 2016 2017 2018 2019 2020
General Revenue Fund Unrestricted Expenditure Authority (1) 5,215,935,477$ (1) 4,941,726,210$ (1) 5,040,560,734$ (1) 5,141,371,949$ (1) 5,244,199,388$ (1)
General Obligation Bond Debt Service 29,385,900$ 29,293,875$ 29,242,625$ 29,180,750$ -$
G.O. Debt Service as % of Appropriations 0.56% 0.59% 0.58% 0.57% 0.00%
Annual Lease Payments 230,361,450$ 248,522,557$ 225,552,082$ 189,145,959$ 180,383,225$
Lease Payments as % of Appropriations 4.42% 5.03% 4.47% 3.68% 3.44%
Total Gross Annual Payments 259,747,350$ 277,816,432$ 254,794,707$ 218,326,709$ 180,383,225$
Total Gross Annual Payments as % of Appropriations 4.98% 5.62% 5.05% 4.25% 3.44%
NET DEBT SERVICE Fiscal Year ---> 2016 2017 2018 2019 2020
General Revenue Fund Unrestricted Expenditure Authority (1) 5,215,935,477$ (1) 4,941,726,210$ (1) 5,040,560,734$ (1) 5,141,371,949$ (1) 5,244,199,388$ (1)
Net General Obligation Debt Service 29,385,900$ 29,293,875$ 29,242,625$ 29,180,750$ -$
G.O. Debt Service as % of Appropriations 0.56% 0.59% 0.58% 0.57% 0.00%
Annual Net Lease Payments (see below for list of exclusions) 140,101,436$ 161,152,755$ 143,355,890$ 108,703,403$ 107,854,114$
Lease Payments as % of Appropriations 2.69% 3.26% 2.84% 2.11% 2.06%
x x
Total Net Annual Payments 169,487,336$ 190,446,630$ 172,598,515$ 137,884,153$ 107,854,114$
Total Net Annual Payments as % of Appropriations 3.25% 3.85% 3.42% 2.68% 2.06%
_______________
on June 20, 2016. Fiscal Years 2018-2020 assume an annual growth rate of 2.0%.
* Other issues supported by non-appropriated dollars (e.g., the Attorney General's Evidence Fund and OSBI fines/forfeitures) have been excluded from this calculation.
(1) Reflects 7.0% pro rata cuts to appropriations during Fiscal Year 2016 and the subsequent return of $140 million balance to appropriated agencies.. The FY 2017 amount was adopted by the Board of Equalization
Exclusions from Gross Debt Service and explanation:
State of Oklahoma
Calculation of Current Gross and Net Annual Debt Burden
* Master Lease Program payments are excluded, since most of these payments are made from internal sources (e.g. student fees/charges, etc.) and do not require use of appropriated funds.
* ODFA Community Development Pooled Finance Act issues are excluded because payments are made from each company's withholding tax collections before they are certified as State revenues.
* ODFA issues in 2004 for Goodyear and Michelin are secured by each company's withholding tax collections and by the State's corporate tax receipts. No taxes have been used.

Bonds
24 Oklahoma Senate Overview of State Issues
OK TX NM CO KS MO AR
Gross Tax-Supported Debt 42nd 7th 39th 20th 30th 33rd 44th
Net Tax-Supported Debt 39th 13th 31st 32nd 25th 27th 37th
Net Tax-Supported Debt:
- Per Capita 43rd 44th 21st 42nd 17th 39th 36th
- As % of 2011 Personal Income 42nd 44th 18th 43rd 17th 39th 34th
1 The higher the number, the lower the state's debt and the lower its debt ratios. Information was taken from
from Moody's "2016 State Debt Medians Report."
State Rank
Selected Ratios for Tax-Backed Debt: 2016
State of Oklahoma
(including comparisons with bordering states)
_______________

Oklahoma Senate Overview of State Issues 25
OKLAHOMA TAXES
This chapter focuses on how Oklahoma government imposes taxes to support
state, county, municipal and other local government programs. It also provides
extensive detail on several major tax sources – how the taxes are assessed, how
they are allocated, and where possible, how they compare with other state’s taxes
in the region and nation. To set the stage, a pie chart is provided on the following
page to show the categories of taxes collected which make the greatest
contribution to Oklahoma’s General Revenue Fund. To conclude, an overview is
provided of selected legislative tax policy initiatives over the past few decades.
STATE REVENUE MIX
Oklahoma’s revenue stream relies most heavily on income and sales/use tax.
Gross production tax from the oil and gas industry, motor vehicle taxes and fees
and alcohol and cigarette taxes are also significant, although to a lesser degree.
While reliance on revenue from income and sales tax is not unique, Oklahoma is
part of a small subset of states which may benefit greatly from gross production
taxes. This reliance on a sometimes volatile revenue source comes with its own
set of revenue estimating and budgeting challenges.
State tax collections flow into various funds, the most important of which is the
General Revenue Fund (more about this fund in the State Budget chapter). The
pie chart below looks at the major categories of tax revenue which make up the
General Revenue Fund.

Oklahoma Taxes
26 Oklahoma Senate Overview of State Issues
Sources of Tax Revenue to General Revenue Fund
FY’17 Estimates (In Millions)
Total = $5.306 Billion
Source: Oklahoma State Board of Equalization, June 2016 Certification
COMPARING STATE-BY-STATE TAX LEVELS
Policymakers often use state-by-state tax comparisons to guide their decisions.
However, profound differences exist between states in the way state and local
governments operate, particularly with respect to the way the burden for funding
public services is allocated. These differences can skew comparisons.
Comparison of Per Capita State and Local Taxes Most experts agree the best way to compare taxes among states is to combine
state and local tax revenues, which eliminates the differences in state versus local
responsibility for public services. The following table shows the most recent
comparison of per capita state and local taxes.

Oklahoma Taxes
Oklahoma Senate Overview of State Issues 27
State and Local Taxes 2013 Per Capita Taxes
Source: State Rankings 2016, A Statistical View of America, CQ Press, p. 303
Among regional states, Oklahoma has the third lowest per capita tax revenue and
all states in the region except Nebraska are below the national average. Alaska
was the highest in the nation with total per capita taxes of $9,211. Alabama had
the lowest with $3,048 in total per capita taxes.
The average Oklahoman contributes $1,108 less per year in state and local tax
revenue than the average American.
Comparison of Taxes as a Percent of Income Comparing the amount of taxes paid per capita (above) becomes more
meaningful when that amount is adjusted for the relative wealth of each state’s
residents. To do that, the following chart compares the percentage of personal
income the average resident pays in taxes. Oklahoma, with its relatively low per
capita income level, ranked 46th of the 50 states in state and local tax revenue as
a percentage of personal income in 2013.
Taxes
State Per Capita Ranking
Arizona $3,417 44
Arkansas $3,639 36
Colorado $4,339 23
Kansas $4,457 21
Louisiana $3,796 32
Missouri $3,460 42
Nebraska $4,653 17
New Mexico $3,673 35
Oklahoma $3,492 41
Texas $3,863 30
U.S. $4,600

Oklahoma Taxes
28 Oklahoma Senate Overview of State Issues
State and Local Taxes
As Percentage of Personal Income
Source: Ibid, p. 305
Alaska is ranked highest at 18 percent. South Dakota is ranked lowest at 7.8
percent. Overall, the amount of state and local taxes as a percentage of personal
income in Oklahoma dropped slightly from 8.4% to 8.3% between 2011 and
2013. Oklahoma’s percentage is lowest in the region, however it is interesting to
note how close it is to that of Texas, a state often cited as having a lower tax
burden due to the lack of a personal income tax.
INCOME TAXES
Oklahoma collected more than $3.25 billion in income tax revenues in FY'16,
accounting for 40.6 percent of total state tax revenue. Income taxes are the
largest single source of money for the state General Revenue (GR) Fund, equal to
46.5 percent of the deposits in FY’16. The state income tax is imposed on the
Oklahoma taxable income of all individuals and corporations, whether resident or
nonresident. Oklahoma taxable income is based on federal adjusted gross
income, so income tax changes enacted by Congress can impact state tax levels.
According to the CQ Press State Rankings 2016 publication, in 2014 Oklahoma
ranked 32nd among the states in per capita revenue collection from individual
income taxes.
Taxes as %
State of 2013 Income Ranking
Arizona 9.3% 35
Arkansas 10.0% 26
Colorado 9.3% 35
Kansas 10.1% 22
Louisiana 9.3% 35
Missouri 8.6% 44
Nebraska 10.1% 22
New Mexico 10.4% 17
Oklahoma 8.3% 46
Texas 8.8% 41
U.S. 10.3%

Oklahoma Taxes
Oklahoma Senate Overview of State Issues 29
Individual Income Tax Oklahoma’s graduated income tax rate ranges from ½ percent to 5 percent,
depending upon the amount of taxable income. For the 2016 tax year, the
schedule for a single individual is as follows:
½ percent on the first $1,000
1 percent on the next $1,500
2 percent on the next $1,250
3 percent on the next $1,150
4 percent on the next $2,300
5 percent on the remainder (see * below)
Since 2000, the Legislature has enacted a number of income tax changes,
ratcheting down the top marginal individual rate from 7 percent to 5 percent.
Legislation enacted during the 2014 session will result in one further reduction,
once a certain revenue target is met (referred to as a “trigger”). Based on the way
the law is written, this could result in a top rate of 4.85% as early as 2018
(discussed more fully in the final section of this chapter). As a result of such
changes over time, the following top marginal income tax rates apply:
Year Top Marginal Rate
2004 6.65%
2005 6.25%
2006 5.65%
2007 5.50%
2012 5.25%
2016 5.0%
2018 (*possible) 4.85%
Individual Income Taxes Comparison
As the chart below demonstrates, Oklahoma ranked 32nd
out of 43 states in the
per capita amount of individual income taxes collected. When compared to the
other states in this region, the state ranked 4th
lowest of nine states.
In 2014, New York had the highest per capita income tax collections with $2,176
collected per person. Seven states (Alaska, Florida, Nevada, South Dakota,
Texas, Washington and Wyoming) have no individual income tax.

Oklahoma Taxes
30 Oklahoma Senate Overview of State Issues
The average Oklahoman pays $213 less per year in individual income taxes than
the average American citizen.
Income Taxes 2016 Rates; 2014 Per Capita Revenue and Rankings
Source: Ibid, p. 334, and State Individual Income Taxes, 2016 Tax Rate Table, web page of
Federation of Tax Administrators (www.taxadmin.org)
Corporate Income Tax Corporate income tax is imposed at a flat six percent rate on Oklahoma taxable
income. The corporate income tax rate was last changed in 1990, as part of HB
1017. Income taxes paid by Oklahoma corporations produced $335 million in
revenues during FY’16. Corporate income taxes total just over 10.3 percent of
the amount collected through all income taxes.
Corporate Income Taxes Comparison Oklahomans pay about 77 percent of the national average per capita in corporate
income taxes. With the exception of Nebraska, all states in the region are below
the national average.
In comparing per capita corporate income tax revenue, Oklahoma ranks 36th of
the 46 states that levy a corporate income tax.
Alaska is the highest with $555 collected per capita. Five states (Ohio, Nevada,
Texas, Washington and Wyoming) have no corporate income tax.
Per Capita
State Tax Rate Revenue Ranking
Arizona 2.59 - 4.54% $514 41
Arkansas 0.9 – 6.9% $877 26
Colorado 4.63% $1,056 17
Kansas 2.7 - 4.6% $865 27
Louisiana 2 - 6% $592 39
Missouri 1.5 - 6% $884 25
Nebraska 2.46 - 6.84% $1,129 13
New Mexico 1.7 - 4.9% $622 38
Oklahoma 0.5 - 5% $764 32
Texas -- -- --
U.S. $977

Oklahoma Taxes
Oklahoma Senate Overview of State Issues 31
Corporate Income Tax 2016 Rates and 2014 Per Capita Revenue and Rankings
Source: Ibid, p. 336 and 2016 web page of Federation of Tax Administrators (www.taxadmin.org)
Statutory Apportionment of Income Taxes Individual income tax revenues are apportioned by the Oklahoma Tax
Commission on a monthly basis according to the following statutory schedule:
85.66% to the General Revenue Fund, which is appropriated by the
Legislature;
8.34% to the Education Reform Revolving Fund;
5.00% to the Teachers’ Retirement System Dedicated Revenue Revolving
Fund; and
1.00% to the Ad Valorem Reimbursement Fund to reimburse local
governments for lost revenues related to the exemption from ad
valorem taxes of new, expanded or acquired manufacturing
facilities.
Corporate income tax revenues are apportioned monthly as follows:
77.50% to the General Revenue Fund, which is appropriated by the
Legislature;
16.5% to the Education Reform Revolving Fund;
5.00% to the Teachers’ Retirement System Dedicated Revenue Revolving
Fund; and
1.00% to the Ad Valorem Reimbursement Fund.
Per Capita
State Tax Rate Revenue Ranking
Arizona 5.5% $85 41
Arkansas 1 - 6.5% $134 23
Colorado 4.63% $134 23
Kansas 4% $114 29
Louisiana 4 - 8% $103 33
Missouri 6.25% $59 44
Nebraska 5.58 - 7.81% $163 18
New Mexico 4.8 – 6.6% $99 36
Oklahoma 6% $102 35
Texas -- -- --
U.S. $145

Oklahoma Taxes
32 Oklahoma Senate Overview of State Issues
It is important to note that in some cases, the statutes provide for a certain
distribution either before the apportionment percentages are applied or outside
the traditional apportionment process. This is sometimes referred to as revenue
“taken off the top”. In the case of income tax collections, amounts are distributed
this way to the Rebuilding Oklahoma Access and Driver Safety Fund (known as
the ROADS Fund), Oklahoma’s Promise (formerly known as OHLAP), two
public transportation-related funds and a fund for certain agency computer
systems. Of these, the ROADS fund is by far the largest amount, with a
distribution expected to reach $511.9 million in FY’17.
History of Revenues from State Income Taxes Revenue from the state income tax has fluctuated over the last 10 years,
reflecting economic and policy changes. From FY’07 to FY’16, actual dollars
declined by 2.4% but when adjusted for inflation using 2007 as the base year, the
decline was significantly larger at just over 16%.
History of Income Tax Revenue FY’07 Through FY’16 (In Millions)
Source: Oklahoma Tax Commission and U.S. Bureau of Labor Statistics Inflation Calculator

Oklahoma Taxes
Oklahoma Senate Overview of State Issues 33
SALES AND USE TAXES
In FY'16, state sales tax revenue totaled over $2.26 billion and the use tax
produced over $203 million. The state rate for both the sales tax and use tax in
Oklahoma is 4.5 percent. The two taxes accounted for 42 percent of actual GR
Fund revenues in FY'16. The Legislature has authorized municipalities and
counties to levy sales taxes. There is no limit on the amount a municipality may
levy, although voter approval is required. Counties may levy up to two percent.
The use tax applies the same 4.5 percent tax on items purchased in other states to
be used in Oklahoma. While the remainder of this section focuses solely on sales
tax, use tax is becoming increasingly more significant due to the growth of
internet sales.
History of the State Sales Tax In actual dollars, sales tax collections grew by 24.2 percent between FY’07 and
FY’16 but when adjusted for inflation, grew by only 6.8 percent.
State Sales Tax Collections FY’07 Through FY’16 (In Millions)
Source: Oklahoma Tax Commission, U.S. Bureau of Labor Statistics Inflation Calculator

Oklahoma Taxes
34 Oklahoma Senate Overview of State Issues
Until 1983, all revenue from the state's then two percent sales tax was dedicated
to the Department of Human Services (DHS) for fulfilling the Oklahoma Social
Security Act. These funds were spent at the discretion of the Public Welfare
Commission and were not subject to legislative appropriation. Effective July
1983, statutes were amended to provide more legislative control. Though the
funds remained separate from the GR Fund, they could be expended only through
direct appropriation by the Legislature.
During the 1984 legislative session, a temporary third cent was added to the sales
tax rate, with the new revenue allocated to the GR Fund. Because of revenue
shortfalls during the next fiscal year, the 1985 Legislature made permanent the
third-cent tax and added another 0.25¢, making the total tax rate 3.25 percent.
Sales tax changes were again made during the 1987 session. Earmarking of the
original two percent sales tax to DHS was discontinued and the funds were
allocated to the GR Fund for annual appropriation by lawmakers. Also that year,
the Legislature confronted severe budget shortfalls by raising the sales tax from
3.25 percent to 4.0 percent effective June 1, 1987.
The most recent changes in the sales tax were made by the 1990 Legislature as
part of HB 1017, the Education Reform Act. Effective May 1, 1990, the sales tax
increased from 4.0 percent to 4.5 percent.
In November of 2016, Oklahomans will be given the opportunity to vote on State
Question 779. If enacted, it will levy an additional one cent sales tax dedicated to
funding public education.
Statutory Apportionment of Sales Taxes Sales tax revenues are apportioned by the Oklahoma Tax Commission as follows:
83.61% to the General Revenue Fund;
10.46% to the Education Reform Revolving Fund (HB 1017 Fund);
5.00% to the Teachers’ Retirement System Dedicated Revenue Revolving
Fund;
0.87% divided between two tourism funds (36%, capped* at $5 million
annually, to the Oklahoma Tourism Promotion Revolving Fund and
64%, capped* at $9 million annually, to the Oklahoma Tourism
Capital Improvement Revolving Fund); and
0.06% to the Oklahoma Historical Society Capital Improvement and
Operations Revolving Fund, capped* at the amount apportioned for
FY’15.
*Any amounts which accrue in excess of the caps are deposited to
the General Revenue Fund.
Prior to the application of the statutory apportionment schedule outlined above
(often referred to as “off the top”), cities and towns are reimbursed for losses
resulting from the annual Sales Tax Holiday.

Oklahoma Taxes
Oklahoma Senate Overview of State Issues 35
Sales Tax Exemptions Items exempt from the state sales tax by statute include most advertising, natural
gas and electricity sold for residential use, prescription drugs, groceries purchased
with food stamps and sales for resale. Many other sales to or by certain
organizations are also exempt. Most services are not taxed.
As a result of the passage of SQ 713 in November of 2004, cigarette and tobacco
products are no longer subject to sales tax.
State and Local Sales Tax 2016 Rates; 2014 Per Capita Revenue and Rankings
Source: Ibid, pg. 307 and 2016 web page of Federation of Tax Administrators (www.taxadmin.org)
Oklahoma’s ranking of 15th
in per capita state and local sales tax revenue places it
in the top half of those states which levy a sales tax. However, in the region only
3 states rank lower. The average Oklahoman spends $137 more a year in per
capita sales taxes than the average American citizen. When the state sales tax
rate is compared, only Colorado, Louisiana and Missouri have lower state rates.
Five states (Delaware, Montana, New Hampshire, Alaska and Oregon) have no
sales tax. It is important to note here that when looking at the actual rates, local
rates were not included. During this time when Oklahomans are considering the
proposed state question to raise the state tax (November of 2016 ballot), much
has been made of the relatively high state and local combined rates in some
jurisdictions.
State & Local State Only Sales Per Capita
State Tax Rate Revenue Ranking
Arizona 5.6% $1,361 9 Arkansas 6.5% $1,303 12 Colorado 2.9% $1,162 16 Kansas 6.5% $1,307 11 Louisiana 4.0% $1,465 5
Missouri 4.225% $880 29
Nebraska 5.5% $1,075 19
New Mexico 5.125% $1,403 7 Oklahoma 4.5% $1,171 15 Texas 6.25% $1,231 14 U.S. $1,034

Oklahoma Taxes
36 Oklahoma Senate Overview of State Issues
GROSS PRODUCTION TAXES
Significant revenues are generated for a number of state and local services
through taxes levied on extraction and production of certain raw materials. Gross
production taxes from the severance tax generated $319.8 million in FY'16. The
volatility of this revenue source is a key component of the state’s budget history.
History of Gross Production Tax Collections FY’07 Through FY’16 (In Millions)
Source: Oklahoma Tax Commission
There are two types of gross production taxes: the severance tax and petroleum
excise tax. The severance tax produces the lion’s share of the revenue.
Severance Tax A severance tax is a tax levied upon the production or mining of minerals when
they are "severed" from the earth. Taxes are levied on the production of uranium
at 5% and other minerals, ores and asphalt are taxed at 0.75%. The tax on
production of oil and gas is more complex, with a standard 7% tax rate which has
been modified over time based on the price per barrel or mcf and on incentives
for certain types of drilling.
From the late 1990’s until the beginning of FY’14, the tax on oil and gas was
based on a three-tiered structure. If the price of oil or gas rose or fell by a
specified amount, the tax rate would be adjusted. While it could fluctuate
between 1%, 4% and 7%, the price thresholds were not modified or indexed in a
way that resulted in many changes. Essentially, the tax rate remained at 7% for
most of the time the three-tiered structure was in place.

Oklahoma Taxes
Oklahoma Senate Overview of State Issues 37
During that same time period, eight unique incentives were put into place to
encourage the use of specific drilling technologies or to enhance production in
certain marginal wells. Each incentive had its own qualifying criteria, time limit
and sunset date. Generally speaking, most gave the producer a tax rebate for
6/7ths of the 7% tax paid on production during a specified number of months.
After each well reached the time limit of the applicable incentive, all production
was taxed at 7%. Sunset dates on these incentives were extended a number of
times, but in 2010 and 2014, more significant changes were made.
During the 2010 legislative session, HB 2432 changed the incentive for
horizontally-drilled wells and certain deep-drilled wells. In lieu of the rebate of
6/7ths of the tax, the wells were taxed at an up-front reduced rate for a specific
time period (1% for horizontal and 4% for deep). HB 2432 also addressed then-
current budget issues by suspending the payment of rebates due on certain
production. That amount was later repaid over a three-year period beginning in
FY’13.
Perhaps the most significant gross production tax change in decades occurred
during the 2014 legislative session. HB 2562 modified the tax rate/incentive
structure for all new production from wells spudded on or after July 1, 2015.
Those wells will be taxed at 2% for 36 months and then 7% thereafter. While
certain existing incentives were left in place for current production, each will
sunset either on July 1, 2015 (deep well, new discovery, and 3-D seismic) or on
July 1, 2020 (enhanced recovery, inactive well, production enhancement
incentives and economically-at-risk). Both the process of claiming an incentive
through a rebate and the taxation of certain production at 1% or 4% will phase
out as the incentives reach the sunset date.
Additional changes were made during the 2016 legislative session to the
economically-at-risk incentive. SB 1577 tightened the qualifications for the
incentive for all production on or after July 1, 2015 and capped the total amount
of claims paid each year to no more than $12.5 million.
Petroleum Excise Tax A petroleum excise tax is levied, in addition to the severance tax, on oil and gas
at a rate of 0.095 of 1 percent of gross value.
Apportionment of Gross Production Taxes Severance Taxes on Oil: Pursuant to 68 O.S. 1001, the apportionment of
severance tax revenues varies depending on the tax rate imposed.
If levied at a seven percent tax rate:
25.72% to the Common Education Technology Fund;
25.72% to the Higher Education Capital Fund;
25.72% to the Oklahoma Tuition Scholarship Fund;
3.745% to the County Bridge and Road Improvement Fund;

Oklahoma Taxes
38 Oklahoma Senate Overview of State Issues
7.14% to counties where the oil is produced, for roads;
7.14% to school districts;
4.28% * to three funds – the Oklahoma Tourism and Recreation
Capital Expenditure Revolving Fund, the Oklahoma
Conservation Commission Infrastructure Revolving Fund
and the Community Water Infrastructure Development
Revolving Fund – at one-third each from FY’07 to FY’19;
and
0.535% to the Statewide Circuit Engineering District Revolving
Fund.
If levied at a four percent tax rate:
22.50% to the Common Education Technology Fund;
22.50% to the Higher Education Capital Fund;
22.50% to the Oklahoma Tuition Scholarship Fund;
3.28% to the County Bridge and Road Improvement Fund;
12.50% to counties where the oil is produced, for roads;
12.50% to school districts;
3.75%* to three funds – the Oklahoma Tourism and Recreation
Capital Expenditure Revolving Fund, the Oklahoma
Conservation Commission Infrastructure Revolving Fund
and the Community Water Infrastructure Development
Revolving Fund – at one-third each from FY’07 to FY’19;
and
0.47% to the Statewide Circuit Engineering District Revolving
Fund.
* Beginning FY’20, the percentage divided between three funds will
revert back to the REAP (Rural Economic Action Plan) Water Projects
Fund.
If levied at a two percent tax rate:
50.0% to the General Revenue Fund;
25.0% to counties where the gas is produced, for roads; and
25.0% to school districts.
If levied at a one percent tax rate:
50.0% to counties where the oil is produced, for roads; and
50.0% to school districts.
Severance Taxes on Gas: Like revenues from severance taxes on oil
production, the monthly apportionment of severance taxes on gas production
varies depending on the tax rate imposed.

Oklahoma Taxes
Oklahoma Senate Overview of State Issues 39
If levied at a seven percent tax rate:
85.72% to the General Revenue Fund;
7.14% to counties where the gas is produced, for roads; and
7.14% to school districts.
If levied at a four percent tax rate:
75.0% to the General Revenue Fund;
12.5% to counties where the gas is produced, for roads; and
12.5% to school districts.
If levied at a two percent tax rate:
50.0% to the General Revenue Fund;
25.0% to counties where the gas is produced, for roads; and
25.0% to school districts.
If levied at a one percent tax rate:
50.0% to counties where the gas is produced, for roads; and
50.0% to school districts.
Severance Taxes on Other Minerals: Severance tax revenues from other
minerals are apportioned monthly as follows:
85.72% to the General Revenue Fund;
7.14% to counties where the mineral is produced for roads; and
7.14% to school districts.
Petroleum Excise Taxes: Until July 1, 2021, petroleum excise tax revenues
from oil are apportioned monthly as follows:
82.634% to the General Revenue Fund*;
10.526% to the Corporation Commission Plugging Fund; and
6.84% to the Interstate Oil Compact Fund.
Excise tax revenue from natural gas is apportioned monthly as follows:
82.6045% to the General Revenue Fund*;
10.5555% to the Corporation Commission Plugging Fund; and
6.84% to the Interstate Oil Compact Fund.
After July 1, 2021, petroleum excise tax revenues from oil and gas will be
apportioned monthly as follows:
92.35% to the General Revenue Fund*; and
7.65% to the Interstate Oil Compact Fund.
* The first $2.7 million is transferred to the Corporation Commission.

Oklahoma Taxes
40 Oklahoma Senate Overview of State Issues
MOTOR VEHICLE TAXES
The State of Oklahoma levies an annual tax for the registration of motor vehicles,
and also levies excise taxes upon the transfer of title or possession of motor
vehicles. Until 2001, the annual registration fee was based upon the value of the
vehicle, and the excise tax was based on the factory delivered price, depreciated
35 percent per year for used vehicles. This resulted in a situation in which annual
registration fees were increasing as factory delivered prices increased from year
to year, and in which the value upon which excise taxes were paid was unequal to
the sales price of a vehicle. (Typically, the value upon which excise taxes were
paid was higher for new vehicles and considerably lower for used vehicles.) The
fees to register vehicles in Oklahoma, other than commercial and farm vehicles,
were among the highest in the nation, resulting in various forms of tax evasion
and avoidance, such as increased use of out-of-state tags, Indian tags and
commercial vehicle tags.
In 2000, the Legislature referred to the voters a question which imposed flat
registration fees based upon the age of the vehicle ($85 for vehicles 1-4 years old,
$75 for 5-8 years old, $55 for 9-12 years old, $35 for 13-16 years old and $15 for
17+ years old, all with an additional $5 in other fees added on). The question
also based excise taxes on the actual sales price of new vehicles, at a rate of 3.25
percent. For used vehicles, the excise tax is based on the actual sales price also,
at a rate of $20 for the first $1,500 and 3.25 percent on the remainder. The value
of used vehicles must be within 20 percent of the “blue book” value.
Beginning with FY’16, motor vehicle taxes and fees are apportioned monthly to
eleven different funds and/or entities, as follows:
36.20% to school districts;
0.31% to the State Transportation Fund;
7.24% to counties;
2.59% to counties for county roads;
3.62% to county highway funds;
0.83% to county general funds;
3.10% to cities and towns;
24.84% to the General Revenue Fund;
1.24% to the Oklahoma Law Enforcement Retirement Fund;
0.034% to the Wildlife Conservation Fund; and
20.0% to the County Improvements for Roads and Bridges Fund.

Oklahoma Taxes
Oklahoma Senate Overview of State Issues 41
As the result of legislation beginning in FY’16 (HB 2244), a number of the
recipients of revenue listed above are subject to limits in spite of the statutory
apportionment percentage. The first seven (italicized above) are capped at the
actual amount apportioned during FY’15, with any excess deposited into the
General Revenue Fund. The last fund listed, the County Improvements for
Roads and Bridges Fund (CIRB) is capped at $120 million annually.
Making comparisons with other states in this area is difficult. Unlike most other
states, in Oklahoma the annual registration fees are in lieu of property taxes on
motor vehicles. Many other states impose sales taxes instead of special motor
vehicle excise taxes, so these revenues are not considered as motor vehicle
revenue. For these reasons, interstate comparisons do not provide an accurate
representation.
ALCOHOL AND TOBACCO TAXES
Oklahoma levies taxes on various categories of alcoholic beverages, cigarettes
and tobacco products. The beverage taxes are split into three separate categories:
“Beverage” tax: All low point beer (½% to 3.2% alcohol) is taxed at $11.25
per 31-gallon barrel and is paid by the wholesaler. All revenue from the
beverage tax is apportioned to the General Revenue Fund.
“Alcoholic beverages”: All spirits ($1.47 per liter), wine ($0.19 per liter),
sparkling wine ($0.55 per liter) and higher-point beer ($12.50 per 31-gallon
barrel) are subject to tax at the rates indicated. It is paid by the first licensee
in the state who imports or handles the beverages and is passed on to, and
levied upon, the ultimate consumer. That revenue is
apportioned as follows:
o 2/3rds of 97% to the General Revenue Fund, except for up to $350,000
collected annually from the sale of wine and sparkling wine to the
Oklahoma Viticulture and Enology Center Development Revolving
Fund;
o 1/3rd
of 97% to counties on the basis of area and population;
and
o 3% to the Tax Commission Revolving Fund.
“Mixed beverage” tax: Any beverage sold by the individual drink for on-
premises consumption is subject to an excise tax of 13.5%, levied on the
license-holder serving the drink. All revenue from the mixed beverage tax is
apportioned to the General Revenue Fund. Unlike the other two taxes listed,
the mixed beverage tax is relatively “new”. It was first levied in 1985, in the
year after Oklahoma voters approved the sale of liquor by the drink.

Oklahoma Taxes
42 Oklahoma Senate Overview of State Issues
If State Question 792 is approved by the voters in November of 2016, the
provisions of SB 383 will take effect on October 1, 2018. SB 383 recodifies all
provisions of Title 37 of the Oklahoma Statutes into a new Title 37A. The tax
structure described above is not substantially changed, except that the beverage
tax on low point beer will not be in effect, and there will be no distinction made
between low point beer and strong beer. If low point beer is sold, it will be taxed
as an alcoholic beverage at the rate of $12.50 per 31-gallon barrel.
History of Alcoholic Beverage-Related* Tax Collections
FY’07 Through FY’16 (In Millions
*Includes taxes and fees associated with alcoholic beverages, low-point beer and mixed
beverages
Source: Oklahoma Tax Commission
Cigarettes and tobacco products are taxed separately from alcoholic beverages
and from each other. It is also important to note that some tax disparities exist
between tribal and non-tribal sales, and that those rates are separate from the tax
outlined below.
Cigarettes: A tax of $1.03 is levied on each 20-cigarette pack. The tax is
paid by wholesalers and passed on the consumer. This tax rate became
effective in January of 2005, when Oklahoma voters approved a change in
the taxation of cigarettes. Cigarettes were exempted from sales tax and the
excise tax rate was increased by $0.80 per pack. The first $0.23 on each
pack is used to repay state bonds. Of the additional $0.80, over 60% is
apportioned to a variety of eight health-related funds. In addition, the
following amounts are apportioned:
o 16.83% to the General Revenue fund
o 14.23 % to counties and cities to replace lost sales tax
o 2.07% to the Education Reform Revolving Fund; and

Oklahoma Taxes
Oklahoma Senate Overview of State Issues 43
o 1% to the Teachers’ Retirement System.
Tobacco products: Tax rates depend upon the size of the cigar or the type of
tobacco. Little cigars are taxed at $0.72 per pack of 20 and large cigars at
$0.12 each. Smoking tobacco is taxed at 80% of the factory list price and
chewing tobacco at 60% of the factory list price. Revenue generated by
tobacco products after January of 2005 is apportioned exactly as the
“additional $.80” for cigarettes, as noted above.
History of Cigarette and Tobacco Products* Tax Collections
FY’07 Through FY’16 (In Millions)
*Includes taxes and fees associated with cigarettes and tobacco products.
Source: Oklahoma Tax Commission
Since the taxation structures for cigarettes and alcoholic beverages can vary
greatly from state to state, comparisons are difficult and may not provide an
accurate picture. For that reason, data for Oklahoma’s surrounding states have
not been included.
MOTOR FUELS TAXES
One of the ways the state generates revenue for state highways and county roads
is through an excise tax levied on motor fuels. The taxes are apportioned
according to formulas established by the Legislature. The two major taxes levied
are the gasoline tax and the diesel fuel tax. The gasoline tax of 17¢ per gallon
and diesel fuel tax of 14¢ per gallon are used to fund work on roads and bridges.

Oklahoma Taxes
44 Oklahoma Senate Overview of State Issues
History of Motor Fuels Taxes The fuel tax was first enacted in 1923 at a rate of 1¢ per gallon. The tax on diesel
fuel was initiated in 1939. Throughout the state’s history, motor fuel taxes have
been increased 19 times, most recently in 1990.
Oklahoma's Motor Fuel Tax Rate History
Date Gasoline Diesel Date Gasoline Diesel
March 1923 $.01 January 1947 $.0558 $.055
March 1924 .025 June 1949 .0658 .065
March 1925 .03 June 1953 .0658 .065
June 1929 .04 June 1957 .0758 .065
February 1931 .05 December 1957 .0658 .065
December 1931 .04 April 1984 .09 .09
April 1939 .04 $.04 July 1985 .10 .10
July 1939 .0408 .04 May 1987 .16 .13
June 1941 .0558 .055 July 1990 .17 .14
April 1945 .0758 .055
In 1996, the Legislature revised the motor fuel tax code in response to a U.S.
Supreme Court ruling that affected the state's ability to tax sales made in Indian
country. Although the tax rate was not changed, the point of taxation was moved
"upstream" to the terminal rack. Also, provisions were made for apportionment
of some motor fuel tax revenue to Indian tribes that enter into agreements with
the state on fuel tax issues.
Revenues from Fuel Taxes Oklahoma state and local governments received approximately $430 million in
motor fuel tax revenues in FY'16. Among the 50 states, Oklahoma ranked 33rd
in per capita state revenue collections in 2014. The average Oklahoman pays $14
less annually in motor fuel taxes than the average American citizen.
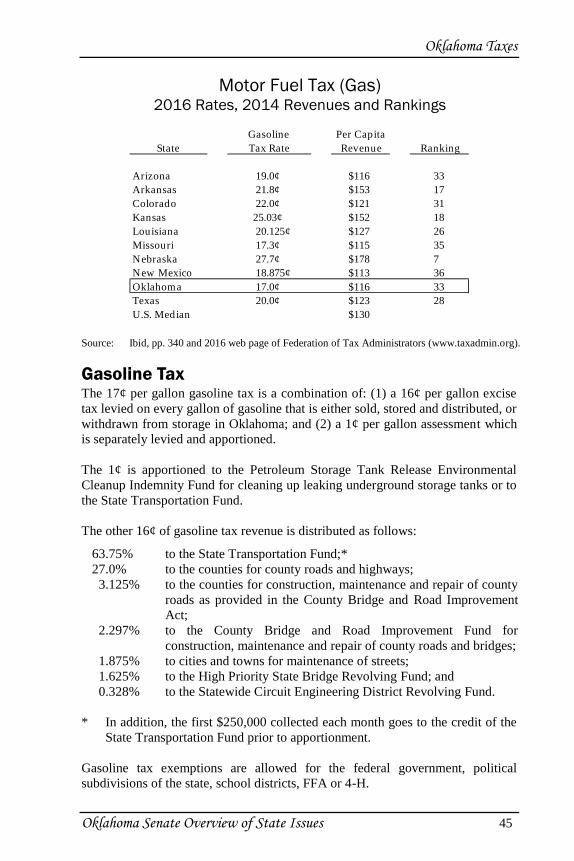
Oklahoma Taxes
Oklahoma Senate Overview of State Issues 45
Motor Fuel Tax (Gas) 2016 Rates, 2014 Revenues and Rankings
Source: Ibid, pp. 340 and 2016 web page of Federation of Tax Administrators (www.taxadmin.org).
Gasoline Tax The 17¢ per gallon gasoline tax is a combination of: (1) a 16¢ per gallon excise
tax levied on every gallon of gasoline that is either sold, stored and distributed, or
withdrawn from storage in Oklahoma; and (2) a 1¢ per gallon assessment which
is separately levied and apportioned.
The 1¢ is apportioned to the Petroleum Storage Tank Release Environmental
Cleanup Indemnity Fund for cleaning up leaking underground storage tanks or to
the State Transportation Fund.
The other 16¢ of gasoline tax revenue is distributed as follows:
63.75% to the State Transportation Fund;*
27.0% to the counties for county roads and highways;
3.125% to the counties for construction, maintenance and repair of county
roads as provided in the County Bridge and Road Improvement
Act;
2.297% to the County Bridge and Road Improvement Fund for
construction, maintenance and repair of county roads and bridges;
1.875% to cities and towns for maintenance of streets;
1.625% to the High Priority State Bridge Revolving Fund; and
0.328% to the Statewide Circuit Engineering District Revolving Fund.
* In addition, the first $250,000 collected each month goes to the credit of the
State Transportation Fund prior to apportionment.
Gasoline tax exemptions are allowed for the federal government, political
subdivisions of the state, school districts, FFA or 4-H.
Gasoline Per Capita State Tax Rate Revenue Ranking
Arizona 19.0¢ $116 33
Arkansas 21.8¢ $153 17 Colorado 22.0¢ $121 31
Kansas 25.03¢ $152 18 Louisiana 20.125¢ $127 26 Missouri 17.3¢ $115 35 Nebraska 27.7¢ $178 7
New Mexico 18.875¢ $113 36 Oklahoma 17.0¢ $116 33 Texas 20.0¢ $123 28 U.S. Median $130

Oklahoma Taxes
46 Oklahoma Senate Overview of State Issues
Gasoline Tax Revenue (16 cents) FY’07 Through FY’16 (In Millions)
Source: Oklahoma Tax Commission
Only five states have a gas tax rate equal to or lower than Oklahoma’s 17¢ per
gallon rate.
Diesel Fuel Tax The 14¢ per gallon diesel fuel tax is a combination of: (1) a 13¢ per gallon excise
tax levied on every gallon of diesel fuel that is either sold, stored and distributed,
or withdrawn from storage in Oklahoma; and (2) a 1¢ per gallon assessment
which is separately levied and apportioned.
The 1¢ assessment is apportioned to the Petroleum Storage Tank Release
Environmental Cleanup Indemnity Fund for cleaning up leaking underground
storage tanks or to the State Transportation Fund.
The remaining 13¢ of diesel fuel tax revenue is distributed as follows:
64.34% to the State Transportation Fund;
26.58% to counties for county roads and highways;
3.36% to the counties for construction, maintenance and repair of county
roads as provided for in the County Bridge and Road
Improvement Act;
3.84% to the County Bridge and Road Improvement Fund for
construction, maintenance and repair of county roads and bridges;
1.39% to the High Priority State Bridge Revolving Fund; and
0.488% to the Statewide Circuit Engineering District Revolving Fund.
Diesel tax exemptions are allowed for the federal government, political
subdivisions of the state, school districts, limited agriculture uses, FFA or 4-H.

Oklahoma Taxes
Oklahoma Senate Overview of State Issues 47
Diesel Fuel Tax Revenue FY’07 Through FY’16 (In Millions)
Source: Oklahoma Tax Commission
Only one state has a lower diesel tax rate than Oklahoma’s 14¢ per gallon rate.
PROPERTY TAXES IN OKLAHOMA
Property taxes, also known as ad valorem taxes, are the primary source of
funding for county government operations and in fact, the Oklahoma Constitution
specifically prohibits the use of ad valorem taxes for state government purposes.
This revenue source also provided 23.07 percent of the statewide public school
budget (FY’15) and 70.9 percent of career technology (vo-tech) center funding
(FY’16).
Decisions about property taxes in Oklahoma are made at three levels: (1) the
Oklahoma Constitution authorizes property taxes to be imposed; (2) the
Legislature has enacted statutes to implement constitutional provisions; and (3)
the State Board of Equalization and the courts have interpreted these
constitutional and statutory provisions. Property taxes can only be imposed if the
people vote for them, a provision that has been in place since statehood and is not
related to SQ 640 (a constitutional limit on other taxes). Property tax levies are
based on the value of a taxpayer's property.

Oklahoma Taxes
48 Oklahoma Senate Overview of State Issues
Property Tax Comparison with Other States Oklahoma’s per capita property tax average of $595 per person in 2013 was
about 41% of the national average of $1,439. Oklahoma ranks 49th out of the 50
states in per-capita property taxes. Only Alabama ranks lower.
The Oklahoma Constitution provides that property tax revenue may not be used
by state government. In many other states, a state property tax is charged in
addition to local property taxes.
Per Capita State and Local Property Tax Revenue
2013
Source: Ibid, p. 309
Valuation of Property for Tax Purposes Property taxes are paid based on the value of a taxpayer’s property. The county
assessor, a locally-elected officeholder, determines the value of most property in
the county for tax purposes.
Real Property: The value of real property (land and structures) is determined by
computer-assisted calculation (see Computerization Appraisals) but are subject to
certain constitutional limits (see Limits on Property Valuations).
Personal Property: The value of personal property – furnishings, equipment,
clothes, etc. – is assessed separately from real property. Motor vehicles are
subject to registration fees in lieu of property taxes. The county assessor by law
may use one of two methods to assess the value of personal property: (1) assume
that a taxpayer's personal property is valued at 10 percent of the value of his/her
real property, or (2) have a taxpayer file a list of his/her personal property for
assessment of value. Most calculations are based on the assumed value. Some
counties have voted to exempt personal property from taxation. A special class
of personal property is known as intangible personal property. In November of
2012, Oklahoma voters voted to exempt all intangible personal property.
Per Capita State Revenue Ranking
Arizona $1,009 33 Arkansas $659 48 Colorado $1,333 24
Kansas $1,425 19
Louisiana $849 42 Missouri $977 34 Nebraska $1,649 13 New Mexico $685 47 Oklahoma $595 49 Texas $1,560 14 U.S. $1,439

Oklahoma Taxes
Oklahoma Senate Overview of State Issues 49
Centrally Assessed Property: Property of certain companies (public service
corporations, railroads and airlines) is centrally assessed – its value is determined
by the State Board of Equalization rather than the local assessors.
Computerizing Appraisals A system called "computer-assisted mass appraisal" (CAMA) was implemented
in Oklahoma to allow counties to systematically update property values based on
recent sales of comparable properties. The goals of this program are (1) to have
property values more accurately reflect fair market value for tax purposes, and
(2) to make property valuation more uniform throughout the county.
Limits on Property Valuations Real property is valued at its "fair cash value" – the price a willing buyer would
pay a willing seller in an "arm's-length" transaction. Real property may also be
valued at its "use value" – its fair cash value for the highest and best use for
which the property was actually used (or classified for use) during the previous
calendar year. This "use value" provision is most often applied to agricultural
land.
In 1996, 2004 and 2011, the Legislature proposed, and the voters approved,
Constitutional amendments that affected the valuation process.
One amendment provided that the fair cash value of locally-assessed real
property (i.e., all real property except that of public service corporations,
airlines and railroads) cannot be increased by more than a specified
percentage in any year, unless title to the property is transferred or
improvements are made to the property. The cap was originally set at 5
percent in 1996, then in November of 2012, voters reduced this percentage to
three percent for homestead property and agricultural property.
Another amendment provided that valuation would be frozen, beginning
January 1, 1997, for taxpayers with gross household income of $25,000 or
less if the head of household is 65 years of age or older (often referred to as
the “senior freeze”. State Question 714 (2004) replaced the $25,000 income
threshold with a county- or metropolitan area-specific amount determined by
the U.S. Department of Housing and Urban Development each year. For
calendar year 2016, county median incomes ranged from $22,000 to
$32,900.
Another amendment enacted in 2004 provided those with 100 percent
military disability with a property tax exemption for the full fair cash value
of their homestead. The benefit is also extended to a surviving spouse. In
November of 2014, Oklahoma voters expanded this provision. One change
made it possible for a veteran who sells one exempt property and acquires a
new one in the same year to claim an exemption for each during the

Oklahoma Taxes
50 Oklahoma Senate Overview of State Issues
appropriate time period. Another allowed a surviving spouse to continue to
claim the full amount of the exemption after the qualified veteran has died.
Homestead Exemptions A taxpayer may apply for a homestead exemption that reduces by $1,000 the
assessed value of a taxpayer's actual residence. Taxpayers whose gross
household income from all sources does not exceed $20,000 may receive an
additional homestead exemption of $1,000 (often referred to as the “double
homestead exemption”). A taxpayer who is at least 65 years old, or who is
totally disabled, and whose gross household income from all sources does not
exceed $12,000, may file a claim for property tax relief for the amount of
property taxes paid over one percent of his/her income, up to a maximum of
$200.
Assessment Ratios Once a property’s value is computed by the county assessor, the "assessment
ratio" or "assessment percentage" is applied. For locally-assessed property, the
county assessor sets the ratio, but any increase must be approved by local voters.
Personal property must be assessed at an amount between 10 percent and 15
percent of its fair cash value; real property must be assessed at an amount
between 11 percent and 13.5 percent of its fair cash value; and most other
property (public service corporation, airline and railroad property) must be
assessed at the ratio it was assessed on January 1, 1997 (22.85 percent for public
service corporation property and 12.08 percent for railroads and airlines).
The value of the property is multiplied by the assessment ratio to get the
"assessed valuation". The assessed valuation is then multiplied by the number of
mills which local voters have approved in their area to compute the amount of tax
due.
Millages Allowed under the State Constitution Votes on property tax levies address the number of mills to be assessed (a mill is
$0.001 or one-tenth of a cent). The Oklahoma Constitution allows the following
maximum levies:
10 mills for counties;
39 mills for schools;
2.5 mills for county health departments;
10 mills for CareerTech schools;
3 mills for ambulance service districts;
3 mills for solid waste management services;
5 mills for county building fund;

Oklahoma Taxes
Oklahoma Senate Overview of State Issues 51
5 mills for city building fund;
5 mills for school building fund; and
4 mills for libraries.
The Constitution allows counties to abolish taxes on household personal property
and livestock upon a vote of the people. If these taxes are abolished, the millage
rates are automatically adjusted upward by an amount necessary to offset the lost
revenue.
Millage Elections Boards of county commissioners or local boards of education generally are the
entities that call millage elections. Those bodies also determine how many mills
will be voted on, although in some cases an initiative petition can propose a
millage amount. Some of these levies must be voted on each year, such as 15 of
the 39 mills allowed for schools. Other levies, once approved by voters, remain
in effect until changed or repealed.
The Constitution also allows counties, cities, school districts, career technology
(vo-tech) districts, ambulance service districts, and solid waste districts to issue
bonds if approved by the voters. If approved, the additional millage levy is
imposed in an amount necessary to repay the bonds each year. This millage level
is not necessarily the same each year. The revenue from these levies is deposited
into a "sinking fund", which disperses principal and interest payments to
bondholders.
Examples of Tax Computation The complex process for computing a taxpayer’s ad valorem tax is confusing to
many. The following step-by-step illustration shows how the final property tax
amount is computed on a specific taxpayer:
A taxpayer lives in a home valued at $50,000 in the city of Moore, in
the Moore school district, in Cleveland County. The sum of all mills
that have been approved by voters in that county was 104.84 in 1997.
Comprising the total are 10.28 mills for the county, 0.28 mills for the
county sinking fund, 13.73 mills for the city sinking fund, 2.57 mills
for the county health department, 4.11 mills for county libraries, 40.18
mills for public schools, 5.15 mills for the school building fund, 15.18
mills for the school sinking fund, 9.25 mills for the vo-tech school and
4.11 mills for the vo-tech building fund.

Oklahoma Taxes
52 Oklahoma Senate Overview of State Issues
Real Property: The assessor would compute the real property tax on that home
as follows:
a. $50,000 gross home valuation x 12 percent assessment ratio = $6,000
assessed valuation
b. $6,000 assessed valuation - $1,000 homestead exemption = $5,000 net
assessed valuation
c. $5,000 net assessed valuation x 104.84 mills = $524.20 annual real property
taxes
Personal Property: Household personal property taxes for this taxpayer would
be computed as follows (note, however, that Cleveland County has abolished
personal property taxes):
a. $50,000 gross home valuation x 10 percent = $5,000 assumed personal
property value (this amount could be changed if the taxpayer chose to file a
list of his/her personal property)
b. $5,000 personal property value x 12 percent assessment ratio = $600
assessed valuation
c. $600 assessed valuation x 104.84 mills = $62.90 annual personal property
taxes
Total Tax Due: $62.90 for personal property + $524.20 for real property =
$587.10.
TAX POLICY
Since the mid-1990s, tax relief legislation has largely been tied to trends in the
state economy. During periods when a strong economy produced healthy growth
in tax revenues, tax relief legislation has tended to be broad in scope and impact
and provided without cutting essential state services. When the opposite is true,
tax relief is limited and generally targeted to a few key industries or groups or, in
the case of income tax changes, made conditional upon revenue growth through
means such as a “trigger” mechanism. During times of budget distress, existing
tax relief provisions are scrutinized.
From the mid-1990’s through 2001, the Legislature reduced the top marginal
income tax rate twice, enacted numerous tax credits, exemptions and deductions
(often referred to as tax expenditures), modified the gross production tax rate
structure and referred to Oklahoma voters a reduction in motor vehicle taxes and
fees. Then during the 2002 and 2003 sessions, when faced with declining state
tax revenues, tax relief was limited to narrowly-targeted measures affecting very
specific economic sectors such as energy and manufacturing.

Oklahoma Taxes
Oklahoma Senate Overview of State Issues 53
From the 2004 through 2007 legislative sessions, bolstered by an improving state
economy, the Legislature embarked on a multi-year tax relief program which
included:
Multiple reductions in the top marginal individual income tax rate;
Property tax relief for 100% disabled veterans and senior citizens (both sent
to a vote of the people);
Increases in the standard deduction and exemptions for senior citizens and
military retirees;
Exemptions for certain capital gains;
Elimination of the estate tax;
Various exemptions from sales tax, particularly for specified groups or
entities; and
Various tax credits for certain classes of taxpayers or industries.
During this same time period, the Legislature sent to a vote of the people a
change in the taxation of cigarettes and tobacco products. In November of 2004,
voters approved a new structure which increased excise taxes and eliminated
sales tax. The majority of new revenue was dedicated to health-related funds.
This type of change in tax policy – an increase implemented through a statewide
vote of the people – demonstrates the role of the constitutional limit on revenue
measures on tax policy (Article V, Section 33, often referred to as “state question
640”).
Since 2008, economic and revenue volatility has limited the ability of the
Legislature to provide tax relief. For several years, only targeted relief was
enacted. For example, 2008 legislation provided gross production tax exemptions
for certain deep-drilled wells and in 2009, the income tax deduction for active
duty military was increased to 100%.
A sea change occurred in 2010 when the state faced an historic revenue shortfall.
During that session the state budget was balanced in part by enactment of both
revenue enhancement measures and a two-year moratorium on the ability to
claim about thirty existing tax credits.
During the next few sessions (2011 and 2012), some targeted tax relief legislation
was enacted but policymakers were unable to agree on the single best approach
for further reducing income tax rates. Interim studies by both the House and
Senate focused on the existing tax structure and on the impact and relative
effectiveness of the numerous existing tax expenditures. This broad, analytical
approach ultimately resulted in the passage of several important measures during
the 2013 session, including:

Oklahoma Taxes
54 Oklahoma Senate Overview of State Issues
A two-step reduction in the top marginal income tax rate, with each
reduction subject to a trigger based on certain revenue targets (HB 2032).
NOTE: Because the bill also apportioned income tax revenue for Capitol
repair and restoration, it was later found by the State Supreme Court to be
unconstitutional as a violation of the “single subject” rule;
Elimination of over twenty credits and deductions in existing law (HB2308);
Conversion of several transferrable tax credit provisions into refundable
credits (SB 343); and
Making tax relief provisions for victims of natural disasters permanent
(SB 330).
At the top of the legislative priority list for the 2014 session was a new measure
to address the invalidation of the income tax cut legislation. SB 1246 provided
for the same two-step rate reduction, with the earliest possible cut to occur for tax
year 2016 and the second step down as early as 2018.
As provided by law, in December of 2014 the State Board of Equalization
(SBOE) met and determined that the statutorily-required revenue growth was
adequate to trigger a change. As a result, the top marginal rate fell from 5.25% to
5% in the 2016 tax year. The specific trigger for this change required the General
Revenue Fund estimate for FY’16 to be equal to or greater than the estimate
certified for that fund in February of 2013 (when the rate cut was originally
enacted).
The determination for the second rate cut from 5% to 4.85% has a trigger which
is structured differently. The law requires the SBOE to determine that the
estimated growth in General Revenue Fund collections for the upcoming fiscal
year (FY’18 at the earliest) is equal to or greater than (will “cover”) the estimated
reduction in income tax collections resulting from the rate drop. If this happens,
the new rate may become effective as early as tax year 2018. In addition to using
a different measure, the law requires that the second trigger decision be made in a
two-step process, with a preliminary determination at its December meeting and
a final determination at its February meeting.
It is worth mentioning here that triggers have been used a number of times in the
past (as far back as the 1990s). While each has been based on unique criteria,
fiscal years and funds, they share the same essential goal – to determine if
estimates of future revenue meet (or in some cases, do not meet) a specified level
which will allow implementation of a proposed tax change. While this is
intended as a hedge against unforeseen revenue or budget problems, the specifics
are important. As noted above, the trigger mechanisms for the two rate changes
prescribed in SB 1246 were very different. The resulting reduction to a 5% top
marginal rate took effect during a year in which the state faced declining
revenues and there were efforts, though ultimately unsuccessful, to roll back the
trigger and delay the implementation of the 5% rate. This is an issue that may be

Oklahoma Taxes
Oklahoma Senate Overview of State Issues 55
revisited in the 56th
Legislature, and certainly when and if additional income tax
rate cuts are proposed.
During the 2014 session, the Legislature also modified existing tax credits,
exemptions and deductions related to the aerospace industry, donations to certain
scholarship-granting organizations, compressed natural gas property, expenses
for foster care providers and natural disasters. A new credit program was
established to incentivize investment in development of low income housing.
Like the prior year, a handful of bills also eliminated or placed sunsets on certain
credit provisions.
Finally, the 2014 session also included a major change to the gross production
tax levy. HB 2562 modified the gross production tax rate for all new oil and gas
production from wells spudded on or after July 1, 2015 to 2% for the 36 months
and 7% thereafter. Existing incentives for certain specific types of drilling will
sunset either on July 1, 2015 (deep well, new discovery, and 3-D seismic) or on
July 1, 2020 (enhanced recovery, inactive well, production enhancement
incentives and economically-at-risk). The process of claiming an incentive
through a rebate process will phase out as the incentives reach the sunset date.
Due to continuing revenue and budget difficulties, tax policy legislation during
the 2015 session was focused in part on analysis of incentive programs. HB 2182
established a formalized procedure for analyzing certain tax incentives by
creating the Incentive Evaluation Act, which requires many incentives to be
evaluated at least once every four years by a new Incentive Evaluation
Commission. A more targeted approach was taken in two measures which
modified the incentives for wind energy production. SB 502 prohibited
taxpayers engaged in wind power generation from claiming the investment/new
jobs tax credit and SB 498 established a 2017 tax year sunset on the ability of
such entities to claim new ad valorem exemptions. Debate also focused on the
earmarking of tax revenue outside of the appropriation process. HB 2243 capped
the amount of sales tax revenue apportioned to certain funds, with the excess
deposited to the credit of the General Revenue Fund. HB 2244 accomplished the
same thing with respect to motor vehicle tax and fee revenue.
In 2016, the Legislature took a targeted approach to income tax incentives, by:
Reducing by 25% the value of credits for railroad modernization (HB 3204)
and coal production and use (SB 1614);
Eliminating the credits for energy efficient residential construction
(SB 1603) and child care service providers (SB 1605);
Capping the total amount of investment/new jobs credits which may be
claimed annually to $25 million for a two-year period (SB 1582);
Extending the sunset date for the small business guaranty fee credit but
adding a specific “measurable goal” requirement (HB 2536);

Oklahoma Taxes
56 Oklahoma Senate Overview of State Issues
Eliminating the refundability aspect of the Oklahoma earned income tax
credit (SB 1604); and
Eliminating the so-called “double deduction” by requiring state and local
income or sales taxes included in itemized deductions on the federal return to
be added back to calculate Oklahoma taxable income (SB 1606).
Gross production tax incentives were also addressed through the application of an
annual $12.5 million cap on the incentive for “economically at-risk” oil and gas
leases (SB 1577).
In order to address revenue volatility, the 2016 Legislature also created the
Revenue Stabilization Fund (HB 2763). This measure requires the SBOE to
monitor the amounts of revenue from oil, gas and corporate income tax by
certifying the 5-year average annual amounts which flow to the General Revenue
Fund. In the future, when General Revenue Fund deposits for the prior fiscal
year meet or exceed $5.73 billion, certain tax revenue above the 5-year average
will be apportioned to the Stabilization Fund.

AGRICULTURE
Section Information Prepared By:
Quinten Dilbeck
Fiscal Analyst (405) 530-2384 [email protected]


Oklahoma Senate Overview of State Issues 59
AGRICULTURE
Although it is sometimes perceived as strictly a rural concern, agricultural
production touches every legislative district. As a product of its geography and
topography, Oklahoma maintains a diverse agricultural sector: from the heavily
irrigated southwest section mostly devoted to cotton, wheat, and cattle, to the
semi-arid high plains of the Panhandle with its heavy concentration of cattle
feedlots and large-scale hog farms. The central section of the state is dominated
by wheat and dairy farming, as well as diversified crops such as peanuts, pecans
and hay. The wetter eastern region adds timber and poultry operations to the
state’s agricultural sector.
Oklahoma ranks third in the U.S. in the production of winter wheat, fifth in cattle
and calf production, first in rye, second in canola, ninth in hog production, and
thirteenth in poultry production.
Department of Agriculture Appropriations Budget History
FY’07 Through FY’17

Agriculture
60 Oklahoma Senate Overview of State Issues
During FY’06, Oklahoma suffered an extreme drought which caused large
wildfires throughout the state. Most of the burden of fighting those fires was put
on rural fire departments which are mostly funded by the Oklahoma Department
of Agriculture, Food, and Forestry (ODAFF). ODAFF is also responsible for
coordinating resources statewide in order to fight widespread wildfires by setting
up, staffing, and managing an Incident Command Post.
For all of the diversity and agricultural bounty in the state, the agricultural
economic sector is in transition. Drastic price fluctuations and the structure of
agricultural production have changed the face of Oklahoma’s farming economy.
Agriculture comprises 1.6 percent of Oklahoma’s Gross State Product, although
gross receipts for crops and livestock totaled over $7.5 billion in 2014.
AGRICULTURAL PRICES
A review of agricultural prices provides some historical trends for Oklahoma’s
major agricultural commodities.
Wheat The price of wheat has generally seen an upward trend since the Great
Depression; however, adjusted for inflation, there has been a dramatic decrease in
the real value of wheat during the same period. Prices for wheat declined 30
percent from 2012 to 2015, and prices dropped to as low as $4.20 in October
2016. Rising yields and slowing global economic growth are putting downward
pressure on many grain prices.
Average Annual Price of Wheat 1935 Through 2015 (Dollars per Bushel)
Source: Oklahoma Agricultural Statistics Service

Agriculture
Oklahoma Senate Overview of State Issues 61
Although the price of wheat has increased from $1.45 per bushel in 1945 to $5.28
per bushel in 2015 (a 264 percent increase in actual price), adjusted for inflation,
the value of wheat per bushel has actually declined 72 percent.
Peanuts The price of peanuts has generally seen an upward trend since the Great
Depression. However, adjusted for inflation, there has been a significant
decrease in the real value of peanuts during the same period.
The price of peanuts has increased from 8.3 cents per pound in 1945 to 21 cents
per pound in 2015 (a 153 percent increase in actual price). Adjusted for inflation,
however, the value of peanuts per pound has declined dramatically since 1945.
Since 2012, the price of peanuts has decreased over 38 percent.
Average Price of Peanuts 1935 Through 2015 (Cents per Pound)
Source: Oklahoma Agricultural Statistics Service
Cattle The price of cattle has generally seen an upward trend since the Great
Depression. Adjusted for inflation, there has also been an increase in the real
value of cattle during the same period.
Cattle is one of the few commodities in Oklahoma that has retained its value
since the Great Depression. In 2015, the average price received for cattle was
$150 dollars per hundred weight.

Agriculture
62 Oklahoma Senate Overview of State Issues
Cattle inventories are recovering from their lowest levels in decades. The
nationwide cattle inventory was 92 million in July 2016, up 3 percent from the
previous January.
Average Price Received for Cattle 1935 Through 2015 (Dollars per Hundred Weight)
Source: Oklahoma Agricultural Statistics Service
RURAL OKLAHOMA
U.S. Census data confirms that fewer Oklahomans are living in rural
communities than ever before. In 2015, almost 60% of Oklahoma’s population
resided within the Oklahoma City and Tulsa metropolitan areas. Only 34.5% of
Oklahoma’s population lives in rural areas. The dominant occupation for rural
Oklahomans continues to be related to agriculture, and, as the industry evolves
and continues utilization of economies of scale, it is projected that small rural
towns will continue to decline in population, while larger rural towns will
modestly increase in size. Overall, the population of rural Oklahoma, especially
of young adults, will continue its decline as labor productivity in the agricultural
industry increases.

Agriculture
Oklahoma Senate Overview of State Issues 63
Age of Farmers The average age of farmers has been rising. According to the 2012 Census of
Agriculture, the average age of farm operators in Oklahoma was 58.3 years of
age. Thirty-seven years ago, the average age for the Oklahoma farmer was 51.
Fewer Oklahomans under 35 years of age are choosing to engage in agricultural
activities.
Farming as an Occupation Only 42 percent of Oklahoma’s principal farm operators consider farming their
primary occupation. Forty-six percent of the total number of principal farm
operators work 200 days or more per year off the farm in other jobs.
The average net income of an Oklahoma farm in 2012 was $11,899. According
to the 2012 USDA Census of Agriculture the number of farms and acreage of
farmland in Oklahoma is decreasing. In 2012, there were 80,245 farms in
Oklahoma, a decrease of 6,320 from the 2007 census. While the number of
family and individual farms is down, the numbers of corporate farms are
increasing. Many crops produced in Oklahoma tend to have large scale
economies, which lower per unit costs as the size of the operation grows. It is
projected that corporate farms will continue to increase, as a share, of overall
farms in the state, and the average size of the farm will continue to grow.
LEGISLATIVE INITIATIVES RELATING TO AGRICULTURE
The Legislature addresses agricultural issues mainly through the Oklahoma
Department of Agriculture, Food, and Forestry (ODAFF) and the Oklahoma
Conservation Commission. Recent legislative spending initiatives include:
programs that assist farmers in developing best management practices;
rural fire suppression expansions to save farm structures and land;
international marketing efforts that assist foreign sales of Oklahoma
commodities and products;
agricultural diversification and a value-added program that allocates grants
and loans to individuals, cooperatives, and other agricultural groups;
efforts to create a safe, competitive environment for producers in agriculture;
working with the USDA and United States Environmental Protection Agency
to encourage sustainable growth;

Agriculture
64 Oklahoma Senate Overview of State Issues
the Farm-to-School Program that links Oklahoma agricultural producers to
Oklahoma school cafeterias;
an AgriTourism program to support agricultural businesses who also
contribute to tourism;
appropriations to address the aging flood control infrastructure; and
creation of drought relief fund to be used when the governor declares a
drought emergency.
State Question 777 State Question 777, which will appear on the November 2016 ballot, is a
constitutional amendment guaranteeing the right of citizens to engage in farming
and ranching practices. The amendment states that the legislature shall not pass
laws that abridge this right without a “compelling state interest.” The
amendment also states that it will not affect any statute or ordinance enacted
before December 31, 2014.

EDUCATION
Common Education
Career and Technology Education
Postsecondary Education
Section Information Prepared By:
Erin Boeckman
Legislative Analyst (405) 521-5671 [email protected]
Leigh Garrison
Fiscal Analyst (405) 521-5778 [email protected]


Oklahoma Senate Overview of State Issues 67
COMMON EDUCATION
Over the past several years, the Legislature has implemented a number of reforms
in education to improve student achievement and educational outcomes in
Oklahoma. These initiatives involve every aspect of education – from early
elementary education to rigorous high school standards to a new teacher and
leader evaluation system. This chapter provides an overview of the Oklahoma
common education system and highlights reform initiatives implemented to
improve student outcomes across the pre-kindergarten through twelfth-grade
years.
APPROPRIATIONS FOR PUBLIC SCHOOLS
Common Education Appropriation History FY’05 Through FY’17 (In Billions)
*Due to a statewide revenue shortfall the agency’s appropriations were reduced by 4.9 percent
The largest single appropriation made by the Legislature supports the state’s
public school systems. For FY’16, 33.4 percent of all appropriations were for
common education. If funding for higher education and career and technology
education is added, the education share increases to 46.7 percent.
$2.008$2.164
$2.348$2.510 $2.532 $2.447 $2.386 $2.331 $2.334 $2.407 $2.484 $2.426 $2.426
FY'05 FY'06 FY'07 FY'08 FY'09 FY'10* FY'11 FY'12 FY'13 FY'14 FY'15 FY'16 FY'17

Common Education
68 Oklahoma Senate Overview of State Issues
Funding Sources for Local School Districts
Public funding for Oklahoma’s public schools comes from four sources:
state appropriated revenue;
local and county revenue;
state dedicated revenue; and
federal funds.
State Appropriations: Annual legislative appropriations rose steadily from
FY’89 to FY’01, when they comprised more than 59 percent of all common
school funding. Since FY’01, this percentage has fallen as low as 45 percent,
mostly due to an increase in local funds and a decrease in state revenue
collections due to the recent recession. Additional funding comes from dedicated
sources outlined below.
Local and County Funds: Local governments assess ad valorem taxes on
property owners to support schools. The Oklahoma Constitution provides
parameters for local millage assessments. For general fund use, each district is
allowed to charge a maximum of 35 mills (a mill is 1/1000 of a dollar) on the
assessed value of the district’s real, personal and public service property. For the
current school year, all 515 districts levied the maximum millage. There is also
an automatic four-mill county levy for each district. In addition to these
operational funds, all districts make use of the five-mill building-fund levy, and
over 390 of the districts utilize a sinking-fund levy. The sinking-fund levy is
used to pay for local bond issues for capital improvements and maintenance.
Bond issues must be approved by a 60 percent majority of a district’s voters.
State Dedicated Revenue: For 2014-15, statutory and constitutional dedication
of state revenue accounts for 8.1 percent of total common school revenue and
comes from the following sources:
Gross Production Tax – 7.14 percent of gross production taxes on extraction
and production of certain raw materials from each county is allocated back to
that county for the support of schools.
Vehicle License and Registration – 36.2 percent of tag and registration fees
are apportioned to local schools.
Rural Electric Association Cooperative Tax – An assessment on rural
electric cooperatives, paid in lieu of property taxes, generates revenues for
schools.
School Land Earnings – Rental earnings from state-held school lands and
interest from investments are distributed to school districts statewide based
on average daily attendance. These funds are managed and distributed by
the Commissioners of the Land Office.

Common Education
Oklahoma Senate Overview of State Issues 69
Federal Funds: Until recently federal funds comprised the smallest share of
total revenue, ranging from 7 percent to 9 percent between FY’89 and FY’01.
Federal funding has increased since FY’01 to allow states to implement
requirements of the No Child Left Behind Act and its replacement, the Every
Student Succeeds Act. It has also increased due to an influx of federal stimulus
dollars for the purposes of Title I, IDEA and Education Jobs funding. All federal
funds are dedicated to specific programs for target populations (e.g., school lunch
programs, special education, economically disadvantaged, etc.).
Revenue Sources for School Districts 2014-2015 School Year
Distribution of Appropriated Funds
For FY’17, 77 percent of the annual appropriation for common education will be
distributed to local districts based on the statutory State Aid Funding Formula,
which is designed to equalize funding among districts. 30 percent of these funds
are for special funding items such as alternative education programs, advanced
placement programs, etc. Less than 1 percent is for operations of the State
Department of Education. Comparatively, in FY’01, 80.2 percent of state
common education funds were distributed through the State Aid Funding
Formula, 18.8 percent of the funds were targeted for specific items such as
textbooks and alternative education, and 1 percent was appropriated to the State
Department of Education for administration.
Historical Changes in Funding Sources for Schools General funding, which currently comprises 67 percent of all expenditures for
schools, has changed radically during the state’s history. Local revenues from
property taxes account for 40 percent of general school funding. Legislative

Common Education
70 Oklahoma Senate Overview of State Issues
appropriations from state revenue sources are the principal source of total
general funding growth, currently comprising 41 percent of the funding mix.
Funding for Common Schools
by Source Using General Funds
FY’03 – FY’15 (Percentage of Total Funding)
Source: OCAS Revenue and Expenditure Reports
State Aid Funding Formula (Section 18-200.1 of O.S. 70)
The State Aid Funding Formula is set in statute and distributes funds through
three categories: Foundation Aid, Incentive Aid and Transportation Aid.
Foundation Aid is calculated on the basis of the highest weighted average
daily membership (ADM) of students in each district for the preceding two
years or the first nine weeks of the current school year, although the count
for virtual students is only based on the current school year. Weighting
recognizes that educational costs vary by district and by student. Students
with special educational needs (impaired vision, learning disabilities,
physical handicaps, etc.) are given additional weighting because additional
costs will be incurred in providing these students an opportunity to learn.
Grade-level weightings are used to account for variations in the cost of
teaching different grade levels. To compensate for higher costs associated
55% 55% 55%54%
56% 56%55%
49% 49%
45% 45%
41% 41%
23% 23% 23% 23% 23%24%
23%
21%
25%
32%33%
40% 40%
10% 10% 10% 10%9%
9% 9% 9%9% 8% 8% 8% 8%
12% 12% 13% 13%12% 11%
13%17%
17%15% 14%
11%11%
State Appr. Local & County State Dedicated Federal

Common Education
Oklahoma Senate Overview of State Issues 71
with smaller schools, weighting is also granted to isolated districts or
districts with fewer than 529 students. Weighting is also provided for
economically disadvantaged students.
The weighted ADM for a district is then multiplied by the Foundation
Support Level ($1,614.00 per weighted ADM for the 2014-2015 school
year). From this figure, a portion of a district’s local revenues and all of its
state-dedicated revenues are subtracted to arrive at the Foundation Aid
amount.
Incentive Aid, also called Salary Incentive Aid, guarantees each district a
minimum amount of funding per weighted student for each mill up to 20
mills of local ad valorem taxes levied above 15 mills. For the 2014-2015
school year, the amount is $73.37.
To calculate Incentive Aid, the weighted ADM is multiplied by the Incentive
Aid Guarantee. A factored amount of local support is then subtracted. The
number of mills the district levies over 15 is then multiplied by the resulting
figure ($73.37x20 = $1,467.40). The product is the district’s Incentive Aid.
Transportation Aid is provided to districts for transporting all students who
live more than 1.5 miles from school. These students, the “average daily
haul,” are multiplied by the per capita transportation allowance and the
transportation factor (set by statute). The per capita transportation allowance
is based on the district’s population and provides greater weight to sparsely
populated areas.
In 1997, the State Aid Funding Formula was changed to allow school districts to
receive additional funding for current year student growth. This eliminated the
need for a mid-term supplemental appropriation due to student increases.
Source: Oklahoma School Finance Technical Assistance Document

Common Education
72 Oklahoma Senate Overview of State Issues
History of Oklahoma State Aid Factor
Per Weighted ADM
FY’92 Through FY’16
Total
% Change
Fiscal
Foundation
Incentive
Amount/
Dollar
in Total
Year
Aid
Aid Factor
WADM
Change
Amount
FY'92
$1,064.00
$51.08
$2,085.60
FY'93
$1,098.00
$53.14
$2,160.80
$75.20
3.6%
FY'94
$1,139.00
$55.12
$2,241.40
$80.60
3.7%
FY'95
$1,149.00
$56.01
$2,269.20
$27.80
1.2%
FY'96
$1,165.00
$56.51
$2,295.20
$26.00
1.1%
FY'97
$1,195.00
$58.17
$2,358.40
$63.20
2.8%
FY'98
$1,216.00
$58.47
$2,385.40
$27.00
1.1%
FY'99
$1,239.00
$59.93
$2,437.60
$52.20
2.2%
FY'00
$1,271.00
$61.69
$2,504.80
$67.20
2.8%
FY'01
$1,320.00
$62.92
$2,578.40
$73.60
2.9%
FY'02*
$1,377.00
$64.81
$2,673.20
$94.80
3.7%
FY'03
$1,359.00
$64.02
$2,639.40
-$33.80
-1.3%
FY'04
$1,354.00
$63.42
$2,622.40
-$17.00
-0.6%
FY'05
$1,365.00
$63.71
$2,639.20
$16.80
0.6%
FY'06
$1,463.00
$70.06
$2,864.20
$225.00
8.5%
FY'07
$1,501.00
$70.93
$2,919.60
$55.40
1.9%
FY'08
$1,616.00
$78.65
$3,189.00
$269.40
9.2%
FY'09
$1,642.00
$78.97
$3,221.40
$32.40
1.0%
FY'10** $1,643.05
$78.35
$3,210.05
-$11.35
-0.4%
FY'11
$1,601.00
$75.62
$3,113.40
-$96.65
-3.0%
FY'12
$1,578.00
$73.11
$3,040.20
-$73.20
-2.4%
FY'13
$1,583.00
$72.60
$3,035.00
$5.00
0.2%
FY'14
$1,574.00
$72.90
$3,032.00
-$9.00
-0.3%
FY'15
$1,609.00
$73.34
$3,075.80
$35.00
1.2%
FY'16
$1,592.00
$72.13
$3,034.60
-$17.00
-0.6%
* Due to a revenue shortfall in FY’02, each district’s total state aid was reduced by 3.8%. ** Due to a revenue shortfall in FY’10, each district’s total state aid was reduced by 7.6%.
Much of the state’s focus on common education funding is aimed at reducing
inequities in general funding available to various school districts. This number is
reflected in the average per pupil expenditures per fall enrollment. For FY’14,
the average Oklahoma per pupil expenditure, except for funds used for capital
expenses, nontraditional expenses, etc., was $7,829, according to data collected
by the U.S. Census Bureau for their Public Education Finances Report.

Common Education
Oklahoma Senate Overview of State Issues 73
LOTTERY AND GAMING
Two additional sources of revenue were approved by Oklahoma voters in
November 2004. The first was the Oklahoma Education Lottery Act; the second
was the State-Tribal Gaming Act. The Oklahoma Education Lottery Act was
approved as a ballot measure by the 2003 Legislature for the 2004 general
election. The State-Tribal Gaming Act was referred to a vote of the people by
the 2004 Legislature.
Oklahoma Education Lottery HB 1278, which provided an outline for the Education Lottery, was approved
during the 2003 legislative session. According to the rules of distribution that
were set forth in the bill, 45 percent serves as prize money, 20 percent is used for
administrative costs and 35 percent is allocated to education. In the first two full
years of its existence, only 30 percent of the net proceeds were allocated to
benefit education since funding was needed to pay off the $10 million bond issue
for start-up costs. Of the portion allocated for education, 45 percent can be used
to fund K-12th
grade public education and early childhood development
programs; 45 percent can be used to fund higher education and career and
technology education tuition assistance programs, capital projects, endowed
chairs, technology improvements, as well as the Schools for the Deaf and the
Blind; 5 percent is deposited in the School Consolidation Assistance Fund; and 5
percent is deposited into the Teachers’ Retirement System Dedicated Revenue
Revolving Fund. The Oklahoma Education Lottery Commission, also authorized
by HB 1278, oversees all lottery operations.
State-Tribal Gaming Act Another legislative initiative from the 2004 legislative session was the passage of
SB 1252, also known as the State-Tribal Gaming Act. This Act provides
revenues for two areas of funding. The first is the Education Reform Revolving
Fund (1017 Fund), in which 88 percent of generated gaming revenues are placed.
The Education Reform Revolving Fund helps provide financial support for public
schools through the State Aid Formula. The second beneficiary is the General
Revenue Fund, in which the remaining 12 percent of generated gaming revenues
are placed. Originally, this 12 percent amount was apportioned to the Oklahoma
Higher Learning Access Program (OHLAP), also known as Oklahoma’s Promise,
which funds scholarships for students who would like to attend an in-state public
college or university. However, SB 820 from the 2007 legislative session
redirected these funds to the General Revenue Fund. This bill provides that the
State Board of Equalization will each year make a determination of the needed
amount for OHLAP and automatically subtract it from the amount it certifies as
available for appropriation from the General Revenue Fund.

Common Education
74 Oklahoma Senate Overview of State Issues
STUDENT DEMOGRAPHICS
Over the past two decades Oklahoma’s student population has experienced a
number of changes. While the total number of students enrolling in school has
increased by 19 percent from FY’90 through FY’15 (from 579,167 to 692,670),
there have been some relatively significant changes in student enrollment by race
and ethnicity. The number of Hispanic children enrolled in Oklahoma schools
has increased by more than 80,000 students since 1990.
Public School Enrollment by Race/Ethnicity 1990 and 2015
Source: State Department of Education Annual Report
During the 2014-15 school year, 103,400 students qualified for special education
programs, which represented 15.4 percent of all students. There has been a rise in
the special education participation rate since the 2009-10 school year. Special
education participation is at its highest mark since these educational indicators
have been collected.
Oklahoma has 515 school districts with 997 elementary schools, 299 middle
schools/junior high schools and 454 senior high schools. There are also 32
charter schools and five virtual charter schools.
EXPENDITURES
Per-Pupil Expenditures
The National Center for Education Statistics (NCES) provides per-pupil
expenditure comparisons for all states. Since NCES is a branch of the federal
education department, per-pupil expenditure statistics from the NCES are widely
used to compare state funding efforts for common education. Each state’s
number is calculated by dividing the total amount of funds expended for
Caucasian, 50%
Asian, 2% American Indian, 14%
African American,
9%
Hispanic, 16%
Hawaiian or Pacific Islander,
0%
Two or More
Races, 8%
2015

Common Education
Oklahoma Senate Overview of State Issues 75
education, excluding expenditures on capital outlay, other programs and interest
on long-term debt, by the fall membership of public school students in the state.
The analysis includes all funding sources – local, state and federal. Historically,
Oklahoma has spent below the national and regional averages on education.
Per-Pupil Spending for Oklahoma and the Region FY’14
Source: Public Education Finances 2014 – U. S. Census
Oklahoma is at 84.8 percent of the regional average. Nationally, Oklahoma
ranks 47 out of 50 states and the District of Columbia in annual per-pupil
expenditures. New York ranks first with $20,610 in annual per-pupil
expenditures, and Utah ranks last with $6,500 in annual per-pupil expenditures
for FY’14.
Expenditures by Function When looking at expenditures by function for the 2012-13 school year,
Oklahoma spent 55.3 percent of its money on instruction. This is 5.4 percent less
than the national average and 3 percent less than the regional average. The
category of instruction includes expenditures for staff and services that work
directly with students, such as teachers, teaching assistants and librarians.
Student support services include guidance counselors, school nurses, social
workers and attendance staff. Administration includes administrators and
administrative staff of schools and school districts. Operations include the
operating expenditures for keeping schools and other school district facilities
operating, as well as student transportation and food services.
Source: National Center for Education Statistics (NCES).
$11,009
$9,972 $9,734 $9,875
$8,985$9,616
$8,593
$7,829
$9,229
U.S. Avg. KS NM MO CO AR TX OK Reg. Avg.

Common Education
76 Oklahoma Senate Overview of State Issues
Percentage of School Expenditures by Function
Oklahoma and Surrounding States 2007 Through 2013
Source: National Center for Education Statistics
Teacher Salaries and Benefits Since FY’90, legislators have focused on raising the salaries of classroom
teachers. Between FY’03 and FY’15, the average salary for instructional staff
has increased 29.9 percent, an average annual increase of 2.5 percent.
Average Instructional Staff Salaries in Oklahoma FY’03 Through FY’15 (Excludes Fringe Benefits)
Source: Southern Regional Education Board (SREB)
55.3% 56.2%57.9%
60.3% 59.2%57.4%
58.9%
17.9
%
13.6
%
12.9
% 17.0
%
13.0
%
26.8
%
13.9
%
8.7%
7.5% 8.6%
8.5% 9.2%
8.2%
7.3%10
.8%
9.7%
9.2%
9.4%
10.0
%
10.3
%
11.0
%
OK AR CO KS MO NM TX
Instruction Student Sup. Serv. Administration Operations
$34,
877
$35,
061
$37,
879
$38,
772
$42,
379
$43,
551
$43,
846
$44,
261
$44,
343
$44,
391
$44,
373
$44,
547
$45,
317
FY'03 FY'04 FY'05 FY'06 FY'07 FY'08 FY'09 FY'10 FY'11 FY'12 FY'13 FY'14 FY'15

Common Education
Oklahoma Senate Overview of State Issues 77
While school districts ultimately set teacher salaries, lawmakers have chosen to
mandate minimum salaries in statute (70 O.S. 18-114.14). This policy has
resulted in significant gains for beginning teachers, bringing Oklahoma’s first-
year teacher salary to parity with regional states. The minimum teacher salary
for a first-year teacher has increased from $17,000 in FY’90 to $31,600
currently, for teachers with at least a bachelor’s degree.
Average Teacher Salaries for Oklahoma and the Region 2014 - 2015 School Year
Source: Southern Regional Education Board (SREB)
In recent years, lawmakers have made several efforts to improve teacher salaries
and health benefits across the state. Since the 2004 legislative session, almost
$529 million in new funding has been appropriated for this purpose.
HB 2662, from the 2004 legislative session, raised the benefit allowance for all
teachers from 58 percent to 100 percent and excluded certain fringe benefits from
being counted toward the teachers’ minimum salary schedule. These two
provisions of the bill yielded an average salary increase of between $850 and
$1,050 per year for approximately 30 percent of all Oklahoma teachers. For the
2005 fiscal year, the Legislature appropriated $76.3 million to cover health
insurance for all certified personnel within Common Education, and $2.2 million
for support personnel.
During the 2005 legislative session, the teachers’ minimum salary schedule was
changed to provide teachers with a salary increase that averaged $1,300 per
teacher throughout the state. For the 2006 fiscal year the Legislature
appropriated $57.8 million to Common Education in order to fund this increase
through the State Aid Formula. Additional increases for health benefits were also
included totaling approximately $32.9 million for certified personnel and $9.9
million for support personnel. For the 2017 fiscal year, the Legislature

Common Education
78 Oklahoma Senate Overview of State Issues
appropriated $284 million to cover health insurance for all certified personnel
and $158 million for support personnel.
SB 2XX from the 2006 Special Session provided a $3,000 across-the-board
salary increase for all teachers, modified the 2006-07 salary schedule to reflect
this increase and modified the 2007-08 salary schedule to include another $600
across-the-board salary increase. For the 2007 fiscal year, the Legislature
appropriated $161.5 million to Common Education and $5.9 million to
CareerTech in order to fund this increase. Additional amounts of $10 million and
$6 million were also appropriated to cover increased costs for certified and
support personnel health benefits respectively. CareerTech received a $1.6
million appropriation for health benefit cost increases, as well.
HB 1134 from the 2007 legislative session helped Oklahoma’s teachers receive
an average annual salary increase of $1,000 during the 2007-08 school year. The
breakdown for this average increase is as follows:
The 2007-08 minimum salary schedule already contained a $600 salary
increase when compared to the 2006-07 minimum salary schedule. This
increase was put in place for all years of experience and degree levels. $32.2
million was appropriated inside the State Aid Formula to cover the
associated costs of this increase, including the employers’ share of taxes and
Teachers’ Retirement contributions. The Department of Career and
Technology Education also received $1.5 million to fully fund this increase.
In addition to this original $600 increase, other increases were added to the
2007-08 minimum salary schedule as follows:
$425 for teachers with at least 10 years of experience who have earned
bachelor’s degrees,
$850 for teachers with at least 10 years of experience who have earned
master’s degrees, and
$1,700 for teachers with at least 10 years of experience who have earned
doctorate degrees.
$20 million was appropriated to the Department of Education to cover the
associated costs of these additional increases. Funding for these increases
was appropriated through the State Aid Formula and again included the
employers’ share of taxes and Teachers’ Retirement contributions. The
Department of Career and Technology Education also received an additional
$845,778 to fully fund this increase.

Common Education
Oklahoma Senate Overview of State Issues 79
Although this salary increase was fully funded for every teacher, school
districts are only required to pay their teachers at the 2013-14 Minimum
Salary Schedule level. In other words, if a school district already pays its
teachers above the 2013-14 Minimum Salary Schedule, it will be up to their
discretion whether or not to pay teachers any additional money.
Additional funding was again provided to address health care benefit cost
increases for certified and support personnel. As a result, school districts
received additional amounts of $8.5 million in FY’13, $23 million in FY’14 and
$39 million in FY’15. In FY'16, school districts received $6 million less due to
revenue failures, while they received $38 million more in FY'17.
PUBLIC SCHOOL REFORM INITIATIVES
Oklahoma’s public schools have undergone significant changes since FY’89.
Many of these changes are the direct result of the enactment of the landmark
educational reform act of 1990, House Bill 1017. The Legislature originally
appropriated more than $565 million over five years to implement a wide range
of reform policies as follows:
Reduced class sizes: The Legislature appropriated $30 million for districts
to hire more teachers to comply with reductions in class size requirements.
For kindergarten through sixth grades, a student teacher ratio of 20:1 is
mandated. For students in grades seventh through twelfth, the maximum
number of students allowed per teacher is 140 per day. Failure to comply
with class size limits results in sanctions, which are authorized by statute.
Exemptions: Some classrooms are exempted from calculations of class size
limits:
If the class taught is a physical education or music class;
If the classroom exceeds the limit after the first nine weeks of school;
If the creation of an additional class will cause a class to have fewer
than 10 students in kindergarten through grade three, and fewer than 16
for grades four through six;
If a teacher’s assistant is employed to serve in classrooms that exceed
the class size limitation;
If the school district has voted indebtedness through the issuance of
bonds for more than 85 percent of the maximum allowable pursuant to
the provisions of Section 26 of Article X of the Oklahoma Constitution;
If the school district is voting the maximum millage allowable for the
support, maintenance and construction of schools; or

Common Education
80 Oklahoma Senate Overview of State Issues
If the school district consolidates or annexes under the Oklahoma
School Voluntary Consolidation and Annexation Act.
Funding Equity: The Legislature achieved more equity in student funding
by appropriating over $88 million to support the State Aid formula.
Early Childhood Programs: HB 1017 and follow-up legislation mandated
and funded half-day kindergarten for all children and provided $8.4 million
for half-day four-year-old programs.
School Deregulation and Consolidation: The initiative provided limited
deregulation and funding incentives for the voluntary reduction of school
districts from 611 in 1988 to 515 for the 2015-2016 school year.
Accountability: The Office of Educational Quality and Accountability was
created to compile student achievement data by school site (see section on
Office of Educational Quality and Accountability below).
Additional key public school reform initiatives that have been passed:
Reading Sufficiency Act
In an effort to ensure that reading skills are attained in the early grades, the
Legislature in 2011 amended the Reading Sufficiency Act (70 § 1210.508C) to
require that third graders demonstrate grade-level reading skills. SB 346 required
that first graders, beginning in the 2011-2012 school year, be assessed to
determine their reading skills. If they were found not to be reading at grade level,
certain supports and assistance were to be provided. Good-cause exemptions
allow for promotion of certain students, including students with limited English
proficiency, students with disabilities and students who demonstrated proficiency
on an alternative test or via a portfolio.
The Reading Sufficiency Act was further amended with HB 2625 in 2014 and SB
630 in 2015. HB 2625 directs a Reading Proficiency Team to determine whether
a third grader who has not demonstrated proficiency on a screening instrument,
has not demonstrated proficiency in reading on the statewide assessment, has not
shown proficiency through a reading portfolio and does not qualify for a good-
cause exemption should receive probationary promotion. If probationary
promotion is granted, the Reading Proficiency Team is tasked with reviewing the
reading performance of the student until he or she demonstrates grade-level
reading. Probationary promotion is allowed through the 2017-18 school year. SB
630 expanded the role of the Reading Proficiency Team to begin working with
students in first and second grade who are not reading at grade level.
SB 630 also increases from "limited knowledge" to "proficient" the threshold for
passage of the reading portion of the statewide assessment beginning in the 2016-
17 school year.

Common Education
Oklahoma Senate Overview of State Issues 81
State Subject Matter Standards
The State Board of Education is tasked with adopting subject matter standards for
use in public schools across the state, while curriculum development to teach
those standards is left to local school districts.
In 2010, the Legislature directed the State Board of Education to adopt the
Common Core state standards in English language arts and mathematics. The
standards were developed as part of an initiative led by the National Governors
Association and the Council of Chief State School Officers. The State Board of
Education developed a timeline for implementation, with testing on the new
standards set to begin during the 2014-15 school year.
During the 2014 session, the Legislature approved HB 3399, which repealed
adoption of the Common Core state standards. It directed the State Board of
Education, in consultation with the State Regents for Higher Education, the State
Board of Career and Technology Education and the Department of Commerce, to
develop and adopt new standards by Aug. 1, 2016.
HB 3399 also created a legislative review process for all subject matter standards
adopted by the State Board of Education, allowing the Legislature to approve the
standards, disapprove the standards in whole or in part, amend the standards in
whole or in part or disapprove the standards in whole or in part with instructions
to the State Board of Education.
The State Board of Education adopted standards and submitted them to the
Legislature for review during the 2016 legislative session. The Legislature took
no official action, so the standards were deemed approved to be implemented in
the 2016-17 school year.
New statewide assessments based on the new subject matter standards will be
administered during 2017-18 school year.
High School Graduation and Testing Reform
Assessments to measure student knowledge of the state's subject matter standards
also underwent modification in 2016 with HB 3218. The bill repealed the end-of-
instruction exams established under the Achieving Classroom Excellence Act of
2005 and called for the establishment of new graduation requirements.
To earn a diploma, students entering the 9th grade in the 2017-18 school year
will be assessed in the subject areas of English language arts, math, science and
U.S. history. The students must also meet any additional graduation requirements
adopted by the State Board of Education and approved by the Legislature.
Students who score certain performance levels on the assessments will be
provided remediation and intervention. Alternative assessments will also be
designated for students to demonstrate mastery of the subject matter standards.

Common Education
82 Oklahoma Senate Overview of State Issues
HB 3218 also modified the assessment requirements for grades 3-8. Beginning in
2017-18, students will be assessed in English language arts and math in grades 3-
8 and once during the grade span of 9-12; in science once during the grade spans
of 3-5, 6-9 and 10-12; and in U.S. history once during the grade span of 9-12.
2015 Legislation
SB 136 directs the Statewide Virtual Charter School Board to establish a review
process for online curriculum to ensure the courses are aligned to the state's
subject matter standards and to make publicly available a list of approved online
courses. It authorizes the board, in conjunction with the Office of Management
and Enterprise Services, to negotiate and enter into contracts with online
curriculum vendors to offer a state rate price to districts.
SB 711 requires school employee firings related to crimes to be reported to the
State Board of Education after due process procedures are complete or after the
teacher resigns. It states that if such a report is made, the teacher shall receive a
copy, and the teacher shall be provided the opportunity to provide supplementary
information to the State Board of Education. It allows a school district to request
a copy of such a report if a teacher is currently employed or is being considered
for employment. If such a request is made, the State Board of Education must
notify the teacher about the request and who requested it. Reports and any related
documents are to be kept confidential and are not subject to the Open Records
Act.
SB 782 amends the Charter Schools Act. It removes the population restriction for
a school district as a sponsor, and it removes the average daily membership
(ADM) requirement for a career and technology school and university as a
sponsor. It allows the State Board of Education to sponsor a charter school if the
proposed school is first denied by a local district board of education, with a limit
of 5 charters per year each of the first 5 years in counties with a population of
less than 500,000. It requires charter applications and contracts to address
additional issues, including student recruitment and enrollment, student
discipline, the governing board organization, plans for parental involvement and
start-up budget plans. It allows a rejected charter school sponsor to appeal to the
State Board of Education. It directs the State Board of Education to establish a
list of public school rankings, identifying charters in the bottom 5 percent
according to the A-F grading system, and it provides options for those charters. It
states that if a low-ranking charter is not closed, the sponsor must appear before
the State Board of Education. It allows the State Board of Education to overturn
the decision and close the charter.
HB 1684 provides for teacher professional development programs to include
information on training, recognition and proper reporting of suspected child
abuse and child sexual abuse. It directs schools' Safe School Committees to make
recommendations to the school principal regarding suicide prevention resources.
It allows Safe School Committees to make recommendations to a principal
regarding the development of a rape and sexual assault response program. It

Common Education
Oklahoma Senate Overview of State Issues 83
allows school districts to establish abuse-prevention programs and provides
guidelines for such programs.
HB 1685 creates the 24/7 Tobacco-free Schools Act. It prohibits the use of
tobacco products on public or private school campuses, school vehicles or school
events.
2016 Legislation
HB 2957 amends the Teacher and Leader Effectiveness Evaluation (TLE)
System. It requires districts to implement qualitative and professional
development components of the TLE, with the professional development
component phased in over a three-year period. It directs districts to issue "district
evaluation ratings," which can be based solely on the qualitative component or
both qualitative and quantitative components - the latter of which can be
implemented at the option of the district. If the quantitative component is
implemented, it must consist of at least one of the research-based measures
approved by the State Board of Education. It requires student performance on
statewide assessments, when available, to be discussed with the teacher.
HB 3114 creates the Empowering Teachers to Lead Act. It provides for teacher
career paths, leadership roles and compensation requirements. It provides
requirements and a salary supplement for a model teacher, a mentor teacher and
a lead teacher.
SB 929 creates the 2016 Workforce Oklahoma Academic High School Diploma
Recognition Act. It provides for three graduation recognitions beginning with
students graduating in 2020-2021.
SB 1269 directs the State Board of Education, in collaboration with the State
Board of Career and Technology Education and the State Regents for Higher
Education, to develop college and career endorsements in various subject areas.
It provides for the boards, the State Regents and representatives of business,
labor and industry to specify the curriculum requirements for each endorsement.
EARLY CHILDHOOD EDUCATION
The Legislature has supported a range of early childhood developmental
programs covering such areas as health care, developmental disabilities, child
abuse prevention, parent education and early childhood education. These
programs provide valuable developmental, health and educational services
designed to ensure children under the age of 5 will be healthy and ready to learn
once they enter kindergarten.

Common Education
84 Oklahoma Senate Overview of State Issues
SoonerStart (Early Intervention) Funded through the State Department of Education, SoonerStart is a
collaborative program which provides nursing, nutrition and case management
services as well as physical, occupational and speech-language therapy to
children who are disabled or developmentally delayed from birth to 36 months.
For FY‘16, the program served 11,879 children with a combined state and
federal budget of $18.2 million.
Head Start Head Start is a state and federally funded program which provides
developmental, health and parent educational services to low-income children
ages 0 through 5 and their families. Oklahoma is one of the few states that
provide state supplements for Head Start. For FY’16, the Legislature
appropriated approximately $1.8 million while receiving $109 million in federal
funds. State funds are appropriated to the Oklahoma Department of Commerce
for administration and management of the program.
During FY’15, Head Start served 16,206 children and 161 pregnant women
through 916 classrooms state wide.
Programs for Four-Year-Olds Free half-day and full-day programs for four-year-olds are offered by school
districts across the state. These programs provide developmentally appropriate
activities to prepare children for kindergarten. In 1998, the Legislature increased
funding available to schools to provide these programs. Enrollment in this
program has increased dramatically since then. During FY’98, 2,493 four-year-
olds in Oklahoma attended half-day public school pre-kindergarten, while in
FY'16, 39,405 children were enrolled in Oklahoma pre-kindergarten programs,
with 33,144 children in a full-day program and 6,261 in a half-day program.
Seventy-five percent of Oklahoma’s 4 year-olds attended public schools in
school year 2015-16.
Full-Day Kindergarten Students who are age 5 must attend at least a half-day of kindergarten; full-day
attendance is optional. Beginning with the 2013-14 school year, all school
districts must offer full-day kindergarten. Districts are exempt from the
requirement if their bonded indebtedness exceeds 85 percent of the maximum
allowable at any time in the previous five years.

Common Education
Oklahoma Senate Overview of State Issues 85
Growth in Full-Day Kindergarten FY’98 Through FY’16
Program of Parent Education The Program of Parent Education is a home visitation program serving families
with children birth to age 3. Monthly home visits, developmental screenings and
referrals are completed by parent educators employed by the school district.
Enrollment is voluntary, but an emphasis is placed upon recruiting high needs
families.
Rural Infant Stimulation Environment (RISE) During the 2007 legislative session, $550,000 was appropriated to establish a
RISE School Program that is designed to serve young children with physical
disabilities from birth to five years of age. Due to the revenue downturn, there
was no funding for this program in FY'17.
Educare (Early Childhood Initiative) During the 2006 legislative session, $5 million was appropriated for an early
childhood public/private match pilot program. During the 2007 legislative
session, funding for this program was increased to $10 million with a required
private match of $15 million. For FY’16, services were provided to 2,664 low-
income children and their families by 11 providers at more than 20 sites at a state
cost of $9,294,614 with a required private match of $13,941,921. For FY’17,
funding for this program was decreased to $8 million with a required private
match of $12 million. There are currently 9 providers in the program serving
2,486 children.

Common Education
86 Oklahoma Senate Overview of State Issues
STUDENT TESTING
Oklahoma requires a number of assessments from third grade through high
school.
In 1985, the Legislature laid the foundation for a comprehensive testing system
with the Oklahoma School Testing Program. Since that time, the program has
undergone a number of changes, most recently with the passage of HB 3218
during the 2016 legislative session.
Beginning in 2017-18, the statewide student assessment system will be required
to yield both norm-referenced and criterion-referenced scores. They must also
align to the Oklahoma subject matter standards and provide a measure of
comparability among other states. At the secondary level, students are
administered assessments at the completion of the subject matter instruction,
rather than at specific grade levels. Beginning in 2017-18,
students attending public schools will be required to participate in the following
tests:
3rd
English Language Arts and Mathematics
4th
English Language Arts and Mathematics
5th
English Language Arts, Mathematics and Science
6th
English Language Arts and Mathematics
7th
English Language Arts and Mathematics
8th
English Language Arts, Mathematics and Science
Secondary English Language Arts, Mathematics, Science and U.S.
history
Students with significant cognitive disabilities who are on an individualized
education program (IEP) may qualify for the Oklahoma Alternative Assessment
Program (OAAP) Portfolio assessment, an alternative way to assess progress
according to alternate grade-level standards.
In addition to the state tests, the National Assessment of Educational Progress
(NAEP), a standardized national test, is administered every two years to a sample
of approximately 2,500 4th
and 8th
grade students in schools selected by the
NAEP governing board as being demographically representative of the state as a
whole. The NAEP is used to compare students’ educational achievement across
the nation as an external check of the rigor of states’ standards and assessments.
Oklahoma has been required to participate in NAEP testing since passage of a
state law in 1997. Since 2003, the federal No Child Left Behind Act required all
states to participate in NAEP, and the reauthorization legislation, the Every
Student Succeeds Act, retained that requirement.

Common Education
Oklahoma Senate Overview of State Issues 87
Oklahoma’s Performance
on the National Assessment of Educational Progress
(NAEP) Tests as Compared to the U.S. Average Scale Score
Source: Oklahoma’s State Profile from “The Nation’s Report Card,” National Assessment of
Educational Progress
READING
Grade
Year
State Avg.
U.S. Avg.
4
1992
220
215
2003
214
216
2005
214
217
2007
217
220
2009
217
220
2011
215
220
2013
217
221
2015
222
221
8
1998
265
261
2003
262
261
2005
260
260
2007
260
261
2009
259
262
2011
260
264
2013
262
266
2015
263
264

Common Education
88 Oklahoma Senate Overview of State Issues
(NAEP) Tests (Cont’d)
Source: Oklahoma’s State Profile from “The Nation’s Report Card,” National Assessment of
Educational Progress
Office of Educational Quality and Accountability Originally created as the Office of Accountability in 1990 via HB 1017, the
office was placed under the purview of the Education Oversight Board. In 2012,
the Legislature passed SB 1797, which combined the Office of Accountability
with the Commission for Teacher Preparation to create the Office of Educational
Quality and Accountability. The Education Oversight Board was replaced with
the Commission for Educational Quality and Accountability. The consolidation
was complete effective July 1, 2014.
The Office of Educational Quality and Accountability provides annual reports on
public school performance at the state, district and school levels. These "Profiles"
report cards provide school performance information that is comparable and in
context with various indicators. The report cards may be viewed online at
www.schoolreportcards.org.
MATHEMATICS
Grade
Year
State Avg.
U.S. Avg.
4
1992
220
219
2003
229
234
2005
234
237
2007
237
239
2009
237
239
2011
237
240
2013
239
241
2015
240
240
8
1992
268
267
2003
272
276
2005
271
278
2007
275
280
2009
276
282
2011
279
283
2013
276
284
2015 275 281

Common Education
Oklahoma Senate Overview of State Issues 89
The Commission for Educational Quality and Accountability is tasked with
overseeing implementation of the Oklahoma Teacher Preparation Act and setting
performance levels and corresponding cut scores pursuant to the Oklahoma
School Testing Program Act.
ACT College Entrance Exam Approximately 82 percent of high school students in Oklahoma participated in
the ACT assessment for college admission in 2016. This compares to 64 percent
of students nationally. Between 2012 and 2016, Oklahoma’s average composite
score decreased slightly from 20.7 to 20.4. A total of 32,854 Oklahoma students
tested in 2016, which is a 12 percent increase from 2012.
Oklahoma Student’s ACT Score Comparison 2016
Note: The number in parenthesis represents the percentage of students taking the ACT in the state.
Source: National and State ACT Profile Reports
During the 2015-16 school year, the State Department of Education offered an
ACT pilot program to allow high school juniors to take the ACT assessment at
no cost.

Common Education
90 Oklahoma Senate Overview of State Issues
FEDERAL EDUCATIONAL REFORM EFFORTS
In December 2015, the U.S. Congress passed and the president signed into law
the Every Student Succeeds Act (ESSA), which replaced the No Child Left
Behind Act as the re-authorization of the federal Elementary and Secondary
Education Act (ESEA). The legislation addresses federal education funding, state
testing and accountability program requirements.
Prior to implementation of ESSA, Oklahoma was operating under a No Child
Left Behind flexibility waiver granted by the U.S. Department of Education.
Under the terms of the waiver, Oklahoma was required to raise education
standards, create accountability systems and improve systems for teacher and
principal evaluation and support. To meet these terms, the state adopted the
Common Core standards in English language arts and mathematics, the Teacher
and Leader Effectiveness Evaluation System and the A-F performance grading
system. After the Legislature repealed the Common Core standards, the State
Board of Education adopted new subject matter standards that will be
implemented during the 2016-17 school year.
SCHOOLS FOR THE BLIND AND THE DEAF
The Oklahoma School for the Blind in Muskogee and the Oklahoma School for
the Deaf in Sulphur provide day and residential services to students from across
the state. Operated by the Department of Rehabilitation Services, both schools
provide comprehensive educational and therapeutic services on their campus.
The schools also provide a satellite pre-school, outreach and educational services
to surrounding schools to allow even more students and families to have access to
specialized programs.
For FY'16, the Oklahoma School for the Blind received more than $6.6 million in
state funds and served 60 students in the residential program, 31 students in the
day program, one child in preschool and 67 students in summer school. For
FY'16, the Oklahoma School for the Deaf received more than $8.1 million in
state funds and served 99 students in the residential program, 71 students in the
day program, 23 in the preschool and 76 in summer school.
As part of the schools’ residential education programs, students have
opportunities to participate in activities similar to a typical public school,
including student organizations and interscholastic athletics. Course work
mirrors classes at any public school but is enhanced with specialized instruction
such as Braille, sign language, adaptive technology and equipment, orientation
and mobility, etc. Both residential programs serve pre-kindergarten through
twelfth grades. Both schools transport residents home for weekends and
holidays.

Common Education
Oklahoma Senate Overview of State Issues 91
OKLAHOMA SCHOOL OF SCIENCE AND MATHEMATICS
Created in 1983 through legislative action, the mission of the Oklahoma School
of Science and Mathematics is to foster the educational development of
Oklahoma high school students who are talented in science and mathematics and
show promise of exceptional development through participation in a residential
educational setting emphasizing instruction in science and mathematics. This
two-year residential school is located in Oklahoma City and provides advanced
science and math courses to students in grades 11 and 12. With possible
capacity for nearly 300 students, the school currently serves approximately 160
students on a 32-acre campus.
Average ACT Score of Residential Seniors FY’01 Through FY’16
In the National Competition of Engineering Aptitude, Mathematics and Science
(TEAM+S), sponsored each year by the Junior Engineering Technical Society,
OSSM teams have placed first regionally for 15 consecutive years. In addition,
the school has produced 229 National Merit Commended Scholars.
To replicate the success of the residential school, the Legislature has provided
funding to establish 9 regional math and science centers across the state to
provide advanced science and math courses to students living in districts that did
not offer these courses. All regional centers are housed in career and technology
centers and are taught by people having a Ph.D. in the subject area.
In 2014, OSSM began a virtual regional center with the goal of serving more
rural students.

Common Education
92 Oklahoma Senate Overview of State Issues
Average Scholarship Amount/Residential Students FY’04 Through FY’16

Oklahoma Senate Overview of State Issues 93
CAREER AND TECHNOLOGY EDUCATION
Career and technology education (CareerTech) got its start in 1904 as
Vocational & Technical Education (Vo-Tech) when teacher H. F. Rusch, with
the support of Oklahoma City Schools Superintendent Edgar Vaught, initiated
the first manual training program. Schools in Lawton, Comanche, Ardmore and
Muskogee followed Oklahoma City’s lead. In all, 90 state schools offered
vocational training prior to the passage of the Smith-Hughes Act of 1917,
which established guidelines and funding for vocational education throughout
the U.S.
In the 20th
century, career and technology education advanced in both ideology
and technology. Today, it is a comprehensive system that significantly
contributes to the state’s economic development and quality of life.
The Oklahoma Department of Career and Technology Education provides
leadership and resources to ensure standards of excellence throughout the
statewide system. The system offers its programs and services through 390
public school districts, 29 technology center districts with 58 campuses and 13
skills centers located in correctional facilities. Currently, there are more than
2,600 instructors working in all areas of CareerTech education. Each of the
technology centers works closely with advisors from local industry to ensure
that Oklahoma’s students learn the skills needed to be valued members of the
workforce.
In FY 2015, enrollments in CareerTech training totaled 517,496. CareerTech
provides nationally recognized competency-based curriculum, education and
training in the following broad categories. Each category offers a myriad of
specialized and customized courses and training opportunities.
Agricultural Education
Business, Marketing and Information Technology Education
Economic and Workforce Development
Family and Consumer Sciences Education

Career and Technology Education
94 Oklahoma Senate Overview of State Issues
Health Careers Education
Science, Technology, Engineering and Mathematics Education
Trade and Industrial Education
Oklahoma’s CareerTech system uses competency-based curriculum. This
curriculum is developed with the input of industry professionals, using skills
standards to identify the knowledge and abilities needed to master an
occupation.
Competency-based education enables CareerTech to provide students with the
skills employers are seeking in the workplace.
CareerTech has developed 15 Career Clusters, which group occupations
together based on commonalities. Schools use these Career Clusters as an
organizational tool to help students identify pathways from secondary schools
to career technical schools, colleges, graduate schools and the workplace. The
Career Clusters show students how what they are learning in school links to the
knowledge and skills needed for their success in postsecondary
education/training and future careers.
FY 15 CareerTech Enrollment in Full-Time Offerings by Career Cluster
Source: Information Management Division, September, 2016

Career and Technology Education
Oklahoma Senate Overview of State Issues 95
CAREER AND TECHNOLOGY FUNDING
Appropriation History State appropriations for career and technology education funding have
decreased by 4.9 percent from FY'05 to FY'17.
Career & Technology Education Appropriation History (In millions)
*Includes an additional $750,000 for adult education, which was transferred from the
Department of Education in 2014.
Technology Center Funding Technology centers are funded through dedicated ad valorem millages, federal
funds, state appropriated revenues and tuition fees paid by students. Millages
are assessed on real property within a technology center district. The Oklahoma
Constitution restricts technology center districts to a maximum of 10 operating
mills and 5 building-fund mills. Changes in technology center millages are
enacted by a majority vote in a district-wide election.
Most technology centers depend more on local ad valorem receipts than state
appropriations. Local property wealth varies widely from district to district,
causing discrepancies in the amount of ad valorem revenue available to support
each technology center.

Career and Technology Education
96 Oklahoma Senate Overview of State Issues
FY’16 Funding Sources for Career-Technology Centers
Source: Oklahoma Department of Career and Technology Education
CAREER AND TECHNOLOGY EDUCATION DELIVERY ARMS
Comprehensive Schools During FY’15, enrollments totaled 132,052. Programs in occupational areas
were offered at 390 schools in Oklahoma. Some 36 percent of students in
grades 6-12 are enrolled in CareerTech offerings ranging from exploration
programs to programs that provide specific knowledge and skills in career
fields. Forty-six percent of students in grades 9-12 are enrolled in Career Tech
offerings.
These students learn valuable skills that prepare them for life and work in our
ever-changing world. The hands-on experience in high-tech classrooms helps
students increase technological proficiency and develop entrepreneurial skills.
All career and technology education programs meet academic standards and
prepare students to work in the “real” world.
Technology Centers Oklahoma’s technology centers provide high school students and adults
opportunities to receive high-quality career and technology education through
various options. While high school students who live in technology center
districts attend tuition-free, adult students are charged nominal tuition.
Currently, 29 technology center districts operate on 58 campuses throughout the
state, making services easily accessible to most Oklahomans. In FY’15, high
school student enrollments in technology centers equaled 18,096. Adult
enrollments in full-time programs, Industry-Specific Training, Adult and Career
Development and Training for Industry totaled 366,538.

Career and Technology Education
Oklahoma Senate Overview of State Issues 97
Technology centers work with business and industry partners to ensure that
curriculum meets the needs of the workplace. Many students participate in
clinicals, internships and on-the-job training to experience the world of work.
Secondary students (10th-12th graders) are also able to earn upper level math
and/or science credit at their local technology centers. In addition, some
technology centers offer Advance Placement (AP) courses. These academic
offerings also meet their high school academic graduation requirements.
Students frequently are able to earn college credit for classes taken at
technology centers through Prior Learning Assessments (PLA) or contractual
agreements with colleges.
Student Organizations More than 88,000 secondary and postsecondary students are members of
CareerTech program-related student organizations, which help develop
teamwork and leadership skills. These organizations include Business
Professionals of America (BPA); Distributive Education Clubs of America
(DECA); Family, Career and Community Leaders of America (FCCLA);
Oklahoma Student organization of National FFA (FFA); Health Occupations
Students of America (HOSA); Partnership of students, teachers and industry
working together (SkillsUSA); and Technology Student Association (TSA).
Skill Centers CareerTech Skills Centers offer specialized, occupational training to adult and
juvenile incarcerated individuals. Services have grown from just a few training
programs in one center to a complete school system that provides services at 13
campuses. In FY’15, more than 1,200 individuals participated in Skills Center
programs. In FY’15, 84.7 percent of those completing Skills Centers programs
were placed in training-related jobs.
In a 2008 study of those who completed Skill Center training and were matched
with training-related jobs, 82.6% did not return to incarceration within 52
months, compared to a rate of 65.5% for those who did not complete a Skill
Center program.
Dropout Recovery The students served through this initiative are out-of-school youth who are 15
to 19 years of age. These youth are given opportunities to gain academic credit
and participate in career-specific training. In FY’16 dropout recovery programs
were available at eleven technology centers which served 504 females and 589
males for a total of 1,093 students. Of the program completers, 365 students
attained a high school diploma and 12 completed a GED. The program also
helped 193 students obtain employment, 20 entered the military and 116
enrolled in postsecondary education. Prior to entering their junior year of high
school, 602 of these students had dropped out of school.

Career and Technology Education
98 Oklahoma Senate Overview of State Issues
ENROLLMENT TRENDS
Between FY’11 and FY’15, total enrollment in career-technology programs
increased 2.7%.
Secondary and Post-Secondary Enrollment in Career
and Technology Education (In Thousands)
Student Outcomes for Career-Tech Programs FY’11 Through FY’15
Source: Oklahoma Department of Career and Technology Education

Career and Technology Education
Oklahoma Senate Overview of State Issues 99
CareerTech Economic & Workforce Development Oklahoma’s CareerTech offers customized programs and services for new
companies, existing companies, small businesses wanting to expand and
entrepreneurs just getting started. Often these services are incentives for
companies to relocate in our state. These programs are designed to ramp-up
very quickly to meet the critical issues facing employers and are focused in
three primary areas: Business and Industry Services, Adult and Career
Development, and Oklahoma Bid Assistance Network.
Business and Industry Services:
Training for Industry Program (TIP): This program meets specific training
needs of new and expanding companies in or coming to Oklahoma, resulting in
net-new jobs.
Customized Training: This initiative is designed to help existing companies
stay competitive by providing the existing workforce with upgraded training or
training on new technology or equipment.
Safety Training: This program is designed to help private or public
organizations plan and implement safety processes, procedures and ongoing
training to assure safe workplaces.
Volunteer Firefighter Training: This program is designed to accommodate the
increased demands for training and testing of volunteer firefighters across the
state.
Business Incubators: This program helps entrepreneurs and start-up business
firms survive and prosper during their early years.
Training for Industry Growth (TIG): This program is designed for training to
accommodate industry identified skilled workforce shortages within an
occupational area by providing customized training for needs of that industry
within a defined geographic region of the state.
Adult and Career Development (ACD): This program is designed to provide
individual avenues to develop the skills and competencies they need to succeed
in today’s workplace
Oklahoma Bid Assistance Network (OBAN): This program is designed for
the marketing and technical assistance to Oklahoma businesses interested in
selling products and services to federal, state, and local governments and other
highly structured markets. The primary purpose is to create jobs and expand the
economy by providing specific, valuable resources to Oklahoma businesses.

Career and Technology Education
100 Oklahoma Senate Overview of State Issues
FY’15 Businesses Served by
CareerTech Economic Development Offerings
Source: Department of Career and Technology Education FY’15 Fast Facts.
Total business served, unduplicated: 6,760

Oklahoma Senate Overview of State Issues 101
POST-SECONDARY EDUCATION
Providing high quality, affordable post-secondary educational programs to
develop a skilled and educated workforce has become a priority with the
Legislature. These programs are seen as an important key to improving the
state’s economy and per-capita income. Oklahoma’s universities, colleges and
career and technology centers play an integral role in educating and preparing
adults to compete in the state, national and global marketplace.
Since 1990, the Legislature has passed and implemented a number of funding and
program initiatives to increase the caliber of our state’s post-secondary
institutions and expand opportunities for students to attain a post-secondary
degree.
This chapter provides an overview of higher education.
HIGHER EDUCATION
Oklahoma higher education began before Oklahoma Territory and Indian
Territory combined to become a state in 1907. As early as 1890, the first
territorial legislature created three institutions of higher learning. By 1901, four
additional institutions of higher education were established across the state.
The Oklahoma State System of Higher Education was created in 1941 by a
constitutional amendment, Article XIII-A, which provides that “all institutions of
higher education supported in whole or in part by direct legislative appropriation
shall be integral parts of a unified system.” The amendment also created the
State Regents for Higher Education as the “coordinating board of control of the
Oklahoma State System of Higher Education.” Currently, there are 25 colleges
and universities, 10 regional universities, 12 community colleges, 11 constituent
agencies, two higher education centers and one public liberal arts university
offering courses and degree programs across the state.

Post-Secondary Education
102 Oklahoma Senate Overview of State Issues
Higher Education Governance The State Regents for Higher Education serve as the coordinating board for all
state institutions. However, most agree that the Legislature has sole power to
establish and/or close institutions (Attorney General Opinion 80-204). The
primary responsibilities of the State Regents are to:
prescribe standards of higher education;
determine functions and courses of study at state institutions;
grant degrees and other forms of academic recognition;
recommend to the Legislature budget needs for state institutions; and
determine fees within the limits set by the Legislature.
In addition to the State Regents, there are three constitutional governing boards
and 12 statutory governing boards. These boards have responsibility for the
operational governance of the state’s higher education institutions. Membership
on all governance and coordinating boards is by appointment of the Governor
and confirmation of the Senate.
Funding Trends for Higher Education In FY’17, 11.9 percent of the state’s appropriated budget went to the State
Regents for Higher Education, which has constitutional authority for allocating
state funds among colleges and universities.
History of Appropriations to Higher Education FY’05 Through FY’17
(In Millions)

Post-Secondary Education
Oklahoma Senate Overview of State Issues 103
The Legislature appropriated $810 million to the State Regents for Higher
Education in FY’17. This was a reduction of over 15% from FY’16. As a result,
institutions significantly raised tuition and fees.
Since FY’89, the State Regents’ office has been funded through a line-item
appropriation in the higher education funding bill. Prior to that year, the state
office was funded through an assessment made on each of the institutions under
the regents’ control. The FY’15 appropriation for administrative operations in
the State Regents’ office is $4.9 million, which represents less than 1 percent of
total appropriations to higher education.
Endowed Chairs: Oklahoma has been making an effort to establish itself as a
research hub in the Midwest. Higher education plays an important role in this
endeavor; state higher education institutions perform a great deal of research that
can benefit the state and the nation. To draw better researchers to Oklahoma, the
State Regents have requested private donations, to be matched by the state, to
fund many new Endowed Chairs and professorships at the institutions. Until
2004, the State Regents could only match up to $7.5 million annually in private
funds for this purpose. Private donations were being offered, but the Regents
lacked the state funds to match them.
In 2004, HB 1904 authorized a $50 million bond issue for the Endowed Chairs
program in order to eliminate the backlog. The Regents' office used their annual
$7.5 million appropriation for Endowed Chairs to fund the debt service on the
bond. However, the backlog of unmatched private funds continued to grow past
this $50 million amount.
As a result, HB 1137 from the 2007 legislative session was passed in order to
increase the bonding authority for the Endowed Chairs program from $50 million
to $100 million in an attempt to address the new backlog of private funds. At this
time, appropriated funding was not provided to fund the debt service on the new
bonds.
HB 1373 from the 2008 legislative session further increased the Oklahoma
Capitol Improvement Authority’s authority to issue bonds for the state’s
matching contribution for Endowed Chairs to $150 million.
This bill also amended the Trust Fund provisions to provide that after July 1,
2008, state matching monies must be used to match the current backlog of
endowment contributions before they may be used to match endowment accounts
created after that date. After the backlog of state matching requirements are
completed, expenditure of state matching monies is limited to a total of $5
million per year; $4 million for the comprehensive universities and $1 million for
other eligible institutions. Trust Fund endowment accounts of $250,000 or less
will be matched dollar for dollar with state matching monies, and those
exceeding $250,000 will be matched with $1 of state match for every $4 received
in contributions.

Post-Secondary Education
104 Oklahoma Senate Overview of State Issues
Although the Oklahoma Capitol Improvement Authority had been given
authority to issue bonds up to $150 million for the Endowed Chairs program,
they had been unable to sell $100 million of those bonds. Therefore, HB 3031
from the 2010 Legislature authorized OCIA to refinance or restructure
outstanding obligations for the Endowed Chairs program. In FY’17, the
Legislature appropriated $11,600,000 to service this debt.
Even after the multiple bond issues to reduce the backlog of Endowed Chairs,
there was still a backlog of $270 million in unmatched Endowed Chair funds at
the beginning of 2012. The 2012 Legislature passed SB 1969, which abolished
the Economic Development Generating Excellence (EDGE) Fund and deposited
the principal of the fund into the Endowment Trust Fund. The amount to be
deposited was approximately at $146.9 million. Currently the Endowed Chair
Fund has an unmatched queue of $154.7 million.
Oklahoma Promise of Excellence Act: During the 2005 session, the
Legislature passed HB 1191 which created the Oklahoma Promise of Excellence
Act of 2005 to authorize bonds for $475 million for The Oklahoma State System
of Higher Education. Bonds were issued by the Oklahoma Capital Improvement
Authority, with revenues from the Oklahoma Education Lottery Trust Fund and
any other source necessary designated for debt retirement. The scope of the
Master Lease Program was expanded to include financing of acquisitions of or
improvements to real property as well as personal property. An additional $25
million in bonds were authorized to establish a permanent revolving lease fund
within the Master Lease Program, to be paid for with lottery revenues. Lease
payments made for projects financed with money from this fund will go back into
the fund for master leases.
In 2007, the Legislature amended both the personal property and real property
portions of the Master Lease Program. The use of the Master Lease Program to
finance the acquisition of personal property is now limited to a total of $50
million in a calendar year. For real property, the State Regents are required to
submit an itemized list of proposed projects to the Legislature at the beginning of
each legislative session, and the Legislature may disapprove all or part of the
proposal. If the Legislature takes no action to disapprove, the proposal is deemed
to be approved. SB 1332 from 2010 allows bonds issued under the Master Lease
Program to be refinanced.
The governing boards for OU, OSU and the State Regents (for all other
institutions) have been authorized to issue bonds for capital projects at the
institutions that may be paid for with any monies lawfully available other than
revenues appropriated by the Legislature from tax receipts. The bonds issued
under this act are tax exempt, and the Legislature is given the power to
disapprove them.

Post-Secondary Education
Oklahoma Senate Overview of State Issues 105
Institutional Budgets For FY’17, state appropriations represent 30.4 percent of total operating revenue
for higher education, while tuition and fee revenue comprise another 52.3
percent of the total higher education budget.
The allocation of appropriations by the State Regents to institutions is based upon
achieving two goals – funding parity within each tier and peer funding parity.
Funding parity within each tier is achieved by the development of a budget need
for each institution as well as the entire system. To arrive at the budget need, the
State Regents use “program budgeting” to focus on the costs of offering courses
for each academic program. The cost base incorporates the actual expenditures
of appropriations, tuition and fees that are allocated to all courses.
Through the accumulation of the course data, a standard cost for each program is
developed for each institution and each tier. The standard cost is then multiplied
by the number of students enrolled in each program, a peer factor, and the
percentage of cost attributable to state appropriations. Again, this data is
aggregated for each institution as well as the entire system to arrive at a budget
need.
The second part of the funding mechanism uses per-student funding data from
peer institutions.
The peer group concept involves first selecting institutions from across the nation
with missions that are comparable to Oklahoma institutions for the three tiers
(comprehensive, four-year regional and two-year institutions). Once peer
institutions are selected, the per-student average revenue from appropriations and
tuition and fees is determined at each peer institution. The average revenue per
student of all peer institutions is multiplied by the student counts at each
Oklahoma college and university to arrive at budget needs.
At a state college or university, the principal operating budget is called the
educational and general (E&G) budget. It contains funds for the primary
functions – instruction, research and public service – and activities supporting the
main functions. The E&G budget is divided into Part I, which comprises mostly
state funds, and Part II (the “sponsored budget”), which derives funding from
external sources such as federal grants and training contracts. The E&G budget
is distinct from the capital budget, which pays for new construction, major
repairs or renovations and major equipment purchases. Auxiliary enterprises –
tangential services such as housing, food services and the college store – are also
excluded from the E&G budget.

Post-Secondary Education
106 Oklahoma Senate Overview of State Issues
There are two primary sources of funds for the Part I E&G budget – state
appropriations and revolving funds. Appropriations by the Legislature are made
to the State Regents who, in turn, allocate directly to each facility in the state
system. Appropriations constitute about 30.4 percent of the institutions’ core
educational budgets. Revolving funds are collected by the institution and consist
primarily of student fees, sales and services of educational departments, and
indirect cost reimbursements from grants and contracts. These funds constitute
approximately 69.6 percent of the core educational budget, with student
tuition/fees being the largest component.
Revolving Funds Among the State Regents’ constitutional powers is:
“…[t]o recommend to the Legislature proposed fees for all of
such institutions and any such fees shall be effective only
within the limits prescribed by the Legislature.”
Since 1890, it has been public policy in Oklahoma to provide comprehensive,
low-cost public higher education. Thus, residents of Oklahoma are afforded
subsidies covering a majority of their educational costs at all colleges and
universities of the state system.
Tuition In Oklahoma, determining tuition limits is a constitutional power of the
Legislature. During the 2001 legislative session, the Legislature passed SB 596
and for the first time since the mid-1980s, delegated this authority, within certain
limits, to the Oklahoma State Regents for Higher Education. From the 2001-
2002 through the 2005-2006 school year, the State Regents were authorized to
increase tuition a maximum of 7 percent per year for Oklahoma residents, and 9
percent per year for nonresidents. Tuition rates at the professional schools (law,
medicine, dental, veterinary medicine, etc.) could increase by 10 percent per year
for residents and 15 percent per year for nonresidents during that time.
In the 2003 legislative session, the Legislature extended even more authority to
the State Regents by allowing them to raise tuition by more than the 7 and 9
percent for residents and nonresidents, respectively. The State Regents are now
allowed to raise tuition at state higher education institutions to no more than the
combined average of resident tuition and fees at the state-supported institutions
of higher education that are members of the Big Twelve Conference. This
change amounted to significant tuition and fee increases for the state’s schools; in
the 2004 school year, students at the University of Oklahoma saw residential
tuition and fees increase nearly 28 percent, and at OSU, by nearly 27 percent.

Post-Secondary Education
Oklahoma Senate Overview of State Issues 107
All revenue derived from enrollment fees, nonresident tuition and special fees for
instruction and academic services are deposited in the institution’s revolving fund
for allocation for support of Part I of the institutions’ educational and general
budget.
HB 2103 from 2007 legislative session directs each institution within the
Oklahoma State System of Higher Education to offer to resident students
enrolling for the first time as a full-time undergraduate beginning with the 2008-
2009 academic year, a tuition rate that will be guaranteed for a period of not less
than four consecutive academic years at the comprehensive and regional
universities at a rate not exceeding 115 percent of the institution’s nonguaranteed
resident tuition rate. Each institution shall provide students with the following
information prior to enrollment:
a. the annual tuition rate charged and the percentage increase for the previous
four academic years, and
b. the annual tuition and percentage increase that the nonguaranteed tuition rate
would have to increase to equal or exceed the guaranteed tuition rate for the
succeeding four academic years.
Undergraduate Tuition and Mandatory Fees
Research Peer Public Universities
2014-2015 2015-2016
University Resident Nonresident Resident Nonresident
Oklahoma $7,695 $20,469 $8,065 $21,451
Oklahoma State $7,442 $20,027 $7,778 $20,978
Kansas $10,448 $25,740 $10,031 $24,671
Kansas State $9,034 $22,624 $9,350 $23,429
Texas $9,816 $34,860 $9,816 $34,860
Texas Tech $9,608 $20,468 $9,567 $21,265
Iowa State $7,731 $20,617 $7,836 $20,856
Source: “FY 2014-15 Tuition Impact Analysis Report,” Oklahoma State Regents for Higher
Education
Source: “FY 2015-16 Tuition Impact Analysis Report” Oklahoma State Regents for Higher
Education

Post-Secondary Education
108 Oklahoma Senate Overview of State Issues
Average Annual Cost of Attendance
Oklahoma Colleges and Universities Full Time Undergraduate Students, FY’17
Source: “FY 2015-16 Tuition and Fee Rates” Oklahoma State Regents for Higher Education.
College Graduates in Oklahoma Over the past 10 years, legislators and the State Regents have implemented a
number of initiatives designed to increase the number of Oklahoma high school
students ready for college level work, going to college and graduating with a
higher education degree. Increasing the number of adults with higher education
degrees in Oklahoma is an important step in improving Oklahoma’s economic
future.

Post-Secondary Education
Oklahoma Senate Overview of State Issues 109
Increasing the number of college graduates in Oklahoma can be achieved one of
two ways. First, the state may import more college graduates through increased
higher wage jobs and economic development. Legislators have created and
funded a number of programs through the Department of Commerce and the
Oklahoma Center for the Advancement of Science and Technology to improve
higher wage economic development opportunities in the state.
Another strategy the State Regents are employing to increase the number of
college graduates in Oklahoma is to increase the number of high school students
entering college and college students remaining and matriculating with a higher
education degree. Some programs are focused on encouraging more middle and
high school students to take a college-preparatory curriculum and attend college
while others are focused on college students.
Percentage of Population 25 Years of Age and Older
With a College Degree
Oklahoma vs. Regional States and U.S., 2007 vs. 2014
Source: U.S. Census Bureau
SB 1792 from the 2006 legislative session requires students beginning with those
entering the ninth grade in the 2006-07 school year to complete a college
preparatory/work ready curriculum to graduate from high school. However, it
allows students to complete the current core curriculum in lieu of the college
preparatory/work ready curriculum upon written parental approval.

Post-Secondary Education
110 Oklahoma Senate Overview of State Issues
Recognizing the importance of retaining and graduating more students,
institutions have worked over the past several years to increase retention and
graduation rates. In 1999, the State Regents launched the “Brain Gain 2010”
campaign to increase the number of Oklahomans graduating with a college
degree in Oklahoma. Task forces were formed at the state and institutional levels
to identify challenges and solutions to ensure more students and adults entered
college and more students in college graduated with a higher education degree.
The most recent endeavor to increase the number of college graduates is called
“Complete College America.” Oklahoma is one of 34 states accepted to
participate in the project due to the commitment to significantly increase the
number of students successfully completing college and closing educational
attainment gaps for traditionally underserved populations. Oklahoma will try to
increase the number of degrees or certificates earned per year by 1,700 so that by
2023 there will be a 67 percent increase in the number earned. Five national
foundations are providing multi-year support to CCA: the Carnegie Corporation,
the Gates Foundation, the Ford Foundation, the Kellogg Foundation and the
Lumina Foundation for Education.
First-Year Persistence Rates
Within State 2005-06 Through 2014-15
Source: State Regents for Higher Education

Post-Secondary Education
Oklahoma Senate Overview of State Issues 111
Degrees Conferred in Oklahoma 2004 Through 2015
Source: State Regents for Higher Education
Graduation Rates by Tier Within State 2003-04 Through 2014-15
Source: State Regents for Higher Education
In addition to the initiatives mentioned above, the Legislature has created a
number of other programs designed to increase the number of graduates and help
students and families finance the cost of higher education. These include the
Oklahoma College Savings Plan Act and the Oklahoma Higher Learning Access
Program, which not only help families pay for college but help students complete
college.

Post-Secondary Education
112 Oklahoma Senate Overview of State Issues
Oklahoma College Savings Plan Act Established in 1998 and implemented in 2000, the Oklahoma College Savings
Plan Act provides parents and others an opportunity to save for college costs by
creating a trust fund for prospective students. Any person may open an account
on behalf of a beneficiary with as little as $100 and contribute as little as $15 per
pay period to the savings plan. A maximum of $300,000 may be invested for
each beneficiary. Among the plan’s benefits:
Contributions up to $10,000/year per taxpayer and $20,000/year per
married couple can be deducted from Oklahoma taxable income;
Funds are invested in a specific mix of securities, bonds and money market
funds depending on the beneficiary’s age;
Withdrawals are exempt from state and federal taxes;
Funds invested can be used to pay for almost all costs of attending an
accredited or approved college, whether public or private, in-state or out-of-
state; funds can also be used for approved business, trade, technical or other
occupational schools such as CareerTech;
If the beneficiary decides not to attend college, account holders may switch
the beneficiary or save the funds for a later date; and
A person may open an account at any time irrespective of the beneficiary’s
age.
This is the state’s only qualified tuition savings plan. As of August 2016, more
than 60,000 accounts have been opened with current assets totaling over $727
million.
State Financial Aid and Scholarships A number of programs are available to help students pay for college expenses.
Some programs are based on financial need, and others are merit-based.
Oklahoma Tuition Aid Grant Program (OTAG): OTAG provides a
maximum annual award of 75 percent of enrollment costs or $1,000, whichever
is less, to low-income students residing in Oklahoma who are attending a public
higher education institution at least part time. Students attending a private higher
education institution in Oklahoma are eligible to receive a maximum $1,300
award. During 2015-16, an estimated 21,000 students were awarded $19
million.
Academic Scholars Program: Ensuring Oklahoma’s best students stay in
Oklahoma to attain a higher education degree is the mission of this scholarship
program. Students qualify for the program in one of three ways: (1) scoring
among the top 0.5 percent of Oklahoma students on the ACT or SAT test; (2)
receiving one of three official national designations; or (3) be nominated by a
higher education institution (institutional nominee). The program provides

Post-Secondary Education
Oklahoma Senate Overview of State Issues 113
$5,500/year to students attending OU, OSU or the University of Tulsa;
$4,000/year to students attending an Oklahoma four-year public or private
college or university; or $3,500 for students attending Oklahoma two-year
colleges if they are eligible under the first two criteria. In the Fall of 2003,
awards provided under the institutional nominee designation became half of all
amounts listed above. In order to remain eligible for these awards, students must
maintain a 3.25 GPA and complete 24 hours of courses a year. For FY’16, 2,958
students were enrolled in the program.
Oklahoma Higher Learning Access Program (OHLAP) – Oklahoma’s
Promise: This program's mission is to provide tuition assistance to students who
might not otherwise attend or complete college. Qualifying students in families
who earn less than $50,000 annually upon application and less than $100,000
annually when the student begins college receive free tuition assistance to any
public or private higher education institution in Oklahoma for up to five years. In
order to qualify, students must enroll in the program by the 10th grade, must
agree to take a college preparatory curriculum, must have a grade point average
of at least 2.5 in high school and must refrain from unlawful behavior. OHLAP
eligibility requirements for students were modified by adding a requirement for
students to be U.S. citizens or lawfully present in the United States as well as by
allowing access to students who are both home schooled and achieve an ACT
composite score of at least 22.
To retain OHLAP eligibility, students must achieve a minimum GPA of 2.0
through their sophomore year and a minimum GPA of 2.5 during their junior
year and thereafter. Students will also lose their program benefits if they are
expelled or suspended for more than one semester from an institution of higher
education.
OHLAP was further modified to extend the time period during which high school
graduates must enroll in postsecondary studies to receive the OHLAP benefit if
they are members of the Armed Forces and ordered to active duty. Also, financial
aid eligibility requirements to qualify for OHLAP were modified for any student
who was adopted while in permanent custody of DHS, in court-ordered custody
of a licensed private nonprofit child-placing agency or federally recognized
Indian tribe.
SB 820 from the 2007 legislative session created a permanent funding source for
OHLAP. Each year, the State Regents for Higher Education will provide the
State Board of Equalization with an estimate of the amount of revenue necessary
to fund OHLAP awards. The Board will make a determination of that amount
and subtract it from the amount it certifies as available for appropriation from the
General Revenue Fund. The director of the Office of Management and Enterprise
Services will transfer this amount to the OHLAP Trust Fund on a periodic basis
as needed. Revenues from horse racing and the State-Tribal Gaming Act that had
been deposited to the OHLAP Trust Fund were directed to the General Revenue
Fund beginning July 1, 2008.

Post-Secondary Education
114 Oklahoma Senate Overview of State Issues
SB 137 from the 2015 legislative session directed the State Regents to review a
student's financial qualification for OHLAP if his/her parents' income includes
military benefits or Social Security due to death or disability of a parent. It
provides for OHLAP eligibility if the parents' income, minus military or Social
Security income, does not exceed $50,000
In FY’17, an estimated 18,000 students will receive Oklahoma’s Promise
scholarships. Studies show that OHLAP students are much less likely to require
remediation classes to prepare them for college-level work and are more likely to
remain in college through the third year.
Degree Completion Rates Five-year Degree Completion Rate for
OHLAP Students vs. All Students
Source: State Regents for Higher Education
Regional University Baccalaureate Scholarship: This program provides
$3,000 and a tuition waiver to students who have received an official national
designation, such as National Merit Finalist, or have achieved an ACT composite
score of at least 30. Scholarships are available only to students attending one of
the Oklahoma public four-year regional universities. For FY’16 there were 338
scholarship recipients.
Teacher Shortage Employment Incentive Program: The Teacher Shortage
Employment Incentive Program (TSEIP) was created in 2000 by SB 1393 to
recruit and retain mathematics and science teachers in Oklahoma public schools.
The incentive is the reimbursement of student loan expenses or an equivalent
cash benefit upon teaching five consecutive years in Oklahoma public schools.
The year 2006 was the first year teachers were eligible for the benefit. To date,
333 teachers have received the incentive. The most recent benefit paid totaled
$14,362.

Post-Secondary Education
Oklahoma Senate Overview of State Issues 115
Future Teachers Scholarship: Up to $1,500/year is awarded to full-time
upperclassmen and graduate students who intend to teach a subject in which
there is a critical need of teachers. In order to qualify, students must have
graduated in the top 15 percent of their high school graduating class, scored at or
above the 85th percentile on the ACT or similar test or have been accepted for
admission to a professional accredited education program in Oklahoma. Lesser
amounts are available to underclassmen and part-time students. There were 108
people participating in this program in FY’16.
National Guard Tuition Waiver: Members of the Army or Air National Guard
who are pursuing an associate or baccalaureate degree at a state system
institution receive an award amount equal to the cost of resident tuition. For
FY’16 there were 2,199 students participating in this program.
Oklahoma Tuition Equalization Grant: This program was established in 2003
to assist Oklahoma college students in meeting the cost of attendance at non-
public post-secondary institutions within the state. To qualify, a student must be
an Oklahoma resident; be a full-time undergraduate; attend a qualified Oklahoma
not-for-profit, private or independent institution of higher education located in
Oklahoma; have a family income of $50,000 or less; and meet their institution’s
policy on satisfactory academic progress for financial aid recipients. Recipients
can receive the $2,000 award for up to five years after their first semester of
post-secondary enrollment, not to exceed the requirements for completion of a
baccalaureate program. In FY’16, approximately 2,112 students received a
grant.


ENERGY AND ENVIRONMENT
Energy and Environment Agencies
Section Information Prepared By:
Quinten Dilbeck
Fiscal Analyst (405) 530-2384 [email protected]


Oklahoma Senate Overview of State Issues 119
ENERGY AND ENVIRONMENT
Most legislation relating to protection of our state’s natural resources and
regulation of the industries utilizing those resources is assigned to the Senate
Energy Committee. These issues include regulation and management of: water
resources; protection of land, air and water quality; exploration of oil and gas
including pipelines, refineries, royalty and mineral owner concerns and surface
damages; generation and distribution of electric power, including wind energy;
telecommunications; and mining of coal, aggregates and other minerals as well as
monitoring and working with the regulatory agencies responsible for governing
these areas such as the Department of Environmental Quality, the Oklahoma
Water Resources Board and the Corporation Commission.
Legislative and regulatory authority over these issues and the agencies assigned
to protect our state’s natural resources is of great importance to our citizens and
the industries which invest billions of dollars in our state’s infrastructure to
provide the energy resources and utility services on which our citizens depend.
Following are brief highlights of the major issue areas and recent legislative
efforts in those areas.
WATER
Any legislation dealing with water can easily become the biggest and most
emotional issue in a legislative session. No citizen, industry, tribal or
governmental entity is without a vital interest in even the slightest amendment to
laws governing the ownership, regulation and permitting of the quantity and
quality of our state’s waters.
In the last decade there have been several moratoriums enacted in an attempt to
prevent large transfers of water out of state. Of particular concern was the State
of Texas seeking water from Southeastern Oklahoma to serve the growing
population in the north Dallas area. These various moratoriums have been
amended over the years, but based on federal court decisions resulting from

Energy and Environment
120 Oklahoma Senate Overview of State Issues
lawsuits brought by Tarrant County, Texas, at least two of the moratorium
statutes are now determined to be void. Ultimately Texas lost their legal battle in
the U.S. Supreme Court but it is likely they will continue to pursue water
resources from Oklahoma in the future.
The recent lawsuit against the City of Oklahoma City, which was seeking a
permit to transfer water from the Sardis Reservoir in Southeast Oklahoma, has
been settled, pending approval of the agreement by the U.S. congress. The
Chickasaw and Choctaw Tribes strongly opposed and filed suit against the permit
the city was seeking and rejected the State of Oklahoma’s legal authority and
ownership of this water. The State will manage the waters of Sardis Lake, which
will allow future use by Oklahoma City, but the tribes will have some control
over the sale of water. There are also certain restrictions on the amount of use of
the water.
There was also an appeal of the Oklahoma Water Resource Board’s order setting
the Maximum Annual Yield for the Arbuckle-Simpson aquifer. In September
2015 it was ruled that the limits can be enforced. This lawsuit was filed by a
large group of industry and landowner representatives in the Oklahoma County
District Court. The plaintiffs are currently appealing to the Civil Appeals Court.
OIL AND GAS
While legislation affecting oil and gas tax credits is critically important and
receives a great deal of attention by the Legislature due to the impact on our state
budget, regulatory issues affecting day-to-day operations of both large and small
producers, royalty owners and surface owners often attract much attention at the
Capitol. One example of this is the increasing public concern over recent
earthquake swarms and their possible connection to oil and gas activity. Even
though the Corporation Commission, a constitutional entity, is charged with
permitting and regulation of oil and gas activities, many of the requirements
governing those activities are statutorily enacted or amended by the Legislature.
Considering such activities are a vital part of the economy in this state, there will
always be great interest in legislation affecting all aspects of the industry, from
initial drilling through distribution of refined products to consumers.
When there has been a high probability that wastewater injection wells have
influenced earthquakes, the Corporation Commission has begun issuing
moratoriums or capping volumes of wastewater injections at certain wells.
Industry has cooperated with these directives in almost every instance and
continues to work with the commission to reduce earthquake swarms.

Energy and Environment
Oklahoma Senate Overview of State Issues 121
ELECTRIC GENERATION AND DISTRIBUTION
The financial investment in electric power generation and distribution facilities
and infrastructure is unparalleled in comparison to all other major industries in
this state; and regulation of this industry, by statute and the authority vested in
the Corporation Commission, is of great importance to both the industry and all
Oklahoma consumers.
Currently, the electric service providers and consumer watch organizations are
greatly concerned about the requirement for Oklahoma utility providers to come
into compliance with new air-quality standards issued by the federal
Environmental Protection Agency. Meeting the new requirements will force our
state utility providers to make costly modifications to aging coal-fired generation
units. Like all costs of service, ratepayers will ultimately pay for these
modifications and the Corporation Commission is in the process of authorizing
rate increases to recoup these costs.
Wind power generation has continued to increase, and according to the American
Wind Energy Association, as of 2016, our state ranks 4th nationally in total
megawatts (MW) installed at a capacity of 5,453MW. During the 2014 session,
there were several important pieces of legislation relating to wind energy due to
citizen complaints. At least one lawsuit filed in federal court against large wind
generation facilities moving closer to populated areas concerning the lack of state
regulation or permitting of siting such facilities. Legislation was enacted in 2014
directing the Corporation Commission to conduct a Notice of Inquiry and begin a
rulemaking process to address these concerns.
In anticipation of future technological advances in electric generation technology,
a measure was enacted in 2014 at the request of electric service providers to
establish a separate tariff for consumers who choose to install “distributed
generation” facilities in their homes. With currently available technology this
would only apply to some 700 homes throughout the state but more importantly,
it sets a policy that consumers choosing to install any type of self-generating
electric service and remain connected to the traditional electric grid shall not be
subsidized by other ratepayers who are purchasing electric power from the
provider. That is a simplified explanation of a rather complicated rate-setting
process whereby certain distribution costs are mingled with electric rates and
these costs are applied to various classes of consumers. The Corporation
Commission is charged with establishing all these rates including the amount of
the tariff established by this act. The amount of which will probably not be
significant enough to deter any customer interested in installing such equipment
in their home.

Energy and Environment
122 Oklahoma Senate Overview of State Issues
TELECOMMUNICATIONS
While issues relating to telephone, internet and cable television are largely
federally regulated, there are certain state regulated activities that often receive
much attention when they occur. Nearly every session there are bills attempting
to modify the Oklahoma Universal Service Fund. The OUSF was created in 1997
to provide basic local toll-free calling service to rural customers at reasonable
and affordable rates comparable to the access in urban areas and internet access
for all public schools, libraries, not-for-profit hospitals, certain qualified health
centers and mental health facilities (added in 2014). Based on the number of
customers and facilities eligible to receive funding from the OUSF, the
Corporation Commission determines the level of funding necessary and sets a
tariff which in turn is added to the bills of Oklahoma telephone customers. There
is a separate, Oklahoma Lifeline Fund, created to provide low-income
Oklahomans assistance in maintaining basic local exchange telephone service.
ENVIRONMENTAL PROTECTION
The Department of Environmental Quality was created in 1993 to streamline
environmental regulation previously provided haphazardly by nine different state
agencies into a smaller and more organized system of state environmental
agencies that cooperate to protect the water, land and air of our state. Each state
environmental agency, which in addition to DEQ include, the Corporation
Commission, the Oklahoma Water Resources Board, the State Department of
Agriculture, Food and Forestry, the Oklahoma Conservation Commission, the
Department of Wildlife Conservation and the Department of Mines, work in
coordination to enforce the Oklahoma Environmental Quality Act under their
jurisdictional area and also operate under the coordination of the Secretary of
Energy and Environment.
From its inception in 1993, DEQ was organized differently than most other state
agencies in that under the governance of a thirteen member Environmental
Quality Board, there are eight smaller advisory councils made up of
representatives of the industries they represent for the purpose of actually
drafting rules, which are later adopted by the Environmental Quality Board, and
working with the agency staff to govern these issues: Air Quality, Hazardous
Waste, Laboratory Services, Radiation Management, Small Business
Compliance, Solid Waste Management, Water Quality Management and
Waterworks and Wastewater Works. These smaller councils, with direct
knowledge and experience in these various industries are involved partners
working closely with agency staff and are highly regarded by the regulated
industries.

Energy and Environment
Oklahoma Senate Overview of State Issues 123
The major tasks of the environmental regulatory agencies are outlined by the
Oklahoma Environmental Quality Act (27A O.S. 1-3-101). There are six state
agencies responsible for environmental regulations:
ENVIRONMENTAL AGENCY RESPONSIBILITIES
Oklahoma Conservation Commission The Conservation Commission’s primary responsibilities lie in the preservation
and development of Oklahoma's natural resources. The commission has the
responsibility for providing assistance to all 88 conservation districts in the areas
of erosion prevention and control, prevention of flood and sediment damage,
development of water resources, environmental education coordination,
administration of the state Cost-Share Program, maintenance of small upstream
flood control structures, abandoned mine land reclamation and the Conservation
Reserve Enhancement Program.
State Department of Agriculture The State Department of Agriculture was created to protect, improve and develop
all of the state's agricultural resources, and to increase the contribution of
agriculture to the state's economy. The department forms educational and
economic partnerships, encourages value-added processing of Oklahoma’s raw
agricultural resources, and develops domestic and international markets for the
state’s agricultural commodities and products. The agency enforces laws and
rules pertaining to food safety, water quality, and agricultural-related product or
service quality along with monitoring concentrated animal feeding operations.
Department of Environmental Quality The Department of Environmental Quality (DEQ) provides comprehensive
environmental protection and program management. DEQ is responsible for the
principal environmental regulatory functions of air quality, water quality, and
solid waste and hazardous waste management.

Energy and Environment
124 Oklahoma Senate Overview of State Issues
* Distributes Federal Funds
* Coord inates pollution control
activities by all state agencies
* Serves as public trustee for
natural resources under various
federal acts
* Soil conservation & erosion * Mining regulation and
control reclamation of active mines * Water pollution includ ing water
* Technical lead agency for the * Inspection of mines for supplies, water quality, waste
Section 319 Federal Clean Water hazardous working cond itions, water treatment systems and
Act safe equipment operation and fresh water wellhead protection
* Wetlands strategy proper ventilation * Air quality
* Assessment and conservation * Health and safety inspections of * Hazardous waste management
plan development and sand , gravel and quarrying * Solid waste management
implementation of watersheds of operations * Federal Superfund
clean lakes responsibilities
* Write Nutrient Management * Radioactive waste
Plans * Environmental laboratory
* Federal upstream flood control * Water quantity includ ing water services and certification
program rights, surface water and
underground water, p lanning
and interstate compacts
* Flood plain management * Water pollution from agricultural
* Promulgate and enforce rules * Weather modification sources
regard ing the exploration, * Dam safety * Pesticide control
d rilling, development, producing * State water/ waste loans and * Forestry and nurseries
or processing of oil and gas grants revolving fund and other * Fertilizer
includ ing operations of related financial aid programs * Facilities which store grain, feed ,
pipelines, storage tanks, etc. * Administration of the federal seed , fertilizer and agricultural
* Conservation of oil and gas State Revolving Fund Program chemicals
* Technical lead agency for clean * Regulation and enforcement of
lakes eligible for fund ing under CAFO facilities
Section 314 of the Federal Clean
Water Act
* Statewide water quality
standards
* Water well d rillers/ pump
installers licensing
* Waste-by-pollution
determinations
Secretary of the Environment
Department of Mines
Corporation Commission
Department of Agriculture
Department of
Environmental Quality
Conservation Commission
Water Resource Board
Oklahoma Water Resources Board The Oklahoma Water Resources Board (OWRB) manages the waters of the state
and plans for Oklahoma's long-range water needs to ensure an adequate supply of
quality water. The primary function of the agency has been to administer the
state's water rights program, both from ground water and stream water. The
OWRB also administers the Clean Water State Revolving Fund (CWSRF) and
the Drinking Water State Revolving Fund (DWSRF), which provide loans to
qualified entities needing financial assistance to construct water and sewer
projects. The OWRB completed the updated version of the Oklahoma
Comprehensive Water Plan in 2011.
Corporation Commission Established in 1907 by the Oklahoma Constitution, the mission of the
Corporation Commission is to regulate the activities of public utilities, oil and
gas drilling, production and waste disposal; motor carriers, the storage, quality
and dispensing of petroleum products, and other hazardous liquid handlers. The
commission also monitors Oklahoma compliance with a number of federal
programs.

Energy and Environment
Oklahoma Senate Overview of State Issues 125
The Commission is comprised of three statewide elected officials. They serve
six-year terms that are staggered so that a vacancy occurs every two years.
Department of Mines The Department of Mines protects the environment through the enforcement of
state and federal laws related to surface and sub-surface mining. Additionally,
the department inspects mines for hazardous conditions, directs special
consideration towards working conditions, verifies the safety of equipment
operation, ensures proper ventilation, and regulates blasting activities.
CURRENT ENVIRONMENTAL INITIATIVES
The Legislature has supported various programs designed to monitor and
remediate the state’s natural resources. The following programs highlight the
state’s commitment to a sound environment.
Water Quality Monitoring (BUMP) During the 1998 session, the OWRB was authorized and provided funding to
implement a coordinated and comprehensive state water quality monitoring
effort, known as the Beneficial Use Monitoring Program (BUMP).
Oklahoma’s water resources are regulated through the promulgation of water
quality standards, required by the federal government and developed by the
OWRB. Beneficial uses are assigned to every water segment in Oklahoma. By
statute, each state environmental agency is tasked with ensuring the maintenance
of these beneficial uses. BUMP is designed to gather scientifically and legally
defensible baseline water quality trend data. The data will be used to assess and
identify sources of water quality impairment, detect water quality trends, provide
needed information for the development of water quality standards, and facilitate
the prioritization of pollution control activities.
BUMP is composed of five key elements or tasks, one of which has not been
implemented due to funding constraints:
River and Stream Monitoring: over 100 sites are sampled monthly for water
quality. These sites are segregated into two distinct types of monitoring
activities: fixed sites and rotating sites; monitoring sites may temporarily
decrease in number due to recent budget reductions.
Fixed Station Load Monitoring: Collection of water quantity flow data is
used to track long-term trends. This component is currently unfunded;

Energy and Environment
126 Oklahoma Senate Overview of State Issues
Fixed Station Lakes Monitoring: Currently 130 lakes are being sampled on a
five year rotation schedule. The effort involves the sampling of about three
stations per reservoir, but varies due to size;
Fixed Station Groundwater Monitoring: Focusing on groundwater will
involve monitoring existing wells. Samples are taken from 750 wells on a
five year rotation and will be completely phased in by 2017; and
Intensive Investigation Sampling: This element attempts to document the
source of water impairment and recommend restorative actions. This
component is currently unfunded.
Superfund Remediation The Superfund Program is administered by DEQ in partnership with the U.S.
Environmental Protection Agency (EPA), which provides almost all the funding.
Superfund is the federal program to monitor and remediate the nation's
uncontrolled hazardous waste sites as well as the sites that pose the greatest threat
to human health and the environment. Nationwide, EPA has identified 1,337 sites
on the National Priorities List (NPL). In Oklahoma, there are seven NPL sites,
seven deleted sites and one proposed site. The current seven sites are:
Oklahoma Refining (Cyril);
Tulsa Fuels and Manufacturing (Collinsville);
Tar Creek (Ottawa County);
Hudson Refining (Cushing);
Tinker Air Force (Midwest City);
Wilcox Oil Co. (Creek County); and
Hardage/Criner (McClain County).
Rural Economic Action Plan (REAP) The Rural Economic Action Plan (REAP) was established in 1996 to stimulate
the economic development of the infrastructure in rural Oklahoma. For FY’17,
the appropriations to REAP totaled about $9.7 million.
The appropriation is given to the REAP fund and divided equally among 10
Substate Planning Districts resulting in two of the districts receiving half of a
portion for rural economic development planning and implementation of projects.
Provisions of REAP restrict grants to cities or towns with a population of less
than 7,000. Also, the selection process gives priority to cities or towns with a
population of less than 1,700.

Energy and Environment
Oklahoma Senate Overview of State Issues 127
Other REAP funds were derived from the apportionment of gross production
revenues. During the 2006 legislative session, legislation was passed that divided
the oil and gas gross production REAP funds three ways until 2014, between the
Oklahoma Water Resources Board (OWRB), the Conservation Commission, and
the Oklahoma Tourism and Recreation Department (OTRD). OWRB will use
their portion of the funds to continue dealing with water infrastructure needs and
also to conduct the Oklahoma Comprehensive Water Plan. The Conservation
Commission will use their portion for the rehabilitation of watershed dams and
for the Conservation Cost Share Program and the Conservation Reserve
Enhancement Program. OTRD will use their portion for the purpose of one-time
capital expenditures for capital assets owned, managed or controlled by the
department. The department plans on using the funds to focus on environmental
issues as identified by DEQ.
The current three-way division of the oil and gas gross production REAP funds
was extended to the year 2019 during the 2016 legislative session.


HEALTH AND SOCIAL SERVICES
State Department of Health
Medicaid
Mental Health and Substance Abuse Services
Section Information Prepared By:
Anthony Sammons
Fiscal Analyst (405) 521-5696 [email protected]


Oklahoma Senate Overview of State Issues 131
STATE DEPARTMENT OF HEALTH
The Oklahoma State Department of Health (OSDH) protects and promotes
health, prevents disease and injury, and helps to create conditions by which
Oklahomans can be healthy. This is achieved through statewide programs that
range from rapid identification and response to disease outbreaks, medical and
public health emergency response, protection of the population through
inspection (e.g. restaurants, medical facilities) and implementing statewide
evidence based initiatives that improve health (e.g. Preparing for a Lifetime).
Local public health efforts through most county health departments are also
coordinated by the OSDH.
ORGANIZATION OF THE PUBLIC HEALTH SYSTEM
The public health effort has evolved over the state’s history as new health
problems, and new ideas for combating them, have emerged. Services that fall
within OSDH’s mandate include:
Providing free immunizations for children who lack resources in order to
prevent contagious illnesses;
Providing prenatal and infant care, including access to nutritious foods and
nurse home visitation services, to improve infant health outcomes among
low-income women;
Providing perinatal and reproductive health services to ensure readiness to
parents and improved children’s health;
Providing food establishment inspections to prevent food-borne diseases.
Health departments offer direct clinical services that protect the community or
derive a greater community benefit. Many clients are charged a fee based on
their ability to pay for these services, however, some traditional infectious disease
services are provided free of charge to ensure prevention of the spread of disease
to the community and unnecessary cost to the healthcare system and businesses.
Providing primary care to individuals is not the agency's mission; however,

State Department of Health
132 Oklahoma Senate Overview of State Issues
ensuring the availability of care is one of the ten essential public health services
and is provided through assessment and designation of shortage areas,
coordination with health workforce entities and health providers. Health
department clinics provide preventive services and education to avert the onset of
illness and disease, for example, by providing vaccines to children, running
educational anti-smoking or healthy infant interventions. Treatment for health
conditions are provided as a means of community prevention (e.g., tuberculosis
or sexually transmitted diseases) or, in rare cases, healthcare shortages. Medical
and case management services are provided for certain health conditions such as
infant and toddler development delays.
OSDH serves as the statewide coordinator of public health services. The central
office provides administrative, laboratory and program services to support local
agencies and also provides state level programs in order to be effective, create
efficiency and achieve an economy of scale. Seventy counties are served by
county-supported health departments. The other seven counties – Alfalfa,
Cimarron, Dewey, Ellis, Nowata, Roger Mills and Washita – do not contribute
local funding to support a health department location. These seven counties
receive only state-wide services (i.e., environmental inspections, outbreak
investigation, public health and medical emergency response, Women, Infants
and Children (WIC) and immunization). Oklahoma City and Tulsa are served by
city-county health departments that are administratively autonomous (guided by
their own boards) but must comply with policies of the State Board of Health.
Counties may assess property taxes of up to 2.5 mills to fund operations of local
health departments. Sixty-seven counties do so, most of them at the highest
millage allowed by the Oklahoma Constitution. Three counties provide local
support via sales taxes.
FUNDING BY REVENUE SOURCE
The majority of OSDH FY 2016 expenditures, $208.8 million or 56.37 percent,
were supported by federal funding sources (WIC, Medicaid and various
categorical federal grants and cooperative agreements from the U.S. Department
of Health and Human Services). State appropriations supported $57.9 million or
15.64% percent, fees charged to clients (for such services as copies of birth and
death certificates, occupational and restaurant licensing, etc.) supported $61.2
million or 16.54 percent and county millage funded $42.4 million or 11.45
percent of anticipated expenditures.

State Department of Health
Oklahoma Senate Overview of State Issues 133
SFY 2016 Expenditures General RevenueRevolving (Fees and other
Revenues)Federal Millage Total
Community and Family Health 38,576,548$ 4,898,888$ 131,876,108$ 42,407,904$ 217,759,449$
Office of the State Epidemiologist 6,285,978$ 4,225,951$ 43,228,795$ -$ 53,740,724$
Protective Health 4,857,537$ 36,941,654$ 19,582,730$ -$ 61,381,921$
Health Improvement Services 5,713,258$ 10,611,803$ 4,179,992$ -$ 20,505,053$
Public Health Infrastructure 2,330,067$ 4,376,134$ 9,947,938$ -$ 16,654,139$
Athletic Commission 189,104$ 238,725$ -$ -$ 427,829$
57,952,492$ 61,293,156$ 208,815,563$ 42,407,904$ 370,469,115$
FUNDING BY SERVICE
The sources of funding vary widely for different health department program
activities. Given that state appropriations to the OSDH account for less than 1%
of all appropriated dollars in the state, few activities are funded solely with state
appropriations. Most programs are implemented utilizing a variety of funding
streams and several function with no appropriated dollars. In some cases, each
$1 of appropriations for a particular program is used to access from $1 to $9 in
federal funds.

State Department of Health
134 Oklahoma Senate Overview of State Issues
SERVICES PROVIDED BY OSDH
Community and Family Health Services Community and Family Health Services provide oversight and direction to the
sixty eight (68) organized county health departments in the state. Additionally,
central office programs focus primarily on preserving and improving the health
of women, adolescents, and babies. Community and Family Health Services acts
as the liaison between the county health departments and state wide programs
within the state health department. The primary responsibility is to enhance the
capacity at the state and local levels for the development of population-based and
clinical preventive services to meet community defined health needs.
County Health Departments: The 68 county health departments are under the
jurisdiction of OSDH and establish priorities in collaboration with communities
and to implement program specific guidelines for OSDH defined goals and
objectives. A basic function of county government, county health departments
develop, implement and administer programs and services that are aimed at
maintaining a healthy community. County residents are encouraged to participate
in assessing public health needs and in formulating a community health plan. It
also works with other community organizations to assure needed services and
programs are available. These units also play a primary role in the development
and implementation of emergency response plans at this level.
Child Guidance and SoonerStart (Early Intervention) Services: The Child
Guidance Service is administered in regional county health departments and the
Childcare Warmline, which offers free telephone consultation and referrals to
child care providers. These programs provide support and training to parents,
childcare providers, educators, the medical community and youth. The agency
also staffs the Early Intervention (SoonerStart) program, primarily funded
through the State Department of Education, for infants and toddlers, birth to 36
months, who have developmental delays.
Dental Health Service: The program provides leadership in oral disease
prevention, anticipates needs, and mobilizes efforts that will help protect and
promote good oral health for Oklahoma citizens. Oral health screening and
small-scale treatment is provided for children and nursing home residents in some
areas through contracts with providers. There is also a school-based dental
education program, a fluoridation program to improve the state’s drinking water
supply and the Dental Loan Repayment Program.
Family Support and Prevention Service: Family Support and Prevention
Service promotes the health, safety and wellness of Oklahoma’s children and
families by administering visitation programs for low-resource mothers and
provides training and assistance to organizations/agencies that service families
with young children. The agency directs resources to improve health outcomes

State Department of Health
Oklahoma Senate Overview of State Issues 135
and parenting skills in an effort to avert child abuse, unplanned repeat
pregnancies and other adverse outcomes.
Maternal and Child Health Service: This service area provides leadership, in
partnership with key stakeholders, to county health departments and non-profit
clinics to improve the physical and mental health, safety, and well-being of the
Oklahoma maternal and child health population. They develop and promote best
practices for women’s and men’s reproductive health and the health of babies.
The agency also provides community-based programs aimed at lowering the
state’s teen birthrate through local agreements with county health departments
and community-based organizations.
Nursing Service: Public health nurses comprise the largest segment of
Oklahoma’s public health workforce. Nursing Service is responsible for the
support of Oklahoma’s public health nurses by providing clinical practice
guidelines and orders, continuing education and training opportunities,
performance improvement activities and professional development.
Record Evaluation and Support Service: This service supports effective and
efficient operations of county health department services by ensuring patient
records are organized and maintained to conform to medico-legal standards. It
provides on-site training and software support for agency computer application
programs for data collection, billing, and patient records.
Screening and Special Services: The mission of this program is to provide
statewide surveillance, screening and specialized programs to protect Oklahoma’s
children and their families. Programs in this service area include: Genetics,
Newborn screening, Newborn Hearing Screening, Childhood Lead Poisoning
Prevention and the Oklahoma Birth Defects Registry.
Women, Infants and Children (WIC) Service: This federally funded program
provides nutritious foods to supplement the diets of women, infants, and children
(approximately 100,000 per month). WIC foods are specifically chosen to
provide the needed nutrients. The agency provides nutrition classes, interactive
online education and fitness group classes, and private consultation with nutrition
experts.
Office of the State Epidemiologist Office of the State Epidemiologist (OSE) is comprised of five public health
prevention and/or surveillance services: Public Health Laboratory, Acute
Disease, HIV/STD, Immunization and Emergency Preparedness and Response
Services. The role of the State Epidemiologist is to serve as a medical consultant
and provide epidemiologic consultation to the agency on matters relating to
infectious disease, immunizations, preparedness and response; supervise the
investigation of disease outbreaks; consult on the preparation and implementation
of various grants and research activities; represent the agency with the Council of
State and Territorial Epidemiologists (CSTE); supervise the collection and

State Department of Health
136 Oklahoma Senate Overview of State Issues
analysis of disease surveillance data; oversee the publication of various
educational materials; and act as the media spokesperson for the agency on
epidemiologic matters.
Public Health Laboratory Service: The Public Health Laboratory is CLIA-
certified and provides essential laboratory services to local county health
departments, agency programs and private health providers. Such services
include analytical testing, training and technical assistance as well as pharmacy
services for county health departments.
Acute Disease Service: : The primary responsibility of this program is to control
communicable diseases through surveillance, investigation of disease outbreaks,
analysis of data to plan, implement and evaluate disease prevention and control
measures, dissemination of pertinent information and education of healthcare
professionals and the public.
HIV/STD Service: The mission of the HIV/STD Service is to protect and
promote the public’s health by intervening in the transmission of the Human
Immunodeficiency Virus and other sexually transmitted diseases. Primarily
federally funded, the Service provides statewide programs for the surveillance
and prevention of HIV and other STD’s. The agency also helps eligible
participants pay for prescriptions under the AIDS Drug Assistance Program.
Immunization Service: Immunizations help to reduce and eliminate morbidity
and mortality caused by vaccine preventable diseases by supplying public and
private health care providers with childhood and adult vaccines, and by
performing immunization quality improvement assessments at schools, public
and private clinics and child care centers.
Emergency Preparedness and Response Service: This program is intended to
plan, prepare and respond to a public health disaster or adverse event using an all-
hazards approach. It involves coordination with all agencies and entities that
would be involved in a response including hospitals, state, local, and city, public,
private and military groups. Activities include assessment, planning, exercises,
detection, education, enhanced disease surveillance and a rapid notification
system.
Protective Health Services OSDH has responsibility for a wide range of regulatory services in areas that
affect the health of citizens. Regulatory responsibilities include enforcing laws
and rules, performing routine inspections, investigating complaints, and issuing,
renewing and revoking licenses. The majority of expenditures for this division
come from licensure fees, trauma disbursements and Federal Medicaid and
Medicare funds which help support health and medical facility inspections
conducted by OSDH employees.

State Department of Health
Oklahoma Senate Overview of State Issues 137
Long-Term Care Service: Long Term Care Service oversees the health and
safety of residents living in licensed long-term care facilities. Long-term care
facilities include nursing homes, skilled nursing facilities, residential care homes,
assisted living centers, continuum of care homes and Intermediate Care Facilities
for individuals who are Intellectually Disabled.
Medical Facilities Service: Medical Facilities Service is comprised of three main
programs; Medical Facilities, Trauma and Emergency Medical Services. The
Medical Facilities program licenses and certifies health care facilities in
accordance with State and Federal Laws. It has responsibility for inspection,
licensure and Medicare certification of all non-long term care medical facilities in
Oklahoma. The Emergency Medical Services develops rules for administering
emergency response systems in the state and performs other functions such as;
developing a comprehensive plan for EMS development, EMS testing and
licensure and collection of statewide EMS data. The Trauma program is
responsible for facilitating and coordinating a multidisciplinary system response
to severely injured patients in Oklahoma. The Trauma system continuum of care
includes; EMS field intervention, emergency department care, surgical
interventions, intensive and general surgical in-hospital care, rehabilitation
services and support groups to enable both the patient and their family to return to
society at the most productive level possible.
Injury Prevention Service: Injuries are the third leading cause of death in
Oklahoma and the leading cause of death among children and young adults 1–44
years of age. Many, if not most, of these injuries are preventable. The mission of
this service is to improve the health of Oklahomans by working in collaboration
with communities and stakeholders to identify injury problems, then develop,
implement and evaluate environmental modifications and educational
interventions. Some of the successful focus areas have been car seat safety, fire
safety, and prevention of traumatic spinal cord injuries.
Consumer Health Service: This service has four programs. The Consumer
Protection program is responsible for licensing, monitoring and inspecting hotels
and motels, eating and drinking establishments, retail and wholesale food outlets,
food manufacturers, public bathing places and all sources of ionizing radiation.
The Occupational Licensing program protects life and property by licensing and
inspecting the alarm and locksmith industry, barbers, hearing aid dealers, home
inspectors and sanitarians. The Professional Counselor Licensing program
promotes and enforces laws and regulations which govern the practices of
Licensed Professional Counselors, Licensed Marital and Family Therapists,
Licensed Behavioral Practitioners and Licensed Genetic Counselors.
Health Resources Development Service: This service performs health
protection and public assurance functions in the following program areas: Health
Facility Systems, Managed Care Systems, Nurse Aide and Non-Technical
Services Workers Registry, Home Care Administrator Registry and Jail
Inspections.

State Department of Health
138 Oklahoma Senate Overview of State Issues
Quality Improvement and Evaluation Service: The Quality Improvement and
Evaluation Service is responsible for coordinating activities and database
functions that fall under the umbrella of the national QualityNet System
developed by the Centers for Medicare and Medicaid Services. Data is collected
from many of the facilities overseen by Long-Term Care Service and Medical
Facilities Service. The collected data is used by researchers studying trends in
health care and as a mechanism for Medicaid and Medicare reimbursements.
Health Improvement Services Health Improvement Services focuses on the leading causes of death
(cardiovascular disease and cancer) and provides a range of programs to prevent
disease, disability or premature death. This includes working directly with
communities, schools and businesses; programs aimed at specific populations
suffering health disparities; and efforts to transform healthcare to improve
outcomes, quality and cost. As OSDH is an outcome driven organization, Health
Improvement Services assesses the health of the population, collects data on
healthcare quality and costs, and makes data available to public health and
healthcare practitioners, health serving entities, stakeholders and the public. This
area also records and provides vital records (birth and death certificates) to the
public.
Partnerships for Health Improvements: : Focuses primarily on improving
health of disparate populations and developing partnerships to improve the health
of all Oklahomans by bringing coalitions and multi-sectorial groups together to
solve complex health problems.
Center for Health Statistics: Provides enterprise-level support for public health
programs through data collection, analytics, dissemination, quality assurance,
governance, privacy and security. The Center for Health Statistics includes two
divisions: Health Care Information and Public Health Informatics. The Health
Care Information division is responsible for ongoing analysis and evaluation of
patterns and trends in the health status of Oklahomans, the utilization and costs of
health care services, and the capability of the various components of the health
care industry to provide needed services. The Public Health Informatics division
is responsible for promoting and practicing the science of informatics through
standard data and information practices, governance and administration of
enterprise information systems.
Public Health Informatics: Responsible for internal and external
communications through three key functions: media relations, electronic
communications, and written publications.
Center for the Advancement of Wellness: Focuses on state level
interventions/partnerships to reduce tobacco use and obesity. This includes
providing technical assistance to local communities and other partners,
conducting health promotion, supporting cessation programs, and providing

State Department of Health
Oklahoma Senate Overview of State Issues 139
health education. These efforts are coordinated closely with the Tobacco
Settlement Endowment Trust and Tribal partners across the state.
Center for Health Innovation & Effectiveness: Conducts planning and
implements coordinated initiatives with healthcare systems to improve
population health, increase healthcare quality and create efficiencies in the
healthcare. Collects data and assess and healthcare workforce and plans for
improved access to care.
Vital Records: Responsible for registering every birth and death which occurs in
the state as well as preserving, amending and issuing certified copies of those
records in accordance with state law.


Oklahoma Senate Overview of State Issues 141
MEDICAID
Medicaid, also known as Title XIX of the federal Social Security Act, is the
primary mechanism for financing health care for low-income Americans. Unlike
Medicare, which targets the elderly and is 100 percent federally funded,
Medicaid is administered by state governments within certain guidelines set by
the federal government.
Federal law requires every state to designate a single agency to administer its
Medicaid program. Since 1993, the Oklahoma Health Care Authority (OHCA)
has been the designated agency in Oklahoma. Prior to that time, the Medicaid
program was administered by the Department of Human Services (OKDHS).
OHCA contracts with DHS to determine if certain individuals qualify for
SoonerCare. Individuals who are disabled, aged, in custody, qualified for cash
assistance or receive State supplemental payment are processed and approved or
denied by OKDHS. Applications and renewals for these programs are reviewed
by each OKDHS county office for financial and/or medical qualifications. Once
an individual meets the qualifications and completes the enrollment process, his
or her records are sent to OHCA to coordinate medical benefits and make
payments for services. All other applicants are processed through the Online
Enrollment System.
FINANCING
Medicaid is funded through a federal-state partnership. The federal share of the
program, also known as the federal medical assistance percentage (FMAP),
varies by state in inverse relation to a state's per capita income. For most
services, Oklahoma’s FMAP for FFY’16 was 60.99%. On average, for every one
state dollar that Oklahoma Medicaid spends, Oklahoma receives $1.60 in federal
money. (The federal match for administrative expenses ranges from 50 percent
to 90 percent, while some program expenditures are also eligible for matching
rates of approximately 79 percent to 100 percent.)

Medicaid
142 Oklahoma Senate Overview of State Issues
In FY’16, the state share appropriated to the Oklahoma Health Care Authority
was $907 million. Total program dollar expenditures were estimated to be in
excess of $5.12 billion.
Total Medicaid Expenditures FY’03 Through FY’16
While OHCA is the main beneficiary of state appropriations for Medicaid, other
state agencies (such as the Department of Human Services, the State Department
of Health, Department of Education and Department of Mental Health and
Substance Abuse Services, the Office of Juvenile Affairs and the University
Hospitals Authority, OU and OSU) pay the state match for various services and
programs that are covered by Medicaid. Medicaid is also partly funded by fees
on hospitals, long-term care facilities and rebates from drug manufacturers.
MEDICAID ELIGIBILITY
Medicaid eligibility is determined by OKDHS and the Online Enrollment
program based on standards set by the state and federal government. Individuals
are determined to be Medicaid-eligible for one year periods.
Covering the Uninsured In general, Medicaid covers low-income mothers and children, the elderly, and
people with disabilities. Most non-disabled working-age adults are ineligible for
Medicaid, even if their income falls considerably below the federal poverty level.
Medicaid enrolled over 1 million Oklahomans throughout FY’16.

Medicaid
Oklahoma Senate Overview of State Issues 143
Children make up 58 percent of Oklahoma's Medicaid population while the aged,
blind and disabled account for about 16.9 percent of the population. Enrollment
patterns in the Medicaid program, however, do not correspond with expenditure
breakdowns. Nationally, only 20 percent of Medicaid program dollars are spent
on children, compared to 62 percent that is spent to provide services for the aged,
blind and disabled populations. This discrepancy reflects the fact that the aged,
blind and disabled are more likely to suffer from chronic health problems which
may require ongoing medical assistance, episodes of acute care, and eventually
long term care.
Medicaid Members and Expenditures Fiscal Year 2016
TANF/AFDC 70.03% TANF/AFDC 35.56%
Aged, Blind and Disabled 16.17% Aged, Blind and Disabled 45.99%
Other 13.80% Other 18.45%
Percentage of Recipients Percentage of Expenditures
Low-Income Pregnant Women and Children While most healthy adults are ineligible for Medicaid, the past decade has seen a
concerted effort by Congress and the states to improve the health of children and
pregnant women. In Oklahoma, children under the age of 19 are covered up to
185 percent of FPL. Pregnant women are also covered up to 185 percent of FPL.
Under HB 2842, passed during the 2nd
Session of the 50th
Legislature (2006),
college students up to age 23 who are full-time students are covered, provided
they meet eligibility requirements. In 1994, 14.2 percent of children nationally
and 20.6 percent of Oklahoma children lacked health insurance. Among low-
income children, the percentage without insurance was even higher. During the
early 1990s, Congress mandated a phased-in expansion of Medicaid coverage for
low-income children and pregnant women. This effort was superseded in
Oklahoma by the passage of SB 639 (1997) and the state’s Children’s Health
Insurance Plan.
Concurrent with Oklahoma’s initiative, the Federal government announced a $24
billion new program known as CHIP (Children’s Health Initiative Plan) to
encourage and assist states in insuring low-income children. The program
provided enhanced federal matching funds to insure uninsured children up to 185
percent of the federal poverty level through the CHIP program. Oklahoma is
currently receiving an enhanced federal match of 95.7 percent for the Medicaid
costs of children, in the State Children’s Health Insurance Program. SB 639
expanded Medicaid coverage to children and pregnant women with income
below 185% of FPL that didn’t qualify for Medicaid because of other reasons
such as being covered by other health insurance.

Medicaid
144 Oklahoma Senate Overview of State Issues
Recipients of Supplemental Security Income (SSI) SSI is a federal cash assistance program for persons who are 65 years of age,
blind or disabled and poor, known as ABD. As of August 2016, there were
138,343 adult and 16,254 children ABD members.
Medicaid Payments for Medicare Premiums Under 1988 federal legislation, states are required to pay Medicare premiums,
deductibles and coinsurance for needy elderly and disabled persons who are
dually eligible for Medicare and Medicaid. This group is known as Qualified
Medicare Beneficiaries (QMBs). The payments are cost-effective from the state's
standpoint because it is less expensive to pay such out-of-pocket expenses for
Medicare eligibles than it is to have them lose their Medicare benefits and fall
into Medicaid eligibility. As of August 2016, there were 112,537 dual enrollees.
Growth in Enrollment The Medicaid program is designed to be counter cyclical with the economy. For
every one percentage point increase in unemployment that occurs, Medicaid
enrollment can be expected to increase by 2.7 percent. Enrollment in the
Medicaid program began to increase dramatically after the events of September
11, 2001, and the national recession that followed. Oklahoma surpassed one
million enrollees in FY’12.
Enrollment has increased every year since FY’03 except for a brief drop off
before the oil industry decline in FY’15.
Average Growth in Enrollment
FY’03 Through FY’16

Medicaid
Oklahoma Senate Overview of State Issues 145
MEDICAID AND MANAGED CARE
Prior to January 1, 2004 OHCA operated two separate forms of managed care –
SoonerCare Plus and SoonerCare Choice. Under the SoonerCare Plus program
OHCA contracted directly with Health Maintenance Organizations (HMOs) to
provide medically necessary services to beneficiaries residing in Oklahoma City,
Tulsa, Lawton and the counties immediately surrounding these urban centers. In
November of 2003, news of increased health care costs and a decision by a HMO
to pull out of the state Medicaid program prompted the Oklahoma Health Care
Authority board to approve a proposal to end its HMO contracts and expand the
state’s other managed care system, SoonerCare Choice. All members from
SoonerCare Plus were transitioned to SoonerCare Choice in January 2004. The
entire Medicaid program is now referred to as SoonerCare.
In January 2009, the Patient-Centered Medical Home delivery system was
implemented for SoonerCare Choice members.
These members have a medical home that provides basic health care, an
information hub and more integrated services. SoonerCare Choice primary care
providers are paid a monthly case management/care coordination fee. Visit-based
services remain compensable on a fee-for-service basis.
Members enrolled in SoonerCare Choice are not “locked in” with a primary care
provider/case manager (PCP/CM) and can change health care providers as
necessary. This important facet to the program allows SoonerCare Choice
members the opportunity to select a provider that has been added to the program.
Providers contracting in this program include Advanced Registered Nurse
Practitioners, Family Practitioners, General Pediatricians, Internists, and
Physician Assistants. Medical Home Providers receive a care coordination fee,
visit-based fee-for-service payment and performance-based payments to
providers meeting the quality of care targets (SoonerExcel).
Some member groups do not qualify to participate in SoonerCare Choice.
Persons eligible for Oklahoma Medicaid who are institutionalized, dual eligible,
in state or tribal custody or enrolled under a Home and Community-Based
Waiver are not included in the SoonerCare Choice program at this time. Most of
these members receive services under the fee-for-service delivery model,
SoonerCare Traditional
In 2015, HB 1566 was passed and required the Health Care Authority to develop
a Request For Proposal (RFP) for a care coordination model for the Aged, Blind
and Disabled population. The intent of the bill was to deliver better access to
care, improve health outcomes and control costs of the ABD population. As of
August 2016, the RFP has been sent to Center for Medicare and Medicaid
Services for approval. If approved the program will be called SoonerHealth+.

Medicaid
146 Oklahoma Senate Overview of State Issues
SERVICES PROVIDED BY MEDICAID
Unlike Medicare, which charges its recipients monthly premiums and includes
co-pays and deductibles, Medicaid is a system of essentially free health insurance
coverage for qualifying members. However, Medicaid involves some cost to
members: providers can charge co-payments for certain services and nursing
home residents must “spend down” their own resources to a certain level before
Medicaid begins paying their bills.
What Services are Covered? Federally Mandated ServicesEarly/Periodic Screening Diagnosis & Case Management Optometrist
Treatment (EPSDT) Under Age 21 Chiropractor Personal Care
Family Planning Services & Supplies Clinic Physical Therapy
Federally Qualified Health Center Services Dental Podiatrist
Freestanding Birth Center Services (Adult Emergency Extractions) Prescribed Drugs
Inpatient Hospital Diagnostic Services Preventive Services
Laboratory & X-ray Emergency Hospital Private Duty Nursing
Non-emergency Transportation Eyeglasses Prosthetic Devices
Nurse Midwife Health Homes for Enrollees with Chronic Conditions Psychologist
Nurse Practitioner Inpatient Hospital for Age 65+ in Rehabilitative
Nursing Facility/Home Health for Institutions for Mental Diseases Respiratory Care
Age 21+ Inpatient Psychiatric under age 21 Screening Services
Outpatient Hospital ICF/MR Speech/Hearing/Language Disorders
Physician Nurse Anesthetist TB Related
Rural Health Clinic Nursing Facility under age 21
Tobacco Cessation Counseling for Pregnant Women Occupational Therapy
Optional Covered Services
Hospital services followed by physician and nursing facility expenditures,
account for more than $1.7 billion of the $5.01 billion Medicaid program.
Long-Term Care Medicaid is the nation’s primary insurer of long-term health care services for
individuals with chronic, non-acute needs. In fact, more than 67 percent of all
residents in Oklahoma nursing homes are Medicaid members. Long-term care
services range from personal care, rehabilitative therapies, chore services, and
home-delivered meals to durable medical equipment and environmental
modification. With the graying of the baby-boom generation and advances in
medical technology contributing to a rapidly expanding senior population,
providing adequate and affordable long-term care will be one of the great
challenges confronting state and federal policy makers in the new century.
Medicaid payments for long-term care fall into two general categories:
Institutional Care: This includes such facilities as nursing homes, Intermediate
Care Facilities for the Intellectually Disabled (ICF/ID), or state hospitals for the
intellectually disabled. The state pays private institutional providers a per diem
to cover the full range of patients’ needs, including room and board. Part of the
revenue for nursing homes and ICF/ID payments is raised by daily per-bed fees
imposed on all licensed facilities, which are matched with federal funds.

Medicaid
Oklahoma Senate Overview of State Issues 147
Home-and Community-Based Programs: Through several Medicaid waivers
administered by OKDHS and three by OHCA, the state contracts with private
agencies to provide needed services set out in an individual care plan. The
largest waiver programs are the Home-and-Community Waiver for the
developmentally disabled and the ADvantage Waiver for the aged and disabled.
All 50 states have developed waivers as a way to allow those who do not need
24-hour nursing care to live fuller, more independent lives outside of
institutions.
Eligibility for Medicaid long-term care services is based on a combination of
medical and financial criteria. Medically, individuals must be certified as
needing a “nursing home level of care” to qualify either for institutional
placement or participation in one of the long-term care waivers. Financially,
Medicaid members’ incomes must be below 300 percent of the SSI eligibility
threshold, which translates to monthly income of roughly $2,199 per person and
$2,000 in non-exempted assets. There is no additional threshold for members
who have Income Pension trusts. That threshold is $4,400 a month.
Premium Assistance Program: In January 2006, the Oklahoma Health Care
Authority (OHCA) started enrolling businesses and individuals into the Insure
Oklahoma program. The first component of the Insure Oklahoma program is
designed to assist Oklahoma small business owners (with 250 or fewer
employees) in purchasing health insurance on the private market for their income
eligible employees (at or below 100 percent of Federal Poverty Level). As of
August 2016, the program had 3,911 businesses and 14,616 employees. A
second component to the Insure Oklahoma program is the Individual Plan. The
Individual Plan is designed as a safety net for those Oklahoma individuals who
cannot access private, group health insurance coverage. Those who may qualify
for this plan include workers whose employer does not offer health insurance and
workers who are ineligible for their employer’s insurance plan. The individual
component of the Insure Oklahoma program began enrollment in March 2007.
As of August 2016, the program had covered 19,102 uninsured Oklahomans.
Funding for this program is generated from the Tobacco Tax approved by the
voters in 2004 (State Question 713). Since 2014, Oklahoma has received waivers
from the federal government to keep operating Insure Oklahoma. Some changes
that have been required to keep Insure Oklahoma operating include decreasing
the Individual Plan from 200% Federal Poverty level to 100% Federal Poverty
level. The Employer Sponsored Insurance Plan has increased business size from
200 employees to 250 or fewer employees.

Medicaid
148 Oklahoma Senate Overview of State Issues
Statewide Medicaid Information
Oklahoma
Population Unduplicated Population
Est. July SoonerCare Enrolled in SFY 2015
County 2014* Enrollees** SoonerCare Expenditures
ADAIR 22,186 10,348 47% $37,225,272.71
ALFALFA 5,790 1,050 18% $3,913,723.13
ATOKA 13,796 4,202 30% $18,671,478.54
BEAVER 5,486 875 16% $1,828,398.50
BECKHAM 23,691 5,879 25% $23,959,011.42
BLAINE 9,917 3,137 32% $10,863,937.29
BRYAN 44,486 14,381 32% $52,362,486.70
CADDO 29,317 9,988 34% $32,922,831.23
CANADIAN 129,582 19,885 15% $74,772,295.09
CARTER 48,821 15,384 32% $65,088,750.41
CHEROKEE 48,341 14,214 29% $65,720,654.39
CHOCTAW 15,161 6,288 41% $27,322,803.75
CIMARRON 2,294 629 27% $1,078,426.74
CLEVELAND 269,908 44,486 16% $167,892,223.41
COAL 5,807 1,908 33% $10,712,564.26
COMANCHE 125,033 30,162 24% $94,141,501.07
COTTON 6,150 1,636 27% $5,329,102.32
CRAIG 14,582 4,788 33% $28,715,049.08
CREEK 70,632 20,326 29% $90,357,626.23
CUSTER 29,500 6,925 23% $25,319,645.22
DELAWARE 41,446 11,927 29% $45,415,686.91
DEWEY 4,914 975 20% $3,475,851.76
ELLIS 4,150 664 16% $1,850,329.54
GARFIELD 63,091 16,748 27% $84,418,646.70
GARVIN 27,561 8,426 31% $40,411,622.54
GRADY 53,854 11,424 21% $45,314,135.28
GRANT 4,501 998 22% $5,006,830.66
GREER 6,151 1,718 28% $7,117,870.66
HARMON 2,798 943 34% $4,046,774.14
HARPER 3,812 788 21% $2,447,665.87
HASKELL 12,896 4,705 36% $20,321,638.93
HUGHES 13,806 4,445 32% $22,879,037.24
JACKSON 25,998 7,045 27% $23,969,607.87
JEFFERSON 6,292 2,303 37% $6,924,500.83
JOHNSTON 11,103 3,822 34% $17,481,501.89
KAY 45,478 15,442 34% $52,827,292.47

Medicaid
Oklahoma Senate Overview of State Issues 149
Oklahoma
Population Unduplicated Population
Est. July SoonerCare Enrolled in SFY 2015
County 2014* Enrollees** SoonerCare Expenditures
KINGFISHER 15,532 3,280 21% $11,660,914.48
KIOWA 9,336 3,067 33% $12,954,384.54
LATIMER 10,693 3,515 33% $13,301,640.09
LEFLORE 49,761 17,443 35% $73,490,037.71
LINCOLN 34,619 9,047 26% $32,733,089.20
LOGAN 45,276 8,163 18% $38,901,900.88
LOVE 9,773 2,747 28% $8,410,684.56
MCCLAIN 37,313 7,993 21% $28,648,817.68
MCCURTAIN 33,050 13,805 42% $53,317,533.54
MCINTOSH 20,088 6,356 32% $33,759,865.74
MAJOR 7,750 1,616 21% $5,426,272.23
MARSHALL 16,182 5,076 31% $19,700,473.43
MAYES 40,816 12,220 30% $53,957,094.05
MURRAY 13,803 3,632 26% $16,813,746.38
MUSKOGEE 69,966 24,255 35% $114,943,325.96
NOBLE 11,494 2,796 24% $14,279,220.20
NOWATA 10,524 2,872 27% $12,260,119.87
OKFUSKEE 12,186 4,241 35% $26,739,532.31
OKLAHOMA 766,215 206,727 27% $799,300,417.29
OKMULGEE 39,095 13,221 34% $64,135,116.08
OSAGE 47,981 6,601 14% $32,244,938.01
OTTAWA 32,105 12,536 39% $47,497,753.01
PAWNEE 16,401 4,822 29% $21,056,117.13
PAYNE 80,264 15,049 19% $59,176,497.21
PITTSBURG 44,626 13,009 29% $61,061,594.56
PONTOTOC 38,005 10,722 28% $63,057,180.00
POTTAWATOMIE 71,811 22,310 31% $92,198,361.24
PUSHMATAHA 11,125 4,142 37% $18,662,039.70
ROGER MILLS 3,761 697 19% $1,533,016.76
ROGERS 89,815 17,414 19% $74,171,249.90
SEMINOLE 25,421 9,255 36% $44,137,443.37
SEQUOYAH 41,358 15,519 38% $64,476,558.30
STEPHENS 44,493 11,985 27% $43,779,469.34
TEXAS 21,853 5,589 26% $9,648,093.19
TILLMAN 7,628 2,659 35% $9,463,598.89
TULSA 629,598 163,787 26% $623,629,389.86

Medicaid
150 Oklahoma Senate Overview of State Issues
Oklahoma
Population Unduplicated Population
Est. July SoonerCare Enrolled in SFY 2015
County 2014* Enrollees** SoonerCare Expenditures
WAGONER 75,702 14,232 19% $47,213,697.25
WASHINGTON 51,937 11,850 23% $49,169,122.45
WASHITA 11,547 2,734 24% $11,239,757.96
WOODS 9,288 1,545 17% $5,895,120.69
WOODWARD 21,529 4,821 22% $15,558,460.06
Out of State 5,525 $21,208,302.60
OTHER⁂ 3,620 $1,065,953,465.86
Total 3,878,051 1,021,359 26% $5,138,872,188.34
*Source: Population Division, U.S. Census Bureau. Estimates rounded to nearest
100. American Fast Fact FInder PEPANNRES table using the advanced search
options. **Enrollees listed above are the unduplicated count per last county on
the enrollee record for the entire state fiscal year (July-June).
‡Garfield and Garvin counties have public institutions and Okfuskee and Craig
counties have private institutions for the intellectually disabled causing the
average dollars per SoonerCare enrollee to be higher than the norm.
◊ Non-member specific payments include $352,893,974 in Supplemental
Hospital Offset Payment Program (SHOPP) payments; $228,621,903 in Hospital
Supplemental payments; $131,025,519 in Medicare Part A & B (Buy-In)
payments; $77,694,210 in Medicare Part D (clawback) payments; $93,666,695 in
GME payments to medical schools; $50,107,558 in Insure Oklahoma ESI
premiums; $688,863 in Insure Oklahoma Out-Of Pocket payments; $38,517,566
in EHR incentive payments; $40,133,334 in Outpatient Behavioral Health
Supplemental payments; $3,623,655 in SoonerExcel payments; $3,885,990 in
Health Access Network payments and -$1,455,659 in non-member specific
provider adjustments. Additionally, “Other” includes $17,512,634 paid on behalf
of custody children within the State Office county code.

Oklahoma Senate Overview of State Issues 151
MENTAL HEALTH AND SUBSTANCE ABUSE
Perhaps no state government function has experienced such a profound change in
its mission over the past 50 years than in the areas of mental health and substance
abuse services. From its crude beginnings, the state mental health system has
shifted paradigms. Hospitalization is now considered a temporary service for all
but a few clients. Most mental health services are now provided in the
community. Advances over the past several years have made recovery a reality
for thousands of Oklahomans.
BACKGROUND ON MENTAL HEALTH CHANGES
Until the mid-1960s, the primary means to treat mental illness was
institutionalization in large state hospitals. On an average day in 1960, nearly
6,400 Oklahomans were in the state's mental hospitals. In the mid-1970s, the
concept of "deinstitutionalization" prompted states to increase efforts to utilize
outpatient services through Community Mental Health Centers. This approach
has proven to be an effective means of recovery and a less costly method to
provide services as compared to long-term inpatient care in a hospital setting.
The department served 195,000 in FY 2016. This includes mental health and
substance abuse inpatient/residential services, outpatient care and targeted
community based services, prevention efforts and educational initiatives. These
services are delivered through a statewide network that includes some state-
operated services. The majority of services, however, are delivered through
private providers at the community level. This includes over 300 contracted
providers, along with 825 behavioral health Medicaid agency and independent
providers.
Much of the department’s recent success can be attributed to an understanding
that when left untreated, mental illness and substance abuse are a leading cause
of disability and premature loss of life. The fiscal and economic impact of
untreated, under-treated and unserved mental illness and substance abuse on
Oklahoma is estimated to be $8 billion.

Mental Health and Substance Abuse
152 Oklahoma Senate Overview of State Issues
ODMHSAS OVERVIEW
The Oklahoma Department of Mental Health and Substance Abuse Services is
responsible for providing services to Oklahomans who are affected by mental
illness and substance abuse.
The state subsidizes services for clients with incomes below 200 percent of the
federal poverty level and receives reimbursement for some services for clients
who are eligible for the Medicaid program.
Funding Sources ODMHSAS is primarily state funded (72 percent according to the FY’16 BWP). Federal funding from various sources comprises the majority of the rest of the
budget. Medicaid is the most important non-appropriated funding source for
individual client services. Federal block grants and other grant funding account
for approximately 11 percent of the budget.
DMHSAS Budget by Source, FY’16 BWP Total = $438,496,601

Mental Health and Substance Abuse
Oklahoma Senate Overview of State Issues 153
Program Budgets Of all persons served in FY’16, approximately 80% received mental health
services and 20% received substance abuse services. Outpatient community
based treatment providers accounted for 69 percent of the budget and served the
majority of clients. Community mental health centers accounted for 9 percent of
the budget, and inpatient or hospital facilities represented approximately 15
percent of the total budget. Substance abuse services represent approximately 16
percent community based services. Administrative costs constituted
approximately 3 percent of the budget.
ODMHSAS Budget by Program, FY’16 BWP Total = $438,496,601
PROGRAM OVERVIEW
The demand for public mental health services exceeds the capacity of the current
treatment system. This has always been the case, but has been exacerbated in
recent years due to a growing public awareness of mental illness and of the
existence of effective treatment; rising healthcare costs; the state’s growing
substance abuse problem and resultant psychotic behavior, along with the state’s
alcohol and prescription drug abuse problem.

Mental Health and Substance Abuse
154 Oklahoma Senate Overview of State Issues
Through the use of proven practices and expansion of community based services,
the department will increase the effectiveness of services and continue to
improve the efficiency of the delivery system. The department’s goal is to ensure
access to appropriate care for all Oklahomans and the recovery of all served.
Mental Health Services One out of four adults will have one or more episodes of mental illness during
their lifetime. People with mental illness are 10 times more likely than the
general population to take their own lives.
For those who survive the illness, other health problems threaten their quality of
life. Persons with mental illness are at significantly increased risk for diabetes,
heart disease, obesity, and associated organ failure. At the same time, people with
medical conditions such as diabetes and heart disease are at increased risk for
mental illness; the combination of the two can be deadly.
The Oklahoma Department of Mental Health and Substance Abuse Services
follows a tiered delivery of services designed to serve the most severely ill first.
This approach is based on key principles that stress the following:
Crisis intervention will be available to all in need. Longer-term services will
be targeted to those most in need.
A thorough face-to-face evaluation of the need for mental health services
will be conducted for anyone meeting financial need criteria.
Persons meeting defined diagnostic criteria will receive services on a timely
basis, within uniformly defined time frames.
Continuity of care between inpatient and outpatient providers will be
emphasized.
Needs are prioritized and resources carefully directed to ensure a standard of
excellence for services that are delivered.
Programs for Assertive Community Treatment (PACT) The Program of Assertive Community Treatment (PACT) is an effective,
evidence-based service delivery model providing intensive, outreach-oriented
mental health services to people with schizophrenia, bi-polar disease and other
serious and persistent mental illnesses. Using a 24 hours-a-day, seven days-a-
week team approach, PACT delivers comprehensive community treatment,
rehabilitation and support services to consumers in their homes, at work and in
community settings.

Mental Health and Substance Abuse
Oklahoma Senate Overview of State Issues 155
Building community supports such as PACT and other non-traditional programs
of care allows an individual, who otherwise may be subjected to multiple hospital
visits, or jail, the ability to address the demands of their illness while remaining
in the community. The program is intended to assist clients with basic needs,
increase compliance with medication regimens, address any co-occurring
substance abuse, help clients train for and find employment, and improve their
ability to live with independence and dignity. PACT was implemented in Tulsa
and Oklahoma City in May of 2001 with $2 million provided by the state
legislature. Currently, there are 12 PACT teams statewide.
With PACT assistance, comparing pre-PACT with post-PACT:
The number of days in inpatient care decreased by 71 percent
The number of days in jail decreased by 93.5 percent
Systems of Care (SOC) The Oklahoma Systems of Care Program – which began in only two
communities in 1999 – now nearly covers the state (73 counties) and serves
nearly 5,000 youth. Youth in OKSOC show decreases in school suspensions and
detentions, decreases in contacts with law enforcement, decreases in self-harm
and suicide attempts, decreases in problem behaviors and clinically significant
improvement in functioning. Over 70% of the youth who came into SOC
between FY’13-FY’15, who were diagnosed as “clinically impaired,” showed
significant improvement six months later.
There is a tremendous need to expand children’s services throughout the state
and programs such as Systems of Care, which cut through red tape and focus
attention on the needs of the children and their families to provide the appropriate
level of services. It is targeted to impact children, ages 6-18 years, with serious
emotional and behavioral problems at home, school and in the community, and, it
has been proven as a model system.
Mental Health Courts Mental health court is a highly structured, court-based program providing a
treatment alternative for non-violent offenders diagnosed with a mental illness.
Court structure and processes are designed to identify and address the unique
needs of a non-violent person who has come in contact with the criminal justice
system because of his or her mental illness. Mental health courts currently exist
in 16 counties, with approximately 600 active participants. An additional 17
counties have requested assistance to start mental health courts.

Mental Health and Substance Abuse
156 Oklahoma Senate Overview of State Issues
Community Mental Health Centers (CMHC) One of the major challenges currently facing the department is appropriate
funding for community mental health centers, so that they may address
community needs. Despite this struggle, the CMHCs continue to provide core
services such as medications, counseling, and case management that help many
people with mental illness live a life in the community. In addition to core
services, most CMHCs are able to offer best practice, evidence-based services,
albeit on a limited basis.
Medications More effective medications for people suffering from schizophrenia, severe
depression, and bipolar disorder have enabled many more clients to lead normal,
healthy lives in their communities. These “new generation” medications have
improved quality of life for many people and have the potential to decrease
hospitalization costs for states. It is important to provide appropriate medications
on a consistent basis for all clients. Otherwise, persons with mental illness are
stabilized in hospitals with medications, discharged, then either cannot or do not
continue to take prescribed medications. Their condition deteriorates until law
enforcement or loved-ones intervene, then they are re-admitted to a hospital.
Forensic Services ODMHSAS is responsible for providing several forensic services: evaluating
people charged with a crime that are believed to suffer from mental illness,
treating defendants with mental illness who are waiting for trial, but are not
competent to proceed because of their mental illness, and hospital-based
treatment for persons adjudicated as Not Guilty by Reason of Insanity (NGRI).
The Oklahoma Forensic Center (OFC) in Vinita has a census (capacity) of 200.
SUBSTANCE ABUSE SERVICES
According to national prevalence studies, 12 percent of adult Oklahomans have a
substance use disorder. Approximately 39,000 Oklahomans received substance
abuse services through the ODMHSAS network in FY’16. Access to treatment
services – through community-based substance abuse treatment programs, drug
courts, support groups, and the encouragement of family and friends – help
thousands of Oklahomans each year find the road to recovery.
The benefits of treatment accrue not only to individuals and their friends and
families, but to society as well. Research shows that, a year after treatment, drug
use was reduced by 50 percent, criminal activity dropped by 80 percent,
employment increased, and homelessness and dependence on public assistance
decreased. For every dollar spent on treatment, nearly $7 is saved in reduced
crime-related costs, a figure that rises to $12 when health-care costs are included.

Mental Health and Substance Abuse
Oklahoma Senate Overview of State Issues 157
The department provides a range of evidence-based outpatient, residential and
aftercare services (primarily through community-based contractors). Programs
offered are based upon the needs of the individual. In addition, substance abuse
treatment is available at community mental health centers. ODMHSAS also
funds a network of 17 Area Prevention Resource Centers offering substance
abuse prevention education and community prevention project development.
The top listed drugs of choice for clients FY’16 were as follows:
Methamphetamine 28.9 percent
Alcohol 27.3 percent
Marijuana 19.1 percent
Opiates 12.2 percent
Proven Substance Abuse Programs Are Making a
Difference in Oklahoma Evidence-based, “best” practices have emerged in substance abuse treatment and
are being implemented in the state, providing tools that result in a recovery for
many individuals previously considered untreatable; as evidenced by stable living
situations, employment, and reduced contact with the criminal justice system.
Drug Courts Coordinated through ODMHSAS, the drug court program couples the power of
the court system with the benefits of substance abuse treatment. The drug court’s
primary purpose is to redirect certain drug offenders into a highly structured,
judicially monitored treatment program rather than sending them to prison. Each
participant is evaluated and assisted by a drug court “team” that includes
representatives from the judicial, criminal justice, law enforcement and treatment
field. Violent offenders are not eligible for the program. Oklahoma has one of
the top drug court programs in the nation, with approximately 4,000 active
participants. In 1995, Oklahoma had one drug court. In FY’16, there were 58
drug courts (this includes adult drug and DUI courts, juvenile drug courts and
family drug courts) serving 73 counties across the state. The average cost of drug
court for one person is about $5,000 per year, compared with $19,000 or more
per year for prison. Drug courts are a highly successful alternative to
incarceration. Studies that measure the incarceration rates of released inmates
versus drug court graduates found that only 7.9 percent of drug court graduates
had been incarcerated compared with 23.4 percent of released inmates.

Mental Health and Substance Abuse
158 Oklahoma Senate Overview of State Issues
Substance Abuse Treatment for Adolescents, Women
and Their Children Pregnant women and women with dependent children are one of the department’s
top priorities. Gender-specific treatment programs offer comprehensive services
focusing on a number of areas. Individual and group counseling covers the
psychology of addiction, core values, spirituality, relationships, anger
management, 12-step recovery groups, family therapy, co-dependency, relapse
prevention and parenting skills, as well as a number of other healthy living-
related topics.
Clients work on receiving their high-school equivalency diplomas, and undergo
job testing and interviewing skills. Programs also have comprehensive services
for children ranging from infants who are born with drugs or alcohol in their
system to toddlers and children up to age 12.
DUI Program Oklahoma also has become one of a small but growing number of states that has
changed from an “offense-driven” DUI system to an “assessment-driven” DUI
system. In the past, DUI offenders had to attend either a 10- or 24-hour DUI
school, depending on whether the offense was the initial or a subsequent arrest.
This type of process is simple and easy to administer, but did not consider the
actual condition of the offender. Now, Oklahoma DUI offenders receive a
detailed assessment, followed by treatment recommendations assigned from a
grid containing five levels of intervention. The levels outlined in the intervention
grid are of increasing intensity and designed to match the indicated severity of
risk identified for the offender. These changes are intended to better identify the
relative risk level of the offender and offer the most appropriate level and type of
intervention.
Problem Gambling Service System Before 2005, no public funds were allocated to prevent and treat pathological and
problem gambling. In March, 2005, however, pursuant to the Oklahoma Horse
Racing State-Tribal Gaming Act, ODMHSAS began receiving monthly
installments, totaling $250,000 annually, to provide treatment and education
related to problem gambling. In May 2007, ODMHSAS received its first
quarterly installment pursuant to the Oklahoma Education Lottery Act, totaling
$500,000 annually. This funding is also targeted to prevention and treatment of
problem gambling. We received an additional $250,000 in lottery funds from the
Legislature in 2013, bringing that amount to $750,000 total. Combined with
funds received from the state tribal gaming compact, the department receives $1
million annually. This has been a good start, but is far short of the investment
needed to appropriately address problem gambling prevention and treatment in
Oklahoma.

Mental Health and Substance Abuse
Oklahoma Senate Overview of State Issues 159
Prevention Services ODMHSAS has a number of Prevention Services initiatives in place geared
toward preventing problems before they become larger and more costly to
society. Activities are designed to help communities prevent the onset and reduce
the progression of substance abuse, and problems/consequences associated with
substance abuse. Priority initiatives are directed toward preventing/reducing
underage drinking, nonmedical use of prescription drugs, adult binge drinking,
inhalant use, methamphetamine use, alcohol use during pregnancy, and
marijuana use. A new initiative is training first responders and law enforcement
officers in the use of naloxone, used to reverse heroin or opioid overdoses. To
date, several lives have been saved using this new prevention technique.
Additionally, ODMHSAS conducts a statewide suicide prevention initiative that
includes community-based training opportunities for schools, local businesses
and organizations; statewide awareness and outreach; planning and
implementation of targeted prevention efforts along with a variety of other
services targeting means to reduce the state’s high rates of suicide. The agency is
also working with hospital and primary care providers to expand opportunity for
early intervention.


HUMAN SERVICES
Department of Human Services
Juvenile Justice
Section Information Prepared By:
Anthony Sammons
Fiscal Analyst (405) 521-5696 [email protected]


Oklahoma Senate Overview of State Issues 163
DEPARTMENT OF HUMAN SERVICES
While the Oklahoma Department of Human Services (DHS) has experienced
many name and structural changes since the creation of the “Oklahoma
Department of Public Welfare” in 1936, its primary mission has remained largely
the same: to improve the quality of life of vulnerable Oklahomans by increasing
people’s ability to lead safer, healthier more independent and productive lives.
DHS was created in the Oklahoma state constitution. The agency’s governance
structure was dictated in the constitution requiring a governing board which
would later be referred to as the Commission for Human Services. This board
consisted of private citizen volunteers who were appointed in rotating years by
the Governor. For most of the agency’s existence, the Commission had the
responsibility of overseeing the agency and hiring/firing the agency’s director.
In 2012, Oklahoma voters passed State Question 765 which amended the state
constitution, abolished the Commission for Human Services, and made DHS an
executive level agency giving the Governor the authority to appoint the director
of the agency with senate confirmation.
Until 1983, the agency received direct funding from a dedicated two-percent state
sales tax, bypassing the annual legislative appropriations process. With a
guaranteed and growing revenue source, more and more functions were put under
DHS over the years as the state’s health and welfare system was developed.
Although DHS today is a much smaller agency than it was at its apex in the early
1990’s, it still has an annual operating budget of more than $2 billion in state and
federal funds. Because of the agency’s purpose, it is able bring in a high
percentage of federal matching dollars and federal block grants – approximately
$2.40 for every state dollar appropriated.

Department of Human Services
164 Oklahoma Senate Overview of State Issues
Beginning in the 1990s, lawmakers began to review the organization, and it was
determined that major divisions of DHS – the public teaching hospitals,
rehabilitative services, SoonerCare (Medicaid), and juvenile justice services –
could be managed more effectively if moved outside the umbrella of the very
large and varied agency.
DECENTRALIZATION
Since 1993, decentralization has significantly changed DHS. The Legislature has
transferred four large service divisions out of the agency and created three
separate state agencies and a private entity:
University Hospitals Authority (OU Teaching Hospitals)
Department of Rehabilitation Services
Oklahoma HealthCare Authority (SoonerCare)
Office of Juvenile Affairs
As a result, DHS’s appropriated budget decreased by more than half between FY
1994 and FY 1995.
Functions Separated from DHS Since 1993
Year Function Transferred Transferred Amount
1993 University Hospitals Authority $29,710,032
1993 Rehabilitation Services $21,952,152
1995 HealthCare Authority $227,816,716
1995 Office of Juvenile Affairs $75,959,840
Total $355,438,740
Note: The University Hospitals Authority is currently partnered with Columbia Health Care
Association, which provides management and operating services.
FUNDING
Approximately 71% of the $2.25 billion total budget in FY 2016 was provided by
Federal block grants, entitlement programs, and a small amount from
expenditures certified by other State Agencies.

Department of Human Services
Oklahoma Senate Overview of State Issues 165
Appropriations and Total Budget Comparison FY’07 through FY’16 (In Millions)
VERTICAL INTEGRATION
In response to legislation in 2012, DHS reorganized and vertically integrated
Child Welfare Services. The program and policy side of child welfare had
previously been separated from the field workers and supervisors in two different
divisions of DHS (Children and Family Services, and Field Operations). The
goal of the legislation and vertical integration was to create a system with clear
delineation of roles, effective lines of communication, and accountability
throughout the system. Vertical integration has allowed for more direct
communication between top level management and frontline child welfare staff.
Accountability for program integrity is now focused and fosters improved
employee and public confidence.

Department of Human Services
166 Oklahoma Senate Overview of State Issues
ORGANIZATION
The agency consists of six main divisions that oversee the following major
programs.
DHS PROGRAMS
AGING SERVICES
Area Agencies on Aging
Meal Programs for the Elderly
Adult Day Care
Personal Care Program
ADvantage Program
DEVELOPMENTAL DISABILITIES SERVICES
Family Support Assistance
Employment Programs
Sheltered Workshops
Home/Community-based Waiver Program
CHILD WELFARE SERVICES
Child Abuse/Neglect Reports, Investigations and Assessments
Emergency Shelters
Foster Home & Other Placement Resource Development & Support
Permanency Planning (Including Reunification & Adoption)
Adoption Assistance
Staff & Contractor Training & Technical Assistance
ADULT AND FAMILY SERVICES
State Supplemental Payment (SSP), Program for the Aged, Blind and Disabled
SoonerCare (Medicaid)
LIHEAP
Child Care Services
Supplemental Nutrition Assistance Program (SNAP)
Temporary Assistance for Needy Families (TANF)
ADULT PROTECTIVE SERVICES
CHILD SUPPORT SERVICES

Department of Human Services
Oklahoma Senate Overview of State Issues 167
Adult & Family Services (AFS) Adult & Family Services is responsible for a number of programs providing low-
income and disabled Oklahomans with cash payments, food benefits, child care,
LIHEAP, and SoonerCare.
State Supplemental Payment (SSP): The SSP Program provides a small
payment to eligible Oklahomans who are aged, blind or disabled. The number of
Oklahomans who receive SSP has increased by almost 17,000 since 2001.
Federal regulations require that Oklahoma expend the same amount in SSP
payments each year. In order to stay within the required spending level the
amount of the individual benefit is adjusted each year to account for the change
in the number of eligible recipients. Since 2004 the maximum individual benefit
has decreased from $50 to the current amount of $41 per month. All SSP
recipients now receive their payment on a debit card or by direct deposit. This
process is handled through the Financial Services Electronic Payments System
(EPS).
SoonerCare (Medicaid) Eligibility: In September 2010 the Oklahoma
HealthCare Authority began online eligibility determination for children, families
with children, and pregnant women through a web-based system called Online
Enrollment. DHS still enrolls people for SoonerCare at county offices and
retains responsibility for determining SoonerCare eligibility for the aged, blind,
and disabled populations, including nursing home care, waivered programs, and
the Medicare Savings programs (Qualified Medicare Beneficiary, Specified Low
Income Beneficiary, and Qualifying Individuals) eligibility.
The Low Income Home Energy Assistance Program (LIHEAP): The
program consists of four components: 1) Heating Assistance, where DHS
provides partial payment directly to the utility company/fuel provider for eligible
household heating bills, beginning in December of each year; 2) Crisis
Assistance, which is paid to the utility company/fuel provider through the Energy
Crisis Assistance Program (ECAP), beginning in March of each year –
applications for crisis assistance are accepted year round from those with life
threatening medical situations; 3) Summer Cooling assistance, where DHS
provides partial payment directly to the utility company for eligible household
cooling bills, beginning in July of each year; and 4) Weatherization Assistance,
where homeowners are assisted in making their homes more energy-efficient,
which is administered by the Oklahoma Department of Commerce with LIHEAP
funds allocated to them by DHS.
Historically, LIHEAP in Oklahoma has been funded solely with federal funds.
Oklahoma's LIHEAP income eligibility maximum was raised to 130 % of the
Federal Poverty Guideline in federal fiscal year (FFY) 2009 from 110 % in past
years to align with the Supplemental Nutrition Assistance Program (SNAP,
formerly the Food Stamp Program). Due to LIHEAP funding reductions, DHS
reduced the income guideline back to 110% FPG in FFY 2012. For FFY 2016,
87,770 households received heating assistance with an average payment of $81;

Department of Human Services
168 Oklahoma Senate Overview of State Issues
3,919 households received energy crisis assistance with an average benefit of
$224; and 78,335 households received summer cooling assistance with an
average benefit of $192.
Child Care Services (CCS): The CCS assures Oklahoma families have access to
licensed, affordable, high-quality child care where children have the opportunity
to develop to their fullest potential in a safe, healthy and nurturing environment.
The Oklahoma Child Care Facilities Licensing Act (10 O.S., § 401-410), enacted
in 1963, authorizes DHS to administer the licensing program. This responsibility
includes developing minimum requirements for child care facilities, revising
existing requirements, and implementing policies and procedures for the
licensing program. The foundation of quality child care is a strong licensing
program working closely with the Child Care Advisory Committee. CCS is
committed to working with providers to ensure licensing requirements are met
that safeguard the health and safety of children while in care. A well-trained
licensing staff and regular monitoring visits increase the likelihood of positive
outcomes in children’s physical, emotional and cognitive well-being.
The National Association of Child Care Resource & Referral Agencies
(NACCRRA) released a state report card comparing states on how well they
meet basic requirements needed to protect the health and safety of children in
care. Independent ranking by NACCRRA placed Oklahoma fourth overall in
center care and first in family child care home care. A key factor in Oklahoma’s
ranking is the fact that Licensing Specialists conduct three unannounced
inspections annually.
In FY 1998, DHS began using a tiered system for rating child care centers and
homes.
A (1 star) rating means the facility meets minimum licensure standards.
A + (1 star plus) rating, added in FY 2001, is available to facilities for a
24-month period. The expectation is that at the end of the 24-months the
facility will meet (2-star) requirements or revert back to the (1-star)
rate.
A (2 star) rating is given if the facility meets additional quality criteria,
or is nationally accredited. This rating was instituted in April 1998.
A (3 star) rating is awarded when a program meets additional
criteria, and is nationally accredited. This rating was instituted in July 1999.
The state child care reimbursement rate depends on a number of factors: the
facility’s star rating, the age of the child, whether the child attends full- or part-
time, whether the facility is a home or a center, and whether the facility is located
in an enhanced area.

Department of Human Services
Oklahoma Senate Overview of State Issues 169
During FY 2016, ninety six percent of children whose center-based care was
subsidized by DHS attended two star or higher centers. During the same year,
eighty percent of children whose home-based care was subsidized by DHS
attended two star or higher homes.
At the end of June 2016 Oklahoma had 3,437 licensed child care facilities
including 1,529 child care centers, part-day, school-age and day camp programs;
and 1,908 family child care homes and large family child care homes. Licensing
specialists work cooperatively with the Cherokee Nation, Muscogee Creek
Nation, Chickasaw Nation, and Choctaw Nation tribal licensing programs to
license facilities and reduce duplication of monitoring tasks.
Residential and Agency Licensing Services license residential child care facilities
and child-placing agencies throughout the state. Licensing staffs provide a
variety of consultative services, in addition to regulatory responsibility for the
enforcement of licensing requirements. They also investigate complaints
regarding non-compliance with licensing requirements or violations of the
Oklahoma Child Care Facilities Act. Their primary mission is to ensure that
licensed programs are safe and healthy environments for children and youth who
are in 24 hour, out of home care. At the end of June 2016, Residential Licensing
Services monitored the following child care facilities with a combined capacity
of 2,730 children: 28 children’s shelters and 75 residential child care programs.
In addition the program monitored 67 child-placing agencies.
The Professional Development Unit is responsible for the development of
initiatives contributing to the mission of the CCS including training for Licensing
staff and child care providers. To accomplish their goals, the Unit participates in
the development of initiatives; creation of contracts through an invitation to bid
process, interagency agreement or grant award; and monitoring of initiatives for
effectiveness. Major services were delivered through contracts with the
University of Oklahoma, Oklahoma State Regents for Higher Education,
Oklahoma Child Care Resource and Referral Association, Oklahoma State
Department of Health, and the Oklahoma Department of Mental Health and
Substance Abuse Services.
Child Care Subsidy Program: The child care subsidy program in Oklahoma
began as part of the Aid to Families with Dependent Children (AFDC) program
in 1969. What had then evolved into four separate child care funding streams
was consolidated in 1996 by the Personal Responsibility and Work Opportunity
Reconciliation Act (PRWORA). This new funding source is called the Child
Care Development Fund (CCDF). This block grant expanded the amount of
money available to states for child care. States can transfer funds from
Temporary Assistance to Needy Families (TANF) block grant into their CCDF
program. The Oklahoma Legislature also appropriated additional funding for the
Child Care Subsidy Program. With this expanded funding, more low-income
families are receiving child care benefits.

Department of Human Services
170 Oklahoma Senate Overview of State Issues
The child care subsidy program encourages collaboration with many agencies
and programs which helps to strengthen and increase resources available to
families. These other agencies and programs include Child Support Services,
SoonerCare, Child Welfare Services, TANF, Head Start, Early Head Start,
Children First, Pre-K, and Child Care Resource and Referral programs.
In FY 2016, DHS provided child care services to 57,028 children. The family
must be determined eligible before their child care services can be either fully or
partially subsidized. The family may have a child care co-payment based on
their income, the number of family members and the number of family members
needing services.
Providing child care benefits are part of an overall plan of service designed to
help low income families achieve their maximum potential for self-support. It is
a service benefit provided for children as a means to strengthen the family.
Providing quality child care services assures the parent or caretaker that each
child in care has the opportunity to receive developmental and learning
experiences while the parent or caretaker is engaged in self-support activities like
employment, education or training. The worker tries to help the client become
more independent by suggesting ways to increase household income and
identifying strengths in the client's life. Child care is also provided in critical
situations to help prevent neglect, abuse or exploitation of children. The Adult
and Family Services worker and the Child Welfare worker freely share
information to develop a plan that best meets the needs of the family when both
are working with the family.
Unlike TANF, no direct payments are made to the families that receive child care
benefits. Instead, all funds from this program are paid directly to a licensed and
contracted child care center or home, or a contracted in-home provider chosen by
the parent or caretaker. Providers are licensed to provide child care from child
care licensing specialists located in the local county offices. Providers request a
contract from the Adult and Family Services Child Care Subsidy Unit. Until a
provider is granted both a license and a contract, subsidized child care cannot be
paid by DHS.
Supplemental Nutrition Assistance Program (SNAP) (formerly the Food
Stamp Program). SNAP serves as the first line of defense against hunger. It
enables low-income families to supplement monthly household food while using
Electronic Benefits Transfer (EBT) cards. Food benefit recipients spend their
allotment to buy eligible food in authorized retail food stores.
During FY 2016, SNAP food benefits totaling $884,328,823 were issued to
Oklahoma eligible households. Based on a monthly average, 615,534 individuals
in 275,229 households were assisted, receiving $266 per household or $119 per
person. This accounts for a monthly average of $73,332,324 food benefit dollars
received by Oklahoma from the USDA-Food and Nutrition Service. SNAP food
benefit issuance increased by 2.9% from FY 2015 to FY 2016.

Department of Human Services
Oklahoma Senate Overview of State Issues 171
Applicant households apply for program benefits through a local county office.
A request for services form can be obtained at the local offices or printed from
the www.OKDHS.org website and submitted to a local office as the first step in
the eligibility process. Eligibility is determined by local office staff based on
federally mandated requirements including:
income test;
meeting work requirements for adults age 18 to 50;
household size.
Congress reauthorizes SNAP every five years. It was last reauthorized in the
2008 Farm Bill (HR 612A). The program name was officially changed effective
October 1, 2008 and Oklahoma chose to adopt the new federal name for its food
benefit program. Every October 1st, states are required to make changes to the
program through the Thrifty Food Plan overall.
Temporary Assistance for Needy Families (TANF) Block Grant: In August,
1996, Congress passed the Personal Responsibility and Work Opportunity
Reconciliation Act (PRWORA), which drastically altered both the funding and
focus of the nation’s welfare system. The act replaced Aid to Families with
Dependent Children (AFDC) with TANF and made major revisions in child
support laws. TANF introduced two critical changes to welfare:
It eliminated the entitlement status of welfare – no longer are citizens
guaranteed public assistance. Eligibility and benefits are determined more
by state policies and budget constraints and less by federal mandates; and
Stringent time limits and work requirements have been enacted for all
recipients of cash assistance. Recipients may collect cash assistance for a
lifetime maximum of five years and must participate in work or an approved
work activity for 25 to 30 hours per week during those five years.
If there are more eligible clients than funds, the state may deny programs and
services to eligible clients. All families who are eligible to receive TANF are
also eligible for SoonerCare.
The Deficit Reduction Act (DRA) of 2005 reauthorized the TANF program
through the year 2010. The program has been authorized through extensions of
the current DRA of 2005 through September 30, 2016. The DRA of 2005
addressed the needs of families by maintaining the program’s overall funding and
basic structure, while focusing increased efforts on building stronger families
through work, job advancement, and research on healthy marriage and
responsible fatherhood programs.

Department of Human Services
172 Oklahoma Senate Overview of State Issues
TANF Eligibility and Benefit Levels: Under TANF, DHS defines eligibility
criteria and benefit levels. The agency also may implement caps on eligible
members of the family and require recipients to work. According to 2016
eligibility requirements, a person qualifying for cash assistance payments must:
have at least one dependent child living with them;
not have over $5,000 equity in a car;
not have over $1,000 in other assets available;
cooperate with child support enforcement efforts if a parent is absent from
the home to establish paternity and increase parental support;
be willing to comply with all of the work requirements mandated by state
and federal law;
all adult applicants must be screened for and found not to be using illegal
substances.
The average family in the TANF program involves a parent and two children. As
seen below, the maximum payment for a family of three is $292. This figure
does not include payments some clients receive for work participation
allowances, work start-up payments or transportation services. The maximum a
family of three can earn to still receive any cash assistance payment is $1,193 per
month in gross income.
Monthly TANF Payments vs.
Federal Poverty Level FY’16
Family FY 2016 TANF Fed. Poverty TANF as
Members Payment Level % of Poverty
1 $180 $990.00 18%
2 $225 $1,335.00 17%
3 $292 $1,680.00 17%
4 $361 $2,025.00 18%
5 $422 $2,370.00 18%
6 $483 $2,715.00 18%
7 $544 $3,060.83 18%
8 $598 $3,407.50 18%
9+ $650 $3,754.16 18%

Department of Human Services
Oklahoma Senate Overview of State Issues 173
TANF has four purposes set out in federal law:
to provide assistance to needy families so that children may be cared for in
their own homes or in the homes of relatives;
to end the dependence of needy parents on government benefits by
promoting job preparation, work and marriage;
to prevent and reduce the incidence of out-of-wedlock pregnancies and
establish annual numerical goals for preventing and reducing the incidence
of these pregnancies; and
to encourage the formation and maintenance of two-parent families.
Under federal laws that ordered the conversion from AFDC to TANF, Oklahoma
must expend at least $60.1 million in state funds each year to access federal funds
that total $145 million (this state funding amount is referred to as “maintenance
of effort” or MOE). In addition to cash assistance, TANF gives states the
flexibility to use the grant for many other programs as long as they meet one of
the four purposes of TANF.
Types of Programs & Services Eligible for TANF Funds
* Adult Basic Education/GED/ * Domestic Violence/Training/
Literacy Prevention
* Low-Income Father Services * Tax Credit for Low-Income
* Child Abuse Prevention Families
* Employer Stipends * Teenage Pregnancy Prevention
* Caseworker Incentives * Services to Teen Parents
* Child Care * Substance Abuse Treatment
* Job Training * Transportation/Cars
* Utility Assistance * Vocational Training
* Tuition Assistance * Legal Aid Services
During the past ten years, the number of adults participating in this program has
declined significantly. However, there was a slight growth in cases due to
economic conditions during FY 2010 but the numbers began to decrease again in
FY 2011.

Department of Human Services
174 Oklahoma Senate Overview of State Issues
Families Served by TANF and SNAP (Monthly Average) FY’07 through FY’16
Adult Protective Services (APS) DHS is mandated by Oklahoma Statutes Title 43A Section 10-101 through 10-
111 to provide protective services for vulnerable adults. There are three units in
the APS Division: the Community APS (CAPS); the Long Term Care
Investigation (LTCI); and the AIDS Coordination and Information Services
(ACIS).
APS is a non-means tested, multi-faceted program for persons 18 years of age or
older who are vulnerable and have allegedly been abused, neglected, and/or
exploited. CAPS includes all investigations where the alleged perpetrator is not a
staff member of a nursing facility. LTCI investigates allegations of maltreatment
by nursing facility staff of nursing facility residents. ACIS is the DHS statewide
HIV case management service designed to provide the most vulnerable
individuals living with HIV/AIDS the continuum of care needed to improve
quality of life, ensure medical plans are individualized, link clients with
appropriate services, expedite access to services, and coordinate a range of
services needed to maintain optimal function.
APS was created in 1977 when the statute was enacted by the Oklahoma
Legislature. The program receives a small portion of the federal funding from
the Social Services Block Grant. The remainder is state dollars. In FY 2016,
with increasing numbers of referrals of maltreatment and decreasing numbers of
workers, CAPS investigated 9,316 reports of maltreatment of vulnerable
Oklahoma adults. These investigations covered 17,723 separate allegations of
maltreatment. Sixty-one percent of the investigations concerned females while
39 percent concerned males. Fifty-three percent were age 60 and over. An
additional 6243 referrals screened as lower risk were assigned as information and
referral with tasks, with APS Specialists offering the clients appropriate services.

Department of Human Services
Oklahoma Senate Overview of State Issues 175
APS staff at the state and local level work with community partners to provide a
safety net of services for vulnerable adults. Staff routinely coordinate with local
law enforcement, district attorneys, local medical and mental health providers as
well as many local service organizations to provide services for those vulnerable
adults who have been mistreated and to prevent a reoccurrence of the
maltreatment. Maltreatment of vulnerable adults was criminalized in 1984 via
Title 21, Section 843.1 of the Oklahoma Statutes. Prosecutions were limited and
sporadic until 2003 when DHS sponsored conferences to improve awareness of
the types of maltreatment.
Vulnerable adults are often preyed upon by individuals who, by illegal means,
target this group to obtain their assets. As a result of this alarming trend, the
DHS APS program responded with a series of conferences that were held
throughout the state. These conferences brought together law enforcement,
district attorneys, judges and APS professionals to improve accountability for
persons who perpetrate on vulnerable adults.
The types of referrals investigated by the DHS APS program are self-neglect,
caretaker neglect, non-caretaker exploitation, abandonment, caretaker abuse,
sexual abuse, caretaker exploitation, verbal abuse, and sexual exploitation. The
Oklahoma Legislature added a new allegation of financial neglect in November
of 2007 in response to requests of Oklahoma’s District Attorneys.
The types of vulnerabilities affecting APS clients include cognitive impairments
such as Alzheimer’s, and other forms of dementia; physical health problems such
as chronic debilitating diseases or illnesses; developmental disabilities; mental
illness; traumatic brain injury; and substance abuse.
Services are offered to assist vulnerable adults to prevent future occurrences of
maltreatment. Self-determination of adults is a cornerstone of the APS program,
and as such staff makes determinations of the person’s ability to consent to
services on every investigation. The client may reject offers of service as a result
of an APS investigation.
Clients who lack decision-making abilities and who are in life endangering
situations may be provided with involuntary protective services if there are
services available to relieve the situation. These involuntary services are court
ordered following approval of a certified petition brought before the court.
Long Term Care Investigations (LTCI): LTCI resides in the DHS Adult
Protective Services. Its focus is investigations involving abuse, neglect and
exploitation of nursing facility residents. During FY 2016 LTCI completed
intake of 4,092 reports. Of these, 515 reports met criteria to be assigned for
LTCI investigation, and in 466 cases, maltreatment was substantiated. An
additional 500 reports were referred to other agencies for possible investigation.

Department of Human Services
176 Oklahoma Senate Overview of State Issues
LTCI staff routinely coordinates with local law enforcement, district attorneys,
the State Department of Health, Ombudsmen, licensure boards and other social
service and enforcement organizations to stop current problems and prevent
reoccurrence of abuse. Staff also coordinates with local, state and county
agencies to improve enforcement of abuse, trouble shoot potential problems in
facilities, provide training and other activities designed to prevent abuse or
facilitate a resolution.
AIDS Coordination and Information Services (ACIS). During FY 2016,
there was a 21% increase in new clients compared to the previous fiscal year. As
part of the case management process, cases area reviewed semi-annually which
resulted in an overall case closure rate of four percent. The most recent available
epidemiology data indicates that 23% of all new HIV diagnosis occurs when
individuals present in an emergency department with advanced disease
progression, are those who are most vulnerable. Forty-two percent of all new
cases opened in FY 2016 were identified as extremely vulnerable and would have
required an APS referral without ACIS interventions. During FY 2016, ACIS
staff coordinated and connected clients with over 5,100 individual services. Of
these services, approximately $9.7 million in social services such as housing
transportation, in-home support services, utility assistance and food stability.
Additionally, staff coordinated another $19.7 million in prescription assistance of
non-state dollars, secured through federal grants, private nonprofit organizations,
and patient assistance programs.
Aging Services Programs Aging Services (AS) administers community programs that support the
independence and quality of life of older Oklahomans. The Older Americans Act
services are delivered through 11 Area Agencies on Aging (AAA’s). The largest
program is the Medicaid ADvantage Waiver. This listing reflects major program
offerings, excluding grants, for FY’16.
Older Americans Act Programs:
Congregate & Home Delivered Meals
Long-Term Care Ombudsman
National Family Caregiver Support Program
Legal Services
Senior Community Services Employment Program
Congregate and Home-Delivered Meals: The OAA program funds meals for
seniors in need. Meals are provided in a congregate setting, usually in a senior
center, as well as delivered to the senior’s home. AAA’s administratively
oversee this process and also provide nutrition education across the state. For
FY’16, 1,370,177 home delivered meals were provided and 2,865,133 congregate
meals served. Approximately 85% of this program is funded by federal OAA
funds. Given the demand for OAA services, particularly meals, the state has long
overmatched this program significantly. There are currently 213 congregate meal

Department of Human Services
Oklahoma Senate Overview of State Issues 177
sites across the state. While not an OAA program, meals provided through the
ADvantage Program (see below) are recognized as complimentary and eligible
members served through that program were afforded 3,765,501 meals during
FY’16.
Long-Term Care Ombudsman Program: The Long-Term Care Ombudsman
Program is administered by Aging Services of the Oklahoma Department of
Human Services under the authority of the Older Americans Act and the
Oklahoma Long-Term Care Ombudsman Act.
The Ombudsman Program serves residents in Oklahoma Long-Term Care
Facilities including nursing homes, assisted living, and residential care homes.
An ombudsman helps improve the quality of life and the quality of care available
to the residents. A long-term care Ombudsman is a person who receives and
investigates complaints from residents of facilities, their friends or relatives, and
attempts to resolve those complaints. Complaints investigated fall into 128
categories and include but are not limited to: violations of resident rights, abuse,
neglect or exploitation, medical care, dietary needs, and numerous other areas.
The Ombudsman has the authority to explore problems and recommend
corrective action. Ombudsmen also provide individual, systems and legislative
advocacy regarding long-term care.
The Ombudsman Program is supported by local staff and volunteers committed
to improving and enriching the lives of institutionalized older persons. Training
in skills such as problem solving and communication, the processes of aging, and
long-term care facility regulations is provided by the Ombudsman Program for
all staff and volunteers.
In FY 2016 the Ombudsman program investigated 5,914 complaints on the
behalf of residents. Over 99% of those complaints were addressed without the
need to refer them on to enforcement agencies, and the great majority of
complaints were resolved to the satisfaction of the resident and/or complainant.
National Family Caregiver Support Program: OAA Caregiver services
include information to caregivers about available services, assistance to
caregivers in gaining access to services, individual counseling, organization of
support groups, and caregiver training to assist the caregivers in the areas of
health, nutrition and financial literacy and in making decisions and solving
problems relating to their caregiver roles. In addition, the respite voucher
program provides respite care to family members caring for older Oklahomans,
and also to grandparents who are raising grandchildren (and other relatives
serving as parents). Vouchers can be used by the caregiver to hire a person of
their choice to provide a temporary break from the stress of caregiving. In FY’16,
the respite voucher program provided 93,486 hours of respite to 1,008
unduplicated caregivers and 16,292 hours of respite to 147 unduplicated
grandparents raising grandchildren. There are also supplemental services on a

Department of Human Services
178 Oklahoma Senate Overview of State Issues
limited basis to complement the care provided by caregivers such as the summer
camp for grandchildren and the backpack program for school age children.
Legal Services: Working with the Legal Aid Society of Oklahoma and the
AAAs, the Legal Services Developer of AS serves to help protect the legal rights
of older Oklahomans and ensure legal services are available to Oklahomans over
the age of 60 by informing service providers, partners and the general public on
issues affecting older Oklahomans and making referrals for legal services. The
Legal Services Developer provides leadership in advocacy that strengthens
protections for older Oklahomans by empowering constituency groups to provide
effective legislative advocacy through education, training, and consultation.
Senior Community Services Employment Program: AS inherited this
program, funded through the U.S. Department of Labor and authorized by Title V
of the Older Americans Act, in 2015. Services are provided in 34 of the 77
counties in Oklahoma. The services are provided through three identified sub-
grantees. The program provides work-based or training in part-time community
service assignments with assistance in skill development. The program serves
adults age 55 and older who have an income below 125% of the federal poverty
level, are unemployed, and have poor employment prospects.
Other smaller services offered through OAA in FY’16:
31,426 hours to 1067 individuals for Homemaker services (provides
assistance preparing meals, shopping for personal items, managing money,
using the telephone, or doing light housework)
1,508 hours to 223 individuals for Chore services (provides assistance with
heavy housework, yard work, or sidewalk maintenance)
11,985 hours to 614 individuals for Health Promotion (provides health
promotion or disease prevention programs and activities demonstrated to be
evidence-based to participants in a group or individual setting)
10,881 hours to 6654 individuals for Outreach services (Provides a one-on-
one contact between a service provider and an older client or caregiver)
233,404 trips to 3364 individuals for Transportation services (provides one,
one-way trip transportation)
393 hours to 326 individuals for Nutrition Counseling services (provides
individualized guidance to a person who is at nutritional risk because of
health or nutrition history, dietary intake, medication use, chronic illnesses,
or to caregivers.)
Transportation Services: Transportation services to medical appointments,
shopping and other social services are provided across the state through AAAs
via local providers (Older Americans Act services) and much more
predominantly through the Federal Transit Administration’s (FTA) Section 5310
program which provides funding for capital assistance (vehicles) to 150 + non-

Department of Human Services
Oklahoma Senate Overview of State Issues 179
profit organizations and governmental entities for transportation to individuals
who are elderly and individuals with disability. These programs assist
participants in remaining independent in their communities. In 2016, the FTA
Section 5310 program alone provided 1,439,313 trips for 578,879 riders, and
approximately 550 vehicles traveled 7,839,204 miles to do so. The year 2016
marks the 40th
anniversary of the FTA’s Section 5310 program being
administered by the Department of Human Services, Aging Services.
Adult Day Care: In FY 2016, 30 sites across the state provided subsidized day
care for 611 elderly persons. The program supported 110,400 service days and
662,400 service hours for the year. Half of the state’s funding, intended for
attendees over 60 years of age, is used to provide Adult Day Services for
individuals on the waiting list for the DDS waiver. Participants who qualify for
the ADvantage or DDS waiver also may receive Adult Day Services through
those waiver programs. People who receive Supplemental Security Income
(SSI), Aid to the Aged, Blind or Disabled (ABD), or meet state income
guidelines may qualify for a subsidy for adult day care costs in the 30 centers that
contract with DHS for funding. The majority of centers are located in the eastern
half of the state and efforts continue to try and boost options in western
Oklahoma. The rollout of the electronic attendance verification system a few
years ago continues to help expedite quick payment to vendors. As a reminder,
this program is a valuable community-based service program that is far less
expensive than nursing home care.
2-1-1: DHS Aging Services participates in the 2-1-1 Coordinating Council with
other state agencies and entities who have a stake in information and referral
(I&R) functions in Oklahoma. DHS Aging Services oversees the state funding
provided for this important service.
Many recognize that 2-1-1 is an easy to remember, free 24-hour telephone
number that connects people with health and human service resources, including:
Basic Human Needs Resources – food banks, clothing closets, shelters, rent
assistance, utility assistance;
Physical and Mental Health Resources – health insurance programs,
SoonerCare and Medicare, prenatal care, Children’s Health Insurance
Program, medical information lines, crisis intervention services, support
groups, counseling, drug and alcohol intervention and rehabilitation;
Employment Supports – financial assistance, job training, transportation
assistance, education programs;
Support for Older Persons and Persons with Disabilities – adult day care,
congregate meals, Meals on Wheels, respite care, home health care,
transportation, homemaker services; and
Support for Children, Youth and Families – child care, after-school
programs, Head Start, family resource centers, summer camps and recreation
programs, mentoring, tutoring, child protective services.

Department of Human Services
180 Oklahoma Senate Overview of State Issues
2-1-1 operates in local communities with additional support from private and
public sources. 2-1-1 is not supported by a phone company surcharge like 9-1-1.
Counties throughout Oklahoma are developing funding partnerships with
stakeholders including local and state government, the business community,
United Way organizations, and charitable foundations. The funding picture for
each county is unique. The 2-1-1 line became effective statewide in spring 2008.
In FY’16, the program received over 325,000 inquiries from Oklahomans. Also,
the program now has a consumer portal that allows individuals to access
information online. This program was de-funded for FY’17 due to the budget.
CNCS (Corporation for National and Community Services) Volunteer
Program: There are three programs under this umbrella. The Foster
Grandparent Program matches mentors age 55 and older with school-age children
in the public school system. The Senior Companion Program (companions to
homebound elders) provides companionship for older adults. Finally, the Retired
Senior Volunteer Program is the largest program and mobilizes older adults to
support community activities in countless ways. DHS contracts with area
programs also funded by the CNCS federal program. Over 5,500 CNCS
volunteers contributed 1,189,479 hours of service in FY 2016. At values
provided by the national non-profit, the Independent Sector, those volunteers
provided services worth $25,573,798 to the State of Oklahoma. This program
was de-funded for FY’17 due to the budget.
ADvantage Waiver: The ADvantage Waiver is a SoonerCare funded alternative
to nursing home care. It provides services to elders and some younger adults with
physical disabilities who qualify to have SoonerCare pay their nursing home care
but elect to stay at home instead. Long-term care services are provided in the
home and community, rather than in a nursing facility through this Medicaid
1915(c) waiver program. Everyone who is in the ADvantage Waiver could
choose to have their long-term care services provided in a nursing facility. Each
member has a case manager who works with the member and family to develop a
care plan comprised of services to keep them safely at home at a reduced cost to
the state. Not every service plan is the same but is based on member need and
informal support capacity to assist in meeting those needs. The cost to the state in
SoonerCare dollars spent for each member’s ADvantage services must be equal
to or less than the state would have paid to provide nursing facility services.
Generally, if a person needs 24 hour skilled care, the ADvantage Waiver is not
the appropriate service delivery system to meet their needs.
DHS staff performs the financial and level of care eligibility determinations. In
Aging Services, a nurse performs the level of care determination and provides
potential members with a list of eligible case management providers in their
geographic region from which the member chooses their case management
agency. All members receive case management. Additional services, with nearly
20 available, are provided based on need and outlined in the plan of care.

Department of Human Services
Oklahoma Senate Overview of State Issues 181
Examples of other services available include:
Personal Care (Assistance with activities of daily living or Home maker/
chore activities)
Adult Day Services
Home Delivered Meals
Specialized Equipment and Supplies
Hospice
Consumer-Directed Services (now statewide)
The ADvantage Waiver began as a pilot in 1994 and has grown steadily since that
time. In FY’16, according to preliminary CMS 372 reports from the Oklahoma
Health Care Authority, 21,146 consumers elected to be served in the ADvantage
Program. In the same year 18,237 consumers received SoonerCare nursing
facility services. The service trend line for the ADvantage Waiver continues to
go up while for nursing homes it is going down, reflecting the obvious desire of
Oklahomans to be served in their home rather than in an institution.
In FY’16, again according to preliminary CMS 372 reports from the Oklahoma
Health Care Authority, ADvantage costs were $187,422,022 as compared to
$530,335,447 in nursing facility costs despite more people being served through
ADvantage. As you can see, it costs the State of Oklahoma almost 3 times more
to serve less people in nursing homes than in the community based setting. Since
approximately 30% of these costs are paid with state-appropriated funds (the
other 70% is federal match through CMS), the program continues to save the
state a significant amount of money, while providing a choice of settings for
SoonerCare consumers to receive their long-term care.
Multiple technology initiatives continue to create efficiency within the program,
most notably the Electronic Visit Verification (EVV) system which allows for
service tracking and billing. Also, the agency is now embarking on a complete
renovation of the Waiver Management Information System (WMIS), the critical
system that tracks all services offered to ADvantage Waiver participants.

Department of Human Services
182 Oklahoma Senate Overview of State Issues
4,9
25,7
37
4,8
62,3
78
4,8
41,7
79
4,8
01,4
05
4,8
09,2
22
4,7
30,2
44
4,6
77,8
62
4,5
92,0
55
4,5
77,4
04
6,748,1767,135,325
6,847,1166,347,963 6,205,847 6,138,590 6,125,294 6,116,819 6,266,437
FY'08 FY'09 FY'10 FY'11 FY'12 FY'13 FY'14 FY'15 FY'16
Nursing Facility Days vs. ADvantage DaysFY'08 - FY'16
Nursing Facility Days ADvantage Days
State Plan Personal Care: Personal Care is an optional SoonerCare service that
is available to any person regardless of age who requires the service and is
financially eligible. DHS determines both financial eligibility and service need.
DHS county office staff performs the financial eligibility determination and AS
nurses housed around the state perform the service need evaluation.
Personal care attendants provide assistance with activities of daily living
(bathing, grooming, etc.), light housekeeping and meal preparation. The amount
and type of assistance needed is based on the consumer’s need, as determined by
DHS. The personal care attendants are employed by licensed home care agencies,
except in a small number of cases where needs dictate the service be provided by
an independent personal care attendant.
Developmental Disabilities Programs The mission of the Developmental Disabilities Services (DDS) is to enable
persons with developmental disabilities to lead healthy, independent and
productive lives to the fullest extent possible; to promote the full exercise of their
rights as citizens of their communities, state, and country; and to promote the
integrity and well-being of their families. The division’s purpose is to design and
operate a service system that efficiently uses available resources to support
individuals in the least restrictive and intrusive manner possible. The division
administers community-based programs and operates an institution serving
individuals with co-occurring intellectual disabilities and mental illness through a
contract with an external company.
General Funding Breakdown: There are two types of funding for DDS
services. First, Home and Community Based Waiver programs represent the
majority of the services administered through DDS. Waiver services allow
Oklahoma to capture a federal match also known as the Federal Medical
Assistance Percentages (FMAP). The FMAP allows Oklahoma to pay 37 cents

Department of Human Services
Oklahoma Senate Overview of State Issues 183
on the dollar for every dollar of service authorized through a Waiver program.
Waiver programs are SoonerCare programs, and thus require all recipients to be
SoonerCare eligible. Because there are Oklahomans with developmental
disabilities that are not SoonerCare eligible for various reasons, there are limited
state funded services available that are wholly funded with state dollars made
available through legislative appropriations.
Medicaid Waiver Services: Again, the Medicaid Waiver program is the
primary funding source for DDS services. DDS operates three major programs
funded by Medicaid: (1) Home and Community-Based Waiver Services
provided through four 1915(c) waivers, (2) Targeted Case Management provided
by DDS staff, and (3) Public Intermediate Care Facilities for persons with
Intellectual Disabilities (ICF/ID).
Home and Community Based Waiver Programs: The division operates four
different Medicaid Waiver programs: In-Home Supports Waiver for Children,
In-Home Supports Waiver for Adults, Community Waiver, and the Homeward
Bound Waiver. Waiver services are provided by contracted provider agencies
throughout Oklahoma. The services available through these Waiver programs
include:
Adaptive Equipment, Architectural Modifications, and Medical Supplies
Employment Services
Family Training/Counseling
Habilitation Training Specialists
Professional Medical Services, including dental, nursing, nutritional,
occupational, physical and speech therapies
Psychological Counseling
Residential Services
Respite Services
Transportation Services
To be eligible for DDS Waiver services, a person must:
be a resident of the State of Oklahoma;
be determined financially eligible for Medicaid by DHS;
be determined to have a diagnosis of an intellectual disability or related
condition;
be determined to meet the Intermediate Care Facilities for persons with
Intellectual Disabilities (ICF/ID) level of care;
be age three or older;
not be simultaneously enrolled in any other Medicaid Waiver program;

Department of Human Services
184 Oklahoma Senate Overview of State Issues
not be residing in a hospital, nursing facility, or ICF/ID; and
meet other waiver-specific eligibility criteria.
Waiver services are not entitlement programs. The fact that a person qualifies for
the service does not mean he or she can automatically be served. Waiver services
are dependent on the availability of state money to match the federal funds
supporting the programs. There is a waiting list for Waiver services because
there are more people requesting these services than there are state-matching
funds to provide services. As of June 30, 2016 there were 7,405 Oklahomans
waiting for Waiver services.
The Community Waiver was first approved by the federal government in 1985.
This Waiver provides for a comprehensive array of services including residential,
employment, professional and habilitation services and supports. Case managers
work closely with family and health professionals to design an annual plan of
care based on identified needs. As of June 30, 2016 there were 2,941
Oklahomans being served through Community Waiver.
The In-Home Supports Waiver (IHSW) was created in 1999 in response to a
comprehensive survey that found 85 % of Oklahomans on the Waiver Request
List wanted support to continue living in their own homes. Individuals on the
IHSW are assigned DDS Case Managers to assist them in locating, securing, and
coordinating needed services.
In FY 2016, eligible children 3 through 17 years of age could receive up to
$13,844 of services per year through the IHSW for Children. Eligible adults 18
years of age or older could receive up to $20,761 of services per year through the
IHSW for Adults. The IHSW for Children provides less funding than the IHSW
for Adults because many services are already available to children through the
Medicaid State Plan Early and Periodic Screening, Diagnosis and Treatment
(EPSDT) Program and the Oklahoma Department of Human Services Disabled
Children’s Program (DCP).
As of June 30, 2016 there were 213 Oklahoma children receiving services
through the IHSW for Children. As of the same time, there were 1,500
Oklahoma adults receiving services through the IHSW for Adults.
The Homeward Bound Waiver was created in September, 2003 to provide
services and supports to the members of the Plaintiff Class of the Homeward
Bound vs. The Hissom Memorial Center lawsuit. Prior to 1994, the Hissom
Memorial Center in Sand Springs was one of the long-term care facilities, also
known as a public ICF/ID, operated by DHS. This Waiver program meets the
requirements set by the federal court for serving the individuals who lived at the
center during a certain period of time. The services provided under the
Homeward Bound Waiver are the same as those under the Community Waiver,
with the exception of Class Members having the choice of sharing a house with

Department of Human Services
Oklahoma Senate Overview of State Issues 185
roommates or living in a single placement. As of June 30, 2016, there were 625
class members served through the Homeward Bound Waiver.
Targeted Case Management Services: Each person receiving waiver services
through DDS has a case manager who ensures that individual needs are met
through linkage, assessment, brokerage, advocacy, and monitoring activities.
Targeted case management services (TCM) are activities that assist this
population in gaining access to needed medical, social, educational, and other
services and supports, even if these supports and services are not covered under
the Oklahoma Home and Community-Based Services Waivers. Services
provided include assessment and reassessment, support/service planning, and
monitoring and coordination. The DDS Case Manager serves as the individual’s
Qualified Intellectual Disability Professional (QIDP).
Public Intermediate Care Facility: The Robert M. Greer Center is located on
the campus of the former publicly operated Northern Oklahoma Resource Center
in Enid which closed November 17, 2014. The Greer Center is the only facility
in the state that exclusively serves individuals who are diagnosed as having both
intellectual disability and mental illness (census June 30, 2016 – 52). The
management and operation of the Greer Center is provided through a contract
with Liberty of Oklahoma Corporation. The Southern Oklahoma Resource
Center in Pauls Valley closed on July 10, 2015.
Non-Medicaid Services: DDS offers additional services that are not funded by
Medicaid but are designed to support individuals in their communities. These
services are often referred to as state-funded services as they are funded
exclusively with state dollars, and are dependent wholly on legislative
appropriations. Because the funding is exclusively with state dollars, the
programs are limited in scope and availability.
Family Support Assistance Program: This program provides monthly cash
payments to a limited number of families who have a child younger than 18 years
of age with a developmental disability, and whose adjusted gross income is no
more than $45,000 a year. The families receive $250 per month for one child
meeting the eligibility criteria. If a family has more than one child meeting the
eligibility criteria, an additional $50 per month per child can be received, with a
maximum of $400 per month. These payments help families pay for needed
services such as respite care, architectural modifications, technical assistance, or
personal items such as diapers and medication. This program is funded through
the Temporary Assistance for Needy Families (TANF) block grant.
State Funded Employment Services (Sheltered Workshop and Community
Integrated Employment): Sheltered Workshops provide employment services
and work activities for individuals with developmental disabilities. In 1975, the
Department began funding Work Activity Centers that later became known as
Sheltered Workshops. Sheltered Workshops continue to provide opportunities for
adults with developmental disabilities to engage in meaningful work or

Department of Human Services
186 Oklahoma Senate Overview of State Issues
participate in training activities. People who receive sheltered workshop services
are paid for their work in accordance with rules established by the US
Department of Labor. Community Integrated Employment services are designed
to promote independence through gainful, integrated employment. Services
include assessment, training, supportive assistance and follow-along support.
Employment may be a single placement or in groups of not more than eight.
State Funded Group Home Program: Group Homes offer a living
arrangement for 6 to 12 people who share a home and receive up to 24 hours per
day of supervision, support, and training in daily living skills. Group Home
residents are 18 years of age or older and are provided community living
services. Group Homes are single-family homes located in the community close
to other services and activities. The home is owned or leased by a private
agency. The agency receives reimbursement from DDS for supervising and
supporting residents of the home.
Office of Client Advocacy The mission of the Office of Client Advocacy (OCA) is to ensure the safety,
well-being, fair treatment, and promotion of individual rights of persons with
intellectual disabilities served by DHS as well as children in state custody living
in residential facilities. OCA provides advocacy services, administrative reviews
and investigations of abuse, neglect or exploitation, and helps to resolve
grievances.
OCA has three Investigative Units: Children’s Investigations, Vulnerable Adult
Investigations, and Specialized Investigations. These units conduct independent
and objective investigations to: protect DHS clients from further maltreatment;
deter and prevent maltreatment; provide relevant evidence in administrative and
judicial proceedings; rule out unfounded allegations; and, hold violators
accountable. Based on investigative findings, OCA makes recommendations to
DHS leadership for systemic changes to enhance services to children and
vulnerable adults.
OCA is responsible for conducting investigations of alleged DHS retaliation,
harassment or discrimination against foster parents as well as conduct
administrative investigations involving the death or near-death of a child known
to DHS, or upon request by the DHS Director.
OCA is also responsible for providing advocacy services for adults and children
receiving services from the Disabilities Services Division. OCA Advocates seek
to ensure that the rights of individuals with disabilities are both promoted and
protected and that they are receiving the services they need to realize their full
potential.

Department of Human Services
Oklahoma Senate Overview of State Issues 187
Investigations involving children in residential care: OCA is charged with the
statutory responsibility to conduct investigations for children residing outside
their own homes other than in foster care. This would include children living in
group homes and mental and behavioral health treatment facilities. Rather than
just report investigative findings, OCA has worked to reduce incidences of
maltreatment of children in residential settings and improve outcomes. This work
has involved collaborating with Child Welfare Services Specialized Placement
and Partnership Unit, DHS Child Care Services, Oklahoma Office of Juvenile
Affairs, the Oklahoma Hospital Association, and the Oklahoma Health Care
Authority.
0 500 1000 1500 2000
Total Referrals Received
Referrals Assigned
Substantiated Findings
Total ReferralsReceived
ReferralsAssigned
SubstantiatedFindings
SFY 2016 1588 465 89
SFY 2015 1510 515 69
SFY 2014 1199 371 59
Children's Investigations in Residential Facilities
1,588 reports of abuse or neglect of children in residential facilities wereSF
received with 465 investigations conducted. 89 of those cases had a confirmed
victim.

Department of Human Services
188 Oklahoma Senate Overview of State Issues
Investigations involving adults with intellectual and developmental
disabilities: OCA is charged with the statutory responsibility of investigating
allegations of abuse or neglect of vulnerable adults with developmental
disabilities who receive services from the DHS Developmental Disabilities
Services (DDS). In FY 2016, OCA received 1,342 reports (referrals) related to
allegations of abuse or neglect of vulnerable adults. Of those referrals, 647 were
investigated. In FY 2015, OCA received 1,465 referrals of which 554 were
investigated. OCA experienced a 14 percent increase in investigations between
FY 2015 and FY 2016.
Referrals and investigations may include multiple victims as well as more than
one allegation type (ex. abuse, neglect, exploitation, financial exploitation, sexual
abuse, indecent exposure, sexual exploitation, or verbal abuse)

Department of Human Services
Oklahoma Senate Overview of State Issues 189
Advocacy services were provided to 1,287 persons with disabilities receiving
Developmental Disabilities Services.
$197,933.21 in mismanaged or exploited client funds were recovered and
returned to clients.
1,342 reports of abuse, neglect or exploitation of vulnerable adults were received
with 647 resulting in investigations.

Department of Human Services
190 Oklahoma Senate Overview of State Issues
Advocacy Services: OCA’s Advocacy Unit seeks to protect and advocate for
the rights of individuals with developmental disabilities to ensure that their needs
are met and that they have access to the same opportunities as those expected by
the general population. OCA Advocates act as a member of the client’s
interdisciplinary support team and assist with resolving issues related to client
services and improving quality of life and care. OCA Advocates assist clients in
expressing the client’s choices and preferences, report any concerns of abuse or
neglect, perform home visits, seek problem resolution and file grievances on
behalf of their client’s and serve as authorized representatives in fair hearings.
In FY’16, Advocacy Services were provided to 1,287 clients, including: Hissom
Class Members; residents of the Robert M. Greer Center; persons receiving
Developmental Disabilities Services who were also Guardian Ad Litem clients;
former residents of the now-closed, state-run resource centers who transitioned
into community services; and, individual DDS clients as requested.
Advocates identified 2,151 issues with service delivery, successfully resolving 99
percent of cases through informal problem resolution. Seventy-five percent of
these cases were resolved in 30 days or less. OCA advocates completed 99
percent of required monitoring visits and service reviews within required
timeframes.
The OCA financial consulting unit received 16 referrals to audit client personal
funds, which resulted in the reimbursement of $197,933.21 to clients whose
funds had been misused, mismanaged or exploited.
Special Advocacy assists individuals receiving services from DDS with resolving
issues related to services that they have or may be in need of obtaining. Case
managers, guardians, family, and providers can request advocacy assistance on
behalf of the service recipient. OCA provided special advocacy services to 316
individuals in FY 2016, 268 of these were new referrals. Referrals for special
advocacy services increased 37 percent from FY 2015 to FY 2016.
OCA also received 38 referrals for special advocacy for children in state custody
during FY 2016. This is a 40 percent increase from the previous fiscal year.
OCA is seeking to expand special advocacy services for children in state custody
who have disabilities to include assistance with educational issues and concerns.
Special Investigations: In FY 2016 a total of 14 cases were referred to the
Specialized Investigations Unit. Of these, six were regarding foster parent
retaliation, harassment or discrimination. As a result of these investigations,
there was one confirmed finding of retaliation, one confirmed finding of
harassment and four were unconfirmed. When an investigation results in a
confirmed finding against an agency employee, the agency is mandated by statute
to promptly initiate a plan of corrective discipline which could include dismissal
of the employee.

Department of Human Services
Oklahoma Senate Overview of State Issues 191
Eight administrative investigations were assigned in FY 2016. Most often
administrative investigations arise from cases involving a death or near death of a
child known to DHS and are assigned at the request of the DHS Director. The
intent of the investigation is to obtain an independent objective review in order to
identify any concerns or recommend systemic changes necessary to improve
system functionality and prevent future occurrences. The administrative
investigations are also utilized by DHS division directors to assist the agency in
making appropriate personnel decisions.
Grievances: The Grievance Program provides a process for children in DHS
custody and DDS service recipients to voice complaints and seek timely
resolution of their concerns. In FY 2016, 2,195 grievances were processed, a
seven percent increase from FY 2015. Ninety-three percent of grievances were
resolved at the lowest level.
OK Foster Parent Voices is a grievance and complaint process available for
foster parents established through legislation in 2014. The program is in
partnership with the Oklahoma Commission on Children and Youth, housed in
OCA, and overseen by the Foster Care Ombudsman. In FY 2016, 283
complaints were filed by foster parents with the majority being resolved at the
lowest level of informal problem resolution.
Foster parents have sought assistance with a variety of issues ranging from
communication with workers, questions about monthly stipends, to concerns
about possible retaliation by an agency employee. Data is collected on each
complaint and is presented to child welfare leadership so that systemic changes
can be made to benefit all foster parents. Complaints that indicate
discrimination, harassment, or retaliation to the foster parent by an agency
employee are forwarded for investigations to the OCA Investigations Unit.
Child Welfare Services DHS is the designated state agency mandated to protect children alleged to be
abused or neglected. Child Welfare Services (CWS): (1) are directed toward
child safety, permanency, and well-being; (2) focus on the family as an integral
part of the child's well-being; and (3) are provided to assist the parent develop
protective capacities and ability to care for their child.
Child Welfare Services works to keep families together when possible. When a
child must be removed from the home to ensure safety, DHS searches for
relatives or resource parents that can support the child and family while efforts
are made toward reunification. When the child and family cannot be safely
reunified, DHS makes efforts to place the child with a family that can provide a
safe, healthy life for the child while maintaining connections to the child's kin,
culture, and community.

Department of Human Services
192 Oklahoma Senate Overview of State Issues
DHS operates and manages two shelter programs and administers the federally–
funded Safe and Stable Families program that funds family preservation, family
support, time-limited family reunification, and adoption support services.
On January 4, 2012, the Oklahoma Department of Human Services (DHS)
reached an agreement with the plaintiffs in class action litigation DG vs.
Yarbrough, Case No. 08-CV-074. As part of this agreement, DHS developed an
improvement plan, with the assistance of key internal and external stakeholders
and the review and approval of the Co-Neutrals, who are child welfare experts
who act as arbiters of any dispute between Child Welfare Services and the
plaintiffs.
The improvement plan, known as the Oklahoma Pinnacle Plan, endorsed by the
Co-Neutrals on July 25, 2012 details a five-year plan that begins Fiscal Year
2013 and addresses 15 performance areas identified in the settlement agreement.
DHS is exploring new and innovative ways to recruit, retain, and support
resource families to provide children with life experiences needed for healthy
development in all aspects of life. The agency's goal is to place each child with a
family that: (1) understands the impact of the trauma the child experiences when
entering out-of-home care; (2) that can help the child heal from trauma; and (3)
that will keep the child in the resource home during difficult times to ensure
placement stability for the child.
Child protective services received 73,417 reports of potential child abuse or
neglect in FY 2014. After screening, 35,549 reports met the criteria for a child
abuse or neglect assessment or investigation. A differential approach in the
response to reports of child abuse and neglect is required for DHS to receive
certain federal funding; therefore, accepted reports of child abuse or neglect are
prioritized and responded to in different manner as either an assessment or an
investigation.
Assessment means a comprehensive review of child safety and evaluation of
family functioning and protective capacities conducted in response to a child
abuse or neglect referral that does not allege a serious and immediate safety
threat to a child. Investigation means a comprehensive review of child safety and
evaluation of family functioning and protective capacities conducted in response
to an allegation of abuse or neglect that involves a serious and immediate threat
to the child's safety.
In FY 2016, DHS conducted an assessment or investigation for 64,328 children
and determined 15,149 or 23.5% of the children were victims of abuse, neglect,
or both.

Department of Human Services
Oklahoma Senate Overview of State Issues 193
Child Protective Services
Number of Investigations and Children for Whom
Abuse and Neglect Was Substantiated
FY’07 – FY’16
51,334 49,454
30,701
19,902 21,818
34,030
49,539
67,790 66,71464,328
13,191 11,7148,605 7,248 8,110 9,842 11,418
14,158 15,253 15,149
FY'07 FY'08 FY'09 FY'10 FY'11 FY'12 FY'13 FY'14 FY'15 FY'16
Investigations Substantiated
When a child cannot be safely maintained in the child's own home, out-of-home
care is required. A child may be placed in: (1) a foster care home with relatives;
(2) a foster care home with non-relative kinship; (3) a foster care home; (4)
therapeutic foster care; (5) a contracted foster care home; or (6) in group home
care.
Oklahoma has one of the highest kinship foster care placement rates in the nation
and provides a foster care maintenance payment to those relatives and kin, as
well as to non-kin, non-relative, foster parents.
In the beginning of FY 2007, 11,941 children in DHS care were in out-of-home
placement. In the beginning of FY 2014, 10,233 children were in out-of-home
care.
Resource foster and adoptive parents are invaluable to the child welfare system.
The foster care payment reimburses resource parents for the cost of food,
clothing, shelter, school supplies, personal incidentals, and reasonable travel for a
child in Oklahoma Department of Human Services (DHS) custody.
As part of the Oklahoma Pinnacle Plan, DHS has recommended that resource
parents be reimbursed at the established Minimum Adequate Rates for Children
as set out in a study published by the University of Maryland, National Resource
Parent Association, and Children's Rights. The full rate increase in the Pinnacle
Plan is a five year plan to fully implement, with four of the five increases being
implemented as of August 1, 2015.

Department of Human Services
194 Oklahoma Senate Overview of State Issues
Pinnacle Plan Monthly Reimbursement Rates
for Resource Parents
Age FY’12 8/1/2012 5/1/2014 7/1/2014 8/1/2015 TBD
0-5 $365 $403.48 $441.97 $480.45 $518.94 $557.42
6-12 $430 $471.78 $513.57 $555.35 $597.14 $638.92
13+ $498.33 $538.73 $579.13 $619.53 $659.93 $700.33
The majority of foster children are reunified with their families. In FY 2014,
4,788 children exited DHS care. Seven percent entered a legal guardianship; 4%
were placed in the legal custody of a family member; 6% reached 18 years of age
while in care; 26% were adopted; and 57% were reunified with their family.
DHS seeks permanent homes for children unable to return home. A child needs
lifelong connections from caring and loving families to thrive. When a child is
removed from the home for abuse or neglect and cannot safely return home, DHS
seeks a safe, permanent family for the child. Between 2007 and 2014, 10,953
children in DHS care were adopted. In FY 2016, DHS finalized 2,243 adoptions.
Per capita, DHS adoptions are twice the national average.
In a few cases, adoptions are dissolved. In FY 2014, there were 6 adoption
dissolutions, which is less than 1% of finalized adoption. On average these
adoptions lasted 74 months.

Department of Human Services
Oklahoma Senate Overview of State Issues 195
Adoptions Finalized FY’07 – FY’16
1,1521,409
1,5311,698
1,143
1,4301,321 1,269
2,186 2,243
FY'07 FY'08 FY'09 FY'10 FY'11 FY'12 FY'13 FY'14 FY'15 FY'16
The number of children qualifying for adoption assistance continues to rise. The
adoption assistance program aids in securing safe, permanent adoptive homes for
children with special needs. Adoption assistance provides adoptive families of
any income level with needed social services and medical and financial support to
care for the child considered difficult to place. Federal and state laws provide for
adoption assistance benefits that include: (1) SoonerCare coverage; (2) a monthly
adoption assistance payment; (3) special services; and (4) reimbursement of non-
recurring adoption expenses.
There were 9,197 children who qualified for adoption assistance at the end of FY
2007, which increased to 14,123 at the end of FY 2014, and 16,582 children at
the end of 2016.
Adoption subsidy amounts are set at the same rate as foster care reimbursement
amounts and the rate for adoption assistance will also increase per the Pinnacle
Plan.
Four salary adjustments have been made for Child Welfare Specialists positions
as of July 2016. One of the many objectives in the Oklahoma Pinnacle Plan
focused on the recruitment and retention of child welfare personnel. The
Pinnacle Plan proposes that the salaries for DHS child welfare personnel be
increased incrementally over five years beginning in FY 2013. The salary
adjustments are based on the compensation market for the Child Welfare
Specialist and does consider what other states pay child welfare workers. The
legislature supported this Pinnacle Point and appropriated funding for the salary
adjustments and the establishment of the new minimum hiring rates for the Child
Welfare Specialist, levels I through IV.

Department of Human Services
196 Oklahoma Senate Overview of State Issues
Minimum Hiring Rates effective July 1, 2014
Job Title FY 2012 New Hiring Rate
for FY 2016
Child Welfare Specialist I $2,381.07 $2,889.11
Child Welfare Specialist II $2,624.33 $3,218.74
Child Welfare Specialist III $2,894.18 $3,802.46
Child Welfare Specialist IV $3,466.10 $4,437.40
Job Title FY 2012 FY 2013 FY 2014 FY 2015 FY 2016 FY 2017 CWS II $2,624.33 $2,821.15 $2990.42 $3,124.99 $3,218.74 $3,307.26
CWS III $2,894.18 $3,111.24 $3,336.81 $3,570.39 $3,802.46 $4,040.11
CWS IV $3,466.10 $3,726.06 $3,986.88 $4,226.09 $4,437.40 $4,603.80
Child Support Services Child support programs help families become stronger and more self-sufficient
while decreasing reliance on public assistance. In addition to recovering funds
spent on welfare, the collection and distribution of reliable child support builds
self-esteem, helps children stay in school, and enables children to build stronger
relationships when they move into adulthood themselves.
Child support is paid by parents for the care and support of children of a
relationship that has ended. Noncustodial parents are legally obligated to provide
child support. Custodial persons receive child support. Child Support Services
(CSS) ended FY 2016 collecting $368 million for the 202,516 families in its
caseload.
To promote healthy families, CSS establishes, monitors and enforces reliable
support while encouraging self-sufficiency and strengthening relationships. In
support of this mission, CSS provides the following services:
Locating parents
Establishing legal fatherhood (paternity)
Establishing and enforcing fair support orders
Increasing health care coverage for children
Child Support Services provides these services to families statewide through a
variety of different delivery models. CSS contracts with District Attorneys to
operate nine full-service Child Support Offices. CSS directly operates 25 full-
service offices, and one full-service office is operated by a non-profit
organization.

Department of Human Services
Oklahoma Senate Overview of State Issues 197
As of June 30, 2016, CSS had more than 202,000 open cases. Of these,
approximately 9% are current TANF or Foster Care assistance cases, 28% are
former TANF or Foster Care assistance cases and 63% have never been on
TANF or Foster Care assistance but 46% of those are SoonerCare cases.
Child Support Caseload 2007 through 2016 (as of June 30)
Total distributed collections (including interstate and out of country collections)
decreased by 1%, from $372 million in FY 2015 to $368 million in FY 2016. In-
state collections also decreased by 1% from $347 million in FY 2015 to $344
million in FY 2016.
Total Child Support Collections FY’07 through FY’16 (in millions)

Department of Human Services
198 Oklahoma Senate Overview of State Issues
Paternities Established in Child Support Cases FY’08 through FY’16
CSS has a variety of tools to compel child support payments. Among them:
Income Assignment – In partnership with employers, CSS withholds child
support from paychecks as the primary method of child support collection.
During the year ending June 30, 2016, over $234 million was collected.
Federal Income Tax Offset – This automated process with IRS allows for
seizure of tax refunds. During the year ending June 30, 2016, almost $36
million was collected, a slight decrease of 4% since the previous year.
Federal Administrative Offset – This automated process with the Office of
Child Support Enforcement (OCSE) and the U.S. Treasury allows for seizure
of various federal monies. During the year ending June 30, 2016, almost
$270 thousand was collected using this remedy, a decrease of 27% from the
previous year.
Oklahoma Tax Refund Offset – This automated process for seizure of state
tax refunds is in partnership with the Oklahoma Tax Commission. During
the year ending June 30, 2016, nearly $4 million was collected using this
remedy, resulting in a 5% decrease compared to FY 2015.
Unemployment Benefit Offset – Another automated process, this seizes
unemployment benefits in partnership with Oklahoma Employment Security
Commission. This offset allows for continuation of regular payment of child
support when the payer is unemployed. During the year ending June 30,
2016, more than $6.8 million was collected, representing a 41% increase
over the previous year. The semi-automated program for CSS collecting
from unemployment agencies in other states received almost $169 thousand
for families that could not have been reached before.

Department of Human Services
Oklahoma Senate Overview of State Issues 199
Workers’ Compensation and Personal Injury Award Intercept – This
automated process intercepts workers’ compensation and personal injury
settlements and awards. During the year ending June 30, 2016, more than
$5.2 million was collected. This represents a decrease in overall workers
compensation and personal injury collections of 6% from the previous year.
Lottery Offset – This automated special collection process intercepts lottery
winnings of parents who owe child support. During the year ending June 30,
2016, $18,000 was collected, a 54% decrease compared to FY 2015.
Passport Denial Collections – Persons who owe past due child support in
excess of $2,500 are not permitted to obtain or renew a passport. During the
year ending June 30, 2016, the passport denial program collected $534,000,
an increase of 84% as compared to FY 2015.
Oklahoma Crime Victims Compensation Program – Persons entitled to
financial compensation from the Oklahoma Crime Victims Fund are
matched with child support obligors. The only funds CSS offsets from the
crime victims is lost wages. This is a small program that collected just over
$14,000 during FY 2016. This represents a 107% increase over FY 2015
collections.
Beginning in the Spring of 2014, CSS began matching with the Oklahoma
State Treasurer’s Office – Unclaimed Property Fund and then sending lump
sum IWO’s to recover obligors unclaimed property. In FY 2016, CSS
collected $2,573.
Also in the Spring of 2014, CSS began working with the State Retirement
and Pension Plans to formalize Qualified Domestic Relations Orders
(QDROs) to offset monthly retirement payments as well as lump sum
withdrawals for payment of past due child support.
The federal cost effectiveness ratio increased from $4.53 to $5.02 between FY
2012 and FY 2016. This means CSS collected over five dollars for every dollar
spent on collection. This value is extended even more with the handsome federal
match rate CSS receives: for every state dollar spent in the child support
program (except federal incentives dollars), the federal government matches that
dollar with two more.
Tribal Child Support Agencies within Oklahoma
The Chickasaw Nation in Oklahoma was the first Tribe nationally to receive
direct funding for a Tribal Child Support Enforcement Program. The readiness of
the Chickasaw Nation to become a federally funded Tribal Child Support
Program was helped by its relationship with Oklahoma Child Support Services.
CSS originally developed a contract with the Chickasaw Nation in 1998 allowing
the Tribe to accept applications for child support services for Native Americans.

Department of Human Services
200 Oklahoma Senate Overview of State Issues
Now there are ten (10) tribes operating comprehensive child support programs in
Oklahoma: the Chickasaw Nation, the Osage Nation, the Cherokee Nation, the
Muscogee (Creek) Nation, the Modoc Tribe of Oklahoma, the Ponca Tribe of
Oklahoma, the Kaw Nation, the Kickapoo Nation, the Comanche Nation, and the
Delaware Tribe of Oklahoma. The Apache Tribe of Oklahoma was approved for
start-up funding effective January 2013 and was approved for second year start-
up funding in 2014. CSS is supportive of all the tribal programs that have
attained start-up or comprehensive status. CSS partners with these tribal child
support programs to coordinate services, refer cases, and provide access to the
CSS automated case management computer system. For those tribes who wish to
use it, CSS grants access to Oklahoma tribal IV-D partners to use the state’s
automated child support case management computer system as their own case
management system. Six (Cherokee, Chickasaw, Kaw, Kickapoo, Modoc and
Osage) tribes are choosing to use full functionality of the Oklahoma system, three
(Muscogee Creek, Delaware, and Ponca) are using the system as read-only and
one (Comanche) is not using the system yet. At this time, the Apache (when they
go comprehensive) do not plan to use the state’s automated case management
computer system - OSIS. All of the Oklahoma Tribes report positive interaction
and assistance with CSS.

Oklahoma Senate Overview of State Issues 201
JUVENILE JUSTICE
The organization of state programs addressing juvenile delinquents changed
significantly in the mid 1990’s. Before 1995, these programs were under the
purview of the Department of Human Services. A separate agency, the Office of
Juvenile Affairs (OJA), was created in 1995 to establish independent
management of the juvenile justice system, a move designed to improve services
and hold juveniles more accountable for their actions.
OFFICE OF JUVENILE AFFAIRS
The creation of OJA was part of a sweeping juvenile justice reform bill, HB
2640, enacted in 1994. After a one-year transition period, the separate agency
became operational on July 1, 1995 (FY’96). The bill expanded prevention,
intervention and detention programs across the state. The goals of the legislation
were to:
Initiate a number of primary prevention programs to prevent juvenile crime;
Provide immediate consequences and rehabilitation programs for early
offenders to prevent further juvenile crime; and
Ensure the public’s safety by providing more medium-security beds for
juveniles adjudicated for serious offenses.
Changes in Juvenile Justice Laws In addition to creating prevention and treatment programs for adjudicated youth,
HB 2640 also enacted the “Youthful Offender Act”. Prior to this time, the
juvenile justice system was required to release a juvenile in the state’s custody at
the age of 18. Under the Act, if a juvenile sentenced as a Youthful Offender
(YO) turns 18 years of age but has failed to successfully complete his treatment
plan, the juvenile may be transferred to the adult correctional system by the court
of jurisdiction. Similarly, the juvenile may also be moved to the adult system at
any time if the terms of the rehabilitation agreement with the court were violated.

Juvenile Justice
202 Oklahoma Senate Overview of State Issues
During the 2000 Legislative Session, the Youthful Offender Act was amended to
allow a youth up to the age of 20 to remain in the juvenile system, if OJA
requests an extension of custody. The purpose of this amendment was to allow
YOs who were seventeen years of age or older at the time of their sentencing to
have sufficient time in the juvenile system to complete their rehabilitation plans.
During the 2006 Legislative Session, the Youthful Offender Act was further
amended. These amendments were the most substantive changes since the
enactment of the original legislation. SB1799 included eliminating the ten-year
cap on the sentence a YO could receive; mandating in lieu of the cap the same
sentencing range as for an adult offender. SB1799 also provided for the retention
of YOs in OJA custody until age twenty-one, only in the event of the opening of
a new, separate facility devoted to the treatment of YOs. SB1760 removed the
cases of fifteen-, sixteen-, and seventeen-year olds charged with first degree
murder from eligibility as YOs or from any further jurisdiction of the Juvenile
Court.
During the 2008 Legislative Session, the legislature rewrote the Youthful
Offender Act in SB1403 to have the courts review the sentence at the time the
YO turns eighteen. At the sentencing review hearing, the court may make one of
four recommendations: (1) the YO is returned to OJA in order to complete the
rehabilitation agreement, provided the time shall not exceed the YO reaching
eighteen years and 5 months; (2) the YO is discharged from OJA and transferred
to DOC to complete the original sentence, and the court cannot add more time
than the original sentence; (3) the YO is placed on probation with DOC; or (4)
the YO is discharged from state custody.
SB1403 (2008) the Youthful Offender Act was further amended by permitting
the transfer of a YO to DOC if a YO is found to have committed battery or
assault and battery on a state employee or contractor while in custody; if a YO
has disrupted the facility, smuggled contraband, engaged in other types of
behaviors which have endangered the lives or health of other residents or staff; or
established a pattern or disruptive behavior not conducive to the policies and
procedures of the program. Additionally, SB1403 defined the placement of a
YO to be the responsibility of OJA, and OJA is to place a YO not more than 45
days following the filing and adoption of the written rehabilitation plan with the
court, unless an emergency is declared. For YOs who have been sentenced to
OJA custody who are pending placement into an OJA facility, seventeen- and
eighteen-year olds may be detained in county jails while eighteen-year olds may
be held in the general population of county jails. The bill also retains annual
court review hearings for YOs who are in OJA custody, which are to be
completed within 30 days of the date the sentence was imposed.
In 2009, SB270 clarified that a sentence imposed upon a youthful offender would
be served in the custody of or under the supervision of OJA until the expiration
of the sentence, the youthful offender is discharged, or the youthful offender
reaches the age of 18, whichever occurs first. The parole of a youthful offender

Juvenile Justice
Oklahoma Senate Overview of State Issues 203
as a triggering event for the termination of the sentence was eliminated. This bill
also clarified that at the age of 18, the court may order that the youthful offender
be placed in the custody of the Department of Corrections rather than
incarcerated in the custody of DOC.
In 2009, HB2029 renumbered all sections of the Juvenile Code, including the
Youthful Offender Act.
In 2010, SB1771 clarified that youthful offenders shall not remain in the custody
of or under the supervision of OJA beyond the maximum age of 18 years and 5
months.
In 2011, SB247 authorized OJA to place juveniles in a collocated secure facility
which meet applicable criteria of the federal Juvenile Justice Delinquency
Prevention Act.
In 2012, SB1582 authorized campus police for secure juvenile facilities, as
provided by the Campus Security Act. HB2300 directed OJA to certify DHS
shelters with OJA establishing a system of certification. Additionally, HB2300
established the OK Mentoring Children of Incarcerated Parents Program for
children who are in the custody of OJA and currently placed outside the home, or
who have been identified by OJA as at-risk of becoming involved in the juvenile
justice system. HB2641 provided an evidence-based counseling curriculum for
students in school districts. HB3091 authorized courts to order an expungement
of an entire file and record of a Youthful Offender case.
In 2013, a large bill, SB679, resulting from the Juvenile Justice Reform
Committee established by the Legislature, consisted of changes to many areas
including, but not limited to, due process when a dispositional order undergoes
revocation or modification, strengthened court orders directing parents of
children who have orders for treatment, additional authority to detain a child,
sealing of child records, uniform intake process, court proceedings, OJA custody
youth, detention, diversion services, sexting, intoxication, interrogations,
adjudication hearings, assessments, and interlocal agreements.
In 2014, SB929 provided OJA standing in YO cases and allows for OJA custody
extended youth to be allowed to remain in detention and receive services.
SB1902 authorized the Board of Juvenile Affairs to serve as a governing body for
an OJA charter school and the Executive Director to provide administration and
operation of such a school.

Juvenile Justice
204 Oklahoma Senate Overview of State Issues
OFFICE OF JUVENILE AFFAIRS BUDGET
Funding for juvenile justice remains primarily a state responsibility. The federal
government provides modest funding for juvenile justice programs or services
through reimbursement from the Title XIX Medicaid program for youth who are
not institutionalized; pass-through and discretionary funding from the Juvenile
Accountability Block Grant (JABG); and Formula and Title V grant funding
from the Office of Juvenile Justice and Delinquency Prevention (OJJDP) of the
U.S. Department of Justice.
Appropriations and Total Budget FY’04 Through FY’17 (In Millions)
Appropriations to the agency were decreased during FY’10 due to the state
revenue failure caused by the recession. Monthly cuts of 5% began in August of
’09 and were increased to 10% beginning in December of ‘09 for the remainder
of the fiscal year. The net effect was a 7.5% reduction in state appropriations for
FY’10. Appropriations were reduced an additional 4.8% for FY’11. In addition,
the agency was required to carryover $912,464 in stimulus savings from FY’10
to FY’11. Appropriations were reduced for FY’12 to $96.2 million appropriated
and $112.9 million budgeted; and for FY’13 to $96.2 million appropriated and
$107.8 million budgeted. In FY’14, the appropriation was $98.2 million but the
$2 million increase was legislatively directed to Community Based Programs, an
increase of Level E rates, and to a group home in Lawton, Oklahoma. This
produced a net appropriated amount of $96.2 million for FY’14. In FY’15, the
appropriated amount was $96.5 million and the budgeted amount was $114.9
million. Additional reductions in appropriations were made in FY’16 and FY’17
due to continuing negative economic conditions.

Juvenile Justice
Oklahoma Senate Overview of State Issues 205
JUVENILE CRIME AND RECIDIVISM
The total number of juveniles adjudicated as delinquent decreased between
FY’10 and FY’16 (-16.9%). There was a slight decrease of the number of
youthful offenders during the same time
Adjudications of Juveniles by Type
FY’10 – FY’16
Source: Office of Juvenile Affairs – Juvenile On-Line Tracking System (JOLTS).
OJA PROGRAMS
In keeping with the agency’s mission, programs provided by the Office of
Juvenile Affairs can be divided into three categories:
Prevention programs, which aim to prevent and decrease juvenile
delinquency;
Intervention/treatment programs, which provide immediate consequences
and rehabilitation services for juveniles adjudicated for less serious offenses;
and
Detention/Secure Facilities programs, which protect the public from
juveniles who have been adjudicated for or are charged with violent or other
serious offenses.

Juvenile Justice
206 Oklahoma Senate Overview of State Issues
Prevention Community-Based Youth Services: Community-based Youth Services agencies
are the primary providers of prevention services for the juvenile justice system,
since part of their mission is to prevent youth from entering the juvenile justice
system.
The State of Oklahoma funds 42 Youth Services agencies serving all 77 counties
across the state and is responsible for providing a continuum of services. Youth
Services Agencies provide community educational programs to schools and
parent organizations, parenting classes, and family counseling (prevention
programs) as well as first-time offender and emergency shelter programs
(intervention programs). Some also subcontract with municipalities to operate
community intervention centers serving as temporary holding facilities for youth
arrested on minor charges when their guardians cannot immediately be located.
During FY’10, Youth Services agencies received nearly $23.3 million in state
funding. In FY’15, Youth Services received $21,305,255 from the $96,499,033
appropriated to OJA. During FY’16 and through FY’17, budgets for Youth
Services was reduced by 5.75%
Intervention/Treatment Programs Graduated Sanctions: This program is a community-based initiative focused on
preventing juveniles who have committed non-violent minor offenses from
committing more serious and/or violent crimes. In previous years, it has been
funded by the federal government under the Juvenile Accountability Block Grant
(JABG) and by community donations. The federal funding which supported this
program has undergone a gradual reduction. State dollars have been appropriated
to allow for continued existence of these community-based services. For FY’10,
nineteen communities had graduated sanctions programs in operations. During
FY’11 and FY’12, the number of communities providing the graduated sanctions
program declined. For FY’15, twelve communities have graduated sanctions
programs in operation. For FY’17, eleven communities have graduated sanctions
programs in operation.
Youth arrested for minor offenses (such as vandalism or petty larceny) are
referred to the sanctions program. The youth and their parent are given the option
to participate in the sanctions program or go through the juvenile justice system.
If the family elects to participate in the program, the youth appears before a
community board. The board determines the appropriate consequences and
treatment plan based on the individual needs of the youth. A variety of
consequences and services are ordered by the community boards to assist the
youth with learning responsibility through community accountability. Each
program is unique to the geographic location and the community it serves.
Services and/or consequences may include counseling, community service
projects, life skills programs, and Saturday school.

Juvenile Justice
Oklahoma Senate Overview of State Issues 207
First Offender: This curriculum-based program is primarily state-funded and
administered by Youth Services agencies across the state. The program is
designed to intervene and prevent identified community youth from further
involvement in the juvenile justice system. Youth served under this program have
committed minor offenses such as being truant, violating curfew, and shoplifting.
Parents and youth must apply to participate in the program; it provides eight
weeks of counseling and instruction on anger management, responsible decision-
making and appropriate behavior. State law allows district attorneys to defer
further prosecution of juveniles who successfully complete the program.
Juveniles Completing First Offender Program
FY’10 – FY’16
Source: Office of Juvenile Affairs – Juvenile On-Line Tracking System (JOLTS).
Detention State funds are provided for 309 secure detention beds located in 17 counties.
These centers provide secure detention to juveniles arrested for serious crimes as
well as juveniles placed in state’s custody and awaiting placement in an OJA-
operated or contracted facility. State reimbursement for these centers varies
according to facility capacity and during FY’10 the OJA budget for detention
centers was reduced by 7.5% and sustained a further reduction during FY’11 of
4.4%. In FY’13, funding for the 11.9% in previous cuts was restored to the
detention centers. In FY15, due to budget constraints, OJA reduced detention
center funding by 3.5%. In FY16, detention rates were reduced 5%, and were
reduced another 2% for FY’17.

Juvenile Justice
208 Oklahoma Senate Overview of State Issues
Residential services are provided to adjudicated youth in the custody of the
Office of Juvenile Affairs for serious property crimes and violent offenses.
Services range from foster homes to medium-security institutions. During
FY’10, the OJA contract for the 30-bed program operated by the Oklahoma
Military Department was cancelled due to the state’s budget shortfall. The
program had served 90 chronic property offenders a year. All OJA placements
incorporate educational services either at a local school, as in the case of foster
care, or on-site at the facility, as in group homes and secure institutions.
Therapeutic Foster Care (TFC): TFC is a contracted service for youth who
need medical and therapeutic services but can be served outside of a
psychiatric facility. The agency contracts for approximately 20 beds costing
$33.80 per day with an annual cost of $12,337 per bed.
Specialized Community Homes: These are homes of individuals in the
community who provide room and board for up to four youths. The
contractors are professional social service providers who offer intensive,
individually focused therapeutic intervention programs. In FY’11, OJA had
a reduction from six to two homes, as the annual salary reduced from
$38,000 to $31,500. In addition to salary, providers receive $22.63 per day
in foster care maintenance payments for each child they are serving. In
FY’12, the number of Specialized Community Homes increased to three
homes and OJA restored the annual salary back to $38,000 for the three
homes. In FY’14, OJA lost one of the Specialized Community Homes due
to the operator’s retirement. OJA currently funds 2 Specialized Community
Homes.
Level E Group Homes: These staff secure group homes have a highly
structured environment and regularly scheduled contact with professional
staff. Crisis intervention is available through a formalized process on a 24-
hour basis. Youth in this category display extreme anti-social and aggressive
behaviors and often suffer emotional disturbances as well. The state
contracts with private providers for 226 Level E beds at an average cost of
$138.20 per day.
Secure Institutions: Secure institutions are locked and fenced facilities that
provide OJA’s most intensive level of residential programming. They are
reserved for youth whose behavior represents the greatest risk to the public
and to themselves. The agency operates 3 institutions: the Southwestern
Oklahoma Juvenile Center in Manitou (64 beds), and the Central Oklahoma
Juvenile Center in Tecumseh (80 beds) and the Oklahoma Juvenile Center
for Girls (19 beds).

Juvenile Justice
Oklahoma Senate Overview of State Issues 209
Juveniles 17 or Under Released from
Residential Treatment Facilities
FY’10 – FY’15
Source: Office of Juvenile Affairs – Juvenile On-Line Tracking System
Follow-up and Aftercare Research shows that an essential part of successful rehabilitation of delinquent
youth includes a program of six to twelve months of follow-up/aftercare that
includes both surveillance as well as therapeutic counseling services. OJA
provides the surveillance and Youth Services Agencies provide the therapeutic
counseling through their Community At-Risk Services (CARS) program. The
CARS program was implemented in FY’00 for individual, group and family
counseling, as well as school reintegration. All youth exiting group homes or
institutions are eligible for CARS services, while other at-risk youth may also
receive services in order for them to remain at home. During FY’10 the CARS
program was reduced by 7.5% and was reduced a further 4.4% during FY’11. In
FY’12, partial funding of approximately one-fifth of the previous reductions was
restored to the CARS program. In FY’16 and FY’17 budgets for community-
based services including CARS services were reduced approximately 5.75% due
to the decrease in the agency’s appropriation.

Juvenile Justice
210 Oklahoma Senate Overview of State Issues
Juveniles Completing CARS Program
FY’10 – FY’16
Source: Office of Juvenile Affairs – Juvenile On-Line Tracking System

STATE PERSONNEL ISSUES
Section Information Prepared By:
Jason Deal
Fiscal Analyst (405) 521-5766 [email protected]


Oklahoma Senate Overview of State Issues 213
STATE PERSONNEL ISSUES
Total State Government Employment State agencies paid an average of 70,943 full-time-equivalent employees in FY
2016, according to data provided by the Budget division of the Office of
Management and Enterprise Services. This total includes an average of 34,829
FTE at state higher education institutions and 36,114 at Executive Branch
agencies.
Note: The numbers above are yearly averages. Source: Budget Division of the Office of Management and Enterprise Services

State Personnel Issues
214 Oklahoma Senate Overview of State Issues
State Employee Salaries The average state employee earns $43,881 per year (according to Office of
Management and Enterprise Services data, which excludes higher education
agencies). State employees’ salaries have increased an average 8.4 percent over
the last five years.
Average Oklahoma State Employee Salary FY’10 through FY’16
Fiscal Year Average Salary Percent Change
2010 $39,842 0.90%
2011 $40,026 0.50%
2012 $40,483 1.20%
2013 $40,966 1.20%
2014 $42,108 2.79%
2015 $43,133 2.43%
2016 $43,881 1.73%
Source: Office of Management and Enterprise Services
Total Remuneration Study In 2012, the State contracted for a Total Remuneration Study for all executive
branch employees. The purpose of this study was to take a comprehensive look at
salary and benefits for both classified and unclassified employees and compare to
jobs in both the private and public sectors. The study began by the formation of a
committee with representation from the Governor’s office, Senate, House of
Representatives, State Agencies, Oklahoma Public Employee Association, and
the State’s Human Capital Management Division. This committee defined the
State’s competitive market, set the desired position in relation to this market, and
drafted the State’s compensation philosophy. Once the competitive market was
determined, benchmark jobs were selected and compared to similar positions in
the market. Overall, the study found that state employees were paid below their
counterparts in both the public and private sectors, but in many cases had a richer
benefits package. The study concluded with recommendations and a five year
plan for implementing them.
In the 2014 legislative session, SB 2131 was passed to provide pay raises for the
job categories identified by the study as being most underpaid. Also passed in
that session was HB 3293, which codified the State’s compensation policy. It
directed the establishment of an effective pay for performance plan and removed
most salaries from statute, both recommendations of the study. Approximately
12,378 employees at 25 state agencies received raises under the provisions of SB
2131. These raises averaged between 5% and 13.5%.

State Personnel Issues
Oklahoma Senate Overview of State Issues 215
PAY RAISE HISTORY Year Status
FY’17 No Pay Raise
FY’16 No Pay Raise
FY'15 A pay raise was passed to provide pay raises for the job categories identified by the total remuneration study as being most underpaid. (SB 2131, SB 232)
FY’08 – FY’14
No Pay Raise
FY’07 5 percent annual across-the-board raise provided for all state employees effective October 1, 2006. (SB 82XX)
FY’06 $700 annual across-the-board raise provided for all state employees effective July 1, 2005. (HB 2005)
FY’05 $1,400 annual across-the-board raise provided for all state employees effective January 1, 2005 (HB 2005).
FY’04 No Pay Raise
FY’03 No Pay Raise
FY’02 No Pay Raise
FY’01 $2,000 annual across-the-board raise provided for all state employees effective October 1, 2000 (SB 994).
FY’00 2 percent pay increase, with a minimum provision of $600 and a maximum provision of $1,000, for all state employees effective July 1, 1999 (SB 183).
FY’99 4 percent pay increase, with minimum provision of $1,250 and a maximum provision of $2,000, for all state employees effective January 1, 1999 (HB 2928).
FY’98 No Pay Raise
FY’97 $1,200 annual across-the-board raise for agency employees. Also, an allied health pay plan gave a 10 percent raise to about 900 health care workers (SB 846).
FY’96 No Pay Raise
FY’95 $800 annual across-the-board raise for agency employees beginning October 1, 1994 (SB 870).
FY’94 No Pay Raise
STATE EMPLOYEE BENEFITS PACKAGE
The state employee benefits package consists of paid annual and sick leave; a
defined benefit retirement plan or a deferred compensation retirement plan; and
group health, life, and disability insurance.
Generally, employees pay the following costs of benefits:
3.5 percent of salary paid to the Oklahoma Public Employees Retirement
System (OPERS). However, contributions differ for employees in other
retirement systems (see Retirement Benefits);
supplemental life insurance premiums (optional);
federally mandated social security tax and Medicare tax; and

State Personnel Issues
216 Oklahoma Senate Overview of State Issues
effective January 1, 2016, employees under the age of 50 may defer up to
$18,000 annually while employees 50 or over may defer up to $24,000 per
year into a defined contribution retirement plan unless they were hired after
November 1, 2015.
16.5 percent of salaries paid to OPERS;
a benefits allowance ranging from $640.98 to $1,677.96 in Plan Year (PY)
2016, depending on whether an employee chooses to buy coverage for
dependents (see Group Health Insurance Benefits). The state funds 75
percent of the monthly group health insurance premiums for dependents;
$25 per month matching employer contribution for employee participants of
the state’s deferred compensation program; and
federally-mandated social security tax and Medicare tax.
RETIREMENT BENEFITS
The state has seven state retirement plans. OPERS is the main retirement system,
covering two of every three state employees. The normal retirement age for state
employees is 62 for those who became a member of OPERS before November 1,
2011. The normal retirement age for those who became a member of OPERS on
or after November 1, 2011, is 65. The employee must have at least six years of
full-time-equivalent employment. Any employee retiring on or after this age is
entitled to an annual benefit equal to 2 percent of the employee's final average
salary, multiplied by the number of years of credited service. For example, an
employee retiring at the age of 62 with a final average salary of $25,000 and 30
years of credited service would receive an annual retirement benefit of $15,000
(2% x 30 years x $25,000).
Employees may elect to receive a greater retirement than that listed above. By
contributing an additional 2.91 percent of all gross salary, an employee will
receive a 2.5 percent multiplier rather than a 2 percent multiplier for all years of
service in which the greater contribution was made.
Statutes also allow state employees to retire under the "Rule of 80" or "Rule of
90", depending on the date the member joined the system. To qualify for
retirement under this option, the sum of the employee's age and years of credited
service must equal 80 or 90. Thus, an employee 55 years of age with 25 years of
service may retire with full benefits under the "Rule of 80”. Persons who become
a member of OPERS on or after November 1, 2011, can retire at the “Rule of 90”
if they are at least 60 years of age.

State Personnel Issues
Oklahoma Senate Overview of State Issues 217
Another option for state employees is early retirement. To qualify, an employee
must be at least 55 years of age and have a minimum of 10 years of credited
service for those who became a member of OPERS before November 1, 2011.
For those who became a member of OPERS on or after November 1, 2011, the
minimum age for early retirement is 60.
Another benefit to retirees is a state contribution of $105 per month credited
toward group health insurance costs. The monthly health insurance premium for
retirees under the age of 65 is equal to the monthly premium for active employees
(commonly known as the blending of rates).
In addition to OPERS, there are six state retirement systems with their own
unique rules and regulations: the Oklahoma Teachers’ Retirement System
(OTRS), the Uniform Retirement System for Justices and Judges (URSJJ), the
Oklahoma Police Pension and Retirement System (OPPRS), the Oklahoma Law
Enforcement Retirement System (OLERS), the Oklahoma Firefighters Pension
and Retirement System (OFPRS), and the Oklahoma Wildlife Conservation
Retirement System.
In 2015 OPERS established Pathfinder, a defined contribution system for
members initially employed on or after November 1, 2015. Pathfinder is a
defined contribution retirement savings program composed of a 401(a) plan for
mandatory contributions and a 457(b) plan for additional voluntary contributions.
The first component of the Pathfinder plan is the 401(a) plan. Employees hired
after November 1, 2015 will be enrolled in the 401(a) and have a mandatory
contribution of 4.5% of their pre-tax salary go into the plan. Their employer also
contributes 6% of their pre-tax salary into the plan. Contributions and any
earnings grow tax-deferred until money is withdrawn, usually during retirement.
The second component of Pathfinder is the 457(b) plan where employees can
elect to contribute more than the mandatory 401(a) contribution of 4.5%. As with
the 401(a) plan, contributions and any earnings in the 457(b) grow tax-deferred
until money is withdrawn. The employer is also required bump up its match
from 6% to 7% if employees increase their pre-tax salary contribution to 7% or
more.
Employee Contribution Employer Match
Minimum 4.5% 6.0%
Less than 7.0% 6.0%
7.0% or Above 7.0%
There are legislative procedures which govern the consideration of certain
retirement measures. The Oklahoma Pension Legislation Actuarial Analysis Act
requires legislation pertaining to OPERS, URSJJ, OTRS, OPPRS, OLERS and
OFPRS to be subject to review by an actuary that contracts with the Legislative
Service Bureau. Legislation relating to these systems is identified by an RB

State Personnel Issues
218 Oklahoma Senate Overview of State Issues
number and the Legislative Actuary makes a determination whether such a
measure does or does not have a fiscal impact. A retirement bill deemed not to
have a fiscal impact may be introduced, considered and enacted during either
session of a Legislature. Legislation which is deemed to have a fiscal impact
must be introduced during the first session of a Legislature. For such legislation
to be considered, the legislation must first be submitted by the committee of
which the legislation was assigned to the Legislative Actuary for an actuarial
investigation. Once the investigation is completed, retirement measures having a
fiscal impact can only be considered, passed and enacted during the second
session if the concurrent funding associated with such measure is also provided.
FUNDING PERCENTAGE OF OKLAHOMA TEACHERS
RETIREMENT SYSTEM (OTRS) AND
OKLAHOMA PUBLIC EMPLOYEES RETIREMENT SYSTEM (OPERS)
GROUP HEALTH INSURANCE BENEFITS
State employees are offered a benefit allowance to pay for mandated and optional
coverages as well as assist employees in the cost of covering dependents. The
benefit allowance is based on the following formula:
Monthly premium of the Health Choice high option health plan
Plus
Average monthly premium of all dental plans
Plus
Basic life insurance monthly premium
Plus
Basic disability monthly premium
Equals
Employee Only Flexible Benefit Allowance
Beginning January 1, 2013, the benefit allowance shall not be less than the plan
year 2012 benefit allowance amounts.

State Personnel Issues
Oklahoma Senate Overview of State Issues 219
Dependents are covered at 75 percent of the monthly premium of the Health
Choice high option health insurance plan. The benefits allowance is used to
purchase the options the employees want. They must select coverage for
themselves in the following areas: medical, dental, life, and disability. If the total
price of the options selected by the employees is less than the benefit allowance,
they receive the difference as taxable income. If the cost of the options selected
by the employees is more than the benefit allowance, the employees may elect to
pay for the excess through pre-tax payroll deductions.
The state offers its employees a standard indemnity plan (HealthChoice) or health
maintenance organizations (HMOs). The basic differences between the medical
plans include: cost; choice of doctors and hospitals; how the employee and the
plan share expenses through deductibles, co-payments, and coinsurance; and the
maximum the employee has to pay out of pocket.
School district employees are also offered a benefit allowance to pay for coverage
for the group health insurance plan offered by the state or the self-insured plan
offered by the school district. Full-time certified and support personnel electing
health insurance coverage will receive an allowance in the amount equal to the
Health Choice Hi-option. Personnel not electing coverage may receive $189.69
per month in taxable compensation. There is no benefit allowance provided to
school district employees for dependent coverage.
The cost of health benefits to state employees and their families has been
increasing steadily over the past decade as the premiums increase each year.
Small changes to the benefit plan and other adjustments have allowed rates to
remain fairly constant the last three years. The monthly benefit allowance cost to
state agencies has remained unchanged since 2013.


PUBLIC SAFETY AND CORRECTIONS
Section Information Prepared By:
Will Robinson
Fiscal Analyst (405) 521-5670 [email protected]


Oklahoma Senate Overview of State Issues 223
PUBLIC SAFETY AND CORRECTIONS
Department of Corrections This chapter describes the state prison system, summarizes recent initiatives and
concerns, and compares significant historical figures.
Organization of the Prison System There are 24 prisons - 18 public and 6 private - scattered throughout the state. Of
the six private prisons, three (Davis, Cimarron, and Lawton) hold Oklahoma
inmates exclusively. Starting in 2016, the North Fork facility will be operated
and leased by DOC at no charge for the first 18 months. With Great Plains
receiving a 10 year contract to house federal inmates, Diamondback remains the
only private prison currently vacant.
With the transfer of prisoners from the Oklahoma State Reformatory to the newly
leased North Fork facility, DOC has enacted a cost saving consolidation of all 15
work centers into the OSR in Granite. DOC continues to operate 7 community
corrections centers and contracts with 11 privately operated halfway houses and
12 county jails to house inmates.
As of September, 2016, the Department had a 106% occupancy-rate at state
facilities and a 97% occupancy rate in contract beds. It also supervised 25,031
offenders on probation, 2,568 on parole and 630 on GPS monitoring.
Private Prisons (owner) City Capacity Opened
Great Plains Correctional Facility (Cornell) Hinton 2,000 1991 North Fork Correctional Facility (CCA) Sayre 2,400 2000 Diamondback Correctional Facility (CCA) * vacant Watonga 2,160 1998 Davis Correctional Facility (CCA) Holdenville 1,620 1996 Cimarron Correctional Facility (CCA) Cushing 1,720 1997 Lawton Correctional Facility (GEO) Lawton 2,526 1998
State Prisons - Maximum Security
Oklahoma State Penitentiary McAlester 1,115 1908 Lexington Assessment and Reception Center Lexington 418 1978

Public Safety and Corrections
224 Oklahoma Senate Overview of State Issues
State Prisons - Medium Security City Capacity Opened
Oklahoma State Reformatory *includes 200 min. beds Granite 999 1909
Dick Conner Correctional Center *includes 236 min. beds Hominy 1,196 1979
Joseph Harp Correctional Center Lexington 1,405 1978
Mack Alford Correctional Center *includes 263 min. beds Stringtown 805 1973
James Crabtree Correctional Center *includes 200 min. beds Helena 969 1982
Lexington Correctional Center *includes 267 min. beds Lexington 1,020 1978
Mabel Basset Correctional Center (Female) *includes 264 min. beds McLoud 1,136 1998
State Prisons - Minimum Security
Jackie Brannon Correctional Center McAlester 737 1985
Jim Hamilton Correctional Center Hodgen 706 1969
Jess Dunn Correctional Center Taft 982 1980
John Lilley Correctional Center Boley 836 1983
Northeast Oklahoma Correctional Center Vinita 501 1994
William S. Key Correctional Center Ft. Supply 1,087 1988
Howard McLeod Correctional Center Atoka 616 1961
Bill Johnson Correctional Center Alva 630 1995
Eddie Warrior Correctional Center (Female) Taft 783 1988
INMATE DEMOGRAPHICS
The statistics below are a snapshot of the demographics of the inmates in DOC
custody taken in July, 2016.
Inmate Count = 28,364
Gender Percentage
Male 88.47%
Female 11.53%
Ethnicity Percentage
Caucasian 54.94%
African American 25.79%
Native American 10.83%
Hispanic 7.83%
Other 0.62%
Crime Type Percentage
Violent 48.95%
Non-Violent 51.05%
Average Age 38.5
Offenders on Death Row 46
Offenders in for Life without Parole 888
Offenders in on 85% Laws 7,852

Public Safety and Corrections
Oklahoma Senate Overview of State Issues 225
Growth in the Prison System The number of inmates in DOC custody has grown by 9% since 2007 while the
appropriation has returned below 2007 levels due to the budget shortfall. The
2017 budget for DOC comprises 7.02% of the total state appropriated budget.
The chart below shows the fiscal year-end inmate counts and appropriated
budgets for DOC since FY 2007.
A major reason for the growth in the prison population is the increasing number
of inmates DOC receives each year. In 2014, statute changes allowing for faster
document transfers were instituted as well as DOC initiating the depopulating of
county jails. As a result, DOC annual receptions are at all-time highs as the chart
below shows.
*Current receptions thru September 2016

Public Safety and Corrections
226 Oklahoma Senate Overview of State Issues
DEPARTMENT OF CORRECTIONS BUDGET
Sources of Funding Almost all funding for DOC comes from state appropriations. Revolving funds
are generated from sales of products and services to inmates (canteen sales), and
from sales of inmate-produced products and services through Oklahoma
Correctional Industries and Agri-Services to state agencies and private
purchasers. Federal funds are generally grants for specific treatment or
rehabilitation programs.
FY'17 DOC Budget by Source
Appropriated Funds
$483,400,943
88.85%
Revolving Funds
$58,817,962
10.81%
Federal Funds
$1,865,139
0.34%
Total Funding
$544,084,044
100.00%
Costs of the Prison System
CURRENT ISSUES AND TRENDS
Staffing Issues The at-capacity or over-capacity levels at DOC facilities and the Department’s
consistent budget struggles have put a strain on DOC employees. The agency
has struggled to deal with poor morale, high turnover rates, high over-time
expenditures and low corrections officer-to-inmate ratios.

Public Safety and Corrections
Oklahoma Senate Overview of State Issues 227
In an attempt to address some of these issues, the Legislature authorized a pay
raise of 8% for many DOC employees during the 2014 session. The pay raise did
not apply to every employee of the agency. The pay raise was granted mainly to
front line security personnel. The chart below compares Correctional Officers to
the inmates directly under their supervision for the last 10 fiscal years.
Pay Raises for Other Public Safety Employees SB 2131 gave a 6.25% pay raise to many employees in the public safety and
judiciary area. The positions affected were identified by OMES using the
compensation study commissioned by the Governor in 2013.
Agency # of Employees Affected
ABLE Commission 22
Attorney General 38
Bureau of Investigation - OSBI 171
Council on Law Enforcement Education & Training - CLEET 1
Fire Marshal 14
Narcotics & Dangerous Drugs Control - OBNDD 79
Pardon and Parole Board 21
Public Safety Department 271

Public Safety and Corrections
228 Oklahoma Senate Overview of State Issues
OTHER AGENCIES
Board of Medicolegal Investigations Another area of concern in the public safety sector is the Board of Medicolegal
Investigations which lost its national accreditation in 2009 primarily due to
inadequate staffing, excessive workload and a lack of sufficient space. The
Agency is in the process of construction for the OKC location with an expected
completion of mid-2017. In order to regain its national accreditation, the Tulsa
building must be constructed and equipped to meet national standards and staff
will need to be increased for both the Tulsa and OKC locations.
Department of Public Safety The Department of Public safety currently has 807 state troopers over 195 of
which are eligible for retirement. Included among the 807 troopers are the 29
probationary troopers from the 63rd
Highway Patrol Academy who will become
full troopers in January of 2017.
According to DPS, the pay raise that went into effect in FY 2015 has increased
the entry level law enforcement positions from 25th
in the state to 6th
and
supervisory positions from 19th
to 9th
. These new salaries are more competitive
and have increased the caliber of the applicant pool. However, due to the budget
shortfall, the 64th
Highway Patrol Academy has been delayed and will not take
place in FY 2017. This is the first year that there will not be a trooper academy
since FY 2011 and only the fifth time in the last 20 fiscal years. With the delay of
the 64th
Academy, a drop in trooper count similar to 2010 can be expected.

TOURISM AND OKLAHOMA HISTORICAL SOCIETY
Oklahoma Department of Tourism and Recreation
Oklahoma Historical Society
Section Information Prepared By:
Quinten Dilbeck
Fiscal Analyst (405) 530-2384 [email protected]


Oklahoma Senate Overview of State Issues 231
OKLAHOMA DEPARTMENT OF TOURISM AND RECREATION
In Oklahoma, tourism offers its citizens two important commodities: economic
development opportunities and recreational resources. The Oklahoma
Department of Tourism and Recreation (OTRD) is the state agency that promotes
development and use of the state parks, resorts and golf courses. The department
also advances tourism by publicizing information about recreation facilities and
events.
OTRD operates the following state facilities:
33 state parks;
5 lodges;
7 golf courses; and
9 Tourism Information Centers.
ECONOMIC IMPACT OF TOURISM
In 2015, Oklahoma tourism generated nearly $8.6 billion in domestic travel
spending, a 19.5% increase over 2012, according to the Oklahoma Tourism and
Recreation Department.
It is estimated that tourism accounts for 95,800 jobs in Oklahoma, amounting to
more than $2.1 billion in payroll for 2015. In addition, tourism contributes to the
development of the workforce for the companies that supply goods and services
to the travel industry, from real estate brokers to cleaning services to grocery
stores to gas stations.
In 2012, tourism contributed more than $979 million in federal, state, and local
taxes. Travel-generated tax revenue is a significant economic benefit because
governments use these funds to support travel infrastructure and help support a
variety of public programs. Each dollar spent by domestic travelers in Oklahoma

Tourism and Oklahoma Historical Society
232 Oklahoma Senate Overview of State Issues
produced 10 cents for federal tax coffers, five cents in state tax receipts, and two
cents in local tax funds.
Domestic Travel Spending in Oklahoma (Billions of Dollars)
Source: U. S. Travel Association; OTRD
STATE PARKS
Oklahoma features an extensive range of state park resources. From large state
parks like Beavers Bend and Lake Murray, to the geographical dispersion of the
parks throughout the state like Black Mesa and Natural Falls, park visitors can
enjoy a multitude of natural resources. Oklahoma State Parks offer a great
ecological diversity from the woodlands and lakes of the southeast to mesas and
deserts of the panhandle. In fact, mile for mile, Oklahoma has the most diverse
terrain in America. All parks offer a great array of natural environments which
welcome both expert and novice nature enthusiasts.
Oklahoma's 33 state parks serve approximately 9.5 million visitors annually.
State Park Attendance in Oklahoma (In Millions)

Tourism and Oklahoma Historical Society
Oklahoma Senate Overview of State Issues 233
The parks consist of more than 330 cabins and cottages and around 2,000
structures and buildings. Private entrepreneurs operate over 50 leased
concessions. These operations provide numerous services and recreational
opportunities for guests, from miniature golf and horseback riding to marinas and
restaurants.
Recent legislation has provided new funds for extensive capital improvement to
the state parks system. In the 2006 legislative session, Tourism was directed to
receive a share of the REAP funds from gross production on oil and gas taxes.
On a continuing basis, the department will be receiving a portion of the REAP
funds, and the sales and use tax revenues.
The portion of the REAP funds will be used to address environment
improvements such as potable water, wastewater infrastructure, and conservation
planning. The department can spend up to $15 million of REAP funds per fiscal
year. Total receipts for FY’16 were $1.88 million.
The Department of Tourism receives 0.87% of sales and use tax revenues each
year to help support its operations and to perform capitol repairs and renovations
to state parks. This apportionment totaled $14 million in FY’16.
STATE GOLF COURSES
The state owns and operates seven golf courses:
Arrowhead Golf Course, Canadian
Cedar Creek Golf Course, Broken Bow
Fort Cobb Golf Course, Fort Cobb

Tourism and Oklahoma Historical Society
234 Oklahoma Senate Overview of State Issues
Grand Cherokee Golf Course, Langley
Lake Murray Golf Course, Ardmore
Roman Nose Golf Course, Watonga
Sequoyah Golf Course, Hulbert
During the peak season, about 30 full-time employees work with 60 seasonal
employees and volunteers to operate the courses located throughout the state. In
FY’16, the courses generated over $2.1 million in revenue. In FY’16, 65,000
rounds of golf were played. Flooding in 2015 severely affected revenue and
caused significant damage and temporary closures.
State Golf Course Statistics
FY’08 Through FY’15
(In Thousands)
FY'10 FY'11 FY'12 FY'13 FY'14 FY'15 FY'16
Total Rounds Played 79 70 72 71 69 55 65
State Appropriations $1,345 $699 $173 $112 $237 $210 $58
Total Golf Visitor Revenue $2,340 $2,157 $2,197 $2,186 $2,231 $1,800 $2,087
Revenue as a % of Total Budget 64% 76% 85% 84% 67% 55% 61%
Total Golf Expenditures $3,657 $3,221 $2,575 $2,614 $2,902 $2,836 $2,667
Profit/Loss (Inc. minus Exp.) -$1,317 -$365 -$378 -$427 -$671 -$1,036 -$580
OKLAHOMA TOURISM MARKETING
A recent study of the return on investment for marketing Oklahoma Tourism
concluded that for every dollar invested returns seven dollars in state and local
tax revenue.
During the first half of 2015, the $2.2 million invested in the Oklahoma Tourism
and Recreation Department’s advertising campaign generated:
1.22 million new visitors who would not otherwise have come to Oklahoma
$205 million in additional visitor spending
$9 million in incremental state tax revenue
$6.5 million in incremental local tax revenue

Tourism and Oklahoma Historical Society
Oklahoma Senate Overview of State Issues 235
STATE LODGES
The Resort Division maintains five lodge properties, all located within our state
parks. Each of our facilities include lodge rooms and cabin accommodations and
offer amenities such as restaurants, meeting space, catering, recreational facilities
and programs. Further, each of our resort parks provide our guests the
opportunity to golf, fish, hike and indulge in a myriad of other activities. The
lodges are geographically distinct and located throughout the state:
Sequoyah Lodge is in the northeast section of the state, located near
Wagoner, in the Sequoyah State Park;
Lake Murray Lodge is in south central Oklahoma, just outside of Ardmore
and within the Lake Murray State Park;
Roman Nose Lodge is found in the Roman Nose State Park close to
Watonga, in the central portion of the state;
The Lakeview Lodge is in the southeast area of the state, near Broken Bow,
within Hochatown State Park; and
The Belle Starr Lodge is located in the Robbers Cave State Park near
Wilburton, in southeast Oklahoma.
Each lodge is designed with a theme reflecting the history of its area and the type
of recreation it provides.
For FY’16, the lodges generated $5.413 million in revenue.
OKLAHOMA TOURISM INFORMATION CENTERS
Information Centers serve as an information resource and rest area for travelers
along Oklahoma’s major highways and interstates.
Oklahoma has 11 Information Centers:
Thackerville (operated by the Chickasaw Nation)
Capitol Building, Oklahoma City
Midwest City (operated by the City of Midwest City)
Miami
Sallisaw
Colbert (operated by the Choctaw Nation)
Blackwell

Tourism and Oklahoma Historical Society
236 Oklahoma Senate Overview of State Issues
Erick
Catoosa (operated by the Cherokee Nation)
Oklahoma City
Cherokee Turnpike in Delaware County (operated by the Cherokee Nation)
These facilities are located at various points of entry to the state, in the major
metropolitan areas, and the state capitol building. These 11 centers provide
tourism-related materials to over 1.83 million visitors per year. Studies have
demonstrated that for every three visitors who stop at a tourism information
center, one is influenced to extend their stay in Oklahoma; thereby, additional
dollars are added to the state and local economies.
OKLAHOMA TODAY MAGAZINE
Oklahoma Today covers the people, places, history and culture of Oklahoma in a
manner designed to encourage readers to explore the state and its people.
As the official state magazine, Oklahoma Today tells the historic and
contemporary story of Oklahoma to a worldwide audience. The magazine is
published bi-monthly beginning in January and ending in November. An extra
issue, the Year in Review, is published in late January.
Oklahoma Today is produced by a staff of seven full-time employees. The
magazine also relies on the talent of freelance writers, photographers and art
directors. Oklahoma Today has a paid circulation of almost 27,000 and a
readership of approximately 132,000. The magazine is distributed to newsstands
in Oklahoma and surrounding states and is available on selected newsstands and
bookstores nationwide.
Oklahoma Today has received multiple awards for excellence. Named “Best
Magazine in Oklahoma” for 2007, 2010 and 2012 by the Society of Professional
Journalist, Oklahoma Today has won the coveted "Magazine of the Year" title six
times since 1991 by the International Regional Magazine Association (IRMA).
OKLAHOMA FILM AND MUSIC COMMISSION
The office of the Oklahoma Film and Music Commission promotes, supports and
expands film, television and music activities in Oklahoma. Activities of the
division include research, scouting and evaluation of locations for film and
television productions and coordinating the activities of the productions and the
communities in which they shoot. That includes permitting, arranging clearances

Tourism and Oklahoma Historical Society
Oklahoma Senate Overview of State Issues 237
and serving as a liaison between the productions and state and location officials,
institutions, businesses and the media.
The division administers three incentive programs: The Oklahoma Film
Enhancement Rebate Program, the Point-of-Purchase Oklahoma Sales Tax
Exemption and the Construction Tax Credit.
The Oklahoma Film Enhancement Rebate program, funded up to $5 million per
year in 2016, offers a 37 percent rebate to qualifying production’s expenditures in
Oklahoma with a minimum $50,000 budget and a minimum $25,000 Oklahoma
expenditure.
The Point-of-Purchase Oklahoma Sales Tax Exemption is offered to qualifying
productions on goods and services to be used in the production. There is no
minimum budget or expenditure requirement. This exemption cannot be used in
conjunction with the 37% rebate.
Films made in Oklahoma in 2015 and 2016
“Rust” (2016)
“Great Plains” (2016)
“Pax Masculina” (2015)
“Heartland” (2015)
“The Scent of Rain and Lightning” (2015)
NACEA
The Native American Cultural and Educational Authority (NACEA) was created
in 1994 to construct and operate the American Indian Cultural Center and
Museum for generating awareness and understanding of the history of tribes and
their relationship to Oklahoma today. Originally, the state would cover one-third
of the construction cost, the federal government would cover one-third, and the
final third would come from private donations or the tribes. The total cost of
construction was estimated at $150 million. However, due to budget restraints,
the federal government will not be able to fulfill its portion of the funding.
Therefore, during the 2008 session the Legislature authorized another bond for
$25 million to further fund the construction of the center.
To date, state funding for construction of the center is a total of over $67 million.
Overall, funding for the center has reached over $91 million. NACEA will need
another $80 million to complete the project, through a mix of state funding and
pledges from private and local entities.

Tourism and Oklahoma Historical Society
238 Oklahoma Senate Overview of State Issues
Of the $80 million needed to complete the Cultural Center, about $50 million
will be used to complete the construction of the facility, and $30 million will be
used to purchase and develop the museum exhibits.
Legislation was passed in 2015 that will transfer the property and the museum
back to the city of Oklahoma City, along with another $25 million in bond funds,
if the city agrees. Oklahoma City reached an agreement with the Chickasaw
Nation earlier this year to operate the completed museum for 7 years. The city
committed $9 million in capital funds toward the museum’s completion. The
remaining funds needed to complete the museum will come from private and
tribal donations.
The NACEA will receive a $6.024 million appropriation for the 2017 fiscal year.
A large majority of NACEA’s yearly appropriations are used to pay debt service
on the previous bond issues. For FY’17, debt service payments will amount to
about $5.2 million. The remaining amount of appropriations will fund NACEA
operations. The majority of operations expenses for NACEA include salaries,
insurance premiums, and the museum site maintenance and security.

Oklahoma Senate Overview of State Issues 239
OKLAHOMA HISTORICAL SOCIETY
The Oklahoma Historical Society (OHS) is a statewide organization dedicated to
collecting, preserving, and sharing the history of Oklahoma and its people.
Through programs and partnerships, the OHS accomplishes its mission through
research collections, artifacts and historic sites, museums, educational programs,
historic preservation, images, and publications.
History of the OHS The Oklahoma Press Association created the OHS in 1893 to collect newspapers.
As a result of that early action, the OHS has collected and preserved more than
98% of all newspapers issued in the twin territories and state since 1844,
representing the history of every community one day, one week at a time.
Through this partnership, all publishers in the state still send free copies of their
newspaper to the OHS for microfilming and digitization.
The OHS is the oldest state agency still in operation. The people of the territory,
through their council members, made the OHS a government agency in 1895, an
endorsement that was followed in 1907 with status as a state agency as well as a
private-membership organization. Since that time, the people of the state have
invested in the old Historical Building (now the Supreme Court Building), the
Oklahoma History Center, and a long list of historic sites and museums across
the state. Today, the OHS is an affiliate of the Smithsonian, the National
Archives, and the National Park Service.
Education The ultimate outcome of all OHS programs is education. Through collections,
programs, and historic preservation, the OHS provides a bridge from the past to
the present, offering insights into who we are, how we got here, and how we have
dealt with challenges and opportunities in the past. This educational outreach
empowers not only students across the state, but also the adult population through
continuing education in the form of museums, historic sites, books, magazines,
newspaper articles, documentaries, and news sources.

Tourism and Oklahoma Historical Society
240 Oklahoma Senate Overview of State Issues
More than a third of all people visiting OHS museums and historic sites are
students, including home schoolers who are offered special programs throughout
the year. One program that has been expanding in recent years is History Day, a
national competition that starts at schools, progresses to regional competitions,
and advances to state finals before going to nationals in Washington, D.C. This
past year History Day as administered by the OHS reached 5,985 students in
more than 20 counties, making Oklahoma number one in the nation on a per-
student basis.
Collections The ability to offer educational outreach is based on collections and the
information each object, document, site, or building represents. The collections
started with newspapers in 1893 but quickly expanded to documents such as
photographs of the first land runs, more than 4 million pages of tribal history
gathered by the Dawes Commission in the 1890s, and the notes and draft copies
of the Constitutional Convention in 1906 and 1907. Among the half million
artifacts in the collections are a bison-hide teepee made and painted in the 1850s,
a stage coach used in the Wild West Shows, and the objects recovered from the
airplane crash that killed Wiley Post and Will Rogers.
In the 1930s the collecting process was expanded to buildings and historic sites,
such as Fort Gibson, established in 1824, and Sequoyah’s Cabin, built by the
Cherokee genius in the 1820s. As support for a growing museum community
expanded in the 1950s and 1960s, the OHS acquired key sites and museums to
preserve and share the stories of Indian history, land runs, farming, oil and gas,
and leadership. From books and photographs to maps and biographical files, the
collections of the OHS help us trace our shared history one community, one
family at a time.
Historic Forts and Battlefields—5
Historic Homes—8
Museums—11
33 million pages of newspapers
12 million photographs and maps
500,000-plus artifacts
1,400 buildings and districts on the National Register of Historic Places
58,000 buildings and sites on Oklahoma Landmark Inventory

Tourism and Oklahoma Historical Society
Oklahoma Senate Overview of State Issues 241
Partnerships While the core mission of the OHS is to collect, preserve, and share history, the
key practices to achieve that mission include higher standards, greater
efficiencies, and increased partnerships. The results of higher standards include
the Route 66 Museum in Clinton, which is still grossing more than $400,000 a
year, and the Oklahoma History Center, an affiliate of the Smithsonian and the
National Archives, the only institution in the country that shares that dual
affiliation.
Along with the higher standards came what OHS leaders call an “entrepreneurial
business plan,” based on the principals of free enterprise and sustainability. Using
state appropriated dollars as seed money for planning, core staff, and innovative
leadership, the OHS has attracted a long list of partners willing to share
collections and resources. Good examples include the $12 million raised to
complete the Oklahoma History Center, the $8 million raised by the people of
Enid to re-invent a regional museum, and a new contract with Ancestry.Com to
share collections with an international audience and generate a stream of revenue
at the same time.
A partial listing of contractual partners includes:
25 separate 501c3 non-profit organizations supporting units of the OHS
Oklahoma Higher Education Heritage Society
Oklahoma Military Hall of Fame
Oklahoma Law Enforcement Hall of Fame
Western District of Federal Courts Historical Society
Oklahoma Energy Resources Board
Oklahoma Regents for Higher Education
Numerous Indian Tribes
Colonial Williamsburg and Mount Vernon
Economic Impact Although it is difficult to place a monetary value on state pride, sense of
community, and life-long learning, we can follow a few OHS trails to establish
an economic impact on the state. The greatest impact is on heritage tourism, an
important building block in an industry that made an $8.6 billion impact on the
economy last year. Although Oklahoma is a beautiful state, there are only a few
natural resources to attract tourists so the attraction has to be landmarks,
buildings, and stories associated with Oklahoma history, whether it is Indians,
cowboys, land runs, Route 66, architecture, or oil.

Tourism and Oklahoma Historical Society
242 Oklahoma Senate Overview of State Issues
A more direct reflection of economic development is the rehabilitation of historic
buildings. Through a contract with the National Park Service, the OHS serves as
the state clearing house for projects utilizing the economic stimulus of tax credits
for bringing historic buildings back to life. In the last decade, the state and
federal tax credits administered by the OHS have been used on 77 buildings,
generating $520 million in investments and creating 3,232 direct jobs and 3,514
indirect jobs. One national study concluded that every dollar spent on historic
rehabilitation spurs an additional $11.70 in economic activity. In 2016
rehabilitation projects in Oklahoma generated more than $20 million in
paychecks.

TRANSPORTATION
Section Information Prepared By:
Jason Deal
Fiscal Analyst (405) 521-5766 [email protected]


Oklahoma Senate Overview of State Issues 245
TRANSPORTATION
The mission of the Oklahoma Department of Transportation (ODOT) is to
provide a safe, economical and efficient transportation network for the people,
commerce and communities of Oklahoma. Because many experts cite quality
roads as an essential element in creating and maintaining healthy economies,
Oklahoma’s legislative leaders have made an effort to reverse the state’s
historically low investment in transportation issues. This chapter summarizes the
challenges facing ODOT and highlights recent initiatives intended to create
solutions.
BACKGROUND
In 2005, ODOT released a comprehensive highway needs study which calculated
a $11.2 billion backlog of construction needs on state highways. At that time,
state fuel taxes were the only significant source of revenue for highway
construction, and a projected fuel tax growth of 2 percent annually would never
bridge the gap between revenues and needs.
To address these funding shortfalls, both ODOT and the Legislature have enacted
various policies over the past decade:
The department outsourced more functions, particularly mowing and
engineering;
The Legislature authorized the use of more inmate labor for routine
maintenance projects (litter removal, guardrail repair and other manual
tasks);
The legislature created the ROADS fund, which will infuse $2.8 billion to the
ODOT construction program between FY’08 and FY’17.

Transportation
246 Oklahoma Senate Overview of State Issues
State Funding Comparison
FY2015
State State State
Lane
Funding for
Funding per
State Miles Highways Lane Mile
Arkansas 37,566 $601,099,094 $16,001
Colorado 23,021 $719,545,951
$31,256
Kansas 23,988 $610,013,000
$25,430
Louisiana 39,230 $618,500,000
$15,766
Missouri 77,409 $1,202,500,000
$15,534
New Mexico 30,934 $403,009,828
$13,028
Oklahoma 30,367 $659,313,069
$21,711
Texas 195,245 $5,589,830,301 $28,630
TRANSPORTATION BOND ISSUES
In an effort to address the state’s highway needs, the Legislature adopted HB
1629 (1997), which provided a plan for $1.01 billion in new revenues for
highway construction. Using a combination of appropriated funds and bond sale
proceeds, the Capitol Improvement Program (CIP) nearly doubled the annual
amount spent for state highway construction. Of the $1.01 billion total, $560
million was provided as direct appropriations to ODOT and another $450 million
was raised through bond financing.
Beginning in 2006 under HB 1176, ODOT is now liable for the CIP debt service.
As the debt service requirement is reduced the difference between the annualized
amount and the debt service requirement will be available for roads and bridges.
Three state bond issues have been passed in recent years to supplement ODOT’s
funding and to cover recent decreases to the State Transportation Fund. The
Oklahoma Capitol Improvement Authority was responsible for issuing the bonds:
2008 (HB 2272)
Authorized the sale of $300 million in bonds in two issues; the first $150 million
no earlier than August 1, 2009 and the second $150 million no earlier than August
1, 2010.
2010 (HB 2434) Authorized ODOT to increase the August 1, 2010 bond issue amount to cover
ODOT’s FY’11 appropriation decrease and continue funding road and bridge
improvements.
2011 (HB 2171)
Authorized ODOT to issue a $70 million dollar bond issue to cover ODOT’s
FY’12 appropriation decrease and continue funding road and bridge
improvements.

Transportation
Oklahoma Senate Overview of State Issues 247
2016 (HB 3231)
Authorized the sale of $200 million in bonds to offset the reduction of $200
million in cash from the ROADS fund as part of FY 2017 state budget
reductions.
CROSS-TOWN EXPRESSWAY – OKLAHOMA CITY
In May 2002 the Federal Highway Administration (FHWA) approved ODOT’s
Crosstown Expressway project, the largest single such undertaking in
Department history. ODOT, the FHWA, the City of Oklahoma City and the
general public had labored since 1996 to solve the problem of an ever-growing I-
40 traffic load with the least impact on the affected area and community. The
now former roadway was designed to accommodate 70,000 vehicles per day;
today’s traffic count numbers 100,000 daily users. Because of the age of the
roadway and the increased traffic, it became clear that prompt action was
necessary to keep traffic safe and flowing.
Eastbound lanes of traffic on the new Crosstown Expressway were opened in
January 2012 with the westbound lanes following in February 2012. The newly
opened Crosstown is designed to carry 173,000 vehicles a day and includes five
driving lanes in each direction.
Reusable steel beams from the old Crosstown Bridge were made available to the
counties for use on the county road system.

Transportation
248 Oklahoma Senate Overview of State Issues
FUNDING FOR STATE HIGHWAYS
Total monies available for support of the state transportation system have
increased by $127.3 million or 8.6 percent between FY’06 and FY’16. This is
largely due to the increase in deposits to the ROADS fund.
ODOT Revenue Sources Comparison
FY'06 to FY'16
FY'06
FY'16
Funding Source
Dollars (in Millions)
Percent of Total
Dollars (in Millions)
Percent of Total
Appropriation
$ 204.4 13.9%
$ 184.9 11.5%
Revolving/Carryover
$ 303.7 20.6%
$ 281.5 17.6%
Federal Funds
$ 951.1 64.5%
$ 700.0 43.7%
ROADS Fund
$ 16.0 1.1%
$ 436.1 27.2%
Total
$ 1,475.2 100.0%
$ 1,602.5 100.0%
Highway construction projects have a significant impact on the economy of
Oklahoma. ODOT reports that for every $1 million in highway construction
projects granted to an Oklahoma-based contractor, about 90 jobs are created and
about $840,000 are expended on indirect salaries and materials.

Transportation
Oklahoma Senate Overview of State Issues 249
ROADS FUND
During the 2005 session a historic piece of legislation was passed that would help
infuse funds into the Oklahoma Department of Transportation for years to come.
HB 1078 created the Rebuilding Oklahoma Access and Driver Safety (ROADS)
Fund. Initially, the fund would provide funding for the maintenance and repair of
state highways and bridges and would increase incrementally ($17.5 million if
the percentage of General Revenue Fund growth is less than 3 percent compared
to the previous year, $35 million if growth is 3 percent or better) until reaching
the amount of $170 million.
Many changes and modifications have been made to the ROADS fund since its
inception to dramatically increase funding for the State’s transportation
infrastructure. The 3% growth trigger was removed in 2008 which provided for a
consistent annual increase to the fund. The annual allocation has increased from
$30 million in 2008 to $41.7 million in 2012. The overall cap has been raised
from the original $170 million to $575 million in 2012. Below are the most
recent modifications to the fund:
2012 (HB 2248)
Increased the annual ROADS fund allocation from $41.7 million to $59.7
million.
Increased the overall cap on the fund from $435 million to $575 million.
$0
$100,000,000
$200,000,000
$300,000,000
$400,000,000
$500,000,000
$600,000,000
2014 2015 2016 2017 2018 2019
$352,100,000
$411,800,000
$452,269,915
$511,969,915
$571,669,915 $575,000,000
ROADS Fund Revenue

Transportation
250 Oklahoma Senate Overview of State Issues
STATE ROAD AND BRIDGE SYSTEM STATISTICS
The chart below shows the number of roads and bridges in disrepair on the State’s
highway system.
31.4% 31.6% 30.5%
6.9%5.5% 4.7%
0%
10%
20%
30%
40%
FY 2014 FY 2015 FY 2016
State Roads and Bridges% Rated as Deficient
Roads Bridges
0
200
400
600
800
1000
1200
2004 2005 2006 2007 2008 2009 2010 2011 2012 2013 2014 2015
1168
1078989
913
831 797
706634
556
468
372321
Num
ber
of B
ridges
Program Year
On System Structurally Deficient Bridges
Based on year of actual inspectionBased on year of actual inspection

Transportation
Oklahoma Senate Overview of State Issues 251
COUNTY ROADS
In the 2006 Legislative Session, HB 1176 apportioned 5 percent of all fees, taxes
and penalties collected or received pursuant to the Oklahoma Vehicle License and
Registration Act to the County Improvements for Roads and Bridges (CIRB)
Fund for the fiscal year beginning July 1, 2007 (FY’08). This apportionment was
to grow to 10 percent in FY’09 and 15 percent in FY’10 for a total annual fiscal
impact of approximately $85 million;
In the 2012 Legislative Session, HB 2249 further increased funding to the County
Improvements for Roads and Bridges Revolving Fund. The measure gradually
increased the CIRB allocation from 15% to 20% over a 3 year period. In 2015,
HB 2244 capped the Fund’s revenue at $120 million per year. Below is an
illustration of the percentage of deficient bridges on the county system.
PORT OF ENTRY WEIGH STATIONS
On January 22, 2008, the Oklahoma Department of Transportation, the
Oklahoma Corporation Commission, and the Oklahoma Turnpike Authority
announced a landmark partnership effort to upgrade Oklahoma’s Port of Entry
facilities. Utilizing an estimated $81 million in funding originating from the
Oklahoma Petroleum Storage Tank Release Indemnity Program as provided by
the Corporation Commission, $11 million from the Turnpike Authority and $4
million from ODOT, the Department will develop eight new Port of Entry
facilities at Oklahoma borders.
33.1% 32.8%
26.9% 25.9% 25.1%22.4% 21.3%
0%
5%
10%
15%
20%
25%
30%
35%
2010 2011 2012 2013 2014 2015 2016
County Bridges% Rated as Sructurally Deficient

Transportation
252 Oklahoma Senate Overview of State Issues
To-date Ports of Entry facilities have been completed on the following four
locations; on Interstate 35 in Kay County at the Kansas state line, on Interstate 40
in Beckham County at the Texas state line, on Interstate 40 East in Sequoyah
County, and Interstate 35 south in Love County and are currently in service. All
currently available funding has been committed and the remaining three facilities
will be scheduled and advanced to construction as additional fiscal resources are
accumulated.
Illegally loaded or operated trucks have an adverse impact on the condition of our
transportation system and on the safety of the traveling public. These state-of-
the-art facilities will establish the front line necessary to create a more controlled
freight transportation environment on the highway system.
RAILROADS
Today, ODOT oversees and monitors five different railroad companies operating
on approximately 134 miles of State owned track, administers the Federal
Highway Administration’s (FHWA) Grade Crossing Safety Program (that
provides federal funds to make safety improvements to Oklahoma’s 3,800 at-
grade public railway / road intersections), manages Oklahoma’s Heartland Flyer
passenger rail service (Amtrak’s highest-rated train for customer satisfaction),
oversees rail company involvement for ODOT projects which touch on railroad
property, and seeks and develops federal funding opportunities to grow and
improve Oklahoma’s passenger and freight rail systems.

Transportation
Oklahoma Senate Overview of State Issues 253
Over the years the Department has developed public – private partnerships with
many Class III and Class I railroads to lease the majority of the State owned
mainline track in order to continue rail service for many Oklahoma communities
and businesses. Two of these leases were developed as long term lease to
purchase agreements, intended to eventually return these facilities to private
ownership. Following the maturation of these 30 year agreements, more than
350 miles of the State owned rail system was returned to private ownership in
2012, thus reducing total ownership from its peak of 882.
In August 2014, ODOT and Stillwater Central Railroad completed a $75 million
sale of the Sooner Sub rail line between Midwest City and Sapulpa. The sale was
a culmination of a 180 day process put into place in 2013 by the State
Legislature. The sale calls for plans to introduce a pilot program for passenger-
rail service, dubbed the "Eastern Flyer" connecting Midwest City and Sapulpa.
With the sale of the Sooner Sub rail line ODOT announced a $100 million
initiative to improve safety at the state's railroad crossings with most of the
money coming from the $75 million sale of the Sooner Sub. Improvements are to
be made at more than 300 rail crossings statewide and will add flashing lights
and crossing arms to many of the crossings. Federal funding and money from
railroad companies also will be used in the program, which should take three to
four years to complete.
Rail freight traffic continues to be the main source of railroad activity in the state.
An estimated 278 million tons of freight flows through the state each year with
many rail lines carrying 50 to 100 trains a day. Rail freight traffic will
experience significant growth over the next few decades. The number of trains on
some corridors is expected to double over the next 20 years, and the largest
growth in freight traffic per day is expected on the BNSF line in the northern part
of the state.

Transportation
254 Oklahoma Senate Overview of State Issues
OKLAHOMA TURNPIKE AUTHORITY (OTA)
Revenue OTA is a non-appropriated state agency that provides and administers the state’s
turnpike system. All revenues are derived from tolls, concessions, interest
income, and fines. Over the past several years the Oklahoma Turnpike System
has experienced a gradual increase in toll revenues, from $185.9 million in 2004
to a projected $259.5 million in 2016. This represents 40 percent growth, which
the Authority attributes to the completion of the additional lanes on the John
Kilpatrick and Creek Turnpikes, a 16 percent toll hike in 2009, along with natural
traffic growth. The Authority also benefits from 40% of its revenue coming from
out-of-state traffic. Although the Turnpike has never had to use them, a portion
of state excise taxes for fuels consumed on turnpikes is made available to the
agency for bond debt payments in the event that revenues fall short of debt
requirements,. Those fuel taxes are immediately remitted to the Oklahoma
Department of Transportation if not used by the Authority. In 2015
approximately $44.7 million was transferred. Since 1992, over $800 million of
fuel taxes has been remitted.
Financial Obligations The financial structure of the turnpike system is based on “cross-pledging”.
Costs incurred and revenues received are combined across the system. The total
debt is based on the entire system and not on an individual turnpike within the
system. “Cross-pledging” was approved by a referendum vote of the people in
1954 for the purpose of financing the construction of other key turnpikes. After
the January 1, 2016 debt payment of $95.3 million was paid, total outstanding
bond debt of the Authority is $880.3 million: $880.3 million in principal, with
$297.7 million in interest paid by the time the bonds are retired in 2031. Annual
payments stay fairly level until 2028 when they drop to around $36.4 million per
year.
Fiscal Responsibility The Authority carries the highest bond rating of any tolling entity in the US with
an Aa3 from Moody’s. This rating is the result of strong debt management
policies, an established and strong network, strong asset preservation practices
and independent oversight by Consulting Engineers, External Auditors, and
Traffic & Revenue Consultants. Because of the conservative fiscal policies of
the Authority, the OTA has kept the rate per mile charged to customers
approximately 57% below the national average for passenger vehicles and 62%
below the national average for commercial vehicles. Recent needed capacity
improvements (added lanes) were made in both Oklahoma City and Tulsa to
accommodate growing demand and was done so without increase tolls.

Transportation
Oklahoma Senate Overview of State Issues 255
Maintenance The Authority annually adopts a comprehensive capital plan. A major basis for
having a comprehensive capital plan is because an ongoing maintenance and
rehabilitation program will extend the useful life of the system. It is a “pay now”
or “pay a lot more later” proposition. The Turner, Will Rogers and H.E. Baily
Turnpikes are a part of the I-44 corridor which provides routes for commercial
shipments all throughout the country. 38% of the Authority’s toll revenues come
from Commercial traffic. Ensuring these as well as other turnpike corridors are
preserved to provide needed commerce and transportation is a key objective of
the Authority.
The OTA Capital Plan, which was started in 1994, identifies maintenance (repair,
rehabilitation, and improvement) expenditures on a five-year basis; it is updated
annually. The current Five-Year Plan (2016-2020) estimates expenditures of over
$413 million. These projects will be funded from unrestricted and restricted
funds of the Authority including Bond proceeds which are discussed on the
following pages.
System Statistics In January 1998, OTA was authorized to issue bonds for the construction of five
new turnpike completion and/or improvement projects: Kilpatrick, Turner,
Muskogee, Will Rogers, and H.E. Bailey. Bonds totaling $687 million were
issued that year. All projects were completed by 2002.
The two urban turnpikes, the Kilpatrick and Creek were completed in 2002 and
represent the busiest turnpikes on the Turnpike System. In order to address
traffic congestion issues, in August of 2011, the Authority was authorized to
issue bonds in order to add capacity on the busiest sections of these two roads.
Bonds totaling $159.7 million were issued in December of 2011. Both segments
were opened to traffic in the fall of 2013 and a substantial traffic increase is seen
on both segments to date which further confirmed the need for these
improvements.
Driving Forward On October 29, 2015, Governor Mary Fallin announced the “Driving Forward”
plan which consists of $892 million of projects to be financed with the proceeds
from revenue bonds issued by the Oklahoma Turnpike Authority over the next
three to four years. The proposed projects are listed on the following page:

Transportation
256 Oklahoma Senate Overview of State Issues
Gilcrease Expressway- consists of building a roadway connecting L.L. Tisdale
to I-44 and completes the Western loop around the Tulsa metro area. The
estimated cost of the project is $28 million.
Muskogee Turnpike-- consists of reconstruction of 9.5 miles of concrete
pavement between Creek Turnpike interchange and State Highway 51 near
Coweta. The estimated cost of this project is $30 million
Muskogee Turnpike-- consists of safety improvements and reconstruction of the
Coweta Toll Plaza. The estimated cost of this project is $12 million.
H.E. Bailey Turnpike --consists of safety improvements and reconstruction of
the Chickasha Toll Plaza. The estimated cost of this project is $12 million.
H.E. Bailey Turnpike-- consists of reconstruction of 7.5 miles of concrete
pavement between Bridge Creek and North Meridian Avenue near Newcastle.
The estimated cost of this project is $20 million.
Kilpatrick Turnpike-- consists of seven miles of new construction on a new
alignment to extend the Kilpatrick Turnpike from the current termination point at
I-40 to a new termination point at State Highway 152/Airport Road. This new
extension will connect SW OKC and the metro area at-large with the urban core.
It will increase access and offer another route to Will Rogers World Airport. The
estimated cost of this project is $190 million.
Eastern Loop-- consists of 21 miles of new construction on a new alignment to
connect I-40 and I-44 (Turner Turnpike) in Eastern Oklahoma County. The
estimated cost of the project is $300 million.
Turner Turnpike-- consists of widening the four-lane segment of the Turner
Turnpike near Tulsa to six lanes and adding lighting. The estimated cost of the
project is $300 million.
Oklahoma’s 605 total turnpike miles account for 5 percent of the state’s highway
system. This 605 miles of road ranks second nationally. By regional comparison
Kansas, a state demographically similar, has some 250 miles of turnpike roads.

Transportation
Oklahoma Senate Overview of State Issues 257
Turnpike Mileage/System Percentage
PIKEPASS The Oklahoma Turnpike Authority was one of the first turnpikes in the nation to
introduce roadway speed toll collection using automatic vehicle identification
(AVI) technology. This system, named PIKEPASS, was opened to its first
travelers in January 1, 1991. This enhancement improved ease and safety of
travel along all turnpikes, most importantly in the urban areas accommodating
multiple entry and exit points. To date, that system has more than 1.5 Million
participants. Approximately 72% of the Authority’s revenue is collected
annually through the PIKEPASS System.
Recent developments with the PIKEPASS System include interoperability with
the North Texas Turnpike Authority (NTTA) and the Kansas Turnpike Authority
(KTA). Beginning in 2014, customers of the PIKEPASS System were able to
travel on NTTA roadways and Kansas Turnpike Roadways using their
PIKEPASS.