Battery Storage Technologies for Electrical Applications - MDPI
Upload
khangminh22Category
view
0download
0
UNIVERSIDADE DE LISBOA
FACULDADE DE CIÊNCIAS
DEPARTAMENTO DE ENGENHARIA GEOGRÁFICA, GEOFÍSICA E ENERGIA
Overview of energy storage technologies for PV
systems
Tânia Sofia Varela Santos
Dissertação
Mestrado Integrado em Engenharia da Energia e do Ambiente
2015

UNIVERSIDADE DE LISBOA
FACULDADE DE CIÊNCIAS
DEPARTAMENTO DE ENGENHARIA GEOGRÁFICA, GEOFÍSICA E ENERGIA
Overview of energy storage technologies for PV
systems
Tânia Sofia Varela Santos
Dissertação
Mestrado Integrado em Engenharia da Energia e do Ambiente
Trabalho realizado sob a supervisão de
José Carlos Amador (Martifer Solar S.A.)
Jorge Maia Alves (FCUL)
2015

Resumo
Devido ao desenvolvimento tecnológico e às exigências da sociedade, o consumo de energia
elétrica tem vindo a aumentar. Com esta procura, foi necessário desenvolver novas formas de
produzir energia limpa, promovendo a diminuição de emissões de gases promotores de efeito
de estufa e da utilização de combustíveis fósseis.
Uma vez que as energias renováveis são variáveis no tempo e não despacháveis, é impossível
ter-se apenas produção de energia a partir de fontes renováveis. Para suprimir este problema,
pode-se recorrer ao armazenamento de energia.
Esta dissertação teve como objetivo identificar e analisar as várias tecnologias de
armazenamento de energia existentes. Foi feita uma comparação entre elas e identificada qual
a tecnologia que se adapta melhor a um sistema fotovoltaico.
Posteriormente foi feito um enquadramento das várias tecnologias em vários tipos de
aplicações, tais como, em aplicações comerciais e residenciais, aplicações em transportes, em
aplicações off-grid e na aplicação para integração com energias renováveis.
Foi feita também uma análise do mercado existente e onde estão presentes as oportunidades de
mercado (autoconsumo, retificação da rede e off-grid).
Por fim foi feito um estudo para três casos distintos, incluindo o dimensionamento de um banco
de baterias. A escolha das baterias foi feita através da análise das suas características e custos.
Palavras-chave: Energias renováveis, Fotovoltaico, Off-grid, Armazenamento, Bateria.

Abstract
Due to a development in technology and society’s requirements, the consumption of electrical
energy has been increasing. With this demand, it was necessary to develop new forms of
producing cleaner energy. This would consequently help promote a decrease in gas emissions,
related to the greenhouse effect and to the utilization of fossil fuels.
Renewable energy is known to be variable in time and not dispatchable. For these reasons, it is
impossible to obtain production of energy only from renewable sources. To suppress this
problem, storing energy can be a resolution.
The purpose of this dissertation was to identify and analyze various existent technologies used
in storing energy. They were also compared with each other. With the obtained information,
one technology was identified as the most suitable for a photovoltaic system.
An outline of various technologies in various types of applications was elaborated. This
includes commercial and residential applications, applications in transports, off-grid
applications and applications to integrate in renewable energies.
An analysis of the existing market and the location of market opportunities was also done (auto-
consumption, grid rectification and off-grid).
Finally, a case study for three different cases was developed including the sizing of a battery
bank. The choice of the batteries was done taking into account its characteristics and costs.
Keywords: Renewable Energies, PV, Off-grid, Storage, Battery.

Index
1. Introduction ......................................................................................................................... 1
2. Energy storage technologies (State of the art) .................................................................... 4
2.1 Storage of mechanical energy...................................................................................... 4
2.1.1 Reversible hydroelectric facilities (PHS) ............................................................. 4
2.1.2 Wheels of inertia .................................................................................................. 4
2.2 Storage of thermodynamic energy ............................................................................... 5
2.2.1 Compressed air (CAES) ....................................................................................... 5
2.2.2 Thermal energy systems ....................................................................................... 6
2.2.3 Systems with heat thermochemical materials ...................................................... 7
2.3 Storage of electrochemical energy .............................................................................. 7
2.3.1 Conventional batteries .......................................................................................... 7
2.3.2 Redox Flow battery – FB (redox flux) ............................................................... 28
2.3.3 Hydrogen ............................................................................................................ 33
2.4 Storage of electromagnetic energy ............................................................................ 36
2.4.1 Superconducting magnetic energy storage (SMES) ........................................... 36
2.4.2 Electric double layer capacitor system (EDLC) ................................................. 36
3. Overview ........................................................................................................................... 38
4. Applications ...................................................................................................................... 42
4.1 Applications for distributed energy storage ............................................................... 42
4.2 Industrial and commercial applications ..................................................................... 42
4.3 Residential applications ............................................................................................. 44
4.4 Applications for transports ........................................................................................ 45
4.5 Off-grid applications .................................................................................................. 46
4.6 Applications for integration with renewable resources ............................................. 47
5. Markets ............................................................................................................................. 49

5.1 Current markets ......................................................................................................... 49
5.2 Opportunities ............................................................................................................. 50
6. Case study: Integrating PV system – storage .................................................................... 52
6.1 Characterization of the system .................................................................................. 52
6.2 Choice of storage technology .................................................................................... 52
6.3 Sizing ......................................................................................................................... 53
6.3.1 10 kWp PV system ............................................................................................. 53
6.3.2 200 kWp PV system ........................................................................................... 55
6.3.3 2MWp PV system .............................................................................................. 56
7. Conclusions ....................................................................................................................... 58
8. References ......................................................................................................................... 59
9. Annex A – Theoretical characteristics of storage technologies ........................................ 62
10. Annex B - Batteries characteristics ............................................................................... 64
10.1 Classic OPzS Solar Battery Datasheet....................................................................... 66
10.2 ABSOLYTE GP Battery Datasheet ........................................................................... 69
10.3 Sonnenschein SOLAR Battery Datasheet ................................................................. 73
10.4 Sonnenschein A600 SOLAR Battery Datasheet ....................................................... 77
10.5 CellCube battery Datasheet ....................................................................................... 80
10.6 Redflow Batteries Datasheet ..................................................................................... 86
11. Annex C - Sizing ........................................................................................................... 88

Figure index
Figure 1- Storage demand for renewables in Europe [43]. ........................................................ 1
Figure 2- Classificação de tecnologias de armazenamento de energia consoante a sua função
[1]. .............................................................................................................................................. 2
Figure 3- Comparison of different storage technologies [34]. ................................................... 2
Figure 4- Technical maturity of different types of energy storage [35]. .................................... 3
Figure 5- Esquema de um sistema PV com baterias [2]. ........................................................... 3
Figure 6 - Illustration of reversible hydroelectric facilities [3]. ................................................. 4
Figure 7 - Layout of a flywheel [4]. ........................................................................................... 5
Figure 8- Illustration of CAES [3]. ............................................................................................ 6
Figure 9 - Sensible heat storage system [6]. ............................................................................... 6
Figure 10- Thermochemical heat system [7]. ...................................................................... 7
Figure 11- Diagram of the operation of a battery [8]. ................................................................ 8
Figure 12- Variation of the voltage with discharge time [9]. ..................................................... 8
Figure 13- Effect of discharge rate on available energy from a lead-acid battery [10]. .......... 10
Figure 14 - Variation of capacity with cycle numbers and DOD for shallow-cycle lead acid
battery [9]. ................................................................................................................................ 14
Figure 15- Impact of charging regime of battery capacity [9]. ................................................ 14
Figure 16 – Variation of battery capacity with discharging rates and temperature [9]. ........... 14
Figure 17 - Impact of battery capacity with DOD and temperature [9]. .................................. 15
Figure 18- Operation principle of a Ni-Cd cell [11]. ............................................................... 18
Figure 19- Relationship between battery capacity, voltage, pressure and temperature for
different charge rates [11]. ....................................................................................................... 19
Figure 20- a) discharge curves for a typical 1.2Ah Ni-Cd cell at different discharge rates b)
discharge curves for a typical Ni-Cd cell at different temperatures at C/2 rate [11]. .............. 19
Figure 21- Operation principle for a Ni-MH cell [11]. ............................................................ 21
Figure 22- Scheme of charging Zinc-air battery [13]. ............................................................. 22
Figure 23 - SBB battery [18]. ................................................................................................... 23
Figure 24- Li-ion battery [19]. ................................................................................................. 24
Figure 25- Charge/discharge process of Li-S battery [21]. ...................................................... 26
Figure 26- Comparing theoretical specific energy for different energy storage technologies [22].
.................................................................................................................................................. 27
Figure 27 - Schematic of a Li-air battery [22]. ........................................................................ 27

Figure 28- Schematic of a redox flow battery [25]. ................................................................. 29
Figure 29- RFB with 2 cells stack [26]. ................................................................................... 30
Figure 30- Schematic of a VRB [27]. ...................................................................................... 31
Figure 31- Schematic of a ZBB with 4 cells stacks [28]. ......................................................... 32
Figure 32- Schematic of the water electrolysis [29]. ............................................................... 34
Figure 33- Schematic of a fuel cell [30]. .................................................................................. 35
Figure 34- Comparison between the different types of fuel cells [31]. .................................... 35
Figure 35- Schematic of a SMES [32]. .................................................................................... 36
Figure 36- Schematic of an EDLC [33]. .................................................................................. 37
Figure 37- Power cost of storage technologies [43]. ................................................................ 38
Figure 38- Batteries specific energy. ........................................................................................ 40
Figure 39- Batteries life cycle. ................................................................................................. 40
Figure 40 - Batteries capital cost per cycle. ............................................................................. 41
Figure 41- Demand [36]. .......................................................................................................... 42
Figure 42- Industrial and commercial demand and irradiation for a typical December day. .. 43
Figure 43- Industrial consumption [37]. .................................................................................. 43
Figure 44- Residential demand [38]. ........................................................................................ 44
Figure 45- Residential demand with PV system and batteries [39]. ........................................ 45
Figure 46- Energy density for different types of lithium batteries [40]. .................................. 45
Figure 47- Fuel cell car [41]. .................................................................................................... 46
Figure 48- Off-grid application [42]. ....................................................................................... 47
Figure 49- Capital cost per cycle for different technologies. ................................................... 48
Figure 50- Energy storage capacity by project status and region [44]. .................................... 49
Figure 51- Advanced battery energy storage by segment, World Markets: 2012 [45]. ........... 50
Figure 52 - Energy storage in commercial buildings revenue and capacity by region [45]. ... 51

Table index
Table 1 - Power rating, discharge time and self-discharge for storage technologies [14,16]. . 39
Table 2- Batteries. .................................................................................................................... 52
Table 3- Batteries characteristics. ............................................................................................ 53
Table 4 - 10 kWp system characteristics. ................................................................................. 54
Table 5 - Batteries characteristics for 10 kWp system. ............................................................ 54
Table 6 - Batteries cost for 10 kWp system. ............................................................................ 55
Table 7 - 200 kWp system characteristics. ............................................................................... 55
Table 8 - Batteries characteristics for 200 kWp system. .......................................................... 55
Table 9 - Batteries cost for 200 kWp system. .......................................................................... 56
Table 10 - 2 MWp system characteristics. ............................................................................... 56
Table 11 - Batteries characteristics for 2 MWp system. .......................................................... 57
Table 12 - Batteries cost for 2 MWp system. ........................................................................... 57
Table 13- Sizing results. ........................................................................................................... 58
Table 14 - Theoretical characteristics of storage technologies [14,16,43]. .............................. 62
Table 15 - Batteries characteristics. ......................................................................................... 64
Table 16 - 10 kWp sizing. ........................................................................................................ 88
Table 17- 200 kWp sizing. ....................................................................................................... 89
Table 18 - 2 MWp sizing. ......................................................................................................... 90

Acronyms
EDLC Electric Double Layer Capacitor
SMES Superconducting Magnetic Energy Storage
PHS Pumped Hydroelectric Storage
CAES Compressed Air Energy Storage
TES Thermal Energy Storage
PV Photovoltaic system
DC Direct Current
AC Alternate Current
DOD Depth of Discharge
BSOC Battery State of Charge
FLA Flooded Lead Acid battery
VRLA Valve-Regulated Lead Acid battery
AGM Absorptive Glass Mating battery
Ni-Cd Nickel - Cadmium battery
Ni-MH Nickel and Metal Hydride battery
SBB Sodium – Beta alumina Battery
Na-Cs Sodium - Cesium
Li-ion Lithium Ion battery
EC-DMC Electrolyte type
Li-S Lithium – Sulfur battery
Li-air Lithium – Air battery
IEM Ion Exchange Membrane
FB Redox Flow Battery
VRB Vanadium Redox flow Battery
ZBB Zinc Bromine flow Battery
PSB Polysulfide Bromine battery
NTP Normal Temperature and Pressure
FCV Fuel Cell Vehicle
PVGIS Solar photovoltaic energy calculator and solar radiation database.

PEM Polymer Electrolyte Membrane fuel cell
AFC Alkaline Fuel Cell
PAFC Phosphoric Acid Fuel Cell
MCFC Molten Carbonate Fuel Cell
SOFC Solid Oxide Fuel Cell
UPS Uninterrupted Power System
EV Electric Vehicle
Nomenclature
P Power (W)
E Energy (Wh) or (J)
C Capacity (Ah)
V Voltage (V)
I Current (A)
𝜂𝐶 Coulombic efficiency (%)
𝑡𝑐 Charge time (s)
𝐼𝑐 Charging current (A)
𝑡𝑑 Discharge time (s)
𝐼𝑑 Discharging current (A)
𝜂𝑉 Voltage efficiency (%)
𝑉𝑐 Charging voltage (V)
𝑉𝑑 Discharging voltage (V)
Cd Cadmium
OH- Hydroxide ions
Cd(OOH)2 Cadmium hydroxide
NiOOH Nickel oxide
H2O Water
e- Electron
T Temperature (ºC)
MH Metal hydride
O2 Oxygen
La Lanthanum
Ce Cerium
Pr Praseodymium
Nd Neodymium
Ni Nickel
Co Cobalt
Mn Manganese
Al Aluminum
Ti Titanium
V Vanadium
Zr Zirconium

Cr Chromium
Zn Zinc
ZnO Zinc oxide
Eº Cell potential (V)
S Sulfur
Na Sodium
Li Lithium
LiCoO2 Lithium cobalt oxide
LiPF6 Lithium hexafluorophosphate
C Carbon
LiFePo4 Lithium iron phosphate battery
Li2S8 Cyclooctasulfur
Li2Sx Polysulfide
Br Bromine
Pb Lead
Fe Iron
H2 Hydrogen
V2O5 Vanadium oxide
H2S Sulfuric acid
𝜌 Density (J/kg)
L Inductance (H)
Ns Strings number
VDC DC voltage (V)
VB Battery voltage (V)
Np Number of batteries in parallel
CN Nominal capacity (Ah)
CB Battery capacity (Ah)
𝜂𝑖𝑛𝑣 Inverter efficiency (%)
𝜂𝑐𝑎𝑏 Cables efficiency (%)

Overview of energy storage technologies for PV systems
Tânia Sofia Varela Santos 1
1. Introduction
The search for electrical energy has shown to be increasing in the past few years. An increase
in gas emissions, and the consequent greenhouse effect, leads to an inevitable search for sources
of cleaner energies, in other words, renewable sources such as the sun and the wind. These
energy sources present a problem however, since they are variable in time and, in general, will
not completely fit the demand. For this reason, we need to use energy storage, that allows us to
store energy that is produced by the renewable source during low-peak hours and, when
necessary, inject into the grid during high-peak hours.
The focus on energy storage has been increasing in different sectors all over the world. In figure
1, the necessity for energy storage in Europe is shown. The residential sector reveals a
significant increase in the search for storage relatively to the commercial sector. In 2016, it is
expected that there will be about 220 MWh of storage capacity installed throughout Europe.
Figure 1- Storage demand for renewables in Europe [43].
Stored energy applications can be divided into two categories: power quality and reliability and
energy management. In power quality and reliability, the stored energy is used in high power
applications with relatively small energy content. The remaining applications of storage belong
into the category of energy management. Figure 2 shows the storage technologies and the
category they belong to.

Overview of energy storage technologies for PV systems
Tânia Sofia Varela Santos 2
Figure 2- Classificação de tecnologias de armazenamento de energia consoante a sua função [1].
In the category power quality and reliability, we can find the supercapacitors (EDLC), the
superconductors (SMES), the flywheels and the batteries. Other technologies including
reversible hydroelectric plants (PHS), compressed air (CAES), large scale batteries, fuel cells
and heat storage (TES) belong to the energy management category.
Due to the high cost of storing electrical energy, various forms of storage have been developed.
Energy can be stored in the form of mechanical energy, including PHS and flywheels. It can
also be stored in the form of thermodynamic energy, including CAES and TES, and in the form
of electrochemical energy that includes all kinds of batteries and hydrogen (fuel cells). A last
way of storing energy is in the form of electromagnetic energy that includes SMES and EDLC.
Figure 3 demonstrates the discharge times and the application that each technology fits into.
Figure 3- Comparison of different storage technologies [34].
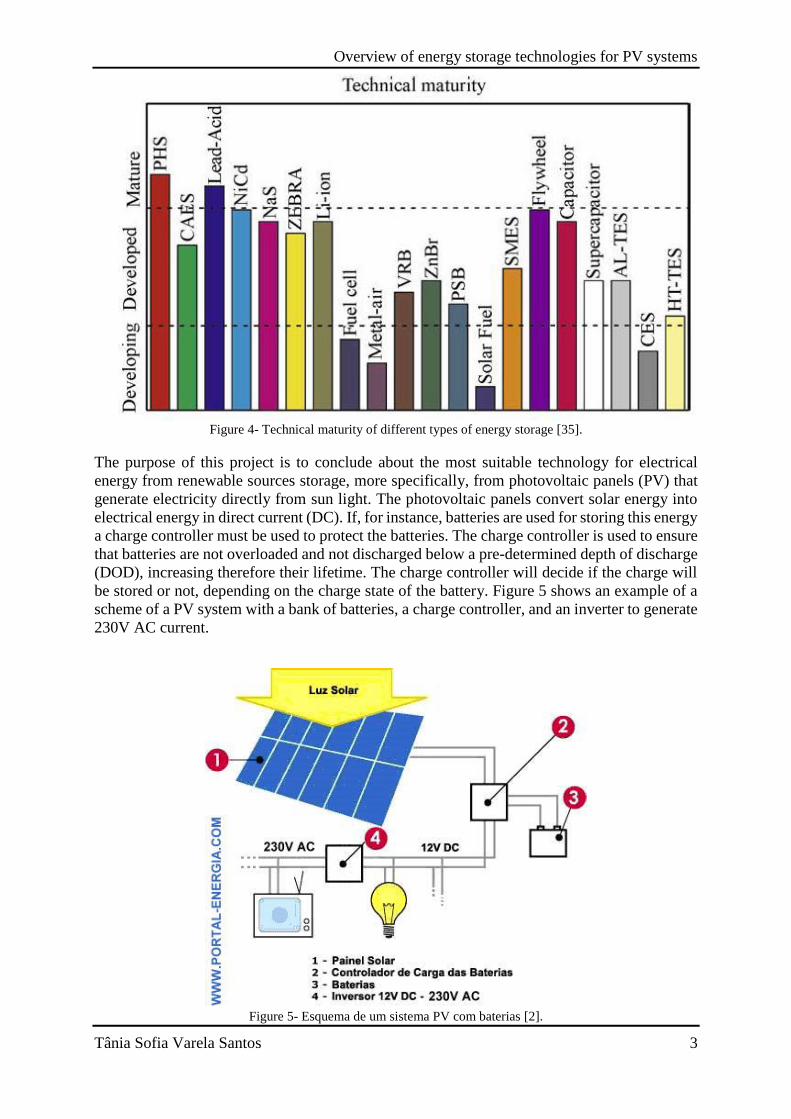
However, most of these technologies are still being developed. Figure 4 illustrates the maturity
of the different technologies.
Overview of energy storage technologies for PV systems
Tânia Sofia Varela Santos 3
Figure 4- Technical maturity of different types of energy storage [35].
The purpose of this project is to conclude about the most suitable technology for electrical
energy from renewable sources storage, more specifically, from photovoltaic panels (PV) that
generate electricity directly from sun light. The photovoltaic panels convert solar energy into
electrical energy in direct current (DC). If, for instance, batteries are used for storing this energy
a charge controller must be used to protect the batteries. The charge controller is used to ensure
that batteries are not overloaded and not discharged below a pre-determined depth of discharge
(DOD), increasing therefore their lifetime. The charge controller will decide if the charge will
be stored or not, depending on the charge state of the battery. Figure 5 shows an example of a
scheme of a PV system with a bank of batteries, a charge controller, and an inverter to generate
230V AC current.
Figure 5- Esquema de um sistema PV com baterias [2].

Overview of energy storage technologies for PV systems
Tânia Sofia Varela Santos 4
2. Energy storage technologies (State of the art)
2.1 Storage of mechanical energy
2.1.1 Reversible hydroelectric facilities (PHS)
This type of storage is done by increasing the water potential energy when the energy generation
exceeds consumption, raising it to a reservoir located at a height h. A fraction of this energy
can be recovered through a turbine coupled to a generator, when production does not meet
consumption (figure 6).
Due to its large capacity this energy storage technology is used in high power applications
(MW). It presents a low cost per cycle, however, the initial investment and maintenance costs
are very high, since it is necessary to have special landscape conditions.
Figure 6 - Illustration of reversible hydroelectric facilities [3].
2.1.2 Wheels of inertia
The wheels of inertia, also known as flywheels, store energy in a rotating mass. A quantity of
kinetic energy is stored as rotational energy, which depends on the inertia and the speed of
rotational mass. This kinetic energy is transferred into and out of the steering wheel, which is
inside a vacuum container to eliminate the air friction losses and suspended by bearings to a
more stable operation. This transfer is done via an electric machine which can operate as a
motor or generator, depending on the phase angle. When operating as a motor, the power
supplied to the stator winding is converted to binary and applied to the rotor, making it spin
faster and gain kinetic energy. The figure 7 shows the layout of a flywheel.
The flywheels are able to respond quickly, both on charging and discharging, but are unable to
have high storage capacity (figure 3). This makes them more suited to grid quality control. They
also have little resistance to external mechanical shocks which cause vibrations and result in
loss of power, the output voltage and frequency have large amplitude variations and features
gyroscopic effect.

Overview of energy storage technologies for PV systems
Tânia Sofia Varela Santos 5
Figure 7 - Layout of a flywheel [4].
2.2 Storage of thermodynamic energy
2.2.1 Compressed air (CAES)
CAES uses a standard gas turbine, which uses about two-thirds of the available energy for
compressing the combustion air in an underground cavern. The energy used to compress air is
the excess power produced by the renewable, which will later be recovered by expanding the
air in the combustion chamber then into the turbine (figure 8).
For the storage container be smaller, the air is compressed to high pressure (40-70 bar) and at
temperatures near ambient [3]. Normally, ancient reservoirs of salt mines or natural gas, which
are embedded in rocks of high quality for less losses possible of air mass.
From grid point of view the system efficiency is approximately 70% and the energy density is
in the order of 12 kWh / m3 [3]. However, this does not accounts for the fossil fuel energy (gas)
that is used in the recuperator to heat the gas after adiabatic expansion. To reduce operating
costs and have better efficiency, the system has to be controlled to minimize air leaks.
Overview of energy storage technologies for PV systems
Tânia Sofia Varela Santos 6
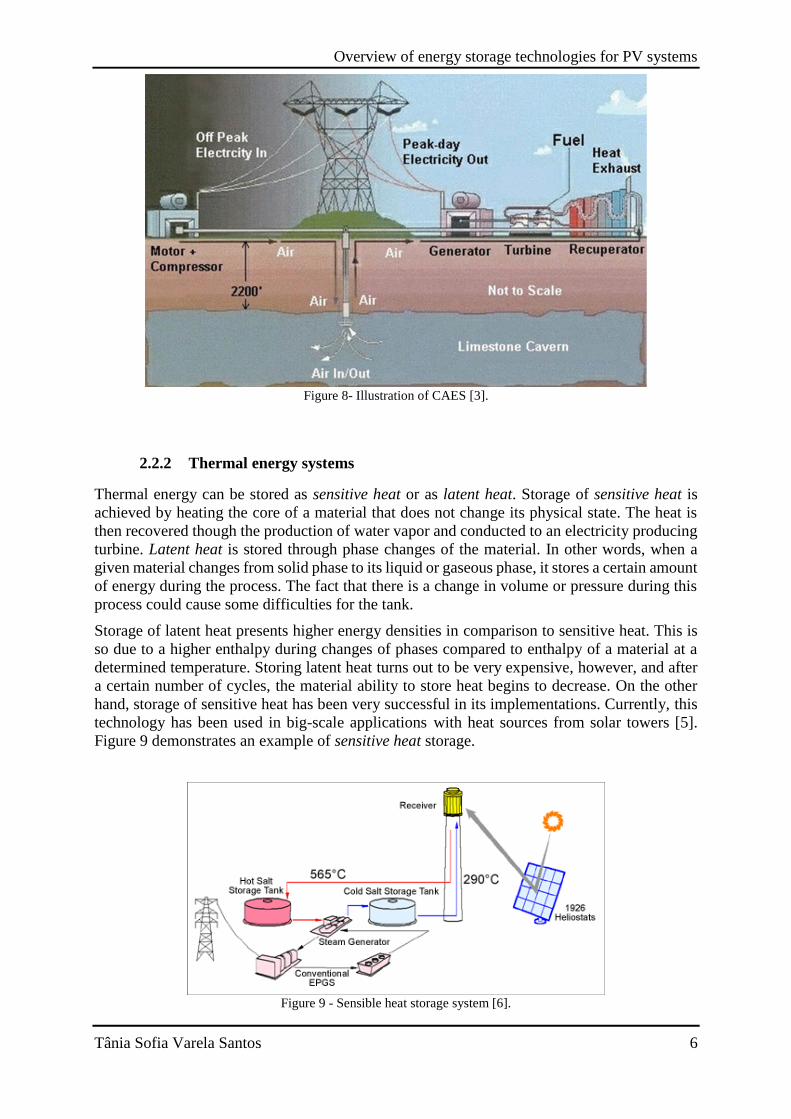
Figure 8- Illustration of CAES [3].
2.2.2 Thermal energy systems
Thermal energy can be stored as sensitive heat or as latent heat. Storage of sensitive heat is
achieved by heating the core of a material that does not change its physical state. The heat is
then recovered though the production of water vapor and conducted to an electricity producing
turbine. Latent heat is stored through phase changes of the material. In other words, when a
given material changes from solid phase to its liquid or gaseous phase, it stores a certain amount
of energy during the process. The fact that there is a change in volume or pressure during this
process could cause some difficulties for the tank.
Storage of latent heat presents higher energy densities in comparison to sensitive heat. This is
so due to a higher enthalpy during changes of phases compared to enthalpy of a material at a
determined temperature. Storing latent heat turns out to be very expensive, however, and after
a certain number of cycles, the material ability to store heat begins to decrease. On the other
hand, storage of sensitive heat has been very successful in its implementations. Currently, this
technology has been used in big-scale applications with heat sources from solar towers [5].
Figure 9 demonstrates an example of sensitive heat storage.
Figure 9 - Sensible heat storage system [6].

Overview of energy storage technologies for PV systems
Tânia Sofia Varela Santos 7
2.2.3 Systems with heat thermochemical materials
Storage of thermal energy in a chemical form has two main advantages: i)the significantly high
density of the stored energy; ii) the fact that the energy may be stored for a long period of time
with minimal losses. This technology, however, is still in development, searching for better
charge and discharge efficiencies and lower costs [7]. An example of a thermo-chemical storage
system is illustrated in the figure 10.
Figure 10- Thermochemical heat system [7].
2.3 Storage of electrochemical energy
2.3.1 Conventional batteries
Since batteries are the more common storage technology for PV systems, we will discuss deeply
their working principle, their constitution, their characteristics, what type of batteries do exist
and which one of them is more suited for this type of application.
Batteries are composed by a negative electrode (anode) and a positive electrode (cathode). The
anode, during discharge, provides electrons to the load that is connected to the battery. The
cathode accepts electrons from the load. There is also an electrolyte to complete the internal
battery circuit that provides ions to the electrodes. This electrolyte has a separator that prevents
the battery from experiencing short-circuit, and as a result, prevents the positive electrode to be
in internal contact with the negative. This separator must be porous to allow for the circulation
of ions from one side to the other. Figure 11 represents schematically the working principle of
a battery.

Overview of energy storage technologies for PV systems
Tânia Sofia Varela Santos 8
Figure 11- Diagram of the operation of a battery [8].
To obtain the desired capacity and output voltage, a multiple-cell battery is used, mounting the
cells in series and in parallel. For best performances and to ensure maximum lifetime, the cells
should all have the same capacity and, preferably, be, of the same brand and model.
All batteries have characteristics that define and distinguish themselves.
Battery voltage
The single cell open circuit voltage is determined by the chemical reactions in the battery, the
concentrations of the components and polarization. The nominal voltage is the output voltage
value when the battery is in equilibrium conditions, the open circuit measured voltage.
When putting multiple cells in series, it is possible to obtain higher voltages, for instance putting
6 cells with a voltage of 2 V in series generate a battery bank that has a voltage of 12 V.
o Voltage variation with discharge
The output voltage depends on the charge state of the battery and thus changes during the
discharge time. This variation may be due to the conditions of discharge, the concentration
levels and polarization. In figure 12, we can observe how typically the voltage changes with
discharge time, for different battery types.
Figure 12- Variation of the voltage with discharge time [9].

Overview of energy storage technologies for PV systems
Tânia Sofia Varela Santos 9
o Cut-off voltage
All batteries should not be fully discharged because this decreases the battery lifetime and may
lead to cell damage. For this reason, there is a level defined for how far they can be discharged.
This level is called "cut-off voltage" a value that depends both on the type of battery and on
temperature.
o Effect of temperature on voltage
With the increase of the system temperature, the battery voltage tends to decrease.
Battery charging and discharging parameters
The battery characteristics changes with the number of cycles of charge/ discharge.
o Battery state of charge (BSOC)
The battery state of charge (BSOC) is one of the most important parameters of batteries. This
is defined by the energy available taken as a percentage of the total battery capacity. For
example, if a battery has a BSOC of 80% and a nominal capacity of 500Ah, the stored energy
in the battery will be 400Ah.
o Depth of discharge (DOD)
As mentioned above, the battery should not be completely discharged. There is, therefore, a
parameter called depth of discharge (DOD) which represents the fraction of energy that can be
removed from the battery. The DOD value that does not compromise battery lifetime is
provided by the battery manufacturer. Using DOD values higher than this, will decrease the
lifetime of the battery and its capacity. On the other hand, the smaller the battery’s voltage
values, the greater its depth of discharge will be for the same amount of energy used.
o Daily depth of discharge
The Daily depth of discharge value is normally provided by the manufacturer. This value
determines the maximum amount of energy that should be extracted from the battery in a 24
hour period.
o Charging and discharging rates
The rate of charge and discharge is represented in amperes (coulombs per second) and
corresponds to the amount of energy added or removed from the battery per unit of time. That
is, it determines the amount of time that the battery takes to charge or discharge completely.
Typically this rate is represented by C/x, where C is the battery’s capacity and x is the number
of hours that the battery needs to charge or discharge.
o Charging and discharging regime
Each type of battery has different characteristics and different requirements for charging and
discharging processes. For example, the nickel cadmium battery should be almost completely
discharged before charging, while lead acid batteries should never be fully discharged. For this
reason different charge controllers, should be used for different battery types, since the voltage
and current during the charge cycle will be different.

Overview of energy storage technologies for PV systems
Tânia Sofia Varela Santos 10
Battery capacity
The battery capacity represents the maximum amount of energy that can be extracted from the
battery under specific conditions. However, when the battery is in different conditions, the real
battery capacity can be different from the nominal capacity. The battery capacity changes with
age, the regimes of loading and unloading and with temperature.
o Units of battery capacity: ampere hours
The energy stored in a battery can be measured in different energy units, such as watt-hour
(Wh), kilowatt-hour (kWh) and ampere hour (Ah). The most commonly used is Ah, which is
defined as the number of hours the battery can deliver a current, that is equal to the discharge
rate, at nominal voltage. The stored energy in Wh is the product of the load capacity Ah by the
nominal battery voltage. These variables will change over the time, as the battery is used.
o Impact of charging and discharging rate
The rate of charge and discharge affects the capacity of the battery. This phenomenon is due to
the fact that the components necessary for the reaction do not have time to get into their
positions and match up. Only a few ions will complete the reaction and then can recombine
later. It is best practice to discharge the battery slowly, using a low current, since this way more
energy can be extracted and the effective battery capacity will be higher.
Figure 13- Effect of discharge rate on available energy from a lead-acid battery [10].
o Temperature
The battery temperature also affects the battery capacity. In general, batteries at higher
temperatures should have a higher capacity. However, when the battery temperature increases,
there will be more losses due to Joules effect, which makes the battery capacity decreases and
consequently its lifetime as well. The optimum operation temperature for the battery is specified
by the manufacturer.
o Age and history of battery
Both the age and how the battery was used have a major impact on the capacity. Even following
the DOD specifications given by the manufacturer, the capacity of the battery will decrease
with the number of charge/discharge cycles. If the battery has been discharged below the DOD,
the battery capacity may decrease, as well as its lifetime.

Overview of energy storage technologies for PV systems
Tânia Sofia Varela Santos 11
Battery efficiency
The battery efficiency is a very important parameter. It is the result of two efficiencies:
coulombic efficiency and voltage efficiency. The global efficiency of the battery is the product
of the two efficiencies.
o Coulombic efficiency
The coulombic efficiency (𝜂𝑐) is the ratio between the charge recovered during the battery’s
discharge and charge injected during the battery’s charging. This efficiency may decrease due
to losses caused by secondary reactions, such as water electrolysis. Normally, the coulombic
efficiency is around 95% and can be determined using the following equation:
𝜂𝑐 =∫ 𝐼𝑑𝑑𝑡𝑡𝑑0
∫ 𝐼𝑐𝑑𝑡𝑡𝑐0
(1)
Where, 𝑡𝑑 is discharge time, 𝐼𝑑 is discharge current, 𝑡𝑐 is charge time and 𝐼𝑐 is charge current.
o Voltage efficiency
The voltage efficiency (𝜂𝑣) is the ratio between the average voltage during discharge (𝑉𝑑) and
the average voltage during charging (𝑉𝑐).
𝜂𝑣 =𝑉𝑑
𝑉𝑐 (2)
We can then obtain a global efficiency of the battery:
𝜂𝐵 = 𝜂𝑣𝜂𝑐 =𝑉𝑑 ∫ 𝐼𝑑𝑑𝑡
𝑡𝑑0
𝑉𝑐 ∫ 𝐼𝑐𝑑𝑡𝑡𝑐0
(3)
Energy, volumetric and power density
o Specific and volumetric energy density
The energy density is a parameter used to compare different types of storage technologies, in
particular, different batteries. The volumetric energy density is the amount of electrical energy
stored per unit battery volume, and is expressed in Wh/m3. There is also a gravimetric energy
density is given by Wh/kg, that is, the amount of energy stored per unit weight. For the same
stored energy a battery having a higher energy density will be lighter than a battery having a
lower energy density, which means, that this parameter is very important for portable systems.
o Power density
The power density is an important parameter for applications where dispachability is important,
such as for transports, however it is not very important for photovoltaic systems. This parameter
is related to the ability that the battery has to discharge faster and the energy density.
Overview of energy storage technologies for PV systems
Tânia Sofia Varela Santos 12
Other electrical battery parameters
o Internal series resistance
The internal resistance of the battery determines the maximum current of the discharge and also
Joule losses during charge/discharge processes. For applications which require the battery to
provide a high instantaneous power, the internal series resistance must be low. This resistance
will also affect the efficiency of the battery, but this can change over the lifetime of the battery.
o Self-discharge
The self-discharge refers to the loss of charge when the battery is not being used, which means,
when the battery is not connected to the network system, the battery will discharge over the
time. This phenomenon is due to the materials involved in the chemical reaction and the battery
temperature. Normally the manufacturer specifies the loss of charge per day or per month.
o Cold cranking current
This parameter is not very relevant for photovoltaic systems but it’s for transport applications,
since the battery has to supply a huge amount of current to start the engine. This parameter
refers to the maximum amount of current the battery may deliver in a short period of time.
o Temperature effects
All batteries lose capacity with decreasing temperature. Some types of batteries are sensitive to
cold and may even suffer irreversible damage if freezing.
Battery Lifetime
Batteries lifetime is expressed in cycles of charging/discharging or years. Normally, the lifetime
is given in number of cycles when the battery is frequently used. When the battery is used in a
system which is only used sporadically, being always connected to the network, its lifetime is
presented in years. When the battery is not used properly and is not in perfect conditions, the
lifetime may decrease dramatically.
Maintenance requirements
In general for the battery to have a longer lifetime maintenance procedures are needed.
Maintenance free batteries are available in the market today. The required maintenance
procedure for each battery type is specified by the supplier.
Safety
Most batteries use dangerous and corrosive chemicals, which means, that batteries must be
installed in ventilated and protected places.

Overview of energy storage technologies for PV systems
Tânia Sofia Varela Santos 13
Battery disposal
When the batteries reach their end of life, they need to be recycled because they contain toxic
and corrosive materials, which can be dangerous for the environment.
2.3.1.1 Lead acid batteries
Lead acid batteries are the most commonly used batteries in many applications including in
photovoltaic systems.
The lead acid batteries use an anode made from porous or spongy lead, which favors the
formation and dissociation of lead, and a cathode made from lead oxide. The electrolyte is an
aqueous sulfuric acid solution. The energy is stored by the reversible chemical reaction shown
below.
During discharge the main reaction at the anode (negative terminal) is
𝑃𝑏 + 𝐻𝑆𝑂4− → 𝑃𝑏𝑆𝑂4 + 𝐻+ + 2𝑒− (4)
At the cathode (the positive terminal during discharge) the corresponding reaction is
𝑃𝑏𝑂2 + 3𝐻+ + 𝐻𝑆𝑂4− + 2𝑒− → 𝑃𝑏𝑆𝑂4 + 2𝐻2𝑂 (5)
The global reaction is
𝑃𝑏 + 𝑃𝑏𝑂2 + 2𝐻2𝑆𝑂4 → 2𝑃𝑏𝑆𝑂4 + 2𝐻2𝑂 (𝐸0 = 2.04𝑉) (6)
By discharging the battery lead sulfate crystals formation and liberation of valence electrons of
lead will occur on the electrodes. This formation of crystals results from the dissociation of the
sulfuric acid from the electrolyte of the battery, which makes it less concentrated. When the
discharge is complete, both electrodes become covered by the same material: lead sulfate. This
way, there will not exist a cell voltage between the two electrodes. Under proper use, however,
the battery should not be completely discharged. For this reason, discharging must be stopped
once the cutoff voltage is reached. When the battery is left with low charge for a long period of
time, the lead sulfate crystals may grow. This results in a battery with reduced capacity.
The most important characteristics of the batteries that are used in battery banks for PV systems
are the depth of discharge and the battery capacity. These two characteristics are always found
alongside one another since the energy extracted from the battery is the result of the
multiplication of the capacity of the battery by the depth of discharge. The batteries can be
classified as deep-cycle or shallow-cycle. Deep-cycle batteries may have a depth of discharge
between 50% and 80%. As for the bank of shallow-cycle batteries, for these to reach the same
available energy as the deep-cycle batteries, they will need a higher capacity since they have
smaller cycles. The following figure shows the dependence of battery capacity on the number
of cycles and the corresponding depth of discharge for a shallow-cycle lead acid battery.

Overview of energy storage technologies for PV systems
Tânia Sofia Varela Santos 14
Figure 14 - Variation of capacity with cycle numbers and DOD for shallow-cycle lead acid battery [9].
By analyzing the figure 14, we can conclude that the lower the depth of discharge of the battery,
the higher the number of cycles the battery will sustain. In other words, the lifetime of a shallow-
cycle battery increases with DOD decrease.
A deep-cycle lead acid battery, may have a lifetime greater than 1000 cycles, even with a DOD
higher than 50%.The lifetime of the battery does not change only due to discharge, but also due
to the charging system. In the figure 15, it is possible to verify the impact that this effect has
upon the capacity of the battery.
Figure 15- Impact of charging regime of battery capacity [9].
In the figure 16, it is possible to see the dependence of battery capacity on discharge rate and
temperature. For each degree below 20ºC, the capacity decreases 1%. However, it is not ideal
for the battery to work at high temperatures since this will accelerate the ageing, the auto-
discharge and the electrolyte reaction. The ideal would be to discharge the battery as slow as
possible and at room temperature (25ºC).
Figure 16 – Variation of battery capacity with discharging rates and temperature [9].
In the figure 17, we can observe the impact of the temperature and of the DOD upon the lifetime
of a battery.
Overview of energy storage technologies for PV systems
Tânia Sofia Varela Santos 15
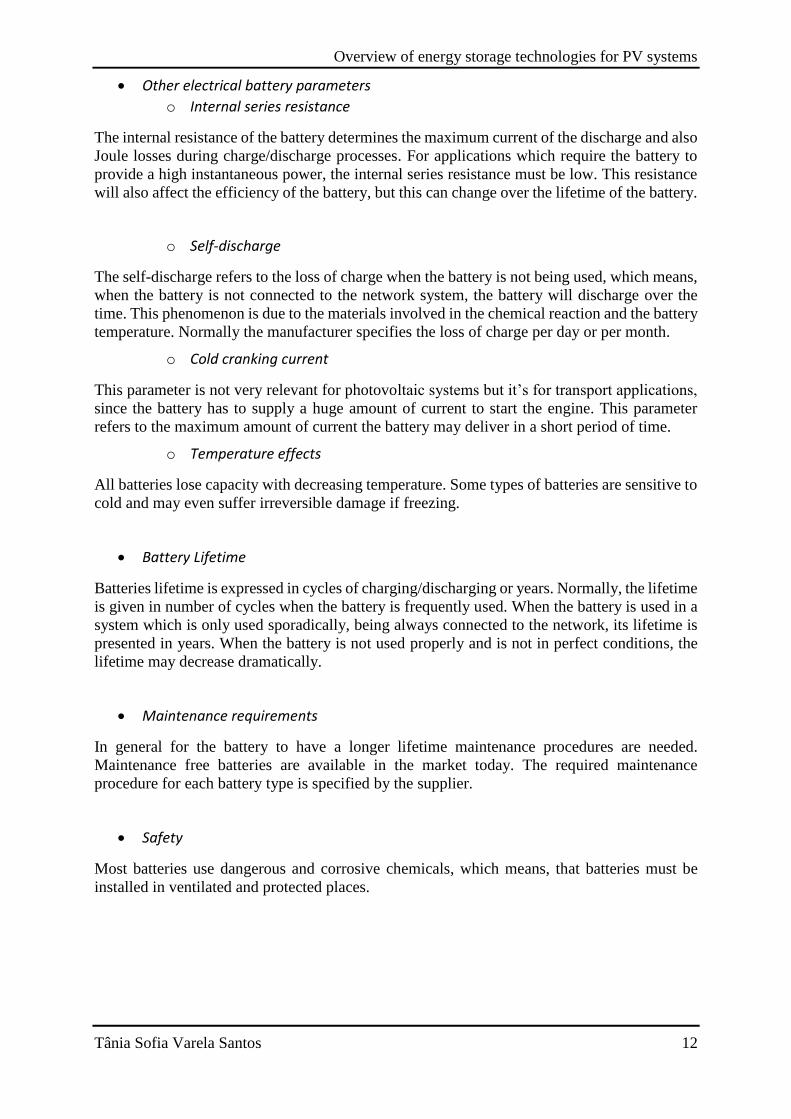
Figure 17 - Impact of battery capacity with DOD and temperature [9].
The general conclusion is that battery lifetime decreases with the working temperature increase
and also with the increase in depth of discharge.
The lead acid batteries normally present efficiencies in the order of 70%, with columbic
efficiency rounds 85%. For the batteries not to decrease their efficiencies drastically, it is
necessary to perform maintenances. Due to the production and liberation of hydrogen and
oxygen during the chemical reactions associated to charge and discharge, the battery will suffer
loss of water, being therefore necessary its reposition. In the next table the advantages and the
disadvantages of lead acid batteries are summarized.
One of the most important characteristics of storage for a PV system is the battery lifetime
because solar panels have a demonstrated lifetime period of about 25 years. Therefore, the most
suited batteries are the deep-cycle batteries. Within this category, there are flooded lead acid
batteries (FLA) and valve-regulated lead acid batteries (VRLA).
Flooded lead acid battery
The FLA batteries are the most popular batteries in the photovoltaic systems. The term
“flooded” is due to the fact that the battery has excess electrolytes, which results in the
electrodes being completely submersed. In a lead acid cell the lead and diluted acid undergo a
chemical reaction that produces lead-sulphate and water during discharge. During charging, the
lead-sulphate and water are turned back into lead and acid. The re-dilution of sulphuric acid
that occurs during charge is a highly exothermic reaction. If this heat is not efficiently removed
the battery will reach a sufficiently high temperature (mainly if excessive charge current is
used) and the diluted acid will be broke down into its component parts: sulphur, hydrogen, and
oxygen. In flooded lead-acid batteries, the sulphur sinks to the bottom of the cell while the
oxygen and hydrogen gases are allowed to escape, and so the cells must be regularly refilled
with water to compensate for the outgassing H and O losses. FLA batteries are more tolerant to
this outgassing because the level of electrolyte is never below the electrodes, preventing this
way, battery damages. These batteries have advantages and disadvantages, which will be
represented in the table below.
Advantages Problems
No maintenance Low specific energy
Low self-discharge range Long charge
Cheap and easy to manufacture Limited lifetime
High specific power Harmful for environment
Good performance at high and low temperatures

Overview of energy storage technologies for PV systems
Tânia Sofia Varela Santos 16
Valve-regulated lead acid battery
The main difference between FLA and VRLA batteries, is that in the valve-regulated lead acid
batteries the already mentioned outgassing only occurs if a security level of pressure inside the
batteries is achieved. Only when this happens outgassing is allowed by that valve. As a
consequence, this type of batteries do not need maintenance and may be used in any position.
The VRLA batteries do not need addition of water since the oxygen produced in the cathode,
during battery charge, migrates to the anode where it combines with hydrogen into water. As
this process is not 100% effective, oxygen and hydrogen gases will be found inside the battery,
which will exert a pressure upon the battery. This excess of pressure will activate a valve that
ventilates the battery, eliminating the gases. It is for this reason that the battery is denominated
valve-regulated and not sealed battery. Nevertheless outgassing being much lower, a loss of
water still occurs and, consequently, a permanent damage of the battery may happen, namely if
charging currents are high.
The migration of oxygen that is necessary for the recombination with hydrogen into water can
be done via two processes:
Absorptive Glass Matting (AGM) battery
The AGM batteries use a porous separator of matt glass that has the ability to absorb a large
quantity of electrolyte. At the same time, this separator will leave some pores unfilled which
will serve as a passageway for the oxygen.
As with all battery technologies, this represents some advantages and disadvantages.
Advantages Problems
Lower cost than VRLA batteries Periodic maintenance
Longer life time than VRLA batteries Can only be used in one position (upright)
Simple maintenance by addition of distilled
water Production of gas when charging
High discharge rate May emit acid spray if overcharged
Good performance in hot climates Require ventilation
Better performance than VRLA batteries
when state of charge is partial
Higher self-discharge rate than VRLA
batteries
Cannot be shipped by air
Cannot be used in the proximities of
electrical equipment or anything high
flammable

Overview of energy storage technologies for PV systems
Tânia Sofia Varela Santos 17
Gel battery
Gel batteries use a porous separator of matt glass linked to a porous polyethylene or
polyvinylchloride sheet, as well as a thyrotrophic gel electrolyte of silica mixed with sulfuric
acid. When an electrolyte is added, the pores of the separator will be all filled, thus not leaving
any space for the passage of oxygen. This way, initially, the battery will function as a flood
battery, outgassing will occur, and there will be loss of water. Due to this occurrence, the gel
on the separator will dry, shrink and crack, allowing then, the passage of oxygen to the anode.
The advantages and disadvantages of the Gel batteries are represented in the following table:
Advantages Problems
Less expensive than Gel batteries
Don't perform as well as FLA or Gel
batteries for systems that require regular
deep of discharge. (i.e. 80% DOD)
Large temperature range than Gel or FLA
batteries
Don’t perform as well as Gel batteries in
low power applications
Low self-discharge
Best shock/vibration resistance
Best for high power applications
Advantages Problems
Better perform than AGM batteries for
systems that require regular deep discharge
(i.e. 80% DOD)
More expensive
Better performance than AGM batteries for
low power applications
Don’t perform as well as FLA or AGM
batteries in cold temperatures
Don’t perform as well as FLA or AGM
batteries when they regularly reach a shallow
depth of discharge. (i.e. 20% DOD)
Higher self-discharge rate than AGM
batteries
Overview of energy storage technologies for PV systems
Tânia Sofia Varela Santos 18
2.3.1.2 Nickel - cadmium batteries (Ni-Cd)
The nickel cadmium battery is constituted by a cathode of nickel oxide hydroxide, a cadmium
metal anode and an electrolyte of potassium hydroxide. In the reaction shown below, it is
represented how the energy is stored.
The main reaction at the anode, during discharge is
𝐶𝑑 + 2𝑂𝐻− → 𝐶𝑑(𝑂𝐻)2 + 2𝑒− (7)
At the cathode, the corresponding reaction is
2𝑁𝑖𝑂𝑂𝐻 + 2𝐻2𝑂 + 2𝑒− → 2𝑁𝑖(𝑂𝐻)2 + 2𝑂𝐻− (8)
The global reaction is
𝐶𝑑 + 2𝑁𝑖𝑂𝑂𝐻 + 2𝐻2𝑂 → 𝐶𝑑(𝑂𝐻)2 + 2𝑁𝑖(𝑂𝐻)2 (𝐸0 = 1.29𝑉) (9)
During discharge, on the anode, the cadmium oxidizes, connecting to OH- ions coming from
the cathode. Cadmium hydroxide and electrons are obtained and pass through the external
circuit. On the cathode, a reduction of nickel oxide hydroxide occurs. When there is an intense
discharge, it is probable that hydrogen will begin to form on the cathode. This hydrogen is
consumed at a very low rate, which results in the pressure inside the battery increasing, and
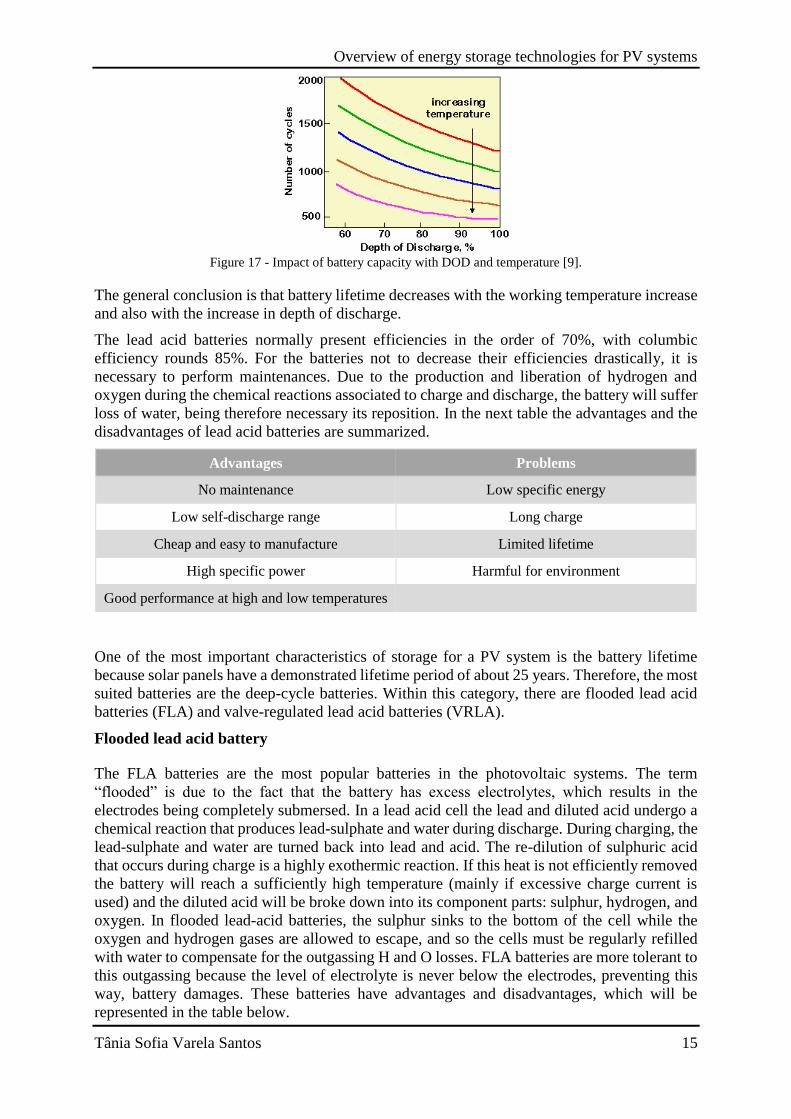
consequently leading to the battery’s explosion. In the figure 18, we can observe more
specifically the reactions that occur in the battery.
Figure 18- Operation principle of a Ni-Cd cell [11].
The performance of nickel cadmium batteries can change according to different factors, such
as, the cell voltage, the operation temperature, or the charge and discharge rating. In the
following figures, we can observe the variation of these characteristics during charge and
discharge of the battery.

Overview of energy storage technologies for PV systems
Tânia Sofia Varela Santos 19
Figure 19- Relationship between battery capacity, voltage, pressure and temperature for different charge rates
[11].
By analyzing figure 19, we can conclude that the slower the charge process, the more stable the
battery will be as the voltage has a smaller variation, and both the pressure and temperature
have less relevant increases.
Figure 20- a) discharge curves for a typical 1.2Ah Ni-Cd cell at different discharge rates b) discharge curves for
a typical Ni-Cd cell at different temperatures at C/2 rate [11].
Low discharge rates at a temperature of about 20ºCis recommended to obtain higher efficiency
and longer lifetime.
The Ni-Cd batteries have a specific energy of about 50Wh/kg, which is 30% higher than with
lead acid batteries, but still lower than more modern batteries. These batteries have been
substituted by the nickel and metal hydride batteries, due to cadmium toxicity.

Overview of energy storage technologies for PV systems
Tânia Sofia Varela Santos 20
In the following table are represented some advantages and disadvantages from nickel cadmium
batteries.
2.3.1.3 Nickel and metal hydride batteries (Ni-MH)
Nickel and metal hydride batteries are very similar to nickel-cadmium batteries. The difference
is that the Ni-MH batteries use a metal hydride anode instead of cadmium. In the following
reaction, we can see the global reaction of the discharge of the battery.
𝑀𝐻 +𝑁𝑖𝑂𝑂𝐻 → 𝑁𝑖𝑂(𝑂𝐻)2 +𝑀 (𝐸0 = 1.35𝑉) (10)
At the anode, the corresponding reaction is
𝑀𝐻 + 𝑂𝐻− → 𝐻2𝑂 +𝑀 + 𝑒− (11)
And at the cathode, the reaction is
𝑁𝑖𝑂𝑂𝐻 + 𝐻2𝑂 + 𝑒− → 𝑁𝑖(𝑂𝐻)2 + 𝑂𝐻− (12)
During discharge, on the cathode, NiOOH is reduced to Ni(OH)2, just as on the Ni-Cd battery.
On the anode, the metal hydride oxidizes, releasing water, a metallic ion and an electron that
passes through the external circuit. During discharge, the inverse reactions occur. In the
following figure, the reactions that occur in the battery are represented explicitly.
Advantages Problems
Fast and simple charging even after prolonged
storage
Low specific energy compared with newer
systems
High number of cycles (over 1000
charge/discharge cycles with proper
maintenance)
Memory effect
Good load performance Cadmium is a toxic metal
Can be stored in a discharge state High self-discharge
Simple storage and transportation
Good low-temperature performance
The most sheep in terms of cost per cycle
Available in a wide range of sizes and
performance options
Overview of energy storage technologies for PV systems
Tânia Sofia Varela Santos 21
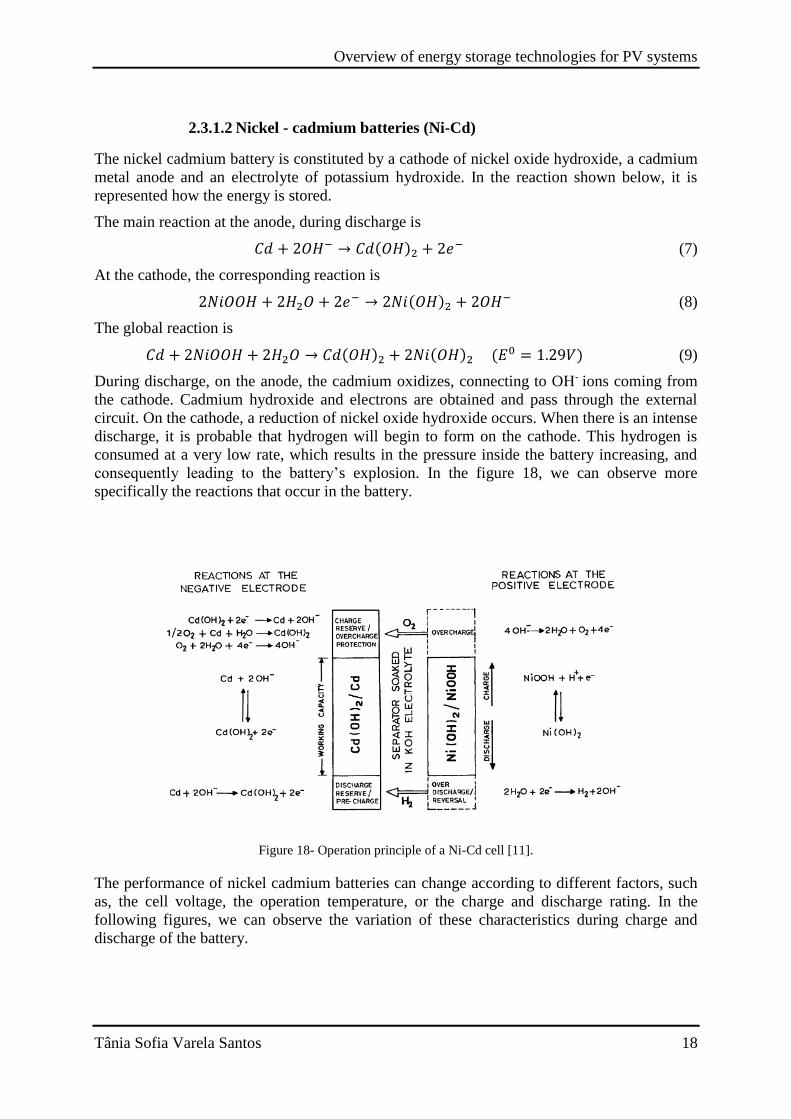
Figure 21- Operation principle for a Ni-MH cell [11].
M is an inter-metallic compound that connects different metals in combination. One of the
compositions is AB5, where A can be a combination of La, Ce, Pr and Nd, and B can be a
combination of Ni, Co, Mn and Al. Another composition of M is AB2, where A is the
combination of de Ti, V and Zr, and B is a combination of Ni, Co, Cr, Mn, Al and Sn. Each
combination offers different characteristics to the battery. This optimizes the battery through
the best combination, allowing the battery to have a higher specific energy, more stability, better
efficiency, higher capacity and a longer lifetime [11].
When an overload of the battery occurs, formation of hydrogen and oxygen begins, as in
previous batteries. However, as the battery uses hydrogen in its reactions, it ends up
compensating the hydrogen formed and maintains this way, a stable pressure. In addition to
tolerance during overload, these batteries do not have a memory effect, do not form dendrites,
and do not use toxic chemicals.
The following table lists some advantages and problems of these batteries.
2.3.1.4 Zinc-air batteries
Zinc air batteries are known for having a big potential but cannot yet be found in the market.
These batteries use zinc on the cathode and oxygen, found freely in the air, on the anode. Since
these batteries only use one electrode, they are able to reach very high specific energy values.
The following equation shows this battery’s global reaction during discharge.
Advantages Problems
Better specific energy than Ni-Cd Limited lifetime
No memory effect Slow charge
Maintenance free High self-discharge
Environmentally acceptable
Recyclable materials

Overview of energy storage technologies for PV systems
Tânia Sofia Varela Santos 22
𝑍𝑛 + 2𝑂𝐻− → 𝑍𝑛𝑂 + 𝐻2𝑂 + 2𝑒− (𝐸0 = 1.26𝑉) (13)
The battery produces current when the anode is reduced with assistance of the catalyzer that
produces hydroxyl ions on the electrolyte. The zinc is oxidized and releases electrons that create
electric current. In the figure 22, a schematic representation of the battery during the charge
process is shown.
Figure 22- Scheme of charging Zinc-air battery [13].
A problem that is under investigation is the entry of carbon dioxide into the battery that may
develop a negative impact on the electrolyte and on the cathode. The following table presents
some advantages and problems found in these batteries.
2.3.1.5 Sodium-Beta Alumina batteries (SBB)
Sodium-sulfur batteries are currently still under investigation. They present a potential to be
used in stationery applications due to their long period of discharge (~6h).
The operational temperature of these batteries is in the range 300-350ºC. This results in the
battery heat losses and may discharge when on standby. Ohmic heat will, however, compensate
these heat losses allowing these losses to be considered as self-discharge. Sodium-sulfur
batteries do not, however, present self-discharge due to their high efficiency [14].
The reactions that occur between sodium and melted sulfur are extremely exothermic. This
causes an increased risk of the cell catching on fire, which would then cause the system to
switch off the cell and consequently all string. For this not to happen, studies are being
Advantages Problems
High specific energy Low efficiency
Inherent safety Susceptible to changes due to ambient air
conditions
Long cycle life
Low cost
100% recyclable

Overview of energy storage technologies for PV systems
Tânia Sofia Varela Santos 23
developed to ensure that the functional temperature of the battery decreases [14]. A recent
published study showed that by using a sodium anode with cesium (Na-Cs), the battery’s
lifetime increases due to the fact that the operating temperature falls to the range 175-150ºC.
Even with temperatures below 95ºC, the cell shows a good performance [17].
During discharge, sodium is oxidized and forms sodium ions. These migrate through the beta
alumina electrolyte and connect with sulfur, which was reduced on the cathode, forming sodium
polysulfide (𝑁𝑎2𝑆𝑥, 𝑥 = 3 − 5). The following equation contains the battery’s global reaction.
2𝑁𝑎 + 𝑥𝑆 → 𝑁𝑎2𝑆𝑥 𝐸0 = 2.07 − 1.78𝑉 (14)
In the following figure we can observe the structure of a sodium-sulfur battery.
Figure 23 - SBB battery [18].
The following table shows some advantages and problems associated to sodium-beta alumina
batteries.
Advantages Problems
High specific energy High production cost
Long lifetime High resistance in cathode caused by sodium
polysulfide formation
Low cost of materials High resistance caused by membrane thickness
High efficiency High self-discharge
High tolerance to overload
Low maintenance
Recyclable

Overview of energy storage technologies for PV systems
Tânia Sofia Varela Santos 24
2.3.1.6 Rechargeable Lithium Ion (Li-Ion)
Lithium batteries are characterized by high specific energy, high efficiency and long lifetime.
However, this technology appears problematic due to issues such us safety, cost, high
operational temperature that may result in battery damage and limits to the materials
availability.
These batteries are lightweight, compact and generate voltages of the order of 4V per cell, with
specific energy ranging between the 100Wh/kg and 150Wh/kg. Currently the most used
structure is the battery that has a graphite anode, a cathode of lithium metal oxide (LiCoO2) and
an electrolyte consisting of a solution of lithium salt (LiPF6) mixed with an organic solvent
(EC-DMC). In figure 24 we present a schematic view of a common lithium ion battery.
Figure 24- Li-ion battery [19].
The reaction that occurs in the battery, which is shown in the figure 24 is:
𝐶6 + 𝐿𝑖𝐶𝑜𝑂2 𝑐ℎ𝑎𝑟𝑔𝑒 →
𝑑𝑖𝑠𝑐ℎ𝑎𝑟𝑔𝑒←
𝐿𝑖0.5𝐶6 + 𝐿𝑖0.5𝐶𝑜𝑂2 (𝐸0 = 3.6𝑉) (15)
During charging, the graphite is reduced and get in touch with the solution of lithium salt, the
lithium ions reducing graphite. Meanwhile the lithium cobalt oxide will oxidize thus releasing
electrons and lithium ions. During discharge, the reaction is reversed, as shown in figure 24.
Since the lithium ion batteries present a very high specific energy, their application is made
mostly on low power portable technology. This is due to the reduced lifetime and low capacity.
These batteries are therefore not advantageous for storage in renewable systems.

Overview of energy storage technologies for PV systems
Tânia Sofia Varela Santos 25
There are also other batteries of ion lithium where the cathode, the anode or the electrolyte can
be differentiated. One of these batteries is the lithium iron phosphate (LiFePo4) battery, where
the cathode is changed to iron phosphate. Through this change, we can obtain a better
electrochemical performance with low resistance, which allows the battery to have a good
thermal stability, long cycles and to be safer. These batteries have a lower specific energy in
comparison to the LiCoO2 batteries, but higher in comparison to the lead acid, Ni-Cd and Ni-
MH batteries.
2.3.1.7 Lithium - Sulfur (Li-S)
Lithium-sulfur batteries are still being developed since there is a necessity to improve their
short lifetime and low capacity. However, these batteries present, theoretically, a high specific
energy (2500Wh/kg) [20], which is five times higher than for ion-lithium batteries. This
characteristic allows for them to be applied in electric vehicles (EV´s).
These batteries are made up by an anode of metallic lithium, a cathode of a metal containing
sulfur, and an organic non-aqueous electrolyte. In equation 16 we present the global reaction of
the battery.
2𝐿𝑖 + 𝑆 → 𝐿𝑖2𝑆 (𝐸0 = 2.2𝑉) (16)
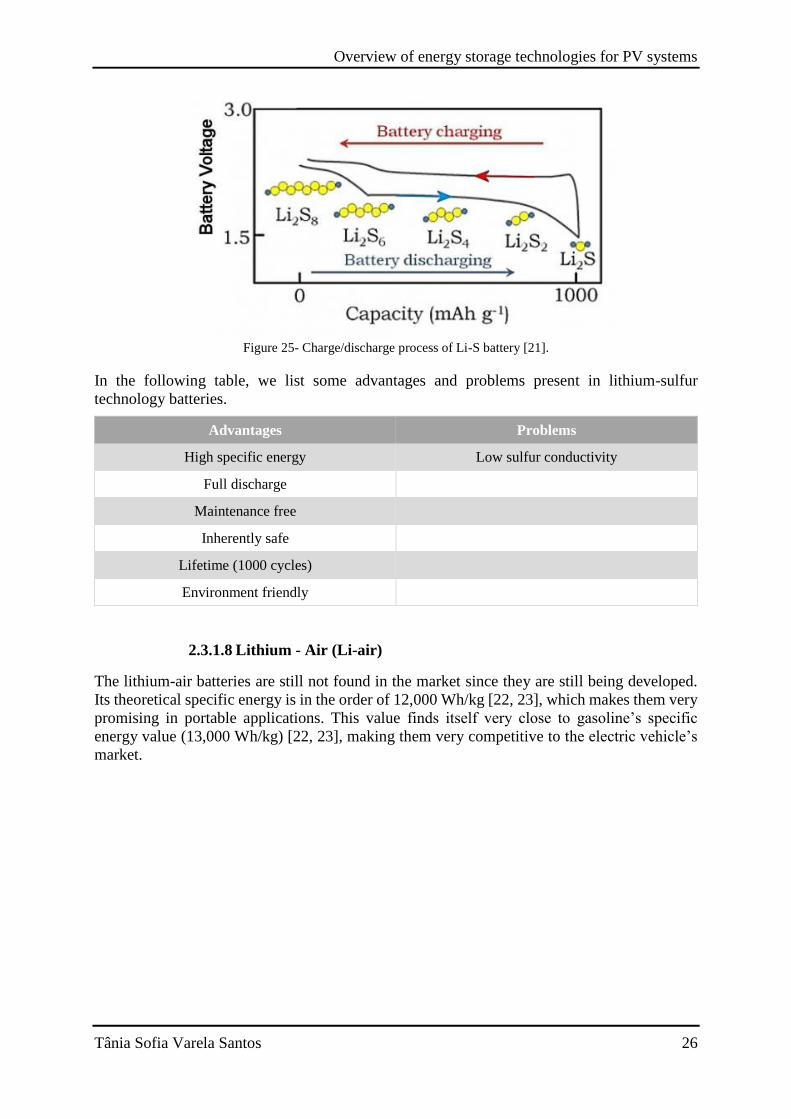
During discharge, the lithium ions go from the anode to the cathode through the electrolyte,
where the formation of a big molecule of cyclooctasulfur (Li2S8) begins. At the end of
discharge, the purpose is to attain Li2S, although this result is not possible in only one step. For
this, there has to be a long chain of lithium polysulfides (Li2Sx, 4<x<8) that will dissolve in the
organic electrolyte transforming into insoluble Li2S2 and finally, into Li2S. In figure 25, the
process of charge and discharge of the batteries is schematically represented.
Advantages Problems
High specific energy
When overloaded and overheated, the battery
deteriorates, losing capacity which leads to a
decreased lifetime. Overloading can cause fires
and even explosions.
Low self-discharge High internal series resistance
Low maintenance Needs an external circuit of protection, for
control the limits of voltage and current.
No memory effect
Wide range of sizes and shapes for different
applications
Environmental friendly
Overview of energy storage technologies for PV systems
Tânia Sofia Varela Santos 26
Figure 25- Charge/discharge process of Li-S battery [21].
In the following table, we list some advantages and problems present in lithium-sulfur
technology batteries.
2.3.1.8 Lithium - Air (Li-air)
The lithium-air batteries are still not found in the market since they are still being developed.
Its theoretical specific energy is in the order of 12,000 Wh/kg [22, 23], which makes them very
promising in portable applications. This value finds itself very close to gasoline’s specific
energy value (13,000 Wh/kg) [22, 23], making them very competitive to the electric vehicle’s
market.
Advantages Problems
High specific energy Low sulfur conductivity
Full discharge
Maintenance free
Inherently safe
Lifetime (1000 cycles)
Environment friendly

Overview of energy storage technologies for PV systems
Tânia Sofia Varela Santos 27
Figure 26- Comparing theoretical specific energy for different energy storage technologies [22].
These batteries are able to have a very high specific energy since the cathode’s active material
(oxygen) is not found stored in the battery. Since lithium has a specific capacity of 3500 mAh/g,
which is superior to zinc’s specific capacity (815 mAh/g), the lithium-air batteries turn out to
be better than zinc-air batteries [24].
The battery is made up of an anode of lithium metal, a cathode of porous carbon for promoting
diffusion of oxygen, and an organic electrolyte that may, or may not, be aqueous (figure 27).
Figure 27 - Schematic of a Li-air battery [22].
During discharge, the lithium ions are conducted from the anode to the cathode through the
electrolyte. The electrons are conducted through an external circuit. These lithium ions will
connect, at the cathode, to the oxygen reduced with two or four electrons. The reactions that
occur during this process are represented below.

Overview of energy storage technologies for PV systems
Tânia Sofia Varela Santos 28
𝐿𝑖 → 𝐿𝑖+ + 𝑒− (17)
2𝐿𝑖+ + 𝑂2 + 2𝑒− → 𝐿𝑖2𝑂2 (18)
4𝐿𝑖+ + 𝑂2 + 4𝑒− → 2𝐿𝑖2𝑂 (19)
Equation 17 refers to the process occurring at the anode. On the cathode, two reactions may
occur resulting in the formation of lithium peroxide and/or lithium oxide, (reactions (18) and
(19) respectively). The global reaction may be written:
2𝐿𝑖 + 𝑂2 → 𝐿𝑖2𝑂2 (𝐸0 = 2.96𝑉) (20)
In the following table, we summarize some advantages and problems that characterize these
batteries.
2.3.2 Redox Flow battery – FB (redox flux)
The redox flow batteries are promising for stationery applications. This technology’s may be
applied to applications requiring power in the range 10 kW to 10 MW, and can supply energy
in the range 500 kWh to 100 MWh. Seven redox pairs are currently being developed (V/V,
S/Br2, Zn/Br2, V/Br2, Fe/Cr, Ce/Zn e Pb/Pb), and only three of these technologies are mature
enough to be commercialized (vanadium, polysulfide-bromine and zinc-bromine). These three
technologies will be developed further on.
These batteries are made up by two electrolyte containing tanks. The anode’s side is designated
analyte and the cathode’s side is designated catholyte. A reservoir designated stack can be found
between these two tanks. This is where the reactions between electrolytes that are separated by
an ion-exchange membrane (IEM) take place. The electrodes are also located in this reservoir.
These three reservoirs are interconnected by conducts and pumps to allow for the electrolyte to
circulate. In figure 28 we schematically represent this type of battery.
Advantages Problems
Higher specific energy than other batteries The battery have to be in a vent site
Safe
No self-discharge
Good lifetime

Overview of energy storage technologies for PV systems
Tânia Sofia Varela Santos 29
Figure 28- Schematic of a redox flow battery [25].
The electrolyte is constituted by active and solvent chemical species. These active species react,
through the following reactions:
𝐴(𝑛−𝑥)+𝐷𝑖𝑠𝑐ℎ𝑎𝑔𝑒→
𝐶ℎ𝑎𝑟𝑔𝑒 ←
𝐴𝑛+ + 𝑥𝑒− , 𝑛 > 𝑥 (21)
𝐵(𝑚+𝑦)+ + 𝑦𝑒−𝐷𝑖𝑠𝑐ℎ𝑎𝑔𝑒→
𝐶ℎ𝑎𝑟𝑔𝑒 ←
𝐵𝑚+ (22)
During discharge, the anode elevated chemical potential causes an oxidation reaction (21). This
results in the liberation of an electron that goes into the external circuit. The electron is then
accepted in the cathode and due to the low chemical potential, a reduction reaction occurs (22).
The state of the battery is given by the difference of the chemical potential between analyte and
catholyte actives. When the battery is charged, the chemical potential of the analyte is higher
than the one of the catholyte. When the battery is discharged, the chemical potential of the
analyte is lower than that of the catholyte.
The redox batteries have the ability to separate power from energy. The power is controlled by
the stack, while the energy is dependent on the volumes of the electrolyte tanks. The higher the
number of cells on the stack (figure 29), the higher the power will be. The power of the cell is
the result of the product of the current with the voltage.
The battery’s voltage depends on active chemical species involved in the reactions and on the
number of cells that are connected in series. The current is determined by the number of atoms
in the active chemical species that react per unit time.
The quantity of energy stored is determined by the total quantity of active chemical species
available in a given volume of electrolyte solution in the system.

Overview of energy storage technologies for PV systems
Tânia Sofia Varela Santos 30
Figure 29- RFB with 2 cells stack [26].
The redox-flow batteries are divided into two categories:
True redox flow batteries: the active chemical species are totally dissolved in the
solution both during charge and discharge. Examples of these kind of batteries are
vanadium and iron-chromium batteries.
Hybrid redox flow batteries: at least one active chemical specie is not dissolved during
the charge, which prevents the total separation of power and energy. The zinc-bromine
and zinc-chlorine batteries are an examples of these kind of batteries.
2.3.2.1 Vanadium flow batteries (VRB)
Vanadium batteries are very promising in renewable energy applications. This type of batteries
use vanadium in both electrolytes as the crossing of active species of two different electrolytes
will lead to metal contamination. This results in a loss of efficiency during cycles and
consequently a loss in the capacity and degradation of the battery. To prevent this degradation,
only one vanadium electrolyte is used in both tanks. In the catholyte, sulfuric acid is used as a
supporting electrolyte. In the tanks, the vanadium will be found in four stages of oxidation. In
the equations 23, 24, and 25, we present the reactions that occur on the anode, the cathode and
the global reaction during the discharge, respectively.
𝑉2+ → 𝑉3+ + 𝑒− (23)
𝑉𝑂2+ + 2𝐻+ + 𝑒− → 𝑉𝑂2+ + 𝐻2𝑂 (24)
𝑉2+ + 𝑉𝑂2+ + 2𝐻+ → 𝑉3+ + 𝑉𝑂2+ + 𝐻2𝑂 (𝐸
0 = 1.26𝑉) (25)
In Figure 30 it can be seen the schematic and operation of a vanadium battery.

Overview of energy storage technologies for PV systems
Tânia Sofia Varela Santos 31
Figure 30- Schematic of a VRB [27].
After several cycles of charge and discharge pH changes. This can lead to a decrease in the
efficiency.
The specific energy of the battery is limited by the solubility of the vanadium in the electrolyte,
depending on both the temperature and the acid concentration. The ideal work temperature is
between 10 and 40ºC. When the system exceeds 40-45ºC, a cooling sub-system is activated. If
the battery’s temperature reaches 50-60ºC, there is a precipitation of V2O5 that is irreversible.
The following table lists the advantages and problems that vanadium batteries may present.
Advantages Problems
High efficiency Lower volumetric energy densities specially in
high power
Long life and unlimited cycles High cost of vanadium
Fast charging Vanadium is toxic
Scales energy and power independently High cost of maintenance
Fast time answer
No self-discharge
Low maintenance
Overview of energy storage technologies for PV systems
Tânia Sofia Varela Santos 32
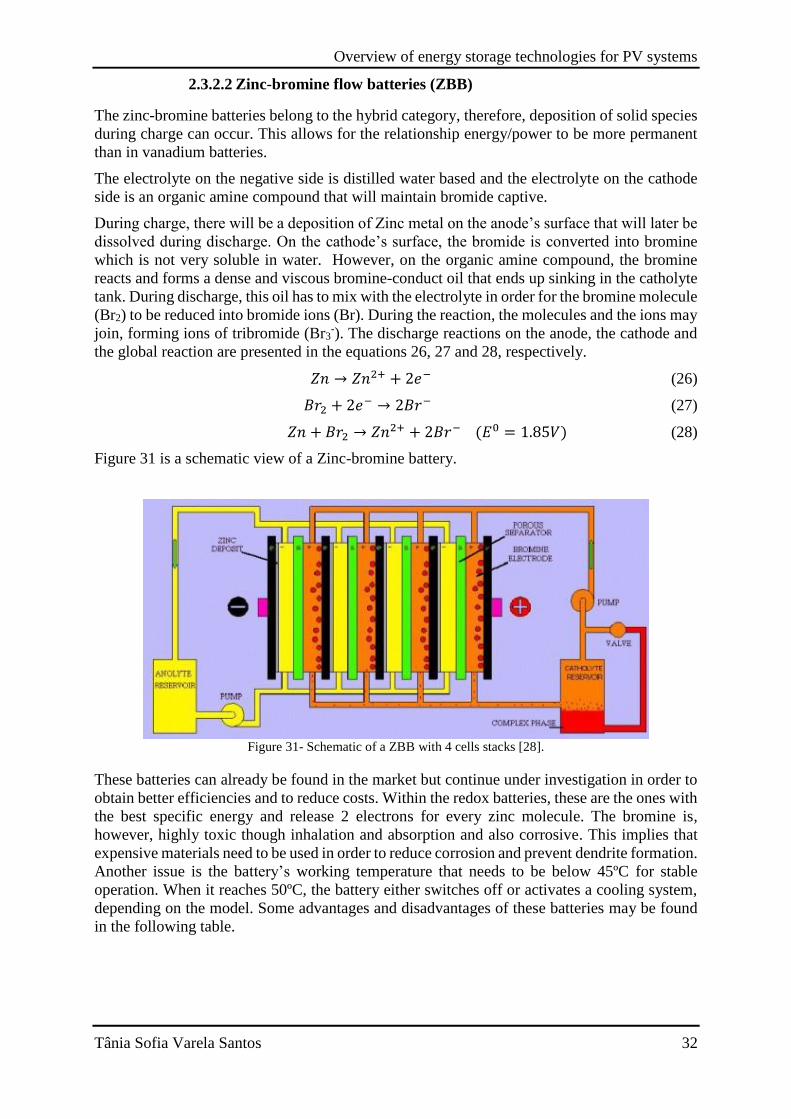
2.3.2.2 Zinc-bromine flow batteries (ZBB)
The zinc-bromine batteries belong to the hybrid category, therefore, deposition of solid species
during charge can occur. This allows for the relationship energy/power to be more permanent
than in vanadium batteries.
The electrolyte on the negative side is distilled water based and the electrolyte on the cathode
side is an organic amine compound that will maintain bromide captive.
During charge, there will be a deposition of Zinc metal on the anode’s surface that will later be
dissolved during discharge. On the cathode’s surface, the bromide is converted into bromine
which is not very soluble in water. However, on the organic amine compound, the bromine
reacts and forms a dense and viscous bromine-conduct oil that ends up sinking in the catholyte
tank. During discharge, this oil has to mix with the electrolyte in order for the bromine molecule
(Br2) to be reduced into bromide ions (Br). During the reaction, the molecules and the ions may
join, forming ions of tribromide (Br3-). The discharge reactions on the anode, the cathode and
the global reaction are presented in the equations 26, 27 and 28, respectively.
𝑍𝑛 → 𝑍𝑛2+ + 2𝑒− (26)
𝐵𝑟2 + 2𝑒− → 2𝐵𝑟− (27)
𝑍𝑛 + 𝐵𝑟2 → 𝑍𝑛2+ + 2𝐵𝑟− (𝐸0 = 1.85𝑉) (28)
Figure 31 is a schematic view of a Zinc-bromine battery.
Figure 31- Schematic of a ZBB with 4 cells stacks [28].
These batteries can already be found in the market but continue under investigation in order to
obtain better efficiencies and to reduce costs. Within the redox batteries, these are the ones with
the best specific energy and release 2 electrons for every zinc molecule. The bromine is,
however, highly toxic though inhalation and absorption and also corrosive. This implies that
expensive materials need to be used in order to reduce corrosion and prevent dendrite formation.
Another issue is the battery’s working temperature that needs to be below 45ºC for stable
operation. When it reaches 50ºC, the battery either switches off or activates a cooling system,
depending on the model. Some advantages and disadvantages of these batteries may be found
in the following table.
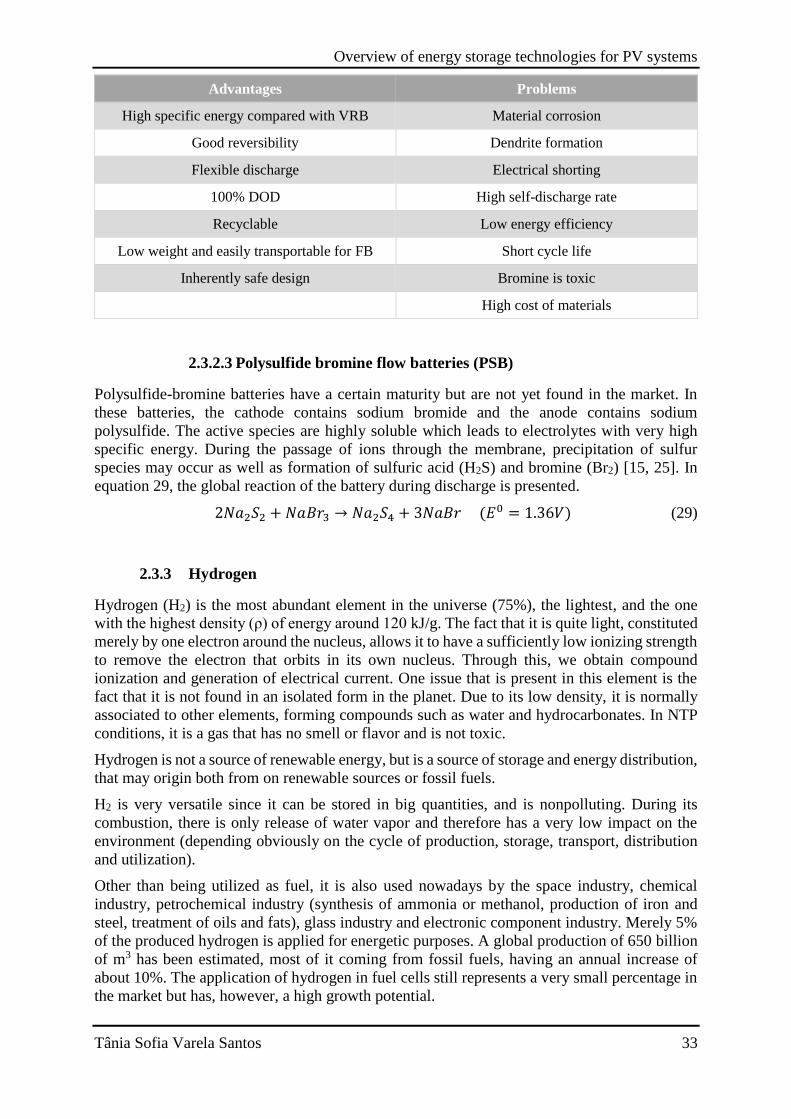
Overview of energy storage technologies for PV systems
Tânia Sofia Varela Santos 33
2.3.2.3 Polysulfide bromine flow batteries (PSB)
Polysulfide-bromine batteries have a certain maturity but are not yet found in the market. In
these batteries, the cathode contains sodium bromide and the anode contains sodium
polysulfide. The active species are highly soluble which leads to electrolytes with very high
specific energy. During the passage of ions through the membrane, precipitation of sulfur
species may occur as well as formation of sulfuric acid (H2S) and bromine (Br2) [15, 25]. In
equation 29, the global reaction of the battery during discharge is presented.
2𝑁𝑎2𝑆2 + 𝑁𝑎𝐵𝑟3 → 𝑁𝑎2𝑆4 + 3𝑁𝑎𝐵𝑟 (𝐸0 = 1.36𝑉) (29)
2.3.3 Hydrogen
Hydrogen (H2) is the most abundant element in the universe (75%), the lightest, and the one
with the highest density (ρ) of energy around 120 kJ/g. The fact that it is quite light, constituted
merely by one electron around the nucleus, allows it to have a sufficiently low ionizing strength
to remove the electron that orbits in its own nucleus. Through this, we obtain compound
ionization and generation of electrical current. One issue that is present in this element is the
fact that it is not found in an isolated form in the planet. Due to its low density, it is normally
associated to other elements, forming compounds such as water and hydrocarbonates. In NTP
conditions, it is a gas that has no smell or flavor and is not toxic.
Hydrogen is not a source of renewable energy, but is a source of storage and energy distribution,
that may origin both from on renewable sources or fossil fuels.
H2 is very versatile since it can be stored in big quantities, and is nonpolluting. During its
combustion, there is only release of water vapor and therefore has a very low impact on the
environment (depending obviously on the cycle of production, storage, transport, distribution
and utilization).
Other than being utilized as fuel, it is also used nowadays by the space industry, chemical
industry, petrochemical industry (synthesis of ammonia or methanol, production of iron and
steel, treatment of oils and fats), glass industry and electronic component industry. Merely 5%
of the produced hydrogen is applied for energetic purposes. A global production of 650 billion
of m3 has been estimated, most of it coming from fossil fuels, having an annual increase of
about 10%. The application of hydrogen in fuel cells still represents a very small percentage in
the market but has, however, a high growth potential.
Advantages Problems
High specific energy compared with VRB Material corrosion
Good reversibility Dendrite formation
Flexible discharge Electrical shorting
100% DOD High self-discharge rate
Recyclable Low energy efficiency
Low weight and easily transportable for FB Short cycle life
Inherently safe design Bromine is toxic
High cost of materials

Overview of energy storage technologies for PV systems
Tânia Sofia Varela Santos 34
One of the best ways to generate energy and fuel for our vehicles, from the emissions point of
view, would be a combination of renewable energy and hydrogen. A cleaner and non-fossil
future is ambitioned for the automobile industry in order to respond to demands of higher
sustainability and a reduction in emissions. This may include vehicles powered by biofuels,
electric vehicles and other types powered by fuel cells (FCV).
Renewable energies are, therefore, a desired energy source for the production of this element
due to the potential for sustainability that exists in this combination. However, several
challenges in producing hydrogen through renewable energies sources are yet to be solved,
namely the economic challenge, aiming for it to be a competitive alternative to gasoline and
diesel.
Hydrogen may be produced through electrolysis, which utilizes electricity to bring about
dissociation of water molecules (H2O), resulting in oxygen (O2) and hydrogen (H2). By
continuously providing a current to the cell, the water molecules undergo a reduction on the
cell’s cathode. The water molecules then separate into hydrogen ions (H+) and hydroxide ions
(OH-). The separation does not originate neutral elements as oxygen has a higher
electronegativity than hydrogen and therefore captures the electron, remaining in its most stable
form. The H+ ion captures an electron from the cathode, giving origin to gaseous hydrogen. The
hydroxide ions lose their electrons to the anode and produces gaseous oxygen, verified by the
air bubbles in the water. In the following equation, this global reaction is presented.
2𝐻2𝑂 → 𝑂2 + 2𝐻2 (30)
In figure 32, water electrolysis is represented schematically, taking place in the inside of an
electrolyzer.
Figure 32- Schematic of the water electrolysis [29].
The efficiency of the electrolytic process lies in the range 70 – 75% and increases with the
increase in temperature. This process may still be improved with either the addition of salts to
the electrolyte to increase its conductivity or by using vapor electrolysis simply using thermal
energy. Its low outcome, when associated to a renewable energy source, is one of the biggest
disadvantages found when using this process to produce “renewable hydrogen”.
The amount of energy necessary to produce hydrogen is very high and its cost is just as high.
Electricity is responsible for two thirds of this energy. For this reason, the production of
hydrogen through this process is not, yet, economically competitive and favorable.
The produced hydrogen is then purified and stored in pressurized reservoirs, meaning that the
storage is made in the form of chemical energy. Then, this stored hydrogen may be used to once

Overview of energy storage technologies for PV systems
Tânia Sofia Varela Santos 35
again produce electrical energy through fuel cells. Here, the inverse process of electrolysis
occurs.
The working principle of a fuel cell is very similar to that of a battery, although in this case, the
source of energy used is hydrogen. The hydrogen is injected onto the anode resulting in a
reduction of hydrogen and liberation of electrons into the network. Oxygen is the element
injected onto the cathode. The oxygen will react to the hydrogen ions that come from the anode,
releasing water vapor during the process. The fuel cells may be associated in series until they
have reached the desired voltage. This process is represented in figure 33.
Figure 33- Schematic of a fuel cell [30].
In figure 34, all types of fuel cells that exist are represented, as well as their characteristics.
Figure 34- Comparison between the different types of fuel cells [31].

Overview of energy storage technologies for PV systems
Tânia Sofia Varela Santos 36
2.4 Storage of electromagnetic energy
2.4.1 Superconducting magnetic energy storage (SMES)
Superconductor magnetic energy storage system stores energy in a superconducting coil in the
form of a magnetic field. This magnetic field is created by a flow of continuous current (DC)
that passes through the coil. For the system to maintain its charge, the coil need to be at low
temperatures (-270ºC) because the transition to the superconducting state only occurs at these
temperatures. This cooling is achieved with a cryogenic liquid and if this cooling fails, the
system ends up suffering stability problems as well as ending up with a very high auto-discharge
rate. The discharge of energy is done through the conversion of magnetic energy into electrical
energy [3, 16, 32]. The magnetic energy stored in the coil may be calculated using the following
formula.
𝐸 =1
2𝐿𝐼2 (𝐽) (31)
L represents inductance in Henries and I is the current in Amperes. The figure 35 shows a
scheme of a SMES system.
Figure 35- Schematic of a SMES [32].
In the following table, some of the advantages and problems associated to this technology are
listed.
2.4.2 Electric double layer capacitor system (EDLC)
A super capacitor is made by two metal electrodes coated with active coal and separated by a
thin porous isolator. The electrolyte may or may not be aqueous, depending on the voltage, on
the temperature and on the power or the peak of current necessary. This technology may seem
very similar to conventional batteries, except that the super capacitors do not use chemical
reactions in their cycles. Instead, they use an electric field between the electrodes [3, 33].
The electrostatic energy stored in the super capacitor may be calculated through the following
equation.
Advantages Problems
High efficiency High cost of operation
Fast response time
Near-zero losses
High power
Full discharge

Overview of energy storage technologies for PV systems
Tânia Sofia Varela Santos 37
𝐸 =1
2𝐶𝑉2 (𝐽) (32)
C represents capacitance and V represents the difference in voltage between the plates of the
capacitor. An EDLC is represented in the figure 36.
Figure 36- Schematic of an EDLC [33].
The following table lists some advantages and problems of this technology.
Advantages Problems
High charge/discharge rates High self-discharge
High power density Need complex electronic control
High efficiency Low specific energy
High lifetime

Overview of energy storage technologies for PV systems
Tânia Sofia Varela Santos 38
3. Overview
Each storage technology presents different characteristics which allow them to be different from
one another and more suited for each type of application.
An analysis and comparison of some characteristics of different technologies will be done
shortly. It is necessary to be aware that some of these technologies are still under research and
all their characteristics are therefore not yet available.
In Figure 37, we represent the costs per kilowatt (kW) for each type of storage technology.
Figure 37- Power cost of storage technologies [43].
The technologies that present the highest cost per kilowatt are PHS, the Li-ion, flow batteries
(VRB and ZBB) and micro-CAES. The cheapest technologies are lead acid batteries, nickel and
metal hydride batteries, SBB, SMES, EDLC and metal-air batteries. It is, however, necessary to
keep in mind the maturity of the technologies, and take into account that some of them are still
not available in the market and still under investigation. For this reason, the presented values
are simply potential values and not real ones.
As previously mentioned, different technologies suite better different kind of applications.
Some of the relevant characteristics that help the choice of technology for a particular
application are is its rating power, its discharge time and its self-discharge. In the following
table these characteristics are presented for different technologies1.
1 The table with all characteristics is shown on the annex A (table 14).

Overview of energy storage technologies for PV systems
Tânia Sofia Varela Santos 39
PHS and CAES are the kind of technologies that are adequate for storing large quantities of
energy for a long period of time. This is due to the low losses in energy per day.
The flywheels, SMES and EDLC are technologies that are more indicated in obtaining extra
energy for a short period of time. In other words, they are able to store energy for a short period
of time and are then able to discharge that energy in a short time. These technologies are most
suited for grid quality control applications.
Fuel cells and batteries are the kind of storage mostly used in diverse applications. This is due
to their ability to store energy for a long period of time and their ability to discharge that stored
energy during a few hours or even days. The secondary batteries present a higher rate of auto-
discharge comparatively to flow batteries and to fuel cells. However, as shown in figure 37,
they also present a lower cost, making them more favorable to the market.
Through this analysis we are able to confirm that, so far, batteries are the technology most
suitable for the application to a photovoltaic hybrid system. A deeper analysis of the different
types of batteries will shortly be made.
In figure 38, specific energies for each battery type are shown.
Table 1 - Power rating, discharge time and self-discharge for storage technologies [14,16].
Technology Power rating Discharge time Self-discharge per day
PHS 100-5000 MW 1-24 h+ very small
Flywheels 0-1 MW Milliseconds-15 min 100%
CAES 5-400 MW 1-24 h+ small
Secondary
batteries
Lead-acid 0-20 MW
Seconds-hours
0.1-0.3%
NiCd 0-40 MW 0.2-0.6%
NiMH 0.3%
SBB 50 kW-8 MW ~20%
L-ion 0-100 kW Minutes-hours
0.1-0.3%
Li-S 0.3-0.5%
Li-air Seconds-24 h+ very small
Zinc-air
Flow
batteries
VRB 30 kW-3 MW
Seconds-hours small ZBB 50 kW-2 MW
PSB
Fuel Cells 0-50 MW Seconds-24 h+ almost zero
SMES 100 kW-10 MW milliseconds-8 s 10-15%
EDLC 0-300 kW milliseconds-60 min 20-40%
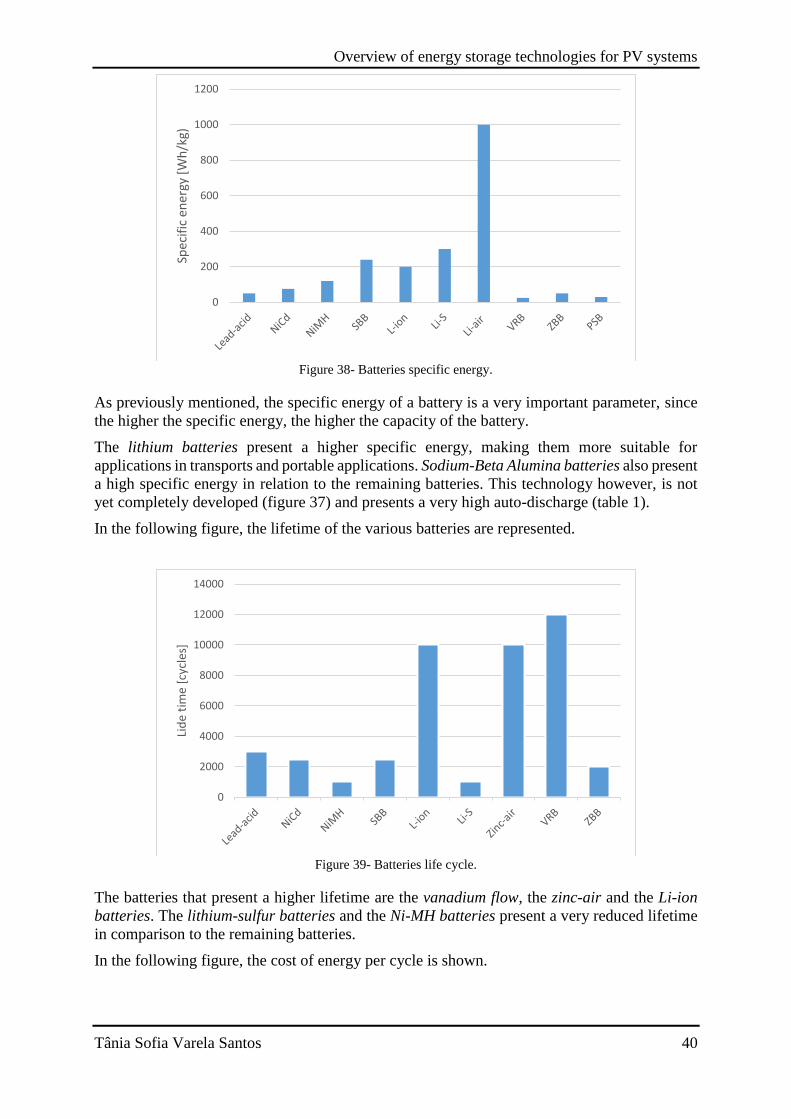
Overview of energy storage technologies for PV systems
Tânia Sofia Varela Santos 40
Figure 38- Batteries specific energy.
As previously mentioned, the specific energy of a battery is a very important parameter, since
the higher the specific energy, the higher the capacity of the battery.
The lithium batteries present a higher specific energy, making them more suitable for
applications in transports and portable applications. Sodium-Beta Alumina batteries also present
a high specific energy in relation to the remaining batteries. This technology however, is not
yet completely developed (figure 37) and presents a very high auto-discharge (table 1).
In the following figure, the lifetime of the various batteries are represented.
Figure 39- Batteries life cycle.
The batteries that present a higher lifetime are the vanadium flow, the zinc-air and the Li-ion
batteries. The lithium-sulfur batteries and the Ni-MH batteries present a very reduced lifetime
in comparison to the remaining batteries.
In the following figure, the cost of energy per cycle is shown.
0
200
400
600
800
1000
1200
Spec
ific
en
ergy
[W
h/k
g)
0
2000
4000
6000
8000
10000
12000
14000
Lid
e ti
me
[cyc
les]

Overview of energy storage technologies for PV systems
Tânia Sofia Varela Santos 41
Figure 40 - Batteries capital cost per cycle.
The batteries that exhibit a higher cost per cycle are the nickel-cadmium and the ZBB batteries.
Zinc-air batteries present the lower costs but since they are still in development, they cannot
yet be found in the market.
Despite the high cost of the vanadium batteries, they present a DOD of 100% and a very high
lifetime (fig. 39). This allows the cost per cycle to be very low. The lead acid batteries also
present a low cost per cycle in comparison to other technologies. This is due to their low initial
cost and their high number of cycles.
Following this analysis we must conclude that, for the moment, the most suitable batteries for
PV systems are the lead acid and the vanadium flow batteries.
0.000
0.000
0.000
0.000
0.000
0.001
0.001
0.001
0.001
Lead-acid NiCd NiMH SBB L-ion Zinc-air VRB ZBB
€/k
Wh
.cyc
le

Overview of energy storage technologies for PV systems
Tânia Sofia Varela Santos 42
4. Applications
4.1 Applications for distributed energy storage
Stored energy can only be distributed in a chemical form. Thus, is may be distributed in batteries
and in the form of hydrogen. As previously mentioned, hydrogen can be compressed and stored
in carbon fiber tanks, allowing for its transportation. Another way of distributing hydrogen is
through a pipeline network.
4.2 Industrial and commercial applications
To analyses storage impact on commercial and industrial applications, it is necessary to take
into account the consumption daily profile that we are targeting because this daily profile may
change a lot depending on the type of application. We can consider that the peak consumption
for commercial and service buildings happens between 9h and 19h. In the industry however,
the peak consumption may change, depending on the type of industry. Some may work 24 hours
during 7 days a week and others may have a 9h till 18h schedule, 5 times a week. In figure 41,
we represent an example of the demand for each of these types of application.
Figure 41- Demand [36].
For the system to be autonomous, it is necessary for the hybrid system (PV + batteries) with a
diesel generator in backup. In the case of an industrial application, contracted power of 100 kW
was considered. This power would be continuous throughout 24 hours, for an industry that
operates during night, or for an industry operating from 9h to 18h, with a residual consumption
of about 6 kW. The residual consumption includes the building’s air-treatment and air-
conditioning systems and some equipment that remains working during the night.
For a commercial application, a contracted power of 20 kW was considered with a 7 kW
residual consumption during the night. The figure below illustrates the evolution in
consumption for different applications throughout the day and the solar irradiation during the
month of December, in a typical year, in Oliveira de Frades.

Overview of energy storage technologies for PV systems
Tânia Sofia Varela Santos 43
Figure 42- Industrial and commercial demand and irradiation for a typical December day.
For the case of an industry with continuous working hours, the ideal would be to have a hybrid
system where a direct consumption of energy would occur, from photovoltaic panels that would
provide at the same time, battery storage. During the night, the batteries would be discharged
between 16h and 24h. During low-peak hours (0h to 7h), it would be best to use the grid, since
in this period, energy would be cheaper.
Figure 43 illustrates the evolution in consumption for an industry with working hours from 8h
till 18h.
Figure 43- Industrial consumption [37].
As observed in Figure 43, the use of a PV system could reduce considerably an electricity bill.
During peak hours, the energy produced can be used directly, allowing for a reduced
consumption of the energy from the grid. Apart from the auto-consumption, it is also possible
to store energy produced by the PV system in batteries. This energy would be consumed later
on when the production of renewable energy did not meet consumption requirements. Another
option would be to recharge batteries during low-peak hours, when energy is cheapest, and then
use this energy when consumption is higher than production. This way, it would be possible to
avoid using energy from the grid, which is normally more expensive during peak hours. This
0
20
40
60
80
100
120
140
160
180
200
0
100
200
300
400
500
600
00:00 02:24 04:48 07:12 09:36 12:00 14:24 16:48 19:12 21:36 00:00
Dem
and
[kW
]
Irra
dia
tio
n [
W/m
2]
G Industrial 24h Industrial 9-18h Commercial

Overview of energy storage technologies for PV systems
Tânia Sofia Varela Santos 44
type of industrial consumption is very similar to commercial consumption, meaning that the
same options for storing energy may be applied.
4.3 Residential applications
Residential consumption has a variety of variations throughout the day. Normally, two peaks
of consumption are present, one in the morning from 6-8h and another at night around 20h.
These peaks are mostly due to the population’s working period. For a better consumption
management, apart from the energy provided from the grid, a hybrid system can be
implemented.
Figure 44 demonstrates the variation in consumption, and the expected production of renewable
energy from a PV hybrid system and how its consumption can be managed. This example is
based on a small contracted power of 1kW just for convenience.
Figure 44- Residential demand [38].
Due to the variability of consumption in the residential sector, with the lowest consumption
being at midday, a PV system would allow for storing energy during those hours, and then use
it in peak hours, between 18h and 24h. This way, the consumer would only be using energy
from the grid during low-peak hours, which is cheaper. During peak-hours, energy would be
injected into the grid from the photovoltaic system, a period during which energy is more
expensive.
Figure 40 demonstrates the variation on demand using only a PV system and a hybrid system.

Overview of energy storage technologies for PV systems
Tânia Sofia Varela Santos 45
Figure 45- Residential demand with PV system and batteries [39].
Through the analysis of the figure, we can conclude that the demand of energy can decrease
considerably with a hybrid system. This happens since the energy stored during sunlight hours,
is later used during peak-hours.
4.4 Applications for transports
For transports, batteries and hydrogen can be used as storage technologies. Batteries may be
used in plug-in cars, which can be recharged during the night when electricity is cheaper or at
electric service stations throughout the city. These batteries need to have certain characteristics
to be used in vehicles, such as high specific energy, high autonomy and safety. Lithium batteries
are the most used for this kind of application since they present the highest specific energy
within the secondary batteries. They also present, however, low autonomy and high risk of
explosion. One of the technologies still in development, and presenting very promising
characteristics for this type of application, is the Li-air batteries. These have the higher specific
energy in the lithium batteries (figure 46), making their autonomy higher and they do not
present risk of explosion.
Figure 46- Energy density for different types of lithium batteries [40].

Overview of energy storage technologies for PV systems
Tânia Sofia Varela Santos 46
There are vehicles that use hydrogen as a combustion fuel, which is converted into electricity
through fuel cells.
As referred to previously, hydrogen can be produced through electrolysis, using electricity from
renewable sources, such as the wind power. This renewable source has its production peak
during the night, when demand is reduced. This means that the energy produced in wind parks
can be used to produce hydrogen. The hydrogen will then be stored in tanks and commercialized
in service stations to supply fuel cell vehicles.
Figure 47- Fuel cell car [41].
4.5 Off-grid applications
In off-grid applications, it is possible to use a source of renewable energy, such as a PV panel
with energy storage (batteries) and a diesel generator as backup. The PV system will produce
electricity during the day for auto-consumption and will store energy in the batteries to.
As this is an off-grid application, the sizing of the batteries bank must be made with autonomy
for several days, because it is not possible to use the grid when there is not enough sun during
several days. When battery’s autonomy is not sufficient, it is possible to use the generator to
produce extra energy. In figure 48, an example of an off-grip application with a hybrid system
and a diesel generator is shown.

Overview of energy storage technologies for PV systems
Tânia Sofia Varela Santos 47
Figure 48- Off-grid application [42].
In off-grid applications, the system requires intelligent networks for consumption management.
In other words, the consumptions should always be inferior or equal to production. When it is
superior, it needs to resort to the batteries or the generator to supplement that necessity. When
the production of renewable energy is higher than demand, the extra energy will be stored in
the batteries to later be used when there is no production. The system is controlled by two
devices that manage the consumption and the production. The Main Controller controls the
production and the Demand Management controls the consumption.
4.6 Applications for integration with renewable resources
Since renewable energy is variable and not controllable, energy production will in general not
match demand. A way of avoiding this problem is to store energy when it is produced and not
needed. The wind power plants are an example of this process since their peak production is
usually during the night when consumption is low. To not shut down the centrals, the energy
produced may be used, for instance, for pumping water in PHS. This means that during the
night, the water is transported from the downstream dam to the upstream dam, to be used later,
when necessary. This is a good form of storage since the cost for producing electricity in PHS
is significantly lower compared to other forms of storage technologies (figure 49). Another
advantage comes from the fact that hydroelectric centrals are dispatchable and, when necessary,
can produce electricity to meet demand very fast.

Overview of energy storage technologies for PV systems
Tânia Sofia Varela Santos 48
Figure 49- Capital cost per cycle for different technologies.
0.000
0.000
0.000
0.000
0.000
0.000
0.000
0.000
0.000
PHS Flywheels CAES Secondarybatteries
Flowbatteries
SMES EDLC
Cap
ital
co
st [
€/k
Wh
.cyc
le]
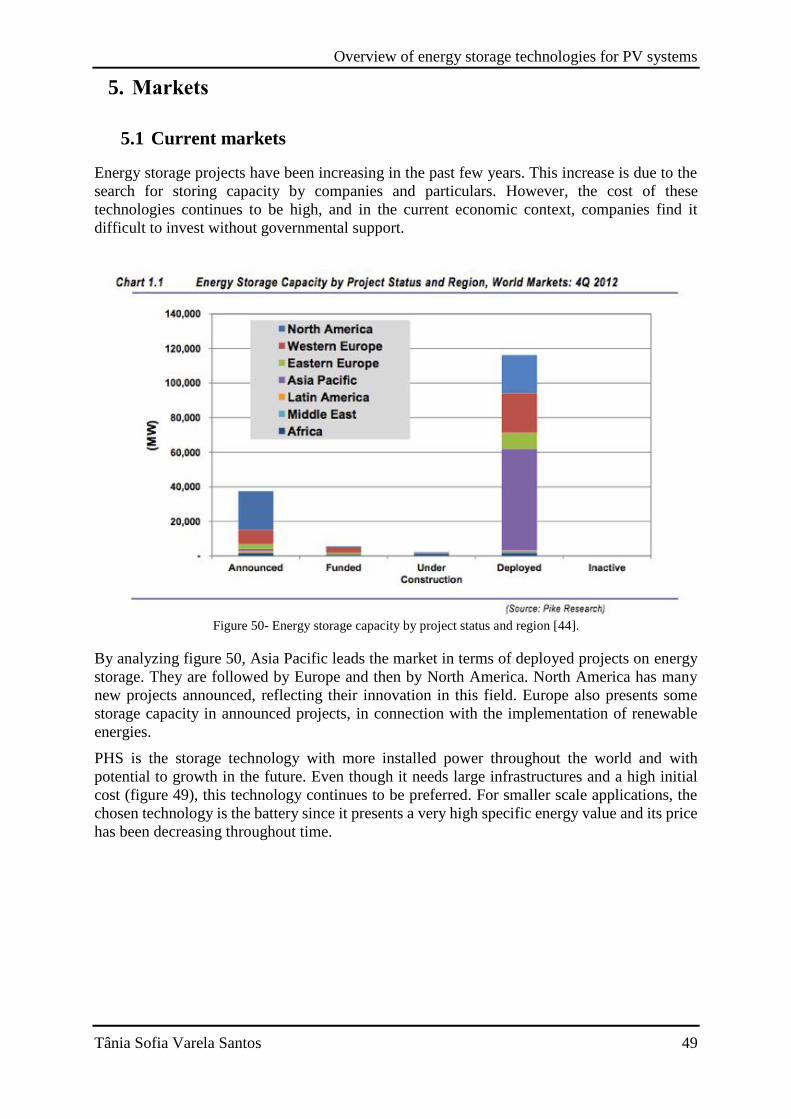
Overview of energy storage technologies for PV systems
Tânia Sofia Varela Santos 49
5. Markets
5.1 Current markets
Energy storage projects have been increasing in the past few years. This increase is due to the
search for storing capacity by companies and particulars. However, the cost of these
technologies continues to be high, and in the current economic context, companies find it
difficult to invest without governmental support.
Figure 50- Energy storage capacity by project status and region [44].
By analyzing figure 50, Asia Pacific leads the market in terms of deployed projects on energy
storage. They are followed by Europe and then by North America. North America has many
new projects announced, reflecting their innovation in this field. Europe also presents some
storage capacity in announced projects, in connection with the implementation of renewable
energies.
PHS is the storage technology with more installed power throughout the world and with
potential to growth in the future. Even though it needs large infrastructures and a high initial
cost (figure 49), this technology continues to be preferred. For smaller scale applications, the
chosen technology is the battery since it presents a very high specific energy value and its price
has been decreasing throughout time.

Overview of energy storage technologies for PV systems
Tânia Sofia Varela Santos 50
Figure 51- Advanced battery energy storage by segment, World Markets: 2012 [45].
In figure 51, the battery market is represented. It is possible to observe that more than 87% of
the market belongs to the electronic consumables. The vehicle section represents a small
percentage in the battery market. However, this value may begin to increase due to the
implementation of electric vehicles in the market. Stationary storage represents just 0.8% of the
total, making this segment, one of big potential and opportunity in the market.
5.2 Opportunities
The market opportunities are found in three zones: in the north of North America (Canada and
north of United States of America), in Europe and in non-developed countries (Asia Pacific,
Africa and Latin America)
One of the very important market segments, are for the commercial building to have an
uninterrupted power system (UPS), betting this way, on a system for energy storage. Figure 52
shows a prediction of this market’s growth.

Overview of energy storage technologies for PV systems
Tânia Sofia Varela Santos 51
Figure 52 - Energy storage in commercial buildings revenue and capacity by region [45].
The tendency of a market for energy storage, in the segment of commercial buildings, is to
increase over the years, especially in North America, Europe and Asia Pacific. The capacity
may increase five times more and the installed power may double within nine years.
The biggest opportunity in the European market is in the auto-consumption segment. This is
because what defines Europe is the integration of renewable energies and as already mentioned,
the renewable energies must rely on storage. In the different sections, PV systems can be
installed to produce energy during peak hours, when electricity is more expensive. By
implementing the auto-consumption, the energy produced may be used directly and the
remainder is stored to use later on, as mentioned earlier in the “Applications” chapter.
In the north of North America, there are many adverse situations that cause breakdowns on the
grid during several days. For this reason, systems to store energy may be implemented to
stabilize transmission and energy distribution (T&D).
Countries like India, Mexico, Peru, Chile and most countries in the African continent, do not
have a very complete T&D network. This results in many villages, and isolated places not
having electricity and creates, therefore, opportunities in the market for off-grid applications.
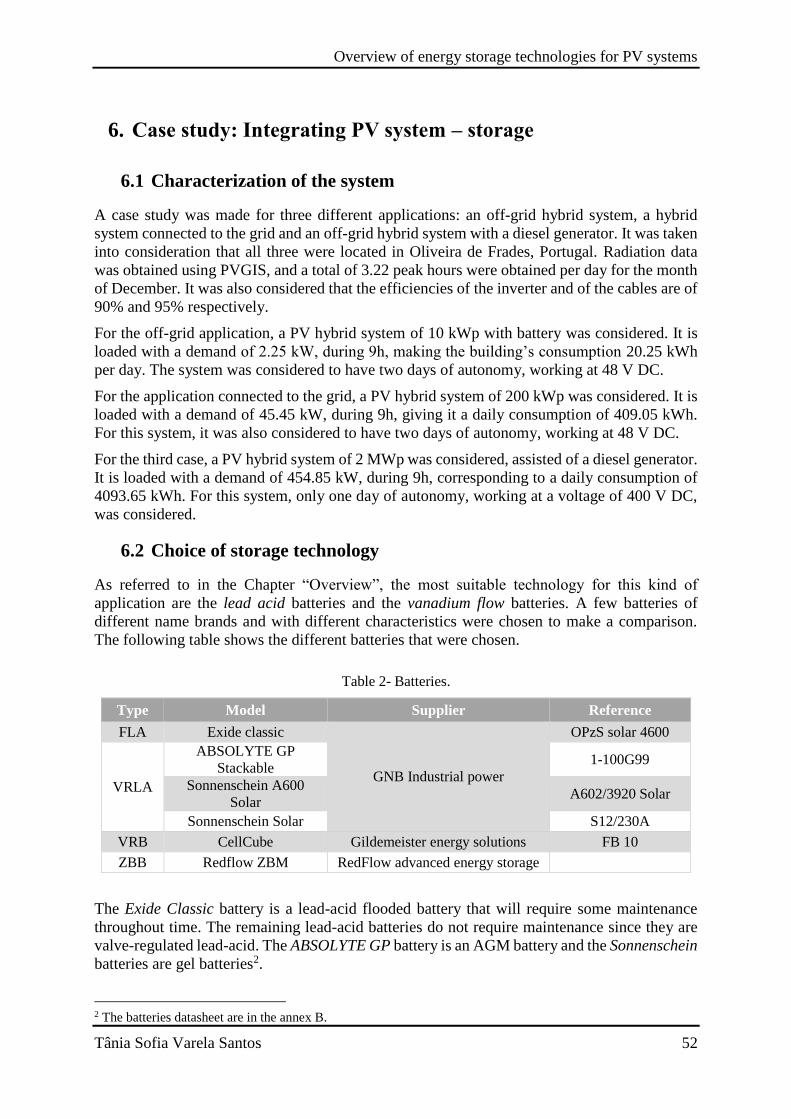
Overview of energy storage technologies for PV systems
Tânia Sofia Varela Santos 52
6. Case study: Integrating PV system – storage
6.1 Characterization of the system
A case study was made for three different applications: an off-grid hybrid system, a hybrid
system connected to the grid and an off-grid hybrid system with a diesel generator. It was taken
into consideration that all three were located in Oliveira de Frades, Portugal. Radiation data
was obtained using PVGIS, and a total of 3.22 peak hours were obtained per day for the month
of December. It was also considered that the efficiencies of the inverter and of the cables are of
90% and 95% respectively.
For the off-grid application, a PV hybrid system of 10 kWp with battery was considered. It is
loaded with a demand of 2.25 kW, during 9h, making the building’s consumption 20.25 kWh
per day. The system was considered to have two days of autonomy, working at 48 V DC.
For the application connected to the grid, a PV hybrid system of 200 kWp was considered. It is
loaded with a demand of 45.45 kW, during 9h, giving it a daily consumption of 409.05 kWh.
For this system, it was also considered to have two days of autonomy, working at 48 V DC.
For the third case, a PV hybrid system of 2 MWp was considered, assisted of a diesel generator.
It is loaded with a demand of 454.85 kW, during 9h, corresponding to a daily consumption of
4093.65 kWh. For this system, only one day of autonomy, working at a voltage of 400 V DC,
was considered.
6.2 Choice of storage technology
As referred to in the Chapter “Overview”, the most suitable technology for this kind of
application are the lead acid batteries and the vanadium flow batteries. A few batteries of
different name brands and with different characteristics were chosen to make a comparison.
The following table shows the different batteries that were chosen.
Table 2- Batteries.
The Exide Classic battery is a lead-acid flooded battery that will require some maintenance
throughout time. The remaining lead-acid batteries do not require maintenance since they are
valve-regulated lead-acid. The ABSOLYTE GP battery is an AGM battery and the Sonnenschein
batteries are gel batteries2.
2 The batteries datasheet are in the annex B.
Type Model Supplier Reference
FLA Exide classic
GNB Industrial power
OPzS solar 4600
VRLA
ABSOLYTE GP
Stackable 1-100G99
Sonnenschein A600
Solar A602/3920 Solar
Sonnenschein Solar S12/230A
VRB CellCube Gildemeister energy solutions FB 10
ZBB Redflow ZBM RedFlow advanced energy storage
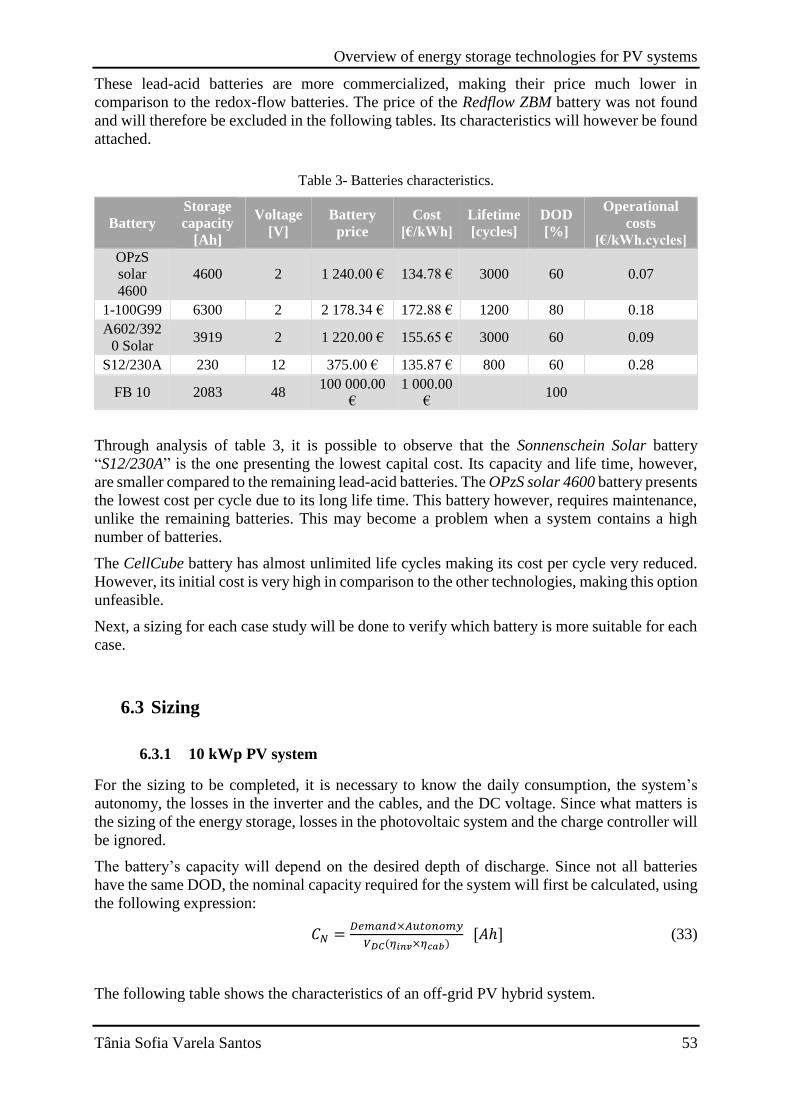
Overview of energy storage technologies for PV systems
Tânia Sofia Varela Santos 53
These lead-acid batteries are more commercialized, making their price much lower in
comparison to the redox-flow batteries. The price of the Redflow ZBM battery was not found
and will therefore be excluded in the following tables. Its characteristics will however be found
attached.
Table 3- Batteries characteristics.
Through analysis of table 3, it is possible to observe that the Sonnenschein Solar battery
“S12/230A” is the one presenting the lowest capital cost. Its capacity and life time, however,
are smaller compared to the remaining lead-acid batteries. The OPzS solar 4600 battery presents
the lowest cost per cycle due to its long life time. This battery however, requires maintenance,
unlike the remaining batteries. This may become a problem when a system contains a high
number of batteries.
The CellCube battery has almost unlimited life cycles making its cost per cycle very reduced.
However, its initial cost is very high in comparison to the other technologies, making this option
unfeasible.
Next, a sizing for each case study will be done to verify which battery is more suitable for each
case.
6.3 Sizing
6.3.1 10 kWp PV system
For the sizing to be completed, it is necessary to know the daily consumption, the system’s
autonomy, the losses in the inverter and the cables, and the DC voltage. Since what matters is
the sizing of the energy storage, losses in the photovoltaic system and the charge controller will
be ignored.
The battery’s capacity will depend on the desired depth of discharge. Since not all batteries
have the same DOD, the nominal capacity required for the system will first be calculated, using
the following expression:
𝐶𝑁 =𝐷𝑒𝑚𝑎𝑛𝑑×𝐴𝑢𝑡𝑜𝑛𝑜𝑚𝑦
𝑉𝐷𝐶(𝜂𝑖𝑛𝑣×𝜂𝑐𝑎𝑏) [𝐴ℎ] (33)
The following table shows the characteristics of an off-grid PV hybrid system.
Battery
Storage
capacity
[Ah]
Voltage
[V]
Battery
price
Cost
[€/kWh]
Lifetime
[cycles]
DOD
[%]
Operational
costs
[€/kWh.cycles]
OPzS
solar
4600
4600 2 1 240.00 € 134.78 € 3000 60 0.07
1-100G99 6300 2 2 178.34 € 172.88 € 1200 80 0.18
A602/392
0 Solar 3919 2 1 220.00 € 155.65 € 3000 60 0.09
S12/230A 230 12 375.00 € 135.87 € 800 60 0.28
FB 10 2083 48 100 000.00
€
1 000.00
€ 100

Overview of energy storage technologies for PV systems
Tânia Sofia Varela Santos 54
Table 4 - 10 kWp system characteristics.
Once the nominal capacity of the storage is known, it is possible to know the nominal capacity
for each type of battery. This can be done by dividing the system’s nominal capacity by the
battery’s depth of discharge. In the case of the CellCube battery, it is also necessary to divide
by the battery’s efficiency value.
The following step is to know the number of strings (34) and the number of batteries in parallel
(35) in order to know the total number of batteries of the batteries bank.
𝑁𝑠 =𝑉𝐷𝐶
𝑉𝐵 (34)
𝑁𝑝 =𝐶𝑁
𝐶𝐵 (35)
Table 5 - Batteries characteristics for 10 kWp system.
As foreseen, if the Sonnenschein Solar battery is utilized, the bank of batteries will contain 28
batteries, an extra 4 batteries in comparison to the other lead-acid batteries. The CellCube
batteries have a higher capacity than required, making only one module necessary.
For the choice of the best battery to be made, it is necessary to know the total cost for the bank
of batteries as well as the cost per cycle.
System power [kWp] 10
Demand [kWh] 20.25
Autonomy [days] 2
System voltage [V] 48
DC load [Wh] 47368
Nominal capacity [Ah] 987
Model Capacity
[Ah]
Voltage
[V] DOD Efficiency CN [Ah] Ns Np Total
OPzS solar
4600 4600 2 70% 1410 24 1 24
ABSOLYTE
GP Stackable 6300 2 70% 1410 24 1 24
Sonnenschein
A600 Solar 3919 2 70% 1410 24 1 24
Sonnenschein
Solar 230 12 70% 1410 4 7 28
CellCube 2083 48 100% 80% 1234 1 1 1

Overview of energy storage technologies for PV systems
Tânia Sofia Varela Santos 55
Table 6 - Batteries cost for 10 kWp system.
The bank of batteries containing Sonnenschein Solar batteries, contains a higher number of
batteries but the total cost remains inferior to the remainder. The cost per cycle, however, is
higher than the Sonnenschein A600 Solar batteries. The difference between the cost per cycle
is lower in comparison to the difference between the final cost of the batteries. This therefore
makes the Sonnenschein Solar batteries the final choice of battery, presenting an initial cost of
10 500.00 € and a bank with 28 batteries.
6.3.2 200 kWp PV system
As referred to previously, this application consists in a PV hybrid system connected to the grid.
It may be considered that this system targets the auto-consumption market mentioned in
Chapter 5 and may work as a residential application, referred to in chapter 4.3.
By using expression 33, it is possible to calculate the system’s nominal capacity, presented in
table 7.
Table 7 - 200 kWp system characteristics.
With a nominal capacity of 19.93 kAh, it is possible to calculate the number of strings and
batteries in parallel, using expression 34 and 35 respectively.
Table 8 - Batteries characteristics for 200 kWp system.
Model Batteries total Unit price Total price Cost per cycle
OPzS solar 4600 24 1 240.00 € 29 760.00 € 9.92 €
ABSOLYTE GP Stackable 24 2 178.34 € 52 280.25 € 43.57 €
Sonnenschein A600 Solar 24 1 220.00 € 29 280.00 € 9.76 €
Sonnenschein Solar 28 375.00 € 10 500.00 € 13.13 €
CellCube 1 100 000.00 € 100 000.00 €
System power [kWp] 200
Demand [kWh] 409.05
Autonomy [days] 2
System voltage [V] 48
DC load [kWh] 956.84
Nominal capacity [kAh] 19.93
Model Capacity
[Ah]
Voltage
[V] DOD Efficiency CN [Ah] Ns Np Total
OPzS solar
4600 4600 2 70% 28477 24 7 168
ABSOLYTE
GP Stackable 6300 2 70% 28477 24 5 120
Sonnenschein
A600 Solar 3919 2 70% 28477 24 8 192
Sonnenschein
Solar 230 12 70% 28477 4 124 496
CellCube 2083 48 100% 80% 24918 1 12 12

Overview of energy storage technologies for PV systems
Tânia Sofia Varela Santos 56
When using the ABSOLYTE GP Stackable batteries, the bank merely needs 120 batteries to
obtain the desired capacity.
Table 9 shows the cost of the battery bank and the cost per cycle for the batteries.
Table 9 - Batteries cost for 200 kWp system.
Even though the ABSOLYTE GP Stackable batteries present a lower battery bank, they also
present a higher final cost and cost per cycle.
The batteries that present a lower cost are the Sonnenschein Solar batteries, since 496 batteries
constitute this bank. This is a higher number in comparison to the remaining batteries. Another
negative aspect is their cost per cycle of 232.50€, a high value in comparison to the remaining
batteries.
Through analysis of Table 9, we can verify that OPzS Solar 4600 batteries are more indicated
for this case. Both their final cost and the number of batteries utilized is reasonable and the cost
per cycle is much lower in comparison to the remaining batteries.
6.3.3 2MWp PV system
An off-grid application with a PV hybrid system of 2 MWp and a backup diesel generator is
now considered. A daily consumption of 4.09 MWh and a voltage of 400 V DC was considered
for the system. This also allows for minimizing losses. The nominal capacity can be calculated
with expression 33.
All the system’s characteristics are represented in Table 10.
Table 10 - 2 MWp system characteristics.
As the system works at 400 V DC, the capacity of the battery bank will be lower in comparison
to what is expected with 48 V DC.
Model Batteries total Unit price Total price Cost per cycle
OPzS solar 4600 168 1 240.00 € 208 320.00 € 69.44 €
ABSOLYTE GP Stackable 120 2 178.34 € 261 401.25 € 217.83 €
Sonnenschein A600 Solar 192 1 220.00 € 234 240.00 € 78.08 €
Sonnenschein Solar 496 375.00 € 186 000.00 € 232.50 €
CellCube 12 100 000.00 € 1 200 000.00 €
System power [MWp] 2
Demand [MWh] 4.09
Autonomy [days] 1
System voltage [V] 400
DC load [MWh] 4.79
Nominal capacity [kAh] 11.97
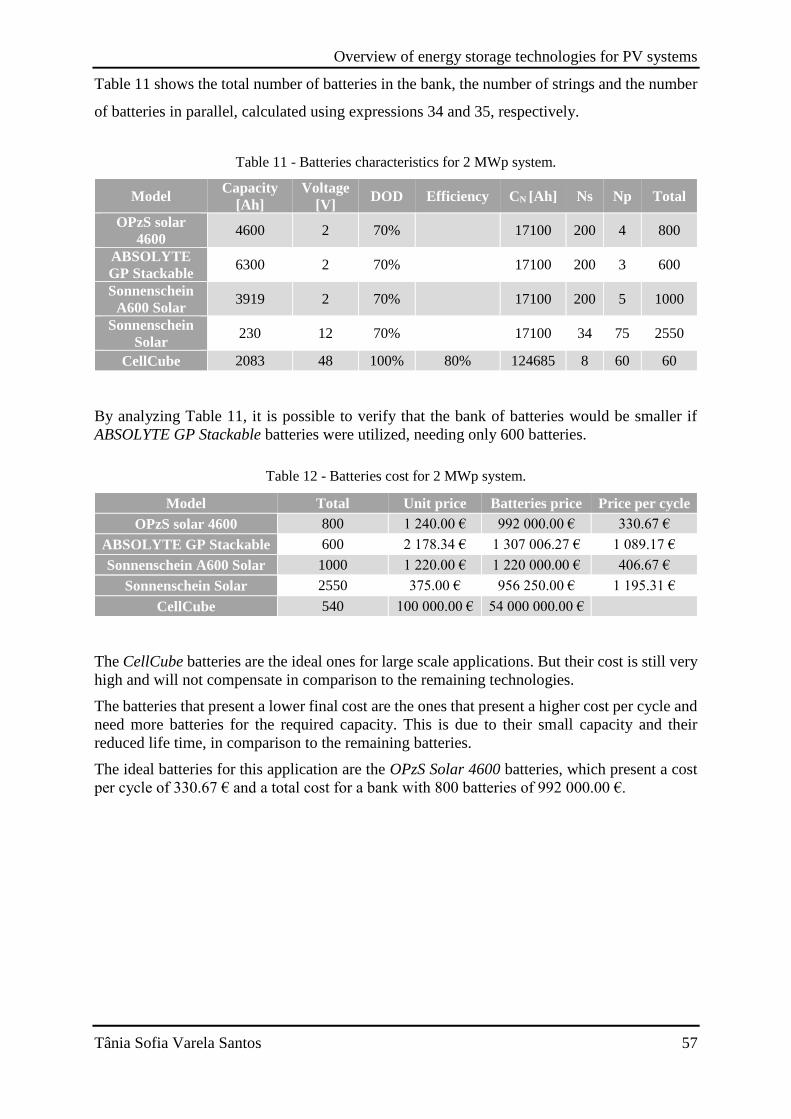
Overview of energy storage technologies for PV systems
Tânia Sofia Varela Santos 57
Table 11 shows the total number of batteries in the bank, the number of strings and the number
of batteries in parallel, calculated using expressions 34 and 35, respectively.
Table 11 - Batteries characteristics for 2 MWp system.
By analyzing Table 11, it is possible to verify that the bank of batteries would be smaller if
ABSOLYTE GP Stackable batteries were utilized, needing only 600 batteries.
Table 12 - Batteries cost for 2 MWp system.
The CellCube batteries are the ideal ones for large scale applications. But their cost is still very
high and will not compensate in comparison to the remaining technologies.
The batteries that present a lower final cost are the ones that present a higher cost per cycle and
need more batteries for the required capacity. This is due to their small capacity and their
reduced life time, in comparison to the remaining batteries.
The ideal batteries for this application are the OPzS Solar 4600 batteries, which present a cost
per cycle of 330.67 € and a total cost for a bank with 800 batteries of 992 000.00 €.
Model Capacity
[Ah]
Voltage
[V] DOD Efficiency CN [Ah] Ns Np Total
OPzS solar
4600 4600 2 70% 17100 200 4 800
ABSOLYTE
GP Stackable 6300 2 70% 17100 200 3 600
Sonnenschein
A600 Solar 3919 2 70% 17100 200 5 1000
Sonnenschein
Solar 230 12 70% 17100 34 75 2550
CellCube 2083 48 100% 80% 124685 8 60 60
Model Total Unit price Batteries price Price per cycle
OPzS solar 4600 800 1 240.00 € 992 000.00 € 330.67 €
ABSOLYTE GP Stackable 600 2 178.34 € 1 307 006.27 € 1 089.17 €
Sonnenschein A600 Solar 1000 1 220.00 € 1 220 000.00 € 406.67 €
Sonnenschein Solar 2550 375.00 € 956 250.00 € 1 195.31 €
CellCube 540 100 000.00 € 54 000 000.00 €
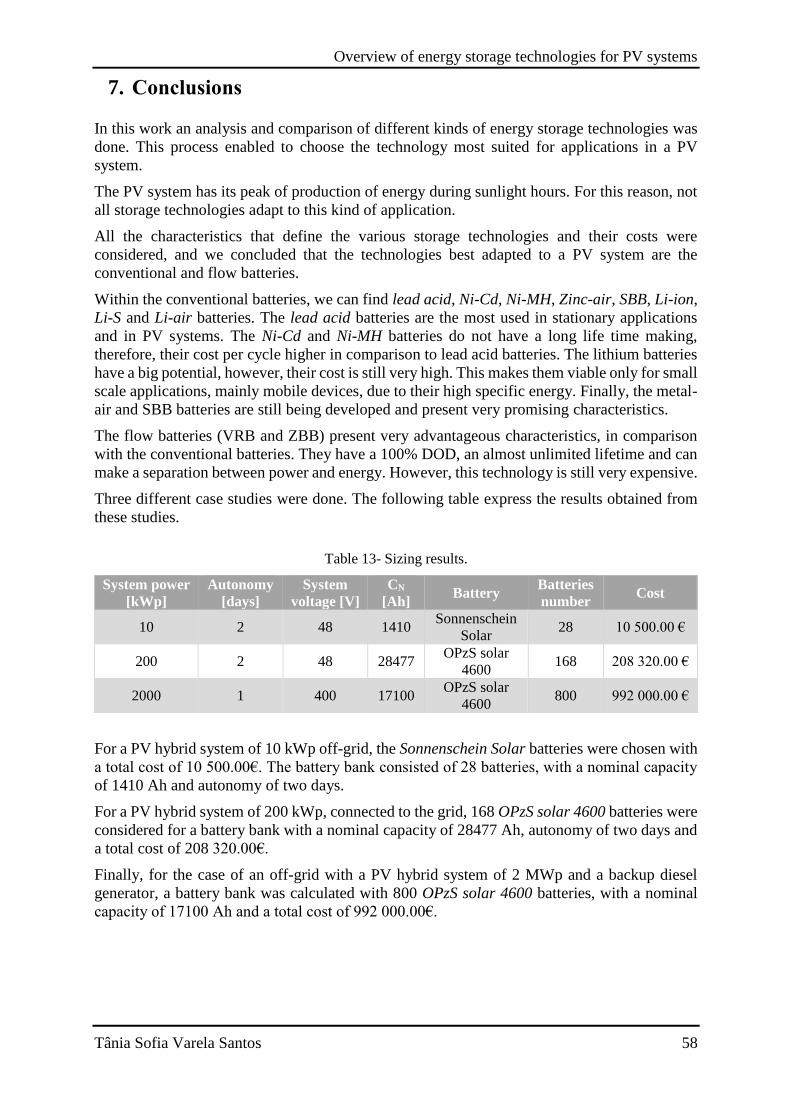
Overview of energy storage technologies for PV systems
Tânia Sofia Varela Santos 58
7. Conclusions
In this work an analysis and comparison of different kinds of energy storage technologies was
done. This process enabled to choose the technology most suited for applications in a PV
system.
The PV system has its peak of production of energy during sunlight hours. For this reason, not
all storage technologies adapt to this kind of application.
All the characteristics that define the various storage technologies and their costs were
considered, and we concluded that the technologies best adapted to a PV system are the
conventional and flow batteries.
Within the conventional batteries, we can find lead acid, Ni-Cd, Ni-MH, Zinc-air, SBB, Li-ion,
Li-S and Li-air batteries. The lead acid batteries are the most used in stationary applications
and in PV systems. The Ni-Cd and Ni-MH batteries do not have a long life time making,
therefore, their cost per cycle higher in comparison to lead acid batteries. The lithium batteries
have a big potential, however, their cost is still very high. This makes them viable only for small
scale applications, mainly mobile devices, due to their high specific energy. Finally, the metal-
air and SBB batteries are still being developed and present very promising characteristics.
The flow batteries (VRB and ZBB) present very advantageous characteristics, in comparison
with the conventional batteries. They have a 100% DOD, an almost unlimited lifetime and can
make a separation between power and energy. However, this technology is still very expensive.
Three different case studies were done. The following table express the results obtained from
these studies.
Table 13- Sizing results.
For a PV hybrid system of 10 kWp off-grid, the Sonnenschein Solar batteries were chosen with
a total cost of 10 500.00€. The battery bank consisted of 28 batteries, with a nominal capacity
of 1410 Ah and autonomy of two days.
For a PV hybrid system of 200 kWp, connected to the grid, 168 OPzS solar 4600 batteries were
considered for a battery bank with a nominal capacity of 28477 Ah, autonomy of two days and
a total cost of 208 320.00€.
Finally, for the case of an off-grid with a PV hybrid system of 2 MWp and a backup diesel
generator, a battery bank was calculated with 800 OPzS solar 4600 batteries, with a nominal
capacity of 17100 Ah and a total cost of 992 000.00€.
System power
[kWp]
Autonomy
[days]
System
voltage [V]
CN
[Ah] Battery
Batteries
number Cost
10 2 48 1410 Sonnenschein
Solar 28 10 500.00 €
200 2 48 28477 OPzS solar
4600 168 208 320.00 €
2000 1 400 17100 OPzS solar
4600 800 992 000.00 €

Overview of energy storage technologies for PV systems
Tânia Sofia Varela Santos 59
8. References
[1] - http://www.intechopen.com/books/energy-storage-technologies-and-applications/techno-economic-
analysis-of-different-energy-storage-technologies. Withdrawn 15/09/2014.
[2] - http://www.portal-energia.com/dimensionamento-do-controlador-de-carga-para-um-sistema-solar/.
Withdrawn 25/11/2014.
[3] - Ibrahim, H., A. Içinca and J. Perron, 2008. Energy storage systems – Characteristics and comparisons.
Canada: Renewable and Sustainable Energy Reviews 12 (2008) 1221-1250.
[4] - Bolund, Björn, Hans Bernhoff and Mats Leijon, 2005. Flywheel energy and power storage systems.
Sweden: Renewable and Sustainable Energy Reviews 11 (2007) 235-258.
[5] - http://large.stanford.edu/courses/2010/ph240/barile2/. Novembro de 2014.
[6] - http://greenterrafirma.com/solar-thermal-for-electricity.html. Withdrawn 24/11/2014.
[7] – Siegel, Nathan P., 2012. Thermal energy storage for solar power production. USA: WIREs Energy
Environ, 1: 119-131 doi: 10.1002/wene.10.
[8] - “Lithium-ion rechargeable battery – discharge mechanism” image, 2014.
http://electronics.howstuffworks.com/everyday-tech/lithium-ion-battery1.htm.
[9] - Honsberg, H., 2008. ELEG620: Solar Electric Systems.
[10] – Messeger, Roger A. and Jerry Ventre, 2003. Photovoltaic System Engineering, 2nd, CRC Press,
Washington. 60
[11] – Shukla, A. K., S. Venugopalan, B. Hariprakash, 2001. Nickel – based rechargeable batteries.
India:Journal of Power Sources 100 (2001), 125-148.
[12] – Fetcenko, M. A., S.R. Ovshinsky, B. Reichman, K. Young, C. Fierro, J. Koch, A. Zallen, W. Mays, T.
Ouchi, 2007. Recent advances in NiMH battery technology. USA: Journal of Power Sources 165 (2007) 544-
551.
[13] – EOS Energy Storage, 2014. Introductory Briefing.
[14] – Soloveichik, Grigorii L., 2011. Battery technologies for large-scale stationary energy storage. Doi:
10.1146/ annurev-chembioeng-061010-114116.
[15] – DOE/EPRI 2013. Electricity storage handbook in collaboration with NRECA. Sandia National
Laboratories. Pg. 29-109.
[16] – Ibrahim, Hussein, Adrian Ilinca, 2013. Techno-economic analysis of different energy storage e
technologies. http://dx.doi.org/10.5772/52220.
[17] - http://www.ncbi.nlm.nih.gov/pubmed/25081362. November 2014.
[18] - https://www.semiconportal.com/en/archive/news/main-news/111026-ngk-nas-battery.html. Withdrawn
24/11/2014.
[19] - Scrosati, Bruno, Jürgen Garche, 2009. Lithium Batteries: Status, prospects and future . Italy: Journal of
Power Sources 195 (2010) 2419–2430.

Overview of energy storage technologies for PV systems
Tânia Sofia Varela Santos 60
[20] – Chen, Lin, Leon L. Shaw, 2014. Recent advances in lithium-sulfur batteries. USA: Journal of Power
Sources 267 (2014) 770-783.
[21] - http://www.gizmag.com/lithium-sulfur-battery-energy-density/29907/. Withdrawn 11/11/2014.
[22] – Padbury, Richard, Xiangwu Zhang, 2011. Lithium-oxygen batteries – Limiting factors that affect
performance. USA: Journal of Power Sources 196 (2011) 4436-4444.
[23] – Imanishi, Nobuyuki, Osamu Yamamoto, 2013. Rechargeable lithium-air batteries: characteristics and
prospects. Japan: http://dx.doi.org/10.1016/j.mattod.2013.12.004.
[24] – Kraytsberg, Alexander, Yair Ein-Eli, 2010. Review on Li-air batteries – Opportunities, limitations and
perspective. Israel: Journal of Power Sources 196 (2011) 886-893.
[25] - Weber, Adam Z., Matthew M. Mench, Jeremy P. Meyers, Philip N. Ross, Jeffrey T. Gostick, Quinghua
Liu, 2011. Redox-flow batteries: a review. J Appl Electrochem, 41:1137–1164. DOI: 10.1007/s10800-011-
0348-2.
[26] - http://energystorage.org/energy-storage/technologies/redox-flow-batteries. Withdrawn 13/11/2014.
[27] - http://solarenergyengineering.asmedigitalcollection.asme.org/article.aspx?articleid=1731893. Withdrawn
19/11/2014.
[28] - http://energystoragedemo.epri.com/cec/zbb/tech_desc.asp. Withdrawn 19/11/2014.
[29] - http://www.nmsea.org/Curriculum/7_12/electrolysis/electrolysis.htm. Withdrawn 17/09/2014.
[30] - http://americanhistory.si.edu/fuelcells/basics.htm. Withdrawn 17/09/2014.
[31] - http://upload.wikimedia.org/wikipedia/commons/3/3e/EERE_Fuel_Cell_Comparison_Chart2.png.
Withdrawn 17/09/2014.
[32] - http://energystoragesense.com/superconducting-magnetic-energy-storage-smes/. Withdrawn 25/11/2014..
[33]- http://energystoragesense.com/supercapacitors/. Withdrawn 25/11/2014.
[34] -
http://www.albertatechfutures.ca/RDSupport/EnvironmentandCarbonManagement/CarbonCaptureStorageandCle
anEnergy/CleanEnergy/ElectricEnergyStorage.aspx. Withdrawn 15/09/2014.
[35] - http://www.intechopen.com/books/energy-storage-technologies-and-applications/techno-economic-
analysis-of-different-energy-storage-technologies. Withdrawn 15/09/2014.
[36] - http://www.evconversion.co.nz/sustainability/vehicle-to-grid-technology/. Withdrawn 15/09/2014.
[37] - http://ofrioquevemdosol.blogspot.pt/2014/05/franca-autoconsumo-de-energia-solar_22.html. Withdrawn
11/12/2014.
[38] - http://www.bine.info/en/publications/projektinfos/publikation/multifunktionale-wechselrichter/.
Withdrawn 04/12/2014.
[39] - http://www.nacleanenergy.com/articles/16088/the-unique-advantage-pv-battery-storage-gives-
commercial-buildings. Withdrawn 04/12/2014.

Overview of energy storage technologies for PV systems
Tânia Sofia Varela Santos 61
[40] - http://www.nature.com/srep/2014/140122/srep03815/full/srep03815.html. Withdrawn 11/11/2014.
[41] - http://www.hydrogenfuturetoday.com/car.html. Withdrawn 17/12/2014.
[42] – “Time-delayed self-consumption isolated from the grid”. Self-consumption Solutions, Circutor, Spain.
[43] - IBESA Renewable Energies and Electricity Storage Report - Technologies and Markets- European
Edition, 2013. EuPD Research.
[44] - http://www.energymanagertoday.com/global-energy-storage-projects-top-700-087896/. Withdrawn
26/01/2015.
[45] - http://www.energymanagertoday.com/stationary-storage-fraction-of-advanced-battery-market-097419/.
Withdrawn 26/01/2015.
[46] - http://www.energymanagertoday.com/energy-storage-in-commercial-buildings-market-to-reach-7-5bn-in-
2022-089368/. Withdrawn 26/01/2015.

Overview of energy storage technologies for PV systems
Tânia Sofia Varela Santos 62
9. Annex A – Theoretical characteristics of storage technologies
Table 14 - Theoretical characteristics of storage technologies [14,16,43].
Technology Power rating Discharge time Specific energy (Wh/kg)
Theory Pratical
PHS 100-5000 MW 1-24 h+ 0.5-1.5
Flywheels 0-1 MW Milliseconds-15 min 10-30
CAES 5-400 MW 1-24 h+ 30-60
Secondary
batteries
Lead-acid 0-20 MW
Seconds-hours
170 30-50
NiCd 0-40 MW 315 50-75
NiMH 60-120
SBB 50 kW-8 MW 755 150-240
L-ion 0-100 kW Minutes-hours
560 75-200
Li-S 2500 200-300
Li-air Seconds-24 h+
12000 1000
Zinc-air 1084
Flow
batteries
VRB 30 kW-3 MW
Seconds-hours
34 10-25
ZBB 50 kW-2 MW 217 30-50
PSB 30
Fuel Cells 0-50 MW Seconds-24 h+ 800-10000
SMES 100 kW-10 MW milliseconds-8 s 0.5-5
EDLC 0-300 kW milliseconds-60 min 2.5-15
Technology Specific power
(W/kg) Efficiency (%)
Life time
years cycles
PHS 75-80 40-60 >10000
Flywheels 400-1500 >90 20 100000
CAES 50 20-40 >5000
Secondary
batteries
Lead-acid 75-300 70-80 5-15 500-3000
NiCd 150-300 60-70 10-20 2000-2500
NiMH 66 500-1000
SBB 150-230 75-90 10-15 2500
L-ion 150-315 85-98 5-15 1000-10000+
Li-S 1000
Li-air
Zinc-air 75 30 10000
Flow
batteries
VRB 75-85 5-10
12000+
ZBB 65-75 2000+
PSB 77
Fuel Cells 500+ 40-50 5-15 1000+
SMES 500-2000 97 20+ 100000+
EDLC 500-5000 >90 20+ 100000+
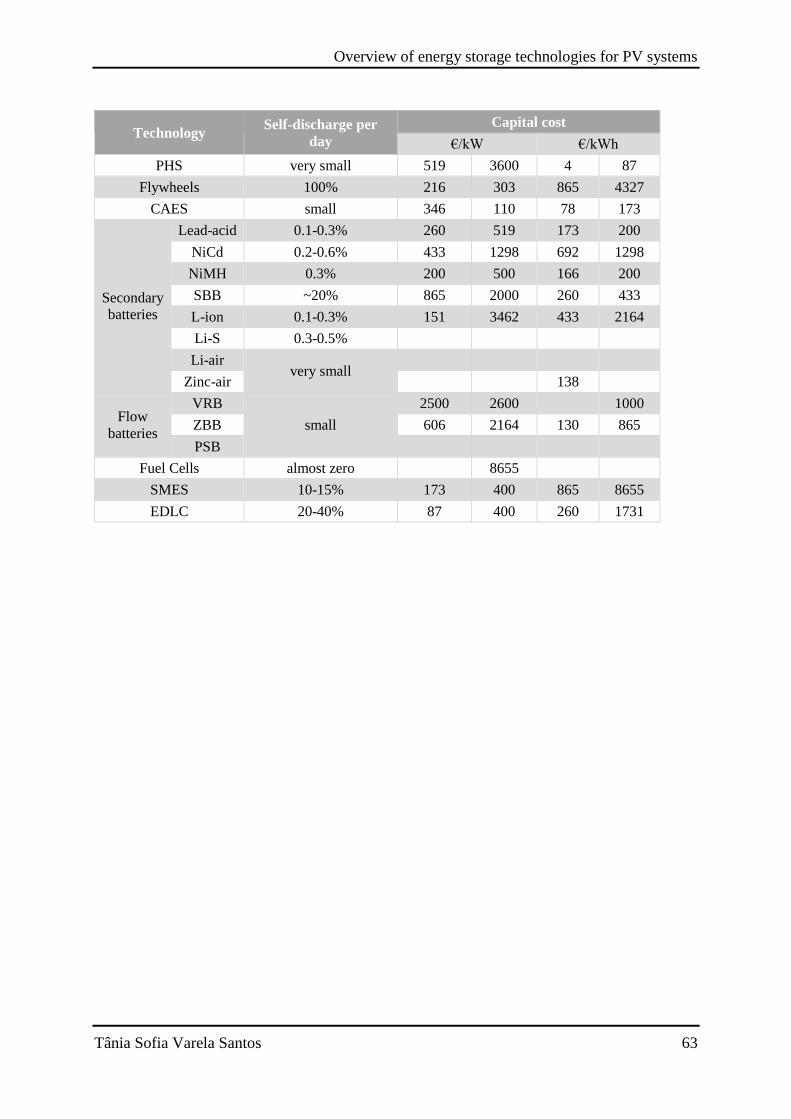
Overview of energy storage technologies for PV systems
Tânia Sofia Varela Santos 63
Technology Self-discharge per
day
Capital cost
€/kW €/kWh
PHS very small 519 3600 4 87
Flywheels 100% 216 303 865 4327
CAES small 346 110 78 173
Secondary
batteries
Lead-acid 0.1-0.3% 260 519 173 200
NiCd 0.2-0.6% 433 1298 692 1298
NiMH 0.3% 200 500 166 200
SBB ~20% 865 2000 260 433
L-ion 0.1-0.3% 151 3462 433 2164
Li-S 0.3-0.5%
Li-air very small
Zinc-air 138
Flow
batteries
VRB
small
2500 2600 1000
ZBB 606 2164 130 865
PSB
Fuel Cells almost zero 8655
SMES 10-15% 173 400 865 8655
EDLC 20-40% 87 400 260 1731

Overview of energy storage technologies for PV systems
Tânia Sofia Varela Santos 64
10. Annex B - Batteries characteristics
Table 15 - Batteries characteristics.
Type Model Supplier Reference Storage
capacity [Ah]
Voltage
[V]
Energy
[kWh]
FLA Exide classic
GNB Industrial
power
OPzS
solar 4600 4600 2
VRLA
ABSOLYTE
GP Stackable 1-100G99 6300 2
Sonnenschein
A600 Solar
A602/392
0 Solar 3919 2
Sonnenschein
Solar S12/230A 230 12
VRB CellCube Gildemeister energy
solutions FB 10 2083 48 100
ZBB Redflow
ZBM
RedFlow advanced
energy storage 170 48
Type Model Power
[kW]
Battery
price
Cost
[€/kWh]
Lifetime
[cycles] DOD
FLA Exide classic 1 240.00 € 134.78 3000 60%
VRLA
ABSOLYTE GP
Stackable 2 178.34 € 172.88 1200 80%
Sonnenschein A600
Solar 1 220.00 € 155.65 3000 60%
Sonnenschein Solar 375.00 € 135.87 800 60%
VRB CellCube 100 000.00 € 1000 100%
ZBB Redflow ZBM 3 100%
Type Model Efficiency
Operational
costs
[€/kWh.cycles]
Discharge
rate
[hours]
Operating
temperature
[ºC]
Height
[mm]
FLA Exide classic 0.07 120 -40 - 50 812
VRLA
ABSOLYTE
GP Stackable 0.18 100 218
Sonnenschein
A600 Solar 0.09 120 816
Sonnenschein
Solar 0.28 100 238
VRB CellCube 80% 2403
ZBB Redflow ZBM 80% 5 - 45

Overview of energy storage technologies for PV systems
Tânia Sofia Varela Santos 65
Type Model Installed length
[mm]
Width
[mm]
Area
[m2]
Volume
[m3]
Self-
Discharging
FLA Exide classic 225 580 0.131 0.106
VRLA
ABSOLYTE GP
Stackable 1080 26.38 0.028 0.006
0.5-1% per
week
Sonnenschein
A600 Solar 214 578 0.124 0.101 low
Sonnenschein
Solar 518 274 0.142 0.034
VRB CellCube 4500 2200 9.900 23.790 low
ZBB Redflow ZBM
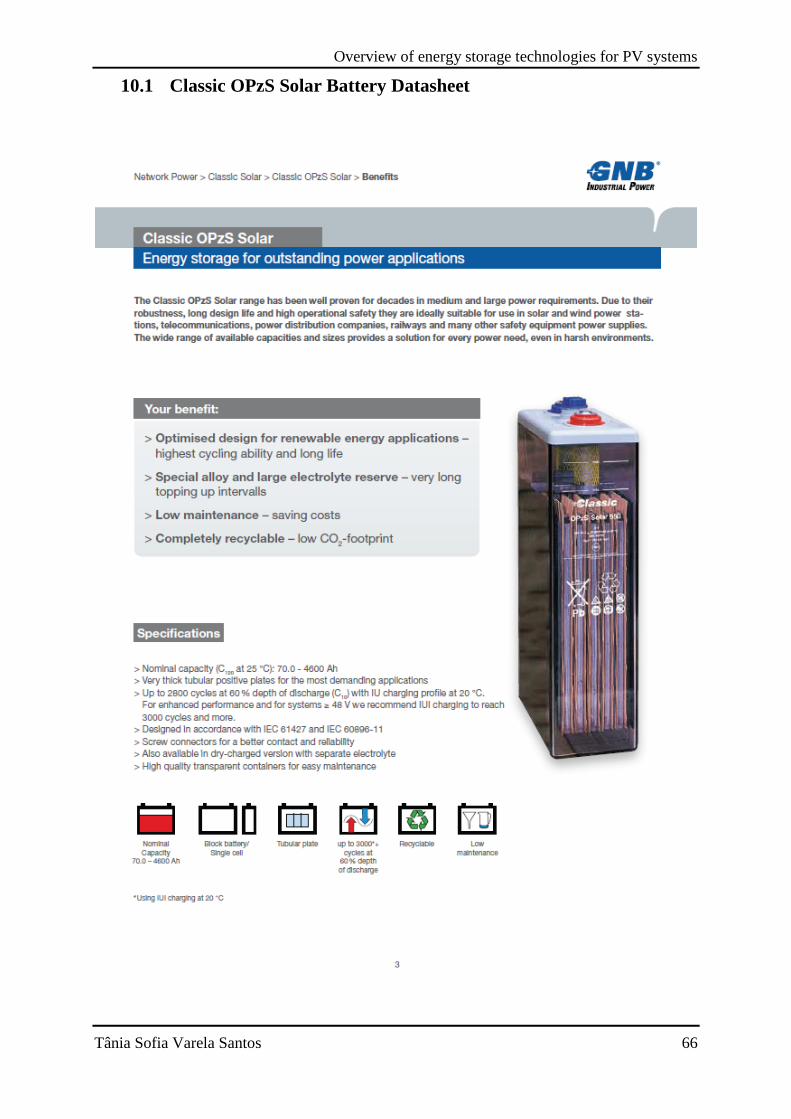
Overview of energy storage technologies for PV systems
Tânia Sofia Varela Santos 66
10.1 Classic OPzS Solar Battery Datasheet
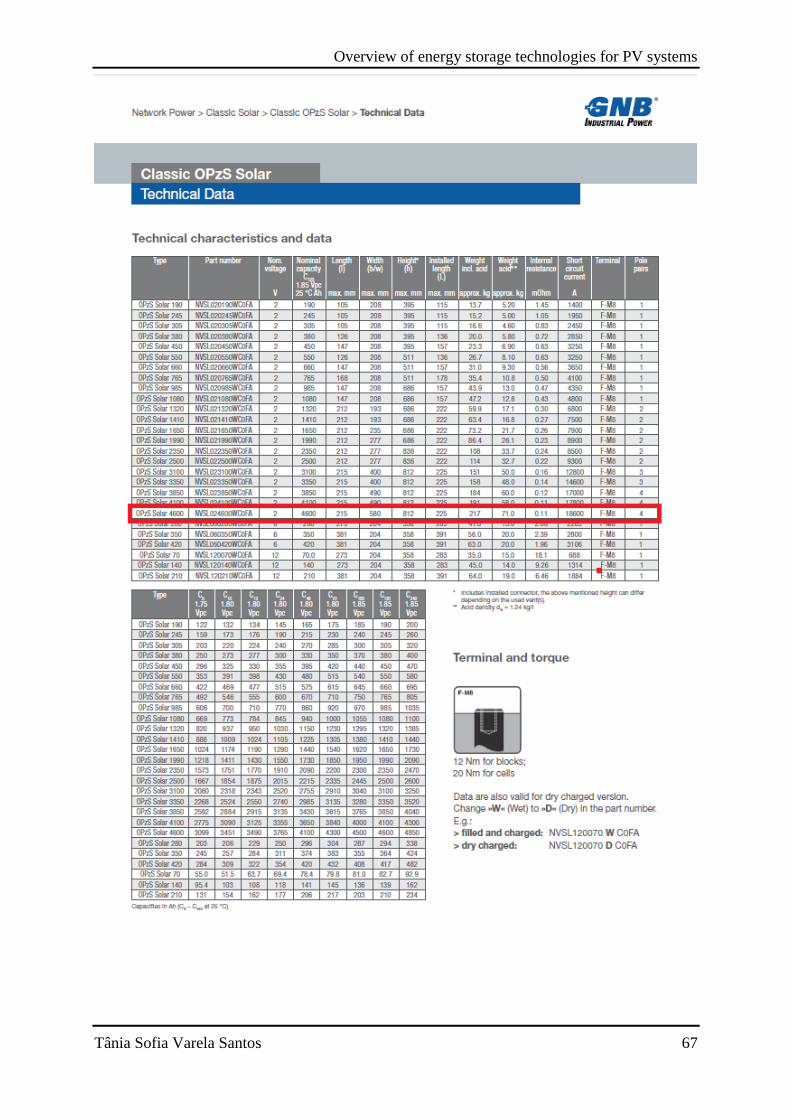
Overview of energy storage technologies for PV systems
Tânia Sofia Varela Santos 67

Overview of energy storage technologies for PV systems
Tânia Sofia Varela Santos 68

Overview of energy storage technologies for PV systems
Tânia Sofia Varela Santos 69
10.2 ABSOLYTE GP Battery Datasheet

Overview of energy storage technologies for PV systems
Tânia Sofia Varela Santos 70

Overview of energy storage technologies for PV systems
Tânia Sofia Varela Santos 71
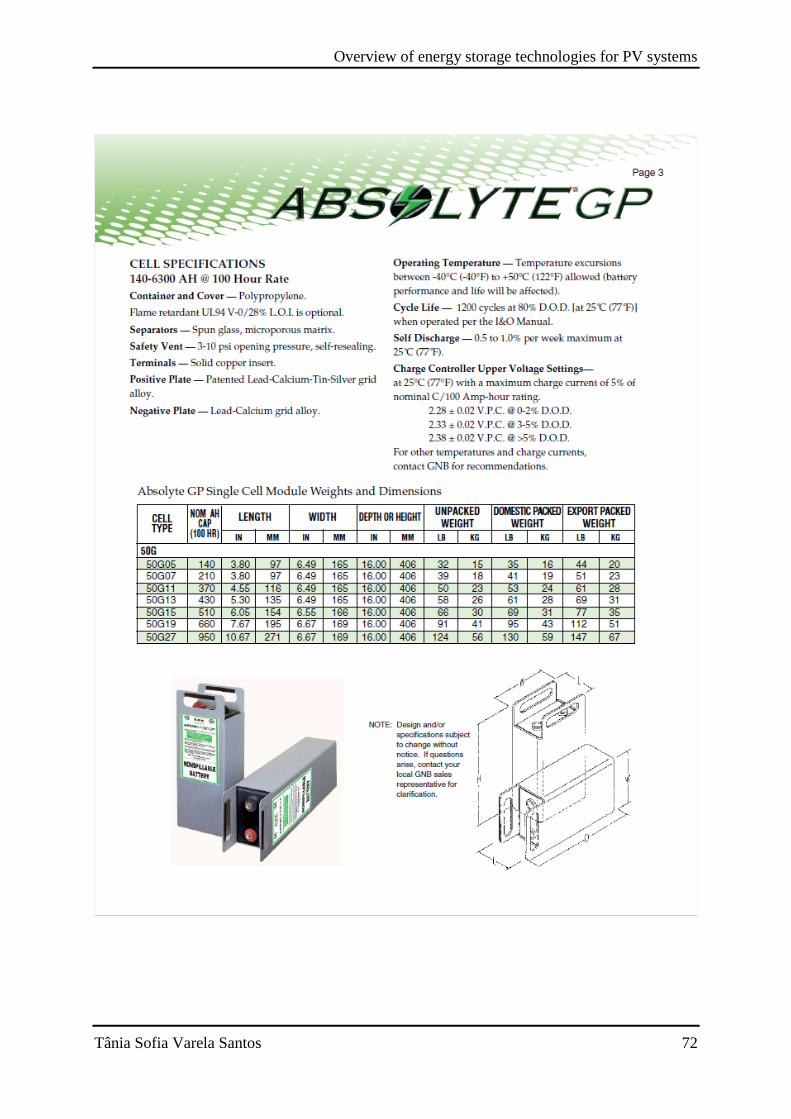
Overview of energy storage technologies for PV systems
Tânia Sofia Varela Santos 72

Overview of energy storage technologies for PV systems
Tânia Sofia Varela Santos 73
10.3 Sonnenschein SOLAR Battery Datasheet
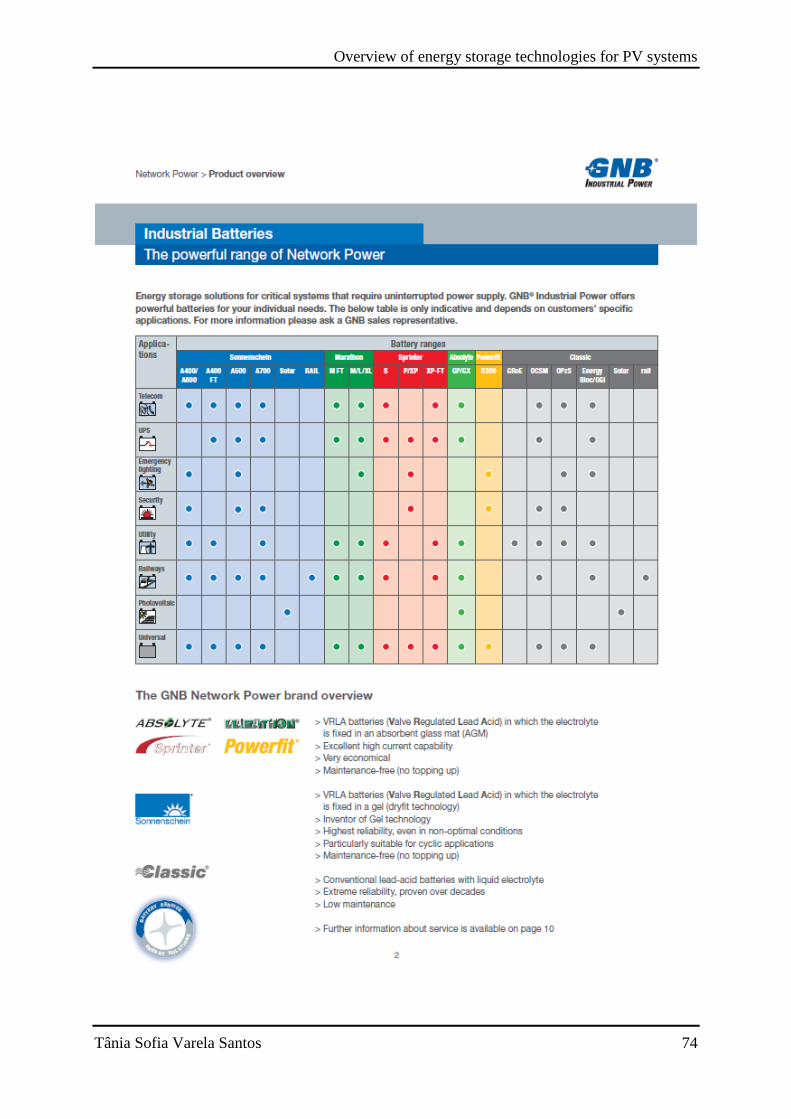
Overview of energy storage technologies for PV systems
Tânia Sofia Varela Santos 74

Overview of energy storage technologies for PV systems
Tânia Sofia Varela Santos 75

Overview of energy storage technologies for PV systems
Tânia Sofia Varela Santos 76

Overview of energy storage technologies for PV systems
Tânia Sofia Varela Santos 77
10.4 Sonnenschein A600 SOLAR Battery Datasheet

Overview of energy storage technologies for PV systems
Tânia Sofia Varela Santos 78

Overview of energy storage technologies for PV systems
Tânia Sofia Varela Santos 79

Overview of energy storage technologies for PV systems
Tânia Sofia Varela Santos 80
10.5 CellCube battery Datasheet
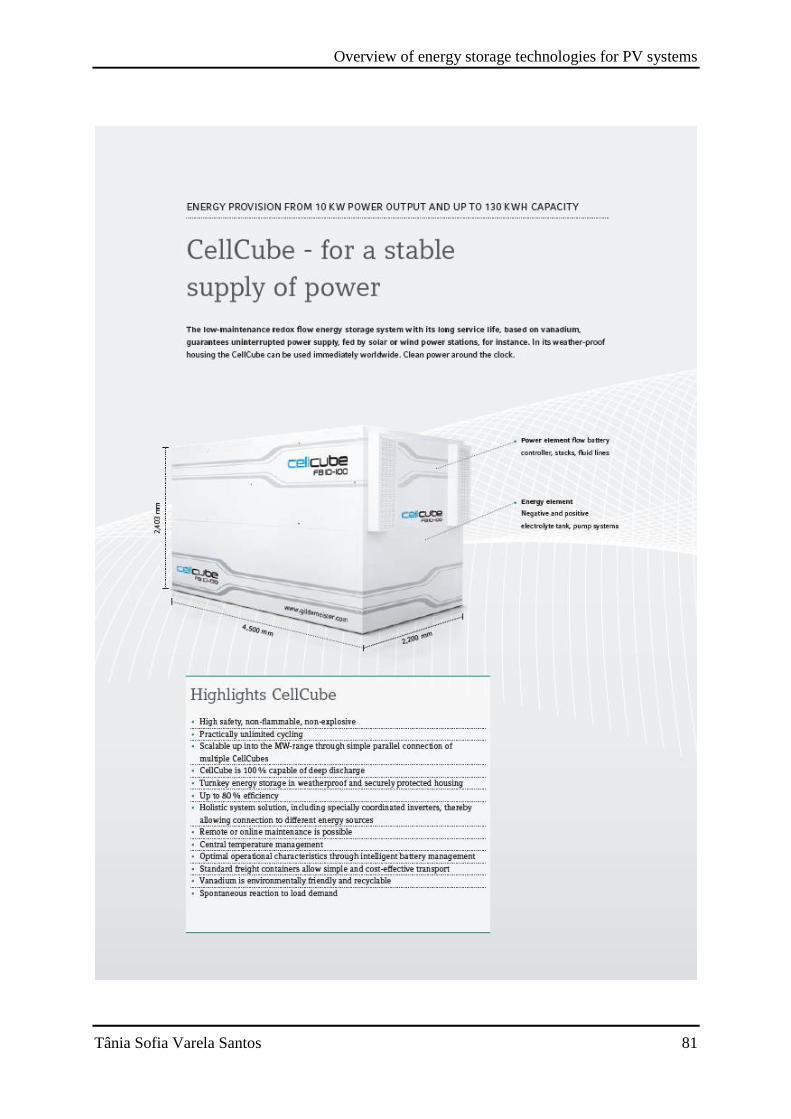
Overview of energy storage technologies for PV systems
Tânia Sofia Varela Santos 81

Overview of energy storage technologies for PV systems
Tânia Sofia Varela Santos 82

Overview of energy storage technologies for PV systems
Tânia Sofia Varela Santos 83

Overview of energy storage technologies for PV systems
Tânia Sofia Varela Santos 84

Overview of energy storage technologies for PV systems
Tânia Sofia Varela Santos 85

Overview of energy storage technologies for PV systems
Tânia Sofia Varela Santos 86
10.6 Redflow Batteries Datasheet

Overview of energy storage technologies for PV systems
Tânia Sofia Varela Santos 87

Overview of energy storage technologies for PV systems
Tânia Sofia Varela Santos 88
11. Annex C - Sizing
Table 16 - 10 kWp sizing.
Type Model Capacity [Ah] Voltage [V] DOD Efficiency
FLA OPzS solar 4600 4600 2 70%
VRLA
ABSOLYTE GP Stackable 6300 2 70%
Sonnenschein A600 Solar 3919 2 70%
Sonnenschein Solar 230 12 70%
VRB CellCube 2083 48 100% 80%
ZBB Redflow ZBM 170 48 100% 80%
Model CN [Ah] Ns Np Total
OPzS solar 4600 1410 24 1 24
ABSOLYTE GP Stackable 1410 24 1 24
Sonnenschein A600 Solar 1410 24 1 24
Sonnenschein Solar 1410 4 7 28
CellCube 1234 1 1 1
Redflow ZBM 1234 1 8 8
Model Unit price Total price Area [m2] Volume [m3]
OPzS solar 4600 1 240.00 € 29 760.00 € 0.131 0.106
ABSOLYTE GP Stackable 2 178.34 € 52 280.25 € 0.028 0.006
Sonnenschein A600 Solar 1 220.00 € 29 280.00 € 0.124 0.101
Sonnenschein Solar 375.00 € 10 500.00 € 0.142 0.034
CellCube 100 000.00 € 100 000.00 € 9.900 23.790
Model Total Area
[m2]
Total Volume
[m3]
Lifetime
[cycles]
Cost per
cycle
OPzS solar 4600 3.132 2.543 3000 9.92 €
ABSOLYTE GP
Stackable 0.684 0.149 1200 43.57 €
Sonnenschein A600
Solar 2.969 2.422 3000 9.76 €
Sonnenschein Solar 3.974 0.946 800 13.13 €
CellCube 9.900 23.790

Overview of energy storage technologies for PV systems
Tânia Sofia Varela Santos 89
Table 17- 200 kWp sizing.
Type Model Capacity [Ah] Voltage [V] DOD Efficiency
FLA OPzS solar 4600 4600 2 70%
VRLA
ABSOLYTE GP Stackable 6300 2 70%
Sonnenschein A600 Solar 3919 2 70%
Sonnenschein Solar 230 12 70%
VRB CellCube 2083 48 100% 80%
ZBB Redflow ZBM 170 48 100% 80%
Model CN [Ah] Ns Np Total
OPzS solar 4600 28477 24 7 168
ABSOLYTE GP Stackable 28477 24 5 120
Sonnenschein A600 Solar 28477 24 8 192
Sonnenschein Solar 28477 4 124 496
CellCube 24918 1 12 12
Redflow ZBM 24918 1 147 147
Model Unit price Total price Area [m2] Volume [m3]
OPzS solar 4600 1 240.00 € 208 320.00 € 0.131 0.106
ABSOLYTE GP Stackable 2 178.34 € 261 401.25 € 0.028 0.006
Sonnenschein A600 Solar 1 220.00 € 234 240.00 € 0.124 0.101
Sonnenschein Solar 375.00 € 186 000.00 € 0.142 0.034
CellCube 100 000.00 € 1 200 000.00 € 9.900 23.790
Model Total Area
[m2]
Total volume
[m3]
Lifetime
[cycles]
Cost per
cycle
OPzS solar 4600 21.92 17.80 3000 69.44 €
ABSOLYTE GP
Stackable 3.42 0.75 1200 217.83 €
Sonnenschein A600
Solar 23.75 19.38 3000 78.08 €
Sonnenschein Solar 70.40 16.75 800 232.50 €
CellCube 118.80 285.48 - €

Overview of energy storage technologies for PV systems
Tânia Sofia Varela Santos 90
Table 18 - 2 MWp sizing.
Type Model Capacity [Ah] Voltage [V] DOD Efficiency
FLA OPzS solar 4600 4600 2 70%
VRLA
ABSOLYTE GP Stackable 6300 2 70%
Sonnenschein A600 Solar 3919 2 70%
Sonnenschein Solar 230 12 70%
VRB CellCube 2083 48 100% 80%
ZBB Redflow ZBM 170 48 100% 80%
Model CN [Ah] Ns Np Total
OPzS solar 4600 17100 200 4 800
ABSOLYTE GP Stackable 17100 200 3 600
Sonnenschein A600 Solar 17100 200 5 1000
Sonnenschein Solar 17100 34 75 2550
CellCube 124685 9 60 540
Redflow ZBM 124685 9 734 6606
Model Unit price Batteries price Lifetime
[cycles]
Price per
cycle
OPzS solar 4600 1 240.00 € 992 000.00 € 3000 330.67 €
ABSOLYTE GP
Stackable 2 178.34 € 1 307 006.27 € 1200 1 089.17 €
Sonnenschein A600
Solar 1 220.00 € 1 220 000.00 € 3000 406.67 €
Sonnenschein Solar 375.00 € 956 250.00 € 800 1 195.31 €
CellCube 100 000.00 € 54 000 000.00 € - €
Model Area [m2] Volume [m3] total area [m2] Total volume [m3]
OPzS solar 4600 0.131 0.106 112.752 91.555
ABSOLYTE GP Stackable 0.028 0.006 24.616 5.366
Sonnenschein A600 Solar 0.124 0.101 160.305 130.809
Sonnenschein Solar 0.142 0.034 367.888 87.557
CellCube 9.900 23.790 5346.000 1427.382
Copyright © 2022 FDOKUMEN