Overcoming scaling challenges in biomolecular simulations across multiple platforms
15
Overcoming Scaling Challenges in Biomolecular Simulations across Multiple Platforms Abhinav Bhatele 1 , Sameer Kumar 3 , Chao Mei 1 , James C. Phillips 2 , Gengbin Zheng 1 , Laxmikant V. Kal´ e 1 1 Department of Computer Science, University of Illinois at Urbana-Champaign Urbana, IL 61801, USA {bhatele2, chaomei2, gzheng, kale}@uiuc.edu 2 Beckman Institute, University of Illinois at Urbana-Champaign Urbana, IL 61801, USA [email protected] 3 IBM T. J. Watson Research Center Yorktown Heights, NY 10598, USA [email protected] Abstract NAMD † is a portable parallel application for biomolecular simulations. NAMD pioneered the use of hybrid spatial and force decomposition, a technique used now by most scalable pro- grams for biomolecular simulations, including Blue Matter and Desmond developed by IBM and D. E. Shaw respectively. NAMD is developed using CHARM++ and benefits from its adaptive communication-computation overlap and dynamic load balancing. This paper focuses on new scalability challenges in biomolecular simulations: using much larger machines and simulating molecular systems with millions of atoms. We describe new techniques we have developed to overcome these challenges. Since our approach involves automatic adaptive run- time optimizations, one interesting issue involves harmful interaction between multiple adap- tive strategies, and how to deal with them. Unlike most other molecular dynamics programs, NAMD runs on a wide variety of platforms ranging from commodity clusters to supercomput- ers. It also scales to large machines: we present results for up to 65,536 processors on IBM’s Blue Gene/L and 8,192 processors on Cray XT3/XT4 in addition to results on NCSA’s Abe, SDSC’s DataStar and TACC’s LoneStar cluster, to demonstrate efficient portability. Since our IPDPS’06 paper two years ago, two new highly scalable programs named Desmond and Blue Matter have emerged, which we compare with NAMD in this paper. 1 Introduction Molecular Dynamics (MD) simulations of biomolecular systems constitute an important technique for understanding biological systems, exploring the relationship between structure and function of biomolecules and rational drug design. Yet such simulations are highly challenging to parallelize † NAMD stands for NAnoscale Molecular Dynamics
-
Upload
independent -
Category
Documents
-
view
4 -
download
0
Transcript of Overcoming scaling challenges in biomolecular simulations across multiple platforms

Overcoming Scaling Challenges in Biomolecular Simulationsacross Multiple Platforms
Abhinav Bhatele1, Sameer Kumar3, Chao Mei1, James C. Phillips2,Gengbin Zheng1, Laxmikant V. Kale1
1 Department of Computer Science, University of Illinois at Urbana-ChampaignUrbana, IL 61801, USA
{bhatele2, chaomei2, gzheng, kale}@uiuc.edu
2 Beckman Institute, University of Illinois at Urbana-ChampaignUrbana, IL 61801, USA
3 IBM T. J. Watson Research CenterYorktown Heights, NY 10598, USA
Abstract
NAMD† is a portable parallel application for biomolecular simulations. NAMD pioneeredthe use of hybrid spatial and force decomposition, a technique used now by most scalable pro-grams for biomolecular simulations, including Blue Matter and Desmond developed by IBMand D. E. Shaw respectively. NAMD is developed using CHARM++ and benefits from itsadaptive communication-computation overlap and dynamic load balancing. This paper focuseson new scalability challenges in biomolecular simulations: using much larger machines andsimulating molecular systems with millions of atoms. We describe new techniques we havedeveloped to overcome these challenges. Since our approach involves automatic adaptive run-time optimizations, one interesting issue involves harmful interaction between multiple adap-tive strategies, and how to deal with them. Unlike most other molecular dynamics programs,NAMD runs on a wide variety of platforms ranging from commodity clusters to supercomput-ers. It also scales to large machines: we present results for up to 65,536 processors on IBM’sBlue Gene/L and 8,192 processors on Cray XT3/XT4 in addition to results on NCSA’s Abe,SDSC’s DataStar and TACC’s LoneStar cluster, to demonstrate efficient portability. Since ourIPDPS’06 paper two years ago, two new highly scalable programs named Desmond and BlueMatter have emerged, which we compare with NAMD in this paper.
1 IntroductionMolecular Dynamics (MD) simulations of biomolecular systems constitute an important techniquefor understanding biological systems, exploring the relationship between structure and function ofbiomolecules and rational drug design. Yet such simulations are highly challenging to parallelize
†NAMD stands for NAnoscale Molecular Dynamics

Figure 1: The size of biomolecular system that can be studied through all-atom simulation has increasedexponentially in size, from BPTI (bovine pancreatic trypsin inhibitor), through the estrogen receptor andF1-ATPase to ribosome. Atom counts include solvent, not shown for better visualization.
because of the relatively small number of atoms involved and extremely large time-scales. Due tothe high frequencies of bond vibrations, a time-step is typically about 1 femtosecond (fs). Biolog-ically important phenomena require a time scale of at least hundreds of nanoseconds (ns), or evena few microseconds (us), which means a million to billion time-steps. In contrast to billion-atomsimulations needed in material science, biological systems require simulations involving only tensof thousands of atoms to a few million atoms, as illustrated in Fig. 1.
Biomolecular systems are fixed and limited in size (in terms of the number of atoms beingsimulated). Even so, the size of the desired simulations has been increasing in the past few years.Although molecular systems with tens of thousands of atoms still remain the mainstay, a fewsimulations using multi-million atom systems are being pursued. These constitute a new set ofchallenges for biomolecular simulations. The other challenge is the emergence of ever-largermachines. Several machines with over hundred thousand processors and petaFLOPS peak per-formance are planned for near future. NSF recently announced plans to deploy a machine withsustained petaFLOPS performance by 2011 and provided a biomolecular simulation benchmarkwith 100 million atoms as one of the applications that must run well on such a machine. Whencombined with lower per-core memory (in part due to high cost of memory) on machines such asBlue Gene/L, this poses the challenge of fitting within available memory.
This paper focuses on our efforts to meet these challenges and the techniques we have recentlydeveloped to this end. One of these involves dealing with an interesting interplay between twoadaptive techniques – load balancing and adaptive construction of spanning trees – that may beinstructive to researchers who use adaptive runtime strategies. Another involves reducing memoryfootprint without negative performance impact.
Another theme is that different machines, different number of processors, and different molec-ular systems may require a different choice or variation of algorithm. A parallel design that isflexible and allows the runtime system to choose between such alternatives, and a runtime systemcapable of making intelligent choices adaptively is required to attain high performance over such
2

a wide terrain of parameter space. Application scientists (biophysicists) would like to run theirsimulations on any of the available machines at the national centers, and would like to be ableto checkpoint simulations on one machine and then continue on another machine. Scientists atdifferent laboratories/organizations typically have access to different types of machines. An MDprogram, such as NAMD, that performs well across a range of architectures is therefore desirable.
These techniques and resultant performance data are new since our IPDPS’06 paper [8]. Anupcoming paper in IBM Journal Res. Dev. [9] will focus on optimizations specific to Blue Gene/L,whereas an upcoming book chapter [11] summarizes performance data with a focus on science.The techniques in this paper are not described and analyzed in these publications.
Finally, two new programs have emerged since our last publication: Blue Matter [5] fromIBM that runs on the Blue Gene/L machine, and Desmond [1] from D. E. Shaw that runs on theirOpteron-Infiniband cluster. We include performance comparisons with these, for the first time. (InSC’06, both programs compared their performance with NAMD. This paper includes an updatedresponse from the NAMD developers). Both these programs are highly scalable and use the ideadeveloped in NAMD (in our 1998 paper [6]) of computing forces between atoms belonging to twoprocessors (potentially) on a third processor. We show that NAMD’s performance is comparablewith these programs even with the specialized processors each runs on. Moreover NAMD runs ona much wider range of machines and molecular systems not demonstrated by these programs.
We showcase our performance on different machines including Cray XT3/XT4 (up to 8,192processors), Blue Gene/L (up to 65,536 processors), TACC Lonestar system (up to 1,024 proces-sors) and SDSC DataStar cluster (up to 1,024 processors) on molecular systems ranging in sizefrom 5,570 atoms to 2.8 million atoms. We also present a performance study that identifies newbottlenecks that must be overcome to enhance the performance with a large number of processors.
We first describe the basic parallelization methodology adopted by NAMD. We then describea series of optimizations, alternative algorithms, and performance trade-offs that were developedto enhance the scalability of NAMD. For many of these techniques, we provide analysis that maybe of use to MD developers as well as other parallel application developers. Finally, we showcasethe performance of NAMD for different architectures and compare it with other MD programs.
2 Background: Parallel Structure of NAMDClassical molecular dynamics requires computation of two distinct categories of forces: (1) Forcesdue to bonds (2) Non-bonded forces. The non-bonded forces include electrostatic and Van derWaal’s forces. A naıve evaluation of these forces takes O(N2) time. However, by using a cut-off radius rc and separating the calculation of short-range and long-range forces, one can reducethe asymptotic operation count to O(N log N ). Forces between atoms within rc are calculatedexplicitly (this is an O(N ) component, although with a large proportionality constant). For long-range calculation, the Particle Mesh Ewald (PME) algorithm is used, which transfers the electriccharge of each atom to electric potential on a grid and uses a 3D FFT to calculate the influenceof all atoms on each atom. Although the overall asymptotic complexity is O(N log N ), the FFTcomponent is often smaller, and the computation time is dominated by the O(N ) computation.
Prior to [6], parallel biomolecular simulation programs used either atom decomposition, spatialdecomposition, or force decomposition for parallelization (for a good survey, see Plimpton et.al [10]). NAMD was one of the first programs to use a hybrid of spatial and force decompositionthat combines the advantages of both. More recently, methods used in Blue Matter [4, 5], the
3

(a)
2.15
2.2
2.25
2.3
2.35
2.4
2.45
2.5
2.55
2.6
2.65
2.7
210 215 220 225 230 235 240 245 250 255
Nanoseconds p
er
day
No. of processors
ApoA1 on Blue Gene/L
ApoA1
(b)
Figure 2: (a) Placement of cells and computes on a 2D mesh of processors, (b) Performance ofNAMD on consecutive processor numbers (ApoA1 running on Blue Gene/L, with PME)
neutral territory and midpoint territory methods of Desmond [1], and those proposed by Snir [12]use variations of such a hybrid strategy.
NAMD decomposes atoms into boxes called “cells” (see Fig. 2(a)). The size of each cell dmin
along every dimension, is related to rc. In the simplest case (called “1-Away” decomposition),dmin= rc + margin, where the margin is a small constant. This ensures that atoms that are withincutoff radius of each other, stay within the neighboring boxes over a few (e.g. 20) time steps. Themolecular system being simulated is in a simulation box of dimensions Bx × By × Bz typicallywith periodic boundary conditions. The size di of a cell along each dimension i is such that forsome integer m, Bi/m is just greater than dmin. For example, if rc = 12 A and margin = 4 A,dmin = 16 A, the cells should be of size 16 × 16 × 16 A. However, this is not the right choice ifthe simulation box is 108.86 × 108.86 × 77.76 A, as is the case in ApoLipoprotein-A1 (ApoA1)simulation (see Table 6). Since the simulation box along X dimension is 108.86 A, one must pickdi = 108.86/6 = 18.15 A as the size along X axis for the cell. (And the size of a cell will be18.15 × 18.15 × 19.44 A). This is the spatial decomposition component of the hybrid strategy.
For every pair of interacting cells, (in our 1-Away decomposition, that corresponds to everypair of touching cells), we create an object (called a “compute object” or just “compute”) whoseresponsibility is to compute the pairwise forces between the two cells. This is the force decom-position component. Since each cell has 26 neighboring cells, one gets 14 × C compute objects(26/2 + 1 = 14), where C is the number of cells. The fact that these compute objects are assignedto processors by a dynamic load balancer (Sec. 2.2) gives NAMD the ability to run on a range ofdiffering number of processors without changing the decomposition.
When the ratio of atoms to processors is smaller, we decompose the cells further. In general,along each axis X , Y or Z the size of a cell can be dmin/k where k is typically 1 or 2 (and rarely3). Since the cells that are “2-Away” from each other must interact if k is 2 along a dimension,this decomposition is called 2-Away-X, 2-Away-XY or 2-Away-XYZ etc. depending on whichdimension uses k = 2. The choice of which decomposition to use for a particular run is decided bythe program depending on the atoms-to-processor ratio and other machine-dependent heuristics.NAMD also gives the user flexibility to choose the decomposition for certain scenarios where the
4

Figure 3: Time profile for ApoA1 on 1k processors of Blue Gene/L (with PME) in Projections
automatic choices do not give the best results.Neither the number of cells nor the number of compute objects need to be equal to the exact
number of processors. Typically, the number of cells is smaller than the number of processors,by an order of magnitude, which still generates adequate parallelism (because of the separationof “compute” objects) to allow the load balancer to optimize communication, and distribute workevenly. As a result, NAMD is able to exploit any number of available processors. Fig. 2(b)shows the performance of the simulation of ApoA1 on varying numbers of Blue Gene/L (BG/L)processors in the range 207-255. In contrast, schemes that decompose particles into P boxes,where P is the total number of processors may limit the number of processors they can use for aparticular simulation: they may require P to be a power of two or be a product of three numberswith a reasonable aspect ratio.
We now describe a few features of NAMD and analyze how they are helpful in scaling perfor-mance to a large number of processors.
2.1 Adaptive Overlap of Communication and ComputationNAMD uses a message-driven runtime system to ensure that multiple modules can be composedconcurrently without losing efficiency. In particular, idle times in one module can be exploitedby useful computations in another. Furthermore, NAMD uses asynchronous reductions, when-ever possible (such as in the calculation of energies). As a result, the program is able to continuewithout sharp reductions in utilization around barriers. For example, Fig. 3 shows a time profileof a simulation of ApoA1 on 1024 processors of BG/L (This figure was obtained by using theperformance analysis tool Projections [7] available in the CHARM++ framework). A time profileshows vertical bars for each (consecutive) time interval of 100 us, activities executed by the pro-gram added across all the processors. The red (dark) colored “peaks” at the bottom correspond tothe force integration step, while the dominant blue (light) colored regions represent non-bondedcomputations. The pink and purple (dark at the top) shade appearing in a thin layer every 4 stepsrepresent the PME computation. One can notice that: (a) time steps “bleed” into each other, over-lapping in time. This is due to lack of a barrier, and especially useful when running on platformswhere the OS noise may introduce significant jitter. While some processor may be slowed down oneach step, the overall impact on execution is relatively small. (b) PME computations which have
5

Processors 512 1024 1024 2048 4096 8192 8192 16384Decomposition X X XY XY XY XY XYZ XYZNo. of Messages 4797 7577 13370 22458 29591 35580 79285 104469Avg Msgs. per processor 10 8 13 11 8 5 10 7Max Msgs. per processor 20 31 28 45 54 68 59 88Message Size (bytes) 9850 9850 4761 4761 4761 4761 2303 2303Comm. Volume (MB) 47.3 74.6 63.7 107 141 169 182 241Atoms per cell 296 296 136 136 136 136 60 60Time step (ms) 17.77 11.6 9.73 5.84 3.85 3.2 2.73 2.14
Table 1: Communication Statistics for ApoA1 running on IBM’s Blue Gene/L, without PME
multiple phases of large latencies, are completely overlapped with non-bonded computations.
2.2 Dynamic Load BalancingNAMD uses measurement-based load balancing. Initially the cells and computes are assignedto processors using a simple algorithm. After a user-specified number of time-steps, the runtimesystem turns on auto-instrumentation to measure the amount of work in each compute object. Itthen uses a greedy algorithm to assign computes to processors.
The load balancer assigns computes to processors so as to minimize the number of messagesexchanged, in addition to minimizing load imbalance. As a result, NAMD is typically able to useless than 20 messages per processor (10 during multicast of coordinates to computes and 10 toreturn forces). Table 1 shows the number of messages (in the non-PME portion of the computa-tion) as a function of number of processors for the ApoA1 simulation on BG/L. The number ofcells and the decomposition used is also shown. The load balancer and the use of spanning treesfor multicast (Sec. 3.1) ensures that the variation in actual number of messages sent/received bydifferent processors is small, and they are all close to the average number. The size of each mes-sage is typically larger than that used by Desmond and Blue Matter. Since many modern parallelmachines use RDMA capabilities, which emphasize per message cost, and hide the per byte cost(by off-loading communication to co-processors), we believe this to be a better tradeoff.
NAMD can be optimized to specific topologies on architectures where the topology informa-tion is available to the application. For example the BG/L machine has a torus interconnect forapplication message passing. The dimensions of the torus and the mapping of ranks to the torusis available through a personality data structure. At application startup, the CHARM++ runtimereads the personality data structure. As the periodic molecular systems are 3D Tori, we exploredmapping the cells on the BG/L torus to improve the locality of cell to cell communication. Weused an ORB scheme to map cells to the processors [9]. First the cell grid is split into two equallyloaded partitions. The load of each cell is proportional to the number of atoms in that cell and thecommunication load of the cell. The processor partition is then split into two with the sizes of twosub-partitions corresponding to the sizes of the two cell sub-partitions. This is repeated recursivelytill every cell is allocated to a processor.
The above scheme enables locality optimizations for cell-to-cell communication. The CHARM++dynamic load-balancer places compute objects that calculate the interactions between cells near theprocessors which have the cell data. The load-balancer tries to allocate the compute on the leastloaded processor that is within a few hops of the midpoint of the two cells. We have observed that
6
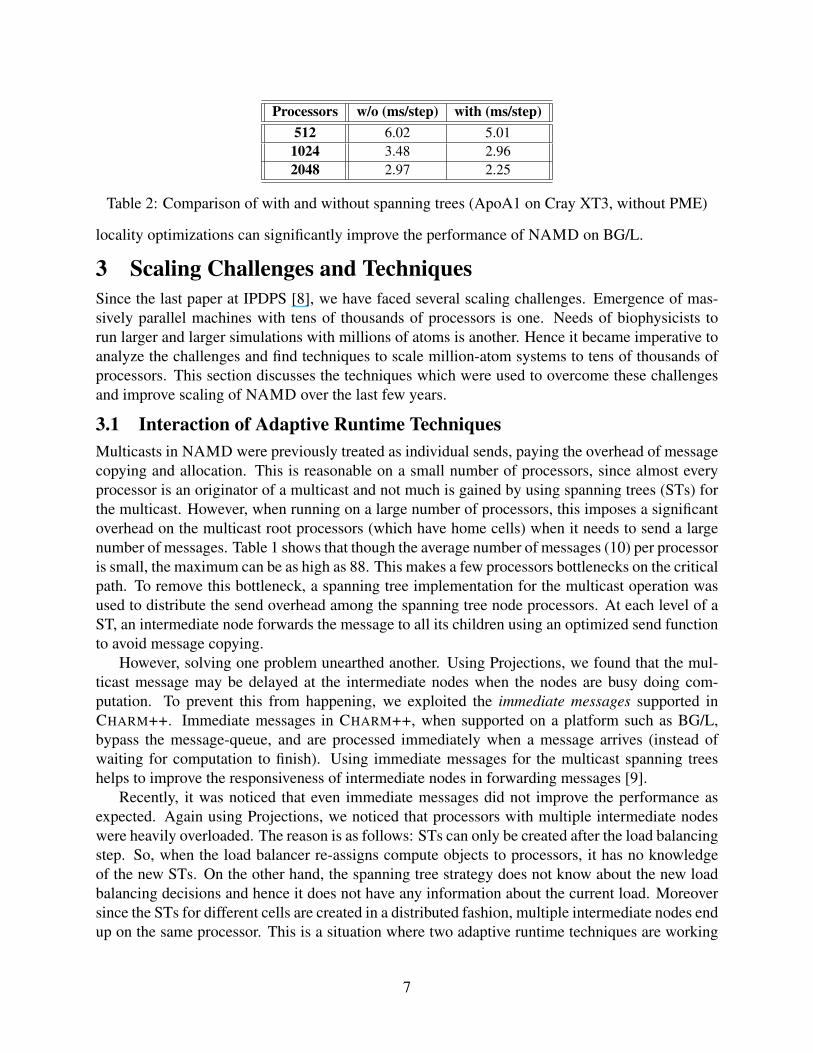
Processors w/o (ms/step) with (ms/step)512 6.02 5.011024 3.48 2.962048 2.97 2.25
Table 2: Comparison of with and without spanning trees (ApoA1 on Cray XT3, without PME)
locality optimizations can significantly improve the performance of NAMD on BG/L.
3 Scaling Challenges and TechniquesSince the last paper at IPDPS [8], we have faced several scaling challenges. Emergence of mas-sively parallel machines with tens of thousands of processors is one. Needs of biophysicists torun larger and larger simulations with millions of atoms is another. Hence it became imperative toanalyze the challenges and find techniques to scale million-atom systems to tens of thousands ofprocessors. This section discusses the techniques which were used to overcome these challengesand improve scaling of NAMD over the last few years.
3.1 Interaction of Adaptive Runtime TechniquesMulticasts in NAMD were previously treated as individual sends, paying the overhead of messagecopying and allocation. This is reasonable on a small number of processors, since almost everyprocessor is an originator of a multicast and not much is gained by using spanning trees (STs) forthe multicast. However, when running on a large number of processors, this imposes a significantoverhead on the multicast root processors (which have home cells) when it needs to send a largenumber of messages. Table 1 shows that though the average number of messages (10) per processoris small, the maximum can be as high as 88. This makes a few processors bottlenecks on the criticalpath. To remove this bottleneck, a spanning tree implementation for the multicast operation wasused to distribute the send overhead among the spanning tree node processors. At each level of aST, an intermediate node forwards the message to all its children using an optimized send functionto avoid message copying.
However, solving one problem unearthed another. Using Projections, we found that the mul-ticast message may be delayed at the intermediate nodes when the nodes are busy doing com-putation. To prevent this from happening, we exploited the immediate messages supported inCHARM++. Immediate messages in CHARM++, when supported on a platform such as BG/L,bypass the message-queue, and are processed immediately when a message arrives (instead ofwaiting for computation to finish). Using immediate messages for the multicast spanning treeshelps to improve the responsiveness of intermediate nodes in forwarding messages [9].
Recently, it was noticed that even immediate messages did not improve the performance asexpected. Again using Projections, we noticed that processors with multiple intermediate nodeswere heavily overloaded. The reason is as follows: STs can only be created after the load balancingstep. So, when the load balancer re-assigns compute objects to processors, it has no knowledgeof the new STs. On the other hand, the spanning tree strategy does not know about the new loadbalancing decisions and hence it does not have any information about the current load. Moreoversince the STs for different cells are created in a distributed fashion, multiple intermediate nodes endup on the same processor. This is a situation where two adaptive runtime techniques are working
7

Molecular System No. of atoms No. of signatures Memory Footprint (MB)Bonded Info Non-bonded Info Original Current
IAPP 5570 102 117 0.290 0.022DHFR (JAC) 23558 389 674 1.356 0.107Lysozyme 39864 398 624 2.787 0.104ApoaA1 92224 423 729 7.035 0.125F1-ATPase 327506 737 1436 20.460 0.215STMV 1066628 461 713 66.739 0.120Bar Domain 1256653 481 838 97.731 0.128Ribosome 2820530 1026 2024 159.137 0.304
Table 3: Number of Signatures and Comparison of Memory Usage for Static Information
in tandem and need to interact to take effective decisions. Our solution is to preserve the waySTs are built across load balancing steps as much as possible. Such persistent STs helps the loadbalancer evaluate the communication overhead. For the STs, the solution is to create the STs in acentralized fashion to avoid placing too many nodes on a single processor. With these optimizationsof the multicast operations in NAMD, parallel performance was significantly improved as shownin Table 2.
A further step is to unite these two techniques into a single phase. We should do a load bal-ancing step and using its decisions, we should create the STs. Then we should update the loadsof processors which have been assigned intermediate nodes. With these updated loads we can doa final load balancing step and modify the created STs to take the new decisions into account. Inthe future, we expect that support from lower-level communication layers (such as that used inBlue Matter) and/or hardware support for multiple concurrent multicasts will reduce the load (andtherefore the importance) of STs.
3.2 Compression of Molecular Structure DataThe design of NAMD makes every effort to insulate the biophysicist from the details of the paralleldecomposition. Hence, the molecular structure is read from a single file on the head processorand the data is replicated across the machine. This structure assumes that each processor of aparallel machine has sufficient memory to perform the simulation serially. But machines such asBG/L assume that the problem is completely distributed in memory and hence 512 MB or less perprocessor is provided. Simulations now stretch into millions of atoms, and future simulations havebeen proposed with 100 million atoms. The molecular structure of large systems whose memoryfootprint grows at least linearly with the number of atoms limited the NAMD simulations thatcould be run on BG/L to several hundred-thousand atoms. To overcome this limitation, it becamenecessary to reduce the memory footprint for NAMD simulations.
The molecular structure in NAMD describes the whole system including all atoms’ physicalattributes, bonded structures etc. In order to reduce the memory footprint for this static informationwe have developed a compression method that reduces memory usage by orders of magnitude andslightly improves performance due to reduced cache misses. The method leverages the similarstructure of common building blocks (amino acids, nucleic acids, lipids, water etc.) from whichlarge biomolecular simulations are assembled.
A given atom is always associated with a set of tuples. This set is defined as its signature from
8

Item Before Opt. After Opt. Reduction Rate (%)Execution time (ms/step) 16.53 16.20 2.04
L1 Data Cache Misses (millions) 189.07 112.51 68.05L2 Cache Misses (millions) 1.69 1.43 18.18
TLB Misses (millions) 0.30 0.24 25.00
Table 4: Reduction in cache misses and TLB misses due to structure compression for ApoA1running (with PME) on 128 processors of CrayXT3 at PSC
which its static information is obtained. Each tuple contains the information of a bonded structurethis atom participates in. Originally, such information is encoded by using absolute atom indiceswhile the compression technique changes it to relative atom indices. Therefore, atoms playingidentical roles in the molecular structure have identical signatures and each unique signature needsto be stored only once. For example, the oxygen atom in one water molecule plays identical roleswith any other oxygen atom in other water molecules. In other words, all those oxygen atoms havethe same signature. Therefore, the memory footprint for those atoms’ static information now isreduced to the memory footprint of a signature.
Extracting signatures of a molecule system is performed on a separate large-memory work-station since it requires loading the entire structure. The signature information is stored in a newmolecular structure file. This new file is read by NAMD instead of the original molecular structurefile. Table 3 shows the number of signatures for bonded and non-bonded static information respec-tively across a bunch of atom systems, and the resulting memory reduction ratio. The number ofsignatures increases only with the number of unique proteins in a simulation. Hence, ApoA1 andSTMV have similar numbers of signatures despite an order of magnitude difference in atom count.Thus, the technique is scalable to simulations of even 100-million atoms.
Using structure compression we can now run million-atom systems on BG/L with 512MB ofmemory per node, including the 1.25 million-atom STMV and the 2.8 million-atom Ribosome, thelargest production simulations yet attempted. In addition, we have also observed slightly betterperformance for all systems due to this compression. For example, the memory optimized NAMDversion is faster by 2.1% percent than the original version for ApoA1 running on 128 processorsof Cray XT3. Using the CrayPat‡ performance analysis tool, we found this better performanceresulted from a overall reduction in cache misses and TLB misses per simulation time-step, asshown in Table 4. Such an effect is expected since the memory footprint for static information issignificantly reduced which now fits into the L2 cache and requires fewer memory pages.
3.3 2D Decomposition of Particle Mesh EwaldNAMD uses the Particle Mesh Ewald method [2] to compute long range Coulomb interactions.PME is based on real-to-complex 3D Fast Fourier Transforms, which require all-to-all communi-cation but do not otherwise dominate the computation. NAMD has used a 1D decomposition forthe FFT operations, which requires only a single transpose of the FFT grid and it is therefore thepreferred algorithm with slower networks or small processor counts. Parallelism for the FFT inthe 1D decomposition is limited to the number of planes in the grid, 108 processors for ApoA1.Since the message-driven execution model of CHARM++ allows the small amount of FFT work to
‡http://www.psc.edu/machines/cray/xt3/#craypat
9

Processors 1D (ms/step) 2D (ms/step)2048 7.04 5.844096 5.05 3.858192 5.01 2.73
Table 5: Comparison of 1D and 2D decompositions for FFT (ApoA1 on Blue Gene/L, with PME)
Molecular System No. of atoms Cutoff (A) Simulation Box Time step (fs)IAPP 5570 12 46.70 × 40.28 × 29.18 2DHFR (JAC) 23558 9 62.23 × 62.23 × 62.23 1Lysozyme 39864 12 73.92 × 73.92 × 73.92 1.5ApoA1 92224 12 108.86 × 108.86 × 77.76 1F1-ATPase 327506 12 178.30 × 131.54 × 132.36 1STMV 1066628 12 216.83 × 216.83 × 216.83 1Bar Domain 1256653 12 195.40 × 453.70 × 144.00 1Ribosome 2820530 12 264.02 × 332.36 × 309.04 1
Table 6: Benchmarks and their simulation parameters used for running NAMD in this paper
be interleaved with the rest of the force calculation, NAMD can scale to thousands of processorseven with the 1D decomposition. Still, we observed that this 1D decomposition limited scalabilityfor large simulations on BG/L and other architectures.
PME is calculated using 3D FFTs [3] in Blue Matter. We implemented a 2D decompositionfor PME NAMD, where the FFT calculation is decomposed into thick pencils with 3 phases ofcomputation and 2 phases of transpose communication. The FFT operation is computed by 3 arraysof objects in CHARM++ with a different array for each of the dimensions. PME has 2 additionalcomputation and communication phases that send grid data between the patches and the PMECHARM++ objects. One of the advantages on the 2D decomposition is that the number of messagessent or received by any given processor is greatly reduced compared to the 1D decomposition forlarge simulations running on large numbers of processors. Table 5 shows the advantages of using2D decomposition over 1D decomposition.
Similar to 2-Away decomposition choices, NAMD can automatically choose between 1D and2D decomposition depending on the benchmark, number of processors and other heuristics. Thischoice can also be overridden by the user. Hence, NAMD’s design provides a runtime systemwhich is capable of taking intelligent adaptive runtime decisions to choose the best algorithm/parameters for a particular benchmark-machine- number of processors combination.
4 Performance ResultsA highly scalable and portable application, NAMD has been tested on a variety of platforms forseveral benchmarks. The platforms vary from small-memory and moderate frequency processorslike Blue Gene/L to faster processors like Cray XT3. The results in this paper range from bench-marks as small as IAPP with 5570 atoms to Ribosome which has 2.8 million atoms. With the recenttechniques for parallelization and memory optimization, NAMD has shown excellent performancein different regimes. Table 6 lists the various molecular systems and their simulation details whichwere used for the performance numbers in this paper. A description of the various architectures on
10

System No. of Procs. Clock Memory Type ofName Location Nodes per Node CPU Type Speed per Node NetworkBlue Gene/L IBM 20,480 2 PPC440 700 MHz 512 MB Torus
LLNL 65,536 2 PPC440 700 MHz 512 MB TorusCray XT3/XT4 PSC 2,068 2 Opteron 2.6 GHz 2 GB Torus
ORNL 17,064 2/4 Opteron 2.6 GHz 2 GB TorusDataStar SDSC 272 8 P655+ 1.5 GHz 32 GB Federation
6 32 P690+ 1.7 GHz 128 GBLoneStar TACC 1,300 2 Xeon 2.66 GHz 8 GB InfinibandAbe NCSA 1,200 8 Intel64 2.33 GHz 8 GB Infiniband
Table 7: Specifications of the parallel systems used for the runs
0.0625
0.25
1
4
16
64
256
1024
64K16K4K1K256641641
Tim
este
ps p
er
second
No. of processors
NAMD on Blue Gene/L
IAPP (5K)DHFR (23K)
Lysozyme (39K)ApoA1 (92K)
Atpase (327K)STMV (1M)
Barbig (1.2M)Ribosome (2.8M)
0.0625
0.25
1
4
16
64
256
1024
4K1K256641641
Tim
este
ps p
er
second
No. of processors
NAMD on Bigben (XT3)
IAPP (5K)DHFR (23K)
Lysozyme (39K)ApoA1 (92K)
Atpase (327K)STMV (1M)
Barbig (1.2M)Ribosome (2.8M)
Figure 4: Performance of NAMD on IBM BG/L and Cray XT3
which the results were obtained for this paper is shown in Table 7.Fig. 4 shows the performance of the eight representative benchmarks from Table 6 on BG/L and
XT3. On BG/L, we present performance numbers for the ATPase up to 32K and STMV up to 64Kprocessors. We just had enough time to run these two benchmarks on the larger 64K LLNL BG/L.Using different adaptive runtime strategies and algorithms discussed in the previous sections, weshow good scaling for all benchmarks on this machine. On XT3, we present numbers for ApoA1and ATPase on 8,192 processors on the Jaguar machine at ORNL. With the faster processors weachieve a lowest time-step of 1.19 ms/step for DHFR which corresponds to 72 ns of simulationper day. It is an achievement that for IAPP running on XT3, we can simulate 140 ns/day witha 2 fs time-step. Table 8 shows the floating point operations per second (FLOPS) for some ofthe benchmarks calculated for BG/L and Cray XT3. They were calculated by using the Perfsuiteperformance suite on a Xeon cluster (Tungsten) at NCSA. For STMV, we do nearly 8.5 TeraFLOPSon 64K processors of BG/L. We did not have a chance to improve this number because we onlyhave a limited access to the LLNL BG/L.
Fig. 5(a) shows the performance of the ApoA1 benchmark on a variety of machines including:SDSC’s DataStar and TACC’s LoneStar and NCSA’s Abe. We ran our application on these ma-chines only recently and the numbers are without any specific optimizations for these machines.This exemplifies that even without any tuning for specific architectures, NAMD performs quite
11

ApoA1 F1-ATPase STMV Bar D. Ribosome#Procs on BG/L 16,384 32,768 65,536 16,384 16,384IBM BG/L (TFLOPS) 1.54 3.03 8.44 3.22 2.07#Procs on Cray XT3 8,192 8,192 4,096 4,096 4,096Cray XT3 (TFLOPS) 2.05 4.41 4.87 4.77 2.78
Table 8: Floating Point Performance of a few benchmarks on BG/L and Cray in TeraFLOPS
1
4
16
64
256
1024
4096
16384
10245122561286432168421
Tim
e (
ms/s
tep)
No. of processors
NAMD on various platforms
Blue Gene/LBigRed (IU)
DataStar (SDSC)BigBen (PSC)
LoneStar (TACC)Abe (NCSA)
(a)
2
4
8
16
32
64
128
256
512
1024
16K8K4K2K1K5122561286432168
Tim
e (
ms/s
tep)
No. of processors
NAMD vs. Desmond and Blue Matter
NAMD on XT3NAMD on TACCNAMD on BG/L
DesmondBlue Matter
(b)
Figure 5: (a) Performance of NAMD on multiple parallel machines (Benchmark: ApoA1), (b)Performance comparison of NAMD with Desmond and Blue Matter for ApoA1
well on newer platforms. We do not show performance beyond 1K processors because withoutfurther performance tuning for the respective machines, NAMD does not scale well (beyond 1K).There is still scope to optimize NAMD on these machines which will improve the performanceeven more.
5 Comparison with other MD codesIn this section, we compare NAMD’s performance with two other MD codes, Blue Matter [4, 5]and Desmond [1]. Fig. 5(b) shows the time step for ApoA1 using NAMD on some representativemachines, Blue Matter on BG/L and Desmond on their cluster. It is noteworthy that NAMDrunning on 4K processors of XT3 achieves better performance than Blue Matter on 32K processorsof BG/L and similar to Desmond running on 2K processors of their Opteron machine.
Blue Matter is a program developed and optimized for the BG/L machine, and has achievedexcellent scalability. Table 9 compares its performance with NAMD. On BG/L, each node has twoprocessors and one has an option of using the second processor as a computational process (thisis called the “virtual node” (VN) mode) or just using it as a co-processor. Blue Matter essentiallyuses the second processor as a co-processor, but off-loads some computations (PME) to it. NAMDcan use both processors for computation, or just use one processor on each node. The co-processor(CO) mode also has the advantage that the communication hardware is not shared with the sec-ond processor. As the table shows, NAMD is about 1.98 times faster than Blue Matter on 1,024processors even if we were to restrict it to use only one processor per node. If it uses both pro-
12

No of Nodes 512 1024 2048 4096 8192 16384Blue Matter 38.42 18.95 9.97 5.39 3.14 2.09NAMD CO mode 17.77 9.73 5.84 3.85 2.73 2.14NAMD VN mode 9.82 6.26 4.34 3.06 2.36 2.11
Table 9: Comparison of benchmark times (in ms/step, ApoA1) for NAMD and Blue Matter
No of Cores 8 16 32 64 128 256 512 1024Desmond ApoA1 256.8 126.8 64.3 33.5 18.2 9.4 5.2 3.0NAMD ApoA1 199.25 104.96 50.69 26.49 13.39 7.12 4.21 3.35Desmond DHFR 41.4 21.0 11.5 6.3 3.7 2.0 1.4NAMD DHFR 27.25 14.99 8.09 4.31 2.37 1.5 2.53
Table 10: Comparison of benchmark times (ms/step) for NAMD and Desmond
cessors (in VN mode), on the same hardware configuration of 1,024 nodes, it performs about 3.03times faster than Blue Matter. This has been achieved by improving the performance of NAMDby about 200% (since [8] which was the basis for Blue Matter’s comparison in [5]) by removingPME and communication bottlenecks. However, it should be noted that NAMD performs a PMEcomputation every 4 steps, whereas Blue Matter does it every step. We believe that the numericalalgorithm used in NAMD ensures that the multiple time-stepping scheme does not lose accuracy.
We compare NAMD with Desmond using a machine similar to that used in their SC’06 paper,although the TACC machine has slightly faster processors (2.6 GHz vs 2.4 GHz on their cluster).Both machines use Infiniband as the interconnect. We used two cores per node for running NAMDon LoneStar to compare fairly with the two cores per node runs of Desmond. Our performancefor ApoA1 is better until 512 processors although Desmond does better at 1,024. This in spiteof the (surmised) fact that Desmond used single precision arithmetic, and thereby exploited SSEinstructions on the processor. Since Desmond is proprietary software, so we could not run it on thesame machine as NAMD. Although the comparison is not apples-to-apples but it still demonstratesthat NAMD’s performance capabilities are comparable with Desmond’s. Moreover, we could notreproduce the performance anomalies of NAMD on their machine in [1] on a similar machine.
6 Future WorkThe needs of biomolecular modeling community require us to pursue strong scaling i.e. we muststrive to scale the same molecular system to an ever larger number of processors. We have demon-strated very good scalability with the techniques described in this paper, but challenges remain,especially if we have to exploit the petascale machines for the same problems. To analyze if this isfeasible and what avenues are open for further optimizations, we carried out a performance studyof scaling that we summarize below.
We used the the summary data provided by Projections which gives detailed information aboutthe time elapsed in the execution of each function in the program and also the time for which eachprocessor is idle. This data, collected on the Cray XT3 machine at PSC and the BG/L machine atIBM for 1 to 4,096 processors, is shown in Fig. 6.
To simplify the figures, functions involved in similar or related activities are grouped together.The first observation is that the idle time rises rapidly beyond 256 processors. This is mostly
13

Figure 6: Percentage increase of different parts of NAMD with increase in number of processors(ApoA1 on BG/L and XT3, without PME)
due to load imbalance, based on further analysis. One of the next challenges is then to developload balancers that attain better performance while not spending much time or memory in the loadbalancing strategy itself. Also, there is a jump in the non-bonded work from 256 to 512 whichcan be attributed to the change in the decomposition strategy from 2-Away-X to 2-Away-XY atthat point which doubles the number of cells. Since the essential computational work involved innon-bonded force evaluation does not increase, we believe that this increase can be reduced bycontrolling the overhead in scheduling a larger number of objects. The other important slowdownis because of the increase in communication overhead as we move across the processors. Lookingback at Table 1 we see that from 512 to 16K processors, the computation time per processor shouldideally decrease 32-fold but does not. This can be attributed in part to the communication volume(per processor) decreasing only by a factor of about 10. Although some of this is inevitable withfiner-grained parallelization, there might be some room for improvement.
7 SummaryThe need for strong scaling of fixed-size molecular systems to machines with ever-increasing num-ber of processors has created new challenges for biomolecular simulations. Further, some of thesystems being studied now include several million atoms. We presented techniques we devel-oped or used, to overcome these challenges. These included dealing with interaction among twoof our adaptive strategies: generation of spanning trees and load balancing. We also presentednew techniques for reducing the memory footprint of NAMD to accommodate large benchmarks,including NSF-specified 100M atom benchmark for the “Track-1” sustained petascale machine.We then demonstrated portability, scalability over a number of processors and scalability acrossmolecular systems ranging from small (5.5k atoms) to large (2.8M atoms), via performance dataon multiple parallel machines, going up to 64K processors for the largest simulations. We alsopresented a performance study that identifies new bottlenecks that must be overcome to enhancethe performance with a large number of processors, when the ratio of atoms to processors fallsbelow 50.
We believe that with these results NAMD has established itself as a high performance programthat can be used at any of the national supercomputing centers. It is a code which is routinely usedand trusted by the biophysicist. With the new techniques presented, it is ready for the next genera-
14

tion of parallel machines that will be broadly deployed in the coming years. Further optimizationsfor long term multi-petascale future machines include a larger reduction in memory footprint to ac-commodate the NSF 100M atom simulation, parallel I/O (especially to avoid memory bottleneck)and improved load balancers.
References[1] K. J. Bowers, E. Chow, H. Xu, R. O. Dror, M. P. Eastwood, B. A. Gregersen, J. L. Klepeis,
I. Kolossvary, M. A. Moraes, F. D. Sacerdoti, J. K. Salmon, Y. Shan, and D. E. Shaw. Scalablealgorithms for molecular dynamics simulations on commodity clusters. In SC ’06: Proceed-ings of the 2006 ACM/IEEE conference on Supercomputing, New York, NY, USA, 2006.ACM Press.
[2] T. Darden, D. York, and L. Pedersen. Particle mesh Ewald. An N·log(N) method for Ewaldsums in large systems. JCP, 98:10089–10092, 1993.
[3] M. Eleftheriou, B. G. Fitch, A. Rayshubskiy, T. J. C. Ward, and R. S. Germain. Scalableframework for 3D FFTs on the Blue Gene/L supercomputer: Implementation and early per-formance measurements. IBM Journal of Research and Development, 49(2/3), 2005.
[4] B. Fitch, R. Germain, M. Mendell, J. Pitera, M. Pitman, A. Rayshubskiy, Y. Sham, F. Suits,W. Swope, T. Ward, Y. Zhestkov, and R. Zhou. Blue Matter, an application framework formolecular simulation on Blue Gene. Journal of Parallel and Distributed Computing, 63:759–773, 2003.
[5] B. G. Fitch, A. Rayshubskiy, M. Eleftheriou, T. J. C. Ward, M. Giampapa, and M. C. Pitman.Blue matter: Approaching the limits of concurrency for classical molecular dynamics. InSC ’06: Proceedings of the 2006 ACM/IEEE conference on Supercomputing, New York, NY,USA, 2006. ACM Press.
[6] L. Kale, R. Skeel, M. Bhandarkar, R. Brunner, A. Gursoy, N. Krawetz, J. Phillips, A. Shi-nozaki, K. Varadarajan, and K. Schulten. NAMD2: Greater scalability for parallel moleculardynamics. Journal of Computational Physics, 1998.
[7] L. V. Kale, G. Zheng, C. W. Lee, and S. Kumar. Scaling applications to massively parallelmachines using projections performance analysis tool. In Future Generation Computer Sys-tems Special Issue on: Large-Scale System Performance Modeling and Analysis, volume 22,pages 347–358, February 2006.
[8] S. Kumar, C. Huang, G. Almasi, and L. V. Kale. Achieving strong scaling with NAMDon Blue Gene/L. In Proceedings of IEEE International Parallel and Distributed ProcessingSymposium 2006, April 2006.
[9] S. Kumar, C. Huang, G. Zheng, E. Bohm, A. Bhatele, J. C. Phillips, H. Yu, and L. V. Kale.Scalable Molecular Dynamics with NAMD on Blue Gene/L. IBM Journal of Research andDevelopment: Applications of Massively Parallel Systems (to appear), 52(1/2), 2007.
[10] S. J. Plimpton and B. A. Hendrickson. A new parallel method for molecular-dynamics simu-lation of macromolecular systems. J Comp Chem, 17:326–337, 1996.
[11] K. Schulten, J. C. Phillips, L. V. Kale, and A. Bhatele. Biomolecular modeling in the eraof petascale computing. In D. Bader, editor, Petascale Computing: Algorithms and Applica-tions, pages 165–181. Chapman & Hall / CRC Press, 2008.
[12] M. Snir. A note on n-body computations with cutoffs. Theory of Computing Systems, 37:295–318, 2004.
15