OVERCOMING CHALLENGES, DELIVERING CHANGE
41
O’Key Group S.A. Annual Report 2015 OVERCOMING CHALLENGES, DELIVERING CHANGE
-
Upload
khangminh22 -
Category
Documents
-
view
0 -
download
0
Transcript of OVERCOMING CHALLENGES, DELIVERING CHANGE

O’Key Group S.A. Annual Report 2015
OVERCOMING CHALLENGES, DELIVERING CHANGE

1O’KEY Group S.A. Annual Report & Accounts 2015
Governance
Financial Statements
Strategic Report
Overview
Overview
37.238.4
2014
2015
2014
2015
152.0162.5
23.624.52014
2015
10.111.32014
2015
6.27.42014
2015
1.95.22014
2015
5.98.62014
2015
593K146326.9%
AT O’KEY, WE ARE COMMITTED TO DELIVERING MAXIMUM VALUE AND QUALITY FOR OUR CUSTOMERS, WHILE GROWING SUSTAINABLY AS A LEADER IN THE LONG-TERM DEVELOPMENT OF THE RUSSIAN RETAIL SECTOR.
We are building a world-class retailer with a passion for quality and the ambition to deliver a unique customer experience. We are developing on the basis of three world-class formats – hypermarkets, supermarkets and discounter stores – and have earned an unrivalled reputation for product quality and customer service.
OVERVIEW 1-3
Financial & Operational Highlights 1
O’KEY Group at a Glance 2
STRATEGIC REPORT 4-26
Chairman and Chief Executive’s Statement 4
Our Strategy 6
In Focus – Private Label 8
In Focus – Online Shopping 10
Statement of CEO of Discounter Format 12
Our Marketplace 14
Corporate Social Responsibility 16
Financial Review 20
Risk Management 24
GOVERNANCE 27-34
Board of Directors 27
Senior Management 28
Corporate Governance 30
Ownership and Shareholder Structure 32
Management & Directors Responsibility Statement 34
FINANCIAL STATEMENTS 35-74
Report of the Réviseur d’Entreprises Agréé 35
Consolidated Statement of Financial Position 36
Consolidated Statement of Profit or Loss and Other Comprehensive Income 37
Consolidated Statement of Changes in Equity 38
Consolidated Statement of Cash Flows 40
Notes to the Consolidated Financial Statements 41
Financial & Operational Highlights
In 2015, O’KEY Group delivered revenue growth of 6.9%, driven by the Company’s expansion and despite the strong headwinds in the Russian retail market. The Group’s gross margin declined year-on-year due to the decision to offer a better value proposition to customers.
Revenue (RUB billion)
Gross profit (RUB billion)
Gross margin (%)
EBITDA (RUB billion)
EBITDA margin (%)
Net profit (RUB billion)
Operating profit (RUB billion)
593,000 m2 of selling space (compared to 552,000 m2 in 2014)
Total stores (compared to 108 in 2014)
Presence in 32 Russian cities (compared to 28 in 2014)
Revenue growth in 2015

2 3O’KEY Group S.A. Annual Report & Accounts 2015 O’KEY Group S.A. Annual Report & Accounts 2015
Governance
Financial Statements
Strategic Report
Overview
Strategic Report
Lipetsk1 HM1 SM
Voronezh2 HM1 SM
Togliatti1 HM1 SM Ufa
3 HM
Tyumen2 HM
Surgut2 HM
Yekaterinburg2 HM
Saratov1 HM1 SM
Krasnoyarsk2 HM1 SMNovosibirsk
2 HM
Omsk1 HM1 SM
Volgograd1 HM3 SM
Astrakhan2 HM1 SM
Orenburg1 HM
Sterlitamak1 HM
Syktyvkar1 HM
Cherepovets1 HM
Stavropol1 HM
Rostov-on-Don2 HM1 SM
Krasnodar4 HM1 SM Sochi
1 HM
Murmansk2 HM
St Petersburg20 HM20 SM
Moscow10 HM 7 SM
Nizhny Novgorod3 HM
Ivanovo1 HM1 SM
Hypermarket (HM)Supermarket (SM)Discounter stores (DS)
Moscow11 DS
Tver[XX] DS
Tula1 DS
Ryazan2 DS
Kaluga1 DS
Smolensk1 DS
Yaroslavl[XX] DS
Vladimir[XX] DS
Lipetsk1 HM1 SM
Voronezh2 HM1 SM
Togliatti1 HM1 SM Ufa
3 HM
Tyumen2 HM
Surgut2 HM
Yekaterinburg2 HM
Saratov1 HM1 SM
Krasnoyarsk2 HM1 SMNovosibirsk
2 HM
Omsk1 HM1 SM
Volgograd1 HM3 SM
Astrakhan2 HM1 SM
Orenburg1 HM
Sterlitamak1 HM
Syktyvkar1 HM
Cherepovets1 HM
Stavropol1 HM
Rostov-on-Don2 HM1 SM
Krasnodar4 HM1 SM Sochi
1 HM
Murmansk2 HM
St Petersburg20 HM20 SM
Moscow10 HM 7 SM
Nizhniy Novgorod3 HM
Ivanovo1 HM1 SM
Hypermarket (HM)Supermarket (SM)Discounter stores (DS)
Tver1 DS
Tula4 DS Ryazan
2 DS
Kaluga1 DS Moscow
11 DS
Tver region1 DS
Tula region4 DS
Ryazan region2 DS
Kaluga region1 DS Moscow region
20 DS
Moscow11 DS
0
00
0
35
29
31
34
39 40
42
52
60
69 71
2011 2012 2013 2014 2015
71
83
94
108
146
714035146
2007-2008 – Focus on expansion in Russia’s regions – Stores opened in 6 new regions – Total stores reaches 37, selling space
doubled to >190k m2
– O’KEY enters into ranks of Russia’s top-10 retailers by revenue
2009-2014 – Emergence as a leading national
Russian retailer – Rapid expansion in Moscow and key
regional markets – IPO on the London Stock Exchange – Total stores exceeds 100, selling space
over 550k m2
2015 – Rollout of market-leading hypermarket
online sales platform – Strengthening of international
management team – Launch of the new discounter format
under the DA! brand – Total stores reaches 146, selling space
reaches 593k m2
O’KEY IS THE SEVENTH LARGEST RUSSIAN RETAILER. OUR PRIMARY RETAIL FORMAT IS THE MODERN EUROPEAN-STYLE HYPERMARKET UNDER THE ‘O’KEY’ BRAND, REINFORCED BY O’KEY SUPERMARKETS. IN 2015, THE GROUP LAUNCHED THE ‘DA!’ DISCOUNTER STORE. IN ADDITION, THE GROUP WAS THE FIRST AMONG HYPERMARKET CHAINS IN RUSSIA TO LAUNCH ONLINE FOOD SALES.
AT A GLANCEO’KEY Group
What We Do:We opened our first hypermarket in St. Petersburg in 2002 and have demonstrated continuous growth ever since. Our customer value proposition is built on an outstanding customer experience with high-quality products delivered at competitive prices. Our global depositary receipts (‘GDRs’) have been listed on the London Stock Exchange since 2010.
– We operated 146 stores in 32 cities in Russia as at 31 December 2015
– 71 hypermarkets, with average of 30,000 SKUs – 40 supermarkets, with average of 10,000 SKUs – 35 discounter stores, with average of 1,500 SKUs – 14.8% 5-year CAGR retail growth in RUB terms (2011-2015)
Our History:
Hypermarkets
Supermarkets
Discounter stores
Growth in Total Stores 2011-2015
Hypermarkets Supermarkets Discounter stores
2001-2002 – Founding of O’KEY Group – First O’KEY hypermarket opened
in St. Petersburg
2003-2006 – Strategy of establishing regional
market leadership – Further 8 hypermarkets and
2 supermarkets opened in St. Petersburg – Total selling space increased from
6,000 m2 to 87,000 m2
146 stores in 32 cities in Russia

4 5O’KEY Group S.A. Annual Report & Accounts 2015 O’KEY Group S.A. Annual Report & Accounts 2015
Governance
Financial Statements
Strategic Report
Overview
Strategic Report
In addition, we are also applying new technology to give our customers added convenience, launching an online shopping platform in Moscow and St. Petersburg last year. We are the first national food retailer to launch an online platform with a full hypermarket assortment.
So we are doing more than just investing in prices; we are, over the longer term, remaking key parts of our business, such as improving buying conditions and centralising logistics to be more efficient. These sorts of steps help to improve our commercial margin.
Tale of Two HalvesWe are pleased with our results in 2015 but cannot be complacent and must do more to retain customers and maintain margins in the current macroeconomic situation. The first half of the year was distinctly tough but, thanks to our new strategy aimed at getting closer to our customers, we were able to deliver a stronger than expected 6.9% revenue increase and 4.3% like-for-like traffic growth, driven by a particularly strong fourth quarter.
Due to the challenging first half, as well as the rollout of the discounter chain, EBITDA and net profit both declined, however, we remain consistently profitable with strong margins. We maintain a conservative approach to borrowing – our debt leverage remains sustainable, based on such metrics as a net debt to EBITDA ratio of 2.6 as of the end of 2015.
Store-opening pace for hypermarkets and supermarkets was conservative and we expect this to remain the case for 2016 as we concentrate on the highest value markets, in particular with our ‘compact hypermarket’ format targeting areas with higher population density.
The launch of our ‘DA!’ discounter format in Moscow was a step-change for the Group as we opened 35 stores in the final months of 2015. The hard discounter format, with limited SKUs, a focus on private-label products and highly efficient logistics, is new to Russia and we see considerable long-term potential. The stores target an urban audience seeking value for money. We are also realising economies of scale for the Group through joint procurement with discounter stores and leveraging their experience in private-label development and marketing.
OutlookWe made important progress last year, but it is only the beginning of a long process. The Russian retail market will see even stronger competition and pressure on prices. Real incomes fell by 4.0% in 2015 and inflation reached a multi-year high. We continue to believe in the Russian growth story, but it is how retailers adapt to new market realities, after years of rapid consumer market and income growth, that will be the real test of all players.
‘THANKS TO OUR NEW STRATEGY AIMED AT GETTING CLOSER TO OUR CUSTOMERS, WE WERE ABLE TO DELIVER A STRONGER THAN EXPECTED 6.9% REVENUE INCREASE AND 4.3% LIKE-FOR- LIKE TRAFFIC GROWTH.’Heigo Kera, Chairman of the Board of Directors and Chief Executive Officer
Our agenda for 2016 is a busy one. The Group will continue the robust roll-out of the discounter stores, while focusing on high-growth markets for our hypermarkets and supermarkets and raising traffic at existing stores. We need to continue working with federal suppliers to improve margins and are enhancing logistics with the opening of distribution centres in St. Petersburg and Moscow. Meanwhile, we are investing in IT to be more efficient across operations with a particular focus on purchasing, logistics, marketing and sales. We are in the process of upgrading our ERP system with a deadline of the end of 2017.
On behalf of the Board of Directors and Management Team, I would like to thank all of our stakeholders for their continued belief in the O’KEY story and for staying with us during this challenging year.
Yours truly,
Heigo KeraChairman of the Board of Directors and Chief Executive Officer
Dear Customers, Investors, Colleagues and Partners,
2015 was a year when we started the transformation of our business to get closer to our customers. I am pleased to report that, despite significant macroeconomic headwinds, we were able to execute our turnaround strategy, achieve a recovery in traffic growth and deliver solid operational results.
During the year, we rebalanced product assortment, enhancing the value proposition in our core hypermarket and complementary supermarket format, re-launched our private-label lines, saw early positive results in our unique online shopping platform and successfully launched a new discounter format. In addition, we embarked on long-term projects aimed at improving efficiency in logistics, marketing and IT systems.
I believe the robust measures taken last year, and continuing into 2016, will ensure we have the right fundamentals in place to deliver long-term, sustainable growth.
Delivering ChangeAlthough I was appointed Chief Executive Officer (‘CEO’) in May 2015, I had the privilege of working with O’KEY at the very beginning, advising the Group’s founders on the development and launch of their first hypermarkets in St. Petersburg. And I have served on the Board of Directors since 2010
When I assumed the CEO post, I had a clear mandate to deliver change in order to improve traffic. The turnaround strategy was based on three equally important pillars: to focus on our customers by offering the best value proposition; to deliver operational excellence at every link of the value chain; and to create an efficient and strong team.
These pillars complement each other, of course. We have strengthened our senior management team with best-in-class professionals delivering change in how we manage logistics, marketing, sales, e-commerce, product quality and security among other areas. And we have a retail professional with a wealth of experience in managing discounter stores heading our new discounter store format.
Reacting to the changes in the marketplace and disposable income, we enhanced our value proposition and rebalanced our product assortment in the lower price-range to make it more appealing to the customer base. We also relaunched private-label brands in the low and medium price ranges. During the year we have already seen a strong take up in sales and we expect to grow the share of private label products in sales to double-digit figures till the end of 2017. Overall, we are now offering attractive prices to our customers without sacrificing the product and customer service quality that is the hallmark of the O’KEY brand.
LAST YEAR SAW US MAKE NECESSARY LONG-TERM CHANGES IN OUR BUSINESS WHILE OVERCOMING A CHALLENGING MARKET ENVIRONMENT.
AN EVENTFUL AND CHALLENGING YEAR
Chairman and Chief Executive’s Statement

6 O’KEY Group S.A. Annual Report & Accounts 2015 7O’KEY Group S.A. Annual Report & Accounts 2015
Governance
Financial Statements
Strategic Report
Overview
Strategic Report
Del
iver
the b
est value proposition Strengthen our presence
Cut costs by im
proving efficiency of Enhance supply ch
ain
business processes and IT systems
208 MILLION CUSTOMERS SERVED IN 2015
OUR STRATEGYStrategy
Achieve robust like-for-like sales growth
while maintaining profitability levels
Ensure a truly ‘one-stop shop experience’ while
offering quality products for all wallets
Increase the share of our affordable
private-label products
Improve commercial margin by obtaining better
condition with suppliers while
maintaining attractive product range for
customers on store shelves
Develop our key format of ‘city
hypermarket’, where shopping becomes a
truly enjoyable experience
Ensure the sustainable growth of our hypermarket
footprint with a focus on the most attractive
markets
Continue the rollout of ‘DA!’
stores, a discounter model unique in the
Russian market
Optimise supply chain for every
product category and SKU and
implement a smart, end-to-end supply chain
Introduce state-of-the-art IT solutions to improve
business processes in sales and marketing, logistics and accounting to realise
efficiencies across operations
Maintain high shelf availability and optimal
inventory levels
Improve efficiency of logistics supporting
import and private-label operations
Leverage ‘Big Data’ to better
understand our customers and cater to their needs
Enhance technological platform to support the roll-out
of new formats and online channels
Our strategy is built around developing a modern, multi-format food retailer in Russia with a passion for quality and the ambition to deliver a unique customer experience. We plan to grow sustainably our presence in the hypermarket and supermarket formats in key regions of the country, as well as aggressively expand our footprint in our new discounter stores.

9O’KEY Group S.A. Annual Report & Accounts 2015
Governance
Financial Statements
Strategic Report
Overview
8 O’KEY Group S.A. Annual Report & Accounts 2015
Strategic Report
4.6%AN IMPORTANT STEP IN OUR TURNAROUND STRATEGY IN 2015 WAS THE COMPLETE RE-LAUNCH OF OUR PRIVATE- LABEL RANGES AND WE SAW STRONG EARLY RESULTS.
PRIVATE LABEL
In Focus
4.6% of sales in 2015 were private label
Before 2015, we maintained two private-label lines in food products, a generic ‘no-name’ first-position brand and an O’KEY brand. However, we concluded that we had not developed our private-label brands to their full potential. We believed there were additional opportunities to increase margin and pass along the savings to our customers.
Last year we launched a new first-price private-label brand called ‘Just what you need’, with around 400 SKUs in 2015 and plans for additional SKUs in 2016. We also re-designed the O’KEY private-label logo covering around 40 SKUs in 2015 and plans for approximately 650 SKUs in 2016.
Beyond new logos, the new lines cover significantly different product categories in order to better meet consumer needs and match offers by competitors. Our O’KEY brand positioned in the second basket remains a by-word for quality, as before, but also offers a price proposition that is truly competitive.
We have an ambitious promotional plan for the O’KEY private label in 2016, with inclusion in our catalogues, dedicated catalogues twice a year and a major advertising campaign. In our stores, we are ensuring the right shelf positioning and constant availability for consumers. We have seen strong early customer response. Already in 2015, we saw the share of private label in sales reach 4.6%. We plan to achieve double-digit share in sales till the end of 2017.
87.5% SHARE OF FOOD IN REVENUES

10 O’KEY Group S.A. Annual Report & Accounts 2015 11O’KEY Group S.A. Annual Report & Accounts 2015
Governance
Financial Statements
Strategic Report
Overview
Strategic Report
12622K
Our online shop awarded Global CIO Project of the Year Award in the Retail and Distribution category
9.8 MILLION LOYALTY CARD HOLDERS IN TOTAL
LAST YEAR WE ROLLED OUT AN ONLINE SHOPPING PLATFORM THAT IS UNIQUE ON THE RUSSIAN MARKET TODAY AND FITS OUR STRATEGY OF USING TECHNOLOGY TO GIVE OUR CUSTOMERS NEW SHOPPING CHANNELS WHILE GROWING REVENUES.
ONLINE SHOPPING
In Focus
Tonnes delivered in 2015
SKUs available in our online shop
We began work on the Online Shopping platform in 2014 and launched it last year in Moscow in February 2015, expanding it to St. Petersburg later in the year. We developed a new IT platform and created an online store that has our full hypermarket selection, unlike other online shopping platforms operating in Russia that offer a much more limited selection.
For convenience, we built pick-up points in selected hypermarkets. These have temperature-controlled zones and the pick-ups are designed to take less than five minutes. In addition, we launched a delivery service in Moscow in April and in St. Petersburg in December. The service has proved particularly popular, regularly booking out several days in advance.
The online platform has proved an early hit with customers and attracted a strong demographic. Customers on average spend more online than in the bricks-and-mortar stores. We plan to expand the geography of the service quickly but sustainably and to include a drive-through zone in our stores to accommodate the future growth of the service.
We see the opportunity to grow revenues through this channel substantially in the coming years. It represents another channel for our customers and is in line with our strategy of building customer loyalty with multiple shopping platforms. It is also Russia’s first hypermarket online food sales platform, unmatched by other top-10 retailers, and another example of O’KEY leading the market place.

12 O’KEY Group S.A. Annual Report & Accounts 2015 13O’KEY Group S.A. Annual Report & Accounts 2015
Governance
Financial Statements
Strategic Report
Overview
Strategic Report
New discount stores opened in 2015
Lipetsk1 HM1 SM
Voronezh2 HM1 SM
Togliatti1 HM1 SM Ufa
3 HM
Tyumen2 HM
Surgut2 HM
Yekaterinburg2 HM
Saratov1 HM1 SM
Krasnoyarsk2 HM1 SMNovosibirsk
2 HM
Omsk1 HM1 SM
Volgograd1 HM3 SM
Astrakhan2 HM1 SM
Orenburg1 HM
Sterlitamak1 HM
Syktyvkar1 HM
Cherepovets1 HM
Stavropol1 HM
Rostov-on-Don2 HM1 SM
Krasnodar4 HM1 SM Sochi
1 HM
Murmansk2 HM
St Petersburg20 HM20 SM
Moscow10 HM 7 SM
Nizhniy Novgorod3 HM
Ivanovo1 HM1 SM
Hypermarket (HM)Supermarket (SM)Discounter stores (DS)
Tver1 DS
Tula4 DS Ryazan
2 DS
Kaluga1 DS Moscow
11 DS
Tver region1 DS
Tula region4 DS
Ryazan region2 DS
Kaluga region1 DS Moscow region
20 DS
Moscow11 DS
IN SEPTEMBER – DECEMBER 2015, WE LAUNCHED OUR FIRST 35 DISCOUNTER STORES UNDER THE DA! BRAND AND OPENED A NEW FRONTIER FOR THE O’KEY GROUP AND FOR THE RUSSIAN MARKETPLACE.
DISCOUNTER STORES
Statement of CEO of Discounter Format
750SKUs of private label products
1,500SKUs on average per store
Dear Customers, Investors, Colleagues and Partners,
The launch was the culmination of 18 months of careful preparation, including the creation of a new company, development of the brand concept and private-label line as well as finding the right locations for our stores. We created a new, state-of-the-art 52,000 m2 distribution centre for the new format, allowing us to supply all of our new discount stores opened in 2015 and ensure a base for organic growth in Moscow and the Moscow region. This lowers our costs and helps us maintain tight logistics and quality controls at each step.
The hard discount store format is well-established in Western and Central Europe, but today is unique in the Russian market. It has around 1,500 SKUs, of which around 700 are private-label products. While ‘DA!’, is run as a separate business unit, we are able to achieve efficiencies of scale in purchasing with our hypermarkets and supermarkets and pass these savings along to the consumer.
Our stores provide a hard discount price proposition, while still offering a modern and bright pleasant shopping experience with the right product mix and fresh products. We supply all our stores with fresh fruit and vegetables and have a bakery on the premises.
We were very pleased with the results of the first 35 store openings in 2015 and believe we can tap enormous market potential. We opened a further four stores in the first two months of 2016 and plan to maintain a robust store-opening pace in 2016 and beyond, in line with the macroeconomic situation and the Group’s overall plans. Over the medium to long term, the discounter format provides the Group with a powerful additional growth driver in Russia, targeting all customer demographics, and able to grow in urban locations with small store footprints.
Yours truly,
Armin BurgerChief Executive of the Discounter Chain

14 15O’KEY Group S.A. Annual Report & Accounts 2015 O’KEY Group S.A. Annual Report & Accounts 2015
Governance
Financial Statements
Strategic Report
Overview
Strategic Report
-6
-4
-2
0
2
4
6
2011 2012 2013 2014 2015
REAL DISPOSABLE INCOME GROWTH (Y-O-Y CHANGE)Source: Rosstat
-10
-5
0
5
10
2011 2012 2013 2014 2015
RETAIL SALES GROWTH (Y-O-Y CHANGE)Source: Rosstat
0
3
6
9
12
15
2011 2012 2013 2014 2015
RUSSIAN CONSUMER PRICE INDEX (%)Source: Rosstat
-30
-20
-10
0
2011 2012 2013 2014 2015
RUSSIAN CONSUMER CONFIDENCE*Source: Rosstat
* as at Q4 each year
While the Russian retail segment has seen two challenging years, the market grew at double-digit rates until 20132. The years 2014 and 2015 saw a confluence of negative factors, including rising consumer price inflation, falling consumer confidence and a decline in real disposable income. Price inflation, while not always harmful, has been dragging down real wage growth.
OutlookThe outlook for 2016 looks similar, with HSBC forecasting a 2% decline in real wages, caused by external macroeconomic forces, driving more consumers to seek lower-priced alternatives. Many observers see a recovery in the second half of 2016 and 2017, but retailers will seek to cut overheads and invest in prices for their customers, and many consumers will have spent down their savings during the downturn. Food producers and retailers will seek to avoid price hikes to maintain customer flow, hitting margins.
While we do see some upside from a recovery in consumer spending through improvement in real wages and slowing consumer price inflation, our strategy is based on a more cautious scenario. We believe by investing in our business today to enhance efficiency and ensure price competitiveness alongside our established reputation for quality and service, we will be one of the best-positioned retailers in the Russian marketplace to benefit from market growth opportunities, with the goal of delivering on behalf of all our stakeholders.
OUR MARKETPLACE
In Focus
The total consumer market was valued at US$250 billion at the beginning of 20161. Despite short-term challenges, it has enormous pent-up growth opportunities due to the still-evolving retail landscape and unmet appetite for a variety of Western-style shopping formats in many regions. Over the medium to long term, retailers able to weather the current macroeconomic headwinds and offering the right consumer value proposition have the opportunity to capture this vast growth potential.
HeadwindsThe Russian consumer market has endured two tough years in 2014 and 2015, the result of overall macroeconomic challenges faced by the country. However, the market retains vast upside potential due its sheer size, latent consumer demand, retail market fragmentation among many smaller players and still large share of traditional retail venues, such as markets, in many parts of Russia.
By various estimates, less than a third of the Russian retail market is controlled by the top-10 retailers, unlike Western European markets or consolidated local markets in the US. Most analysts see this market consolidating around the largest players as measured by annual turnover. This suggests room for larger players, such as O’KEY, to deliver sustainable growth, using differentiated formats to reach target consumer segments according to buying power and preference.
One example is the hard discounter format. With limited SKUs, a high proportion of sales of private-label products, world-class logistics and a high level of service, this format is new to the Russian market, but is a proven one in Europe. A large and demographically-attractive consumer base gives it considerable room to grow in Moscow, the Moscow Region and the surrounding regions, before spreading to other cities.
1. Source: Goldman Sachs.2. Source: Data from Rosstat, Euromonitor and Candean; analysis by BCG.
WITH 144 MILLION CONSUMERS, RUSSIA IS THE WORLD’S FIFTH-LARGEST GROCERY MARKET IN TERMS OF REVENUE.
16 17O’KEY Group S.A. Annual Report & Accounts 2015 O’KEY Group S.A. Annual Report & Accounts 2015
Governance
Financial Statements
Strategic Report
Overview
Strategic Report
We support these assessments with a reporting system introduced across the Group in 2013. We have also developed and implemented integrated systems for regular tracking of working conditions and all accidents and injuries in line with the best international practices. We have a systematic approach for investigating any accidents involving our employees or customers. Thanks to our systematic approach to safety management at work, the number of work-related injuries in 2015 continued to fall.
RecruitmentOur success is built on recruiting and retaining top talent while embracing diversity. Our HR strategy requires that we hire talented people to support our continued growth. Embracing diversity is not only the right thing to do, it is also crucial for our business, as it is how we ensure that we recruit the best people.
We are particularly proud of our efforts to promote gender equality in the workplace. We believe gender diversity is important for any business, and are particularly proud of our performance in this area, although there is still room for further progress. In 2015, women made up around 70% of store directors, more than 75% of the Group’s overall workforce.Our Recruitment Policy expressly prohibits any discrimination on the grounds of race, age, gender or religious persuasion. We conduct regular workshops to raise awareness of diversity and its positive impact on our business.
To share our vision and values, as well as practical experience, we hold regular career days and conduct professional seminars for students with a demonstrated interest in pursuing a career in the retail sector.
Employee RetentionWe see retention as a bellwether of our success in being an Employer of Choice. We maintain a Talent Management system, designed to assess and grow talented managers across all departments and develop incentives aimed at retaining talent within the Group. We provide our managers with a clear pathway to future growth and supply them with the tools to maximise their talents and achieve their potential within O’KEY.
Our motivation system is also designed to give our employees the right tools and incentives to deliver the world-class service to every customer that is the hallmark of the O’KEY brand.
As well as benefits provided to employees under Russian legislation, O’KEY offers additional benefits such as supplementary medical insurance, access to gym and sports facilities and, should one of our people find themselves in need, emergency financial aid.
75%Of the group’s overall workforce are women
We believe that our greatest contribution to society is the long-term growth of our business and resulting contribution to Russia’s economic growth and sustainable development. Equally, we believe our long-term growth is only possible through sustainability and partnership with all of our stakeholders. In this spirit, our CSR efforts are focused on four priority areas: preventing corruption, health and safety, recruitment and employee retention, and working with our local communities.
Preventing CorruptionWe have put in place clear policies to prevent the appearance of corruption in our business as well as to detect and avoid potential conflicts of interest. O’KEY Group has a ‘zero tolerance’ policy towards corruption. This is applied rigorously to our internal processes and is enshrined in our contractual relationships with suppliers. Our managers adhere to strict policy regarding gifts and discounts. We maintain a confidential whistle-blower e-mail address for reporting potential problems to our internal audit and security departments.
We established our Supplier Policy in 2010 as part of our efforts to ensure transparency and fairness throughout our supply chain. It establishes strict guidelines designed to identify and eliminate potential conflicts of interest when choosing a supplier. Under the policy, we conduct an open tender process to ensure that all potential suppliers are judged on their merits. A committee approves all tender outcomes.
Once we have selected a supplier, our contract conditions now include an addendum stipulating that the supplier will inform the Group about any known incidents of corruption. In particular, under our contracts, suppliers must report any instances of a Group employee soliciting an unauthorised payment or bribe. These reporting requirements provide us with an additional level of security.
In the last few years, we have enforced our supplier selection procedures still further in the interests of strengthening transparency. The Group has put in place specific requirements for the selection of service providers for security and construction services. We have also created expert oversight committees composed of members chosen from a range of departments, including finance and legal, to ensure a fair and informed decision-making process.
Throughout 2015, our efforts focused on continued awareness building, training both managers and employees to identify potential instances of corruption or conflicts of interest and making them aware of the resources available for reporting these issues without fear of negative repercussions.
Health and SafetyWe are committed to providing our customers with a safe shopping environment and our employees with safe working conditions. As part of our Health and Safety monitoring process, we conduct regular inspections of our work sites to ensure they are in full compliance with Russian legislation governing workplace safety.
SINCE OUR FOUNDING, WE HAVE BEEN COMMITTED TO MEETING THE HIGHEST STANDARDS IN CORPORATE SOCIAL RESPONSIBILITY (CSR) IN EVERY ASPECT OF OUR BUSINESS.
MEETING THE HIGHEST STANDARDS
Corporate Social Responsibility

18 19O’KEY Group S.A. Annual Report & Accounts 2015 O’KEY Group S.A. Annual Report & Accounts 2015
Governance
Financial Statements
Strategic Report
Overview
Strategic Report
organised a campaign to support Russian veterans. In St. Petersburg, we offered our customers the opportunity to buy packages of gifts for war veterans and congratulated our veterans on the anniversary. Overall, nearly 1,800 packages were sold for a total of over RUB 600,000.
We are also engaged in charitable activities of our partners. In 2015, we joined forces with P&G to support SOS Children’s Villages, an organisation providing a family-based approach to the long-term care of orphaned, abandoned children or those whose families are unable to care for them. In autumn 2015, a portion of the revenues from sales of P&G products in O’KEY stores was transferred to SOS Children Village. Overall, with the help of our customers, we were able to donate over RUB 4 million to this project.
Not only are we active in charitable programmes, but also we aim to promote charity in society. In 2014 and 2015, we sponsored the Dobry Piter charitable festival in St. Petersburg, where over 40 organisations were able to present their projects, collect funds and engage volunteers in their activities. Prior to the New Year holidays, we invited over 30 organisations to set up stands and collect funds in our stores.
We also aim to support the most vulnerable categories of society by providing discounts and maintaining low level of prices on vital staple products. In December 2014, despite the sharp devaluation of the ruble, we introduced a freeze on prices for essential products in St. Petersburg and Leningrad Region, Krasnoyarsk and Volgograd. Between March and May 2015, building on the success of that campaign, we introduced low prices for 30 essential product items in all of our stores, selling them at minimal mark-up or even below cost. In addition, we also expanded our programme supporting the most vulnerable members of society, including pensioners, schoolchildren, students and pregnant women, by offering a discount to holders of special social cards. These programmes have been launched in Moscow, Moscow Region and Krasnoyarsk Region. In Moscow Region, we are also providing discounts to social workers caring for the disabled.
Being a responsible corporate citizen and contributing to society is one of O’KEY’s overriding priorities. By supporting a diverse range of initiatives in these areas, the Group aims to improve life for individuals, communities and the nation as a whole.
We conduct an annual performance appraisal every year for our employees. It is designed not only to grade employee performance and reward excellence, but also to receive their feedback about the organisation. The appraisal system has been designed to be transparent and employees can appeal disputed findings to a committee.
In addition, we reach out to every employee through proactive internal communications, including our in-house magazine. We celebrate work anniversaries at every store for our people and their families.
Development and Training We believe that the key to retaining the best people is to provide the resources needed for them to reach their full potential within O’KEY Group. In 2015, a record 85% of our employees participated in training programmes, including programmes in inventory management, display, customer service and merchandising.
Working with our Communities O’KEY has built an integrated programme of charity and social investment designed to align the Group’s objectives with addressing social problems. This approach involves working together with local authorities, business partners, non-governmental organisation and our customers for the benefit of the community as a whole.
In line with our mission, we place particular emphasis on targeted assistance and support programmes helping orphans and children lacking parental care, as well as large families with five or more children. To this end, our key areas of charitable activity include:
– Support of educational programmes for children in orphanages: our goal is to help these vulnerable children overcome the challenges facing them in life and integrate into wider society
– Support for gifted children lacking parental care – Holistic support of large families, designed to improve
their financial position
Many charitable projects have grown out of the initiatives of our employees. We believe it is crucial to foster this passion through our local efforts. In St. Petersburg, for example, our employees are driving a major programme to share goods with orphanages, NGOs and religious charitable organisations helping children.
We are particularly proud of our support for Advita, a charitable organisation helping children and adults suffering from cancer. In September 2015, we organised a campaign in our St. Petersburg stores to raise funds for two Advita patients recovering from major surgery. Our customers donated funds and bought 3,600 packages with various necessities, including nappies, napkins, cleansers and baby food.
In late 2015, with the assistance of the Arithmetic of Good charity, our employees bought and sent presents to children from orphanages in Ivanovo and Voronezh.
In May 2015, Russia celebrated the 70th anniversary of the victory in the Second World War. To mark the event, O’KEY
Corporate Social Responsibility continued
“O’KEY HAS BUILT AN INTEGRATED PROGRAMME OF CHARITY AND SOCIAL INVESTMENT DESIGNED TO ALIGN THE GROUP’S OBJECTIVES”

20 21O’KEY Group S.A. Annual Report & Accounts 2015 O’KEY Group S.A. Annual Report & Accounts 2015
Governance
Financial Statements
Strategic Report
Overview
Strategic Report
General, selling and administrative expenses
RUB millionYear ended
31 December 2015Percentage of
revenue (%)Year ended
31 December 2014Percentage of
revenue (%) Change, p.p.
Personnel costs (14,989) 9.2 (13,929) 9.2 0.0Operating leases (4,728) 2.9 (3,873) 2.5 0.4Depreciation and amortisation (3,838) 2.4 (3,056) 2.0 0.4Communication and utilities (3,046) 1.9 (2,687) 1.8 0.1Advertising and marketing (1,651) 1.0 (1,823) 1.2 -0.2Security expenses (740) 0.5 (833) 0.5 0.0Repairs and maintenance costs (940) 0.6 (726) 0.5 0.1Insurance and bank commission (687) 0.4 (661) 0.4 0.0Operating taxes (759) 0.5 (633) 0.4 0.1Legal and professional expenses (660) 0.4 (517) 0.3 0.1Materials and supplies (300) 0.2 (345) 0.2 0.0Other costs (33) 0.0 (34) 0.0 0.0
Total general, selling and administrative expenses (32,371) 19.9 (29,117) 19.2 0.7
The Group’s general, selling and administrative expenses grew 11.2% y-o-y to RUB 32,371 million in 2015, primarily attributable to higher lease expenses resulting from the increase in the selling space as well the impact of the ruble depreciation on foreign currency denominated leases in US dollars and euro. General, selling and administrative expenses were also impacted by an increase in D&A resulting from the opening of new stores. As a percentage of revenue, the Group’s general, selling and administrative expenses increased by 0.7 pp to 19.9% in 2015.
In order to streamline investment portfolio and focus on the most efficient markets, the Group has divested 8 objects (5 stores under construction and 3 land plots) and closed two hypermarkets and two supermarkets.
Personnel costsPersonnel costs grew 7.6% y-o-y to RUB 14,989 million in 2015. This was mainly a result of a 5.0% increase in average headcount and an increase in salaries in line with the industry trends.
RUB million 2015 2014Year-on-year
change
Wages and salaries 9,894 8,814 12.3%Social security contributions 3,037 2,796 8.6%Employee benefits and bonuses 966 1,219 -20.8%Other staff costs 1,092 1,100 -0.7%
Total payroll 14,989 13,929 7.6%
Operating leasesA 22.1% y-o-y increase in lease costs in 2015 was primarily attributable to the net opening of two hypermarkets, one supermarket and 35 discounter stores and the impact of ruble depreciation on the payments under the leases linked to the US dollar and euro.
Communications and utilitiesCosts related to communications and utilities increased by 13.4% y-o-y in 2015 to RUB 3,046 million, mostly as a result of adding new stores, including discounter stores, and increased utilities tariffs.
Advertising and marketingAdvertising and marketing costs declined by 9.4% in 2015 to RUB 1,651 million as the Group has improved efficiency of marketing efforts.
Financial Review
RUB million 2015 2014Year-on-year
change, %
Revenue 162,510 151,983 6.9Gross profit 38,367 37,205 3.1Gross margin 23.6% 24.5%% -0.9 ppEBITDA 10,109 11,270 -10.3EBITDA margin 6.2% 7.4% -1.2 ppOperating profit 5,848 8,566 -31.7Net Profit 1,918 5,226 -63.6
RevenueFor the year, like-for-like (LFL) revenue was impacted by profound changes in customer behaviour driven by the worsening macroeconomic conditions, declining disposable incomes and import restrictions. LFL revenue increased by 0.6% due to a 1.3% increase in average ticket as a result of inflation, while LFL traffic fell 0.7%.
Facing macroeconomic headwinds and intensifying competition, in summer 2015 we launched a turnaround strategy, rebalanced product assortment to face the clients and address the changing demands and streamlined marketing efforts to drive traffic to our stores. Results of the turnaround strategy were already visible in Q4 2015 when LFL revenue grew by 3.8% year-on-year with LFL traffic increasing by 4.3% year-on-year.
During the year, the Group continued to strengthen its presence with a focus on the strongest markets. Selling space rose 7.4% after the net opening of two hypermarkets, one supermarket and 35 discounters and reached 593 thousand m2. in 2015.
Sales PerformanceRetail revenue
growth, % Traffic growth, %Av. Ticket growth,
%
Trade revenue FY 2015 6.9 7.2 -0.4Trade revenue LFL FY 2015 0.6 -0.7 1.3
Cost of goods sold and gross profitThe cost of goods sold increased 8.2% in 2015 to RUB 124,143 million. In the table below, we provide further detail about the cost of goods sold in 2014 and 2015:
RUB million 2015Percentage of 2015 revenue 2014
Percentage of 2014 revenue Change, p.p.
Revenue 162,510 100.0 151,983 100.0Cost of goods sold, including (124,143) 76.4 (114,779) 75.5 0.9Cost of trading stock (less supplier bonuses) (117,725) 72.4 (110,100) 72.4 0.0Inventory shrinkage (3,391) 2.1 (2,161) 1.5 0.6Logistics costs (2,214) 1.4 (1,797) 1.2 0.2Packaging and labelling costs (814) 0.5 (721) 0.5 0.0Gross profit 38,367 23.6 37,205 24.5 -0.9
Gross profit increased by 3.1% to RUB 38,367 million in 2015, compared to RUB 37,205 million in 2014 as the Group’s decision to offer better value proposition to customers was balanced by our sustained efforts to obtain better commercial terms with suppliers. Gross margin contracted by 0.9 pp to 23.6% impacted by:
– higher shrinkage rate attributable to supply chain disruptions following the introduction by the government of special economic measures pertaining to food import; and
– higher logistics costs as the Group embarked upon centralization of logistics to improve inventory management.

22 23O’KEY Group S.A. Annual Report & Accounts 2015 O’KEY Group S.A. Annual Report & Accounts 2015
Governance
Financial Statements
Strategic Report
Overview
Strategic Report
Working capitalAs of 31 December 2015, the Group’s working capital, defined as current assets (excluding cash and cash equivalents and short-term investments) less current liabilities (excluding short-term loans), was a negative RUB 8, 023 compared to negative RUB 9,043 million, at the end of 2014. Working capital figures in the food retail industry are usually negative, and the Group intends to maintain a negative working capital position.
The Group considers the net debt/EBITDA ratio as the principal means for evaluating the impact on its operations of the size of the Group’s borrowings. As of 31 December 2015, O’KEY’s net debt/EBITDA ratio was 2.6x. The increase in this ratio was driven by a decline in EBTIDA, while the amount of net debt fell by 2%.
RUB million 2015 2014
Total debt 35,558 32,081Short-term debt 12,000 12,426Long-term debt 23,558 19,655Less cash and equivalents (9,768) (5,810)Net debt 25,790 26,271Net debt/EBITDA 2.6 2.3
Financial Review continued
Operating profitIn 2015, the Group reported a 31.7% decline in operating profit to RUB 5,848 million from RUB 8,566 million due to an increase in SG&A driven by Company’s expansion and inflationary pressure. The decline was also impacted by a rise in other operating expenses the amount of RUB 126 million due to the recognition of the loss from the disposal of other non-current assets relating to the stores and land plots closed by the Group in 2015 partially offset by the income generated as a result of the streamlining of our real estate portfolio. This compares to an increase in operating income in 2014 attributable to the gain from the disposal of non-current assets in the amount of RUB 743 million which was partially offset by an impairment charge of RUB 200 million, which mainly related to the leasehold improvements in two loss-making stores.
Financing costsFinancing costs increased 2.2x to RUB 3,413 million in 2015, due to the higher value of the Group’s average loan portfolio (consolidated debt stood at RUB 35,558 million as of 31 December 2015; it was RUB 32,081 million on 31 December 2014, and it was RUB 16,755 million on 31 December 2013) and an increase in the Group’s weighted average interest rate in 2014 to 12.5% from 9.4% in 2014 driven by worsening market conditions.
Profit before income taxProfit before income tax declined by 70.0% to RUB 1,901 million in 2014 from RUB 6,314 million in 2014. Key factors influencing the decrease include a substantial increase in finance costs, a foreign exchange loss of RUB 615 million primarily attributable to a US dollar loan from a related party and an increase in D&A due to expansion of the Group’s footprint.
In 2015, the Group realized income tax benefit in the amount of RUB 16 million impacted by a tax reimbursement of RUB 702 million paid for 2013 and 2014 and a decline in profit before income tax compared to 2014. In 2014, the Group reported income tax expense in the amount of RUB 1,089 million as the tax authorities reimbursed to the Group RUB 764 million of income tax previously paid for the years 2010-2012, in addition RUB 191 million were claimed for recovery for prior years.
Profit for the yearDuring 2015, net profit fell by 63.6% y-o-y to RUB 1,918 million with a net profit margin of 1.2%.
Cash flows and working capitalRUB million 2015 2014 Restated
Net cash from operating activities 9,140 9,378Net cash used in investing activities (2,332) (16,287)Net cash (used in)/from financing activities (2,885) 9,583Net increase in cash and cash equivalents 3,923 2,674Effect of exchange rate fluctuations on cash and cash equivalents 34 129
Cash flows from operating activitiesIn 2015, the operating cash flows were impacted by a decline in EBITDA while working capital demonstrated positive dynamics. As a result, net cash from operating activities fell slightly by 2.5% to RUB 9,140 million. Cash receipts from customers grew by 6.8%, in line with revenue increases.
Cash used in investing activitiesNet cash used in investing activities declined from RUB 16,287 million in 2014 to RUB 2,332 million in 2015 as a result of the Company’s efforts aimed at streamlining its real estate portfolio. In 2015, proceeds from sales of property, plant and equipment and intangible assets (excluding VAT) amounted to RUB 6,289 million. Prepayments for PPE fell from RUB 4,867 million to RUB 1,704 million.
Cash flows from financing activitiesProceeds from new loans and borrowing less the repayments reached RUB 3,091 million as the Group made significant repayments during the period and finance costs rose following the increase in weighted average interest rate. In addition, the Group decreased the level of dividend payments from RUB 2,929 million in 2014 to RUB 1,644 in 2015.

24 25O’KEY Group S.A. Annual Report & Accounts 2015 O’KEY Group S.A. Annual Report & Accounts 2015
Governance
Financial Statements
Strategic Report
Overview
Strategic Report
Operational Risks
Name of Risk Definition and Potential Impact Mitigating Actions
Changing customer expectations
We strive to provide our customers with a wide range of goods and services, at competitive prices. However, we recognise that our customers’ shopping habits and expectations are influenced by the economic environment and will change over time.
We are constantly assessing and reviewing our business processes to ensure that we follow the evolving customer expectations.
To maximise the efficiency and relevance of such assessments, we monitor internal and external reports on retail market development and changes in O’KEY positioning.
We are developing IT solutions, particularly a Client Relationship Management (‘CRM’) system, that will enable us to understand better and react quicker to changes in consumer behaviour.
Employee recruitment and retention
Competition for highly qualified management and store personnel remains intense in Russia. To meet our expansion plans we need highly-skilled employees. Our future success depends in part on our continued ability to hire and retain new employees. We understand that any inability to attract and retain highly-qualified employees and key personnel in the future could have a material adverse effect on our business.
To improve motivation we have developed a system of Performance Appraisal that is conducted on a regular basis and rewards employees based on their individual results.
We also promote internal opportunities for career development via trainings and special programs.
Additionally, to facilitate adaptation of new employees, we organise introductory courses and coaching in our stores.
Supply chain risk Our financial performance depends in part on reliable and effective supply chain management. We rely on third parties to supply us with merchandise and services. The third parties that supply us with merchandise and services also have other customers and may not have sufficient capacity to meet all of their customers’ needs, including ours, during periods of excess demand. Shortages and delays could materially harm our business. Unanticipated increases in prices could also adversely affect our performance. Furthermore, we may be exposed to risk of delays and interruptions to our supply chain as a consequence of natural disasters, in case we are unable to identify alternative sources of supply in a timely manner.
To minimise the impact of potential disruptions in deliveries, we form a short list of suppliers for every product in every city. This ensures that if one supplier is unable to fulfil an order, an alternative supplier can provide it.
We also have systematised standards and requirements for warehouse operators, and conduct regular checks for compliance. This allows us to promptly change the warehouse operator in the case of service quality deterioration.
IT platform development Execution of our strategic targets requires adaptation of current IT infrastructure to the changing business needs. As the business grows the complexity of processes supporting it and diversity of tasks around such growth are increasing. Delayed or inappropriate decisions on development of the infrastructure can lead to failures in meeting Group goals and impede attainment of longer-term goals.
We are putting plans in place to enhance our existing systems and are considering further development of our IT platform to ensure that we are well supported for the future growth.
Managing store-opening process
The achievement of our expansion strategy depends upon our ability to locate and acquire locations for future stores, manage counterparties involved in the construction process and obtain all necessary permits. There are several factors which may affect our ability to open new stores:
– Availability of locations that meet our investment criteria;
– Ability of subcontractors to deliver results in a timely manner;
– Risks associated with developers’ ability to execute projects;
– Regulatory system and permitting process run by local administrations; and
– Local community action opposed to the location of specific stores at specific sites.
These factors alone or in combination may negatively impact our store-opening process and result in significant opening delays.
We aim to maintain a large portfolio of approved and secured projects for future development to cover more than two years of expansion.
We also conduct regular performance reviews for our subcontractors to ensure sufficient control over construction process.
Finally, we maintain active and constructive dialogue with local authorities in accordance with the law to resolve emerging issues.
IT security threats We are observing an increase in IT security threats and higher levels of professionalism in computer crime. Our systems and solutions, as well as those of our counterparties remain potentially vulnerable to attacks. Depending on their nature and scope, such attacks could potentially lead to the leakage of confidential information, improper use of our systems, manipulation and destruction of data, sales downtimes and supply shortages, which in turn could adversely affect our reputation, competitiveness, and business, financial and operational performance.
We employ a number of measures, including employee training, comprehensive monitoring of our networks and systems, and maintenance of backup and protective systems such as firewalls and virus scanners in attempt to reduce the threats to our IT security.
Risk Management
Risk management plays an integral part in how we plan and execute our business strategies. Our risk management process aims to enable us to pursue our strategy of sustainable growth while ensuring risks to the business are minimised and managed at an appropriate level. It also provides assurance to our shareholders, employees, customers and suppliers.
The Board of Directors has overall responsibility for the establishment and oversight of the Group’s risk management framework. The Group’s risk management policies are established to identify and analyse the risks faced by the Group, to set appropriate risk limits and controls and to monitor risks and adherence to limits. Risk management policies are reviewed regularly to reflect changes in market conditions and the Group’s activities.
The Group, through its training and management standards and procedures, aims to develop a disciplined and constructive control environment in which all employees understand their roles and obligations.
The Group’s Audit Committee oversees how management monitors compliance with the Group’s risk management policies and procedures and reviews the adequacy of the risk management framework in relation to the risks faced by the Group. Internal Audit assists the Group’s Audit Committee in its oversight role. Internal Audit undertakes both regular and ad hoc reviews of risk management controls and procedures, the results of which are reported to the Audit Committee.
Below we describe the key risks that could have a material adverse effect on our business, our financial and operational performance and, as a result, could impact our share price and our reputation. Additional risks not known to us, or those risks that we currently consider immaterial, may also impair our business operations.
We do not expect to incur any risks that may jeopardise the continuity of our business.
Principal Risks
Strategic Risks
Name of Risk Definition and Potential Impact Mitigating Actions
Economic outlook Our business is affected by uncertainties associated with changing economic conditions, particularly in the current environment of global economic instability. Therefore we may face reduced customer demand as the income and purchasing power of our customers decreases under the impact of the weaker macroeconomic environment exacerbated by declining oil prices and sustained ruble volatility.
We closely monitor the changes in the macroeconomic environment, income levels, consumer confidence index and other indicators. Therefore, if significant unfavourable developments occur, we are ready to take corrective steps and adjust our business model. During 2015, we reduced prices in our O’KEY stores to respond to the declining purchasing power of our customers and invested in the roll-out of discounter stores.
Competition risk The retail sector in Russia is highly competitive. We face strong competition from other retailers (Russian and international), some of which are larger and have greater resources. Retail chains compete mainly for store locations, product assortment, price, service and store conditions. Some competitors might be more effective and faster in capturing certain market opportunities, which in turn may negatively impact our market share and our ability to achieve our performance and expansion targets.
We maintain and further develop our key differentiators that create loyalty and lend uniqueness to our offering.
We constantly monitor our customers’ perception of O’KEY and our main competitors to ensure we can respond appropriately. Our pricing policy, based on the price- matching concept, aims to guarantee the competitiveness of the core assortment.
Political risk Political developments may adversely impact the macroeconomic environment and the market in which our Company operates. Although political stability in Russia has improved, Russia is still a state whose political, economic and financial systems are rapidly developing and changing.
Although these risks are outside the control of the Group, O’KEY monitors political developments closely and maintains strong relationships with various national industry bodies.
Regulatory risk Our operations are subject to various government regulations and industry-specific legislation with respect to quality, packaging, health and safety, labelling, distribution and other standards. Some regulations are still being developed in Russia. Current and future government regulations or changes thereto may require us to change the way we run our operations and could result in cost increases. Failure to comply with regulations can also lead to reputational damage.
We aim to ensure compliance with all applicable regulations by monitoring regulatory developments and changes, and following up and responding to changes in regulations and standards in a timely manner.
We participate in the regulatory development of Russian retail through The Retail Companies Association (‘ACORT’).
Monitoring results in a timely update of relevant internal policies/bylaws and, consequently, the Group’s business processes.

26 27O’KEY Group S.A. Annual Report & Accounts 2015 O’KEY Group S.A. Annual Report & Accounts 2015
Governance
Financial Statements
Strategic Report
Overview
Strategic Report
Board of Directors
Our current Board of Directors was elected at the Extraordinary General Meeting (‘EGM’) of Shareholders held on 13 October 2015.
Members of the Board of Directors of O’KEY Group S.A., as at 31 December 2015:
Heigo KeraChairman of the Board and Chief Executive Officer
Heigo was elected as a Member of the Group’s Board of Directors on 30 June 2010, with effect from 13 July 2010, re-elected on 28 October 2013 and 13 October 2015, effective from the same date. He is a Member of the Audit Committee and Chair of the Remuneration Committee.
Heigo was appointed Chief Executive Officer of the O’KEY Group effective 1 May 2015. He was with the Group from the very beginning, and was first employed by the O’KEY Group to provide consultation on the development of a hypermarket format concept in Russia from 1998 until 2002. Heigo has been the owner and, since 2008, a Member of the Board of Directors of Silverko Consult OU, an Estonian consulting Group with an international client base. From 2008, he has worked as Retail Projects Manager with HT Project Management OU, where he was responsible for launching a gourmet supermarket in Ukraine. Prior to that, from 2002 until 2008, he provided private consulting services, including research on retail markets in Belarus, Kazakhstan and China. Heigo is a graduate of the Tallinn Technical University (Estonia) and holds a degree in economics.
Dmitrii TroitskiiDirector
Dmitrii was elected as a Member of the Group’s Board of Directors on 30 June 2010, with effect from 13 July 2010; he was re-elected on 28 October 2013 and 13 October 2015, effective from the same date. He is a Member of the Remuneration Committee.
From 2005 until 2007, Dmitrii served as a Member of the Board of Directors of the Ochakovo Dairy Plant. He also serves as a Member of the Supervisory Board of Bank Saint Petersburg, a position he has held since December 2005, and as Development Director of Neva-Rus, a position he has held since 2005. He graduated from Leningrad Shipbuilding Institute, currently known as the State Marine Technical University of St. Petersburg, and holds a degree in engineering. Dmitrii indirectly owns approximately 23.49% of the shares of O’KEY Group S.A.
Dmitry KorzhevDirector
Dmitry was elected as a Member of the Group’s Board of Directors on 30 June 2010, with effect from 13 July 2010, re-elected on 28 October 2013 and 13 October 2015, effective from the same date. He is a Member of the Audit Committee.
From 2005 until April 2010, Dmitry served as a Member of the Supervisory Board of Bank Saint Petersburg. He graduated from Leningrad Shipbuilding Institute, currently known as the State Marine Technical University of St. Petersburg, and holds a degree in engineering. Dmitry indirectly owns approximately 23.49% of the shares of O’KEY Group S.A.
Boris VolchekDirector
Boris was elected as a Member of the Group’s Board of Directors on 30 June 2010, with effect from 13 July 2010, re-elected on 28 October 2013 and 13 October 2015, effective from the same date. He is a Member of the Audit and Remuneration Committee.
Boris has also served as President of the Union Group of companies since 1995. In addition, since 2000, he has served as General Director of St. Petersburg Automobile Museum. He graduated from the Leningrad Institute of Railway Engineers, currently known as the St. Petersburg State University of Communications, and holds a degree in engineering. Boris indirectly owns 25.001% of the shares of O’KEY Group S.A.
Mykola BuinyckyiIndependent Director
Mykola was elected as a Member of the Group’s Board of Directors on 13 October 2015. He served on the Board in 2010-2013. In October 2013, he stepped down from the Board of Directors, although he continued to serve as chair of the Audit Committee.
His experience includes over 35 years in international financial management and over 20 years of experience in Russia. Prior to working in Russia, he worked for seven years as a management consultant with Coopers & Lybrand. Prior to that, he worked for several years in senior financial management positions in oil support services, construction, IT and retail sectors. In addition, he has experience in corporate finance including investment appraisals, raising funds on public and private equity and debt markets, as well as dealing with international financial institutions, banks and ratings agencies. He is a graduate of Edinburgh University in the UK and is also a fellow of the Chartered Institute of Management Accountants and a Member of the Institute of British Management. He holds joint diploma in management accounting.
FINANCIAL RISKS
Name of Risk Definition and Potential Impact Mitigating Actions
Providing sufficient level of financing
Recent changes in the macroeconomic situation might result in a liquidity squeeze and tightening of lending policies by Russian banks. Given the expansion programme in the coming periods, issues with availability of external financing or significant changes in its cost can negatively impact our Group’s ability to execute its expansion program.
We maintain available lines of credit to close potential liquidity gaps.
We diversify and enlarge the list of partnering banks to increase our control over the availability and cost of financing. Our securities are listed on the London Stock Exchange that allows us to utilise secondary placement of shares as an alternative way of financing.
Tax regulations Russian tax law has complex tax rules, which may be interpreted in different ways and tax rules are subject to frequent changes. Examinations by tax authorities and changes in tax regulations could adversely affect our business and financial and operational performance.
Changes in tax law could result in higher tax expense and payments. Furthermore, legislative changes could materially impact tax receivables and liabilities as well as deferred tax assets and deferred tax liabilities.
Our tax and legal specialists review compliance with applicable tax regulations, current interpretations issued by the authorities and judicial precedents resulting from tax disputes. This work is conducted on a regular basis and in a consistent manner and ensures we are aware of any changes we may need to enforce.
Changes in working capital Inability to control and manage elements of the working capital can result in negative changes for the operating cash flow and lead to liquidity gaps and excessive reliance on external financing.
We exercise constant control over the working capital, which is detailed in our monetary policy. The aim of this policy is to minimise prepayment balances and control of overdue receivables.
We are also taking steps to improve stock management efficiency by establishing and monitoring KPIs and organising training sessions for store employees.
Risks of currency and interest rates volatility
We are exposed to fluctuations in exchange rates because of loans received in USD and contractual obligations in USD and EUR. Although measures are taken to minimise this risk, there can be no assurance that exchange rate and interest rate fluctuations will not negatively influence our results.
Certain interest rate risks are hedged using derivative financial instruments. Interest rate risks are also managed by borrowing money at both variable and fixed interest rates
Risk of misstatements in financial statements
We face exposure to risks relating to failures in proper financial reporting and the classification of accounting entries, and risks of making inaccurate accounting estimates.
We regularly test internal controls over financial reporting to prevent misstatements in financial statements. We have a qualified team of finance professionals preparing our financial statements and we are currently implementing a new accounting system that will help us improve automation during the preparation of our consolidated IFRS financial statements. For a description of financial risks and exposure calculation please refer to the note 27 in the Group Consolidated Financial Statements.
Risk Management continued

28 29O’KEY Group S.A. Annual Report & Accounts 2015 O’KEY Group S.A. Annual Report & Accounts 2015
Governance
Financial Statements
Strategic Report
Overview
Governance
Pavel TomanekSales Director
Pavel joined O’KEY Group in 2015 as Sales Director for the Northwest and Southern regions. In February 2016, after the reporting period, he became Sales Director for all regions, responsible for developing and implementing Group strategy designed to strengthen O’KEY’s market leadership, in particular the operational management of stores. His work is focused on growing store traffic, the development and implementation of innovative retail solutions, increasing trade turnover and EBITDA and creating and maintaining strong regional management teams.
Pavel has extensive retail experience and worked for 15 years at leading international retail chains. Before joining O’KEY, he worked for three years at X5 Retail Group. Previously, he was responsible for operations and logistics at Lenta and was a regional director for Tesco in Czech Republic. Pavel graduated from Masaryk University in Brno, Czech Republic, with a degree in clinical psychology.
Marc LeblondSupply Chain Director
Marc was appointed as Supply Chain Director in 2014 to achieve a step-change in our supply chain infrastructure and ensure the success of this transformation.
Previously, Marc served as Supply Chain Director for X5 Retail Group. Prior to this, he worked as IT & Supply Chain Director for Orangina Schweppes. As a seasoned logistics professional with more than four decades of expertise, he has also worked at such companies as Galeries Lafayette, Carrefour and Lactalis.
Marc holds a degree in Transport and Logistics from Val de Marne University, Paris, as well as professional development diplomas in Finance and Accounting.
Peter RachovidesTrade Development Director
Peter joined as Trade Development Director in September 2015, and he heads a team responsible for developing the marketing strategy, implementing trade concept in the Group’s stores and developing concepts for growing traffic, increasing sales volumes, raising profits and improving the overall operational efficiency of the business. He also oversees assortment management and price formation, as well as analysis of sales and consumer demand.
Peter has more than 20 years of experience in the retail sector. Prior to joining O’KEY, he worked for ten years in various senior management positions at Tesco, the largest retailer in the UK. Prior to this, he was in charge of space range planning at Safeway Stores in the UK.
Elena PolozovaHuman Resources Director
Elena has headed the Human Resources (‘HR’) Department for O’KEY Group since September 2015. She joined O’KEY in January 2013 and over the following two years served in HR management positions the Group’s Sales Department. In her position, she oversees the Group’s centralised HR function, which sets the strategy for developing the Group’s human capital, as well as introducing best practices in HR for increasing employee productivity.
Elena is a highly experienced specialist with more than a decade of experience in HR. Before joining O’KEY, she was an HR business partner at Magnit, overseeing the efficiency of its HR processes. She graduated from the Department of Business and Management of Lipetsk State Technical University with a degree in psychology. She also obtained an MBA, with a specialisation in HR, from Moscow International Higher School of Business (‘MIRBUS’).
Senior Management
One of O’KEY Group’s key competitive advantages is the strength and experience of its international management team. This group of professionals brings to the table deep knowledge of the Russian marketplace combined with international best practices. The team was further strengthened through the recruitment of selected senior managers in 2015.
Heigo KeraChairman of the Board and Chief Executive Officer
Heigo was appointed Chief Executive Officer (‘CEO’) effective 1 May 2015. He was with the Group from the very beginning, and was first employed by O’KEY Group to provide consultation on the development of a hypermarket format concept in Russia from 1998 until 2002. He was elected as Member of the Group’s Board of Directors in 2010 and became Chairman of the Board of Directors in October 2015.
Heigo has been the owner and, since 2008, a Member of the Board of Directors of Silverko Consult OU, an Estonian consulting Group with an international client base. Also since 2008, he has additionally worked as Retail Projects Manager with HT Project Management OU, where he was responsible for launching a gourmet supermarket in Ukraine. Prior to that, from 2002 until 2008, he provided private consulting services, including research on retail markets in Belarus, Kazakhstan and China. Heigo is a graduate of the Tallinn Technical University (Estonia) and holds a degree in economics.
Armin BurgerChief Executive Officer of Fresh Market LLC
In October 2013, Armin was appointed Chief Executive Officer (‘CEO’) of Fresh Market LLC, the operating company for the Group’s ‘DA!’ discounter stores, where he oversaw the successful launch of the format in September 2015. In his current role he oversees all aspects of the development of the discounter format, including operations, the management of real estate, buying, information technology, human resources, marketing, public and investor relations.
Prior to joining O’KEY, Armin worked in a variety of senior management roles in leading European retail groups. From 2012 to 2013, he was CEO and Member of the Supervisory Board of Prakitker AG, where he managed the company’s restructuring process. In April 2011, he founded Vienna Estate SE, an Austrian real-estate developer, and from February 2011 to June 2012, he headed the Supervisory Board of Vivatis AG, in Austria. Previously, he spent nearly two decades in progressively senior roles at Aldi in Germany and in the UK and Hofer KG, in Austria. Armin has a graduate degree in economics from the University of Freiburg, Germany.
Dmitry PryanikovChief Financial Officer
Dmitry has been with the Group since its founding in June 2001. Having served as Chief Financial Officer (‘CFO’) of O’KEY Trading Company for several years, he became Group CFO.
In his role, Dmitry manages such business streams as accounting, liquidity management, financial control, internal audit and control, project management, insurance, business processes, corporate reporting, and planning and control. Dmitry’s leadership of our finance team was instrumental in making possible our successful initial public offering (‘IPO’) on the London Stock Exchange in November 2010.
Prior to joining O’KEY, Dmitry held various positions at Bank of Saint Petersburg and other private companies from 1995 to 2001.
Dmitry holds a degree in Economics and Management from St. Petersburg State Technical University.
Angelo TuratiCommercial Director
Angelo joined the Group in 2014 as Commercial Director and Member of the Management Board.
In his position, Angelo develops and executes the commercial strategy as part of the global corporate strategy, builds on category management capabilities for both hypermarkets and supermarkets, drives the Group’s buying agenda as part of category management initiatives, manages the private-label business and its profitability, as well as designs, enhances and implements uniform standards and technology in order to achieve maximum commercial efficiency.
Angelo previously served as Commercial Director for X5 Retail Group. Prior to this, he worked as Managing Director for Metro Cash & Carry Croatia and Vice President of Metro Cash & Carry International.
Angelo holds a degree in Business Economics (Trade Marketing & Retail, Management) from Bocconi University as well as professional development diplomas (Logistics, and Retail) from the European Social Fund and London Business School.

30 31O’KEY Group S.A. Annual Report & Accounts 2015 O’KEY Group S.A. Annual Report & Accounts 2015
Governance
Financial Statements
Strategic Report
Overview
Governance
Board CommitteesThere are two committees on the Board of Directors, the Audit Committee and the Remuneration Committee. The Board’s committees conduct an initial review and discussion of the issues for which they are responsible, before making recommendations to the full Board of Directors.
The composition and the key responsibilities of the Board’s committees are described below:
Audit CommitteeMembership:
Mykola Buinyckyi (Chairman, non-Director)Boris Volchek (Member, Director)Dmitry Korzhev (Member, Director)Heigo Kera (Member, Director)Ilya Ilin (Member, non-Director)Alvidas Brusokas (Member, non-Director)
Description: The Audit Committee is responsible for overseeing the integrity of the Group’s financial statements, including periodically reporting to the full Board of Directors on its activities and on the adequacy of internal control systems over financial reporting.
The committee also makes recommendations regarding the appointment, compensation, retention and supervision of the external auditors, and monitors their independence. The committee performs such other duties as are imposed by applicable laws and regulations of the regulated market or markets on which the Group’s shares or global depositary receipts may be listed, as well as any other duties entrusted to it by the Board of Directors. The ultimate responsibility for preparing the annual report and accounts and the half-yearly reports remains with the full Board of Directors.
The Independent Director Mykola Buinyckyi remains the Chair of the Audit Committee. Mykola’s qualifications and extensive experience in international financial management with major companies in Moscow, London, Paris, Brussels, Prague, Vilnius and Lagos is extremely valuable and we believe his membership of the Audit Committee will continue to benefit the Group.
Remuneration CommitteeMembership:
Heigo Kera (Chairman, Director)Boris Volchek (Member, Director)Dmitrii Troitskii (Member, Director)Alvidas Brusokas (Member, non-Director)Ilya Ilin (Member, non-Director)
Description: The responsibilities of the remuneration committee include reviewing compensation policy, making proposals to the full Board of Directors regarding the remuneration of Executive Directors and management, and advising on any benefit or incentive schemes. The Board of Directors determines the remuneration and any bonuses paid to the Chief Executive Officer of O’KEY Group.
Board of Directors and Management RemunerationIn 2015, key management personnel of O’KEY Group were paid an aggregate amount of RUB 683,060 thousand in remuneration and other compensation. Members of the Board of Directors of O’KEY Group S.A. and the Audit Committee of O’KEY Group S.A. were paid a net fee of US$241,998. No more than US$800,000 is to be paid per year in compensation to the entire Board and other senior officers of O’KEY Group S.A.
DividendsIn 2015, O’KEY Group paid a total of US$24 million in dividends.
Corporate Governance
Governance SystemO’KEY Group S.A. is company incorporated under the Laws of Grand Duchy of Luxembourg with Global Depositary Receipts (‘GDRs’) listed on the London Stock Exchange, and as such is not required to comply with UK Corporate Governance Code. O’KEY Group is committed to managing and conducting its operations in accordance with applicable regulations of Luxembourg and London Stock Exchange We recognise our obligation to our shareholders to adopt appropriate standards of governance and control both at Board level and within our management teams and aim to establish and support a corporate governance framework that is necessary for development of our business and meets the requirements of our shareholders.
Key elements of O’KEY Group’s corporate governance policy include:
– Appointing individuals with relevant skills and experience to our Board of Directors who occupy key positions and participate fully in the most senior level of management in the Group (see page 27 for further information on the members of our Board of Directors).
– The Board is responsible for taking key decisions relating to Group strategy and strategic direction. – The Board exercises oversight of the Group’s internal control and risk management procedures. – The Group has in place a system of Board Committees, which ensures due consideration of key decisions by experienced
individuals and provides an appropriate system of checks and balances, including in the areas of remuneration and incentives (further information on the committees, their functions and their membership can be found below).
Composition of the Board of DirectorsThere are five members of our Board, including one independent Director. The General Meeting of Shareholders appoints Board members by a simple majority of votes cast, for a period not exceeding six years or until their successors are elected.
During the reporting period, on 29 April 2015, Heigo Kera was appointed the Chief Executive – at this point he was no longer considered independent. On 13 October 2015 the General Meeting of Shareholders of O’KEY Group S.A. has re-elected the Board of Directors, and Mykola Buinyckyi was appointed independent Director in place of Tony Maher, who decided to step down from his position as a Chairman and a Member of the Board.
Following the re-election of the Board of Directors, on 14 October 2015, Heigo Kera was re-elected as a Chairman of the Board – a position he held until October 2013.
As at 31 December 2015, the Board of Directors consisted of five members, including one Independent Director.
Name Office Date of appointment
Mr. Heigo Kera Chairman 13 October 2015 Mr. Dmitrii Troitskii Director 13 October 2015 Mr. Dmitry Korzhev Director 13 October 2015 Mr. Boris Volchek Caraden Director 13 October 2015 Mr. Mykola Buinyckyi Independent Director 13 October 2015
The rules governing the appointment and replacement of the Directors and the amendment of the Articles are set out under the law of 10 August 1915 on commercial companies, as amended, and the Articles (in particular Articles 8, 15 and 16).
The consolidated version of the Articles is published under the Shareholders section on http://okeyinvestors.ru/shareholder/documents/.
Powers of the BoardThe Board is vested with the broadest powers to manage the business of the Company and to authorise and perform all acts of disposal and administration falling within the purposes of the Company.
The Board is not authorised to issue or buy back shares. The validity period of the authorised un-issued share capital expired on 10 December 2010 and the relevant provisions were crossed out from the new edition of the Articles as approved by the General Meeting of the Shareholders held on 10 June 2015. The repurchase by the Company of its own shares is subject to the conditions set out in the Company Law and the Articles.

32 33O’KEY Group S.A. Annual Report & Accounts 2015 O’KEY Group S.A. Annual Report & Accounts 2015
Governance
Financial Statements
Strategic Report
Overview
Governance
Transfer Restrictions As of 31 December 2015 and the date hereof, to the knowledge of the Company, all the shares in issue in the Company are freely transferable, provided that the transfer formalities set out under Article 6 of the Articles are fulfilled.
The Company has no information about any agreements between shareholders which may result in restrictions on the transfer of securities or voting rights, as mentioned under Article 11 (1) (g) of the Directive 2004/25/EC of the European Parliament and of the Council of 21 April 2004 on takeover bids.
Special Control RightsAll the issued and outstanding shares of the Company have equal voting rights and there are no special control rights attaching to shares of the Company.
The Caraden Shareholder (as defined in the Articles) has, under the condition of holding a minimum amount of shares in the Company, a specific right with respect to the appointment and removal of Directors since at least one Director (designated as the Caraden Director) must be appointed from a list of candidates proposed from the Caraden Shareholder and may be removed at the initiative of the Caraden Shareholder (additional information may be found under Article 8 of the Articles).
The positive vote of the Caraden Shareholder is required, under certain conditions, to amend the provisions of the Articles relating to: (i) the rights and prerogatives of the Caraden Shareholder; and (ii) the appointment, removal, replacement, rights, prerogatives and positive vote of the Caraden Director (additional information may be found under Article 16.4 of the Articles).
Voting RightsEach share issued and outstanding in the Company bears one vote.
The Articles do not provide for any voting restrictions.
In accordance with the Articles, a record date for the admission to a general meeting may be set by the Board (Article 15 of the Articles). Only those Shareholders as shall be shareholders of record on any such record date shall be entitled to notice of and to vote at any general meeting and any adjournment thereof, or to give any such consent, as the case may be.
In accordance with the Articles, the Board may determine such other conditions that must be fulfilled by Shareholders for them to take part in any meeting of shareholders in person or by proxy (Article 15 of the Articles).
Appointment of the Directors, Amendment of the ArticlesThe rules governing the appointment and replacement of the directors and the amendment of the Articles are set out under the Company Law and the Articles (in particular Articles 8, 15 and 16).
The consolidated version of the Articles is published under the Shareholders section on http://www.okmarket.ru/en/investors/shareholder_documents.
Significant Agreements or Essential Business ContractsThe Board is not aware of any significant agreements to which the Company is a party and which take effect, alter or terminate upon a change of control of the Company following a takeover bid.
The Board has considered essential business contracts and concluded that there is none.
Agreements with Directors and EmployeesAs of the date hereof, no agreements between the Company and its Directors or employees exist that provide for compensation if the Directors or the employees resign or are made redundant without valid reason or if their employment ceases because of a takeover bid.
Footnote: for the purposes of Luxembourg law sections 1 through 33 of this Annual report shall be considered the consolidated director’s report for the year ended 31 December 2015.
Ownership and Shareholder Structure
Legal and Ownership Structure (as of 1 March 2016)
38.171%BoNY (Nominees)
(of them Freefloat – 24.047%)
23.020%GSU Ltd
(together with GDRs – 25.001%)
38.809%NISEMAX Co Ltd
(together with GDRs – 50.952%)
O’KEY Group S.A. (Luxembourg)
Dorinda JSCO’KEY LLC
– Retail operations – Employer of all store
personnel
O’KEY Group LLC
– Employer for senior management
– Management company for Dorinda JSC and O’KEY LLC
– Owner of real estate and long-term lease rights
O’KEY Logistics LLC Fresh Market LLC
– Import operations – Supplier of non-food products,
non-branded and private- label goods
– Employer for personnel and owner and operator of a new retail chain under ‘DA!’ trademark

34 35O’KEY Group S.A. Annual Report & Accounts 2015 O’KEY Group S.A. Annual Report & Accounts 2015
Governance
Financial Statements
Strategic Report
Overview
Governance
We confirm, to the best of our knowledge, that the consolidated financial statements which have been prepared in accordance with the International Financial Reporting Standards as adopted by the European Union, give a true and fair view of the assets, liabilities, financial position and profit or loss of O’KEY Group S.A. and the undertakings included in the consolidation taken as a whole, and that the consolidated Directors’ report includes a fair review of the development and performance of the business and the position of O’KEY Group S.A. and the undertakings included in the consolidation taken as a whole, together with a description of the principal risks and uncertainties they face.
Luxembourg, 8 March 2016
Member of the Board of Directors Member of the Board of Directors
Heigo Kera Dmitry PryanikovChairman/CEO Financial Director
Management & Directors Responsibility Statement Report of the Réviseur d’Entreprises Agréé
KPMG Luxembourg, Société coopérative Tel: +352 22 51 51 139, Avenue John F. Kennedy Fax: +352 22 51 71L-1855 Luxembourg Email: [email protected] Internet: www.kpmg.lu
To the Shareholders ofO’KEY GROUP S.A.23, rue BeaumontL-1219 Luxembourg
Report on the consolidated financial statementsWe have audited the accompanying consolidated financial statements of O’KEY GROUP S.A., which comprise the consolidated statement of financial position as at December 31, 2015, the consolidated statements of profit or loss and other comprehensive income, changes in equity and cash flows for the year then ended, and a summary of significant accounting policies and other explanatory information.
Board of Directors’ responsibility for the consolidated financial statementsThe Board of Directors is responsible for the preparation and fair presentation of these consolidated financial statements in accordance with International Financial Reporting Standards as adopted by the European Union, and for such internal control as the Board of Directors determines is necessary to enable the preparation of consolidated financial statements that are free from material misstatement, whether due to fraud or error.
Responsibility of the Réviseur d’Entreprises agrééOur responsibility is to express an opinion on these consolidated financial statements based on our audit. We conducted our audit in accordance with International Standards on Auditing as adopted for Luxembourg by the Commission de Surveillance du Secteur Financier. Those standards require that we comply with ethical requirements and plan and perform the audit to obtain reasonable assurance about whether the consolidated financial statements are free from material misstatement.
An audit involves performing procedures to obtain audit evidence about the amounts and disclosures in the consolidated financial statements. The procedures selected depend on the judgement of the Réviseur d’Entreprises agréé, including the assessment of the risks of material misstatement of the consolidated financial statements, whether due to fraud or error. In making those risk assessments, the Réviseur d’Entreprises agréé considers internal control relevant to the entity’s preparation and fair presentation of the consolidated financial statements in order to design audit procedures that are appropriate in the circumstances, but not for the purpose of expressing an opinion on the effectiveness of the entity’s internal control. An audit also includes evaluating the appropriateness of accounting policies used and the reasonableness of accounting estimates made by the Board of Directors, as well as evaluating the overall presentation of the consolidated financial statements.
We believe that the audit evidence we have obtained is sufficient and appropriate to provide a basis for our audit opinion.
OpinionIn our opinion, the consolidated financial statements give a true and fair view of the consolidated financial position of O’KEY GROUP S.A. as of December 31, 2015, and of its consolidated financial performance and its consolidated cash flows for the year then ended in accordance with International Financial Reporting Standards as adopted by the European Union.
Report on other legal and regulatory requirementsThe consolidated Directors’report, including the corporate governance statement, which is the responsibility of the Board of Directors, is consistent with the consolidated financial statements and includes the information required by the law with respect to the Corporate Governance Statement.
Luxembourg, 8 March 2016 KPMG Luxembourg, Société coopérativeCabinet de révision agréé
Jean-Manuel Séris

36 37O’KEY Group S.A. Annual Report & Accounts 2015 O’KEY Group S.A. Annual Report & Accounts 2015
Governance
Financial Statements
Strategic Report
Overview
Governance
’000 RUB Note 2015 2014
Revenue 8 162,510,392 151,983,180Cost of goods sold (124,143,425) (114,778,593)
Gross profit 38,366,967 37,204,587General, selling and administrative expenses 9 (32,371,077) (29,117,399)Other operating income and expenses 10 (148,353) 478,362
Operating profit 5,847,537 8,565,550
Finance income 12 81,691 24,197Finance costs 12 (3,413,258) (1,587,734)Foreign exchange loss 13 (614,562) (687,529)
Profit before income tax 1,901,408 6,314,484Income tax benefit/(expense) 14 16,299 (1,088,765)
Profit for the year 1,917,707 5,225,719
Other comprehensive incomeItems that will never be reclassified to profit or lossExchange differences on translating to presentation currency 266,887 392,973Items that are or may be reclassified subsequently to profit or lossChange in fair value of hedges and reclassification from hedging reserve 12 (308,749) 135,159Income tax on other comprehensive income 12,14 61,750 (27,032)
Other comprehensive income for the year, net of income tax 19,888 501,100
Total comprehensive income for the year 1,937,595 5,726,819
Earnings per shareBasic and diluted earnings per share (RUB) 24 7.1 19.4
The consolidated statement of profit or loss and other comprehensive income is to be read in conjunction with the notes to, and forming part of, the consolidated financial statements set out on pages 40 to 74.
Consolidated Statement of Financial Position as at 31 December 2015
’000 RUB Note 2015 2014
ASSETSNon-current assetsInvestment property 17 564,000 548,500Property, plant and equipment 15 43,088,062 40,006,546Construction in progress 15 6,694,671 7,180,792Intangible assets 16 1,293,723 539,435Deferred tax assets 19 654,512 1 ,144,855Other non-current assets 18 6,934,782 11,004,304
Total non-current assets 59,229,750 60,424,432
Current assetsInventories 20 12,628,304 12,859,297Trade and other receivables 21 6,937,346 6,207,273Prepayments 1,515,881 1,277,663Cash and cash equivalents 22 9,768,130 5,810,182
Total current assets 30,849,661 26,154,415
Total assets 90,079,411 86,578,847
EQUITY AND LIABILITIESEquity 23 24,490,967 24,197,143Non-current liabilitiesLoans and borrowings 25 23,558,269 19,655,016Deferred tax liabilities 19 826,874 835,550Other non-current liabilities 99,352 78,044
Total non-current liabilities 24,484,495 20,568,610
Current liabilitiesLoans and borrowings 25 11,999,730 12,425,527Trade and other payables 26 28,817,333 29,098,249Current income tax payable 286,886 289,318
Total current liabilities 41,103,949 41,813,094
Total liabilities 65,588,444 62,381,704
Total equity and liabilities 90,079,411 86,578,847
The consolidated statement of profit or loss and other comprehensive income is to be read in conjunction with the notes to, and forming part of, the consolidated financial statements set out on pages 40 to 74.
Consolidated Statement of Profit or Loss and Other Comprehensive Incomefor the year ended 31 December 2015

38 39O’KEY Group S.A. Annual Report & Accounts 2015 O’KEY Group S.A. Annual Report & Accounts 2015
Governance
Financial Statements
Strategic Report
Overview
Financial Statements
’000 RUB NoteShare
capitalLegal
reserveAdditional
paid-in capitalHedging reserve
Retained earnings
Translation reserve
Total equity
Balance at 1 January 2014 119,440 10,597 8,903,606 – 12,187,055 178,687 21,399,385
Total comprehensive income for the year
Profit for the year – – – – 5,225,719 – 5,225,719
Other comprehensive incomeForeign currency translation
differences – – – – – 392,973 392,973Change in fair value of hedges and
reclassification from hedging reserve 12 – – – 135,159 – – 135,159
Income tax on other comprehensive income 14 – – – (27,032) – – (27,032)
Total other comprehensive income – – – 108,127 – 392,973 501,100
Total comprehensive income for the year – – – 108,127 5,225,719 392,973 5,726,819
Transactions with owners, recorded directly in equity
Contributions by and distributions to owners
Dividends paid 23 – – – – (2,929,061) – (2,929,061)
Total contributions by and distributions to owners – – – – (2,929,061) – (2,929,061)
Balance at 31 December 2014 119,440 10,597 8,903,606 108,127 14,483,713 571,660 24,197,143
The consolidated statement of changes in equity is to be read in conjunction with the notes to, and forming part of, the consolidated financial statements set out on pages 40 to 74.
Consolidated Statement of Changes in Equity for the year ended 31 December 2015
’000 RUB NoteShare
capitalLegal
reserveAdditional
paid-in capitalHedging reserve
Retained earnings
Translation reserve
Total equity
Balance at 1 January 2015 119,440 10,597 8,903,606 108,127 14,483,713 571,660 24,197,143
Total comprehensive income for the year
Profit for the year – – – – 1,917,707 1,917,707
Other comprehensive incomeForeign currency translation
differences – – – – – 266,887 266,887Change in fair value of hedges and
reclassification from hedging reserve 12 – – – (308,749) – – (308,749)
Income tax on other comprehensive income 14 – – – 61,750 – – 61,750
Total other comprehensive income – – – (246,999) – 266,887 19,888
Total comprehensive income for the year – – – (246,999) 1,917,707 266,887 1,937,595
Transactions with owners, recorded directly in equity
Contributions by and distributions to owners
Dividends paid 23 – – – – (1,643 771) – (1,643 771)
Total contributions by and distributions to owners – – – – (1,643 771) – (1,643 771)
Balance at 31 December 2015 119,440 10,597 8,903,606 (138,872) 14,757,649 838,547 24,490,967
The consolidated statement of changes in equity is to be read in conjunction with the notes to, and forming part of, the consolidated financial statements set out on pages 40 to 74.

40 41O’KEY Group S.A. Annual Report & Accounts 2015 O’KEY Group S.A. Annual Report & Accounts 2015
Governance
Financial Statements
Strategic Report
Overview
Financial Statements
’000 RUB Note 2015 2014
35 Restated
Cash flows from operating activities
Cash receipts from customers 185,480,172 173,675,975Other cash receipts 381,666 187,512Interest received 49,708 13,678Cash paid to suppliers and employees (175,156,270) (159,017,273)Operating taxes (681,509) (583,609)Other cash payments (205,326) (137,106)VAT paid (762,978) (2,898,021)Income tax paid 34,651 (1,863,368)
Net cash from operating activities 9,140,114 9,377,788
Cash flows from investing activitiesPurchase of property, plant and equipment and initial cost of land lease (excluding VAT) (8,348,734) (16,095,340)Purchase of other intangible assets (excluding VAT) (272,017) (204,896)Proceeds from sales of property, plant and equipment and intangible assets (excluding VAT) 6,289,003 13,292
Net cash used in investing activities (2,331,748) (16,286,944)
Cash flows from financing activitiesProceeds from loans and borrowings 18,002,000 16,974,749Repayment of loans and borrowings (14,911,105) (2,139,482)Interest paid (4,303,410) (2,353,426)Dividends paid (1,643,771) (2,929,061)Other financial (payments)/proceeds (28,205) 30,516
Net cash (used in)/from financing activities (2,884,491) 9,583,296
Net increase in cash and cash equivalents 3,923,875 2,674,140Cash and cash equivalents at beginning of the period 5,810,182 3,006,730Effect of exchange rate fluctuations on cash and cash equivalents 34,073 129,312
Cash and cash equivalents at end of the year 9,768,130 5,810,182
The consolidated statement of cash flows is to be read in conjunction with the notes to, and forming part of, the consolidated financial statements set out on pages 40 to 74.
Consolidated Statement of Cash Flows for the year ended 31 December 2015
1 Reporting entity(a) Organisation and operationsThese consolidated financial statements have been prepared in accordance with International Financial Reporting Standards (‘IFRSs’) as adopted by the European Union for the year ended 31 December 2015 for O’KEY Group S.A. and its subsidiaries (together referred to as the ‘Group’).
The Company was incorporated and is domiciled in Luxembourg. The Company was set up in accordance with Luxembourg regulations. The main part of the Group is located and conducts its business in the Russian Federation.
The major shareholders of the Group are three individuals, Mr. Korzhev, Mr. Troitsky and Mr. Volchek (‘the shareholder Group’). They also have a number of other business interests outside of the Group.
As at 31 December 2015 the Company’s shares are listed on the London Stock Exchange in the form of Global Depositary Receipts (GDRs).
Related party transactions are detailed in note 31.
The Company’s registered address is: Luxembourg 23, rue Beaumont, L-1219 Luxembourg.
The Group’s principal business activity is the operation of a retail chain in Russia under the brand name ‘O’KEY’. In September 2015 the Group launched the discounter chain under the brand name ‘DA!’. At 31 December 2015 the Group operated 146 stores including 35 discounter stores (31 December 2014: 108 stores) in major Russian cities, including but not limited to Moscow, St. Petersburg, Murmansk, Nizhniy Novgorod, Rostov-on-Don, Krasnodar, Lipetsk, Volgograd, Ekaterinburg, Novosibirsk, Krasnoyarsk, Ufa, Astrakhan and Surgut.
(b) Business environmentThe Group’s operations are primarily located in the Russian Federation. Consequently, the Group is exposed to the economic and financial markets of the Russian Federation which display characteristics of an emerging market. The legal, tax and regulatory frameworks continue development, but are subject to varying interpretations and frequent changes which together with other legal and fiscal impediments contribute to the challenges faced by entities operating in the Russian Federation. The imposition of economic sanctions on Russian individuals and legal entities by the European Union, the United States of America, Japan, Canada, Australia and others, as well as retaliatory sanctions imposed by the Russian government, has resulted in increased economic uncertainty including more volatile equity markets, a depreciation of the Russian Rouble, a reduction in both local and foreign direct investment inflows and a significant tightening in the availability of credit. In particular, some Russian entities may be experiencing difficulties in accessing international equity and debt markets and may become increasingly dependent on Russian state banks to finance their operations. The longer-term effects of implemented sanctions, as well as the threat of additional future sanctions, are difficult to determine.
The consolidated financial statements reflect management’s assessment of the impact of the Russian business environment on the operations and the financial position of the Group. The future business environment may differ from management’s assessment.
2 Basis of accounting(a) Statement of complianceThese consolidated financial statements have been prepared in accordance with International Financial Reporting Standards (‘IFRSs’) as adopted by the European Union and were authorised for issue by the Board of Directors on 8 March 2016.
3 Functional and presentation currencyItems included in the financial statements of each of the Group’s entities are measured using the currency of the primary economic environment in which the entity operates (‘the functional currency’). The consolidated financial statements are presented in Russian Roubles. All financial information presented in RUB has been rounded to the nearest thousand, except when otherwise indicated.
Notes to the Consolidated Financial Statements for the year ended 31 December 2015

42 43O’KEY Group S.A. Annual Report & Accounts 2015 O’KEY Group S.A. Annual Report & Accounts 2015
Governance
Financial Statements
Strategic Report
Overview
Financial Statements
The results and financial position of the Group entities, which functional currencies are different from Russian Roubles, are translated into the presentation currency as follows:
– assets and liabilities for each statement of financial position presented are translated at the closing rate of the year end; – profit and loss items for each statement of profit and loss and other comprehensive income are translated at the date of
transaction; – all resulting exchange differences are recognised as translation reserve in equity.
At 31 December 2015 the principal rate of exchange used for translating foreign currency balances were USD 1 = 72.8827 RUB; EUR 1 = 79.6972 RUB (2014: USD 1 = RUB 56.2584; EUR 1 = RUB 68.3427).
4 Use of estimates and judgmentsThe preparation of consolidated financial statements in conformity with IFRSs requires management to make judgments, estimates and assumptions that affect the application of accounting policies and the reported amounts of assets, liabilities, income and expenses. Actual results may differ from those estimates.
Estimates and underlying assumptions are reviewed on an ongoing basis. Revisions to accounting estimates are recognised in the period in which the estimates are revised and in any future periods affected.
Judgments that have the most significant effect on the amounts recognised in the consolidated financial statements and estimates that can cause a significant adjustment to the carrying amount of assets and liabilities within the next financial year include:
Tax legislation. The Group is subject to income taxes in several jurisdictions. Significant judgment is required in determining the provision for income taxes. The major part of the tax burden refers to Russian tax, currency and customs legislation, which is subject to varying interpretations. Refer to note 30.
Bonuses from suppliers. The Group receives various bonuses from suppliers which represent a significant reduction in cost of sales and inventory cost. The calculation of these amounts is in part dependent on an estimation of whether amounts due under agreements with suppliers have been earned at the reporting date based on inventory purchased and other conditions. The process for calculating and recording supplier bonuses involves significant manual processes which are more susceptible to error. Furthermore, the allocation of the bonuses to inventory cost also has some element of judgement.
Determination of net realisable value of inventory. The Group performs analysis of stock for write-off as at each reporting date and writes down inventories to their net realisable value when necessary. For details of approach used for determination of net realisable value refer to note 20.
5 Determination of fair valuesA number of the Group’s accounting policies and disclosures require the determination of fair value, for both financial and non-financial assets and liabilities.
When measuring the fair value of an asset or a liability, the Group uses market observable data as far as possible. Fair values are categorised into different levels in a fair value hierarchy based on the inputs used in the valuation techniques as follows.
– Level 1: quoted prices (unadjusted) in active markets for identical assets or liabilities. – Level 2: inputs other than quoted prices included in Level 1 that are observable for the asset or liability, either directly
(i.e. as prices) or indirectly (i.e. derived from prices). – Level 3: inputs for the asset or liability that are not based on observable market data (unobservable inputs).
If the inputs used to measure the fair value of an asset or a liability might be categorised in different levels of the fair value hierarchy, then the fair value measurement is categorised in its entirety in the same level of the fair value hierarchy as the lowest level input that is significant to the entire measurement.
The Group recognises transfers between levels of the fair value hierarchy at the end of the reporting period during which the change has occurred.
5 Determination of fair values continuedFair values have been determined for measurement and for disclosure purposes based on the following methods. When applicable, further information about the assumptions made in determining fair values is disclosed in the notes specific to that asset or liability.
(a) Investment propertyAn external, independent valuation company, having appropriate recognised professional qualifications and recent experience in the location and category of property being valued, values the Group’s investment property every year. The fair values are based on market values, being the estimated amount for which a property could be exchanged on the date of the valuation between a willing buyer and a willing seller in an arm’s length transaction after proper marketing wherein the parties had each acted knowledgeably and willingly.
In the absence of current prices in an active market, the valuations are prepared by considering the aggregate of the estimated cash flows expected to be received from renting out the property. A yield that reflects the specific risks inherent in the net cash flows then is applied to the net annual cash flows to arrive at the property valuation.
Valuations reflect, when appropriate, the type of tenants actually in occupation or responsible for meeting lease commitments or likely to be in occupation after letting vacant accommodation and the allocation of maintenance and insurance responsibilities between the Group and the lessee.
(b) Non-derivative financial assetsThe fair value of trade and other receivables is estimated as the present value of future cash flows, discounted at the market rate of interest at the reporting date. This fair value is determined for disclosure purposes.
(c) DerivativesThe fair value of interest rate swaps is estimated by discounting estimated future cash flows based on the terms and maturity of each contract and using market interest rates for a similar instrument at the measurement date.
Fair values reflect the credit risk of the instrument and include adjustments to take account of the credit risk of the Group entity and counterparty when appropriate.
(d) Non-derivative financial liabilitiesFair value, which is determined for disclosure purposes, is calculated based on the present value of future principal and interest cash flows, discounted at the market rate of interest at the reporting date. For finance leases the market rate of interest is determined by reference to similar lease agreements.
6 Operating segmentsThe Group is engaged in management of retail stores located in Russia. Although the Group is not exposed to concentration of sales to individual customers, all the Group’s sales are in the Russian Federation. As such, the Group is exposed to the economic development in Russia, including the development of the Russian retail industry. The Group has no significant non-current assets outside the Russian Federation.
The Group identified its operating segments in accordance with the criteria set in IFRS 8 Operating Segments and based on the way the operations of the Group are regularly reviewed by the chief operating decision maker to analyse performance and allocate resources within the Group.
The Group’s chief operating decision maker has been determined as the CEO.
In September 2015 the Group launched discounter chain under brand name ‘DA!’ and since then the Group has two reportable segments. Previously the Group identified retail operations as a single reportable segment. Each new segment has similar format of their stores which is described below:
– O’KEY –chain of modern Western European-style hypermarkets under the ‘O’KEY’ brand reinforced by O’KEY supermarkets throughout Russian Federation;
– ‘DA!’ – chain of discounter stores in Moscow and Central region.
Notes to the Consolidated Financial Statements continuedfor the year ended 31 December 2015

44 45O’KEY Group S.A. Annual Report & Accounts 2015 O’KEY Group S.A. Annual Report & Accounts 2015
Governance
Financial Statements
Strategic Report
Overview
Financial Statements
Notes to the Consolidated Financial Statements continuedfor the year ended 31 December 2015
The assortment of goods in each chain is different, and the segments are managed separately. For each of the segments, the CEO of the Group reviews internal management reports on at least a monthly basis.
Within each reportable segment all business components demonstrate similar characteristics:
– the products and customers; – the business processes are integrated and uniform: the components manage their operations centrally. Purchasing, logistics,
finance, HR and IT functions are centralised; – the components’ activities are mainly limited to Russia which has a uniform regulatory environment.
The CEO assesses the performance of the operating segment based on earnings before interest, tax, depreciation and amortisation (EBITDA) adjusted for one-off items. Term EBITDA is not defined in IFRS. Other information provided to the CEO is measured in a manner consistent with that in the consolidated financial statements. The accounting policies used for the segment are the same as accounting policies applied for the consolidated financial statements as described in note 35.
The segment information for the year ended 31 December 2015 is as follows:
’000 RUB
O’Key Da! Total
2015 2014 2015 2014 2015 2014
External revenue 161,822,399 151,983,180 687,993 – 162,510,392 151,983,180EBITDA 11,672,274 11,836,850 (1,563,108) (567,342) 10,109,166 11,269,508
Inter-segment revenue for 2015 amounts RUB 12,338 thousand (2014: Nil) and relates to a rental agreement between LLC Fresh-Market (operator of discounter chain ‘DA!’) and LLC O’KEY.
A reconciliation of EBITDA to profit for the year is as follows:
’000 RUB 2015 2014
EBITDA 10,109,166 11,269,508Revaluation of investment property (49,854) 7,528(Loss)/gain from disposal of non-current assets (126,069) 724,595Impairment of non-current assets (41,127) (199,697)Loss from write-off of receivables (137,696) (198,243)Reversal of impairment/(impairment) of receivables (848) 17,747Depreciation and amortisation (3,838,115) (3,055,888)Finance income 81,691 24,197Finance costs (3,413,258) (1,587,734)Foreign exchange loss (614,562) (687,529)Other expenses (67,920) -
Profit before income tax 1,901,408 6,314,484Income tax benefit/(expense) 16,299 (1,088,765)
Profit for the year 1,917,707 5,225,719
7 SubsidiariesDetails of the Company’s significant subsidiaries at 31 December 2015 and 31 December 2014 are as follows:
Subsidiary Country of incorporation Nature of operations2015
Ownership/voting2014
Ownership/voting
LLC O’KEY Russian Federation Retail 100% 100%JSC Dorinda Russian Federation Real estate 100% 100%Axus Financial Ltd BVI Financing 100% 100%LLC O’KEY Group Russian Federation Managing company 100% 100%LLC O’KEY Logistics Russian Federation Import operations 100% 100%LLC Fresh Market Russian Federation Retail and real estate 100% 100%
8 Revenue’000 RUB 2015 2014
Sales of trading stock 153,112,272 142,613,948Sales of self-produced catering products 7,172,270 7,340,159
Revenue from sale of goods 160,284,542 149,954,107Rental income 1,529,250 1,501,627Revenue from advertising services 696,600 527,446
Total revenues 162,510,392 151,983,180
Total revenues comprise sale of goods, rental income from tenants, which rent trade area in the Group stores and income from placing advertising in the Group stores.
9 General, selling and administrative expenses’000 RUB Note 2015 2014
Personnel costs 11 (14,988,722) (13,928,875)Operating leases 28 (4,728,035) (3,872,641)Depreciation and amortisation 15, 16, 18 (3,838,115) (3,055,888)Communication and utilities (3,046,569) (2,687,257)Advertising and marketing (1,650,564) (1,822,828)Repairs and maintenance costs (940,327) (725,920)Operating taxes (758,886) (632,734)Security expenses (739,972) (833,025)Insurance and bank commission (687,075) (661,191)Legal and professional expenses (659,763) (517,361)Materials and supplies (300,245) (345,419)Other costs (32,804) (34,260)
(32,371,077) (29,117,399)
Fees billed to the Company and its subsidiaries by KPMG Luxembourg Societe cooperative, and other member firms of the KPMG network during the year are as follows:
’000 RUB 2015 2014
Auditors’ remuneration for annual and consolidated accounts 13,905 9,316Auditors’ remuneration for other assurance services 3,534 3,269Auditors’ remuneration for tax advisory services 855 2,411
18,294 14,996
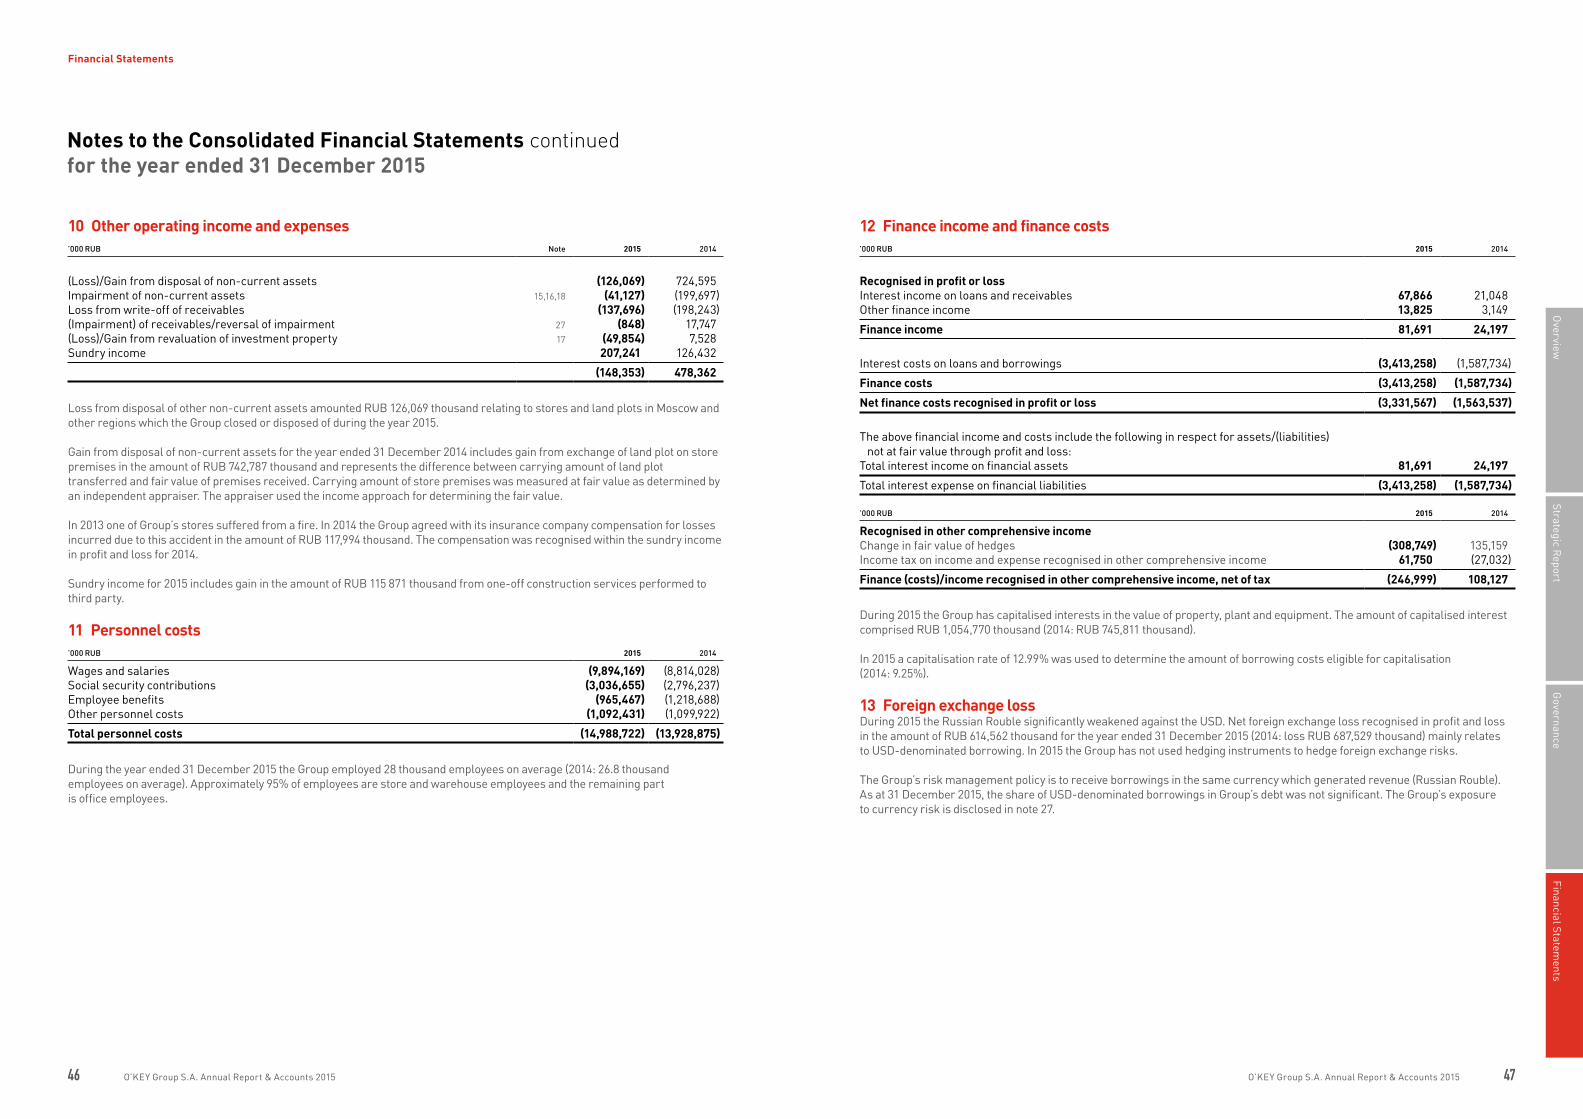
46 47O’KEY Group S.A. Annual Report & Accounts 2015 O’KEY Group S.A. Annual Report & Accounts 2015
Governance
Financial Statements
Strategic Report
Overview
Financial Statements
10 Other operating income and expenses’000 RUB Note 2015 2014
(Loss)/Gain from disposal of non-current assets (126,069) 724,595Impairment of non-current assets 15,16,18 (41,127) (199,697)Loss from write-off of receivables (137,696) (198,243)(Impairment) of receivables/reversal of impairment 27 (848) 17,747(Loss)/Gain from revaluation of investment property 17 (49,854) 7,528Sundry income 207,241 126,432
(148,353) 478,362
Loss from disposal of other non-current assets amounted RUB 126,069 thousand relating to stores and land plots in Moscow and other regions which the Group closed or disposed of during the year 2015.
Gain from disposal of non-current assets for the year ended 31 December 2014 includes gain from exchange of land plot on store premises in the amount of RUB 742,787 thousand and represents the difference between carrying amount of land plot transferred and fair value of premises received. Carrying amount of store premises was measured at fair value as determined by an independent appraiser. The appraiser used the income approach for determining the fair value.
In 2013 one of Group’s stores suffered from a fire. In 2014 the Group agreed with its insurance company compensation for losses incurred due to this accident in the amount of RUB 117,994 thousand. The compensation was recognised within the sundry income in profit and loss for 2014.
Sundry income for 2015 includes gain in the amount of RUB 115 871 thousand from one-off construction services performed to third party.
11 Personnel costs’000 RUB 2015 2014
Wages and salaries (9,894,169) (8,814,028)Social security contributions (3,036,655) (2,796,237)Employee benefits (965,467) (1,218,688)Other personnel costs (1,092,431) (1,099,922)
Total personnel costs (14,988,722) (13,928,875)
During the year ended 31 December 2015 the Group employed 28 thousand employees on average (2014: 26.8 thousand employees on average). Approximately 95% of employees are store and warehouse employees and the remaining part is office employees.
Notes to the Consolidated Financial Statements continuedfor the year ended 31 December 2015
12 Finance income and finance costs’000 RUB 2015 2014
Recognised in profit or lossInterest income on loans and receivables 67,866 21,048Other finance income 13,825 3,149
Finance income 81,691 24,197
Interest costs on loans and borrowings (3,413,258) (1,587,734)
Finance costs (3,413,258) (1,587,734)
Net finance costs recognised in profit or loss (3,331,567) (1,563,537)
The above financial income and costs include the following in respect for assets/(liabilities) not at fair value through profit and loss:
Total interest income on financial assets 81,691 24,197
Total interest expense on financial liabilities (3,413,258) (1,587,734)
’000 RUB 2015 2014
Recognised in other comprehensive incomeChange in fair value of hedges (308,749) 135,159Income tax on income and expense recognised in other comprehensive income 61,750 (27,032)
Finance (costs)/income recognised in other comprehensive income, net of tax (246,999) 108,127
During 2015 the Group has capitalised interests in the value of property, plant and equipment. The amount of capitalised interest comprised RUB 1,054,770 thousand (2014: RUB 745,811 thousand).
In 2015 a capitalisation rate of 12.99% was used to determine the amount of borrowing costs eligible for capitalisation (2014: 9.25%).
13 Foreign exchange lossDuring 2015 the Russian Rouble significantly weakened against the USD. Net foreign exchange loss recognised in profit and loss in the amount of RUB 614,562 thousand for the year ended 31 December 2015 (2014: loss RUB 687,529 thousand) mainly relates to USD-denominated borrowing. In 2015 the Group has not used hedging instruments to hedge foreign exchange risks.
The Group’s risk management policy is to receive borrowings in the same currency which generated revenue (Russian Rouble). As at 31 December 2015, the share of USD-denominated borrowings in Group’s debt was not significant. The Group’s exposure to currency risk is disclosed in note 27.
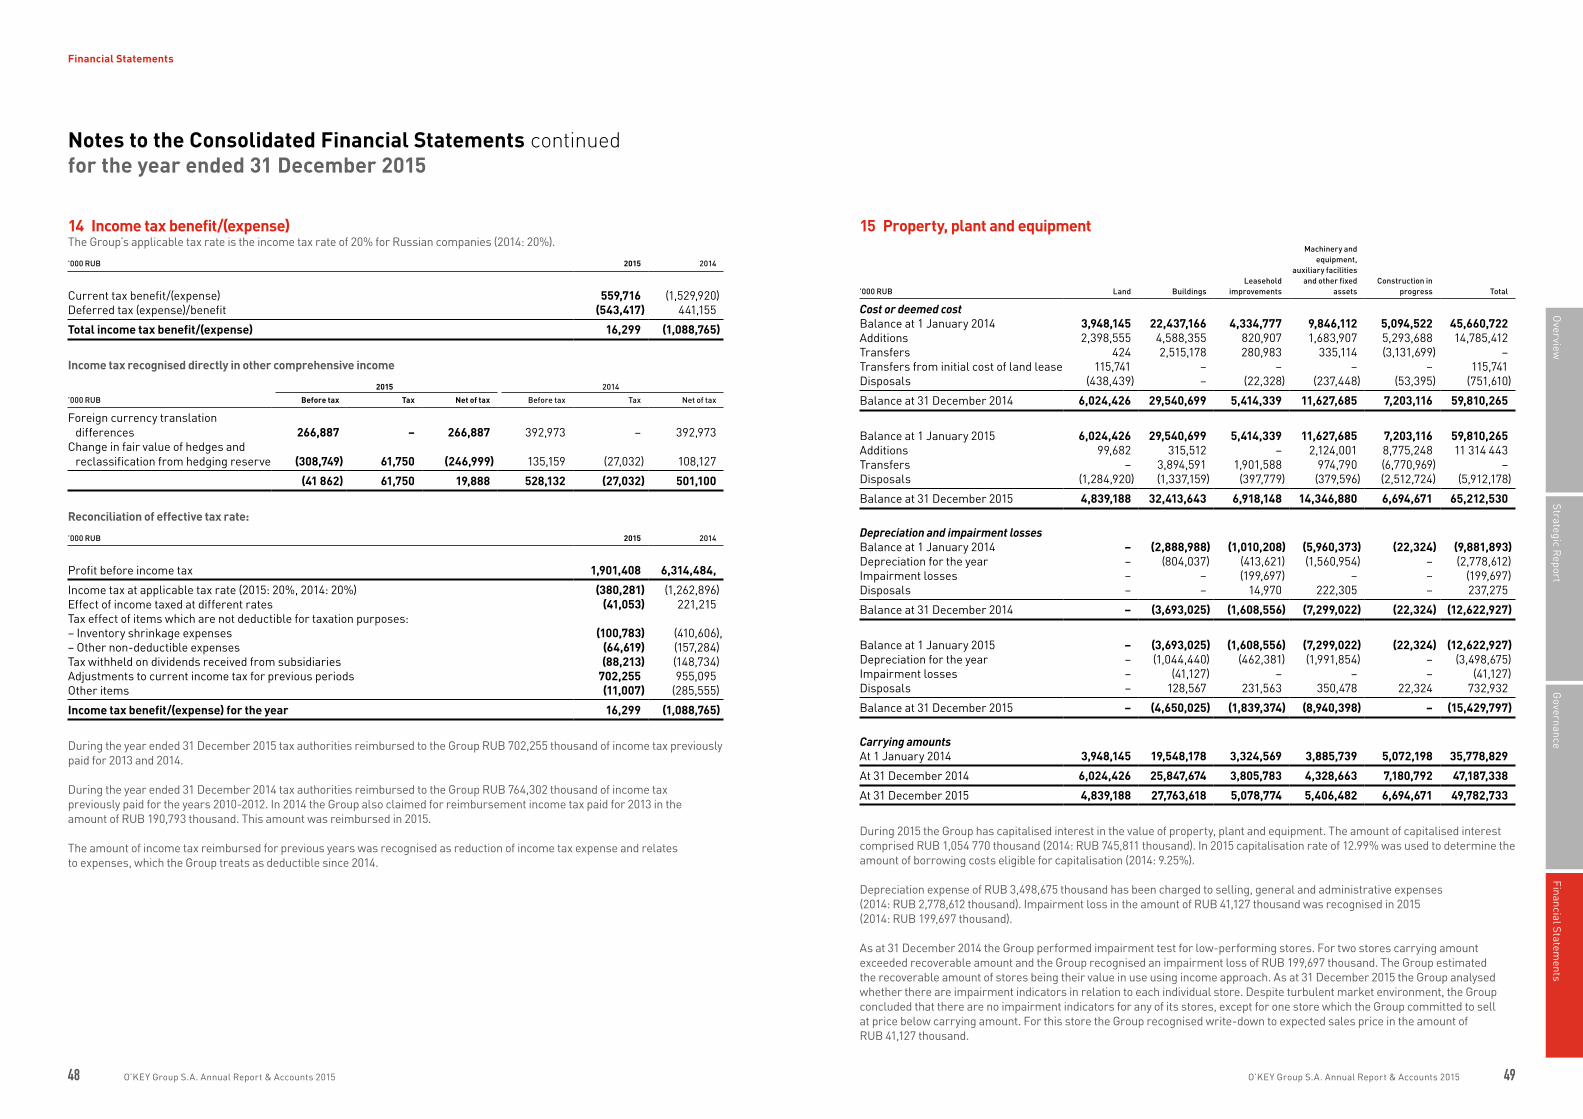
48 49O’KEY Group S.A. Annual Report & Accounts 2015 O’KEY Group S.A. Annual Report & Accounts 2015
Governance
Financial Statements
Strategic Report
Overview
Financial Statements
14 Income tax benefit/(expense)The Group’s applicable tax rate is the income tax rate of 20% for Russian companies (2014: 20%).
’000 RUB 2015 2014
Current tax benefit/(expense) 559,716 (1,529,920)Deferred tax (expense)/benefit (543,417) 441,155
Total income tax benefit/(expense) 16,299 (1,088,765)
Income tax recognised directly in other comprehensive income
’000 RUB
2015 2014
Before tax Tax Net of tax Before tax Tax Net of tax
Foreign currency translation differences 266,887 – 266,887 392,973 – 392,973
Change in fair value of hedges and reclassification from hedging reserve (308,749) 61,750 (246,999) 135,159 (27,032) 108,127
(41 862) 61,750 19,888 528,132 (27,032) 501,100
Reconciliation of effective tax rate:
’000 RUB 2015 2014
Profit before income tax 1,901,408 6,314,484,
Income tax at applicable tax rate (2015: 20%, 2014: 20%) (380,281) (1,262,896)Effect of income taxed at different rates (41,053) 221,215Tax effect of items which are not deductible for taxation purposes:– Inventory shrinkage expenses (100,783) (410,606),– Other non-deductible expenses (64,619) (157,284)Tax withheld on dividends received from subsidiaries (88,213) (148,734)Adjustments to current income tax for previous periods 702,255 955,095Other items (11,007) (285,555)
Income tax benefit/(expense) for the year 16,299 (1,088,765)
During the year ended 31 December 2015 tax authorities reimbursed to the Group RUB 702,255 thousand of income tax previously paid for 2013 and 2014.
During the year ended 31 December 2014 tax authorities reimbursed to the Group RUB 764,302 thousand of income tax previously paid for the years 2010-2012. In 2014 the Group also claimed for reimbursement income tax paid for 2013 in the amount of RUB 190,793 thousand. This amount was reimbursed in 2015.
The amount of income tax reimbursed for previous years was recognised as reduction of income tax expense and relates to expenses, which the Group treats as deductible since 2014.
15 Property, plant and equipment
’000 RUB Land Buildings Leasehold
improvements
Machinery and equipment,
auxiliary facilities and other fixed
assetsConstruction in
progress Total
Cost or deemed costBalance at 1 January 2014 3,948,145 22,437,166 4,334,777 9,846,112 5,094,522 45,660,722Additions 2,398,555 4,588,355 820,907 1,683,907 5,293,688 14,785,412Transfers 424 2,515,178 280,983 335,114 (3,131,699) –Transfers from initial cost of land lease 115,741 – – – – 115,741Disposals (438,439) – (22,328) (237,448) (53,395) (751,610)
Balance at 31 December 2014 6,024,426 29,540,699 5,414,339 11,627,685 7,203,116 59,810,265
Balance at 1 January 2015 6,024,426 29,540,699 5,414,339 11,627,685 7,203,116 59,810,265Additions 99,682 315,512 – 2,124,001 8,775,248 11 314 443Transfers – 3,894,591 1,901,588 974,790 (6,770,969) –Disposals (1,284,920) (1,337,159) (397,779) (379,596) (2,512,724) (5,912,178)
Balance at 31 December 2015 4,839,188 32,413,643 6,918,148 14,346,880 6,694,671 65,212,530
Depreciation and impairment lossesBalance at 1 January 2014 – (2,888,988) (1,010,208) (5,960,373) (22,324) (9,881,893)Depreciation for the year – (804,037) (413,621) (1,560,954) – (2,778,612)Impairment losses – – (199,697) – – (199,697)Disposals – – 14,970 222,305 – 237,275
Balance at 31 December 2014 – (3,693,025) (1,608,556) (7,299,022) (22,324) (12,622,927)
Balance at 1 January 2015 – (3,693,025) (1,608,556) (7,299,022) (22,324) (12,622,927)Depreciation for the year – (1,044,440) (462,381) (1,991,854) – (3,498,675)Impairment losses – (41,127) – – – (41,127)Disposals – 128,567 231,563 350,478 22,324 732,932
Balance at 31 December 2015 – (4,650,025) (1,839,374) (8,940,398) – (15,429,797)
Carrying amountsAt 1 January 2014 3,948,145 19,548,178 3,324,569 3,885,739 5,072,198 35,778,829
At 31 December 2014 6,024,426 25,847,674 3,805,783 4,328,663 7,180,792 47,187,338
At 31 December 2015 4,839,188 27,763,618 5,078,774 5,406,482 6,694,671 49,782,733
During 2015 the Group has capitalised interest in the value of property, plant and equipment. The amount of capitalised interest comprised RUB 1,054 770 thousand (2014: RUB 745,811 thousand). In 2015 capitalisation rate of 12.99% was used to determine the amount of borrowing costs eligible for capitalisation (2014: 9.25%).
Depreciation expense of RUB 3,498,675 thousand has been charged to selling, general and administrative expenses (2014: RUB 2,778,612 thousand). Impairment loss in the amount of RUB 41,127 thousand was recognised in 2015 (2014: RUB 199,697 thousand).
As at 31 December 2014 the Group performed impairment test for low-performing stores. For two stores carrying amount exceeded recoverable amount and the Group recognised an impairment loss of RUB 199,697 thousand. The Group estimated the recoverable amount of stores being their value in use using income approach. As at 31 December 2015 the Group analysed whether there are impairment indicators in relation to each individual store. Despite turbulent market environment, the Group concluded that there are no impairment indicators for any of its stores, except for one store which the Group committed to sell at price below carrying amount. For this store the Group recognised write-down to expected sales price in the amount of RUB 41,127 thousand.
Notes to the Consolidated Financial Statements continuedfor the year ended 31 December 2015

50 51O’KEY Group S.A. Annual Report & Accounts 2015 O’KEY Group S.A. Annual Report & Accounts 2015
Governance
Financial Statements
Strategic Report
Overview
Financial Statements
SecurityAt 31 December 2015, four stores have been pledged to third parties as collateral for borrowings (2014: four stores). Refer to notes 25 and 30.
16 Intangible assets
’000 RUB Software Lease rightOther intangible
assets Total
CostBalance at 1 January 2014 692,872 491,475 43,249 1,227,596Additions 159,809 – 5,904 165,713Transfer (621) – 621 –Disposals (289) (87,319) (66) (87,674)
Balance at 31 December 2014 851,771 404,156 49,708 1,305,635
Balance at 1 January 2015 851,771 404,156 49,708 1,305,635Additions 241,279 657,817 78,404 977,500Transfer (44) – 44 –
Balance at 31 December 2015 1,093,006 1,061,973 128,156 2,283,135
Amortisation and impairment lossesBalance at 1 January 2014 (298,503) (368,869) (10,175) (677,547)Amortisation for the year (123,227) (47,138) (5,261) (175,626)Transfer 626 748 (1,374) –Disposals 289 86,622 62 86,973
Balance at 31 December 2014 (420,815) (328,637) (16,748) (766,200)
Balance at 1 January 2015 (420,815) (328,637) (16,748) (766,200)Amortisation for the year (137,318) (74,671) (11,223) (223,212)Transfer 56 – (56) –
Balance at 31 December 2015 (558,077) (403,308) (28,027) (989,412)
Carrying amountsAt 1 January 2014 394,369 122,606 33,074 550,049
At 31 December 2014 430,956 75,519 32,960 539,435
At 31 December 2015 534,929 658,665 100,129 1,293,723
Amortisation and impairment lossesAmortisation of RUB 223,212 thousand has been charged to selling, general and administrative expenses (2014: RUB 175,626 thousand).
Notes to the Consolidated Financial Statements continuedfor the year ended 31 December 2015
17 Investment property(a) Reconciliation of carrying amount
’000 RUB NoteInvestment
property
Investment properties at fair value as at 1 January 2014 540,000Expenditure on subsequent improvements 972Fair value gain (unrealised) 10 7,528
Investment properties at fair value as at 31 December 2014 548,500
Investment properties at fair value as at 1 January 2015 548,500Expenditure on subsequent improvements 65,354Fair value loss (unrealised) 10 (49,854)
Investment properties at fair value as at 31 December 2015 564,000
(b) Measurement of fair value The carrying amount of investment property is the fair value of the property as determined by registered independent appraisers having an appropriate recognised professional qualification and recent experience in the location and type of the property being valued.
The fair value measurement for investment property has been categorised as a Level 3 fair value based on the inputs to the valuation technique used (see note 5).
The appraisers used the income approach for determining the fair value. An estimate was made of annual net operating income for five years which is mainly based on annual net rent rate of RUB 7,000 per sq. m. (2014: RUB 8,000) and expected occupancy of 95% (2014: 95%). The annual net operating income was assumed to be constant from year six to perpetuity. Discount rate of 19% (2014: 19%) was applied to discount future cash flows.
There were no direct operating expenses arising from investment property that did not generate rental income for the year ended 31 December 2015 (2014: Nil).
18 Other non-current assets’000 RUB 2015 2014
Initial cost of land lease 4,188,872 4,540,476Long-term prepayments to entities under control of shareholder group 651,302 511,619Prepayments for property plant and equipment 1,703,876 4,866,979Long-term deposits to lessors 390,732 303,241Other non-current receivables - 781,989
6,934,782 11,004,304
Initial cost of land lease includes purchase price, costs directly attributable to the acquisition of lease rights, and is amortised over the period of the lease (49-51 years).
Long-term prepayments to entities under control of the shareholder group represent prepayments for rent of hypermarkets for the period until 2034. Related party transactions are detailed in note 31.
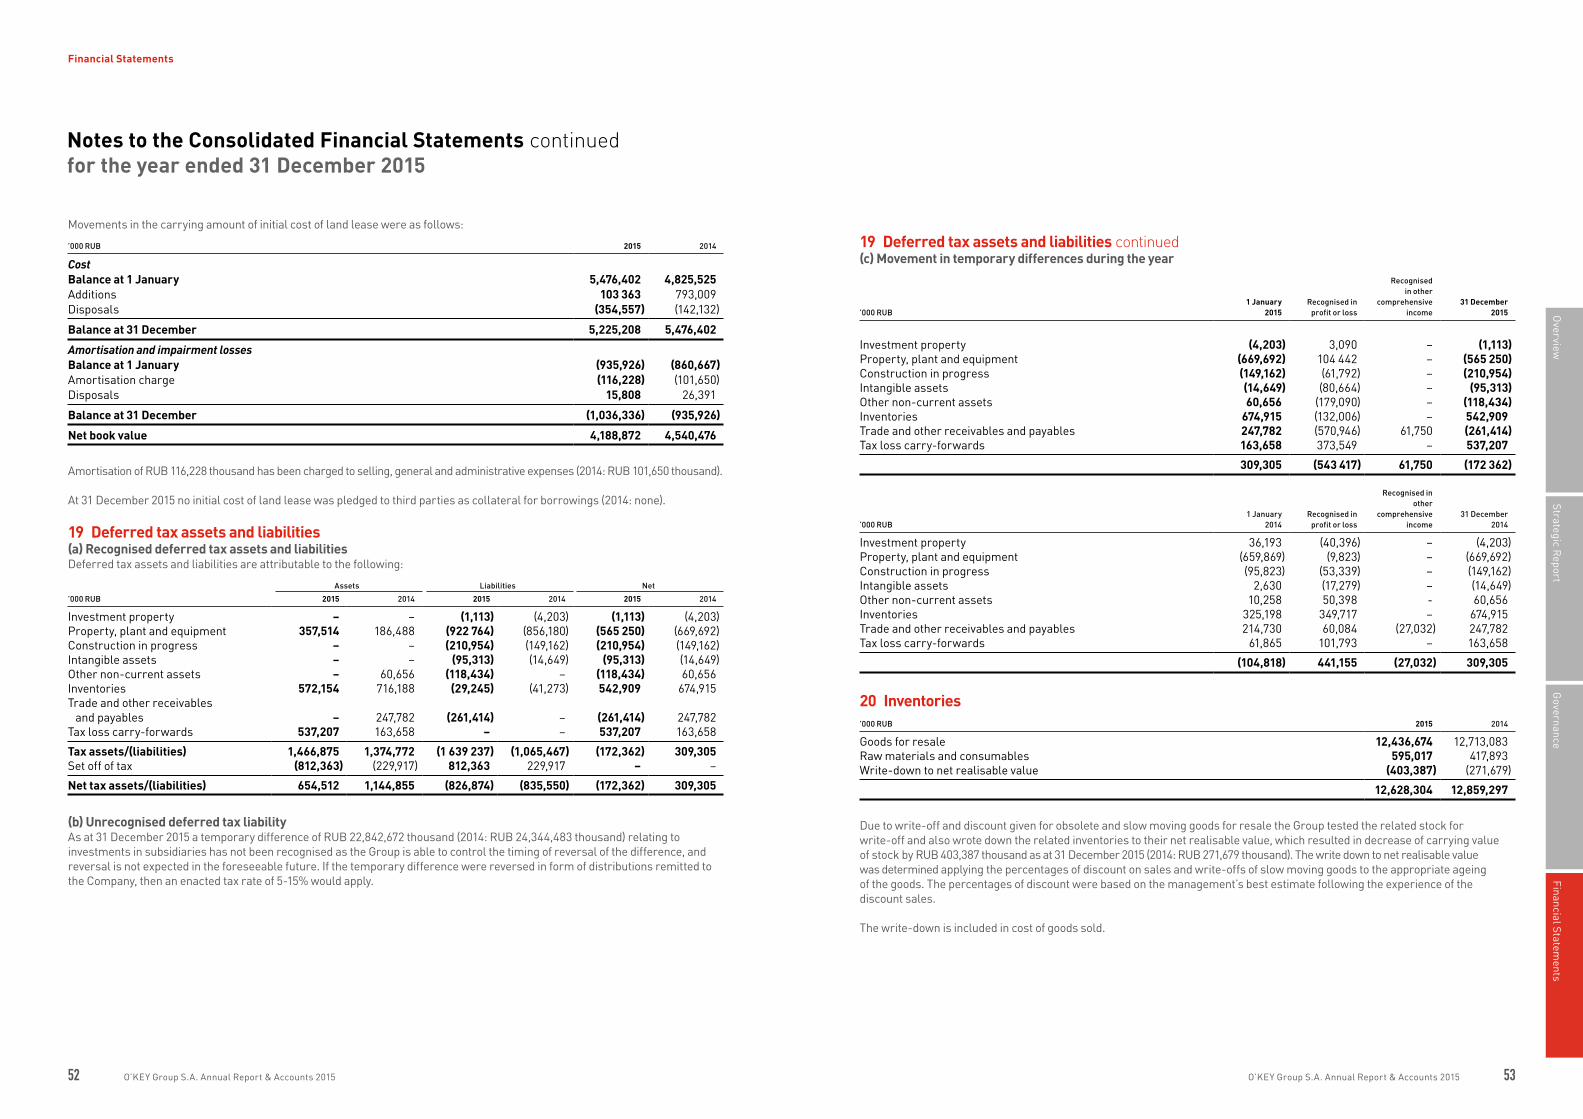
52 53O’KEY Group S.A. Annual Report & Accounts 2015 O’KEY Group S.A. Annual Report & Accounts 2015
Governance
Financial Statements
Strategic Report
Overview
Financial Statements
Movements in the carrying amount of initial cost of land lease were as follows:
’000 RUB 2015 2014
CostBalance at 1 January 5,476,402 4,825,525Additions 103 363 793,009Disposals (354,557) (142,132)
Balance at 31 December 5,225,208 5,476,402
Amortisation and impairment lossesBalance at 1 January (935,926) (860,667)Amortisation charge (116,228) (101,650)Disposals 15,808 26,391
Balance at 31 December (1,036,336) (935,926)
Net book value 4,188,872 4,540,476
Amortisation of RUB 116,228 thousand has been charged to selling, general and administrative expenses (2014: RUB 101,650 thousand).
At 31 December 2015 no initial cost of land lease was pledged to third parties as collateral for borrowings (2014: none).
19 Deferred tax assets and liabilities (a) Recognised deferred tax assets and liabilitiesDeferred tax assets and liabilities are attributable to the following:
Assets Liabilities Net
’000 RUB 2015 2014 2015 2014 2015 2014
Investment property – – (1,113) (4,203) (1,113) (4,203)Property, plant and equipment 357,514 186,488 (922 764) (856,180) (565 250) (669,692)Construction in progress – – (210,954) (149,162) (210,954) (149,162)Intangible assets – – (95,313) (14,649) (95,313) (14,649)Other non-current assets – 60,656 (118,434) – (118,434) 60,656Inventories 572,154 716,188 (29,245) (41,273) 542,909 674,915Trade and other receivables
and payables – 247,782 (261,414) – (261,414) 247,782Tax loss carry-forwards 537,207 163,658 – – 537,207 163,658
Tax assets/(liabilities) 1,466,875 1,374,772 (1 639 237) (1,065,467) (172,362) 309,305Set off of tax (812,363) (229,917) 812,363 229,917 – –
Net tax assets/(liabilities) 654,512 1,144,855 (826,874) (835,550) (172,362) 309,305
(b) Unrecognised deferred tax liabilityAs at 31 December 2015 a temporary difference of RUB 22,842,672 thousand (2014: RUB 24,344,483 thousand) relating to investments in subsidiaries has not been recognised as the Group is able to control the timing of reversal of the difference, and reversal is not expected in the foreseeable future. If the temporary difference were reversed in form of distributions remitted to the Company, then an enacted tax rate of 5-15% would apply.
Notes to the Consolidated Financial Statements continuedfor the year ended 31 December 2015
19 Deferred tax assets and liabilities continued(c) Movement in temporary differences during the year
’000 RUB1 January
2015Recognised in
profit or loss
Recognised in other
comprehensive income
31 December 2015
Investment property (4,203) 3,090 – (1,113)Property, plant and equipment (669,692) 104 442 – (565 250)Construction in progress (149,162) (61,792) – (210,954)Intangible assets (14,649) (80,664) – (95,313)Other non-current assets 60,656 (179,090) – (118,434)Inventories 674,915 (132,006) – 542,909Trade and other receivables and payables 247,782 (570,946) 61,750 (261,414)Tax loss carry-forwards 163,658 373,549 – 537,207
309,305 (543 417) 61,750 (172 362)
’000 RUB1 January
2014Recognised in
profit or loss
Recognised in other
comprehensive income
31 December 2014
Investment property 36,193 (40,396) – (4,203)Property, plant and equipment (659,869) (9,823) – (669,692)Construction in progress (95,823) (53,339) – (149,162)Intangible assets 2,630 (17,279) – (14,649)Other non-current assets 10,258 50,398 - 60,656Inventories 325,198 349,717 – 674,915Trade and other receivables and payables 214,730 60,084 (27,032) 247,782Tax loss carry-forwards 61,865 101,793 – 163,658
(104,818) 441,155 (27,032) 309,305
20 Inventories’000 RUB 2015 2014
Goods for resale 12,436,674 12,713,083Raw materials and consumables 595,017 417,893Write-down to net realisable value (403,387) (271,679)
12,628,304 12,859,297
Due to write-off and discount given for obsolete and slow moving goods for resale the Group tested the related stock for write-off and also wrote down the related inventories to their net realisable value, which resulted in decrease of carrying value of stock by RUB 403,387 thousand as at 31 December 2015 (2014: RUB 271,679 thousand). The write down to net realisable value was determined applying the percentages of discount on sales and write-offs of slow moving goods to the appropriate ageing of the goods. The percentages of discount were based on the management’s best estimate following the experience of the discount sales.
The write-down is included in cost of goods sold.

54 55O’KEY Group S.A. Annual Report & Accounts 2015 O’KEY Group S.A. Annual Report & Accounts 2015
Governance
Financial Statements
Strategic Report
Overview
Financial Statements
21 Trade and other receivables’000 RUB 2015 2014
Trade receivables 362,599 243,483VAT receivable 1,902,761 2,743,875Prepaid taxes other than income 67,747 14,822Prepaid income tax 791,787 342,389Interest rate swap receivables – 135,159Bonuses receivable from suppliers 1,653,027 2,281,600Other receivables 2,159,425 445,945
6,937,346 6,207,273
The Group’s exposure to credit and currency risks and impairment losses related to trade and other receivables are disclosed in note 27.
22 Cash and cash equivalents’000 RUB 2015 2014
Cash on hand 404,853 437,753RUB-denominated bank current account 728,549 544,109USD-denominated bank current account 10,586 14,048RUB term deposits (interest rate: 2015: 5%-11% p.a.; 2014: 12%-24% p.a.) 7,180,674 3,517,607Cash in transit 1,443,468 1,296,665
Cash and cash equivalents 9,768,130 5,810,182
Term deposits had original maturities of less than three months.
The Group keeps its deposits in the following banks: VTB bank, Rosbank and Unicredit bank.
The Group’s exposure to credit and currency risks related to cash and cash equivalents is disclosed in note 27.
23 EquityReconciliation of number of shares from 1 January to 31 December is provided in the table below.
Ordinary shares
Number of shares unless otherwise stated 2015 2014
Par value EUR 0.01 EUR 0.01On issue at 1 January 269,074,000 269,074,000
On issue at 31 December, fully paid 269,074,000 269,074,000
As at 31 December 2015 the Group’s subscribed share capital of RUB 119,440 thousand (EUR 2,691 thousand) is represented by 269,074,000 shares with a par value of 0.01 EUR each.
In accordance with Luxemburg Company Law, the Company is required to transfer a minimum of 5% of its net profits for each financial year to a legal reserve. This requirement ceases to be necessary once the balance of the legal reserve reaches 10% of the issued share capital. The legal reserve is not available for distribution to the shareholders. During the year ended 31 December 2015 there were no transfers to legal reserve (2014: Nil). In 2015 the Group paid interim dividends to shareholders in amount of RUB 1,643,770 thousand (2014: RUB 2,929,061 thousand). Interim dividends paid were recognised as distribution to owners in the Consolidated Statement of Changes in Equity.
Dividends per share recognised as distribution to shareholders for the year ended 31 December 2015 amounted to RUB 6.1 (2014: RUB 10.9).
Notes to the Consolidated Financial Statements continuedfor the year ended 31 December 2015
23 Equity continuedIn June 2015 shareholders of the Company approved annual dividends for the year ended 31 December 2014. The amount of annual dividends for 2014 was paid by the Group to shareholders as interim dividends in 2014 in the amount of RUB 2,929,061 thousand.
There were no movements in additional paid-in capital during the year ended 31 December 2015.
24 Earnings per shareThe calculation of basic earnings per share at 31 December 2015 was based on the profit attributable to ordinary shareholders of RUB 1,917,707 thousand (2014: RUB 5,225,719 thousand), and a weighted average number of ordinary shares outstanding of 269,074,000, calculated as shown below. The Company has no dilutive potential ordinary shares.
Number of shares 2015 2014
Issued shares at 1 January 269,074,000 269,074,000
Weighted average number of shares for the year ended 31 December 269,074,000 269,074,000
25 Loans and borrowingsThis note provides information about the contractual terms of the Group’s interest-bearing loans and borrowings, which are measured at amortised cost. For more information about the Group’s exposure to interest rate, foreign currency and liquidity risk, see note 27.
’000 RUB 2015 2014
Non-current liabilitiesSecured bank loans 5,000,000 5,000,000Unsecured bank facilities 17,052,875 8,699,975Unsecured bonds 385,144 4,980,000Unsecured loans from related parties 1,117,400 975,041Unsecured loans from third parties 2,850 –
23,558,269 19,655,016
Current liabilitiesUnsecured bank facilities 1,780,993 9,314,926Unsecured bonds 9,980,000 3,000,000Unsecured bonds interest 238,714 107,730Unsecured loans from third parties 23 2,871
11,999,730 12,425,527
As at 31 December 2015 loans and borrowings with carrying value of RUB 5,000,000 thousand were secured by property, plant and equipment (2014: RUB 5,000,000 thousand). Refer to note 30.
As at 31 December 2015 the Group has RUB 6,300,000 thousand of undrawn, committed borrowing facilities available in respect of which all conditions present had been met.

56 57O’KEY Group S.A. Annual Report & Accounts 2015 O’KEY Group S.A. Annual Report & Accounts 2015
Governance
Financial Statements
Strategic Report
Overview
Financial Statements
(a) Terms and debt repayment scheduleTerms and conditions of outstanding loans were as follows:
’000 RUB Currency Year of maturity
31 December 2015 31 December 2014
Face value Carrying amount
Face value Carrying amount
Unsecured bonds RUB 2016 – 2017 10,603,858 10,603,858 8,087,730 8,087,730Secured bank facility RUB 2018 5,000,000 5,000,000 5,000,000 5,000,000Unsecured bank facility RUB 2016-2019 18,833,868 18,833,868 18,014,901 18,014,901Unsecured loans from related parties USD 2018 1,117,400 1,117,400 975,041 975,041Unsecured loans from other
companies RUB 2017 2,873 2,873 2,871 2,871
35,557,999 35,557,999 32,080,543 32,080,543
During 2012 and 2013 the Group placed unsecured bonds on Moscow Exchange which mature after five years in 2017 and 2018, accordingly. However, bond holders have an option to claim repayment after three years. In 2015 part of the bond holders used their option and claimed a repayment in the amount of RUB 2,614,856 thousand.
During the year ended 31 December 2015 the Group issued bonds in the amount of RUB 5,000,000 thousand which expire after five years in 2020. Bonds holders have an option to claim repayment in April 2016.
Compliance with loan covenantsThe Group monitors compliance with loan covenants on an ongoing basis. Where noncompliance is unavoidable in management’s view, the Group requests waiver letters from the banks before the year-end, confirming that the banks shall not use its right to demand early redemption.
At 31 December 2015 and during the year then ended the Group complied with all loan covenants.
26 Trade and other payables’000 RUB 2015 2014
Trade payables 24,000,558 26,272,658Advances received 1,772,204 335,282Taxes payable (other than income tax) 627,824 644,760Payables to staff 1,603,412 1,322,765Deferred income 85,310 76,632Interest rate swap liability 173,590 –Other current payables 554,435 446,152
28,817,333 29,098,249
The Group’s exposure to currency and liquidity risk related to trade and other payables is disclosed in note 27.
Notes to the Consolidated Financial Statements continuedfor the year ended 31 December 2015
27 Financial instruments and risk management(a) OverviewThe Group has exposure to the following risks from its use of financial instruments:
– credit risk; – liquidity risk; and – market risk.
This note presents information about the Group’s exposure to each of the above risks, the Group’s objectives, policies and processes for measuring and managing risk, and the Group’s management of capital. Further quantitative disclosures are included throughout these consolidated financial statements.
Risk management frameworkThe Board of Directors has overall responsibility for the establishment and oversight of the Group’s risk management framework.
The Group’s risk management policies are established to identify and analyse the risks faced by the Group, to set appropriate risk limits and controls, and to monitor risks and adherence to limits. Risk management policies are reviewed regularly to reflect changes in market conditions and the Group’s activities. The Group, through its training and management standards and procedures, aims to develop a disciplined and constructive control environment in which all employees understand their roles and obligations.
The Group’s Audit Committee oversees how management monitors compliance with the Group’s risk management policies and procedures and reviews the adequacy of the risk management framework in relation to the risks faced by the Group. The Group’s Audit Committee is assisted in its oversight role by Internal Audit. Internal Audit undertakes both regular and ad hoc reviews of risk management controls and procedures, the results of which are reported to the Audit Committee.
(b) Credit riskCredit risk is the risk of financial loss to the Group if a customer or counterparty to a financial instrument fails to meet its contractual obligations, and arises principally from the Group’s receivables from customers and investments.
(i) Exposure to credit riskThe carrying amount of financial assets represents the maximum credit exposure. The maximum exposure to credit risk at the reporting date was:
’000 RUB Note
Carrying amount
2015 2014
Trade and other receivables 21 4,175,051 3,106,187Cash and cash equivalents 22 9,768,130 5,810,182
13,943,181 8,916,369
Due to the fact that the Group’s principal activities are located in the Russian Federation the credit risk is mainly associated with its domestic market. The credit risks associated with foreign counterparties are considered to be remote, as there are only few foreign counterparties and they were properly assessed for creditability.
(ii) Trade and other receivablesThe Group has no considerable balance of trade receivables because the majority of its customers are retail consumers, who are not provided with any credit. Therefore the Group’s trade receivables primarily include receivables from tenants and receivables connected to provision of advertising services. Usually the Group provides advertising services to suppliers of goods sold in O’KEY stores. Thus, the credit risk in part of trade receivables is mostly managed through procedures for selection of suppliers and tenants.
The Group establishes an allowance for impairment that represents its estimate of incurred losses in respect of trade and other receivables. The main component of this allowance is a specific loss component that relates to individually significant exposures.

58 59O’KEY Group S.A. Annual Report & Accounts 2015 O’KEY Group S.A. Annual Report & Accounts 2015
Governance
Financial Statements
Strategic Report
Overview
Financial Statements
Impairment losses The aging of trade and other receivables at the reporting date was:
’000 RUBGross
2015Impairment
2015Gross
2014Impairment
2014
Not overdue and past due less than 90 days 4 064 535 – 2,813,630 –Past due 90-180 days 57 304 – 75,980 –Past due 181-360 days 36 799 – 9,191 –More than 360 days 45 690 (29,277) 235,815 (28,429)
4,204,328 (29,277) 3,134,616 (28,429)
The movement in the allowance for impairment in respect of trade receivables during the year was as follows:
’000 RUB 2015 2014
Balance at beginning of the year 28,429 46,176Impairment loss recognised 848 –Impairment loss reversed – (17,747)
Balance at end of the year 29,277 28,429
The management has performed a thorough analysis of the recoverability of the receivables and impaired the balances outstanding for more than one year. Based on past experience management believes that normally the balances outstanding less than 360 days should not be impaired.
(iii) Cash and cash equivalentsThe Group held cash and cash equivalents of RUB 9,768,130 thousand at 31 December 2015 (2014: RUB 5,810,182 thousand), which represents its maximum credit exposure on these assets. Cash and cash equivalents are mainly held with banks which are rated from BB+ to B based on Standard and Poor’s and Fitch national rating for Russian Federation.
(c) Liquidity riskLiquidity risk is the risk that the Group will encounter difficulty in meeting the obligations associated with its financial liabilities that are settled by delivering cash or another financial asset. The Group’s approach to managing liquidity is to ensure, as far as possible, that it will always have sufficient liquidity to meet its liabilities when due, under both normal and stressed conditions, without incurring unacceptable losses or risking damage to the Group’s reputation.
Liquidity risk management is a responsibility of the Treasury under the supervision of the Group’s Financial Director. The Group’s liquidity risk management objectives are as follows:
– Maintaining financial independence: a share of one creditor in debt portfolio should not exceed 30%; – Maintaining financial stability: the ratio DEBT/EBITDA should not exceed 4.0; – Monitoring of compliance with debt covenants; – Planning: timely preparation of operating, investing and financing cash-flow forecasts on a rolling basis.
Notes to the Consolidated Financial Statements continuedfor the year ended 31 December 2015
27 Financial instruments and risk management continued(c) Liquidity risk continued(i) Exposure to liquidity riskThe following are the contractual maturities of financial liabilities, including future interest payments:
2015
’000 RUBCarrying amount
Contractual cash flows 0-6 mths 6-12 mths 1-5 yrs
Non-derivative financial liabilitiesSecured bank loan 5,000,000 (5,858,020) (207,034) (210,466) (5,440,520)Unsecured bonds 10,603,858 (11,277,679) (5,724,587) (5,125,475) (427,617)Unsecured bank facilities 18,833,868 (23,184,757) (1,846,406) (2,216,104) (19,122,247)Unsecured loans from related parties 1,117,400 (1,303,777) (44,329) (44,329) (1,215,119)Unsecured loans from other companies 2,873 (2,878) (25) (1) (2,852)Trade and other payables 26,331,994 (26,331,994) (26,331,994) – –
61,889,993 (67,959,105) (34,154,375) (7,596,375) (26,208,355)
As at 31 December 2015 Group’s current liabilities exceed current assets by RUB 10,254,288 thousand (2014: RUB 15,658,679 thousand). Excess of current liabilities over current assets is usual for retail industry. The Group uses excess of trade and other payables over inventory to finance its investing activities.
During 2012, 2013 and 2015 the Group placed unsecured bonds on the Moscow Exchange which mature after five years in 2017, 2018, 2020 respectively. Bond holders have an option to claim repayment of bonds after three years (after one year for the 2015 bond issuance), thus a three year period (one year for new bond) are used for contractual cash flows calculation purposes
2014
’000 RUBCarrying amount
Contractual cash flows 0-6 mths 6-12 mths 1-5 yrs
Non-derivative financial liabilitiesSecured bank loan 5,000,000 (6,306,546) (208,178) (209,322) (5,889,046)Unsecured bonds 8,087,730 (9,206,360) (480,705) (3,375,025) (5,350,630)Unsecured bank facilities 18,014,901 (23,235,154) (9,207,764) (2,723,745) (11,303,645)Unsecured loans from related parties 975,041 (1,059,456) (38,681) (38,681) (982,094)Unsecured loans from other companies 2,871 (2,873) (22) (2,851) –Trade and other payables 28,041,575 (28,041,575) (28,041,575) – –
60,122,118 (68,851,964) (37,976,925) (6,349,624) (23,525,415)
There are no payments due after five years.
(d) Market riskMarket risk is the risk that changes in market prices, such as foreign exchange rates, interest rates and equity prices will affect the Group’s income or the value of its holdings of financial instruments. The objective of market risk management is to manage and control market risk exposures within acceptable parameters, while optimising the return.
The Group buys derivatives in order to manage market risk. All such transactions are carried out within the guidelines set in Group’s policy on hedging market risk. The Group applies hedge accounting in order to manage volatility in profit or loss.

60 61O’KEY Group S.A. Annual Report & Accounts 2015 O’KEY Group S.A. Annual Report & Accounts 2015
Governance
Financial Statements
Strategic Report
Overview
Financial Statements
(i) Currency riskThe Group holds its business in the Russian Federation and mainly collects receivables nominated in Russian Roubles. However financial assets and liabilities of the Group are also denominated in other currencies, primarily US Dollar.
Thus the Group is exposed to currency risk, which may materially influence the financial position and financial results of the Group through the change in carrying value of financial assets and liabilities and amounts on foreign exchange rate gains or losses. The Group ensures that its exposure is kept to an acceptable level by keeping the proportion of financial assets and liabilities in foreign currencies to total financial liabilities at an acceptable level. From time to time the Group converts assets and liabilities from one currency to another. The Group regularly considers the necessity of using derivatives to hedge its exposure to currency risk.
Exposure to currency riskThe Group’s exposure to foreign currency risk was as follows based on national amounts:
’000 RUB
USD- denominated
2015
USD- denominated
2014
Trade and other receivables 2,101 251,011Unsecured loans from related parties (1,117,400) (975,041)Trade and other payables (760,753) (120,810)
Gross exposure (1,876,052) (844,840)
Of which carrying amount of hedged financial assets and financial liabilities – –
Net exposure (1,876,052) (844,840)
The following significant exchange rates applied during the year:
Russian Rouble equals
Average rate Reporting date rate
2015 2014 2015 2014
US Dollar 60,9579 38,4217 72,8827 56,2584
Sensitivity analysisA 20% weakening of the RUB against USD at 31 December 2015 would have decreased equity and profit and loss by RUB 375,210 thousand (2014: RUB 168,968 thousand). This analysis is based on foreign currency exchange rate variances that the Group considered to be reasonably possible at the end of the reporting period. The analysis assumes that all other variables, in particular interest rates, remain constant. The analysis was performed on the same basis for 2014.
A strengthening of the RUB against the USD at 31 December would have had the equal but opposite effect on equity and profit and loss, on the basis that all other variables remain constant.
(ii) Interest rate riskThe Group has material exposure to interest rate risk. As at 31 December 2015, 39% of the Group’s interest-bearing financial liabilities were subject to re-pricing within six months after the reporting date (2014: 56%).
The Group uses swaps to hedge its exposure to variability of interest rates. As at 31 December 2015 the Group had interest swap agreements with two banks. Under these agreements the Group swaps Mosprime rate for fixed rate. At inception, the swaps had a maturity of three years. As at 31 December 2015 fair value of swaps was RUB (173,590) thousand (31 December 2014: RUB 135,159 thousand).
Notes to the Consolidated Financial Statements continuedfor the year ended 31 December 2015
27 Financial instruments and risk management continued(d) Market risk continuedProfileAt the reporting date the interest rate profile of the Group’s interest-bearing financial instruments was:
’000 RUB
Carrying amount
2015 2014
Fixed rate instrumentsFinancial assets 7,180,674 3,517,607Financial liabilities (26,736,999) (21,019,143)
Variable rate instrumentsFinancial liabilities (8,821,000) (11,061,400)
Cash flow sensitivity analysis for variable rate instrumentsA change of 500 basis points in interest rates at the reporting date would have increased (decreased) equity and profit or loss by the amounts shown below. This analysis assumes that all other variables, in particular foreign currency rates, remain constant. The analysis was performed on the same basis for 2014.
’000 RUB
Profit or loss Equity
500 bp increase 500 bp decrease 500 bp increase 500 bp decrease
2015Variable rate instruments (441,050) 441,050Interest rate swap 163,250 (163,250) 246,893 (231,668)
Cash flow sensitivity (net) (277,800) 277,800 246,893 (231,668)
2014Variable rate instruments (553,070) 553,070 – –Interest rate swap 76,500 (76,500) 55,628 (56,213)
Cash flow sensitivity (net) (476,570) 476,570 55,628 (56,213)
(e) Offsetting of financial assets and financial liabilitiesThe Group may enter into sales and purchase agreements with the same counterparty in the normal course of business. The related amount receivable and payable do not always meet the criteria for offsetting in the statement of financial position. This is because the Group may not have any currently legally enforceable right to offset recognised amounts, because the right to offset may be enforceable only on the occurrence of future events. In particular, in accordance with the Russian civil law an obligation can be settled by offsetting against a similar claim if it is due, has no maturity or is payable on demand.

62 63O’KEY Group S.A. Annual Report & Accounts 2015 O’KEY Group S.A. Annual Report & Accounts 2015
Governance
Financial Statements
Strategic Report
Overview
Financial Statements
The following table sets out the carrying amounts of recognised financial instruments that are subject to the above agreements.
’000 RUBTrade and other
receivablesTrade and other
payables
31 December 2015Gross amounts 1,222,653 9,429,773Amounts offset in accordance with IAS 32 offsetting criteria (1,053) (1,053)
Net amounts presented in the statement of financial position 1,221,600 9,428,720Amounts related to recognised financial instruments that do not meet some or all of the
offsetting criteria (1,221,600) (1,221,600)
Net amount – 8,207,120
’000 RUBTrade and other
receivablesTrade and other
payables
31 December 2014Gross amounts 1,463,010 8,833,587Amounts offset in accordance with IAS 32 offsetting criteria (2,560) (2,560)
Net amounts presented in the statement of financial position 1,460,450 8,831,027Amounts related to recognised financial instruments that do not meet some or all of the
offsetting criteria (1,460,421) (1,460,421)
Net amount 29 7,370,606
The net amounts presented in the statement of financial position disclosed above form part of trade and other receivables and trade and other payables, respectively. Other amounts included in these line items do not meet the criteria for offsetting and are not subject to the agreements described above.
Amounts offset in accordance with IAS 32 offsetting criteria comprise mainly trade payables for goods and bonuses receivable from suppliers.
(f) Fair valuesBasis for determination of fair value of financial assets and liabilities is disclosed in note 5. Fair value of Group’s financial assets and liabilities, including loans and borrowings, approximates their carrying amounts.
(g) Fair value hierarchyGroup’s derivative financial assets and liabilities comprise interest rate swaps which are carried at fair value. Fair value of swaps was determined based on observable market data (Level 2 fair value), including forward interest rates. The Group has no financial assets and liabilities measured at fair value based on unobservable inputs (Level 3 fair value).
Group’s bonds are listed on Moscow Exchange. Fair value of bonds payable was determined for disclosure purposes based on active market quotations (Level 1 fair value).
(h) Capital managementThe Group’s policy is to maintain a strong capital base so as to maintain investor, creditor and market confidence and to sustain future development of the business. Neither the Company nor its subsidiaries are subject to externally imposed capital requirements, except for statutory requirement in relation to minimum level of share capital; the Group follows this requirement.
Notes to the Consolidated Financial Statements continuedfor the year ended 31 December 2015
28 Operating leasesLeases as lesseeThe Group has both owned and leased land plots. The owned land plots are included in property, plant and equipment. Leased land plots are treated as operating leases. In case the Group incurs costs directly attributable to acquisition of operating lease rights, these costs are capitalised as initial cost of land lease and are amortised over the period of the lease (49-51 years). The further information on leases is detailed below.
When the Group leases land plots under operating leases, the lessors for these leases are State authorities and third parties. The leases are typically run for two to three years, after which long-term operating lease contract is concluded for 49 years.
The Group also rents premises under operating leases. These leases typically run up to ten years, although some leases may be for longer periods. Property leases can be renewed based on mutual agreement of the lessor and the Group. The Group has subleases. Fees payable by the Group for operating leases of stores comprise fixed payments and contingent rent which is determined as an excess of 2-6% of the revenue of related stores over the fixed rent rate.
During the year ended 31 December 2015 RUB 4,844,263 thousand was recognised as an expense (including amortisation of initial cost of land lease amounting to RUB 116 228 thousand) in the profit and loss in respect of operating leases (2014: RUB 3,974,291 thousand). Contingent rent recognised as an expense for the year ended 31 December 2015 amounted to RUB 1,076,139 thousand (2014: RUB 866,605 thousand).
At 31 December, the future minimum lease payments under non-cancellable leases were payable as follows:
RUB 000’ 2015 2014
Less than one year 3,012,410 2,634,774Between one and five years 10,775,153 8,525,459More than five years 20,743,629 15,809,958
34,531,192 26,970,191
Future minimum lease payments as at 31 December 2015 include RUB 26,722,003 thousand (31 December 2014: RUB 18,713,753 thousand) in respect of property leases cancellable only with the permission of the lessor. Management believes that the Group is able to negotiate early cancellation of these leases, if necessary.
Leases as lessorThe Group leases out its investment property and some space in the buildings of hypermarkets. During the year ended 31 December 2015 RUB 1,529,250 thousand was recognised as rental income in the consolidated statement of profit or loss and other comprehensive income (2014: RUB 1,501,627 thousand). All leases where the Group is lessor are cancellable. The Group has contingent rent arrangements.
Contingent rent recognised as income amounted to RUB 67 483 thousand for the year ended 31 December 2015 (2014: RUB 52,275 thousand). Contingent rent is determined as an excess of 4%-25% of the tenant’s revenue over the fixed rent rate.
29 Capital commitmentsThe Group has capital commitments to acquire property, plant and equipment and intangible assets amounting to RUB 3,570,470 thousand as at 31 December 2015 (2014: RUB 8,616,146 thousand). The capital commitments mostly consist of construction contracts for stores.
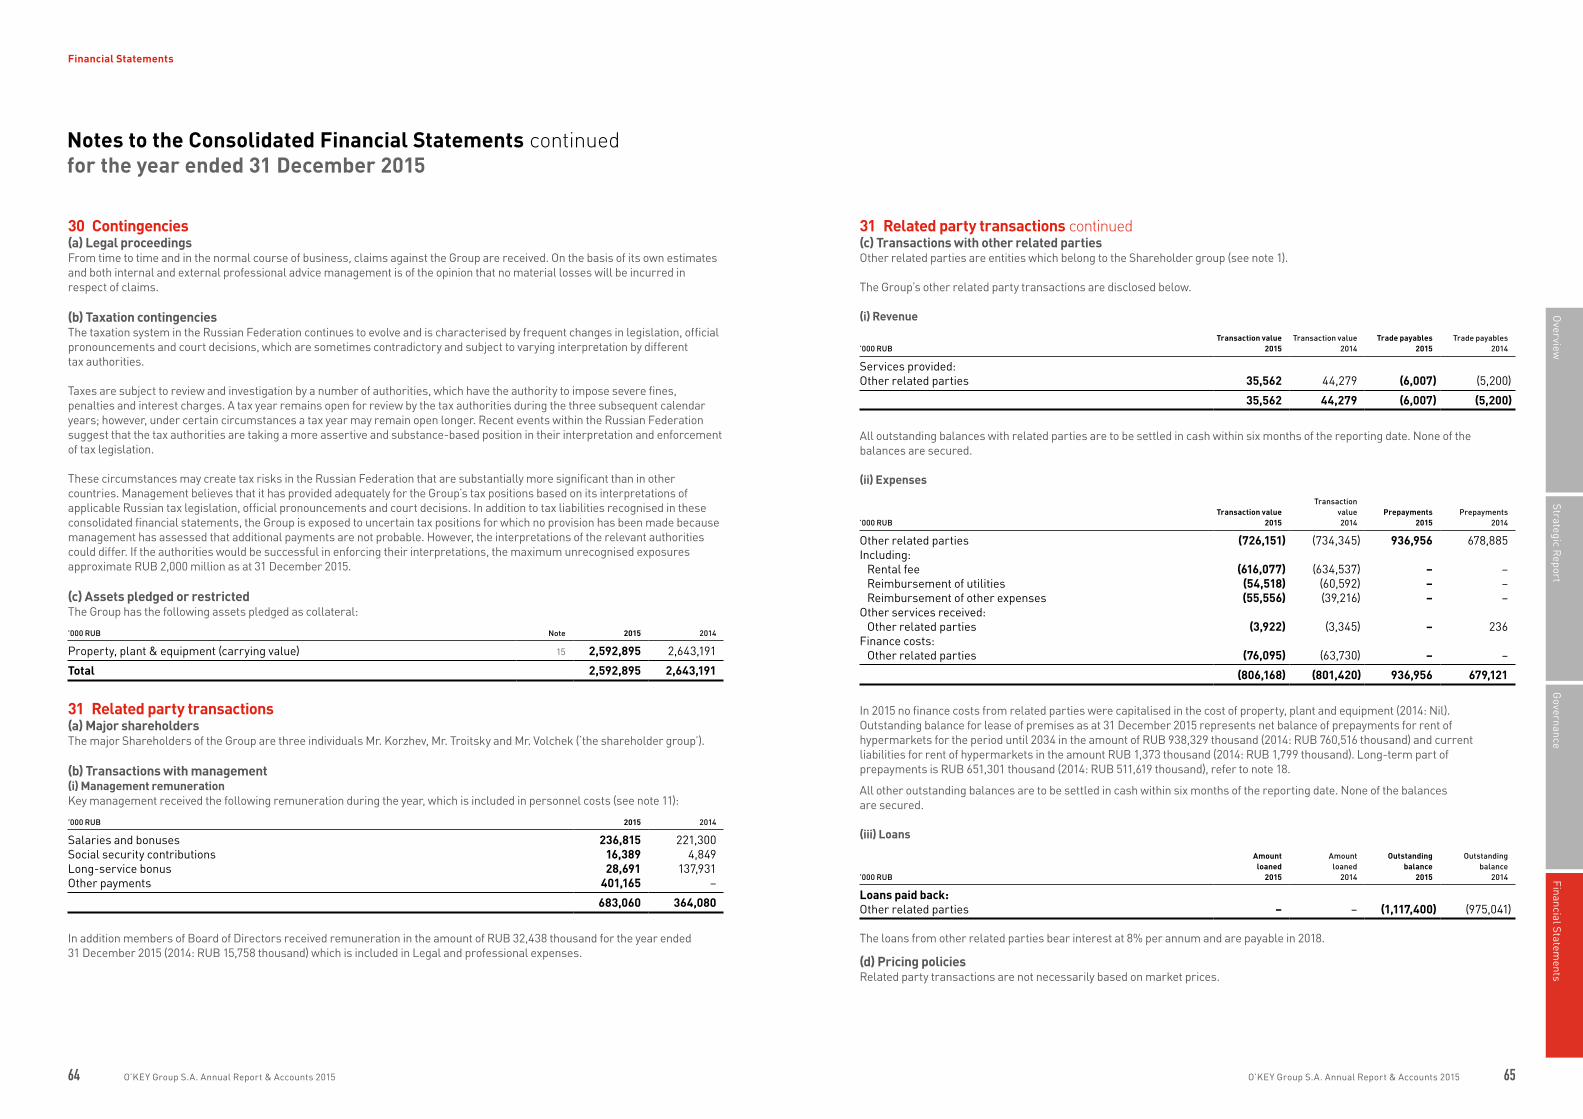
64 65O’KEY Group S.A. Annual Report & Accounts 2015 O’KEY Group S.A. Annual Report & Accounts 2015
Governance
Financial Statements
Strategic Report
Overview
Financial Statements
30 Contingencies(a) Legal proceedingsFrom time to time and in the normal course of business, claims against the Group are received. On the basis of its own estimates and both internal and external professional advice management is of the opinion that no material losses will be incurred in respect of claims.
(b) Taxation contingenciesThe taxation system in the Russian Federation continues to evolve and is characterised by frequent changes in legislation, official pronouncements and court decisions, which are sometimes contradictory and subject to varying interpretation by different tax authorities.
Taxes are subject to review and investigation by a number of authorities, which have the authority to impose severe fines, penalties and interest charges. A tax year remains open for review by the tax authorities during the three subsequent calendar years; however, under certain circumstances a tax year may remain open longer. Recent events within the Russian Federation suggest that the tax authorities are taking a more assertive and substance-based position in their interpretation and enforcement of tax legislation.
These circumstances may create tax risks in the Russian Federation that are substantially more significant than in other countries. Management believes that it has provided adequately for the Group’s tax positions based on its interpretations of applicable Russian tax legislation, official pronouncements and court decisions. In addition to tax liabilities recognised in these consolidated financial statements, the Group is exposed to uncertain tax positions for which no provision has been made because management has assessed that additional payments are not probable. However, the interpretations of the relevant authorities could differ. If the authorities would be successful in enforcing their interpretations, the maximum unrecognised exposures approximate RUB 2,000 million as at 31 December 2015.
(c) Assets pledged or restrictedThe Group has the following assets pledged as collateral:
’000 RUB Note 2015 2014
Property, plant & equipment (carrying value) 15 2,592,895 2,643,191
Total 2,592,895 2,643,191
31 Related party transactions(a) Major shareholdersThe major Shareholders of the Group are three individuals Mr. Korzhev, Mr. Troitsky and Mr. Volchek (‘the shareholder group’).
(b) Transactions with management(i) Management remunerationKey management received the following remuneration during the year, which is included in personnel costs (see note 11):
’000 RUB 2015 2014
Salaries and bonuses 236,815 221,300Social security contributions 16,389 4,849Long-service bonus 28,691 137,931Other payments 401,165 –
683,060 364,080
In addition members of Board of Directors received remuneration in the amount of RUB 32,438 thousand for the year ended 31 December 2015 (2014: RUB 15,758 thousand) which is included in Legal and professional expenses.
Notes to the Consolidated Financial Statements continuedfor the year ended 31 December 2015
31 Related party transactions continued(c) Transactions with other related partiesOther related parties are entities which belong to the Shareholder group (see note 1).
The Group’s other related party transactions are disclosed below.
(i) Revenue
’000 RUBTransaction value
2015Transaction value
2014Trade payables
2015Trade payables
2014
Services provided:Other related parties 35,562 44,279 (6,007) (5,200)
35,562 44,279 (6,007) (5,200)
All outstanding balances with related parties are to be settled in cash within six months of the reporting date. None of the balances are secured.
(ii) Expenses
’000 RUBTransaction value
2015
Transaction value2014
Prepayments2015
Prepayments 2014
Other related parties (726,151) (734,345) 936,956 678,885Including:
Rental fee (616,077) (634,537) – –Reimbursement of utilities (54,518) (60,592) – –Reimbursement of other expenses (55,556) (39,216) – –
Other services received:Other related parties (3,922) (3,345) – 236
Finance costs:Other related parties (76,095) (63,730) – –
(806,168) (801,420) 936,956 679,121
In 2015 no finance costs from related parties were capitalised in the cost of property, plant and equipment (2014: Nil).Outstanding balance for lease of premises as at 31 December 2015 represents net balance of prepayments for rent of hypermarkets for the period until 2034 in the amount of RUB 938,329 thousand (2014: RUB 760,516 thousand) and current liabilities for rent of hypermarkets in the amount RUB 1,373 thousand (2014: RUB 1,799 thousand). Long-term part of prepayments is RUB 651,301 thousand (2014: RUB 511,619 thousand), refer to note 18.
All other outstanding balances are to be settled in cash within six months of the reporting date. None of the balances are secured.
(iii) Loans
’000 RUB
Amount loaned
2015
Amount loaned
2014
Outstanding balance
2015
Outstanding balance
2014
Loans paid back:Other related parties – – (1,117,400) (975,041)
The loans from other related parties bear interest at 8% per annum and are payable in 2018.
(d) Pricing policiesRelated party transactions are not necessarily based on market prices.

66 67O’KEY Group S.A. Annual Report & Accounts 2015 O’KEY Group S.A. Annual Report & Accounts 2015
Governance
Financial Statements
Strategic Report
Overview
Financial Statements
32 Events subsequent to the reporting dateThere are no events subsequent to the reporting date which require disclosure.
33 Basis of measurementThe consolidated financial statements are prepared on the historical cost basis except for the following:
– Derivative financial instruments are stated at fair value; – Liabilities incurred in cash-settled share-based payment transactions are remeasured at fair value; – Investment property is remeasured at fair value.
34 Significant accounting policiesThe accounting policies set out below have been consistently applied to all periods presented in these consolidated financial statements, and have been applied consistently by Group entities, except as explained in note 35, which addresses changes in accounting policies.
(a) Basis of consolidation(i) SubsidiariesSubsidiaries are entities controlled by the Group. The financial statements of subsidiaries are included in the consolidated financial statements from the date that control commences until the date that control ceases. The accounting policies of subsidiaries have been changed when necessary to align them with the policies adopted by the Group.
(ii) Transactions eliminated on consolidationIntra-group balances and transactions, and any unrealised income and expenses arising from intra-group transactions, are eliminated in preparing the consolidated financial statements.
(b) Foreign currency(i) Foreign currency transactionsTransactions in foreign currencies are translated to the respective functional currencies of Group entities at exchange rates at the dates of the transactions. Monetary assets and liabilities denominated in foreign currencies at the reporting date are retranslated to the functional currency at the exchange rate at that date. The foreign currency gain or loss on monetary items is the difference between amortised cost in the functional currency at the beginning of the period, adjusted for effective interest and payments during the period, and the amortised cost in foreign currency translated at the exchange rate at the end of the reporting period.
Non-monetary assets and liabilities denominated in foreign currencies that are measured at fair value are retranslated to the functional currency at the exchange rate at the date that the fair value was determined. Non-monetary items in a foreign currency that are measured based on historical cost are translated using the exchange rate at the date of the transaction.
Foreign currency differences arising in retranslation are recognised in profit or loss.
(ii) Foreign operationsThe assets and liabilities of foreign operations are translated to RUB at the exchange rates at the reporting date. The income and expenses of foreign operations are translated to RUB at exchange rates at the dates of the transactions.
Foreign currency differences are recognised directly in other comprehensive income. Since 1 January 2005, the Group’s date of transition to IFRSs, such differences have been recognised in the foreign currency translation reserve. When a foreign operation is disposed of such that control or joint control is lost, the cumulative amount in the translation reserve related to that foreign operation is reclassified to profit or loss as part of the gain or loss on disposal. When the Group disposes of only part of its interest in a subsidiary that includes a foreign operation while retaining control, the relevant proportion of the cumulative amount is reattributed to non-controlling interests. When the Group disposes of only part of its investment in joint venture that includes a foreign operation while retaining joint control, the relevant proportion of the cumulative amount is reclassified to profit or loss.
Foreign exchange gains and losses arising from a monetary item received from or payable to a foreign operation, the settlement of which is neither planned nor likely in the foreseeable future, are considered to form part of a net investment in a foreign operation and are recognised in other comprehensive income, and are presented within equity in the foreign currency translation reserve.
Notes to the Consolidated Financial Statements continuedfor the year ended 31 December 2015
34 Significant accounting policies continued(c) Financial instrumentsNon-derivative financial instruments comprise trade and other receivables, cash and cash equivalents, loans and borrowings, and trade and other payables.
(i) Non-derivative financial assets and financial liabilities – recognition and derecognitionThe Group initially recognises loans and receivables and debt securities issued on the date that they are originated. All other financial assets and financial liabilities are recognised initially on the trade date at which the Group becomes a party to the contractual provisions of the instrument.
The Group derecognises a financial asset when the contractual rights to the cash flows from the asset expire, or it transfers the rights to receive the contractual cash flows on the financial asset in a transaction in which substantially all the risks and rewards of ownership of the financial asset are transferred. Any interest in transferred financial assets that is created or retained by the Group is recognised as a separate asset or liability.
The Group derecognises a financial liability when its contractual obligations are discharged or cancelled or expire.
Financial assets and liabilities are offset and the net amount presented in the statement of financial position when, and only when, the Group has a legal right to offset the amounts and intends either to settle on a net basis or to realise the asset and settle the liability simultaneously.
(ii) Non-derivative financial assets – measurementThe Group has the following non-derivative financial assets: loans and receivables.
Loans and receivables are financial assets with fixed or determinable payments that are not quoted in an active market. Such assets are recognised initially at fair value plus any directly attributable transaction costs. Subsequent to initial recognition loans and receivables are measured at amortised cost using the effective interest method, less any impairment losses.
Loans and receivables comprise trade and other receivables and cash and cash equivalents.
Cash and cash equivalents comprise cash balances and call deposits with original maturities of three months or less. Bank overdrafts that are repayable on demand and form an integral part of the Group’s cash management are included as a component of cash and cash equivalents for the purpose of the statement of cash flows.
(iii) Non-derivative financial liabilities – measurementThe Group has the following non-derivative financial liabilities: loans and borrowings, bank overdrafts, trade and other payables.
Such financial liabilities are recognised initially at fair value less any directly attributable transaction costs. Subsequent to initial recognition, these financial liabilities are measured at amortised cost using the effective interest method.
(iv) Derivative financial instrumentsThe Group holds derivative financial instruments to hedge its interest rate and foreign currency risk exposures.
On initial designation of the hedge, the Group formally documents the relationship between the hedging instruments and hedged items, including the risk management objectives and strategy in undertaking the hedge transaction, together with the methods that will be used to assess the effectiveness of the hedging relationship. The Group makes an assessment, both at the inception of the hedge relationship as well as on an ongoing basis, whether the hedging instruments are expected to be ‘highly effective’ in offsetting the changes in the fair value or cash flows of the respective hedged items during the period for which the hedge is designated, and whether the actual results of each hedge are within a range of 80-125%. For a cash flow hedge of a forecast transaction, the transaction should be highly probable to occur and should present an exposure to variations in cash flows that could ultimately affect reported net income.
Derivatives are recognised initially at fair value; attributable transaction costs are recognised in profit or loss when incurred. Subsequent to initial recognition, derivatives are measured at fair value, and changes therein are accounted for as described.

68 69O’KEY Group S.A. Annual Report & Accounts 2015 O’KEY Group S.A. Annual Report & Accounts 2015
Governance
Financial Statements
Strategic Report
Overview
Financial Statements
When a derivative is designated as the hedging instrument in a hedge of the variability in cash flows attributable to a particular risk associated with a recognised asset or liability or a highly probable forecast transaction that could affect profit or loss, the effective portion of changes in the fair value of the derivative is recognised in other comprehensive income and presented in the hedging reserve in equity. The amount recognised in other comprehensive income is removed and included in profit or loss in the same period as the hedged cash flows affect profit or loss under the same line item in the statement of profit and loss and other comprehensive income as the hedged item. Any ineffective portion of changes in the fair value of the derivative is recognised immediately in profit or loss.
If the hedging instrument no longer meets the criteria for hedge accounting, expires or is sold, terminated, exercised, or the designation is revoked, then hedge accounting is discontinued prospectively. The cumulative gain or loss previously recognised in other comprehensive income and presented in the hedging reserve in equity remains there until the forecast transaction affects profit or loss. If the forecast transaction is no longer expected to occur, then the balance in other comprehensive income is recognised immediately in profit or loss.
(d) Transactions with owners(i) Ordinary shares/share capitalOrdinary shares are classified as equity. Incremental costs directly attributable to issue of ordinary shares and share options are recognised as a deduction from equity, net of any tax effects.
(ii) Distributions to owners/contributions from ownersThe dividends paid to the shareholders are recognised directly in equity once the decision on the payment takes place. The transfers of assets to the related parties (companies under the control of the Group’s ultimate shareholders) or other benefits to such related parties are recognised directly in equity as distributions to the shareholders.
(e) Property, plant and equipment(i) Recognition and measurementItems of property, plant and equipment, except for land, are measured at cost less accumulated depreciation and impairment losses. The cost of property, plant and equipment at 1 January 2005, the date of transition to IFRSs, was determined by reference to its fair value at that date.
Cost includes expenditure that is directly attributable to the acquisition of the asset. The cost of self-constructed assets includes the cost of materials and direct labour, any other costs directly attributable to bringing the asset to a working condition for their intended use, the costs of dismantling and removing the items and restoring the site on which they are located and capitalised borrowing costs. Purchased software that is integral to the functionality of the related equipment is capitalised as part of that equipment.
Any gain or loss on disposal of an item of property, plant and equipment is determined by comparing the proceeds from disposal with the carrying amount of property, plant and equipment, and is recognised net within ‘other income’ in profit or loss.
(ii) Subsequent costsThe cost of replacing part of an item of property, plant and equipment is recognised in the carrying amount of the item if it is probable that the future economic benefits embodied within the part will flow to the Group and its cost can be measured reliably. The carrying amount of the replaced part is derecognised. The costs of the day-to-day servicing of property, plant and equipment are recognised in profit or loss as incurred.
(iii) DepreciationItems of property, plant and equipment are depreciated from the date that they are installed and are ready for use, or in respect of internally constructed assets, from the date that the asset is completed and ready for use. Depreciation is based on the cost of an asset less its residual value. Significant components of individual assets are assessed and if a component has a useful life that is different from the remainder of that asset, that component is depreciated separately.
Depreciation is recognised in profit or loss on a straight-line basis over the estimated useful lives of each part of an item of property, plant and equipment, since this most closely reflects the expected pattern of consumption of the future economic benefits embodied in the asset. Leased assets are depreciated over the shorter of the lease term and their useful lives unless it is reasonably certain that the Group will obtain ownership by the end of the lease term. Land is not depreciated.
Notes to the Consolidated Financial Statements continuedfor the year ended 31 December 2015
34 Significant accounting policies continued(e) Property, plant and equipment continuedThe estimated useful lives of significant items of property, plant and equipment for the current and comparative periods are as follows:
– Buildings 30 years; – Machinery and equipment, auxiliary facilities 2-20 years; – Motor vehicles 5-10 years; – Leasehold improvements over the term of underlying lease; – Other fixed assets 2-10 years.
Depreciation methods, useful lives and residual values are reviewed at each financial year end and adjusted if appropriate.
(f) Investment propertyInvestment property is property held by the Group to earn rental income or for capital appreciation and which is not occupied by the Group.
Investment property, including investment property under construction, is initially recognised at cost, including transaction costs, and subsequently remeasured at fair value with any change therein recognised in profit or loss. If fair value of investment property under construction is not reliably determinable, the Group measures that investment property under construction at cost until either its fair value becomes reliably determinable or construction is completed (whichever is earlier).
Fair value of the Group’s investment property is determined by independent appraisers, who hold a recognised and relevant professional qualification and who have recent experience in valuation of property of similar location and category.
When the use of a property changes such that it is reclassified as property, plant and equipment, its fair value at the date of reclassification becomes its cost for subsequent accounting.
(g) Intangible assets(i) Other intangible assetsOther intangible assets that are acquired by the Group have finite useful lives and are measured at cost less accumulated amortisation and accumulated impairment losses. Other intangible assets primarily include capitalised computer software, patents and licenses. Acquired computer software, licenses and patents are capitalised on the basis of the costs incurred to acquire and bring them to use.
(ii) Subsequent expenditureSubsequent expenditure is capitalised only when it increases the future economic benefits embodied in the specific asset to which it relates. All other expenditure is recognised in the profit or loss as incurred.
(iii) AmortisationAmortisation is based on the cost of the asset less its estimated residual value.
Amortisation is recognised in profit or loss on a straight-line basis over the estimated useful lives of intangible assets from the date that they are available for use since this most closely reflects the expected pattern of consumption of future economic benefits embodied in the asset. The estimated useful lives for the current and comparative periods are as follows:
– lease rights 5-10 years; – software licenses 1-7 years; – other intangible assets 1-5 years.
Amortisation methods, useful lives and residual values are reviewed at each financial year end and adjusted if appropriate.
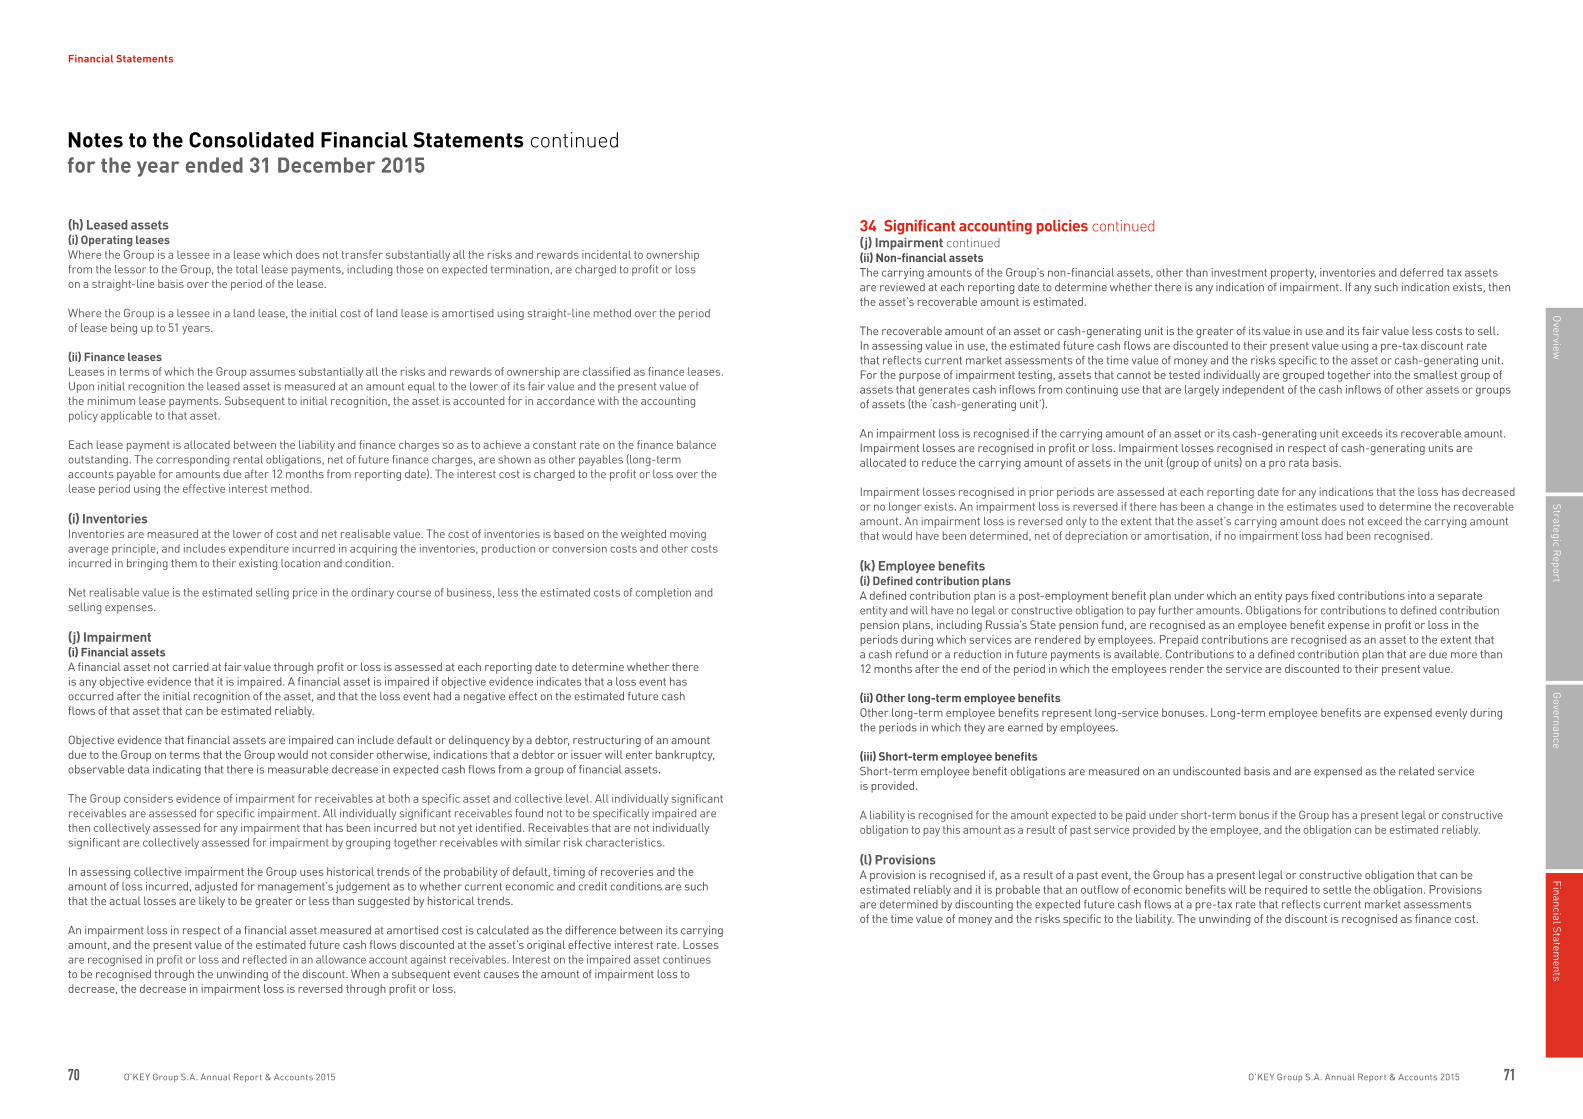
70 71O’KEY Group S.A. Annual Report & Accounts 2015 O’KEY Group S.A. Annual Report & Accounts 2015
Governance
Financial Statements
Strategic Report
Overview
Financial Statements
(h) Leased assets(i) Operating leasesWhere the Group is a lessee in a lease which does not transfer substantially all the risks and rewards incidental to ownership from the lessor to the Group, the total lease payments, including those on expected termination, are charged to profit or loss on a straight-line basis over the period of the lease.
Where the Group is a lessee in a land lease, the initial cost of land lease is amortised using straight-line method over the period of lease being up to 51 years.
(ii) Finance leasesLeases in terms of which the Group assumes substantially all the risks and rewards of ownership are classified as finance leases. Upon initial recognition the leased asset is measured at an amount equal to the lower of its fair value and the present value of the minimum lease payments. Subsequent to initial recognition, the asset is accounted for in accordance with the accounting policy applicable to that asset.
Each lease payment is allocated between the liability and finance charges so as to achieve a constant rate on the finance balance outstanding. The corresponding rental obligations, net of future finance charges, are shown as other payables (long-term accounts payable for amounts due after 12 months from reporting date). The interest cost is charged to the profit or loss over the lease period using the effective interest method.
(i) InventoriesInventories are measured at the lower of cost and net realisable value. The cost of inventories is based on the weighted moving average principle, and includes expenditure incurred in acquiring the inventories, production or conversion costs and other costs incurred in bringing them to their existing location and condition.
Net realisable value is the estimated selling price in the ordinary course of business, less the estimated costs of completion and selling expenses.
(j) Impairment (i) Financial assetsA financial asset not carried at fair value through profit or loss is assessed at each reporting date to determine whether there is any objective evidence that it is impaired. A financial asset is impaired if objective evidence indicates that a loss event has occurred after the initial recognition of the asset, and that the loss event had a negative effect on the estimated future cash flows of that asset that can be estimated reliably.
Objective evidence that financial assets are impaired can include default or delinquency by a debtor, restructuring of an amount due to the Group on terms that the Group would not consider otherwise, indications that a debtor or issuer will enter bankruptcy, observable data indicating that there is measurable decrease in expected cash flows from a group of financial assets.
The Group considers evidence of impairment for receivables at both a specific asset and collective level. All individually significant receivables are assessed for specific impairment. All individually significant receivables found not to be specifically impaired are then collectively assessed for any impairment that has been incurred but not yet identified. Receivables that are not individually significant are collectively assessed for impairment by grouping together receivables with similar risk characteristics.
In assessing collective impairment the Group uses historical trends of the probability of default, timing of recoveries and the amount of loss incurred, adjusted for management’s judgement as to whether current economic and credit conditions are such that the actual losses are likely to be greater or less than suggested by historical trends.
An impairment loss in respect of a financial asset measured at amortised cost is calculated as the difference between its carrying amount, and the present value of the estimated future cash flows discounted at the asset’s original effective interest rate. Losses are recognised in profit or loss and reflected in an allowance account against receivables. Interest on the impaired asset continues to be recognised through the unwinding of the discount. When a subsequent event causes the amount of impairment loss to decrease, the decrease in impairment loss is reversed through profit or loss.
Notes to the Consolidated Financial Statements continuedfor the year ended 31 December 2015
34 Significant accounting policies continued(j) Impairment continued(ii) Non-financial assetsThe carrying amounts of the Group’s non-financial assets, other than investment property, inventories and deferred tax assets are reviewed at each reporting date to determine whether there is any indication of impairment. If any such indication exists, then the asset’s recoverable amount is estimated.
The recoverable amount of an asset or cash-generating unit is the greater of its value in use and its fair value less costs to sell. In assessing value in use, the estimated future cash flows are discounted to their present value using a pre-tax discount rate that reflects current market assessments of the time value of money and the risks specific to the asset or cash-generating unit. For the purpose of impairment testing, assets that cannot be tested individually are grouped together into the smallest group of assets that generates cash inflows from continuing use that are largely independent of the cash inflows of other assets or groups of assets (the ‘cash-generating unit’).
An impairment loss is recognised if the carrying amount of an asset or its cash-generating unit exceeds its recoverable amount. Impairment losses are recognised in profit or loss. Impairment losses recognised in respect of cash-generating units are allocated to reduce the carrying amount of assets in the unit (group of units) on a pro rata basis.
Impairment losses recognised in prior periods are assessed at each reporting date for any indications that the loss has decreased or no longer exists. An impairment loss is reversed if there has been a change in the estimates used to determine the recoverable amount. An impairment loss is reversed only to the extent that the asset’s carrying amount does not exceed the carrying amount that would have been determined, net of depreciation or amortisation, if no impairment loss had been recognised.
(k) Employee benefits(i) Defined contribution plansA defined contribution plan is a post-employment benefit plan under which an entity pays fixed contributions into a separate entity and will have no legal or constructive obligation to pay further amounts. Obligations for contributions to defined contribution pension plans, including Russia’s State pension fund, are recognised as an employee benefit expense in profit or loss in the periods during which services are rendered by employees. Prepaid contributions are recognised as an asset to the extent that a cash refund or a reduction in future payments is available. Contributions to a defined contribution plan that are due more than 12 months after the end of the period in which the employees render the service are discounted to their present value.
(ii) Other long-term employee benefitsOther long-term employee benefits represent long-service bonuses. Long-term employee benefits are expensed evenly during the periods in which they are earned by employees.
(iii) Short-term employee benefitsShort-term employee benefit obligations are measured on an undiscounted basis and are expensed as the related service is provided.
A liability is recognised for the amount expected to be paid under short-term bonus if the Group has a present legal or constructive obligation to pay this amount as a result of past service provided by the employee, and the obligation can be estimated reliably.
(l) ProvisionsA provision is recognised if, as a result of a past event, the Group has a present legal or constructive obligation that can be estimated reliably and it is probable that an outflow of economic benefits will be required to settle the obligation. Provisions are determined by discounting the expected future cash flows at a pre-tax rate that reflects current market assessments of the time value of money and the risks specific to the liability. The unwinding of the discount is recognised as finance cost.
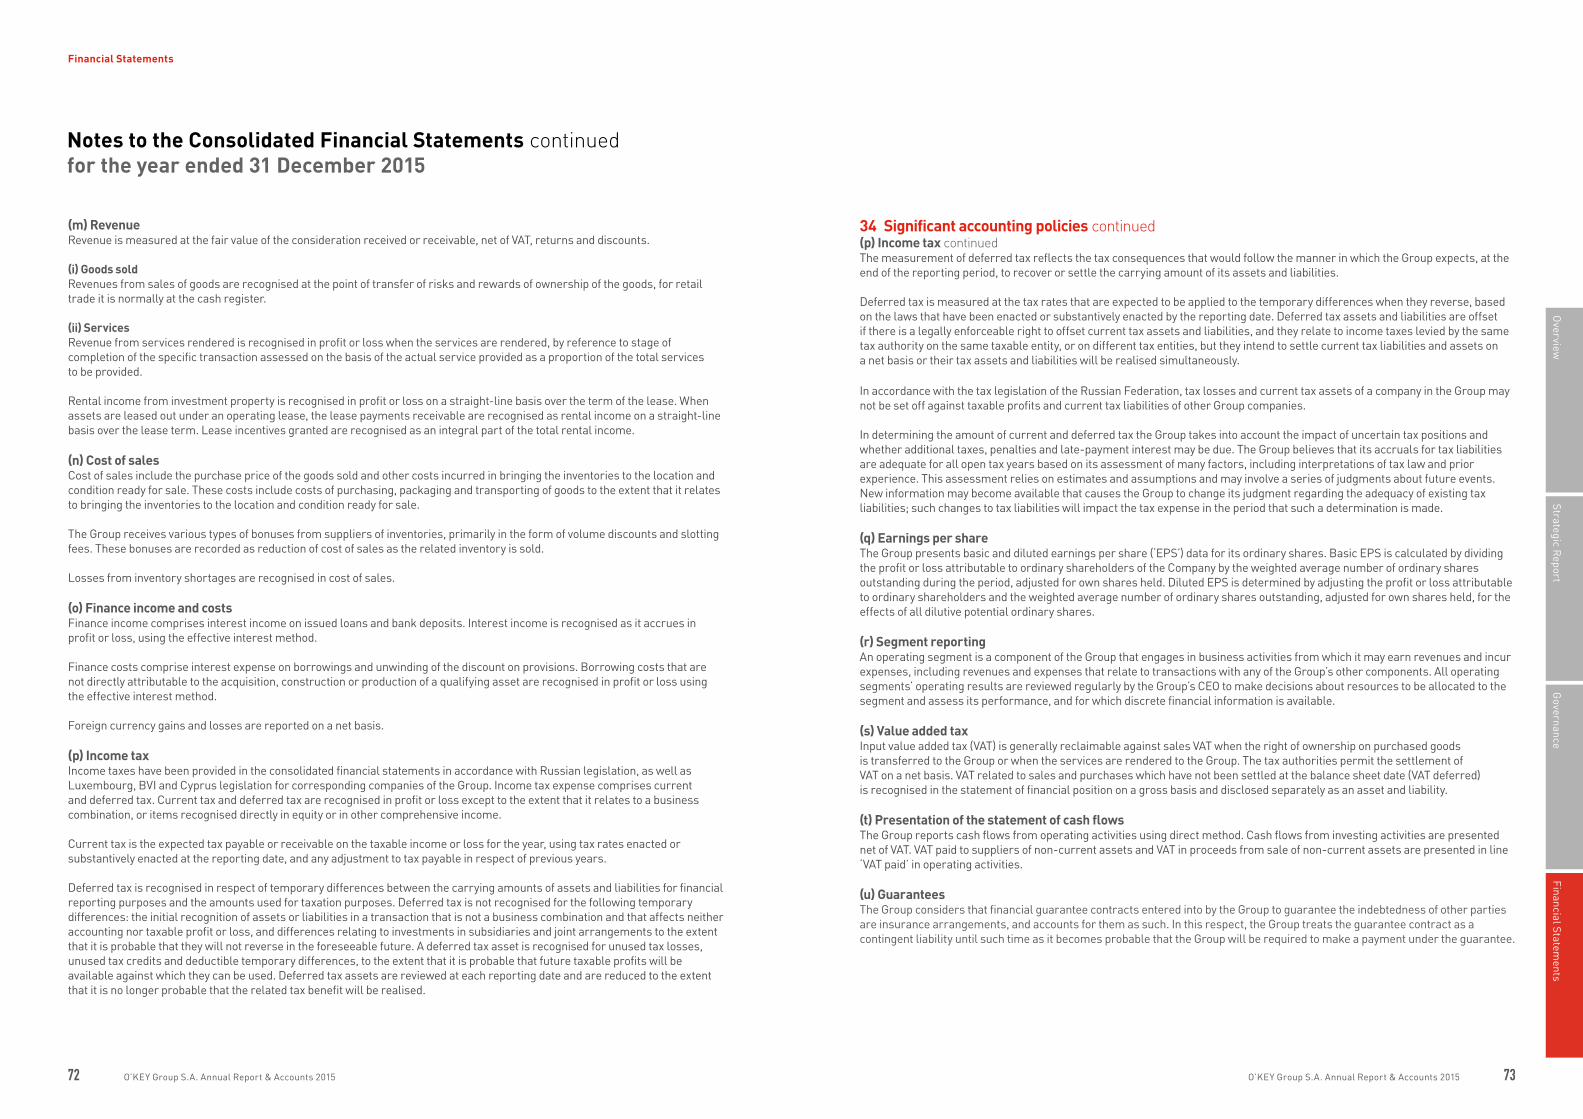
72 73O’KEY Group S.A. Annual Report & Accounts 2015 O’KEY Group S.A. Annual Report & Accounts 2015
Governance
Financial Statements
Strategic Report
Overview
Financial Statements
(m) RevenueRevenue is measured at the fair value of the consideration received or receivable, net of VAT, returns and discounts.
(i) Goods soldRevenues from sales of goods are recognised at the point of transfer of risks and rewards of ownership of the goods, for retail trade it is normally at the cash register.
(ii) Services Revenue from services rendered is recognised in profit or loss when the services are rendered, by reference to stage of completion of the specific transaction assessed on the basis of the actual service provided as a proportion of the total services to be provided.
Rental income from investment property is recognised in profit or loss on a straight-line basis over the term of the lease. When assets are leased out under an operating lease, the lease payments receivable are recognised as rental income on a straight-line basis over the lease term. Lease incentives granted are recognised as an integral part of the total rental income.
(n) Cost of salesCost of sales include the purchase price of the goods sold and other costs incurred in bringing the inventories to the location and condition ready for sale. These costs include costs of purchasing, packaging and transporting of goods to the extent that it relates to bringing the inventories to the location and condition ready for sale.
The Group receives various types of bonuses from suppliers of inventories, primarily in the form of volume discounts and slotting fees. These bonuses are recorded as reduction of cost of sales as the related inventory is sold.
Losses from inventory shortages are recognised in cost of sales.
(o) Finance income and costsFinance income comprises interest income on issued loans and bank deposits. Interest income is recognised as it accrues in profit or loss, using the effective interest method.
Finance costs comprise interest expense on borrowings and unwinding of the discount on provisions. Borrowing costs that are not directly attributable to the acquisition, construction or production of a qualifying asset are recognised in profit or loss using the effective interest method.
Foreign currency gains and losses are reported on a net basis.
(p) Income taxIncome taxes have been provided in the consolidated financial statements in accordance with Russian legislation, as well as Luxembourg, BVI and Cyprus legislation for corresponding companies of the Group. Income tax expense comprises current and deferred tax. Current tax and deferred tax are recognised in profit or loss except to the extent that it relates to a business combination, or items recognised directly in equity or in other comprehensive income.
Current tax is the expected tax payable or receivable on the taxable income or loss for the year, using tax rates enacted or substantively enacted at the reporting date, and any adjustment to tax payable in respect of previous years.
Deferred tax is recognised in respect of temporary differences between the carrying amounts of assets and liabilities for financial reporting purposes and the amounts used for taxation purposes. Deferred tax is not recognised for the following temporary differences: the initial recognition of assets or liabilities in a transaction that is not a business combination and that affects neither accounting nor taxable profit or loss, and differences relating to investments in subsidiaries and joint arrangements to the extent that it is probable that they will not reverse in the foreseeable future. A deferred tax asset is recognised for unused tax losses, unused tax credits and deductible temporary differences, to the extent that it is probable that future taxable profits will be available against which they can be used. Deferred tax assets are reviewed at each reporting date and are reduced to the extent that it is no longer probable that the related tax benefit will be realised.
Notes to the Consolidated Financial Statements continuedfor the year ended 31 December 2015
34 Significant accounting policies continued(p) Income tax continuedThe measurement of deferred tax reflects the tax consequences that would follow the manner in which the Group expects, at the end of the reporting period, to recover or settle the carrying amount of its assets and liabilities.
Deferred tax is measured at the tax rates that are expected to be applied to the temporary differences when they reverse, based on the laws that have been enacted or substantively enacted by the reporting date. Deferred tax assets and liabilities are offset if there is a legally enforceable right to offset current tax assets and liabilities, and they relate to income taxes levied by the same tax authority on the same taxable entity, or on different tax entities, but they intend to settle current tax liabilities and assets on a net basis or their tax assets and liabilities will be realised simultaneously.
In accordance with the tax legislation of the Russian Federation, tax losses and current tax assets of a company in the Group may not be set off against taxable profits and current tax liabilities of other Group companies.
In determining the amount of current and deferred tax the Group takes into account the impact of uncertain tax positions and whether additional taxes, penalties and late-payment interest may be due. The Group believes that its accruals for tax liabilities are adequate for all open tax years based on its assessment of many factors, including interpretations of tax law and prior experience. This assessment relies on estimates and assumptions and may involve a series of judgments about future events. New information may become available that causes the Group to change its judgment regarding the adequacy of existing tax liabilities; such changes to tax liabilities will impact the tax expense in the period that such a determination is made.
(q) Earnings per shareThe Group presents basic and diluted earnings per share (‘EPS’) data for its ordinary shares. Basic EPS is calculated by dividing the profit or loss attributable to ordinary shareholders of the Company by the weighted average number of ordinary shares outstanding during the period, adjusted for own shares held. Diluted EPS is determined by adjusting the profit or loss attributable to ordinary shareholders and the weighted average number of ordinary shares outstanding, adjusted for own shares held, for the effects of all dilutive potential ordinary shares.
(r) Segment reportingAn operating segment is a component of the Group that engages in business activities from which it may earn revenues and incur expenses, including revenues and expenses that relate to transactions with any of the Group’s other components. All operating segments’ operating results are reviewed regularly by the Group’s CEO to make decisions about resources to be allocated to the segment and assess its performance, and for which discrete financial information is available.
(s) Value added taxInput value added tax (VAT) is generally reclaimable against sales VAT when the right of ownership on purchased goods is transferred to the Group or when the services are rendered to the Group. The tax authorities permit the settlement of VAT on a net basis. VAT related to sales and purchases which have not been settled at the balance sheet date (VAT deferred) is recognised in the statement of financial position on a gross basis and disclosed separately as an asset and liability.
(t) Presentation of the statement of cash flowsThe Group reports cash flows from operating activities using direct method. Cash flows from investing activities are presented net of VAT. VAT paid to suppliers of non-current assets and VAT in proceeds from sale of non-current assets are presented in line ‘VAT paid’ in operating activities.
(u) GuaranteesThe Group considers that financial guarantee contracts entered into by the Group to guarantee the indebtedness of other parties are insurance arrangements, and accounts for them as such. In this respect, the Group treats the guarantee contract as a contingent liability until such time as it becomes probable that the Group will be required to make a payment under the guarantee.
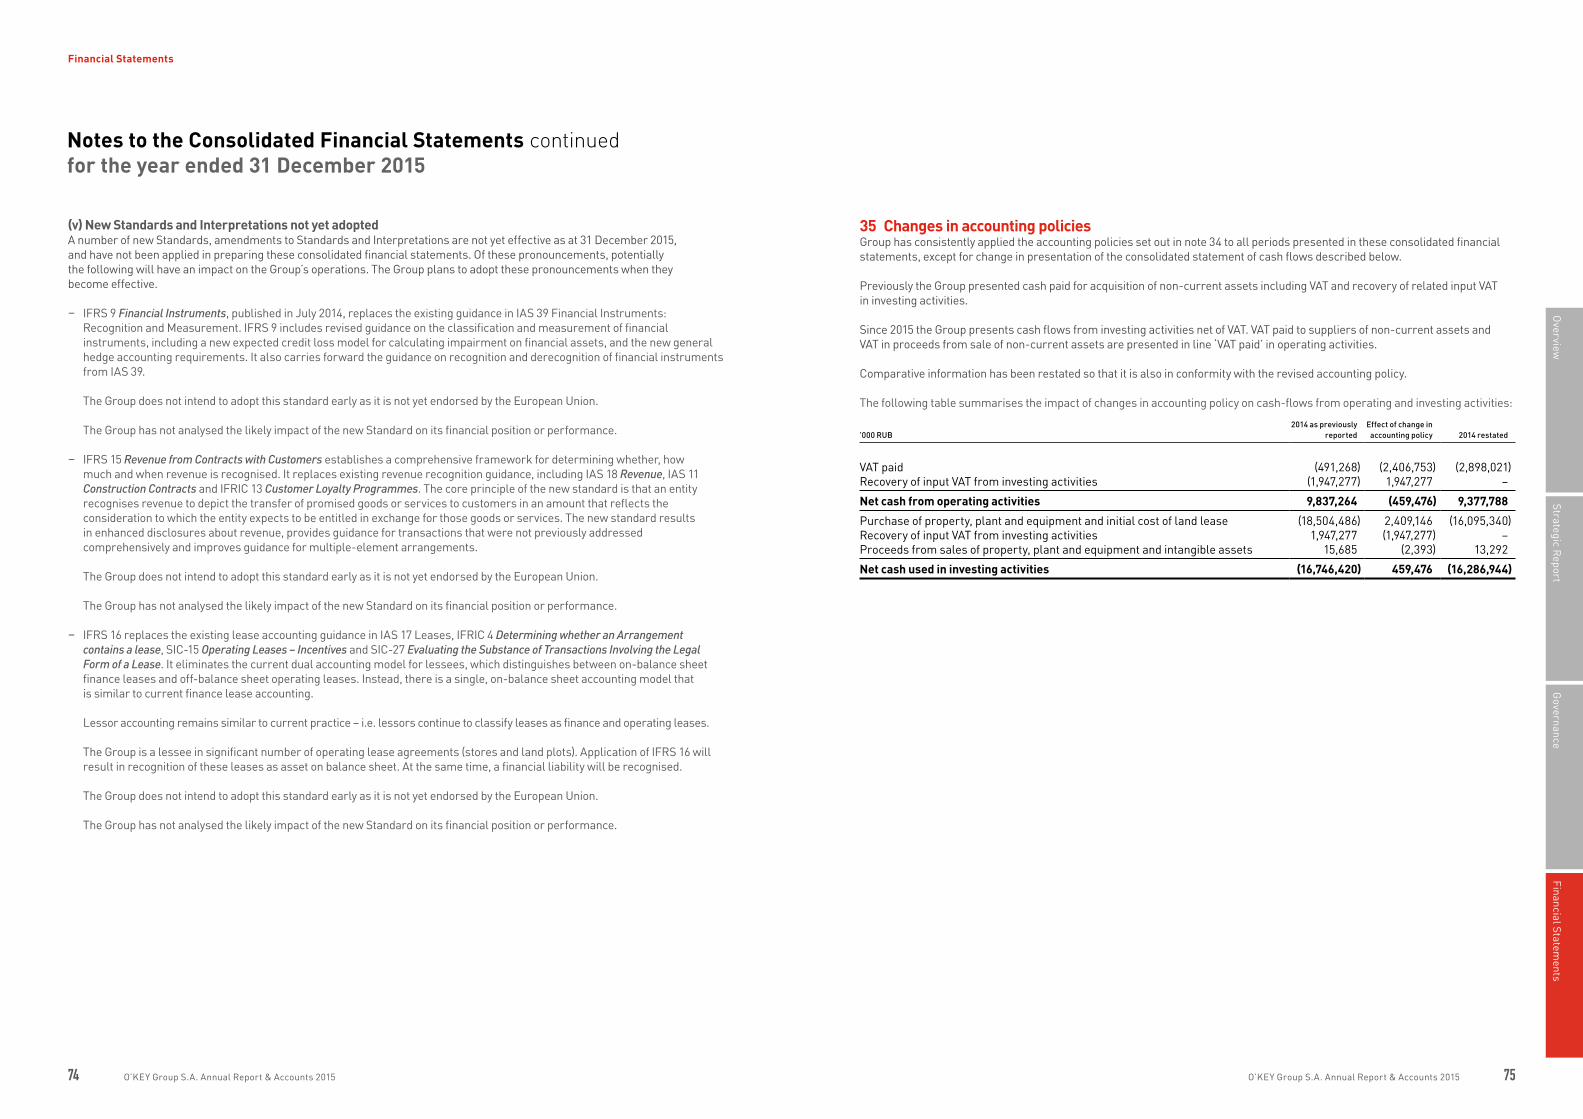
74 75O’KEY Group S.A. Annual Report & Accounts 2015 O’KEY Group S.A. Annual Report & Accounts 2015
Governance
Financial Statements
Strategic Report
Overview
Financial Statements
(v) New Standards and Interpretations not yet adoptedA number of new Standards, amendments to Standards and Interpretations are not yet effective as at 31 December 2015, and have not been applied in preparing these consolidated financial statements. Of these pronouncements, potentially the following will have an impact on the Group’s operations. The Group plans to adopt these pronouncements when they become effective.
– IFRS 9 Financial Instruments, published in July 2014, replaces the existing guidance in IAS 39 Financial Instruments: Recognition and Measurement. IFRS 9 includes revised guidance on the classification and measurement of financial instruments, including a new expected credit loss model for calculating impairment on financial assets, and the new general hedge accounting requirements. It also carries forward the guidance on recognition and derecognition of financial instruments from IAS 39.
The Group does not intend to adopt this standard early as it is not yet endorsed by the European Union.
The Group has not analysed the likely impact of the new Standard on its financial position or performance.
– IFRS 15 Revenue from Contracts with Customers establishes a comprehensive framework for determining whether, how much and when revenue is recognised. It replaces existing revenue recognition guidance, including IAS 18 Revenue, IAS 11 Construction Contracts and IFRIC 13 Customer Loyalty Programmes. The core principle of the new standard is that an entity recognises revenue to depict the transfer of promised goods or services to customers in an amount that reflects the consideration to which the entity expects to be entitled in exchange for those goods or services. The new standard results in enhanced disclosures about revenue, provides guidance for transactions that were not previously addressed comprehensively and improves guidance for multiple-element arrangements.
The Group does not intend to adopt this standard early as it is not yet endorsed by the European Union.
The Group has not analysed the likely impact of the new Standard on its financial position or performance.
– IFRS 16 replaces the existing lease accounting guidance in IAS 17 Leases, IFRIC 4 Determining whether an Arrangement contains a lease, SIC-15 Operating Leases – Incentives and SIC-27 Evaluating the Substance of Transactions Involving the Legal Form of a Lease. It eliminates the current dual accounting model for lessees, which distinguishes between on-balance sheet finance leases and off-balance sheet operating leases. Instead, there is a single, on-balance sheet accounting model that is similar to current finance lease accounting.
Lessor accounting remains similar to current practice – i.e. lessors continue to classify leases as finance and operating leases.
The Group is a lessee in significant number of operating lease agreements (stores and land plots). Application of IFRS 16 will result in recognition of these leases as asset on balance sheet. At the same time, a financial liability will be recognised.
The Group does not intend to adopt this standard early as it is not yet endorsed by the European Union.
The Group has not analysed the likely impact of the new Standard on its financial position or performance.
Notes to the Consolidated Financial Statements continuedfor the year ended 31 December 2015
35 Changes in accounting policiesGroup has consistently applied the accounting policies set out in note 34 to all periods presented in these consolidated financial statements, except for change in presentation of the consolidated statement of cash flows described below.
Previously the Group presented cash paid for acquisition of non-current assets including VAT and recovery of related input VAT in investing activities.
Since 2015 the Group presents cash flows from investing activities net of VAT. VAT paid to suppliers of non-current assets and VAT in proceeds from sale of non-current assets are presented in line ‘VAT paid’ in operating activities.
Comparative information has been restated so that it is also in conformity with the revised accounting policy.
The following table summarises the impact of changes in accounting policy on cash-flows from operating and investing activities:
’000 RUB2014 as previously
reportedEffect of change in accounting policy 2014 restated
VAT paid (491,268) (2,406,753) (2,898,021)Recovery of input VAT from investing activities (1,947,277) 1,947,277 –
Net cash from operating activities 9,837,264 (459,476) 9,377,788
Purchase of property, plant and equipment and initial cost of land lease (18,504,486) 2,409,146 (16,095,340)Recovery of input VAT from investing activities 1,947,277 (1,947,277) –Proceeds from sales of property, plant and equipment and intangible assets 15,685 (2,393) 13,292
Net cash used in investing activities (16,746,420) 459,476 (16,286,944)

76 O’KEY Group S.A. Annual Report & Accounts 2015
Financial Statements
Notes
Content by Edward Austinwww.edward-austin.com+44 (0)207 193 4402

Nikolay Minashin
Head of Investor Relations
+ 7 495 663 66 77 ext 127
+ 7 985 180 31 07