Outpatient dialysis services - MedPAC
34
Outpatient dialysis services CHAPTER 6
-
Upload
khangminh22 -
Category
Documents
-
view
1 -
download
0
Transcript of Outpatient dialysis services - MedPAC

Outpatient dialysis services
C H A P T E R6

R E C O M M E N D A T I O N
6 For calendar year 2022, the Congress should eliminate the update to the 2021 Medicare end-stage renal disease prospective payment system base rate.
COMMISSIONER VOTES: YES 17 • NO 0 • NOT VOTING 0 • ABSENT 0
163 Repo r t t o t h e Cong r e s s : Med i ca r e Paymen t P o l i c y | Ma r ch 2021
Outpatient dialysis services
Chapter summary
Outpatient dialysis services are used to treat the majority of individuals
with end-stage renal disease (ESRD). In 2019, nearly 395,000 beneficiaries
with ESRD on dialysis were covered under traditional fee-for-service (FFS)
Medicare and received dialysis from nearly 7,700 dialysis facilities. Since
2011, Medicare has paid for outpatient dialysis services based on a prospective
payment system (PPS) bundle that includes certain dialysis drugs and ESRD-
related clinical laboratory tests that were previously paid separately. In 2019,
Medicare expenditures for outpatient dialysis services were $12.9 billion. Ten
percent of total spending in 2019 consisted of payments for two calcimimetics
paid under the ESRD PPS’s transitional drug add-on payment adjustment
(TDAPA); this policy pays providers according to the number of units of a
drug and the drug’s average sales price.
In this chapter, we recommend a payment rate update for 2022. Because of
standard data lags, the most recent complete data we have for most payment
adequacy indicators is from 2019. Where relevant, we have considered
the effects of the 2020 coronavirus public health emergency (PHE) on our
indicators and whether those effects are likely to be temporary or permanent.
To the extent that the effects of the PHE are temporary or vary significantly
across outpatient dialysis facilities, they are best addressed through targeted
temporary funding policies rather than a permanent change to all dialysis
facilities’ payment rates in 2022 and future years. Based on information
In this chapter
• Are Medicare payments adequate in 2021?
• How should Medicare payments change in 2022?
C H A P T E R 6

164 Ou tpa t i e n t d i a l y s i s s e r v i c e s : A s s e s s i ng paymen t adequacy and upda t i ng paymen t s
available at the time of publication, we do not anticipate any long-term PHE-related
effects that would warrant inclusion in the annual update to outpatient dialysis
facility payments in 2022.
Assessment of payment adequacy
Our payment adequacy indicators for outpatient dialysis services are generally
positive.
Beneficiaries’ access to care—Growth in the capacity of dialysis facilities and their
continued financial incentive to treat additional Medicare FFS beneficiaries indicate
that beneficiaries’ access to dialysis services has been adequate.
• Capacity and supply of providers—Dialysis facilities appear to have the
capacity to meet demand. Between 2018 and 2019, the number of dialysis
treatment stations grew faster than the number of FFS dialysis beneficiaries (but
kept pace with demand from all dialysis patients).
• Volume of services—Between 2018 and 2019, growth in the number of FFS
dialysis beneficiaries matched growth in the total number of treatments. At
the same time, use of ESRD drugs in the bundle (including erythropoiesis-
stimulating agents, which are used in anemia management) continued to
decline, but at a slower rate than during the initial years of the ESRD PPS
(2011 and 2012). The ESRD PPS created an incentive for providers to be more
judicious about their provision of ESRD drugs that are included in the payment
bundle.
• The marginal profit—The 25 percent marginal profit in 2019 suggests that
dialysis providers have a financial incentive to continue to serve Medicare
beneficiaries.
Quality of care—Between 2014 and 2019, hospitalization, hospital readmission,
and mortality rates remained steady, though the proportion of FFS dialysis
beneficiaries using the emergency department slightly increased. Between 2014 and
2019, the share of beneficiaries using home dialysis, which is associated with better
patient satisfaction, increased.
Providers’ access to capital—Information from investment analysts suggests
that access to capital for dialysis providers continues to be strong. The number of
facilities, particularly for-profit facilities, continues to increase. Under the ESRD
PPS, the two largest dialysis organizations have grown through acquisitions and
mergers with midsize dialysis organizations.
Medicare payments and providers’ costs—Our analysis of Medicare payments
and costs is based on 2018 and 2019 claims and cost report data submitted to CMS
165 Repo r t t o t h e Cong r e s s : Med i ca r e Paymen t P o l i c y | Ma r ch 2021
by freestanding dialysis facilities, which provided 96 percent of all FFS dialysis
treatments in both years. During this period, cost per treatment fell by 4 percent,
while Medicare payment per treatment rose by 2 percent, and the aggregate
Medicare margin increased from 2.1 percent to 8.4 percent. The increase in the
aggregate Medicare margin is linked to the profitability of the TDAPA drugs,
particularly generic oral calcimimetics that became available in 2019. We project
the 2021 Medicare margin will drop to 4 percent, in part due to CMS including
calcimimetics in the ESRD PPS bundled payment, which will promote provider
efficiency.
How should Medicare payments change in 2022?
Under current law, the Medicare FFS base payment rate for dialysis services is
projected to increase by 1.5 percent. Given that most of our indicators of payment
adequacy are positive, the update recommendation is that for 2022, the Congress
should eliminate the update to the 2021 ESRD PPS base rate. ■


167 Repo r t t o t h e Cong r e s s : Med i ca r e Paymen t P o l i c y | Ma r ch 2021
Background
End-stage renal disease (ESRD) is the last stage of chronic kidney disease (CKD) and is characterized by permanent, irreversible kidney failure. Patients with ESRD include those who are treated with dialysis—a process that removes wastes and fluid from the body—and those who have a functioning kidney transplant. Because of the limited number of kidneys available for transplantation and the variation in patients’ suitability for transplantation, about 70 percent of ESRD patients undergo maintenance dialysis (see text box on dialysis treatment choices). Patients receive additional items and services related to their dialysis treatments, including dialysis drugs and biologics to treat conditions such as anemia and bone disease resulting from the loss of kidney function.
The 1972 amendments to the Social Security Act extended Medicare benefits to people with ESRD, including those under age 65. For an individual with ESRD to qualify for Medicare, he or she must be fully or currently insured under the Social Security or Railroad Retirement program or be the spouse or dependent child of an eligible beneficiary.1
In 2019, nearly 395,000 ESRD beneficiaries on dialysis were covered under fee-for-service (FFS) Medicare and received dialysis from nearly 7,700 dialysis facilities.2,3 Since 2011, Medicare has been paying facilities using a prospective payment system (PPS) bundle that includes dialysis drugs (for which facilities previously received separate payments) and services for which other Medicare providers (such as clinical laboratories) previously received separate payments.4 In 2019, Part B spending
Dialysis treatment choices
Dialysis replaces the filtering function of the kidneys when they fail. The two types (modalities) of dialysis—hemodialysis and
peritoneal dialysis (PD)—remove waste products from the bloodstream differently. For each of these two dialysis types, patients may select various protocols.
Most dialysis patients travel to a treatment facility to undergo hemodialysis three times per week, although patients can also undergo hemodialysis at home. Hemodialysis uses an artificial membrane encased in a dialyzer to filter the patient’s blood. Because of recent clinical findings, there is increased interest in more frequent hemodialysis, administered five or more times per week while the patient sleeps, and short (two to three hours per treatment) daily dialysis administered during the day. Research also has increased interest in the use of “every-other-day” hemodialysis; reducing the two-day gap in thrice-weekly hemodialysis could be linked to improved outcomes.
PD, the most common form of home dialysis, uses the lining of the abdomen (peritoneum) as a filter to clear wastes and extra fluid and is usually performed independently in the patient’s home or workplace five
to seven days a week. During treatments, a cleansing fluid (dialysate) is infused into the patient’s abdomen through a catheter. This infusion process (an exchange) is done either manually (continuous ambulatory peritoneal dialysis) or using a machine (automated peritoneal dialysis).
Patients should be given the opportunity to make an informed choice about the type of dialysis they select. Each dialysis method has advantages and disadvantages; no one method is best for everyone. People choose a particular dialysis method for many reasons, including quality of life, patients’ awareness of different treatment methods and personal preferences, and physician training and recommendations. The use of home dialysis has grown since 2009, a trend that has continued under the end-stage renal disease prospective payment system. Some patients switch methods when their conditions or needs change. Although most patients still undergo in-center dialysis, home dialysis remains a viable option for many patients because of such advantages as increased patient satisfaction, better health-related quality of life, and fewer transportation challenges compared with in-center dialysis. ■

168 Ou tpa t i e n t d i a l y s i s s e r v i c e s : A s s e s s i ng paymen t adequacy and upda t i ng paymen t s
the calcimimetics’ add-on payment is the first and only TDAPA that CMS has implemented under the ESRD PPS. Additionally, in 2018 (the most recent data available), Part D payments for ESRD oral-only drugs that were not yet included in the PPS—multiple phosphate binders—totaled nearly $1.2 billion.
In 2019, most of Medicare’s dialysis beneficiaries had FFS coverage. Historically, beneficiaries with ESRD were prohibited from enrolling in Medicare Advantage (MA) plans. However, beneficiaries enrolled in a managed care plan before receiving an ESRD diagnosis can remain in the plan after they are diagnosed. Over time, the share of all Medicare ESRD beneficiaries on dialysis under FFS has gradually declined, while the share of beneficiaries enrolled in MA plans has increased. For example, between 2014 and 2019, the share of MA beneficiaries on dialysis rose from about 17 percent to 24 percent and the share of FFS beneficiaries on dialysis fell from about 83 percent to 76 percent.
In 2000, the Commission recommended that the Congress lift the prohibition on ESRD beneficiaries enrolling in MA (Medicare Payment Advisory Commission 2000). The 21st Century Cures Act allows ESRD beneficiaries to enroll in MA beginning in 2021. In addition, dialysis beneficiaries residing in selected geographic areas have access to ESRD special needs plans (SNPs), a type of chronic condition SNP (C–SNP). As of October 2020, few dialysis beneficiaries—about 5,800—were enrolled in 10 ESRD SNPs operated by 7 managed care organizations in 6 states (Arizona, California, Connecticut, Nevada, New Jersey, and Texas). The Commission recommended that Medicare maintain C–SNPs for beneficiaries with ESRD, HIV/AIDs, or chronic and disabling mental health conditions (Medicare Payment Advisory Commission 2013).
Characteristics of fee-for-service dialysis beneficiaries, 2019Compared with all other Medicare FFS beneficiaries, FFS dialysis beneficiaries are disproportionately younger, male, and Black (Table 6-1). In 2019, 75 percent of FFS dialysis beneficiaries were less than 75 years old, 56 percent were male, and 35 percent were Black. By comparison, of all FFS Medicare beneficiaries, 63 percent were less than 75 years old, 47 percent were male, and 9 percent were Black. A greater share of dialysis beneficiaries resided in urban areas compared with all FFS beneficiaries (83 percent vs. 80 percent).
for Medicare-covered outpatient dialysis services was $12.9 billion. This total includes payments of nearly $1.3 billion for the two ESRD drugs classified as calcimimetics—Sensipar (oral cinacalcet) and Parsabiv (injectable etelcalcetide)—that qualified, beginning in 2018, for a transitional drug add-on payment adjustment (TDAPA) under the ESRD PPS. As of December 2020,
T A B L E6–1 FFS dialysis beneficiaries are
disproportionately younger, male, and Black compared with all
Medicare FFS beneficiaries, 2019
Share of FFS:
Dialysis beneficiaries
All other beneficiaries
AgeUnder 45 years 10% 3%45–64 years 37 1165–74 years 28 4975–84 years 18 2685+ years 6 12
SexMale 56 47Female 44 53
RaceWhite 47 81Black 35 9Hispanic 8 2Asian 4 2All others 6 5
Residence, by type of countyUrban 83 80Micropolitan 10 11Rural, adjacent to urban 5 5Rural, not adjacent to urban 2 4Frontier 1 1
Note: FFS (fee-for-service). “All other beneficiaries” excludes beneficiaries on dialysis and those who have received a kidney transplant. Beneficiary location reflects the beneficiary’s county of residence in one of four categories (urban, micropolitan, rural adjacent to urban, and rural nonadjacent to urban) based on an aggregation of the Urban Influence Codes. Frontier counties have six or fewer people per square mile. Totals may not sum to 100 percent due to rounding.
Source: Data compiled by MedPAC from enrollment data and claims submitted by dialysis facilities to CMS.

169 Repo r t t o t h e Cong r e s s : Med i ca r e Paymen t P o l i c y | Ma r ch 2021
To help pay for Part A and Part B cost sharing, some FFS beneficiaries have private or other public coverage that supplements the FFS benefit package. Compared with all FFS beneficiaries, FFS dialysis beneficiaries are:
• more likely to be dually eligible for Medicare and Medicaid (18 percent vs. 46 percent),
• less likely to have coverage from other sources such as Medigap and employer-sponsored health plans (58 percent vs. 30 percent), and
• as likely to have no supplemental coverage (about 24 percent for each group).
In addition, since 1997, the American Kidney Fund has maintained a Health Insurance Premium Program that helps pay dialysis patients’ health insurance premiums, including Medicare Part B premiums.5
Over the last decade, the adjusted rate of new ESRD cases, or incidence rate (which includes patients of all types of health coverage who initiate dialysis or receive a kidney transplant), has declined. Between 2008 and 2018 (the most recent year of data available), the adjusted incidence rate decreased by 1 percent per year, from 417 per million people to 385 per million people, the lowest incidence rate since 1998 (United States Renal Data System 2020). We estimate that in 2019, nearly 84,000 FFS beneficiaries were new to dialysis, and about half (45 percent) were under age 65 and thus entitled to Medicare based on ESRD (with or without disability).6
The timing of starting dialysis is a matter of clinical judgment, guided by values of residual kidney function and the symptoms and comorbidities of affected patients. From the mid-1990s through 2010, the Commission’s analysis of data (from CMS’s ESRD Medical Evidence Report) suggests a trend toward initiating dialysis earlier in the course of CKD. The proportion of new dialysis patients (of all types of health coverage) with higher levels of residual kidney function steadily increased between 1996 and 2010, from 13 percent to nearly 44 percent. (An estimated glomerular filtration rate (eGFR)—a measure of residual kidney function— above 10 mL/min/1.73 m2 is considered a higher level of residual kidney function. Lower values of this measure suggest comparatively less residual kidney function.)
While the share of patients initiating dialysis earlier in the course of CKD decreased modestly between 2011 and 2019 (from 43 percent to 40 percent), the share
remains three times higher than in 1996. Researchers have questioned this early initiation of dialysis in those with late-stage CKD, concluding that it is not associated with improved survival or clinical outcomes (Cooper et al. 2010, Evans et al. 2011, Kazmi et al. 2005, Stel et al. 2009, Traynor et al. 2002). Of the few randomized controlled trials (RCTs) on this topic, the most influential RCT found that survival is similar between patients for whom dialysis is initiated early (with an eGFR equal to 10.0 mL/min/1.73 m2 to 14.0 mL/min/1.73 m2) and those for whom dialysis is electively delayed (with an eGFR equal to 5.0 mL/min/1.73 m2 to 7.0 mL/min/1.73 m2) and concluded that dialysis can be delayed for some patients until the eGFR drops below 7.0 mL/min/1.73 m2 or until more traditional clinical indicators for the initiation of dialysis are present (Cooper et al. 2010). Since publication of this RCT in 2010, the share of early dialysis initiation has begun to level off, but it has not yet returned to its earlier levels.
Better primary care management of the risk factors for CKD—particularly hypertension and diabetes, which together are the primary causes of roughly 7 of 10 new ESRD cases—can help prevent or delay the illness’s onset. Payers and dialysis providers are testing interventions among CKD patients to improve their clinical outcomes (e.g., by reducing hospitalizations), prevent or slow kidney disease progression, and increase their preparedness for ESRD (e.g., by educating patients about treatment alternatives, including transplantation and home dialysis). The Center for Medicare & Medicaid Innovation (CMMI) has sponsored several voluntary and mandatory models to manage the care of individuals with late-stage CKD and with ESRD. Some dialysis providers have entered into agreements with commercial payers to provide care coordination to individuals with CKD and ESRD. The Commission has long argued that primary care services are undervalued in Medicare’s fee schedule and has made recommendations to support primary care, which in turn could support better management of kidney disease risk factors.
Since 2011, Medicare has paid for dialysis services under the ESRD PPS To treat ESRD, dialysis beneficiaries receive care from two principal providers: (1) the clinicians (typically nephrologists) who prescribe and manage the provision of dialysis and establish the beneficiary’s plan of care and (2) facilities that provide dialysis treatments in a dialysis

170 Ou tpa t i e n t d i a l y s i s s e r v i c e s : A s s e s s i ng paymen t adequacy and upda t i ng paymen t s
decline in dialysis drug use under the ESRD PPS.10 In 2016, the agency recalibrated and redefined the patient-level and facility-level payment adjusters that are used to calculate each patient’s adjusted payment per treatment.11 In addition, since 2018, transitional add-on payments have been used to pay for certain drugs (calcimimetics) and are available for qualifying equipment and supplies.
Transitional add-on payments for new drugs, devices, and equipment
CMS uses transitional add-on payment policies for:
• ESRD oral-only drugs that were intended to be in the bundle in 2011 but were delayed due to actions by regulatory and statutory provisions—With the availability of an injectable calcimimetic in 2017, CMS no longer considered these drugs oral-only and, between 2018 and 2020, paid for them under the ESRD PPS using a transitional drug add-on payment adjustment (TDAPA).12,13 As summarized in the text box on injectable and oral calcimimetics, in 2021, CMS will pay for calcimimetics under the PPS bundled payment rate.
• New ESRD drugs in a new ESRD functional category—To comply with the statute’s mandate for including new ESRD-related injectable and intravenous drugs in the prospective payment bundle, the agency finalized a policy in 2016 that pays a TDAPA for new ESRD-related injectable drugs not in 1 of 11 ESRD-related functional categories of drugs included in the PPS payment bundle.14 (Functional categories are similar to therapeutic classes of drugs.) A qualifying drug is paid based on its average sales price (ASP) for at least two years, until sufficient rate-setting data are available. When the TDAPA period ends, CMS includes the drug in the prospective payment bundle (by adding a new functional category or modifying an existing one) and adjusts the PPS base rate, if appropriate, to reflect changes to the functional categories.
• Certain new ESRD drugs in an existing ESRD functional category—CMS expanded the TDAPA policy in 2020 to apply to new ESRD drugs in an existing functional category (based on the agency’s statutory authority). CMS pays a TDAPA using the product’s ASP for a two-year period; thereafter, it is included in the PPS bundle without any change to the ESRD PPS base rate. CMS does not apply a
center or support and supervise the care of beneficiaries on home dialysis. Medicare uses different methods to pay for ESRD clinician and facility services. Clinicians receive a monthly capitated payment established in the Part B physician fee schedule for outpatient dialysis–related management services (which includes managing the dialysis prescription and prescribing dialysis drugs); payment varies based on the number of visits per month, the beneficiary’s age (adults vs. pediatric beneficiaries under age 20), and whether the beneficiary receives dialysis in a facility or at home.7 While our work in this report focuses on Medicare’s payments to facilities, it is important to recognize that facilities and clinicians collaborate to care for dialysis beneficiaries. CMMI’s models requiring facilities and nephrologists to work together—Medicare’s Comprehensive ESRD Care Model, a shared savings program that began in 2015 and ends in 2021, and the ESRD Treatment Choices Model, a model that is intended to promote home dialysis and kidney transplantation, that begins in 2021 and ends in 2027—acknowledge the need for collaboration.
To improve provider efficiency, in 2011 Medicare began a PPS for outpatient dialysis services that expanded the prospective payment bundle to add (1) Part B dialysis drugs, laboratory tests, and other ESRD items and services that were previously billable separately and (2) Part D dialysis oral-only drugs—calcimimetics and phosphate binders. Clinicians use drugs in these two therapeutic classes to manage mineral bone disorders, a complication of advanced CKD.
Under the outpatient ESRD PPS, the unit of payment is a single dialysis treatment. For adult dialysis beneficiaries (18 years or older), the base payment rate does not differ by type of dialysis—in-center dialysis versus home dialysis—but rather by patient-level characteristics (age, body measurement characteristics, onset of dialysis, and selected acute and chronic comorbidities) and facility-level factors (low treatment volume, rural location, and local input prices).8 Medicare pays facilities furnishing dialysis treatments in the facility or in a patient’s home for up to three treatments per week, unless there is documented medical justification for more than three weekly treatments.9
Since it was implemented in 2011, the outpatient ESRD PPS has undergone several significant changes. In 2014, CMS rebased the base payment rate, as mandated by the American Taxpayer Relief Act of 2012, to account for the

171 Repo r t t o t h e Cong r e s s : Med i ca r e Paymen t P o l i c y | Ma r ch 2021
under this transitional payment policy. CMS sets the new item’s payment rate at 65 percent of the price that the Medicare administrative contractors (MACs) establish.18
In our June 2020 report to the Congress, the Commission recommended that the Congress direct the Secretary to eliminate the TDAPA for new drugs that are in an existing ESRD functional category that is already included in the payment bundle. Doing so would maintain the structure of the ESRD PPS and avoid the introduction of incentives to unbundle services covered under the PPS. In addition, eliminating the TDAPA for these drugs would create pressure for drug manufacturers to constrain the growth of prices for new and existing ESRD drugs. At market entry, such new drugs would be included in the ESRD PPS bundle, with no update to the base payment rate.
In our comment letters on CMS’s proposals to implement the TPNIES, the Commission argued for maintaining the
substantial clinical improvement criterion to determine a new drug’s eligibility. Drugs that do not qualify for this TDAPA include generic equivalents and new dosage forms of an active ingredient that the Food and Drug Administration (FDA) has already approved, among others.16 To date, no new drugs (whether in an ESRD functional category or not) have qualified for this adjustment.
• New ESRD equipment and supplies that are not capital assets and home dialysis machines (a capital asset) when used in the home for a single patient17—Based on its regulatory authority, CMS pays a transitional add-on payment adjustment for new and innovative equipment and supplies (TPNIES) for a two-year period; thereafter, it is included in the bundle, without any change to the ESRD PPS base rate. Unlike ESRD drugs, a substantial clinical improvement standard is used to determine eligibility
In 2021, injectable and oral calcimimetics are included in the ESRD PPS payment bundle
In 2021, injectable and oral calcimimetics are included in the end-stage renal disease (ESRD) prospective payment system (PPS) bundle, and the
base rate increases by $9.93 per treatment (in 2020 dollars). This one-time addition to the ESRD PPS base rate is based on oral and injectable calcimimetic utilization, using dialysis facility claims from the third quarter of 2018 through the fourth quarter of 2019. Using this period accounts for an increase in the use of oral generic calcimimetics, a steep decrease in the oral brand calcimimetic (following loss of its patent exclusivity), and an increase in the use of the injectable brand version. CMS then multiplied oral and injectable calcimimetic utilization by their respective average sales prices (ASPs) from the fourth quarter of 2020, which represents the lowest ASP value for both products between 2018 and 2020.15
The agency did not use 2020 calcimimetic utilization in the rate-setting process because the public health
emergency may have altered practice patterns. In addition, the rate-setting process is not based on only 2019 calcimimetic utilization out of concern that the increased use of the injectable in that year would have overestimated the PPS payment to account for the cost of calcimimetics. According to CMS, “the 2018 claims data may have demonstrated low uptake for the injectable calcimimetic, but it also may reflect that the significant upswings in utilization of the injectable calcimimetic in 2019 were from ESRD facilities anticipating CMS ending the TDAPA [transitional drug add-on payment adjustment] for calcimimetics” (Centers for Medicare & Medicaid Services 2020). During the early years of the ESRD PPS, drug utilization substantially declined as providers became more efficient. CMS intends to revisit the Medicare expenditures for calcimimetics in the future, such as when a generic injectable comes on the market. ■
172 Ou tpa t i e n t d i a l y s i s s e r v i c e s : A s s e s s i ng paymen t adequacy and upda t i ng paymen t s
This second measurement system, which CMS established through a subregulatory process, assigns each facility from 1 to 5 stars; more stars mean that a dialysis facility performs better on quality compared with all other facilities. The Commission has questioned why CMS finds a second quality system necessary for dialysis facilities and has raised concerns that beneficiaries and their families might be confused if a facility’s star rating and QIP scores diverge, which could occur because the measurement systems use different methods and measures to calculate a facility’s performance score (Medicare Payment Advisory Commission 2014).19
Are Medicare payments adequate in 2021?
To address whether payments for 2021 are adequate to cover the costs that efficient providers incur and how much providers’ costs are likely to change in the update year (2022), we examine several indicators of payment adequacy. We assess beneficiaries’ access to care by examining the capacity of dialysis facilities and changes over time in the volume of services provided. We also examine quality of care, providers’ access to capital, and the relationship between Medicare’s payments and facilities’ costs.
While impossible to predict the future with any certainty given the evolving coronavirus pandemic, we anticipate most dialysis payment adequacy indicators will remain positive in 2021. (For a description of how the coronavirus pandemic has been incorporated into our payment adequacy framework, see text box, pp. 174–175.)
Beneficiaries’ access to care: Indicators continue to be favorableOur analysis of access indicators—including the capacity of providers to meet beneficiary demand, changes in the volume of services, and the marginal profitability of Medicare dialysis beneficiaries under the PPS—shows that beneficiaries’ access to care remains favorable.
Capacity has exceeded FFS beneficiary demand
Growth in the number of dialysis facilities and in-center treatment stations alongside growth in the number of dialysis beneficiaries suggests that, between 2014 and 2019, provider capacity has exceeded demand for care
structure of the ESRD PPS and not creating policies that would unbundle services covered under the ESRD PPS or create incentives that encourage high launch prices of technologies. We said that if the agency proceeded with this policy, then CMS should require that the new product be an advance in medical technology that substantially improves beneficiaries’ outcomes relative to technologies in the PPS payment bundle and should not make duplicative payments for new equipment and supplies by paying under the TPNIES for two years and paying for equipment and supplies with a similar purpose or use that is already paid under the ESRD PPS base rate.
Linking payments to quality of care
Since 2012, outpatient dialysis payments are linked to the quality of care that facilities provide under the ESRD Quality Incentive Program (QIP). Under statutory provisions, the maximum payment reduction that CMS can apply to any facility is 2 percent. In 2020, the QIP assessed quality using:
• clinical measures that assess dialysis adequacy, vascular access among hemodialysis beneficiaries, hospitalization rates, hospital readmission rates, blood transfusion rates, presence of hypercalcemia, bloodstream infections among hemodialysis beneficiaries, and the quality of care that in-center hemodialysis beneficiaries report that they receive from their nephrologist and dialysis facility; and
• process measures that assess whether dialysis facilities report on pain assessment, clinical depression screening, anemia management, management of serum phosphorus, ultrafiltration rates, influenza vaccination rates among their health care personnel, and infection events (reported to the Centers for Disease Control and Prevention’s National Healthcare Safety Network).
In 2020, of the roughly 7,000 facilities with a QIP performance score, 58 percent had no payment reduction, 24 percent had their Medicare outpatient dialysis payments reduced by 0.5 percent, 12 percent had payments reduced by 1.0 percent, 4 percent of facilities had payments reduced by 1.5 percent, and 2 percent of facilities had payments reduced by the maximum, 2.0 percent.
In addition to the QIP, since 2015, CMS uses a second measurement system, the dialysis star ratings system, to assess the quality of care furnished by dialysis facilities.

173 Repo r t t o t h e Cong r e s s : Med i ca r e Paymen t P o l i c y | Ma r ch 2021
year, while capacity at facilities that were hospital based decreased by 3 percent per year and capacity at nonprofit facilities grew by less than 1 percent per year (Table 6-2). Between 2014 and 2019, capacity at urban facilities grew 4 percent per year, while capacity at all rural facilities grew 2 percent per year (latter data not broken out). Growth of capacity across different provider types between 2018 and 2019 is generally similar to changes over the past five years.
Between 2014 and 2019, providers’ capacity to furnish home dialysis remained relatively constant. Based on data from Medicare claims, freestanding dialysis reports, and Dialysis Facility Compare, roughly half of facilities offered home dialysis in 2014 and 2019 (47 percent of facilities in each year). Among facilities that furnished
from FFS beneficiaries. During that period, the number of facilities and their capacity to provide care—as measured by dialysis treatment stations—each increased by 4 percent annually (Table 6-2). By contrast, between 2014 and 2019, the number of FFS dialysis beneficiaries grew 1 percent annually (data not shown). However, in-center capacity is growing to keep pace with demand from all patients, not just FFS beneficiaries. During the most recent five-year period for which data are available (2013 to 2018), the number of dialysis patients with all types of health coverage grew 3 percent per year (United States Renal Data System 2020).
Between 2014 and 2019, capacity at facilities that were freestanding and for profit each grew by 4 percent per
T A B L E6–2 Increasing number and capacity of freestanding,
for-profit, and largest dialysis organizations
2019 Average annual percent change
Total number of FFS
treatments (in millions)
Total number
of facilities
Total number of
stations
Mean number
of stations
Number of facilities
Number of stations
2014–2019
2018–2019
2014–2019
2018–2019
All 45.4 7,700 134,200 18 4% 3% 4% 3%
Percent of total
Freestanding 96% 95% 96% 18 4 3 4 3Hospital based 4 5 4 14 –3 –1 –3 –3
Urban 86 83 86 18 4 3 4 3Micropolitan 10 10 9 16 2 1 2 1Rural, adjacent to urban 3 4 3 14 2 2 2 3Rural, not adjacent to urban 1 2 1 12 1 –2 1 –0.4Frontier 0.2 0.4 0.2 10 1 0 1 0
For profit 89 89 89 18 4 3 4 3Nonprofit 11 11 11 17 –1 –0.1 0.2 –0.2
Two largest dialysis organizations 75 74 75 18 5 4 4 4All others 25 26 25 17 1 1 1 1
Note: FFS (fee-for-service). Provider location reflects the county where the provider is located in one of four categories (urban, micropolitan, rural adjacent to urban, and rural nonadjacent to urban) based on an aggregation of the Urban Influence Codes. Frontier counties have six or fewer people per square mile. Totals may not sum to 100 percent due to rounding.
Source: Compiled by MedPAC from the Dialysis Compare database from CMS and claims submitted by dialysis facilities to CMS.

174 Ou tpa t i e n t d i a l y s i s s e r v i c e s : A s s e s s i ng paymen t adequacy and upda t i ng paymen t s
the majority of dialysis treatments. In 2019, freestanding facilities furnished 96 percent of FFS treatments, and for-profit facilities furnished 89 percent (Table 6-2, p. 173). In 2019, the capacity of facilities in urban and rural areas was generally consistent with where FFS dialysis beneficiaries lived.
The dialysis sector is highly consolidated, with two large dialysis organizations (LDOs)—Fresenius Medical Care and DaVita—dominating the industry. In 2019, these LDOs accounted for three-quarters of facilities and Medicare treatments.
home dialysis, the share of total treatments that were furnished in the home increased modestly between 2014 and 2019, from an average of 24 percent to 28 percent. (At the 75th percentile of facilities, the share increased from 28 percent to 31 percent.)
Providers of outpatient dialysis services In 2019, there were roughly 7,700 dialysis facilities in the U.S. that furnished about 45.5 million Medicare-paid treatments to FFS dialysis beneficiaries. FFS Medicare accounted for nearly 60 percent of all treatments furnished in 2019.21 According to CMS facility survey data, since the late 1980s, for-profit, freestanding facilities have provided
The coronavirus public health emergency and the Commission’s payment adequacy framework
The coronavirus pandemic and associated public health emergency (PHE) had tragic effects on beneficiaries’ health in 2020.20 According
to the Centers for Disease Control and Prevention, dialysis patients are at high risk for serious illness and death related to infection with COVID-19. According to CMS, between January 2020 and May 2020, beneficiaries eligible for Medicare due to end-stage renal disease had greater rates of COVID-19 cases and hospitalizations compared with beneficiaries who were eligible for Medicare due to age or disability.
As an initial step to learn about the effect of the PHE on treatment volume and spending for fee-for-service dialysis beneficiaries, we analyzed facilities’ claims for the first six months of 2019 and 2020. Compared with 2019, our analysis found the following:
• The number of dialysis beneficiaries decreased by 2 percent and the number of dialysis treatments furnished in 2020 declined slightly. These findings could be due to excess mortality during the PHE as well as new patients delaying the start of dialysis.
• Dialysis payment per treatment increased by 2 percent in 2020. This finding is associated with the 2020 statutory payment update and the temporary elimination of sequestration.
COVID-19 also had material effects on providers’ patient volume, revenues, and costs. The impact of COVID-19 has varied considerably both geographically and over time, and it is not clear when or whether the pandemic’s full effects will end. In their public statements, the large dialysis organizations (LDOs) (Fresenius Medical Care and DaVita) have said that mortality has increased among their patients, particularly the elderly. In-center capacity and the number of treatments furnished have increased but more slowly than in 2019. Treatment growth has been affected by increased mortality during the PHE and new patients delaying the start of dialysis, offset by a decline in patients undergoing kidney transplantation. There has been increased interest in home dialysis from these LDOs’ patients. One LDO (Fresenius Medical Care) reported increased home dialysis trainings in 2020 compared with 2019 (Charnow 2020). Although both organizations have incurred increased costs (e.g., personal protective equipment (PPE) and testing) due to the PHE, in general the PHE has had a lesser impact on their operations during the third quarter of 2020 compared with the second quarter. In addition, higher COVID-19 expenses were partly offset by savings associated with the pandemic in the form of reduced travel and other items. During the PHE, their commercial-payer mix of patients (which is linked to
(continued next page)

175 Repo r t t o t h e Cong r e s s : Med i ca r e Paymen t P o l i c y | Ma r ch 2021
In addition, many dialysis facilities are operated as joint ventures between a dialysis organization and physicians. Joint ventures allow participating partners to share in the management, profits, and losses. Between 2008 and 2018, DaVita more than doubled the number of its joint ventures (from 259 facilities to 651 facilities), increasing the share of the company’s facilities that were joint ventures from 18 percent to 25 percent (DaVita 2020). Other dialysis organizations, including Fresenius Medical Care, American Renal Associates, and U.S. Renal Care, also have established joint ventures with physicians.
There is concern that joint ventures between dialysis organizations and physicians create financial incentives for participating physicians that could inappropriately
influence decisions about patient care (Berns et al. 2018). Under federal disclosure requirements, a dialysis facility must report certain ownership information to CMS and its state survey agency but is not required to disclose such information to its patients, researchers, or members of the public (Centers for Medicare & Medicaid Services 2008, 42 CFR 494.180(j)). In 2009, the Commission recommended that the Congress require all hospitals and other entities that bill Medicare to annually report the ownership share of each physician who directly or indirectly owns an interest in the entity (excluding owners of publicly traded stock) and that the Secretary should post this information on a searchable public website (Medicare Payment Advisory Commission 2009).
The coronavirus public health emergency and the Commission’s payment adequacy framework (cont.)
each company’s financial performance) has remained relatively steady or improved.
Some dialysis providers benefited from federal grants and loans (which would affect total facility margins but not Medicare margins) and temporary policy changes (such as the elimination of the sequester between May 2020 and December 2020) that eased the PHE’s impact on lower volume (and its associated revenue) and higher costs for staffing, PPE, and testing. For example, one of the LDOs (Fresenius Medical Care) accepted funds under the Coronavirus Aid, Relief, and Economic Security, or CARES, Act, while the other LDO (DaVita) returned such funds. As applicable, more information about the impact of COVID-19 on dialysis providers can be found throughout this chapter.
While the PHE has not changed the nature of dialysis care (multiple treatments per week), providers have coordinated with each other to ensure capacity is sufficient to treat all patients. For example, multiple dialysis providers, including DaVita, Fresenius Medical Care, U.S. Renal Care, American Renal Associates, Satellite Healthcare, and others have formed the Dialysis Community Response Network to coordinate care for patients when certain units are overwhelmed
with either staff- or patient-related COVID-19 illness (Kossman and Williamson 2020).
In this chapter, we recommend payment rate updates for 2022. Because of standard data lags, the most recent complete data we have is from 2019 for most payment adequacy indicators. The coronavirus PHE has created additional data lags, most notably for cost reports, due to extensions of reporting deadlines. We use available data as well as changes in payment policy to project margins for 2021 and make payment recommendations for 2022. To the extent that the effects of the coronavirus PHE are temporary changes or vary significantly across individual dialysis facilities, they are best addressed through targeted temporary funding policies rather than a permanent change to all providers’ payment rates in 2022 and future years. For each payment adequacy indicator in this chapter, we discuss whether the effects of the PHE on those indicators will most likely be temporary or permanent. Only permanent effects of the pandemic will be factored into recommended permanent changes in Medicare base payment rates. (For an overview of how our payment adequacy framework takes account of the PHE, see Chapter 2.) ■

176 Ou tpa t i e n t d i a l y s i s s e r v i c e s : A s s e s s i ng paymen t adequacy and upda t i ng paymen t s
in both urban and rural areas. Compared with facilities that treated beneficiaries in both years, facilities that closed in 2018 (about 50 facilities) were more likely to be hospital based, nonprofit, and smaller (as measured by the number of dialysis treatment stations), which is consistent with long-term trends in the supply of dialysis providers.
According to our analysis, few dialysis FFS beneficiaries (roughly 2,400 individuals) were affected by facility closures in 2018. Our analysis found that beneficiary groups who were disproportionately affected included beneficiaries who were Black and younger (under the age of 65 years), which is consistent with last year’s findings. However, less than 1 percent of FFS beneficiaries in these
Types of facilities that closed and their effect on beneficiaries’ access to care Each year, we examine the types of facilities that closed and whether certain groups of Medicare dialysis beneficiaries are disproportionately affected by facility closures. Using facilities’ claims submitted to CMS and CMS’s Dialysis Compare database and provider of service file, we compare the characteristics of beneficiaries treated by facilities that closed in 2018 with beneficiaries treated at facilities that provided dialysis in 2018 and 2019.
Between 2018 and 2019, the number of dialysis treatment stations—a measure of providers’ capacity—increased by 3 percent (Table 6-2, p. 173). There was a net increase in the number of facilities that were freestanding and located
T A B L E6–3 Under the ESRD PPS, use per treatment of dialysis drugs
has declined, shifting to less costly, clinically similar products
Dialysis drug
Mean units per treatment* Aggregate percent change
2010 2018 2019 2010–2019 2018–2019
ESAsEpoetin alfa (reference biologic) 5,214 1,239 1,206 –77% –3%Darbepoetin alfa 1.26 1.6 0.9 –28 –44Epoetin beta N/A 3.9 4.5 N/A 18Epoetin alfa (biosimilar) N/A N/A 33.4 N/A N/A
Iron agentsSodium ferric gluconate 0.15 0.1 0.1 –46 –9
Iron sucrose 16.0 12.6 13.2 –17 5Ferumoxytol 0.8 0.004 0.004 –99 6Ferric carboxymaltose N/A 0.0001 0.0001 N/A 14
Vitamin D agentsParicalcitol 2.3 0.3 0.3 –89 –9Doxercalciferol 0.9 1.3 1.3 51 1Calcitriol 0.13 0.03 0.01 –92 –67
AntibioticsDaptomycin 0.22 0.1 0.1 –64 –26Vancomycin 0.02 0.01 0.01 –57 –15
Other drugsLevocarnitine 0.010 0.001 0.001 –93 –24Alteplase 0.020 0.002 0.002 –90 –5
Note: ESRD (end-stage renal disease), PPS (prospective payment system), ESA (erythropoiesis-stimulating agent), N/A (not applicable). Individual units per treatment are rounded; the aggregate percentage change is calculated using unrounded units per treatment. Ferric carboxymaltose was introduced to the U.S. market in 2013, epoetin beta was introduced in 2015, and epoetin alfa (biosimilar) was introduced in 2019.
*Each drug is reported using its own drug units.
Source: MedPAC analysis of claims submitted by dialysis facilities to CMS.

177 Repo r t t o t h e Cong r e s s : Med i ca r e Paymen t P o l i c y | Ma r ch 2021
two groups were affected by facility closures. Our analysis of claims data suggests that beneficiaries affected by these closures obtained care elsewhere.
Travel distances for new FFS dialysis beneficiaries Another way to assess whether facility closures and consolidations affect beneficiaries’ access to care is to look at changes over time in the distance to services that new FFS dialysis beneficiaries travel. Longer travel time to the dialysis unit, which creates a substantial burden for many patients, has been linked to decreased patients’ adherence to the dialysis prescription and increased mortality (Moist et al. 2008). We calculated driving distances for new FFS dialysis beneficiaries in 2013 and 2018 using claims submitted by facilities to CMS, CMS’s Renal Management Information System file, and Dialysis Compare.
During this five-year period, median driving miles (defined as the distance between a beneficiary’s residence and the dialysis facility that furnished treatment) did not substantially change. Median driving distance was about five miles for all new FFS dialysis beneficiaries. Driving distances remained constant for beneficiaries in the 25th percentile of driving distances (3 miles) and for beneficiaries in the 75th percentile (11 miles). Older beneficiaries and Black beneficiaries traveled fewer median miles than those who were younger or White. As expected, new FFS dialysis beneficiaries residing in rural areas drove longer distances than beneficiaries residing in urban areas; between 2013 and 2018, the median driving distance increased for new dialysis beneficiaries residing in rural areas. (For beneficiaries residing in rural areas, median driving distance was 11 miles in 2013 and 12 miles in 2018. By comparison, median driving distance was five miles in each year for beneficiaries residing in urban areas.)
Volume of services
To assess changes in the volume of dialysis services, we examined recent trends in the number of dialysis treatments provided to beneficiaries and in the use of injectable drugs administered during dialysis.
Trends in number of dialysis treatments provided
Between 2018 and 2019, there was little change in the number of FFS dialysis beneficiaries (395,000 beneficiaries in each year) and total Medicare-covered dialysis treatments (45.5 million treatments in 2018 and 45.4 million treatments in 2019). The number of dialysis treatments per beneficiary remained steady at 115.22 Over the most recent five-year period for which we have data
(2014 to 2019), the number of FFS dialysis beneficiaries increased by 0.6 percent per year, total dialysis treatments increased by 0.3 percent per year, while the number of treatments per beneficiary declined from 117 to 115.
Use of most ESRD drugs in the PPS bundle has declined with no sustained negative changes in beneficiaries’ outcomes Under the ESRD payment method used before 2011, ESRD drugs were paid according to the number of units of the drug administered: in other words, the more units of a drug provided, the higher the Medicare payment. The ESRD PPS increased the incentive for providers to be more judicious in providing dialysis drugs included in the payment bundle. When CMS broadened the payment bundle in 2011 to include ESRD-related drugs that were separately billable under the prior payment method, the agency set the PPS payment rate based on a per treatment basis using claims data from 2007. In 2014, to account for the decline in dialysis drug use under the ESRD PPS, the statute required that CMS rebase the PPS base rate by comparing drug use in 2007 with such use in 2012. Consequently, we examined changes between 2007 and 2019 (the most current year for which complete data are available) in the use per treatment for the leading dialysis drugs and aggregated them into four therapeutic classes—erythropoiesis-stimulating agents (ESAs), iron agents, vitamin D agents, and antibiotics.23
As shown in Table 6-3, between 2018 and 2019, per treatment drug use increased for several products—epoetin beta, doxercalciferol, ferric carboxymaltose, ferumoxytol, and iron sucrose. In 2019, we began to see use of the biosimilar epoetin alfa, which was launched in late 2018. However, use of all dialysis drugs available between 2010 and 2019 declined except for one product: doxercalciferol. The shift over time in the use of products within the ESA and vitamin D therapeutic classes is linked to price competition between the products within each class. For example, Figure 6-1 (p. 178) shows the shift in ESA use from epoetin alfa and darbepoetin alfa to epoetin beta. In at least one situation, switching was an explicit goal: One of the LDOs announced its intent to have more than 70 percent of the company’s ESA patients (110,000 patients) switched to epoetin beta (from epoetin alfa) by the end of the first quarter of 2016 (Reuters 2016).24 According to several sources, the LDO reduced its total ESA costs by switching beneficiaries to epoetin beta (Reuters 2016, Seeking Alpha 2016). A midsize chain announced that between 85 percent and 90 percent of its facilities will have switched to epoetin beta by the end of 2018 (Seeking Alpha 2018).

178 Ou tpa t i e n t d i a l y s i s s e r v i c e s : A s s e s s i ng paymen t adequacy and upda t i ng paymen t s
With the launch of a biosimilar for epoetin alfa in late 2018, we anticipate that competition among ESA products within the bundle will continue (and ESA costs for facilities could drop further).
As shown in Figure 6-2, most of the decline in the per treatment use of ESRD drugs—which is estimated by multiplying drug units per treatment reported on CMS claims by each drug’s 2020 ASP + 0 percent (i.e., we hold price constant)—occurred in the early years of the PPS.25 For example, between 2010 and 2012, use per treatment across all therapeutic classes declined by 23 percent per year (data not shown). Most of this decline was due to declining ESA use, which also fell by 23 percent per year during the same period. For ESAs, some of this decline may also have stemmed from clinical evidence showing that higher doses of these drugs led to increased risk of morbidity and mortality, which resulted in the FDA
changing the ESA label in 2011. Between 2018 and 2019, holding price constant, the use of all dialysis drugs in the four classes declined by 5 percent. Although the ESRD PPS affected use of certain ESRD-related services, particularly the provision of drugs paid under the bundle, CMS has concluded that the agency’s claims-based monitoring program has revealed no sustained negative changes in beneficiary health status (Centers for Medicare & Medicaid Services 2019).
Use of ESRD drugs paid under the TDAPA Our analysis of dialysis drug use also examines beneficiaries’ use of the calcimimetics paid for under the TDAPA policy—Sensipar (cinacalcet), the oral product, and Parsabiv (etelcalcetide), the injectable product. Before 2018, Medicare covered the oral calcimimetic under Part D. After the FDA approved the injectable calcimimetic Parsabiv in 2017, Medicare began to pay for both products under the ESRD PPS
Under the ESRD PPS, use of ESAs shifted due to price competition
Note: ESRD (end-stage renal disease), PPS (prospective payment system), ESA (erythropoiesis-stimulating agent).
Source: MedPAC analysis of claims submitted by dialysis facilities to CMS.
Medicare margins....Sh
are
of
ESA
use
rsFIGUREX-X
Note: Note and Source are in InDesign.
Source:
Notes about this graph:• Data is in the datasheet. Make updates in the datasheet.• WATCH FOR GLITCHY RESETS WHEN YOU UPDATE DATA!!!!• The column totals were added manually.• I had to manually draw tick marks and axis lines because they kept resetting when I changed any data.• I can’t delete the legend, so I’ll just have to crop it out in InDesign.• Use direct selection tool to select items for modification. Otherwise if you use the black selection tool, they will reset to graph default when you change the data.• Use paragraph styles (and object styles) to format. • Data was from: R:\Groups\MGA\data book 2007\data book 2007 chp1
0
10
20
30
40
50
60
70
80
90
100
2019201620152014
Epoetin alfa reference biologic
Darbepoetin alfa
Epoetin beta
More than oneESA product used
F IGURE6–1

179 Repo r t t o t h e Cong r e s s : Med i ca r e Paymen t P o l i c y | Ma r ch 2021
from 7 percent to 10 percent, while the share of beneficiaries receiving Sensipar (the less costly product on a per user basis) declined from 28 percent to 26 percent.
• Fourth quarter ASPs for each product declined (by 12 percent for Sensipar and by 13 percent for Parsabiv).
Dialysis marginal profitability suggests incentive to serve Medicare beneficiaries Another measure of access is whether providers have a financial incentive to expand the number of Medicare beneficiaries they serve. In considering whether to treat a patient, a provider with excess capacity compares the marginal revenue it will receive (i.e., the Medicare payment) with its marginal
(Medicare Part B) in 2018. CMS paid facilities 106 percent of each drug’s ASP in 2018 and 2019 and lowered the payment in 2020 to 100 percent of each drug’s ASP.26 In 2021, both products are included and paid for under the PPS bundle.
Between 2018 and 2019, TDAPA spending for both calcimimetics increased by 8 percent, from nearly $1.2 billion to $1.3 billion. The increase in calcimimetic spending between 2018 and 2019 is linked to greater use of the injectable product (Parsabiv), not the price Medicare paid for the drug:
• The share of beneficiaries receiving Parsabiv (the more costly product on a per user basis) increased
Use of ESRD drugs in the payment bundle has declined under the outpatient ESRD PPS
Note: ESRD (end-stage renal disease), PPS (prospective payment system), ESA (erythropoiesis-stimulating agent). To estimate drug use by therapeutic class, we hold the price of each drug constant and multiply drug units reported on claims in a given year by 2020 average sales price + 0 percent. The ESRD drugs in this analysis are included under the outpatient ESRD PPS bundle and paid under the base payment rate. That is, included drugs are those for which Medicare paid dialysis facilities separately before the ESRD PPS or are in 1 of the 11 functional categories of drugs included in the ESRD PPS bundle. Drugs included are epoetin alfa (reference biologic), epoetin alfa (biosimilar), epoetin beta, darbepoetin (ESAs); iron sucrose, sodium ferric gluconate, ferumoxytol, ferric carboxymaltose, ferric pyrophosphate citrate (iron agents); calcitriol, doxercalciferol, paricalcitol (vitamin D agents); daptomycin, vancomycin, alteplase, levocarnitine (all other drugs).
Source: MedPAC analysis of 100 percent claims submitted by dialysis facilities to CMS.
Medicare margins....Es
tim
ate
d p
er t
reatm
ent
use
(in 2
020 d
olla
rs)
FIGUREX-X
Note: Note and Source are in InDesign.
Source:
Notes about this graph:• Data is in the datasheet. Make updates in the datasheet.• WATCH FOR GLITCHY RESETS WHEN YOU UPDATE DATA!!!!• The column totals were added manually.• I had to manually draw tick marks and axis lines because they kept resetting when I changed any data.• I can’t delete the legend, so I’ll just have to crop it out in InDesign.• Use direct selection tool to select items for modification. Otherwise if you use the black selection tool, they will reset to graph default when you change the data.• Use paragraph styles (and object styles) to format. • Data was from: R:\Groups\MGA\data book 2007\data book 2007 chp1
0
10
20
30
40
50
60
70
80
201920182017201520132007
Other drugs
Vitamin D agents
Iron agents
ESAs
F IGURE6–2

180 Ou tpa t i e n t d i a l y s i s s e r v i c e s : A s s e s s i ng paymen t adequacy and upda t i ng paymen t s
In assessing quality, we also examine the multiple factors that affect access to kidney transplantation. This procedure is widely regarded as a better ESRD treatment option than dialysis in terms of patients’ clinical and quality of life outcomes and Medicare spending, but demand far outstrips supply.
Quality under the ESRD PPS
Between 2014 and 2019, the Commission’s analysis of claims data found that mean all-cause hospital stays remained relatively steady at 1.5 admissions per beneficiary, and 30-day readmission rates remained relatively steady at 22 percent of admissions. Between 2013 and 2018 (the most recent data that are available), CMS’s monitoring data for cardiovascular outcomes among dialysis beneficiaries show that monthly hospitalization rates for stroke and acute myocardial infarction (measures of anemia management) remained steady while heart failure hospitalizations declined until 2013 and then increased beginning in 2015 (Centers for Medicare & Medicaid Services 2019).28 Between 2014 and 2017, the proportion of dialysis beneficiaries who used
costs—that is, the costs that vary with volume. If Medicare payments are larger than the marginal costs of treating an additional beneficiary, a provider has a financial incentive to increase its volume of Medicare beneficiaries if it has the capacity to do so. In contrast, if payments do not cover the marginal costs, the provider could have a disincentive to care for Medicare beneficiaries.27
For dialysis facilities, Medicare payments exceed marginal costs by 25 percent, a positive indicator of patient access in that facilities with available capacity have an incentive to treat Medicare beneficiaries.
Quality of care Our analysis focuses on changes in quality indicators—including mortality and morbidity, process measures that assess dialysis adequacy and anemia management, and treatment utilization (including home dialysis and kidney transplantation rates). The findings, except where indicated, are based on the Commission’s analysis of Medicare FFS enrollment and claims data.
F IGURE6–3 Changes in hemoglobin levels under the ESRD PPS
Note: ESRD (end-stage renal disease), PPS (prospective payment system), g/dL (grams per deciliter). According to the Food and Drug Administration’s label for ESAs (erythropoiesis-stimulating agents): (1) in controlled clinical trials, patients experienced greater risks for death, serious adverse cardiovascular reactions, and stroke when administered ESAs to target a hemoglobin level of greater than 11 g/dL; (2) no trial has identified a hemoglobin target level, ESA dose, or dosing strategy that does not increase these risks; and (3) clinicians are advised to use the lowest ESA dose sufficient to reduce the need for red blood cell transfusions.
Source: MedPAC analysis of Medicare claims submitted by dialysis facilities to CMS.
Share
of
dia
lysi
s ben
efici
ari
esex
per
ienci
ng o
utc
om
e (in p
erce
nt)
Title hereFIGUREx-x
0
10
20
30
40
50
60
70
80
January 2019
January 2018
January 2017
January 2016
January 2015
January 2014
January 2013
January 2012
January 2011
January 2010
Notes about this graph:• Data is in the datasheet. Make updates in the datasheet.• I had to force return the items on the x-axis. They will reflow if I update the data.• I had to manually draw tick marks and axis lines because they kept resetting when I changed any data.• Use direct selection tool to select items for modification. Otherwise if you use the black selection tool, they will reset to graph default when you change the data.• Use paragraph styles (and object styles) to format.
Note: Note and Source in InDesign.
Hemoglobin level at or exceeding12 g/dL
Hemoglobin level under 10 g/dLHemoglobin level 10–12 g/dL

181 Repo r t t o t h e Cong r e s s : Med i ca r e Paymen t P o l i c y | Ma r ch 2021
to be more judicious in providing drugs included in the payment bundle. These findings may also be associated with the FDA’s 2007 “black box warning” on ESA drug labels, which advised physicians that the risks of death and serious cardiovascular events are greater when ESAs are administered to achieve higher target hemoglobin levels and that dosing should be individualized to maintain hemoglobin levels between 10 g/dL and 12 g/dL.
Access to home dialysis
Researchers have shown that the ESRD PPS is associated with an overall increase in the use of home dialysis (Lin et al. 2017). Between January 2014 and December 2019, the share of beneficiaries dialyzing at home increased from 10.3 percent to 12.7 percent. While we are encouraged by this increase, differences by race persist: Black beneficiaries are less likely to use home methods. According to the Commission’s analysis, about 35 percent of all beneficiaries with ESRD are Black, but only 26 percent of beneficiaries who dialyze at home are Black. Between 2014 and 2019, the proportion of beneficiaries undergoing home dialysis training was relatively small but increased slightly, ranging from a monthly average of 0.7 percent to 0.8 percent of dialysis beneficiaries.
Researchers have identified many factors that affect the use of home dialysis, including both clinical (patients’ other health problems and prior nephrology care) and nonclinical (e.g., patients’ social circumstances (including presence of a caregiver at home) and knowledge about treatment options and physician’s training and preference). Some beneficiaries report that they were never informed about their options. Facility factors, such as unused in-center capacity or additional in-center shifts and dialysis facility’s staff experience, can also affect use of home dialysis (Walker et al. 2010). During the PHE, however, both LDOs and midsize providers reported that their patients showed increased awareness of and interest in home dialysis.30
Some clinical and nonclinical factors affecting home dialysis use are amenable to intervention. For example, between 2008 and 2018, under an integrated care delivery system (Kaiser Permanente Northern California), PD use among new dialysis patients more than doubled, from 15 percent to 34 percent. To augment the use of home dialysis, the health care system implemented a multidisciplinary, system-wide approach that increased patient and family education, educated health care professionals about the importance of PD, adopted operational improvements, monitored outcomes, and shared best practices with staff (Pravoverov et al. 2019).
the emergency department on an outpatient basis increased from an average of 11.3 percent per month to 11.9 percent per month. In 2018 and 2019, the proportion of dialysis beneficiaries who used the emergency department held steady at 11.9 percent per month. According to CMS and Commission data, rates of mortality per beneficiary per month during this period remained relatively unchanged, at 1.5 percent per month.
Beneficiaries’ fluid management is related to factors such as the adequacy of the dialysis procedure, defined as having enough waste removed from their blood. According to the Commission’s analysis, between 2014 and 2019, from 97 percent to 98 percent of hemodialysis beneficiaries and from 91 percent to 93 percent of peritoneal dialysis (PD) beneficiaries received adequate dialysis.
We assess anemia management by examining trends over time in (1) beneficiaries’ hemoglobin level, a blood test that measures the level of hemoglobin, the protein that carries oxygen in red blood cells, and (2) frequency of red blood cell transfusions.29 Lower hemoglobin levels (which may suggest underuse of ESAs and iron agents) may increase the frequency of red blood cell transfusions while higher hemoglobin levels (greater than 11 g/dL) among patients maintained on higher doses of ESAs may increase their risk of death and cardiovascular events (congestive heart failure, myocardial infarction, and stroke).
Median hemoglobin levels fell during the initial years of the ESRD PPS, then stabilized; between 2014 and 2019, median levels ranged between 10.4 g/dL and 10.5 g/dL. Figure 6-3 shows that the proportion of dialysis beneficiaries with higher hemoglobin levels declined and the proportion with lower hemoglobin levels increased (which is generally associated with lower ESA use). According to CMS, during the initial years of the ESRD PPS, blood transfusion rates increased (from 2.7 percent per month to 3.4 percent per month). However, between 2013 and 2018 (the most recent year data are available), the proportion of beneficiaries receiving a blood transfusion declined (from 3.3 percent per month to 2.2 percent per month) (Centers for Medicare & Medicaid Services 2019). These findings—the decline in hemoglobin levels and increase in transfusion rates during the early years of the ESRD PPS—are consistent with the incentives under the prior and current ESRD payment methods. The pre-2011 payment method (which paid providers according to the number of units of each drug administered) gave some providers the incentive to overutilize dialysis drugs while the current payment method gives providers the incentive

182 Ou tpa t i e n t d i a l y s i s s e r v i c e s : A s s e s s i ng paymen t adequacy and upda t i ng paymen t s
transplants despite their fourfold greater likelihood of developing ESRD; however, between 2014 and 2019, the number of Black patients receiving a transplant grew by 8 percent per year (to 6,274 individuals, data not shown). According to Ephraim and colleagues, the lower rates of kidney transplantation for Black patients have been associated with multiple factors, including immunological incompatibility with deceased donor kidneys, lower rates of referral for transplantation, lower rates of cadaver kidney donation, and lack of knowledge and suboptimal discussions about kidney transplantation among recipients, their families, and health care providers (Ephraim et al. 2012).
Education efforts directed at patients can be effective in encouraging them to make an informed decision about their treatment, including home dialysis, in-center dialysis, kidney transplantation, and conservative care. For example, a recent review of educational interventions found a strong association between patient-targeted dialysis modality education and choosing and receiving PD (Devoe et al. 2016). An augmented nurse care management program that targeted persons with late-stage CKD resulted in a statistically significant reduction in the number of hospitalizations during the intervention period and, for those who required renal replacement therapy, higher use of PD or a preemptive kidney transplant (Fishbane et al. 2017).
In 2010, to help inform beneficiaries diagnosed with Stage 4 CKD (the disease stage before ESRD) about their treatment options and managing the disease and related comorbidities, the Medicare Improvements for Patients and Providers Act of 2008 (MIPPA) established Medicare payment for up to six sessions of kidney disease education (KDE) per beneficiary. Since its implementation, relatively few beneficiaries have been provided KDE services. In 2019, 3,300 beneficiaries received KDE services, with spending nearing $420,000.31
According to the Government Accountability Office, payment limitations regarding the providers who can furnish KDE services and the beneficiaries who are eligible might constrain the service’s use (Government Accountability Office 2015). MIPPA specified the categories of providers who can furnish KDE services—physicians, physician assistants, nurse practitioners, clinical nurse specialists, and certain providers of services in rural areas.32 MIPPA also specified that beneficiaries with Stage 4 CKD are eligible for the benefit. Some stakeholders contend that other categories of beneficiaries,
Access to kidney transplantation
Kidney transplantation is widely regarded as a better ESRD treatment option than dialysis in terms of patients’ clinical and quality of life outcomes. In addition, transplantation results in lower Medicare spending. In 2018, average Medicare spending for patients who had a functioning kidney transplant was less than a third of the spending for dialysis patients ($37,260 vs. $91,800) (United States Renal Data System 2020). However, demand for kidney transplantation exceeds supply of kidneys available for transplantation. Besides donation rates, factors that affect access to kidney transplantation include the clinical allocation process; patients’ health literacy, clinical characteristics, and preferences; the availability of education for patients; clinician referral for transplant evaluation at a transplant center; and transplant center policies.
Between 2014 and 2019, according to the Organ Procurement and Transplantation Network, the number of kidney transplants increased by 6 percent per year, to 23,401 (Table 6-4). During this period, the share of live-donor kidney transplants declined, from 32 percent of all transplants to 29 percent. In 2019, Black patients were less likely than White patients to receive kidney
T A B L E6–4 Between 2014 and 2019,
the number of kidney transplants increased, and Black, Hispanic, and Asian American recipients
accounted for an increasing share
2014 2019
Total transplants 17,108 23,401
Share of transplants from live donors 32% 29%
Share of recipients who were:White 50% 45%Black 25 27Hispanic 16 19Asian 6 7Other 2 2
Note: Totals may not sum to 100 percent due to rounding.
Source: Organ Procurement and Transplantation Network 2020.

183 Repo r t t o t h e Cong r e s s : Med i ca r e Paymen t P o l i c y | Ma r ch 2021
Renal Care LLC (an affiliate of Nautic Partners, a middle market private equity firm). The all-cash transaction is valued at $853 million, and shareholders of American Renal Associates will receive $11.50 per share in cash, which represents an approximate premium of 66 percent to the company’s closing price on October 1, 2020.
Another indicator of the relatively good access to capital is that, during the past decade, several companies—both small and large—have entered the renal care field aiming to improve treatment of individuals with CKD and ESRD, including Outset Medical (in 2010), Cricket Health (in 2015), Somatus (in 2016), and CVS (in 2018).
In addition to private sector investment in renal care, in 2018, a public-private partnership between the Department of Health and Human Services and the American Society of Nephrology was initiated to accelerate innovation in the prevention, diagnosis, and treatment of kidney diseases. This initiative—referred to as the Kidney Innovation Accelerator (KidneyX)—sponsors cash prize competitions. For example, there is currently a competition offering up to $10 million in prizes to accelerate artificial kidney development toward human clinical trials.
In public financial filings, the two LDOs reported generally positive financial performance related to their dialysis business for 2020, including improvements in productivity and revenue growth—that is, growth achieved apart from mergers and acquisitions. Since 2010, the two LDOs have also grown through large acquisitions of and mergers with other dialysis facilities and other health care organizations. For example, during this period, both of the largest dialysis organizations acquired midsize for-profit organizations: DaVita acquired Purity and Renal Ventures and Fresenius Medical Care acquired Liberty Dialysis.
The two LDOs, in addition to operating three-quarters of all dialysis facilities, are each vertically integrated. Both organizations operate an ESRD-related laboratory, a pharmacy, and one or more centers that provide vascular access services; they provide ESRD-related care coordination and disease management services to government and nongovernment payers (including MA plans); and they operate dialysis facilities internationally. One LDO manufactures, acquires, in-licenses, and distributes ESRD-related pharmaceutical products (e.g., phosphate binders and iron replacement products) and manufactures dialysis products (hemodialysis machines,
including those with Stage 5 CKD (i.e., ESRD) who have not started dialysis as well as individuals who have already initiated hemodialysis, might also benefit from Medicare KDE coverage.
Providers’ access to capital: Growth trends indicate access is adequateProviders need access to capital to improve their equipment and open new facilities so they can accommodate the growing number of patients requiring dialysis. The two LDOs as well as other renal companies appear to have had adequate access to capital. For example, in 2019 and 2020:
• DaVita purchased nearly 8 million shares of its common stock (representing 6.5 percent of total outstanding shares as of September 2020) for a total cost of $702 million. The company is financing the share purchases with cash on hand.
• Fresenius Medical Care acquired all of the outstanding shares of NxStage Medical Inc., a company that develops, manufactures, and markets medical devices for use in home dialysis and in the critical care setting. As a condition to the closing of the acquisition set by the U.S. Federal Trade Commission, Fresenius Medical Care divested the NxStage bloodlines business.
• CVS is continuing its entry into furnishing kidney care with the launch of its CKD management program, which aims to delay the progression of renal disease. The program is available to 3.5 million people in commercial plans. The company launched a clinical trial for a new home dialysis device (“HemoCare” hemodialysis system) designed by the firm of Dean Kamen and aims to have the device in the market in late 2021. Rather than furnishing dialysis in its own stores, CVS intends to lease or sell home dialysis devices to other providers.
• Outset Medical, a manufacturer of portable hemodialysis machines, raised $125 million in its initial public offering. The total capital raised 38 percent more in proceeds than the company expected (Nasdaq 2020).
• American Renal Associates, a midsize dialysis organization that currently operates 251 facilities in 27 states and Washington, DC, announced that it has entered into an agreement to be acquired by Innovative

184 Ou tpa t i e n t d i a l y s i s s e r v i c e s : A s s e s s i ng paymen t adequacy and upda t i ng paymen t s
peritoneal cyclers, dialyzers, peritoneal solutions, hemodialysis concentrates, bloodlines, and systems for water treatment) and nondialysis products, including acute cardiopulmonary and apheresis products. This LDO supplies dialysis facilities that it owns, operates, or manages with dialysis products, and it sells dialysis products to other dialysis service providers.
Another positive indicator of the dialysis sector’s strong access to capital is its all-payer margin. Using cost report data submitted by freestanding dialysis facilities to CMS, we estimate that the 2019 all-payer margin was roughly 18 percent. In their financial documents, dialysis providers reported that FFS Medicare payment rates were on average lower than commercial rates (DaVita 2018). In general, current growth trends among dialysis providers indicate that the dialysis industry is attractive to for-profit facilities and investors.
Medicare payments and providers’ costsEach year, we examine the relationship between Medicare’s payments and providers’ costs as part of our assessment of payment adequacy. To make this assessment, we reviewed Medicare expenditures for outpatient dialysis services in 2019 and examined trends in spending under the PPS. We also reviewed evidence regarding providers’ costs under the PPS.
Medicare payments for outpatient dialysis services
In 2019, Medicare spending for outpatient dialysis services was $12.9 billion, an increase of 2 percent compared with 2018. Per capita spending also increased by 2 percent to roughly $32,700 in 2019. Between 2018 and 2019, dialysis spending for services in the bundle (which accounts for 90 percent of total spending) grew by 1.1 percent, while TDAPA spending (which accounts for 10 percent of total spending) grew by 8 percent. Other factors affecting spending growth include a statutory update (of 1.3 percent) to the base dialysis payment rate in 2019 and the number of dialysis treatments per beneficiary holding steady in 2018 and 2019.
Since 2017, dialysis facilities are able to furnish dialysis to beneficiaries with acute kidney injury (AKI), as mandated by the Trade Preferences Extension Act of 2015. AKI is the sudden loss of kidney function typically caused by an event that leads to kidney malfunction, such as dehydration, blood loss from major surgery or injury, or the use of medicines. By contrast, CKD is usually caused by a long-term disease, such as hypertension or diabetes,
that slowly damages the kidneys and reduces their function over time. AKI is more commonly reversible than late-stage CKD.
In 2019, Medicare spending for outpatient dialysis services for beneficiaries with AKI was nearly $71 million, an increase from nearly $40 million in 2017 and $58 million in 2018. Medicare pays facilities the ESRD PPS base rate adjusted by the PPS wage index for the treatment of beneficiaries with AKI.33 Medicare spending for treatment of AKI by dialysis facilities is not included in the Commission’s analysis of Medicare’s payments and costs for dialysis facilities.
Between 2017 and 2018, Part D spending for ESRD oral-only phosphate binders declined
As of 2018, phosphate binders are the only ESRD oral-only drug class that is paid for under the Part D program, and roughly 70 percent of dialysis beneficiaries with Part D coverage were prescribed such drugs.34 Between 2017 and 2018 (the most recent year data are available), spending for phosphate binders furnished to dialysis FFS beneficiaries declined by 17 percent to $1.1 billion. This decline is linked to the FDA’s approval for a generic version of Renvela (sevelamer carbonate) in 2017. By contrast, spending grew 12 percent per year for the five-year period 2012 through 2017. In 2018, Part D spending for phosphate binders accounted for 40 percent of all Part D spending for dialysis beneficiaries. Medicare spending for dialysis drugs under Part D is not included in the Commission’s Medicare analysis of dialysis facilities’ financial performance under the ESRD PPS.
As of January 1, 2025, phosphate binders will be included in the ESRD PPS bundled payment. Including phosphate binders covered under Part D in the ESRD PPS bundle is intended to lead to better management of drug therapy and improve beneficiaries’ access to these medications since some beneficiaries lack Part D coverage or have coverage less generous than the Part D standard benefit. Including phosphate binders in the ESRD PPS bundle might also improve provider efficiency. Between 2017 and 2018, Medicare total spending increased for the phosphate binders that did not have generic competitors, while spending decreased for products with generic competitors.
Providers’ costs for outpatient dialysis services under the ESRD PPS
To assess the appropriateness of costs for dialysis services paid for under the ESRD PPS, we examine whether

185 Repo r t t o t h e Cong r e s s : Med i ca r e Paymen t P o l i c y | Ma r ch 2021
we found substantial variation in the level of selected cost categories reported by the five largest dialysis organizations. For example, the cost per treatment for administrative and general services and labor each varied by roughly $30 per treatment among these organizations. We anticipate that CMS’s audit of a representative sample of facilities’ ESRD cost reports will examine their accuracy. In the final rule for the 2020 ESRD PPS, CMS said that (1) the audit process is complete, (2) it is conducting follow-up activities related to the audit to obtain summary results and is investigating what adjustments were made on the cost reports of specific ESRD facilities, and (3) it intends to discuss the results when these follow-up activities are available in a future rule. Consistent with our 2014 recommendation, the Protecting Access to Medicare Act of 2014 funded CMS to audit a representative sample of ESRD facility cost reports.37
Cost per treatment is correlated with facility service volume Cost per treatment is correlated with the total number of treatments a facility provides. To examine this relationship, we adjusted the cost per treatment to remove differences in the cost of labor across areas and included all treatments regardless of payer. Our analysis showed, in each year from 2011 through 2019, a statistically significant relationship between total treatments and cost per treatment (correlation coefficient equaled –0.5) (Figure 6-4, p. 186). That is, the greater the facility’s service volume, the lower its costs per treatment. Facilities that qualified for increased Medicare payment due to low volume had substantially higher cost per treatment for capital as well as administrative and general services compared with all other facilities.
The trend in the aggregate Medicare margin for freestanding dialysis facilities
The Commission assesses current payments and costs for dialysis services for freestanding dialysis facilities by comparing Medicare’s payments with facilities’ Medicare-allowable costs. The latest and most complete data available on payments and costs are from 2019.
Under the ESRD PPS, dialysis facilities’ financial performance under Medicare has varied due to statutory and regulatory changes and the use and profitability of certain ESRD drugs (Figure 6-5, p. 187). During the initial years of the ESRD PPS, the aggregate Medicare margin increased, particularly because of declining use of
aggregate dialysis facility ESRD-allowable costs reflect costs that efficient providers would incur in furnishing high-quality care. For this analysis, we used 2018 and 2019 cost reports and claims submitted to CMS by freestanding dialysis facilities. For those years, we looked at the growth in the cost per treatment and how total treatment volume affected that cost.
Cost growth under the PPS Between 2018 and 2019, total cost per treatment decreased by 4 percent, from nearly $267 per treatment to $255 per treatment. Total cost per treatment fell in part due to lower cost per treatment for calcimimetics (which Medicare pays for under a TDAPA policy based on each product’s ASP). We estimate that, between 2018 and 2019, the cost of calcimimetics dropped by more than half, from roughly $15 per treatment to $6 per treatment because of the launch of generic versions of Sensipar (the oral calcimimetic).35,36
Excluding providers’ estimated costs of calcimimetics, the cost per treatment between 2018 and 2019 would have declined by about 1 percent. This decrease was due to lower cost per treatment for the four categories that made up 44 percent of the total 2019 cost per treatment. The cost per treatment for supplies, administrative and general expenses, laboratory services, and ESAs declined by 1 percent, 3 percent, 6 percent, and 13 percent, respectively. Lower cost per treatment for these categories was somewhat offset by the following increases:
• Labor costs, which accounted for about 33 percent of the cost per treatment, increased by 1 percent.
• Capital costs, which accounted for 18 percent of the cost per treatment, increased by 4 percent.
• Composite rate drugs, which accounted for less than 1 percent of the cost per treatment, increased by 2 percent.
Variation in cost growth across freestanding dialysis facilities shows that some facilities were able to hold their cost growth well below that of others. For example, between 2018 and 2019, per treatment costs decreased by 11 percent for facilities in the 25th percentile of cost growth, compared with a decrease of 0.4 percent for facilities in the 75th percentile.
The extent to which some of the variation in costs among facilities results from differences in the accuracy of facilities’ reported data is unknown. In 2018 and 2019,

186 Ou tpa t i e n t d i a l y s i s s e r v i c e s : A s s e s s i ng paymen t adequacy and upda t i ng paymen t s
paid under the TDAPA policy.39 The aggregate Medicare margin was 2.1 percent in 2018 and 8.4 percent in 2019. Excluding calcimimetics’ payments and estimated costs, we estimate that the 2018 aggregate Medicare margin would have been about –2 percent and the 2019 aggregate margin would have been 0.5 percent.
Most of the increase in the Medicare margin between 2018 and 2019 is associated with the availability of generic versions of the oral calcimimetic in 2019. There is a two-quarter lag in the data used to set ASP-based payment rates under the TDAPA policy, which can result in a difference between the average provider acquisition cost for a drug and the ASP used to set the Medicare payment amount for a quarter. When prices increase or decrease, it takes two quarters before that change is reflected in the ASP data that Medicare uses to pay providers. When newly available generic drugs enter the market, their ASPs are often substantially lower than their brand counterparts, but payment amounts remain at the higher brand level for typically two quarters (or more). In 2019, TDAPA payments (which account for 10 percent of total dialysis payments) averaged $28 per treatment while providers’ costs averaged an estimated $6 per treatment (Table 6-5, p. 188).
Medicare margin varies by treatment volume
Aggregate Medicare margins in 2019 decidedly varied by treatment volume: Facilities in the lowest volume quintile had margins below –14 percent, while facilities in the top volume quintile had margins of over 15 percent (Table 6-6, p. 189). Urban facilities averaged higher margins than rural facilities (9.0 percent vs. 5.0 percent). Total treatment volume accounted for much of the difference in margins between urban and rural facilities. Urban dialysis facilities are larger on average than rural facilities in the number of treatment stations and total treatments provided. For example, in 2019, urban facilities averaged about 12,000 treatments, while rural facilities averaged about 7,800 treatments (data not shown). And, as shown in Figure 6-4, higher volume facilities had lower cost per treatment.
The Commission has raised concerns about continued access to low-volume facilities that are located in isolated areas (Medicare Payment Advisory Commission 2020). Although some rural facilities have benefited from the ESRD PPS’s 23.9 percent low-volume adjustment and 0.8 percent rural adjustment, the Commission has stated that neither adjustment targets low-volume, geographically
ESRD drugs between 2011 and 2012 (Table 6-3, p. 176). Between 2014 and 2017, facilities’ financial performance under Medicare reversed, with the aggregate Medicare margin declining from 2.1 percent to –1.1 percent, which was not unexpected given the payment adjustments required by statute. To reflect more-current use of dialysis drugs, the American Taxpayer Relief Act of 2012 required that CMS rebase the base payment rate effective 2014, and the Protecting Access to Medicare Act of 2014 set the statutory update at (1) 0 percent in 2015, (2) market basket minus 1.25 percent in 2016 and 2017, and (3) market basket minus 1.0 percent in 2018.38
In 2018 and 2019, the aggregate Medicare margin increased due to the profitability of the calcimimetics
F IGURE6–4 Higher volume dialysis
facilities have lower cost per treatment, 2011–2019
Note: Cost per treatment is adjusted to remove differences in the cost of labor. “Dialysis facilities” includes those paid by all insurance sources. Medicare’s coverage of calcimimetics under the end-stage renal disease prospective payment system primarily accounts for the cost per treatment decreasing in 2019.
Source: MedPAC analysis of cost reports submitted by freestanding dialysis facilities to CMS and the end-stage renal disease wage index files.
Adju
sted
med
ian c
ost
per
tre
atm
ent
(in d
olla
rs)
Reduction in drug...FIGURE6-5
200
220
240
260
280
300
320
340
360
3802019
2018
2016
2011
≥30,
000
25,0
00–2
9,99
9
20,0
00–2
4,99
9
15,0
00–1
9,99
9
10,0
00–1
4,99
9
9,00
0–9,
999
8,00
0–8,
999
7,00
0–7,
999
6,00
0–6,
999
5,00
0–5,
999
4,00
0–4,
999
3,00
0–3,
999
<3,0
00
Notes about this graph:• Data is in the datasheet. Make updates in the datasheet.• I had to force return the items on the x-axis. They will reflow if I update the data.• I had to manually draw tick marks and axis lines because they kept resetting when I changed any data.• Use direct selection tool to select items for modification. Otherwise if you use the black selection tool, they will reset to graph default when you change the data.• Use paragraph styles (and object styles) to format.
Note: Note and Source in InDesign.
2011201620182019
Number of dialysis treatments
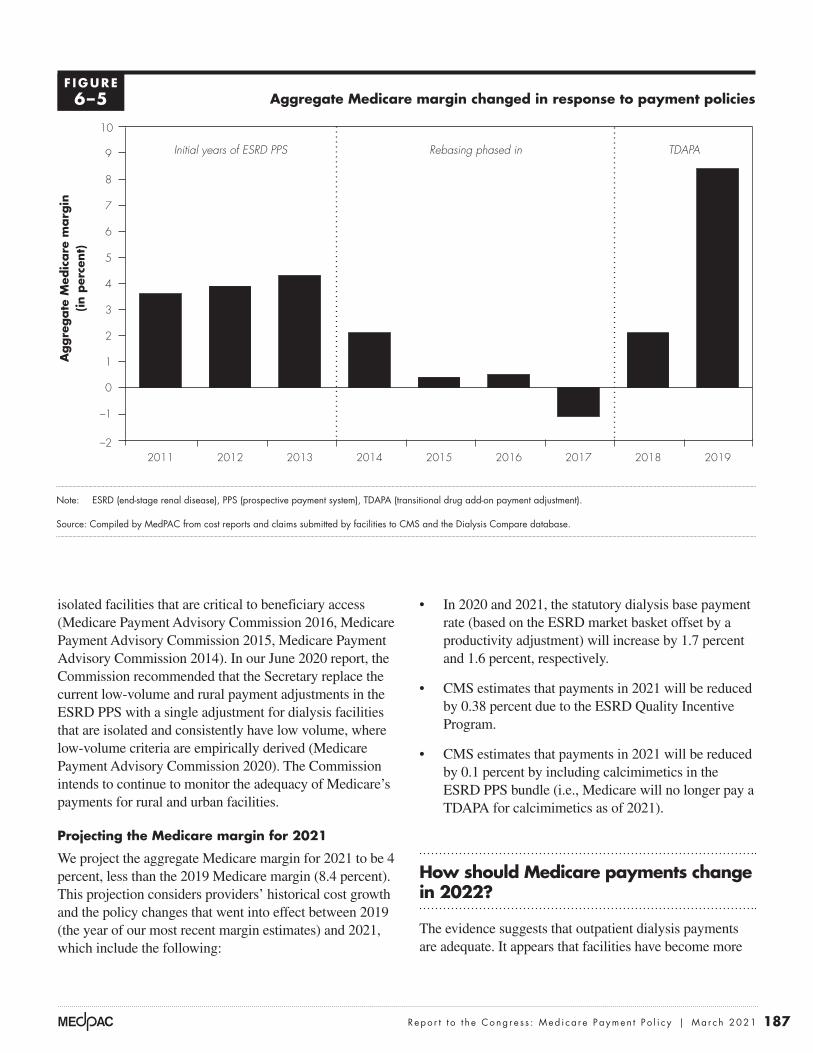
187 Repo r t t o t h e Cong r e s s : Med i ca r e Paymen t P o l i c y | Ma r ch 2021
• In 2020 and 2021, the statutory dialysis base payment rate (based on the ESRD market basket offset by a productivity adjustment) will increase by 1.7 percent and 1.6 percent, respectively.
• CMS estimates that payments in 2021 will be reduced by 0.38 percent due to the ESRD Quality Incentive Program.
• CMS estimates that payments in 2021 will be reduced by 0.1 percent by including calcimimetics in the ESRD PPS bundle (i.e., Medicare will no longer pay a TDAPA for calcimimetics as of 2021).
How should Medicare payments change in 2022?
The evidence suggests that outpatient dialysis payments are adequate. It appears that facilities have become more
isolated facilities that are critical to beneficiary access (Medicare Payment Advisory Commission 2016, Medicare Payment Advisory Commission 2015, Medicare Payment Advisory Commission 2014). In our June 2020 report, the Commission recommended that the Secretary replace the current low-volume and rural payment adjustments in the ESRD PPS with a single adjustment for dialysis facilities that are isolated and consistently have low volume, where low-volume criteria are empirically derived (Medicare Payment Advisory Commission 2020). The Commission intends to continue to monitor the adequacy of Medicare’s payments for rural and urban facilities.
Projecting the Medicare margin for 2021
We project the aggregate Medicare margin for 2021 to be 4 percent, less than the 2019 Medicare margin (8.4 percent). This projection considers providers’ historical cost growth and the policy changes that went into effect between 2019 (the year of our most recent margin estimates) and 2021, which include the following:
Aggregate Medicare margin changed in response to payment policies
Note: ESRD (end-stage renal disease), PPS (prospective payment system), TDAPA (transitional drug add-on payment adjustment).
Source: Compiled by MedPAC from cost reports and claims submitted by facilities to CMS and the Dialysis Compare database.
Medicare margins....A
ggre
gate
Med
icare
marg
in(in p
erce
nt)
FIGUREX-X
Note: Note and Source are in InDesign.
Source:
Notes about this graph:• Data is in the datasheet. Make updates in the datasheet.• WATCH FOR GLITCHY RESETS WHEN YOU UPDATE DATA!!!!• The column totals were added manually.• I had to manually draw tick marks and axis lines because they kept resetting when I changed any data.• I can’t delete the legend, so I’ll just have to crop it out in InDesign.• Use direct selection tool to select items for modification. Otherwise if you use the black selection tool, they will reset to graph default when you change the data.• Use paragraph styles (and object styles) to format. • Data was from: R:\Groups\MGA\data book 2007\data book 2007 chp1
–2
–1
0
1
2
3
4
5
6
7
8
9
10
201920182017201620152014201320122011
Initial years of ESRD PPS Rebasing phased in TDAPA
F IGURE6–5

188 Ou tpa t i e n t d i a l y s i s s e r v i c e s : A s s e s s i ng paymen t adequacy and upda t i ng paymen t s
which would provide reimbursement for Roxadustat for dialysis-dependent patients outside of the prospective payment system bundle. The earliest Roxadustat could receive TDAPA coverage would be April 1, 2021” (Motley Fool 2020).40
Further, beginning in 2020, Medicare also includes a payment adjustment under the ESRD PPS that pays dialysis facilities for new and innovative equipment and supplies based on the product’s invoice price for a two-year period. For non-capital-related technologies, this policy could raise Medicare payments relative to facilities’ costs because CMS will not offset the ESRD PPS base rate. (The payment adjustment for new and innovative home dialysis machines (a capital asset) includes an offset applied to the ESRD PPS base rate.)
R E C O M M E N D A T I O N 6
For calendar year 2022, the Congress should eliminate the update to the 2021 Medicare end-stage renal disease prospective payment system base rate.
R A T I O N A L E 6
Most of our indicators of payment adequacy are positive, including beneficiaries’ access to care, the supply and capacity of providers, volume of services, and access to capital. Providers have become more efficient in the use
efficient under the PPS, as measured by declining use of most injectable dialysis drugs, and we conclude that dialysis facilities can continue to provide services to beneficiaries with ESRD without an update to current rates.
We note that, beginning in 2020, in addition to the base payment rate, Medicare includes a TDAPA payment adjustment under the ESRD PPS that pays dialysis facilities for certain new drugs and biologics based on the product’s ASP + 0 percent for a two-year period. If a drug becomes eligible for a TDAPA payment, this policy will likely increase Medicare payments relative to facilities’ costs because CMS will not offset the ESRD PPS base rate (even for new drugs that fall into 1 of the 11 functional categories already included in the payment bundle). In 2021, Roxadustat, a new drug that treats anemia for dialysis patients, may be launched in the U.S. (Woolridge 2020). The manufacturer filed its application with the FDA in February 2020, and the FDA’s deadline to review the application (the Prescription Drug User Fee Act (PDUFA) date) is currently March 20, 2021. If CMS determines that Roxadustat meets the TDAPA eligibility criteria (set forth in CFR 413.234), then dialysis facilities would be paid a TDAPA for the drug. According to its manufacturer: “Assuming a positive decision by a PDUFA date of December 2020, the plan is to immediately apply for the transitional drug add-on payment adjustment, or TDAPA,
T A B L E6–5 The impact of calcimimetic costs and payments
on the aggregate Medicare margin in 2019
ESRD PPSCost
per treatmentPayment
per treatment*Aggregate
Medicare margin
All items and services $255 $278 8%
All items and services other than calcimimetics 249 250 0.5
Calcimimetics 6** 28 79
Note: ESRD (end-stage renal disease), PPS (prospective payment system). *Payment per treatment is net of uncollected bad debt for which Medicare does not compensate facilities. **We estimate calcimimetic costs because freestanding dialysis facilities report costs for these drugs, along with other non–erythropoiesis-stimulating agents and
non–composite rate drugs, in the cost category “ESRD-related other drugs.” Calcimimetic costs are estimated by subtracting 2017 costs for “ESRD-related other drugs” (the year before Medicare covered calcimimetics under the ESRD PPS) from 2019 costs for this category.
Source: MedPAC analysis of claims and cost reports submitted by freestanding dialysis facilities to CMS.
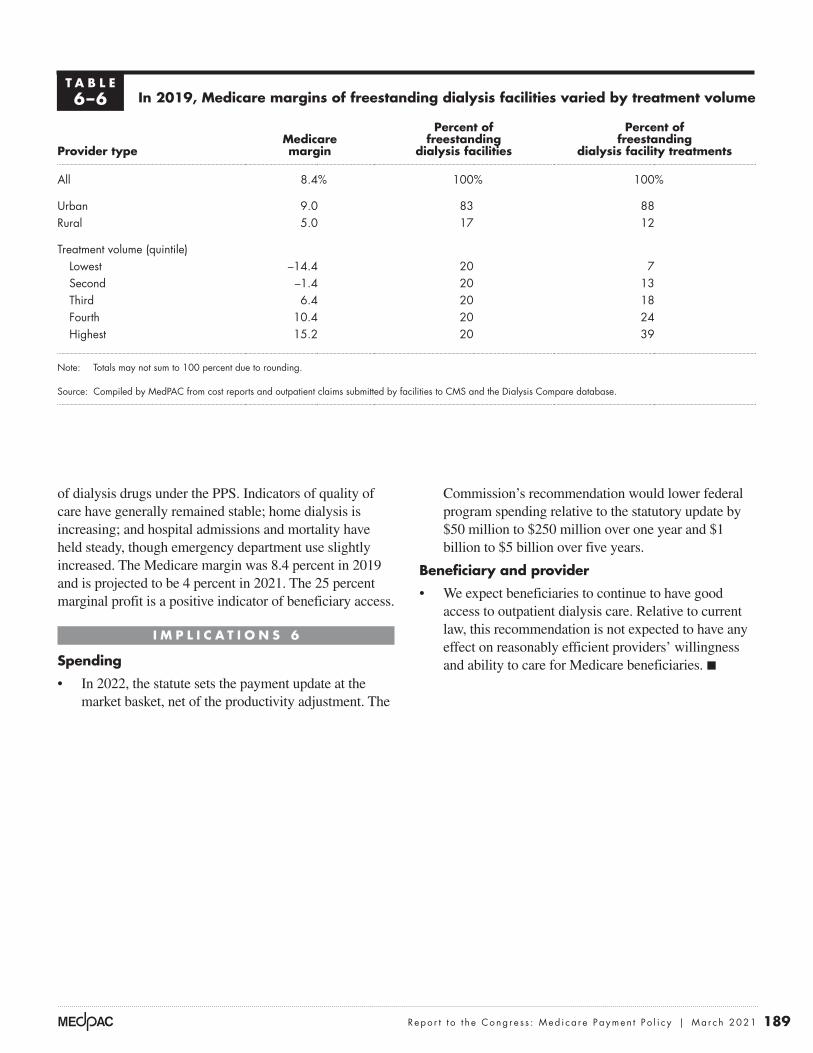
189 Repo r t t o t h e Cong r e s s : Med i ca r e Paymen t P o l i c y | Ma r ch 2021
Commission’s recommendation would lower federal program spending relative to the statutory update by $50 million to $250 million over one year and $1 billion to $5 billion over five years.
Beneficiary and provider
• We expect beneficiaries to continue to have good access to outpatient dialysis care. Relative to current law, this recommendation is not expected to have any effect on reasonably efficient providers’ willingness and ability to care for Medicare beneficiaries. ■
of dialysis drugs under the PPS. Indicators of quality of care have generally remained stable; home dialysis is increasing; and hospital admissions and mortality have held steady, though emergency department use slightly increased. The Medicare margin was 8.4 percent in 2019 and is projected to be 4 percent in 2021. The 25 percent marginal profit is a positive indicator of beneficiary access.
I M P L I C A T I O N S 6
Spending
• In 2022, the statute sets the payment update at the market basket, net of the productivity adjustment. The
T A B L E6–6 In 2019, Medicare margins of freestanding dialysis facilities varied by treatment volume
Provider typeMedicare margin
Percent of freestanding
dialysis facilities
Percent of freestanding
dialysis facility treatments
All 8.4% 100% 100%
Urban 9.0 83 88Rural 5.0 17 12
Treatment volume (quintile)Lowest –14.4 20 7Second –1.4 20 13Third 6.4 20 18Fourth 10.4 20 24Highest 15.2 20 39
Note: Totals may not sum to 100 percent due to rounding.
Source: Compiled by MedPAC from cost reports and outpatient claims submitted by facilities to CMS and the Dialysis Compare database.

190 Ou tpa t i e n t d i a l y s i s s e r v i c e s : A s s e s s i ng paymen t adequacy and upda t i ng paymen t s
1 Generally, individuals are fully insured under Social Security if they have 40 credits of covered employment (i.e., the individual is employed in a job that pays Social Security taxes). Individuals are currently insured under Social Security if they have a minimum of six credits of covered employment in the three years before ESRD diagnosis.
2 In this chapter, the term beneficiaries refers to individuals covered by Medicare, and patients refers to all individuals who have ESRD.
3 Throughout this chapter, we use the term “FFS Medicare” or “traditional Medicare” as equivalents for the CMS term “Original Medicare.” Collectively, we distinguish the payment model represented by these terms from other models such as Medicare Advantage or advanced alternative payment models that may use FFS mechanisms but are designed to create different financial incentives.
4 In this chapter, the term drugs refers to both drugs and biologics.
5 According to the American Kidney Fund, the organization provided direct financial assistance to 84,000 low-income dialysis and transplant patients.
6 For individuals entitled to Medicare based on ESRD, Medicare coverage does not begin until the fourth month after the start of dialysis, unless the individual had a kidney transplant or began training for self-care, including dialyzing at home.
7 Under the Bipartisan Budget Act of 2018, beginning January 2019, clinicians who manage home-dialysis beneficiaries can furnish their visits through telehealth (rather than in person). Beneficiaries are required to receive a face-to-face visit for the first three months of home dialysis and once every three months thereafter.
8 For pediatric dialysis beneficiaries (younger than age 18 years), the base rate is adjusted for age and type of dialysis.
9 The Commission’s Payment Basics provides more information about Medicare’s method of paying for outpatient dialysis services (available at http://medpac.gov/docs/default-source/payment-basics/medpac_payment_basics_20_dialysis_final_sec.pdf?sfvrsn=0).
10 The Commission’s March 2014 report to the Congress provides more information about the rebasing of the dialysis base payment rate (available at http://medpac.gov/docs/default-source/reports/mar14_ch06.pdf?sfvrsn=0).
11 More information about these payment changes can be found in the Commission’s March 2016 report to the Congress (available at http://www.medpac.gov/docs/default-source/reports/march-2016-report-to-the-congress-medicare-payment-policy.pdf). The Commission’s methodological concerns about these patient-level and facility-level refinements can be found in our comment letter to CMS (available at http://medpac.gov/docs/default-source/comment-letters/medpac-comment-on-cms-s-proposed-rule-on-the-end-stage-renal-disease-prospective-payment-system-and-.pdf?sfvrsn=0).
12 In 2011, CMS delayed including ESRD oral-only drugs (calcimimetics and phosphate binders paid for under Part D) in the Part B ESRD prospective payment bundle to give facilities additional time to make operational changes and logistical arrangements to furnish these products to their beneficiaries. Section 204 of the Stephen Beck, Jr., Achieving a Better Life Experience Act of 2014 delayed including oral-only renal dialysis services in the ESRD PPS bundled payment until January 1, 2025. According to CMS, these products were paid under a TDAPA because the base dialysis payment rate has not yet accounted for their costs.
13 In 2016, CMS established a drug designation process (as mandated by the Protecting Access to Medicare Act of 2014) for determining when ESRD oral-only drugs are no longer oral only and therefore must be paid under the ESRD PPS. Under the process, once the Food and Drug Administration (FDA) approves an equivalent injectable product (or other non-oral forms), the agency pays facilities for both the oral and non-oral products under a TDAPA until sufficient claims data (at least two years’ worth) for rate-setting analysis are available; thereafter, these drugs will be included in the PPS bundle.
14 Currently, drugs and biologics reported on dialysis facility claims are categorized into 1 of the following 11 functional categories: access management, anemia management, bone and mineral metabolism, cellular management, antiemetic, anti-infective, antipruritic, anxiolytic, excess fluid management, fluid and electrolyte management, and pain management.
15 To calculate an average per treatment cost (in 2020 dollars), CMS divided total calcimimetic expenditures ($683,246,041) by the total number of hemodialysis-equivalent treatments furnished between the third quarter of 2018 and the fourth quarter of 2019 (68,148,651 treatments), and then reduced the product by 1 percent to account for the ESRD PPS outlier policy.
Endnotes

191 Repo r t t o t h e Cong r e s s : Med i ca r e Paymen t P o l i c y | Ma r ch 2021
22 Treatments are nonannualized, meaning that the calculation does not account for each beneficiary’s length of dialysis (i.e., number of days) in a given year.
23 These drug classes accounted for nearly all dialysis drug spending (about 97 percent) in 2010, the year before the start of the new payment method.
24 The FDA approved epoetin beta under the biologics license application process, not under the biosimilar process.
25 To measure changes in the use of drugs in the payment bundle, we combine drugs within and across therapeutic classes by multiplying the number of drug units reported on claims in a given year by each drug’s 2020 ASP. By holding the price constant, we account for the different billing units assigned to a given drug.
26 According to CMS, the agency decreased the TDAPA payment for calcimimetics from ASP plus 6 percent to ASP because (1) facilities have had sufficient opportunity to address any administrative complexities and overhead costs associated with the provision of calcimimetics and (2) the agency needs to take into account the financial burden that increased payments place on beneficiaries and Medicare.
27 If we approximate marginal cost as total Medicare costs minus fixed building and equipment costs, then marginal profit can be calculated as follows: Marginal profit = (payments for Medicare services – (total Medicare costs – fixed building and equipment costs)) / Medicare payments. This comparison is a lower bound on the marginal profit because we do not consider any potential labor costs that are fixed.
28 According to CMS, the increasing cumulative share of beneficiaries with heart failure beginning in 2015 could be associated with the issuance of local coverage determinations in that year by CMS’s contractors that required certain conditions, including heart failure, to be reported on dialysis facility claims for Medicare to cover dialysis treatments exceeding thrice weekly (Centers for Medicare & Medicaid Services 2018).
29 Blood transfusions are of concern to patients because they (1) carry a small risk of transmitting blood-borne infections to the patient, (2) may cause some patients to develop a reaction, and (3) are costly and inconvenient for patients. Blood transfusions are of particular concern for patients seeking kidney transplantation because they increase a patient’s alloantigen sensitization, which can require a patient to wait to receive a transplant.
16 New drugs not eligible for a TDAPA include generic drugs, which the FDA approves under Section 505(j) of the Federal Food, Drug, and Cosmetic Act, and drugs approved for a new dosage form (e.g., pill size, time-release forms, chewable or effervescent pills); new drugs approved for a new formulation (e.g., new inactive ingredient); new drugs approved that were previously marketed without a new drug application (NDA); and approved new drugs that changed from prescription to over-the-counter availability. CMS will identify these drugs using the NDA classification code that the FDA assigns to an NDA.
17 CMS defines a capital-related asset as an asset that a provider has an economic interest in through ownership (as set forth in the Provider Reimbursement Manual, Chapter 1, Section 104.1). The agency includes the following items as examples of capital-related assets: dialysis machines, water purification systems, and systems designed to clean dialysis filters for reuse.
18 Because home dialysis machines are capital-related depreciable assets, CMS (1) applies a five-year straight-line depreciation method to determine an annual allowance, by dividing the MAC-determined price by its useful life of five years; (2) divides the annual allowance by the number of treatments expected to be furnished in a year; and (3) reduces the payment by an offset (of $9.32) that is intended to represent the portion of payment attributable to home dialysis machines from the base rate.
19 For example, a Commission analysis found that in 2017, 30 percent of facilities assigned only 1 star did not have a QIP payment reduction in that payment year. Conversely, nearly 10 percent of facilities assigned 4 or 5 stars had some QIP payment reduction. The correlation coefficient between a facility’s star rating and QIP score was 0.36, which means there is a positive but somewhat weak correlation between the two quality programs.
20 Under Section 319 of the Public Health Services Act, the Secretary of Health and Human Services may determine that a disease or disorder presents a public health emergency (PHE) or that a PHE, including significant outbreaks of infectious disease or bioterrorist attacks, otherwise exists. The Secretary first determined the existence of a coronavirus PHE, based on confirmed cases of COVID-19 in the U.S., on January 31, 2020. At the time of publication, the coronavirus PHE had been renewed four times, most recently on January 7, 2021.
21 Based on the Commission’s analysis of Medicare and total treatments reported by freestanding facilities on cost reports submitted to CMS.

192 Ou tpa t i e n t d i a l y s i s s e r v i c e s : A s s e s s i ng paymen t adequacy and upda t i ng paymen t s
36 One of the two LDOs reported calcimimetic costs ranging from $4 per treatment to $11 per treatment in 2019.
37 Given the vertical integration of the outpatient dialysis sector, such an audit could assess the reporting of costs by facilities for services purchased by a related organization. Under current regulation, if a provider obtains services from an organization that is owned or controlled by the provider’s owner, reimbursable cost should include the costs for these items at the supplying organization’s cost. However, if the price in the open market for comparable services is lower than the supplier’s cost, the allowable cost to the provider may not exceed the market price.
38 As a result of rebasing, in 2014, CMS reduced the base payment rate by $8.16 to $239.02.
39 The Commission’s longstanding approach to calculating the Medicare ESRD PPS margin uses only Medicare-allowable costs for ESRD services. Such an approach is consistent with the methods we use to calculate the Medicare margin for other FFS sectors. Our ESRD margin analysis relies on the cost data that freestanding dialysis facilities report on the cost reports that they submit to CMS. In 2019, there was an anomalous increase in non-ESRD drug costs compared to prior years. Consistent with our longstanding approach, non-ESRD drug costs are not included in the Commission’s analysis of ESRD PPS costs incurred by freestanding dialysis facilities or in our calculation of the ESRD PPS margin.
40 The FDA delayed the drug’s PDUFA date by three months (from December 30, 2020 to March 30, 2021) to review additional analyses of existing clinical data.
30 See our March 2020 report to the Congress for more information on the factors that affect use of home dialysis and the factors associated with some patients’ discontinuation of home dialysis (available at http://www.medpac.gov/docs/default-source/reports/mar20_medpac_ch6_sec.pdf?sfvrsn=0).
31 This analysis used 100 percent of 2014 through 2019 carrier and outpatient claims submitted for KDE services.
32 MIPPA does not permit other providers (such as registered nurses, social workers, and dieticians) or dialysis facilities to bill for KDE services.
33 In addition, for beneficiaries with AKI, Medicare pays dialysis facilities separately for drugs, biologicals, and laboratory services that are not renal dialysis services.
34 In 2018, about 90 percent of FFS dialysis beneficiaries were enrolled in Part D or had other sources of creditable drug coverage. About 10 percent of FFS dialysis beneficiaries in 2018 had either no Part D coverage or coverage less generous than Part D’s standard benefit.
35 Freestanding dialysis facility cost reports do not collect the cost of calcimimetics separately from other ESRD drugs. To estimate providers’ cost of calcimimetics, we determined the difference between 2017 and 2019 in the cost per treatment for other ESRD drugs (that are neither ESAs nor composite rate drugs). Between 2014 and 2017, the cost per treatment for other ESRD drugs declined by 13 percent per year.

193 Repo r t t o t h e Cong r e s s : Med i ca r e Paymen t P o l i c y | Ma r ch 2021
Berns, J. S., A. Glickman, and M. S. McCoy. 2018. Dialysis-facility joint-venture ownership—Hidden conflicts of interest. New England Journal of Medicine 379, no. 14 (October 4): 1295–1297.
Centers for Medicare & Medicaid Services, Department of Health and Human Services. 2020. Medicare program; end-stage renal disease prospective payment system, payment for renal dialysis services furnished to individuals with acute kidney injury, and End-Stage Renal Disease Quality Incentive Program. Final rule. Federal Register 85, no. 217 (November 9): 71398–71487.
Centers for Medicare & Medicaid Services, Department of Health and Human Services. 2019. ESRD prospective payment system claims-based monitoring program. Baltimore, MD: CMS.
Centers for Medicare & Medicaid Services, Department of Health and Human Services. 2018. Medicare program; end-stage renal disease prospective payment system, payment for renal dialysis services furnished to individuals with acute kidney injury, end-stage renal disease quality incentive program, durable medical equipment, prosthetics, orthotics and supplies (DMEPOS) competitive bidding program (CBP) and fee schedule amounts, and technical amendments to correct existing regulations related to the CBP for certain DMEPOS. Final rule. Federal Register 83, no. 220 (November 14): 56922–57073.
Charnow, J. 2020. COVID-19 crisis could speed adoption of home dialysis. Renal & Urology News, April 24.
Cooper, B. A., P. Branley, L. Bulfone, et al. 2010. A randomized, controlled trial of early versus late initiation of dialysis. New England Journal of Medicine 363, no. 7 (August 12): 609–619.
DaVita. 2020. Joint ventures and acquisitions. https://www.davita.com/physicians/partnerships/joint-ventures-acquisitions.
DaVita. 2018. Annual report pursuant to section 13 or 15(d) of the Securities Exchange Act of 1934 for the fiscal year ended December 31, 2017. February 23.
Devoe, D. J., B. Wong, M. T. James, et al. 2016. Patient education and peritoneal dialysis modality selection: A systematic review and meta-analysis. American Journal of Kidney Diseases 68, no. 3 (September): 422–433.
Ephraim, P. L., N. R. Powe, H. Rabb, et al. 2012. The providing resources to enhance African American patients’ readiness to make decisions about kidney disease (PREPARED) study: Protocol of a randomized controlled trial. BMC Nephrology 13: 135.
Evans, M., G. Tettamanti, O. Nyren, et al. 2011. No survival benefit from early-start dialysis in a population-based, inception cohort study of Swedish patients with chronic kidney disease. Journal of Internal Medicine 269, no. 3 (March): 289–298.
Fishbane, S., S. Agoritsas, A. Bellucci, et al. 2017. Augmented nurse care management in CKD Stages 4 to 5: A randomized trial. American Journal of Kidney Diseases 70, no. 4 (October): 498–505.
Government Accountability Office. 2015. End-stage renal disease: Medicare payment refinements could promote increased use of home dialysis. Washington, DC: GAO.
Kazmi, W. H., D. T. Gilbertson, G. T. Obrador, et al. 2005. Effect of comorbidity on the increased mortality associated with early initiation of dialysis. American Journal of Kidney Diseases 46, no. 5 (November): 887–896.
Kossman, R., and D. Williamson. 2020. Op-ed: Business rivals join to help vulnerable kidney patients during COVID–19. MedPage Today, June 22.
Lin, E., X. S. Cheng, K. K. Chin, et al. 2017. Home dialysis in the prospective payment system era. Journal of the American Society of Nephrology 28, no. 10 (October): 2993–3004.
Medicare Payment Advisory Commission. 2020. Report to the Congress: Medicare and the health care delivery system. Washington, DC: MedPAC.
Medicare Payment Advisory Commission. 2016. Comment letter on CMS’s proposed rule on the ESRD prospective payment system, July 29.
Medicare Payment Advisory Commission. 2015. Comment letter to CMS on the ESRD prospective payment system and the ESRD Quality Incentive Program, August 6.
Medicare Payment Advisory Commission. 2014. Comment letter to CMS on the end-stage renal disease prospective payment system and quality incentive program proposed rule, August 15.
Medicare Payment Advisory Commission. 2013. Report to the Congress: Medicare payment policy. Washington, DC: MedPAC.
Medicare Payment Advisory Commission. 2009. Report to the Congress: Medicare payment policy. Washington, DC: MedPAC.
Medicare Payment Advisory Commission. 2000. Report to the Congress: Medicare payment policy. Washington, DC: MedPAC.
References

194 Ou tpa t i e n t d i a l y s i s s e r v i c e s : A s s e s s i ng paymen t adequacy and upda t i ng paymen t s
Moist, L. M., J. L. Bragg-Gresham, R. L. Pisoni, et al. 2008. Travel time to dialysis as a predictor of health-related quality of life, adherence, and mortality: The Dialysis Outcomes and Practice Patterns Study (DOPPS). American Journal of Kidney Diseases 51, no. 4 (April): 641–650.
Motley Fool. 2020. FibroGen Inc (FGEN) Q3 2020 earnings call transcript. https://www.fool.com/earnings/call-transcripts/2020/11/06/fibrogen-inc-fgen-q3-2020-earnings-call-transcript/.
Nasdaq. 2020. Hemodialysis device maker Outset Medical prices upsized IPO above the range at $27, September 15. https://www.nasdaq.com/articles/hemodialysis-device-maker-outset-medical-prices-upsized-ipo-above-the-range-at-%2427-2020-09.
Pravoverov, L. V., S. Zheng, R. Parikh, et al. 2019. Trends associated with large-scale expansion of peritoneal dialysis within an integrated care delivery model. JAMA Internal Medicine 179, no. 11 (November 1): 1537.
Reuters. 2016. FMC aims for 110,000 U.S. patients to be on Mircera in first-quarter. February 24. http://www.reuters.com/article/us-fresenius-medi-results-mircera-idUSKCN0VX11F.
Seeking Alpha. 2018. American Renal Associates (ARA) CEO, Joe Carlucci on Q3 2018 results—earnings call transcript. https://seekingalpha.com/article/4220467-american-renal-associates-ara-ceo-joe-carlucci-q3-2018-results-earnings-call-transcript?part=single.
Seeking Alpha. 2016. Fresenius Medical Care AG & Co. KGaA (FMS) Rice Powell on Q4 2015 results—Earnings call transcript. February 24. https://seekingalpha.com/article/3926506-fresenius-medical-care-ag-and-co-kgaa-fms-rice-powell-q4-2015-results-earnings-call.
Stel, V. S., F. W. Dekker, D. Ansell, et al. 2009. Residual renal function at the start of dialysis and clinical outcomes. Nephrology Dialysis Transplantation 24, no. 10 (October): 3175–3182.
Traynor, J. P., K. Simpson, C. C. Geddes, et al. 2002. Early initiation of dialysis fails to prolong survival in patients with end-stage renal failure. Journal of the American Society of Nephrology 13, no. 8 (August): 2125–2132.
United States Renal Data System, National Institute of Diabetes and Digestive and Kidney Diseases. 2020. USRDS 2020 annual data report. Bethesda, MD: NIDDK.
Walker, D. R., G. W. Inglese, J. A. Sloand, et al. 2010. Dialysis facility and patient characteristics associated with utilization of home dialysis. Clinical Journal of the American Society of Nephrology 5, no. 9 (September): 1649–1654.
Woolridge, S. 2020. 5 new drugs coming down the pipeline in 2021. BenefitsPRO, December 16. https://www.benefitspro.com/2020/12/16/5-new-drugs-coming-down-the-pipeline-in-2021/?.&slreturn=20201118135101.