
Our winners are everywhere! - The Ohio Lottery
52
The Ohio Lottery | An Enterprise Fund of the State of Ohio TM Comprehensive Annual Financial Report for the Fiscal Years Ended June 30, 2009 and 2008 Our winners are everywhere! People play. People win. Schools benefit. Over 16 billion for education since 1974. These happy faces are a few of the many millions of Lottery winners. Our big winners, however, are Ohio schools. They received $702.3 million from the Lottery Profits Education Fund in Fiscal Year 2009.
-
Upload
khangminh22 -
Category
Documents
-
view
0 -
download
0
Transcript of Our winners are everywhere! - The Ohio Lottery

The Ohio Lottery | An Enterprise Fund of the State of Ohio
TMComprehensive Annual Financial Report for the Fiscal Years Ended June 30, 2009 and 2008
Our winners are
everywhere!
People play.
People win.
Schools benefit.
Over 16 billion for
education since 1974.
These happy faces are a few of the many millions of Lottery winners. Our big winners, however, are Ohio schools. They received $702.3 million from the Lottery Profits Education Fund in Fiscal Year 2009.
090707_OLC_CAFR 09_cover.indd 1 12/11/09 9:01:02 AM

Comprehensive Annual Financial Report 2009 & 2008 �
The Ohio Lottery Commission
An Enterprise Fund of the State of Ohio Comprehensive Annual Financial Report
For the Fiscal Years Ended June 30, 2009 and 2008
Prepared by the Ohio Lottery Office of Finance
Ted Strickland, GovernorKathleen B. Burke, Executive Director
Allan C. Krulak, Commission ChairpersonDennis R. Berg, CPA, CFE, Deputy Director, Office of Finance

� Over $16 Billion For Education Since 1974.
Comprehensive Annual Financial Report 2009 & 2008 �
TABLE OF CONTENTS
INTRODUCTORY SECTIONLetter of Transmittal ...................................................................................................................................................................6
GFOA Certificate of Achievement ...............................................................................................................................................12
Structure of Organization ..........................................................................................................................................................13
Principal Officials ......................................................................................................................................................................14
FINANCIAL SECTIONIndependent Accountants’ Report ...............................................................................................................................................16
Management’s Discussion and Analysis ......................................................................................................................................18
Basic Financial Statements:
Statement of Net Assets – Major Funds ..............................................................................................................................22
Statement of Revenues, Expenses, and Changes in Fund Net Assets – Major Funds ...............................................................23
Statement of Cash Flows – Major Funds .............................................................................................................................24
Notes to Basic Financial Statements ..................................................................................................................................25
STATISTICAL SECTIONIntroduction ..............................................................................................................................................................................36
Ohio Lottery Statistics:
Net Assets, Revenues and Sales ........................................................................................................................................37
History of Payments to Education ......................................................................................................................................38
Prize Payout and Expenses ................................................................................................................................................39
Lottery Industry Statistics ..................................................................................................................................................40
Ohio Lottery Comparative Statistics ...................................................................................................................................41
Employee Data .................................................................................................................................................................42
Retailer Data ....................................................................................................................................................................42
State of Ohio Statistics
State of Ohio Demographics ..............................................................................................................................................43
� Over $16 Billion For Education Since 1974.

Comprehensive Annual Financial Report 2009 & 2008 �
Introductory Section
TM
Jennifer: Top Prize WinnerJennifer received a $1,000 winning instant ticket as a tip from a customer. More than a year later she won the $100,000 Top Prize from the same instant ticket. That’s a gift that kept on giving.
� Over $16 Billion For Education Since 1974.
November 13, 2009
To the Governor of the State of OhioThe Ohio Lottery Commissioners andThe Citizens of Ohio:
We are pleased to submit to you this Comprehensive Annual Financial Report (CAFR) of the Ohio Lottery Commission (the Ohio Lottery) for the fiscal year ended June 30, 2009. The Office of Finance of the Ohio Lottery has prepared this report in accordance with generally accepted accounting principles. The Ohio Lottery, an agency of the State of Ohio (the State), was created in July 1974 and is operated as a business enterprise within the framework of the State’s laws and regulations. The Ohio Lottery’s mission is to maximize revenues to provide funds for the educational system of the State by offering dignified games of chance to the public at large.
The Ohio Lottery is an enterprise of the State and is included in the State’s CAFR. The Ohio Lottery’s activity is reported as an enterprise fund type and includes all activity for which the Ohio Lottery is financially accountable. No data related to any other State agency or fund is included.
BACKGROUNDIn 1964, New Hampshire established a state-run lottery to raise money for education. It became the first state in the United States to enter the lottery business. New York followed in 1967. In 1971, New Jersey introduced a computer-based $0.50 weekly game, which offered frequent drawings, inexpensive tickets, convenience of sale and a weekly prize of $50,000. New Jersey grossed $142.5 million in its first year and established a new paradigm for the industry. New York and New Hampshire revamped their systems and other states soon introduced lotteries using New Jersey’s operation as a model. Ohio implemented its lottery in 1974.
To increase player involvement, state lotteries now market games that feature faster play action and a greater degree of player participation. Ticket sales increased significantly in the early 1990s. As of September 30, 2009, 43 U.S. states, the District of Columbia and the U.S. Virgin Islands operate lotteries using computer-based online games and instant “scratch off” games.
ECONOMIC OUTLOOKThis past year, the United States endured its worst economy in recent history. The U.S. Government made a decision to provide bailouts to the banking, insurance and automotive industries. The United States created the Troubled Asset Relief Program, which averted a possible collapse of the financial markets. The economy was further hit with an unemployment rate in the United States that continued to grow, with the national rate reaching a high of 9.8 percent in September 2009 as compared to 6.2 percent in September 2008.
During the third quarter, the Gross Domestic Product is expected to show an increase of approximately 3.0 percent. The economy appears to have started a moderate U-shaped recovery that will continue into 2010. However, economists are cautious since the third quarter consumer spending trend included the now expired Cash-for-Clunkers trade in program and the federal stimulus package.
The year 2009 was also one of Ohio’s worst economic years in recent history. Much of Ohio relies on the automotive industry and the manufacturing concerns that support that industry. With auto sales lagging for all of 2008 and the first half of 2009, automotive manufacturers idled most if not all of their plants for an extended period of time. The idled automotive industry caused a chain reaction throughout the supply chain, forcing suppliers to implement staff reductions. This chain reaction and the reduction in staffing in the financial industry pushed the unemployment rate to a high of 11.2 percent in July 2009. On a positive note, as of September 2009, the unemployment rate for Ohio has dropped to 10.1 percent.
Many factors in the national and state economies directly impact revenue generation at the Ohio Lottery. As smaller retail outlets close, national big box retailers and bulk consumer product warehouse clubs open in their place. The Ohio Lottery’s revenues are negatively impacted by this national and statewide trend because these retailers do not consider lottery products part of their business model.
Despite the weak economy, fiscal year 2009 marks the eighth consecutive year of sales growth for the Ohio Lottery, increasing 4.0 percent from fiscal year 2008 to fiscal year 2009. The Ohio Lottery has taken strategic measures over the past years to keep lottery products fresh in an effort to rejuvenate player interest. Additionally, as consumers scale back on discretionary spending, Ohio Lottery games offer an affordable entertainment alternative.
LOTTERY PRODUCTSThe Ohio Lottery provides the opportunity for the public to participate in different games with two styles of play - instant games and online games. Descriptions of the games and their portion of sales are as follows:
INSTANT GAMES are played by scratching the latex covering off a play area to reveal pre-printed combinations. There are different ways to win in an instant or “scratch off” game, such as matching three like dollar amounts, symbols or letters. If the correct combinations appear, the player becomes an “instant winner” and may immediately submit a claim to cash the ticket.
Instant games have been the Ohio Lottery’s dominant product since fiscal year 1997. For fiscal year 2009, instant game sales of $1.3 billion decreased $15.4 million or 1.1 percent from the previous fiscal year and represented 55.8 percent of total ticket sales. The Ohio Lottery has successfully sold instant games at the $1, $2, $3, $5, $7, $10, $12 and $20 price points. The Ohio Lottery continues to feature several “spotlight” instant games, which are games sold at the $10 and $20 price points with attractive, higher prize payouts.
THE OHIO LOTTERY COMMISSION ��� West Superior AvenueCleveland, Ohio �����-�879�-800-�8�-��08

Comprehensive Annual Financial Report 2009 & 2008 7
ONLINE GAMES allow the customer to pick the numbers for their wager or utilize automatic computer-generated plays. They receive a ticket with the numbers selected and must wait for a drawing to determine if they have matched the numbers and won.
MEGA MILLIONS is a multi-state online game. For each wager, players select five numbers from a pool of 1 to 56 and select one Mega ball number from a second pool of 1 to 46. To win the jackpot, all six numbers must
be matched. The jackpot starts at $12 million and increases if not won. Drawings are held on Tuesday and Friday evenings. Mega Millions sales for fiscal year 2009 were $193.0 million, or 8.0 percent of total Ohio Lottery sales.
KICKER is an online game, with a top prize of $100,000, which can only be purchased along with Mega Millions. To win you must match in exact order from left to right, the computer generated six-digit Kicker number printed
on each Mega Millions ticket. Prizes are also awarded for 5 of 6, 4 of 6, 3 of 6, and 2 of 6 matches. Kicker sales are materially impacted by the sales volume of Mega Millions. Sales for fiscal year 2009 were $21.4 million, or 0.9 percent of total Ohio Lottery sales.
CLASSIC LOTTO is an online game in which players select six numbers from a pool of 1 to 49. To win the jackpot, all six numbers must be matched. The jackpot starts at $1 million and increases if not won. Drawings are held
on Monday, Wednesday and Saturday evenings. Classic Lotto sales for fiscal year 2009 were $43.9 million, or 1.8 percent of total Ohio Lottery sales.
PICK � was Ohio’s first online game. Players select a three-digit number from 000 to 999 and can play the numbers straight (numbers in exact order), boxed (numbers in any order) or as backup bets (players can win
either or both ways). A wheel wager can also be placed. This wager is, in essence, equivalent to a straight bet being made for each number combination. Pick 3 sales for fiscal year 2009 were $382.5 million, or 15.8 percent of total Ohio Lottery sales.
PICK � is played similar to Pick 3. Players select a four-digit number from 0000 to 9999 and may play them straight, boxed or in back-up bets. Pick 4 began in 1981. Sales for fiscal year 2009 were $205.9 million, or
8.5 percent of total Ohio Lottery sales. Both Pick 3 and Pick 4 are drawn midday and evenings Sunday through Saturday.
ROLLING CASH � is an online game in which players select five numbers from a pool of 1 to 39, with overall odds of winning any prize of 1 in 9. The top prize starts at $100,000 and increases if not won. Sales for fiscal year
2009 were $67.2 million, or 2.8 percent of total Ohio Lottery sales. Drawings are held Sunday through Saturday.
RAFFLE was introduced to the Ohio Lottery’s players for the first time in fiscal year 2007. The game is similar to a traditional 50-50 raffle, with players purchasing a single ticket worth $20. The tickets, which have a six-digit
number, are sold in sequential order. Prizes range from $100 to $1,000,000. The sales period for raffles is targeted for a set period of time, followed by the drawing. Sales for fiscal year 2009 were $9.3 million, or 0.4 percent of total Ohio Lottery sales.
TEN-OH! is an online game which was introduced in August 2007. Ten-OH! is a pick 10 draw game in which players can win a top prize of $500,000 by matching 10 of 20 numbers drawn. There are six other prizes including $3
for matching 0 of the 20 numbers drawn. Drawings are held both midday and evenings on Sunday through Saturday. Sales for fiscal year 2009 were $11.0 million, or 0.5 percent of total Ohio Lottery sales.
EZ PLAY is a game that was introduced in Ohio in April 2008. EZPlay is a hybrid instant/online game. EZPlay combines the instant win experience with an online game component. The player purchases an online ticket that is
made up of two sections, a draw section followed by a play section. Players then match the two sections to determine if they are a winner. Game themes and ticket selling prices can be easily changed to keep the product line fresh. Sales for fiscal year 2009 were $34.3 million, or 1.4 percent of total Ohio Lottery sales.
KENO is an online game that debuted in Ohio in August 2008. Currently KENO is offered to retailers who hold a Class D liquor permit with on-site consumption in age and time controlled environments. KENO is a draw game in
which a player can choose from 1 to 10 numbers (also called spots) for a top prize of $100,000 by matching 10 of 20 numbers drawn. Drawings are held every day starting at 11:04 a.m. and occurring every four minutes, ending at 1:44 a.m. Sales for fiscal year 2009 were $ 99.8 million, or 4.1 percent of total Ohio Lottery sales.
8 Over $16 Billion For Education Since 1974.
ACCOMPLISHMENTSOhio Lottery profits were specifically designated by statute in 1987 to help fund the State’s public education system through the Lottery Profits Education Fund (LPEF). During fiscal year 2009, the Ohio Lottery transferred $702.3 million to the LPEF, bringing the total funding the Ohio Lottery has provided in support of the State’s public education system to over $16.3 billion since its inception in 1974. The $702.3 million transfer to the LPEF in fiscal year 2009 was $30.1 million above the Ohio Lottery’s fiscal year 2008 transfer amount. Additionally, several other milestones were achieved during fiscal year 2009. These include:
Upon the approval of Keno by Governor Strickland in January 2008, the Ohio Lottery established licensing procedures and began recruiting retailers to sell Keno in establishments with a Class D liquor permit with onsite liquor consumption. By adopting Keno, which went on sale in August 2008, the Ohio Lottery became one of 13 states to sell the game. This new trade channel has provided the Ohio Lottery the opportunity to reach out to establishments such as bars, taverns, restaurants, fraternal organizations and bowling alleys to sell the new Keno game, as well as all other Ohio Lottery games.
On July 1, 2009, the Ohio Lottery successfully completed its conversion to a new gaming system vendor, Intralot USA. The contract award is for two years, with up to four two-year renewals. The Ohio Lottery is projected to save upwards of $200 million over a ten-year period under the new contract as compared with the preceding contract. Expected savings result from lower commission rates paid to the gaming system vendor, savings on communication services and the bundling of ticket dispensing and player activated equipment. The new gaming system replaced all existing gaming equipment, including terminals, printers, ticket checkers and communications protocols.
Partners in Education completed its second year honoring outstanding students and teachers from around the state. The Ohio Lottery encourages nominations from students, teachers and parents in each of the Ohio Lottery’s nine geographical areas for the Academic All Star and Teacher of the Month awards. More than 100 schools statewide were represented in the nomination process. Random drawings are held monthly to select the winners. Awardees receive public recognition and an invitation to a community or sports event.
The Ohio Lottery offered to pay the materials and enrollment fee for any school entering the Scripps National Spelling Bee. Approximately 1,700 schools took advantage of the Ohio Lottery’s support for entry to this prestigious national event this past year. The event is held annually in March.
During fiscal year 2009 the Ohio Lottery, in conjunction with the Ohio Attorney General and the Ohio Department of Job and Family Services, recovered a total of $1,049,727 from 294 prize winners who owed either state debt or child support.
For fiscal year 2009, Ohio had three Mega Millions jackpot wins for an advertised jackpot total of $297.7 million, generating state tax withholdings of nearly $11.7 million. Since May 2002, when Ohio began participating in the Mega Millions game, Ohio has had 14 jackpot winners representing advertised jackpots of more than $1.6 billion. The State of Ohio benefits each time a jackpot winner is drawn in Ohio since state income taxes are withheld from the prize winner’s gross proceeds. Since the inception of Mega Millions, state tax withholdings for jackpot prize winners have totaled $40.3 million.
The Ohio Lottery is an active participant in the State’s implementation of the Ohio Administrative Knowledge System (OAKS) project. The system has integrated five major statewide business functions and has resulted in decreased paperwork and duplication of effort and has minimized the potential for inaccurate information. The Ohio Lottery participated in the debut of the Budget Module in July 2008, which was used to facilitate development of the fiscal year 2010-2011 biennium budget.
The Ohio Lottery instituted a pilot program in January 2008 utilizing player activated machines. These player activated machines are designed to allow the player to purchase instant and online tickets without the direct assistance of a lottery retailer. The machines can accept cash and carry instant ticket games for purchase as well as any online game with the exception of KENO and EZPLAY. Having successfully completed the pilot program, the Ohio Lottery has begun to deploy approximately 1,500 WINSTATION machines that were received in conjunction with the new gaming contract.
The employees of the Ohio Lottery are very active in the philanthropic community. Each year, employees participate in several events, some of which are:
Combined Charitable CampaignHarvest for HungerGo Red for WomenDomestic Violence Women’s Shelter
In an effort to promote a healthy and productive workforce, Ohio Lottery employees participated in numerous health and wellness awareness programs, along with free health screenings and fitness health walks throughout the year. The health programs are designed to empower employees and encourage positive living habits which in turn help to create a productive workforce. The positive momentum and general acceptance by the Ohio Lottery’s associates has continued into fiscal year 2010. Lastly, certain health initiative programs are designed to actually reward employees monetarily as a direct result of their participation.
The Ohio Lottery has made a concerted effort to be responsible and safeguard the environment by “Going Green.” The Ohio Lottery has downsized its vehicles in both size and number, resulting in better fuel efficiency and reduced repair costs.
Mini vans make up 81.0 percent of the fleet.Flex fuel vehicles make up 63.0 percent of the fleet.
The Ohio Lottery also participates in a state sponsored recycling program. In fiscal year 2009, the Ohio Lottery recycled paper, plastic and aluminum cans.
FUTURE PROJECTSThe Ohio Lottery continues to develop new ways to enhance its current product offerings and maximize operational efficiency and effectiveness. In fiscal year 2010, the Ohio Lottery’s energies are being concentrated on the following projects:
As the lottery games available in the industry evolve, the Ohio Lottery will continue to evaluate available game options and prize matrices. As such, the Ohio Lottery plans to benchmark Ohio’s sales results against peer lottery states and review best practices in an effort to optimize Ohio’s catalog of products. From time-to-time during the fiscal year, the Ohio Lottery plans to adjust both its instant ticket and online gaming product mix as necessary. Collaboration with the Ohio Lottery’s primary instant ticket and online gaming vendors will enhance the Ohio Lottery’s research and benchmarking efforts.
•
•
•
•
•
•
•
•
•
••••
•
•
••
•
•
Comprehensive Annual Financial Report 2009 & 2008 9
Throughout fiscal year 2010, the Ohio Lottery will deploy equipment to enhance the sales of Keno. Keno retailers may choose to receive a MP machine, which is a self-service device designed for Keno establishments.
The Ohio Lottery plans to enhance the number of promotional offerings available to the public. Industry practices support the need for retailers to implement on-going promotional programs to stimulate the public’s interest in the products being offered. There are numerous promotional opportunities the Ohio Lottery plans to offer over the course of the fiscal year.
The Ohio Lottery, in conjunction with the North American Association of State and Provincial Lotteries, strives to create best practice standards and initiatives within the industry. In fiscal year 2010, the Ohio Lottery will continue to streamline processes, promote industry best practices and adopt common technology protocols.
ACCOUNTING SYSTEMS AND POLICIESThe Ohio Lottery operates under two enterprise funds, each using the full accrual basis of accounting. Under this basis, revenues are recognized when earned and expenses are recognized when incurred. The two Ohio Lottery funds are the Lottery Operating Fund and the Deferred Prizes Fund.
The Ohio Lottery’s operations are accounted for on a flow of economic resources measurement focus. With this measurement focus, all assets and liabilities associated with the operations of the Ohio Lottery are included in the statement of net assets. Operating statements present increases (e.g. revenues) and decreases (e.g. expenses) in total net assets. A narrative overview and analysis of the Ohio Lottery’s financial activities for the fiscal year ended June 30, 2009 may be found in Management’s Discussion and Analysis in the financial section of this document.
BUDGETARY CONTROLBudgetary control for all state agencies is maintained through legislative appropriations and the executive branch allotment. The budget includes all costs to operate the Lottery with the exception of certain prizes paid to winners and all commissions paid to retailers. Prizes and commissions are funded through the sale of lottery tickets and are not included as part of the biennial budget submitted for approval. An encumbrance system is utilized, whereby purchase orders reserve portions of applicable appropriations. The appropriations and the amounts expended within the Ohio Lottery’s funds are monitored by the State of Ohio Office of Budget and Management. The adopted budget is divided among the operating offices at the Ohio Lottery, which have responsibility for delivery of service. These offices control the funds within their program. The Finance Office monitors all accounts via OAKS and its accounting reporting system, Solomon. Additionally, the Ohio Lottery prepares periodic revisions to project revenue and expenditure trends and implements any changes necessary to keep both within appropriation and internal management targets set by the Director.
INTERNAL CONTROL ENVIRONMENTManagement of the Ohio Lottery is responsible for establishing and maintaining internal controls designed to ensure that assets are protected from loss, theft or misuse, and to ensure that the accounting system allows for compilation of accurate and timely financial information. Financial information must be reported at monthly public meetings of the Ohio Lottery. The structure is designed to provide reasonable, but not absolute, assurance that these objectives are met.
To enhance controls over accounting procedures, the Ohio Lottery has segregated the following functions: personnel and payroll; purchasing; accounts payable; general ledger; and accounts receivable processing. Additionally, a Contract Compliance Officer monitors the execution of all large vendor contracts. Data input and processing is separate from system programming. An Information Security Manager monitors and audits automated systems. An Electronic Data Processing Audit Plan is executed annually to further improve internal controls. An internal audit team reviews all areas of operations and reports to the Director. The Office of Internal Audit prepares an annual internal audit plan and formally submits the plan to the Auditor of State for approval. Results of these internal audits have been submitted to the Auditor of State for review and consideration in its financial audit.
Since the Ohio Lottery manages a valuable ticket inventory and controls the disbursement of prizes, the following steps are taken to ensure that operations remain honest and secure:
Maintain secure Ohio Lottery facilities with limited access.Perform background checks on retailers, contractors and Ohio Lottery employees.Print lottery tickets with special paper, inks, dyes and security codes.Establish and execute detailed procedures for all game drawings.Contract with the Auditor of State as an independent witness to further ensure the integrity of our drawings, promotions and the television game show.Provide a variety of access and other controls in our computer systems.
•
•
•
•••••
•

�0 Over $16 Billion For Education Since 1974.
FINANCIAL INFORMATIONThe Ohio Lottery operates as an enterprise activity, selling lottery tickets to the general public and funding all related support activities from funds internally generated. No general government functions or fiduciary operations are managed by the Ohio Lottery or included in this report.
DEBT ADMINISTRATIONA majority of the Ohio Lottery’s non-current liabilities are comprised of payments owed to deferred prizewinners. The payments due are funded by an investment portfolio managed by the Treasurer of the State of Ohio and shown as restricted assets of the Ohio Lottery on its statements of net assets. Other non-current liabilities include accrued workers’ compensation and compensated absences, which will be satisfied through operating activities.
GFOA CERTIFICATE OF ACHIEVEMENTThe Government Finance Officers Association (GFOA) awarded a Certificate of Achievement for Excellence in Financial Reporting to the Ohio Lottery for its CAFR for the fiscal year ended June 30, 2008. This was the twelfth consecutive year that the Ohio Lottery has achieved this prestigious award. In order to be awarded a Certificate of Achievement, the Ohio Lottery published an easily readable and efficiently organized CAFR. This report satisfied both generally accepted accounting principles and applicable legal requirements.
A Certificate of Achievement is valid for a period of one year only. We believe our current CAFR continues to meet the Certificate of Achievement Program’s requirements and we are submitting it to the GFOA to determine its eligibility for another certificate.
INDEPENDENT AUDITOhio law requires an annual audit of the Ohio Lottery by an independent auditor. The Auditor of State for the State of Ohio currently conducts the annual financial audit of the Ohio Lottery. The Ohio Lottery’s financial statements audit for fiscal year 2009 has been completed in conformity with generally accepted governmental auditing standards. The auditor’s unqualified opinion of the Ohio Lottery’s financial statements is included in the financial section of this report.
ACKNOWLEDGMENTSPreparation of this report was made possible by the efficient and dedicated efforts of our employees. A special note of thanks is given to the General Accounting Bureau comprised of Michele Olivo-Santoriella, Mike Popadiuk, Anna Callas and Joe Angelillo, and to the entire finance staff. Thanks to Michael M. Bycko, Visual Communications Manager, for the layout and graphics support of this publication. Publishing this CAFR reflects our commitment to meet the highest standards of accountability. The Ohio Lottery intends to continually improve financial management and clearly communicate its financial story. It is important for the public to know that the Ohio Lottery’s financial condition is properly reported, including payments made to education. Credit is due to former Director Michael Dolan, Commission Chair Allan C. Krulak and the members of the Ohio Lottery Board of Commissioners for their commitment to operating the Ohio Lottery in a responsible and progressive manner.
Respectfully Submitted,
Dennis R. Berg, CPA, CFEDeputy Director of Finance
Kathleen B. BurkeExecutive Director
Comprehensive Annual Financial Report 2009 & 2008 ��
�� Over $16 Billion For Education Since 1974.
Comprehensive Annual Financial Report 2009 & 2008 ��
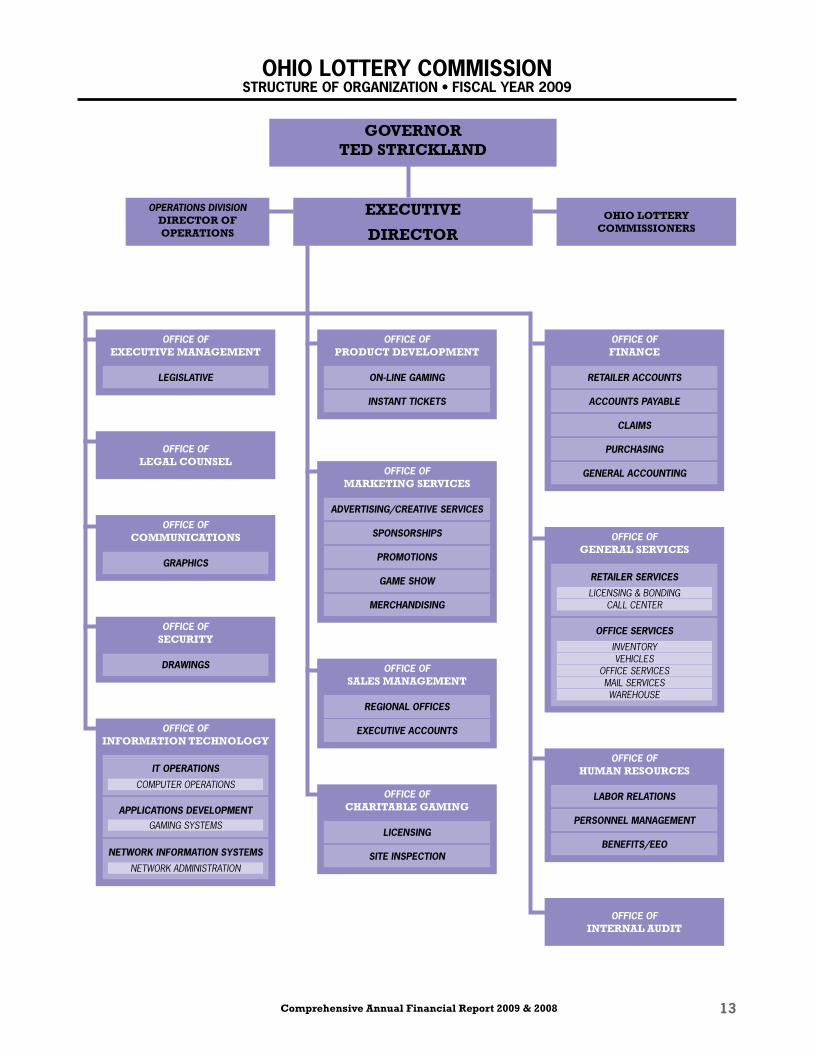
OHIO LOTTERY COMMISSION STRUCTURE OF ORGANIZATION • FISCAL YEAR �009
OFFICE OFFINANCE
PURCHASING
RETAILER ACCOUNTS
ACCOUNTS PAYABLE
CLAIMS
GENERAL ACCOUNTING
OFFICE OFHUMAN RESOURCES
LABOR RELATIONS
PERSONNEL MANAGEMENT
BENEFITS/EEO
OFFICE OFGENERAL SERVICES
OFFICE SERVICES
INVENTORYVEHICLES
OFFICE SERVICESMAIL SERVICESWAREHOUSE
RETAILER SERVICES
LICENSING & BONDINGCALL CENTER
OFFICE OFINTERNAL AUDIT
EXECUTIVE
DIRECTOROHIO LOTTERY
COMMISSIONERS
OPERATIONS DIVISIONDIRECTOR OF OPERATIONS
GOVERNOR TED STRICKLAND
OFFICE OFLEGAL COUNSEL
OFFICE OFSECURITY
DRAWINGS
OFFICE OFEXECUTIVE MANAGEMENT
LEGISLATIVE
OFFICE OFCOMMUNICATIONS
GRAPHICS
OFFICE OFINFORMATION TECHNOLOGY
IT OPERATIONS
COMPUTER OPERATIONS
APPLICATIONS DEVELOPMENTGAMING SYSTEMS
NETWORK INFORMATION SYSTEMS
NETWORK ADMINISTRATION
OFFICE OFSALES MANAGEMENT
REGIONAL OFFICES
EXECUTIVE ACCOUNTS
OFFICE OFCHARITABLE GAMING
LICENSING
SITE INSPECTION
OFFICE OFPRODUCT DEVELOPMENT
ON-LINE GAMING
INSTANT TICKETS
OFFICE OFMARKETING SERVICES
GAME SHOW
ADVERTISING/CREATIVE SERVICES
SPONSORSHIPS
PROMOTIONS
MERCHANDISING
�� Over $16 Billion For Education Since 1974.
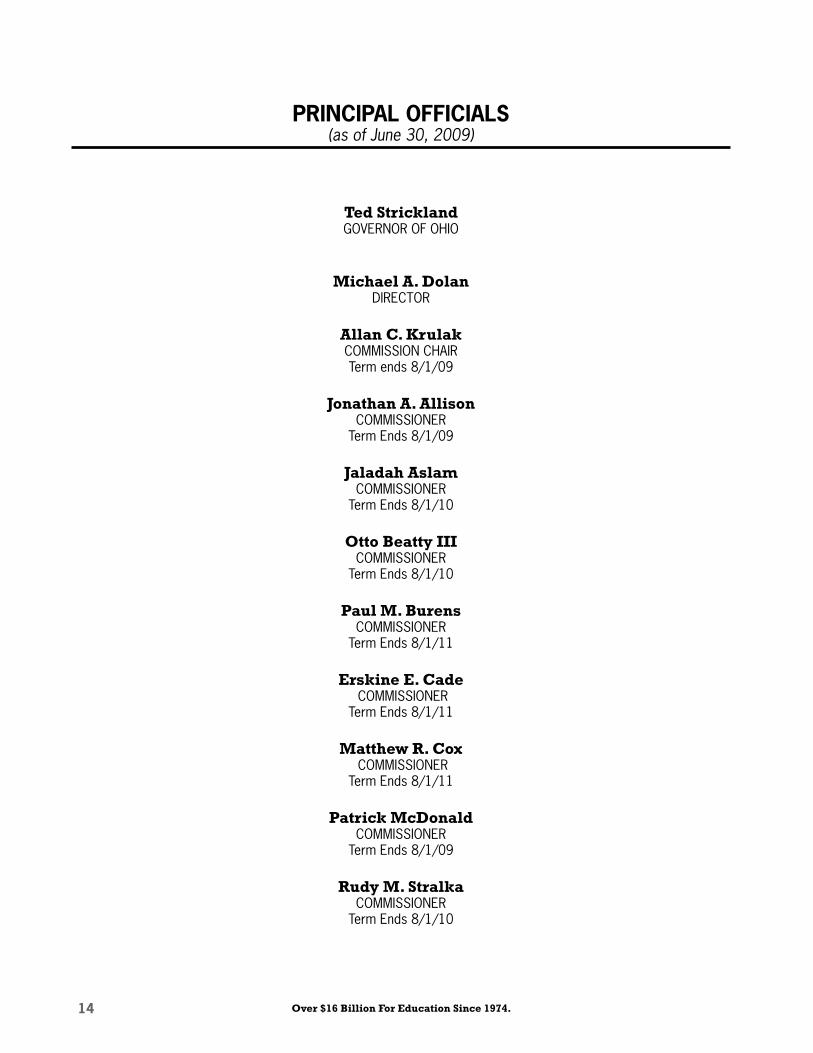
PRINCIPAL OFFICIALS (as of June 30, 2009)
Ted StricklandGOVERNOR OF OHIO
Michael A. Dolan DIRECTOR
Allan C. KrulakCOMMISSION CHAIRTerm ends 8/1/09
Jonathan A. Allison COMMISSIONER
Term Ends 8/1/09
Jaladah AslamCOMMISSIONER
Term Ends 8/1/10
Otto Beatty IIICOMMISSIONER
Term Ends 8/1/10
Paul M. BurensCOMMISSIONER
Term Ends 8/1/11
Erskine E. Cade COMMISSIONER
Term Ends 8/1/11
Matthew R. Cox COMMISSIONER
Term Ends 8/1/11
Patrick McDonald COMMISSIONER
Term Ends 8/1/09
Rudy M. StralkaCOMMISSIONER
Term Ends 8/1/10

Comprehensive Annual Financial Report 2009 & 2008 ��
Financial Section
TM
Glenda:
Keno Winner
Glenda’s a winner as a Keno player
and retailer – she’s won more
than $4,200 so far and her family
establishment thrives.
She turned those wins into a
nice new big screen digital TV.
��
Lausche Building / 615 Superior Ave., NW / Twelfth Floor / Cleveland, OH 44113 1801Telephone: (216) 787 3665 (800) 626 2297 Fax: (216) 787 3361
www.auditor.state.oh.us
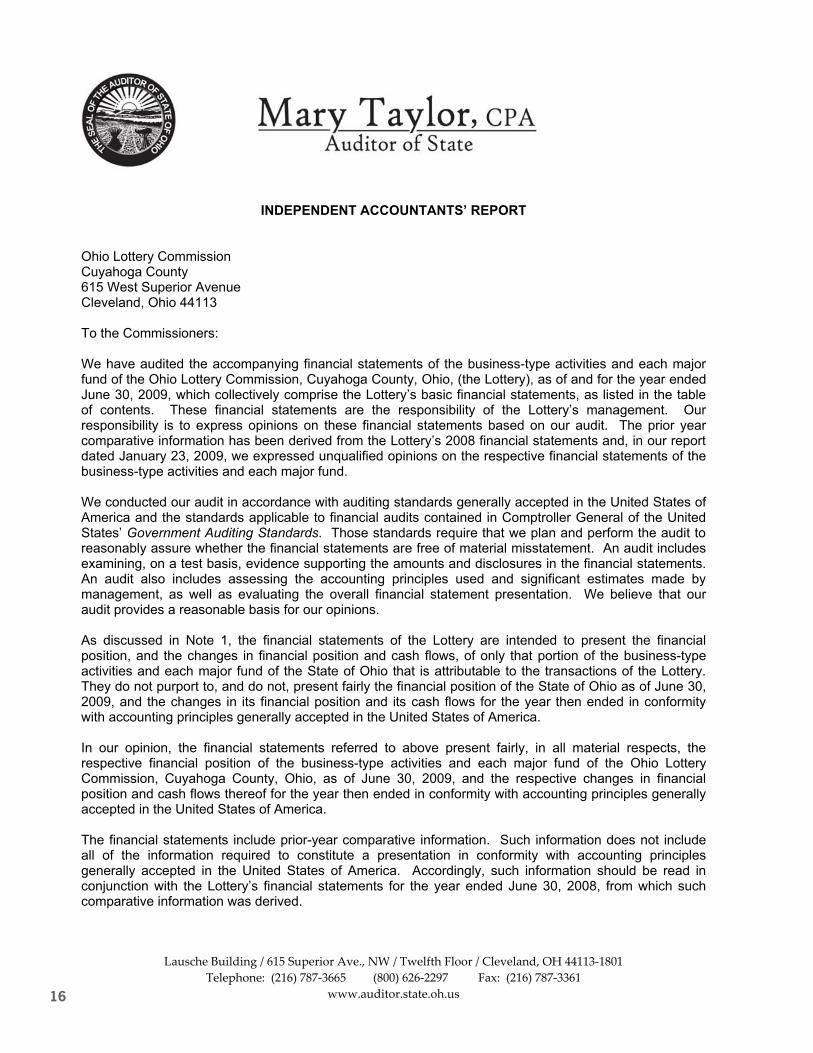
INDEPENDENT ACCOUNTANTS’ REPORT
Ohio Lottery Commission Cuyahoga County 615 West Superior Avenue Cleveland, Ohio 44113
To the Commissioners:
We have audited the accompanying financial statements of the business-type activities and each major fund of the Ohio Lottery Commission, Cuyahoga County, Ohio, (the Lottery), as of and for the year ended June 30, 2009, which collectively comprise the Lottery’s basic financial statements, as listed in the table of contents. These financial statements are the responsibility of the Lottery’s management. Our responsibility is to express opinions on these financial statements based on our audit. The prior year comparative information has been derived from the Lottery’s 2008 financial statements and, in our report dated January 23, 2009, we expressed unqualified opinions on the respective financial statements of the business-type activities and each major fund.
We conducted our audit in accordance with auditing standards generally accepted in the United States of America and the standards applicable to financial audits contained in Comptroller General of the United States’ Government Auditing Standards. Those standards require that we plan and perform the audit to reasonably assure whether the financial statements are free of material misstatement. An audit includes examining, on a test basis, evidence supporting the amounts and disclosures in the financial statements. An audit also includes assessing the accounting principles used and significant estimates made by management, as well as evaluating the overall financial statement presentation. We believe that our audit provides a reasonable basis for our opinions.
As discussed in Note 1, the financial statements of the Lottery are intended to present the financial position, and the changes in financial position and cash flows, of only that portion of the business-type activities and each major fund of the State of Ohio that is attributable to the transactions of the Lottery. They do not purport to, and do not, present fairly the financial position of the State of Ohio as of June 30, 2009, and the changes in its financial position and its cash flows for the year then ended in conformity with accounting principles generally accepted in the United States of America.
In our opinion, the financial statements referred to above present fairly, in all material respects, the respective financial position of the business-type activities and each major fund of the Ohio Lottery Commission, Cuyahoga County, Ohio, as of June 30, 2009, and the respective changes in financial position and cash flows thereof for the year then ended in conformity with accounting principles generally accepted in the United States of America.
The financial statements include prior-year comparative information. Such information does not include all of the information required to constitute a presentation in conformity with accounting principles generally accepted in the United States of America. Accordingly, such information should be read in conjunction with the Lottery’s financial statements for the year ended June 30, 2008, from which such comparative information was derived.
�7
Ohio Lottery Commission Cuyahoga County Independent Accountants’ Report Page 2
In accordance with Government Auditing Standards, we have also issued our report dated November 13, 2009, on our consideration of the Lottery’s internal control over financial reporting and our tests of its compliance with certain provisions of laws, regulations, contracts and grant agreements and other matters. While we did not opine on the internal control over financial reporting or on compliance, that report describes the scope of our testing of internal control over financial reporting and compliance and the results of that testing. That report is an integral part of an audit performed in accordance with Government Auditing Standards. You should read it in conjunction with this report in assessing the results of our audit.
Management’s Discussion and Analysis is not a required part of the basic financial statements but is supplementary information accounting principles generally accepted in the United States of America requires. We have applied certain limited procedures, consisting principally of inquiries of management regarding the methods of measuring and presenting the required supplementary information. However, we did not audit the information and express no opinion on it.
We conducted our audit to opine on the financial statements that collectively comprise the Lottery’s basic financial statements. The introductory section and statistical tables provide additional information and are not a required part of the basic financial statements. We did not subject the introductory section and statistical tables to the auditing procedures applied in the audit of the basic financial statements and, accordingly, we express no opinion on them.
Mary Taylor, CPA Auditor of State
November 13, 2009
�8 Over $16 Billion For Education Since 1974.
MANAGEMENT’S DISCUSSION AND ANALYSIS
As management of the Ohio Lottery Commission (the Ohio Lottery), we offer readers of the Ohio Lottery’s financial statements this narrative overview and analysis of the financial activities of the Ohio Lottery for the fiscal year ended June 30, 2009. We encourage the readers to consider the information presented here in conjunction with additional information that we have furnished in our letter of transmittal, which can be found on pages 6-10 of this report, and the financial statements which begin on page 22.
FINANCIAL HIGHLIGHTS
The Ohio Lottery’s net assets increased $4.8 million or 3.5 percent, as a result of this year’s operations, predominantly due to the Government Accounting Standards Board (GASB) adjustments directly related to the investment portfolio. The adjustment reflects an increase in the fair market value of the Ohio Lottery’s investments.
Ticket sales increased $92.6 million or 4.0 percent over last fiscal year, resulting in record sales of $2.4 billion. The increase in sales can be attributed in part to the introduction of a new online product.
Online sales increased $108.0 million or 11.2 percent. The introduction of KENO and a full year of EZPLAY, the two newest online games, contributed $99.8 million and $34.3 million respectively.
Instant ticket sales decreased $15.4 million or 1.1 percent from last year,
Prize expense increased $62.0 million for fiscal year 2009, primarily due to higher sales volume. Total prize expense for fiscal year 2009 represented 60.3 percent of total ticket sales compared to 60.1 percent in fiscal year 2008. The increase in prize percentage payout is a combination of higher online prize payouts of core games and new games with higher prize payout designs, as well as higher instant ticket prize payouts.
Operating expenses increased by $14.0 million in conjunction with the launching of new games and higher sales volume.
The Ohio Lottery transferred $702.3 million to the Lottery Profits Education Fund (LPEF), $30.1 million above the 2008 transfer amount.
OVERVIEW OF THE FINANCIAL STATEMENTS
This annual report consists of three parts: management’s discussion and analysis; basic financial statements; and supplementary information. The basic financial statements include the statements of net assets, statements of revenues, expenses and changes in fund net assets, statements of cash flows, as well as the notes to the basic financial statements, which disclose in detail information within the financial statements.
The Ohio Lottery’s activities are accounted for within the enterprise fund type and are reported using a full accrual basis of accounting, which is comparable to the methods used by private sector entities. The Ohio Lottery manages the following major funds:
LOTTERY OPERATING FUNDRevenues for this fund are provided primarily from ticket sales. Expenses of this fund represent primarily prize expenses (including cash transfers to the Deferred Prize Fund), operating expenses and transfers to the LPEF. Also included in this fund is activity associated with the Charitable Gaming Oversight Fund. Revenues are credited through reimbursements from the Office of the Attorney General (Attorney General) in accordance with an agreement between the Ohio Lottery and the Attorney General. Expenses for this fund represent oversight, licensing, and monitoring of charitable gaming activity. As part of the State’s biennial budget process for fiscal year 2006/2007, the Office of Budget and Management (OBM) required that a separate fund be established. Effective fiscal year 2006, the Charitable Gaming Oversight Fund (2310) was established. For purposes of this financial report, all financial activity is presented within the Lottery Operating Fund. Please see notes to the basic financial statements for more detailed activity reported within this fund.
DEFERRED PRIZE FUNDRevenues for this fund are provided through cash transfers from the Lottery Operating Fund for the purpose of providing investment principal for funding long-term prize obligations. Expenses of the Deferred Prize Fund primarily represent deferred prize payments.
The statement of net assets presents information on all of the Ohio Lottery’s assets and liabilities, with the difference between the two reported as net assets. Over time, increases or decreases in net assets may serve as a useful indicator of whether the financial position of the Ohio Lottery is improving or deteriorating. The statement of revenues, expenses and changes in fund net assets reports the revenue and expense activity of the Ohio Lottery. This statement is used to measure the success of the Ohio Lottery’s operations over the given period related to sales, expenses, funding of the State of Ohio’s education and profitability. The statement of cash flows provides information about the Ohio Lottery’s cash receipts and cash payments during the reporting period from operating, non-capital and capital financing, and investing activities.
•
•
•
•
•
•
•
•
•
Comprehensive Annual Financial Report 2009 & 2008 �9
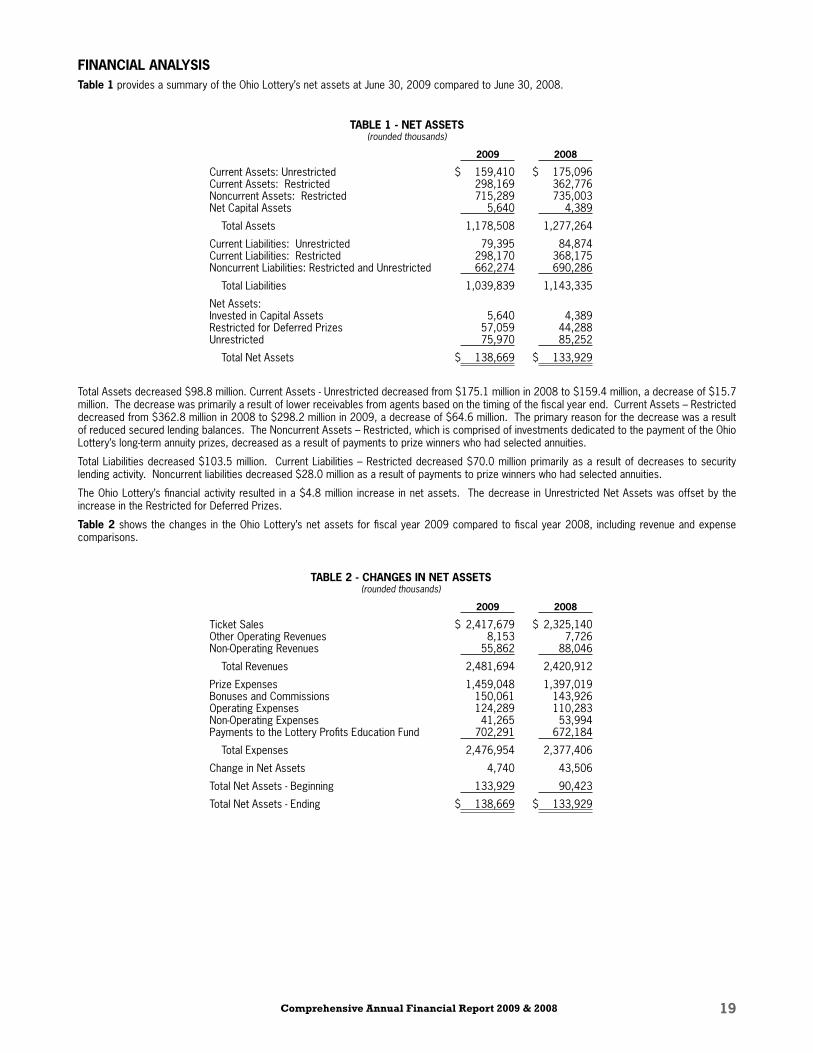
FINANCIAL ANALYSISTable � provides a summary of the Ohio Lottery’s net assets at June 30, 2009 compared to June 30, 2008.
TABLE � - NET ASSETS(rounded thousands)
�009 �008
Current Assets: Unrestricted $ 159,410 $ 175,096Current Assets: Restricted 298,169 362,776Noncurrent Assets: Restricted 715,289 735,003Net Capital Assets 5,640 4,389
Total Assets 1,178,508 1,277,264
Current Liabilities: Unrestricted 79,395 84,874Current Liabilities: Restricted 298,170 368,175Noncurrent Liabilities: Restricted and Unrestricted 662,274 690,286
Total Liabilities 1,039,839 1,143,335
Net Assets:Invested in Capital Assets 5,640 4,389Restricted for Deferred Prizes 57,059 44,288Unrestricted 75,970 85,252
Total Net Assets $ 138,669 $ 133,929
Total Assets decreased $98.8 million. Current Assets - Unrestricted decreased from $175.1 million in 2008 to $159.4 million, a decrease of $15.7 million. The decrease was primarily a result of lower receivables from agents based on the timing of the fiscal year end. Current Assets – Restricted decreased from $362.8 million in 2008 to $298.2 million in 2009, a decrease of $64.6 million. The primary reason for the decrease was a result of reduced secured lending balances. The Noncurrent Assets – Restricted, which is comprised of investments dedicated to the payment of the Ohio Lottery’s long-term annuity prizes, decreased as a result of payments to prize winners who had selected annuities.
Total Liabilities decreased $103.5 million. Current Liabilities – Restricted decreased $70.0 million primarily as a result of decreases to security lending activity. Noncurrent liabilities decreased $28.0 million as a result of payments to prize winners who had selected annuities.
The Ohio Lottery’s financial activity resulted in a $4.8 million increase in net assets. The decrease in Unrestricted Net Assets was offset by the increase in the Restricted for Deferred Prizes.
Table � shows the changes in the Ohio Lottery’s net assets for fiscal year 2009 compared to fiscal year 2008, including revenue and expense comparisons.
TABLE � - CHANGES IN NET ASSETS (rounded thousands)
�009 �008
Ticket Sales $ 2,417,679 $ 2,325,140Other Operating Revenues 8,153 7,726Non-Operating Revenues 55,862 88,046
Total Revenues 2,481,694 2,420,912
Prize Expenses 1,459,048 1,397,019Bonuses and Commissions 150,061 143,926Operating Expenses 124,289 110,283Non-Operating Expenses 41,265 53,994Payments to the Lottery Profits Education Fund 702,291 672,184
Total Expenses 2,476,954 2,377,406
Change in Net Assets 4,740 43,506
Total Net Assets - Beginning 133,929 90,423
Total Net Assets - Ending $ 138,669 $ 133,929

�0 Over $16 Billion For Education Since 1974.
Ticket Sales by ProductFiscal Years �009 and �008
(rounded thousands)
Game �009 �008
Pick 3 $ 382,506 $ 387,149Pick 4 205,866 198,819Rolling Cash 5 67,195 70,489Kicker 21,431 21,390Raffle 9,254 10,000Keno 99,782 N/AClassic Lotto 43,918 41,210Mega Millions 193,048 201,001EZ Play 34,286 12,302Ten-Oh 11,009 17,957
Total Online Sales 1,068,295 960,317
Instants 1,349,384 1,364,823
Total Sales $ 2,417,679 $ 2,325,140
The Ohio Lottery’s total revenues increased $60.8 million in fiscal year 2009. The Ohio Lottery had record ticket sales in fiscal year 2009 of $2.4 billion. Online ticket sales increased by $108.0 million, with the most coming from adding Keno as an online game in August of 2008. A decrease of $32.2 million in non-operating income can be attributed to GASB adjustments. During the year, three Mega Millions jackpots were won totaling $297.7 million in Ohio, as compared to 2008 when one jackpot of $196.0 million was won in Ohio. Instant ticket sales had a modest decrease and sales surpassed the $1.0 billion mark for the seventh consecutive year.
Operating Related Expenses and Payments to EducationFiscal Years �009 and �008
(rounded thousands)
�009 �008
Prize Awards $ 1,459,048 $ 1,397,019Bonuses/Commissions 150,061 143,926Operating Expense 124,289 110,283Payments to Education 702,291 672,184
Total $ 2,435,689 $ 2,323,412
Prize awards increased by $62.0 million from the prior year while bonuses and commissions increased by $6.1 million. The payments to education expenses increased by $30.1 million. Total operating expenses increased $14.0 million.
The activity described above resulted in an increase in Net Assets of $4.8 million, increasing the balance at June 30, 2009 to $138.7 million from $133.9 million.
CAPITAL ASSETS AND DEBT ADMINISTRATION
CAPITAL ASSETSTable � below summarizes the Ohio Lottery’s capital assets at the end of 2009 and 2008.
TABLE � - CAPITAL ASSETS (Net of Depreciation)Fiscal Years �009 and �008
(rounded thousands)
�009 �008
Equipment $ 4,133 $ 2,962Vehicles 1,507 1,427
Total Net Capital Assets $ 5,640 $ 4,389
As of June 30, 2009, the Ohio Lottery had $5.6 million, net of accumulated depreciation, in Capital Assets. Total Net Capital Assets remained relatively unchanged with an increase of $1.3 million in combined equipment and vehicles.
Additional information on the Ohio Lottery’s capital assets may be found in Note 3 of this report.
DEBT The significant components of the Ohio Lottery’s debt is deferred prize awards payable, which is payable from restricted assets. Prize Awards Payable from Restricted Assets – Net of Discount decreased $ 40.3 million as prior long-term annuities are being paid off at a faster pace than new annuities are being selected by prize winners.
Additional information on the Ohio Lottery’s long-term debt may be found in Notes 4 and 6 of this report.

Comprehensive Annual Financial Report 2009 & 2008 ��
CONTACTING THE OHIO LOTTERY’S FINANCIAL MANAGEMENTThis financial report is designed to provide the legislative and executive branches of government, the Ohio Lottery Commissioners, the public, and other interested parties a general overview of the Ohio Lottery’s finances and to demonstrate the Ohio Lottery’s accountability for the monies it receives. If you have questions about this report or need additional financial information, contact the Ohio Lottery’s Finance Director at the Ohio Lottery Commission, 615 W. Superior Avenue, Cleveland, Ohio 44113-1879. You may also access more information about the Ohio Lottery by visiting the lottery’s website at www.ohiolottery.com.
�� Over $16 Billion For Education Since 1974.
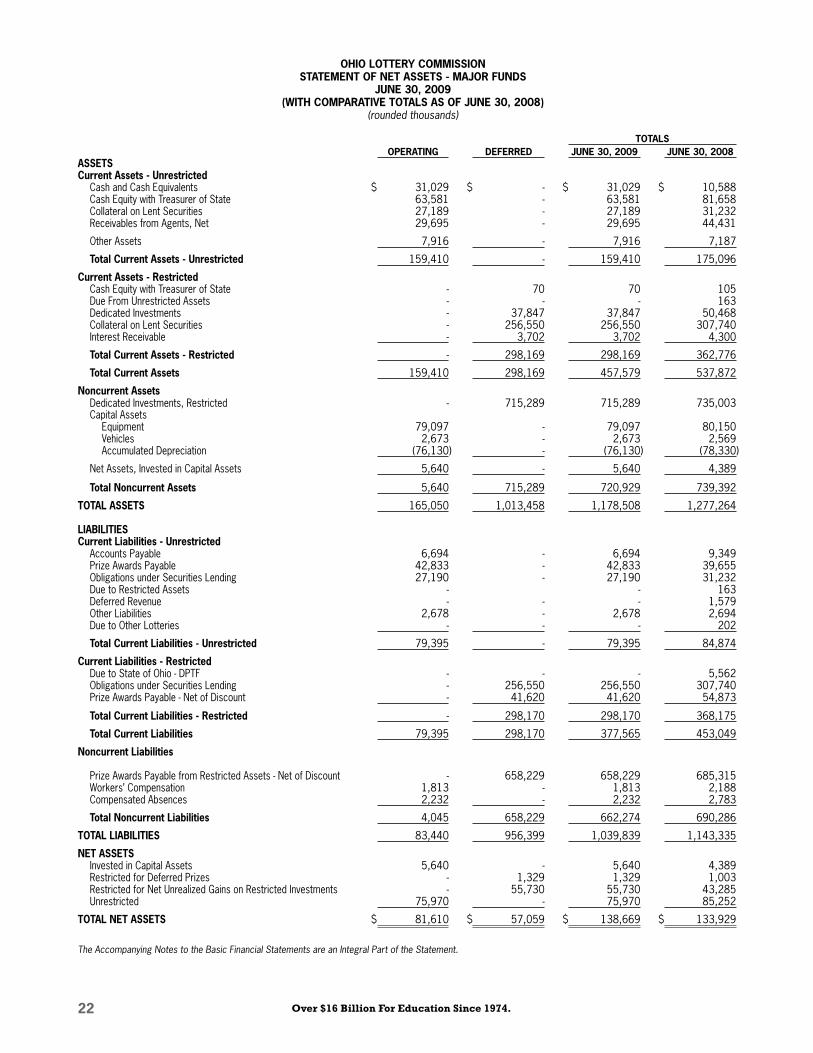
OHIO LOTTERY COMMISSIONSTATEMENT OF NET ASSETS - MAJOR FUNDS
JUNE �0, �009(WITH COMPARATIVE TOTALS AS OF JUNE �0, �008)
(rounded thousands)
TOTALSOPERATING DEFERRED JUNE �0, �009 JUNE �0, �008
ASSETSCurrent Assets - Unrestricted
Cash and Cash Equivalents $ 31,029 $ - $ 31,029 $ 10,588Cash Equity with Treasurer of State 63,581 - 63,581 81,658Collateral on Lent Securities 27,189 - 27,189 31,232Receivables from Agents, Net 29,695 - 29,695 44,431
Other Assets 7,916 - 7,916 7,187
Total Current Assets - Unrestricted 159,410 - 159,410 175,096
Current Assets - RestrictedCash Equity with Treasurer of State - 70 70 105Due From Unrestricted Assets - - - 163Dedicated Investments - 37,847 37,847 50,468Collateral on Lent Securities - 256,550 256,550 307,740Interest Receivable - 3,702 3,702 4,300
Total Current Assets - Restricted - 298,169 298,169 362,776
Total Current Assets 159,410 298,169 457,579 537,872
Noncurrent AssetsDedicated Investments, Restricted - 715,289 715,289 735,003Capital Assets
Equipment 79,097 - 79,097 80,150Vehicles 2,673 - 2,673 2,569Accumulated Depreciation (76,130) - (76,130) (78,330)
Net Assets, Invested in Capital Assets 5,640 - 5,640 4,389
Total Noncurrent Assets 5,640 715,289 720,929 739,392
TOTAL ASSETS 165,050 1,013,458 1,178,508 1,277,264
LIABILITIESCurrent Liabilities - Unrestricted
Accounts Payable 6,694 - 6,694 9,349Prize Awards Payable 42,833 - 42,833 39,655Obligations under Securities Lending 27,190 - 27,190 31,232Due to Restricted Assets - - 163Deferred Revenue - - - 1,579Other Liabilities 2,678 - 2,678 2,694Due to Other Lotteries - - - 202
Total Current Liabilities - Unrestricted 79,395 - 79,395 84,874
Current Liabilities - Restricted Due to State of Ohio - DPTF - - - 5,562Obligations under Securities Lending - 256,550 256,550 307,740Prize Awards Payable - Net of Discount - 41,620 41,620 54,873
Total Current Liabilities - Restricted - 298,170 298,170 368,175
Total Current Liabilities 79,395 298,170 377,565 453,049
Noncurrent Liabilities
Prize Awards Payable from Restricted Assets - Net of Discount - 658,229 658,229 685,315Workers’ Compensation 1,813 - 1,813 2,188Compensated Absences 2,232 - 2,232 2,783
Total Noncurrent Liabilities 4,045 658,229 662,274 690,286
TOTAL LIABILITIES 83,440 956,399 1,039,839 1,143,335
NET ASSETSInvested in Capital Assets 5,640 - 5,640 4,389Restricted for Deferred Prizes - 1,329 1,329 1,003Restricted for Net Unrealized Gains on Restricted Investments - 55,730 55,730 43,285Unrestricted 75,970 - 75,970 85,252
TOTAL NET ASSETS $ 81,610 $ 57,059 $ 138,669 $ 133,929
The Accompanying Notes to the Basic Financial Statements are an Integral Part of the Statement.
Comprehensive Annual Financial Report 2009 & 2008 ��
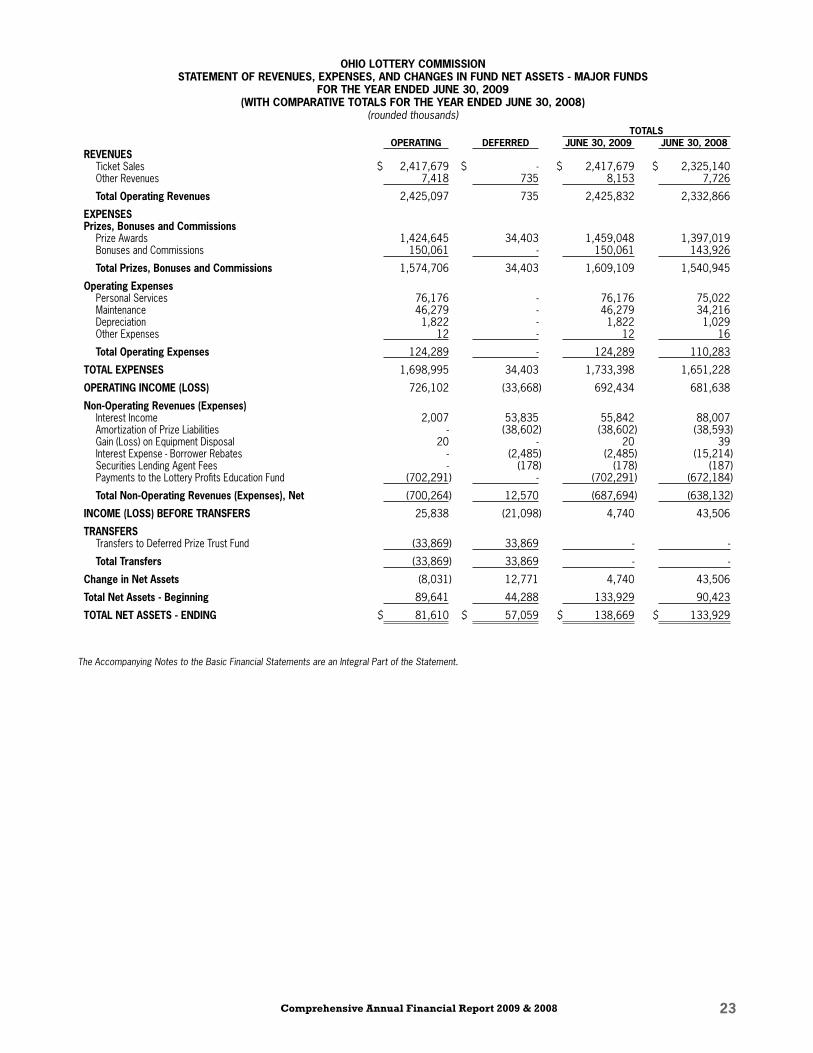
OHIO LOTTERY COMMISSIONSTATEMENT OF REVENUES, EXPENSES, AND CHANGES IN FUND NET ASSETS - MAJOR FUNDS
FOR THE YEAR ENDED JUNE �0, �009(WITH COMPARATIVE TOTALS FOR THE YEAR ENDED JUNE �0, �008)
(rounded thousands)TOTALS
OPERATING DEFERRED JUNE �0, �009 JUNE �0, �008REVENUES
Ticket Sales $ 2,417,679 $ - $ 2,417,679 $ 2,325,140Other Revenues 7,418 735 8,153 7,726
Total Operating Revenues 2,425,097 735 2,425,832 2,332,866
EXPENSESPrizes, Bonuses and Commissions
Prize Awards 1,424,645 34,403 1,459,048 1,397,019Bonuses and Commissions 150,061 - 150,061 143,926
Total Prizes, Bonuses and Commissions 1,574,706 34,403 1,609,109 1,540,945
Operating ExpensesPersonal Services 76,176 - 76,176 75,022Maintenance 46,279 - 46,279 34,216Depreciation 1,822 - 1,822 1,029Other Expenses 12 - 12 16
Total Operating Expenses 124,289 - 124,289 110,283
TOTAL EXPENSES 1,698,995 34,403 1,733,398 1,651,228
OPERATING INCOME (LOSS) 726,102 (33,668) 692,434 681,638
Non-Operating Revenues (Expenses)Interest Income 2,007 53,835 55,842 88,007Amortization of Prize Liabilities - (38,602) (38,602) (38,593)Gain (Loss) on Equipment Disposal 20 - 20 39Interest Expense - Borrower Rebates - (2,485) (2,485) (15,214)Securities Lending Agent Fees - (178) (178) (187)Payments to the Lottery Profits Education Fund (702,291) - (702,291) (672,184)
Total Non-Operating Revenues (Expenses), Net (700,264) 12,570 (687,694) (638,132)
INCOME (LOSS) BEFORE TRANSFERS 25,838 (21,098) 4,740 43,506
TRANSFERSTransfers to Deferred Prize Trust Fund (33,869) 33,869 - -
Total Transfers (33,869) 33,869 - -
Change in Net Assets (8,031) 12,771 4,740 43,506
Total Net Assets - Beginning 89,641 44,288 133,929 90,423
TOTAL NET ASSETS - ENDING $ 81,610 $ 57,059 $ 138,669 $ 133,929
The Accompanying Notes to the Basic Financial Statements are an Integral Part of the Statement.
�� Over $16 Billion For Education Since 1974.
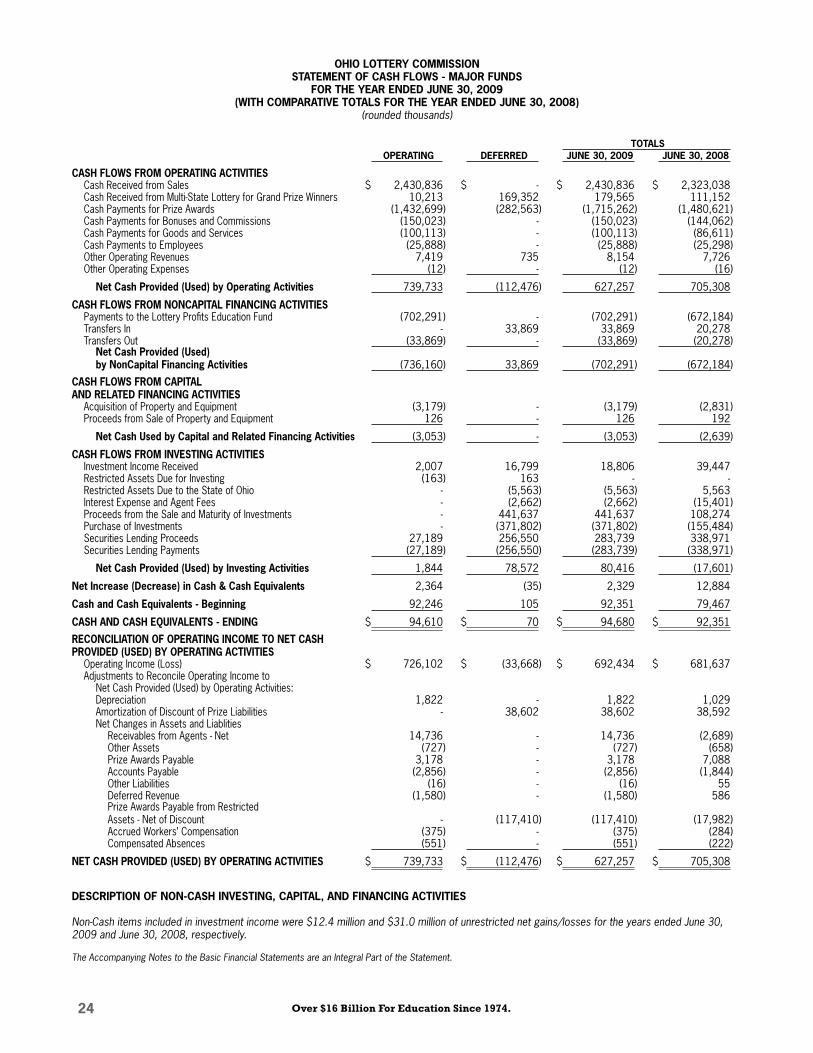
OHIO LOTTERY COMMISSIONSTATEMENT OF CASH FLOWS - MAJOR FUNDS
FOR THE YEAR ENDED JUNE �0, �009(WITH COMPARATIVE TOTALS FOR THE YEAR ENDED JUNE �0, �008)
(rounded thousands)
TOTALS OPERATING DEFERRED JUNE �0, �009 JUNE �0, �008
CASH FLOWS FROM OPERATING ACTIVITIES Cash Received from Sales $ 2,430,836 $ - $ 2,430,836 $ 2,323,038Cash Received from Multi-State Lottery for Grand Prize Winners 10,213 169,352 179,565 111,152Cash Payments for Prize Awards (1,432,699) (282,563) (1,715,262) (1,480,621)Cash Payments for Bonuses and Commissions (150,023) - (150,023) (144,062)Cash Payments for Goods and Services (100,113) - (100,113) (86,611)Cash Payments to Employees (25,888) - (25,888) (25,298)Other Operating Revenues 7,419 735 8,154 7,726Other Operating Expenses (12) - (12) (16)
Net Cash Provided (Used) by Operating Activities 739,733 (112,476) 627,257 705,308
CASH FLOWS FROM NONCAPITAL FINANCING ACTIVITIES Payments to the Lottery Profits Education Fund (702,291) - (702,291) (672,184)Transfers In - 33,869 33,869 20,278Transfers Out (33,869) - (33,869) (20,278)
Net Cash Provided (Used)by NonCapital Financing Activities (736,160) 33,869 (702,291) (672,184)
CASH FLOWS FROM CAPITALAND RELATED FINANCING ACTIVITIES
Acquisition of Property and Equipment (3,179) - (3,179) (2,831)Proceeds from Sale of Property and Equipment 126 - 126 192
Net Cash Used by Capital and Related Financing Activities (3,053) - (3,053) (2,639)
CASH FLOWS FROM INVESTING ACTIVITIES Investment Income Received 2,007 16,799 18,806 39,447Restricted Assets Due for Investing (163) 163 - -Restricted Assets Due to the State of Ohio - (5,563) (5,563) 5,563Interest Expense and Agent Fees - (2,662) (2,662) (15,401)Proceeds from the Sale and Maturity of Investments - 441,637 441,637 108,274Purchase of Investments - (371,802) (371,802) (155,484)Securities Lending Proceeds 27,189 256,550 283,739 338,971Securities Lending Payments (27,189) (256,550) (283,739) (338,971)
Net Cash Provided (Used) by Investing Activities 1,844 78,572 80,416 (17,601)
Net Increase (Decrease) in Cash & Cash Equivalents 2,364 (35) 2,329 12,884
Cash and Cash Equivalents - Beginning 92,246 105 92,351 79,467
CASH AND CASH EQUIVALENTS - ENDING $ 94,610 $ 70 $ 94,680 $ 92,351
RECONCILIATION OF OPERATING INCOME TO NET CASH PROVIDED (USED) BY OPERATING ACTIVITIES
Operating Income (Loss) $ 726,102 $ (33,668) $ 692,434 $ 681,637Adjustments to Reconcile Operating Income to
Net Cash Provided (Used) by Operating Activities: Depreciation 1,822 - 1,822 1,029Amortization of Discount of Prize Liabilities - 38,602 38,602 38,592Net Changes in Assets and Liablities
Receivables from Agents - Net 14,736 - 14,736 (2,689)Other Assets (727) - (727) (658)Prize Awards Payable 3,178 - 3,178 7,088Accounts Payable (2,856) - (2,856) (1,844)Other Liabilities (16) - (16) 55Deferred Revenue (1,580) - (1,580) 586Prize Awards Payable from RestrictedAssets - Net of Discount - (117,410) (117,410) (17,982)Accrued Workers’ Compensation (375) - (375) (284)Compensated Absences (551) - (551) (222)
NET CASH PROVIDED (USED) BY OPERATING ACTIVITIES $ 739,733 $ (112,476) $ 627,257 $ 705,308
DESCRIPTION OF NON-CASH INVESTING, CAPITAL, AND FINANCING ACTIVITIES Non-Cash items included in investment income were $12.4 million and $31.0 million of unrestricted net gains/losses for the years ended June 30, 2009 and June 30, 2008, respectively.
The Accompanying Notes to the Basic Financial Statements are an Integral Part of the Statement.
Comprehensive Annual Financial Report 2009 & 2008 ��
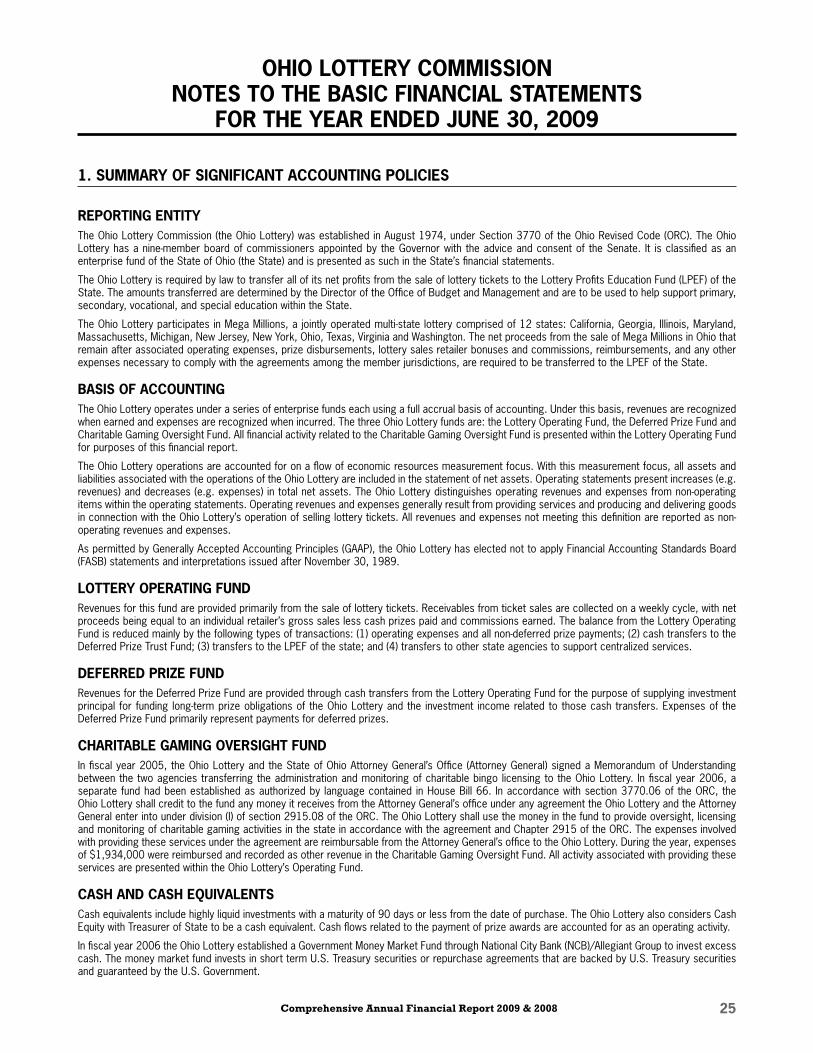
OHIO LOTTERY COMMISSION NOTES TO THE BASIC FINANCIAL STATEMENTS
FOR THE YEAR ENDED JUNE �0, �009
�. SUMMARY OF SIGNIFICANT ACCOUNTING POLICIES
REPORTING ENTITYThe Ohio Lottery Commission (the Ohio Lottery) was established in August 1974, under Section 3770 of the Ohio Revised Code (ORC). The Ohio Lottery has a nine-member board of commissioners appointed by the Governor with the advice and consent of the Senate. It is classified as an enterprise fund of the State of Ohio (the State) and is presented as such in the State’s financial statements.
The Ohio Lottery is required by law to transfer all of its net profits from the sale of lottery tickets to the Lottery Profits Education Fund (LPEF) of the State. The amounts transferred are determined by the Director of the Office of Budget and Management and are to be used to help support primary, secondary, vocational, and special education within the State.
The Ohio Lottery participates in Mega Millions, a jointly operated multi-state lottery comprised of 12 states: California, Georgia, Illinois, Maryland, Massachusetts, Michigan, New Jersey, New York, Ohio, Texas, Virginia and Washington. The net proceeds from the sale of Mega Millions in Ohio that remain after associated operating expenses, prize disbursements, lottery sales retailer bonuses and commissions, reimbursements, and any other expenses necessary to comply with the agreements among the member jurisdictions, are required to be transferred to the LPEF of the State.
BASIS OF ACCOUNTINGThe Ohio Lottery operates under a series of enterprise funds each using a full accrual basis of accounting. Under this basis, revenues are recognized when earned and expenses are recognized when incurred. The three Ohio Lottery funds are: the Lottery Operating Fund, the Deferred Prize Fund and Charitable Gaming Oversight Fund. All financial activity related to the Charitable Gaming Oversight Fund is presented within the Lottery Operating Fund for purposes of this financial report.
The Ohio Lottery operations are accounted for on a flow of economic resources measurement focus. With this measurement focus, all assets and liabilities associated with the operations of the Ohio Lottery are included in the statement of net assets. Operating statements present increases (e.g. revenues) and decreases (e.g. expenses) in total net assets. The Ohio Lottery distinguishes operating revenues and expenses from non-operating items within the operating statements. Operating revenues and expenses generally result from providing services and producing and delivering goods in connection with the Ohio Lottery’s operation of selling lottery tickets. All revenues and expenses not meeting this definition are reported as non-operating revenues and expenses.
As permitted by Generally Accepted Accounting Principles (GAAP), the Ohio Lottery has elected not to apply Financial Accounting Standards Board (FASB) statements and interpretations issued after November 30, 1989.
LOTTERY OPERATING FUNDRevenues for this fund are provided primarily from the sale of lottery tickets. Receivables from ticket sales are collected on a weekly cycle, with net proceeds being equal to an individual retailer’s gross sales less cash prizes paid and commissions earned. The balance from the Lottery Operating Fund is reduced mainly by the following types of transactions: (1) operating expenses and all non-deferred prize payments; (2) cash transfers to the Deferred Prize Trust Fund; (3) transfers to the LPEF of the state; and (4) transfers to other state agencies to support centralized services.
DEFERRED PRIZE FUNDRevenues for the Deferred Prize Fund are provided through cash transfers from the Lottery Operating Fund for the purpose of supplying investment principal for funding long-term prize obligations of the Ohio Lottery and the investment income related to those cash transfers. Expenses of the Deferred Prize Fund primarily represent payments for deferred prizes.
CHARITABLE GAMING OVERSIGHT FUNDIn fiscal year 2005, the Ohio Lottery and the State of Ohio Attorney General’s Office (Attorney General) signed a Memorandum of Understanding between the two agencies transferring the administration and monitoring of charitable bingo licensing to the Ohio Lottery. In fiscal year 2006, a separate fund had been established as authorized by language contained in House Bill 66. In accordance with section 3770.06 of the ORC, the Ohio Lottery shall credit to the fund any money it receives from the Attorney General’s office under any agreement the Ohio Lottery and the Attorney General enter into under division (I) of section 2915.08 of the ORC. The Ohio Lottery shall use the money in the fund to provide oversight, licensing and monitoring of charitable gaming activities in the state in accordance with the agreement and Chapter 2915 of the ORC. The expenses involved with providing these services under the agreement are reimbursable from the Attorney General’s office to the Ohio Lottery. During the year, expenses of $1,934,000 were reimbursed and recorded as other revenue in the Charitable Gaming Oversight Fund. All activity associated with providing these services are presented within the Ohio Lottery’s Operating Fund.
CASH AND CASH EQUIVALENTSCash equivalents include highly liquid investments with a maturity of 90 days or less from the date of purchase. The Ohio Lottery also considers Cash Equity with Treasurer of State to be a cash equivalent. Cash flows related to the payment of prize awards are accounted for as an operating activity.
In fiscal year 2006 the Ohio Lottery established a Government Money Market Fund through National City Bank (NCB)/Allegiant Group to invest excess cash. The money market fund invests in short term U.S. Treasury securities or repurchase agreements that are backed by U.S. Treasury securities and guaranteed by the U.S. Government.
�� Over $16 Billion For Education Since 1974.
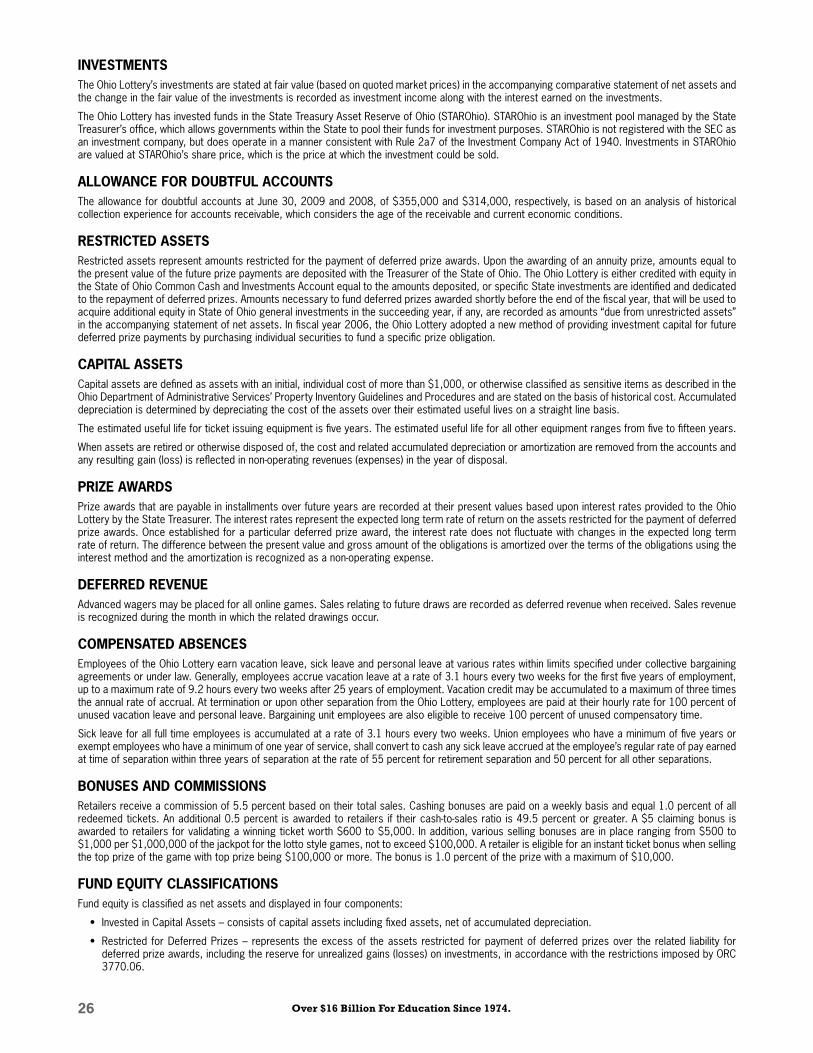
INVESTMENTSThe Ohio Lottery’s investments are stated at fair value (based on quoted market prices) in the accompanying comparative statement of net assets and the change in the fair value of the investments is recorded as investment income along with the interest earned on the investments.
The Ohio Lottery has invested funds in the State Treasury Asset Reserve of Ohio (STAROhio). STAROhio is an investment pool managed by the State Treasurer’s office, which allows governments within the State to pool their funds for investment purposes. STAROhio is not registered with the SEC as an investment company, but does operate in a manner consistent with Rule 2a7 of the Investment Company Act of 1940. Investments in STAROhio are valued at STAROhio’s share price, which is the price at which the investment could be sold.
ALLOWANCE FOR DOUBTFUL ACCOUNTSThe allowance for doubtful accounts at June 30, 2009 and 2008, of $355,000 and $314,000, respectively, is based on an analysis of historical collection experience for accounts receivable, which considers the age of the receivable and current economic conditions.
RESTRICTED ASSETSRestricted assets represent amounts restricted for the payment of deferred prize awards. Upon the awarding of an annuity prize, amounts equal to the present value of the future prize payments are deposited with the Treasurer of the State of Ohio. The Ohio Lottery is either credited with equity in the State of Ohio Common Cash and Investments Account equal to the amounts deposited, or specific State investments are identified and dedicated to the repayment of deferred prizes. Amounts necessary to fund deferred prizes awarded shortly before the end of the fiscal year, that will be used to acquire additional equity in State of Ohio general investments in the succeeding year, if any, are recorded as amounts “due from unrestricted assets” in the accompanying statement of net assets. In fiscal year 2006, the Ohio Lottery adopted a new method of providing investment capital for future deferred prize payments by purchasing individual securities to fund a specific prize obligation.
CAPITAL ASSETSCapital assets are defined as assets with an initial, individual cost of more than $1,000, or otherwise classified as sensitive items as described in the Ohio Department of Administrative Services’ Property Inventory Guidelines and Procedures and are stated on the basis of historical cost. Accumulated depreciation is determined by depreciating the cost of the assets over their estimated useful lives on a straight line basis.
The estimated useful life for ticket issuing equipment is five years. The estimated useful life for all other equipment ranges from five to fifteen years.
When assets are retired or otherwise disposed of, the cost and related accumulated depreciation or amortization are removed from the accounts and any resulting gain (loss) is reflected in non-operating revenues (expenses) in the year of disposal.
PRIZE AWARDSPrize awards that are payable in installments over future years are recorded at their present values based upon interest rates provided to the Ohio Lottery by the State Treasurer. The interest rates represent the expected long term rate of return on the assets restricted for the payment of deferred prize awards. Once established for a particular deferred prize award, the interest rate does not fluctuate with changes in the expected long term rate of return. The difference between the present value and gross amount of the obligations is amortized over the terms of the obligations using the interest method and the amortization is recognized as a non-operating expense.
DEFERRED REVENUEAdvanced wagers may be placed for all online games. Sales relating to future draws are recorded as deferred revenue when received. Sales revenue is recognized during the month in which the related drawings occur.
COMPENSATED ABSENCESEmployees of the Ohio Lottery earn vacation leave, sick leave and personal leave at various rates within limits specified under collective bargaining agreements or under law. Generally, employees accrue vacation leave at a rate of 3.1 hours every two weeks for the first five years of employment, up to a maximum rate of 9.2 hours every two weeks after 25 years of employment. Vacation credit may be accumulated to a maximum of three times the annual rate of accrual. At termination or upon other separation from the Ohio Lottery, employees are paid at their hourly rate for 100 percent of unused vacation leave and personal leave. Bargaining unit employees are also eligible to receive 100 percent of unused compensatory time.
Sick leave for all full time employees is accumulated at a rate of 3.1 hours every two weeks. Union employees who have a minimum of five years or exempt employees who have a minimum of one year of service, shall convert to cash any sick leave accrued at the employee’s regular rate of pay earned at time of separation within three years of separation at the rate of 55 percent for retirement separation and 50 percent for all other separations.
BONUSES AND COMMISSIONSRetailers receive a commission of 5.5 percent based on their total sales. Cashing bonuses are paid on a weekly basis and equal 1.0 percent of all redeemed tickets. An additional 0.5 percent is awarded to retailers if their cash-to-sales ratio is 49.5 percent or greater. A $5 claiming bonus is awarded to retailers for validating a winning ticket worth $600 to $5,000. In addition, various selling bonuses are in place ranging from $500 to $1,000 per $1,000,000 of the jackpot for the lotto style games, not to exceed $100,000. A retailer is eligible for an instant ticket bonus when selling the top prize of the game with top prize being $100,000 or more. The bonus is 1.0 percent of the prize with a maximum of $10,000.
FUND EQUITY CLASSIFICATIONSFund equity is classified as net assets and displayed in four components:
Invested in Capital Assets – consists of capital assets including fixed assets, net of accumulated depreciation.
Restricted for Deferred Prizes – represents the excess of the assets restricted for payment of deferred prizes over the related liability for deferred prize awards, including the reserve for unrealized gains (losses) on investments, in accordance with the restrictions imposed by ORC 3770.06.
•
•
Comprehensive Annual Financial Report 2009 & 2008 �7
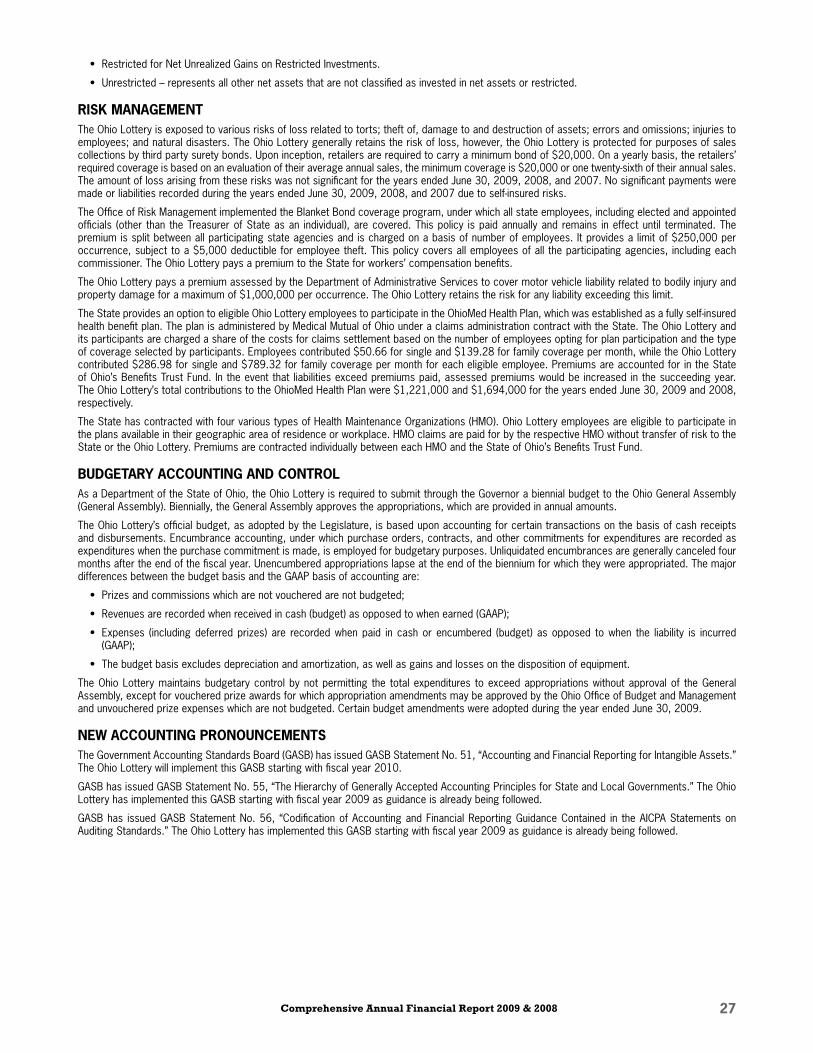
Restricted for Net Unrealized Gains on Restricted Investments.
Unrestricted – represents all other net assets that are not classified as invested in net assets or restricted.
RISK MANAGEMENTThe Ohio Lottery is exposed to various risks of loss related to torts; theft of, damage to and destruction of assets; errors and omissions; injuries to employees; and natural disasters. The Ohio Lottery generally retains the risk of loss, however, the Ohio Lottery is protected for purposes of sales collections by third party surety bonds. Upon inception, retailers are required to carry a minimum bond of $20,000. On a yearly basis, the retailers’ required coverage is based on an evaluation of their average annual sales, the minimum coverage is $20,000 or one twenty-sixth of their annual sales. The amount of loss arising from these risks was not significant for the years ended June 30, 2009, 2008, and 2007. No significant payments were made or liabilities recorded during the years ended June 30, 2009, 2008, and 2007 due to self-insured risks.
The Office of Risk Management implemented the Blanket Bond coverage program, under which all state employees, including elected and appointed officials (other than the Treasurer of State as an individual), are covered. This policy is paid annually and remains in effect until terminated. The premium is split between all participating state agencies and is charged on a basis of number of employees. It provides a limit of $250,000 per occurrence, subject to a $5,000 deductible for employee theft. This policy covers all employees of all the participating agencies, including each commissioner. The Ohio Lottery pays a premium to the State for workers’ compensation benefits.
The Ohio Lottery pays a premium assessed by the Department of Administrative Services to cover motor vehicle liability related to bodily injury and property damage for a maximum of $1,000,000 per occurrence. The Ohio Lottery retains the risk for any liability exceeding this limit.
The State provides an option to eligible Ohio Lottery employees to participate in the OhioMed Health Plan, which was established as a fully self-insured health benefit plan. The plan is administered by Medical Mutual of Ohio under a claims administration contract with the State. The Ohio Lottery and its participants are charged a share of the costs for claims settlement based on the number of employees opting for plan participation and the type of coverage selected by participants. Employees contributed $50.66 for single and $139.28 for family coverage per month, while the Ohio Lottery contributed $286.98 for single and $789.32 for family coverage per month for each eligible employee. Premiums are accounted for in the State of Ohio’s Benefits Trust Fund. In the event that liabilities exceed premiums paid, assessed premiums would be increased in the succeeding year. The Ohio Lottery’s total contributions to the OhioMed Health Plan were $1,221,000 and $1,694,000 for the years ended June 30, 2009 and 2008, respectively.
The State has contracted with four various types of Health Maintenance Organizations (HMO). Ohio Lottery employees are eligible to participate in the plans available in their geographic area of residence or workplace. HMO claims are paid for by the respective HMO without transfer of risk to the State or the Ohio Lottery. Premiums are contracted individually between each HMO and the State of Ohio’s Benefits Trust Fund.
BUDGETARY ACCOUNTING AND CONTROLAs a Department of the State of Ohio, the Ohio Lottery is required to submit through the Governor a biennial budget to the Ohio General Assembly (General Assembly). Biennially, the General Assembly approves the appropriations, which are provided in annual amounts.
The Ohio Lottery’s official budget, as adopted by the Legislature, is based upon accounting for certain transactions on the basis of cash receipts and disbursements. Encumbrance accounting, under which purchase orders, contracts, and other commitments for expenditures are recorded as expenditures when the purchase commitment is made, is employed for budgetary purposes. Unliquidated encumbrances are generally canceled four months after the end of the fiscal year. Unencumbered appropriations lapse at the end of the biennium for which they were appropriated. The major differences between the budget basis and the GAAP basis of accounting are:
Prizes and commissions which are not vouchered are not budgeted;
Revenues are recorded when received in cash (budget) as opposed to when earned (GAAP);
Expenses (including deferred prizes) are recorded when paid in cash or encumbered (budget) as opposed to when the liability is incurred (GAAP);
The budget basis excludes depreciation and amortization, as well as gains and losses on the disposition of equipment.
The Ohio Lottery maintains budgetary control by not permitting the total expenditures to exceed appropriations without approval of the General Assembly, except for vouchered prize awards for which appropriation amendments may be approved by the Ohio Office of Budget and Management and unvouchered prize expenses which are not budgeted. Certain budget amendments were adopted during the year ended June 30, 2009.
NEW ACCOUNTING PRONOUNCEMENTSThe Government Accounting Standards Board (GASB) has issued GASB Statement No. 51, “Accounting and Financial Reporting for Intangible Assets.” The Ohio Lottery will implement this GASB starting with fiscal year 2010.
GASB has issued GASB Statement No. 55, “The Hierarchy of Generally Accepted Accounting Principles for State and Local Governments.” The Ohio Lottery has implemented this GASB starting with fiscal year 2009 as guidance is already being followed.
GASB has issued GASB Statement No. 56, “Codification of Accounting and Financial Reporting Guidance Contained in the AICPA Statements on Auditing Standards.” The Ohio Lottery has implemented this GASB starting with fiscal year 2009 as guidance is already being followed.
•
•
•
•
•
•
�8 Over $16 Billion For Education Since 1974.
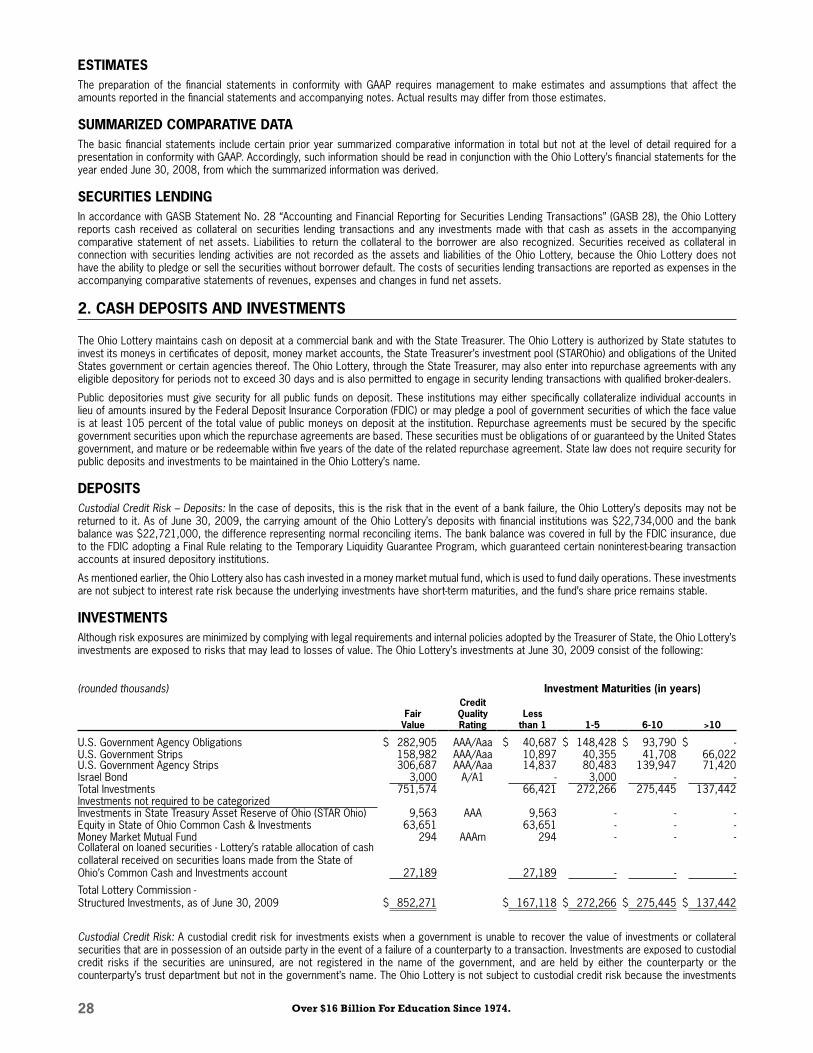
ESTIMATESThe preparation of the financial statements in conformity with GAAP requires management to make estimates and assumptions that affect the amounts reported in the financial statements and accompanying notes. Actual results may differ from those estimates.
SUMMARIZED COMPARATIVE DATAThe basic financial statements include certain prior year summarized comparative information in total but not at the level of detail required for a presentation in conformity with GAAP. Accordingly, such information should be read in conjunction with the Ohio Lottery’s financial statements for the year ended June 30, 2008, from which the summarized information was derived.
SECURITIES LENDINGIn accordance with GASB Statement No. 28 “Accounting and Financial Reporting for Securities Lending Transactions” (GASB 28), the Ohio Lottery reports cash received as collateral on securities lending transactions and any investments made with that cash as assets in the accompanying comparative statement of net assets. Liabilities to return the collateral to the borrower are also recognized. Securities received as collateral in connection with securities lending activities are not recorded as the assets and liabilities of the Ohio Lottery, because the Ohio Lottery does not have the ability to pledge or sell the securities without borrower default. The costs of securities lending transactions are reported as expenses in the accompanying comparative statements of revenues, expenses and changes in fund net assets.
�. CASH DEPOSITS AND INVESTMENTS
The Ohio Lottery maintains cash on deposit at a commercial bank and with the State Treasurer. The Ohio Lottery is authorized by State statutes to invest its moneys in certificates of deposit, money market accounts, the State Treasurer’s investment pool (STAROhio) and obligations of the United States government or certain agencies thereof. The Ohio Lottery, through the State Treasurer, may also enter into repurchase agreements with any eligible depository for periods not to exceed 30 days and is also permitted to engage in security lending transactions with qualified broker-dealers.
Public depositories must give security for all public funds on deposit. These institutions may either specifically collateralize individual accounts in lieu of amounts insured by the Federal Deposit Insurance Corporation (FDIC) or may pledge a pool of government securities of which the face value is at least 105 percent of the total value of public moneys on deposit at the institution. Repurchase agreements must be secured by the specific government securities upon which the repurchase agreements are based. These securities must be obligations of or guaranteed by the United States government, and mature or be redeemable within five years of the date of the related repurchase agreement. State law does not require security for public deposits and investments to be maintained in the Ohio Lottery’s name.
DEPOSITSCustodial Credit Risk – Deposits: In the case of deposits, this is the risk that in the event of a bank failure, the Ohio Lottery’s deposits may not be returned to it. As of June 30, 2009, the carrying amount of the Ohio Lottery’s deposits with financial institutions was $22,734,000 and the bank balance was $22,721,000, the difference representing normal reconciling items. The bank balance was covered in full by the FDIC insurance, due to the FDIC adopting a Final Rule relating to the Temporary Liquidity Guarantee Program, which guaranteed certain noninterest-bearing transaction accounts at insured depository institutions.
As mentioned earlier, the Ohio Lottery also has cash invested in a money market mutual fund, which is used to fund daily operations. These investments are not subject to interest rate risk because the underlying investments have short-term maturities, and the fund’s share price remains stable.
INVESTMENTSAlthough risk exposures are minimized by complying with legal requirements and internal policies adopted by the Treasurer of State, the Ohio Lottery’s investments are exposed to risks that may lead to losses of value. The Ohio Lottery’s investments at June 30, 2009 consist of the following:
(rounded thousands) Investment Maturities (in years)
FairValue
Credit Quality Rating
Lessthan � �-� �-�0 >�0
U.S. Government Agency Obligations $ 282,905 AAA/Aaa $ 40,687 $ 148,428 $ 93,790 $ -U.S. Government Strips 158,982 AAA/Aaa 10,897 40,355 41,708 66,022U.S. Government Agency Strips 306,687 AAA/Aaa 14,837 80,483 139,947 71,420Israel Bond 3,000 A/A1 - 3,000 - -Total Investments 751,574 66,421 272,266 275,445 137,442Investments not required to be categorizedInvestments in State Treasury Asset Reserve of Ohio (STAR Ohio) 9,563 AAA 9,563 - - -Equity in State of Ohio Common Cash & Investments 63,651 63,651 - - -Money Market Mutual Fund 294 AAAm 294 - - -Collateral on loaned securities - Lottery’s ratable allocation of cash collateral received on securities loans made from the State of Ohio’s Common Cash and Investments account 27,189 27,189 - - -
Total Lottery Commission -Structured Investments, as of June 30, 2009 $ 852,271 $ 167,118 $ 272,266 $ 275,445 $ 137,442
Custodial Credit Risk: A custodial credit risk for investments exists when a government is unable to recover the value of investments or collateral securities that are in possession of an outside party in the event of a failure of a counterparty to a transaction. Investments are exposed to custodial credit risks if the securities are uninsured, are not registered in the name of the government, and are held by either the counterparty or the counterparty’s trust department but not in the government’s name. The Ohio Lottery is not subject to custodial credit risk because the investments
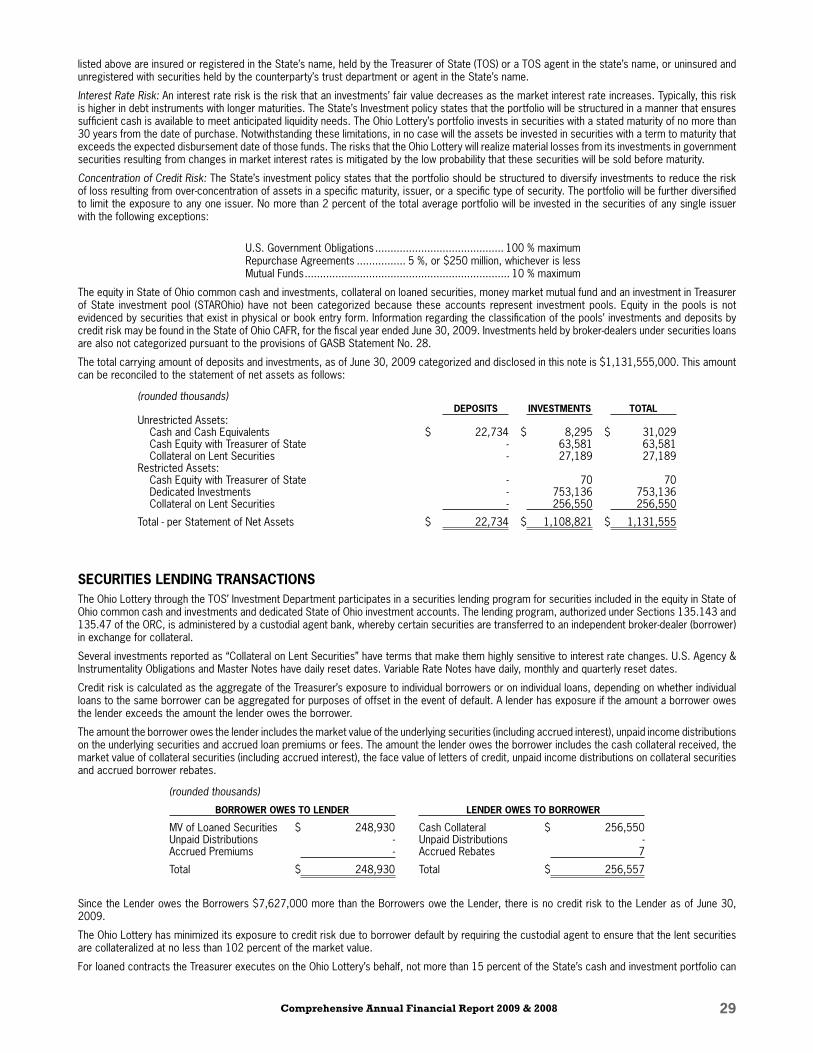
Comprehensive Annual Financial Report 2009 & 2008 �9
listed above are insured or registered in the State’s name, held by the Treasurer of State (TOS) or a TOS agent in the state’s name, or uninsured and unregistered with securities held by the counterparty’s trust department or agent in the State’s name.
Interest Rate Risk: An interest rate risk is the risk that an investments’ fair value decreases as the market interest rate increases. Typically, this risk is higher in debt instruments with longer maturities. The State’s Investment policy states that the portfolio will be structured in a manner that ensures sufficient cash is available to meet anticipated liquidity needs. The Ohio Lottery’s portfolio invests in securities with a stated maturity of no more than 30 years from the date of purchase. Notwithstanding these limitations, in no case will the assets be invested in securities with a term to maturity that exceeds the expected disbursement date of those funds. The risks that the Ohio Lottery will realize material losses from its investments in government securities resulting from changes in market interest rates is mitigated by the low probability that these securities will be sold before maturity.
Concentration of Credit Risk: The State’s investment policy states that the portfolio should be structured to diversify investments to reduce the risk of loss resulting from over-concentration of assets in a specific maturity, issuer, or a specific type of security. The portfolio will be further diversified to limit the exposure to any one issuer. No more than 2 percent of the total average portfolio will be invested in the securities of any single issuer with the following exceptions:
U.S. Government Obligations .......................................... 100 % maximumRepurchase Agreements ................ 5 %, or $250 million, whichever is lessMutual Funds ................................................................... 10 % maximum
The equity in State of Ohio common cash and investments, collateral on loaned securities, money market mutual fund and an investment in Treasurer of State investment pool (STAROhio) have not been categorized because these accounts represent investment pools. Equity in the pools is not evidenced by securities that exist in physical or book entry form. Information regarding the classification of the pools’ investments and deposits by credit risk may be found in the State of Ohio CAFR, for the fiscal year ended June 30, 2009. Investments held by broker-dealers under securities loans are also not categorized pursuant to the provisions of GASB Statement No. 28.
The total carrying amount of deposits and investments, as of June 30, 2009 categorized and disclosed in this note is $1,131,555,000. This amount can be reconciled to the statement of net assets as follows:
(rounded thousands)DEPOSITS INVESTMENTS TOTAL
Unrestricted Assets: Cash and Cash Equivalents $ 22,734 $ 8,295 $ 31,029Cash Equity with Treasurer of State - 63,581 63,581Collateral on Lent Securities - 27,189 27,189
Restricted Assets: Cash Equity with Treasurer of State - 70 70Dedicated Investments - 753,136 753,136Collateral on Lent Securities - 256,550 256,550
Total - per Statement of Net Assets $ 22,734 $ 1,108,821 $ 1,131,555
SECURITIES LENDING TRANSACTIONSThe Ohio Lottery through the TOS’ Investment Department participates in a securities lending program for securities included in the equity in State of Ohio common cash and investments and dedicated State of Ohio investment accounts. The lending program, authorized under Sections 135.143 and 135.47 of the ORC, is administered by a custodial agent bank, whereby certain securities are transferred to an independent broker-dealer (borrower) in exchange for collateral.
Several investments reported as “Collateral on Lent Securities” have terms that make them highly sensitive to interest rate changes. U.S. Agency & Instrumentality Obligations and Master Notes have daily reset dates. Variable Rate Notes have daily, monthly and quarterly reset dates.
Credit risk is calculated as the aggregate of the Treasurer’s exposure to individual borrowers or on individual loans, depending on whether individual loans to the same borrower can be aggregated for purposes of offset in the event of default. A lender has exposure if the amount a borrower owes the lender exceeds the amount the lender owes the borrower.
The amount the borrower owes the lender includes the market value of the underlying securities (including accrued interest), unpaid income distributions on the underlying securities and accrued loan premiums or fees. The amount the lender owes the borrower includes the cash collateral received, the market value of collateral securities (including accrued interest), the face value of letters of credit, unpaid income distributions on collateral securities and accrued borrower rebates.
(rounded thousands)
BORROWER OWES TO LENDER LENDER OWES TO BORROWER
MV of Loaned Securities $ 248,930 Cash Collateral $ 256,550Unpaid Distributions - Unpaid Distributions -Accrued Premiums - Accrued Rebates 7
Total $ 248,930 Total $ 256,557
Since the Lender owes the Borrowers $7,627,000 more than the Borrowers owe the Lender, there is no credit risk to the Lender as of June 30, 2009.
The Ohio Lottery has minimized its exposure to credit risk due to borrower default by requiring the custodial agent to ensure that the lent securities are collateralized at no less than 102 percent of the market value.
For loaned contracts the Treasurer executes on the Ohio Lottery’s behalf, not more than 15 percent of the State’s cash and investment portfolio can
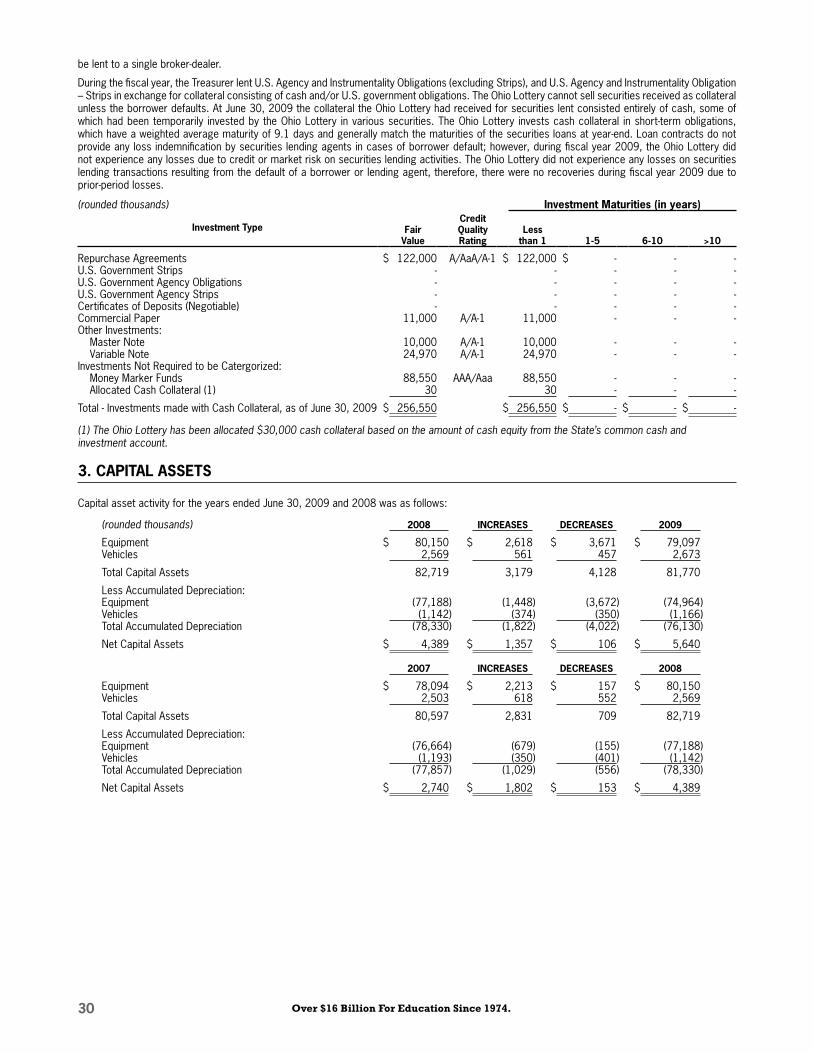
�0 Over $16 Billion For Education Since 1974.
be lent to a single broker-dealer.
During the fiscal year, the Treasurer lent U.S. Agency and Instrumentality Obligations (excluding Strips), and U.S. Agency and Instrumentality Obligation – Strips in exchange for collateral consisting of cash and/or U.S. government obligations. The Ohio Lottery cannot sell securities received as collateral unless the borrower defaults. At June 30, 2009 the collateral the Ohio Lottery had received for securities lent consisted entirely of cash, some of which had been temporarily invested by the Ohio Lottery in various securities. The Ohio Lottery invests cash collateral in short-term obligations, which have a weighted average maturity of 9.1 days and generally match the maturities of the securities loans at year-end. Loan contracts do not provide any loss indemnification by securities lending agents in cases of borrower default; however, during fiscal year 2009, the Ohio Lottery did not experience any losses due to credit or market risk on securities lending activities. The Ohio Lottery did not experience any losses on securities lending transactions resulting from the default of a borrower or lending agent, therefore, there were no recoveries during fiscal year 2009 due to prior-period losses.
(rounded thousands) Investment Maturities (in years)
Investment Type FairValue
Credit Quality Rating
Lessthan � �-� �-�0 >�0
Repurchase Agreements $ 122,000 A/AaA/A-1 $ 122,000 $ - - -U.S. Government Strips - - - - -U.S. Government Agency Obligations - - - - -U.S. Government Agency Strips - - - - -Certificates of Deposits (Negotiable) - - - - -Commercial Paper 11,000 A/A-1 11,000 - - -Other Investments:
Master Note 10,000 A/A-1 10,000 - - -Variable Note 24,970 A/A-1 24,970 - - -
Investments Not Required to be Catergorized:Money Marker Funds 88,550 AAA/Aaa 88,550 - - -Allocated Cash Collateral (1) 30 30 - - -
Total - Investments made with Cash Collateral, as of June 30, 2009 $ 256,550 $ 256,550 $ - $ - $ -
(1) The Ohio Lottery has been allocated $30,000 cash collateral based on the amount of cash equity from the State’s common cash and investment account.
�. CAPITAL ASSETS
Capital asset activity for the years ended June 30, 2009 and 2008 was as follows:
(rounded thousands) �008 INCREASES DECREASES �009
Equipment $ 80,150 $ 2,618 $ 3,671 $ 79,097 Vehicles 2,569 561 457 2,673
Total Capital Assets 82,719 3,179 4,128 81,770
Less Accumulated Depreciation:Equipment (77,188) (1,448) (3,672) (74,964)Vehicles (1,142) (374) (350) (1,166)Total Accumulated Depreciation (78,330) (1,822) (4,022) (76,130)
Net Capital Assets $ 4,389 $ 1,357 $ 106 $ 5,640
�007 INCREASES DECREASES �008
Equipment $ 78,094 $ 2,213 $ 157 $ 80,150 Vehicles 2,503 618 552 2,569
Total Capital Assets 80,597 2,831 709 82,719
Less Accumulated Depreciation:Equipment (76,664) (679) (155) (77,188)Vehicles (1,193) (350) (401) (1,142)Total Accumulated Depreciation (77,857) (1,029) (556) (78,330)
Net Capital Assets $ 2,740 $ 1,802 $ 153 $ 4,389
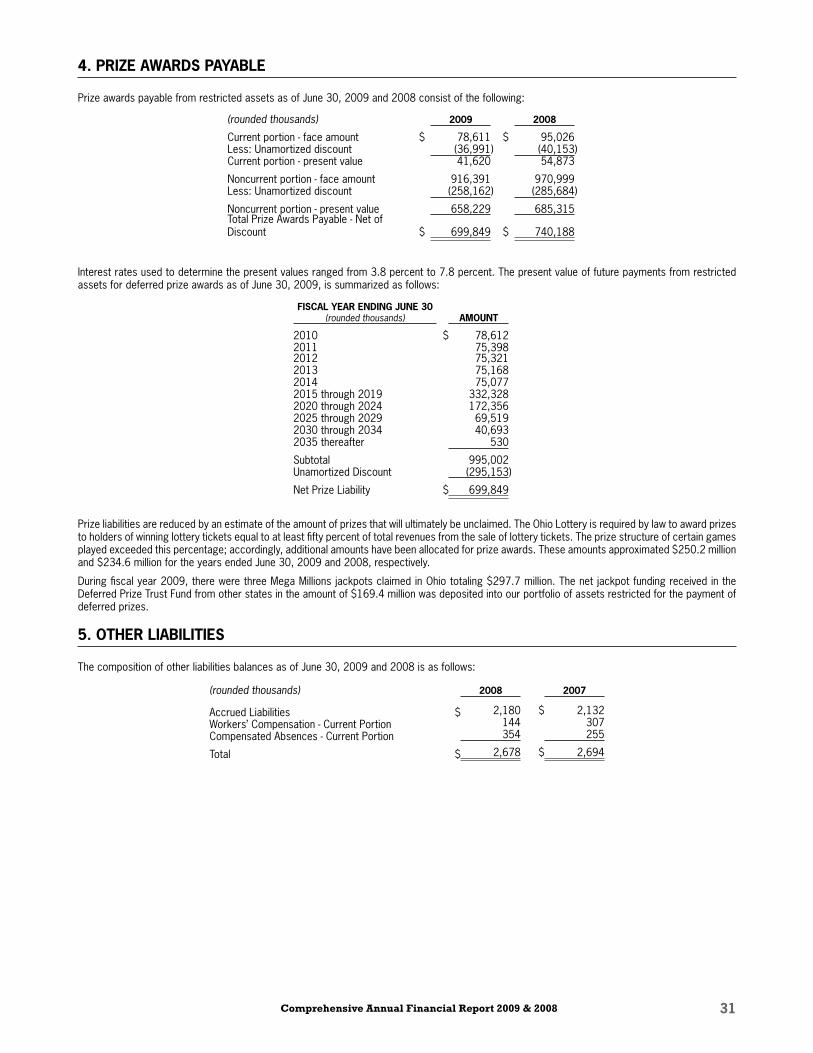
Comprehensive Annual Financial Report 2009 & 2008 ��
�. PRIZE AWARDS PAYABLE
Prize awards payable from restricted assets as of June 30, 2009 and 2008 consist of the following:
(rounded thousands) �009 �008
Current portion - face amount $ 78,611 $ 95,026Less: Unamortized discount (36,991) (40,153)Current portion - present value 41,620 54,873
Noncurrent portion - face amount 916,391 970,999Less: Unamortized discount (258,162) (285,684)
Noncurrent portion - present value 658,229 685,315Total Prize Awards Payable - Net of Discount $ 699,849 $ 740,188
Interest rates used to determine the present values ranged from 3.8 percent to 7.8 percent. The present value of future payments from restricted assets for deferred prize awards as of June 30, 2009, is summarized as follows:
FISCAL YEAR ENDING JUNE �0 (rounded thousands) AMOUNT
2010 $ 78,6122011 75,3982012 75,3212013 75,1682014 75,0772015 through 2019 332,3282020 through 2024 172,3562025 through 2029 69,5192030 through 2034 40,6932035 thereafter 530
Subtotal 995,002Unamortized Discount (295,153)
Net Prize Liability $ 699,849
Prize liabilities are reduced by an estimate of the amount of prizes that will ultimately be unclaimed. The Ohio Lottery is required by law to award prizes to holders of winning lottery tickets equal to at least fifty percent of total revenues from the sale of lottery tickets. The prize structure of certain games played exceeded this percentage; accordingly, additional amounts have been allocated for prize awards. These amounts approximated $250.2 million and $234.6 million for the years ended June 30, 2009 and 2008, respectively.
During fiscal year 2009, there were three Mega Millions jackpots claimed in Ohio totaling $297.7 million. The net jackpot funding received in the Deferred Prize Trust Fund from other states in the amount of $169.4 million was deposited into our portfolio of assets restricted for the payment of deferred prizes.
�. OTHER LIABILITIES
The composition of other liabilities balances as of June 30, 2009 and 2008 is as follows:
(rounded thousands) �008 �007
Accrued Liabilities $ 2,180 $ 2,132Workers’ Compensation - Current Portion 144 307Compensated Absences - Current Portion 354 255
Total $ 2,678 $ 2,694
�� Over $16 Billion For Education Since 1974.
�. NONCURRENT LIABILITIES
Noncurrent liabilities activity for the years ended June 30, 2009 and 2008 was as follows:
(rounded thousands) �008 ADDITIONS REDUCTIONS �009
Prize Awards Payable from Restricted Assets - Net of Discount $ 685,315 $ 255,477 $ (282,563) $ 658,229Accrued Workers’ Compensation 2,188 - (375) 1,813Compensated Absences 2,783 1,811 (2,362) 2,232Total Noncurrent Liabilities $ 690,286 $ 257,288 $ (285,300) $ 662,274
�007 ADDITIONS REDUCTIONS �008
Prize Awards Payable from Restricted Assets - Net of Discount $ 618,949 $ 170,055 $ (103,689) $ 685,315Accrued Workers’ Compensation 2,472 - (284) 2,188Compensated Absences 3,006 2,304 (2,527) 2,783Total Noncurrent Liabilities $ 624,427 $ 172,359 $ (106,500) $ 690,286
The amounts due within one year for accrued worker’s compensation and compensated absences are reported as current liabilities. Current liabilities for prize awards payable from restricted assets were $41.6 million and $54.9 million for the years ended June 30, 2009 and June 30, 2008, respectively.
7. PENSIONS – DEFINED BENEFIT PENSION PLAN
PLAN DESCRIPTIONThe Ohio Lottery contributes to the Ohio Public Employees Retirement System (OPERS) which administers three separate pension plans as described below:
The Traditional Pension Plan (TP) – a cost-sharing multiple-employer defined benefit pension plan.
The Member-Directed Plan (MD) – a defined contribution plan in which the member invests both member and employer contributions (employer contributions vest over five years at 20 percent per year). Under the Member-Directed Plan, members accumulate retirement assets equal to the value of member and (vested) employer contributions plus any investment earnings.
The Combined Plan (CO) – a cost-sharing multiple-employer defined benefit pension plan. Under the Combined Plan, OPERS invests employer contributions to provide a formula retirement benefit similar in nature to the Traditional Pension Plan benefit. Member contributions, the investment of which is self-directed by the members, accumulate retirement assets in a manner similar to the Member-Directed Plan.
The ORC permits, but does not mandate, OPERS to provide Other Post Employment Benefits (OPEB) to its eligible members and beneficiaries. Authority to establish and amend benefits is provided by State statute per Chapter 145 of the ORC.
OPERS issues a stand-alone financial report. Interested parties may obtain a copy by making a written request to: OPERS, 277 East Town Street, Columbus, Ohio 43215-4642 or by calling (614) 222-5601 or 1-800-222-7377.
FUNDING POLICYThe ORC provides the statutory authority requiring public employees to fund post retirement health care through their contributions to OPERS. For 2008 calendar year end, member and employer contribution rates were consistent across all three plans (TP, MD and CO). The 2008 member contribution rates were 10.0 percent for members in classifications other than law enforcement and the employer contribution rate for State employers was 14.0 percent of covered payroll. The ORC currently limits the employer contribution to a rate not to exceed 14.0 percent.
The Ohio Lottery’s required contributions to OPERS for the years ended June 30, 2009, 2008, and 2007 were $1,321,000, $1,405,000, and $1,666,000 respectively, equal to the required contribution for each year.
8. OTHER POST EMPLOYMENT BENEFITS
PLAN DESCRIPTIONIn addition to the pension benefits described in Note 7, OPERS maintains a cost-sharing multiple employer defined benefit post-employment health care plan, which includes a medical plan, prescription drug program and Medicare Part B reimbursement, to qualifying members of both the Traditional Pension and the Combined Plans. Members of the Member-Directed plan do not qualify for ancillary benefits, including post-employment health care coverage. In order to qualify for post-retirement health care coverage, age and service retirees, under the Traditional and Combined plans, must have 10 or more years of qualifying Ohio service credit. Health care coverage for disability benefit recipients and qualified survivor benefit recipients is available. Authority to establish and amend benefits is provided in Chapter 145 of the Ohio Revised Code. The health care coverage provided by the Retirement System is considered an OPEB as described in GASB Statement No. 45.
FUNDING POLICYThe post-employment health care plan was established under, and is administered in accordance with, Internal Revenue Code 401(h). State statute requires that public employers fund post-employment health care through contributions to OPERS. A portion of each employer’s contribution to the traditional or combined plans is set aside for the funding of post-retirement health care. Employer contribution rates are expressed as a percentage of the covered payroll of active employees. The 2008 employer contribution rate for State employers was 14.0 percent of covered payroll. The portion of employer contributions, for all employers, allocated to health care was 7.0 percent.
•
•
•

Comprehensive Annual Financial Report 2009 & 2008 ��
The retirement board is also authorized to establish rules for the payment of a portion of the health care benefits by the retiree or the retiree’s surviving beneficiaries. Payment amounts vary depending on the number of covered dependents and the coverage selected. Active members do not make contributions to the post-employment health care plan. In fiscal years 2009, 2008 and 2007, $1,321,000, $1,085,000, and $829,000, respectively, of the Ohio Lottery’s total contributions to OPERS were used for post-employment benefits. The actuarial value of the Retirement System’s net assets available for OPEB was $12.8 billion at December 31, 2007.
On September 9, 2004 the OPERS Retirement Board adopted a Health Care Preservation Plan with an effective date of January 1, 2007. Member and employer contribution rates increased as of January 1, 2006, January 1, 2007, and January 1, 2008, which will allow additional funds to be allocated to the health care plan.
9. LITIGATION
The Ohio Lottery is a party to various legal proceedings. A liability for a claim is established if information indicates that it is probable that a liability has been incurred at the date of the financial statements and the amount of the loss is reasonably estimable. In the opinion of management the ultimate outcome of such legal proceedings will not have a material adverse impact on the Ohio Lottery’s financial position.
�0. SUBSEQUENT EVENTS
The Ohio Lottery entered into a contractual agreement in July 2009 with Intralot, for gaming services commencing July 1, 2009. The length of the contract is two years, with four optional two-year renewal periods.

�� Over $16 Billion For Education Since 1974.

Comprehensive Annual Financial Report 2009 & 2008 ��
Statistical Section
TM
Mark: Mega Millions Winner Beginner’s luck? Just after his 18th birthday, Mark bought his very first
Mega Millions ticket and won $10,000. He’s paying for college. That’s beginner’s smarts.

�� Over $16 Billion For Education Since 1974.
OHIO LOTTERY COMMISSION STATISTICAL INFORMATION SECTION
This section of the Ohio Lottery’s comprehensive annual financial report presents detailed information as a supplement to the information presented in the financial statements and note disclosures to assist readers in assessing the Lottery’s overall financial health.
FINANCIAL TRENDSThese schedules contain trend information to help readers understand how the Lottery’s financial performance and position has changed over time. The information presented includes changes in net assets, sales, and transfer data specific to the Lottery as well as the lottery industry as a whole.
REVENUE CAPACITYThese schedules contain information to help readers assess the Lottery’s most significant revenue source. Sales information, included in the financial trends section, provides data about the various games available to the public. The Lottery’s statewide retailer network determines the market exposure for the Lottery’s games.
DEMOGRAPHIC AND ECONOMIC INFORMATIONThese schedules offer demographic and economic indicators to help readers understand the environment within which the Lottery operates.
OPERATING INFORMATIONThese schedules contain information about the Lottery’s organization and efficiency.
SOURCESUnless otherwise noted, the information in these schedules is derived from the comprehensive annual financial reports or the audited financial statements for the relevant year.
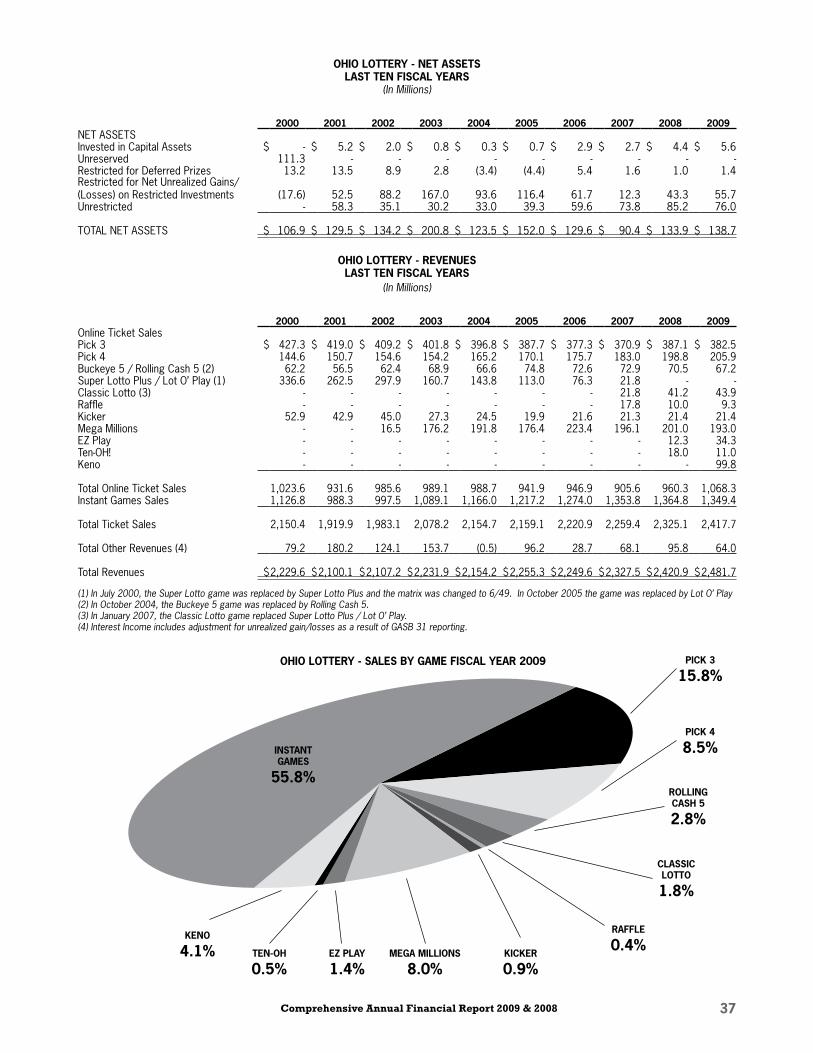
Comprehensive Annual Financial Report 2009 & 2008 �7
OHIO LOTTERY - NET ASSETSLAST TEN FISCAL YEARS
(In Millions)
�000 �00� �00� �00� �00� �00� �00� �007 �008 �009NET ASSETSInvested in Capital Assets $ - $ 5.2 $ 2.0 $ 0.8 $ 0.3 $ 0.7 $ 2.9 $ 2.7 $ 4.4 $ 5.6Unreserved 111.3 - - - - - - - - -Restricted for Deferred Prizes 13.2 13.5 8.9 2.8 (3.4) (4.4) 5.4 1.6 1.0 1.4Restricted for Net Unrealized Gains/(Losses) on Restricted Investments (17.6) 52.5 88.2 167.0 93.6 116.4 61.7 12.3 43.3 55.7Unrestricted - 58.3 35.1 30.2 33.0 39.3 59.6 73.8 85.2 76.0
TOTAL NET ASSETS $ 106.9 $ 129.5 $ 134.2 $ 200.8 $ 123.5 $ 152.0 $ 129.6 $ 90.4 $ 133.9 $ 138.7
OHIO LOTTERY - REVENUESLAST TEN FISCAL YEARS
(In Millions)
�000 �00� �00� �00� �00� �00� �00� �007 �008 �009Online Ticket SalesPick 3 $ 427.3 $ 419.0 $ 409.2 $ 401.8 $ 396.8 $ 387.7 $ 377.3 $ 370.9 $ 387.1 $ 382.5Pick 4 144.6 150.7 154.6 154.2 165.2 170.1 175.7 183.0 198.8 205.9Buckeye 5 / Rolling Cash 5 (2) 62.2 56.5 62.4 68.9 66.6 74.8 72.6 72.9 70.5 67.2Super Lotto Plus / Lot O’ Play (1) 336.6 262.5 297.9 160.7 143.8 113.0 76.3 21.8 - -Classic Lotto (3) - - - - - - - 21.8 41.2 43.9Raffle - - - - - - - 17.8 10.0 9.3Kicker 52.9 42.9 45.0 27.3 24.5 19.9 21.6 21.3 21.4 21.4Mega Millions - - 16.5 176.2 191.8 176.4 223.4 196.1 201.0 193.0EZ Play - - - - - - - - 12.3 34.3Ten-OH! - - - - - - - - 18.0 11.0Keno - - - - - - - - - 99.8
Total Online Ticket Sales 1,023.6 931.6 985.6 989.1 988.7 941.9 946.9 905.6 960.3 1,068.3Instant Games Sales 1,126.8 988.3 997.5 1,089.1 1,166.0 1,217.2 1,274.0 1,353.8 1,364.8 1,349.4
Total Ticket Sales 2,150.4 1,919.9 1,983.1 2,078.2 2,154.7 2,159.1 2,220.9 2,259.4 2,325.1 2,417.7
Total Other Revenues (4) 79.2 180.2 124.1 153.7 (0.5) 96.2 28.7 68.1 95.8 64.0
Total Revenues $2,229.6 $2,100.1 $2,107.2 $2,231.9 $2,154.2 $2,255.3 $2,249.6 $2,327.5 $2,420.9 $2,481.7
(1) In July 2000, the Super Lotto game was replaced by Super Lotto Plus and the matrix was changed to 6/49. In October 2005 the game was replaced by Lot O’ Play(2) In October 2004, the Buckeye 5 game was replaced by Rolling Cash 5.(3) In January 2007, the Classic Lotto game replaced Super Lotto Plus / Lot O’ Play.(4) Interest Income includes adjustment for unrealized gain/losses as a result of GASB 31 reporting.
OHIO LOTTERY - SALES BY GAME FISCAL YEAR �009
INSTANTGAMES
��.8%
TEN-OH
0.�%EZ PLAY
�.�%MEGA MILLIONS
8.0%KICKER
0.9%
RAFFLE
0.�%
CLASSIC LOTTO
�.8%
ROLLING CASH �
�.8%
PICK �
8.�%
PICK �
��.8%
KENO
�.�%
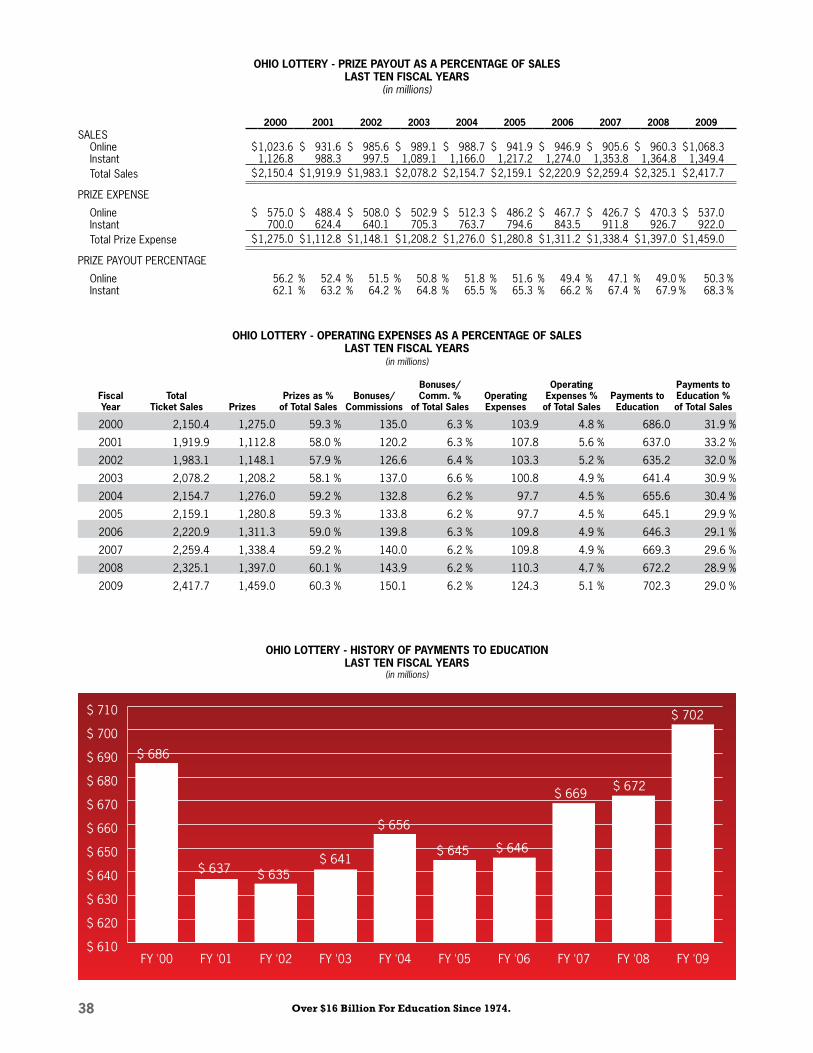
�8 Over $16 Billion For Education Since 1974.
OHIO LOTTERY - OPERATING EXPENSES AS A PERCENTAGE OF SALESLAST TEN FISCAL YEARS
(in millions)
Fiscal Year
TotalTicket Sales Prizes
Prizes as %of Total Sales
Bonuses/Commissions
Bonuses/Comm. %
of Total SalesOperating Expenses
Operating Expenses %
of Total SalesPayments to Education
Payments to Education %of Total Sales
2000 2,150.4 1,275.0 59.3 % 135.0 6.3 % 103.9 4.8 % 686.0 31.9 %
2001 1,919.9 1,112.8 58.0 % 120.2 6.3 % 107.8 5.6 % 637.0 33.2 %
2002 1,983.1 1,148.1 57.9 % 126.6 6.4 % 103.3 5.2 % 635.2 32.0 %
2003 2,078.2 1,208.2 58.1 % 137.0 6.6 % 100.8 4.9 % 641.4 30.9 %
2004 2,154.7 1,276.0 59.2 % 132.8 6.2 % 97.7 4.5 % 655.6 30.4 %
2005 2,159.1 1,280.8 59.3 % 133.8 6.2 % 97.7 4.5 % 645.1 29.9 %
2006 2,220.9 1,311.3 59.0 % 139.8 6.3 % 109.8 4.9 % 646.3 29.1 %
2007 2,259.4 1,338.4 59.2 % 140.0 6.2 % 109.8 4.9 % 669.3 29.6 %
2008 2,325.1 1,397.0 60.1 % 143.9 6.2 % 110.3 4.7 % 672.2 28.9 %
2009 2,417.7 1,459.0 60.3 % 150.1 6.2 % 124.3 5.1 % 702.3 29.0 %
OHIO LOTTERY - PRIZE PAYOUT AS A PERCENTAGE OF SALESLAST TEN FISCAL YEARS
(in millions)
�000 �00� �00� �00� �00� �00� �00� �007 �008 �009SALES
Online $1,023.6 $ 931.6 $ 985.6 $ 989.1 $ 988.7 $ 941.9 $ 946.9 $ 905.6 $ 960.3 $1,068.3Instant 1,126.8 988.3 997.5 1,089.1 1,166.0 1,217.2 1,274.0 1,353.8 1,364.8 1,349.4Total Sales $2,150.4 $1,919.9 $1,983.1 $2,078.2 $2,154.7 $2,159.1 $2,220.9 $2,259.4 $2,325.1 $2,417.7
PRIZE EXPENSE
Online $ 575.0 $ 488.4 $ 508.0 $ 502.9 $ 512.3 $ 486.2 $ 467.7 $ 426.7 $ 470.3 $ 537.0Instant 700.0 624.4 640.1 705.3 763.7 794.6 843.5 911.8 926.7 922.0Total Prize Expense $1,275.0 $1,112.8 $1,148.1 $1,208.2 $1,276.0 $1,280.8 $1,311.2 $1,338.4 $1,397.0 $1,459.0
PRIZE PAYOUT PERCENTAGE
Online 56.2 % 52.4 % 51.5 % 50.8 % 51.8 % 51.6 % 49.4 % 47.1 % 49.0 % 50.3 %Instant 62.1 % 63.2 % 64.2 % 64.8 % 65.5 % 65.3 % 66.2 % 67.4 % 67.9 % 68.3 %
OHIO LOTTERY - HISTORY OF PAYMENTS TO EDUCATIONLAST TEN FISCAL YEARS
(in millions)
$ 610
$ 620
$ 630
$ 640
$ 650
$ 660
$ 670
$ 680
$ 690
$ 700
$ 710
FY '09FY '08FY '07FY '06FY '05FY '04FY '03FY '02FY '01FY '00
$ 672
$ 645
$ 686
$ 656
$ 637 $ 635
$ 646
$ 702
$ 641
$ 669

Comprehensive Annual Financial Report 2009 & 2008 �9
OHIO LOTTERY - EXPENSES AND PAYMENTSLAST TEN FISCAL YEARS
(in millions)
$ 0
$ 10
$ 20
$ 30
$ 40
$ 50
$ 60
$ 70
$ 80
$ 90
$ 100
$ 110
$ 120
2009200820072006200520042003200220012000
$ 0
$ 10
$ 20
$ 30
$ 40
$ 50
$ 60
$ 70
$ 80
$ 90
$ 100
$ 110
$ 120
$ 130
$ 140
$ 150
2009200820072006200520042003200220012000$ 0
$ 100
$ 200
$ 300
$ 400
$ 500
$ 600
$ 700
$ 800
$ 900
$ 1000
$ 1100
$ 1200
$ 1300
$ 1400
2009200820072006200520042003200220012000
$ 0
$ 100
$ 200
$ 300
$ 400
$ 500
$ 600
$ 700
$ 800
2009200820072006200520042003200220012000
OPERATING EXPENSE
PRIZE EXPENSE
PAYMENTS TO EDUCATION
BONUSES / COMMISSIONS
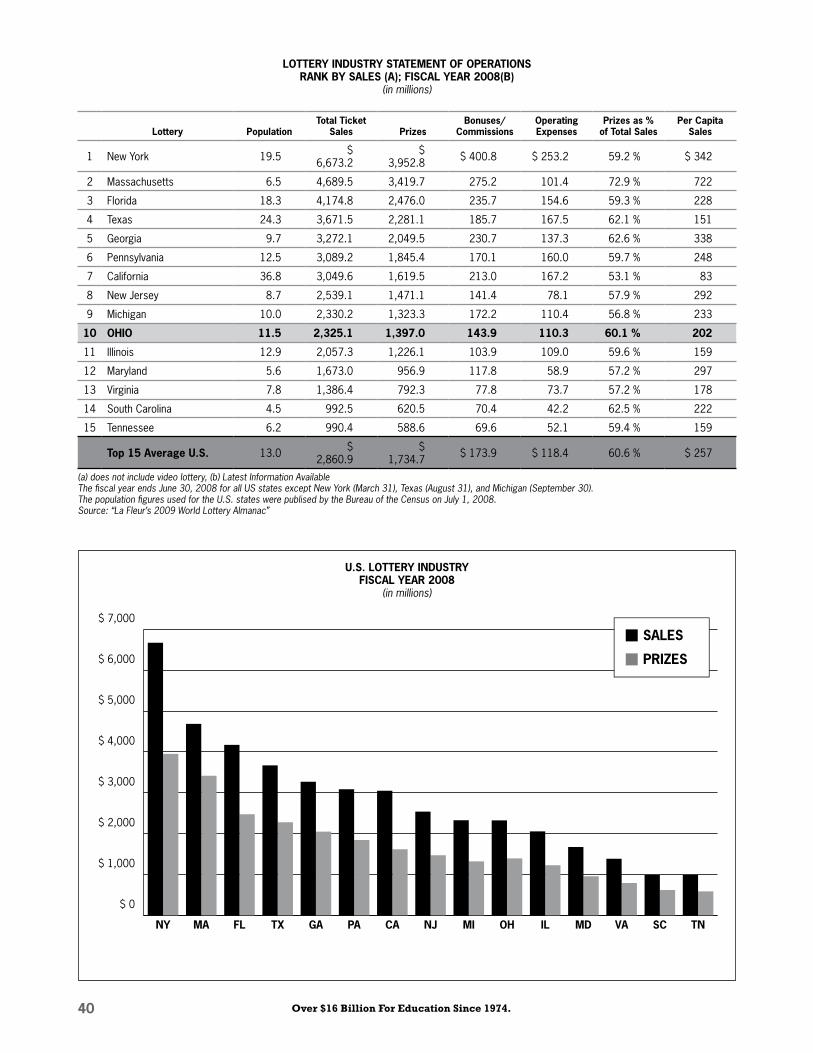
�0 Over $16 Billion For Education Since 1974.
U.S. LOTTERY INDUSTRYFISCAL YEAR �008
(in millions)
$ 0
$ 1,000
$ 2,000
$ 3,000
$ 4,000
$ 5,000
$ 6,000
$ 7,000
TNSCVAMDILOHMINJCAPAGATXFLMANY
PRIZES
SALES
LOTTERY INDUSTRY STATEMENT OF OPERATIONSRANK BY SALES (A); FISCAL YEAR �008(B)
(in millions)
Lottery PopulationTotal Ticket
Sales PrizesBonuses/
CommissionsOperating Expenses
Prizes as % of Total Sales
Per Capita Sales
1 New York 19.5 $ 6,673.2
$ 3,952.8 $ 400.8 $ 253.2 59.2 % $ 342
2 Massachusetts 6.5 4,689.5 3,419.7 275.2 101.4 72.9 % 722
3 Florida 18.3 4,174.8 2,476.0 235.7 154.6 59.3 % 228
4 Texas 24.3 3,671.5 2,281.1 185.7 167.5 62.1 % 151
5 Georgia 9.7 3,272.1 2,049.5 230.7 137.3 62.6 % 338
6 Pennsylvania 12.5 3,089.2 1,845.4 170.1 160.0 59.7 % 248
7 California 36.8 3,049.6 1,619.5 213.0 167.2 53.1 % 83
8 New Jersey 8.7 2,539.1 1,471.1 141.4 78.1 57.9 % 292
9 Michigan 10.0 2,330.2 1,323.3 172.2 110.4 56.8 % 233
�0 OHIO ��.� �,���.� �,�97.0 ���.9 ��0.� �0.� % �0�
11 Illinois 12.9 2,057.3 1,226.1 103.9 109.0 59.6 % 159
12 Maryland 5.6 1,673.0 956.9 117.8 58.9 57.2 % 297
13 Virginia 7.8 1,386.4 792.3 77.8 73.7 57.2 % 178
14 South Carolina 4.5 992.5 620.5 70.4 42.2 62.5 % 222
15 Tennessee 6.2 990.4 588.6 69.6 52.1 59.4 % 159
Top �� Average U.S. 13.0 $ 2,860.9
$ 1,734.7 $ 173.9 $ 118.4 60.6 % $ 257
(a) does not include video lottery, (b) Latest Information AvailableThe fiscal year ends June 30, 2008 for all US states except New York (March 31), Texas (August 31), and Michigan (September 30).The population figures used for the U.S. states were publised by the Bureau of the Census on July 1, 2008.Source: “La Fleur’s 2009 World Lottery Almanac”
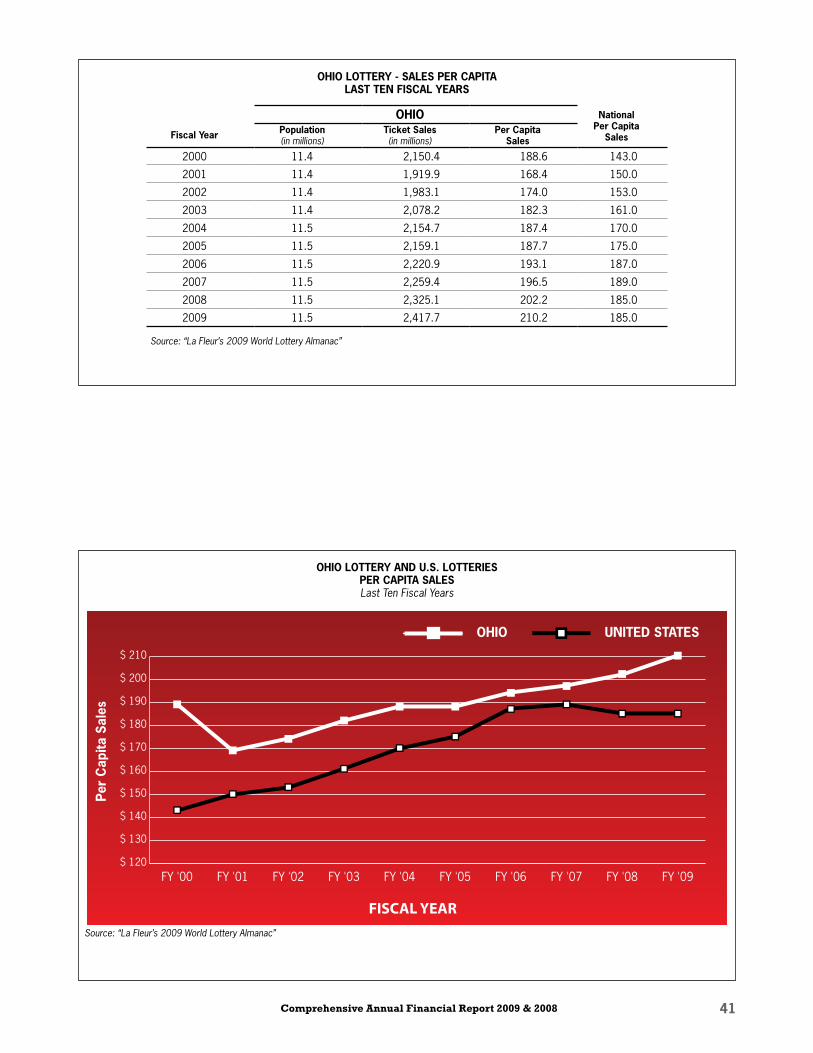
Comprehensive Annual Financial Report 2009 & 2008 ��
OHIO LOTTERY - SALES PER CAPITALAST TEN FISCAL YEARS
OHIO NationalPer Capita
SalesFiscal Year Population(in millions)
Ticket Sales(in millions)
Per CapitaSales
2000 11.4 2,150.4 188.6 143.0
2001 11.4 1,919.9 168.4 150.0
2002 11.4 1,983.1 174.0 153.0
2003 11.4 2,078.2 182.3 161.0
2004 11.5 2,154.7 187.4 170.0
2005 11.5 2,159.1 187.7 175.0
2006 11.5 2,220.9 193.1 187.0
2007 11.5 2,259.4 196.5 189.0
2008 11.5 2,325.1 202.2 185.0
2009 11.5 2,417.7 210.2 185.0
Source: “La Fleur’s 2009 World Lottery Almanac”
OHIO LOTTERY AND U.S. LOTTERIESPER CAPITA SALESLast Ten Fiscal Years
FISCAL YEAR
$ 120
$ 130
$ 140
$ 150
$ 160
$ 170
$ 180
$ 190
$ 200
$ 210
FY '09FY '08FY '07FY '06FY '05FY '04FY '03FY '02FY '01FY '00
Per
Cap
ita S
ales
OHIO UNITED STATES
Source: “La Fleur’s 2009 World Lottery Almanac”
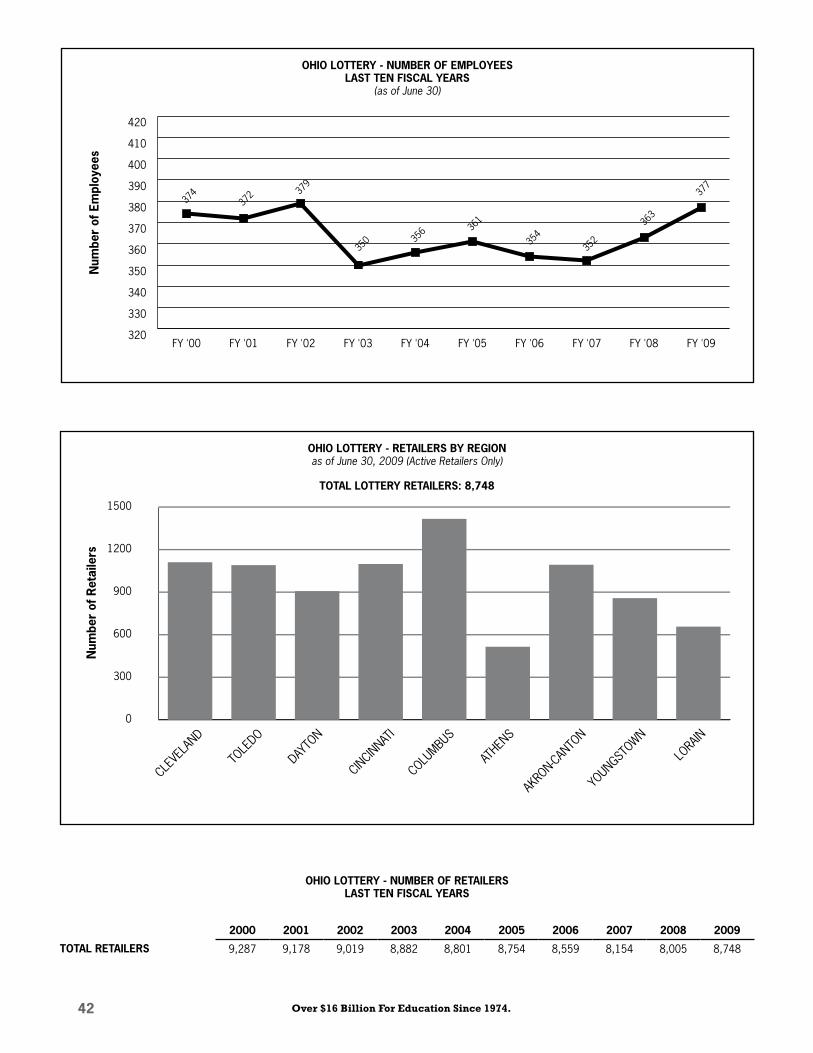
�� Over $16 Billion For Education Since 1974.
OHIO LOTTERY - NUMBER OF EMPLOYEESLAST TEN FISCAL YEARS
(as of June 30)
320
330
340
350
360
370
380
390
400
410
420
FY '09FY '08FY '07FY '06FY '05FY '04FY '03FY '02FY '01FY '00
Num
ber
of E
mpl
oyee
s
379
352
363
354
361
356
350
37237
4 377
OHIO LOTTERY - RETAILERS BY REGIONas of June 30, 2009 (Active Retailers Only)
TOTAL LOTTERY RETAILERS: 8,7�8
0
300
600
900
1200
1500
LORA
IN
YOUN
GSTOWN
AKRO
N-CANTO
N
ATHEN
S
COLUMBU
S
CINCINNATI
DAYTO
N
TOLE
DO
CLEVE
LAND
Num
ber
of R
etai
lers
OHIO LOTTERY - NUMBER OF RETAILERSLAST TEN FISCAL YEARS
�000 �00� �00� �00� �00� �00� �00� �007 �008 �009
TOTAL RETAILERS 9,287 9,178 9,019 8,882 8,801 8,754 8,559 8,154 8,005 8,748
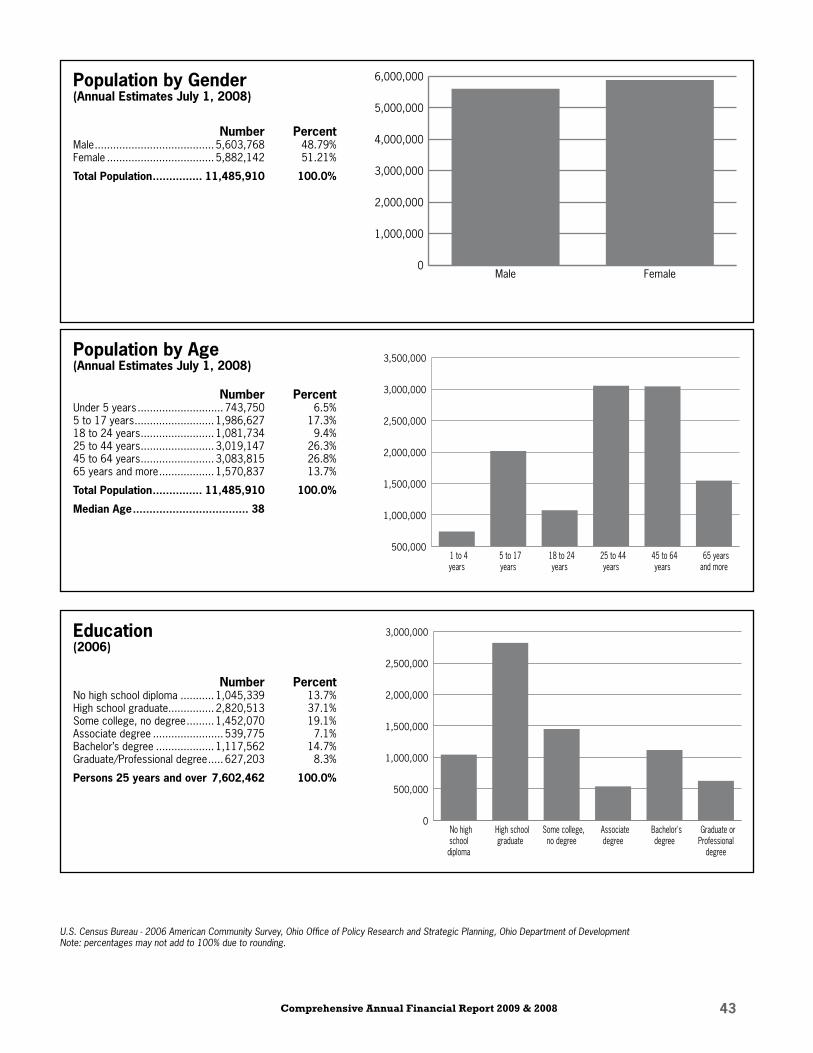
Comprehensive Annual Financial Report 2009 & 2008 ��
Population by Gender(Annual Estimates July �, �008)
Number PercentMale ....................................... 5,603,768 48.79%Female ................................... 5,882,142 51.21%
Total Population ............... ��,�8�,9�0 �00.0%
Population by Age(Annual Estimates July �, �008)
Number PercentUnder 5 years ............................ 743,750 6.5%5 to 17 years .......................... 1,986,627 17.3%18 to 24 years ........................ 1,081,734 9.4%25 to 44 years ........................ 3,019,147 26.3%45 to 64 years ........................ 3,083,815 26.8%65 years and more .................. 1,570,837 13.7%
Total Population ............... ��,�8�,9�0 �00.0%
Median Age ................................... �8
Education(�00�)
Number PercentNo high school diploma ........... 1,045,339 13.7%High school graduate ............... 2,820,513 37.1%Some college, no degree ......... 1,452,070 19.1%Associate degree ....................... 539,775 7.1%Bachelor’s degree ................... 1,117,562 14.7%Graduate/Professional degree ..... 627,203 8.3%
Persons �� years and over 7,�0�,��� �00.0%
U.S. Census Bureau - 2006 American Community Survey, Ohio Office of Policy Research and Strategic Planning, Ohio Department of DevelopmentNote: percentages may not add to 100% due to rounding.
0
500,000
1,000,000
1,500,000
2,000,000
2,500,000
3,000,000
Graduate orProfessional
degree
Bachelor'sdegree
Associatedegree
Some college,no degree
High schoolgraduate
No highschooldiploma
500,000
1,000,000
1,500,000
2,000,000
2,500,000
3,000,000
3,500,000
65 yearsand more
45 to 64years
25 to 44years
18 to 24years
5 to 17years
1 to 4years
0
1,000,000
2,000,000
3,000,000
4,000,000
5,000,000
6,000,000
FemaleMale
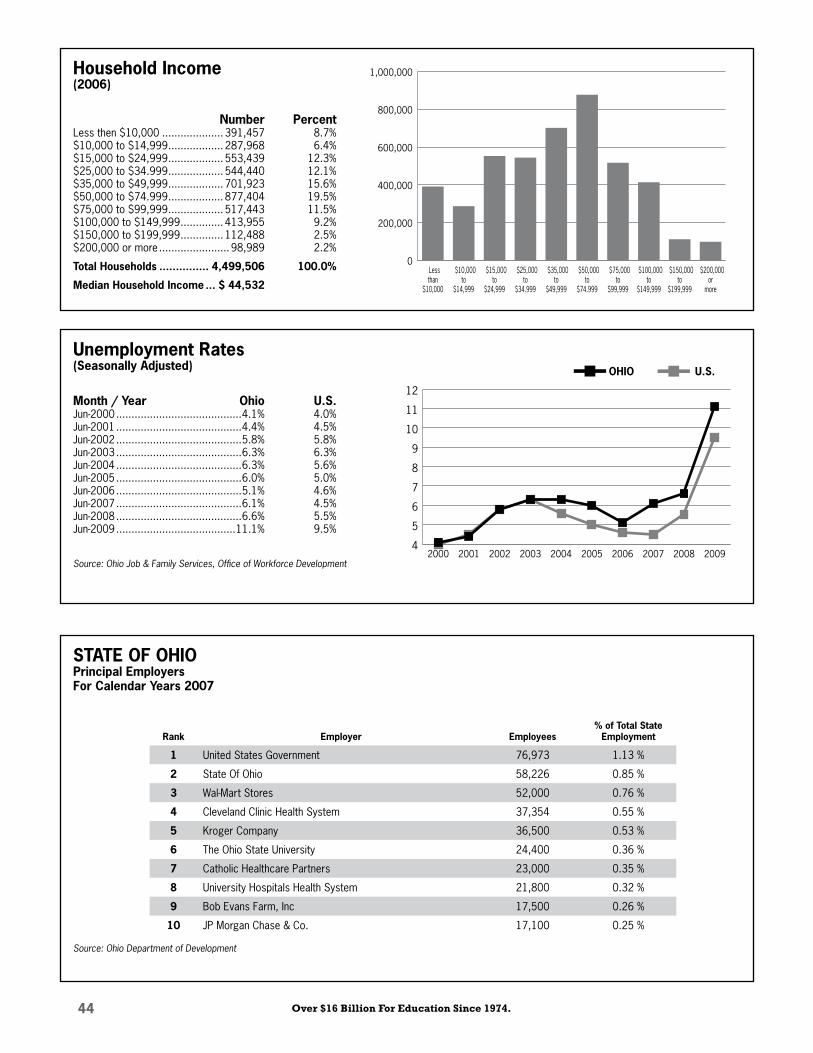
�� Over $16 Billion For Education Since 1974.
Household Income(�00�)
Number PercentLess then $10,000 .................... 391,457 8.7%$10,000 to $14,999 .................. 287,968 6.4%$15,000 to $24,999 .................. 553,439 12.3%$25,000 to $34.999 .................. 544,440 12.1%$35,000 to $49,999 .................. 701,923 15.6%$50,000 to $74.999 .................. 877,404 19.5%$75,000 to $99,999 .................. 517,443 11.5%$100,000 to $149,999 .............. 413,955 9.2%$150,000 to $199,999 .............. 112,488 2.5%$200,000 or more ....................... 98,989 2.2%
Total Households ............... �,�99,�0� �00.0%
Median Household Income ... $ ��,���
Unemployment Rates(Seasonally Adjusted)
Month / Year Ohio U.S.Jun-2000 .........................................4.1% 4.0%Jun-2001 .........................................4.4% 4.5%Jun-2002 .........................................5.8% 5.8%Jun-2003 .........................................6.3% 6.3%Jun-2004 .........................................6.3% 5.6%Jun-2005 .........................................6.0% 5.0%Jun-2006 .........................................5.1% 4.6%Jun-2007 .........................................6.1% 4.5%Jun-2008 .........................................6.6% 5.5%Jun-2009 .......................................11.1% 9.5%
Source: Ohio Job & Family Services, Office of Workforce Development
U.S.OHIO
4
5
6
7
8
9
10
11
12
2009200820072006200520042003200220012000
0
200,000
400,000
600,000
800,000
1,000,000
$200,000or
more
$150,000to
$199,999
$100,000to
$149,999
$75,000to
$99,999
$50,000to
$74.999
$35,000to
$49,999
$25,000to
$34.999
$15,000to
$24,999
$10,000to
$14,999
Lessthan
$10,000
STATE OF OHIOPrincipal EmployersFor Calendar Years �007
Rank Employer Employees% of Total State
Employment
� United States Government 76,973 1.13 %
� State Of Ohio 58,226 0.85 %
� Wal-Mart Stores 52,000 0.76 %
� Cleveland Clinic Health System 37,354 0.55 %
� Kroger Company 36,500 0.53 %
� The Ohio State University 24,400 0.36 %
7 Catholic Healthcare Partners 23,000 0.35 %
8 University Hospitals Health System 21,800 0.32 %
9 Bob Evans Farm, Inc 17,500 0.26 %
�0 JP Morgan Chase & Co. 17,100 0.25 %
Source: Ohio Department of Development
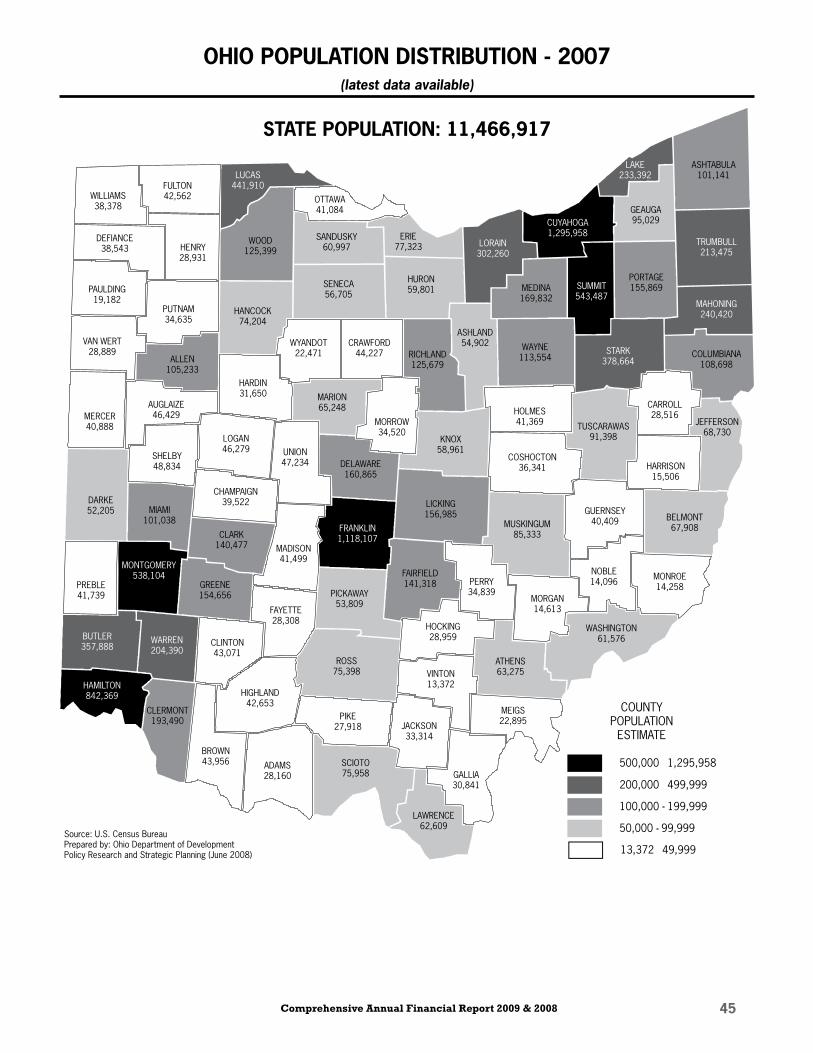
Comprehensive Annual Financial Report 2009 & 2008 ��
MERCER40,888
DARKE52,205
PREBLE41,739
MIAMI101,038
SHELBY48,834
AUGLAIZE46,429
LOGAN46,279
CHAMPAIGN39,522
CLARK140,477
GREENE154,656
WILLIAMS38,378
DEFIANCE38,543
PAULDING19,182
VAN WERT28,889
ALLEN105,233
PUTNAM34,635
HENRY28,931
FULTON42,562
LUCAS441,910
WOOD125,399
HANCOCK74,204
HARDIN31,650
OTTAWA41,084
SANDUSKY60,997
SENECA56,705
WYANDOT22,471
CUYAHOGA1,295,958
HURON59,801
RICHLAND125,679
ASHLAND54,902
ERIE77,323 LORAIN
302,260
MEDINA169,832
LAKE233,392
GEAUGA95,029
SUMMIT543,487
PORTAGE155,869
WAYNE113,554
STARK378,664
HOLMES41,369
ASHTABULA101,141
TRUMBULL213,475
MAHONING240,420
COLUMBIANA108,698
CARROLL28,516
HARRISON15,506
ROSS75,398
FAYETTE28,308
MADISON41,499
MARION65,248
UNION47,234 DELAWARE
160,865
MORROW34,520
KNOX58,961
LICKING156,985
FRANKLIN1,118,107
PICKAWAY53,809
COSHOCTON36,341
MUSKINGUM85,333
FAIRFIELD141,318
SCIOTO75,958
PIKE27,918
GUERNSEY40,409 BELMONT
67,908
MONROE14,258
WASHINGTON61,576
NOBLE14,096
MORGAN14,613
PERRY34,839
HOCKING28,959
ATHENS63,275
MEIGS22,895
VINTON13,372
JACKSON33,314
GALLIA30,841
LAWRENCE62,609
BUTLER357,888
HAMILTON842,369
WARREN204,390
CLINTON43,071
HIGHLAND42,653
BROWN43,956 ADAMS
28,160
MONTGOMERY538,104
CLERMONT193,490
CRAWFORD44,227
TUSCARAWAS91,398
JEFFERSON68,730
COUNTYPOPULATION
ESTIMATE
Source: U.S. Census BureauPrepared by: Ohio Department of DevelopmentPolicy Research and Strategic Planning (June 2008)
OHIO POPULATION DISTRIBUTION - �007 (latest data available)
STATE POPULATION: ��,���,9�7
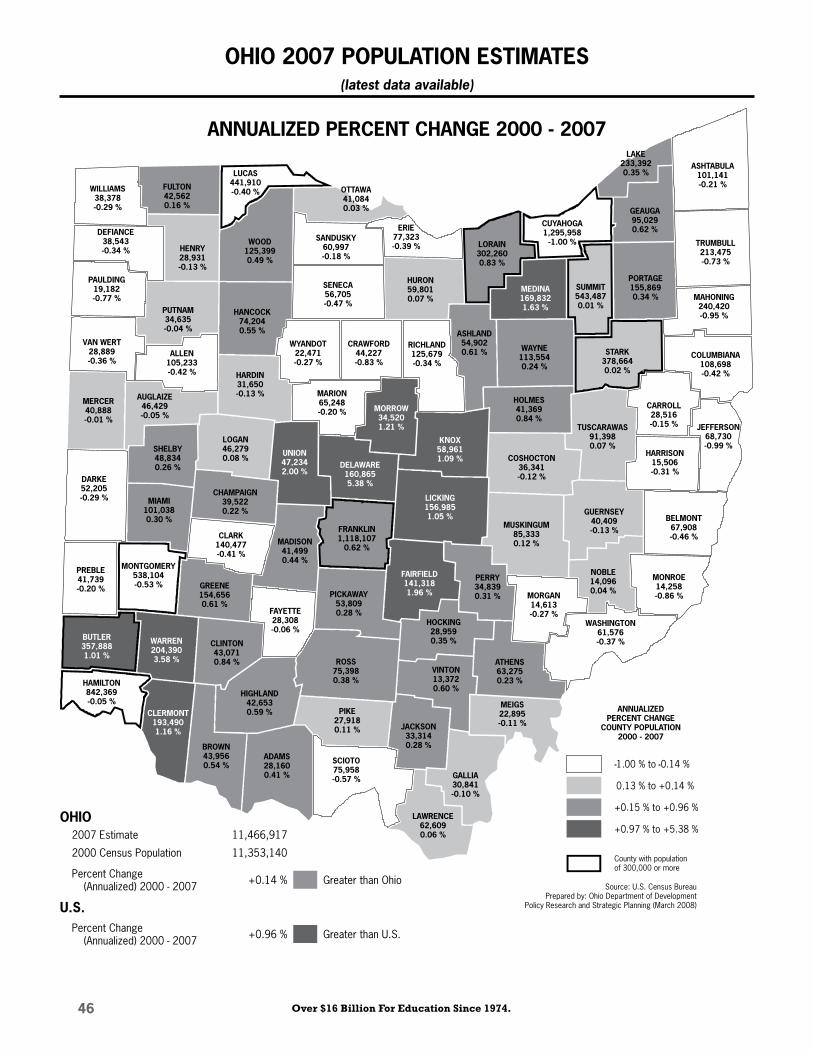
�� Over $16 Billion For Education Since 1974.
OHIO �007 POPULATION ESTIMATES (latest data available)
ANNUALIZED PERCENT CHANGE �000 - �007
ANNUALIZEDPERCENT CHANGE
COUNTY POPULATION2000 - 2007
MERCER40,888-0.01 %
DARKE52,205-0.29 %
PREBLE41,739-0.20 %
MIAMI101,0380.30 %
SHELBY48,8340.26 %
AUGLAIZE46,429-0.05 %
LOGAN46,2790.08 %
CHAMPAIGN39,5220.22 %
CLARK140,477-0.41 %
GREENE154,6560.61 %
WILLIAMS38,378-0.29 %
DEFIANCE38,543-0.34 %
PAULDING19,182-0.77 %
VAN WERT28,889-0.36 %
ALLEN105,233-0.42 %
PUTNAM34,635-0.04 %
HENRY28,931-0.13 %
FULTON42,5620.16 %
LUCAS441,910-0.40 %
WOOD125,3990.49 %
HANCOCK74,2040.55 %
HARDIN31,650-0.13 %
OTTAWA41,0840.03 %
SANDUSKY60,997-0.18 %
SENECA56,705-0.47 %
WYANDOT22,471-0.27 %
CUYAHOGA1,295,958
-1.00 %
HURON59,8010.07 %
RICHLAND125,679-0.34 %
ASHLAND54,9020.61 %
ERIE77,323-0.39 % LORAIN
302,2600.83 %
MEDINA169,8321.63 %
LAKE233,3920.35 %
GEAUGA95,0290.62 %
SUMMIT543,4870.01 %
PORTAGE155,8690.34 %
WAYNE113,5540.24 %
STARK378,6640.02 %
HOLMES41,3690.84 %
ASHTABULA101,141-0.21 %
TRUMBULL213,475-0.73 %
MAHONING240,420-0.95 %
COLUMBIANA108,698-0.42 %
CARROLL28,516-0.15 %
HARRISON15,506-0.31 %
ROSS75,3980.38 %
FAYETTE28,308-0.06 %
MADISON41,4990.44 %
MARION65,248-0.20 %
UNION47,2342.00 %
DELAWARE160,8655.38 %
MORROW34,5201.21 %
KNOX58,9611.09 %
LICKING156,9851.05 %
FRANKLIN1,118,107
0.62 %
PICKAWAY53,8090.28 %
COSHOCTON36,341-0.12 %
MUSKINGUM85,3330.12 %
FAIRFIELD141,3181.96 %
SCIOTO75,958-0.57 %
PIKE27,9180.11 %
GUERNSEY40,409-0.13 %
BELMONT67,908-0.46 %
MONROE14,258-0.86 %
WASHINGTON61,576-0.37 %
NOBLE14,0960.04 %MORGAN
14,613-0.27 %
PERRY34,8390.31 %
HOCKING28,9590.35 %
ATHENS63,2750.23 %
MEIGS22,895-0.11 %
VINTON13,3720.60 %
JACKSON33,3140.28 %
GALLIA30,841-0.10 %
LAWRENCE62,6090.06 %
BUTLER357,8881.01 %
HAMILTON842,369-0.05 %
WARREN204,3903.58 %
CLINTON43,0710.84 %
HIGHLAND42,6530.59 %
BROWN43,9560.54 %
ADAMS28,1600.41 %
MONTGOMERY538,104-0.53 %
CLERMONT193,4901.16 %
CRAWFORD44,227-0.83 %
TUSCARAWAS91,3980.07 %
JEFFERSON68,730-0.99 %
Source: U.S. Census BureauPrepared by: Ohio Department of Development
Policy Research and Strategic Planning (March 2008)
OHIO2007 Estimate 11,466,917
2000 Census Population 11,353,140
Percent Change(Annualized) 2000 - 2007 +0.14 % Greater than Ohio
U.S.Percent Change
(Annualized) 2000 - 2007 +0.96 % Greater than U.S.
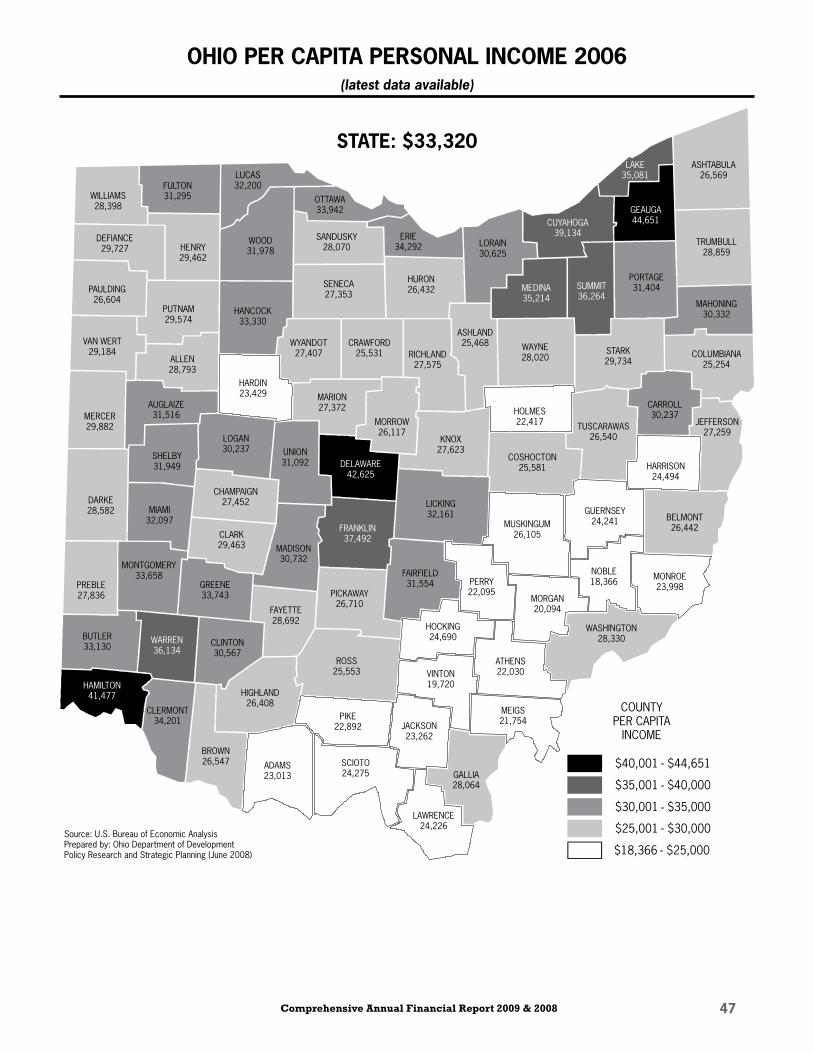
Comprehensive Annual Financial Report 2009 & 2008 �7
MERCER29,882
DARKE28,582
PREBLE27,836
MIAMI32,097
SHELBY31,949
AUGLAIZE31,516
LOGAN30,237
CHAMPAIGN27,452
CLARK29,463
GREENE33,743
WILLIAMS28,398
DEFIANCE29,727
PAULDING26,604
VAN WERT29,184
ALLEN28,793
PUTNAM29,574
HENRY29,462
FULTON31,295
LUCAS32,200
WOOD31,978
HANCOCK33,330
HARDIN23,429
OTTAWA33,942
SANDUSKY28,070
SENECA27,353
WYANDOT27,407
CUYAHOGA39,134
HURON26,432
RICHLAND27,575
ASHLAND25,468
ERIE34,292 LORAIN
30,625
MEDINA35,214
LAKE35,081
GEAUGA44,651
SUMMIT36,264
PORTAGE31,404
WAYNE28,020
STARK29,734
HOLMES22,417
ASHTABULA26,569
TRUMBULL28,859
MAHONING30,332
COLUMBIANA25,254
CARROLL30,237
HARRISON24,494
ROSS25,553
FAYETTE28,692
MADISON30,732
MARION27,372
UNION31,092 DELAWARE
42,625
MORROW26,117
KNOX27,623
LICKING32,161
FRANKLIN37,492
PICKAWAY26,710
COSHOCTON25,581
MUSKINGUM26,105
FAIRFIELD31,554
SCIOTO24,275
PIKE22,892
GUERNSEY24,241 BELMONT
26,442
MONROE23,998
WASHINGTON28,330
NOBLE18,366
MORGAN20,094
PERRY22,095
HOCKING24,690
ATHENS22,030
MEIGS21,754
VINTON19,720
JACKSON23,262
GALLIA28,064
LAWRENCE24,226
BUTLER33,130
HAMILTON41,477
WARREN36,134
CLINTON30,567
HIGHLAND26,408
BROWN26,547 ADAMS
23,013
MONTGOMERY33,658
CLERMONT34,201
CRAWFORD25,531
TUSCARAWAS26,540
JEFFERSON27,259
COUNTYPER CAPITA
INCOME
Source: U.S. Bureau of Economic AnalysisPrepared by: Ohio Department of DevelopmentPolicy Research and Strategic Planning (June 2008)
OHIO PER CAPITA PERSONAL INCOME �00� (latest data available)
STATE: $��,��0

�8 Over $16 Billion For Education Since 1974.

The Ohio Lottery is an equal opportunity employer and service provider.
OvER $16 BiLLiOn FOR EduCATiOn SinCE 1974
Total Copies Printed: Publication date: 01/10
The Ohio Lottery615 West Superior AvenueCleveland, Ohio 44113-1879
1-800-686-4208www.ohiolottery.com
090707_OLC_CAFR 09_cover.indd 2 12/11/09 9:01:02 AM


![Winners List - Motor Car [ADN]](https://static.fdokumen.com/doc/165x107/633559773108fad7760fede0/winners-list-motor-car-adn.jpg)