Our Place in Space - Philippine Space Agency
64
Our Place in Space Space S&T and Applications in the Philippines VOLUME 1 Space Data Mobilization 2016 to 2020
-
Upload
khangminh22 -
Category
Documents
-
view
1 -
download
0
Transcript of Our Place in Space - Philippine Space Agency

Our Place in SpaceSpace S&T and Applications in the Philippines
VOLUME 1
Space Data Mobilization
2016 to 2020


VOLUME 1 3
Foreword Space is the expanse above us, which can bridge our islands, communities and wherever Filipinos may go on Earth. Space travel and rockets uplift us, figuratively, in mind and spirit (and literally). Being in space, building in space, with its high vantage point, empowers us.
The Philippines has taken significant steps in space science and technology applications (SSTA) over the period 2014-2020. A number of SSTA activities implemented as project-based initia-tives have been initiated and continue to be pursued with the support of the Department of Science and Technology’s (DOST) Grants-in-Aid (GIA). Projects such as the Philippine Scientific Earth Observation Microsatellite Program (PHL- Microsat) and its successor, the Space Technology and Applications Mastery, Inno-vation and Advancement Program (STAMINA4Space) have led to the development, launch, operation and utilization of the country’s own small satellites for scientific Earth observation, DIWATA-1 launched in 2016, followed by DIWATA-2 in 2018 and MAYA-1, the country’s first nanosatellite, also launched in 2018. DIWATA and MAYA provide a blueprint that enable the development of small satellites to be sustained, proliferated and localized in the coun-try. These achievements have enabled the Philippines to join the ranks of countries that not only own and operate satellites, but have been able to build and develop them.
Thes satellite development activities are joined by complementary ground infrastructure and services, such as multi-mission sat-ellite receiving stations, which we call the Philippine Earth Data Resource Observation (PEDRO) Center, as well as high perfor-mance computing (HPC) facilities for the processing, archiving and distribution of satellite images and other spaceborne data. There is also the Remote Sensing and Data Science Help Desk or DATOS, which have been developing a gamut of applications from the satellite image data. These investments have equipped the Philippines with a capacity to create and add value from space, specifically through the generation, processing, dissemination and utilization of data obtained by satellites and space infrastructure.
The success and value of these prior efforts confirmed that we need a dedicated and specialized agency to champion a national space program. On August 8, 2019, President Rodrigo Roa Dute-rte signed Republic Act No. 11363 or the “The Philippine Space Act”. By virtue of this law, the Philippine Space Agency or PhilSA was established to serve as the primary policy, planning, coordi-nating, implementing, and administrative entity of the Executive
Branch of the government that will plan, develop, and promote our national space program. The Philippine Space Act recognizes these prior efforts that have produced our emergent local tech-nological capacity in space. With foundational elements in capa-bilities, infrastructure and people in place, the PhilSA is therefore building from the ground up and not starting from scratch. The PhilSA’s succeeding programs shall grow, expand and nurture these resources so they can yield further socio-economic benefits and impact for Filipinos.
In Our Place in Space, we compile and select showcases from the prior initiatives in Space Science & Technology and Applications (SSTA) in the Philippines. These activities have been undertaken by different groups from the academe, research institutions and government agencies, which we acknowledge at the end of each of the three Volumes in the compilation. Each Volume highlights a different component of SSTA that contribute to the growth of the space ecosystem in the country. The simple and humble goal is to create better awareness of local SSTA capabilities and the benefits that they bring to Filipino society.
In coming up with the compilation, we considered the segmenta-tion of the space economy and industry into two complementary sectors: the “Upstream” and the “Downstream”. “Upstream space” activities consist of the design, assembly, integration and testing of satellites and other spacecraft and their payloads, systems, subsystems, and components. This also includes the infrastructure necessary to launch and operate them from Earth. In other words, the upstream segment is the sector of space that makes or manu-factures, controls and launches objects such as satellites, rovers, space probes and other spacecraft into space orbit. “Downstream space” uses these spacecraft and systems to deliver products and services for scientific, experimental and commercial use on Earth, such as telecommunications, navigation, surveillance and Earth observation, among others.
Our country has been an active users in the downstream of sat-ellites and space. That is, the utilization of and the applications arising from the data generated by satellites, such as images and other spaceborne data. That is valuable since the downstream is expected to largely account for the growth of the space sector and therefore its contributions to the economic growth of nations. Data and the resulting actionable information and intelligence is the currency of the knowledge economy. Current downstream activities in SSTA are discussed in Volume 1: Space Data Utilization.

OUR PLACE IN SPACE4
A strong presence in the space upstream sector is important for our country as well. The upstream involves components of the space value chain that offer a strategic advantage to those who master and control such technologies. For example, the detailed knowledge and competence on the upstream engagement serves as the basis for the development of standards and operations that influence the downstream, such as end user applications and the needs of satellite operators. Building space satellite payloads and buses equip us with the wherewithal to adapt to and anticipate evolving downstream requirements, thus the ability to customize solutions for existing and new downstream verticals. Building satellites enables us to understand the source of the solutions – the source of the data. Current upstream activities in SSTA in the Philippines are addressed primarily in Volume 2: Space Technology.
By engaging in both the upstream and downstream of space, we can instantiate a “vir-tuous cycle” in this exponentially growing and exciting new area that our country should nurture and feed. The virtuous cycle will enable us to develop endogenous S&T capacity that will supplant the vicious cycle of technological dependence.
The downstream and upstream SSTA activities that have catapulted our country’s capabilities in space need to be proliferated, disseminated and sustained. In Volume 3: Capacity-building, Outreach and Sustainability, we provide a window to the inward- and outward-facing initiatives aimed at developing people, institutions, linkages, partnerships and outreach activities. These activities are essential in cascading the gains and benefits obtained from our satellite development and space data mobilization efforts to society.
Finally, through this compilation, it is our aim to impart the PhilSA’s vision – A Filipino nation bridged, uplifted and empowered through the peaceful uses of outer space; and our mission – To promote and sustain a robust Philippine space ecosystem that adds and creates value in space for and from Filipinos and for the world.
By capturing the best (so far) of our fledgling Philippine space ecosystem, we hope that you will find this compilation not only informative, but also inspiring. Through these pages, we find and truly affirm Our Place in Space.
Joel Joseph S. Marciano, Jr. PhDDirector GeneralPhilippine Space Agency (PhilSA)
09 October 2020

VOLUME 1 5
Volume 1: Space Data Utilization provides examples of actual, real-world end use of spaceborne data, i.e. the downstream space segment, in the Philippines across various domains. Data from space can help uplift our condition and better our lives through data-driven and evidence-based policies. Amidst concerns in food security, satellites are able to gather relevant data through remote sensing of agricultural crops, watersheds, fisheries, forests and other natural resources. Through satellite connectivity, space can bridge Filipinos and our communities, especially the underserved or unserved populations in Geographically Isolated and Disadvan-taged Areas (GIDA). In promoting better health services amidst the lack of health workers, satellite coverage enables medical and public health services, through telemedicine.
Our country has been an active user of downstream of satellites and space. That is, the utilization of and the applications arising from the data generated by satellites, such as images and other spaceborne data. This is a valuable endeavor since the down-stream is expected to largely account for the growth of the space sector and therefore its contributions to the economic growth of nations. Data and the resulting actionable information and intelli-gence is the currency of the knowledge economy. The use cases in this Volume focus on the application of satellite images to generate actionable information across applications such as disaster risk management, agriculture and fisheries, natural and built environ-ment monitoring, defense and security, and planning and econo-metrics.
Prologue

OUR PLACE IN SPACE6
This page is intentionally left blank.
VOLUME 1 7
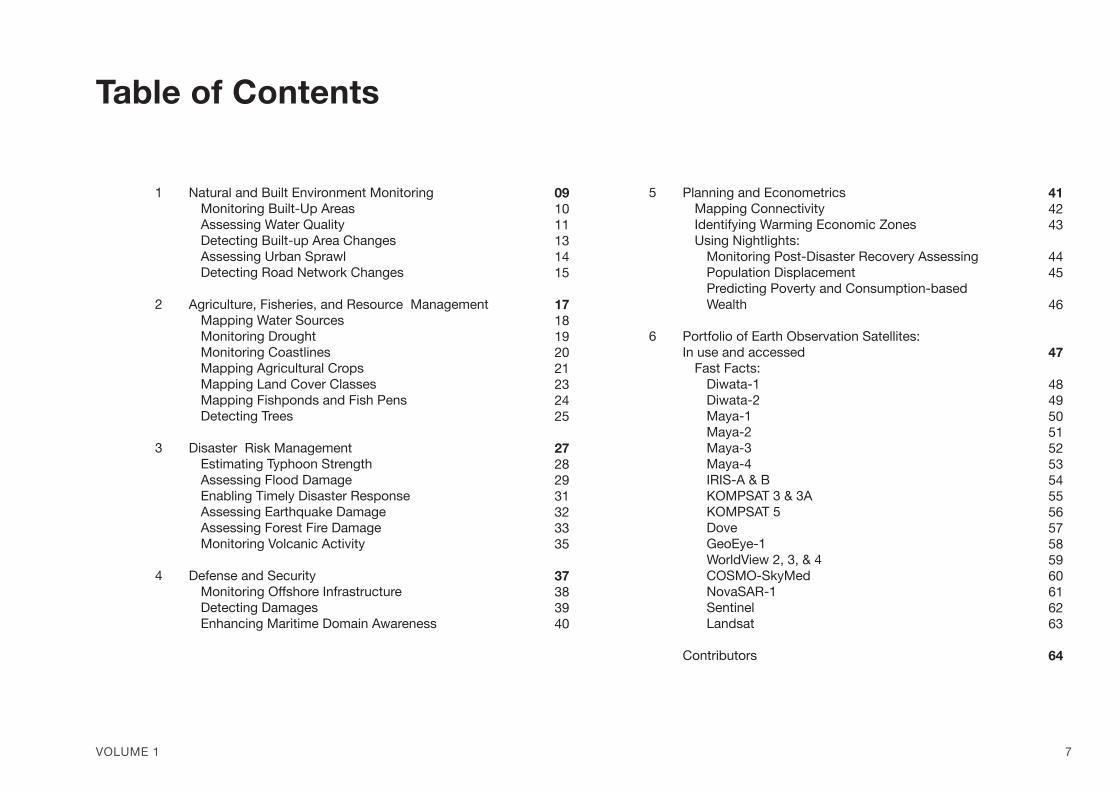
Table of Contents
Natural and Built Environment MonitoringMonitoring Built-Up AreasAssessing Water QualityDetecting Built-up Area ChangesAssessing Urban SprawlDetecting Road Network Changes
Agriculture, Fisheries, and Resource ManagementMapping Water SourcesMonitoring DroughtMonitoring CoastlinesMapping Agricultural CropsMapping Land Cover Classes Mapping Fishponds and Fish PensDetecting Trees
Disaster Risk ManagementEstimating Typhoon StrengthAssessing Flood DamageEnabling Timely Disaster ResponseAssessing Earthquake Damage Assessing Forest Fire Damage Monitoring Volcanic Activity
Defense and SecurityMonitoring Offshore InfrastructureDetecting DamagesEnhancing Maritime Domain Awareness
Planning and EconometricsMapping ConnectivityIdentifying Warming Economic Zones Using Nightlights:
Monitoring Post-Disaster Recovery AssessingPopulation Displacement Predicting Poverty and Consumption-based Wealth
Portfolio of Earth Observation Satellites:In use and accessed
Fast Facts:Diwata-1Diwata-2Maya-1Maya-2Maya-3Maya-4IRIS-A & BKOMPSAT 3 & 3AKOMPSAT 5DoveGeoEye-1WorldView 2, 3, & 4COSMO-SkyMedNovaSAR-1SentinelLandsat
Contributors
1
2
3
4
5
6
0910 11131415
1718192021232425
27282931323335
37383940
4142 43 4445 46
47 48495051525354555657585960616263
64

OUR PLACE IN SPACE8
This page is intentionally left blank.

VOLUME 1 9
Natural and Built Environment Monitoring
Monitoring Built-Up Areas
Assessing Water Quality
Detecting Built-Up Area Changes
Assessing Urban Sprawl
Detecting Road Network Changes
Monitoring Light Pollution
1

1 NATURAL AND BUILT ENVIRONMENT MONITORING
OUR PLACE IN SPACE10
N N
MonitoringBuilt-Up AreasNew Developmentsin Boracay
These satellite images show the changes in the urban sprawl of Boracay island from 2013 to 2017. Through satellite images, researchers monitored the decline of vegetation and the rise of built-up areas in the island.
Boracay island – a famous tourist destination – underwent a six-month rehabilitation program in 2018. These images were used by the Boracay rehabilitation monitoring team.
Satellite: Rapid EyeAccessed via: DOST-ASTI PEDRO CenterCapture date: 10 February 2013Payload: OpticalResolution: 5 mBasemap: PhilGIS, Google Earth
Satellite: Rapid EyeAccessed via: DOST-ASTI PEDRO CenterCapture date: 10 February 2017Payload: OpticalResolution: 5 mBasemap: PhilGIS, Google Earth
56.78%40.10%
35.27%57.65%
02013 2017
10203040506070
Comparison between 2013 & 2017
Vegetated Areas
LEGEND
Built-up Areas
1 2
21

1 NATURAL AND BUILT ENVIRONMENT MONITORING
VOLUME 1 11
AssessingWater Quality
New Developments
Formazine Nephelometric Unit (FNU)
<4 >24
Analyzing Manila Bay’s water quality using satellite imagery is important in identifying how human activities affect coastal resource degradation. Turbidity, or the murkiness (versus clarity) of water, is one of the indicators studied here. Possible changes in turbidity or clarity of Manila Bay’s coastal waters before and after its rehabilitation as observed through images captured by Diwata-1 in 2018 (leftmost) and Diwata-2 in 2019 (rightmost). The Diwata-1 image shows murky waters at the mouth of Pasig River (red areas in the middle image). Additionally, monitoring this area at different times of the year can contribute to existing and future studies assessing the results of the ongoing Manila Bay rehabilitation efforts.
Satellite: Diwata-1Accessed via: STAMINA4SpaceCapture date: 19 February 2018Payload: Spaceborne Multispectral Imager (SMI)Resolution: 66mBasemap: PhilGISImage: Google Earth
Satellite: Diwata-1Accessed via: STAMINA4SpaceCapture date: 19 February 2018Payload: Spaceborne Multispectral Imager (SMI)Resolution: 66mBasemap: PhilGISImage: Google Earth
Satellite: Diwata-2Accessed via: STAMINA4SpaceCapture date: 05 June 2019Payload: Spaceborne Multispectral Imager (SMI)Resolution: 127mBasemap: PhilGISImage: Google Earth
True-Color Image Turbidity Map Turbidity Map
1 2 3
1 2 3
in Manila Bay

1 NATURAL AND BUILT ENVIRONMENT MONITORING
OUR PLACE IN SPACE12
AssessingWater Quality
Mapping Total Suspended Solids (TSS) in Laguna Lake
Using Diwata-1 and Sentinel-3 images, researchers have captured the total suspended solids (TSS) in Laguna de Bay at different times of the year. This technique of capturing several images at different times in a given period is called spatiotemporal monitoring. Diwata images can provide a spatially comprehensive assessment of water quality (see below) which is difficult and tedious to do through conventional water quality
Satellite: Diwata-1 and Sentinel-3Accessed via: STAMINA4SpacePayloads: Spaceborne Multispectral Imager (SMI) & Ocean and Land Color Imager (OLCI)Resolution: 66m and 300mBasemap: PhilGIS and Google EarthCapture dates and times indicated on the images
TSS (mg/L)
20 200
monitoring approach. “Hotspots” or areas with high, frequent TSS values can be easily identified from satellite images. This is crucial in identifying potential pollution sources and areas vulnerable to low dissolved oxygen, which may result to fish kill. Complementary use of Diwata imageries with other optical satellites such as Sentinel-3 may increase the temporal monitoring of Laguna Lake.
1
1

1 NATURAL AND BUILT ENVIRONMENT MONITORING
VOLUME 1 13
DetectingBuilt-Up Area Changes
Built-up areas inBaguio City
Maps of built-up areas show intensive use of the land covered by structures. They are generated to monitor the evolution of cities and settlements, including their characteristics, extent, and attributes. Built-up areas show the increase and expansion of large urban centers.
This map shows the urban density in Baguio City. Changes can be analyzed throughout time by using various processing techniques and models like Artificial Intelligence (AI) to predict the urban extent in the future.
Built-up areas were generated using three (3) Planetscope.
Built-up Areas
LEGEND
N
Cartographic InformationCoordinate System: WGS 84/UTM0 0.45 0.9 1.35 1.8 km
Satellite: Planet DoveAccessed via: DOST-ASTI PEDRO CenterPayload: Optical Capture dates: 22 December 2016, 11 May 2017, and 23 June 2018Resolution: 3mBasemap: OpenStreetMap (inset)
1
1

1 NATURAL AND BUILT ENVIRONMENT MONITORING
OUR PLACE IN SPACE14
AssessingUrban Sprawl
Urban Sprawl inDavao City
The image shows the increase of settlements in Davao City from 2013 to 2016.
Using historical images as training materials, Artificial Intelligence (AI) models were trained to differentiate changes in land cover using satellite images. Employing automated and unsupervised processing that would accelerate extraction of images is useful for further studies such as projecting growth of urban areas.
Sizes larger than the original 30m resolution were digitized and used as training data.
Land Area
LEGEND
2013 Built-up Areas2016 Built-up Areas
N
Satellite: Landsat 8Capture date: Whole year predic-tions (2013 and 2016)Accessed via: DOST-ASTI PEDRO Center
Multi-temporal Optical Imagery
Payload: Optical Resolution: 3mBasemap: OpenStreetMap
1
1

1 NATURAL AND BUILT ENVIRONMENT MONITORING
VOLUME 1 15
DetectingRoad Network Changes
Road Network ofMuntinlupa City,Metro Manila
Through machine learning—a component of Artificial Intelligence (AI)—road features that are continuous, long, and with homogenous hue throughout their length are digitized and used as training data to detect road network changes.
AI is able to simulate human vision to detect features, and can also see beyond what is visible to the naked eye. This allows it to detect and isolate these features more accurately.
Cartographic InformationCoordinate System: WGS 84/UTM0 0.15 0.3 0.45 0.6 km
Roads
LEGEND NSatellite: Planetscope Accessed via: DOST-ASTI PEDRO CenterCapture date: 30 April 2018 Payload: OpticalResolution: 3m
1
1

OUR PLACE IN SPACE16
This page is intentionally left blank.

VOLUME 1 17
Agriculture, Fisheries, and Resource Management
Mapping Water Sources
Monitoring Drought
Monitoring Coastlines
Mapping Agricultural Crops
Mapping Land Cover Classes
Mapping Fishponds and Fish Pens
Detecting Trees
2

OUR PLACE IN SPACE18
2 AGRICULTURE, FISHERIES, AND RESOURCE MANAGEMENT
MappingWater Sources
La Mesa Dam water level
To see the effects of El Niño on the La Mesa Dam, a time series of satellite images from December 2018 to March 2019 were analyzed. The images used Normalized Difference Water Index (NDWI) which highlights the change in the extent of the water surface area. This is then used to compute for an estimation of the volume of the water in the dam.
March 10, 2019
10 March 2019
Extracted water features
January 17, 2019
17 January 2019
LEGEND
February 24, 2019 24 February 2019
January 4, 2019
February 8, 2019
December 18, 2018
18 December 2018
March 16, 2018
Satellite: PLANETSCOPEAccessed via: DOST-ASTI PEDROCenter Capture date: Dec 2018 to March 2019Payload: OpticalResolution: 3 mBasemap: OpenStreetMap
1N
0 250 500 m
1

VOLUME 1 19
2 AGRICULTURE, FISHERIES, AND RESOURCE MANAGEMENT
MonitoringDrought
Vegetation Health Index (VHI) of Occidental Mindoro
The VHI indicates whether or not an area is experiencing drought. “Low health” of a vegetated area denotes “high stress levels” of vegetation due to dryness and heat. This can be detected from satellite images. The more “stressed” the vegetation is, the more likely that it is experiencing drought.
During the agricultural drought in early 2019, the DATOS project acquired snapshots of the VHI of Mindoro Island for February 2 & 21, 2019, 2019, and March 9, 2019. Note the extreme “stress levels” experienced by the vegetation in Occidental Mindoro on the lower left (in red).
1
Satellite: Landsat 8Accessed via: DOST-ASTI PEDRO CenterCapture dates: 02 February 2019,21 February 2019, and 09 March 2019 Resolution: 30m
Multi-temporal Optical Imagery
1
1 - Extreme
LEGEND
2 - Severe
4 - Mild3 - Moderate
5 - None

OUR PLACE IN SPACE20
2 AGRICULTURE, FISHERIES, AND RESOURCE MANAGEMENT
MonitoringCoastlines
Double barrier reefin Bohol
It is important to monitor seagrasses, corals, mangroves, and sandy areas because they are home to various marine species. This area shown, which is under the National Integrated Protected Areas System (NIPAS), was mapped and processed to identify these features.
Constant monitoring of these sites helps us determine if there is a decline in the NIPAS site’s benthic habitats and at what rate the habitat is declining. This can then give us science-based recommendations for stricter protection, conservation, and rehabilitation if needed.
Satellite: Sentinel-2 MSIAccessed via: STAMINA4SpaceCapture date: March 23, 2019Resolution: ~127mBasemap: PhilGIS, Google Earth
1
Unclassified
Dense Seagrass
Sargassum
Corals
LEGEND
Bare Sand
Sparse Seagrass
Seagrass
WaterTurbid Water
1
N

VOLUME 1 21
2 AGRICULTURE, FISHERIES, AND RESOURCE MANAGEMENT
Mapping Agricultural Crops
Sugar Cane, Rice, and Corn Mapping
Research on remote sensing (RS) techniques allows for faster methods in mapping agricultural resources. In cooperation with the Department of Agriculture and Sugar Regulatory Administration, mapping these high-value crops using advanced RS methods would help streamline and hasten activities in inventory, yield projection, monitoring, data analysis, and assessment.
Cyan areas indicate plantations of high-value seasonal crops, such as sugarcane, rice, and corn. These can be identified through satellite images (temporal SAR) using automated remote sensing methods like time series analysis.
Satellite: Sentinel-1A, 1BLocation: Tarlac Mill DistrictAccessed via: DOST-ASTI PEDRO CenterCapture period: 01 November 2016 to 08 March 2018 Payload: SARResolution: 15 mBasemap: OpenStreetMap (inset)
Location: IsabelaSatellite: Sentinel-1A, 1BAccessed via: DOST-ASTI PEDRO CenterCapture period: 06 April 2017 to 12 June 2018 Payload: SARResolution: 15 mBasemap: OpenStreetMap (inset)
Location: IsabelaSatellite: Sentinel-1A, 1BAccessed via: DOST-ASTI PEDRO CenterCapture period: 06 April 2017 to 12 June 2018Payload: SARResolution: 15 mBasemap: OpenStreetMap (inset)
Multi-temporal SAR Imagery Multi-temporal SAR Imagery Multi-temporal SAR Imagery1 2
2
3
31
LEGEND
OUR PLACE IN SPACE22
2 AGRICULTURE, FISHERIES, AND RESOURCE MANAGEMENT
Mapping Agricultural Crops
Rice Mapping in Region VI
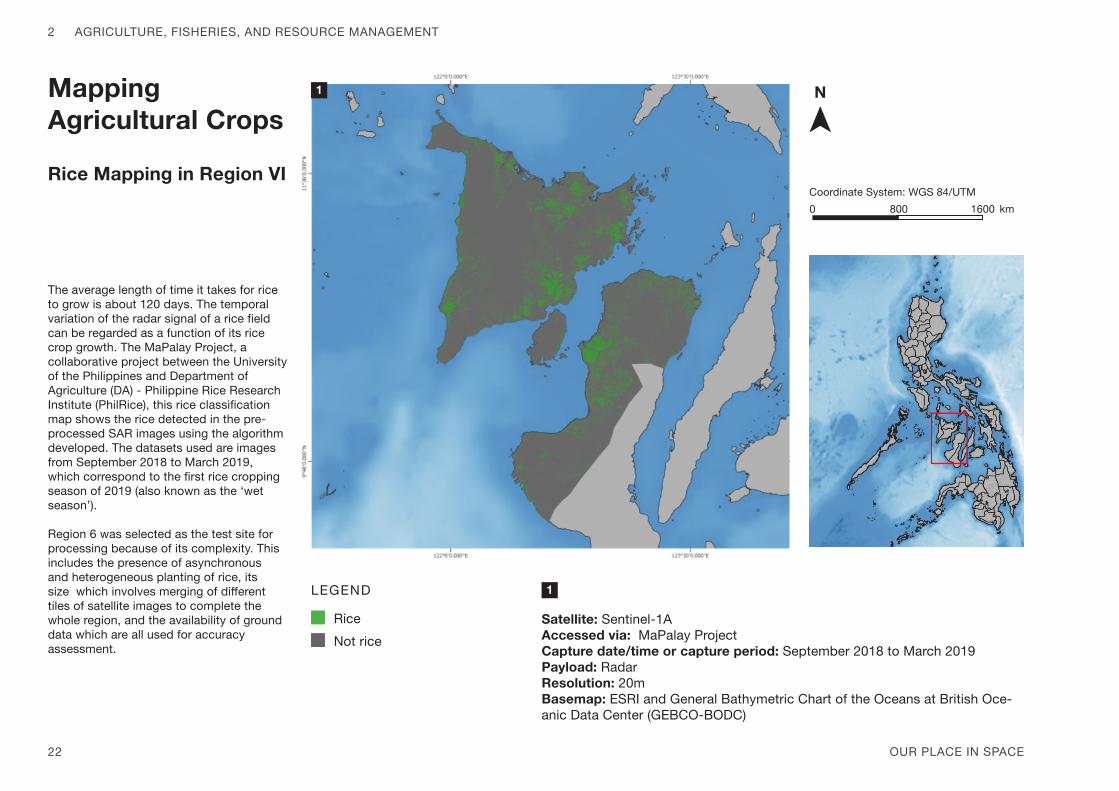
The average length of time it takes for rice to grow is about 120 days. The temporal variation of the radar signal of a rice field can be regarded as a function of its rice crop growth. The MaPalay Project, a collaborative project between the University of the Philippines and Department of Agriculture (DA) - Philippine Rice Research Institute (PhilRice), this rice classification map shows the rice detected in the pre-processed SAR images using the algorithm developed. The datasets used are images from September 2018 to March 2019, which correspond to the first rice cropping season of 2019 (also known as the ‘wet season’).
Region 6 was selected as the test site for processing because of its complexity. This includes the presence of asynchronous and heterogeneous planting of rice, its size which involves merging of different tiles of satellite images to complete the whole region, and the availability of ground data which are all used for accuracy assessment.
Satellite: Sentinel-1AAccessed via: MaPalay ProjectCapture date/time or capture period: September 2018 to March 2019Payload: RadarResolution: 20mBasemap: ESRI and General Bathymetric Chart of the Oceans at British Oce-anic Data Center (GEBCO-BODC)
1
Rice
LEGEND
Not rice
Coordinate System: WGS 84/UTM0 800 km1600
N1

VOLUME 1 23
2 AGRICULTURE, FISHERIES, AND RESOURCE MANAGEMENT
Mapping Land Cover Classes
Butuan City,Agusan del Norte
With the increasing availability of Earth observation data such as those in the form of satellite images, deep learning methods (e.g. AI & Convolutional Neural Networks) have shown promising results in identifying the physical aspect of the earth’s surface (land cover). Through these methods and automated systems developed by the DATOS Project, updating of land cover classifications can now be expedited.
In partnership with NAMRIA, different models were created for each class and were later merged to create a land cover map.
Satellite: Planetscope ImageAccessed via: DOST-ASTI PEDRO CenterCapture date: August 25, 2017Payload: OpticalResolution: 3mBasemap: OpenStreetMap
1
Roads
Water
LEGEND
Bare soilBuilt-upVegetation
N
Cartographic InformationCoordinate System: WGS 84/UTM0 0.35 0.7 1.05 1.4 km
1

OUR PLACE IN SPACE24
2 AGRICULTURE, FISHERIES, AND RESOURCE MANAGEMENT
Mapping Fish Ponds andFish Pens
Nationwideaquaculturemapping
Aquaculture research and operations have begun adopting technologies, such as Artificial Intelligence, in accounting, mapping, and monitoring nationwide fish ponds and fish pens facilities.
DOST-ASTI conducts research in partnership with the Bureau of Fisheries and Aquatic Resources (BFAR) of the Department of Agriculture to assist them in creating a nationwide inventory that can be used to monitor fish pens and fish ponds in over highly dense areas all over the country.
Location: Laguna LakeSatellite: Sentinel-1Accessed via: DOST-ASTI PEDRO CenterCapture date: June 2018 Payload: SARResolution: 15mBasemap: OpenStreetMap (inset)
Location: Laguna LakeSatellite: Sentinel-1Accessed via: DOST-ASTI PEDRO CenterCapture date: June 2018 Payload: SARResolution: 15mBasemap: OpenStreetMap (inset)
1
22
1
Detected fishpen and dish cages
LEGEND

VOLUME 1 25
2 AGRICULTURE, FISHERIES, AND RESOURCE MANAGEMENT
Satellite: Digital GlobeAccessed via: DOST-ASTI PEDRO CenterCapture date : May 2018 Payload: OpticalResolution: 0.5 mBasemap: OpenStreetMap (inset)
Coconut trees
LEGEND
DetectingTrees
Coconut trees inDavao City
Coconuts account for 25% of total agricultural land in the country, playing an important role in the Philippine’s national economy . It remains to be a major export, contributing 3.6% of the country’s gross value-added in agriculture. However, according to reports from Philippine Coconut Authority, coconut production had been stagnant.
With the available image processing techniques and earth observation data from DOST-ASTI, damage detection and rapid inventory of coconut trees in a given area is now possible. Artificial Intelligence can be used on earth observation data to detect and map distinct features from satellite images.
1
1
N
Cartographic InformationCoordinate System: WGS 84/UTM0 0.01 0.02 0.03 0.04 km

OUR PLACE IN SPACE26
2 AGRICULTURE, FISHERIES, AND RESOURCE MANAGEMENT
DetectingTrees
Satellite Detection of Fruit Bearing Trees
According to the Department of Agriculture, the volume of production and yield of mango have significantly deteriorated over the years. Despite hectares of mango farms around the country, there is no sufficient data on mango tree inventory. With the available image processing techniques and Earth observation data from DOST-ASTI, a rapid inventory of mango trees in a given area as well as assigning their geographic coordinates for ground-truthing is now possible.
In an ongoing collaboration with the Bataan Peninsula State University, DOST-ASTI employs this research for the province-wide Mango Detection Project of Bataan (for inventory and potential damage assessment).
Mango trees
LEGENDSatellite: Digital GlobeAccessed via: DOST-ASTI PEDRO CenterCapture date: May 2018Payload: OpticalResolution: 0.5mBasemap: OpenStreetMap (inset)
1N
Cartographic InformationCoordinate System: WGS 84/UTM0 0.02 0.04 0.06 0.08 km
VHR Imagery

VOLUME 1 27
Disaster Risk Management
Estimating Typhoon Strength
Assessing Flood Damage
Enabling Timely Disaster Response
Assessing Earthquake Damage
Assessing Forest Fire Damage
Monitoring Volcanic Activity
3

OUR PLACE IN SPACE28
3 DISASTER RISK MANAGEMENT
Estimating Typhoon Strength
Typhoon Tisoy (Kammuri) over the Philippine Area of Responsibility (PAR)
While Diwata-1 and Diwata-2 are used for Earth Observation, they can also give us images that can be used to study atmospheric conditions like typhoons. These images of Typhoon Tisoy (Kammuri) were captured before it made landfall in Sorsogon on December 2, 2019. By analyzing the image captured by Diwata-2’s Wide Field Camera (WFC) further, researchers were able to estimate the intensity of the typhoon.
Based on the presence of a well-defined eye and curved rain band patterns estimates a Current Intensity (CI) number of 4.5, which is equivalent to a maximum sustained winds of 143 kph. This was validated in a weather bulletin released by the Philippine Atmospheric, Geophysical and Astronomical Services and Administration (PAGASA) released at 2:00 p.m. on December 2, where it reported a maximum sustained winds of 150 kph.
An RGB subset from Himawari-8 acquired on 02 December 2019 at 13:00 PHT.
The red circle indicates the extent of area captured using Diwata-2’s Wide Field Camera (WFC).
Satellite: Diwata-2Accessed via: STAMINA4Space Program Capture date: 09 December 2019 Payload: Wide Field Camera (WFC)Resolution: 7km
11
22

VOLUME 1 29
3 DISASTER RISK MANAGEMENT
AssessingFlood Damage
Aparri, Cagayan duringTyphoon Falcon
Comparing the pre-disaster and post-disaster images, areas affected by possible flooding were identified. These are the areas with more than 95% change in pixel identity.
21
N N1 2
Satellite: KOMPSAT-5Accessed via: DOST-ASTI PEDRO CenterCapture date: 16 July 2019Resolution: 2m
Satellite: KOMPSAT-5Accessed via: DOST-ASTI PEDRO CenterCapture date: 25 May 2018 Resolution: 2m
SAR Image SAR ImageRoad Networks
Possible Findings
Municipal Boundaries
LEGEND

OUR PLACE IN SPACE30
3 DISASTER RISK MANAGEMENT
AssessingFlood Damage
Flood Situation Map in Region 2
Areas in red were potentially-flooded areas in Northern Leyte during the onslaught of Tropical Storm Agaton (Bolaven) in January 2018.
The research employs the use of Convolutional Neural Networks in processing satellite images to detect potentially-flooded areas during hazard events.
The flood situation maps, generated every after extreme weather events, are sent to NDRRMC, OCD, DOST, and affected LGUs to aid in their damage assessment efforts.
Satellite: Sentinel-1A, 1B Accessed via: DOST-ASTI PEDRO CenterCapture date and time: 10 April 2018, 22 April 2018, 30 December 2016, approximately 6:00 PM PHTResolution: 15mBasemap: OpenStreetMap
1 Multi-temporal SAR Imagery
1
Potentially-flooded areas
LEGENDN
VOLUME 1 31
3 DISASTER RISK MANAGEMENT
Enabling Timely Disaster Response
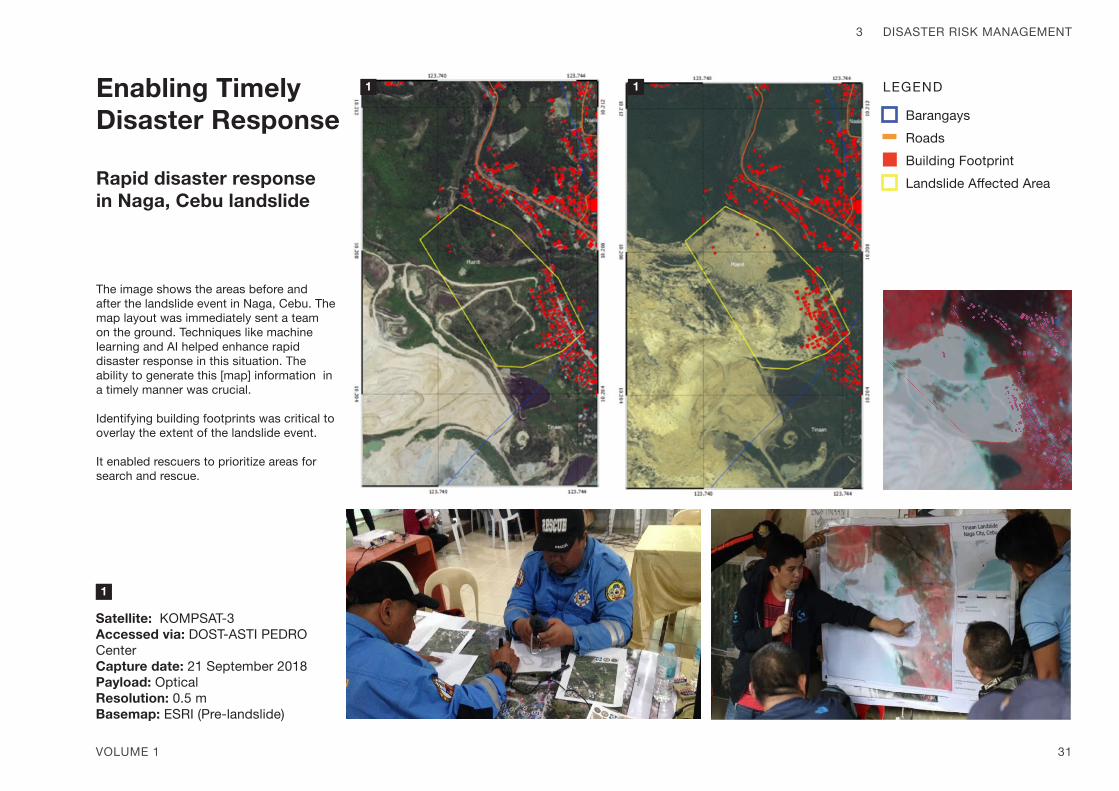
Rapid disaster response in Naga, Cebu landslide
The image shows the areas before and after the landslide event in Naga, Cebu. The map layout was immediately sent a team on the ground. Techniques like machine learning and AI helped enhance rapid disaster response in this situation. The ability to generate this [map] information in a timely manner was crucial.
Identifying building footprints was critical to overlay the extent of the landslide event.
It enabled rescuers to prioritize areas for search and rescue.
Satellite: KOMPSAT-3Accessed via: DOST-ASTI PEDRO CenterCapture date: 21 September 2018 Payload: OpticalResolution: 0.5 mBasemap: ESRI (Pre-landslide)
1
1 1
Barangays
Building FootprintLandslide Affected Area
LEGEND
Roads

OUR PLACE IN SPACE32
3 DISASTER RISK MANAGEMENT
AssessingEarthquakeDamage
Rapid detection and mapping of earthquake-induced landslides in Makilala, Cotabato
The image shows the areas potentially affected by earthquake-induced landslides in Makilala, Cotabato. Artificial Intelligence (AI) models were used to predict the bare soil and vegetation cover from Planetscope satellite images. Areas with changes from vegetation to bare soil are interpreted as the potential landslide areas. The hazard event was triggered by multiple quakes that hit large parts of Mindanao in 29-31 October 2019.
Identifying the extent of landslides through advanced image processing techniques immediately after the event can potentially aid in the rapid damage assessment and response operations of DRRM actors on the ground.
This image was shared with Philippine Institute of Volcanology and Seismology (PHIVOLCS) and the Cotabato LGU.
Cartographic InformationCoordinate System: WGS 84/UTM Zone 51N0 1 2 3 4 km
Satellite: PlanetscopeAccessed via: DOST-ASTI PEDRO CenterCapture date : 08 November 2019 Resolution: 3m
1
Landslide areas
LEGENDN
1

VOLUME 1 33
3 DISASTER RISK MANAGEMENT
AssessingForest FireDamage
Rapid detection of affected areas in Kabayan, Benguet
The image shows potentially burnt areas in Barangays Adaoay, Anchokey, and Kabayan Barrio in Kabayan, Benguet. The fire extents are detected by analyzing change in vegetation (NDVI) from Planetscope Images captured from 28 January and 22 February 2020.
NDVI or Normalized Difference Vegetation Index (NDVI) is an index used as an index indicator to determine features in an image with live green vegetation because vegetated areas have high values of NDVI. A drastic change (drop) in the NDVI values indicates activities contributing to the death or removal of live green vegetation.
Satellite: PlanetscopeAccessed via: DOST-ASTI PEDRO CenterCapture date : 28 January to 22 February 2020 Resolution: 3mBasemap: OpenStreetMap
1
Buildings/Houses
Barangay Boundary
Burnt Extent
Municipal Boundary
LEGENDN
1

OUR PLACE IN SPACE34
3 DISASTER RISK MANAGEMENT
AssessingForest FireDamage
Identifying other affected areas in Benguet using Diwata-2
In the same event mentioned previously, Diwata-2 was used to identify other areas in Benguet that were affected. Approximately 2,714.59 hectares were burnt, excluding other possibly undetected areas covered by clouds and their shadow. Affected areas include Itogon, Bokod, Kabayan, Kibungan, and some parts of Tuba. Maps like these, made using Support Vector Machine (SVM) and Burned Area Index (BAI), can be used to complement other data used by agencies tasked with post-disaster assessment and rehabilitation.
Satellite: Diwata-2Accessed via: STAMINA4SpaceCapture date: 29 February 2020Payload: Spaceborne Multispectral Imager (SMI)
Overlaid on an RGB basemap, using Support Vector Machine (SVM) and Burned Area Index (BAI)
True-Color/RGB image with identified burned areas
Diwata-2 Burned Area Map 1 2
Benguet municipal boundary
LEGEND
Burned areas

VOLUME 1 35
3 DISASTER RISK MANAGEMENT
Monitoring Volcanic Activity
Tracking Mayon Volcano’s eruption plume
Plumes and ashfall fromMayon Volcano eruption
When the Mayon Volcano erupted on January 2018, the PEDRO Center accessed optical images of Albay, Bicol captured by Planet’s Dove satellites (top image). The danger zones and affected areas were identified. These images were distributed to local government units and government agencies like the Philippine Institute of Volcanology and Seismology (PHIVOLCS) and National Disaster Risk Reduction and Management Council (NDRRMC) to assist in their operations.
The Diwata-1 image (bottom) was captured two weeks after the image shown above was captured. This image shows volcanic plumes coming from Mayon Volcano, vividly depicted as a bright white streak near the center of the image. Wind simulations show that the wind direction in the area during the acquisition time was coming from the northeast. This coincides with the observed dispersion of plumes relative to the volcano. Other portions of the image appear whitish due to the cloud cover passing over the captured areas at that time.
Satellite: PlanetScapeAccessed via: DOST-ASTI PEDRO Center Capture date:21 January 2018Payload: OpticalResolution:3m
Satellite: Diwata-1Accessed via: STAMINA4SpaceCapture date:30 January 2018Payload: Middle Field Camera (MFC)Resolution:287mBasemap:PhilGiS and Google Earth
1
22
1
N
Mayon Volcano
LEGEND

OUR PLACE IN SPACE36
3 DISASTER RISK MANAGEMENT
Monitoring Volcanic ActivityAshfall from Taal Volcano Eruption last January 2020
The extent of the ashfall from the Taal Volcano eruption may be used by LGUs for post-disaster resource prioritization. For example, the ashfall reaching bodies of water such as Laguna de Bay may induce a change in its water quality.
Satellite: KOMPSAT-3AAccessed via: DOST-ASTI PEDRO CenterCapture date: 05 April 2019Payload: KOMPSAT-3Resolution: 70 cmBasemap: OpenStreetMap
Satellite: KOMPSAT-3AAccessed via: DOST-ASTI PEDRO CenterCapture date: 16 January 2020Payload: KOMPSAT-3Resolution: 70 cmBasemap: OpenStreetMap
Satellite: KOMPSAT-3AAccessed via: DOST-ASTI PEDRO CenterCapture date: 05 April 2019Payload: KOMPSAT-3Resolution: 70 cmBasemap: OpenStreetMap
Satellite: KOMPSAT-3AAccessed via: DOST-ASTI PEDRO CenterCapture date: 16 January 2020Payload: KOMPSAT-3Resolution: 70 cmBasemap: OpenStreetMap
Optical Image
Emissions of the Taal Volcano Pre- and Post-Disaster Images
Optical Image Optical Image Optical Image1
1
2
2
3
3
4
4

VOLUME 1 37
Defense and Security
Monitoring Offshore Infrastructure
Detecting Damages
Enhancing Maritime Domain Awareness
4

OUR PLACE IN SPACE38
4 DEFENSE AND SECURITY
Monitoring Offshore Infrastructure
Infrastructure inMischief Reef, Subi Reef, and Fiery Cross Reef
The Philippines is a mission partner in the NovaSAR-1 satellite, which has Synthetic Aperture Radar (SAR) imaging capability. As a mission partner, the country can undertake data tasking and acquisition, allowing access to NovaSAR-1 SAR raw data and image processing for various applications. SAR is ideal for continuous monitoring of tropical countries like the Philippines for its ability to penetrate clouds, allowing us to capture clear images even on cloudy skies. Shown in this picture are details of built infrastructure such as those in offshore islands.
In the figure below, we compared images from an optical satellite and NovaSAR- 1. Due to its cloud penetrating capability, images from NovaSAR-1 gave us an unobstructed view of the built infrastructure on the offshore islands.
Satellite: NovaSARCapture date: 19 March 2020, 11:04:04 AM PHT Accessed via: SiyaSAT PortalPayload: Stripmap_HH Resolution: 6m
Satellite: NovaSARCapture date: 01 December 2019, 10:06:13 AM PHT Accessed via: SiyaSAT PortalPayload: Stripmap_HH Resolution: 6m
Satellite: NovaSARCapture date: 07 January 2020, 10:06:13 AM PHT Accessed via: SiyaSAT PortalPayload: Stripmap_HH Resolution: 6m
Mischief Reef Subi Reef Fiery Cross Reef1
1
1
2
2
2
3
3
3

VOLUME 1 39
4 DEFENSE AND SECURITY
Detecting Damages
Prototype damage detection using Artificial Intelligence (AI) inMarawi City
AI is capable of analyzing spatial patterns, shapes and forms. With this capability, it is able to identify damaged areas due to their non-uniform shapes or forms.
Satellite: WorldviewAccessed via: DOST-ASTI PEDRO CenterCapture date: April 2018Resolution: 0.5mBasemap: OpenStreetMap (inset)
VHR Optical Imagery1
1
Cartographic InformationCoordinate System: WGS 84/UTM0 0.01 0.02 0.03 0.04 km
Damaged areas
LEGENDN
OUR PLACE IN SPACE40
4 DEFENSE AND SECURITY
Enhancing Maritime Domain Awareness
Detecting ships in Balacbac Strait, Palawan
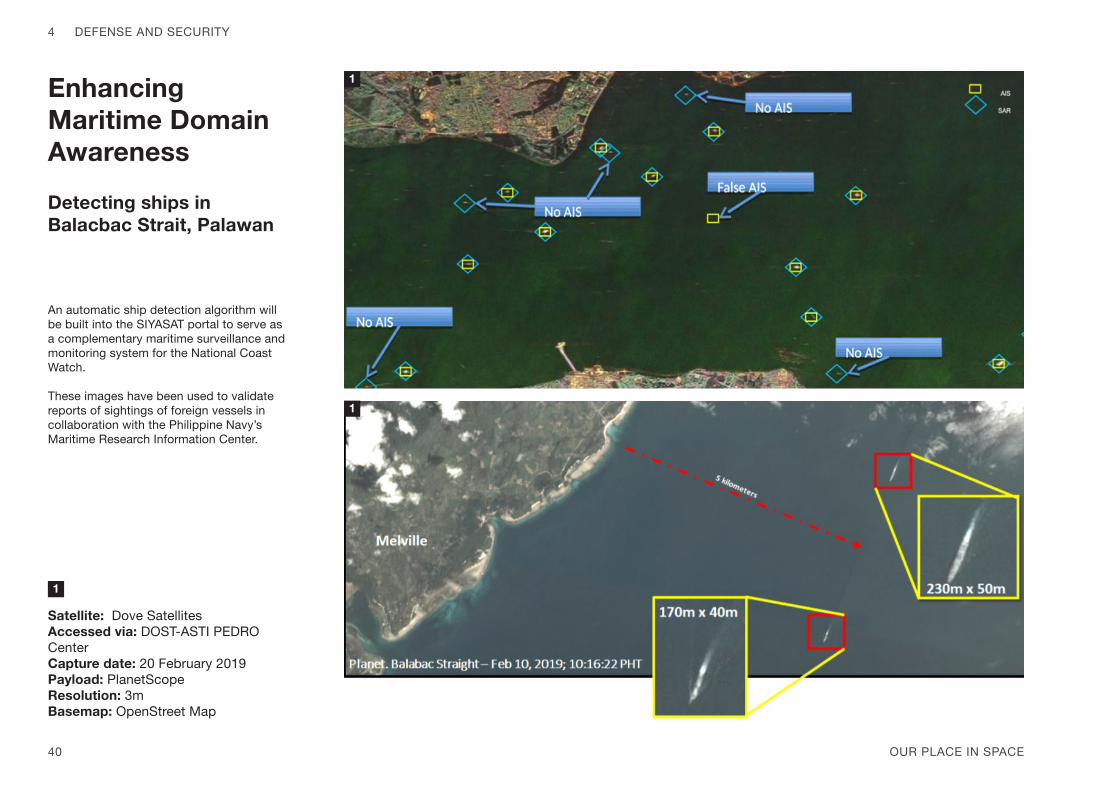
An automatic ship detection algorithm will be built into the SIYASAT portal to serve as a complementary maritime surveillance and monitoring system for the National Coast Watch.
These images have been used to validate reports of sightings of foreign vessels in collaboration with the Philippine Navy’s Maritime Research Information Center.
Satellite: Dove SatellitesAccessed via: DOST-ASTI PEDRO CenterCapture date: 20 February 2019 Payload: PlanetScopeResolution: 3m Basemap: OpenStreet Map
1
1
1

VOLUME 1 41
Planning and Econometrics
Mapping Connectivity
Identifying Warming Economic Zones
Monitoring Post-Disaster Recovery Using Nightlights
Assessing Population Displacement Using Nightlights
Predicting Poverty and Consumption-based Wealth Using Nightlights
5

OUR PLACE IN SPACE42
5 PLANNING AND ECONOMETRICS
Mapping Connectivity
Signal Assessment using Geospatial Analysis Project (SAGAP)
Currently, DOST-ASTI is conducting data collection and processing to examine the potential of radio frequency modelling and planning in assessing signal propagation. The study will use satellite images from the PEDRO Center, Diwata microsatellites, open source satellite data, and elevation data from the PHL-Lidar project and NAMRIA. The information generated from these assessments can be used by the Department of Information and Communications Technology (DICT), telecommunication companies, TV and radio operators, and other stakeholders operating wireless sensor networks and rural networks to strategically place their transmitters while considering radio parameters, geographical conditions, and possible obstructions.
Received power (dBm)
-109 to -105
-84 to -80
-94 to -90
-69 to -65
LEGEND
less than -110
-99 to -95
-74 to -70
-104 to -100
-79 to -75
-89 to -85
-64 to -100
Satellite: Advanced Land Observing Satellite “DAICHI” (ALOS) Accessed via: JAXA EORCCapture date and time: 2016 (release of global DSM)Payload: Panchromatic Remote-sensing
1 Instrument for Stereo Mapping (PRISM)Resolution: 30m (Digital Surface Model) Basemap source: ESRI
1

VOLUME 1 43
5 PLANNING AND ECONOMETRICS
Identifying Warming Economic Zones
Geospatial Assessment and Modelling of Urban Heat Islands (GUHeat) in Quezon City
This image is the daytime Land Surface Temperature (LST) map of Quezon City. Here, one can see which areas are hotter (dense clusters of establishments) as indicated in red. This is the work of Geospatial Assessment and Modelling of Urban Heat Islands in Philippine Cities (GUHeat), which studies thermal images from satellites to minimize the warming of urban areas or urban heat islands (UHIs), and even reverse it to decrease electricity consumption and air pollution, reduce health risks and diseases, that will result to greater livability.
The project was formed to find ways to mitigate the harmful effects of the rising temperatures in urban areas, assessing the development of urban heat islands in rapidly urbanizing and highly urbanized cities in the Philippines using satellites and modeling-simulation techniques.
For the microclimate modelling in Quezon city, specific sites were chosen within the Commercial Business District (CBD) of the city. The areas of study are the following: Timog Avenue, Tomas Morato, Visayas Avenue and UP Diliman.
0 1
1 : 120 000
2 3 4 5 km
38.5
22.5
LST
Quezon City
Boundary
LEGEND
N
Satellite: Sentinel 2-AAccessed via: Project GuHEAT Capture date: 05 February 2019Resolution: 30mBasemap: Google
1
(Degree Celsius)
1

OUR PLACE IN SPACE44
5 PLANNING AND ECONOMETRICS
Monitoring Post-Disaster Recovery Using NightlightsRehabilitation and recovery in Tacloban, Leyte after Typhoon Yolanda
Nightlights can also be used to track rehabilitation efforts done for disaster-stricken areas like Tacloban, after it was hit by Typhoon Yolanda (Haiyan) on November 2013.
Tacloban, Leyte Nightlights (2013 to 2015)
Nig
htlig
ht In
tens
ity (n
anoW
atts
/cm
2/sr
)
Time
Satellite: Suomi-National Polar Partnership satellite Accessed via: DOST-ASTI PEDRO Center Capture date: September 2013 to August 2015 Payload: Visible Infrared Imaging Radiometer Suite (VIIRS)
1
1
This graph shows that it took 20 months for Tacloban’s nighlight intensity to resume to its pre-typhoon record.

VOLUME 1 45
5 PLANNING AND ECONOMETRICS
Assessing Population Displacement Using NightlightsTracking electrification in Marawi City after the Marawi Siege
Marawi Change in Nightlights (May vs. June)
Marawi Nightlights (May 2017) - Total: 222.58 nanoW/cm2/sr Marawi Nightlights (June 2017) - Total: 116.215 nanoW/cm2/sr
Satellite: Suomi-National Polar Partnership satellite Accessed via: DOST-ASTI PEDRO Center Capture date: September 2013 to August 2015 Payload: Visible Infrared Imaging Radiometer Suite (VIIRS)
Total nightlight intensity (clustered per barangay) in Marawi City before and after the breakout of the armed conflict.
1
Since electrification is visible in space, studying nightlights can give us data that can be useful in sustainable development studies. In these Visible Infrared Imaging Radiometer Suite (VIIRS) scans of Marawi City, nightlights were seen to have decreased from May 2017 (the start of the Marawi Siege) to June 2017.
The nightlight intensity on a given place can be studied to assess how populations are possibly displaced from the major areas of war to the neighboring cities. In armed conflicts, this kind of intelligence can also aid humanitarian efforts by lessening the need to deploy people on the ground for data collection.
Longitude
nanoW/cm2/sr
nanoW/cm2/sr
0
Longitude LongitudeLa
titud
e
Latit
ude
Latit
ude
1
30
10
20
Increase (15)
No change (0)
Decrease (-15)

OUR PLACE IN SPACE46
5 PLANNING AND ECONOMETRICS
Predicting Poverty and Consumption-based WealthUsing NightlightsNighttime illumination corresponds to wealth through the following assumptions:
(1) Access to power grid requires financial resources;
(2) Nightlights indicate economic activity leading to higher levels of wealth;
Generalized Additive Model (Province Nightlights 2006, 2009, 2012) Generalized Additive Model (Region Nightlights 2006, 2009, 2012)
(3) Nighttime illumination (street lamps) can be a result of preferential treatment for specific societal groups.
Analytical models are used to fit the features to household expenditure collected by Philippine Statistics Authority

VOLUME 1 47
Portfolio of Earth Observation Satellites:In use and accessed
Diwata-1Diwata-2Maya-1Maya-2Maya-3Maya-4IRIS-A & BKOMPSAT 3, 3A, & 5PlanetGeoEye-1WorldView 2, 3, & 4COSMO-SkyMed NovaSAR-1SentinelLandsat
6
Fast Facts:

OUR PLACE IN SPACE48
6 PORTFOLIO OF EARTH OBSERVATION SATELLITES: IN USE AND ACCESSED
Diwata-1Fast Facts Trivia
Class
Mass
Type
Dimensions
Orbit
Payloads
Launch
Release
Image acquisition
Status
Mission/s
Microsatellite (Microsat)
52.40 kg
Scientific Earth Observation
55 cm x 35 cm x 55 cm
Low Earth
High Precision Telescope (HPT), Spaceborne Multispectral Imager with Liquid Crystal Tunable Filter (SMI w/ LCTF), Middle Field Camera (MFC), Wide Field Camera (WFC)
Diwata-1 is the first Filipino-built satellite under the Development of Philippine Scientific Earth Observation Microsatellite (PHL-Microsat) Program, in partnership with Japanese Universities Hokkaido University and Tohoku University. PHL-Microsat is funded by the Department of Science and Technology (DOST), DOST-Philippine Council for Industry, Energy and Emerging Technology Research and Development (PCIEERD), and implemented by the University of the Philippines Diliman together with DOST-Advanced Science and Technology Institute.
23 March 2016 via Atlas V Rocket from Kennedy Space Center (Cape Canaveral, Florida)
27 April 2016 from the International Space Station (ISS)
Approximately 38% or 114,087 km. sq. Philippine land covered
Decommissioned (06 April 2020)
Disaster Response and Management1. Assess damages caused by natural disasters by taking pre and post disaster images in the area.
Environmental and Natural Resource Assessment
1. Multi-spectral Earth Observation for remote sensing applications.2. Derive geophysical parameters for land and ocean applications. X-ANT
X-ANT
GPS-ANTSES
SES
SMI
HPT
MFCWFC
SESDEPSW
SAS
S-ANT
S-ANT
S-ANT
U-ANT
S-ANT
Actual image of Diwata-1
Diagram of Diwata-1 modules

VOLUME 1 49
6 PORTFOLIO OF EARTH OBSERVATION SATELLITES: IN USE AND ACCESSED
TriviaDiwata-2 is the successor of Diwata-1 that is also built through PHL-Microsat, with satellite operations continued under the STAMINA4Space Program. Significant enhancements were made to Diwata-2, such as its deployment to a Sun-Synchronous Orbit, the addition of deployable solar arrays for additional power provision, and the inclusion of an Enhanced Resolution Imager camera and an Amateur Radio Unit (ARU) which can be used as an alternative means of communication during disasters on the ground.
Diwata-2Fast Facts
Class
Mass
Type
Dimensions
Orbit
Payloads
Launch
Release
Image acquisition
Status
Mission/s
Microsatellite (Microsat)
57.36 kg
Earth Observation
50cm x 50 cm x 50 cm (Stowed State)
Low Earth, Sun-Synchronous
High Precision Telescope (HPT), Spaceborne Multispectral Imager with Liquid Crystal Tunable Filter (SMI w/ LCTF), Middle Field Camera (MFC), Wide Field Camera (WFC), Enhanced Resolution Camera (ERC), Deployable Solar Array Panels (DSAP), an Amateur Radio Unit (ARU), Zenith Sun Sensor Module (SAS-Z), and an Extended Attitude Control Unit (ACU-Ex)
29 October 2018
Direct release to space via rocket
Approximately 80% or 245,063 km sq. of Philippine land area covered (as of June 2020)
In orbit (since 29 October 2018)
(1) Multi-spectral Earth Observation for remote sensing applications; (2) Data Collection by Store-and-Forward Mechanism; (3) Provide Satellite data to agriculture, fisheries, forestry , and other sectors; (4) Assess damages caused by natural disasters by taking pre and post disaster images in the area; (5) Provide means of communication for emergency responders through amateur radio; (6) Automatic Packet Reporting System (APRS) Message Digipeater
Actual Image of Diwata-2
Diwata-2 Modules Diagram

OUR PLACE IN SPACE50
6 PORTFOLIO OF EARTH OBSERVATION SATELLITES: IN USE AND ACCESSED
Maya-1Fast Facts
Class
Mass
Type
Dimensions
Payloads
Launch
Release
Status
Mission/s
Cube Satellite (Cubesat)
1.11 kg
Technology Demonstration
10cm x 10 cm x 10 cm (Stowed State)
Camera, Global Positioning System (GPS) chip, Automatic Packet Reporting System Message Digipeater (APRS-DP) payload, Anisotropic Magnetoresistance Sensor
June 29, 2018 via SpaceX Falcon 9 rocket launched from Kennedy Space Center, Cape Canaveral (Florida, USA)
August 20, 2018 via International Space Station (ISS)
In orbit (since August 10, 2018)
1. Remote Data Collection by Store-and-Forward (S&F) Mechanism2. Commercial off-the-shelf (COTS) APRS-Digipeater Payload Demonstration on Cubesat3. Image and Video CaptureGPS Chip Demonstration4. Detection of an Electronics Circuit Anomaly due to Space Radiation5. Magnetic Field Measurement in space using an Anisotropic Magnetoresistance Sensor
TriviaMaya-1 is the first cube satellite (CubeSat) developed by Filipino engineers through the PHL-Microsat Program. It is part of the 2nd Joint Global Multi-Nation Birds Satellite project of the Kyushu Institute of Technology in Japan, which launched Maya-1 together with BHUTAN-1 (Bhutan) and UiTMSAT-1 (Malaysia). The Maya-1 bus design is currently used as the reference design of the first locally built CubeSats Maya-3 and Maya-4.
Actual Image of Maya-1
Maya’1 Modules Diagram
RBF Port
Solar Cell
VHFMonopoleAntenna
VHFAntenna
UHFAntenna
GPS Patch
Camera
Nichrome Wire

VOLUME 1 51
6 PORTFOLIO OF EARTH OBSERVATION SATELLITES: IN USE AND ACCESSED
Maya-2Fast Facts
Class
Mass
Type
Dimensions
Payloads
Launch
Release
Status
Mission/s
Cube Satellite (Cubesat)
1.3 kg
Technology Demonstration
10cm x 10 cm x 10 cm (Stowed State)
Camera, Automatic Packet Reporting System Message Digipeater (APRS-DP) payload, Attitude determination and control units, Perovskite solar cells, Latchup-detection chip
Target: February 2021
To be determined
Under development
1. Remote Data Collection by Store-and-Forward (S&F) mechanism (S&F mission)2. Commercial off-the-shelf (COTS) APRS-Digipeater Payload Demonstration on Cubesat (APRS-DP Mission)3. Image and Video Capture (CAM mission)4. Demonstration of active attitude stabilization and control5. Testing of perovskite solar cells in space6. Demonstration of CubeSat structure as antenna7. Test of latchup-detection chip 8. Test of COTS glue for solar cell attachment
TriviaMaya-2 is currently being developed by Filipino students in Kyushu Institute of Technology in Japan, and is part of the 4th Joint Global Multi-Nation Birds Satellite project. The Filipino students building Maya-2 came from different Philippine universities, and is the country’s first inter-university satellite project. Maya-2 builds from the Maya-1 heritage, and incorporates more advanced technology demonstration missions. The satellite will be launched along with Tsuru (Japan) and GuaraniSat-1 (Paraguay).
5x Solar Panels
Reaction Wheel
Main Structure
Backplane Board
Antenna Panel
COM BoardMission Board #1
Mission Board #2
Rear Access Board
Front Access Board
6x NiMH Batteries
Battery Insulator
OBC
Battery Box
Magnetic Coil-X
Magnetic Coil-X
Magnetic Coil-X
Reaction Wheel
Actual Image of Maya-2
Maya-2 Modules Diagram

OUR PLACE IN SPACE52
6 PORTFOLIO OF EARTH OBSERVATION SATELLITES: IN USE AND ACCESSED
Maya-3Fast Facts
Class
Mass
Type
Dimensions
Payloads
Launch
Release
Status
Mission/s
Cube Satellite (Cubesat)
1.08 kg
Technology Demonstration
10cm × 10cm × 11.4cm (Stowed State)
RGB Camera, Automatic Packet Reporting System Message Digipeater (APRS-DP) Payload, Global Positioning System (GPS) Chip, Anisotropic Magnetoresistance Sensor
Target: May 2021
To be determined
Under development
1. Demonstration of Ground Data Acquisition using Store and Forward (S&F mission)2. Commercial off-the-shelf (COTS) APRS-Digipeater Payload Demonstration on Cubesat (APRS-DP mission)3. Image and Video Capture (RGB CAM Mission), Demonstration of an NIR Camera (NIR CAM Mission)4. GPS Chip Demonstration (GPS Mission)5. Detection of an Electronics Circuit Anomaly due to Space Radiation (SEL mission)6. Magnetic Field Measurement in Space using an Anisotropic Magnetoresistance Sensor (AMR-MM mission)
TriviaMaya-3 and Maya-4 (see next page) are the first Philippine-university built CubeSats developed under the STAMINA4Space Program. The project aims to gain and locally extend the knowledge and skills on satellite development acquired from foreign schooling, and utilize the domestic capabilities for satellite development. The two share the same bus but differ in some payloads: Maya-3 has two 5MP visual camera that will take photos and/or videos of the country, while Maya-4 has a combination of a 5MP visual camera and a near-infrared camera.
VHF Dipole Antenna
GPS Patch Antenna
Solar Cells
RGB Camera
RGB Camera
UHF Dipole Antenna
RBF Pin
Deployment Switch
Lever Switch
Actual Image of Maya-3 Engineering Model

VOLUME 1 53
6 PORTFOLIO OF EARTH OBSERVATION SATELLITES: IN USE AND ACCESSED
Maya-4Fast Facts
Class
Mass
Type
Dimensions
Payloads
Launch
Release
Status
Mission/s
Cube Satellite (Cubesat)
1.08 kg
Technology Demonstration
10cm × 10cm × 11.4cm (Stowed State)
RGB Camera, Near-Infrared (NIR) Camera, Automatic Packet Reporting System Message Digipeater (APRS-DP) Payload, Global Positioning System (GPS) Chip, Anisotropic Magnetoresistance Sensor
Target: May 2021
To be determined
Under development
1. Demonstration of Ground Data Acquisition using Store and Forward (S&F mission)2. Commercial off-the-shelf (COTS) APRS-Digipeater Payload Demonstration on Cubesat (APRS-DP mission)3. Image and Video Capture (RGB CAM Mission), Demonstration of an NIR Camera (NIR CAM Mission)4. GPS Chip Demonstration (GPS Mission)5. Detection of an Electronics Circuit Anomaly due to Space Radiation (SEL mission)6. Magnetic Field Measurement in Space using an Anisotropic Magnetoresistance Sensor (AMR-MM mission)
Exploded View
Back Plane
Battery Case
Front Access Board
UHF Com Board
EPS/OBCBoard
VHF Com Board
Mission Board Rear Access Board
Internal Boards
VHF Dipole Antenna
GPS Patch Antenna
Solar Cells
NIR Camera
RGB Camera
UHF Dipole Antenna
RBF Pin
Deployment Switch
Lever Switch

OUR PLACE IN SPACE54
6 PORTFOLIO OF EARTH OBSERVATION SATELLITES: IN USE AND ACCESSED
TriviaIRIS-A and IRIS-B are CubeSats that are part of the IRIS satellite series initiated by Taiwan’s National Cheng Kung University (NCKU) and STAMINA4Space. Two Filipino engineers are involved in the development of this series.
IRIS-A will be equipped with Internet of Things (IoT) technologies to achieve a
IRIS-A & BFast Facts
Class
Mass
Type
Payloads
Release
Launch
Dimensions
Mission/s
Status
IRIS-A: 2U Cube Satellite (Cubesat) IRIS-B: 3U Cube Satellite (Cubesat)
IRIS-A: 2.42 kgIRIS-B: TBD
Technology Demonstration
AI Software (Inference) (NCNU), Optical Mechanism Structure (NSPO), Image Capture/Processing Boards (Liscotech)
To be determined
To be determined
IRIS-A: 22.7cm x11.2cm x11.2cmIRIS-B: 34x11.3x11.3
IRIS A: Demonstrate Internet of Things (IoT)IRIS B: Demonstrate in-orbit intelligent remote sensing technology
Under development
Doppler shift estimation and improve the quality of downlink signal, increasing the efficiency of future IoT constellations of nanosatellites intended to monitor objects from space.
Iris-A rendered image.
Iris-B rendered image.

VOLUME 1 55
6 PORTFOLIO OF EARTH OBSERVATION SATELLITES: IN USE AND ACCESSED
KOMPSAT 3 & 3AFast Facts
Country
Class
Mass
Type
Dimensions
Payloads
Launch
Mission/s
South Korea
KOMPSAT 3: Medium satellite KOMPSAT 3A: Large satelliteBoth optical high-resolution satellites
KOMPSAT 3: ~980 kgKOMPSAT 3A: less than 1,100 kg
Optical Earth Observation
Both 3.5m tall with a diameter of 2m
KOMPSAT 3: Advanced Earth Imaging Sensor System (AEISS)KOMPSAT 3A: Advanced Earth Imaging Sensor System-A (AEISS-A) & Infrared Imaging System (IIS)
KOMPSAT 3: 17 May 2012, Tanegashima Space Center of JAXA, JapanKOMPSAT 3A: 25 March 2015, Jasny Dombarovsky, Russia
KOMPSAT 3: Earth observation continuity from the previous KOMPSATsGeographical Information Systems (GIS)Environmental monitoring
KOMPSAT 3AObtain infrared and high resolution electro-optical images for GISEnvironmental monitoring
TriviaKOMPSAT 3 is a high-resolution earth observation satellite by the Korea Aerospace Research Institute (KARI) and funded by the Ministry of Education, Science and Technology (MEST). KOMPSAT 3 was launched in 2012 to continue the missions of KOMPSAT-1 and 2.
KOMPSAT 3A, launched in 2015, is South Korea’s first satellite to have two imaging
systems onboard. Its main mission is to obtain infrared and high resolution electro-optical images for Geographic Information Systems (GIS).
The PEDRO Center is subscribed to both satellites through Skymap Global Philippines.
Computer generated image of KOMPSAT 3.Retrieved from spacedata.copernicus.eu

OUR PLACE IN SPACE56
6 PORTFOLIO OF EARTH OBSERVATION SATELLITES: IN USE AND ACCESSED
KOMPSAT 5Fast Facts
Country
Class
Mass
Type
Payloads
Launch
Resolution
Mission/Attributes
South Korea
Large satellite
~1400 kg
X-band Synthetic Aperture Radar
Corea SAR Instrument (COSI), Atmosphere Occultation and Precision Orbit Determination, Laser Retro Reflector Array22 August 2013 from Yasny, Russia
1m, 2.5m and 20m
Develop, launch and operation of a Synthetic Aperture Radar (SAR) satellite for:
Geographic information applicationsDisaster and environmental monitoringOcean and land management
TriviaKOMPSAT 5 is a Synthetic Aperture Radar mission developed by KARI. Its main mission is to provide satellite imagery for GIS applications, ocean and land management, and disaster and environmental monitoring.
The PEDRO Center is subscribed to the satellite via Skymap Global Philippines.
Computer generated image of KOMPSAT 5 in orbit.Retrieved from telespazio.co.uk

VOLUME 1 57
6 PORTFOLIO OF EARTH OBSERVATION SATELLITES: IN USE AND ACCESSED
Dove SatellitesFast Facts
Country
Class
Mass
Type
Dimensions
Spatial Resolution
Launch
Mission/Attributes
USA (Commercial)
Satellite constellation consisting of 130+ nanosatellites
~ 5 kg per satellite
Earth Observation
10 cm x 10 cm x 30 cm
3 - 5 meters
2013 to April 2019
The entire constellation can cover all of Earth’s land everyday.
TriviaDove is a commercial satellite constellation made up of more than 130 nanosatellites. This constellation can cover the Earth’s land every day.
The PEDRO Center is subscribed to the satellite constellation through Geospectrum Marketing Services.
Computer generated image of Dove Satellites in orbit.Retrieved from altaonline.com

OUR PLACE IN SPACE58
6 PORTFOLIO OF EARTH OBSERVATION SATELLITES: IN USE AND ACCESSED
GeoEye-1Fast Facts
Country
Class
Mass
Type
Dimensions
Payloads
Spatial Resolution (at nadir)
Launch
Mission/Attributes
USA (Commercial)
Large satellites
1955 kg
Earth Observation
4.35 m x 2.7m
GEOEYE Imaging System
Panchromatic: 41cm. GSDMultispectral: 1.64m GSD
September 6, 2008
The satellite can produce over 350,000 sq. km. of pan-sharpened multispectral satellite imagery daily.
TriviaGeoEye-1, formerly known as OrbView-5, is a commercial satellite by GeoEye Inc. launched in 2008. The satellite is equipped with a pushbroom imager. As of 2013, the satellite is being operated by DigitalGlobe after their merger with GeoEye Inc.
The PEDRO Center is subscribed to the satellite via Geo-Surveys & Mapping Inc.
Computer generated image of GeoEye-1 in orbit.Retrieved from spacenews.com

VOLUME 1 59
6 PORTFOLIO OF EARTH OBSERVATION SATELLITES: IN USE AND ACCESSED
WorldView 2 & 3 Fast Facts
Country
Class
Mass
Type
Dimensions
Payloads
Launch
Mission
USA (Commercial)
Large satellites
WorldView 2: 2,800 kgWorldView 3: 2,812 kg
Earth Observation
WorldView 2: 4.3 m x 2.5 m x 7.1 mWorldView 3: 5.7 m x 2.5 m x 7.1 m
WorldView 2: WorldView-110 cameraWorldView 3: WorldView-3 camera and CAVIS (Cloud, Aerosols, Vapors, Ice and Snow) Imager.
WorldView 2: 08 October 2009WorldView 3: 13 August 2014
High-resolution satellite imagery
TriviaWorldView 2 & 3 are commercial satellites from DigitalGlobe Inc. These satellites are made to provide high-resolution satellite imagery. Aside from its imagers, WorldView 3 is equipped with its CAVIS payload which enables the satellite to monitor the atmosphere.
The PEDRO Center is subscribed to these satellites via Geo-Surveys & Mapping Inc.
Computer generated image of WorldView 2 in orbit.Retrieved from satnews.com

OUR PLACE IN SPACE60
6 PORTFOLIO OF EARTH OBSERVATION SATELLITES: IN USE AND ACCESSED
COSMO-SkyMedFast Facts
Country
Class
Mass
Type
Payloads
Launch
Mission
Italy (commercial)
Constellation satellite (four satellites), large satellites
Each satellite weighs about 1700 kg
Earth Observation
SAR-2000, X-band , multi-resolution and multi-polarisation imaging radar
June 2007 to Nov 2010
Global Earth observationDefense and security applicationsDIsaster managementEnvironmental monitoring
Computer generated image of COSMO-SkyMed in orbit.Retrieved from Thales Alenia Space Facebook page.Trivia
COSMO-SkyMed is a constellation of four satellites managed by the Agenzia Spaziale Italiana (ASI). It is funded by the Italian Ministry of Research and Italian Ministry of Defense. These SAR satellites were made for the needs of the military and the general public.
The PEDRO Center is subscribed to these satellites via Geo-Surveys & Mapping Inc.

VOLUME 1 61
6 PORTFOLIO OF EARTH OBSERVATION SATELLITES: IN USE AND ACCESSED
NovaSAR-1Fast Facts
Country
Class
Mass
Type
Orbit
Payloads
Launch
Mission
Modes of Operation
Status
United Kingdom (commercial)
Synthetic Aperture Radar minisatellite
430 kg
Earth Observation
Low Earth
S-band Synthetic Aperture Radar (SAR), Automatic Identification System (AIS)
16 September 2018 from ISRO (Sriharikota, India)
Disaster Management and Environmental MonitoringAssess an area by taking SAR images. This is especially helpful when cloud cover is an issue
Maritime MonitoringThrough AIS, detect ships and track their movements.
ScanSAR: 20m resolution, 100 km swathMaritime mode: 30m, 400-750 km swathStripmap: 6m resolution, 20 km swathScanSAR wide: 30m resolution, 140 km swath
In orbit (since September 2018)
Computer generated image of NovaSAR-1 in orbit.Retrieved from research.csiro.au Trivia
The PEDRO Center’s ground receiving stations have access to 10% of NovaSAR-1’s capacity for the satellite’s lifetime. Other mission partners include UK Space Agency, Australia’s Commonwealth Scientific and Industrial research Organization and Indian Space Research Organization.

OUR PLACE IN SPACE62
6 PORTFOLIO OF EARTH OBSERVATION SATELLITES: IN USE AND ACCESSED
Sentinel 1 & 2Fast Facts
Country
Class
Mass
Type
Orbit
Payloads
Launch
Mission
Status
Europe
Large satellite
Sentinel-1: 2,300 kgSentinel-2: 1140 kg
Sentinel-1: Synthetic Aperture RadarSentinel-2: Multispectral Imaging Satellite
Sun-synchronous
Sentinel-1: C-band Synthetic Aperture RadarSentinel-2: Multispectral Imager (10m, 20m, 60m)
Sentinel-1A: 03 April 2014Sentinel-1B: 25 April 2016
Sentinel-2A: 23 June 2015Sentinel-2B: March 2017
Sentinel-1: Continuity for the C-Band Synthetic Aperture Radar operational application and services Sentinel-2: Land observation
Ongoing
TriviaThe Sentinel missions are developed and designed by the European Space Agency and funded by the European Commission.
Computer generated image of Sentinel 1 in orbit.Retrieved from ESA.int

VOLUME 1 63
6 PORTFOLIO OF EARTH OBSERVATION SATELLITES: IN USE AND ACCESSED
Landsat-8Fast Facts
Country
Class
Mass
Type
Orbit
Payloads
Launch
Mission
Status
United States of America
Large satellite
2071 kg
Earth Observation
Sun-synchronous
Operational Land ImagerThermal Infrared Sensors
11 February 2013
Collect and archive moderate resolution reflective and thermal multispectral image data to provide coverage for the world in less than 5 years.
Ongoing
TriviaLandsat-8 was a collaboration between NASA and U.S. Geological Survey.
Landsat-8Retrieved from NASA.gov

OUR PLACE IN SPACE64
Contributors
DOST-ASTI Bldg., UP Technology Park Complex, C.P. Garcia Avenue, Diliman, Quezon City, Metro Manila, Philippines 1108
ULyS3ES Building 1, University of the Philippines Electrical and Electronics Engineering Institute (UP-EEEI) P. Velasquez St., UP Diliman, Quezon City, Metro Manila, Philippines 1108
DOST-ASTI Bldg., UP Technology Park Complex, C.P. GarciaAvenue, Diliman, Quezon City, Metro Manila, Philippines 1108
DOST-ASTI Bldg., UP Technology Park Complex, C.P. GarciaAvenue, Diliman, Quezon City, Metro Manila, Philippines 1108
DOST-ASTI Bldg., UP Technology Park Complex, C.P. Garcia Avenue, Diliman, Quezon City, Metro Manila, Philippines 1108
Science Heritage Bldg., Science Community Complex,Gen. Santos Avenue, Bicutan, Taguig City, Metro Manila , Philippines 1631
DOST Building, Gen. Santos Avenue Bicutan, Taguig City, Metro Manila ,Philippines 1631
Philippine Space Agency (PhilSA)
Space Technology and Applications Mastery, Innovation and Advancement (STAMINA4Space) Program
Project DATOS
Philippine Earth Data Resource Observation Center (PEDRO)
DOST Advanced Science and Technology Institute (DOST-ASTI)
DOST Philippine Council for Industry, Energy and Emerging Technology Research and Development (DOST-PCIEERD)
Department of Science and Technology (DOST)
+63 (2) 426 9764
+632 8837-2071 to 82 loc. 2100, 2120 & 2121
+632 837-20-71 to 82 (632) 837-2937
philsa.gov.ph
stamina4space.upd.edu.ph
asti.dost.gov.ph/projects/datos/
asti.dost.gov.ph/projects/pedro-center/
asti.dost.gov.ph
pcieerd.dost.gov.ph
dost.gov.ph
@philspaceagency
@stamina4space
@dostpcieerd
@PhilSpaceAgency
@STAMINA4Space
@dostasti
@dostpcieerd
linkedin.com/company/philspaceagency@PhilSpaceAgency
@STAMINA4Space
@DATOSproject
@ThePEDROCenter
@DOSTASTI
@dostpcieerd
@DOSTph