Organised Genome Dynamics in the Escherichia coli Species Results in Highly Diverse Adaptive Paths
25
Organised Genome Dynamics in the Escherichia coli Species Results in Highly Diverse Adaptive Paths Marie Touchon 1,2. , Claire Hoede 3. , Olivier Tenaillon 3. , Vale ´ rie Barbe 4 , Simon Baeriswyl 5 , Philippe Bidet 6 , Edouard Bingen 6 , Ste ´ phane Bonacorsi 6 , Christiane Bouchier 7 , Odile Bouvet 3 , Alexandra Calteau 8 , He ´le `ne Chiapello 9 , Olivier Clermont 3 , Ste ´ phane Cruveiller 8 , Antoine Danchin 10 , Me ´de ´ ric Diard 5 , Carole Dossat 4 , Meriem El Karoui 12 , Eric Frapy 12 , Louis Garry 3 , Jean Marc Ghigo 13 , Anne Marie Gilles 10 , James Johnson 14,15 , Chantal Le Bougue ´ nec 16 , Mathilde Lescat 3 , Sophie Mangenot 4 , Vanessa Martinez-Je ´ hanne 16 , Ivan Matic 5 , Xavier Nassif 12 , Sophie Oztas 4 , Marie Agne ` s Petit 11 , Christophe Pichon 16 , Zoe ´ Rouy 8 , Claude Saint Ruf 5 , Dominique Schneider 17 , Je ´ro ˆ me Tourret 3 , Benoit Vacherie 4 , David Vallenet 8 , Claudine Me ´ digue 8 *, Eduardo P. C. Rocha 1,2 *, Erick Denamur 3 * 1 Atelier de BioInformatique, Universite ´ Pierre et Marie Curie - Paris 6 (UPMC), Paris, France, 2 Microbial Evolutionary Genomics, Institut Pasteur, CNRS URA2171, Paris, France, 3 Faculte ´ de Me ´decine, Universite ´ Paris 7 Denis Diderot, INSERM U722, Site Xavier Bichat, Paris, France, 4 Ge ´noscope, Institut de Ge ´nomique, CEA, Evry, France, 5 Faculte ´ de Me ´decine, Universite ´ Paris 5 Rene ´ Descartes, INSERM U571, Paris, France, 6 Universite ´ Paris 7 Denis Diderot, Ho ˆ pital Robert Debre ´ (APHP), EA 3105, Paris, France, 7 Plate-Forme Ge ´nomique, Institut Pasteur, Paris, France, 8 Laboratoire de Ge ´nomique Comparative, CNRS UMR8030, Institut de Ge ´nomique, CEA, Ge ´ noscope, Evry, France, 9 UR1077 Mathe ´ matique, Informatique, et Ge ´nome, INRA, Jouy en Josas, France, 10 Unite ´ de Ge ´ne ´tique des Ge ´nomes Bacte ´ riens, Institut Pasteur, CNRS URA2171, Paris, France, 11 UR888 Unite ´ des Bacte ´ ries Lactiques et Pathoge ` nes Opportunistes, INRA, Jouy en Josas, France, 12 Faculte ´ de Me ´ decine, Universite ´ Paris 5 Rene ´ Descartes, INSERM U570, Paris, France, 13 Unite ´ de Ge ´ne ´ tique des Biofilms, Institut Pasteur, CNRS URA2172, Paris, France, 14 Veterans Affairs Medical Center, Minneapolis, Minnesota, United States of America, 15 Department of Medicine, University of Minnesota, Minneapolis, Minnesota, United States of America, 16 Pathoge ´nie Bacte ´rienne des Muqueuses, Institut Pasteur, Paris, France, 17 Universite ´ Grenoble 1 Joseph Fourier, CNRS UMR 5163, Grenoble, France Abstract The Escherichia coli species represents one of the best-studied model organisms, but also encompasses a variety of commensal and pathogenic strains that diversify by high rates of genetic change. We uniformly (re-) annotated the genomes of 20 commensal and pathogenic E. coli strains and one strain of E. fergusonii (the closest E. coli related species), including seven that we sequenced to completion. Within the ,18,000 families of orthologous genes, we found ,2,000 common to all strains. Although recombination rates are much higher than mutation rates, we show, both theoretically and using phylogenetic inference, that this does not obscure the phylogenetic signal, which places the B2 phylogenetic group and one group D strain at the basal position. Based on this phylogeny, we inferred past evolutionary events of gain and loss of genes, identifying functional classes under opposite selection pressures. We found an important adaptive role for metabolism diversification within group B2 and Shigella strains, but identified few or no extraintestinal virulence-specific genes, which could render difficult the development of a vaccine against extraintestinal infections. Genome flux in E. coli is confined to a small number of conserved positions in the chromosome, which most often are not associated with integrases or tRNA genes. Core genes flanking some of these regions show higher rates of recombination, suggesting that a gene, once acquired by a strain, spreads within the species by homologous recombination at the flanking genes. Finally, the genome’s long-scale structure of recombination indicates lower recombination rates, but not higher mutation rates, at the terminus of replication. The ensuing effect of background selection and biased gene conversion may thus explain why this region is A+T-rich and shows high sequence divergence but low sequence polymorphism. Overall, despite a very high gene flow, genes co-exist in an organised genome. Citation: Touchon M, Hoede C, Tenaillon O, Barbe V, Baeriswyl S, et al. (2009) Organised Genome Dynamics in the Escherichia coli Species Results in Highly Diverse Adaptive Paths. PLoS Genet 5(1): e1000344. doi:10.1371/journal.pgen.1000344 Editor: Josep Casadesu ´ s, Universidad de Sevilla, Spain Received September 2, 2008; Accepted December 16, 2008; Published January 23, 2009 Copyright: ß 2009 Touchon et al. This is an open-access article distributed under the terms of the Creative Commons Attribution License, which permits unrestricted use, distribution, and reproduction in any medium, provided the original author and source are credited. Funding: MT was funded by the ‘‘Conseil Re ´gional de l’Ile de France’’, ML was funded by the ‘‘Fondation pour la Recherche Me ´dicale’’. JRJ was supported by Office of Research and Development, Medical Research Service, Department of Veterans Affairs. Annotation was supported by a grant from MRT/ANR PFTV 2007, MicroScope project. OT was supported by a grant from the ‘‘Agence Nationale de la Recherche’’ ANR-05-JC-0136-01. Competing Interests: The authors have declared that no competing interests exist. * E-mail: [email protected] (CM); [email protected] (EPCR); [email protected] (ED) . These three authors contributed equally to this work. Introduction Escherichia coli was brought into laboratories almost a century ago to become one of the most important model organisms and by far the best-studied prokaryote. Major findings in phage genetics, bacterial conjugation, recombination, genetic regulation and chromosome replication involved the use of E. coli, especially laboratory derivatives of the K-12 strain, originally isolated from the faeces of a convalescent diphtheria patient in Palo Alto in 1922 [1]. However, K-12 derivatives are far from representing the PLoS Genetics | www.plosgenetics.org 1 January 2009 | Volume 5 | Issue 1 | e1000344
-
Upload
independent -
Category
Documents
-
view
1 -
download
0
Transcript of Organised Genome Dynamics in the Escherichia coli Species Results in Highly Diverse Adaptive Paths
Organised Genome Dynamics in the Escherichia coliSpecies Results in Highly Diverse Adaptive PathsMarie Touchon1,2., Claire Hoede3., Olivier Tenaillon3., Valerie Barbe4, Simon Baeriswyl5, Philippe Bidet6,
Edouard Bingen6, Stephane Bonacorsi6, Christiane Bouchier7, Odile Bouvet3, Alexandra Calteau8, Helene
Chiapello9, Olivier Clermont3, Stephane Cruveiller8, Antoine Danchin10, Mederic Diard5, Carole Dossat4,
Meriem El Karoui12, Eric Frapy12, Louis Garry3, Jean Marc Ghigo13, Anne Marie Gilles10, James
Johnson14,15, Chantal Le Bouguenec16, Mathilde Lescat3, Sophie Mangenot4, Vanessa Martinez-Jehanne16,
Ivan Matic5, Xavier Nassif12, Sophie Oztas4, Marie Agnes Petit11, Christophe Pichon16, Zoe Rouy8,
Claude Saint Ruf5, Dominique Schneider17, Jerome Tourret3, Benoit Vacherie4, David Vallenet8,
Claudine Medigue8*, Eduardo P. C. Rocha1,2*, Erick Denamur3*
1 Atelier de BioInformatique, Universite Pierre et Marie Curie - Paris 6 (UPMC), Paris, France, 2 Microbial Evolutionary Genomics, Institut Pasteur, CNRS URA2171, Paris,
France, 3 Faculte de Medecine, Universite Paris 7 Denis Diderot, INSERM U722, Site Xavier Bichat, Paris, France, 4 Genoscope, Institut de Genomique, CEA, Evry, France,
5 Faculte de Medecine, Universite Paris 5 Rene Descartes, INSERM U571, Paris, France, 6 Universite Paris 7 Denis Diderot, Hopital Robert Debre (APHP), EA 3105, Paris,
France, 7 Plate-Forme Genomique, Institut Pasteur, Paris, France, 8 Laboratoire de Genomique Comparative, CNRS UMR8030, Institut de Genomique, CEA, Genoscope,
Evry, France, 9 UR1077 Mathematique, Informatique, et Genome, INRA, Jouy en Josas, France, 10 Unite de Genetique des Genomes Bacteriens, Institut Pasteur, CNRS
URA2171, Paris, France, 11 UR888 Unite des Bacteries Lactiques et Pathogenes Opportunistes, INRA, Jouy en Josas, France, 12 Faculte de Medecine, Universite Paris 5 Rene
Descartes, INSERM U570, Paris, France, 13 Unite de Genetique des Biofilms, Institut Pasteur, CNRS URA2172, Paris, France, 14 Veterans Affairs Medical Center, Minneapolis,
Minnesota, United States of America, 15 Department of Medicine, University of Minnesota, Minneapolis, Minnesota, United States of America, 16 Pathogenie Bacterienne
des Muqueuses, Institut Pasteur, Paris, France, 17 Universite Grenoble 1 Joseph Fourier, CNRS UMR 5163, Grenoble, France
Abstract
The Escherichia coli species represents one of the best-studied model organisms, but also encompasses a variety ofcommensal and pathogenic strains that diversify by high rates of genetic change. We uniformly (re-) annotated thegenomes of 20 commensal and pathogenic E. coli strains and one strain of E. fergusonii (the closest E. coli related species),including seven that we sequenced to completion. Within the ,18,000 families of orthologous genes, we found ,2,000common to all strains. Although recombination rates are much higher than mutation rates, we show, both theoretically andusing phylogenetic inference, that this does not obscure the phylogenetic signal, which places the B2 phylogenetic groupand one group D strain at the basal position. Based on this phylogeny, we inferred past evolutionary events of gain and lossof genes, identifying functional classes under opposite selection pressures. We found an important adaptive role formetabolism diversification within group B2 and Shigella strains, but identified few or no extraintestinal virulence-specificgenes, which could render difficult the development of a vaccine against extraintestinal infections. Genome flux in E. coli isconfined to a small number of conserved positions in the chromosome, which most often are not associated with integrasesor tRNA genes. Core genes flanking some of these regions show higher rates of recombination, suggesting that a gene,once acquired by a strain, spreads within the species by homologous recombination at the flanking genes. Finally, thegenome’s long-scale structure of recombination indicates lower recombination rates, but not higher mutation rates, at theterminus of replication. The ensuing effect of background selection and biased gene conversion may thus explain why thisregion is A+T-rich and shows high sequence divergence but low sequence polymorphism. Overall, despite a very high geneflow, genes co-exist in an organised genome.
Citation: Touchon M, Hoede C, Tenaillon O, Barbe V, Baeriswyl S, et al. (2009) Organised Genome Dynamics in the Escherichia coli Species Results in HighlyDiverse Adaptive Paths. PLoS Genet 5(1): e1000344. doi:10.1371/journal.pgen.1000344
Editor: Josep Casadesus, Universidad de Sevilla, Spain
Received September 2, 2008; Accepted December 16, 2008; Published January 23, 2009
Copyright: � 2009 Touchon et al. This is an open-access article distributed under the terms of the Creative Commons Attribution License, which permitsunrestricted use, distribution, and reproduction in any medium, provided the original author and source are credited.
Funding: MT was funded by the ‘‘Conseil Regional de l’Ile de France’’, ML was funded by the ‘‘Fondation pour la Recherche Medicale’’. JRJ was supported byOffice of Research and Development, Medical Research Service, Department of Veterans Affairs. Annotation was supported by a grant from MRT/ANR PFTV 2007,MicroScope project. OT was supported by a grant from the ‘‘Agence Nationale de la Recherche’’ ANR-05-JC-0136-01.
Competing Interests: The authors have declared that no competing interests exist.
* E-mail: [email protected] (CM); [email protected] (EPCR); [email protected] (ED)
. These three authors contributed equally to this work.
Introduction
Escherichia coli was brought into laboratories almost a century
ago to become one of the most important model organisms and by
far the best-studied prokaryote. Major findings in phage genetics,
bacterial conjugation, recombination, genetic regulation and
chromosome replication involved the use of E. coli, especially
laboratory derivatives of the K-12 strain, originally isolated from
the faeces of a convalescent diphtheria patient in Palo Alto in 1922
[1]. However, K-12 derivatives are far from representing the
PLoS Genetics | www.plosgenetics.org 1 January 2009 | Volume 5 | Issue 1 | e1000344
whole E. coli species [2]. The primary habitat of E. coli is the lower
intestinal tract of humans and other vertebrates, with which it
typically establishes commensal associations. Healthy humans
typically carry more than a billion E. coli cells in their intestine. It
has been estimated that half of the living E. coli cells are outside
their host, in their secondary habitat [3]. Beside these habitats,
certain strains have the potential to cause a wide spectrum of
intestinal and extra-intestinal diseases such as urinary tract
infection, septicaemia, meningitis, and pneumonia in humans
and animals [4]. Furthermore, Shigella, which have been elevated
to the genus order with four species (dysenteriae, flexneri, boydii, sonnei)
based on their capacity to generate a specific mucosal invasive
diarrhoea strictly in humans and their biochemical characteristics,
in fact belong to the E. coli species [5–7]. Of note, Shigella and
enteroinvasive E. coli are considered the only obligate pathogens of
the species, whereas other strains are facultative pathogens with a
broad host range. Thus, natural isolates of E. coli/Shigella live in
conditions quite different from those in the laboratory and
must cope with very diverse environments that provide stresses
ranging from immune system attack and protozoal grazing to
starvation, low temperatures, and, more recently, antibiotic
therapy.
With its large range of pathologies, E. coli is a major cause of
human morbidity and mortality around the world. Each year E.
coli causes more than two million deaths due to infant diarrhoea
[8,9] and extraintestinal infections (mainly septicaemia derived
from urinary tract infection) [10], and is also responsible for
approximately 150 million cases of uncomplicated cystitis [10].
Since humans and food animals carry so many E. coli cells that
may establish commensal or antagonistic interactions with their
hosts it is mandatory to define the genetic and population
determinants that drive commensal strains to adopt a pathogenic
behaviour.
Population genetic studies based on both multi-locus enzyme
electrophoresis [11–13] and various DNA markers [14–18] have
identified four major phylogenetic groups (A, B1, D and B2) and a
potential fifth group (E) among E. coli strains. Strains of these
groups differ in their phenotypic characteristics, including the
ability to use certain sugars, antibiotic resistance profiles and
growth rate–temperature relationships [19]. The distribution
(presence/absence) of a range of virulence factors thought to be
involved in the ability of a strain to cause diverse diseases also
varies among strains of these phylogenetic groups [20–22],
indicating a role of the genetic background in the expression of
virulence [23]. Consequently, these groups are differently
associated with certain ecological niches, life-history characteristics
and propensity to cause disease. For example, group B2 and D
strains are less frequently isolated from the environment [24],
but more frequently recovered from extra-intestinal body sites
[23]. While B2 strains represent 30 to 50% of the strains isolated
from the faeces of healthy humans living in industrialised
countries, they account for less than 5% in French Guyana
Amerindians [25–26].
The clear clustering of E. coli strains into monophyletically
meaningful groups has long been used as an argument favouring
clonality within the species. However, analysis of gene sequences
shows pervasive recombination, matching the well-known effi-
ciency of conjugation and transduction of the species [17,27].
Hence, it remains controversial whether such frequent recombi-
nation obliterates the phylogenetic signal. E. coli genomes show
evidence of widespread acquisition of functions by horizontal gene
transfer, concomitant with similar amounts of gene deletion [28–
29]. While less than 3% of nucleotide divergence is found among
conserved genes, the gene content between pairs of E. coli genomes
may diverge by more than 30% [30]. Such diversification of gene
content due to horizontal gene transfer contributes greatly to the
diversity of the strains’ phenotypes and can be accurately
quantified only by the sequencing of a large number of strains
to completion and closure.
Until now, sequencing efforts in E. coli have been focused
mainly on pathogenic strains, particularly on diarrhoeal and group
B2 extraintestinal pathogenic strains (see Table 1), precluding an
unbiased assessment of the diversity of the species. Therefore, we
have sequenced with high coverage and up to completion the
genomes of 6 human-source E. coli strains. The E. coli strains were
chosen to complement the available sequences and other ongoing
sequencing projects (http://msc.jcvi.org/e_coli_and_shigella/
index.shtml, http://www.sanger.ac.uk/Projects/Escherichia_Shigella/).
They encompass two commensal strains of phylogenetic groups
B1 and B2, a group B1 enteroaggregative strain, two group D
urinary tract infection strains and a group B2 newborn
meningitis strain (Table 1). We also sequenced the type strain
of the closest E. coli relative, i.e., E. fergusonii [31], as an
outgroup to permit accurate and meaningful evolutionary
analyses with the 6 new E. coli genomes and the 14 other
currently available E. coli/Shigella genomes. To statistically
substantiate the identification of extraintestinal virulence-associ-
ated genes, we also applied a mouse lethality assay to the strains
[32] to quantify the intrinsic virulence of the strain, excluding
host variability and other potential confounding factors (Table 1).
Our goal was to take the outstanding opportunity provided by
the availability of many genomes of a single bacterial species,
regarding which a considerable amount of knowledge has been
accumulated over the years, to answer to the following
questions. (i) Is there genome-wide evidence of frequent
recombination and does it vary with genome location? (ii) If
so, can one nonetheless infer an intra-specific bacterial
phylogeny? (iii) How do the different factors of genome
dynamics (mutation, horizontal gene transfer with or without
recombination) result together in strain diversification? (iv) Is
genome dynamics in conflict with genome organisation? (v) How
does the commensalism/pathogenicity duality evolve?
Author Summary
Although abundant knowledge has been accumulatedregarding the E. coli laboratory strain K-12, little is knownabout the evolutionary trajectories that have driven thehigh diversity observed among natural isolates of thespecies, which encompass both commensal and highlyvirulent intestinal and extraintestinal pathogenic strains.We have annotated or re-annotated the genomes of 20commensal and pathogenic E. coli strains and one strain ofE. fergusonii (the closest E. coli related species), includingseven that we sequenced to completion. Althoughrecombination rates are much higher than mutation rates,we were able to reconstruct a robust phylogeny based onthe ,2,000 genes common to all strains. Based on thisphylogeny, we established the evolutionary scenario ofgains and losses of thousands of specific genes, identifyingfunctional classes under opposite selection pressures. Thisgenome flux is confined to very few positions in thechromosome, which are the same for every genome.Notably, we identified few or no extraintestinal virulence-specific genes. We also defined a long-scale structure ofrecombination in the genome with lower recombinationrates at the terminus of replication. These findingsdemonstrate that, despite a very high gene flow, genescan co-exist in an organised genome.
Organised Disorder in E. coli
PLoS Genetics | www.plosgenetics.org 2 January 2009 | Volume 5 | Issue 1 | e1000344

Results/Discussion
The General Features of the Seven Sequenced GenomesWe fully sequenced the chromosomes and the plasmids, if any,
of 6 strains of E. coli and the reference type strain of E. fergusonii.
The general features of these replicons are listed in Tables 2 and 3.
Genomes were sequenced at an average of 12-fold coverage and
were then finished. The 6 newly sequenced E. coli chromosomes
contain between 4.7 Mb and 5.2 Mb each, corresponding to
between 4627 and 5129 protein coding genes, slightly above the
average value within the 20 genomes that we analyzed (,4700
genes, ranging from 4068 to 5379). The chromosome of E.
fergusonii is slightly smaller with ,4.6 Mb and ,4500 protein
coding genes. The G+C content is very similar among the 6 strains
and close to the E. coli K-12 MG1655 value (,50.8%). The G+C
content of E. fergusonii is lower at 49.9%. These chromosomes have
similar densities of coding genes and numbers of stable RNA
genes. By contrast, the number of pseudogenes varies more widely,
from 22 in E. fergusonii to 95 in strain ED1a (Table 2). The list of
pseudogenes is available in Table S1.
The variation in the number of pseudogenes is uncorrelated
with the number of transposable elements and phage-associated
genes, which vary in the range 42–224 and 201–517 respectively.
While some phage-associated genes are scattered throughout the
chromosomes, the majority are concentrated in well-defined
prophage regions. Analyses of the prophages suggest that many
may still be functional. These prophages often carry at their
extremity some unrelated cargo genes that probably arose from
genomes of previously infected bacteria, as found in Salmonella
[33]. We sequenced a total of 6 plasmids, varying in size from 34
to 134 kbp: four strains possess one plasmid each whereas one
strain has 2 plasmids (Table 3). As frequently noted, the plasmids
have a lower gene density (84%, vs. 87% for chromosomes), lower
G+C content (47.4%, vs. 50.7% for chromosomes) and more
pseudogenes (2.7%, vs. 1.5% for chromosomes). The percentage of
orphan proteins (i.e., having no detectable homolog in other
organisms) is also high on plasmids (6.5 to 52.2%), while it ranges
between 1–3% on the chromosomes.
A manual expert annotation of the new E. coli strains was
performed on genes and regions not found in E. coli K-12
MG1655 (about 10 000 genes in total; Table S2A). This allowed
the re-annotation of orthologs in the previously available
Escherichia and Shigella genomes (see Materials and Methods).
The annotation data, together with the results of the comparative
analysis were stored in a relational database called ColiScope,
which is publicly available using the MaGe Web-based interface at
http://www.genoscope.cns.fr/agc/mage. This re-annotation pro-
cess revealed extensive variations in the number of the newly
Table 1. Principal characteristics of the 20 Escherichia coli/Shigella strains and 1 E. fergusonii strain.
Strains Host SampleClinical condition(Pathotypea)
Phylogeneticgroupb
Extraintestinal mousemodel phenotypec (Numberof mice killed out of 10)
Genomesequencereference
K-12 MG1655 Human Faeces Commensal A NK (0) [115]
K- 12 W3110 Human Faeces Commensal A NK (0) Nara Instituteof Science andTechnology
IAI1 Human Faeces Commensal B1 NK (0) This work
55989 Human Faeces Diarrhoea (EAEC) B1 K (10) This work
S. boydii 4 227 (Sb 227) Human Faeces Shigellosis S1 NDd [116]
S. sonnei 046 (Ss 046) Human Faeces Shigellosis SS ND [116]
S. flexneri 2a 301 (Sf 301) Human Faeces Shigellosis S3 ND [117]
S. flexneri 2a 2457T (Sf 2457T) Human Faeces Shigellosis S3 NK (0) [118]
S. flexneri 5b 8401 (Sf 8401) Human Faeces Shigellosis S3 ND [119]
S. dysenteriae 1 197 (Sd 197) Human Faeces Shigellosis SD1 ND [116]
O157:H7 EDL933 Human Faeces Diarrhoea (EHEC) E NK (1) [120]
O157:H7 Sakai Human Faeces Diarrhoea (EHEC) E NK (1) [121]
UMN026 Human Urine Cystitis (ExPEC) D K (10) This work
IAI39 Human Urine Pyeloneprhitis (ExPEC) D K (8) This work
UTI89 Human Urine Cystitis (ExPEC) B2 K (10) [122]
APEC O1 Chicken Lung Colisepticemia (ExPEC) B2 K (10) [123]
S88 Human Cerebro-spinal fluid
New born meningitis(ExPEC)
B2 K (10) This work
CFT073 Human Blood Pyeloneprhitis (ExPEC) B2 K (10) [30]
ED1A Human Faeces Healthy subject B2 NK (0) This work
536 Human Urine Pyeloneprhitis (ExPEC) B2 K (10) [124]
E. fergusonii Human Faeces Unknown Outgroup NK (1) This work
The strains in bold correspond to the strains sequenced in this work.aEAEC (enteroaggregative E. coli), EHEC (enterohaemorrhagic E. coli), ExPEC (extraintestinal pathogenic E. coli).bThe E. coli and Shigella phylogenetic groups are as defined in [22] and [6], respectively.cK, killer; NK, Non Killer [32].dND, not determined.doi:10.1371/journal.pgen.1000344.t001
Organised Disorder in E. coli
PLoS Genetics | www.plosgenetics.org 3 January 2009 | Volume 5 | Issue 1 | e1000344

predicted genes (Table S2B). For example, between the two strains
of E. coli O157:H7 we found twice as many newly predicted genes
in one strain as in the other. In some genomes important genes
were missing. For example, in E. coli APEC O1 several subunits of
the ribosome, DNA polymerase III, and ATP synthase were
missing in the original annotation (Table S3, E. coli APEC sheet).
In other genomes, the re-annotation allowed us to standardise the
definition and identification of pseudogenes. For example, in S.
sonnei Ss 046 most of the newly annotated genes correspond to
insertion sequences (ISs) and small fragments of incompletely
annotated pseudogenes (Table S3, S. sonnei sheet). As a result of
this effort, the present ColiScope database contains a complete
and consistent set of annotations for the 7 newly sequenced
genomes and the 14 available Escherichia and Shigella genomes.
These data were the starting point of the work presented here.
We analyzed gene order conservation within the 21 genomes
(Table S4). More than half of the genomes have exactly the gene
order of E. coli K-12 MG1655, which we inferred as ancestral. Thus,
the organisation of the core genome is stable in most strains. Three
genomes show 1 or 2 rearrangements. Seven genomes show more
Table 2. General features of the Escherichia coli and E. fergusonii genomes sequenced in this work with E. coli K-12 MG1655 asreference (chromosome features).
Chromosome featuresE. coli K-12MG1655 E. coli strains E. fergusonii ATCC
55989 IAI1 ED1a S88 IAI39 UMN026
Genome Size (bp) 4 639 675 5 154 862 4 700 560 5 209 548 5 032 268 5 132 068 5 202 090 4 588 711
G+C content (%) 50.8 50.7 50.8 50.7 50.7 50.6 50.7 49.9
rRNA operons 7 (+5S) 7 (+5S) 7 (+5S) 7 (+5S) 7 (+5S) 7 (+5S) 7 (+5S) 7 (+5S)
tRNA genes 86 94 86 91 91 88 88 87
Total Protein-coding genesa 4306 4969 4491 5129 4859 4906 4918 4336
Pseudogenesb (nb) 81 79 51 95 90 80 45 22
Protein coding densityc 85.7 87.4 87.6 86.2 87 86.1 87.8 84.7
Assigned functiond (%) 80 74 77 74 77 78 76.5 77
Conserved hypothetical (%) 12.5 23 21.5 23 22 20 22 20
Orphans (%) 7.5 3 1.5 3 1 2 1.5 3
IS-like genes (nb) 66 150 42 118 47 224 92 29
Phage-associated genes (nb) 231 406 201 657 507 393 429 235
aThe number of protein-coding genes is given without the number of coding sequences annotated as artifactual genes (Supplementary Table 2A).bThe number of pseudogenes computed for each genome corresponds to the real number of genes that are pseudogenes: one pseudogene can be made of only one
CDS (in this case the gene is partial compared to the wild type form in other E. coli strains) or of several CDSs (generally two or three CDSs corresponding to thedifferent fragments of the wild type form in other E. coli strains). These lists of pseudogenes are available in Supplementary Table 1.
cThe computed protein coding density takes into account the total length of protein genes excluding overlaps between genes, artifacts, and RNA genes.dProtein genes with assigned function include the total number of definitive and putative functional assignments.doi:10.1371/journal.pgen.1000344.t002
Table 3. General features of the Escherichia coli and E. fergusonii genomes sequenced in this work with E. coli K-12 MG1655 asreference (plasmid features).
Plasmid features E. coli strains E. fergusonii ATCC
55989 ED1a S88 UMN026
Genome Size (bp) 72 482 119 594 133 853 122 301 33 809 55 150
G+C content (%) 46.1 49.2 49.3 50.5 42 48.5
Total Protein-coding genesa 100 150 144 149 49 54
Pseudogenesb (nb) 7 11 9 8 0 5
Protein coding densityc 75.6 86.2 87 79.4 87.5 88.7
Assigned functiond (%) 74 53 65 65.7 35.4 46.6
Orphans (%) 17 31.5 25.8 27.8 12.5 20.7
Hypothetical (%) 9 15.5 9.2 6.5 52.2 32.7
IS-like genes (nb) 18 14 14 15 0 4
aThe number of protein-coding genes is given without the number of coding sequences annotated as artifactual genes (Supplementary Table 2A).bThe number of pseudogenes computed for each genome corresponds to the real number of genes that are pseudogenes: one pseudogene can be made of only one
CDS (in this case the gene is partial compared to the wild type form in other E. coli strains) or of several CDSs (generally two or three CDSs corresponding to thedifferent fragments of the wild type form in other E. coli strains). These lists of pseudogenes are available in Supplementary Table 1.
cThe computed protein coding density takes into account the total length of protein genes excluding overlaps between genes, artifacts, and RNA genes.dProtein genes with assigned function include the total number of definitive and putative functional assignments.doi:10.1371/journal.pgen.1000344.t003
Organised Disorder in E. coli
PLoS Genetics | www.plosgenetics.org 4 January 2009 | Volume 5 | Issue 1 | e1000344
than 10 blocks of synteny: 6 of these genomes are from Shigella, the
high rearrangement rates of which resulted in up to 65 blocks of
synteny in S. dysenteriae. These genomes have a large number of ISs,
ranging from 549 to 1155 in S. flexneri and S. dysenteriae, respectively,
which are well known to shuffle genomes. E. fergusonii also shows a
large number of rearrangements relative to the ancestral organiza-
tion of the E. coli genome. Since the organisation of some strains of
the more distantly related Salmonella enterica closely resembles that of
E. coli K-12 MG1655, many rearrangements must have taken place
in the branch leading to E. fergusonii.
Figure S1 provides the classical concentric circle representation
for the 7 genomes we sequenced, showing GC skews, G+C variation,
and a description of the presence of genes in ever-increasing clades
within the genus, relative to the inferred ancestral genome. The first
position of the sequences was chosen to match the orthologous
region in the E. coli K-12 MG1655 genome and corresponds to the
intergenic region between lasT and thrL. Origins and termini of
replication were identified by GC skews and homology with the
respective E. coli K-12 MG1655 regions. These figures show that
divergence from the average G+C content often occurs in genomic
regions absent in the other strains. They also reveal the highly mosaic
structure of these genomes, comprising the core genes and the
accessory genes, which we then set out to quantify.
The Core and Pan-Genomes of E. coliThe analysis of the first E. coli genomes changed our views about
the evolution of gene repertoires in bacteria. Genomes within the
species vary in size by more than 1 Mb, i.e., by more than 1000
genes, and even the gene repertoires of similarly sized genomes
differ widely [30,34]. We have thus taken advantage of the
unprecedented availability of 20 completely sequenced genomes of
the same species to analyse the evolution of the gene repertoire.
We first identified the core and pan-genomes of E. coli, i.e., the
genes present in all genomes and the full set of non-orthologous
genes among all genomes. In our data set, the average E. coli
genome contains 4721 genes, the core genome contains 1976
genes, and the pan-genome contains 17 838 genes. The random
sampling of one gene within a randomly selected E. coli genome
has a probability of only ,42% of revealing a ubiquitous gene. On
the other hand, the full sequencing of an E. coli strain allows
observation of only one-fourth of the observed pan-genome. This
implies that although some fundamental functions can be well
studied by using a model strain, no single strain can be regarded as
highly representative of the species.
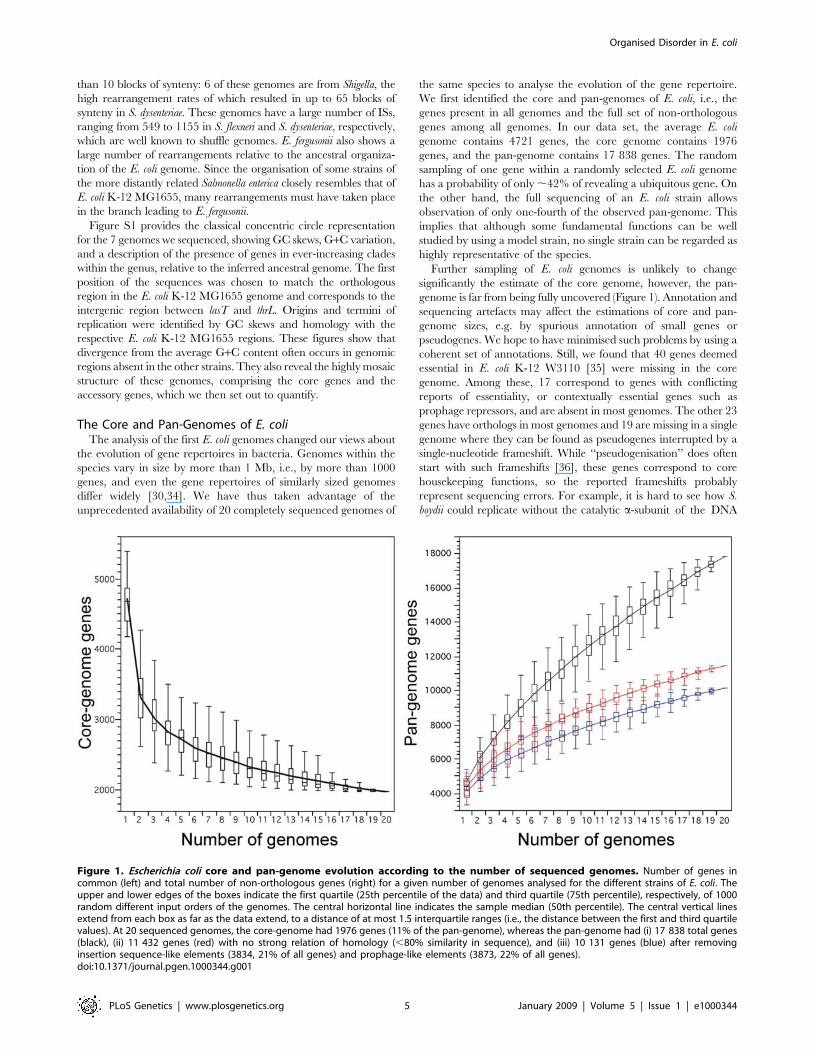
Further sampling of E. coli genomes is unlikely to change
significantly the estimate of the core genome, however, the pan-
genome is far from being fully uncovered (Figure 1). Annotation and
sequencing artefacts may affect the estimations of core and pan-
genome sizes, e.g. by spurious annotation of small genes or
pseudogenes. We hope to have minimised such problems by using a
coherent set of annotations. Still, we found that 40 genes deemed
essential in E. coli K-12 W3110 [35] were missing in the core
genome. Among these, 17 correspond to genes with conflicting
reports of essentiality, or contextually essential genes such as
prophage repressors, and are absent in most genomes. The other 23
genes have orthologs in most genomes and 19 are missing in a single
genome where they can be found as pseudogenes interrupted by a
single-nucleotide frameshift. While ‘‘pseudogenisation’’ does often
start with such frameshifts [36], these genes correspond to core
housekeeping functions, so the reported frameshifts probably
represent sequencing errors. For example, it is hard to see how S.
boydii could replicate without the catalytic a-subunit of the DNA
Figure 1. Escherichia coli core and pan-genome evolution according to the number of sequenced genomes. Number of genes incommon (left) and total number of non-orthologous genes (right) for a given number of genomes analysed for the different strains of E. coli. Theupper and lower edges of the boxes indicate the first quartile (25th percentile of the data) and third quartile (75th percentile), respectively, of 1000random different input orders of the genomes. The central horizontal line indicates the sample median (50th percentile). The central vertical linesextend from each box as far as the data extend, to a distance of at most 1.5 interquartile ranges (i.e., the distance between the first and third quartilevalues). At 20 sequenced genomes, the core-genome had 1976 genes (11% of the pan-genome), whereas the pan-genome had (i) 17 838 total genes(black), (ii) 11 432 genes (red) with no strong relation of homology (,80% similarity in sequence), and (iii) 10 131 genes (blue) after removinginsertion sequence-like elements (3834, 21% of all genes) and prophage-like elements (3873, 22% of all genes).doi:10.1371/journal.pgen.1000344.g001
Organised Disorder in E. coli
PLoS Genetics | www.plosgenetics.org 5 January 2009 | Volume 5 | Issue 1 | e1000344

polymerase III or how E. coli 536 could survive without a
tyrosine tRNA synthetase. We found some comfort in verifying
that none of the 23 genes was absent from the 7 genomes we
sequenced. If one assumes that these essential genes cannot be
deleted and that no special care has been taken to check for
sequencing errors at these loci, then our estimation of the core
genome should be increased by a factor of 260/(260-23) to 2167
genes. This still makes the core genome less than half of the
average E. coli genome (,46%). Importantly, no gene of the
core genome, nor any operon ubiquitous in E. coli, was unique
to the species, i.e., we could always find a homolog in at least
one of the other fully sequenced bacterial genomes.
Some elements recently amplified in the genome, such as
transposable elements, create multiple copies that are not
orthologs sensu strictu, even though they probably have the same
function. They will thus inflate the size of the pan-genome by
increasing the number of strain-specific genes. We therefore made
two complementary analyses. First, we classed together all
paralogs with more than 80% sequence similarity. This led to
11 432 genes of a functionally diverse pan-genome (Figure 1).
Second, we removed all transposable elements and prophages, but
not their cargo genes, from the pan-genome to obtain a set of
10 131 genes. These analyses still lead to a vast pan-genome for
the species and show that its large size is not a simple consequence
of the presence of selfish genes or recent amplifications of genetic
material. They also show that further sampling of E. coli genomes
is likely to uncover a significant number of currently unrecognised
genes that may confer lasting adaptive value for the diversification
of the species.
Progressive sampling of E. coli genomes will tend to reduce the
core genome to the list of essential genes because only
instantaneously lethal deletions will never be found in natural
populations of living cells. Hence, it is more relevant to quantify
the relative frequency of each gene of the pan-genome among
extant genomes (Figure 2). Of the genes in an average E. coli
genome, approximately 62% are present in at least 18 genomes,
and thus might be called the persistent genes [37], while 26% exist
in 4 or fewer genomes, and thus might be called the volatile genes.
Thus, most genes of the pan-genome exist in very few (#20%) or
almost all ($90%) of the genomes, leaving only a small subset of
genes that are present in around half of the genomes. The
functional pattern of these groups of genes varies. Genes of known
function are strongly over-represented among persistent genes,
whereas genes of unknown function and especially selfish DNA,
such as transposable and prophage elements, are over-represented
among strain-specific (volatile) genes (Figure 2). Although some of
these strain-specific genes may confer adaptive functions that
allow the exploration of new niches (see below the section on the
genome repertoire dynamics), the volatility of this set and the
functions thereby over-represented suggest that most such genes
are non-adaptive.
We assessed how different was E. fergusonii from the strains of E.
coli. We computed the core genome of the 21 genomes (20 E. coli+1
E. fergusonii), which contained 1878 genes. We then made
experiments in which we computed the core genome of all
combinations of 20 genomes and then added the 21st at the end.
We ranked the genomes in terms of which led to the highest
decrease in the core genome size. S. dysenteriae (174 genes) led to the
greatest reduction in the core genome, followed by E. fergusonii (98
genes). We then repeated the experiment with the pan-genome. In
this analysis, we also found that the most contributory 21st genome
was S. dysenteriae (1434 genes), followed by E. fergusonii (984 genes).
However, this results from the large number of ISs in the former
strain. When we computed the pan-genome while merging
together paralogs that are more than 80% identical, we found
that E. fergusonii ranks first (709 genes), well ahead of the second
place strain (E.coli CFT073 with 462 genes). This latter difference
matches the phylogenetic distance of E. fergusonii, but the overall
analysis shows that crossing the E. coli species barrier does not lead
to dramatic changes in the core and pan-genome.
Figure 2. Frequency of genes within the 20 analysed Escherichia coli genomes. At one extreme of the x-axis are the genes present in a singlegenome which are regarded as strain specific genes (9054 genes: 51% of the pan-genome), while at the opposite end of the scale are situated thegenes found in all 20 genomes, which represent the E. coli core-genome (1976 genes: 11% of the pan-genome). Coloured rectangles represent theproportion of insertion sequence (IS)-like elements (yellow), prophage-like elements (green), and genes of unknown/unclassified function (white).Black rectangles represent genes for which a function can be assigned. Strain-specific genes correspond to 2885 IS-like elements (32%), 2352prophage-like elements (26%), and 3220 genes of unknown/unclassified function (35%).doi:10.1371/journal.pgen.1000344.g002
Organised Disorder in E. coli
PLoS Genetics | www.plosgenetics.org 6 January 2009 | Volume 5 | Issue 1 | e1000344
Gene Conversion Is Frequent, but Not Enough So toObscure the Phylogenetic Signal
Horizontal transfer of new genes necessarily entails different
phylogenies for these genes, but has few implications for the
inference of phylogeny in the core genome. However, a
considerable fraction of the large amounts of DNA that seemingly
enter E. coli cells is expected to arise from consepecifics or closely
related species. Such DNA can integrate into the chromosome by
homologous recombination and thus lead to allelic replacements
that obscure the phylogenetic signal. To address this question, we
first estimated the rate of recombination in the genomes, then
tested whether such a rate could affect the phylogenetic
reconstruction.
Using methods based on the coalescent framework, it is possible
to estimate the ratio of recombination to mutation rates, i.e., to
compare the probability of a recombination being initiated at a
particular nucleotide with the probability of a mutation occurring
at that same nucleotide. We analyzed each core gene with LDHat,
a coalescent-based estimator of recombination [38], and estimated
an average ratio of recombination to mutation close to 1.0 (data
not shown). Classical population genetics models, such as the one
used in LDHat, assume that recombination occurs through
reciprocal exchange of DNA with a single crossover. In
prokaryotes, incoming DNA sequences are short and the
recombination process is akin to gene conversion, whereby linkage
between two close regions may be weaker than between two
distant ones if one of the former has engaged in conversion with
incoming DNA. Bacterial genetic exchange does not always imply
mechanisms strictly analogous to those involved in eukaryotic gene
conversion. However, since we are concerned more with the
signature of gene conversion in linkage disequilibrium than with
the underlying molecular mechanisms, we will use the term gene
conversion hereafter to refer generically to bacterial genetic
exchanges. We took advantage of the peculiar signature of gene
conversion on linkage disequilibrium [39] to estimate the per-base
rates of mutation (theta) and gene conversion (Cgc), as well as the
average tract length (Lgc) (assuming a geometrical distribution),
with Approximate Bayesian Computation method [40,41] (see
model in Materials and Methods). We applied the method to
individual genes of the core genome and to 3 kbp sliding windows
along the whole genome multiple alignment (see Materials and
Methods, Figure S2).
Both analyses provided similar average values, but since the
genes differ widely in size, we preferred to use the genome
alignment for the rest of the analyses. The average ratio of gene
conversion to mutation (Cgc/theta) was 2.4760.05. The average
tract length was very short: 50 bp on average, lower than our
previous estimate of 120 bp based on multi-locus sequence typing
(MLST) data [42], and lower than expected based on experimen-
tal data [43]. Contrary to expectations based on random
experiments (see Materials and Methods), we observed a strong
negative correlation (Pearson r = 20.55, p,0.001) between the
ratio of recombination to mutation and the length of the
conversion fragments. This may be explained by the overlap of
gene conversion fragments in regions of high rate of exchange,
which results in artificially low values of Lgc, lending further
support to the existence of high conversion rates in the population.
In any case, these tract lengths should not necessarily be equated
with the size of incoming DNA fragments.
Our model assumes a homogenous population. However, in the
gut of a vertebrate, the most likely neighbour for a cell probably is
another cell from the same clone, since mucus provides a
structured environment within which sister cells are likely to stay
together for some time. Transfers between such closely related
strains are less affected by restriction [43] or divergence [44].
Every time such a transfer overlaps with a previous transfer from a
distant clone it will effectively remove some trace of recombination
and, thus, lead to a lower observed tract length. In spite of such
limitations we find that a gene conversion event is twice as likely as
a mutation to occur at a given position. Therefore, taking into
account the estimated tract length (50 bp), a base is 100 times
more likely to be involved in a gene conversion than to be involved
in a mutation. This is twice as large as the classical estimate [27].
Is such a rate of gene conversion compatible with a meaningful
phylogeny? If we do not consider the specificities of bacterial
genetic exchange, the answer is no. The estimates provided under
a simple crossing-over model are incompatible with any
phylogenetic approach (data not shown). However the answer
might be different if one considers that exchange in bacteria results
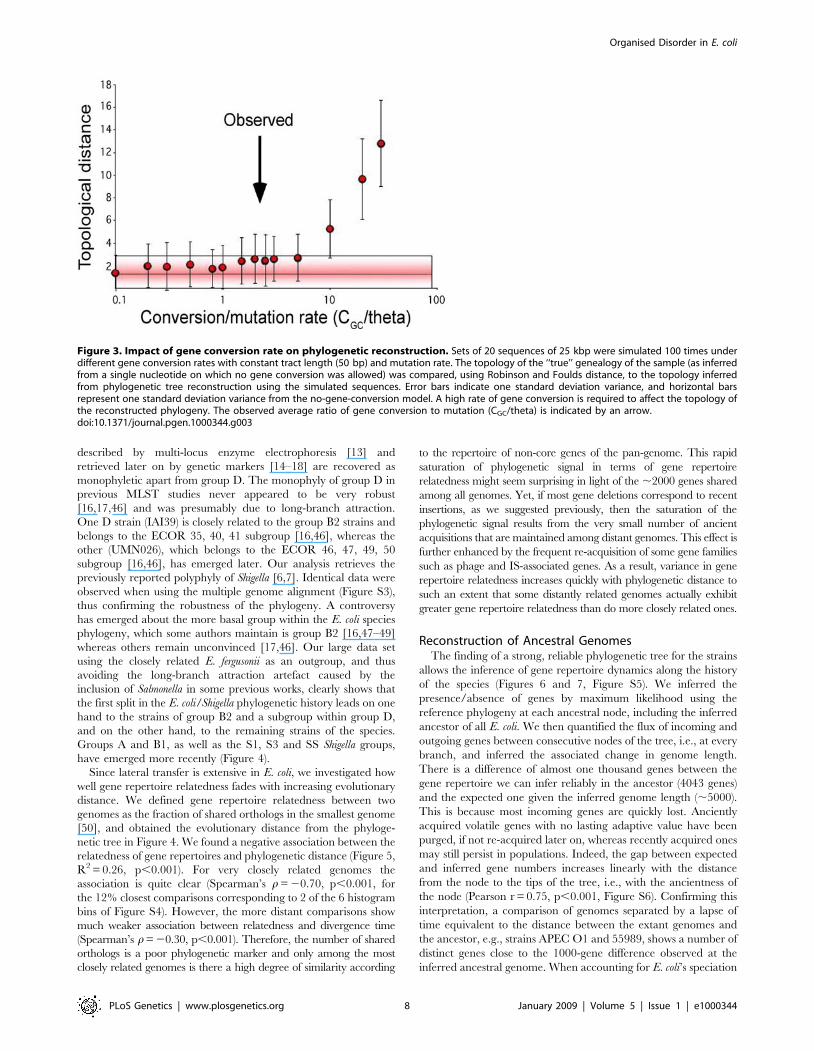
in gene conversion. To test this idea quantitatively, we made
coalescent simulations in which we used the parameters estimated
previously (theta = 0.014 and Lgc = 50) and various rates of gene
conversion to mutation (100 experiments for each value) to
simulate the evolution of 25 kbp sequences (see Materials and
Methods). We then compared the tree inferred by maximum
likelihood with the tree derived directly from the simulated history,
which reflects the history of the chromosomal background. We
compared the tree topologies with Robinson and Foulds distances
[45] and the SH, KH and ELW tests (see Materials and Methods).
The average distance between the topologies of the pair of trees
only starts to increase for gene conversion to mutation ratios (Cgc/
theta) much higher than the observed value (Figure 3). Hence,
surprisingly, the substantial level of gene conversion in E. coli is not
expected to blur the phylogenetic signal, and a meaningful and
robust tree topology can be extracted from the sequences.
The Phylogenetic History of the StrainsThe foregoing analysis suggests that phylogenetic approaches
can be used to analyse genome evolution even within highly non-
clonal prokaryotic species. We therefore characterised the
phylogenetic relationships among the 20 fully sequenced strains
and the outgroup, using a maximum likelihood approach on all
1878 genes of the Escherichia core genome (i.e., the genes present in
all 20 E. coli/Shigella and E. fergusonii), either independently or
concatenated (1 769 508 nt, 88 883 informative sites). The same
analysis was also performed on the chromosomal backbone using
the E. coli/Shigella multiple genome alignment (2 672 618 nt,
115 435 informative sites) that, in addition, integrates non-coding
sequences and pseudogenes.
Using the concatenated genes of the core genome and a
maximum likelihood approach, regardless of the method used to
estimate a model (see Materials and Methods) we obtained a
robust phylogeny with very high bootstrap values (Figure 4). When
each of the 1878 individual gene phylogenies is compared to the
concatenated gene phylogeny using various tree topology
comparison tests (see Materials and Methods), about 25% are
not significantly different from the concatenated gene tree. (It is
worth noting that these tests are very stringent, as tree topologies
differing by a single strain position can be significantly different.)
Similarly, when the ‘‘consensus strength’’ of a node is defined as
the percentage of genes that supports the bipartition at a specific
node using CONSENSE, it can be shown that nodal consensus
strength varies greatly, from 11% to 90% (Figure 4). However, in
both approaches (tree topology comparison tests and consensus
strength), the low values are largely due to an absence of
phylogenetic signal differentiating the strains rather than to
conflicting phylogenies, as 55% of genes have fewer than 40
informative sites (data not shown). All the classical groups
Organised Disorder in E. coli
PLoS Genetics | www.plosgenetics.org 7 January 2009 | Volume 5 | Issue 1 | e1000344
described by multi-locus enzyme electrophoresis [13] and
retrieved later on by genetic markers [14–18] are recovered as
monophyletic apart from group D. The monophyly of group D in
previous MLST studies never appeared to be very robust
[16,17,46] and was presumably due to long-branch attraction.
One D strain (IAI39) is closely related to the group B2 strains and
belongs to the ECOR 35, 40, 41 subgroup [16,46], whereas the
other (UMN026), which belongs to the ECOR 46, 47, 49, 50
subgroup [16,46], has emerged later. Our analysis retrieves the
previously reported polyphyly of Shigella [6,7]. Identical data were
observed when using the multiple genome alignment (Figure S3),
thus confirming the robustness of the phylogeny. A controversy
has emerged about the more basal group within the E. coli species
phylogeny, which some authors maintain is group B2 [16,47–49]
whereas others remain unconvinced [17,46]. Our large data set
using the closely related E. fergusonii as an outgroup, and thus
avoiding the long-branch attraction artefact caused by the
inclusion of Salmonella in some previous works, clearly shows that
the first split in the E. coli/Shigella phylogenetic history leads on one
hand to the strains of group B2 and a subgroup within group D,
and on the other hand, to the remaining strains of the species.
Groups A and B1, as well as the S1, S3 and SS Shigella groups,
have emerged more recently (Figure 4).
Since lateral transfer is extensive in E. coli, we investigated how
well gene repertoire relatedness fades with increasing evolutionary
distance. We defined gene repertoire relatedness between two
genomes as the fraction of shared orthologs in the smallest genome
[50], and obtained the evolutionary distance from the phyloge-
netic tree in Figure 4. We found a negative association between the
relatedness of gene repertoires and phylogenetic distance (Figure 5,
R2 = 0.26, p,0.001). For very closely related genomes the
association is quite clear (Spearman’s r = 20.70, p,0.001, for
the 12% closest comparisons corresponding to 2 of the 6 histogram
bins of Figure S4). However, the more distant comparisons show
much weaker association between relatedness and divergence time
(Spearman’s r = 20.30, p,0.001). Therefore, the number of shared
orthologs is a poor phylogenetic marker and only among the most
closely related genomes is there a high degree of similarity according
to the repertoire of non-core genes of the pan-genome. This rapid
saturation of phylogenetic signal in terms of gene repertoire
relatedness might seem surprising in light of the ,2000 genes shared
among all genomes. Yet, if most gene deletions correspond to recent
insertions, as we suggested previously, then the saturation of the
phylogenetic signal results from the very small number of ancient
acquisitions that are maintained among distant genomes. This effect is
further enhanced by the frequent re-acquisition of some gene families
such as phage and IS-associated genes. As a result, variance in gene
repertoire relatedness increases quickly with phylogenetic distance to
such an extent that some distantly related genomes actually exhibit
greater gene repertoire relatedness than do more closely related ones.
Reconstruction of Ancestral GenomesThe finding of a strong, reliable phylogenetic tree for the strains
allows the inference of gene repertoire dynamics along the history
of the species (Figures 6 and 7, Figure S5). We inferred the
presence/absence of genes by maximum likelihood using the
reference phylogeny at each ancestral node, including the inferred
ancestor of all E. coli. We then quantified the flux of incoming and
outgoing genes between consecutive nodes of the tree, i.e., at every
branch, and inferred the associated change in genome length.
There is a difference of almost one thousand genes between the
gene repertoire we can infer reliably in the ancestor (4043 genes)
and the expected one given the inferred genome length (,5000).
This is because most incoming genes are quickly lost. Anciently
acquired volatile genes with no lasting adaptive value have been
purged, if not re-acquired later on, whereas recently acquired ones
may still persist in populations. Indeed, the gap between expected
and inferred gene numbers increases linearly with the distance
from the node to the tips of the tree, i.e., with the ancientness of
the node (Pearson r = 0.75, p,0.001, Figure S6). Confirming this
interpretation, a comparison of genomes separated by a lapse of
time equivalent to the distance between the extant genomes and
the ancestor, e.g., strains APEC O1 and 55989, shows a number of
distinct genes close to the 1000-gene difference observed at the
inferred ancestral genome. When accounting for E. coli’s speciation
Figure 3. Impact of gene conversion rate on phylogenetic reconstruction. Sets of 20 sequences of 25 kbp were simulated 100 times underdifferent gene conversion rates with constant tract length (50 bp) and mutation rate. The topology of the ‘‘true’’ genealogy of the sample (as inferredfrom a single nucleotide on which no gene conversion was allowed) was compared, using Robinson and Foulds distance, to the topology inferredfrom phylogenetic tree reconstruction using the simulated sequences. Error bars indicate one standard deviation variance, and horizontal barsrepresent one standard deviation variance from the no-gene-conversion model. A high rate of gene conversion is required to affect the topology ofthe reconstructed phylogeny. The observed average ratio of gene conversion to mutation (CGC/theta) is indicated by an arrow.doi:10.1371/journal.pgen.1000344.g003
Organised Disorder in E. coli
PLoS Genetics | www.plosgenetics.org 8 January 2009 | Volume 5 | Issue 1 | e1000344

process from the other Escherichia spp. it should thus be borne in
mind that genes involved in speciation may have disappeared
altogether from extant lineages.
To analyse in detail the gains and losses of genes we considered that
genes were present at an ancestral node if the probability of presence
was higher than 50%, and otherwise were absent. (Variations around
this value had little effect of the overall results.) Genes were
then classified in 4 mutually exclusive categories: core genome,
clade-unspecific (i.e., also present in some genomes not descending
from the focal node), clade-specific and present in all descendents from
the focal node, or clade-specific but present in only some of the
descendents (Figure 5). Most non-core genes are clade-unspecific,
especially in nodes close to the root. This is best understood by
revisiting Figure 2, which shows that most non-core genes are present
in very few genomes. As a result, few genes in the internal nodes are
clade-specific and present in all genomes of the clade. The last
common ancestor is an exception because it contains many genes
present in some E. coli genomes but absent in E. fergusonii. Elsewhere,
very few genes are clade-specific, consistent with the idea that most
transferred genes quickly disappear from the populations.
Very recent acquisitions are highly enriched in phage-related
genes, except in the branches leading to Shigella where transposable
elements dominate (Figure 7). Few terminal branches show
significant amounts of acquisition of known function genes. The
exceptions, UMN026 and IAI39, correspond to the largest
terminal branches, which include very ancient and very recent
acquisitions. This pattern is suggestive of rare acquisition of genes
of known function followed by lower probability of loss for these
Figure 4. Maximum likelihood phylogenetic tree of the 20 Escherichia coli and Shigella strains as reconstructed from the sequencesof the 1878 genes of the Escherichia core genome. The earliest diverging species, E. fergusonii, was chosen to root the tree. The numbers at thenodes correspond, in black, to the bootstrap values (1000 bootstraps) and, in grey, to a ‘‘consensus strength’’, which is the number of genes thatconfirms the bipartition (see Materials and Methods). The latter value is displayed only in instances where consensus and tested trees correspond. Thebranch length separating E. fergusonii from the E. coli strains is not to scale; the numbers above the branch indicate its length. Phylogenetic groupmembership of the strains is indicated with bars at the right of the figure.doi:10.1371/journal.pgen.1000344.g004
Organised Disorder in E. coli
PLoS Genetics | www.plosgenetics.org 9 January 2009 | Volume 5 | Issue 1 | e1000344
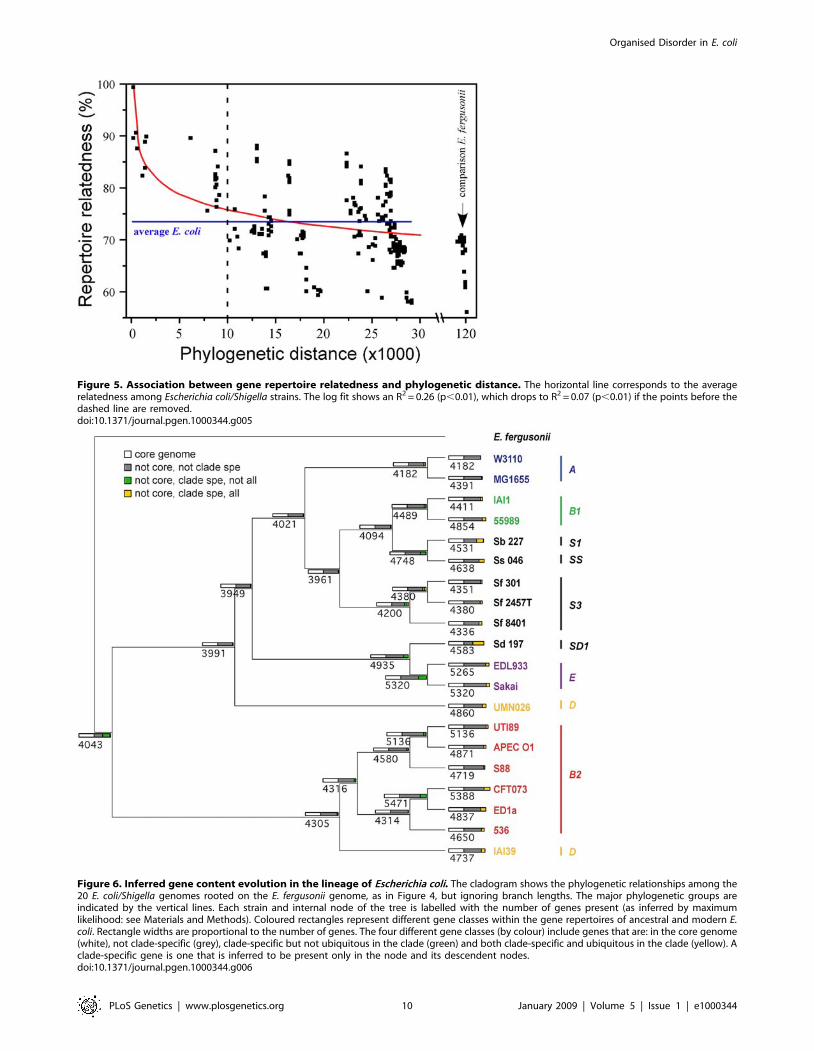
Figure 5. Association between gene repertoire relatedness and phylogenetic distance. The horizontal line corresponds to the averagerelatedness among Escherichia coli/Shigella strains. The log fit shows an R2 = 0.26 (p,0.01), which drops to R2 = 0.07 (p,0.01) if the points before thedashed line are removed.doi:10.1371/journal.pgen.1000344.g005
Figure 6. Inferred gene content evolution in the lineage of Escherichia coli. The cladogram shows the phylogenetic relationships among the20 E. coli/Shigella genomes rooted on the E. fergusonii genome, as in Figure 4, but ignoring branch lengths. The major phylogenetic groups areindicated by the vertical lines. Each strain and internal node of the tree is labelled with the number of genes present (as inferred by maximumlikelihood: see Materials and Methods). Coloured rectangles represent different gene classes within the gene repertoires of ancestral and modern E.coli. Rectangle widths are proportional to the number of genes. The four different gene classes (by colour) include genes that are: in the core genome(white), not clade-specific (grey), clade-specific but not ubiquitous in the clade (green) and both clade-specific and ubiquitous in the clade (yellow). Aclade-specific gene is one that is inferred to be present only in the node and its descendent nodes.doi:10.1371/journal.pgen.1000344.g006
Organised Disorder in E. coli
PLoS Genetics | www.plosgenetics.org 10 January 2009 | Volume 5 | Issue 1 | e1000344
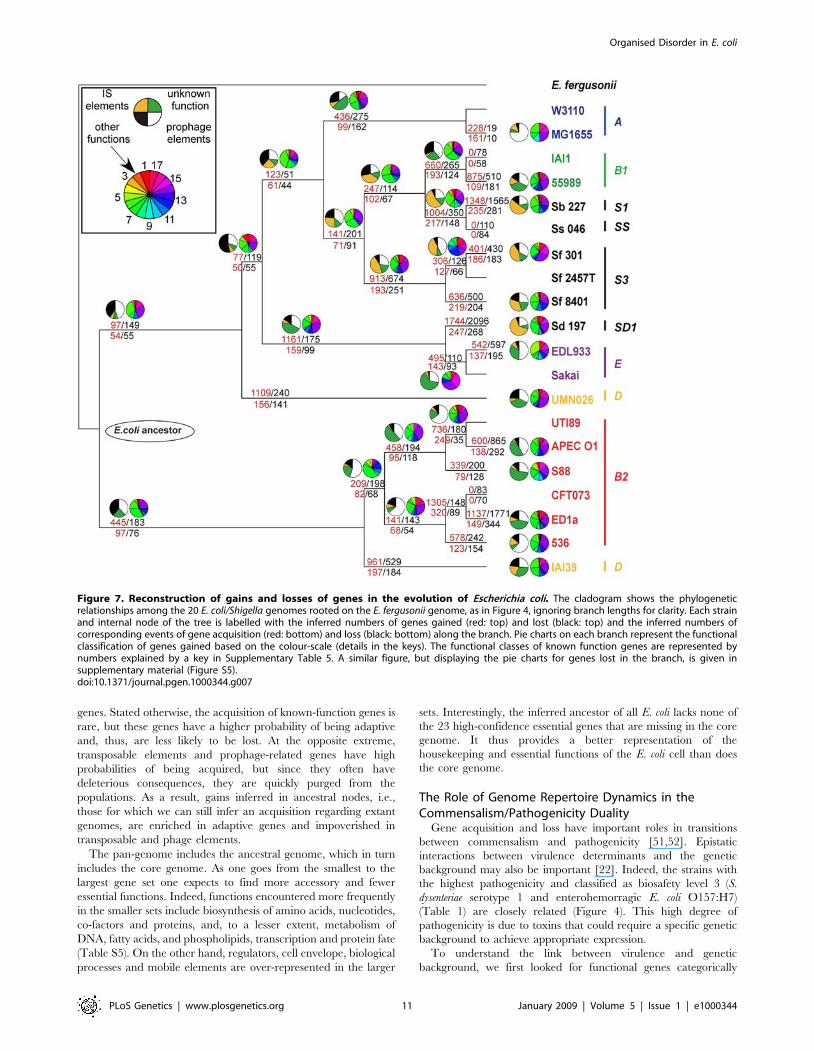
genes. Stated otherwise, the acquisition of known-function genes is
rare, but these genes have a higher probability of being adaptive
and, thus, are less likely to be lost. At the opposite extreme,
transposable elements and prophage-related genes have high
probabilities of being acquired, but since they often have
deleterious consequences, they are quickly purged from the
populations. As a result, gains inferred in ancestral nodes, i.e.,
those for which we can still infer an acquisition regarding extant
genomes, are enriched in adaptive genes and impoverished in
transposable and phage elements.
The pan-genome includes the ancestral genome, which in turn
includes the core genome. As one goes from the smallest to the
largest gene set one expects to find more accessory and fewer
essential functions. Indeed, functions encountered more frequently
in the smaller sets include biosynthesis of amino acids, nucleotides,
co-factors and proteins, and, to a lesser extent, metabolism of
DNA, fatty acids, and phospholipids, transcription and protein fate
(Table S5). On the other hand, regulators, cell envelope, biological
processes and mobile elements are over-represented in the larger
sets. Interestingly, the inferred ancestor of all E. coli lacks none of
the 23 high-confidence essential genes that are missing in the core
genome. It thus provides a better representation of the
housekeeping and essential functions of the E. coli cell than does
the core genome.
The Role of Genome Repertoire Dynamics in theCommensalism/Pathogenicity Duality
Gene acquisition and loss have important roles in transitions
between commensalism and pathogenicity [51,52]. Epistatic
interactions between virulence determinants and the genetic
background may also be important [22]. Indeed, the strains with
the highest pathogenicity and classified as biosafety level 3 (S.
dysenteriae serotype 1 and enterohemorragic E. coli O157:H7)
(Table 1) are closely related (Figure 4). This high degree of
pathogenicity is due to toxins that could require a specific genetic
background to achieve appropriate expression.
To understand the link between virulence and genetic
background, we first looked for functional genes categorically
Figure 7. Reconstruction of gains and losses of genes in the evolution of Escherichia coli. The cladogram shows the phylogeneticrelationships among the 20 E. coli/Shigella genomes rooted on the E. fergusonii genome, as in Figure 4, ignoring branch lengths for clarity. Each strainand internal node of the tree is labelled with the inferred numbers of genes gained (red: top) and lost (black: top) and the inferred numbers ofcorresponding events of gene acquisition (red: bottom) and loss (black: bottom) along the branch. Pie charts on each branch represent the functionalclassification of genes gained based on the colour-scale (details in the keys). The functional classes of known function genes are represented bynumbers explained by a key in Supplementary Table 5. A similar figure, but displaying the pie charts for genes lost in the branch, is given insupplementary material (Figure S5).doi:10.1371/journal.pgen.1000344.g007
Organised Disorder in E. coli
PLoS Genetics | www.plosgenetics.org 11 January 2009 | Volume 5 | Issue 1 | e1000344

present (i.e., ubiquitous in the clade but absent elsewhere) or
absent (i.e., absent in the clade but ubiquitously present elsewhere)
within three main phylogenetic groups: A, B1 and B2 (with group
D being unsuitable for the analysis as it is paraphyletic) (Table 4
and Table S6). Since only one group A strain was available (E. coli
K-12 MG1655), we added to this analysis the genome of strain HS
(http://msc.jcvi.org/e_coli_and_shigella/escherichia_coli_hs/index.
shtml), a group A human commensal strain. Few genes (5 to 81 per
phylogenetic group, depending on the group) were found to be
specific to and ubiquitous within the particular phylogenetic group, in
agreement with the high gene flow observed in the species. However,
the numbe of specific genes was higher within group B2 than within
other phylogenetic groups, despite the greater number of studied B2
genomes and the greater time of divergence of this phylogenetic
group (two factors that should decrease the number of shared genes)
(Table 4). This could indicate that these genes stably gained or lost,
contribute to the fitness of the group B2 strains. Indeed, only one of
these genes corresponds to a transposase and none to phages, whereas
75% have an assigned function. This is significantly higher (Chi
square test, p,0.001) than the proportion of genes with assigned
functions in the B2 pan-genome (4097 of 8439, 48.5%). Furthermore,
the distribution of the genes with assigned functions among different
functional categories (‘Product type’ annotations, Table 4) is
significantly different for the specific genes as compared with the
pan-genome (Chi square test, p = 0.049). The study of Pearson
residuals shows that the enzymes and transporters and carriers
categories contribute significantly to this difference. Integrative
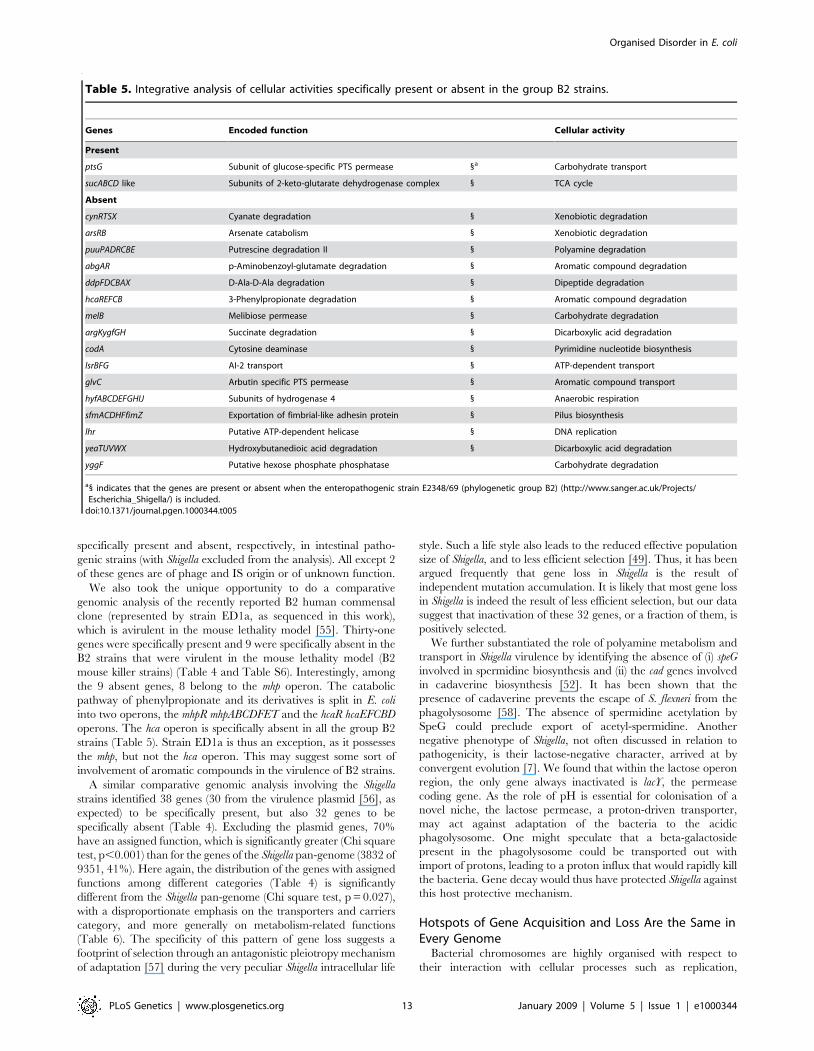
analysis of the documented functions of the specific genes shows a
large part of them to be involved in metabolism (Table 5). These
observations represent a hallmark of selection and suggest an
important role for metabolism in the niche adaptation of group B2
strains that needs to be further substantiated by experimental
analyses.
We then examined whether the presence of specific genes could
be related to a specific phenotype. No gene was specific either to
commensal strains or to pathogenic strains in general. However, in
extraintestinal pathogenic strains (ExPEC pathotype) 16 genes
were specifically present and 1 was specifically absent (Table 4).
Most of these genes have an assigned function corresponding
mainly to 2 clusters: (i) the pap operon, a well-known adhesin
determinant involved in the pathogenesis of urinary tract infection
[53], and (ii) two genes coding for an aldo-keto reductase activity
(one of these genes shares 95% identity with akr5f1 gene from
Klebsiella spp [54]) and a divergent lysR family regulatory gene
(Table S6). In addition, when considering intrinsic extraintestinal
virulence potential as assessed using a mouse model of septicaemia
that avoids host variability [32], no gene specific to the virulent
phenotype was identified. All these data indicate that extraintes-
tinal virulence is a multigenic process resulting from numerous
gene combinations and multiple redundancies. Furthermore, the
fact that no gene specific to extraintestinal infection could be
identified reinforces the hypothesis that extraintestinal virulence is
a coincidental by-product of commensalism [42]. This suggests
that the development of vaccines specific for extraintestinal
infections will be extremely difficult. Any gene target likely will
also be present in some commensal strains; therefore, such
vaccines will presumably lead to potentially undesirable modifica-
tion of the resident microbiota. Twenty and 4 genes were
Table 4. General characteristics of functional genes specifically present or absent in strains belonging to the main phylogeneticgroups or exhibiting a specific phenotype.
Phylogeneticgroupor phenotype
Specificgene Total Assigned functiona
Phageorigin IS
Unknownfunction
Total Enzymes RegulatorsTransportersand carriers Factors
Membranecomponents andstructures
Ab Present 19 4 1 1 0 1 1 2 1 12
Absent 19 4 3 0 1 0 0 10 0 5
B1 Present 23 6 1 0 1 1 3 0 1 16
Absent 5 4 2 0 1 0 1 0 0 1
B2 Present 62 (36)c 39 18 4 10 2 5 0 1 22
Absent 81 (80) 68 22 12 22 3 9 0 0 13
ExPEC pathotype Present 16 (13) 14 2 4 0 3 5 0 0 2
Absent 1 (0) 1 0 0 1 0 0 0 0 0
B2 mouse killer Present 31 (23) 11 6 3 1 1 0 1 1 18
Absent 9 (0) 8 6 1 1 0 0 0 1 0
Invasive diarrhoea(Shigella)
Present 8+30d 0 0 0 0 0 0 3 0 5
Absent 32 28 12 2 13 1 0 0 0 4
aFunctions were assigned according to E. coli K-12 MG1655 orthologous gene annotations [96] if any, or to similarity results obtained using the MicroScope analysispipeline described in [95]. The categories ‘Enzymes’, ‘Regulators’, ‘Transporters and carriers’ (‘carriers’ includes specialized electron-carrying proteins and electron-carrying subunits of enzymes), ‘Factors’ (such as transcription and translation factors, and chaperones), and ‘Membrane components and structures’ are fromGenProtEC [125] ‘Product type’ annotations (i.e., types of molecular functions) (Supplementary Table 6). The number of genes in each category does not take intoaccount genes from phage and insertion sequence (IS) origin.
bConsidering the complete genome of the strain HS (phylogenetic group A). (http://msc.jcvi.org/e_coli_and_shigella/escherichia_coli_hs/index.shtml).cConsidering the complete genome of enteropathogenic strain E2348/69 (phylogenetic group B2) (http://www.sanger.ac.uk/Projects/Escherichia_Shigella/). This strainis not virulent (0 of 10 mice killed) in the mouse model of extraintestinal virulence [32].
dGenes on the virulence plasmid [56], not detailed in the subsequent columns.doi:10.1371/journal.pgen.1000344.t004
Organised Disorder in E. coli
PLoS Genetics | www.plosgenetics.org 12 January 2009 | Volume 5 | Issue 1 | e1000344
specifically present and absent, respectively, in intestinal patho-
genic strains (with Shigella excluded from the analysis). All except 2
of these genes are of phage and IS origin or of unknown function.
We also took the unique opportunity to do a comparative
genomic analysis of the recently reported B2 human commensal
clone (represented by strain ED1a, as sequenced in this work),
which is avirulent in the mouse lethality model [55]. Thirty-one
genes were specifically present and 9 were specifically absent in the
B2 strains that were virulent in the mouse lethality model (B2
mouse killer strains) (Table 4 and Table S6). Interestingly, among
the 9 absent genes, 8 belong to the mhp operon. The catabolic
pathway of phenylpropionate and its derivatives is split in E. coli
into two operons, the mhpR mhpABCDFET and the hcaR hcaEFCBD
operons. The hca operon is specifically absent in all the group B2
strains (Table 5). Strain ED1a is thus an exception, as it possesses
the mhp, but not the hca operon. This may suggest some sort of
involvement of aromatic compounds in the virulence of B2 strains.
A similar comparative genomic analysis involving the Shigella
strains identified 38 genes (30 from the virulence plasmid [56], as
expected) to be specifically present, but also 32 genes to be
specifically absent (Table 4). Excluding the plasmid genes, 70%
have an assigned function, which is significantly greater (Chi square
test, p,0.001) than for the genes of the Shigella pan-genome (3832 of
9351, 41%). Here again, the distribution of the genes with assigned
functions among different categories (Table 4) is significantly
different from the Shigella pan-genome (Chi square test, p = 0.027),
with a disproportionate emphasis on the transporters and carriers
category, and more generally on metabolism-related functions
(Table 6). The specificity of this pattern of gene loss suggests a
footprint of selection through an antagonistic pleiotropy mechanism
of adaptation [57] during the very peculiar Shigella intracellular life
style. Such a life style also leads to the reduced effective population
size of Shigella, and to less efficient selection [49]. Thus, it has been
argued frequently that gene loss in Shigella is the result of
independent mutation accumulation. It is likely that most gene loss
in Shigella is indeed the result of less efficient selection, but our data
suggest that inactivation of these 32 genes, or a fraction of them, is
positively selected.
We further substantiated the role of polyamine metabolism and
transport in Shigella virulence by identifying the absence of (i) speG
involved in spermidine biosynthesis and (ii) the cad genes involved
in cadaverine biosynthesis [52]. It has been shown that the
presence of cadaverine prevents the escape of S. flexneri from the
phagolysosome [58]. The absence of spermidine acetylation by
SpeG could preclude export of acetyl-spermidine. Another
negative phenotype of Shigella, not often discussed in relation to
pathogenicity, is their lactose-negative character, arrived at by
convergent evolution [7]. We found that within the lactose operon
region, the only gene always inactivated is lacY, the permease
coding gene. As the role of pH is essential for colonisation of a
novel niche, the lactose permease, a proton-driven transporter,
may act against adaptation of the bacteria to the acidic
phagolysosome. One might speculate that a beta-galactoside
present in the phagolysosome could be transported out with
import of protons, leading to a proton influx that would rapidly kill
the bacteria. Gene decay would thus have protected Shigella against
this host protective mechanism.
Hotspots of Gene Acquisition and Loss Are the Same inEvery Genome
Bacterial chromosomes are highly organised with respect to
their interaction with cellular processes such as replication,
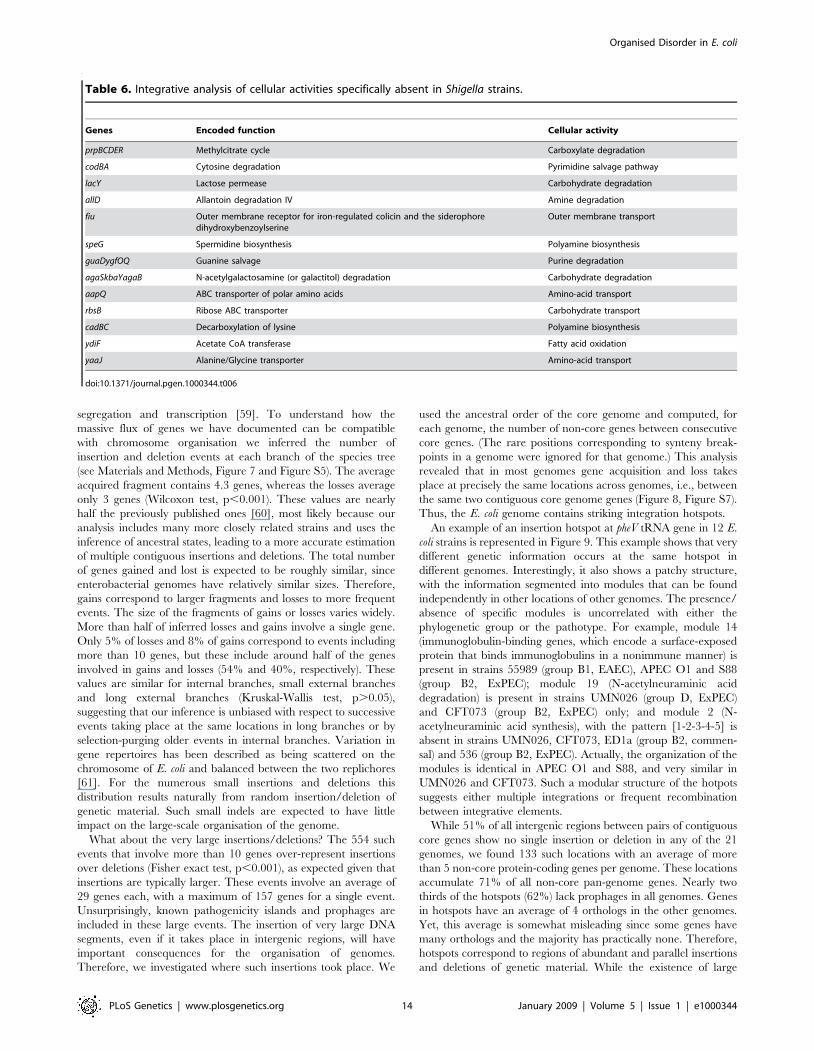
Table 5. Integrative analysis of cellular activities specifically present or absent in the group B2 strains.
Genes Encoded function Cellular activity
Present
ptsG Subunit of glucose-specific PTS permease 1a Carbohydrate transport
sucABCD like Subunits of 2-keto-glutarate dehydrogenase complex 1 TCA cycle
Absent
cynRTSX Cyanate degradation 1 Xenobiotic degradation
arsRB Arsenate catabolism 1 Xenobiotic degradation
puuPADRCBE Putrescine degradation II 1 Polyamine degradation
abgAR p-Aminobenzoyl-glutamate degradation 1 Aromatic compound degradation
ddpFDCBAX D-Ala-D-Ala degradation 1 Dipeptide degradation
hcaREFCB 3-Phenylpropionate degradation 1 Aromatic compound degradation
melB Melibiose permease 1 Carbohydrate degradation
argKygfGH Succinate degradation 1 Dicarboxylic acid degradation
codA Cytosine deaminase 1 Pyrimidine nucleotide biosynthesis
lsrBFG AI-2 transport 1 ATP-dependent transport
glvC Arbutin specific PTS permease 1 Aromatic compound transport
hyfABCDEFGHIJ Subunits of hydrogenase 4 1 Anaerobic respiration
sfmACDHFfimZ Exportation of fimbrial-like adhesin protein 1 Pilus biosynthesis
lhr Putative ATP-dependent helicase 1 DNA replication
yeaTUVWX Hydroxybutanedioic acid degradation 1 Dicarboxylic acid degradation
yggF Putative hexose phosphate phosphatase Carbohydrate degradation
a1 indicates that the genes are present or absent when the enteropathogenic strain E2348/69 (phylogenetic group B2) (http://www.sanger.ac.uk/Projects/Escherichia_Shigella/) is included.
doi:10.1371/journal.pgen.1000344.t005
Organised Disorder in E. coli
PLoS Genetics | www.plosgenetics.org 13 January 2009 | Volume 5 | Issue 1 | e1000344
segregation and transcription [59]. To understand how the
massive flux of genes we have documented can be compatible
with chromosome organisation we inferred the number of
insertion and deletion events at each branch of the species tree
(see Materials and Methods, Figure 7 and Figure S5). The average
acquired fragment contains 4.3 genes, whereas the losses average
only 3 genes (Wilcoxon test, p,0.001). These values are nearly
half the previously published ones [60], most likely because our
analysis includes many more closely related strains and uses the
inference of ancestral states, leading to a more accurate estimation
of multiple contiguous insertions and deletions. The total number
of genes gained and lost is expected to be roughly similar, since
enterobacterial genomes have relatively similar sizes. Therefore,
gains correspond to larger fragments and losses to more frequent
events. The size of the fragments of gains or losses varies widely.
More than half of inferred losses and gains involve a single gene.
Only 5% of losses and 8% of gains correspond to events including
more than 10 genes, but these include around half of the genes
involved in gains and losses (54% and 40%, respectively). These
values are similar for internal branches, small external branches
and long external branches (Kruskal-Wallis test, p.0.05),
suggesting that our inference is unbiased with respect to successive
events taking place at the same locations in long branches or by
selection-purging older events in internal branches. Variation in
gene repertoires has been described as being scattered on the
chromosome of E. coli and balanced between the two replichores
[61]. For the numerous small insertions and deletions this
distribution results naturally from random insertion/deletion of
genetic material. Such small indels are expected to have little
impact on the large-scale organisation of the genome.
What about the very large insertions/deletions? The 554 such
events that involve more than 10 genes over-represent insertions
over deletions (Fisher exact test, p,0.001), as expected given that
insertions are typically larger. These events involve an average of
29 genes each, with a maximum of 157 genes for a single event.
Unsurprisingly, known pathogenicity islands and prophages are
included in these large events. The insertion of very large DNA
segments, even if it takes place in intergenic regions, will have
important consequences for the organisation of genomes.
Therefore, we investigated where such insertions took place. We
used the ancestral order of the core genome and computed, for
each genome, the number of non-core genes between consecutive
core genes. (The rare positions corresponding to synteny break-
points in a genome were ignored for that genome.) This analysis
revealed that in most genomes gene acquisition and loss takes
place at precisely the same locations across genomes, i.e., between
the same two contiguous core genome genes (Figure 8, Figure S7).
Thus, the E. coli genome contains striking integration hotspots.
An example of an insertion hotspot at pheV tRNA gene in 12 E.
coli strains is represented in Figure 9. This example shows that very
different genetic information occurs at the same hotspot in
different genomes. Interestingly, it also shows a patchy structure,
with the information segmented into modules that can be found
independently in other locations of other genomes. The presence/
absence of specific modules is uncorrelated with either the
phylogenetic group or the pathotype. For example, module 14
(immunoglobulin-binding genes, which encode a surface-exposed
protein that binds immunoglobulins in a nonimmune manner) is
present in strains 55989 (group B1, EAEC), APEC O1 and S88
(group B2, ExPEC); module 19 (N-acetylneuraminic acid
degradation) is present in strains UMN026 (group D, ExPEC)
and CFT073 (group B2, ExPEC) only; and module 2 (N-
acetylneuraminic acid synthesis), with the pattern [1-2-3-4-5] is
absent in strains UMN026, CFT073, ED1a (group B2, commen-
sal) and 536 (group B2, ExPEC). Actually, the organization of the
modules is identical in APEC O1 and S88, and very similar in
UMN026 and CFT073. Such a modular structure of the hotpots
suggests either multiple integrations or frequent recombination
between integrative elements.
While 51% of all intergenic regions between pairs of contiguous
core genes show no single insertion or deletion in any of the 21
genomes, we found 133 such locations with an average of more
than 5 non-core protein-coding genes per genome. These locations
accumulate 71% of all non-core pan-genome genes. Nearly two
thirds of the hotspots (62%) lack prophages in all genomes. Genes
in hotspots have an average of 4 orthologs in the other genomes.
Yet, this average is somewhat misleading since some genes have
many orthologs and the majority has practically none. Therefore,
hotspots correspond to regions of abundant and parallel insertions
and deletions of genetic material. While the existence of large
Table 6. Integrative analysis of cellular activities specifically absent in Shigella strains.
Genes Encoded function Cellular activity
prpBCDER Methylcitrate cycle Carboxylate degradation
codBA Cytosine degradation Pyrimidine salvage pathway
lacY Lactose permease Carbohydrate degradation
allD Allantoin degradation IV Amine degradation
fiu Outer membrane receptor for iron-regulated colicin and the siderophoredihydroxybenzoylserine
Outer membrane transport
speG Spermidine biosynthesis Polyamine biosynthesis
guaDygfOQ Guanine salvage Purine degradation
agaSkbaYagaB N-acetylgalactosamine (or galactitol) degradation Carbohydrate degradation
aapQ ABC transporter of polar amino acids Amino-acid transport
rbsB Ribose ABC transporter Carbohydrate transport
cadBC Decarboxylation of lysine Polyamine biosynthesis
ydiF Acetate CoA transferase Fatty acid oxidation
yaaJ Alanine/Glycine transporter Amino-acid transport
doi:10.1371/journal.pgen.1000344.t006
Organised Disorder in E. coli
PLoS Genetics | www.plosgenetics.org 14 January 2009 | Volume 5 | Issue 1 | e1000344
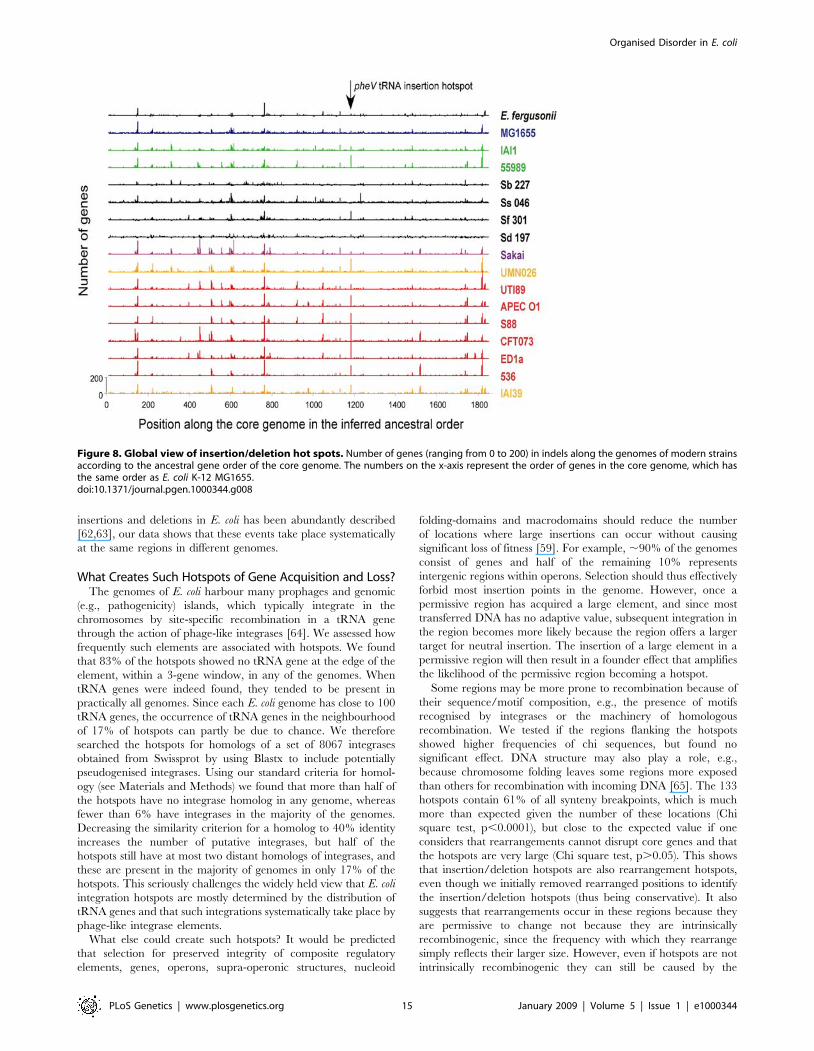
insertions and deletions in E. coli has been abundantly described
[62,63], our data shows that these events take place systematically
at the same regions in different genomes.
What Creates Such Hotspots of Gene Acquisition and Loss?The genomes of E. coli harbour many prophages and genomic
(e.g., pathogenicity) islands, which typically integrate in the
chromosomes by site-specific recombination in a tRNA gene
through the action of phage-like integrases [64]. We assessed how
frequently such elements are associated with hotspots. We found
that 83% of the hotspots showed no tRNA gene at the edge of the
element, within a 3-gene window, in any of the genomes. When
tRNA genes were indeed found, they tended to be present in
practically all genomes. Since each E. coli genome has close to 100
tRNA genes, the occurrence of tRNA genes in the neighbourhood
of 17% of hotspots can partly be due to chance. We therefore
searched the hotspots for homologs of a set of 8067 integrases
obtained from Swissprot by using Blastx to include potentially
pseudogenised integrases. Using our standard criteria for homol-
ogy (see Materials and Methods) we found that more than half of
the hotspots have no integrase homolog in any genome, whereas
fewer than 6% have integrases in the majority of the genomes.
Decreasing the similarity criterion for a homolog to 40% identity
increases the number of putative integrases, but half of the
hotspots still have at most two distant homologs of integrases, and
these are present in the majority of genomes in only 17% of the
hotspots. This seriously challenges the widely held view that E. coli
integration hotspots are mostly determined by the distribution of
tRNA genes and that such integrations systematically take place by
phage-like integrase elements.
What else could create such hotspots? It would be predicted
that selection for preserved integrity of composite regulatory
elements, genes, operons, supra-operonic structures, nucleoid
folding-domains and macrodomains should reduce the number
of locations where large insertions can occur without causing
significant loss of fitness [59]. For example, ,90% of the genomes
consist of genes and half of the remaining 10% represents
intergenic regions within operons. Selection should thus effectively
forbid most insertion points in the genome. However, once a
permissive region has acquired a large element, and since most
transferred DNA has no adaptive value, subsequent integration in
the region becomes more likely because the region offers a larger
target for neutral insertion. The insertion of a large element in a
permissive region will then result in a founder effect that amplifies
the likelihood of the permissive region becoming a hotspot.
Some regions may be more prone to recombination because of
their sequence/motif composition, e.g., the presence of motifs
recognised by integrases or the machinery of homologous
recombination. We tested if the regions flanking the hotspots
showed higher frequencies of chi sequences, but found no
significant effect. DNA structure may also play a role, e.g.,
because chromosome folding leaves some regions more exposed
than others for recombination with incoming DNA [65]. The 133
hotspots contain 61% of all synteny breakpoints, which is much
more than expected given the number of these locations (Chi
square test, p,0.0001), but close to the expected value if one
considers that rearrangements cannot disrupt core genes and that
the hotspots are very large (Chi square test, p.0.05). This shows
that insertion/deletion hotspots are also rearrangement hotspots,
even though we initially removed rearranged positions to identify
the insertion/deletion hotspots (thus being conservative). It also
suggests that rearrangements occur in these regions because they
are permissive to change not because they are intrinsically
recombinogenic, since the frequency with which they rearrange
simply reflects their larger size. However, even if hotspots are not
intrinsically recombinogenic they can still be caused by the
Figure 8. Global view of insertion/deletion hot spots. Number of genes (ranging from 0 to 200) in indels along the genomes of modern strainsaccording to the ancestral gene order of the core genome. The numbers on the x-axis represent the order of genes in the core genome, which hasthe same order as E. coli K-12 MG1655.doi:10.1371/journal.pgen.1000344.g008
Organised Disorder in E. coli
PLoS Genetics | www.plosgenetics.org 15 January 2009 | Volume 5 | Issue 1 | e1000344

brokering effect of homologous recombination. Indeed, incoming
DNA once integrated in one genome can propagate within the
population by lateral transfer via classical homologous recombi-
nation involving the homologous flanking regions. Given the
observed rates of recombination in the species, this mechanism
could quickly lead to the horizontal spread of highly adaptive
newly acquired genes. We describe some evidence for this in the
next section.
Hotspots of Phylogenetic IncongruenceFor any given sequence alignment, the likelihood of the overall
gene tree topology, i.e., the phylogenetic congruence, reflects the
extent to which the phylogenetic signal of the sequences was
altered by recombination. While the concatenate of genes provides
a strong phylogenetic signal, the individual genes’ histories can
be very diverse as a result of recombination. Furthermore,
these histories may depend on the genes’ positioning in the
chromosome. Notably, if homologous recombination helps in
disseminating recent acquisitions, as we propose, the core genome
around these hotspots should show signs of recombination as
indicated by phylogenetic incongruence. We therefore made an
analysis in 5 kbp sliding windows along the multiple genome
alignment to identify the most phylogenetically incongruent
regions (see Material and Methods). This method identified two
large regions of very strong incongruence, one centred around rfb
(Figure S8), the operon involved in O antigen synthesis, and the
other around the leuX tRNA gene, and including fimA, which is
under diversifying selection and is involved in the adhesion of
bacteria to host cells [66]. Both loci were previously identified as
hotspots of phylogenetic incongruence [67,68]; the present
analysis reveals how much they affect the chromosome.
Recombination at the rfb locus significantly affects congruence
within a striking 150 kbp surrounding region, i.e., from positions
1988 kbp to 2138 kbp (100% of windows tested had scores lower
than 1.96 standard deviation away from the average, with an
average of 24.84 and peaks at 210.19). The fim locus includes an
incongruence region close to 200 kbp in length (from positions
4421 kbp to 4618 kbp, average 22.54 standard deviation and
73% with lower than 21.96 standard deviation and peaks at
26.65). Interestingly those two regions are centered on integration
hotspots and encompass 11 of the 133 hotspots of integration. The
genes present in such loci arose most likely by lateral transfer since
Figure 9. The genomic island at the pheV tRNA insertion hot spot in the different Escherichia coli strains. The figure provides a syntheticview of the pheV tRNA insertion hotspot in the different studied E. coli strains. This region has been defined using the synteny breaks among 12 E. colistrains. In E. coli K-12 MG1655, the genes immediately flanking the pheV tRNA gene are the ECK2960 gene (speC, ornithine decarboxylase) and theECK2981 gene (pitB, phosphate transporter). In strain APEC O1, the pheV tRNA gene is absent. As most E. coli genomic regions have a compositestructure, e.g., a region partially conserved or found in different synteny groups in other strains (i.e., at different genomic locations), we have manuallydivided this large genomic island into sub-regions (or modules), which are found in only a subset of the compared E. coli strains. Homologousmodules have the same colour code and identifying number throughout. A total of 23 homologous modules were defined. The composition of thesemodules (i.e, the lists and functional descriptions of the constituent genes) is available in Supplementary Table 7. Black modules are strain-specific.Modules with hatched patterns correspond to repeated regions. Modules with grey dotted patterns are found in other strains but at anothergenomic location. The pathogenicity island published as PAI-V in UTI89 and 536 or PAI-I in APEC O1 and CFT073 ends just before module number 6.doi:10.1371/journal.pgen.1000344.g009
Organised Disorder in E. coli
PLoS Genetics | www.plosgenetics.org 16 January 2009 | Volume 5 | Issue 1 | e1000344

they are highly dissimilar between strains. For example, genes at
the rfb locus genes can exhibit less than 50% similarity, while the
leuX locus encompasses a highly variable assortment of non-
homologous inserts in all the genomes sequenced. Hence at least
for those two major loci we find a striking link between hotspots of
integration and hotspots of homologous recombination. In the
case of the rfb locus, it is worth noting that the incongruence signal
we observe might be a composite signal, due not only to rfb but
also to neighbouring loci. Within the above defined rfb region of
incongruence, a flagella locus (fli operon) associated with two
hotspots of integration is also under diversifying selection.
Moreover, the high pathogenicity island (HPI) is integrated within
that high recombination region in many isolates and corresponds
also to a hotspot of integration. It has been suggested that after a
recent and unique integration event, the HPI has propagated
within the species by homologous recombination [69]. The
propagation or diversification of these loci, located to the left of
rfb, through homologous recombination might generate the
asymmetrical pattern of phylogenetic incongruence we observe
around the rfb locus (extended incongruence on the left side of the
rfb locus) (Figure S8).
We found 23 other regions with weaker signatures of
incongruence (i.e., with a 5 kbp sequence incongruence score
more than 2 standard deviations from the average), each spanning
less than 20 kbp. It is important to note that most of these
incongruent regions include genes involved in diversification of
genetic information and often pathogenicity. The vast majority of
these include 3 groups of common genes. First are regions with the
porin-encoding genes ompA and ompC, the flagella-encoding genes,
the rfa locus coding for the core lipopolysaccaride and genes
coding for several membrane proteins such as LolCDE,
CcmABCDE, ABC transporter, AroP APC transporter, LplT-
aas, FadK, YeaY, EamB, YhgE and YicG membrane proteins.
These loci are probably involved in diversifying selection since
they code for antigenic proteins exposed at the cell surface. Second
are two regions encompassing mismatch repair genes (mutS and
mutH) that have been shown to be under selection for cycles of
inactivation and reacquisition through recombination [70]. Third
is a region associated with the integration of a locus that can
provide resistance to phages through clustered regulatory
interspaced short palindromic repeats (CRISPRs) [71].
All available methods estimate the effective, not the intrinsic,
recombination rate. Effective recombination results from the intrinsic
recombination rate and the ensuing selection on recombinants. Most
of the phylogenetic incongruence hotspots we found contain genes
under diversifying selection, for instance to escape immune pressure
or to acquire resistance to phage. Hence, it is very likely that
differences in the intensity of selection might be responsible for the
differences observed in the size of the regions affected by a
phylogenetic incongruence hotspot. A recombinant carrying a new
allele at a locus under strong diversifying selection will be selected and
thus will increase rapidly in frequency in populations. Hence, the
recombinant will invade the local population before any further
recombination occurs at the locus [72]. In that case, sampling the
genome after the action of natural selection allows identification of
the original recombining fragment. In contrast, if selection is
moderate, the recombining fragment that brought the interesting
allele into the genome will be covered by many further recombination
events before it reaches high frequency. In this case, only fragments
around the selected allele will retain the trace of the recombination
event. As a consequence, when selection is intense, one expects to
identify long recombinant fragments in some strains, as we did at the
rfb or leuX loci. Our observations suggest that the intensity of
diversifying selection acting on the rfb and leuX-fimH loci are under
very strong selective pressure compared with the diversifying selection
acting on the core LPS, the flagella or some of the porins. The fact
that most hotspots of integration (117 among 133) do not result in
hotspots of phylogenetic incongruence suggests that they carry
neutral or deleterious genes. Conversely, it also suggests that some
horizontally acquired genes can be highly beneficial (e.g., 11 hotspots
of phylogenetic incongruence around the rfb or leuX-fimH locus) or
moderately beneficial (e.g., 4 hotspots of integration associated with
hotspots of phylogenetic incongruence) and that this results in
different selection footprints in the neighbouring core genome.
Recombination and Chromosome OrganisationThe existence of integration and phylogenetic incongruence
hotspots brings to the fore the conflict between genome dynamics
and organisation. We therefore analysed the variation in recombi-
nation along the backbone sequence (as estimated by a population
genetic-based approach), using a sliding window of 3 kbp on the
multiple genome alignment and a step size of 500 bp. This analysis
revealed a large region around the terminus of replication with a
particularly low ratio between gene conversion and mutation rates
(Cgc/theta) (Figure 10). The region between 1 Mb and 2 Mb shows
lower gene conversion rates, since there is 20% lower chance for a
base to be involved in a gene conversion event (Cgc6Lgc, unilateral t
test: p = 1e-21). This region also shows 10% lower levels of
polymorphism (theta of Watterson, p = 1e-7), i.e., variations within
the E. coli species, and 2% lower G+C content (Figure 10). A+T
richness at the terminus region has been suggested to result from
higher mutation rates [73]. Based on comparative genomics with
Salmonella, it was also shown that divergence, i.e., the genetic distance
between species, slightly increased closer to the terminus [74,75],
further supporting the hypothesis of a higher local mutation rate.
Using our newly sequenced outgroup genome E. fergusonii, which
unlike Salmonella does not shows saturation of synonymous substitu-
tions, we found that the terminus domain has synonymous and non-
synonymous substitution rates twice as high as the rest of the
chromosome. While decreased G+C content and increased diver-
gence could reflect a higher mutation rate at the terminus, such an
interpretation is contradicted by the observed lower polymorphism.
Theoretical population genetic studies have shown that the
fluctuation of recombination frequency along chromosomes affects
the level of polymorphism and the efficiency of selection [76].
When there are numerous deleterious mutations and low
recombination rates, a fraction of the population bearing
deleterious alleles is doomed to disappear in the long term without
contributing to the gene pool of the future population. The
relevance of this phenomenon, referred to as background
selection, requires the existence of deleterious mutations of
moderate effects, i.e., mutations that can persist for some time in
the population before selection wipes them out. At the population
level, this result in an excess of rare alleles, which can be estimated
by Tajima’s D statistics. We found that overall a gene’s average
Tajima’s D was slightly negative (indicating an excess of rare
alleles). However, the Tajima’s D of synonymous mutations was
null, while that of non-synonymous mutations was much more
negative (Figure S9). This suggests that most non-synonymous
mutations are deleterious since, in contrast to synonymous
mutations, they do not increase in frequency within the population
reflecting the purging effect of natural selection. Therefore the
conditions for the action of background selection are met.
Furthermore, under background selection, a reduced recombina-
tion rate results in a decreased polymorphism (such as we observed
around the terminus), an increased fraction of rare alleles and a
decreased efficiency of selection [76]. The terminus region shows a
lower Tajima’s D than the rest of the chromosome (Student
Organised Disorder in E. coli
PLoS Genetics | www.plosgenetics.org 17 January 2009 | Volume 5 | Issue 1 | e1000344

bilateral test, p,0.00001). It also shows a reduced ratio of non-
synonymous to synonymous polymorphism (Student bilateral test,
p,0.002). This suggests that more non-synonymous mutations,
presumably slightly deleterious, persist around the terminus. When
applying the same approach to the ratio of non-synonymous to
synonymous divergence, we found more non-synonymous muta-
tions fixed around the terminus (Student bilateral test, p,0.05).
All these observations are in agreement with a reduced efficiency
of selection at this region, compatible with the effects of
background selection in low recombination regions.
The observed co-occurrence of lower GC% and lower
recombination rate at the terminus could also indicate a reduced
action of recombination to purge deleterious mutations in that
region. Most mutations tend to be from GC to AT and, as our
analysis of Tajima’s D revealed, most non-synonymous mutations
are presumably deleterious. Consequently, if a segment of DNA
lacking deleterious mutations replaces a fragment that contains
many of them, presumably GC-towards-AT, the resulting
recombinant will be selected for and, hence, will increase the
GC content. Therefore, in regions of low recombination rate, a
greater number of deleterious GC-towards-AT mutations will
accumulate. This is in agreement with recent analyses showing an
association between G+C enrichment and purifying selection of
non-synonymous substitutions [77].
Alternatively, recombination could have a direct mutagenic
effect. The biased gene conversion hypothesis, which enjoys
growing popularity to explain the G+C heterogeneity in
mammalian genomes, states that mismatches in recombination
heteroduplexes are repaired in favour of G and C [78]. If in E. coli,
as in humans and elephants, biased gene conversion results in
G+C enrichment, then lower conversion rates at the terminus
should result in the observed lower G+C content. Biased gene
conversion results in the biased segregation of nucleotides and,
therefore, in a gap between the composition of genomes and their
mutation patterns. We had previously found that such a gap was
common in bacterial genomes [79]. The re-assessment of those
data showed that in all 6 E. coli genomes considered in our
previous work the G+C content was higher than expected given
the observed mutational patterns. This suggests that mutations
towards G and C are more likely to attain fixation, in agreement
with the hypothesis of biased gene conversion in E. coli.
Both hypotheses are compatible with the pattern observed, but
attribute different meaning to reduced GC% at the terminus. In
the biased gene conversion hypothesis, lower GC% is just a result
of the mutational bias induced directly by recombination, while in
the second one a lower GC% reflects the lower efficiency of
recombination to purge slightly deleterious mutations and is
therefore a signature of maladaptation.
Why should conversion rates be lower at the terminus? This could
be explained by the patterns of genome organisation. Firstly, in
exponentially growing E. coli cells the regions near the origin of
replication are present in many more copies than the regions near the
terminus [80]. Therefore, they provide more abundant targets for
gene conversion with foreign DNA. Because of gene dosage effects
the origin of replication is also enriched in highly expressed genes,
which are under stronger purifying selection. This might lead to lower
observed rates of mutation or to higher rates of recombination, if
recombination’s role is to maintain housekeeping functions [81].
Secondly, the low recombination / high A+T content region near the
terminus coincides with the boundaries of the Ter macrodomain of
chromosome folding in E. coli [82]. Four macrodomains (Ori, Ter
and two flanking Ter named Right and Left: Figure 10) have been
described [82]. These macrodomains are compacted structures that
act as intra-chromosomal recombination insulators. Tight compac-
tion of the Ter domain might lead to lower conversion rates with
incoming DNA. The link between the frequency of gene conversion,
biased sequence composition, chromosome compaction and selection
highlights the intimate association between genome dynamics and
chromosome organisation.
Concluding RemarksNew high-throughput sequencing technologies will soon allow
the sequencing of hundreds of strains of the same species, but not
to completion and closure. The genomes of Escherichia that we
sequenced, the previously sequenced ones, plus others and our re-
annotation efforts, will provide a solid basis for the next phase of E.
Figure 10. Standardized cumulative sum of effective gene conversion rate and G+C content. Gene conversion rate (i.e., probability ofbeing involved in a gene conversion event Cgc.Lgc) is shown in blue, and G+C content in red. A decrease in the cumulative sum reflects regions oflower-than-expected values of the statistics. Around the terminus domain, we found a decrease in both recombination and G+C content. Colouredboxes represent the 4 different organisation macrodomains (Right, Ter, Left, Ori). The arrows point towards the origin and terminus of replication.doi:10.1371/journal.pgen.1000344.g010
Organised Disorder in E. coli
PLoS Genetics | www.plosgenetics.org 18 January 2009 | Volume 5 | Issue 1 | e1000344
coli genomics in which population genetics and experimental
evolution will have important roles. We also hope to have
contributed to narrowing the gap between population genetic and
phylogenetic approaches in studying genome evolution by showing
that they both can be used to untangle the effects of gene dynamics
on adaptation and genome organisation. Within a bacterial
species, the core genome evolves mostly through mutation and
recombination, whereas the rest of the genome is also subject to
horizontal gene transfer. While this fits with qualitative observa-
tions in other species [83–85], in E. coli the rates of lateral transfer
are particularly high and lead to very short gene residence times.
Furthermore, once introduced by lateral transfer, genes can spread
by homologous recombination at the flanking regions. Despite this
very high gene flow, genes co-exist in organised genomes. The
conflict between genome dynamics and organisation may have
resulted in the striking integration hotspots, which confine regions
of high instability. It may also have resulted in regionalised gene
conversion.
Chromosomal plasticity certainly accelerates the adaptation of E.
coli to varied environments. First, it allows many parallel and specific
evolutionary pathways of gain and loss of genes leading to convergent
phenotypes. Second, it allows multiple gene combinations that, with
epistatic interactions, will result in phenotypic diversification. As a
result of these complex evolutionary patterns, most often there is no
simple association between the presence of a gene and a given
phenotype. For example, our genomic analysis of the extraintestinal
virulence phenotype suggests that it will be very difficult to develop a
vaccine against extraintestinal infections without affecting also
resident intestinal microbiota because there is no single determinant
of the former. The vast diversity among E. coli genomes suggests that
the key to understanding the emergence of such phenotypes resides in
ampler sampling of natural isolates combined with a systematic
analysis of the data at a physiological level.
Materials and Methods
Bacterial StrainsSix E. coli strains as well as the type strain (ATCC 35469T) of E.
fergusonii, the closest E. coli-related species [31], were selected for
complete genome sequencing (Table 1). Among the E. coli strains,
2 were commensal: IAI1 (serogroup O8) was isolated from the
faeces of a young healthy military conscript in the 1980s in France
[23] and ED1a (serogroup O81) was isolated in the 2000s from the
faeces of a healthy man in France and belongs to a human-specific
widespread commensal clone that is increasing in frequency [55].
Four E. coli strains were pathogenic. Enteroaggregative E. coli
strain 55989 was originally isolated from the diarrheagenic stools
of an HIV-positive adult suffering from persistent watery diarrhea
in Central African Republic [86]. The enteroaggragative patho-
type is recognized as an emerging cause of diarrhoea in children
and adults worldwide [87]. Among the three extraintestinal
pathogenic strains, IAI 39 (serotype O7:K1) was isolated from
the urine of a patient with pyelonephritis in the 1980s in France
[23]. UMN026 (serotype O17:K52:H18) was isolated from a
woman with uncomplicated acute cystitis in 1999 in the USA
(Minnesota) and is a representative of a recently emerged E. coli
clonal group (‘‘clonal group A’’) that is now widely disseminated
and a cause of drug-resistant urinary tract and other extraintestinal
infections [88]. S88 (serotype O45:K1:H7) was isolated in 1999
from the cerebro-spinal fluid of a new born with late-onset
neonatal meningitis in France and represents what is now
considered a highly virulent emerging clone in France [89]. These
strains were distributed in 3 of the 4 main E. coli phylogenetic
groups: IAI1 and 55989 belong to group B1, UMN026 and
IAI392 belong to each of the two major subgroups within group
D, and ED1a and S88 belong to subgroups VIII and IX,
respectively, within group B2 [42]. Few data are available on E.
fergusonii strains. They have been isolated from humans and warm
blood animals, sometimes in pathogenic (intestinal and extrain-
testinal) conditions [90–92]. The main characteristics of the 14
strains (8 E. coli sensu strictu and 6 Shigella) with freely available
genomes at the time of the study are presented in Table 1. These
genomes were used for comparison purpose.
SequencingThree DNA libraries were constructed to determine, for each
strain, the complete genome sequence. Two of the libraries were
obtained after mechanical shearing of the genomic DNA and cloning
of the resulting 3 kbp and 10 kbp inserts into plasmids pcDNA2.1
(Invitrogen) and pCNS (pSU18 derived), respectively. DNA
fragments of about 30 kbp generated after partial digestion using
HindIII and/or Sau3A were introduced into pBeloBac11. Vector
DNAs were purified and end-sequenced using dye-terminator
chemistries on ABI3730 sequencers to provide an average of 12-
fold coverage for each genome. A pre-assembly was made without
repeat sequences, as previously described [93] using Phred/Phrap/
Consed software package (www.phrap.com). The finishing step was
achieved by primer walking, transposition and PCR.
Annotation and Re-Annotation of the EscherichiaGenomes
Once the consensus sequence of a first complete (single contig)
assembly was available for one of the new genomes, gene
prediction was conducted using the AMIGene software [94].
The predicted coding sequences (CDSs) were assigned a unique
identifier prefixed with ‘‘ECED1_’’ for E. coli ED1a, ‘‘EC55989_’’,
for E. coli 55989, ‘‘ECIAI1_’’ for E. coli IAI1, ‘‘ECIAI39_’’ for E.
coli IAI39, ‘‘ECS88_’’ for E. coli S88, ‘‘ECUMN_’’ for E. coli
UMN026, and ‘‘EFER_’’ for E. fergusonii ATCC. These identifiers
start with ‘p’ if the corresponding CDSs are encoded on plasmids.
The sets of predicted genes were submitted to automatic functional
annotation, as previously described [95]. Apart from the plasmid-
encoded genes, the final functional assignation was based on the
transfer of the recently updated E. coli K-12 MG1655 annotations
[96] between strong orthologs i.e., 85% identity over at least 80%
of the length of the smallest protein (Table S2A). Sequence data
for comparative analyses were obtained from the NCBI database
(RefSeq section, http://www.ncbi.nlm.nih.gov/RefSeq). Putative
orthologs and synteny groups (i.e., conservation of the chromo-
somal co-localisation between pairs of orthologous genes from
different genomes) were computed between each newly sequenced
genomes and all the other complete genomes, as previously
described [95]. All these data (syntactic and functional annota-
tions, results of comparative analysis) are stored in a relational
database, called ColiScope. Manual validation of the automatic
annotation by multiple users in different locations was performed
using the MaGe (Magnifying Genomes, http://www.genoscope.
cns.fr) web-based interface. For each newly sequenced genome,
only ‘specific’ regions, i.e., those containing genes not orthologous
to ones in E. coli K-12 MG1655 or to expert annotated genes in
another genome of the ColiScope project, were manually
annotated (Table S2A). In total, 9776 genes were annotated by
our group.
This expert work was also used to re-annotate the other public
and Shigella genomes. This allowed the creation of a set of
consistent expert annotations for the 20 genomes. First, we
integrated these genomes into the ColiScope database by using
MICheck, a method that enables rapid verification of sets of
Organised Disorder in E. coli
PLoS Genetics | www.plosgenetics.org 19 January 2009 | Volume 5 | Issue 1 | e1000344
annotated genes and frameshifts in previously published bacterial
genomes [97]. Some inaccurate or missed gene annotations were
defined for these genomes (see Table S2B and Table S3 for the list
of newly predicted genes in the 14 analyzed genomes). Second, we
automatically transferred the functional annotation of E. coli K-12
MG1655 genes, or genes annotated in the context of this project to
the genes in the other genomes that showed very strong sequence
similarity (85% identity over at least 80% of the length of the
smallest protein). The remaining genes, i.e., those without
orthologs in E. coli K-12 MG1655 or one of the new Escherichia
genomes, retained the original functional annotations (column
‘Specific’ genes in Table S2B).
The new E. coli and E. fergusonii nucleotide sequences and
annotations data have been deposited in the EMBL database
(http://www.ebi.ac.uk/embl; see accession numbers list below). In
addition, the ColiScope database, which includes all data for the
set of Escherichia and Shigella strains sequenced to date, is publicly
available via the MaGe interface at https://www.genoscope.cns.
fr/agc/mage.
Assignment of OrthologyA preliminary set of orthologs was defined by identifying unique
pairwise reciprocal best hits, with at least 80% similarity (,85%
identity) in amino acid sequence and less than 20% difference in
protein length. The analysis of orthology was made for every pair
of E. coli/Shigella genomes. The core genome, consisting of genes
ubiquitously found among all strains of the species, was defined as
the intersection of pairwise lists.
For every pair of genomes this list of persistent orthologs was
then supplemented, with attention to conservation of gene order.
Because (i) few rearrangements are observed at these short
evolutionary distances, and (ii) horizontal gene transfer is frequent,
genes outside conserved blocks of synteny are likely to be xenologs
or paralogs. Hence, we combined the homology analysis (protein
sequence similarity $80%, #20% difference in protein length)
with the classification of these genes as either syntenic or
nonsyntenic, for positional orthology determination. The analysis
was made for every pair of E. coli/Shigella genomes. The definitive
list of orthologs of the pan-genome was then defined as the union
of pairwise lists.
A syntenic block was defined as a set of consecutive pairs of
genes in the core genome. Conserved order gene blocks are
obtained by comparison of the localisation of best bi-directional hit
pairs in the core genome, adopting a window size of one gap.
These lists were also used to perform gene accumulation curves
using R, which describe the number of new genes and genes in
common, with the addition of new comparative genomes
(Figure 1). The procedure was repeated 1000 times by randomly
modifying genome insertion order to obtain median and quartiles.
Assignment of Homology and OrthologyIn the same bacterial species, homologs (paralogs, orthologs,
xenologs) were defined by identifying reciprocal blastp, with
$80% similarity in amino acid sequence and #20% difference in
protein length. Among different proteobacterial species, orthologs
were defined by identifying unique pairwise reciprocal best hits,
with $40% similarity in amino acid sequence and #20%
difference in protein length. The analysis of orthology was made
with 99 proteobacterial genomes.
Whole Genome Multi-Alignments of the 20 E. coli StrainsWhole genome alignments of the 20 E. coli/Shigella study
strains were performed using the Aligner algorithm of the
MAUVE program, version 2.0.0 [98], with the following
parameters: –island-size = 20 –backbone-size = 20 –max-back-
bone-gap = 20 –seed-size = 19 –gapped-aligner = clustal –max-
gapped-aligner-length = 10000 –min-recursive-gap-length = 5000
–weight = 5000. The MAUVE output file was further treated so
as to assign each part of the alignment to either one of two
categories, ‘backbone’ or ‘variable segment’ (previously named
‘loops’), as described [99]. Briefly, regions not belonging to a
‘‘match’’, as defined by MAUVE and less than 10 kbp long were
aligned using ClustalW and the alignment was automatically
inspected. The region was considered as a backbone segment if all
pairwise comparisons gave more than 76% identity, with never
more than 20 consecutive gaps. In all other cases, the entire region
was considered as a variable segment.
To produce the DNA alignment file from the above mentioned
procedure, the coordinates of all backbone segments on each
genome were extracted and aligned with MAFFT, version 6.24
[100], using a home made Perl script. Segments were first aligned
with the ‘–globalpair option’, which is suitable for a suite of
globally alignable sequences. When problems occurred (especially
for long backbone segments), MAFFT alignments were computed
using the ‘–auto’ option which automatically selects an appropriate
alignment algorithm according to data size.
Statistical analysis along the chromosome (scans). Along the
chromosomal multiple genome alignment we studied the variation
of descriptive statistics, such as the GC% and estimates of the
mutation and recombination rates. We estimated each statistics, F,
on a sliding window of constant size along the concatenated
alignment. We then estimated the average value of the statistic mand its standard deviation s with the median and the inter quartile
distance (normalised by a factor of 1.38) as these estimates are less
affected by the existence of extremes values. We then calculated
the standardised cumulative sum along the genome
S xð Þ~Px
i~0
F ið Þ{mð Þs . When the cumulative sum is decreasing in a
region, it means that this region harbours a lower than average
value of the statistics. Hence for each statistics we can identify the
boundaries of regions having atypical values.
Phylogenetic AnalysesTo reconstruct the phylogeny of the strains, we used two data
sets: the genes common to all the E. coli/Shigella and E. fergusonii
strains (Escherichia core genome) and the genome backbone,
defined as above. We also used several methods for each dataset.
(i) The reference phylogenetic tree of the Escherichia core genome
genes was reconstructed from the concatenated alignments of 1878
genes of the core genome of the E. coli/Shigella and E. fergusonii
strains. We used Tree-puzzle 5.2 [101] to compute the distance
matrix between all strains using maximum likelihood under the
HKY+gamma (with 8 categories)+I model. The tree was then built
from the distance matrix using BioNJ [102]. We made 1000
bootstrap experiments on the concatenated sequences to assess the
robustness of the topology. (ii) We also inferred a tree for each of
the 1878 genes in the core genome, using maximum likelihood
with PHYML 2.4.4 with a GTR+gamma+I model for each gene
[103]. For each tree we extracted the relevant parameters of the
model and made a weighted average to obtain a global average
model. We used the lengths of the genes as weights of the average.
The global model thus obtained was used to infer a tree based on
the concatenation of the genes using Tree-puzzle 5.2. The tree was
then built from the matrix of distances using the BioNJ algorithm.
To check that the branch lengths obtained with this method were
correct we computed them by maximum likelihood by imposing
the tree topology (baseML from package PAML 4 implementation
[104]). The differences found were extremely small. To assess the
Organised Disorder in E. coli
PLoS Genetics | www.plosgenetics.org 20 January 2009 | Volume 5 | Issue 1 | e1000344
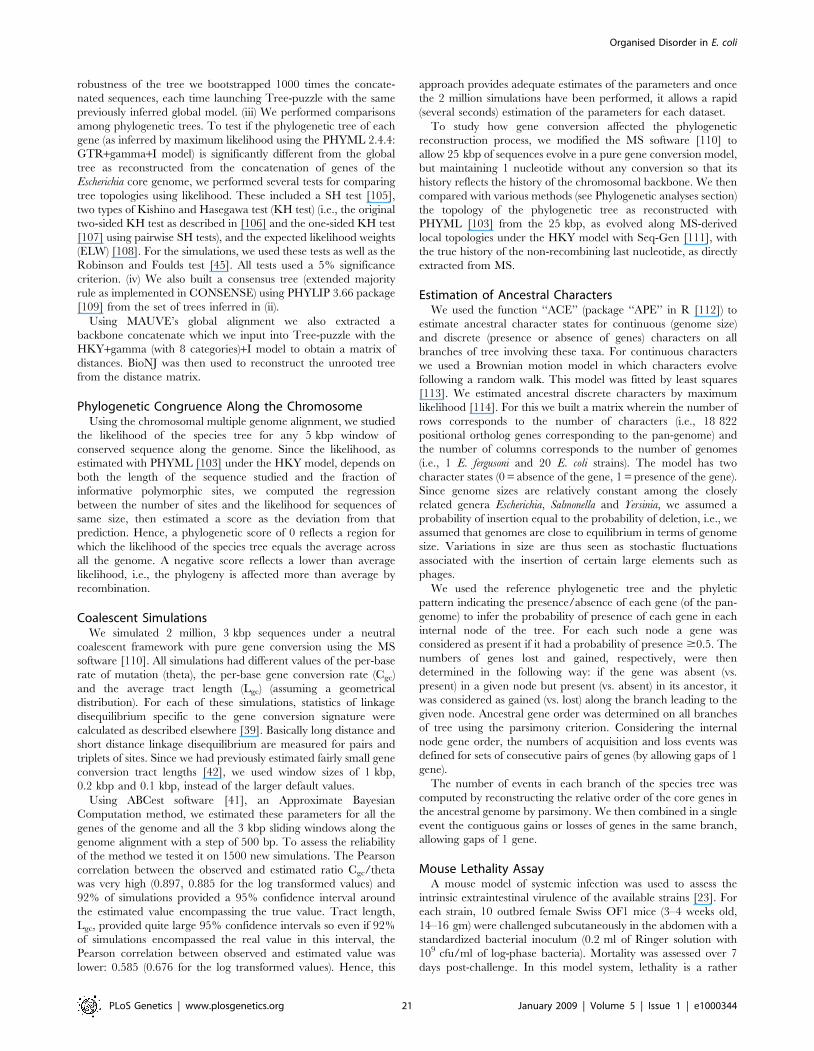
robustness of the tree we bootstrapped 1000 times the concate-
nated sequences, each time launching Tree-puzzle with the same
previously inferred global model. (iii) We performed comparisons
among phylogenetic trees. To test if the phylogenetic tree of each
gene (as inferred by maximum likelihood using the PHYML 2.4.4:
GTR+gamma+I model) is significantly different from the global
tree as reconstructed from the concatenation of genes of the
Escherichia core genome, we performed several tests for comparing
tree topologies using likelihood. These included a SH test [105],
two types of Kishino and Hasegawa test (KH test) (i.e., the original
two-sided KH test as described in [106] and the one-sided KH test
[107] using pairwise SH tests), and the expected likelihood weights
(ELW) [108]. For the simulations, we used these tests as well as the
Robinson and Foulds test [45]. All tests used a 5% significance
criterion. (iv) We also built a consensus tree (extended majority
rule as implemented in CONSENSE) using PHYLIP 3.66 package
[109] from the set of trees inferred in (ii).
Using MAUVE’s global alignment we also extracted a
backbone concatenate which we input into Tree-puzzle with the
HKY+gamma (with 8 categories)+I model to obtain a matrix of
distances. BioNJ was then used to reconstruct the unrooted tree
from the distance matrix.
Phylogenetic Congruence Along the ChromosomeUsing the chromosomal multiple genome alignment, we studied
the likelihood of the species tree for any 5 kbp window of
conserved sequence along the genome. Since the likelihood, as
estimated with PHYML [103] under the HKY model, depends on
both the length of the sequence studied and the fraction of
informative polymorphic sites, we computed the regression
between the number of sites and the likelihood for sequences of
same size, then estimated a score as the deviation from that
prediction. Hence, a phylogenetic score of 0 reflects a region for
which the likelihood of the species tree equals the average across
all the genome. A negative score reflects a lower than average
likelihood, i.e., the phylogeny is affected more than average by
recombination.
Coalescent SimulationsWe simulated 2 million, 3 kbp sequences under a neutral
coalescent framework with pure gene conversion using the MS
software [110]. All simulations had different values of the per-base
rate of mutation (theta), the per-base gene conversion rate (Cgc)
and the average tract length (Lgc) (assuming a geometrical
distribution). For each of these simulations, statistics of linkage
disequilibrium specific to the gene conversion signature were
calculated as described elsewhere [39]. Basically long distance and
short distance linkage disequilibrium are measured for pairs and
triplets of sites. Since we had previously estimated fairly small gene
conversion tract lengths [42], we used window sizes of 1 kbp,
0.2 kbp and 0.1 kbp, instead of the larger default values.
Using ABCest software [41], an Approximate Bayesian
Computation method, we estimated these parameters for all the
genes of the genome and all the 3 kbp sliding windows along the
genome alignment with a step of 500 bp. To assess the reliability
of the method we tested it on 1500 new simulations. The Pearson
correlation between the observed and estimated ratio Cgc/theta
was very high (0.897, 0.885 for the log transformed values) and
92% of simulations provided a 95% confidence interval around
the estimated value encompassing the true value. Tract length,
Lgc, provided quite large 95% confidence intervals so even if 92%
of simulations encompassed the real value in this interval, the
Pearson correlation between observed and estimated value was
lower: 0.585 (0.676 for the log transformed values). Hence, this
approach provides adequate estimates of the parameters and once
the 2 million simulations have been performed, it allows a rapid
(several seconds) estimation of the parameters for each dataset.
To study how gene conversion affected the phylogenetic
reconstruction process, we modified the MS software [110] to
allow 25 kbp of sequences evolve in a pure gene conversion model,
but maintaining 1 nucleotide without any conversion so that its
history reflects the history of the chromosomal backbone. We then
compared with various methods (see Phylogenetic analyses section)
the topology of the phylogenetic tree as reconstructed with
PHYML [103] from the 25 kbp, as evolved along MS-derived
local topologies under the HKY model with Seq-Gen [111], with
the true history of the non-recombining last nucleotide, as directly
extracted from MS.
Estimation of Ancestral CharactersWe used the function ‘‘ACE’’ (package ‘‘APE’’ in R [112]) to
estimate ancestral character states for continuous (genome size)
and discrete (presence or absence of genes) characters on all
branches of tree involving these taxa. For continuous characters
we used a Brownian motion model in which characters evolve
following a random walk. This model was fitted by least squares
[113]. We estimated ancestral discrete characters by maximum
likelihood [114]. For this we built a matrix wherein the number of
rows corresponds to the number of characters (i.e., 18 822
positional ortholog genes corresponding to the pan-genome) and
the number of columns corresponds to the number of genomes
(i.e., 1 E. fergusoni and 20 E. coli strains). The model has two
character states (0 = absence of the gene, 1 = presence of the gene).
Since genome sizes are relatively constant among the closely
related genera Escherichia, Salmonella and Yersinia, we assumed a
probability of insertion equal to the probability of deletion, i.e., we
assumed that genomes are close to equilibrium in terms of genome
size. Variations in size are thus seen as stochastic fluctuations
associated with the insertion of certain large elements such as
phages.
We used the reference phylogenetic tree and the phyletic
pattern indicating the presence/absence of each gene (of the pan-
genome) to infer the probability of presence of each gene in each
internal node of the tree. For each such node a gene was
considered as present if it had a probability of presence $0.5. The
numbers of genes lost and gained, respectively, were then
determined in the following way: if the gene was absent (vs.
present) in a given node but present (vs. absent) in its ancestor, it
was considered as gained (vs. lost) along the branch leading to the
given node. Ancestral gene order was determined on all branches
of tree using the parsimony criterion. Considering the internal
node gene order, the numbers of acquisition and loss events was
defined for sets of consecutive pairs of genes (by allowing gaps of 1
gene).
The number of events in each branch of the species tree was
computed by reconstructing the relative order of the core genes in
the ancestral genome by parsimony. We then combined in a single
event the contiguous gains or losses of genes in the same branch,
allowing gaps of 1 gene.
Mouse Lethality AssayA mouse model of systemic infection was used to assess the
intrinsic extraintestinal virulence of the available strains [23]. For
each strain, 10 outbred female Swiss OF1 mice (3–4 weeks old,
14–16 gm) were challenged subcutaneously in the abdomen with a
standardized bacterial inoculum (0.2 ml of Ringer solution with
109 cfu/ml of log-phase bacteria). Mortality was assessed over 7
days post-challenge. In this model system, lethality is a rather
Organised Disorder in E. coli
PLoS Genetics | www.plosgenetics.org 21 January 2009 | Volume 5 | Issue 1 | e1000344

clear-cut parameter and, based on the number of mice killed,
almost all strains were classified as non-killer (,2 of 10 mice killed)
or killer (.8 mice killed) [32].
Supporting Information
Figure S1 Circular representation of the six Escherichia coli
genomes and the E. fergusonii genome. Circles display from the
inside out: (1) GC skew (G+C/G2C using a 1 kbp sliding
window). (2) Location of tRNA genes, rRNA operons and
Insertion Sequences (ISs). (3) GC deviation (difference between
the mean GC content in a 1 kbp window and the overall mean
GC). Red areas indicate that the deviation is greater than 2
standard deviations. (4) Ancestral E. coli genome. Yellow areas
denote genes that are present in all the genomes under study. (5)
Scale. (6) Gene specificity at strain level. Genes sharing at least one
homolog in an other E. coli strain of the same phylogenetic group
and having more than 85% identity over at least 80% of their
length were regarded as non specific. To simplify the visualisation
of specific regions, we created a colour gradient that denotes the
percentage of organisms that possess a homolog of a given gene
within the reference genome. If this particular gene is present in all
the organisms under study, it is tagged in light grey. Conversely, if
it is present only in the reference genome, it is tagged in dark
colour. In other words, the more pronounced the colour, the
higher the specificity. (7) Gene specificity at group level. The same
criteria were used as for circle (6) but the genome analysed is
compared to E. coli strains that belong to other phylogenetic
groups. The comparison includes Shigella as well. (8) Gene
specificity at the species level. The same protocol was used as
for circles (6) and (7) except the comparison involves E. fergusonii
which is considered as the outgroup for this study.
Found at: doi:10.1371/journal.pgen.1000344.s001 (1.82 MB PPT)
Figure S2 Visual representation of MAUVE multiple alignment
of 20 Escherichia coli/Shigella genomes. The representation was
performed using the MOSAIC database (http://genome.jouy.
inra.fr/mosaic/) multiple alignment viewer. Horizontal lines
correspond to a linear representation of each genome sequence
drawn to scale. The blue line corresponds to annotated genes. (At
this scale only a unique line is visible.) Coloured blocks correspond
to the locally collinear blocks (LCBs) of the alignment as defined
by MAUVE. LCBs corresponding to inversions are represented on
a second line. An LCB in one genome is linked to the
corresponding LCB on the subsequent genome with a plot of
the same colour. This visual representation shows that, apart from
the rearrangements present in Shigella chromosomes, E. coli
genomes are mostly collinear.
Found at: doi:10.1371/journal.pgen.1000344.s002 (0.11 MB PPT)
Figure S3 Phylogenetic tree of the backbone of the 20 Escherichia
coli and Shigella strains as reconstructed by MAUVE software. This
unrooted tree was built using Tree-puzzle with the HKY+gamma
(with 8 categories)+I model followed by BioNJ to reconstruct the
tree from the distance matrix. The values at the nodes correspond
to support values for each internal branch, as estimated by Tree-
puzzle (range 0–100), and can be interpreted in much the same
way as bootstrap values.
Found at: doi:10.1371/journal.pgen.1000344.s003 (0.09 MB PPT)
Figure S4 Association between gene repertoire relatedness and
phylogenetic distance. A. Genomes were binned according to
phylogenetic distance for clarity. For the first two bins, which
correspond to the most closely related genes, there is a high
percentage of genome in common, which is not the case for the
other bins, which correspond with more distantly related genes. B.
Histogram of the phylogenetic distances between pairs of genomes.
Found at: doi:10.1371/journal.pgen.1000344.s004 (0.04 MB PPT)
Figure S5 Reconstruction of gains and losses of genes in the
evolution of Escherichia coli. The cladogram shows the phylogenetic
relationships between the 20 E. coli/Shigella genomes rooted on the
E. fergusonii genome, as in Figure 4, with branch lengths ignored for
clarity. Each strain and internal node of the tree is labelled with
the inferred numbers of genes gained (red: top) and lost (black:
top), and the inferred numbers of corresponding events of gene
acquisition (red: bottom) and loss (black: bottom) along the branch.
Pie charts on each branch indicate the functional classification of
genes lost, using the colour-scale (details in the keys). The
functional classes of known-function genes are represented by
numbers explained by a key in Supplementary Table 4.
Found at: doi:10.1371/journal.pgen.1000344.s005 (0.31 MB PPT)
Figure S6 Association between the distance of a node to the tip
of the tree and the difference between the predicted ancestral
genome size and the effective number of genes reliably predicted
to be present in the node. The association is highly significant
(R2 = 0.56, p,0.001).
Found at: doi:10.1371/journal.pgen.1000344.s006 (0.03 MB PPT)
Figure S7 Characteristics of hotspots of insertion/deletion of
genetic material. The circles indicate the values per location between
contiguous genes in the core genome. Data are (from the outside
circle inwards): average number of genes, standard deviation, sum of
genes, number of prophage-like elements, number of insertion
sequence like elements, sum of tRNA genes and heterogeneity rate at
hotspots. The latter is the ratio between the observed number of
orthologs and the expected value if all genes had orthologs in all
genomes, after excluding genomes lacking genes at the hotspot and
those for which the region has a synteny breakpoint.
Found at: doi:10.1371/journal.pgen.1000344.s007 (0.14 MB PPT)
Figure S8 Phylogenetic congruence at the rfb locus coding for O
antigen. We followed the likelihood of the species topology for 5 kbp
windows (spaced by 250 bp) along the chromosomal backbone. After
correcting for the number of polymorphic sites, each window
received a Z score of phylogenetic congruence. Low values reflect
lower than average phylogenetic congruence. A large region (green
arrow) has a significantly lower congruence than the rest of the
genome. The red arrows indicate the hotspots of integration and the
corresponding loci when identified. HPI: high pathogenicity island.
Found at: doi:10.1371/journal.pgen.1000344.s008 (0.03 MB PPT)
Figure S9 Distribution of Tajima’s D statistics on the 1976
Escherichia coli core genome genes. The colour code is as follows: all
mutations (red), synonymous mutations (green) and non-synony-
mous mutations (yellow). Negative Tajima’s D values [126] reflect
a higher than expected frequency of rare alleles. The more
negative value of Tajima’s D for non-synonymous mutations
suggests that they are on average deleterious: they persist some
time in populations before selection removes them.
Found at: doi:10.1371/journal.pgen.1000344.s009 (0.08 MB PPT)
Table S1 Pseudogenes found in Escherichia coli K-12 MG1655
and the 7 newly sequenced genomes of the ColiScope project. The
‘Reference’ column give the coding sequence (CDS) identifier of
the wild type form of the gene, in one of the 21 analyzed Escherichia
and Shigella bacterial genomes. For each of these 21 genomes the
particular gene’s status is indicated as functional (‘1’), absent (‘0’)
or a pseudogene (‘21’). Gene names in boldface correspond to
genes that are pseudogenes only in the considered strain.
Found at: doi:10.1371/journal.pgen.1000344.s010 (0.25 MB XLS)
Organised Disorder in E. coli
PLoS Genetics | www.plosgenetics.org 22 January 2009 | Volume 5 | Issue 1 | e1000344
Table S2 A) Number of predicted protein encoding genes in the
genomes of the newly sequenced strains of Escherichia coli and E.
fergusonii. Genes were (a) functionality annotated using automatic
annotation transfer from K-12 MG1655 orthologs or other
ColiScope manually annotated orthologous genes, (b) manually
annotated using the MaGe web-based graphical interface, or (c)
considered as false positive gene predictions. B) Publicly available
Escherichia and Shigella genomes included in the ColiScope
database. (a) Inaccurate (‘Wrong’ status) or missed gene annota-
tions (‘New’ status) have been found using our MICheck
procedure. For the 14 analyzed genomes, the list of newly
predicted genes is given in Supplementary Table 3. (b) Automatic
functional annotation transfer between orthologous genes (85%
identity over at least 80% of the length of the smallest protein)
began with similarity results obtained with E. coli K-12 MG1655,
then with the new genomes of the ColiScope project. False gene
predictions (i.e., artefacts) were those defined in the course of the
expert annotation of the ColiScope sequences. (c) ‘Specific genes’
are genes that have no ortholog in E. coli K-12 MG1655 or any of
the newly sequenced and annotated genomes.
Found at: doi:10.1371/journal.pgen.1000344.s011 (0.05 MB
DOC)
Table S3 Missing genes in publicly available Escherichia coli and
Shigella genomes. The genes are ordered by length (given in base
pairs). Those that are similar to genes from the minimal gene set
defined by [127] are highlighted in boldface. Functional
descriptions of the genes, starting with ‘fragment of’ (Product
column), are provided for putative pseudogenes (whether actual
pseudogenes or sequencing errors). For some E. coli stains, e.g.,
UTI89, the corresponding pseudogenes were probably correctly
annotated by the authors (numbering of the gene locus_tags), but
were not reported in the databank files (GeneBank and EMsBL),
and thus were annotated as missing genes by the MICheck
procedure [97].
Found at: doi:10.1371/journal.pgen.1000344.s012 (0.36 MB XLS)
Table S4 Synteny blocks and insertion sequence (IS) elements
among the 21 Escherichia coli/Shigella/E. fergusonii genomes.
Found at: doi:10.1371/journal.pgen.1000344.s013 (0.03 MB
DOC)
Table S5 Classification of bioprocesses (key for Figure 7). The
tests indicate the sense of the difference in the number of genes
associated with a given bioprocess. ‘+/2’ means more/fewer
genes in the first class, i.e., more/fewer in the core genome than in
the complementary set. ‘++/22’ means the difference is
significant at the 5% level, using a Chi square test followed by a
sequential Bonferroni correction for multiple tests.
Found at: doi:10.1371/journal.pgen.1000344.s014 (0.02 MB
DOC)
Table S6 Genes (and associated characteristics) categorically
associated with certain phylogenetic groups or pathotypes.
Principal characteristics of the genes were deduced from the
annotation process.
Found at: doi:10.1371/journal.pgen.1000344.s015 (0.23 MB
DOC)
Table S7 Genes of the genomic island at the pheV tRNA
insertion hot spot (see Figure 9).
Found at: doi:10.1371/journal.pgen.1000344.s016 (0.08 MB
XLS)
Acknowledgments
We thank Alain Billault, Beatrice Segurens, Laurence Ma, Antony
Lepelletier and Herve Le Nagard for technical assistance, Pierre Darlu
for advice on phylogenetic analyses and Edward Feil for comments on the
manuscript. We acknowledge the ‘‘Centre de Biomodelisation’’ of the
IFR02 at the Faculte de Medecine Xavier Bichat.
Author Contributions
Conceived and designed the experiments: OT VB EPCR ED. Performed
the experiments: VB CB OC CD LG SM SO BV. Analyzed the data: MT
CH OT VB SB PB EB SB OB AC HC SC AD MD MEK EF JMG AMG
JJ CLB ML VMJ IM XN MAP CP ZR CSR DS JT DV CM EPCR ED.
Contributed reagents/materials/analysis tools: MT CH OT VB CM
EPCR. Wrote the paper: MT CH OT JJ CM EPCR ED.
References
1. Bachmann BJ (2004) Derivations and genotypes of some mutant derivatives of
Escherichia coli K-12. In Escherichia coli and Salmonella typhimurium: cellular and
molecular biology. Neidhardt F, et al., eds. Washington, DC: American Societyfor Microbiology, [Online.] http://www.ecosal.org.
2. Hobman JL, Penn CW, Pallen MJ (2007) Laboratory strains of Escherichia coli:model citizens or deceitful delinquents growing old disgracefully? Molecular
Microbiol 64: 881–885.
3. Savageau MA (1983) Escherichia coli habitats, cell types, and molecular
mechanisms of gene control. Am Nat 122: 732–744.
4. Donnenberg MS (2002) Escherichia coli. Virulence mechanisms of a versatile
pathogen. Baltimore: Academic press, Elsevier Science.
5. Rolland K, Lambert-Zeschovsky N, Picard B, Denamur E (1998) Shigella and
enteroinvasive Escherichia coli strains are derived from distinct ancestral strains ofE. coli. Microbiology 144: 2667–2672.
6. Pupo GM, Lan R, Reeves PR (2000) Multiple independent origins of Shigella
clones of Escherichia coli and convergent evolution of many of their characters.Proc Natl Acad Sci USA 97: 10567–10572.
7. Escobar-Paramo P, Giudicelli C, Parsot C, Denamur E (2003) Theevolutionary history of Shigella and enteroinvasive Escherichia coli revised. J Mol
Evol 57: 140–148.
8. Kotloff KL, Winickoff JP, Ivanoff B, Clemens JD, Swerdlow DL, et al. (1999)
Global burden of Shigella infections: implications for vaccine development andimplementation of control strategies. Bull World Health Organ 77: 651–66.
9. Kosek M, Bern C, Guerrant RL (2003) The global burden of diarrhoealdisease, as estimated from studies published between 1992 and 2000. Bull
World Health Organ 81: 197–204.
10. Russo TA, Johnson JR (2003) Medical and economic impact of extraintestinal
infections due to Escherichia coli: focus on an increasingly important endemic
problem. Microbes Infect 5: 449–456.
11. Ochman H, Selander RK (1984) Standard reference strains of Escherichia coli
from natural populations. J Bacteriol 157: 690–693.
12. Selander RK, Caugant DA, Whittam TS (1987) Genetic structure andvariation in natural populations of Escherichia coli. In Escherichia coli and Salmonella
typhimurium: cellular and molecular biology, pp1625–1648. Neidhardt FC,et al., eds. Washington, DC: American Society of Microbiology.
13. Herzer PJ, Inouye S, Inouye M, Whittam TS (1990) Phylogenetic distribution
of branched RNA-linked multicopy single-stranded DNA among natural
isolates of Escherichia coli. J Bacteriol 172: 6175–6181.
14. Desjardins P, Picard B, Kaltenbock B, Elion J, Denamur E (1995) Sex inEscherichia coli does not disrupt the clonal structure of the population: evidence
from random amplified polymorphic DNA and restriction-fragment-lengthpolymorphism. J Mol Evol 41: 440–448.
15. Clermont O, Bonacorsi S, Bingen E (2000) Rapid and simple determination of
the Escherichia coli phylogenetic group. Appl Environ Microbiol 66: 4555–4558.
16. Escobar-Paramo P, Sabbagh A, Darlu P, Pradillon O, Vaury C, et al. (2004)Decreasing the effects of horizontal gene transfer on bacterial phylogeny: the
Escherichia coli case study. Mol Phyl Evol 30: 243–250.
17. Wirth T, Falush D, Lan R, Colles F, Mensa P, et al. (2006) Sex and virulence inEscherichia coli: an evolutionary perspective. Mol Microbiol 60: 1136–1151.
18. Gordon DM, Clermont O, Tolley H, Denamur E (2008) Assigning Escherichia
coli strains to phylogenetic groups: multi-locus sequence typing versus the
triplex method. Environ Microbiol 10: 2484–2496.
19. Gordon DM (2004) The influence of ecological factors on the distribution andgenetic structure of Escherichia coli. In Escherichia coli and Salmonella typhimurium:
cellular and molecular biology. Neidhardt F, et al., eds. Washington DC:American Society for Microbiology, [Online] http://www.ecosal.org.
20. Boyd EF, Hartl DL (1998) Chromosomal regions specific to pathogenic isolates
of Escherichia coli have a phylogenetically clustered distribution. J Bacteriol 180:1159–1165.
21. Johnson JR, Delavari P, Kuskowski M, Stell AL (2001) Phylogenetic
distribution of extraintestinal virulence-associated traits in Escherichia coli.
J Infect Dis 183: 78–88.
Organised Disorder in E. coli
PLoS Genetics | www.plosgenetics.org 23 January 2009 | Volume 5 | Issue 1 | e1000344
22. Escobar-Paramo P, Clermont O, Blanc-Potard AB, Bui H, Le Bouguenec C, et
al. (2004) A specific genetic background is required for acquisition andexpression of virulence factors in Escherichia coli. Mol Biol Evol 21: 1085–1094.
23. Picard B, Garcia JS, Gouriou S, Duriez P, Brahimi N, et al. (1999) The link
between phylogeny and virulence in Escherichia coli extraintestinal infection.
Infect Immun 67: 546–553.
24. Walk ST, Alm EW, Calhoun LM, Mladonicky JM, Whittam TS (2007) Genetic
diversity and population structure of Escherichia coli isolated from freshwater
beaches. Environ Microbiol 9: 2274–2288.
25. Zhang L, Foxman B, Marrs C (2002) Both urinary and rectal Escherichia coli
isolates are dominated by strains of phylogenetic group B2. J Clin Microbiol 40:3951–3955.
26. Escobar-Paramo P, Grenet K, Le Menac’h A, Rode L, Salgado E, et al. (2004)
Large-scale population structure of human commensal Escherichia coli isolates.
Appl Environ Microbiol 70: 5698–5700.
27. Guttman DS, Dykhuizen DE (1994) Clonal divergence in Escherichia coli as a
result of recombination, not mutation. Science 266: 1380–1383.
28. Medigue C, Rouxel T, Vigier P, Henaut A, Danchin A (1991) Evidence for
horizontal gene transfer in Escherichia coli speciation. J Mol Biol 222: 851–856.
29. Lawrence JG, Ochman H (1998) Molecular archaeology of the Escherichia coli
genome. Proc Natl Acad Sci USA 95: 9413–9417.
30. Welch RA, Burland V, Plunkett G 3rd, Redford P, Roesch P, et al. (2002)
Extensive mosaic structure revealed by the complete genome sequence ofuropathogenic Escherichia coli. Proc Natl Acad Sci U S A 99: 17020–17024.
31. Lawrence JG, Ochman H, Hartl DL (1991) Molecular and evolutionary
relationships among enteric bacteria. J Gen Microbiol 137: 1911–1921.
32. Johnson JR, Clermont O, Menard M, Kuskowski MA, Picard B, et al. (2006)Experimental mouse lethality of Escherichia coli isolates, in relation to accessory
traits, phylogenetic group, and ecological source. J Infect Dis 194: 1141–1150.
33. Thomson N, Baker S, Pickard D, Fookes M, Anjum M, et al. (2004) The role of
prophage-like elements in the diversity of Salmonella enterica serovars. J Mol Biol
339: 279–300.
34. Willenbrock H, Hallin PF, Wassenaar TM, Ussery DW (2007) Characteriza-
tion of probiotic Escherichia coli isolates with a novel pan-genome microarray.
Genome Biol 8: R267.
35. Baba T, Ara T, Hasegawa M, Takai Y, Okumura Y, et al. (2006) Construction
of Escherichia coli K-12 in-frame, single-gene knockout mutants: the Keio
collection. Mol Syst Biol 2: 0008.
36. Lerat E, Ochman H (2005) Recognizing the pseudogenes in bacterial genomes.
Nucleic Acids Res 33: 3125–3132.
37. Fang G, Rocha EPC, Danchin A (2005) How essential are nonessential genes?
Mol Biol Evol 22: 2147–2156.
38. McVean G, Awadalla P, Fearnhead P (2002) A coalescent-based method for
detecting and estimating recombination from gene sequences. Genetics 160:1231–1241.
39. Padhukasahasram B, Wall JD, Marjoram P, Nordborg M (2006) Estimating
recombination rates from single-nucleotide polymorphisms using summary
statistics. Genetics 174: 1517–1528.
40. Beaumont MA, Zhang W, Balding DJ (2002) Approximate Bayesian
computation in population genetics. Genetics 162: 2025–2035.
41. Excoffier L, Estoup A, Cornuet JM (2005) Bayesian analysis of an admixture
model with mutations and arbitrarily linked markers. Genetics 169:1727–1738.
42. Le Gall T, Clermont O, Gouriou S, Picard B, Nassif X, et al. (2007)
Extraintestinal virulence is a coincidental by-product of commensalism in B2
phylogenetic group Escherichia coli strains. Mol Biol Evol 24: 2373–2384.
43. McKane M, Milkman R (1995) Transduction, restriction and recombination
patterns in Escherichia coli. Genetics 139: 35–43.
44. Vulic M, Dionisio F, Taddei F, Radman M (1997) Molecular keys to
speciation: DNA polymorphism and the control of genetic exchange in
enterobacteria. Proc Natl Acad Sci USA 94: 9763–9767.
45. Robinson DF, Foulds LR (1981) Comparison of phylogenetic trees.
Mathematical Biosciences 53: 131–147.
46. Johnson JR, Owens KL, Clabots CR, Weissman SJ, Cannon SB (2006)
Phylogenetic relationships among clonal groups of extraintestinal pathogenicEscherichia coli as assessed by multi-locus sequence analysis. Microbes Infect 8:
1702–1713.
47. Lecointre G, Rachdi L, Darlu P, Denamur E (1998) Escherichia coli molecular
phylogeny using the incongruence length difference test. Mol Biol Evol 15:
1685–1695.
48. Reid SD, Herbelin CJ, Bumbaugh AC, Selander RK, Whittam TS (2000)
Parallel evolution of virulence in pathogenic Escherichia coli. Nature 406: 64–67.
49. Hershberg R, Tang H, Petrov DA (2007) Reduced selection leads toaccelerated gene loss in Shigella. Genome Biol 8: R164.
50. Snel B, Bork P, Huynen MA (1999) Genome phylogeny based on gene content.
Nat Genet 21: 108–110.
51. Dobrindt U, Hochhut B, Hentschel U, Hacker J (2004) Genomic islands inpathogenic and environmental microorganisms. Nat Rev Microbiol 2:
414–424.
52. Maurelli AT, Fernandez RE, Bloch CA, Rode CK, Fasano A (1998) ‘‘Black
holes’’ and bacterial pathogenicity: a large genomic deletion that enhances the
virulence of Shigella spp. and enteroinvasive Escherichia coli. Proc Natl AcadSci U S A 95: 3943–3948.
53. Lane MC, Mobley HLT (2007) Role of P-fimbrial-mediated adherence in
pyelonephritis and persistence of uropathogenic Escherichia coli (UPEC) in themammalian kidney. Kindney Int 72: 19–25.
54. Jiang H, Yang C, Qu H, Liu Z, Fu QS, et al. (2007) Cloning of a novel aldo-
keto reductase gene from Klebsiella sp. strain F51-1-2 and its functional
expression in Escherichia coli. Appl Environ Microbiol 73: 4959–4965.
55. Clermont O, Lescat M, O’Brien CL, Gordon DM, Tenaillon O, et al. (2008)
Evidence for a human specific Escherichia coli clone. Environ Microbiol 10:
1000–1006.
56. Buchrieser C, Glaser P, Rusniok C, Nedjari H, D’Hauteville H, et al. (2000)
The virulence plasmid pWR100 and the repertoire of proteins secreted by thetype III secretion apparatus of Shigella flexneri. Mol Microbiol 38: 760–771.
57. Cooper VS, Lenski RE (2000) The population genetics of ecological
specialization in evolving Escherichia coli populations. Nature 407: 736–9.
58. Fernandez IM, Silva M, Schuch R, Walker WA, Siber AM, et al. (2001)
Cadaverine prevents the escape of Shigella flexneri from the phagolysosome: a
connection between bacterial dissemination and neutrophil transepithelial
signaling. J Infect Dis 184: 743–745.
59. Rocha EPC (2008) The organisation of the bacterial genome. Annu Rev Genet
42: 211–233.
60. Ochman H, Jones IB (2000) Evolutionary dynamics of full genome content in
Escherichia coli. Embo J 19: 6637–6643.
61. Bergthorsson U, Ochman H (1998) Distribution of chromosome lengthvariation in natural isolates of Escherichia coli. Mol Biol Evol 15: 6–16.
62. Groisman EA, Ochman H (1996) Pathogenicity islands: bacterial evolution in
quantum leaps. Cell 87: 791–794.
63. Hacker J, Kaper JB (2000) Pathogenicity islands and the evolution of microbes.Annu Rev Microbiol 54: 641–679.
64. Frost LS, Leplae R, Summers AO, Toussaint A (2005) Mobile genetic
elements: the agents of open source evolution. Nat Rev Microbiol 3: 722–732.
65. Garcia-Russell N, Harmon TG, Le TQ, Amaladas NH, Mathewson RD, et al.
(2004) Unequal access of chromosomal regions to each other in Salmonella:
probing chromosome structure with phage lambda integrase-mediated long-
range rearrangements. Mol Microbiol 52: 329–344.
66. Sokurenko EV, Chesnokova V, Dykhuizen DE, Ofek I, Wu XR, et al. (1998)Pathogenic adaptation of Escherichia coli by natural variation of the FimH
adhesin. Proc Natl Acad Sci U S A 95: 8922–8926.
67. Milkman R, Jaeger E, McBride RD (2003) Molecular evolution of the
Escherichia coli chromosome. VI. Two regions of high effective recombination.
Genetics 163: 475–483.
68. Weissman SJ, Chattopadhyay S, Aprikian P, Obata-Yasuoka M, Yarova-
Yarovaya Y, et al. (2006) Clonal analysis reveals high rate of structural
mutations in fimbrial adhesins of extraintestinal pathogenic Escherichia coli. Mol
Microbiol 59: 975–988.
69. Schubert S, Darlu P, Clermont O, Wieser A, Magistro G, et al. (2008) Role of
intraspecies recombination in the spread of pathogenicity islands within the
Escherichia coli species. PLoS Pathog; In press.
70. Denamur E, Lecointre G, Darlu P, Tenaillon O, Acquaviva C, et al. (2000)
Evolutionary implications of the frequent horizontal transfer of mismatchrepair genes. Cell 103: 711–721.
71. Barrangou R, Fremaux C, Deveau H, Richards M, Boyaval P, et al. (2007)
CRISPR provides acquired resistance against viruses in prokaryotes. Science
315: 1709–1712.
72. Kaplan NL, Darden T, Hudson RR (1988) The coalescent process in models
with selection. Genetics 120: 819–829.
73. Daubin V, Perriere G (2003) G+C structuring along the genome: a common
feature in prokaryotes. Mol Biol Evol 20: 471–483.
74. Sharp PM, Shields DC, Wolfe KH, Li WH (1989) Chromosomal location and
evolutionary rate variation in enterobacterial genes. Science 246: 808–810.
75. Hudson RE, Bergthorsson U, Roth JR, Ochman H (2002) Effect of
chromosome location on bacterial mutation rates. Mol Biol Evol 19: 85–92.
76. Charlesworth B, Morgan MT, Charlesworth D (1993) The effect of deleterious
mutations on neutral molecular variation. Genetics 134: 1289–1303.
77. Balbi KJ, Rocha EP, Feil EJ (2008) The temporal dynamics of slightly
deleterious mutations in Escherichia coli and Shigella spp. Mol Biol Evol; Nov 4[Epub ahead of print].
78. Galtier N, Piganeau G, Mouchiroud D, Duret L (2001) GC-content evolution
in mammalian genomes: the biased gene conversion hypothesis. Genetics 159:
907–911.
79. Rocha EP, Touchon M, Feil EJ (2006) Similar compositional biases are caused
by very different mutational effects. Genome Res 16: 1537–1547.
80. Couturier E, Rocha EPC (2006) Replication-associated gene dosage effects
shape the genomes of fast-growing bacteria but only for transcription andtranslation genes. Mol Microbiol 59: 1506–1518.
81. Treangen TJ, Ambur OH, Tonjum T, Rocha EP (2008) The impact of the
neisserial DNA uptake sequences on genome evolution and stability. Genome
Biol 9: R60.
82. Valens M, Penaud S, Rossignol M, Cornet F, Boccard F (2004) Macrodomain
organization of the Escherichia coli chromosome. Embo J 23: 4330–4341.
83. Tettelin H, Masignani V, Cieslewicz MJ, Donati C, Medini D, et al. (2005)
Genome analysis of multiple pathogenic isolates of Streptococcus agalactiae:
implications for the microbial ‘‘pan-genome’’. Proc Natl Acad Sci U S A 102:13950–13955.
Organised Disorder in E. coli
PLoS Genetics | www.plosgenetics.org 24 January 2009 | Volume 5 | Issue 1 | e1000344

84. Hao W, Golding GB (2006) The fate of laterally transferred genes: life in the
fast lane to adaptation or death. Genome Res 16: 636–643.85. Vernikos GS, Thomson NR, Parkhill J (2007) Genetic flux over time in the
Salmonella lineage. Genome Biol 8: R100.
86. Mossoro C, Glaziou P, Yassibanda S, Lan NT, Bekondi C, et al. (2002)Chronic diarrhea, hemorrhagic colitis, and hemolytic-uremic syndrome
associated with HEp-2 adherent Escherichia coli in adults infected with humanimmunodeficiency virus in Bangui, Central African Republic. J Clin Microbiol
40: 3086–3088.
87. Bernier C, Gounon P, Le Bouguenec C (2002) Identification of an aggregativeadhesion fimbria (AAF) type III-encoding operon in enteroaggregative
Escherichia coli as a sensitive probe for detecting the AAF-encoding operonfamily. Infect Immun 70: 4302–11.
88. Manges AR, Johnson JR, Foxman B, O’Bryan TT, Fullerton KE, et al. (2001)Widespread distribution of urinary tract infections caused by a multidrug-
resistant Escherichia coli clonal group. N Engl J Med 345: 1007–1013.
89. Bonacorsi S, Clermont O, Houdouin V, Cordevant C, Brahimi N, et al. (2003)Molecular analysis and experimental virulence of French and North American
Escherichia coli neonatal meningitis isolates: identification of a new virulent clone.J Infect Dis 187: 1895–1906.
90. Farmer JJ 3rd, Fanning GR, Davis BR, O’Hara CM, Riddle C, et al. (1985)
Escherichia fergusonii and Enterobacter taylorae, two new species of Enterobacteriaceae
isolated from clinical specimens. J Clin Microbiol 21: 77–81.
91. Chaudhury A, Nath G, Tikoo A, Sanyal SC (1999) Enteropathogenicity andantimicrobial susceptibility of new Escherichia spp. J Diarrhoeal Dis Res 17:
85–87.92. Mahapatra A, Mahapatra S, Mahapatra A (2005) Escherichia fergusonii: an
emerging pathogen in South Orissa. Indian J Med Microbiol 23: 204.
93. Vallenet D, Nordmann P, Barbe V, Poirel L, Mangenot S, et al. (2008)Comparative analysis of Acinetobacters: three genomes for three lifestyles.
PLoS ONE 3: e1805.94. Bocs S, Cruveiller S, Vallenet D, Nuel G, Medigue C (2003) AMIGene:
Annotation of MIcrobial Genes. Nucleic Acids Res 31: 3723–3726.
95. Vallenet D, Labarre L, Rouy Z, Barbe V, Bocs S, et al. (2006) MaGe: amicrobial genome annotation system supported by synteny results. Nucleic
Acids Res 34: 53–65.96. Riley M, Abe T, Arnaud MB, Berlyn MK, Blattner FR, et al. (2006) Escherichia
coli K-12: a cooperatively developed annotation snapshot–2005. Nucleic AcidsRes 34: 1–9.
97. Cruveiller S, Le Saux J, Vallenet D, Lajus A, Bocs S, et al. (2005) MICheck: a
web tool for fast checking of syntactic annotations of bacterial genomes. NucleicAcids Res 33: W471–479.
98. Darling AC, Mau B, Blattner FR, Perna NT (2004) Mauve: multiple alignmentof conserved genomic sequence with rearrangements. Genome Res 14:
1394–1403.
99. Chiapello H, B Gendrault A, Caron C, Blum J, Petit MA, et al. (2008)MOSAIC: an online database dedicated to the comparative genomics of
bacterial strains at the intra-species level. BMC Bioinformatics 9: 948.100. Katoh K, Kuma K, Toh H, Miyata T (2005) MAFFT version 5: improvement
in accuracy of multiple sequence alignment. Nucleic Acids Res 33: 511–518.101. Schmidt HA, Strimmer K, Vingron M, von Haeseler A (2002) TREE-
PUZZLE: maximum likelihood phylogenetic analysis using quartets and
parallel computing. Bioinformatics 18: 502–504.102. Gascuel O (1997) BIONJ: an improved version of the NJ algorithm based on a
simple model of sequence data. Mol Biol Evol 14: 685–695.103. Guindon S, Gascuel O (2003) A simple, fast, and accurate algorithm to
estimate large phylogenies by maximum likelihood. Syst Biol 52: 696–704.
104. Yang Z (1997) PAML: a program package for phylogenetic analysis bymaximum likelihood. Comput Appl Biosci 13: 555–556.
105. Shimodaira H, Hasegawa M (1999) Multiple comparisons of log-likelihoodswith applications to phylogenetic inference. Mol Biol Evol 16: 1114–1116.
106. Kishino H, Hasegawa M (1989) Evaluation of the maximum likelihood
estimate of the evolutionary tree topologies from DNA sequence data, and the
branching order in hominoidea. J Mol Evol 29: 170–179.
107. Goldman N, Anderson JP, Rodrigo AG (2000) Likelihood-based tests of
topologies in phylogenetics. Syst Biol 49: 652–670.
108. Strimmer K, Rambaut A (2002) Inferring confidence sets of possibly
misspecified gene trees. Proc Biol Sci 269: 137–142.
109. Felsenstein J (1981) Evolutionary trees from DNA sequences: a maximum
likelihood approach. J Mol Evol 17: 368–376.
110. Hudson RR (2002) Generating samples under a Wright-Fisher neutral model of
genetic variation. Bioinformatics 18: 337–338.
111. Rambaut A, Grassly NC (1997) Seq-Gen: an application for the Monte Carlo
simulation of DNA sequence evolution along phylogenetic trees. Comput Appl
Biosci 13: 235–238.
112. Paradis E, Claude J, Strimmer K (2004) APE: Analyses of phylogenetics and
evolution in R language. Bioinformatics 20: 289–290.
113. Felsenstein J (1985) Phylogenies and the comparative method. Am Nat 125:
1–15.
114. Pagel M (1994) Detecting correlated evolution on phylogenies: a general
method for the comparative analysis of discrete characters. Proc Biol Sci 255:
37–45.
115. Blattner FR, Iii GP, Bloch CA, Perna NT, Burland V, et al. (1997) The
complete genome sequence of Escherichia coli K-12. Science 277: 1453–1461.
116. Yang F, Yang J, Zhang X, Chen L, Jiang Y, et al. (2005) Genome dynamics
and diversity of Shigella species, the etiologic agents of bacillary dysentery.
Nucleic Acids Res 33: 6445–6458.
117. Jin Q, Yuan Z, Xu J, Wang Y, Shen Y, et al. (2002) Genome sequence of
Shigella flexneri 2a: insights into pathogenicity through comparison with genomes
of Escherichia coli K-12 and O157. Nucleic Acids Res 30: 4432–4441.
118. Wei J, Goldberg MB, Burland V, Venkatesan MM, Deng W, et al. (2003)
Complete genome sequence and comparative genomics of Shigella flexneri
serotype 2a strain 2457T. Infect Immun 71: 2775–2786.
119. Nie H, Yang F, Zhang X, Yang J, Chen L, et al. (2006) Complete genome
sequence of Shigella flexneri 5b and comparison with Shigella flexneri 2a. BMC
Genomics 7: 173.
120. Perna NT, Plunkett G 3rd, Burland V, Mau B, Glasner JD, et al. (2001)
Genome sequence of enterohaemorrhagic Escherichia coli O157:H7. Nature 409:
529–533.
121. Hayashi T, Makino K, Ohnishi M, Kurokawa K, Ishii K, et al. (2001)
Complete genome sequence of enterohemorrhagic Escherichia coli O157:H7 and
genomic comparison with a laboratory strain K-12. DNA Res 8: 11–22.
122. Chen SL, Hung CS, Xu J, Reigstad CS, Magrini V, et al. (2006) Identification
of genes subject to positive selection in uropathogenic strains of Escherichia coli: a
comparative genomics approach. Proc Natl Acad Sci U S A 103: 5977–5982.
123. Johnson TJ, Kariyawasam S, Wannemuehler Y, Mangiamele P, Johnson SJ, et
al. (2007) The genome sequence of avian pathogenic Escherichia coli strain
O1:K1:H7 shares strogng similarities with human extraintestinal pathogenic E.
coli genomes. J Bacteriol 189: 3228–3236.
124. Brzuszkiewicz E, Bruggemann H, Liesegang H, Emmerth M, Olschlager T, et
al. (2006) How to become a uropathogen: comparative genomic analysis of
extraintestinal pathogenic Escherichia coli strains. Proc Natl Acad Sci U S A 103:
12879–12884.
125. Serres MH, Goswami S, Riley M (2004) GenProtEC: an updated and
improved analysis of functions of Escherichia coli K-12 proteins. Nucleic Acids
Res 32: D300–D302.
126. Tajima F (1989) Statistical method for testing the neutral mutation hypothesis
by DNA polymorphism. Genetics 123: 585–595.
127. Gil R, Silva FJ, Pereto J, Moya A (2004) Determination of the core of a
minimal bacterial gene set. Microbiol Mol Biol Rev 68: 518–537.
Organised Disorder in E. coli
PLoS Genetics | www.plosgenetics.org 25 January 2009 | Volume 5 | Issue 1 | e1000344