
Optimization and Applications of Slow-Proton-Exchange (SPE ...
83
Optimization and Applications of Slow-Proton-Exchange (SPE) Nuclear Magnetic Resonance pH Sensors by Ryan Vincent Correa A thesis submitted in conformity with the requirements for the degree of Master of Science Department of Physical and Environmental Sciences University of Toronto © Copyright by Ryan Vincent Correa 2018
-
Upload
khangminh22 -
Category
Documents
-
view
0 -
download
0
Transcript of Optimization and Applications of Slow-Proton-Exchange (SPE ...

Optimization and Applications of Slow-Proton-Exchange (SPE) Nuclear Magnetic Resonance pH Sensors
by
Ryan Vincent Correa
A thesis submitted in conformity with the requirements for the degree of Master of Science
Department of Physical and Environmental Sciences University of Toronto
© Copyright by Ryan Vincent Correa 2018

ii
Optimization and Applications of Slow-Proton-Exchange
(SPE) Nuclear Magnetic Resonance pH Sensors
Ryan Vincent Correa
Master of Science
Department of Physical and Environmental Sciences
University of Toronto
2018
Abstract
The measurement of pH is ubiquitously important in biochemistry, clinical medicine, and
industrial processes. There are still improvements to be made in this field, especially in terms of
accuracy, non-invasiveness for biomedical applications and real-time monitoring. Herein, a new
series of NMR sensors have been evaluated and applied that employ the Slow-Proton-Exchange
(SPE) sensing mechanism. Three sensors, SPE1, SPE2, and TUC, exhibit the SPE phenomenon
and thus can be used in unconventional conditions to accurately and reliably quantify pH. The
second generation SPE2, optimized from the previous SPE1 with biocompatible pKa and broader
operating pH window, has been used to detect real-time pH changes in a series of enzymatic
hydrolysis reactions, simulating a metabolic process. All sensors SPE1, SPE2, and TUC have
been utilized in DMSO to measure the strengths of organic acids and characterize activity,
expanding the application scope from aqueous to organic solvents.

iii
Acknowledgements
During my time studying as a Master of Science, there have been many colleagues and people who
have supported me, mentored me, and helped me carry myself through some of the most
discouraging moments I have experienced. It would be remiss of me not to acknowledge them
here.
First and foremost, I owe a great debt of gratitude to my supervisor and mentor, Dr. Xiao-an Zhang.
As a member of his laboratory for three years, he has helped introduce me to the world of academia
and has taught me how to approach scientific questions. Furthermore, I would like to thank Dr.
Zhang for his incredible patience with me over the years. His openness for debate and
disagreement, as well as his ability to approach a problem from several angles have encouraged
me at multiple points throughout my research. While there is still a whole world of questions to be
answered and still many skills for me to develop, I’m glad that my first step into academic
biochemistry was in the Zhang Research Group.
Second, I must absolutely thank my significant other, Bethany Smith, for her unwavering support
and encouragement over these last years. Whether its simple encouraging words to get me through
day by day or its her willingness to allow a chemistry nerd to rant about his research, it has been
fulfilling to know that I could have a partner outside of chemistry who could so strongly support
my academic endeavors.
In my time here, I have taken on two undergraduate students as research assistants. Without them,
much of the research here could not have advanced so rapidly. I would like to thank Yingying Su,
whose contributions during the summer of 2017 were invaluable to understanding our sensors and
tuning our research to produce meaningful data. Her ability to adapt and learn rapidly is enviable.
I would also like to thank Hlib Razumkov for his contributions during the 2016-2017 school year.
I cannot move forward in acknowledgements without mentioning my fellow graduate students in
the Zhang Research Lab. I’d like to thank Hanlin Liu, the most senior graduate student of our
laboratory, for his humour, support, insight, and memes. I’d like to thank Maryam Abdinejad for
her encouragement and openness to discussion about any topic, whether related to her research or
mine. I owe gratitude to Henry Tieu, who has taken this journey along with me and has empathized
every step of the way. I would like to thank Piryanka Sasidharan for her humour and for the cheer

iv
she brings to the workplace (and for being willing to withstand my constant short jokes). I’d like
to thank Keith Tang for his contributions to our lab group outings and for being a delightful
addition to our lab. I sincerely hope that my colleagues all succeed in their future endeavours and
research.
I would like to thank Ronald Soong, a staff member at the TRACES laboratory. His assistance and
expertise when developing and troubleshooting the NMR experiments. His diligence in
maintaining the equipment and his approachability and availability warrant great gratitude, and to
him I am in debt.
I would like to thank Dr. Andre Simpson for reading my thesis. As a previous collaborator on the
SPE project and as a fantastic and reputable faculty member at UTSC, I have great respect for him
and his work.
I must also thank my parents, Mike and Susan, for their constant support and love through the
years of my research. Their encouragement has helped push me to work harder and hold my work
in high esteem.
Finally, I am thankful for my friend, Jean-Philippe Lantagne, for his support and discussion. As a
fellow student of chemistry, it has been enriching to engage in debate and discussion both in
relation to chemistry as well as other topics.
If it were not for the aforementioned people, I certainly would not have found as much value as I
did within my studies.

v
Table of Contents Acknowledgements ...................................................................................................................... iii
Table of Contents......................................................................................................................... v
List of Figures .............................................................................................................................. vii
List of Schemes ............................................................................................................................. x
Abbreviations ................................................................................................................................ xi
1 Introduction ............................................................................................................................ 1
1.1 Importance of pH Measurement .................................................................................. 1
1.1.1 Modern pH Measurement Methods ..................................................................... 1
1.1.2 Measurement of pH by NMR Sensors ................................................................ 2
1.2 The NMR Time Scale and Slow-Proton-Exchange .................................................. 3
1.3 The SPE Sensors: SPE1 and SPE2........................................................................... 5
1.3.1 SPE1: Structure and Properties ........................................................................... 6
1.3.2 SPE2: Function and Properties ............................................................................ 8
1.4 Objectives ..................................................................................................................... 10
2 Hydrolysis of Ethyl Acetates using Pig Liver Esterase ................................................. 11
2.1 Background................................................................................................................... 11
2.1.2 Properties of Pig Liver Esterase ........................................................................ 11
2.1.3 Experimental Design and Rationale .................................................................. 12
2.2 Results and Discussion .............................................................................................. 13
2.2.1 Hydrolysis of Ethyl Acetate ................................................................................. 13
2.2.2 Hydrolysis of Ethyl Trifluoroacetate ................................................................... 15
2.2.3 Hydrolysis of Ethyl Trichloroacetate .................................................................. 17
2.3 Conclusions .................................................................................................................. 19
2.4 Materials and Methods ............................................................................................... 19
2.4.1 Synthesis of Tris(2-(ethyl oxalate)aminoethyl)amine (Trenest) .................... 19
2.4.2 Synthesis of 1,4,7,10,13,16,21,24-octazabicyclo[8.8.8]hexacosan-
5,6,14,15,22,23-hexone (SPE2) ....................................................................................... 20
2.4.3 Hydrolysis of Ethyl Acetate Derivatives Using Pig Liver Esterase ............... 20
3 Measurement of pH in Non-Aqueous Solvents Using SPE NMR Sensors ............... 22
3.1 Background................................................................................................................... 22
3.1.1 Non-Aqueous Media and Activity....................................................................... 22

vi
3.1.2 SPE sensing of Non-Aqueous pH – Design and Rationale ........................... 23
3. 2 Mathematical Method of Determining pH and pKa values .................................... 24
3.3 NMR Experiment Results and Discussion ............................................................... 26
3.3.1 Properties of SPE1 in DMSO ............................................................................. 26
3.3.2 Properties of SPE2 in DMSO ............................................................................. 30
3.2.3 Properties of TUC in DMSO ............................................................................... 32
3.3 Conclusions .................................................................................................................. 38
3.4 Materials and Methods ............................................................................................... 39
3.4.1 Synthesis of tris(2-isothiocyanatoethyl)amine (ITC) ....................................... 39
3.4.2 Synthesis of 1,4,6,9,12,14,19,21-octazabicyclo[7,7,7]tricosan-5,13,20-
trithione (TUC) ..................................................................................................................... 40
3.4.3 Synthesis of 1,4,6,9,12,14,19,21-octazabicyclo[7,7,7]tricosan-5,13,20-trione
(SPE1) 41
3.4.4 Titration of Acetic Acid in DMSO Using SPE Sensors ................................... 41
3.4.5 Titration of 4-Nitrophenol in DMSO Using SPE Sensors ............................... 42
3.4.6 Titration of Trifluoroacetic Acid in DMSO Using SPE Sensors ..................... 42
3.4.7 Titration of Methanesulfonic Acid in DMSO Using SPE Sensors ................. 42
3.4.8 Titration of p-toluenesulfonic acid in DMSO Using TUC ................................ 42
4 Conclusions and Future Directions .................................................................................. 43
References .................................................................................................................................. 46
Supplemental Information ......................................................................................................... 51

vii
List of Figures
Figure 1: A hypothetical NMR spectra for a chemical sensor undergoing Fast-Proton-Exchange.
For a peak sensitive to pH, the chemical shift would be found at a weighted average between
chemical shifts for each isolated protonation state. ........................................................................ 4
Figure 2: A hypothetical NMR spectrum for a chemical sensor undergoing Slow-Proton-
Exchange. Peaks for both protonation states are well resolved and simultaneously visible.
Integrations of each peak represent the relative amount of each protonation state present. ........... 5
Figure 3: Change in chemical structure upon protonation of SPE1. The pink cloud represents
negative charge buildup due to lone pair electrons. Methylene peaks A, B, A’, and B’ are
analyzed on NMR spectra. .............................................................................................................. 6
Figure 4: NMR spectra for SPE1 methylene peaks at various pH values. As pH decreases, the
integration of A’ and B’ decrease as the peaks for A and B increase in proportion. ...................... 7
Figure 5: Structural changes in SPE2 upon protonation. Mono-protonation results in the loss of a
horizontal mirror plane of symmetry, while bis-protonation restores the mirror plane. ................. 9
Figure 6: Selected NMR spectra of SPE2 methylene peaks at various pH values. Starting at
upper right, as pH decreases, four peaks representing mono-protonated SPE2 appear. As pH
decreases into the second protonation event, these four peaks decrease in integration while two
peaks representing highly symmetric bis-protonated SPE2 appear. .............................................. 9
Figure 7: The general reaction scheme for the PLE catalyzed ester hydrolysis. The release of an
acetic acid derivative causes a decrease in pH over time. Ethyl acetate, ethyl trifluoroacetate, and
ethyl trichloroacetate were the chosen substrates. ........................................................................ 12
Figure 8: Spectra over time of SPE2 within the range of 4 ppm to 2.5 ppm during hydrolysis of
EtOAc. .......................................................................................................................................... 14
Figure 9: pH shown as a function of time as measured by SPE2 for the hydrolysis of EtOAc
using PLE. ..................................................................................................................................... 14
Figure 10: Data for PLE catalyzed hydrolysis of ethyl trifluoroacetate. The pH is shown as a
function of time. For comparison, potentiometric pH measurements are shown in red. .............. 16
Figure 11: Selected NMR spectra obtained during hydrolysis of EtTFA in the presence of PLE.
....................................................................................................................................................... 16

viii
Figure 12: Data for PLE catalyzed hydrolysis of ethyl trichloroacetate. The pH is shown as a
function of time. To fill in pH values outside of the sensing range of SPE2, potentiometric pH
measurements are shown here in red. ........................................................................................... 17
Figure 13: Selected NMR spectra obtained during hydrolysis of EtTFA with PLE present. ...... 18
Figure 14: Selected NMR spectra obtained during hydrolysis of EtTFA with no enzyme present.
....................................................................................................................................................... 18
Figure 15: Spectra for titration of SPE1 with acetic acid. Acid concentration (Ca) and pH are
shown. Solvent peak is observed at 2.51 ppm. Peaks A and B represent neutral sensor, peaks A’
and B’ represent bis-protonated sensor. ........................................................................................ 28
Figure 16: Spectra for titration of SPE1 with 4-nitrophenol. Acid concentration (Ca) and pH are
shown. Solvent peak is observed at 2.51 ppm. Peaks A and B represent neutral sensor, peaks A’
and B’ represent bis-protonated sensor. ........................................................................................ 29
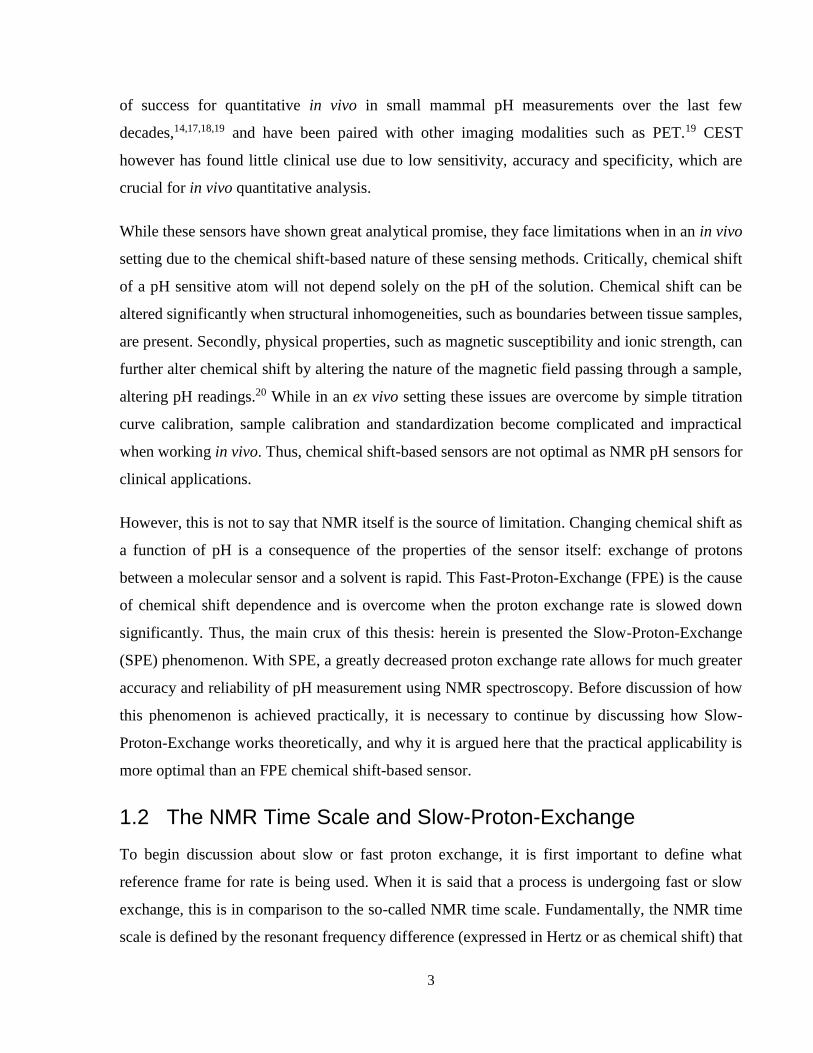
Figure 17: Spectra for titration of SPE2 with 4-nitrophenol. Acid concentration (Ca) and pH are
shown. Solvent peak is observed at 2.51 ppm. Peaks A and B represent neutral sensor, peaks A’
and B’ represent bis-protonated sensor. ........................................................................................ 31
Figure 18: Spectra for titration of SPE2 with 4-nitrophenol. Acid concentration (Ca) and pH are
shown. Solvent peak is observed at 2.51 ppm. Peaks A and B represent neutral sensor, peaks A’
and B’ represent bis-protonated sensor. ........................................................................................ 32
Figure 19: Structural changes in TUC upon protonation. All proton signals A – G are analyzed
on NMR spectra. ........................................................................................................................... 33
Figure 20: Spectra and peak assignments of TUC in d6-DMSO with 1 eq. TFA (top) and no acid
present (bottom). Peaks are assigned with reference to Figure 19................................................ 34
Figure 21: Selected spectra for titration of TUC with TFA. Peaks A, B, and C belong to neutral
TUC; D’, E’, and F’ to mono-protonated TUC; and D, E, and F to bis-protonated TUC. Peak A
is obscured by the DMSO solvent peak. ....................................................................................... 35
Figure 22: Titration curves for TUC in 95% DMSO. All three protonation states are represented
as a fraction of the total TUC concentration. ............................................................................... 36
Figure 23: Selected spectra for titration of TUC with p-toluenesulfonic acid. Peak C belongs to
neutral TUC; D’, E’, and F’ to mono-protonated TUC; and D, E, and F to bis-protonated TUC.
....................................................................................................................................................... 37
Figure 24: The collective sensing range of SPE sensors in DMSO. ............................................ 38

ix
Figure 25: The sensing ranges of SPE1 and SPE2 superimposed over their aqueous pH values.
....................................................................................................................................................... 44
Figure 26: Three possible structures for a hypothetical SPE3. The left-most structure represents
a fluorinated structure, which may be used to avoid competing signals typically seen in a
biological medium. The center structure contains reactive α-carbons, which may be further
functionalized to various ends. The right-most structure is a quaternary-salt alternative to SPE1,
to demonstrate a possibility for ionizing SPE sensors. ................................................................. 45

x
List of Schemes
Scheme 1: Synthetic scheme for the synthesis of tris(2-(ethyl oxalate)aminoethyl)amine
(trenest). ........................................................................................................................................ 19
Scheme 2: Synthetic scheme for the synthesis of 1,4,7,10,13,16,21,24-
octazabicyclo[8.8.8]hexacosan-5,6,14,15,22,23-hexone (SPE2). ................................................ 20
Scheme 3: Synthetic scheme for the synthesis of ITC. ................................................................ 39
Scheme 4: Synthetic scheme for the synthesis of TUC. .............................................................. 40
Scheme 5: Synthetic scheme for the synthesis of SPE1. ............................................................. 41

xi
Abbreviations
AcOH Acetic acid
CEST Chemical exchange saturation transfer
CDCl3 Deuterated Chloroform
CHCl3 Chloroform
CS2 Carbon disulfide
CT Computed tomography
DCC N,N’-dicyclohexylcarbodiimide
DCM Dichloromethane
DMSO Dimethyl sulfoxide
d6-DMSO Deuterated dimethyl sulfoxide
D2O Deuterated water
EtOAc Ethyl acetate
EtOH Ethanol
EtOTCA Ethyl trichloroacetate
EtOTFA Ethyl trifluoroacetate
FPE Fast proton exchange
ITC Tris(2-isothiocyanatoethyl)amine
LiCl Lithium Chloride
MeOH Methanol
MR Magnetic resonance
MRI Magnetic resonance imaging
MRS Magnetic resonance spectroscopy
MsOH Methanesulfonic acid
NMR Nuclear magnetic resonance
NIRS Near-infrared Spectroscopy
4-NP 4-nitrophenol
PET Positron emission tomography
PLE Porcine liver esterase
pTsOH p-toluenesulfonic acid
RT Room temperature

xii
SPE Slow proton exchange
SPE1 1,4,6,9,12,14,19,21-octazabicyclo[7,7,7]tricosan-5,13,20-trione
SPE2 1,4,7,10,13,16,21,24-octazabicyclo[8,8,8]hexacosan-5,6,14,15,22,23-hexone
TCA Trichloroacetic acid
TFA Trifluoroacetic acid
THF Tetrahydrofuran
TLC Thin layer chromatography
Tren Tris(2-aminoethyl)amine
Trenest Tris(2-(ethyl oxoacetate)aminoethyl)amine
TUC 1,4,6,9,12,14,19,21-octazabicyclo[7,7,7]tricosan-5,13,20-trithione

1 Introduction
1.1 Importance of pH Measurement
The measurement of pH is a crucial element of many analytical, biochemical, medicinal, and
clinical studies. The definition of pH is most broadly stated as the activity, or effective
concentration, of hydrogen ions that are solvated in any given solution. Links between
dysregulated pH and various pathologies have been vigorously studied.1,2,3 More specifically,
cancer is often notably linked to acidosis: the reduction of extracellular pH.4 Many studies have
covered the link between acidosis and cancer and have notably determined that tumour related
acidosis can be found as early as carcinoma in situ, one of the earliest stages of cancer growth.1
Thus, it follows that clinical detection of acidosis in vivo can be a useful tool in early cancer
detection and diagnosis. In addition to cancer, pH abnormalities have recently been linked to
various neurological pathologies such as Alzheimer’s disease3,5,6,7 and known links to ischemia
have been well established.3,6 The need and applicability for in vivo pH measurement is broad and
ubiquitous, and thus the methods by which measurements are made must be studied and developed
extensively. However, aqueous media is not the only mode by which pH has been studied. Various
industrial processes and analytical protocols require measurement of pH in diverse organic media,
and many environmental factors such as activity changes caused by ionic strength or at low pH
have not been well characterized in organic solvents.
1.1.1 Modern pH Measurement Methods
The most common methods used for pH measurement, such as pH electrode and colorimetric pH
indicators (including pH paper), are not suited for an in vivo environment. These methods either
require biopsies, which are invasive and remove tissue from the host, or require direct application
to a tissue. This direct application comes with multiple caveats. Electrodes are not suitable for live
in vivo methods due in part to the severe invasiveness and logistical difficulties in being able to
measure different types of tissues. Common chemical pH indicators are often toxic and are rarely
quantitative, instead offering measurements across pH ranges rather than giving discrete numerical
measurements. The most typical and simple laboratory practices are rendered impractical when
postured in a clinical environment. In addition to this, electrodes are often dysfunctional or
2
complex when used in non-aqueous media, and few indicators are established reliably for use
especially in more non-polar organic solvents.
Since these common practical methods are not suited for in vivo measurement, pH detection is
often proposed using spectrometry and imaging. Accurate and successful pH imaging has already
been demonstrated in vivo using Near-Infrared Spectroscopy (NIRS) and fluorescence
spectroscopy, requiring the use of extraneous chemical sensors.8,9,10 However, despite recent
advances, NIRS and fluorescence pose a challenge for truly universal clinical applications due to
the inability of these spectroscopic modalities to achieve deep tissue penetration.11 Other imaging
modalities including Positron Emission Tomography (PET) and X-ray Computed Tomography
(CT) involve invasive ionizing gamma rays and x-rays, respectively, which should be avoided
whenever possible. However, Magnetic Resonance (MR) can overcome these limitations, as MR
applies benign radio-wave radiation and promises unlimited tissue penetration. Clinically, MR is
applied as either Magnetic Resonance Imaging (MRI) or Magnetic Resonance Spectroscopy
(MRS) to provide either an in vivo image or NMR spectrum, respectively.
1.1.2 Measurement of pH by NMR Sensors
The sensing of pH by NMR is has been an attractive but remaining challenging research topic.
Strategically, NMR spectra are utilized to solve the relative amounts of two protonation states, B
and BH+, of a chemical sensor undergoing the following chemical exchange:
BH+ ↔ B + H+ (1)
When the relative concentrations of these species are known in tandem with the dissociation
constant, pKa, of the sensor, pH can be found through acidity functions such as the Henderson-
Hasselbalch equation. Many sensing molecules and classes of pH sensors have been developed
and studied in detail.12 For example, imidazole derivatives have been found to be reliable pH
monitors in ex vivo titrations and measurements.13,14 In imidazole, certain hydrogen peaks exhibit
strong environmental sensitivity and will predictably change their NMR chemical shifts in
response to protonation of the adjacent nitrogen atoms. Similar properties have been observed ex
vivo in both naturally occurring phosphates15 and extraneous phosphate derivatives,16 where 31P-
NMR can be used to observe chemical shift alterations. These sensors both employ Fast-Proton-
Exchange (see section 1.1.3 for more details). CEST-MRI has also been utilized to varying degrees
3
of success for quantitative in vivo in small mammal pH measurements over the last few
decades,14,17,18,19 and have been paired with other imaging modalities such as PET.19 CEST
however has found little clinical use due to low sensitivity, accuracy and specificity, which are
crucial for in vivo quantitative analysis.
While these sensors have shown great analytical promise, they face limitations when in an in vivo
setting due to the chemical shift-based nature of these sensing methods. Critically, chemical shift
of a pH sensitive atom will not depend solely on the pH of the solution. Chemical shift can be
altered significantly when structural inhomogeneities, such as boundaries between tissue samples,
are present. Secondly, physical properties, such as magnetic susceptibility and ionic strength, can
further alter chemical shift by altering the nature of the magnetic field passing through a sample,
altering pH readings.20 While in an ex vivo setting these issues are overcome by simple titration
curve calibration, sample calibration and standardization become complicated and impractical
when working in vivo. Thus, chemical shift-based sensors are not optimal as NMR pH sensors for
clinical applications.
However, this is not to say that NMR itself is the source of limitation. Changing chemical shift as
a function of pH is a consequence of the properties of the sensor itself: exchange of protons
between a molecular sensor and a solvent is rapid. This Fast-Proton-Exchange (FPE) is the cause
of chemical shift dependence and is overcome when the proton exchange rate is slowed down
significantly. Thus, the main crux of this thesis: herein is presented the Slow-Proton-Exchange
(SPE) phenomenon. With SPE, a greatly decreased proton exchange rate allows for much greater
accuracy and reliability of pH measurement using NMR spectroscopy. Before discussion of how
this phenomenon is achieved practically, it is necessary to continue by discussing how Slow-
Proton-Exchange works theoretically, and why it is argued here that the practical applicability is
more optimal than an FPE chemical shift-based sensor.
1.2 The NMR Time Scale and Slow-Proton-Exchange
To begin discussion about slow or fast proton exchange, it is first important to define what
reference frame for rate is being used. When it is said that a process is undergoing fast or slow
exchange, this is in comparison to the so-called NMR time scale. Fundamentally, the NMR time
scale is defined by the resonant frequency difference (expressed in Hertz or as chemical shift) that

4
can be resolved by NMR between a given proton signal that exchanges between two discrete
states.21 Should the exchange rate between the two states be larger than difference in resonant
frequencies between signals in either state, FPE is taking place. The opposite applies: if the
exchange rate between two states is smaller than the resonant frequency difference, it is said to be
undergoing SPE.
On an NMR spectrum, the effects that differing exchange rates have overall on an exchanging
proton spin environment becomes clear. For example, take a hypothetical molecular pH sensor
possessing a proton with discrete chemical shifts for a de-protonated and protonated state. In a
fast-proton-exchange scenario (Figure 1), these two chemical shifts are not resolved; instead, the
two chemical shifts coalesce into a single peak. The coalesced peak adopts a chemical shift with a
weighted average between the shifts observed for either de-protonated or protonated state.
Furthermore, the chemical shift is proportionally dependent on the fraction of each protonation
state in solution. The imidazole derivatives and phosphate derivatives previously introduced
function using this Fast-Proton-Exchange mechanism and therefore exhibit chemical shift
dependent, FPE pH sensing. To reiterate, changes in chemical shift not directly caused by pH
changes can occur especially if used in typical in vivo environments, and thus FPE sensors suffer
from lower reliability in complicated clinical situations.
Figure 1: A hypothetical NMR spectra for a chemical sensor undergoing Fast-Proton-Exchange. For a peak sensitive
to pH, the chemical shift would be found at a weighted average between chemical shifts for each isolated protonation
state.
If the same hypothetical pH sensor were to instead undergo Slow-Proton-Exchange, the two
chemical shifts corresponding to either protonation state would both be well resolved and
observable simultaneously on an NMR spectrum. Whereas under Fast-Proton-Exchange, the

5
chemical shift is used as a signal to determine pH, Slow-Proton-Exchangeable species would alter
their integrations in response to changing protonation state amounts. This effectively means over
the full pH sensing range, both de-protonated and protonated species would be observable at all
pH values (Figure 2). Not only does this allow for easily accessible ratiometric analysis of any
given NMR spectrum, but this also circumvents the major issue facing chemical shift dependent
pH sensors: alterations in chemical shift due to non-pH related environmental factors no longer
affect measurements.
Figure 2: A hypothetical NMR spectrum for a chemical sensor undergoing Slow-Proton-Exchange. Peaks for both
protonation states are well resolved and simultaneously visible. Integrations of each peak represent the relative amount
of each protonation state present.
1.3 The SPE Sensors: SPE1 and SPE2
The main focus of this research is the application of the SPE phenomenon as a tool for accurate
ratiometric pH sensing. Three sensors have been previously developed by the Zhang Research
Group that exhibit SPE and are sensitive to pH. The sensors have been dubbed SPE122 and SPE2,
A third sensor, TUC,23 has also been developed but will be discussed in Chapter 3, as it has only
been exhibited in organic solvents, such as DMSO to function as an SPE sensor. All sensors have
in common a “three-armed-cage” geometric structure, which have been verified in previous
research through NMR and crystallographic methods. At the bridgehead between the arms of the
cage structure are protonatable bridgehead nitrogen atoms that adopt an endo formation – with the
lone pair facing inwards into the structure cavity (Figure 3). The differences in structure are
brought about by the length and/or chemical composition of the arms of the cage.

6
1.3.1 SPE1: Structure and Properties
SPE1 is a three-armed cryptand with a small internal cavity.22 These arms are connected at central
bridgehead nitrogen atoms with lone pairs pointed internally towards the cavity, which can be
protonated in an endo conformation. Upon protonation of the bridgehead nitrogens, the urea
functional groups located on each arm of the molecule will flip inwards, allowing the internal
proton to engage in hydrogen bonding with the urea oxygen. This is believed to be the mechanism
causing SPE, as once the hydrogen is coordinated within the molecular cavity, it is kinetically
hindered from rapid exchange with the external solvent. As can be seen in Figure 3, protons bound
to two methylene carbons will change their magnetic microenvironment upon protonation. This is
clearly observed on the NMR spectra (Figure 4) as two separate methylene peaks.
Figure 3: Change in chemical structure upon protonation of SPE1. The pink cloud represents negative charge buildup
due to lone pair electrons. Methylene peaks A, B, A’, and B’ are analyzed on NMR spectra.

7
Figure 4: NMR spectra for SPE1 methylene peaks at various pH values. As pH decreases, the integration of A’ and
B’ decrease as the peaks for A and B increase in proportion.
Interestingly, though SPE1 has two bridgehead nitrogens, only two protonation states are
observed: neutral SPE1 and bis-protonated SPE1. Evidence of a lack of mono-protonated species
is provided by Figure 4, where the growth of only two peaks corresponding to each methylene of
SPE1H22+ appears, indicating a conservation of a horizontal mirror symmetry. In a mono-
protonated variant of SPE1, a loss of mirror symmetry is expected, and four methylene peaks
would be predicted, as these -CH2- groups will experience different chemical environment closer
to or further from the positively charged central N-atom. Deductively, this indicates that upon
protonation of SPE1, two protons simultaneously bind – a phenomenon known as positive
cooperativity. Positive cooperativity likely occurs because the SPE1 inner cavity is small enough
that, upon binding of only a single proton, the endo conformation of the urea groups creates a great
deal of electrostatic strain between lone pairs of electrons. To alleviate the increased chemical
instability, a second proton binds in tandem to the second bridgehead nitrogen. In other words, it
was observed that pKa1 > pKa2, and the apparent pKa utilized was an average of the two values (pKa
= 0.5(pKa1 + pKa2). The mono-protonated species was not observed during the NMR titration
experiment.

8
While this makes for simple spectra, the apparent single-step protonation reduces the total pH
sensing range of the molecule. The apparent pKa of SPE1 was found to be 8.00 ± 0.06 at 20 °C
and 7.72 ± 0.07 at 37 °C, with a sensing range approximately between pH 7-9. The SPE
phenomenon allowed for accurate detection of pH changes as low as Δ0.02. However, the basic
pH in combination with the low sensing range posed challenges for true use in a biological setting,
and so a new sensor with lower pKa and greater sensing range was warranted.
1.3.2 SPE2: Function and Properties
A second generation SPE sensor, SPE2, was developed which was able to satisfy the increased
range and decreased pKa criteria. This compound was introduced as an SPE sensor by Loise
Perruchoud and is the subject of a manuscript currently in preparation. Like SPE1, the structure
of SPE2 is a three-armed cryptand with endo conformed nitrogen bridgeheads that can be
protonated. The incorporation of the second carbonyl group into the linker arm produces some
significant consequential differences. Firstly, the addition of the electron withdrawing carbonyl
serves to reduce the nucleophilicity of both bridgehead nitrogens, reducing pKa1. Second, space is
created between nitrogen bridgeheads, thus alleviating negative charge buildup as seen in SPE1.
This means that two separate protonation events at pKa1 and pKa2 values can be observed
separately. Finally, upon mono-protonation, the dipoles of the carbonyl groups point in opposite
directions, thus directing partial positively charged amide protons, as oppose to partial negatively
charged carbonyl oxygens in SPE1, into the central cavity. These three protons undergo hydrogen
bonding at the bridgehead nitrogen, significantly reducing its nucleophilicity and thus reducing the
value of pKa2 beyond what could be expected only accounting for charge buildup. This can be
described as negative cooperativity. See Figure 5 for a mechanistic depiction of SPE2 protonation.
All of this results in an increase in the operable pH sensing range. Since both bridgehead nitrogens
of SPE2 are separately protonated, a loss of horizontal mirror plane symmetry is expected between
the mono-protonated SPE2 compared to the other protonation states. This indeed is observed on
NMR as the appearance of four peaks appears during the first protonation event (Figure 6),
indicating that two new methylene spin environments are added.

9
Figure 5: Structural changes in SPE2 upon protonation. Mono-protonation results in the loss of a horizontal mirror
plane of symmetry, while bis-protonation restores the mirror plane.
Figure 6: Selected NMR spectra of SPE2 methylene peaks at various pH values. Starting at upper right, as pH
decreases, four peaks representing mono-protonated SPE2 appear. As pH decreases into the second protonation event,
these four peaks decrease in integration while two peaks representing highly symmetric bis-protonated SPE2 appear.
The pKa values for SPE2 are 7.30 ± 0.05 at 20 °C and 6.98 ± 0.06 at 37 °C (hereafter referred to
as the biological pH range), and 1.57 ± 0.06 at 20 °C, and1.59 ± 0.09 at 37 °C (hereafter referred
to as the low pH range).

10
1.4 Objectives
The objective of this research was to take the SPE phenomenon and demonstrate its viability and
reliability in various archetypical pH measurements. Herein is presented the real-time use of SPE2
in an enzymatic hydrolysis, designed to emulate the most basic type of metabolic process.
Furthermore, applications of new SPE sensors are expanded from common aqueous solution to the
measurement of non-aqueous pH, specifically in DMSO and methanol. In both cases, the aim was
to demonstrate that SPE pH sensors could accurately measure and thus be useful in a wide range
of physical, analytical, and biological chemical uses.

11
2 Hydrolysis of Ethyl Acetates using Pig Liver Esterase
2.1 Background
2.1.1 Purpose
As discussed in Chapter 1, a major reason to pursue pH measurement is to detect acidosis or pH
related pathology that could signify cancer or neurological disorders. A wide range of metabolic
processes are accompanied by some change in pH, and thus monitoring pH can be a useful
biomarker to track a specific metabolic process. Moreover, the ability to reliably track in vivo pH
in real time has wide utility in metabolic research as well as potential clinical applicability. Real
time pH changes have been demonstrated with SPE1 in past research,22 in fermenting E. coli
bacteria. However, the relative high pKa prevented it from measuring metabolic processes that
produce more acidic products. The lower pKa values and wider operating windows of SPE2 open
up potential to diversify the types of reactions that are measurable and increase the time in which
they can be measured. SPE2 has not previously been demonstrated to measure real time pH in
both of its measurement ranges. Thus, the objective of this project was to demonstrate SPE2 as an
accurate real time pH sensor in a simulated metabolic process where pH change is a known
biomarker. Furthermore, SPE2 was applied to measure differences in hydrolysis rate and pH
between background solvolysis and enzymatic hydrolysis. This demonstration was designed to
exhibit both pH sensing ranges of SPE2. In this case, the metabolic process chosen was a
enzymatic hydrolysis of ethyl acetate and halogenated derivatives thereof using Pig Liver Esterase.
2.1.2 Properties of Pig Liver Esterase
Esterases are a diverse group of enzymes that are abundantly found in various metabolic processes
such as fatty acid catabolism and deacetylation reactions. Pig Liver Esterase (PLE) is often used
in research and has been most commonly known as a tool for enantiospecifically hydrolyzing
prochiral esters into pure enantiomer components, as well as kinetic resolution of racemic mixtures
of prochiral esters.24,25,26 PLE is well established as a synthetic tool, and as a result its kinetics and
properties have been well understood for years, and has a broad range of ester substrates including
methyl, ethyl, and tert-butyl esters of cycloalkanoates and 1,2-dicarboxyesters.27,28 This makes
ethyl esters and halogenated derivatives viable substrates for use with PLE.

12
2.1.3 Experimental Design and Rationale
To produce a hydrolysis reaction catalyzed by PLE, for which progress can be monitored by pH
change, it is necessary to ignore many of the conventions that are typically applied in a study of
enzyme catalyzed reactions. Namely, the pH is intentionally left uncontrolled or unbuffered, in
order to permit the pH to change over a very wide range of values. Also crucial to the progress of
this reaction is the choice of substrate used. In this case, simple sterically unencumbered ethyl
acetates and their halogenated derivatives were chosen. From a simple chemical standpoint, the
hydrolysis of these compounds releases an acetic acid derivative and ethanol, of which the former
product is responsible for a decrease in pH over the course of reaction (Figure 7).
Figure 7: The general reaction scheme for the PLE catalyzed ester hydrolysis. The release of an acetic acid derivative
causes a decrease in pH over time. Ethyl acetate, ethyl trifluoroacetate, and ethyl trichloroacetate were the chosen
substrates.
Ethyl acetate (EtOAc), as a natural substrate of esterase, releases one equivalent of acetic acid with
a pKa of 4.76 upon hydrolysis. Since acetic acid is thus a relatively weak acid, it was needed in
very high concentrations in order to reach pH values low enough to be measured in the low pH
range of SPE2. Since this substrate was not predicted to produce the low pH values to be measured
by the second pH window close to the pKa2 of SPE2, tri-halogenated derivatives of EtOAc were
used to produce more acidic products. The mechanism of the hydrolysis is typically through a
negatively charged tetrahedral intermediate on the carbonyl carbon, therefore, introducing
electronegative halogens is expected to accelerate the hydrolysis. Specifically, ethyl
trifluoroacetate (EtOTFA) and ethyl trichloroacetate (EtOTCA) were used. Upon hydrolysis, they
release an equivalent of trifluoroacetic acid (TFA) and trichloroacetic acid (TCA), respectively,
which are both known to be strong organic acids in aqueous media. With sufficient catalysis, it
was predicted that the ethyl esters of these acids would be hydrolyzed to a sufficient degree to
produce pH values below 3, which fit into the low pH sensing range of SPE2.

13
EtOTFA and EtOTCA (and to a lesser extent, EtOAc) all contain highly electrophilic carbonyl
centers, and thus are known to undergo some degree of background hydrolysis by the aqueous
solvent. Thus, to ensure that the activity of PLE is being measured as opposed to background
hydrolysis, all hydrolyses were performed both with and without the enzyme present, to ensure
that differences in reaction rates could be measured. Ideally, in all hydrolyses, pH would be
obtained using SPE2 in the biological pH range, and, after some amount of time, in the low pH
range as well.
2.2 Results and Discussion
All data are taken at room temperature over a 6.5 hour time period.
2.2.1 Hydrolysis of Ethyl Acetate
As expected, the hydrolysis of EtOAc is catalyzed by PLE to produce acetic acid, and consequently
decreasing pH over time, which can be accurately measurable in real time by SPE2 on NMR. With
PLE in solution, after approximately 45 minutes of reaction, the pH almost linearly dropped from
7.61to 6.09, after which pH was no longer trackable using SPE2. Due to a combination of partial
denaturation of PLE and the high pKa of acetic acid, the reaction was not able to proceed far enough
for low pH measurements to be possible. Crucially, with no enzyme present, background
hydrolysis of EtOAc was not at all observed over a 24-hour period. This is a reasonable
observation, as the carbonyl of ethyl acetate is not particularly electrophilic, and only reacts very
slowly in pure water at room temperature. While only pH values in the sensing range of SPE2
were observed, and no low pH values were measurable after 24 hours, the observation of pH
beyond the limits of SPE1 was promising. The results of this hydrolysis can be visualized in Figure
8 and Figure 9.

14
Figure 8: Spectra over time of SPE2 within the range of 4 ppm to 2.5 ppm during hydrolysis of EtOAc.
Figure 9: pH shown as a function of time as measured by SPE2 for the hydrolysis of EtOAc using PLE.
5.00
5.50
6.00
6.50
7.00
7.50
8.00
0 5 10 15 20 25 30 35 40 45
pH
Time Elapsed (mins)
pH = 7.61, T = 0 mins
pH = 7.48, T = 3 mins
pH = 7.24, T = 6 mins
pH = 7.07, T = 9 mins
pH = 6.98, T = 12 mins
pH = 6.91, T = 15 mins
pH = 6.85, T = 18 mins
pH = 6.74, T = 21 mins
pH = 6.58, T = 24 mins
pH = 6.49, T = 27 mins
pH = 6.50, T = 30 mins
pH = 6.23, T = 33 mins
pH = 6.18, T = 36 mins
pH = 6.09, T = 39 mins
pH = 6.09, T = 42 mins

15
2.2.2 Hydrolysis of Ethyl Trifluoroacetate
In stark contrast to the EtOAc hydrolysis, EtOTFA hydrolysis was rapid and the resulting solution
spanned a wide range of pH values. Before addition of PLE, the pH of the sample was set to have
an average of 8.21 ± 0.01. Within the first 10 minutes of reaction either with or without PLE, pH
drops rapidly to an average of 2.69 ± 0.06, then continues to decrease steadily over the next 6.5
hours to a pH of 1.32 ± 0.03. After the 10 min. time point, all peaks representing neutral SPE2 had
disappeared, and mono and bis protonated SPE2 remained. Thus, pH measurements at the low
sensing range of SPE2 could be obtained. Interestingly, the difference in hydrolysis rate observed
was rather small with or without PLE present. This was an indication that background hydrolysis
by the solvent itself was occurring with a much faster rate than the hydrolysis of EtOAc. This is a
predictable result, as the fluorine within EtOTFA drastically increases the electrophilicity of the
carbonyl center and stabilize the anionic transition state, making it highly susceptible to hydrolysis
by water even without catalysis. Though the enzyme component is less significant in the hydrolysis
of EtOTFA, a small average decrease in pH of Δ0.11 at the final 370 min. time point was observed
in the presence of PLE as compared to without. This was likely a result of marginally faster
reaction rates in the presence of PLE during the first 10 minutes of reaction time. Though
individual pH data points are slightly lower with enzyme hydrolysis, the reaction rate does not
seem to differ appreciably in the low pH range. At these pH values, PLE had likely denatured and
thus no longer contributed to hydrolysis. This is supported in literature, where the irreversible
denaturation point for PLE is at approximately pH < 4.29,30,31,32 The results of this hydrolysis can
be observed in Figure 10 and spectra for a single trial in the presence of PLE can be seen in Figure
11. All three trials for all conditions can be seen in Figure S6 – Figure S11 in Supplemental
Information for trials with and without PLE present.

16
Figure 10: Data for PLE catalyzed hydrolysis of ethyl trifluoroacetate. The pH is shown as a function of time. For
comparison, potentiometric pH measurements are shown in red.
Figure 11: Selected NMR spectra obtained during hydrolysis of EtTFA in the presence of PLE.
0.0
1.0
2.0
3.0
4.0
5.0
6.0
7.0
8.0
9.0
0 100 200 300 400
pH
Time Elapsed (mins)
No Enzyme, SPE2 Measurement
With Enzyme, SPE2 Measurement
No Enzyme, Electrode Measurement
With Enzyme, Electrode Measurement

17
2.2.3 Hydrolysis of Ethyl Trichloroacetate
The hydrolysis of EtOTCA again yielded distinct results from both EtOAc and EtOTFA. Without
the use of enzyme, initial average pH was 8.15 ± 0.11 and dropped to 5.75 ± 0.17 within the first
50 minutes of hydrolysis, after which pH dropped below the biological sensing range of SPE2.
After 161 minutes, SPE2 could once again measure pH at an average of 2.96 ± 0.19. Between 161
and 369 minutes, the pH dropped to 2.61 ± 0.12. With the presence of PLE, the hydrolysis had a
much more rapid rate. The pH started at an average of 8.03 ± 0.05 and dropped rapidly past the
biological sensing range of SPE2 until 77 minutes later, at which SPE2 could measure the pH at
2.83 ± 0.02. The pH then slowly dropped until 2.46 ± 0.07. Thus, in the EtOTCA hydrolysis, there
was a significant observable difference in hydrolysis rate when PLE was added compared to when
hydrolysis was allowed to occur without enzyme catalysis. The slower rate of background
hydrolysis of EtOTCA compared to EtOTFA was a consequence of the insolubility of the ester,
meaning that hydrolysis could only occur at the phase boundary between EtOTCA and the aqueous
solution. The results of this hydrolysis can be observed in Figure 12 and spectra for a single trial
each with and without PLE can be seen in Figure 13 and 14 respectively. Note that in Figure 14,
the neutral SPE2 can be observed for a much longer period of time with no enzyme present. All
three trials for all conditions can be seen in Figure S12 – Figure S17 in Supplemental Information
for trials with and without PLE present.
Figure 12: Data for PLE catalyzed hydrolysis of ethyl trichloroacetate. The pH is shown as a function of time. To fill
in pH values outside of the sensing range of SPE2, potentiometric pH measurements are shown here in red.
0.0
1.0
2.0
3.0
4.0
5.0
6.0
7.0
8.0
9.0
10.0
0 100 200 300 400
pH
Time Elapsed (mins)
No Enzyme, SPE2 Measurement
With Enzyme, SPE2 Measurement
No Enzyme, Electrode Measurement
With Enzyme, Electrode Measurement

18
Figure 13: Selected NMR spectra obtained during hydrolysis of EtTFA with PLE present.
Figure 14: Selected NMR spectra obtained during hydrolysis of EtTFA with no enzyme present.

19
2.3 Conclusions
SPE2 has been demonstrated as an accurate and applicable pH sensor in real-time ester hydrolysis
reactions. Both background hydrolysis and enzymatic hydrolysis reactions were measured for three
individual substrates, and differentiations in rates could be observed with accuracy. This
experiment provides proof that is SPE2 a viable sensor and also lays down a framework for
potential future utility of the compound. Though this project was ostensibly a proof of concept for
real-time measurement accuracy, it can be easily inferred that SPE2 could potentially act as a
measurement tool for enzyme kinetic studies in vivo under more controlled, deliberate conditions.
Though it is not common to require study of biological reaction rates over such a vast range of pH
values, the versatility of SPE2 demonstrated herein could prove invaluable to a diverse series of
analytical uses.
2.4 Materials and Methods
2.4.1 Synthesis of Tris(2-(ethyl oxalate)aminoethyl)amine (Trenest)
Scheme 1: Synthetic scheme for the synthesis of tris(2-(ethyl oxalate)aminoethyl)amine (trenest).
Tris-(2-aminoethyl)amine (tren) (0.73 g, 5.0 mmol) was dissolved in 40 mL of THF in a dropping
funnel and added dropwise to 7.5 mL of diethyl oxalate over the course of 3 hours at room
temperature. The volume solution was reduced to 10% by rotary evaporation and combined with
75 mL of diethyl ether. The solution was stored at room temperature for 12 hours. The ether was
decanted, and the remaining yellow oil was pre-adsorbed on silica gel and eluted through a silica
column using 19:1 ethyl acetate:ethanol. The solvent was reduced to 10% volume using rotary
evaporation and the remaining mixture was left overnight. Clear colorless trenest crystals were
obtained with a yield of 1.24 g (55%, 2.8 mmol). TLC (19:1 ethyl acetate:ethanol) and 1H-NMR
were used for characterization. Rf = 0.24. 1H-NMR (CDCl3) δ: 7.49 (broad, 1H), 4.37 (q, 2H), 3.42
20
(q, 2H), 2.74 (t, 2H), 1.41 (t, 3H). The 1H-NMR spectrum can be viewed in Figure S4 in
Supplemental Information.
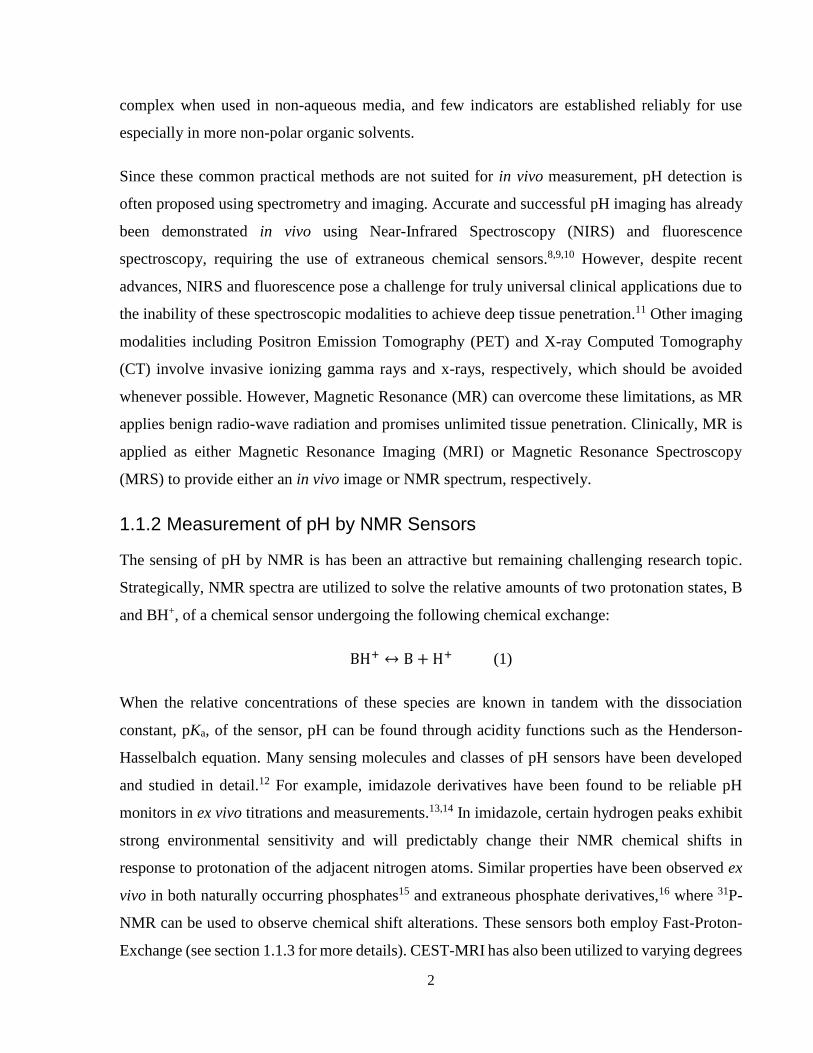
2.4.2 Synthesis of 1,4,7,10,13,16,21,24-octazabicyclo[8.8.8]hexacosan-5,6,14,15,22,23-hexone (SPE2)
Scheme 2: Synthetic scheme for the synthesis of 1,4,7,10,13,16,21,24-octazabicyclo[8.8.8]hexacosan-
5,6,14,15,22,23-hexone (SPE2).
Trenest and tren were combined using an equimolar under the high dilution condition. Trenest
(1.14 g, 2.5 mmol) was dissolved in 250 mL ethanol in a dropping funnel. In another dropping
funnel, tren (0.37 g, 2.5 mmol) was dissolved in 250 mL ethanol. Both dropping funnels were
connected to a 4 neck round bottom flask containing 300 mL ethanol and their contents were added
dropwise slowly and simultaneously at room temperature. The volumes of either dropping funnel
did not differ by more than 5 mL at any point during addition. After addition, the mixture was
stirred for 12 hours. The mixture was then reduced to 10% volume by rotary evaporation and stored
at room temperature for another 24 hours. The white precipitate was collected by vacuum filtration
and washed with ethanol. White powder SPE2 was collected with a yield of 0.70 g (60%, 1.5
mmol). 1H-NMR was used for characterization. 1H-NMR (D2O) δ: 3.22 (q, 2H), 2.49 (t, 2H). The
1H-NMR spectrum can be viewed in Figure S5 in Supplemental Information.
2.4.3 Hydrolysis of Ethyl Acetate Derivatives Using Pig Liver Esterase
Solutions of 0.9 mM SPE2 in 700 μL water were prepared in an NMR tube with a internal D2O
capillary for deuterium lock. To this solution, either 6.0 μL ethyl acetate, 11.9 μL ethyl
trifluoroacetate, or 13.9 μL ethyl trichloroacetate were added, after which 1H NMR on a 500 MHz
Bruker spectrometer was performed every 10 minutes for 370 minutes. All spectra were recorded

21
using 32 scans and presaturation of the water signal. Hydrolyses were repeated in triplicate. The
same process was then repeated using solutions of 4.8 μM Porcine Liver Esterase and 0.9 mM
SPE2 in 700 μL water. These experiments were scaled up by a factor of ten and repeated, and pH
was measured in triplicate using a Fischer accumet pH meter.

22
3 Measurement of pH in Non-Aqueous Solvents Using SPE NMR Sensors
3.1 Background
The concept of pH as a measure of proton activity is most commonly applied to aqueous media.
However, non-aqueous media, specifically organic solvents, have found various applications in
industry, pharmacy, and biochemical analysis, in which proton transfer or Bronsted acid-base
reactions play essential roles. For example, modulation of pH is important in the design of
electroplate baths, of which non-aqueous variants are utilized.33,34 Many batteries contain non-
aqueous electrolyte solutions or mixed organic-aqueous solutions with careful pH regulation.35,36
In pharmaceutical chemistry, various organic-aqueous mixed solvents are used to determine
physical and thermodynamic properties of hydrophilic drugs.37,38 Non-aqueous biocatalysis is also
an emerging strategy for the synthesis of organic molecules, for which pH regulation is critical to
ensure optimal activity of catalysts.39 Thus, from a practical standpoint, non-aqueous pH
measurement has a wide utility. On the other had, understand and control proton transfer in non-
aqueous environment is fundamentally important. For example, non-aqueous chemistry is applied
in a research context to determine pKa values of various acids as a strategy for overcoming the
solvent leveling effect seen in water.40,41 Overall, developing robust methods for pH measurement
is valuable both in water and in other media. However, accurate measurement of proton activity in
organic solvent remains a challenging task, due to various reasons discussed below.
3.1.1 Non-Aqueous Media and Activity
For many of the industrial and pharmaceutical applications previously mentioned, simple
potentiometry is often a sufficient method of determining pH values, especially in the cases of
mixed organic-aqueous solvent systems. However, consumer pH electrodes are generally
inaccurate in any system other than a 100% aqueous solvent, and more robust laboratory electrodes
can become quite expensive or require complicated setups. Potentiometry, inherently, struggles as
a method to measure pH under conditions such as high ionic strength or extreme high or low pH
values. This is due to the effect ionic activity has on a solution.42 Activity incorporates hydrogen
bonding and electrostatic interactions such as ion-pairing into consideration for concentration
measurements. This is especially true for solutions of electrolytes, such as a proton and its counter-
anion that are produced upon acid dissociation.

23
Water has a known dielectric constant of 80.1,43 one of the highest for any known solvent. Thus,
water is uniquely effective at dispersing ionic charges through hydrogen bonding and dipolar
interactions. As a consequence, in aqueous media, between pH values of 2-14, the activity either
does not appreciably change. In cases where activity must be predicted, known models to predict
activity coefficients such as the Debye-Hückel, Davies, or Pitzer equations have been
established.41,44,45,46 None of this applies particularly well in organic media. Firstly, organic
solvents are less capable of interacting with ions in solution due to smaller dipoles or fewer
possible hydrogen bond donors. Thus, the total chemical potential, and therefore activity, of an
organic solution can be more significantly altered by relatively smaller changes in ion
concentration than would be the case in aqueous media. Second, with the exception of high-
dilution limiting laws,45 it appears that there have been no established and reliable models of
activity coefficient determination in any solvent aside from water.
In aqueous media at very low pH, activity begins to become a significant factor. To handle this,
acidity functions such as the Hammett Acidity Function are employed to relate the degree of
protonation of some basic indicator (typically a substituted aniline) to some value representing the
protonation strength of the solution as a whole.41 This approach can be applied in theory to non-
aqueous media. However, few indicators have been established, especially at low pH, for non-
aqueous media for which an acidity function can be applied.
3.1.2 SPE sensing of Non-Aqueous pH – Design and Rationale
Herein, it is proposed that the SPE sensors can be expanded for non-aqueous pH measurement.
SPE1, SPE2, and TUC were all titrated in DMSO as a proof of concept that the SPE phenomenon
was still observable in solvents other than water and to measure the pKa of each sensor. DMSO
was chosen as a solvent as pH measurement in DMSO has been established in literature, and
compendia of acid strengths for wide varieties of organic acids have been established, such as the
Bordwell table.46 Though this information was used as a guide to paint a general approach towards
this experiment, many individual data were called into question on the grounds of inconsistencies
derived from activity and ion-pairing.
In DMSO, one of the objectives was to control ionic strength and, if possible, characterize activity
using SPE sensors. Thus, lithium chloride, which is well soluble in DMSO, but does not produce
1H NMR signal to the background, was required as an electrolyte to each measurement. DMSO is

24
known to be highly hygroscopic. It was found in preliminary acid measurements that water intake
could not be neglected as a factor, as water content would rapidly increase and alter pH
measurements. Thus, the water content was controlled by using a 5% water in DMSO solvent
system. Trifluoroacetic acid, acetic acid, p-toluenesulfonic acid, and 4-nitrophenol were used as
analytes for the purposes of this experiment. These acids were chosen both for diversity of
functional groups and diversity of expected pKa ranges.
3. 2 Mathematical Method of Determining pH and pKa values
In this study, potentiometry was used in tandem with NMR measurements as a second
measurement for pH. However, for reasons stated previously, potentiometry was not solely relied
upon as factors such as junction potential and activity may have provided some degree of
inaccuracy to measurements. In these titrations, the SPE sensors were titrated by acids in which
the pKa values are assumed to be unknown and were determined by SPE method. Since the unique
advantage of SPE mechanism allows accurate measure of the concentration of SPE sensors at
different protonation states, together with the known concentration of total acid added, a
mathematical method of determining pH could be established. This allowed for the pKa of the weak
acids and the strength of each SPE sensor (hereafter notated as pKs) to be ignored until pH is
determined, and for the acid strengths to thus be solved after pH is calculated.
This method starts simply with mass balance equations of our sensors. Shown below are the
dissociation equilibria of an arbitrary acid, HA, as well as those for SPE1, SPE2, and TUC in
DMSO:
HA ↔ A− + H+ (2)
SPEHnn+ ↔ SPE + nH+ (3)
First, the dissociation of the acid is approached. Since the total concentration, Ca of the acid is
known, equations can be developed to relate the concentrations of A- and HA as variables at
equilibrium. If any SPE sensor is present in the system and protonated, it can be assumed at large
acid concentrations that all protons contained in the SPE sensor cavity originated from the weak
acid. This allows us to derive the value, S, that represents protons removed from a weak acid by
any SPE sensor based on Eq. 4:
S = [SPEH+] + 2[SPEH22+] (4)

25
We can now approach the dissociation equilibrium of the weak acid. First, Eq. 5 is a simple
expression of the equilibrium condition of acid dissociation, where [H+] is a representation of
solvated hydrogen ion, [A-] is the dissociated acid, and [HA] is the undissociated acid, all as
concentrations in units of moles/litre (M). Eq. 6 simply expresses mass balance: the total
concentration of acid initially added to solution must equal the sum of dissociated and
undissociated acid. In any solvent, the concentration of dissociated acid in total is equal to the
concentration of protons removed from the acid, which in Eq. 7 is expressed as the sum of protons
removed by an SPE sensor and protons freely dissociated and solvated. It follows that the
remaining undissociated acid at equilibrium is equal to the difference between the total acid
concentration and the dissociated acid concentration, as expressed in Eq. 8. By rewriting Eq. 1 in
terms of Eq. 7 and Eq. 8, the total equilibrium equation can be expressed in terms of only hydrogen
ion concentration, analytical concentration of acid initially added to solution, and concentration of
protonated species of any SPE sensor present. This is represented as Eq. 9.
𝐾a =[H+][A−]
[HA] (5)
Ca = [A−] + [HA] (6)
[A−] = S + [H+] (7)
[HA] = Ca − S − [H+] (8)
𝐾a =[H+]2 + S[H+]
Ca − S − [H+] (9)
At this point, it is important to note that this mathematical approach does not account for activity.
An assumption made at this point on is that the acid dissociation constant indeed stays constant
over a change in hydrogen ion concentration. In situations where hydrogen ion concentrations are
very high or where ionic strength is expected to undergo large changes, this assumption would
need modification. However, in situations such as the ones applied herein, under constant ionic
strength no such observation is expected. Thus, mathematically, we can represent this assumption
as:
d𝐾a
d[H+]= 0 (10)

26
We can use this to derive a new expression wherein all variables are known or measurable, with
the exception of hydrogen ion concentration:
0 = d ([H+]2 + S[H+]
Ca − S − [H+]) /d[H+]
= −0.5[H+]2 + [H+](Ca − 2[𝐒𝐏𝐄𝟏𝐇𝟐𝟐+]) + (Ca[𝐒𝐏𝐄𝟏𝐇𝟐
𝟐+] − 2[𝐒𝐏𝐄𝟏𝐇𝟐𝟐+]2) (11)
Solving this equation by use of the quadratic formula allows for a solution for hydrogen ion
concentration:
[H+] = Ca − S ± √Ca2 − CaS (12)
Eq. 6 requires the knowledge of Ca, which is determined experimentally, and the concentrations
of each protonation state of the SPE sensor used, which is determined by 1H-NMR spectroscopy,
thanks to the unique features of SPE sensors. Once pH is determined, pKa values of the weak acids
and sensors can all be solved using simple equilibria calculations, such as one seen in Eq. 9.
3.3 NMR Experiment Results and Discussion
All results and pH values given herein are reported in d6-DMSO with 5% water and 0.01 M ionic
strength at 25 °C.
3.3.1 Properties of SPE1 in DMSO
In DMSO, SPE1 was first and foremost observed to exhibit the SPE phenomenon just as it does
in water. SPE1 was titrated with four different acids: TFA, methylene sulfonic acid (MsOH) acetic
acid, and 4-nitrophenol. Before discussing the results yielded from these titrations, it is important
to note that, as in water, similar strong positive cooperativity was observed in SPE1. As such,
mono-protonated SPE1 was not observed in DMSO at any pH/acid concentration, and an apparent
pKa was measured, instead of individual pKs1 or pKs2. As discussed in Chapter 1.3.1, the apparent
pKa is defined as pKs = 0.5(pKs1 + pKs2). To compensate for these observations, Eq. 12 is modified
to specifically suit the function of SPE1:
[H+] = Ca − 2[𝐒𝐏𝐄𝟏𝐇𝟐𝟐+] ± √Ca
2 − 2Ca[𝐒𝐏𝐄𝟏𝐇𝟐𝟐+] (13)
The titrations with TFA and MsOH did not yield sufficient data to determine neither the pKs of
SPE1 nor the pKa of either acid. This was primarily due to the strong acidity of both acids, which
could be qualitatively explained by Eq. 13, wherein a significantly stronger acid than protonated

27
SPE1 will donate all or nearly all protons to the neutral sensor, returning a value of 0 for free
hydrogen ion concentration. While equilibrium dictates that some small concentration of protons
should still be solvated, NMR is not sensitive enough to detect this concentration and thus pH was
unobtainable. The spectra for TFA and MsOH titrations of SPE1 are in Supplemental Information
Figures S18 and S19, respectively.
As expected, in the case of the titration with relatively weaker acid, namely acetic acid, pH and
pKs values could in fact be determined through NMR spectra and calculation using Eq. 13. The
spectra for this titration can be observed in Figure 15. Since the pH determined by calculation is
dependent on rate of change of proton concentration, only a few spectra are required to make
inference into sensor properties. With this titration, the apparent pKs of SPE1 was determined to
be 3.57 ± 0.05, and pKa of acetic acid was found to be 7.2 ± 0.1. In the case of titration with 4-
nitrophenol, which can be observed in Figure 16, the apparent pKs of SPE1 was found to be 3.61
± 0.08, and pKa of 4-nitrophenol was found to be 6.81 ± 0.09. Before continuing, it is important to
note that these acid pKa values do not comport with literature values for acetic acid and 4-
nitrophenol found in the Bordwell table and are in fact lower.48 The Bordwell pKa values for acetic
acid and 4-nitrophenol are 12.6 and 10.8, respectively. This is easily explainable, as with an
increase in water in the solution, a neutral acid could favour dissociation at equilibrium (and thus
have a reduced pKa) when water is present to coordinate with the resulting ions.

28
Figure 15: Spectra for titration of SPE1 with acetic acid. Acid concentration (Ca) and pH are shown. Solvent peak is
observed at 2.51 ppm. Peaks A and B represent neutral sensor, peaks A’ and B’ represent bis-protonated sensor.

29
Figure 16: Spectra for titration of SPE1 with 4-nitrophenol. Acid concentration (Ca) and pH are shown. Solvent peak
is observed at 2.51 ppm. Peaks A and B represent neutral sensor, peaks A’ and B’ represent bis-protonated sensor.
When all data from both acetic acid and 4-nitrophenol titrations are collectivized, the data found
all determine the pKs of SPE1 to be found as 3.59 ± 0.07. Interestingly, while the typical trend in
the established literature is that the pKa of some neutral acid will increase in DMSO relative to
water,48 it can also be seen that many cationic acids will have lower pKa values. It was observed
that the pKs of SPE1 decreased quite significantly from 8.00 ± 0.06 in water to 3.59 ± 0.07 in
DMSO at 25 °C. In the case of SPE1, due to strong positive cooperativity, the specific acid
dissociation being investigated is that of an bis-cationic species SPE1H22+ into two protons and a
neutral organic molecule, as depicted in Eq. 14:
𝐒𝐏𝐄𝟏𝐇𝟐𝟐+ ↔ 𝐒𝐏𝐄𝟏 + 2H+ (14)

30
In a solvent with a reduced capability for solvating mono-ionic species let alone bis-ionic species,
it is certainly predictable that the chemical potential of a bis-protonated SPE1 species is higher
than would be expected in water, thus favouring dissociation. The proton, which is a much smaller
cation, can be stabilized by DMSO,49 unlike a large bis-cation such as bis-protonated SPE1 This,
in other words, leads to a lower pKa.
3.3.2 Properties of SPE2 in DMSO
SPE2 was also titrated using TFA, MsOH, acetic acid, and 4-nitrophenol. In contrast to SPE1,
SPE2 does not exhibit positive cooperativity, but a strong negative cooperativity instead (see
section 1.3.2), similar to what it is observed in water. Thus, Eq. 12 is rewritten as Eq. 15 below:
[H+] = Ca − [𝐒𝐏𝐄𝟐𝐇+] ± √Ca2 − Ca[𝐒𝐏𝐄𝟐𝐇+] (15)
The TFA and MsOH titrations of SPE2 did not yield pH data again, for the same reasons as with
SPE1. While in water, a second protonation event was observed at a lower pKs2, no such bis-
protonated SPE2 species was observed in DMSO even at acid concentrations as high as 2 M
(approximately 2000 molar equivalents). Unlike SPE1, where stability of a bis-protonated species
compensates for the relative instability of a mono-protonated species, SPE2 exhibits no positive
cooperativity or any other such phenomenon to compensate for electrostatic instability. Thus, a
bis-protonated SPE2 would be expected to strongly favour dissociation. Thus, only measurements
for pKs1 for SPE2 were determined in DMSO. Spectra for TFA and MsOH titrations of SPE2 can
be seen in Supplemental Information Figures S20 and S21.
In the case of the acetic acid titration, pH and pKs values could be determined through NMR spectra
and calculation using Eq. 15. The spectra for this titration can be observed in Figure 17. With this
titration, the pKs1 of SPE2 was determined to be 3.13 ± 0.02, and pKa of acetic acid was found to
be 7.2 ± 0.4. This corroborates the data found in SPE2, with a nearly identical acetic acid pKa. In
the case of titration with 4-nitrophenol, which can be observed in Figure 18, the apparent pKs1 of
SPE2 was found to be 3.17 ± 0.02, and pKa of 4-nitrophenol was found to be 6.29 ± 0.03, slightly
lower than found when using SPE1.
31
Figure 17: Spectra for titration of SPE2 with 4-nitrophenol. Acid concentration (Ca) and pH are shown. Solvent peak
is observed at 2.51 ppm. Peaks A and B represent neutral sensor, peaks A’ and B’ represent bis-protonated sensor.

32
Figure 18: Spectra for titration of SPE2 with 4-nitrophenol. Acid concentration (Ca) and pH are shown. Solvent peak
is observed at 2.51 ppm. Peaks A and B represent neutral sensor, peaks A’ and B’ represent bis-protonated sensor.
When all data from both acetic acid and 4-nitrophenol titrations are collectivized, the pKs1 was
found to be 3.15 ± 0.03 for SPE2. Again, this pKs value is lower than the 7.30 ± 0.06 observed in
water. Since mono-protonated SPE2 is also an ionic species, dissociation may be favoured in
DMSO to stabilize electrostatic potential, just as observed with SPE1. Again, the bis-protonated
SPE2 has not yet been observed in DMSO.
3.2.3 Properties of TUC in DMSO
TUC is unique from SPE1 and SPE2 in that it has limited applicability in aqueous media due to
its insolubility in water. In previous research, TUC has been utilized as an anion sensor in non-
polar solvents.23 Structurally, TUC demonstrates some similar properties seen in SPE1. However,
the carbonyl oxygen atoms are replaced by sulfur atoms. Like SPE1, positive cooperativity is

33
observed, although it is less significant in comparison (pKa2 < pKa1). It undergoes two different
protonation states that are observable on NMR. These two observations are consequences of
having two protonation events with separate pKa values that are close enough to both occur in
tandem. Interestingly, this means that all three possible protonation states of TUC can be visible
on NMR simultaneously. Neutral TUC has only two methylene peaks, consistent with the
symmetry expected. Like SPE2, an extra four methylene peaks corresponding to mono-protonated
TUC appear as pH decreases, indicating a loss in horizontal mirror plane symmetry. This can be
visualized in Figure 19.
Figure 19: Structural changes in TUC upon protonation. All proton signals A – G are analyzed on NMR spectra.
However, unlike SPE2, the bis-protonated TUC shows another four methylene peaks rather than
the two expected for a restoration of the horizontal mirror plane. As determined from previous
work into TUC,23 intra-molecular hydrogen bonding between the thiocarbonyl groups and thiourea
hydrogens causes rigidity in the overall structure, increasing the barrier for rotation of the
methylene groups. Consequently, all individual methyl protons exhibit a unique NMR chemical
shift (making for four methylene peaks in total). Finally, in pure DMSO, the internal protons in
mono and bis protonated TUC are visible as distinct, albeit broad, peaks. Figure 20 shows NMR
spectra depicting peaks for all three protonation states of TUC. Some peaks are obscured by the
DMSO and HDO solvent peaks.

34
Figure 20: Spectra and peak assignments of TUC in d6-DMSO with 1 eq. TFA (top) and no acid present (bottom).
Peaks are assigned with reference to Figure 19.
Unlike SPE1 and SPE2, there is no precedent for SPE pH sensing using TUC in water, due to the
insolubility of TUC. However, in DMSO, TUC is both soluble and a functional SPE sensor. This
opens a possibility to expand the pH sensing range in DMSO, as well as explore acids beyond the
operating pH windows with SPE1 and SPE2.
TUC was titrated with TFA, p-toluenesulfonic acid, acetic acid, and 4-nitrophenol. However, in
stark contrast to SPE1 and SPE2, acetic acid and 4-nitrophenol were not strong enough to observe
protonation up to 0.05 M, and only marginal protonation was observed between 0.05 and 1 M.
Thus, the results for TFA and p-toluenesulfonic acid titrations are presented here. Since TUC is a
new SPE sensor that has not been fully characterized, a full titration was performed with TFA,
which does not contain any proton signals, to observe the spectra of TUC at diverse pH values.
Because all three possible protonation states are simultaneously visible, both pKs1 and pKs2 can be
measured. Eq. 12 is rewritten as Eq. 16 for the purposes of application for TUC:

35
[H+] = Ca − (2[𝐓𝐔𝐂𝐇𝟐𝟐+] + [𝐓𝐔𝐂𝐇+]) ± √Ca
2 − Ca(2[𝐓𝐔𝐂𝐇𝟐𝟐+] + [𝐓𝐔𝐂𝐇+]) (16)
During the TFA titration of TUC, the value of pKs1 was found to be 2.36 ± 0.18, and the value of
pKs2 was found to be 2.04 ± 0.17. Selected spectra for this titration are shown in Figure 21. The
pKa of TFA was indeterminate, as while pH values were calculable, the calculation of pKa of TFA
using Eq. 9 returned undefined values, as the denominator was calculated as having a value of
approximately 0. This is evidence that TFA was measured by TUC as a strong acid in DMSO
under the conditions used – in other words, TFA was nearly fully dissociated.
Figure 21: Selected spectra for titration of TUC with TFA. Peaks A, B, and C belong to neutral TUC; D’, E’, and F’
to mono-protonated TUC; and D, E, and F to bis-protonated TUC. Peak A is obscured by the DMSO solvent peak.
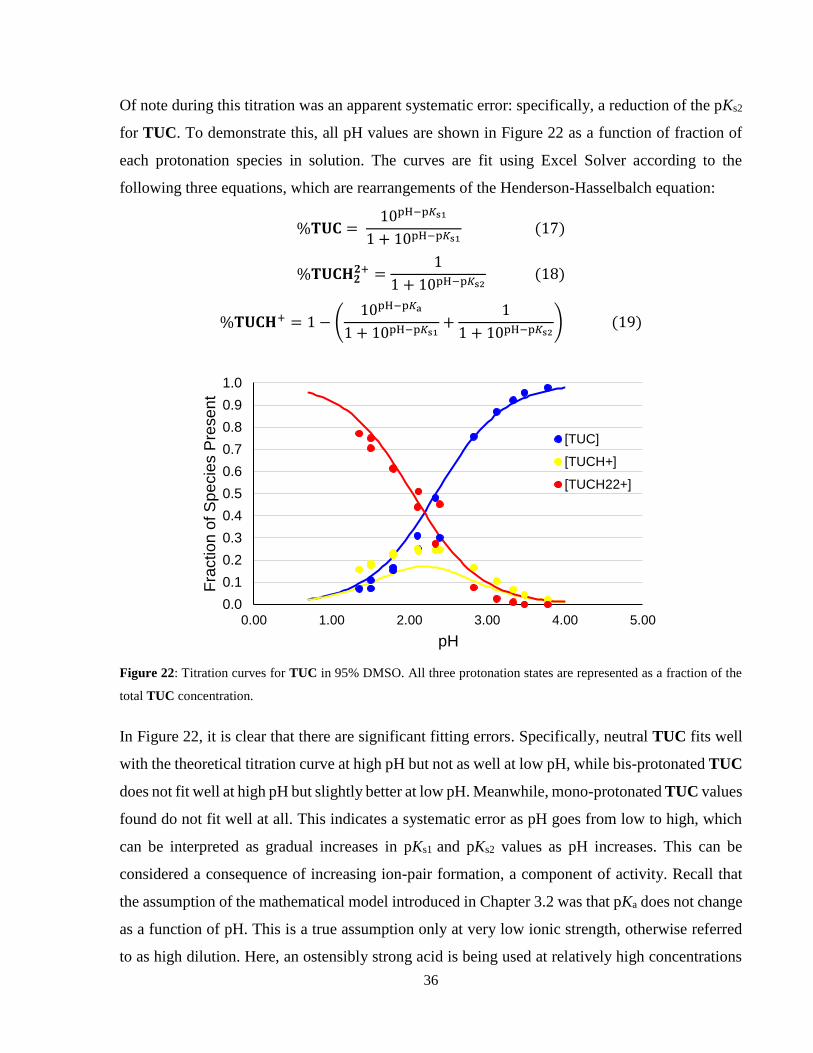
36
Of note during this titration was an apparent systematic error: specifically, a reduction of the pKs2
for TUC. To demonstrate this, all pH values are shown in Figure 22 as a function of fraction of
each protonation species in solution. The curves are fit using Excel Solver according to the
following three equations, which are rearrangements of the Henderson-Hasselbalch equation:
%𝐓𝐔𝐂 = 10pH−p𝐾s1
1 + 10pH−p𝐾s1 (17)
%𝐓𝐔𝐂𝐇𝟐𝟐+ =
1
1 + 10pH−p𝐾s2 (18)
%𝐓𝐔𝐂𝐇+ = 1 − (10pH−p𝐾a
1 + 10pH−p𝐾s1+
1
1 + 10pH−p𝐾s2) (19)
Figure 22: Titration curves for TUC in 95% DMSO. All three protonation states are represented as a fraction of the
total TUC concentration.
In Figure 22, it is clear that there are significant fitting errors. Specifically, neutral TUC fits well
with the theoretical titration curve at high pH but not as well at low pH, while bis-protonated TUC
does not fit well at high pH but slightly better at low pH. Meanwhile, mono-protonated TUC values
found do not fit well at all. This indicates a systematic error as pH goes from low to high, which
can be interpreted as gradual increases in pKs1 and pKs2 values as pH increases. This can be
considered a consequence of increasing ion-pair formation, a component of activity. Recall that
the assumption of the mathematical model introduced in Chapter 3.2 was that pKa does not change
as a function of pH. This is a true assumption only at very low ionic strength, otherwise referred
to as high dilution. Here, an ostensibly strong acid is being used at relatively high concentrations
0.0
0.1
0.2
0.3
0.4
0.5
0.6
0.7
0.8
0.9
1.0
0.00 1.00 2.00 3.00 4.00 5.00
Fra
ctio
n o
f S
pe
cie
s P
rese
nt
pH
[TUC]
[TUCH+]
[TUCH22+]

37
in an organic solvent. It is certainly plausible that, even with the conditions used, ionic strength
could be increasing as pH decreases. This has a consequence of increasing the effective pKa or pKs
values of all components in solution due to promotion of hydrogen-anion ion-pairing instead of
solvation in DMSO.
Similar observations were made during the titration of TUC with p-toluenesulfonic acid. The
sensor strength values were found to be pKs1 = 2.39 ± 0.26 and pKs2 = 2.07 ± 0.29. Spectra for this
titration are shown on Figure 23. Again, a systematic decrease in pKs values were observed as pH
decreased, and again the value of pKa of p-toluenesulfonic acid could not be determined
mathematically, as it was effectively a strong acid in solution. Note that during this titration, many
pH data points were not mathematically obtainable, likely due to very high relative acid strength
of p-toluenesulfonic acid to TUC. Curve fitting was not employed since many data points were
not calculable.
Figure 23: Selected spectra for titration of TUC with p-toluenesulfonic acid. Peak C belongs to neutral TUC; D’, E’,
and F’ to mono-protonated TUC; and D, E, and F to bis-protonated TUC.

38
3.3 Conclusions
Herein, it was firstly demonstrated that the SPE phenomenon is conserved in DMSO solvent, and
thus it was shown that the SPE sensors are viable tools for measuring pH in organic solvents. In
Figure 24 below, a summary of the pKa values of the three sensors, SPE1, SPE2, and TUC as well
as their pH measurement ranges are displayed. In comparison with water, these pKs values are
significantly lower, though this can be attributed to the expected relative instability of ionic species
in organic media, including DMSO.
Figure 24: The collective sensing range of SPE sensors in DMSO.
The sensors were used to determine pH without the use of a pH electrode, and consequently were
able to measure the pKa values of acetic acid and 4-nitrophenol. This demonstrates potential in the
SPE sensors as a tool for general measurement of acidic strength of organic acids in DMSO
solvent. Finally, TUC was newly debuted as a functional SPE sensor in DMSO and displayed two
separate protonation events at a low pH range in DMSO.

39
3.4 Materials and Methods
3.4.1 Synthesis of tris(2-isothiocyanatoethyl)amine (ITC)
Scheme 3: Synthetic scheme for the synthesis of ITC.
Tren (0.94 g, 6.4 mmol) was dissolved in 24 mL of THF in a dropping funnel and added dropwise
to 8 mL of CS2 combined with 5.12 g DCC over the course of 3 hours at -10 °C. The solution was
stirred overnight. The THF was removed by rotary evaporation and combined with 40 mL of
diethyl ether, and a white precipitate formed. The mixture was vacuum filtered, and the filtrate was
rotary evaporated until an orange precipitate remained. The remaining precipitate was pre-
adsorbed on silica gel and eluted through a silica column using 1:1 DCM:hexanes. The solvent
was reduced to 10% volume using rotary evaporation and the remaining mixture was left
overnight. Solid ITC was obtained with a yield of 1.47 g (84%, 5.4 mmol). TLC (3:2
DCM:hexanes) and 1H-NMR were used for characterization. Rf = 0.14. 1H-NMR (CDCl3) δ: 3.63
(t, 1H), 3.00 (t, 1H). The 1H-NMR spectrum can be viewed in Figure S1 in Supplemental
Information.

40
3.4.2 Synthesis of 1,4,6,9,12,14,19,21-octazabicyclo[7,7,7]tricosan-5,13,20-trithione (TUC)
Scheme 4: Synthetic scheme for the synthesis of TUC.
ITC and tren were combined using an equimolar High Dilution technique. ITC (0.37 g, 1.4 mmol)
was dissolved in 250 mL chloroform in a dropping funnel. In another dropping funnel, tren (0.37
g, 1.4 mmol) was dissolved in 250 mL chloroform. Both dropping funnels were connected to a 4
neck round bottom flask containing 300 mL chloroform and their contents were added dropwise
slowly and simultaneously at 60 °C. The volumes of either dropping funnel did not differ by more
than 5 mL at any point during addition. After addition, the mixture was stirred for 12 hours. The
solvent was then removed by rotary evaporation. The white precipitate was collected and washed
with chloroform. White powder TUC was collected with a yield of 0.59 g (99%, 1.4 mmol). 1H-
NMR was used for characterization. 1H-NMR (d6-DMSO) δ: 7.08 (m, 1H), 3.47 (m, 2H), 2.56 (t,
2H). The 1H-NMR spectrum can be viewed in Figure S2 in Supplemental Information.

41
3.4.3 Synthesis of 1,4,6,9,12,14,19,21-octazabicyclo[7,7,7]tricosan-5,13,20-trione (SPE1)
Scheme 5: Synthetic scheme for the synthesis of SPE1.
TUC (0.25 g, 0.60 mmol) was dissolved in 20 mL DMSO along with 0.34 g of p-TsOH. It was
refluxed at 110 °C under argon for 6 hours, with an additional 0.34 g of p-TsOH being added after
3 hours. TLC followed by an iodine stain was used to monitor progress of reaction (9:1
DCM:ethanol with 10 drops ammonium hydroxide, Rf = 0.30). Vacuum distillation was used at
110 °C to remove DMSO. The remaining red precipitate was dissolved in 40 mL distilled water
and washed thrice with 20 mL ether. The aqueous mixture was alkalinized with sodium carbonate
until pH 10 was reached (measured by litmus paper). The water was removed by rotary
evaporation. The remaining orange precipitate was preadsorbed onto activated basic alumina and
eluted through a basic alumina column using 95:5 DCM:methanol. The solvent was removed by
rotary evaporation, and the crude SPE1 was recrystallized by vapour diffusion in methanol-ether.
Clear colourless SPE1 crystals were obtained with a yield of 0.14 g (62%, 0.38 mmol). TLC
followed by an iodine stain (9:1 DCM:ethanol with 10 drops ammonium hydroxide, Rf = 0.30) and
1H-NMR were used for characterization. Rf = 0.30. 1H-NMR (D2O) δ: 3.04 (q, 2H), 2.48 (t, 2H).
The 1H-NMR spectrum can be viewed in Figure S3 in Supplemental Information.
3.4.4 Titration of Acetic Acid in DMSO Using SPE Sensors
Solutions of 95%-5% d6-DMSO-water were prepared containing 0.01 M LiCl and either 1.0 mM
SPE1, SPE2, or TUC. The concentration of acetic acid was changed between 0.1 M, 0.2 M, and
0.5 M, with 1H-NMR spectra and pH electrode measurements taken between each addition of
acetic acid. The total volume of the solution did not increase by more than 2% volume.

42
3.4.5 Titration of 4-Nitrophenol in DMSO Using SPE Sensors
Solutions of 95%-5% d6-DMSO-water was prepared containing 0.01 M LiCl and either 1.0 mM
SPE1, SPE2, or TUC. The concentration of 4-nitrophenol was changed between 0.1 M, 0.2 M,
and 0.5 M, with 1H-NMR spectra and pH electrode measurements taken between each addition of
4-nitrophenol. The total volume of the solution did not increase by more than 2% volume.
3.4.6 Titration of Trifluoroacetic Acid in DMSO Using SPE Sensors
Solutions of 95%-5% d6-DMSO-water was prepared containing 0.01 M LiCl and either 1.0 mM
SPE1, SPE2, or TUC. The concentration of trifluoroacetic acid was changed between a range of
10 μM, to 0.1 M, with 1H-NMR spectra and pH electrode measurements taken between each
addition of trifluoroacetic acid. The total volume of the solution did not increase by more than 2%
volume.
3.4.7 Titration of Methanesulfonic Acid in DMSO Using SPE Sensors
Solutions of 95%-5% d6-DMSO-water was prepared containing 0.01 M LiCl and either 1.0 mM
SPE1, or SPE2. The concentration of methanesulfonic acid was changed between a range of 10
μM, to 0.1 M, with 1H-NMR spectra and pH electrode measurements taken between each addition
of trifluoroacetic acid. The total volume of the solution did not increase by more than 2% volume.
3.4.8 Titration of p-toluenesulfonic acid in DMSO Using TUC
Solutions of 95%-5% d6-DMSO-water was prepared containing 0.01 M LiCl and 1.0 mM TUC.
The concentration of p-toluenesulfonic acid was changed between a range of 10 μM, to 0.1 M,
with 1H-NMR spectra and pH electrode measurements taken between each addition of
trifluoroacetic acid. The total volume of the solution did not increase by more than 2% volume.

43
4 Conclusions and Future Directions
The SPE method of pH sensing has been proven to be reliable and accurate. In this research, it has
also been shown to be useful in a versatile variety of applications. A successful optimized sensor,
SPE2, was applied as a biosensor for the pH tracking of a real-time enzymatic hydrolysis of various
organic ester substrates. The hydrolysis of the ethyl ester of acetic acid, trifluoroacetic acid, and
trichloroacetic acid were all accurately measured. Trichloroacetic acid hydrolysis specifically
allowed for the observation of hydrolysis rates at two different measurement ranges of SPE2. As
a proof of concept, this project indicates that SPE2 could have potential use in future biochemical
kinetics and thermodynamics studies. SPE sensors SPE1, SPE2, and TUC were all also applied
as non-aqueous pH sensors in DMSO with controlled ionic strength. All sensors were able to make
internally consistent measurements of the acidic strengths of acetic acid, 4-nitrophenol,
methanesulfonic acid, trifluoroacetic acid, and p-toluenesulfonic acid. TUC specifically was able
to debut as a new effective pH sensor applying Slow-Proton-Exchange.
While the SPE method is effective and reliable, it is always helpful to apply some degree of self-
criticism to address the limits of these sensors. One critical complication that arises with the use
of NMR sensors in general is the issue of sensitivity. While an NMR pH sensor may function well
in a controlled, laboratory environment, in vivo sensing brings along a wide variety of challenges,
especially when MRS is being utilized as a sensing modality. Native biological molecules such as
sugars and proteins will provide signals on 1H and 13C NMR that can obscure the signals used by
the SPE sensors shown here. This couples with the decreased resolution provided with MRS
inherently due to inhomogeneity and complex networks of hydrogen bonding within biological
media to potentially reduce the signal strength of NMR pH sensors.
In addition to the technological challenges posed, the SPE sensors themselves have one particularly
crucial limitation, which herein is referred to as the sensing gap. In Figure 17 below, the aqueous
sensing ranges of SPE1 and SPE2 are illustrated in comparison to the full pH range of water. It is
clear that between the approximate pH values of 3.5 to 5.5 that neither sensor has the ability to
measure pH. Spectrally, in this pH range either the bis-protonated species of SPE1 would be
exclusively observed or the mono-protonated species of SPE2 would be exclusively observed.
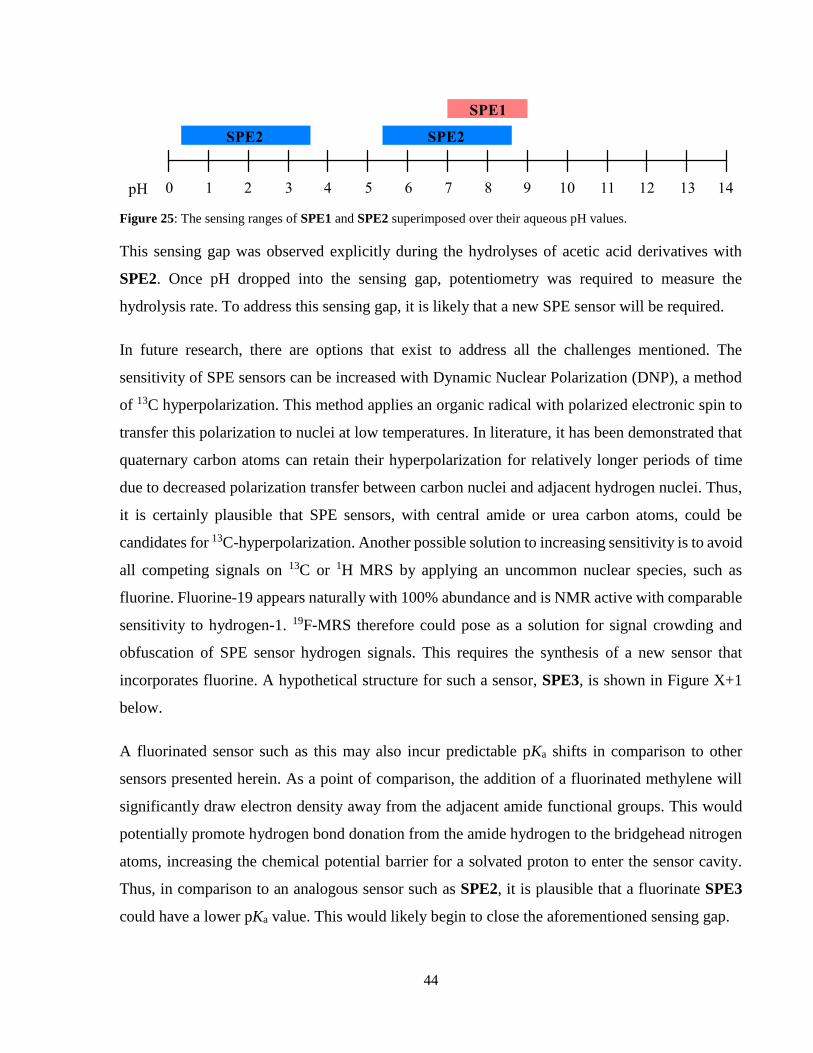
44
Figure 25: The sensing ranges of SPE1 and SPE2 superimposed over their aqueous pH values.
This sensing gap was observed explicitly during the hydrolyses of acetic acid derivatives with
SPE2. Once pH dropped into the sensing gap, potentiometry was required to measure the
hydrolysis rate. To address this sensing gap, it is likely that a new SPE sensor will be required.
In future research, there are options that exist to address all the challenges mentioned. The
sensitivity of SPE sensors can be increased with Dynamic Nuclear Polarization (DNP), a method
of 13C hyperpolarization. This method applies an organic radical with polarized electronic spin to
transfer this polarization to nuclei at low temperatures. In literature, it has been demonstrated that
quaternary carbon atoms can retain their hyperpolarization for relatively longer periods of time
due to decreased polarization transfer between carbon nuclei and adjacent hydrogen nuclei. Thus,
it is certainly plausible that SPE sensors, with central amide or urea carbon atoms, could be
candidates for 13C-hyperpolarization. Another possible solution to increasing sensitivity is to avoid
all competing signals on 13C or 1H MRS by applying an uncommon nuclear species, such as
fluorine. Fluorine-19 appears naturally with 100% abundance and is NMR active with comparable
sensitivity to hydrogen-1. 19F-MRS therefore could pose as a solution for signal crowding and
obfuscation of SPE sensor hydrogen signals. This requires the synthesis of a new sensor that
incorporates fluorine. A hypothetical structure for such a sensor, SPE3, is shown in Figure X+1
below.
A fluorinated sensor such as this may also incur predictable pKa shifts in comparison to other
sensors presented herein. As a point of comparison, the addition of a fluorinated methylene will
significantly draw electron density away from the adjacent amide functional groups. This would
potentially promote hydrogen bond donation from the amide hydrogen to the bridgehead nitrogen
atoms, increasing the chemical potential barrier for a solvated proton to enter the sensor cavity.
Thus, in comparison to an analogous sensor such as SPE2, it is plausible that a fluorinate SPE3
could have a lower pKa value. This would likely begin to close the aforementioned sensing gap.

45
The proposed SPE3 could be designed without fluorine to provide an acidic α-carbon to the
structure. With the vast and diverse array of organic reactions provided by α-carbon chemistry,
such a structure could potentially open up SPE sensors to functionalization for a wide variety of
niche applications. Similarly, quaternization of a bridgehead nitrogen could provide higher
solubility and optimized partition coefficients for niche applications requiring an ionic species,
though such a venture would occur at the expense of sensing range.
Figure 26: Three possible structures for a hypothetical SPE3. The left-most structure represents a fluorinated
structure, which may be used to avoid competing signals typically seen in a biological medium. The center structure
contains reactive α-carbons, which may be further functionalized to various ends. The right-most structure is a
quaternary-salt alternative to SPE1, to demonstrate a possibility for ionizing SPE sensors.
In conclusion, the SPE sensor functionality have been demonstrated as a simple proof of concept,
and a few of the many possible applications have been exhibited: namely real-time enzyme kinetics
and non-aqueous pH measurement. SPE sensor functionality has much room to be explored as a
wide variety of new structures and functionality is possible to introduce and experiment with.
While this is clearly only the first step towards accurate in vivo pH sensing, it is by no means a
small step. The SPE sensor is an effective strategy and has overcome many of the challenges
observed in a typical NMR pH sensor.
46
References
(1) Damaghi, M.; Wojtkowiak, J. W.; Gillies, R. J. pH Sensing and Regulation in Cancer.
Front. Physiol. 2013, 4, 370.
(2) Oosterwijk, E.; Gillies, R. J. Targeting Ion Transport in Cancer. Phil. Trans. R. Soc.
2014, 369, 1638.
(3) Chelser, M. Regulation and Modulation of pH in the Brain. Physiol. Rev. 2003, 83, 1183-
1221.
(4) Chiche, J.; Brahimi-Horn, M. C.; Pouysségur, J. Tumour Hypoxia Induces a Metabolic
Shift Causing Acidosis: A Common Feature in Cancer. J. Cell. Mol. Med. 2010, 14, 771-
795.
(5) Colacurcio, D. J.; Nixon, R. A. Disorders of Lysosomal Acidification – The Emerging
Role of v-ATPase in Ageing and Neurodegenerative Disease. Ageing Res. Rev. 2016, 32,
75-88.
(6) Bukanova, J. V.; Solntseva, E. I.; Kondratenko, R. V.; Skrebitsky, V. G. The Influence of
Acidic Media on the Effect of Beta-Amyloid Peptide on the Function of Glycine
Receptor in Hippocampal Neurons. Neurochem. Int. 2017, 110, 69-74.
(7) Eugenín, J.; Vecchiola, A.; Murgas, P.; Arroyo, P.; Cornejo, F.; von Bernhardi, R.
Expression Pattern of Scavenger Receptors and Amyloid-β Phagocytosis of Astrocytes
and Microglia in Culture and Modified by Acidosis: Implications for Alzheimer’s
Disease. J. Alzheimers Dis. 2016, 53, 857-873.
(8) Niu, W.; Wei, Z.; Jia, J.; Shuang, S.; Dong, C.; Yun, K. A Ratiometric Emission NIR-
Fluorescent Probe for Sensing and Imaging pH Changes in Live Cells. Dyes Pigm. 2018,
152, 155-160.
(9) Gilson, R. C.; Tang, R.; Som, A.; Klajer, C.; Sarder, P.; Sudlow, G. P.; Akers, W. J.;
Achilefu, S. Protonation and Trapping of a Small pH-Sensitive Near-Infrared Fluorescent
Molecule in the Acidic Tumor Environment Delineate Diverse Tumors in Vivo. Mol.
Pharmaceutics 2015, 12, 4237-4246.
(10) Khan, T.; Soller, B. R. NIRS Measurement of Tissue pH: Optimizing Small Fiber Optic
Probe Designs with the Aid of Monte-Carlo Simulations. Proc. SPIE 2000, 3911, 244-
249.

47
(11) He, X.; Gao, J.; Gambhir, S. S.; Cheng, Z. Near-Infrared Fluorescent Nanoprobes for
Cancer Molecular Imaging: Status and Challenges. Trends Mol. Med. 2010, 16, 574-583.
(12) Gillies, R. J.; Raghunand, N.; Garcia-Martin, M. L.; Gatenby, R. A. pH Imaging – A
Review of pH Measurement Methods and Applications in Cancers. IEEE Eng. Med. Biol.
Mag. 2004, 23, 57-64.
(13) Gil, S.; Zaderenzo, P.; Cruz, F.; Cerdán, S.; Ballesteros, P. Imidazol-1-ylalkanoic Acids
as Extrinsic 1H NMR Probes for the Determination of Intracellular pH, Extracellular pH,
and Cell Volume. Bioorg. Med. Chem. 1994, 2, 305-314.
(14) Yang, X.; Song, X.; Banerjee, S. R.; Li, Y.; Byun, Y.; Liu, G.; Bhujwalla, Z. M.; Pomper,
M. G.; McMahon, M. T. Developing Imidazoles as CEST MRI pH Sensors. Contrast
Media Mol. Imaging 2016, 11, 304-312.
(15) Stubbs, M.; Bhujwalla, Z. M.; Tozer, G. M.; Rodrigues, L. M.; Maxell, R. J.; Morgan, R.;
Howe, F. A.; Griffiths, J. R. An Assessment of 31P MRS as a Method of Measuring pH in
Rat Tumours. NMR Biomed. 1992, 5, 351-359.
(16) Ojugo, A. S. E.; McSheehy, P. M. J.; McIntyre, D. J. O.; McCoy, C.; Stubbs, M.; Leach,
M. O.; Judson, I. R.; Griffiths, J. R. Measurement of the Extracellular pH of Solid
Tumours in Mice by Magnetic Resonance Spectroscopy: A Comparison of Exogenous
19F and 31P Probes. NMR Biomed. 1999, 12, 495-504.
(17) Longo, D. L.; Bartoli, A.; Consolino, L.; Bardini, P.; Arena, F.; Schwaiger, M.; Aime, S.
In Vivo Imaging of Tumor Metabolism and Acidosis by Combining PET and MRI-CEST
pH Imaging. Cancer Rev. 2016, 76, 6463-6470.
(18) Wu, Y.; Zhou, I. Y.; Lu, D.; Manderville, L.; Lo, E. H.; Zheng, H.; Sun, P. Z. pH-
Sensitive Amide Proton Transfer Effect Dominates the Magnetization Transfer
Asymmetry Contrast During Acute Ischemia—Quantification of Multipool Contribution
to In Vivo CEST MRI. Magn. Reson. Med. 2018, 79, 1602-1608.
(19) Ward, K. M.; Balaban, R. S. Determination of pH Using Water Protons and Chemical
Exchange Dependent Saturation Transfer (CEST). Magn. Reson. Med. 2000, 44, 799-802.
(20) Smith, A. M.; Lee, A. A.; Perkin, S. The Electrostatic Screening Length in Concentrated
Electrolytes Increases with Concentration. J. Phys. Chem. Lett. 2016, 7, 2157-2163.
(21) Bryant, R. G. The NMR Time Scale. J. Chem. Educ. 1983, 60, 933-935.

48
(22) Perruchoud, L. H.; Jones, M. D.; Sutrisno, A.; Zamble, D. B.; Simpson, A. J.; Zhang, X-
a. A Ratiometric NMR pH Sensing Strategy Based on a Slow-Proton-Exchange (SPE)
Mechanism. Chem. Sci. 2015, 6, 6305-6311.
(23) Perruchoud, L. H.; Hadzovic, A.; Zhang, X-a. Ultrasensitive Anion Detection by NMR
Spectroscopy: A Supramolecular Strategy Based on Modulation of Chemical Exchange
Rate. Chem. Eur. J. 2015, 21, 8711-8715.
(24) Chartrain, M.; Maligres, P.; Cohen, D.; Upadhyay, V.; Pecore, V.; Askin, D.; Greasham,
R. Porcine Liver Esterase-Catalyzed Enantioselective Hydrolysis of a Prochiral Diester
into its Optically Pure (S)-Ester Acid, a Precursor to a Growth Hormone Secretagogue. J.
Biosci. Bioeng. 1999, 87, 386-389.
(25) Hinze, J.; Süss, P.; Strohmaier, S.; Bornscheuer, U. T.; Wardenga, R.; von Langermann,
J. Recombinant Pig Liver Esterase-Catalyzed Synthesis of (1S,4R)-4-Hydroxy-2-
cyclopentenyl Acetate Combined with Subsequent Enantioselective Crystallization. Org.
Process Res. Dev. 2016, 20, 1258-1264.
(26) Noguchi, N.; Tsuna, K.; Nakada, M. Research on the pig liver esterase (PLE)-catalyzed
kinetic resolution of half-esters derived from prochiral diesters. Tetrahedron: Asymmetry
2013, 24, 357-361.
(27) Sousa, H. A.; Afonso, C. A. M.; Crespo, J. G. Kinetic study of the enantioselective
hydrolysis of a meso-diester using Pig Liver Esterase. J. Chem. Technol. Biotechnol.
2000, 75, 707-714.
(28) Tamm, C. Pig liver esterase catalyzed hydrolysis: substrate specificity and
stereoselectivity. Pure. Appl. Chem. 1992, 64, 1187-1192.
(29) Toone, E. J.; Werth, M. J.; Jones, J. B. Active-Site Model for Interpreting and Predicting
the Specificity of Pig Liver Esterase. J. Am. Chem. Soc. 1990, 112, 4946-4952.
(30) Adler, A. J.; Kistiakowsky, G. B. Kinetics of Pig Liver Esterase Catalysis. J. Am. Chem.
Soc. 1962, 84, 695-703.
(31) Barker, D. L.; Jencks, W. P. Pig Liver Esterase. Some Kinetic Properties. Biochemistry
1969, 8, 3890-3897.
(32) Farb, D.; Jencks, W. P. Dependence on pH of the Activity of Pig Liver Esterase. Arch.
Biochem. Biophys. 1980, 203, 227-235.
(33) Brown, L. Electroplating with non-aqueous solutions. Trans. Inst. Met. Finish. 2010, 88,
122-123.
49
(34) Böck, R.; Lanzinger, G.; Freudenberger, R.; Mehner, T.; Nickel, D.; Scharf, I.; Lampke,
T. Effect of additive and current mode on surface morphology of palladium films from a
non-aqueous deep eutectic solution (DES). J. Appl. Electrochem. 2013, 43, 1207-1216.
(35) Li, Y.; Wang, X.; Dong, S.; Chen, X.; Cui, G. Recent Advances in Non-Aqueous
Electrolyte for Rechargeable Li-O2 Batteries. Adv. Energy Mater. 2016, 6, 1600751.
(36) Chen, Z.; Ren, Y.; Jansen, A. N.; Lin, C-k.; Weng, W.; Amine, K. New class of
nonaqueous electrolytes for long-life and safe lithium-ion batteries. Nat. Commun. 2012,
4. 1513.
(37) Wang, Q.; Hu, C.; Qian, A.; Liu, T.; Zhang, H.; Zhang, Y.; Xia, Q. Enhanced oral
bioavailability of quercetin by a new non-aqueous self-double-emulsifying drug delivery
system. Eur. J. Lipid Sci. 2017, 119, 1600167.
(38) Determination of cannabinoids in hair using high-pH non-aqueous electrolytes and
electrochemical detection. Some aspects of sensitivity and selectivity. J. Chromatogr. A
2002, 942, 259-269.
(39) Yu, H-L.; Ou, L.; Xu, J-H. New Trends in Non-Aqueous Biocatalysis. Curr. Org. Chem.
2010, 14, 1424-1432.
(40) Zhang, S.; Zhang, T.; Tang, S. Determination of the Hammett Acidity Functions of
Triflic Acid/Ionic Liquid Binary Mixtures by the 13C NMR-Probe Method. J. Chem. Eng.
Data 2016, 61, 2088-2097.
(41) Lowry, T. H.; Schueller Richardson, K. Mechanism and Theory in Organic Chemistry, 3rd
ed.; Harper & Row: New York, 1976, pp 135-137.
(42) Fisicaro, P.; Ferrara, E.; Prenesti, E.; Berto, S. Role of the activity coefficient in the
dissemination of pH: comparison of primary (Harned cell) and secondary (glass
electrode) measurements on phosphate buffer considering activity and concentration
scales. Anal. Bioanaol. Chem. 2005, 383, 341-348.
(43) Rumble, J. R. CRC Handbook of Chemistry and Physics, 98th ed.; CRC Press: Boca
Raton, 2017.
(44) Nagai, H.; Kuwabara, K.; Carta, G. Temperature Dependence of the Dissociation
Constants of Several Amino Acids. J. Chem. Eng. Data 2008, 53, 619-627.
(45) Pérez-Villaseñor, F.; Iglesias-Silva, G. A. Osmotic and Activity Coefficients Using a
Modified Pitzer Equation for Strong Electrolytes 1:1 and 1:2 at 298.15 K. Ind. Eng.
Chem. Res. 2002, 41, 1031-1037.

50
(46) Rowland, D.; May, P. M. Comparison of the Pitzer and Hückel Equation Frameworks for
Activity Coefficients, Osmotic Coefficients, and Apparent Molar Relative Enthalpies,
Heat Capacities, and Volumes of Binary Aqueous Strong Electrolyte Solutions at 25 °C.
J. Chem. Eng. Data 2015, 60, 2090-2097.
(47) Hong, C.; Lisheng, W.; Bo, J.; Miyi, L. Measurements of Conductivity for Low
Concentration Strong-electrolytes in Organic Solvents (I) LiBr, LiCl, and LiNO3 in
Alcohols. Chin. J. Chem. Eng. 2012, 20, 1024-1033.
(48) Bordwell, F. G. Equilibrium Acidities in Dimethyl Sulfoxide Solution. Acc. Chem. Res.
1988, 21, 456-463.
(49) Himmel, D.; Goll, S. K.; Leito, I.; Krossing, I. A Unified pH Scale for All Phases.
Angew. Chemie. Int. Ed. 2010, 49, 6885-6888.

51
Supplemental Information
Figure S1: NMR Spectrum for ITC in CDCl3.

52
Figure S2: NMR Spectrum of TUC in d6-DMSO.

53
Figure S3: NMR Spectrum for SPE1 in D2O.
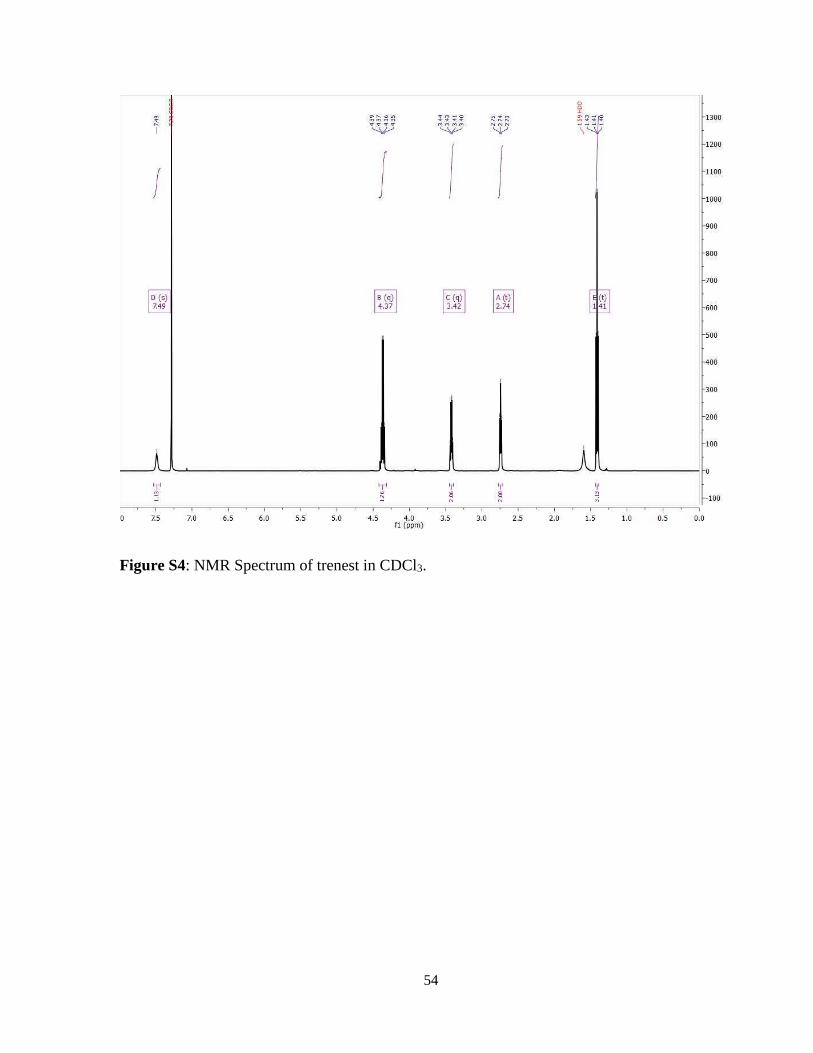
54
Figure S4: NMR Spectrum of trenest in CDCl3.

55
Figure S5: NMR Spectrum of SPE2 in basic D2O.

56
Figure S6: NMR Spectra for hydrolysis of EtOTFA without an enzyme, trial 1. Peaks A and B
belong to neutral SPE2, A’, B’, C’, and D’ belong to mono-protonated SPE2, and C and D
belong to bis-protonated SPE2.

57
Figure S7: NMR Spectra for hydrolysis of EtTFA without an enzyme, trial 2. Peaks A and B
belong to neutral SPE2, A’, B’, C’, and D’ belong to mono-protonated SPE2, and C and D
belong to bis-protonated SPE2.

58
Figure S8: NMR Spectra for hydrolysis of EtTFA without an enzyme, trial 3. Peaks A and B
belong to neutral SPE2, A’, B’, C’, and D’ belong to mono-protonated SPE2, and C and D
belong to bis-protonated SPE2.
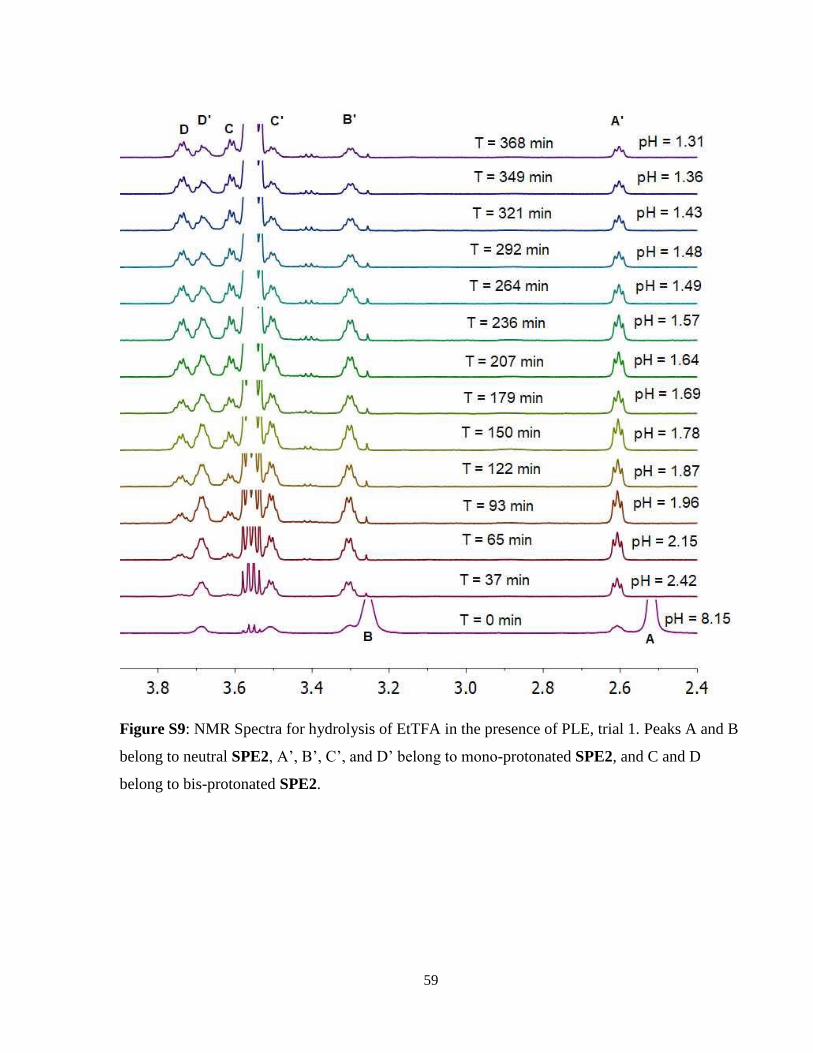
59
Figure S9: NMR Spectra for hydrolysis of EtTFA in the presence of PLE, trial 1. Peaks A and B
belong to neutral SPE2, A’, B’, C’, and D’ belong to mono-protonated SPE2, and C and D
belong to bis-protonated SPE2.

60
Figure S10: NMR Spectra for hydrolysis of EtTFA in the presence of PLE, trial 2. Peaks A and
B belong to neutral SPE2, A’, B’, C’, and D’ belong to mono-protonated SPE2, and C and D
belong to bis-protonated SPE2.

61
Figure S11: NMR Spectra for hydrolysis of EtTFA in the presence of PLE, trial 3. Peaks A and
B belong to neutral SPE2, A’, B’, C’, and D’ belong to mono-protonated SPE2, and C and D
belong to bis-protonated SPE2.

62
Figure S12: NMR Spectra for hydrolysis of EtTCA without an enzyme, trial 1. Peaks A and B
belong to neutral SPE2, A’, B’, C’, and D’ belong to mono-protonated SPE2, and C and D
belong to bis-protonated SPE2.
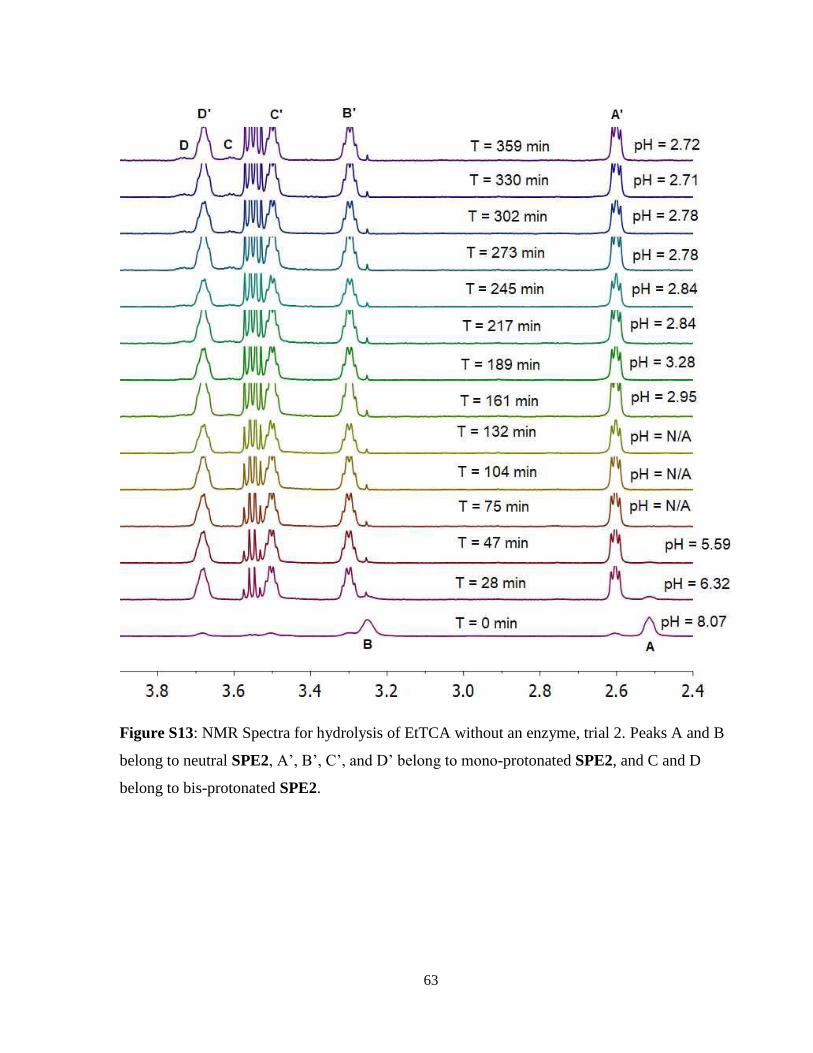
63
Figure S13: NMR Spectra for hydrolysis of EtTCA without an enzyme, trial 2. Peaks A and B
belong to neutral SPE2, A’, B’, C’, and D’ belong to mono-protonated SPE2, and C and D
belong to bis-protonated SPE2.
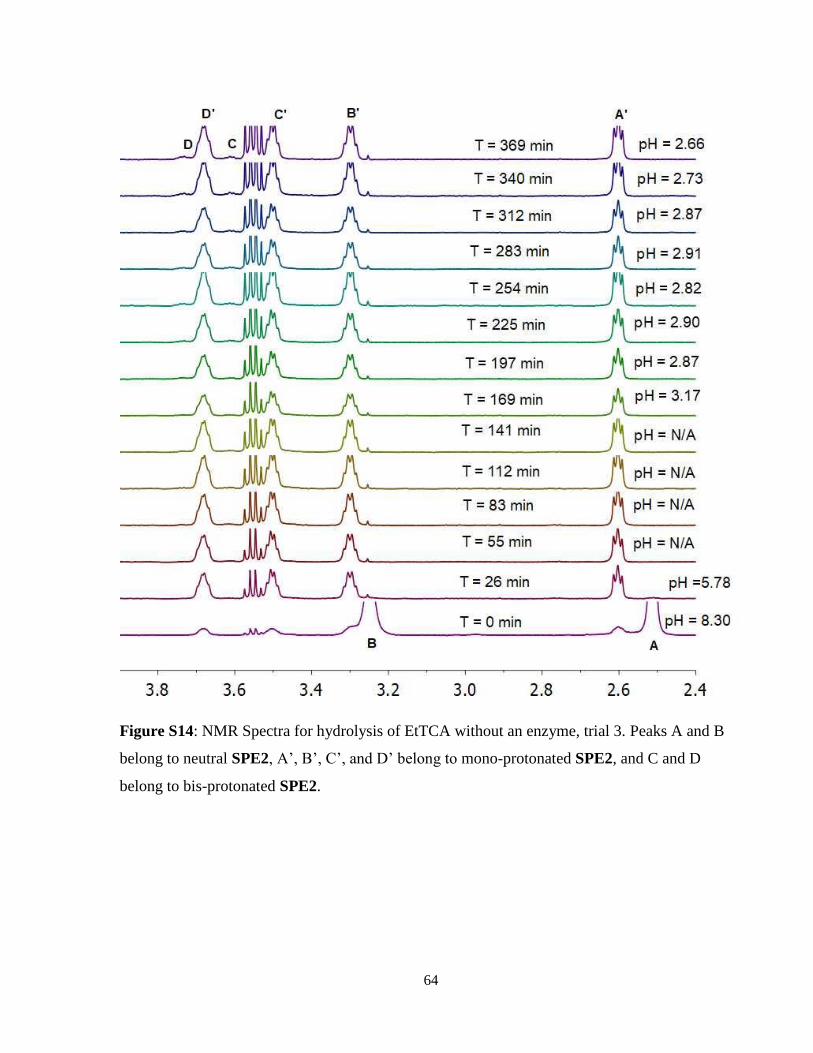
64
Figure S14: NMR Spectra for hydrolysis of EtTCA without an enzyme, trial 3. Peaks A and B
belong to neutral SPE2, A’, B’, C’, and D’ belong to mono-protonated SPE2, and C and D
belong to bis-protonated SPE2.

65
Figure S15: NMR Spectra for hydrolysis of EtTCA in the presence of PLE, trial 1. Peaks A and
B belong to neutral SPE2, A’, B’, C’, and D’ belong to mono-protonated SPE2, and C and D
belong to bis-protonated SPE2.

66
Figure S16: NMR Spectra for hydrolysis of EtTCA in the presence of PLE, trial 2. Peaks A and
B belong to neutral SPE2, A’, B’, C’, and D’ belong to mono-protonated SPE2, and C and D
belong to bis-protonated SPE2.

67
Figure S17: NMR Spectra for hydrolysis of EtTCA in the presence of PLE, trial 3. Peaks A and
B belong to neutral SPE2, A’, B’, C’, and D’ belong to mono-protonated SPE2, and C and D
belong to bis-protonated SPE2.

68
Figure S18: Peaks for TFA titration of SPE1. Only amide peaks are shown due to obfuscation of
methylene peaks by water and DMSO solvent peaks. Peak C represents neutral SPE1, peak C’
represents bis-protonated SPE1.
Ca = 0.000099 M
Ca = 0.000196 M
Ca = 0.000291 M
Ca = 0.000476 M
C C’
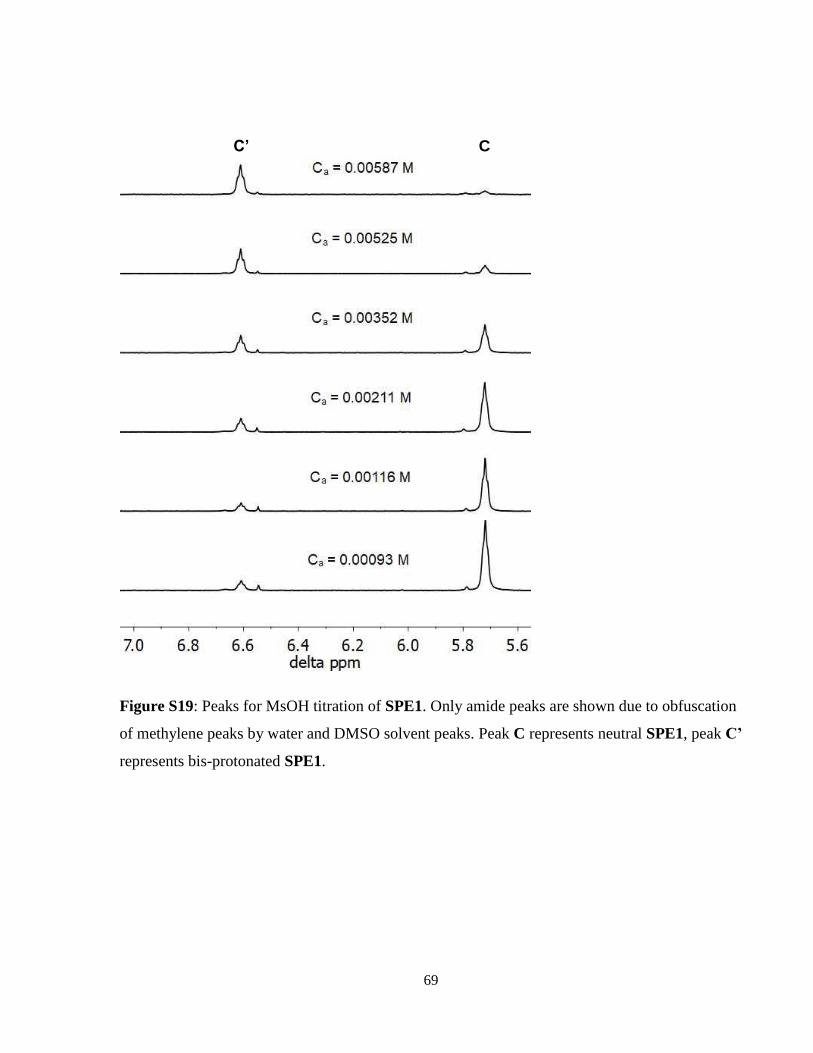
69
Figure S19: Peaks for MsOH titration of SPE1. Only amide peaks are shown due to obfuscation
of methylene peaks by water and DMSO solvent peaks. Peak C represents neutral SPE1, peak C’
represents bis-protonated SPE1.
C C’

70
Figure S20: Peaks for TFA titration of SPE2. Only amide peaks are shown due to obfuscation of
methylene peaks by water and DMSO solvent peaks. Peak C represents neutral SPE1, peak C’
and F’ represents mono-protonated SPE2.
Ca = 0.000099 M
Ca = 0.000196 M
Ca = 0.000291 M
Ca = 0.000476 M C C’ F’
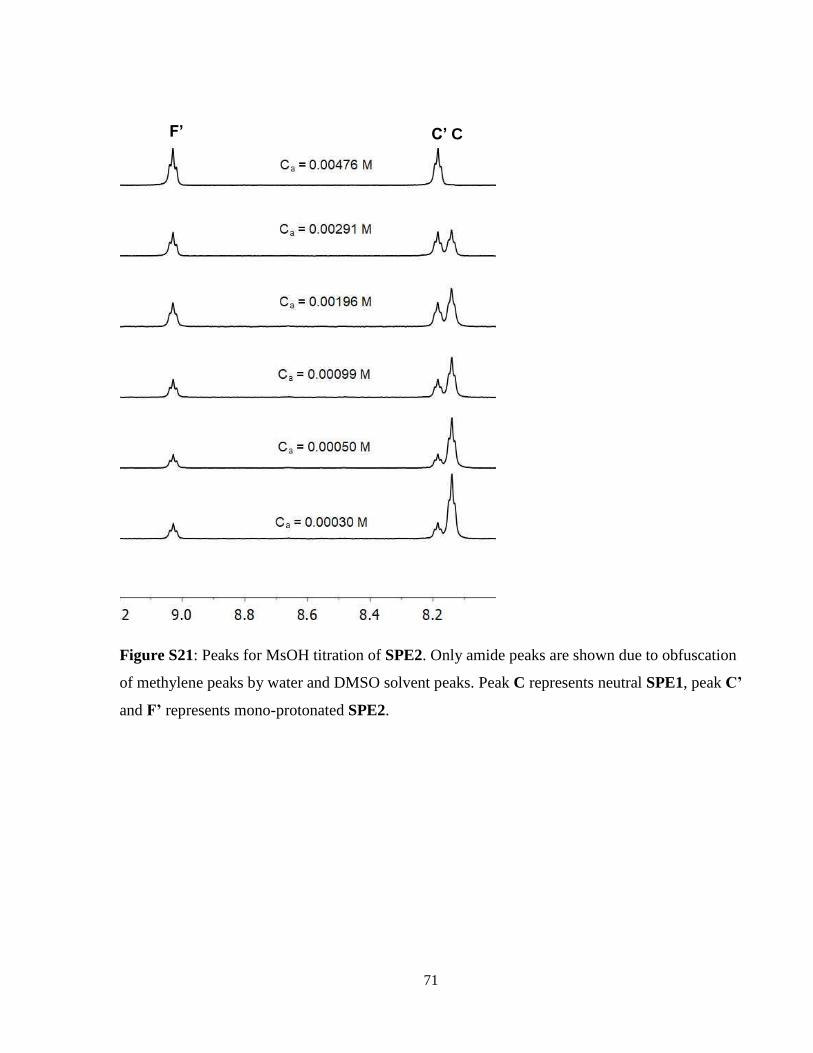
71
Figure S21: Peaks for MsOH titration of SPE2. Only amide peaks are shown due to obfuscation
of methylene peaks by water and DMSO solvent peaks. Peak C represents neutral SPE1, peak C’
and F’ represents mono-protonated SPE2.
C C’ F’