ATP-binding cassette transporters, atherosclerosis, and inflammation
Upload
independentCategory
view
6download
0
Herman Taylor and Michael AndrewEduardo Nunez, Donna K. Arnett, Emelia J. Benjamin, Philip R. Liebson, Thomas N. Skelton,
Atherosclerosis Risk in Communities StudyOptimal Threshold Value for Left Ventricular Hypertrophy in Blacks: The
Print ISSN: 0194-911X. Online ISSN: 1524-4563 Copyright © 2004 American Heart Association, Inc. All rights reserved.
is published by the American Heart Association, 7272 Greenville Avenue, Dallas, TX 75231Hypertension doi: 10.1161/01.HYP.0000149951.70491.4c
2005;45:58-63; originally published online November 29, 2004;Hypertension.
http://hyper.ahajournals.org/content/45/1/58World Wide Web at:
The online version of this article, along with updated information and services, is located on the
http://hyper.ahajournals.org/content/suppl/2004/12/23/01.HYP.0000149951.70491.4c.DC1.htmlData Supplement (unedited) at:
http://hyper.ahajournals.org//subscriptions/
is online at: Hypertension Information about subscribing to Subscriptions:
http://www.lww.com/reprints Information about reprints can be found online at: Reprints:
document. Permissions and Rights Question and Answer this process is available in the
click Request Permissions in the middle column of the Web page under Services. Further information aboutOffice. Once the online version of the published article for which permission is being requested is located,
can be obtained via RightsLink, a service of the Copyright Clearance Center, not the EditorialHypertensionin Requests for permissions to reproduce figures, tables, or portions of articles originally publishedPermissions:
by guest on November 11, 2013http://hyper.ahajournals.org/Downloaded from by guest on November 11, 2013http://hyper.ahajournals.org/Downloaded from by guest on November 11, 2013http://hyper.ahajournals.org/Downloaded from by guest on November 11, 2013http://hyper.ahajournals.org/Downloaded from by guest on November 11, 2013http://hyper.ahajournals.org/Downloaded from by guest on November 11, 2013http://hyper.ahajournals.org/Downloaded from by guest on November 11, 2013http://hyper.ahajournals.org/Downloaded from by guest on November 11, 2013http://hyper.ahajournals.org/Downloaded from by guest on November 11, 2013http://hyper.ahajournals.org/Downloaded from by guest on November 11, 2013http://hyper.ahajournals.org/Downloaded from by guest on November 11, 2013http://hyper.ahajournals.org/Downloaded from by guest on November 11, 2013http://hyper.ahajournals.org/Downloaded from

Optimal Threshold Value for Left Ventricular Hypertrophyin Blacks
The Atherosclerosis Risk in Communities Study
Eduardo Nunez, Donna K. Arnett, Emelia J. Benjamin, Philip R. Liebson, Thomas N. Skelton,Herman Taylor, Michael Andrew
Abstract—The distribution of echocardiographic left ventricular (LV) mass differs among ethnicities. Becauseethnic-specific echocardiographic criteria for LV hypertrophy (LVH) are not established, we determined whetherthreshold values derived from overwhelmingly white populations are appropriate for blacks, a subgroup havingmore LVH. Between 1992 and 1994, LV mass was measured echocardiographically in the Jackson, Mississippi,black cohort of the Atherosclerosis Risk in Communities study. Participants free of prevalent cardiovasculardisease (CVD) (n�1616; mean�SD, age 59�5.7; 65% women and 57% with hypertension) were included. Theoptimal LVH threshold value was selected from the continuum of LV mass index (LVMI�LV mass/height2.7) using3 methods: (1) the best operating point from the area under the resulting receiver-operating characteristic (ROC)curve predicting incident CVD; (2) the value with the smallest probability value associated with incident CVD; and(3) visual inspection of functions of LVMI and CVD in the general additive model (GAM) plot. At a medianfollow-up of 6.8 years, there were 192 events (coronary heart disease�87, stroke�62, and congestive heartfailure�43; incidence�17.6/1000 person-years). The best operating point from the resulting ROC analysis was51.2 g/m2.7 for sensitivity (53.4%) and specificity (61.5%). The Cox and GAM models adjusted for age, gender,systolic blood pressure, hypertension, diabetes, smoking, total cholesterol-to-high-density lipoprotein ratio, LVHby ECG criterion, and socioeconomic status found 50 to 51 g/m2.7 as the optimal threshold for LVH in middle-agedblacks, corresponding to a minimum probability value and to a log-hazard ratio of zero, respectively. Because thesevalues are close to the 51 g/m2.7 established from predominantly white populations, this cutpoint is appropriate forboth groups. (Hypertension. 2005;45:58-63.)
Key Words: epidemiology � population � echocardiography � hypertrophy � blacks
Left ventricular hypertrophy (LVH) detected by echocar-diography is a precursor of premature mortality across all
genders, races, and ages,1–6 beyond the prognostic signifi-cance of alterations in LV geometry7 and/or electrocardio-graphic patterns of LVH.8 Moreover, regression of LVH is afavorable prognostic marker independent of treatment-induced reduction in blood pressure.9
LVH has traditionally been determined as the upper 2.5 to5 percentiles of LV mass index (LVMI) in a referencepopulation.10–15 However, it is known that LVMI does nothave a Gaussian distribution; thus, the normal range may notcontain 95% of the values. Therefore, some authors16,17 haveadvocated using a risk factor-driven cutpoint as the optimalapproach to dichotomize a continuous diagnostic test. Be-cause LVH prevalence12,15,18–20 and incidence of morbid
events21 varies depending on the threshold selected, it isadvisable to determine if thresholds obtained from onepopulation apply to others.
To date, LVH thresholds have been derived from over-whelmingly white populations (Table 1) and applied to otherethnic groups.5,23–32 Because ethnic groups differ in anthro-pometric measures that correlate with heart size,33 ethnic-specific criteria for LVH may be warranted. The aim of thisstudy is to determine the optimal threshold for LVMI todefine LVH in a middle-aged black American population.
MethodsMethods are described in detail in the online supplement available athttp://www.hypertensionaha.org.
Received May 10, 2004; first decision June 2, 2004; revision accepted October 27, 2004.From the Division of Epidemiology (E.N., D.K.A.), University of Minnesota, Minneapolis, Minn; Boston Medical Center (E.J.B.), Boston University
School of Medicine, Boston, Mass; Rush Medical College (P.R.L.), Chicago, Ill; University of Mississippi Medical Center (T.N.S.), Jackson, Miss; TheJackson Heart Study (H.T.), Jackson Medical Mall, Jackson, Miss; Health Effects Laboratory Division (M.A.), National Institute for Occupational Safetyand Health, Morgantown, WV.
This paper was sent to Ernesto Schiffrin, associate editor, for review by expert referees, editorial decision, and final disposition.Correspondence to Donna K. Arnett, PhD, University of Minnesota, Division of Epidemiology, 1300 South Second Street, Suite 300, Minneapolis, MN
55454. E-mail [email protected]© 2004 American Heart Association, Inc.
Hypertension is available at http://www.hypertensionaha.org DOI: 10.1161/01.HYP.0000149951.70491.4c
58 by guest on November 11, 2013http://hyper.ahajournals.org/Downloaded from

Study PopulationAn echocardiographic examination34,35 was performed in blacksaged 51 to 70 years from Jackson, Mississippi. After excludingineligible participants, 570 men and 1046 women were included.
EchocardiographyThe echocardiograph protocol has been reported.34,35 The reliabilityassessment of the Atherosclerosis Risk in Communities Study(ARIC) echocardiographic reading center reported intraobservercoefficients of variation of 4.6% for interventricular septum, 4.6%for posterior wall, 1.5% for internal diameter, and 6.3% for LV mass.
Echocardiography MeasurementsLV measurements were taken according to the American Society ofEchocardiography recommendations.36 LV mass was calculatedaccording to Devereux’s validated formula.37,38 As recommended,13
LV mass values were normalized by height2.7 to correct for body sizedifferences. The online supplement also contains LV mass valuesnormalized to body surface area (BSA).
Risk Factors Measurements and Definitionof VariablesRisk factors were measured at the echocardiographic examinationvisit using standardized methods. See Table I, available online, fordefinitions and measurement procedures.
Ascertaining Incident CardiovascularDisease EventsCoronary heart disease (CHD) and stroke incidence were ascertainedby annual contact, identifying hospitalizations and deaths during the
previous year, and surveying discharge lists from local hospitals anddeath certificates for potential events.39–41 For participants with noevent, follow-up continued until noncardiovascular death (n�62),December 31, 2001 (n�1405), or date of last contact (n�1). Themedian follow-up was 6.55 years (interquartile range, 6.13 to 7.51years).
Statistical AnalysisComparisons between genders were performed with Mann–Whitney2-sample statistic for continuous variables and �2 or Fisher exact testfor discrete variables.
We followed a 3-step approach to determine the optimal criterionfor LVH:16 (1) we used Cox regression analysis to quantify theassociation between LVMI and incident cardiovascular disease(CVD); (2) we created a general additive model (GAM)42 with Coxextension to uncover the underlying relationship between LVMI andthe composite CVD endpoint (Figure 1). We also plotted sensitivity(Se) against 1�specificity (Sp) of each value in the continuum ofLVMI (Figure 2). The resulting receiver-operating characteristic(ROC) curve43 provided a full range of diagnostic thresholds for allpossible combinations of Se and Sp; and (3) all values suggested bythe exploratory plots were examined as candidates for optimalcutpoints. Once the range of values of LVMI was selected (45 to 53g/m2.7), Cox proportional hazard regression models were used todetermine the value associated with a minimum probability value ormaximum �2 statistic.16,44 Univariate and risk factor-adjusted esti-mates were computed.
Figure 1. Optimal LV mass index threshold suggested by GAMplot. In the panel marked “univariate,” the functional form in theassociation between LVMI and the hazard rate for CVD is dis-played. In the “multivariate” plot, this association is adjustedsimultaneously by age, gender, systolic blood pressure, hyper-tension, diabetes, status, total cholesterol-to-high-densitylipoprotein cholesterol ratio, LVH by ECG, and education level.The dotted curves indicate �95% CIs for the smoothed hazard.
TABLE 1. Studies Reporting the Methodology Used in Selection of Threshold Values for EchocardiographicLeft Ventricular Hypertrophy
Studyreference (y) Male/Female White/Black Index CriteriaThreshold Selection
Criteria Cutoff: M/F (All)
Devereux22 (1984) 78/55 ND BSA (g/m2) mean�2SD 134/110 (120)
106/119
Liao5 (1995) NA (total�107) 0/107 BSA (g/m2) 85th percentile 136/125
Levy12 (1987) 347/517 ND BSA (g/m2) Height (g/m) mean�2SD 150/120
163/121
Galderisi14 (1992) 608/1134 ND Height (g/m) 95th percentile 141/98
De Simone13 (1992) 137/91 ND Height2.7 (g/m2.7) 95th percentile 50/47
De Simone20 (1995) 137/91 ND Height2.7 (g/m2.7) 97.5th percentile 50/47 (�51)
Bella15 (1998) 147/134 Native American FFM (g/kg) 97.5th percentile 3.6/4.9 (4.10)
ND indicates not defined; BSA, body surface area; NA, not available; FFM, fat-free mass.
Figure 2. Se and Sp curves against LV mass index values,with incident CVD at a median of 7 years follow-up used asthe reference test. The optimal cutoff point was estimated at51.2 g/m2.7, with an associated Se and Sp of 53.4 and 61.5,respectively. The dotted curves indicate the 95% CIs.
Nunez et al Threshold for LVH in Blacks 59
by guest on November 11, 2013http://hyper.ahajournals.org/Downloaded from

Gaussian Distribution MethodWe computed a threshold value corresponding to the 95th percentileof LVMI in a subset of apparently healthy individuals.
Single or Gender-Specific ThresholdTo further evaluate the generalizability of the threshold for bothsexes, the interaction term of LVH (with a 50 g/m2.7 threshold) withgender was tested in the multivariate analysis, and the value ofLVMI corresponding to a log-hazard ratio (HR) of 0 in the GAMcurves, in men and women, was also examined.
ResultsClinical and Echocardiographic FindingsClinical characteristics of the study population are presentedonline in Table II. Echocardiographic variables are presentedin Table 2.
LV mass was higher in men, a difference that disappearedwhen it was indexed by height2.7 (P�0.08). The prevalence ofLVH varied from 40% to 50% in women, but not in men(36%), depending on the criteria used. When using the singlepartition value currently in use (50 g/m2.7), the difference inLVH prevalence by gender (P�0.05) is attenuated, whencompared with the gender-specific criteria, in which womenhad a greater prevalence than men (P�0.001).
Outcomes and Crude RatesAt the median follow-up, a total of 192 events were identified(Table 3). Under the Poisson assumption, an event rate of17.6 per 1000 person-years was calculated for the entirepopulation, but men had significantly higher rates thanwomen (25.4 versus 13.4 per 1000 person-years; P�0.001).
GAMFigure 1 displays the GAM plots. No differences in theoptimal threshold were seen between univariate and the
multivariate models. Visual inspection of the graph showedthat CVD risk increased steadily as LVMI increased, there-fore rejecting the null hypothesis of nonlinearity for LVMI(�2�4.10; df�4.84; P�0.37). The curve also identified 51g/m2.7 to be the value of LVMI when the correspondinghazard rate for CVD was zero.
ROC Curve AnalysesFigure 2 shows sensitivity and specificity curves plottedalong a range of LVMI values given the reference test(incident CVD); the optimal threshold estimated by the pointwhere the curves cross was 51.2 g/m2.7, with an associated Seof 53.4% (46.7% to 60.3%) and Sp of 61.5% (59.4% to63.6%)
Cox Proportional AnalysisLVMI (per 10-g/m2.7 increment) predicted incident CVD(HR, 1.36; 95% confidence interval [CI], 1.24 to 1.50;P�0.001), an association that persisted after adjustment forrisk factors (HR, 1.19; 95% CI, 1.07 to 1.32; P�0.001). TableIII shows that LVH with a threshold at 50 g/m2.7 (P�0.083)best-separated subjects’ outcomes by the minimum probabil-ity value approach. The interaction term of LVH with genderwas not significant in any of the models tested. As supportiveevidence, the same threshold chosen by the adjusted mini-mum probability value was associated with the highest areaunder the curve (0.744), indicating the multivariate modeldefining LVH at 50 g/m2.7 had the highest discriminatoryability for future CVD events. Similar trends in the resultsfrom univariate analyses were found after adjusting bymultiple comparisons (results not shown).
TABLE 2. Echocardiographic Measures of LV Structure and Function
Variable
Study PopulationReference Population
(n�108)Men (n�570) Women (n�1046) All (n�1616)
PWT in diastole, mm 1.22�0.21 1.16�0.20* 1.18�0.20 1.03�0.16
SWT in diastole, mm 1.19�0.23 1.12�0.21* 1.14�0.22 1.02�0.19
LVIDd, mm 4.78�0.57 4.51�0.53* 4.61�0.56 4.50�0.53
RWT 0.51�0.12 0.50�0.11 0.50�0.11 0.47�0.10
LV mass, g 217�57 183�52* 195�56 162�46
LVMI, g/m2.7 47�13 49�14 48�14 37�10
LVH,‡ % 36.1 41.2† 39.4 7.4
LVH,� % 36.1 49.5* 44.8 8.3
LV geometric pattern
Normal, % 23.9 22.0 22.7 37.0
Concentric remodeling, % 35.8 34.3 34.8 54.6
Concentric hypertrophy, % 28.3 31.2 30.1 5.6
Eccentric hypertrophy, % 12.1 12.5 12.4 2.8
Data are presented as mean�SD or %.PWT indicates posterior wall thickness; SWT, septal wall thickness; LVIDd, left ventricular internal diameter in
diastole; RWT, relative wall thickness; LVMI, left ventricular mass index.*P�0.001.†P�0.05 for gender comparisons.‡LVMI–HT2.7 �50 g/m2.7.�Men: LVMI–HT2.7 �50 g/m2.7; women: LVMI–HT2.7 �47 g/m2.7
60 Hypertension January 2005
by guest on November 11, 2013http://hyper.ahajournals.org/Downloaded from

Diagnostic Test CharacteristicsTable 4 depicts the characterization of the LVH modeled as adichotomous screening test in terms of true and false-positiverates, positive predictive value (PPV) and negative predictivevalue (NPV), and likelihood ratio (LR). Our criterion forLVH was associated with a sensitivity of 57.1% and speci-ficity of 60.8%. Regarding how accurately LVH predictsfuture CVD events, the calculated PPV and NPV were 13.3%and 93.1%, respectively.
Gaussian Distribution MethodDemographic and clinical characteristics of the apparentlyhealthy population are displayed in Table II; echocardio-graphic characteristics are in Table 2. The computed 95thpercentile of LVMI was 52.9 g/m2.7 (95% CI, 50.1 to 55.7).
BSA-Normalized CutpointTo allow comparison with other studies, the online supple-ment (Figure I) shows the GAM plot and sensitivity andspecificity curves for BSA-normalized LV mass index. Theoptimum threshold for BSA–LVH was 105 g/m2. Table IVcompares prognostic parameters for LVH indexed by BSAversus height2.7.
DiscussionTo our knowledge, this is the first report that determinedechocardiographic LVH thresholds in blacks. Previous stud-ies that have focused on comparing black and white patients,or a few of them performed exclusively in blacks, have usedthe thresholds derived from whites.10–15 This was performeddespite caution raised by the authors regarding the lack ofvalidation with other ethnic groups.10–12,14 Using the ap-proach recommended by Mazumdar et al,16 our results pointto 50 g/m2.7 as the optimal threshold selected on multivariatesetting, which is the value that minimizes the probabilityvalue relating LVH to cardiovascular disease. This thresholdvalue was further supported by the generalized additivemodel analysis, which showed graphically that 51 g/m2.7 wasthe point that the GAM curve crossed a hazard rate of 0, andby the finding that the best operating point derived from the
TABLE 3. Outcome Description and Event Rates
Variable Men (n�570) Women (n�1046) All (n�1616)
First CVD events, n (%) 73 (12.8) 75 (7.2)§ 148 (9.2)
First CHD events, n (%) 37 (6.5) 28 (2.7)§ 65 (4.0)
First stroke events, n (%) 32 (5.6) 30 (2.9)§ 62 (3.8)
First CHF events, n (%) 16 (2.8) 27 (2.6) 43 (2.7)
Time,* years 6.76 (5.86–7.54) 6.80 (6.21–7.50) 6.79 (6.13–7.51)
Competing risk events,† n (%)
MI 23 (4.0) 17 (1.6) 40 (2.5)
CV death 10 (1.8) 8 (0.8) 18 (1.1)
RP 16 (2.8) 13 (1.2) 29 (1.8)
CHF 16 (2.8) 27 (2.6) 43 (2.7)
Stroke 33 (5.6) 30 (2.9) 62 (3.8)
Event rates‡
Person-year 3 862 7 108 10 970
N of events 98 95 192
Crude rates (�1000 person-years) 25.4 13.4 17.6
95% CI (20.6–30.9) (10.8–16.3)§ (15.2–20.3)
MI indicates myocardial infarction; RP, cardiac revascularization procedures (CABG surgery orPTCA); CV death, cardiovascular death; CHF, congestive heart failure; CI, confidence interval.
*Time-to first CVD event occurred, or censored, summarized as median (interquartile range).†Included �1 event per subject (recurrent events).‡Rates calculated with Poisson assumption, counting all events occurred on the same subject until
death or December 31, 2001.§P�0.01 for comparison between men and women.
TABLE 4. Characteristics of Single LVH Criteria as aDichotomous Screening Test
Parameters LVH*
TPR, % (95% CI) 57.1 (49.9–64.2)
FPR, % (95% CI) 39.2 (37.0–41.5)
Cumulative prevalence of CVD among 8-yearfollow-up, %
9.5
PPV, % (95% CI) 13.3 (11.0–15.7)
NPV, % (95% CI) 93.1 (91.5–94.5)
LR� (95% CI) 1.46 (1.28–1.67)
LR� (95% CI) 0.71 (0.60–0.83)
Pretest odds of CVD, % 0.105
Post-test odds of CVD by knowing LVH�, % 0.153
Post-test odds of CVD by knowing LVH�, % 0.074
TPR indicates true positive rate; FPR, false positive rate; PPV, positivepredictive value; NPV, negative predictive value; LR�, likelihood ratio for apositive test; LR�, likelihood ratio for a negative test.
*LVH with a threshold at 50 g/m2.7 for men and women combined.
Nunez et al Threshold for LVH in Blacks 61
by guest on November 11, 2013http://hyper.ahajournals.org/Downloaded from

area under the curve points toward a similar value. To makeour results comparable with previous studies,10–15 we alsoestimated the 95th percentile of LVMI values in our referencesubpopulation. Our results based in the percentile method (asingle threshold at 52.9 g/m2.7) were slightly higher thanprevious LVH criteria10–15 and our prognostically drivenestimates. We speculate that differences in exclusion criteriaapplied as well as the ethnic composition of the referencepopulation in which the criteria were estimated may play animportant role. For example, Devereux et al22 used a refer-ence population from 2 different sources, hospital-basedseries and employed adults, and de Simone et al13,20 from 3normotensive populations (in New York City; Naples, Italy;and Cincinnati, Ohio), and no mention is made in thosestudies about the proportion of blacks. The composition of thereference population from the Framingham study is predom-inantly white.12,14 Nonetheless, the confidence intervals asso-ciated with the 95th percentile of LVMI in our analysisincluded the threshold value estimated by endpoint-drivenmethods.
Single Threshold for Both GendersIt has been unclear whether gender-specific threshold valuesare needed to define LVH. For the sake of simplicity,previous investigators11,13,22 have proposed a unique partitionvalue typically estimated by a prespecified percentile andthen validated prognostically against morbid CHD events.1,20
To determine the generalizability of the single thresholdcomputed on our cohort, we tested the interaction betweenLVH and gender in the Cox model. Because no differenceswere found (P�0.814), our findings support a commonthreshold of 50 g/m2.7 for both genders. Likewise, a commonthreshold was supported by visual inspection of the GAMcurves, calculated separately in each gender (results notpresented).
Characteristics of LVH as a Diagnostic ToolRelative performance of LVH defined by our single criterionmay be evaluated using 2 dimensions of the accuracy scale,namely disease-specific classification probabilities (true pos-itive rate) and false-positive rate, predictive values (PPV andNPV), and diagnostic likelihood ratios (LR� and LR�). Usingour criterion, a TPR of 57.1% and an false-positive rate of39.2% means testing positive for LVH misses 42.9% of thesubjects in whom CVD developed at follow-up and incor-rectly identified 39.2% of low-risk subjects as being at highrisk for future events. In regard to how well LVH predictedfuture CVD events, a PPV of 13.3% indicates that amongsubjects that test positive for LVH, only a few of them hadevents in the 8-year follow-up period. A NPV of 93.1%showed that only 6.9% of subjects that tested negative were atrisk for future events. The likelihood ratios associated withour proposed threshold were: LR��1.46 (1.28 to 1.67) andLR��0.71 (0.60 to 0.83). However, the pretest odds ofdisease, 0.105, were increased to 0.153 by a positive test, andthis was decreased to 0.074 by a negative test. Furtherdiscussion of the usefulness of LVH as a diagnostic tool isincluded in the online supplement (Table V, Figure II, andcomments).
Limitations of the StudyFirst, the threshold derived here has been tested only in thedata set from which it was derived; it has not been prospec-tively validated with independent data or in another cohort ofblacks. Second, the validity of our results is limited to aCVD-free population of blacks. Third, the lack of a longitu-dinal assessment of LV mass did not permit us to account forthe effects of serial changes in LV mass that may beassociated with the incidence of CVD events. Although ourthreshold for blacks is the same as that recommendedgenerally, we cannot extrapolate this finding to other ethnicgroups. Therefore, we recommend future research be per-formed to establish ethnic-specific LVH thresholds for othergroups.
AcknowledgmentsThe ARIC study was funded by contracts N01 HC55015, N01HC55016, N01 HC55018, N01 HC55019, N01 HC55020, N01HC55021, and N01 HC55022 from the US National Heart, Lung,and Blood Institute. The authors thank the staff and their participantsin the ARIC study for their important contributions.
References1. Casale PN, Devereux RB, Milner M, Zullo G, Harshfield GA, Pickering
TG, Laragh JH. Value of echocardiographic measurement of left ventric-ular mass in predicting cardiovascular morbid events in hypertensivemen. Ann Intern Med. 1986;105:173–178.
2. Levy D, Garrison RJ, Savage DD, Kannel WB, Castelli WP. Left ven-tricular mass and incidence of coronary heart disease in an elderly cohort.The Framingham Heart Study. Ann Intern Med. 1989;110:101–107.
3. Levy D, Garrison RJ, Savage DD, Kannel WB, Castelli WP. Prognosticimplications of echocardiographically determined left ventricular mass inthe Framingham Heart Study. N Engl J Med. 1990;322:1561–1566.
4. Koren MJ, Devereux RB, Casale PN, Savage DD, Laragh JH. Relation ofleft ventricular mass and geometry to morbidity and mortality in uncom-plicated essential hypertension. Ann Intern Med. 1991;114:345–352.
5. Liao Y, Cooper RS, McGee DL, Mensah GA, Ghali JK. The relativeeffects of left ventricular hypertrophy, coronary artery disease, and ven-tricular dysfunction on survival among black adults. Jama. 1995;273:1592–1597.
6. Gardin JM, McClelland R, Kitzman D, Lima JA, Bommer W,Klopfenstein HS, Wong ND, Smith VE, Gottdiener J. M-mode echocar-diographic predictors of six- to seven-year incidence of coronary heartdisease, stroke, congestive heart failure, and mortality in an elderly cohort(the Cardiovascular Health Study). Am J Cardiol. 2001;87:1051–1057.
7. Ghali JK, Liao Y, Cooper RS. Influence of left ventricular geometricpatterns on prognosis in patients with or without coronary artery disease.J Am Coll Cardiol. 1998;31:1635–1640.
8. Sundstrom J, Lind L, Arnlov J, Zethelius B, Andren B, Lithell HO.Echocardiographic and electrocardiographic diagnoses of left ventricularhypertrophy predict mortality independently of each other in a populationof elderly men. Circulation. 2001;103:2346–2351.
9. Verdecchia P, Schillaci G, Borgioni C, Ciucci A, Gattobigio R, Zampi I,Reboldi G, Porcellati C. Prognostic significance of serial changes in leftventricular mass in essential hypertension. Circulation. 1998;97:48–54.
10. Valdez RS, Motta JA, London E, Martin RP, Haskell WL, Farquhar JW,Popp RL, Horlick L. Evaluation of the echocardiogram as an epidemi-ologic tool in an asymptomatic population. Circulation. 1979;60:921–929.
11. Reichek N, Devereux RB. Left ventricular hypertrophy: relationship ofanatomic, echocardiographic and electrocardiographic findings. Circu-lation. 1981;63:1391–1398.
12. Levy D, Savage DD, Garrison RJ, Anderson KM, Kannel WB, CastelliWP. Echocardiographic criteria for left ventricular hypertrophy: the Fra-mingham Heart Study. Am J Cardiol. 1987;59:956–960.
13. de Simone G, Daniels SR, Devereux RB, Meyer RA, Roman MJ, deDivitiis O, Alderman MH. Left ventricular mass and body size in nor-motensive children and adults: assessment of allometric relations andimpact of overweight. J Am Coll Cardiol. 1992;20:1251–1260.
62 Hypertension January 2005
by guest on November 11, 2013http://hyper.ahajournals.org/Downloaded from

14. Galderisi M, Lauer MS, Levy D. Echocardiographic determinants ofclinical outcome in subjects with coronary artery disease (the Fra-mingham Heart Study). Am J Cardiol. 1992;70:971–976.
15. Bella JN, Devereux RB, Roman MJ, O’Grady MJ, Welty TK, Lee ET,Fabsitz RR, Howard BV. Relations of left ventricular mass to fat-free andadipose body mass: the strong heart study. The Strong Heart StudyInvestigators. Circulation. 1998;98:2538–2544.
16. Mazumdar M, Glassman JR. Categorizing a prognostic variable: reviewof methods, code for easy implementation and applications to decision-making about cancer treatments. Stat Med. 2000;19:113–132.
17. Roman MJ. How best to identify prognostically important left ventricularhypertrophy: a cut to the chase. J Am Coll Cardiol. 1997;29:648–650.
18. Abergel E, Tase M, Bohlender J, Menard J, Chatellier G. Which defi-nition for echocardiographic left ventricular hypertrophy? Am J Cardiol.1995;75:498–502.
19. Wachtell K, Bella JN, Liebson PR, Gerdts E, Dahlof B, Aalto T, RomanMJ, Papademetriou V, Ibsen H, Rokkedal J, Devereux RB. Impact ofdifferent partition values on prevalences of left ventricular hypertrophyand concentric geometry in a large hypertensive population : the LIFEstudy. Hypertension. 2000;35:6–12.
20. de Simone G, Devereux RB, Daniels SR, Koren MJ, Meyer RA, LaraghJH. Effect of growth on variability of left ventricular mass: assessment ofallometric signals in adults and children and their capacity to predictcardiovascular risk. J Am Coll Cardiol. 1995;25:1056–1062.
21. Liao Y, Cooper RS, Durazo-Arvizu R, Mensah GA, Ghali JK. Predictionof mortality risk by different methods of indexation for left ventricularmass. J Am Coll Cardiol. 1997;29:641–647.
22. Devereux RB, Lutas EM, Casale PN, Kligfield P, Eisenberg RR,Hammond IW, Miller DH, Reis G, Alderman MH, Laragh JH. Standard-ization of M-mode echocardiographic left ventricular anatomic mea-surements. J Am Coll Cardiol. 1984;4:1222–1230.
23. Dunn FG, Oigman W, Sungaard-Riise K, Messerli FH, Ventura H, ReisinE, Frohlich ED. Racial differences in cardiac adaptation to essentialhypertension determined by echocardiographic indexes. J Am CollCardiol. 1983;1:1348–1351.
24. Koren MJ, Mensah GA, Blake J, Laragh JH, Devereux RB. Comparisonof left ventricular mass and geometry in black and white patients withessential hypertension. Am J Hypertens. 1993;6:815–823.
25. Robinson FC, Satterwhite K, Potter C, Craddock K, Beyoglu SA. Leftventricular mass index and coronary artery disease in hypertensive blackmales. J Natl Med Assoc. 1993;85:452–456.
26. Chaturvedi N, Athanassopoulos G, McKeigue PM, Marmot MG,Nihoyannopoulos P. Echocardiographic measures of left ventricular structureand their relation with rest and ambulatory blood pressure in blacks andwhites in the United Kingdom. J Am Coll Cardiol. 1994;24:1499–1505.
27. Gardin JM, Wagenknecht LE, Anton-Culver H, Flack J, Gidding S,Kurosaki T, Wong ND, Manolio TA. Relationship of cardiovascular riskfactors to echocardiographic left ventricular mass in healthy young blackand white adult men and women. The CARDIA study. Coronary ArteryRisk Development in Young Adults. Circulation. 1995;92:380–387.
28. Chapman JN, Mayet J, Chang CL, Foale RA, Thom SA, Poulter NR.Ethnic differences in the identification of left ventricular hypertrophy inthe hypertensive patient. Am J Hypertens. 1999;12:437–442.
29. Rautaharju PM, Park LP, Gottdiener JS, Siscovick D, Boineau R, SmithV, Powe NR. Race- and sex-specific ECG models for left ventricularmass in older populations. Factors influencing overestimation of leftventricular hypertrophy prevalence by ECG criteria in African-Americans. J Electrocardiol. 2000;33:205–218.
30. Aronow WS, Ahn C, Kronzon I. Comparison of echocardiographic abnor-malities in African-Am, Hispanic, and white men and women aged �60years. Am J Cardiol. 2001;87:1131–1133, A1110.
31. Chen CH, Ting CT, Lin SJ, Hsu TL, Chou P, Kuo HS, Wang SP, Yin FC,Chang MS. Relation between diurnal variation of blood pressure and leftventricular mass in a Chinese population. Am J Cardiol. 1995;75:1239–1243.
32. Thomas F, Benetos A, Ducimetiere P, Bean K, Guize L. Determinants ofleft ventricular mass in a French male population. Blood Press. 1999;8:79–84.
33. Wagner DR, Heyward VH. Measures of body composition in blacks andwhites: a comparative review. Am J Clin Nutr. 2000;71:1392–1402.
34. ARIC Protocol Manual 15: Echocardiography. Chapel Hill, NC: ARICCoordinating Center, University of NC; 1994.
35. Arnett DK, Skelton TN, Liebson PR, Benjamin E, Hutchinson RG.Comparison of m-mode echocardiographic left ventricular massmeasured using digital and strip chart readings: The Atherosclerosis Riskin Communities (ARIC) study. Cardiovasc Ultrasound. 2003;1:8.
36. Sahn DJ, DeMaria A, Kisslo J, Weyman A. Recommendations regardingquantitation in M-mode echocardiography: results of a survey of echo-cardiographic measurements. Circulation. 1978;58:1072–1083.
37. Devereux RB, Reichek N. Echocardiographic determination of left ven-tricular mass in man. Anatomic validation of the method. Circulation.1977;55:613–618.
38. Devereux RB, Alonso DR, Lutas EM, Gottlieb GJ, Campo E, Sachs I,Reichek N. Echocardiographic assessment of left ventricular hypertrophy:comparison to necropsy findings. Am J Cardiol. 1986;57:450–458.
39. The Atherosclerosis Risk in Communities (ARIC) Study: design andobjectives. The ARIC investigators. Am J Epidemiol. 1989;129:687–702.
40. ARIC Protocol Manual 3: Surveillance Component Procedures. ChapelHill, NC: ARIC Coordinating Center, University of NC; 1988.
41. White AD, Folsom AR, Chambless LE, Sharret AR, Yang K, Conwill D,Higgins M, Williams OD, Tyroler HA. Community surveillance ofcoronary heart disease in the Atherosclerosis Risk in Communities(ARIC) Study: methods and initial two years’ experience. J Clin Epi-demiol. 1996;49:223–233.
42. Hastie T, Tibshirani R. Generalized Additive Models. New York:Chapman and Hall; 1990.
43. Zweig MH, Campbell G. Receiver-operating characteristic (ROC) plots:a fundamental evaluation tool in clinical medicine. Clin Chem. 1993;39:561–577.
44. Altman DG. Problems in dichotomizing continuous variables. Am JEpidemiol. 1994;139:442–445.
Nunez et al Threshold for LVH in Blacks 63
by guest on November 11, 2013http://hyper.ahajournals.org/Downloaded from
Online supplement for
Optimal threshold value for left ventricular hypertrophy in African-Americans: the ARIC study Nunez E, Arnett DK, Benjamin EJ, Liebson PR, Skelton TN, Taylor H, Andrew M Complete methods
Study population The Atherosclerosis Risk in Communities Study (ARIC)1 is a prospective epidemiological study investigating the etiology and natural history of cardiovascular disease (CVD) in four US communities. The study design and procedures have been reported.1,2 An echocardiographic examination3,4 was performed (1992 through 1994) in African Americans age 51-70 years from Jackson, Mississippi. Participants were selected by probability sampling. After excluding subjects with technically inadequate echocardiograms, valvular heart disease, LV wall motion abnormalities, ventricular aneurysm, severely depressed LV function, and prevalent coronary heart disease (CHD), 570 men and 1046 women were included in this analysis.
Echocardiography The echocardiograph protocol has been reported.3,4 In brief, M-mode tracings and measurements of the LV were performed under two-dimensional guidance. Tracings were read by one of two cardiologists, and the average of three measurements was computed. The reliability assessment of the ARIC echocardiographic reading center reported intraobserver coefficients of variation of 4.6% for interventricular septum, 4.6% for posterior wall, 1.5% for internal diameter, and 6.3% for LV mass.
Echocardiography measurements LV measurements were taken according to the American Society of Echocardiography recommendations.5 LV mass was calculated according to Devereux’s validated formula.6,7 As recommended,8 LV mass values were normalized by height2.7 to correct for body size differences.
Risk factors measurements and definition of variables Risk factors were measured at the echocardiographic exam visit using standardized methods. See Table I in this online supplement for definitions and measurement procedures.
Ascertaining incident CVD events CHD and stroke incidence were ascertained by annual contact, identifying hospitalizations and deaths during the previous year, and surveying discharge lists from local hospitals and death
certificates for potential events.1,9,10 CHD incidence was defined as hospitalization for myocardial infarction (MI), cardiac death, or revascularization procedure, or by electrocardiogram (ECG) changes between baseline and follow-up examinations.1 Definite or probable MI was based on a combination of chest pain, evolving electrocardiographic changes, and levels of cardiac enzymes.1,10 Stroke included ischemic as well as hemorrhagic stroke. Heart failure was defined by hospital discharge diagnosis. For participants with a verified clinical event, follow-up time was calculated between the echocardiogram and date of the first event. For participants with no event, follow-up continued until non-cardiovascular death (n=62), 31 December 2001 (n=1405), or date of last contact (n=1). The median follow-up was 6.55 years (interquartile range 6.13-7.51 years).
Statistical analysis Comparisons between genders were performed with Mann-Whitney two-sample statistic for continuous variables and chi-square or Fisher’s exact test (2x2 tables) for discrete variables. All statistical analyses were performed using Stata 8.2 (StataCorp, College Station, TX).
We followed a three step approach to determine the optimal criterion for left ventricular hypertrophy (LVH)11:
1. Identify continuous prognostic variable in appropriate regression setting We used Cox regression analysis to quantify the association between left ventricular mass index (LVMI) and incident CVD after graphically assessing the proportional hazards assumption.
2. Create exploratory plots and look for patterns a. Generalized Additive Model (GAM)
We used GAM12 with Cox extension to uncover the underlying relationship between LVMI and the composite CVD endpoint. By plotting smoothed LVMI functions versus the hazard rate for CVD, we selected the value along the continuum of LVMI corresponding to a hazard rate of zero as the optimal threshold (Figure 1 in print version).
b. Area under the curve (AUC)
Online supplement for Nunez, Arnett, Benjamin, et al. ■ Threshold for LVH in blacks ■ 1

The ability of the LVMI to discriminate between low-high probabilities of CVD events was assessed by plotting sensitivity (Se) against 1-specificity (Sp) of each value in the continuum of LVMI (Figure 2 in print version). The resulting receiver operating characteristic (ROC) curve13 provided a full range of diagnostic thresholds for all possible combinations of Se and Sp. Confidence intervals for the AUC were estimated using bootstrapping resampling with 1000 simulations and using the exact binomial method.
3. Perform systematic search All values suggested by the exploratory plots were examined as candidates for optimal cutpoints. Once the range of values of LVMI was selected (45-53 g/m2.7), Cox proportional hazard regression models were used to determine the value associated with a minimum P-value or maximum chi-square statistic.11,14 Univariate as well as risk factor-adjusted (age, gender, systolic blood pressure, hypertension, diabetes, total cholesterol-
high density lipoprotein cholesterol ratio, smoking status, LVH by ECG criterion, and level of education greater than high school) estimates were computed. As an ancillary criterion for model selection, C statistics (or AUC) were estimated from the multivariate Cox regression analyses to characterize them by their discriminatory capacity.15
Gaussian distribution method We computed a threshold value corresponding to the 95th percentile of LVMI in a subset of apparently healthy individuals (i.e., excluding subjects with diabetes, overweight/obese, abdominal obesity, hypertension, and those receiving any cardioactive drug).
Single or gender-specific threshold To further evaluate the generalizability of the threshold for both sexes, the interaction term of LVH (with a 50 g/m2.7 threshold) with gender was tested in the multivariate analysis, as well as looking at the value of LVMI corresponding to a log hazard ratio of 0 in the GAM curves, in men and women.
Online supplement for Nunez, Arnett, Benjamin, et al. ■ Threshold for LVH in blacks ■ 2

Table I. Risk factor definitions and measurement procedures Risk factor Definition and/or measurement
body mass index (BMI) weight/height2 (kg/m2)
body surface area according to DuBois16
weight classification NHANES17 • normal=BMI<25 kg/m2 • overweight=25≤BMI<30 kg/m2 • obese=BMI≥30 kg/m2
waist-to-hip ratio (WHR) waist:hip circumference
abdominal obesity • WHR≥0.85 for women • WHR≥1.00 for men
systolic and diastolic blood pressure (SBP, DBP) average of last two of three measures with a random-zero sphygmomanometer
hypertension status • SBP≥140 mm Hg, or • DBP≥90 mm Hg, or • self-reported use of anti-hypertensive drug during two weeks before exam
prevalent diabetes • fasting glucose≥126 mg/dl, or • non-fasting glucose≥200 mg/dl, or • self-reported history of diabetes, or • self-reported use of hypoglycemic drug
cigarette smoking self-reported (current/previous/never)
total-to-high density lipoprotein cholesterol ratio (TC-HDL ratio)
serum TC:HDL
socio-economic status (SES) education level used as surrogate measure of socioeconomic status (high school and below/greater than high school)
LVH by Cornell voltage criteria • males and voltage>28 mV, or • female and voltage>20
prevalent CHD • self-reported physician diagnosis of prior myocardial infarction (MI), or • ECG changes characteristic of previous MI, or • self-report of prior coronary reperfusion procedure
Online supplement for Nunez, Arnett, Benjamin, et al. ■ Threshold for LVH in blacks ■ 3
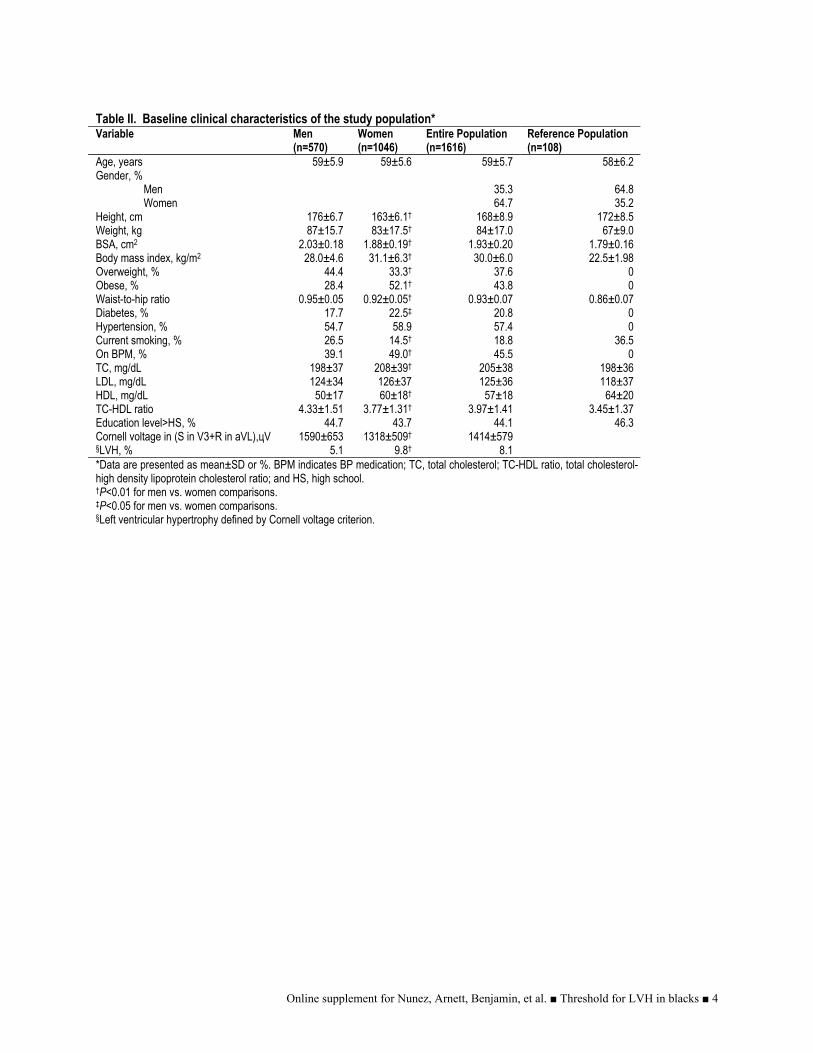
Table II. Baseline clinical characteristics of the study population* Variable Men
(n=570) Women (n=1046)
Entire Population (n=1616)
Reference Population (n=108)
Age, years 59±5.9 59±5.6 59±5.7 58±6.2 Gender, % Men Women
35.3 64.7
64.8 35.2
Height, cm 176±6.7 163±6.1† 168±8.9 172±8.5 Weight, kg 87±15.7 83±17.5† 84±17.0 67±9.0 BSA, cm2 2.03±0.18 1.88±0.19† 1.93±0.20 1.79±0.16 Body mass index, kg/m2 28.0±4.6 31.1±6.3† 30.0±6.0 22.5±1.98 Overweight, % Obese, %
44.4 28.4
33.3† 52.1†
37.6 43.8
0 0
Waist-to-hip ratio 0.95±0.05 0.92±0.05† 0.93±0.07 0.86±0.07 Diabetes, % 17.7 22.5‡ 20.8 0 Hypertension, % 54.7 58.9 57.4 0 Current smoking, % 26.5 14.5† 18.8 36.5 On BPM, % 39.1 49.0† 45.5 0 TC, mg/dL 198±37 208±39† 205±38 198±36 LDL, mg/dL 124±34 126±37 125±36 118±37 HDL, mg/dL 50±17 60±18† 57±18 64±20 TC-HDL ratio 4.33±1.51 3.77±1.31† 3.97±1.41 3.45±1.37 Education level>HS, % 44.7 43.7 44.1 46.3 Cornell voltage in (S in V3+R in aVL),цV 1590±653 1318±509† 1414±579 §LVH, % 5.1 9.8† 8.1 *Data are presented as mean±SD or %. BPM indicates BP medication; TC, total cholesterol; TC-HDL ratio, total cholesterol-high density lipoprotein cholesterol ratio; and HS, high school. †P<0.01 for men vs. women comparisons. ‡P<0.05 for men vs. women comparisons. §Left ventricular hypertrophy defined by Cornell voltage criterion.
Online supplement for Nunez, Arnett, Benjamin, et al. ■ Threshold for LVH in blacks ■ 4

Table III. Search for the optimal threshold using a minimum P-value approach* Variables HR 95% CI P-value P-value† AUC ≥45 1.16 0.84-1.60 0.367 0.811 0.738 ≥46 1.24 0.90-1.71 0.190 0.899 0.738 ≥47 1.87 1.00-1.87 0.054 0.513 0.740 ≥48 1.44 1.05-1.97 0.023 0.293 0.742 ≥49 1.55 1.14-2.12 0.005 0.093 0.743 ≥50 1.54 1.14-2.10 0.005 0.083 0.744 ≥51 1.48 1.09-2.01 0.013 0.191 0.742 ≥52 1.42 1.04-1.93 0.026 0.317 0.739 ≥53 1.47 1.08-1.99 0.014 0.210 0.741 *All estimates are adjusted by age, gender, systolic blood pressure, hypertension, diabetes, total cholesterol-high density lipoprotein cholesterol ratio, smoking status, LVH by ECG, and education level. †Corrected P-values using the Altman et al. formula.18
Online supplement for Nunez, Arnett, Benjamin, et al. ■ Threshold for LVH in blacks ■ 5

Table IV. Prognostic parameters comparison between LVH indexed by BSA and by height2.7* BSA-LVH† Ht2.7-LVH‡ Diagnostic test parameters
TPR, % 55.6 54.1 FPR, % 35.7 36.7 Cumulative prevalence of CVD, % 9.49 9.49 PPV, % 13.7 13.7 NPV, % 0.93 0.93 LR+ 1.52 1.52 LR- 0.70 0.71 Pre-test odds of CVD, % 9.49 9.49 Post-test odds of CVD by LVH+, %
14.4 14.4
Post-test odds of CVD by LVH- , %
6.64 6.74
Discriminative measures at follow-up AUC 0.749 0.753 Brier score 0.079 0.079
Regression estimates at follow-up LVM index 1.20 (1.04-1.38)
per 25 g/m2 1.19 (1.07-1.32)
per 10 g/m2.7 LVH 1.40 (1.03-1.90) 1.48 (1.09-2.02)
*TPR indicates true positive rate; FPR, false positive rate; PPV, positive predictive value; NPV, negative predictive value; LR+, likelihood ratio for a positive test; and LR-, likelihood ratio for a negative test. †BSA-normalized LVH with a threshold at 105 g/m2 for men and women combined. ‡Height2.7-normalized LVH with a threshold at 51 g/m2.7 for men and women combined.
Online supplement for Nunez, Arnett, Benjamin, et al. ■ Threshold for LVH in blacks ■ 6

Figure I. LV mass index normalized to body surface area. Top panel: Optimal LV mass index threshold suggested by GAM plot. This association is adjusted simultaneously for age, gender, systolic blood pressure, hypertension, diabetes status, total cholesterol-high density lipoprotein cholesterol ratio, LVH by ECG, and education level. The optimal cutoff point was estimated to be 105 g/m2. The curves with short dashes indicate approximate 95% CIs for the smoothed hazard. Bottom panel: Sensitivity and specificity curves for BSA-normalized LV mass index using incident CVD at a median of seven years follow-up as the reference test. The optimal cutoff point was estimated to be 103 g/m2.
Online supplement for Nunez, Arnett, Benjamin, et al. ■ Threshold for LVH in blacks ■ 7

Table V. Degradation of the prognostic value of LVH as the time elapsed from baseline increases* 1-year
(# events=26) 3-year
(# events=88) 5-year
(# events=144) 8-year
(# events=196) Diagnostic test parameters at follow-up for LVH†
TPR, %† 84.6 (65.1-95.6) 64.8 (53.9-74.7) 54.9 (46.4-63.2) 54.1 (46.8-61.2) FPR, %† 37.6 (35.5-39.8) 37.0 (34.9-39.2) 37.0 (34.8-39.2) 36.5 (34.4-38.8) Cumul. prev. of CVD, % 1.26 4.26 6.97 9.49 PPV, %† 2.79 (1.76-4.2) 7.22 (5.52-9.26) 10.0 (8.01-12.3) 13.4 (11.1-16.0) NPV, %† 99.7 (99.2-99.9) 97.6 (96.6-98.3) 94.9 (93.6-96.1) 93.0 (91.4-94.3) LR+† 2.25 (1.89-2.68) 1.75 (1.48-2.06) 1.48 (1.27-1.74) 1.48 (1.28-1.71) LR-† 0.25 (0.10-0.61) 0.56 (0.42-0.74) 0.72 (0.60-0.86) 0.72 (0.62-0.85) Pre-test odds of CVD, % 1.26 4.45 6.97 9.49 Post-test odds of CVD by LVH+, %
2.84 7.79 10.32 14.05
Post-test odds of CVD by LVH- , %
0.32 2.49 5.02 6.83
Discriminative measures at follow-up AUC 0.858 0.793 0.763 0.752 Brier score 0.012 0.038 0.060 0.079
Regression estimates at follow-up LVM index, gr/m2 1.54 (1.14-1.85) 1.31 (1.14-1.50) 1.19 (1.06-1.33) 1.19 (1.07-1.32) LVH† 5.80 (1.90-17.64) 2.27 (1.40-3.67) 1.42 (1.00-2.04) 1.48 (1.09-2.02)
*TPR indicates true positive rate; FPR, false positive rate; PPV, positive predictive value; NPV, negative predictive value; LR+, likelihood ratio for a positive test; and LR-, likelihood ratio for a negative test. †LVH with a threshold at 51 g/m2.7 for men and women combined. LVH as a predictor of CVD
In evaluating a biomarker as a predictor for cardiovascular risk, several conditions must be met to establish its prognostic utility; chief among these is the strength and duration of the association between biomarker and outcome. With this in mind, we sought to determine the performance of LVH at different time points of follow-up, in terms of strength of the association with CVD (measured as
hazard ratio (HR)), discriminative performance (measured as area under the curve (AUC) and Brier Score), and predictive accuracy (measured as likelihood ratios (LR+ and LR-)). Table V shows a degradation of the prognostic value of LVH as follow-up time increases. The hazard ratio is below 2.00 which indicates LVH is a modest predictor for CVD.
Online supplement for Nunez, Arnett, Benjamin, et al. ■ Threshold for LVH in blacks ■ 8

Figure II. Competing components of the composite risk analysis. The performance of LVH as a diagnostic tool is also a function of our composite endpoint. This figure shows the cumulative incidence of endpoint components CHD, CHF, and stroke. LVH is a powerful predictor for stroke and CHF but not for incident CHD. By broadening the nominal endpoint to include CHD, we effectively lowered the predictive value of LVH.
Online supplement for Nunez, Arnett, Benjamin, et al. ■ Threshold for LVH in blacks ■ 9
References for online supplement1. The Atherosclerosis Risk in Communities (ARIC)
Study: design and objectives. The ARIC investigators. Am J Epidemiol. 1989;129:687-702.
2. ARIC Manual 1. General description and study management. In: National Heart, Lung, and Blood Institute, NIH; 1987.
3. ARIC Manual of Operations-Echocardiography. In; 1993.
4. Arnett DK, Skelton TN, Liebson PR, Benjamin E, Hutchinson RG. Comparison of m-mode echocardiographic left ventricular mass measured using digital and strip chart readings: The Atherosclerosis Risk in Communities (ARIC) study. Cardiovasc Ultrasound. 2003;1:8.
5. Sahn DJ, DeMaria A, Kisslo J, Weyman A. Recommendations regarding quantitation in M-mode echocardiography: results of a survey of echocardiographic measurements. Circulation. 1978;58:1072-1083.
6. Devereux RB, Reichek N. Echocardiographic determination of left ventricular mass in man. Anatomic validation of the method. Circulation. 1977;55:613-618.
7. Devereux RB, Alonso DR, Lutas EM, Gottlieb GJ, Campo E, Sachs I, Reichek N. Echocardiographic assessment of left ventricular hypertrophy: comparison to necropsy findings. Am J Cardiol. 1986;57:450-458.
8. Reichek N, Devereux RB. Left ventricular hypertrophy: relationship of anatomic, echocardiographic and electrocardiographic findings. Circulation. 1981;63:1391-1398.
9. ARIC Manual 3. Surveillance component and procedures. In. Chapel Hill, NC: National Heart, Lung, and Blood Institute, NIH; 1987.
10. White AD, Folsom AR, Chambless LE, Sharret AR, Yang K, Conwill D, Higgins M, Williams
OD, Tyroler HA. Community surveillance of coronary heart disease in the Atherosclerosis Risk in Communities (ARIC) Study: methods and initial two years' experience. J Clin Epidemiol. 1996;49:223-233.
11. Mazumdar M, Glassman JR. Categorizing a prognostic variable: review of methods, code for easy implementation and applications to decision-making about cancer treatments. Stat Med. 2000;19:113-132.
12. Hastie T, Tibshirani R. Generalized Additive Models. New York: Chapman and Hall; 1990.
13. Zweig MH, Campbell G. Receiver-operating characteristic (ROC) plots: a fundamental evaluation tool in clinical medicine. Clin Chem. 1993;39:561-577.
14. Altman DG. Problems in dichotomizing continuous variables. Am J Epidemiol. 1994;139:442-445.
15. Harrell FE, Jr., Lee KL, Mark DB. Multivariable prognostic models: issues in developing models, evaluating assumptions and adequacy, and measuring and reducing errors. Stat Med. 1996;15:361-387.
16. Dubois D, Dubois E. A formula to estimate the approximate surface area if height and weight be known. Arch Intern Med. 1916;17:863-871.
17. Kuczmarski RJ, Carroll MD, Flegal KM, Troiano RP. Varying body mass index cutoff points to describe overweight prevalence among U.S. adults: NHANES III (1988 to 1994). Obes Res. 1997;5:542-548.
18. Altman DG, Lausen B, Sauerbrei W, Schumacher M. Dangers of using "optimal" cutpoints in the evaluation of prognostic factors. J Natl Cancer Inst. 1994;86:829-835.
Online supplement for Nunez, Arnett, Benjamin, et al. ■ Threshold for LVH in blacks ■ 10
Copyright © 2022 FDOKUMEN