Optimal mixing to improve the performance of batch and continuous fermentations with recombinant...
10
Journal of Chemical Technology and Biotechnology J Chem Technol Biotechnol 80:361–370 (2005) DOI: 10.1002/jctb.1194 Optimal mixing to improve the performance of batch and continuous fermentations with recombinant Escherichia coli Venkata SRK Ganduri, 1 Sanjoy Ghosh 1 and Pratap R Patnaik 2∗ 1 Department of Biotechnology, Anna University, Chennai 600 025, India 2 Institute of Microbial Technology, Sector 39-A, Chandigarh 160 036, India Abstract: Fermentations with genetically altered bacteria tend to lose plasmids as the fermentation progresses. Methods such as two-stage cultivation, cell recycle and the addition of antibiotics are commonly used to enhance plasmid stability. Here we examine a different method, the regulation of mixing in the bioreactor. In particular, large bioreactors are considered where uniform mixing is difficult to achieve and the probability of plasmid loss varies with the specific growth rate. For both batch and continuous cultivations of Escherichia coli C600 gal K containing the plasmid pBR Eco gap, it is seen through a model that both modes of operation exhibit high plasmid stability and cell growth when the broth is incompletely mixed, and mixing near and away from the point of inoculation are unequal. Thus, the natural incomplete mixing in large bioreactors may be utilized to improve plasmid stability. A practical method to implement this idea is suggested. 2005 Society of Chemical Industry Keywords: recombinant fermentations; plasmid stability; incomplete mixing; distribution of mixing NOTATION CFSTB Continuous flow stirred tank bioreactor CSTR Continuous stirred tank reactor D Overall dilution rate (h −1 ) D 1 , D 2 Dilution rates in reactors (1) and (2) (h −1 ) K Equilibrium constant (g dm −3 ) n Constant in eqn (11) (dimensionless) p r Probability of plasmid loss (dimensionless) p r i Probability of plasmid loss in i th CFSTB (dimensionless) Q Volumetric flow rate (dm 3 h −1 ) Q r i Recycle volumetric flow rate from i th CFSTB (dm 3 h −1 ) s f Feed substrate concentration (g dm −3 ) s i Concentration of substrate in i th CFSTB (g dm −3 ) t Time (h) V Volume of CSTR (dm 3 ) V i Volume of i th CFSTB (dm 3 ) x − i Concentration of plasmid-free cells in i th CFSTB (g dm −3 ) x + i Concentration of plasmid-bearing cells in i th CFSTB (g dm −3 ) Y − Yield coefficient for plasmid-free cell (g g −1 ) Y + Yield coefficient for plasmid-bearing cells (g g −1 ) Subscripts 1 Upper (non-inoculated) region of bioreactor 2 Lower (inoculated) region of bioreactor α Constant in eqn (11) (h) β Constant in eqn (11) (h −1 ) γ Constant in eqn (11) (h −1 ) µ + Specific growth rate of plasmid-bearing cells (h −1 ) µ − i Specific growth rate of plasmid-free cells in i th CFSTB (h −1 ) µ + i Specific growth rate of plasmid-bearing cells in i th CFSTB (h −1 ) µ − m Maximum specific growth rate of plasmid-free cells (h −1 ) µ + m Maximum specific growth rate of plasmid-bearing cells (h −1 ) φ i Mass fraction of plasmid-bearing cells in i th CFSTB (dimensionless) 1 INTRODUCTION A major difficulty in the scaling-up of recombi- nant fermentations is maintenance of the stability of plasmid-containing cell cultures. 1,2 The productivity of a bioreactor employing recombinant strains depends on the degree to which the plasmid-bearing cells are generated, propagated and sustained, and their ability to express the desired (recombinant) protein. The determination and maintenance of conditions that favor these requirements depends on the analysis of the fermentation through a good model that comple- ments as well as acts as a precursor to experimental design and exploration. Many investigators 1–10 have ∗ Correspondence to: Pratap R Patnaik, Institute of Microbial Technology, Sector 39-A, Chandigarh 160 036, India E-mail: [email protected] (Received 14 May 2004; revised version received 26 September 2004; accepted 29 September 2004) Published online 17 February 2005 2005 Society of Chemical Industry. J Chem Technol Biotechnol 0268–2575/2005/$30.00 361
-
Upload
independent -
Category
Documents
-
view
1 -
download
0
Transcript of Optimal mixing to improve the performance of batch and continuous fermentations with recombinant...

Journal of Chemical Technology and Biotechnology J Chem Technol Biotechnol 80:361–370 (2005)DOI: 10.1002/jctb.1194
Optimal mixing to improve the performance ofbatch and continuous fermentations withrecombinant Escherichia coliVenkata SRK Ganduri,1 Sanjoy Ghosh1 and Pratap R Patnaik2∗1Department of Biotechnology, Anna University, Chennai 600 025, India2Institute of Microbial Technology, Sector 39-A, Chandigarh 160 036, India
Abstract: Fermentations with genetically altered bacteria tend to lose plasmids as the fermentationprogresses. Methods such as two-stage cultivation, cell recycle and the addition of antibiotics arecommonly used to enhance plasmid stability. Here we examine a different method, the regulation ofmixing in the bioreactor. In particular, large bioreactors are considered where uniform mixing is difficultto achieve and the probability of plasmid loss varies with the specific growth rate. For both batch andcontinuous cultivations of Escherichia coli C600 gal K containing the plasmid pBR Eco gap, it is seenthrough a model that both modes of operation exhibit high plasmid stability and cell growth when the brothis incompletely mixed, and mixing near and away from the point of inoculation are unequal. Thus, thenatural incomplete mixing in large bioreactors may be utilized to improve plasmid stability. A practicalmethod to implement this idea is suggested. 2005 Society of Chemical Industry
Keywords: recombinant fermentations; plasmid stability; incomplete mixing; distribution of mixing
NOTATIONCFSTB Continuous flow stirred tank bioreactorCSTR Continuous stirred tank reactorD Overall dilution rate (h−1)D1, D2 Dilution rates in reactors (1) and (2) (h−1)K Equilibrium constant (g dm−3)n Constant in eqn (11) (dimensionless)pr Probability of plasmid loss (dimensionless)pri Probability of plasmid loss in ith CFSTB
(dimensionless)Q Volumetric flow rate (dm3 h−1)Qri Recycle volumetric flow rate from ith CFSTB
(dm3 h−1)sf Feed substrate concentration (g dm−3)si Concentration of substrate in ith CFSTB
(g dm−3)t Time (h)V Volume of CSTR (dm3)Vi Volume of ith CFSTB (dm3)x−
i Concentration of plasmid-free cells in ithCFSTB (g dm−3)
x+i Concentration of plasmid-bearing cells in ith
CFSTB (g dm−3)Y− Yield coefficient for plasmid-free cell (g g−1)Y+ Yield coefficient for plasmid-bearing cells
(g g−1)
Subscripts1 Upper (non-inoculated) region of bioreactor2 Lower (inoculated) region of bioreactor
α Constant in eqn (11) (h)β Constant in eqn (11) (h−1)γ Constant in eqn (11) (h−1)µ+ Specific growth rate of plasmid-bearing cells (h−1)µ−
i Specific growth rate of plasmid-free cells in ithCFSTB (h−1)
µ+i Specific growth rate of plasmid-bearing cells in ith
CFSTB (h−1)µ−
m Maximum specific growth rate of plasmid-freecells (h−1)
µ+m Maximum specific growth rate of plasmid-bearing
cells (h−1)φi Mass fraction of plasmid-bearing cells in ith
CFSTB (dimensionless)
1 INTRODUCTIONA major difficulty in the scaling-up of recombi-nant fermentations is maintenance of the stability ofplasmid-containing cell cultures.1,2 The productivityof a bioreactor employing recombinant strains dependson the degree to which the plasmid-bearing cells aregenerated, propagated and sustained, and their abilityto express the desired (recombinant) protein. Thedetermination and maintenance of conditions thatfavor these requirements depends on the analysis ofthe fermentation through a good model that comple-ments as well as acts as a precursor to experimentaldesign and exploration. Many investigators1–10 have
∗ Correspondence to: Pratap R Patnaik, Institute of Microbial Technology, Sector 39-A, Chandigarh 160 036, IndiaE-mail: [email protected](Received 14 May 2004; revised version received 26 September 2004; accepted 29 September 2004)Published online 17 February 2005
2005 Society of Chemical Industry. J Chem Technol Biotechnol 0268–2575/2005/$30.00 361

VSRK Ganduri, S Ghosh, and PR Patnaik
quantitatively analyzed different fermentation systemsthrough models that have considered the frequencyof generation of plasmid-free daughter cells fromplasmid-carrying mother cells and the specific growthrate difference between plasmid-bearing and plasmid-free cells.
When a plasmid-containing cell subdivides, occa-sionally defective partitioning results in a daughter cellwhich does not contain the plasmid; such daughtercells consume nutrients but generate no useful prod-uct. This is called segregational instability. While it iswell known that segregational instability depends onthe kinetics of plasmid propagation, a less known butimportant factor is the distributions of plasmid-bearingand plasmid-free cells relative to those of the sub-strate(s). In an ideal (small, well-mixed) bioreactor,the distributions are spatially uniform. However, this isnot true in the realistic conditions of large bioreactors.This affects the availability of substrate(s) at differ-ent locations and consequently the relative growthrates of the two kinds of cells. Therefore the bestoperating policies and the productivities determinedfor ideal fermentations may be (and indeed oftenare) quite different from those of larger, incompletelymixed reactors.
A common idealization is to assume that theprobability of plasmid loss per cycle of cell divisionis constant.11–13 However, Satyagal and Agrawal14
allude to varying probability by expressing it asa function of the number of DNA molecules inthe mother cell at the time of cell division, anumber which varies with time. Recognizing this,Mosrati et al6 developed an analytical expressionfor the dependence of plasmid loss probabilityon the specific growth rate of plasmid-containingcells. In the present communication, we incorporatethis variable probability and finite macromixing ina recombinant fermentation system of Escherichiacoli C600 gal K strain containing the plasmidpBR Eco gap, which encodes for glyceraldehyde-3-phosphate dehydrogenase (GAPDH), to study theireffects on plasmid stability, substrate utilizationand product formation by inserting generalizedplasmid kinetics1 into an experimentally validatedmacromixing model.15
2 MATHEMATICAL MODEL DEVELOPMENT2.1 Imperfectly mixed batch bioreactorTo represent finite macromixing in a simple manner,Tanner et al15 conceptually divided the broth in thebioreactor into two well-mixed regions with exchangeof fluid between them. As Fig 1 shows, each regionfunctions as a continuous flow stirred tank bioreactor(CFSTB) and the interconnecting streams representinternal circulation. Tanner et al also considered thereactors to be of the same size and hence of thesame dilution rate. However, Patnaik7 relaxed thisrestriction, thus allowing two dilution rates, D1 andD2. This generalization enables the degree of mixing
1
2
Reactor-1 Reactor-2
inoculum inoculumcirculation
Figure 1. Two-region model of macromixing in a batch fermentation(from Tanner et al15).
in the two regions to be set independently at differentvalues, which the Tanner model does not allow. If D1
or D2 → ∞, that region is perfectly mixed, while D1 orD2 → 0 indicates complete regional segregation. Forcomplete mixing throughout the broth, both D1 andD2 → ∞, and similarly complete spatial segregationoccurs when D1 and D2 → 0. Most real fermentationswill of course have dilution rates between these limits.Since continuity considerations require the flow ratesinto and out of each region to be the same, both D1
and D2 have to approach 0 or ∞ together. However,they can have finite unequal values, implying unequalvolumes of the two regions.
The mechanism suggested by Imanaka and Aiba1
for plasmid loss through defective partitioning at thetime of cell division (segregational instability) hasbeen used widely to model plasmid dynamics infermentations. It may be represented schematically(and not stoichiometrically) as:5
aS + X+ −−−→ (2 − pr)X+ + X− (1)
bS + X− −−−→ 2X− (2)
where S is the substrate and X+, X− denoteplasmid-bearing and plasmid-free cells respectively.The model assumes that X+ cells degenerate toX− cells with a probability ‘pr’ per generation, ieX− = prX+. Incorporation of the kinetic equations5
for this mechanism in the material balances for thetwo regions of modified Tanner model (Fig 1) leadsto a set of mass balance equations.
Reactor- 1
dx−1
dt= D1(x−
2 − x−1 ) + µ−
1 x−1 + pr1µ
+1 x+
1 (3)
dx+1
dt= D1(x+
2 − x+1 ) + (1 − pr1)µ
+1 x+
1 (4)
ds1
dt= D1(s2 − s1) − µ−
1 x−1
Y− − µ+1 x+
1
Y+ (5)
Reactor- 2
dx−2
dt= D2(x−
1 − x−2 ) + µ−
2 x−2 + pr2µ
+2 x+
2 (6)
362 J Chem Technol Biotechnol 80:361–370 (2005)
Improving the performance of fermentations with E coli
dx+2
dt= D2(x+
1 − x+2 ) + (1 − pr2)µ
+2 x+
2 (7)
ds2
dt= D2(s1 − s2) − µ−
2 x−2
Y− − µ+2 x+
2
Y+ (8)
In this model, substrate consumption rates areconsidered proportional to the rates of formation ofthe two types of cells through their yield factors. Thespecific growth rates of plasmid-bearing and plasmid-free cells follow Monod kinetics according to thefollowing equations:6
µ−i = µ−
msi
K + si; i = 1, 2 (9)
µ+i = µ+
msi
K + si; i = 1, 2 (10)
Previous studies12,16 indicate that the equilibriumconstants and yield factors for plasmid-harboring andplasmid-free cells are approximately equal. Hence,the same value of K has been used in eqns (9) and(10). Although the original Imanaka–Aiba model andmany applications of it12,17,18 assumed the plasmidloss probabilities, pr1 or pr2 , to be constant, there arereports19,20 that it depends on the specific growth rateof plasmid-containing cells. This dependence may beexpressed as:6
pri = α
(µ+
i − β(µ+i /γ )n
1 + (µ+i /γ )n
); i = 1, 2 (11)
Thus, the variable plasmid loss probability, pri , isimplicitly a function of time.
Since in real terms one is interested in the broth asa whole, the concentrations in the two-region modelhave to be averaged. By a simple material balance,these averages may be expressed in terms of dilutionrates as:
Plasmid-free cell concentration : x−av
= x−1 D2 + x−
2 D1
D1 + D2(12)
Plasmid-bearing cell concentration : x+av
= x+1 D2 + x+
2 D1
D1 + D2(13)
Substrate concentration : sav
= s1D2 + s2D1
D1 + D2(14)
Plasmid loss probability : prav
= pr1D2 + pr2D1
D1 + D2(15)
Mass fraction of plasmid-bearing cells : φav
= φ1D2 + φ2D1
D1 + D2(16)
where : φi = x+i
x+i + x−
i
; i = 1, 2 (17)
Qr1
Reactor-1 Qr2Reactor-2
V1 V2
Q, s fQ, s1, x1 ,x1 − +
Figure 2. Two-region model of macromixing in a continuousfermentation (from Patnaik7).
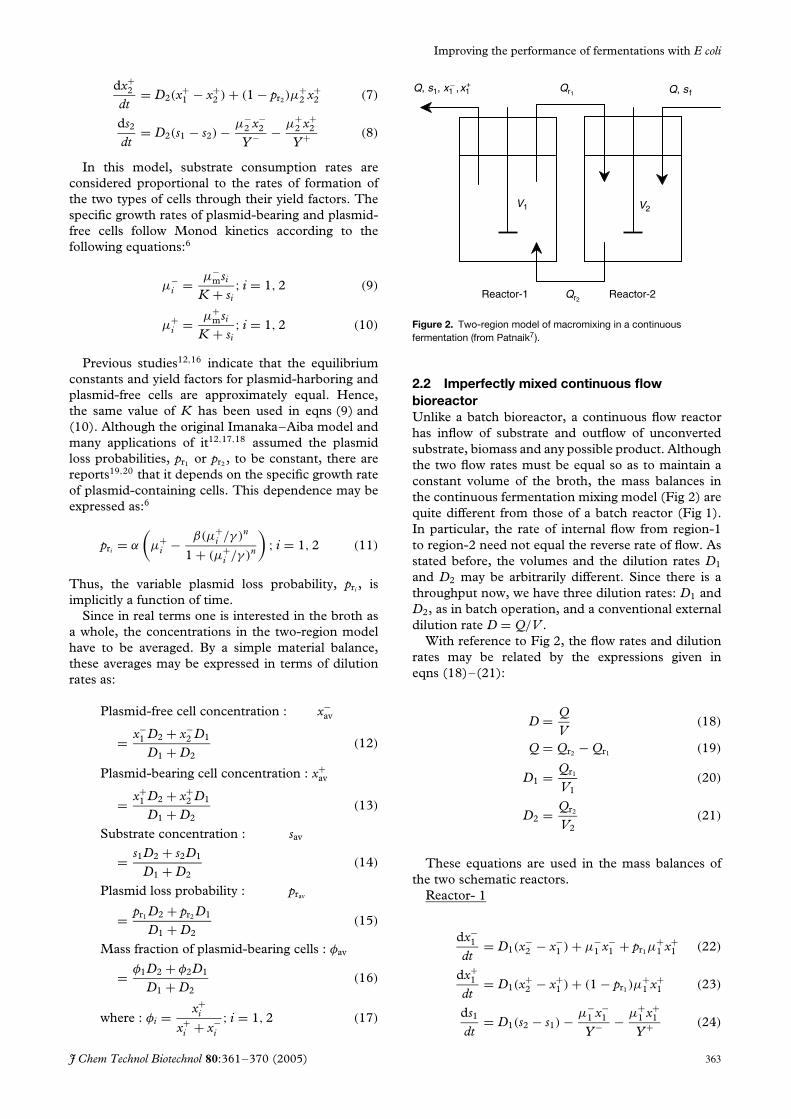
2.2 Imperfectly mixed continuous flowbioreactorUnlike a batch bioreactor, a continuous flow reactorhas inflow of substrate and outflow of unconvertedsubstrate, biomass and any possible product. Althoughthe two flow rates must be equal so as to maintain aconstant volume of the broth, the mass balances inthe continuous fermentation mixing model (Fig 2) arequite different from those of a batch reactor (Fig 1).In particular, the rate of internal flow from region-1to region-2 need not equal the reverse rate of flow. Asstated before, the volumes and the dilution rates D1
and D2 may be arbitrarily different. Since there is athroughput now, we have three dilution rates: D1 andD2, as in batch operation, and a conventional externaldilution rate D = Q/V .
With reference to Fig 2, the flow rates and dilutionrates may be related by the expressions given ineqns (18)–(21):
D = QV
(18)
Q = Qr2 − Qr1 (19)
D1 = Qr1
V1(20)
D2 = Qr2
V2(21)
These equations are used in the mass balances ofthe two schematic reactors.
Reactor- 1
dx−1
dt= D1(x−
2 − x−1 ) + µ−
1 x−1 + pr1µ
+1 x+
1 (22)
dx+1
dt= D1(x+
2 − x+1 ) + (1 − pr1)µ
+1 x+
1 (23)
ds1
dt= D1(s2 − s1) − µ−
1 x−1
Y− − µ+1 x+
1
Y+ (24)
J Chem Technol Biotechnol 80:361–370 (2005) 363
VSRK Ganduri, S Ghosh, and PR Patnaik
Reactor- 2
dx−2
dt= D2(x−
1 − x−2 ) − D
(1 + V1
V2
)x−
1
+ µ−2 x−
2 + pr2µ+2 x+
2 (25)
dx+2
dt= D2(x+
1 − x+2 ) − D
(1 + V1
V2
)x+
1
+ (1 − pr2)µ+2 x+
2 (26)
ds2
dt= D2(s1 − s2) + D
(1 + V1
V2
)(sf − s1)
− µ−2 x−
2
Y− − µ+2 x+
2
Y+ (27)
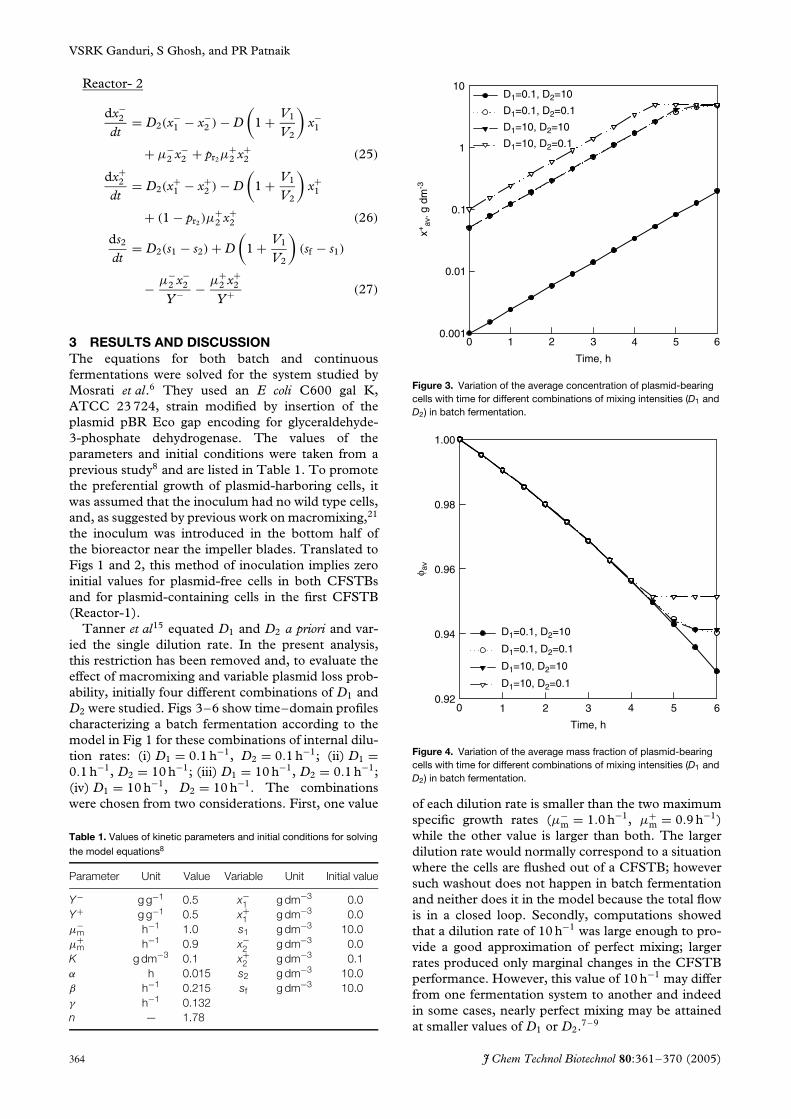
3 RESULTS AND DISCUSSIONThe equations for both batch and continuousfermentations were solved for the system studied byMosrati et al.6 They used an E coli C600 gal K,ATCC 23 724, strain modified by insertion of theplasmid pBR Eco gap encoding for glyceraldehyde-3-phosphate dehydrogenase. The values of theparameters and initial conditions were taken from aprevious study8 and are listed in Table 1. To promotethe preferential growth of plasmid-harboring cells, itwas assumed that the inoculum had no wild type cells,and, as suggested by previous work on macromixing,21
the inoculum was introduced in the bottom half ofthe bioreactor near the impeller blades. Translated toFigs 1 and 2, this method of inoculation implies zeroinitial values for plasmid-free cells in both CFSTBsand for plasmid-containing cells in the first CFSTB(Reactor-1).
Tanner et al15 equated D1 and D2 a priori and var-ied the single dilution rate. In the present analysis,this restriction has been removed and, to evaluate theeffect of macromixing and variable plasmid loss prob-ability, initially four different combinations of D1 andD2 were studied. Figs 3–6 show time–domain profilescharacterizing a batch fermentation according to themodel in Fig 1 for these combinations of internal dilu-tion rates: (i) D1 = 0.1 h−1, D2 = 0.1 h−1; (ii) D1 =0.1 h−1, D2 = 10 h−1; (iii) D1 = 10 h−1, D2 = 0.1 h−1;(iv) D1 = 10 h−1, D2 = 10 h−1. The combinationswere chosen from two considerations. First, one value
Table 1. Values of kinetic parameters and initial conditions for solving
the model equations8
Parameter Unit Value Variable Unit Initial value
Y− g g−1 0.5 x−1 g dm−3 0.0
Y+ g g−1 0.5 x+1 g dm−3 0.0
µ−m h−1 1.0 s1 g dm−3 10.0
µ+m h−1 0.9 x−
2 g dm−3 0.0K g dm−3 0.1 x+
2 g dm−3 0.1α h 0.015 s2 g dm−3 10.0β h−1 0.215 sf g dm−3 10.0γ h−1 0.132n — 1.78
Time, h
0 3 5
x+av
, g d
m-3
0.001
0.01
0.1
1
10D1=0.1, D2=10
D1=0.1, D2=0.1
D1=10, D2=10
D1=10, D2=0.1
1 2 4 6
Figure 3. Variation of the average concentration of plasmid-bearingcells with time for different combinations of mixing intensities (D1 andD2) in batch fermentation.
Time, h
0 2 4 60.92
0.94
0.96
0.98
1.00
D1=0.1, D2=10
D1=0.1, D2=0.1
D1=10, D2=10
D1=10, D2=0.1
φ av
1 3 5
Figure 4. Variation of the average mass fraction of plasmid-bearingcells with time for different combinations of mixing intensities (D1 andD2) in batch fermentation.
of each dilution rate is smaller than the two maximumspecific growth rates (µ−
m = 1.0 h−1, µ+m = 0.9 h−1)
while the other value is larger than both. The largerdilution rate would normally correspond to a situationwhere the cells are flushed out of a CFSTB; howeversuch washout does not happen in batch fermentationand neither does it in the model because the total flowis in a closed loop. Secondly, computations showedthat a dilution rate of 10 h−1 was large enough to pro-vide a good approximation of perfect mixing; largerrates produced only marginal changes in the CFSTBperformance. However, this value of 10 h−1 may differfrom one fermentation system to another and indeedin some cases, nearly perfect mixing may be attainedat smaller values of D1 or D2.7–9
364 J Chem Technol Biotechnol 80:361–370 (2005)

Improving the performance of fermentations with E coli
Time, h
0
p rav
0.000
0.002
0.004
0.006
0.008
0.010
D1=0.1, D2=10
D1=0.1, D2=0.1
D1=10, D2=10
D1=10, D2=0.1
1 2 3 4 5 6
Figure 5. Variation of the average plasmid loss probability with timefor different combinations of mixing intensities (D1 and D2) in batchfermentation.
Time, h
0 3 6
s av,
g d
m-3
0
2
4
6
8
10
D1=0.1, D2=10
D1=0.1, D2=0.1
D1=10, D2=10
D1=10, D2=0.1
1 2 4 5
Figure 6. Variation of the average substrate concentration with timefor different combinations of mixing intensities (D1 and D2) in batchfermentation.
Figure 3 shows that the average concentrationof plasmid-bearing cells (eqn (13)) increases withtime, whereas their mass fractions decrease (Fig 4);these trends are consistent with the expectation thatthe metabolic requirement of the foreign plasmidsslows down the growth rate of the host cells.Hence, their concentration increases more slowlythan that of plasmid-free cells, thus lowering themass fraction of recombinant cells as time progresses.It needs to be clarified that the same amountof inoculum (0.1 g dm−3 as mentioned in Table 1)was introduced for all combinations of D1 and D2.Different combinations of D1 and D2 then result indifferent spatially averaged values of x+ (according
to eqn (13)) at the start. Since this a consequence ofincomplete mixing, the differences between the plotsin Fig 3 are due to differences in fluid mixing ratherthan the starting concentrations. This interpretation issupported by Fig 4, where the average mass fractionof plasmid-harbouring cells at t = 0 is 1.0 for allcombinations of D1 and D2.
Both figures also reveal two other features. First,the changes in the concentration and the mass fractionof plasmid-bearing cells (as also of plasmid-free cells,not shown) are linear and with the same slope forall four combinations of D1 and D2. Secondly, apoorly mixed inoculated (D2 = 0.1 h−1) and a well-mixed non-inoculated region (D1 = 10 h−1) is morefavorable than the converse situation. More significantis the observation that this combination generatesmore growth and plasmid stability than in a bioreactorin which both regions (ie the entire broth) arewell-mixed (D1 = D2 = 10 h−1). For (D1 = 10 h−1,D2 = 0.1 h−1), the concentration as well as the massfraction stabilize after about 4.5 h whereas for othercombinations of mixing intensities the mass fractionsdecline even as the concentrations increase, implyingcontinuous segregational instability.
These trends are matched by the concentrationprofiles of the average plasmid loss probability(Fig 5) and the average substrate concentration(Fig 6). The best distribution of macromixing (D1 =10 h−1, D2 = 0.1 h−1) also results in the fastestdecline in the plasmid loss probability, implyinggreater segregational stability. Consequently, substrateutilization is also the most rapid for this case. Forthis kind of mixing, both profiles reach their minimaearliest (∼4.5 h into the fermentation), while the othersare still declining. An interesting feature of Figs 3–6is that when D1 = D2, the time–domain plots for anyvariable are coincident for all values of D1 and D2.This means that uniform mixing generates the sameaverage performance, regardless of how intense orsparse the mixing is. However, the performances inall these cases are inferior to that for [D1 = 10 h−1,D2 = 0.1 h−1]. Results beyond the limits 0.1 ≤ D1,D2 ≤ 10 h−1 have not been shown because there wereno significant changes outside the range.
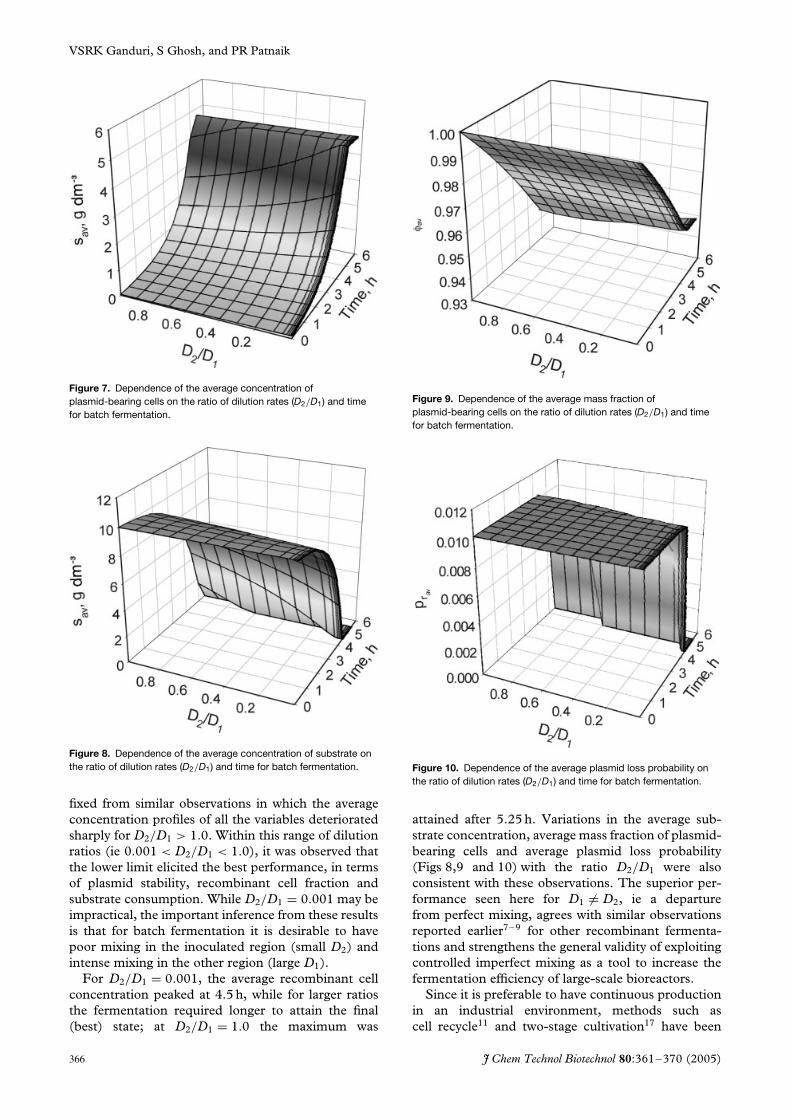
It may be noted that apart from differences in theindividual values of D1 and D2, the ratio of dilutionrates D2/D1 also differs among the four combinationspresented in Figs 3–6. In a recent study of poly-β-hydroxy butyric acid (PHB) synthesis using thesame macromixing model22 as here, it was seenthat the dilution ratio, D2/D1, rather than D1 orD2 alone determined the performance. Thereforethe effect of this ratio on the batch fermentationperformance was studied for 0.001 < D2/D1<1 andthe results are presented in the three-dimensional plotsof Figs 7–10, for the same variables as in Figs 3–6.The lower limit for the dilution ratio was set from thedetailed calculations for Figs 3–6, which showed thatbiomass concentration and other variables improve asD2/D1 decreases below 0.01. The upper limit was
J Chem Technol Biotechnol 80:361–370 (2005) 365
VSRK Ganduri, S Ghosh, and PR Patnaik
Figure 7. Dependence of the average concentration ofplasmid-bearing cells on the ratio of dilution rates (D2/D1) and timefor batch fermentation.
Figure 8. Dependence of the average concentration of substrate onthe ratio of dilution rates (D2/D1) and time for batch fermentation.
fixed from similar observations in which the averageconcentration profiles of all the variables deterioratedsharply for D2/D1 > 1.0. Within this range of dilutionratios (ie 0.001 < D2/D1 < 1.0), it was observed thatthe lower limit elicited the best performance, in termsof plasmid stability, recombinant cell fraction andsubstrate consumption. While D2/D1 = 0.001 may beimpractical, the important inference from these resultsis that for batch fermentation it is desirable to havepoor mixing in the inoculated region (small D2) andintense mixing in the other region (large D1).
For D2/D1 = 0.001, the average recombinant cellconcentration peaked at 4.5 h, while for larger ratiosthe fermentation required longer to attain the final(best) state; at D2/D1 = 1.0 the maximum was
Figure 9. Dependence of the average mass fraction ofplasmid-bearing cells on the ratio of dilution rates (D2/D1) and timefor batch fermentation.
Figure 10. Dependence of the average plasmid loss probability onthe ratio of dilution rates (D2/D1) and time for batch fermentation.
attained after 5.25 h. Variations in the average sub-strate concentration, average mass fraction of plasmid-bearing cells and average plasmid loss probability(Figs 8,9 and 10) with the ratio D2/D1 were alsoconsistent with these observations. The superior per-formance seen here for D1 �= D2, ie a departurefrom perfect mixing, agrees with similar observationsreported earlier7–9 for other recombinant fermenta-tions and strengthens the general validity of exploitingcontrolled imperfect mixing as a tool to increase thefermentation efficiency of large-scale bioreactors.
Since it is preferable to have continuous productionin an industrial environment, methods such ascell recycle11 and two-stage cultivation17 have been
366 J Chem Technol Biotechnol 80:361–370 (2005)

Improving the performance of fermentations with E coli
proposed to increase plasmid stability in continuousoperation in small fermentation vessels. Such methods,however, increase the cost as well as the difficultyof operation. Since controlled mixing improvedbatch fermentation, this method was investigated forcontinuous operation. Plasmid loss kinetics remainsthe same but the mixing model (Fig 2) and the massbalance equations [eqns (22)–(27)] are modified.Now there are three dilution rates, two internal(D1 and D2) and one overall external dilution rateD = Q/V , where V (= V1 + V2) is the total (constant)volume of broth in the vessel and Q is the overallthroughput rate. While D1 and D2 determine theintensity of mixing, D governs the availability ofsubstrate. Obviously D, D1 and D2 should be less thanthe overall specific growth rate (µ = 0.9 h−1) in orderto avoid washout. Investigation of the performanceacross a wide range of the dilution rates (0.1 ≤ D,D1, D2 ≤ 0.7 h−1) showed that the fermentation wassensitive to changes in the mixing intensity in theinoculated region (ie in D2) and in the overall dilutionrate D, but relatively insensitive to mixing in thenon-inoculated region (ie in D1). The insensitivity toD1 allows weak control of this region, while strongercontrol is required over D2 and D. Strong sensitivityto mixing in the inoculated region and the overalldilution rate are physically plausible since fermentationbegins in the inoculated region, while D determinesthe availability of substrate and thus the course offermentation. Because D has a strong influence,the substrate feed rate is commonly employed as amanipulated variable for the control of continuousflow bioreactors.23,24
Unlike batch operation, continuous fermentationsdepend on the rate of supply of substrate, expressedthrough the external dilution rate D. So theperformance for different combinations of mixingintensities, ie D1 and D2, was determined at differentvalues of D in the range [0.1–0.7 h−1]. These resultssuggest two inferences. The first is that at low values ofD(∼0.1 h−1), D2 has little effect on the fermentation,but this effect increases with D and becomes significantfor D > 0.5 h−1. In other words, at low dilution ratesthe extent of mixing in the lower (inoculated) regionof the bioreactor may be chosen freely, but not sofor larger dilution rates. Secondly, the terminationtime, identified as the time when the concentration ofthe substrate or of the plasmid-bearing cells becomestoo small to sustain the fermentation, decreased from5.8 h to 2.0 h when D was increased from 0.1 h−1 to0.7 h−1. A low dilution rate, ie a low throughput rate,not only allows the fermentation to last longer but alsogenerates higher values for the concentration and massfraction of plasmid-bearing cells.
Exploration of the performance over feasibleranges of D, D1 and D2 showed that a lowvalue of D favored a high concentration and massfraction of plasmid-bearing cells, with correspondinglylarge consumption of substrate (Fig 11). So theperformance at D = 0.1 h−1 was computed in detail
for 0.1 ≤ D1, D2 ≤ 0.7 h−1. The rationale for theranges of D1 and D2 has already been explained.As the fermentation progressed, the generation andstability of recombinant cells were maximized bymaintaining D2 = 0.1 h−1 at all times but controllingD1 at different optimum values. These maxima andthe corresponding values of D1 are plotted in Figs 12and 13 from the start to the end of the fermentationat 5.8 h. The direction of movement with time isshown by the arrows next to the plots. It is seen thatuntil about 4 h there is little change in the optimalD1; beyond this time D1, ie the degree of mixingin the non-inoculated region, should be reducedcontinuously until the fermentation time. This is anovel departure from the conventional practice ofmaintaining a constant degree of mixing at all times.A constant D2 and a variable D1 may be realizedin practice but sparging inert gas into the uppernon-inoculated region. While stirring provides mixingcorresponding to D1 = D2 = 0.1 h−1, gas sparging inthe upper region increases the level of mixing here,which may be changed by regulating the pressureand flow rate of the gas. Sparging may be used inconjunction with other methods such as stirrer designand appropriate positioning of baffles.
It is reasonable to ask why an optimal degree ofmacromixing should generate a better performancethan complete mixing or complete segregation. Twopossible effects of incomplete mixing may explain thepresent observations. First, complete mixing makesthe nutrients freely accessible to all cells through-out the broth. Then the natural metabolic advantagesof plasmid-free cells12,21 enable them to prevail overplasmid-containing cells. Too little mixing makesthe fluid elements so strongly segregated that thesubstrate(s) consumed at different locations is notreplenished fast enough. Both extremes of mixing aretherefore unfavorable to recombinant cells and proteinsynthesis.
The second effect of macromixing is on theproduction and distribution of acetate. In themechanism postulated by Boudrant and coworkers,5,6
acetate is a product as well as a reactant. Althoughacetate inhibits cell growth, it replaces glucose as thecarbon source when the concentration of the latter istoo small. So, when mixing is complete and there issufficient glucose, acetate plays an inhibitory role. In apoorly mixed broth, acetate is an inhibitor in localizedregions with high glucose concentrations and it is acarbon substrate in glucose-depleted regions. The keyto a successful fermentation is therefore to create sucha distribution of these regions that neither glucosenor acetate dominates in the broth as a whole. Thisrequirement translates to an optimal distribution ofmixing intensity.
4 CONCLUSIONSMacromixing in large batch and continuous flowbioreactors is often incomplete. This may be modeled
J Chem Technol Biotechnol 80:361–370 (2005) 367

VSRK Ganduri, S Ghosh, and PR Patnaik
Time, h
20 1 3 4 5 60.000
p r
0.002
0.004
0.006
0.008
0.010
0.012
(d)
S, g
dm
-3
Time, h
20 1 3 4 5 60
2
4
6
8
10
(c)
X+, g
dm
-3
0
1
2
3
4
5
Time, h
20 1 3 4 5 6
(a)
Time, h
20 1 3 4 5 60.93
0.94
0.95
0.96
0.97
0.98
0.99
1.00
(b)
φ
D1 = 10, D2 = 0.001, D = 0.1
D1 = 10, D2 = 0.001, D = 0.05
D1 = 10, D2 = 0.001, D = 0 (batch)
Figure 11. Comparison of the effect of internal dilution rates (D1 and D2) and an overall dilution rate (D) on (a) the concentration of plasmid-bearingcells, (b) their mass fraction, (c) the concentration of substrate and (d) the plasmid loss probability for different feasible values of D. All dilution ratesare in reciprocal hours.
by means of two CFSTBs with interconnecting flowsin a closed loop. Each CFSTB represents a mixedregion in the bioreactor, and the degree of mixing ineach region is expressed through its internal dilutionrate. This model was applied to a fermentation byE coli C600 gal K containing the plasmid pBR Ecogap, whose plasmid loss probability varies nonlinearlywith the specific growth rate. The recombinantproduct is glyceraldehyde-3-phosphate dehydrogenase(GAPDH).
A pure culture containing only plasmid-bearing cellswas introduced as the inoculum. A kinetic model withvariable plasmid loss probability proposed by Nancibet al5 was inserted into the mass balance equationsof each CFSTB, which were then solved to obtainperformance curves of relevant variables until the endof fermentation. Different combinations of the internal
dilution rates D1 and D2 and also their ratio werestudied to cover poor and good mixing in each region.For continuous fermentation, the overall dilution rateD was also considered and varied from 0.1 h−1 to0.7 h−1 to understand its effect on the performance.
The results of batch fermentation indicate that highconcentrations of plasmid-bearing cells are achievedwhen the inoculated (lower) region is poorly mixedand the non-inoculated (upper) region is well mixed.It was also observed that the final (peak) concentrationof plasmid-bearing cells depended on the ratio D2/D1
rather than on their individual values. By varying thisratio between 0.001 and 1.0, a high concentration(4.85 g dm−3) and mass fraction (0.95) of plasmid-bearing cells were obtained at D2/D1 = 0.001.
In continuous fermentation, a low value (0.1 h−1)of both the overall dilution rate and the dilution
368 J Chem Technol Biotechnol 80:361–370 (2005)

Improving the performance of fermentations with E coli
D1, h-1
0.1 0.3 0.5 0.7
x+ m
ax, g
dm
-3
0
1
2
3
4
5
t=1 h2 h
3 h
4 h
5 h
5.8 h
Figure 12. Trajectory of the maximum concentration ofplasmid-bearing cells and corresponding optimum values of D1 ascontinuous fermentation progresses. D = D2 = 0.1 h−1 and at 5.8 hthe fermentation ceases to be sustainable.
D1, h-1
0.1 0.3 0.5 0.7
φ max
0.93
0.94
0.95
0.96
0.97
0.98
0.99
1.00
t=1 h
2 h
3 h
5.8 h
5 h
4 h
Figure 13. Trajectory of the maximum mass fraction ofplasmid-bearing cells and corresponding optimum values of D1 ascontinuous fermentation progresses. D = D2 = 0.1 h−1 and at 5.8 hthe fermentation ceases to be sustainable.
rate in the inoculated region favored the concentra-tion of plasmid-bearing cells, their mass fraction andthe consumption of substrate; the performance wasinsensitive to the dilution rate in the non-inoculatedregion (D1 = 0.1–0.7 h−1), thus allowing mixing hereto be uncontrolled or weakly controlled. Althoughthere were significant differences between the resultsof batch and continuous fermentations, both modesof operation generated the best performances, as indi-cated by plasmid stability and substrate consumption,when the broth was partially mixed and the degrees of
macromixing in the two regions were unequal. Theseobservations may be explained in terms of the relativegrowth rates of plasmid-free and plasmid-containingcells, and the roles of glucose and acetate in themechanism of cell growth.
The results obtained here indicate that for arecombinant fermentation with variable plasmidloss probability, perfect mixing is not necessarilya good choice. Controlled, segregated and time-dependent incomplete mixing is better. Similarobservations reported earlier for a constant plasmidloss probability suggest that, in general, imperfectmixing is desirable for both batch and continuousrecombinant fermentations. This is in contrast with theconventional concept of promoting complete mixing.Therefore, for enhanced plasmid stability and bettergrowth of cells, this natural feature of large bioreactorsmay be utilized in a controlled manner rather thandevising methods to approximate perfect mixing.
REFERENCES1 Imanaka T and Aiba S, A perspective on the application of
genetic engineering: stability of recombinant plasmid. AnnNY Acad Sci 369:1–4 (1981).
2 Kim SH and Ryu DDY, Instability kinetics of trp operonplasmid colel-trp in recombinant Escherichia coli: MV12(pVH5) and MV12 tr R (pVH5). Biotechnol Bioeng26:497–502 (1984).
3 Lauffenburger DA, Stability of colicin plasmids in continuousculture: mathematical model analysis. Biotechnol Prog 1:53–59(1985).
4 Noack D, Muller G and Roth M, Mathematical modelingof genetic segregational kinetics obtained with chemostatcultures of prokaryotic microorganisms. Z Allg Mikrobiol24:459–465 (1985).
5 Nancib N, Mosrati R and Boudrant J, Study of populationdynamics for a recombinant bacterium during continuouscultures: application of data filtering and smoothing.Biotechnol Bioeng 39:398–407 (1992).
6 Mosrati R, Nancib N and Boudrant J, Variation and modelingof the probability of plasmid loss as a function of growth rateof plasmid-bearing cells of Escherichia coli during continuouscultures. Biotechnol Bioeng 41:395–404 (1993).
7 Patnaik PR, Incomplete mixing in large bioreactors- a studyof its role in the fermentative production of streptokinase.Bioprocess Eng 14:91–96 (1996).
8 Patnaik PR, Influence of macromixing on plasmid stabilityduring batch fermentation with recombinant bacteria. IndJ Chem Technol 4:291–297 (1997).
9 Patnaik PR, On the improvement of bacterial growth oncomplementary substrates by partial segregation in the broth.J Chem Technol Biotechnol 75:229–236 (2000).
10 Ganusov VV and Brilkov AV, Estimating the instability param-eters of plasmid-bearing cells. I. Chemostat cultures. J TheorBiol 219:193–205 (2002).
11 Stephens ML and Lyberatos G, Effect of cycling on the stabilityof plasmid-bearing microorganisms in continuous culture.Biotechnol Bioeng 31:464–469 (1988).
12 Lee SB, Ryu DDY, Siegel R and Park SH, Performance ofrecombinant fermentation and evaluation of gene expressionefficiency for gene product in two-stage continuous culturesystem. Biotechnol Bioeng 31:805–820 (1988).
13 Syamsu K, Impoolsup A, Greenfield PF and Mitchell DA,Data analysis of plasmid stability in continuous cultureof recombinant Saccharomyces cerevesiae Biotechnol Tech6:393–398 (1992).
J Chem Technol Biotechnol 80:361–370 (2005) 369
VSRK Ganduri, S Ghosh, and PR Patnaik
14 Satyagal VN and Agrawal P, A generalized model of plasmidreplication. Biotechnol Bioeng 33:1135–1144 (1989).
15 Tanner RD, Dunn IJ, Bourne JR and Klu MK, The effect ofimperfect mixing on idealised kinetic fermentation model.Chem Eng Sci 40:1213–1219 (1985).
16 Nancib N, Mosrati R and Boudrant J, Modeling of batchfermentation of a recombinant Escherichia coli producingglyceraldehyde-3-phosphate dehydrogenase on a complexselective medium. Chem Eng J 52:B35–B48 (1993).
17 Siegel R and Ryu DD, Kinetic study of instability of recombi-nant plasmid pPLc23trpAI in E. coli using two-stage contin-uous culture system. Biotechnol Bioeng 27:28–33 (1985).
18 Park SH and Ryu DDY, Effects of operating parameters onTrp A productivity and performance of a recombinantfermentation process in a two-stage continuous fermentation.Biotechnol Bioeng 35:287–295 (1989).
19 Impulsup A, Caunt P and Greenfield PF, Effect of growth rateon stability of a recombinant plasmid during continuous
culture of Saccharomyces cerevesiae in non-selective medium.J Biotechnol 10:171–180 (1989).
20 Weber AE and San KY, Enhanced plasmid maintenance in aCSTR upon square-wave perturbations in the dilution rate.Biotechnol Lett 10:531–536 (1988).
21 Mayr B, Haorvat P and Moser A, Engineering approachto mixing quantification in bioreactors. Bioprocess Eng8:137–143 (1992).
22 Ganduri VSRK, Ghosh S and Patnaik PR, Mixing control as adevice to increase PHB production in batch fermentationswith co-cultures of Lactobacillus delbrueckii and Ralstoniaeutropha. Process Biochem 40:257–264 (2005).
23 Dochani D and Perrier M, Dynamic modeling, analysis,monitoring and control design for nonlinear bioprocesses.Adv Biochem Eng/Biotechnol 56:147–197 (1997).
24 Henson MA and Seborg DE, Nonlinear control strategies forcontinuous fermentors. Chem Eng Sci 47:821–835 (1992).
370 J Chem Technol Biotechnol 80:361–370 (2005)