opportunities through value creations from low value fish for ...
59
P.O. Box 1390, Skulagata 4 120 Reykjavik, Iceland Final Project 2010 Prepared By: Zakaria Bin Ali Fisheries Development Authority of Malaysia [email protected] Supervisor: Mr. Helgi Gestsson Professor, University of Akureyri Iceland [email protected] Dr. Ögmundur Knútsson Professor, University of Akureyri Iceland [email protected] Abstract The project tried to discover opportunities for value creation from low value short mackerel (Rastrelliger brachysoma) using dried/salted and salted methods which will be introduce to FOMBEs in Malaysia. The systematic Stage-Gate model procedure was used as a tool to select the best species from the available low value fish in Malaysia for the production method of FOMBEs. The decisions to select the best species was apply by using the ABC analysis and weighted matrix with specified criteria and the highest scores will be the selected species to be implemented by FOMBEs. To find the feasibility of the project, the profitability model was used along the planning horizon of 10 years. The results show that FOMBEs are able to gain more than 20% from the investment of equity along the planning horizon, but the project is sensitive to the sales price, sales quantity and the variable cost. Application of knowledge in fish processing and financial prudence will have to be coordinated before profits can be realised. The formation of FOMBEs will create employment opportunities for rural coastal fishermen communities in Malaysia. It is a great opportunity for the Malaysian fisheries sector to form FOMBEs among the fisherman family to maximise the available resources from low value fish. Fisheries Development Authority of Malaysia (FDAM) can provide the technical assistance to structure the future FOMBEs. With the available financial assistance from the Malaysian government for Small and Medium Enterprises (SMEs) and low interest rate, FOMBEs may take advantage of capitalising on producing a quality product from low value fish. OPPORTUNITIES THROUGH VALUE CREATIONS FROM LOW VALUE FISH FOR FAMILY OWNED MICRO-BUSINESS ENTERPRISES IN WEST MALAYSIA
-
Upload
khangminh22 -
Category
Documents
-
view
0 -
download
0
Transcript of opportunities through value creations from low value fish for ...

P.O. Box 1390, Skulagata 4
120 Reykjavik, Iceland Final Project 2010
Prepared By:
Zakaria Bin Ali Fisheries Development Authority of Malaysia
Supervisor:
Mr. Helgi Gestsson
Professor, University of Akureyri
Iceland
Dr. Ögmundur Knútsson
Professor, University of Akureyri
Iceland
Abstract The project tried to discover opportunities for value creation from low value short mackerel
(Rastrelliger brachysoma) using dried/salted and salted methods which will be introduce to
FOMBEs in Malaysia. The systematic Stage-Gate model procedure was used as a tool to
select the best species from the available low value fish in Malaysia for the production
method of FOMBEs. The decisions to select the best species was apply by using the ABC
analysis and weighted matrix with specified criteria and the highest scores will be the selected
species to be implemented by FOMBEs. To find the feasibility of the project, the profitability
model was used along the planning horizon of 10 years. The results show that FOMBEs are
able to gain more than 20% from the investment of equity along the planning horizon, but the
project is sensitive to the sales price, sales quantity and the variable cost. Application of
knowledge in fish processing and financial prudence will have to be coordinated before
profits can be realised. The formation of FOMBEs will create employment opportunities for
rural coastal fishermen communities in Malaysia. It is a great opportunity for the Malaysian
fisheries sector to form FOMBEs among the fisherman family to maximise the available
resources from low value fish. Fisheries Development Authority of Malaysia (FDAM) can
provide the technical assistance to structure the future FOMBEs. With the available financial
assistance from the Malaysian government for Small and Medium Enterprises (SMEs) and
low interest rate, FOMBEs may take advantage of capitalising on producing a quality product
from low value fish.
OPPORTUNITIES THROUGH VALUE CREATIONS FROM LOW
VALUE FISH FOR FAMILY OWNED MICRO-BUSINESS ENTERPRISES
IN WEST MALAYSIA

Bin Ali
2
UNU-Fisheries Training Programme
TABLE OF CONTENTS
1. Introduction ............................................................................................................ 4
2. Background ............................................................................................................. 6
2.1. Overview of Malaysia ..................................................................................... 6
2.2. Malaysian fisheries .......................................................................................... 7
3. Literature review ................................................................................................... 10
3.1. Small and medium enterprises ...................................................................... 10
3.2. Low value fish ............................................................................................... 12
3.3. Processing Methods ....................................................................................... 13
3.4. Prospects for low value fish .......................................................................... 15
3.5. New product investment and profitability analysis ....................................... 18
4. Project Analysis .................................................................................................... 20
4.1. Ideation .......................................................................................................... 20
4.2. Gate 1: Initial screening ................................................................................ 22
4.3. Stage 1: Preliminary investigation ................................................................ 25
4.4. Gate 2: Second screening .............................................................................. 29
4.5. Stage 2: Detailed investigation ...................................................................... 29
4.6. Profitability analysis ...................................................................................... 34
5. DISCUSSION ....................................................................................................... 40
6. CONCLUSIONS AND RECOMMENDATIONS ............................................... 42
LIST OF REFERENCES ............................................................................................. 45
APPENDICES ............................................................................................................. 50
Appendix 1: Quantity (metric tonnes) of landings of marine fish by states and fishing
gears in West Malaysia, 2009 ...................................................................................... 50
Appendix 2:Quantity (metric tonnes) of landings of major marine capture fisheries by
fishing gear group and species in West Malaysia, 2009 (DOF 2009) ......................... 51
Appendix 3: Average ex-vessel price (Malaysian Ringgit) per kilogram of fish by
species from marine capture fisheries, Peninsula Malaysia 2009 (DOF 2009) ........... 52
Appendix 4: Processed product from marine capture fisheries, Peninsula Malaysia ,
2000-2009 (metric tonnes) ........................................................................................... 53
Appendix 5: Disposition of Malaysian capture fisheries according to species ........... 54
Appendix 6: Assessments of species alternatives ........................................................ 55
Appendix 7: Weighting of species (Assessments criteria x Criteria weight) .............. 56
Appendix 8: FOMBEs investment cost summary for production of mixed product
dried/salted and salted short mackerel ......................................................................... 57
Appendix 9: FOMBEs fixed cost and variable cost summary for production of mixed
product dried/salted and salted short mackerel ............................................................ 58
Appendix 10: Profitability Assessment Model ............................................................ 59

Bin Ali
3
UNU-Fisheries Training Programme
LIST OF TABLES
Table 1 : Contribution of the Malaysian fisheries sector 2000 - 2009 ........................... 7
Table 2 : Species of Fish and Grades in Malaysia (Modified from DOF, 2009) ........... 7
Table 3 : Utilization of West Malaysian capture fisheries 2000 - 2009 ........................ 8
Table 4: Malaysian micro, small and medium enterprises by sectors ......................... 11
Table 5 : IMPACT fisheries commodity categories and component ........................... 13
Table 6 : Attributes for fisheries products (Modified and adapted from Caswell
(2006)) .......................................................................................................................... 16
Table 7: Three species EBIT calculation for FOMBEs ............................................... 26
Table 8 : Effective price margin in RM ....................................................................... 27
Table 9 : Second screening for FOMBEs .................................................................... 29
Table 10 : EBIT for processed products ...................................................................... 31
Table 11: The financial requirement for FOMBEs ...................................................... 32
Table 12 : Financial rates and assumptions ................................................................. 34
Table 13 : FOMBEs – Assumtions and results ............................................................ 34
Table 14 : FOMBEs - Operations statement ................................................................ 35
Table 15 : FOMBEs - Balance sheet ............................................................................ 36
Table 16 : FOMBEs - Investment and financing ......................................................... 36
Table 17 : FOMBEs - Cash flow statement ................................................................. 37
Table 18 : FOMBEs - Profitabality statement ............................................................. 37
Table 19 : FOMBEs impact analysis in sales price, sales quantity and variable cost . 38
LIST OF FIGURES
Figure 1 : Map of Malaysia (World Fact Book 2010) ................................................... 6
Figure 2 : Total Landing of Fish in West Malaysia by Grades ...................................... 8
Figure 3: Stage-gate model (Cooper 1997) .................................................................. 18
Figure 4 : Short mackerel (Rastrelliger brachysoma) .................................................. 30
Figure 5: Perlis, West Malaysia the proposed site selection ........................................ 31
Figure 6 : FOMBEs impact analysis on IRR and equity ............................................. 38

Bin Ali
4
UNU-Fisheries Training Programme
1. INTRODUCTION
The Malaysian fisheries sector plays an important role supplying protein as a source
of food and providing employment for more than 125,000 fishermen (DOF 2009).
The Fisheries Development Authority of Malaysia (FDAM) and the Department of
Fisheries (DOF) are the government agencies responsible for providing assistance to
fishermen communities in terms of social development and technical assistance to
foster the growth of the fisheries sector. The Ministry of Agriculture and Agro-Based
Industry (MOA) in Malaysia and its relevant authorities like MARDI (Malaysian
Agriculture Research and Development Institution) provide assistance to the small
and medium enterprises (SMEs) of the agriculture and fisheries sector to enhance the
income and employment among rural fishermen communities. In 2009, Malaysia
harvested 1.4 MT (Million Tonnes) of marine fisheries valued at 6.3 billion RM1
(DOF, 2009). A large proportion of the volume of fish landed in Malaysia is of
relatively low value. Family owned micro-business enterprises (FOMBEs) can
develop value adding processed products from low value catches such as diverse
dried, salted and smoked products.
The aim of this project is to study the opportunities for FOMBEs to increase value
creations of low value marine fish landed in West Malaysia. This can create
employment opportunities, social improvement for the rural fishermen communities
and help fulfil the demand for protein. The purpose of this study is to discover good
opportunities for value creation of low value fish products and establish convenient
methods which would be introduced to FOMBEs in Malaysia answering the question:
What opportunities and methods of value addition can be introduced to FOMBEs in
Malaysia for profitable production from low value fish?
The expected outcomes from this study are:
i. To introduce opportunities for FOMBEs for the creation of employment
opportunities for rural fishermen communities in Malaysia.
ii. To select a particular species of low value fish harvested in Malaysia that can
be processed economically.
iii. To select a suitable method of production for adding value to the low value
fisheries value chain.
iv. To estimate the profitability of the operations of FOMBEs producing products
from low value fish.
1 RM-Ringgit Malaysia (Malaysia currency)

Bin Ali
5
UNU-Fisheries Training Programme
The objective of this project is to suggest a profitable operating structure for micro
business FOMBEs owned by the coastal fishermen and their families.
In this paper both primary and secondary data and information on specific aspects of
value creations in Malaysian fisheries are analysed. The information was collected by
reviewing both print and electronic documents from research publications (library and
on-line reprints and databases), journals and by interviews conducted in Iceland.
Calculations of assumptions and financial measurements are used to evaluate the
feasibility of the project of establishing a FOMBE owned by fishermen and their
families processing products from low value fish. Small and medium enterprises in
Iceland producing dried, salted and smoked fish will be visited and their managers
interviewed.
A Stage-Gate process will be applied to screen the process at every gate in order to
identify feasible options of business for the FOMBEs. At the gates either go or kill
decisions have to be used.
In the paper an ABC analysis method will be used. This method estimates different
levels of significance. It is a form of Pareto analysis. Grade II and III species, suitable
for salting, smoking or drying, are grouped into A, B and C categories according to
the lowest average ex vessel price. The project then analyses the 10 groups of low
value A species chosen.
A product development decisional process, The Stage-Gate Model, is used for
structuring the decisions needed. Two decisional gates are used. A weighted
importance matrix is then used for differentiating among the 10 species at gate one by
assigning weights to importance criteria used. At gate two the 10 species are cut down
to three. These criteria are awarded scores from 10 down to 1 and the weights and the
scores multiplied giving a weighted score that is used for choosing the most important
species to work with.
A profitability analysis model is then used to assess the feasibility of establishing a
FOMBE processing 200 kg of fish each day for 200 working days a year. A
sensitivity analysis is also conducted to estimate the changes in profitability for the
FOMBE if sales, variable cost and cost of equipment would change from the
assumptions of the model.
The justification for the author for starting this work is that information from the
Malaysian fisheries statistics has shown that there are great opportunities for existing
entrepreneurs and future FOMBEs among fishermen and their families. People are
ready to identify the business opportunities in transforming low value fish into value
added products.
In order for FOMBESs in Malaysia to be able to export value added fishery products
to demanding foreign markets, the industry has to acquire the necessary skills to
process high quality food for consumption and to fully meet all the standard
requirements of food safety.

Bin Ali
6
UNU-Fisheries Training Programme
2. BACKGROUND
2.1. Overview of Malaysia
Malaysia is located in the South East Asian region, bordering Thailand in the north
and Singapore on the southern tip (figure 1). It is situated at the coordinates of 2°30'
north and 112°30' east. Malaysia gained its independence from the British in 1957.
The capital city is Kuala Lumpur and the administrative centre is at Putra Jaya. The
total population is about 28.3 million (World Fact Book 2010).
Figure 1 : Map of Malaysia (World Fact Book 2010)
Total area of the mainland is about 329,847 km² with a coastline of 4,675 km. The
territorial sea of Malaysia is 12 nautical miles. The EEZ2 of the Malaysian sea is 200
nautical miles from the shore line. The country is located at a very strategic location
along the busiest straits in the world which are the Straits of Malacca along the west
coast and the South China Sea in the east (World Fact Book 2010).
At present Malaysia is diversifying its economy, moving from export of raw materials
to expansion into the multi-sector economy of manufacturing, services and tourism
and shifting to knowledge-based technology. The government has encouraged private
sectors and investors to invest through foreign direct investment in value added
production chains in the high technology industries. The main export commodities are
electronic equipment, petroleum, liquid natural gas, wood and woods products, palm
oil, rubber, textiles and chemicals. In 2009 the per capita GDP was $13, 800 USD and
the annual growth rate was negative by 2.3% compared to + 4.6% in 2008 (World
Bank 2010). Malaysia has a labour force of 11.38 million (40.2%) from a total
2 EEZ-economic exclusion zone

Bin Ali
7
UNU-Fisheries Training Programme
population of about 28.3 million with an unemployment rate of 3.7%. The most
common occupations are in services (51%), industry (36%) and agriculture (13%)
(World Fact Book 2010).
2.2. Malaysian fisheries
Fish contributes about two-thirds of all protein consumed in the country. In 2009, the
fisheries sector for all of Malaysia contributed 1.3% to the GDP and employed about
4.3% of the population. More than 90% of the fisheries production is from marine
capture fisheries. Landing quantity ranging from 1.3 MT3 in 2000 to 1.4 MT in 2009
(Table 1). From the total landings 82% are captured from inshore and 18% from deep
sea (DOF 2000; DOF 2001; DOF 2009).
Table 1 : Contribution of the Malaysian fisheries sector 2000 - 2009
Years 2000 2001 2002 2003 2004 2005 2006 2007 2008 2009
Capture Fisheries (MT) 1.29 1.23 1.27 1.29 1.54 1.21 1.40 1.38 1.39 1.39
Aquaculture (MT) 0.12 0.14 0.15 0.15 0.20 0.21 0.21 0.27 0.35 0.47
Total Production (MT) 1.41 1.37 1.42 1.44 1.74 1.42 1.61 1.65 1.74 1.86
Value (RM billion) 5.37 5.45 5.41 5.31 5.50 4.30 6.26 6.43 7.37 8.60
GDP (%) 1.60 1.50 1.50 1.40 1.70 1.30 1.10 1.20 1.20 1.30
There were 125,632 local fishermen and 34,520 foreign fishermen working on 48,745
fishing vessels in 2009, excluding other workforce directly or indirectly involved in
the upstream and downstream activities in the fisheries industry (DOF 2009). The
marine capture fisheries catch landed in Malaysia is categorized into grade I, grade II
and grade III according to the value of the fish. The definitions for fish grades are
shown in Table 2. The grade I is normally caught by fishing gears like long lines, gill
nets, fish traps and from daily trips of trawlers and purse seine vessels. Generally the
duration of a trawling operation trip is between four to six days.
Table 2 : Species of fish and grades in Malaysia (Modified from DOF 2009) Average Ex-Vessel
Price Range (RM) Species
Grade I Price: RM10.00 and above
Size: > 600 gm and above
Chinese Pomfret, Silver Pomfret, Black Pomfret,
Large Threadfin, Spanish Mackerel, Wolf Herring,
Grouper, Mangrove Snapper, Red Snapper and Sea
Bass.
Grade II Price: RM5.00 – RM9.99
Size: 6 – 8 pieces per kilogram
Longtail Shad, Shads/Slender Shads, Red Snapper,
Sweetlip, Horse Mackerel, Indian Mackerel and Giant
Sea Perch, Medium Threadfin, Neritic Tuna and other
medium pelagic and demersal species.
Grade III Price: RM4.99 and below
Size: > 8 pieces per kilogram Small Sting Ray, Sharks, Ribbon fish, Large Head
Hairtail, Short Mackerel, Sardines, Scads, Croaker,
Anchovy and other small pelagic and demersal
species.
Grade II and III fish are considered as low commercial value fish. This makes up
more than 80% of the total landings in West Malaysia, mostly from commercial
trawlers and purse seiners consisting of small size pelagic fin fish and demersal
3 MT- million tonnes

Bin Ali
8
UNU-Fisheries Training Programme
species. One of the issues of the Malaysian fisheries is the high volume landings of
low commercial value from fish purse seiners and the by-catch from trawlers. This
can be seen from the total landings of marine capture fisheries in West Malaysia
(excluding trash fish, crustaceans and shell fish) according to grades as shown in
figure 2 (DOF 2000; DOF 2001; DOF 2009).
Figure 2 : Total landing of fish in West Malaysia by grades
The low commercial value fish can be utilised as fresh fish for direct human
consumption, as a processed product for value addition, and as animal feed or oil. In
2009 (Table 3) the most common method of utilisation from Malaysian fisheries
(63%) was the consumption of mostly fresh fish; 29% was utilised as fish meal or
feed for animals and only 8% was processed for human consumption as value added
products (DOF 2000-2009).
Table 3 : Utilization of West Malaysian capture fisheries 2000 - 2009
Disposition 2000 2001 2002 2003 2004 2005 2006 2007 2008 2009
Fresh 648,435 586,346 607,169 571,705 607,169 595,748 737,149 710,697 734,605 672,651
Frozen 5,100 5,360 3,497 3,653 3,497 5,886 3,310 15,150 6,382 10,410
Dried/Salted/
Smoke 39,496 35,082 38,893 41,420 38,893 20,136 23,501 18,892 33,110 31,928
Steamed/Boiled 1,900 2,413 2,925 3,253 2,925 4,800 4,811 4,371 3,932 5,951
Fermented 11,203 11,220 8,882 13,110 8,882 6,985 90,839 14,316 28,806 31,830
Fish meal/feed mill 170,807 183,859 206,529 196,392 206,529 112,178 154,563 161,293 143,010 211,682
Others 40,933 47,712 81,207 90,821 81,207 98,806 93,887 104,376 105,444 99,971
Total 919,874 873,993 951,104 922,357 951,106 846,544 1,110,066 1,031,102 1,057,297 1,066,432
N.B.: Including trash fish.
The major commercial fishing gears used in Malaysia are trawls and purse seine nets.
Other fishing gears used are gill nets, fish traps, long lines, anchovy purse seines and
small trawls. The by-catches (small pelagic fish and demersal fish) from trawlers and
purse seiners are not discarded. They are landed and considered as grade III product.
A survey conducted in Malaysian waters in 2004 showed that only 12% of the total
0
100
200
300
400
500
600
700
2000 2001 2002 2003 2004 2005 2006 2007 2008 2009
Tho
usa
nd
s M
T
Grade I
Grade II
Grade III

Bin Ali
9
UNU-Fisheries Training Programme
catch is grade I and II fish, 10% is high value jelly fish and the rest, 78% is the low
value grade III fish (Mohammad Samauna Safa 2004). For small enterprises among
the fisher community this offers great opportunities to create and add value to that low
value by-catch.

Bin Ali
10
UNU-Fisheries Training Programme
3. LITERATURE REVIEW
3.1. Small and medium enterprises
Small and medium enterprises (SMEs) have unique advantages compared to bigger
companies often due to fewer layers in the hierarchy and departments and less internal
organisational barriers. The only barriers for SMEs starting a strategic alliance with
bigger companies are the limited accessibility of resources such as capital, knowledge
and time. According to Knútsson (2001) the following five factors can explain
efficiency differences between large and small companies:
The organisation culture for a small company is based on lean and informal
enterprise characteristics, compared to large companies that have more formal
hierarchy, bureaucracy and formalities
The decision making process is very fast for small companies and can be
easily done at the workplace. While large companies possess slow decision-
making and they have to go through many levels until the top level will finally
make the decisions
The management style of small companies is based on strong leadership and
spontaneous response. For bigger companies it is a traditional mechanism style
of management.
The different capabilities to change. Small companies are able to adapt quickly
to changes by using innovation compared to bigger companies that change
slowly due to their size.
The different style in decision making. The management of partnership of
small business allows the top manager responsible to have the authority for
making decisions compared to bigger companies, where middle managers
would be responsible and could not make decisions themselves.
SMEs act as a catalyst to industry. SMEs do business with big companies and are
through that interlinked to agriculture, manufacturing and other related services.
There are many small and medium enterprises that are involved in the bigger sectors
and subsectors providing employment to the population. Medium size business
employs 20 or more but fewer than 200 people (Price Waterhouse Coopers 2007).
Small firms or organisations, often owner managed and with fewer than 50
employees, are considered small businesses (QFinance 2010). The Australian Bureau
of Statistics (ABS) defines small businesses as companies that employ fewer than 20
people. They also included in their definition non-employing businesses, both sole
proprietorships and partnerships without employees. Micro-businesses can be defined
as an owner-operated business with few employees and a turnover of less than
$250,000 (Viewpoint Banks 2010). These types of businesses can also be considered
as very small commercial activities with fewer than 6 employees and limited access or
no access to source of capital (Encarta 2010).
In Malaysia there are differences between micro enterprises, small enterprises and
medium enterprises in various sectors (Table 4). Micro-business or micro-enterprises
in the Malaysian agriculture sector is defined as an enterprise with sales turnover of
less than RM 200,000 or full time employees of fewer than five. For small enterprises
the sales turnover is in the range of RM 200,000 to RM 1.0 million or full time
employees between five and 19. Medium enterprises have sales turnover of RM 1.0

Bin Ali
11
UNU-Fisheries Training Programme
million and RM 5.0 million and full time employees between 20 and 50 (SME Corp.
2010).
Table 4: Malaysian micro, small and medium enterprises by sector
Sectors Micro-enterprise Small enterprise Medium enterprise
Manufacturing,
Manufacturing-Related
Services and Agro-based
industries
Sales turnover of
less than
RM250,000 OR full
time employees
fewer than 5
Sales turnover between
RM250,000 and less
than RM10 million OR
full time employees
between 5 and 50
Sales turnover
between RM10
million and RM25
million OR full time
employees between 51
and 150
Services, Primary
Agriculture and
Information &
Communication
Technology (ICT)
Sales turnover of
less than
RM200,000 OR full
time employees
fewer than 5
Sales turnover between
RM200,000 and less
than RM1 million OR
full time employees
between 5 and 19
Sales turnover
between RM1 million
and RM5 million OR
full time employees
between 20 and 50
The National Bank of Malaysia reported that in 2005, that there were about 519,000
SME business establishments in Malaysia and about 412,000 of them could be
considered as micro business enterprises. SMEs employed more than three million
workers and generated sales from value-adding of turnover more than RM 154 billion
in 2003. In the agriculture subsectors there are about 32,000 SMEs and 93.3% of them
are micro enterprises involved with food crops, market produce, horticulture and
livestock. In terms of value-added product, agriculture contributed 39.7% from total
value of RM 72 billion. In terms of ownership structure, 88% of SMEs were small
businesses (BNM 2005).
Family owned business is currently recognised as both important and dynamic for
world economic development. Family owned business can be considered as the oldest
form of business organisation. A family owned business may be defined as any
business in which two or more family members are involved and control the majority
of the ownership and the control lies within the family members (US Legal 2010).
Family businesses have become established as an increasingly significant element in
the corporate sector and the ones that were established long time ago have proven
performance track records. Scholars and practitioners acknowledge the successful
performance of family controlled firms. There are many advantages in the family
business hierarchy such as the sense of being in control of the destiny, greater feelings
of independence, less bureaucracy and quick decision-making. Managers of family
owned businesses have various perspectives towards shareholders, employees and
customers that add value to the system and affect the good quality of the product
(Ibrahim and Fazilah 2010).
Small-scale food processing companies play a dynamic role in the Malaysian
economy. To maintain the industrial growth, the government supports small-scale
industries with various policies and incentives such as providing technical, financial
and marketing assistance for food processing companies. Activities of small scale
processors for low value fish are mostly located near the fish landing sites. Among the
popular products made from fish are fish balls, salted dried fish and fermented fish.
Low value fish are processed by gutting and cleaning them before soaking in saturated

Bin Ali
12
UNU-Fisheries Training Programme
brine overnight. The next day the fish is sun dried for two or three days (Ghani 1995).
In 2008, the food industry in Malaysia was dominated by SMEs. The Malaysian food
export amounted to RM 17.9 billion and the second highest main products exported
were fisheries products valued at RM 2.5 billion. Exported products from the fisheries
subsector are processed seafood such as frozen and canned fish, crustacean and
mollusc, surimi and surimi based products (MIDA 2010).
3.2. Low value fish
There are general broad definitions of the term “low value fish”. What some countries
may consider as non-food products or “trash fish” suited for fish meal/feed mills and
given to animals, others consider as small/low economic value fish fit for human
consumption, especially for the poor people living in rural areas. In China, the term
“low value fish” is used for fish destined for human consumptions and trash fish is
used for fish for animal feed. Some countries consider low value fish as fish that is
by-catch from commercial trawlers operating offshore and should rightly be termed as
“lowest value fish” (APFIC 2005). In Thailand, “trash fish” is defined as small fish
for livestock/fish feed and most of the trash fish is sent to fish meal/oil production.
Artisanal fisheries use low value food fish extensively for processing value added
food for human consumption. The ‘true’ trash fish are small in size even though they
are at the maturity stage (FAO 2005). Trash fish in Vietnam has no clear
identification. Normally, trash fish is by-catch from trawlers and is important for
artisanal fisheries in terms of weight and value. Previously of low and no economic
value, they are now converted into value added products such as fermented stock for
fish sauce, dried fish or salted. The price of the low value fish is now increasing in
value due to the processing and value addition (FAO 2005). In Iceland, fisherman
families used to produce salted and dried products from demersal fish, mainly cod and
herring. The process of salting and drying does not need high technology or expensive
equipment. Thus small companies with one to five employees are able to operate,
although there are bigger companies that have implemented higher technology in
production in the last decade. For the bigger companies salted fish is normally by-
product production or secondary product for the company (Knútsson 2001).
Malaysia defined trash fish as by-catch from trawlers not fit for direct human
consumption and smaller size of commercial species. The major disposition of trash
fish is through fish meal for aquaculture or as feed mills for live stocks. Malaysian
harvesters land most of the small low value pelagic fish and small size demersal fish
as by-catch. The importance of the fish depends on the species, the size and the
freshness of the fish. The major pelagic fish groups landed are Indian/short mackerels
(Rastrelliger spp.), round scad (Decapterus spp.), neritic tunas, sardines (Sardinella
spp. and Dussumieria spp.), hardtail scad (Megalaspis cordyla), ox-eye scad (Selar
boops), anchovies and yellow-tail scad (Alepes spp.). The most landed demersal
species are threadfin bream (Nemipterus spp.), jewfish/croaker (Pennahia spp.,
Johnius spp. and Otolithes spp.), rays, goatfish (Upeneus spp., Parupeneus spp.),
lizard fish (Saurida spp., Trachinocephalus spp.) and marine catfish (Arius spp.,
Osteiogenoisus spp.) (Musa and Nuruddin 2005).
Traditional processed products are also still being produced, such as fermented fish
for fish sauce and cured fish (dried, salted and smoked) for adding to the value of low
value fish (Menasveta 2001). Low discard of fish among countries in Southeast Asia
is due to the fact that low value fish is still used for direct human consumption. This is

Bin Ali
13
UNU-Fisheries Training Programme
the case in Malaysia, Indonesia and the Philippines, as some of the fish are sold at
good prices for human consumption and fishmeal. Due to better quality catch, smaller
vessels that normally sail short trips are able to sell their low value fish for human
consumption (Goh and Tan 2008).
In 2005 the FAO defined low value/trash fish as;
“Fish that have a low commercial value by virtue of their low quality, small size or
low consumer preference. They are either used for human consumption (often
processed or preserved) or used to feed livestock/fish, either directly or through
reduction to fish meal/oil.” (FAO 2005)
Aggregated consumptions of low value food fish among developing countries has
increased from 18 million tons in 1973 to 43 million tons in 1997. Herring and
anchovies and other small pelagic fish from marine capture fisheries and carp and
tilapia from fresh water/diadromous fisheries are considered low value fish. Shown in
table 5 is the classification of low value and high value finfish according to IMPACT,
the international model for policy analysis of agriculture commodities and trade
groups (Delgado et al. 2003).
Table 5 : IMPACT fisheries commodity categories and component Low value finfish High value finfish
Carp, Barbell and other cyprinids, Herring,
Sardines, Anchovies, Jack, Mullet, Sauries,
Mackerel, Snoek, Cutlassfish, River eels,
Shad, Tilapia, miscellaneous marine fishes and
other cichlids
Cod, Hake, Haddock, Flounder, Halibut, Sole,
Redfish, Bass, Conger, Salmon, Trout, Smelt,
Shark, Ray, Chimera, Sturgeon, Paddlefish, Tuna,
Bonito, Billfish
The global fisheries production (both capture and aquaculture) was about 140 million
tons in 2008 and from that about 115 million tons (82%) were used for human
consumption and the remaining 25 million tons (18%) were used for non-food
products like fishmeal and oil. About 56.5 million tons (39.7 %) of the global
production were consumed as fresh, 58.6 million tons (41.2%) went into value adding
activities such as frozen, cured (dried, salted and smoked) and ready to eat food (FAO
2010).
3.3. Processing Methods
The catch in Malaysia may constitute 30 or more species, both pelagic and demersal,
which can be consumed as fresh or in processed form. Small demersal fish are a
diverse group that include different shapes and sizes and live deeper than pelagic fish.
The size of small demersal fish is normally less than 25 cm with hard scales and
moderately firm flesh. The oil content is generally less than 5% and much less than
the pelagic fish. The group consists of many species such as small mullets, snappers,
breams, croaker/jewfish and silver bellies.
Salted and dried products of good quality can be made from demersal fish but the
products fetch a low price. Most of the demersal fish are lean and bony and not
suitable for canning or as fermented products. They provide a low income group
inexpensive source of protein food. Expensive methods of processing are not possible
due to the low price of the processed product. Small scale industries process it as
dried fish, depending on the seasonal availability. The most popular pelagic species
are sardines, mackerels, ribbon fish, lizard fish, sharks, threadfin bream and snappers.

Bin Ali
14
UNU-Fisheries Training Programme
They can be boiled or salted and dried. Normally in Malaysia, fish, both demersal and
pelagic, is sold fresh but it can also be marketed after processing (ILO-WEP 1982).
Some of the by-catch species are prepared dried, salted or fermented.
Large quantities of small low value pelagic species (small mackerels or Indian chub
mackerel) are harvested seasonally. Most of these species have high oil content and
are often dried whole without salting or smoking, but the products are fragile and
break easily. They can also be boiled or salted and dried. Normally the fish are sold
fresh and can be marketed after processing. Only fresh fish makes a good product
(ILO-WEP 1982).
The most important factor for the suitability of processing small fish for drying,
salting and smoking is the size, oil content and the flesh texture. Smaller size fish can
be dried whole, but the bigger the size it has to be cut and split for better penetration
of salt and moisture removal. Fish with high oil content are more rancid and generally
not suited for salting or drying. The oil is a barrier to salt penetration and moisture
reduction. Normally it is cooked/boiled and then dried or smoked. Often it is pickled
in salt. Fish that contains moderately or firm flesh texture is easier to handle and
transport in dried form. It is more suitable to be dried or salted. Fish size between 15-
25 cm is better if cut and split for the penetration of salt and moisture loss (ILO-WEP
1982).
By salting fish it loses some water content from its flesh when absorbing the salt. Salt
is desirable for protecting the product during the curing process. Salting can be done
by various methods, depending on both the final product that is desired by consumers
and the production cost. There are many factors that may influence the quality of the
product such as the quality of the fish, climate and salt quality. Salting is done by
rubbing dry salt on to the fish and immersing them in a brine solution (a solution of
salty water). The fish are then drained before drying or covered with salt for pickle
curing. The yield for salted mackerel after 48 hours curing is 70% with a moisture
content of 60%. If the salted fish is dried in the sun the yield will vary according to
moisture content (ILO-WEP 1982).
The quality of the raw material is important. In Iceland, fresh fish has been used for
salting (Thorarinsdottir et al. 2010). The quality of the raw material largely depends
on the gear type used to harvest the fish. Trawls give less quality fish compared to
other fishing gears because the fish can be compressed at the end of the net. The
handling of raw materials, from harvesting to processing, influences the quality and
yields of the final products (Valdimarsson and Gunnarsdottir 1982). If the raw
materials are not properly handled it may cause defects such as bruises, blood clots
and gaping (Botta et al. 1987a; Thorarinsdottir et al. 2010). The high contents of
omega-3 fatty acids in pelagic species are beneficial for humans. Thorarinsdottir et al.
(2010) also reported that according to the “Norwegian Industry Standard for salted
and dried salted products” superior quality of salted fish is made from raw materials
that are thoroughly cleaned. In Iceland, the salting procedure uses wet salting, that is
brining and injection of brine (Thorarinsdottir 2010; Lindkvist et al. 2008). New
methods of salting have increased yields and quality.
The simplest, commonest and cheapest method used in tropical countries for drying
fish is natural drying by using the sun and wind. Dried fish is commonly used by low-

Bin Ali
15
UNU-Fisheries Training Programme
income groups which cannot afford to buy other more expensive fish products. Simple
improvement such as using a suitable method of drying in order to avoid
contamination may help to raise product quality. The common process for dried fish is
sun drying with a moisture content of up to 40% (ILO-WEP 1982).
Smoking is the process whereby the heat from a fire dries the fish while chemicals
from the smoke impregnate the flesh. The final flavours of the smoked product
depend on the raw materials used, type of wood used and the duration of time used to
smoke the fish. Traditional smoking methods range from simple open fires or smoke
pits to a smoke house. It is inexpensive to build smoke pits using local materials.
Smoking is common practice for curing when there is a short supply of salt. Fatty fish
such as mackerel and sardines are very suitable for smoking and the water content in
the flesh is then reduced by salting or drying or a combination of both. Fatty fish such
as mackerels and sardines are very popular smoked products in Europe and Africa
(ILO-WEP 1982).
3.4. Prospects for low value fish
A number of countries of the Southeast Asian Region are producers and important
consumers of dried seafood, importing products from neighbouring countries and
offering new possibilities for Malaysian exporters. A study by Richmond (1997)
reported good sales prospects for new products, innovative and ready to eat food. Fish
snacks are considered popular in Singapore. Southeast Asian nations are the main
suppliers to Singapore due to abundance of fish and demand by consumers offering
reasonable prices. There is a potential product diversification possibility for mackerel
and croaker from the present product forms such as dried, boiled and raw material for
surimi plants. Mackerel and croaker can be converted into dressed and marinated
products and surimi base fabricated products both for domestic consumption and the
export market. There are great opportunities to improve the product processing and
presentation from this sector (FAO 2008).
In Japan, cod stomachs, gills and gullets are slated and preserved for human
consumption. If larger quantities of fish offal are available, a product known as fish
silage could be produced by acidification with minerals and organic acids. Silage is
prepared by adding formic acid and letting the whole mass break down to a liquid.
There is great interest in silage production now even more than for the production of
fishmeal. Silage can be dried and added into animal feed. Fish offal can also be
fermented by adding lactic acid in order to produce silage. The skins and heads of the
fish can be used to produce fish glue. This is done by steaming fresh material for
about 8 hours over perforated screens. The glue was used extensively in furniture
making, bookbinding and making leather goods before synthetic glue was introduced.
An important byproduct from fish waste is fish oil which is derived from a fish meal
process. Fish oil contains high levels of vitamins A and D and can be extracted from
the fish livers (ILO-WEP 1982).
The world’s most widely traded food commodities are fishery products and the trade
is dominated by developing countries. Most eco-labelling studies indicate that
labelling of quality attributes provides a flow of information between consumers and
producers. A study by Caswell and Anders (2009) on food safety and quality received
global attention among consumer trends researchers and showed consumers’ greater
Bin Ali
16
UNU-Fisheries Training Programme
concern about the health and safety benefits of the product. They are more aware of this
when making buying decisions. This is especially true for women as most of them act as
the gate keeper and decision maker in preparing food for the family.
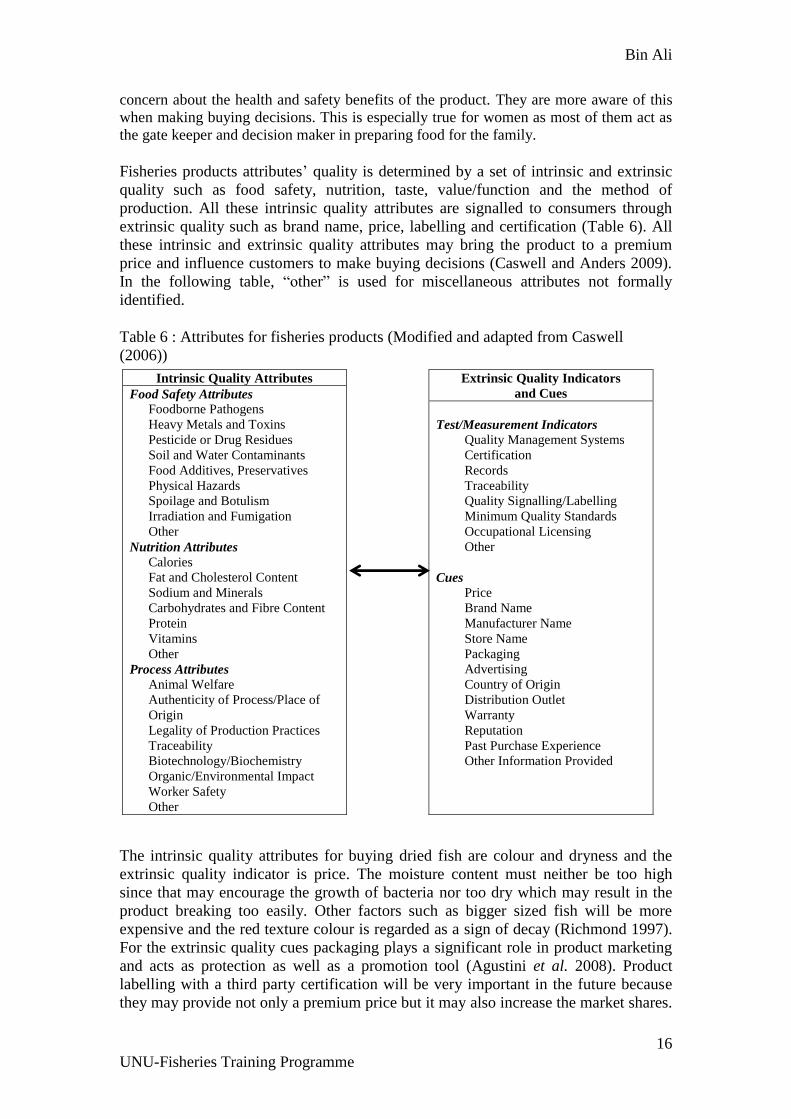
Fisheries products attributes’ quality is determined by a set of intrinsic and extrinsic
quality such as food safety, nutrition, taste, value/function and the method of
production. All these intrinsic quality attributes are signalled to consumers through
extrinsic quality such as brand name, price, labelling and certification (Table 6). All
these intrinsic and extrinsic quality attributes may bring the product to a premium
price and influence customers to make buying decisions (Caswell and Anders 2009).
In the following table, “other” is used for miscellaneous attributes not formally
identified.
Table 6 : Attributes for fisheries products (Modified and adapted from Caswell
(2006))
The intrinsic quality attributes for buying dried fish are colour and dryness and the
extrinsic quality indicator is price. The moisture content must neither be too high
since that may encourage the growth of bacteria nor too dry which may result in the
product breaking too easily. Other factors such as bigger sized fish will be more
expensive and the red texture colour is regarded as a sign of decay (Richmond 1997).
For the extrinsic quality cues packaging plays a significant role in product marketing
and acts as protection as well as a promotion tool (Agustini et al. 2008). Product
labelling with a third party certification will be very important in the future because
they may provide not only a premium price but it may also increase the market shares.
Intrinsic Quality Attributes
Food Safety Attributes
Foodborne Pathogens
Heavy Metals and Toxins
Pesticide or Drug Residues
Soil and Water Contaminants
Food Additives, Preservatives
Physical Hazards
Spoilage and Botulism
Irradiation and Fumigation
Other
Nutrition Attributes
Calories
Fat and Cholesterol Content
Sodium and Minerals
Carbohydrates and Fibre Content
Protein
Vitamins
Other
Process Attributes
Animal Welfare
Authenticity of Process/Place of
Origin
Legality of Production Practices
Traceability
Biotechnology/Biochemistry
Organic/Environmental Impact
Worker Safety
Other
Extrinsic Quality Indicators
and Cues
Test/Measurement Indicators
Quality Management Systems
Certification
Records
Traceability
Quality Signalling/Labelling
Minimum Quality Standards
Occupational Licensing
Other
Cues
Price
Brand Name
Manufacturer Name
Store Name
Packaging
Advertising
Country of Origin
Distribution Outlet
Warranty
Reputation
Past Purchase Experience
Other Information Provided

Bin Ali
17
UNU-Fisheries Training Programme
This may happen even if the product comes from nations with underdeveloped fishing
industry and the terms of “environmentally friendly” or “sustainability harvested”
may differ between countries. For small scale producers to be certified increased cost
may be perceived as a trade barrier (Vidarsson, 2008).
Looking closer at the environmental attributes and the intrinsic attributes of nutrition
and food safety, Menasveta (2001) in her report concluded that the increasing demand
of fish and fish products due to the expanding of population may create more stress to
the inshore fishery with already depleted stocks. Sivasubramaniam (2000) noted that
due to intensive exploitation of demersal species by trawlers, stocks have been
significantly reduced and the size of the species caught becomes smaller as is the case
of Thai and Malaysian waters. As cited by FAO (2010), that unless effective effort is
given to the sustainable fisheries management the increased percentage of over
exploited, depleted and declining of the global catch in the last few years may affect
the production from wild capture fisheries. Hotta (2000) also reported that coastal
areas are overfished by small-scale fisheries whereby catch rates, fish sizes, quality
and fisher income are declining. In some cases like in the South China Sea most of the
fish stocks are been fully exploited or depleted.
According to Seafish (2010), and certified by the Food Standards Agency, it is safe to
eat smoked fish if it is cured and not in raw form. Andrew and Helen (2005) point out
that processed fish such as dried and salted fish may contain higher cholesterol and
sodium contents compared to fresh fish. Older age groups who are more health
conscious should avoid the product. Jonsson et al. (2007) stated that dried fish is a
protein-rich food supplement and based on numerous research have proved that fish is
good for health and can minimise the risk of stroke.
High concentration of Omega-34 oil is in seafood and it is therefore among the
healthiest dietary choices as it is low-fat but high density source of protein. Oily fish
such as mackerel, sardines, herring, pilchards and salmon are rich in essential fats
such as Omega-3. By consuming more fish women are much less likely to suffer from
post-natal depression. Fish is also a source of vitamin A, healthy for skin and eyes and
also for vitamin D, helping the body absorb calcium to strengthen teeth and bones
(Seafish 2010). As Hotta (2000) mentioned fish has for a long time played an important
role in regional food security for the South East Asian people by supplying nutritious
food which includes protein, amino acids, fish oils and other micronutrients such as
calcium, iodine and vitamins. A research by Jonsson et al. (2007) concluded that
protein in dried fish was of high quality containing between 80-85% of protein. Dried
fish also contain high quantity of amino acids.
4 Omega 3- a type of fat that is found in oil-rich fish.
Bin Ali
18
UNU-Fisheries Training Programme
3.5. New product investment and profitability analysis
For this project a game plan or ‘Stage-Gate’ system for product innovation and ABC
analysis is applied to determine the feasibility and attractiveness of the products.
A ‘Stage-Gate’ model
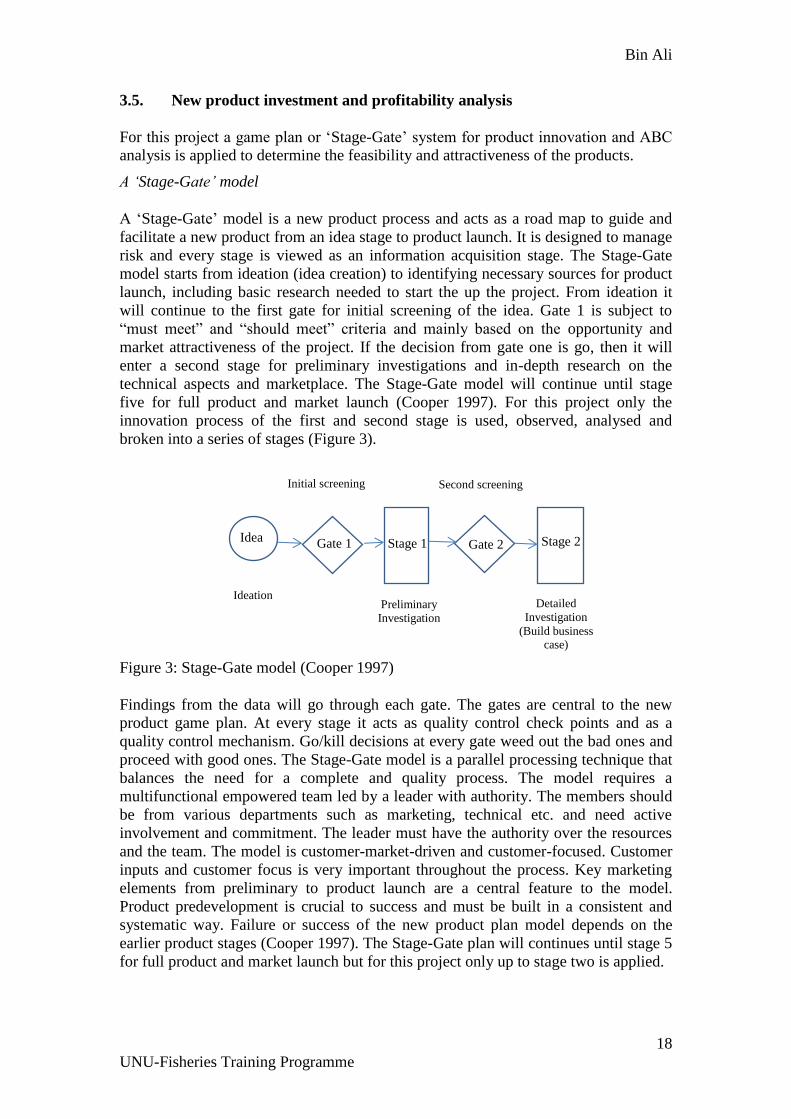
A ‘Stage-Gate’ model is a new product process and acts as a road map to guide and
facilitate a new product from an idea stage to product launch. It is designed to manage
risk and every stage is viewed as an information acquisition stage. The Stage-Gate
model starts from ideation (idea creation) to identifying necessary sources for product
launch, including basic research needed to start the up the project. From ideation it
will continue to the first gate for initial screening of the idea. Gate 1 is subject to
“must meet” and “should meet” criteria and mainly based on the opportunity and
market attractiveness of the project. If the decision from gate one is go, then it will
enter a second stage for preliminary investigations and in-depth research on the
technical aspects and marketplace. The Stage-Gate model will continue until stage
five for full product and market launch (Cooper 1997). For this project only the
innovation process of the first and second stage is used, observed, analysed and
broken into a series of stages (Figure 3).
Figure 3: Stage-Gate model (Cooper 1997)
Findings from the data will go through each gate. The gates are central to the new
product game plan. At every stage it acts as quality control check points and as a
quality control mechanism. Go/kill decisions at every gate weed out the bad ones and
proceed with good ones. The Stage-Gate model is a parallel processing technique that
balances the need for a complete and quality process. The model requires a
multifunctional empowered team led by a leader with authority. The members should
be from various departments such as marketing, technical etc. and need active
involvement and commitment. The leader must have the authority over the resources
and the team. The model is customer-market-driven and customer-focused. Customer
inputs and customer focus is very important throughout the process. Key marketing
elements from preliminary to product launch are a central feature to the model.
Product predevelopment is crucial to success and must be built in a consistent and
systematic way. Failure or success of the new product plan model depends on the
earlier product stages (Cooper 1997). The Stage-Gate plan will continues until stage 5
for full product and market launch but for this project only up to stage two is applied.
Stage 2
Initial screening Second screening
Ideation Preliminary
Investigation
Detailed
Investigation
(Build business case)
Idea Gate 1 Stage 1 Gate 2

Bin Ali
19
UNU-Fisheries Training Programme
Capital budgeting
Capital budgeting is the process of making decisions in assets acquisitions or assets
investment. Capital investment includes buying new equipment or buildings as assets
to be used for a long period of time (Oliver and Horngren 2010). For example, future
FOMBEs need to invest in buildings, new processing centres and equipment, such as
a cold room for storage of raw materials and finished product. Management uses
capital budgeting techniques to determine which projects will offer the highest return
over the period of the planning horizon. The popular methods of capital budgeting
include net present value (NPV), internal rate of return (IRR), accounting rate of
return (ARR) and payback period. ARR and payback period are used to screen out
potential investments from those that are less necessary. The NPV and IRR use the
factor of time value of money for longer term investment. If the NPV is positive then,
according to the assumptions, the investment should be started. The IRR of the
project’s cash flow gives the percentage of the rate of return at the point when the
NPV is exactly 0.

Bin Ali
20
UNU-Fisheries Training Programme
4. PROJECT ANALYSIS
The project analysis starts by analysing the ideas behind the first screen of the Stage-
Gate model for the low value fish harvested in West Malaysia. All relevant statistical
data is analysed to find out the source of resources. After analysing the data it will be
discussed at gate one which is the initial screening of the project. A decision either to
proceed or not will be decided at gate one. If the decision is to proceed then it will go
to stage one for a quick scope of preliminary market assessments, technical
assessment and financial assessment. The process will proceed to gate two for
decision making to either go or kill the project. If the results from gate two are “go”
then it will proceed to stage two which is the detailed investigation of the project. A
further detailed assessment will be conducted in stage two. In this project it will end at
stage two.
4.1. Ideation
The statistical data and information on the quantity of grade II and III fish landed in
West Malaysia revealed that there appears to be a possibility for FOMBEs and small
entrepreneurs to venture into processing of low value fish in Malaysia. As reported by
Ghani (1995), small-scale food processing is expected to play an important role in the
Malaysian economy and thus for the Malaysian government. The fact is that the
government is now recognising the functions of the SMEs as not only providing job
opportunities but as companies playing an important role in the social, economic and
political development of the country. The government is currently supporting such
incentives by providing technical, financial and marketing assistance to the SMEs
through various policies and incentives. The agencies that provide micro credit
finance to SMEs in Malaysia are Amanah Ikhtiar Malaysia (AIM), TEKUN Nasional
and Malaysia National Bank (BNM) channelling it through 10 financial institutions.
The maximum loan provided for working capital is RM 50,000.00. The loan tenure is
10 years with 4% interest (SME Corp. 2010).
In the last century Icelandic fisherman families did not need high capital investment
for the technology or equipment used to process demersal fish through the process of
salting or drying (Knutson 2001). Although modern processing has developed in
Malaysia, traditional processes such as dried, salted and smoked fish products are still
being produced in order to increase the value addition of low value fish (Menasveta
2001). FAO (2005) has pointed out that low value fish, previously of low or no
economic value, is now being converted into value added products such as dried and
salted fish products and fermented fish used in fish sauce.
In 2009, almost 78% of the total capture fisheries landed in West Malaysia are from
trawlers (51%) and fish purse seiners (27%) (Appendix 1). The major landing areas
from trawlers are the states Perak (26%), Selangor (20%) and Pahang (16%). The
three states control about 62% of the total fish landed by trawlers. The second most
large catches come from the fish purse seiners and are mostly landed in the states
Perlis (34%), Perak (21%) and Terengganu (15%). These three states control about
70% of the total capture fisheries landed by the purse seines. Analysing the combined
landings of both fishing gears shows that the major states are Perak (24%), Perlis
(18%), Selangor (13%) and Pahang (13%). The four states received 68% from the two
main fishing gears in West Malaysia. It can be concluded that the main sources of low

Bin Ali
21
UNU-Fisheries Training Programme
value fish are to be found in these four states out of the eleven states in West
Malaysia. For this project it is important to identify the sources since the project needs
to be implemented as near to the resources as possible. Therefore for this project the
FOMBEs are assumed to come from one of these states.
From the statistical data on total fish landed by species and fishing gear, as is shown
in Appendix 2, trash fish and miscellaneous fish landed was excluded from being a
potential raw material for the FOMBEs. This amounts to almost 40% of the total
catch. Based on the statistics and excluding this and molluscs, crustaceans and shells,
there are 22 species of fish which are landed in West Malaysia. The most harvested
species are mackerels (35%), scads (28%), croaker fish (8%) and then there are 29%
from other species. From the data given it can be assumed that the low value species
are mostly harvested by fish purse seiners and by-catch from trawlers.
The average ex-vessel price
5 in 2009 for all the 22 species was observed as shown in
appendix 3. From the average price it can be seen that most of the low value fish are
small demersal and pelagic fin fish. The price varies between grades I, II and III. The
lowest price is RM 1.15 per kilogramme for tiger tooth croaker and the highest price
is RM 13.32 for Spanish mackerel. All but one of the species are from grades II and
III. The Spanish mackerel is in grade I and can therefore not be included as a possible
alternative. From the average price statistic there seem to be great opportunities for
value adding for Grade III species due to the low prices.
Malaysian capture fisheries put the fish through various processing, as is shown in
appendix 4. Almost 54% of the small low value fish are used for fish meal or feed
mills as 14% is processed traditionally as locally popular fish crackers and 8% are
processed as salted, dried/smoked and the balance of 14% as fertilizers, surimi and
surimi based products. Most of the processed products are for domestic consumption
except for the first grade surimi which is exported as are the frozen molluscs, shells
and crustaceans. Smoked fish from sardines and short mackerel are not popularly
known local products perhaps due to eating habits or lack of promotion to the public.
Although there is an effort made to produce smoked fish products the quantity of that
is not significant. As the statistics from 2000-2009 show the production of dried and
salted products is increasing every year.
The biggest part of the Malaysian catch is consumed as fresh whole fish (appendix 5).
Dried and salted fish are the most popular fish products. The dried/salted processing
of low value fish is normally done by small scale processors for the fisher’s family
members. Among the popular species for dried/salted processing are croakers, scads,
mackerels and rays. The smaller species such as anchovies are put through a dried and
fermented process in order to produce local fish sauces which are popularly known as
‘budu’. Other small species such as the goatfish (biji nangka) are filleted and grilled
to produce ‘satay’ fish snacks, as the locals call it. The species with low fat content
are mostly being processed as surimi and part of the low grade surimi that will be
used to produce products such as fish balls, fish cakes, nuggets and fish paste (otak-
otak). Some of the species are seasonally caught and if the quantity of landings is high
it will be used for fish meal, feed mills and as fertilizers.
5 Ex-vessel price- Price received by fishermen for fish, shellfish and other aquatic plants and animals
landed at the dock.

Bin Ali
22
UNU-Fisheries Training Programme
SMEs will be an important part of the Malaysian economy in the future. For the
fishermen and their families their SMEs can be seen to be small and mostly use the
labour of the family members. Still, if they are to be able to grow they have to be
structured as a family owned business enterprise or the FOMBE. It can therefore be
suggested that forming FOMBEs in Malaysia could lead to a great success for the
fishermen and their families. The great opportunities of FOMBEs in the fisheries
sector can be defined as small business activities producing fisheries products by the
labour of 1 to 5 of the family members. The members of the FOMBEs must directly
be involved in all activities such as harvesting, processing, marketing and
management. For the enterprise to be a FOMBE it must be registered under the
Malaysian Company Act 1965 as a sole proprietorship or partnership of family
members. Sales turnover of the company must be at least RM 200,000 annually and
the capital assets must be of less than RM 50,000 (SME Corp. 2010).
4.2. Gate 1: Initial screening
At the initial screening stages of the Stage-Gate Plan ten species out of twenty four of
those with the lowest average ex-vessel price were chosen for the first screening by an
ABC analysis method. Two species from the twenty four low value species had
already been excluded since their catch is very low and had the categories “trash fish”
and “miscellaneous fish” (see appendix three). Nine criteria of importance were
identified to assess the factors for the 10 species chosen. These criteria in their order
of weighted importance are: the price of raw material (0.175), the yield of flesh
(0.140), quality of catch (0.140), quantity of grade II and II (0.123), market familiarity
(0.105), suitable for drying (0.088), suitable for salting (0.088), suitable for smoking
(0.088) and use of by-product (0.053). The weights of importance (1.0) were
determined by the author based on his experience. A low price for the raw material
was thought to be most important for the FOMBEs along with a good yield of flesh
for easier production, the possible raw material quality from the vessels and the
possible quantity of raw material. The importance of familiarity in the market, along
with how well suited for processing the species are, was also deemed very important.
At last it was estimated how easily by-products from the species can be used. A score
of 0 to 10 was then awarded to all species in each category according to the species’
category performance. The score was either given as the relative best of the species
score (10 the highest) or as scores compared to general information (highest score
lower than 10). Again this was decided on according to the author’s experience (see
Appendix 7). Further reasoning for the weights and grades of the criteria are as
follows:
Price of raw material
The price of raw material is given the highest weight of 0.175 (17.5%) since in the
fish processing industry in Malaysia, the cost of purchasing raw material is more than
80% of the variable cost. Low price of raw material is also important for both the
FOMBEs and the traditional processors so as not to need to a high working capital.
The price of the same species may vary according to the quality and fishing gear used
or by volume of purchase. Therefore an average ex-vessel price for the species is
used. Normally the bigger processors purchase the raw material with a long term
contract price and it will be lower than market price. Here the same price pr. kg. raw
material is believed to apply for both the traditional processors and the FOMBEs. All
species are given the weight according to the 2009 average price (Appendix 3) with

Bin Ali
23
UNU-Fisheries Training Programme
the lowest price for the tiger tooth croaker with a maximum score of 10.0 and the
highest price for round scad with the lowest score of 1.0.
Yields of flesh
The yield of flesh (not including head, bones and guts) is the second most important
criteria with a weight of 0.14 (14%). If the yield of flesh is high the production will be
more efficient. In this context the round scad is awarded a maximum score of 8 and
the goat fish with the lowest score of 3.
Quality of catch
According to Agustini et al. (2008) the freshness and the quality of the fish depends
heavily on fishing techniques and fish handling. The best quality of raw material to
produce processed products is from fresh fish. The quality of catch was given a
weight of 0.14 (14.0%). In this context the harvest from the fish purse seine or fish
traps is found to be the best because the fish are caught alive and then chilled with ice
to maintain the freshness. Moreover the fish purse seiners mostly operate for one or
two days per trips. Fish harvested from gill nets is also fresh since the operations are
normally only daily trips. The harvest from trawlers offers less quality due to the fact
that the smaller size fish is being pressed at the cod end of the bag net and also
because most trawlers operate for 3 to 5 days per trip. Taking this into consideration,
the short mackerel, sardine and round scad get the highest score of 8 since they are
mostly caught by purse seine and gill nets but large head hair tail gets the lowest score
of 4 since it is mostly caught by trawlers.
Quantity of grade II and III
A steady supply of raw material is necessary for stable and consistent processing of
fish products and furthermore the price of raw materials will then be more stable and
less risk to the processors. Therefore the quantity of catch was given a weight of 0.123
(12.3%). Based on the landing statistics for West Malaysia in 2009 the most harvested
species are mackerels (35%), scads (28%), croaker fish (8%) and 29% from other
species (DOF 2009). Here the short mackerels are given the highest score of 10 and
large head hair tail with the lowest score of 1.
Market familiarity
In Malaysia, most of the fish products are consumed fresh/chilled or dried. The most
popular dried products are from the low commercial value fish, both from pelagic and
small demersal species. Dried fish is common for low-income groups who cannot
afford to buy more expensive fish products (ILO-WEP 1982). It has been stated that
the croakers and mackerels are a popular dried and salted fish product that can be
converted to other fabricated products for domestic and export market for croakers
(FAO 2008). Higher income Malaysian households spend more on processed fish and
traditionally processed fish such as salted fish which is considered a delicacy (Andrew
and Helen 2005). Market familiarity was given a weight of 0.105 (10.5%). In terms of
familiarity among the species, croaker fish is given the maximum score of 8 and large
head hair tail with the least score of 5.
Suited for drying
Size is an important factor for drying fish, as small fish may be dried whole but larger
fish have to be cut, gutted and split to increase the surface area and moisture
evaporation. Generally in Malaysia, only very small fish may be dried without salting
as larger fish often spoils before the drying process is complete. Fish with a firm or

Bin Ali
24
UNU-Fisheries Training Programme
moderate texture is more suitable for drying. The oil content is generally preferred to
be less than 5%. This applies to small mullets, snappers, breams, croakers, jewfish
and silver bellies as they are suitable for drying as cited from ILO-WEP (1982). Fish
with high oil content are not very suitable for drying as the flesh then becomes fragile
and breaks easily. Suited for drying was given a weight 0.088 (8.8%). All smaller size
fish from demersal species are suited for drying and therefore tiger tooth croaker,
round scad and croaker fish are given a score of 8 and the rest of the species a score
between of 5 to 7.
Suited for salting
For smaller species it is difficult to fillet the fish and it will have to be cured as whole
fish. Bigger size fish will be gutted, cleaned and split with head-on before curing to
increase the surface area for salt penetration and moisture evaporation. Small fish may
be salted whole. Bigger fish, such as demersal fish which have a fat content of less
than 5%, are also suitable for split or fillet salting. Fish which contain much oil have
flesh that acts as a barrier to salt penetration and moisture loss. The firmer the flesh of
the fish is the easier it is for handling and transportation without breaking up the flesh.
Salted and dried products of good quality can be processed from the demersal fish but
normally those products fetch a low price (ILO-WEP, 1982). Suited for salting was
given a weight 0.088 (8.8%). Round scad is given the highest score of 9 and the goat
fish the lowest score of 4.
Suited for smoking
Fish with high oil content such as sardine-like, herring-like species and mackerels
with relative small scales and soft flesh is most suitable for smoking. Suited for
smoking was given a weight 0.088 (8.8%). After considering the fat contents the
round scad and fringescale sardine are given the maximum score of 9 and the tiger
tooth croaker, the goat fish and croaker the lowest score of 3.
Use of by-product
People in South Asia use dried fish both in whole and split open forms. For them the
fish maws (fish swim bladder) are special and they believe in the health benefits
derived from eating the products. The most expensive fish maws are from the giant
yellow croakers. For protection due to the danger of that species’s extinction, smaller
fish maws from other croaker species are also collected and sold in the market (Clarke
2009). Fish maws in Singapore can fetch a price between US$116 to US$160 per
kilogram (Richmond 1997).
Waste from fish processing in the form of fish offal, heads and trimmings may also be
commercialised. An important by-product from fish waste is fish oil which is derived
from the fish meal process. The oil can be used for human consumption or it can be
used for the production of various compounds. Fish oil can be extracted from the fish
livers and contains vitamins A and D (ILO-WEP 1982). Use of by-product was given
a weight of 0.053 (5.3%). For the by-products the fish maws differentiate the most
since small size of the Grade II and III fish make it impossible to use for other by-
products than fishmeal or oil. The fish maws from the croaker might be small but the
processor may dry it. For use from by-products the croaker fish is given the score of 5
and the tiger tooth croaker and goat fish end up with the lowest score of 2 (due to their
small size).

Bin Ali
25
UNU-Fisheries Training Programme
After calculations the weighted total score of the ten species was found to be in the
range from 4.65 for the large head hair tail to 6.93 for the short mackerel. Five species
were given a total score over 6.0 but only three of them scored over 6.5. These were
the croaker fish with 6.7, the round scad with 6.81 and the short mackerel with 6.93
(Appendix 6). For this reason and since the difference was so small these three
species were chosen for the preliminary investigation that follows.
4.3. Stage 1: Preliminary investigation
The criteria for the second gate had to be decided on and necessary calculations were
then carried out. The same process of deciding on important criteria, their weights and
scores was used as before. Processed products used for comparison were for dried and
for salted for all three species. Processed smoked products were only used for the
short mackerel and round scad. As for Gate 1, the croaker was not deemed suitable for
smoking (scores of 8, 9 and 3 respectively).
The efficiency and effectiveness of operations is of great importance for the criteria of
Gate 2. The three species are therefore evaluated for each of the following criteria:
EBIT (earnings before interest and taxes) – value for an entity operating solely
with its highest return product, this shows the earnings before interest and
taxes from the operations of the process, given the assumptions.
An effective price margin – this is of importance as it shows the difference
between the revenue and the price pr. effective kg (product) of raw material.
Amount for investment needed – this was also deemed important since the
FOMBEs and the traditional processors have limited funds for investment. The
lower the capital of investment is the better for both processors.
Possibilities of new products – this relates to the possibilities to grow and
increase the profitability by introducing new and better products for both the
domestic and the regional markets.
From the study by Caswell and Anders (2009) it was seen that the attribute quality is
determined by a set of both intrinsic and extrinsic quality such as food safety,
nutrition, taste, value/function and that the method of production which may bring the
product a premium price and influence customers to make buying decisions. In light
of this the safety attributes, nutritional attributes and environmental attributes were
also used as criteria for Gate 2 evaluation of the three species:
Environmental attributes - are important regarding responsible and sustainable
methods of harvest.
Safety attributes – concern food safety in handling the fish from harvest to
table. Although there may be some preservatives used, they must be within the
permitted level.
Nutritional attributes – concern the nutritional values for the consumer. All
types of fish have high nutritional value, but fish with high oil content is here
deemed better for dietary health
Further calculation and reasoning for the weights and grades of the criteria are as
follows;

Bin Ali
26
UNU-Fisheries Training Programme
Calculating EBIT for the FOMBEs
Earnings before interest and tax are all profits before taking into account the interest
payments and income taxes. EBIT is also known as operating earnings or operating
income.
The formula to derive the EBIT is
EBIT= Revenue – Operating expenses
The assumptions used for the calculations are as follows (Table 7): the capacity of
operations for the FOMBE is 200 kg of raw materials per day. The operation is 200
working days per year for all the products of the three species. The sales price used
are prices stated by operating staff of FDAM in Perlis and staff of AFA in Rompin
Pahang giving both prices for raw material and selling price.
Table 7: Three species EBIT calculation for FOMBEs
Species Croaker Short mackerel Round scad
Methods Dried
Dried
/Salted Smoked Dried
Dried
/Salted Smoked Dried
Dried
/Salted Smoked
Sales (tonnes) 12.6 14.4 12.6 14.4 18.36 12.6 14.4 16.2 12.6
Price (RM/per
tonnes) 12,000 15,000 16,000 13,000 15,000 16,000 13,000 15,000 16,000
Revenue 151,200 216,000 201,600 187,200 275,400 201,600 187,200 243,000 201,600
(-) Variable cost
(RM) 104,380 114,040 112,730 144,920 155,426 152,730 164,920 174,670 172,730
Net profit
contribution 46,820 101,960 88,870 42,280 119,974 48,870 22,280 68,330 28,870
(-) Fixed cost (RM) 45,216 41,901 41,900 45,216 41,901 41,900 45,955 41,901 44,901
EBIT (Operating
surplus)(RM) 1,604 60,059 46,970 -2,936 78,073 6,970 -23,675 26,429 -16,031
EBIT as percentage
of revenue 1% 28% 23% -2% 28% 3% -13% 11% -8%
The selling prices used are different from the average prices used for the analysis in
gate 1. There an average ex vessel prices were used for all the 23/10 species. The
difference is quite high. For the raw materials the price used is 66% lower than the
average price for the croaker, almost 18% lower for the short mackerel and around
27% lower for the round scad. This is mainly due to the fact that the average price
shows a mix of grade II and III fish. The selling prices are also based on interviews
with the operating staff. Variable costs include raw material, water and electricity
bills, labour costs and overtime, salt, packaging and marketing costs (Appendix 9).
The fixed costs include renting land, electricity and telephone, maintenance and repair
costs, insurance, permanent employee costs, licences and other fees (Appendix 9).
The highest EBIT of all species is chosen for gate two scoring. The dried/salted
process always gives the highest EBIT. For the croaker the EBIT is RM 60,059, for
the short mackerel it is 78,073 and for the round scad it is 26,429. The short mackerel
provides the highest earnings before interest, taxes and then building up profit.
The effective price margin
The effective price margin is an important ratio for determining its effective raw
material contribution margin as is shown in Table 9. The formula for deriving the
effective price margin is:

Bin Ali
27
UNU-Fisheries Training Programme
Effective price margin = (selling price pr. kg x yields) – price of raw materials used
As seen from Table 8 the highest percentage effective margin is 67% for the salted
croaker then 61% for the short mackerel and 48% for the round scad.
Table 8 : Effective price margin in RM
Species Croaker Short mackerel Round scad
Method of curing Dried Salted Dried
Dried/
Salted Smoked Dried Salted
Ringgit Malaysia RM RM RM RM RM RM RM
Price of raw material per kg 2.00 2.00 3.00 3.00 3.00 3.50 3.50
Selling price per kg 12.00 15.00 13.00 15.00 16.00 13.00 15.00
Yields (%) 0.35 0.40 0.40 0.51 0.35 0.40 0.45
Effective price 4.20 6.00 5.20 6.50 5.60 5.20 6.75
Effective price margin per kg 2.20 4.00 2.20 4.65 2.60 1.70 3.25
% effective price margin 52% 67% 42% 61% 46% 33% 48%
When comparing processing methods for head-on and fillet products, the first method
will naturally have better yields. Comparison between pelagic and demersal species
also show that the pelagic species have more fat and maintain high moisture content
in the flesh and thus for some processes provide better yields than demersal species.
The yield used is founded on information from ILO-WEP (1982) for mackerel (used
here for the all the species) and shows that if the moisture content is 45% the yields
will be for 51% and decrease to 40% if the moisture content is 30% (Appendix 10).

Bin Ali
28
UNU-Fisheries Training Programme
Investment needed
The investment needed depends on the process used. It is assumed that both for drying
and drying/smoking the investment for the FOMBEs is RM 51,611. This covers
buildings, equipment and 5% contingencies. For smoking this amount is RM 45,310
(Appendix 8). For the traditional processors the amount for investment needed is RM
1,100 for dried and dried/salted and RM 2,750 for smoking (Appendix 8). Registered
FOMBEs are entailed for loans up to RM 50,000 at 4% interest for the period of 10
years.
Possibilities of new product
New products are necessary for the growth of companies. One reason for this is that
the life cycle of the company’s product mix will call for decline and diminishing sales
at the declining stage after the stages of introduction, growth and maturity. In
developing countries there is a trend to increase methods of advanced value-addition
applied, such as breading, quick-freezing, and cooking (FAO 2010). In Malaysia
modern fish processing factories have developed and introduced many new products
such as fish balls, fish cakes, breaded fish or shrimp which are now available in the
Malaysian supermarkets in urban centres (Menasveta 2001). Consumers seem to
change their preferences towards the growing needs of time-saving products such as
pre-cooked or prepared products from seafood. This offers producers chances for
better price, added value and profitability (Montfort 2006).
The possibilities of new products are deemed highest for the short mackerel as it is
possible to introduce products from it as ready meals, for example smoked with
sauces as is done in Asian countries and with other types of mackerel. It has until
recently been offered smoked whole but is not available any longer. The croaker fish
also offers possibilities for new products by filleting the bigger fish and breading it.
The round scad offers fewer possibilities for new products as it is now already used
for surimi and surimi based products.
Environmental attributes
The different methods of fish harvesting and the possible depletion of fish stocks
mostly determine the environmental attributes. The round scad is not a depleted stock
species and is mostly fished by purse seiners. The way of fishing is not quite
environmentally friendly enough to be graded very highly. However, it gets a better
grade than the short mackerel. The short mackerel is not a depleted stock species but
is fished both by purse seiners and by gill nets. The croaker fish is mostly fished by
trawlers and is in more of a danger of depletion as the fish caught is getting smaller.
Safety attributes
For the three species there is no difference regarding the safety attributes. There are
no additives used for the drying but for the drying/salting preserves are used. In
excess salting is also not very good for human consumption. With increasing demand
for seafood products consumers may face exposure to foodborne risks. Biological,
chemical and physical hazards may be found relating to the potential of Listeria
monocytogenes in seafood products. For ready-to-eat foods that are heat-treated and
preserved foods, a level below ten L.monocytogene per gram is regarded as
acceptable. The World Health Organization states that weekly intake of 1.7%
(2.3µg/day) is tolerable for countries that have a high intake of seafood. It is important

Bin Ali
29
UNU-Fisheries Training Programme
for processors to handle the raw materials as high levels of histamine may indicate the
process of decomposition (Arvanitoyannis 2009).
Nutritional attributes
Oil content from fish is believed to be good and among the healthiest dietary choices.
Here the short mackerel and round scad are given top scores because of their high fat
and oil content but the croaker fish scores a little lower.
4.4. Gate 2: Second screening
At the second screening stage of the project, information obtained from the
preliminary investigation is added and used for the screening. Same methods as
before are used for assigning the weights and scores to the criteria. Greater
importance is on the operational criteria than the attributes. EBIT is given the weight
of 0.3 out of 1.0, the effective price margin 0.2, the amount of investment needed 0.15
and the possibility of new products 0.15. For the attributes the environmental-, safety-
nutritional attributes were given 0.10, 0.05 and 0.05 respectively.
The criteria are given a high score from 10 to the lowest score of 1. The scoring is
given all species according to their best process, dried, dried/salted or smoked. Again
the author will give the scores based and from his experience and from his
calculations as explained in the preliminary investigation, either as relative highest
scores or generally observed scores. The criteria score is then multiplied by the
weights and the results investigated both for FOMBEs and for traditional processing.
After that one species will be chosen for a detailed investigation in stage 2.
The results of second screening are shown in Table 9.
Table 9 : Second screening for FOMBEs
Criteria Weight Croaker
Short
mackerel Round scad
EBIT Micro business 0.30 8 2.40 10 3.00 3 0.90
Effective price margin 0.20 10 2.00 9 1.80 6 1.20
Investment for FOMBEs 0.15 10 1.50 9 1.35 9 1.35
Possibilities of new product 0.15 9 1.35 10 1.50 7 1.05
Environmental attributes 0.10 5 0.50 6 0.60 7 0.70
Safety attributes 0.05 9 0.45 9 0.45 9 0.45
Nutritional attributes 0.05 8 0.40 10 0.50 10 0.50
Total 8.60 9.20 6.15
Short mackerel has the highest score of 9.2. Croaker comes next with a score of 8.6
and round scad scores only 6.15. For the FOMBEs, the short mackerel is the best
choice for the detailed investigation needed.
4.5. Stage 2: Detailed investigation
A detailed investigation is conducted for the species short mackerel. It will initially be
done by using a profitability analysis model designed by professor Pall Jensson of the

Bin Ali
30
UNU-Fisheries Training Programme
University of Iceland (Appendix 11) for estimating the profitability of establishing a
FOMBE processing products of the short mackerel in Malaysia.
The highest EBIT contribution for the short mackerel is for the dried/salted process
(Table 8). Additional information from staff in the AFA in Pahang indicated that a
mix of Grade II and II is sold together and that when selling products dried/salted the
same is the case. This means that for both raw material and that the selling price the
customer expects a mix of grade II and III fish. For the detailed investigation a mix of
70% grade II fish and 30% grade III fish is used. Both the raw material and selling
prices that are used take that into account.
The processes for the short mackerel products under the detailed investigation are in
the beginning dried, dried/salted, salted and smoked products.
The short mackerel
Short mackerel (Rastrelliger brachysoma) is a common species in the Malaysian fish
market. The species is mostly consumed as a fresh fish although products both salted
and dried/salted can be found in the market. Short mackerel is a neritic-pelagic
species with a distribution along the tropical climate area and the common length is
20 cm (Fish Base 2010).
Figure 4 : Short mackerel (Rastrelliger brachysoma)
Short mackerel was partly selected as the target species due to the availability of
resources. The volume of short mackerel harvested from marine capture fisheries in
West Malaysia is about 15% of all the catch (Figure 7). Due to seasonality the ex-
vessel price of the species varies between RM 3.00 to RM 4.00 per kilogram but the
fish processors normally negotiate a stable long term contract price from suppliers.
(Suriza Suboh, personal communication FDAM, Perlis 2011; Rosnani Bidin, personal
communication Area Fisherman Association, Rompin, Pahang 2011).
Site selection
For the detailed investigation the proposed site for the project is in the state of Perlis
(Figure 5) which is situated on the northern part of West Malaysia. Perlis was partly
chosen over Perak and Selangor for the quality of raw material since in Perlis 34% of
the total catch of the purse seiners in West Malaysia is landed at the Kuala Perlis
fisheries complex. Also since the supply of short mackerel is more consistent there
than in Pahang in the east.

Bin Ali
31
UNU-Fisheries Training Programme
Figure 5: Perlis, West Malaysia the proposed site selection
Perlis has a good fisheries infrastructure such as fish landing complexes and
supporting facilities and good access to electricity, water supplies and
telecommunications systems. It also has good road connections to other major cities in
West Malaysia.
Production mix selection
The most feasible production methods for the short mackerel have to be estimated.
For doing that the EBITs of the four processed products were compared (Table 10).
Table 10 : EBIT for processed products
The selling price of the dried/salted product is RM 15.00 and RM 11.00 per kilogram
for the salted product. Since both dried/salted and salted product give a similar
amount RM for the EBIT, both yield 28% EBIT to revenue and the processes are
almost the same; both processed products are used for the profitability analysis.
Production comprising of 70% dried/salted and 30% of salted product will be used in
the calculations of the profitability model. This mix of different processed products is
chosen to make the operations more stable.
Assessments method
The financial feasibility of establishing a FOMBE in Malaysia is assessed using both
profitability- and sensitivity analysis. A break-even quantity, the net present value of
the investment and the internal rate of return for the investment will be calculated.
Species Methods Dried Dried/Salted Smoked Salted Sales (RM/tonnes) 14,4 18,36 12,6 25,2 Price (RM/per tonnes) 13.000 15.000 16.000 11.000 Revenue 187.200 275.400 201.600 277.200 (-) Variable cost (RM) 144.920 155.426 152.730 157.820 Net profit contribution 42.280 119.974 48.870 119.380 (-) Fixed cost (RM) 45.216 41.901 41.900 42.955 EBIT (Operating surplus)(RM) -2.936 78.073 6.970 76.425 EBIT percentage of revenue -2% 28% 3% 28%
Short mackerel

Bin Ali
32
UNU-Fisheries Training Programme
The sensitivity of factors that may affect the feasibility of the project will be analysed,
such as possible changes in variable cost, selling price and investment in equipment.
Financial requirement of the investment
The total financial requirement for FOMBEs to start the project is Ringgit Malaysia
(RM) 64,686 (Table 11). The owners of the FOMBEs will self-finance the 30%
equity and 70% will be financed through a bank loan from the Agriculture Bank (the
SMEs scheme).
Table 11: The financial requirement for FOMBEs Particulars Financial requirements
Start-up
Investment cost
Working capital
Total financing required
Annual operation
Fixed cost
Variable cost pr. ton of mixed products
Variable cost producing 13.068 tons of mixed products
Total operation producing 13.068 tons of mixed products
RM 51,686
RM 13,000
RM 64,686
RM 45,960
RM 7,191
RM 93.974
RM 145,934
The amount for working capital needed (current assets – current liabilities) is assumed
to be RM 13,000.00 based on the cash flows needed to never become negative. It is
assumed that the yearly depreciations fairly describe the use of the fixed assets. This
means that in year 7 the old equipment is sold for RM 3.068 and new equipment is
bought for the same amount or RM 3.068.
Financial assumptions
The project for FOMBEs assumes a constant mixed production of 20.4 tonnes
annually for dried/salted and salted product of short mackerels. The market price per
kilo of short mackerel for dried/salted mackerel is RM 15.00 and RM 11.00 for salted
(Suriza Suboh, personal communication, FDAM, Perlis, 2011). However, this
project’s average selling price of RM 12.69 per kilo is used based on the product
mix’s 70/30 price. The assumptions and the financial rate used for the measurement of
profitability in the profitability model are shown in Table 12.

Bin Ali
33
UNU-Fisheries Training Programme
The loan interest rate is 4% per annum under the SMEs scheme (Malaysian
Agriculture Bank 2011) and the income tax rate is based on the existing Malaysian
income tax structure (Inland Revenue Board Malaysia 2011).

Bin Ali
34
UNU-Fisheries Training Programme
Table 12 : Financial rates and assumptions Particulars Reference/Sources
Loan
Equity
Loan Interest
Income Tax
Discounted rates
Payment period
Dividend payment
Debtors
Creditors
70%
30%
4%
25%
15%
10 years
30% of profit
25% of turnover
15% of variable cost
Malaysian Agriculture Bank (SMEs scheme)
Self-funding.
Malaysian Agriculture Bank (SMEs scheme)
Malaysian tax structure
Marginal attractive rate of return
Negotiable
Negotiable
30 days credit
30 days credit
The marginal attractive rate of return is assumed to be at 15% based on the best
possible alternative investments in the market. Other assumptions come from the
author based on his experience.
4.6. Profitability analysis
The profitability model is then fed with the assumptions and information from the
detailed investigation returning a net present worth of the total capital and the equity
of RM 15,100 and RM 28,700 respectively and IRR of 20% and 36% respectively
(Table 13).
Table 13 : FOMBEs – Assumptions and results
Assumptions and Results
2011 Discounting Rate 15%
Investment: $RM Planning Horizon 10 years
Buildings 21
Equipment 100% 31 Total Cap. Equity
Other 0 NPV of Cash Flow 15.1 28.7
Total 51.69 Internal Rate 20% 36%
Financing:
Working Capital 13 Capital/Equity (Internal Value of Shares) 6.2
Total Financing 64.69 after 10 years
Equity 100% 30%
Loan Repayments 100% 10 years Minimum Cash Account 0
Loan Interest 100% 4%
Operations: 2012 2013 2014 2015 2016
Sales Quantity 100% 13.07 13.07 13.07 13.07 13.07 Kton/year
Sales Price 100% 12.69 12.69 12.69 12.69 12.69 K$RM/ton
Variable Cost 100% 7.191 $RM/ton
Fixed Cost 100% 45.960 $RM/year
Inventory Build-up 5
Debtors 25% of turnover
Creditors 15% of variable cost
Income Tax 25% of taxable profit
Dividend 30% of profit
Depreciation Buildings 4% of buildings
Depreciation Equipment 15% of equipment for 6 years
Depreciation Other Cost 20% of other cost
Loan Management Fee 2% of loan
This positive NPV means that this investment is feasible over the planning horizon of
10 years.

Bin Ali
35
UNU-Fisheries Training Programme
The operations statement shows that a yearly EBIT of RM 20,000 for all the operating
years. The yearly profits are RM 9,900 in 2012 and 2013 and grow from RM 10,000
in 2013 to RM 10,600 in 2021 (Table 14).
Table 14 : FOMBEs - Operations statement
Operations
2011 2012 2013 2014 2015 2016 2017 2018 2019 2020 2021 Total
Operations Statement
Sales Volume Ktons/year 13.1 13.1 13.1 13.1 13.1 13.1 13.1 13.1 13.1 13.1 131
Price KUSD/ton 12.7 12.7 12.7 12.7 12.7 12.7 12.7 12.7 12.7 12.7
Revenue 166 166 166 166 166 166 166 166 166 166 1658
Variable Cost 7 99 94 94 94 94 94 94 94 94 94 945
Net Profit Contribution 66.8 71.8 71.8 71.8 71.8 71.8 71.8 71.8 71.8 71.8 713
Fixed Cost 46 46 46 46 46 46 46 46 46 46 46 460
Diverse Taxes ##### 0
Operating Surplus (EBITDA) 21 26 26 26 26 26 26 26 26 26 254
Inventory Movement 5 5
Depreciation 5.44 5.44 5.44 5.44 5.44 5.44 5.44 5.44 5.44 5.44 54.4
Operating Gain/Loss EBIT 20 20 20 20 20 20 20 20 20 20 204
Interest + Loan Man. Fee 0.9 1.8 1.6 1.4 1.3 1.1 0.9 0.7 0.5 0.4 0.2 10.9
Profit before Tax -0.9 18.6 18.8 19.0 19.1 19.3 19.5 19.7 19.9 20.1 20.2 193
Loss Transfer 0 -0.9 0.0 0.0 0.0 0.0 0.0 0.0 0.0 0.0 0.0 0.0
Taxfree Dividend 0% 0
Taxable Profit 0.0 17.7 18.8 19.0 19.1 19.3 19.5 19.7 19.9 20.1 20.2 193
Income Tax 25% 0 4.42 4.7 4.74 4.8 4.8 4.9 4.9 5.0 5.0 5.1 48.3
Net Worth Tax 0.00% 0
Profit after Tax -0.9 14.2 14.1 14.2 14.4 14.5 14.6 14.8 14.9 15.0 15.2 145
Dividend 30% 0.0 4.3 4.2 4.3 4.3 4.3 4.4 4.4 4.5 4.5 4.6 43.8
Net Profit/Loss -0.9 9.9 9.9 10.0 10.1 10.1 10.2 10.3 10.4 10.5 10.6 101 The profit before taxes is profitable for all operating years earning RM 193,000 in the
period.
A total of RM 48,300 is estimated to be paid in taxes and RM 43,800 in dividends.
The net profit after taxes for the FOMBE is RM 145,000.
The balance sheet shows that the total assets grow from RM 64,000 in year 2012 to
RM 144,000 in 2021. The equity grows for the same time from RM 18,500 to RM
120,600 respectively (Table 15).
No long term debts are remaining at the end of the period as the original loan has been
repaid in full.

Bin Ali
36
UNU-Fisheries Training Programme
Table 15 : FOMBEs - Balance sheet Balance Sheet
Assets 2011 2012 2013 2014 2015 2016 2017 2018 2019 2020 2021 TOTAL
Cash Account 0 12 0 10 21 32 43 55 38 50 61 73
Debtors (Accounts Receivable) 25% 0 41,5 41,5 41,5 41,5 41,5 41,5 41,5 41,5 41,5 41,5
Stock (Inventory) 0 0 5 5 5 5 5 5 5 5 5 5
Current Assets 12 46 57 68 79 90 101 85 96 108 119
Fixed Assets (Booked Value) 52 46 41 35 30 24 19 41 36 30 25
Total Assets 64 93 98 103 109 114 120 126 132 138 144
Debts
Dividend Payable 0,0 4,3 4,2 4,3 4,3 4,3 4,4 4,4 4,5 4,5 4,6
Taxes Payable 0,0 4,4 4,7 4,7 4,8 4,8 4,9 4,9 5,0 5,0 5,1
Creditors (Accounts Payable) 15% 0,0 14,8 14,1 14,1 14,1 14,1 14,1 14,1 14,1 14,1 14,1
Next Year Repayment 4,5 4,5 4,5 4,5 4,5 4,5 4,5 4,5 4,5 4,5 0,0
Current Liabilities (Short Term Debt) 4,5 28,1 27,5 27,6 27,7 27,8 27,9 28,0 28,1 28,2 23,7
Long Term Debt ( - next year repayment) 40,8 36,2 31,7 27,2 22,6 18,1 13,6 9,1 4,5 0,0 0,0
Total Debt 45,3 64,3 59,2 54,8 50,4 45,9 41,5 37,0 32,6 28,2 23,7
Equity (Shareholders Capital) 0 19,4 19,4 19,4 19,4 19,4 19,4 19,4 19,4 19,4 19,4 19,4
Profit & Loss Balance 0 -0,9 9,0 18,9 28,8 38,9 49,0 59,3 69,6 80,1 90,6 101,2
Total Capital 18,5 28,4 38,3 48,2 58,3 68,4 78,7 89,0 99,5 110,0 120,6
Debts and Capital 64 93 98 103 109 114 120 126 132 138 144
In 2018 the equipment is fully depreciated so new equipment is assumed to cost the
same as the old one did originally. Because of this the yearly total depreciations are
RM 5,443, the same for all operating years. As said before the loan is fully repaid in
2021 bearing a total interest cost of RM 9,962 (Table 16).
Table 16 : FOMBEs - Investment and financing
Investment
2011 2012 2013 2014 2015 2016 2017 2018 2019 2020 2021 Total
Investment and Financing 1 2 3 4 5 6 7 8 9 10
Investment:
Buildings 21 20 19 18 18 17 16 15 14 13 13
Equipment 31 26 21 17 12 8 3 26 21 17 12
Other 0 0 0 0 0 0 0 0 0 0 0
Booked Value 52 46 41 35 30 24 19 41 36 30 25
Depreciation:
Depreciation Buildings 4% 0,84 0,84 0,84 0,84 0,84 0,84 0,84 0,84 0,84 0,84 8,4
Depreciation Equipm. 15% 4,6 4,6 4,6 4,6 4,6 4,6 4,6 4,6 4,6 4,6 46
Depreciation Other 20% 0 0 0 0 0 0
Total Depreciation 5,44 5,44 5,44 5,44 5,44 5,44 5,44 5,44 5,44 5,44 54,4
Financing: 65 64,7
Equity 30% 19,4 19,4
Loans 70% 45,3 45,3
Repayment 10 4,5 4,5 4,5 4,5 4,5 4,5 4,5 4,5 4,5 4,5 45,3
Principal 45,3 40,8 36,2 31,7 27,2 22,6 18,1 13,6 9,1 4,5 0,0
Interest 4% 1,8 1,6 1,4 1,3 1,1 0,9 0,7 0,5 0,4 0,2 9,96
Loan Managem. Fees 2% 0,9
There is a positive or 0 cash flow all the operating years. The total cash flow before
taxes is RM 226,000 and RM 183,000 after tax. After taking into account the interest
payments, the repayment of the loan, the dividends paid and the refinancing of the
equipment, then the total cash movements amount to RM 73,000 (Table 17).

Bin Ali
37
UNU-Fisheries Training Programme
Table 17 : FOMBEs - Cash flow statement Cash Flow
2011 2012 2013 2014 2015 2016 2017 2018 2019 2020 2021 Total
Cash Flow
Operating Surplus (EBITDA) 0 20.9 25.9 25.9 25.9 25.9 25.9 25.9 25.9 25.9 25.9 254
Debtor Changes -41.5 0 0 0 0 0 0 0 0 0 -41
Creditor Changes 14.8 -0.75 0 0 0 0 0 0 0 0 14
Cash Flow before Tax 0 -5.75 25.1 25.9 25.9 25.9 25.9 25.9 25.9 25.9 25.9 226
Paid Taxes 0.0 4.4 4.7 4.7 4.8 4.8 4.9 4.9 5.0 5.0 43
Cash Flow after Tax 0 -5.75 20.7 21.2 21.1 21.1 21 21 20.9 20.9 20.8 183
Interest + Loan Man. Fee 0.9 1.8 1.6 1.4 1.3 1.1 0.9 0.7 0.5 0.4 0.2 11
Repayment 0.0 4.5 4.5 4.5 4.5 4.5 4.5 4.5 4.5 4.5 4.5 45
Net Cash Flow -0.9 -12.1 14.5 15.2 15.3 15.5 15.6 15.7 15.9 16.0 16.1 127
Paid Dividend 0.0 4.3 4.2 4.3 4.3 4.3 4.4 4.4 4.5 4.5 39
Financing - Expenditure (W.Cap.) 13 -27.6 -15
Cash Movement 12.1 -12.1 10.3 11.0 11.1 11.1 11.2 -16.3 11.4 11.5 11.6 73
(changes in Cash Account)
For a further study on the profitability, the total cash flow from operations (after
taxes) is RM 183,000 and RM 127,000 for the net cash flow. Using 15% as the
discounting rate the NPV of the total cash flows will first become positive in the year
2019 ending in RM 15,000 in 2021 having an IRR of 36%. For the NPV of the equity
cash flows it is first positive in 2016 and goes to RM 29,000 in 2021 (Table 18).
Table 18 : FOMBEs - Profitability statement
Profitability
2011 2012 2013 2014 2015 2016 2017 2018 2019 2020 2021 Total
Profitability Measurements
NPV and IRR of Total Cash Flow
Cash Flow after Taxes 0 -5,75 20,68 21,16 21,1 21,1 21 21 20,9 20,9 20,8 183
Loans -45,3
Equity -19,4
Total Cash Flow & Capital -64,7 -5,75 20,68 21,16 21,1 21,1 21 21 20,9 20,9 20,8 118
NPV Total Cash Flow 15% -56 -61 -47 -35 -24 -15 -7 -1 5 11 15
IRR Total Cash Flow 5% 11% 15% 17% 19% 20%
NPV and IRR of Net Cash Flow
Net Cash Flow -0,9 -12,1 14,5 15,2 15,3 15,5 15,6 15,7 15,9 16,0 16,1 127
Equity -19,4
Net Cash Flow & Equity -20,3 -12,1 14,5 15,2 15,3 15,5 15,6 15,7 15,9 16,0 16,1 107
NPV Net Cash Flow 15% -18 -27 -17 -9 -1 6 12 17 21 25 29
IRR Net Cash Flow 23% 28% 31% 34% 35% 36%
The sensitivity of the profitability and internal rate of return is of importance. Sales
price, sales quantity and variable costs are analysed for sensitivity of the IRR for
equity (Table 19).

Bin Ali
38
UNU-Fisheries Training Programme
Table 19 : FOMBEs impact analysis in sales price, sales quantity and variable cost
Impact Analysis
Change Sales Price Sales Quantity Variable cost
36% 36% 36%
-50% 50% NA 50% NA 50% 177%
-40% 60% NA 60% NA 60% 144%
-30% 70% NA 70% NA 70% 114%
-20% 80% NA 80% 1% 80% 86%
-10% 90% -8% 90% 19% 90% 60%
0% 100% 38% 100% 38% 100% 38%
10% 110% 77% 110% 52% 110% 13%
20% 120% 123% 120% 68% 120% NA
30% 130% 173% 130% 85% 130% NA
40% 140% 226% 140% 103% 140% NA
50% 150% 281% 150% 121% 150% NA
It can be seen that just a small decrease in the price of the products leaves the IRR
negative and when the decrease is more than 10% no IRR can be calculated since the
cash flow of equity is negative every year. From the graph shown in figure 5, it is
evident that the project is highly sensitive to a small decrease in sales price. This is
also the case for the sales quantity even if it is not quite as sensitive. An increase of
20% in the variable cost also means that the IRR of the equity cannot be calculated
since every cash flow is negative but at that point the IRR for the total cash flow is -
5%.
-50%
0%
50%
100%
150%
200%
250%
300%
-50% -40% -30% -20% -10% 0% 10% 20% 30% 40% 50%
IRR
of
Eq
uit
y
Deviation
Impact Analysis on IRR of Equity
Sales Price
Sales Quantity
Variable cost
Figure 6 : FOMBEs impact analysis on IRR and equity

Bin Ali
39
UNU-Fisheries Training Programme
From the detailed investigation calculations, a break-even point (BEP) can be found.
The formula for deriving the BEP in quantity is:
Contribution margin = Revenue – variable cost
= RM 12,686 – RM 7,191
= RM 5,495
Break even (quantity) = Total fixed cost ÷ contribution margin
= RM 45,960 ÷ RM 5,495
= 8.36 tons
For the FOMBEs the selling price of the mix-product is at RM 12,686 per ton of the
dried/salted and salted short mackerel products. The variable cost of the production is
RM 7,191 per ton and the net contribution margin is therefore RM 5,495. The BEP
analysis using assumptions on variables and fixed costs shows the quantity of BEP is
8.36 tons. For every ton after the first 8.36 tons a profit of RM 5,495 is added.

Bin Ali
40
UNU-Fisheries Training Programme
5. DISCUSSION
The Malaysian fisherman as a stakeholder remains as one of the most important actors
in the Malaysian economy and his struggle for survival has proven to be challenging.
In this study the author has examined data on the Malaysian capture fisheries. During
the study period weaknesses have been found that need to be looked at by FDAM,
DOF and other related agencies working to enhance the fisheries sector in Malaysia.
The Malaysian marine capture fisheries are categorized into three grades; I, II and III.
This is very ambiguous. The definition of the fish grades are not well defined neither
according to the size and quality nor the price. For instance, sardines and mackerel are
considered as grade III fish due to their small size. The definition becomes very vague
because the species are small in size and grades III only looks at the size but not the
species. In terms of quality all fish start out with the same quality provided the catch
is well preserved from harvesting to the table. Although the quality may differ in
terms of methods used to catch the fish (purse seiners or trawlers) advance
preservation technology on-board the fishing vessels should be able make the quality
of the catch equally good. The grading process of the same species of fish mixes
grade II and grade III fish and this affects the price that the fisherman gets. Based on
the author’s visits at an Icelandic fishing company he found that in Iceland the grades
of fish are first defined by individual species and then by size.
In most countries in the Asian region including Malaysia, species harvested or caught
as by-catch constitute more than 30 species of small pelagic and demersal fish which
is normally smaller than 25 cm in size. This fish is an important supply of protein to
the marginal community due to its low commercial value and is normally consumed
fresh. Due to seasonality the traditional processors do not have the capability to
increase production. At this juncture, a formation of FOMBEs in Malaysia is a crucial
opportunity to strengthen the industry’s production capacity. The current increase of
food prices globally can become a great advantage for FOMBEs in Malaysia and a
reason for them to produce better quality fish products from available resources.
Today traditional small scale processors of cured (dried/salted/smoked) products in
Malaysia operate from the home and have only limited access to information,
infrastructure and facilities regarding the surrounding environment of the domestic
and international demand for fisheries products. In the State of Perlis, due to low local
demand for smoked short mackerel the processors have stopped producing the product
instead of trying to see if they can export the products (Suriza Suboh, personal
communication with FDAM staff in Perlis 2011). The demand for ready-to-eat
products (healthy food) is increasing globally due to changes for the younger
consumer preferences. This also holds true for smoked fish. The traditional small
scale processors of croaker fish in Rompin, Pahang do not process the by-product of
the fish swim bladder (the fish-maw) although it can fetch a good price in Hong Kong
(Rosnani Bidin, personal communication Rompin, Area Fisherman Association).
There is a barrier in the flow of information between small scale processors and the
consumers regarding the preferences of the latter. Icelandic fisheries companies
process all the by-product and export it globally, like dried fish head/backbone, skin,
liver etc. Small Icelandic family business companies processing salted and smoked
salmon, herring and arctic charr have yields higher than 80% because the raw
materials used are in fillet form and from fish that are bigger in size.

Bin Ali
41
UNU-Fisheries Training Programme
In Malaysia during high season, the wife or the family members process the fish as
dried or salted, as that is the most common way to preserve the fish. The product is
sold to local dealers or directly to consumers. The revenue from the business normally
goes towards sustaining the livelihood of the family. The traditional processors lack
knowledge for doing business calculations regarding processing fisheries products.
The cost of raw material is not calculated as the fish is brought back from one of the
family members who is a fisherman. Also the yields that are important for the final
out-put are not calculated. Because of this lack of knowledge the fishing industry does
not grow as it could in the country. Often the traditional processors are only
processing the fish on a part time basis. During high season when the catch is in
abundance they process the excess from the catch just to compliment the family
resources.
The best quality fisheries products will be produced from fresh fish. Good quality
means that the fish has to be preserved correctly from harvesting at sea until it has
reached the processors and the same goes for the chain from the processors to the
consumers. Harvesting by trawlers can affect the quality of the smaller fish which are
pressed at the cod end of the trawl net. The by-catch species mostly harvested by
trawl nets is the croaker fish, threadfin bream, large head hair tail, rays and other
small demersal species. In Malaysian fisheries, the small and medium size bottom
trawlers operate within the coastal areas. The bottom trawlers affect the sea bed and
damage the biodiversity of the aquatic life. Today responsible and sustainable
fisheries are very important as the fish stocks keep on declining due to overfishing.
From the environmental perspective Perlis was chosen as a site location for the
FOMBEs profitability calculations and not Perak. This was done both because the
fishing gears used in Perlis are more environmentally friendly and the harvest of the
target species is more consistent.
The quality of catch also depends on the post-harvest handling procedures. If the fish
is chilled immediately after harvesting then it is likely to be of good quality for
producing fisheries products. In the long run the processors need a constant supply of
raw materials and in Malaysia short mackerel will be the best choice since it is the
most harvested species. Among the fisheries product that are popular dried/salted in
the domestic market are croaker fish, mackerels and scads. Dried croaker is popular in
domestic and regional markets due to its white flesh. Fish with high oil content such
as round scads and mackerels are suitable for smoking and the products are popular in
the Japanese market. All the ten species chosen for the first gate in the Stage-Gate
plan have possibilities to be produced as quality and value added products. Even if the
short mackerel was chosen for the FOMBE calculations the croaker fish can be an
interesting alternative or a second product to be introduced to the production of either
the FOMBE or for the traditional processors.

Bin Ali
42
UNU-Fisheries Training Programme
6. CONCLUSIONS AND RECOMMENDATIONS
The project tried to look for the best opportunities in fish processing for the FOMBEs
(family owned micro-business enterprises) in West Malaysia. This was done by using
a particular low value fish species for value creation. The systematic Stage-Gate
model procedure was used as a tool to find out the best output options for micro-
businesses owned by the fishermen families.
The first level of the Stag-Gate model is ideation. The ideation process reveals all the
required information regarding the main issues of the low value catches in West
Malaysia. It looks at types of species, the average ex-vessel price, harvesting methods,
and the most harvested locations in West Malaysia. The trawls and the fish purse
seiners harvest most of the catch of the capture fisheries and those are landed in
Perak, Perlis, Selangor and Pahang. Perlis was chosen as a selected area because the
short mackerel is landed there mostly by purse seiners and also that there the ex-
vessel price for the short mackerel is the lowest at RM 3.00 per kilogram (Suriza
Suboh, personal contact from FDAM Perlis, Malaysia, 2011).
To find out the feasibility of the project, assumptions and information are used for
calculations and are simulated with the profitability model. The results from the
simulation are that this investment should be undertaken and a FOMBE established
producing from 40 tons of short mackerel a year. Because of the sensitivity to changes
in sales price, sales volume and variable cost it is recommended to double check the
assumptions that were partly decided on after short interviews with FDAM and AFA
staff in Malaysia and redo the calculations if deemed necessary. The break-even point
(BEP) is the minimum production output for FOMBEs. At that point all costs have
been covered but no profit made. The BEP for the FOMBE is 8,352 tons annually.
The project must achieve an IRR based on the expected return on investment and the
NPV cash inflows must correspond to the expected IRR. If the decision criteria are set
at IRR 20%, thus achieving positive NPV in cash inflows at the end of the planning
horizon, then this project should proceed. In this project FOMBEs achieved IRR of
equity of 20% at the end of the planning horizon. The sensitivity analysis shows that
the project is sensitive to the sales price, sale volume and the variable cost. If the sales
price is reduced by 8.5% the IRR will be 0% and the project not viable.
This study shows the opportunities in establishing FOMBEs in Malaysia working on
projects adding value from low value fish. The opportunities for the FOMBEs do not
only lie in processing short mackerel but it is also likely that it can be profitable to
process both croaker fish and round scad. This has to be looked into more closely. It is
the opinion of the author that it can be profitable for the FOMBEs to process quality
trash fish for fish sauce, dried and salted products. The World Bank reported in
December 2010 that the global increase of food price index had risen by 17%. For the
FOMBEs this should raise awareness of the possibilities of producing products fit for
export and higher domestic markets.
Today there is a good opportunity to establish FOMBEs in Malaysia by using the
SME funds that are provided by the government. For this the traditional processors in
Malaysia need tore structure their operations and form a cluster of FOMBEs. With
changes of consumers’ preferences like ready-to-eat and prepared products there are
great opportunities for FOMBEs in Malaysia.

Bin Ali
43
UNU-Fisheries Training Programme
FDAM and the research institute MARDI should focus on the development of the
value addition of the specific individual species such as scads, mackerels, sardines,
croakers and threadfin bream which have high commercial value at domestic and
international markets. FDAM and MARDI have to collaborate and provide technical
assistance to the traditional processors as well as to the future FOMBEs in capacity
building. Research and development regarding the value creations of fisheries
products in accordance with high quality standards is very crucial. Greater
collaborations between Malaysian fisheries authorities and international communities,
like Iceland Marine Research Institute, Icelandic Food and Biotech research and
Development (MATIS) and higher learning institutions is of great importance for the
benefits of the fisherman and the country in fisheries economics.

Bin Ali
44
UNU-Fisheries Training Programme
ACKNOWLEDGEMENTS
I thank God for the strength he has provided me during this research work. I have
been blessed with the presence of many people who have assisted me with this
research. I would like to express my sincere gratitude to all who have contributed to
this work, especially to Director General of Fisheries Development Authority of
Malaysia (FDAM) for giving me the opportunity to work on my research in Iceland. I
would like to thank my supervisors, Professor Helgi Gestsson and Professor
Ogmundur Knutsson, for their guidance, opinions and efforts that they contributed to
this project. I would sincerely like to thank Dr. Tumi Tomasson, Director of the UNU-
FTP, Mr. Thor Asgeirsson, Deputy Director, and staff of the Icelandic Marine
Research Institute for giving me the opportunity to study in this programme and for
being very good hosts that made my stay here a pleasant and memorable one. I would
like to thank all fellows at University of Akureyri for their friendship and cooperation.
Last but not least my gratitude goes to my wife, Madam Norsiah bte Abu Samah for
her moral support and guidance of our children for the last six months.

Bin Ali
45
UNU-Fisheries Training Programme
LIST OF REFERENCES
Agustini, T.W., Susilowati, I., Subagyo and Setyati, W.A. 2008. IIFET 2008 Vietnam
proceedings: Will soft-boned milkfish- a traditional food product from Semarang city,
Indonesia- breakthrough the global market? Vietnam.
Andrew, T.K.G. and Helen, L.S.H. 2005. Determinants of Malaysian household
expenditures on freshfish, shellfish and processed fish. [January 3, 2011]
<http://eprints.usm.my/8885/1/DETERMINANTS_OF_MALAYSIAN_HOUSEHOL
D_EXPENDITURES_2005.pdf>
APFIC 2005. Asia-Pacific Fishery Commission. Low value and “trash fish” in the
Asia-Pacific region. Rap publication. 2005/21. Bangkok.
Arvanitoyannis, I.S. 2009. HACCP and ISO 22000. Application to foods of animal
origin. Blackwell Publishing Ltd. United Kingdom. ISBN 978-1-4051-5366-9.
Bank Negara M 2005. Status and performance of small and medium enterprise.
[December 24, 2010]. <
http://www.bnm.gov.my/files/publication/sme/en/2005/chap_2.pdf>
Botta, J. R., G. Bonnell, et al. 1987a. "Effect of method of catching and time of season
on sensory quality of fresh raw Atlantic cod (Gadus morhua)." Journal of Food
Science 52(4): 928-931.
Caswell, Julie A. (2006). “Quality assurance, information tracking, and consumer
labelling”. Marine Pollution Bulletin. 53 (10-12): 650-656.
Caswell, J.A. and Anders, S.M. 2009. The economics of market information related to
certification and standards in fisheries. Round table on eco-labelling and certification
in the fisheries sector. Organisation for economic co-cooperation and development
(OECD). The Hague, Netherlands. 22-23 April, 2009.
Clarke, S. 2009. Understanding pressures on fishery resources through trade statistics.
A pilot study of four products in the Chinese dried seafood market. [January 17, 2011]
www.iccs.org.uk/shelleyclarke.htm
Cooper, R.G. 1997. Winning at New Products. Accelerating the Process from Idea to
Launch (2nd
Edition). USA, Canada. ISBN 0-201-56381-9.
Department of Fisheries (DOF). 2000. Statistics 2000, Kuala Lumpur. Department of
Fisheries. [December 14, 2010]. <http://www.dof.gov.my/home>.
Department of Fisheries (DOF). 2001. Statistics 2001, Kuala Lumpur. Department of
Fisheries. [December 14, 2010]. <http://www.dof.gov.my/home>.
Department of Fisheries (DOF). 2002. Statistics 2002, Kuala Lumpur. Department of
Fisheries[December 13, 2010]. <http://www.dof.gov.my/home>.

Bin Ali
46
UNU-Fisheries Training Programme
Department of Fisheries (DOF). 2003. Statistics 2003, Kuala Lumpur. Department of
Fisheries. [December 13, 2010]. <http://www.dof.gov.my/home>.
Department of Fisheries (DOF). 2004. Statistics 2004, Kuala Lumpur. Department of
Fisheries. [December 12, 2010]. <http://www.dof.gov.my/home>.
Department of Fisheries (DOF). 2005. Statistics 2005, Kuala Lumpur. Department of
Fisheries. [December 12, 2010]. <http://www.dof.gov.my/home>.
Department of Fisheries (DOF). 2006. Statistics 2006, Kuala Lumpur. Department of
Fisheries. [December 11, 2010]. <http://www.dof.gov.my/home>.
Department of Fisheries (DOF). 2007. Statistics 2007, Kuala Lumpur. Department of
Fisheries. [December 11, 2010] <http://www.dof.gov.my/home >.
Department of Fisheries (DOF). 2008. Statistics 2008, Kuala Lumpur. Department of
Fisheries. [December 10, 2010] <http://www.dof.gov.my/home >.
Department of Fisheries (DOF). 2009. Statistics 2009, Kuala Lumpur. Department of
Fisheries.[December 10, 2010] <http://www.dof.gov.my/home>.
Delgado, C.L., Wada, N., Rosegranr, M.W., Meijer, S. and Ahmed, M. 2003. Fish to
2020. Supply and demand in changing global markets. ISBN 0-89629-725-X
[December 26. 2010]
<http://www.ifpri.org/sites/default/files/publications/oc44.pdf>
Encarta 2010. Encarta Dictionary MSN [December 21, 2010]. <
http://encarta.msn.com/dictionary_561533544/microbusiness.html>
Fish Base 2010. FishBase. http://www.fishbase.org/summary/Rastrelliger-
brachysoma.html
Food and Agriculture Organization (FAO). 2005. Asian fisheries today: The
production of low value/trash fish from marine fisheries in the Asia-pacific region.
RAP Publications 2005/16, Bangkok. [December 27,
2010].<http://www.fao.org/docrep/008/ae934e/ae934e04.htm>.
Food and Agriculture Organization (FAO). 2008. Present and future markets for fish
and fish products from small-scale fisheries- case studies from Asia, Africa and Latin
America. ISBN 978-92-5-106024-7. [January 16, 2011]
<http://ibcperu.org/doc/isis/9819.pdf>
Food and Agriculture Organization (FAO). 2010. The state of world fisheries and
aquaculture 2010. [January 6, 2010] <
http://www.fao.org/docrep/013/i1820e/i1820e00.htm.>
Ghani, S. 1995. Small-scale food processing enterprises in Malaysia. Food &
Fertilizer Technology Centre, Taiwan. [January 3, 2011][email protected]

Bin Ali
47
UNU-Fisheries Training Programme
Goh, K. H. and Tan-Low L.K. 2008. Maximizing the utilization of fish catch for
human consumption. In: Fish for the People. Vol. 6 No. 3 SEAFDEC, Bangkok,
Thailand. [January 3, 2011]
Hotta, M. 2000. The sustainable contribution of fisheries to food security in the Asia
and Pacific Regional: Regional synthesis. [January 7, 2011]<
http://www.fao.org/docrep/003/x6956e/x6956e02.htm#P0_0>
Ibrahim, H. and Fazilah, A.S. 2010. Family business in emerging markets: The case of
Malaysia.[December 24, 2010].< http://www.academicjournals.org/ajbm/PDF>.
Inland Revenue Board Malaysia 2011. www.hasil.gov.my
International Labour Organization (ILO) – World Employment Programme (WEP).
1982. Small scale processing of fish [January 16, 2011]<.
http://puka.cs.waikato.ac.nz/gsdlmod?e=d-00000-00---off-0fnl2.2--00-0----0-10-0---
0---0direct-10---4-------0-1l--11-ro-50---20-preferences---10-0-1-00---4----0-0-11-1-
0windowsZz-1253-
00&a=d&c=fnl2.2&cl=CL1.4&d=HASH01376f2d816ed97cdf1a0adc>
Jonsson, M.,Finnbogadottir, G.A., Porkelsson, G., Magnusson, H., Reykdal, O., and
Arason, S., 2007. Dried fish as health food. ISSN 1670-7192.
Knútsson, Ö. 2001. Strategic Alliances; The role of central firm in governing strategic
alliances between small and medium size companies; The case in the Icelandic fish
industry. [January 3, 2011]. <
http://staff.unak.is/hreidar/Skjol/Ogmundur_Phd_Thesis.pdf >.
Lindkvist KB, Gallart-Jornet L, and Stabell MC. 2008. The restructuring of the
Spanish salted fish market. The Canadian Geographer/Le Géographe canadien, 52(1),
105-120.
Menasveta, D. 2001. The sustainable of fisheries to food security in Southeast Asia.
AFS Special publication. Vol.11, 2001. [January 3, 2011]. <
http://www.fao.org/docrep/003/x6956e/x6956e07.htm#P0_0>.
Malaysia industrial development authority (MIDA). 2010. [December 26, 2010]
<http://www.mida.gov.my>.
Malaysian Agriculture Bank 2011. http://www.agrobank.com.my/
Mohammad Samaun Safa 2004. Potential fishery industry activities and financial
aspects of east Malaysian marine fisheries. MPRA. Munich Personal PeFEc Arcive.
University Putra Malaysia, International Institute of Fisheries Economics and Trade.
26. July 2004. http://mpra.ub.uni-muenchen.de/10887/1/MPRA_paper_10887.pdf
Montfort, M. C. 2006. IIFET 2006 proceedings. Adding value to salmon helps capturing
market shares. [January 19, 2011] <http://bit.ly/hf8SAT>

Bin Ali
48
UNU-Fisheries Training Programme
Musa, C.U. and Nuruddin, A.A. 2005. Regional workshop on low value and trash
fish in the Asia-Pacific region. [December 27,2010].
<http://www.apfic.org/apfic_downloads/2005_trash_fish/Malaysia >.
Oliver, M.S. and Horngren, C.T. 2010. Managerial accounting. Pearson Prentice hall.
New Jersey. ISBN 10: 0-13-801178-8
Price Waterhouse Coopers 2007. National Association of Retail Grocers of Australia.
The economic contribution of small to medium-sized grocery retailers to the
Australian economy, with a particular focus on western Australia. [December 25,
2010].< http://www.narga.net.au/>.
QFinance 2010. Valuation: Measuring and Managing the Value of Companies
Tim Koller, Marc Goedhart, and David Wessels (5th ed 2010, originally 1990).
http://www.qfinance.com/asset-management-finance-library/valuation-measuring-
and-managing-the-value-of-companies
Richmond, D. 1997. The Singapore market for dried fish; Prepared for Alaskan dried
foods. [January 18,2011]<http://bit.ly/giGRvo>
Seafish 2010. Nutrition.[February 7,2011]< http://www.seafish.org/about-
seafish/nutrition>
Sivasubramaniam, K. 2000. The sustainable contribution of fisheries to food security
in the South Asian region. [February 7, 2011]<
http://www.fao.org/docrep/003/x6956e/x6956e08.htm#TopOfPage>
Small Medium Enterprise Corporation (SME). 2010, Small and Medium Enterprise
Corporation, Malaysia [December 21, 2010].< http://www.smecorp.gov.my/node/33>.
Thorarinsdottir, K.A, Bjorkevoll, I. Arason, S., 2010. Production of salted fish in the
Nordic countries.Variation in quality and characteristics of the salted products. ISSN
1670-7192.
US Legal 2010. [December 24, 2010] < http://definitions.uslegal.com/f/family-
owned-businesses/>
Valdimarsson and Gunnarsdottir, 1982. Áhrif mismunandi blóðgunar and slægingar á
gæði ferskfisks, frystra flaka og saltsfisks. The Icelandic Fisheries Laboratories.
Tæknitíðindi 141. Page 18.
Vidarsson, J.R. 2008. Environment and natural resources: Environmental labelling in
the seafood industry-Iceland’s perspective. MATIS, Iceland.[January 20, 2011]<
http://www.matis.is/media/utgafa/krokur/Jonas-Runar-Environmental_labelling.pdf>
Viewpoint Banks 2010. Glossary of Terms.[December 24, 2010]. <
http://viewpointbank.mediaroom.com/index.php?s=glossary>
World Fact Book 2010. Malaysia [January 4, 2011].
<https://www.cia.gov/library/publications/the-world-factbook/geos/my.html>

Bin Ali
49
UNU-Fisheries Training Programme
World Bank 2010. [January 4, 2011]. <http://data.worldbank.org/country/malaysia

Bin Ali
50
UNU-Fisheries Training Programme
APPENDICES
Appendix 1: Quantity (metric tonnes) of landings of marine fish by states and
fishing gears in West MALAYSIA, 2009
Fishing gears Trawls
Fish
Purse Anchovy Other
Drift/Gill
net Other Total
States Seine
Purse
seine
Purse
Seine Gears
Perlis 57,335 95,565 0 89 24,921 337 178,247
Kedah 54,751 5,188 7,472 426 19,231 19,418 106,486
Pulau Pinang 16,868 1,940 0 3,952 11,725 8,305 42,790
Perak 139,856 59,718 838 22,294 22,576 12,804 258,086
Selangor 104,860 6,163 0 13 11,450 8,864 131,350
Negeri
Sembilan 0 0 0 17 517 76 610
Melaka 0 0 0 0 1,415 276 1,691
Johor Barat 5,675 0 0 0 3,944 679 10,298
Kelantan 19,373 26,107 1,436 0 2,689 9,286 58,891
Terengganu 14,609 42,494 1,106 0 11,477 14,633 84,319
Pahang 88,907 19,524 519 156 1,665 3,567 114,338
Johor Timur 45,741 26,894 0 0 1,298 3,383 77,316
Total 547,975 283,593 11,371 26,947 112,908 81,628 1,064,422
Percentage
(fishing gears) 51.48 26.64 1.07 2.53 10.61 7.67 100

Bin Ali
51
UNU-Fisheries Training Programme
APPENDIX 2:QUANTITY (METRIC TONNES) OF LANDINGS OF MAJOR
MARINE CAPTURE FISHERIES BY FISHING GEAR GROUP AND
SPECIES IN WEST MALAYSIA, 2009 (DOF 2009)
Fishing gears Trawls
Fish
Purse
Seine
Anchovy
Purse
seine
Other
Purse
Seine
Drift/Gill
net
Other
Gears
Total
Species
Threadfin bream 19,281 49 0 0 1,941 6,302 27,573
Tiger tooth croaker 18,806 29 0 0 0 23 18,858
Goatfish 11,575 30 0 0 48 108 11,761
Croaker/jewfish 11,790 18 292 2,416 5,516 519 20,551
Temenggong/lara
bara 10,455 31 0 0 0 4 10,490
Indian mackerel 13,490 22,574 35 0 9,285 1,513 46,897
Short mackerel 19,504 55,124 98 1 53,866 0 128,593
Yellow tail scad 4,032 10,032 0 0 780 1,268 16,112
Hard tail scad 6,653 16,470 0 0 462 889 24,474
Sea cat fish 3,255 27 1,041 426 2,743 953 8,445
Ox eye scad 6,769 11,392 0 0 179 37 18,377
Spanish mackerel 3,103 248 0 1 2,467 891 6,710
Large head hair tail 5,728 164 22 0 416 33 6,363
Rays 5,717 8 34 17 831 1,358 7,965
Yellow stripe scad 5,484 5,674 0 0 157 448 11,763
Fringe scale sardine 488 14,325 139 0 96 421 15,469
Long tail tuna 653 19,550 0 0 153 662 21,018
Kawa-kawa 117 14,670 0 0 480 1,148 16,415
Round scad 2,986 61,963 0 0 16 1,632 66,597
Small yellow tail
scad 1,849 3,129 0 0 13 0 4,991
Barracuda 2,478 216 0 9 205 217 3,125
Anchovy 185 119 7,685 0 5,411 0 13,400
Trash fish 211,029 16,128 1,654 12,928 1,627 5,419 248,785
Miscellaneous fish 26,997 19,033 262 259 5,762 1,509 53,822
Total 392,424 271,003 11,262 16,057 92,454 25,354 808,554
Excluding molluscs, crustaceans and sea shells

Bin Ali
52
UNU-Fisheries Training Programme
APPENDIX 3: AVERAGE EX-VESSEL PRICE (MALAYSIAN RINGGIT) PER KILOGRAM OF FISH BY SPECIES FROM
MARINE CAPTURE FISHERIES, PENINSULA MALAYSIA 2009 (DOF 2009)
Month/Species Jan Feb Mar Apr May Jun July Aug Sept Oct Nov Dis Average
Threadfin bream 5.29 5.08 4.99 5.26 5.12 5.20 5.10 4.74 5.14 5.00 5.26 5.30 5.12
Tiger tooth croaker 1.14 1.11 1.19 1.09 1.26 1.11 1.13 1.07 1.21 1.17 1.18 1.08 1.15
Goatfish 1.96 1.93 1.94 1.98 1.97 1.84 1.93 1.92 1.91 1.92 2.09 1.70 1.93
Croaker/jewfish 3.32 3.28 3.20 3.23 3.23 3.23 3.20 3.63 3.35 3.36 3.50 3.33 3.32
Temenggong/lara bara 1.38 1.66 1.53 1.44 1.48 1.58 1.44 1.53 1.57 1.37 1.48 1.45 1.49
Indian mackerel 6.68 6.61 6.56 6.59 6.61 6.75 6.51 6.34 6.47 6.25 6.73 6.18 6.52
Short mackerel 3.51 3.22 3.02 3.26 3.36 3.61 3.36 3.54 3.84 3.87 3.96 3.75 3.53
Yellow tail scad 5.54 5.38 5.35 5.87 5.84 5.87 5.97 5.45 5.75 5.30 5.92 5.59 5.65
Hard tail scad 4.06 3.84 3.79 3.99 4.01 4.14 4.04 3.79 3.99 3.80 4.07 3.98 3.96
Sea cat fish 4.25 4.22 4.21 3.98 4.05 4.16 4.09 4.02 4.19 4.05 4.07 4.21 4.13
Ox eye scad 3.55 3.23 3.56 3.41 3.30 3.41 3.41 3.44 3.49 3.26 3.39 3.33 3.40
Spanish mackerel 13.12 13.29 13.54 13.29 13.35 13.25 13.33 13.15 13.60 13.29 13.58 13.04 13.32
Large head hair tail 2.99 2.96 2.86 2.99 2.90 2.87 2.82 2.87 3.00 2.77 2.73 2.85 2.88
Rays 5.27 5.20 4.95 4.91 5.07 5.02 5.02 5.18 5.31 5.31 5.65 5.84 5.23
Yellow stripe scad 4.38 4.31 4.25 4.25 4.26 4.32 4.26 4.32 4.30 3.95 3.75 3.65 4.17
Fringe scale sardine 3.18 2.92 2.79 2.90 3.01 2.96 2.92 2.82 3.00 3.05 2.68 2.61 2.90
Long tail tuna 6.20 5.96 5.60 5.94 5.77 5.78 5.70 6.01 5.94 5.39 5.51 5.88 5.81
Kawa-kawa 5.62 5.32 5.06 5.43 5.20 5.25 5.10 5.17 5.30 4.72 5.04 4.60 5.15
Round scad 4.71 4.54 4.75 4.45 4.54 4.59 4.60 4.53 4.31 4.33 4.04 4.08 4.46
Small yellow tail scad 4.78 4.42 4.74 4.74 4.75 4.90 5.19 5.06 5.27 4.72 5.23 5.02 4.90
Barracuda 6.05 5.64 5.48 5.33 5.43 5.40 5.37 5.64 5.80 5.42 5.16 5.52 5.52
Anchovy 5.02 5.58 5.22 4.54 6.47 5.47 5.13 5.55 5.64 5.35 5.76 5.68 5.45
Trash fish 0.55 0.55 0.56 0.52 0.56 0.56 0.56 0.58 0.59 0.56 0.58 0.61 0.57
Miscellaneous fish 2.48 2.45 2.56 2.72 2.74 2.73 2.68 2.55 2.78 2.77 2.65 2.56 2.64

Bin Ali
53
UNU-Fisheries Training Programme
APPENDIX 4: PROCESSED PRODUCT FROM MARINE CAPTURE
FISHERIES, PENINSULA MALAYSIA , 2000-2009 (METRIC TONNES)
Methods of
Processing 2000 2001 2002 2003 2004 2005 2006 2007 2008 2009
Salted/Dried 4,391 4,586 3,511 4,141 3,510 3,386 4,807 7,307 8,969 13,461
Dried Anchovies 5,564 4,467 7,665 6,586 7,685 5,885 5,952 8,381 13,226 13,360
Dried Prawns 442 346 251 351 251 1,610 1,768 1,550 990 1,349
Dried Cuttle fish 184 313 139 140 139 69 93 431 1,376 739
Dried Jelly fish 615 630 81 218 81 310 332 653 462 1,800
Dried Shell fish 122 56 0 0 0 580 113 570 428 1,162
Smoked Fish 14 22 0 0 0 0 0 0 183 58
Fertilizer 14,610 11,572 14,109 12,997 14,109 12,712 12,718 27,108 18,687 18,625
Fish Meals 170,807 183,859 206,529 196,392 206,529 112,178 154,563 161,239 143,010 211,682
Shrimp Paste 3,271 2,783 1,943 2,880 1,943 1,400 1,645 9,995 26,575 27,305
Pickled Prawn 54 54 105 50 105 14 26 54 38 216
Fermented
Anchovies 173 549 707 1,157 707 706 1,100 4,266 2,193 4,309
Fish Ball 7,235 9,083 9,731 9,605 9,731 11,517 11,094 24,554 16,470 17,407
Fish Cake 815 966 191 314 191 532 247 2,818 509 434
Fish Paste(Otak-
Otak) 247 205 112 363 112 496 662 1,938 2,048 1,824
Fish Surimi 1,105 1,107 1,467 1,665 1,467 7,565 1,685 3,802 2,615 3,993
Fish Crackers 8,904 15,494 18,459 22,667 18,460 24,741 25,760 43,869 46,135 54,808
Prawns/Cuttlefish
Crackers 18 52 58 16 14 19 14 43 77 88
Satay Fish 1,210 1,574 1,498 1,543 1,498 316 315 2,117 2,344 2,729
Frozen Cuttlefish 1,497 1,185 966 821 966 1,460 1,000 4,752 1,713 6,398
Frozen
Prawns/Mussels 1,562 923 572 1,077 762 2,064 982 10,388 4,669 4,012
Moruku 0 0 5,868 8,957 5,868 5,874 76 31 35 52
Nugget 0 0 71 231 71 0 0 1 17 10
Fish Steamed 1,519 1,930 2,340 2,602 2,340 3,848 3,849 4,371 3,932 5,951
Total 224,359 241,755 276,373 274,773 276,539 197,282 228,801 320,238 296,701 391,772

Bin Ali
54
UNU-Fisheries Training Programme
APPENDIX 5: DISPOSITION OF MALAYSIAN CAPTURE FISHERIES
ACCORDING TO SPECIES
Species/Method con
sum
ed
Fre
sh
salt
ed/d
ried
smo
ked
Fer
men
ted
suri
mi
sata
y f
ish
stea
med
/
bo
iled
fish
cra
cker
s
fish
ba
ll
fish
ca
ke
nu
gg
et
ota
k-o
tak
fish
mea
ls
feed
mil
ls
ferti
lize
r
Threadfin bream x x
Tiger tooth
croaker x x x x x x
Goat fish x x x
Croaker/jewfish x x x x x x x
Temenggong/lara
bara x
Indian mackerel x x
Short mackerel x
x x x x x
Yellow tail scad x x
Hard tail scad x x
Sea cat fish x
Ox-eye scad x x x x x
Spanish mackerel x x
Large head hair
tail x x x
Rays x x
Yellow striped
scad x x
Fringe scale
sardine x x x x x x x x
Long tail tuna x
Kawa-kawa x
Round scad x x x
Small yellow tail
scad x x x x x x
Barracuda x x x x x
Anchovy x x
Trash fish x x x
Miscellaneous
fish x x x x x

Bin Ali
55
UNU-Fisheries Training Programme
APPENDIX 6: ASSESSMENTS OF SPECIES ALTERNATIVES
Alternatives criteria
Tig
er t
oo
th c
roak
er
Go
at f
ish
Cro
aker
/jew
fish
Sh
ort
mac
ker
el
Har
d t
ail
scad
Ox
-eye
scad
Lar
ge
hea
d h
air
tail
Yel
low
str
iped
sca
d
Fri
ng
esca
le s
ard
ine
Roun
d s
cad
1.Price of raw material 1.0 0.9 0.6 0.4 0.3 0.5 0.8 0.2 0.7 0.1
2.Yields of flesh 0.5 0.3 0.7 0.7 0.6 0.6 0.4 0.5 0.6 0.8
3.Quality of catch 0.5 0.5 0.7 0.8 0.7 0.6 0.4 0.7 0.8 0.8
4.Quantity of grade II and III 0.6 0.2 0.7 1.0 0.8 0.5 0.1 0.3 0.4 0.9
5.Market familiarity 0.7 0.6 0.8 0.8 0.6 0.6 0.5 0.6 0.6 0.7
6.Suited for drying 0.8 0.7 0.8 0.7 0.7 0.5 0.5 0.7 0.7 0.8
7.Suited for salting 0.5 0.4 0.8 0.6 0.7 0.5 0.6 0.7 0.7 0.9
8.Suited for smoking 0.3 0.3 0.3 0.8 0.6 0.7 0.4 0.4 0.9 0.9
9.Use of By-product 0.2 0.2 0.6 0.4 0.4 0.5 0.3 0.4 0.3 0.5
Total 5.1 4.1 6.0 6.2 5.4 5.0 4.0 4.5 5.7 6.4
Ranking 3 2 1
Criteria and weights in selection of the most important species
Criterion Percentage Weight
Price of raw material 17.5% 1.0
Yields of flesh 14.0% 0.8
Quality of catch 14.0% 0.8
Quantity of grade II and III 12.3% 0.7
Market familiarity 10.5% 0.6
Suited for drying 8.8% 0.5
Suited for salting 8.8% 0.5
Suited for smoking 8.8% 0.5
Use of by-product 5.3% 0.3
Total 100.0% 5.7
Calculation of Criteria and weights (example):
Importance of weight of raw materials =1.0
Importance of price of raw materials =17.5%
Weighting (Importance) of species =1/5.7
=0.1754
~0.18

Bin Ali
56
UNU-Fisheries Training Programme
APPENDIX 7: WEIGHTING OF SPECIES (ASSESSMENTS CRITERIA X CRITERIA WEIGHT)
Alternatives Weight
Tiger
tooth
croaker
Goat
fish Croaker
Short
mackerel
Hard tail
scad
Ox-eye
scad
Large
head
hair tail
Yellow
striped
scad
Fringescale
sardine Round scad
Price of raw material 0.175 10 1.8 9 1.6 6 1.1 4 0.7 5 0.9 5 0.9 8 1.4 2 0.4 7 1.2 1 0.2
Yields of flesh 0.140 5 0.7 3 0.4 7 1.0 7 1.0 6 0.8 6 0.8 4 0.6 5 0.7 6 0.8 8 1.1
Quality of catch 0.140 5 0.7 5 0.7 7 1.0 8 1.1 6 0.8 6 0.8 4 0.6 7 1.0 8 1.1 8 1.1
Quantity of grade II and III 0.123 6 0.7 2 0.2 7 0.9 10 1.2 5 0.6 5 0.6 1 0.1 3 0.4 4 0.5 9 1.1
Market familiarity 0.105 7 0.7 6 0.6 8 0.8 8 0.8 7 0.6 6 0.6 5 0.5 6 0.6 6 0.6 7 0.7
Suited for drying 0.088 8 0.7 7 0.6 8 0.7 7 0.6 5 0.4 5 0.4 5 0.4 7 0.6 7 0.6 8 0.7
Suited for salting 0.088 5 0.4 4 0.4 8 0.7 6 0.5 5 0.4 5 0.4 6 0.5 7 0.6 7 0.6 9 0.8
Suited for smoking 0.088 3 0.3 3 0.3 3 0.3 8 0.7 7 0.6 7 0.6 4 0.4 4 0.4 9 0.8 9 0.8
Use of By-product 0.053 2 0.1 2 0.1 6 0.3 4 0.2 5 0.3 5 0.3 3 0.2 4 0.2 3 0.2 5 0.3
Total 6.14 4.91 6.70 6.93 5.67 5.56 4.65 4.82 6.49 6.81

Bin Ali
57
UNU-Fisheries Training Programme
APPENDIX 8: FOMBES INVESTMENT COST SUMMARY FOR PRODUCTION OF MIXED PRODUCT DRIED/SALTED AND
SALTED SHORT MACKEREL
Items Quantity Unit Price
(RM)
RM Sources/Rationale
Buildings (Store, processing & office – 40 m²) 1 Lump sum 20,000 Estimation
Drying racks 105m² 50 5,225 ILO-WEP 1982
Fish tubs 30 250 7,500 Estimation
Stainless cutting tables (2’ x 5’) 1 2,500 2,500 Estimation
Cold room for storage finished product (capacity 1 ton) 1 6,000 6,000 Estimation
Cold room for storage raw materials (capacity 1 ton) 1 8,000 8000 Estimation
Contingencies (5%) 2,461 Estimation
Total investment cost 51,686

Bin Ali
58
UNU-Fisheries Training Programme
APPENDIX 9: FOMBES FIXED COST AND VARIABLE COST SUMMARY FOR PRODUCTION OF MIXED PRODUCT
DRIED/SALTED AND SALTED SHORT MACKEREL Items Quantity Unit Price
(RM)
RM Sources/Rationale
Fixed Cost
Land (Renting 250m² -drying area and buildings) 250m² 1 3,000 Estimation
Electricity bills 250 3,000 Calculated rates (National Electricity board)
Telephone bills 100 1,200 Estimation
Maintenance and repair cost (5% of investment cost 2,584 Estimation
Insurance (1.5% of investment cost) 775 Estimation
Operation supervisor 1 1,500 18,000 Calculated estimation
Accounting clerk 1 1,000 12,000 Calculated estimation
Contributions to employee provident funds (12% from basic monthly
wages)
3,600 Employee Provident Fund, Malaysia, 2011
Employee insurance (1% from basic monthly wages) 300 Estimation
License and other fees 1,500 Estimation
Total fixed cost 45,960
Variable cost
Raw materials (fish)-200 days operations 200 kg 3.00 120,000 FDAM, Perlis
Water bills- RM 300/month 3,600 Calculated estimation (Perlis water board)
Electricity bills- RM 600/month 600 Calculated estimation (National Electricity
Board )
Labour- 200 days operation 3 30 18,000 Calculated estimation
Overtime- (2 workers) 200 days operation 4 hrs 5 8,000 Calculated estimation
Packaging-Styrofoam box 20kg/box 1,021 3 3,062 Calculated estimation
Salt- (35% intake) 14 tons 600 8,400 ILO-WEP 1982
Marketing cost –RM0.20 per kg 20.412 kg 4,082 Calculated estimation
Total variable cost 189,744
Assumption based on ILO-WEP 1982 Yields of production:
Dried – 40% (moisture content -30%)
Dried/Salted – 51% (moisture content- 45%)
Smoke – 35% (moisture content -20%)
Salted- 70% (moisture content -60%)

Bin Ali
59
UNU-Fisheries Training Programme
APPENDIX 10: PROFITABILITY ASSESSMENT MODEL
The Excel Model for Profitability Analysis
Model Components
Investment Revenue and Costs
Depreciation Interest
Repayment Interest Taxes Net Profit/Loss Stock Dividend
Work.Cap.Changes
Cash Movements
Cash Flow Financial Ratios
NPV IRR
Assumptions
Summary
Investment Revenue Operating Costs
Results and
Sensitivity
Scenario Summary Sensitivity Chart
Investment and
Financing
Investment Depreciation Financing
Operating
Statement
Revenue and Costs Taxation Appropriation of profit
Cash Flow
Operating Surplus Paid Taxes Repaym. & Interest Paid Dividend
Balance Sheet
Assets (Current, Fixed) Debt (Short, Long) Equity (Shares, Other)
Profitability
Measures
Project, Equity:
Net Present Value Internal Rate of Return
Graphs and Charts
Profitability (NPV, IRR)
Financial Ratios Cost Breakdown