OPENSEES DAYS EUROPE 2017
160
I OPENSEES DAYS EUROPE 2017 FIRST EUROPEAN CONFERENCE ON OPENSEES AN EVENT FROM THE CONFERENCE SERIES OF EOS, THE EUROPEAN OPENSEES ASSOCIATION HUMBERTO VARUM JOSÉ MIGUEL CASTRO LUÍS MACEDO NUNO PEREIRA XAVIER ROMÃO GIORGIO MONTI EDITORS
-
Upload
khangminh22 -
Category
Documents
-
view
0 -
download
0
Transcript of OPENSEES DAYS EUROPE 2017

I
OPENSEES DAYS EUROPE 2017 FIRST EUROPEAN CONFERENCE ON OPENSEES
AN EVENT FROM THE CONFERENCE SERIES OF EOS, THE EUROPEAN OPENSEES ASSOCIATION
HUMBERTO VARUM JOSÉ MIGUEL CASTRO LUÍS MACEDO NUNO PEREIRA XAVIER ROMÃO GIORGIO MONTI EDITORS


I
OPENSEES DAYS EUROPE 2017 FIRST EUROPEAN CONFERENCE ON OPENSEES
AN EVENT FROM THE CONFERENCE SERIES OF EOS, THE EUROPEAN OPENSEES ASSOCIATION JUNE 19 – JUNE 20, 2017 PORTO, PORTUGAL EDITED BY HUMBERTO VARUM FACULTY OF ENGINEERING, UNIVERSITY OF PORTO, PORTUGAL
JOSÉ MIGUEL CASTRO FACULTY OF ENGINEERING, UNIVERSITY OF PORTO, PORTUGAL
LUÍS MACEDO FACULTY OF ENGINEERING, UNIVERSITY OF PORTO, PORTUGAL
NUNO PEREIRA FACULTY OF ENGINEERING, UNIVERSITY OF PORTO, PORTUGAL
XAVIER ROMÃO FACULTY OF ENGINEERING, UNIVERSITY OF PORTO, PORTUGAL
GIORGIO MONTI UNIVERSITY OF ROME “LA SAPIENZA”, ITALY

II
Copyright © Individual authors. These proceedings cannot be reproduced in part or as a whole for educational or research purposes without the specific permission from the authors of each publication. Reference to the publications must include appropriate credit to the author(s) and to the OpenSees Days Europe 2017 Conference. These proceedings may not be reproduced for commercial purposes. The editors, the organising committee and the sponsors of the OpenSees Days Europe 2017 accept no responsibility for damages resulting from the use, application, or interpretation of the information presented, discussed or referred in the articles contained in these proceedings. The information published in these proceedings is presented in the form received by the contributing authors. Mention of trade names or commercial products does not constitute endorsement or recommendation for use.
ISBN 978-972-752-221-7
Published in 2017 by:
Faculty of Engineering, University of Porto
Rua Dr. Roberto Frias, s/n 4200-465 Porto PORTUGAL
Additional material can be downloaded from http://opensees.fe.up.pt

III
Preface
The EOSD2017 is the second OpenSees conference held in Porto, Portugal, (after the OpenSees
Days Portugal in 2014). This conference appears after a series of successful European events
held in Italy (2011, 2015), the U.K. (2014) and Portugal (2014), and is also the official launching
event of the European OpenSees Association. It is therefore an honour to host the EOSD2017
conference that coincides with the launch of the European OpenSees Association.
The conference aimed at gathering new users and assembling the OpenSees community in
Europe to discuss some of the new features. The Programme included some of the more active
OpenSees developers, thus contributing for productive and interesting discussions. The invited
speakers included Anastasios Sextos, André Barbosa, Asif Usmani, Dimitrios Lignos, Dimitrios
Vamvatsikos, Frank McKenna, Khalid Mosalam, Lu Xinzheng, Pedro Arduino and Theodore
Karavasilis.
The invited speakers’ presentations addressed topics where OpenSees plays a key role in
simulating structural behaviour and geotechnical problems involving different types of structures
and hazards such as fire, earthquakes and tsunamis.
The conference programme also included presentations addressing the integration and
combination of OpenSees with commercial software, presentations focusing on new software
developments and several case study applications. These proceedings compile the extended
abstracts of the presentations made during the conference.
The EOSD2017 had approximately 80 participants, originating from 16 different countries. We
were therefore pleased to host such an inter-cultural conference and hope that it serves as an
opportunity to launch new partnerships.
We would like to thank all the lecturers, authors and participants for their contributions to this
event. Finally, we would like to specially thank all who actively contributed to the organization of
this event at FEUP, in particular all the funding institutions for their generous contributions and
the secretariat of “Instituto da Construção” for their considerable help.
The Organizing Committee of the EOSD2017
Porto, July 2017

IV

V
Diamond Sponsors
Platinum Sponsors
Gold Sponsors
Supporting Organizations

VI

VII
Contents # Title Page
1 Robust and efficient nonlinear structural analysis using the central difference time integration scheme Reagan Chandramohan, Jack W. Baker, Gregory G. Deierlein………………………………..………… 1
2 Two new elements to OpenSees Javier Pereiro-Barceló, Manuel Fernández-Baños…………………………………………………………. 6
3 OpenSees software architecture for substructure-based seismic simulation method for partially-nonlinear structures Ming Fang, Jian Wang, Hui Li………………………………………………………………………………… 10
4 Virtual hybrid simulation test - modelling experimental errors Gidewon Tekeste, António A. Correia, Aníbal Costa………………………………………………………. 14
5 Numerical modelling of concrete-filled steel tubular members in OpenSees…. Yadong Jiang , António Silva, Luís Macedo, José Miguel Castro, Ricardo Monteiro………………….. 18
6 Optimized design of steel frames using OpenSees João Nogueira, Luís Macedo, José Miguel Castro…………………………………………………………. 22
7 Automatic calibration of hysteretic models through multiple responses Corrado Chisari, Gianvittorio Rizzano, Claudio Amadio, Massimo Latour………………………………. 27
8 Advantages of using Bayesian inference for model calibration in OpenSees Ádám Zsarnóczay……………………………………………………………………………………………… 33
9 Residual fire resistance of steel frames assessed using a multi-hazard analysis framework in OpenSees Mian Zhou, Liming Jiang, Suwen Chen, Asif.Usmani……………………………………………………… 39
10 Modelling structures in fire using OpenSees - an integrated approach Liming Jiang, Asif Usmani……………………………………………………………………………….….. 43
11 Implementation of fire models in OpenSees Xu Dai, Yaqiang Jiang,Liming Jiang, Stephen Welch, Asif S. Usmani 47
12 Timber shear walls: numerical assessment of dissipation of sheathing-to-framing G. Di Gangi, C. Demartino, G. Monti…………………………………………………………………………. 51
13 Study of the dynamic soil-abutment-superstructure interaction for a bridge abutment Davide Noè Gorini, Luigi Callisto……………………………………………………………………….……. 57
14 Modelling of soil-structure interaction in OpenSees: a practical approach for performance-based engineering Smail Kechidi, Aires Colaço, Mário Marques, José Miguel Castro, Pedro A. Costa……………………. 61
15 Implementation and finite-element analysis of shell elements confined by through-the-thickness uniaxial devices Salvatore Sessa, Roberto Serpieri, Luciano Rosati………………………………………………………… 65
16 OpenSees integrated in a BIM workflow as calculation engine Javier Pereiro-Barceló, Manuel Fernández-Baños…………………………………………………………. 69
17 A New Graphical User Interface for OpenSees V. K. Papanikolaou, T. Kartalis-Kaounis, E. Protopapadakis, T. Papadopoulos………………………... 73
18 Modelling of a Shear Reinforced Flat Slab Building for Seismic Fragility Analysis Brisid Isufi, Ildi Cismasiu, António M. P. Ramos,Válter J. G. Lúcio………………………………………. 77
19 Non-linear dynamic analyses of a 60’s RC building collapsed during L’Aquila 2009 earthquake Maria Gabriella Mulas, Paolo Martinelli……………………………………………………………………… 81
20 A genetic algorithm aimed at optimizing seismic retrofitting of existing RC frames C. Faella, R. Falcone, C. Lima, E. Martinelli………………………………………………………………… 85
21 Numerical modelling of RC columns with plain reinforcing bars José Melo, Humberto Varum, Tiziana Rossetto…………………………………………………………….. 89

VIII
22 Improved drift assessment approach for steel moment frames under realistic earthquake loading Borjan Petreski, Mihail Garevski………………………………………………..…………………………..… 93
23 Assessment of the seismic performance of steel frames using OpenSees Sara Oliveira, Filippo Gentili, Ashkan Shahbazian, Hugo Augusto, Ricardo Costa, Carlos Rebelo, Yukihiro Harada and Luís Simões da Silva………………………………………………………………….. 97
24 Development of an OpenSees model for collapse risk assessment of Italian-code-conforming steel single-storey buildings F. Scozzese, A. Zona, A. Dall’Asta…………………………………………………………………………… 101
25 Evaluating the use of OpenSees for Lifetime Seismic Performance Assessment of Steel Frame Structures John Hickey, Brian Broderick, Terence Ryan………………………………………………………………... 105
26 Blind test prediction of an infilled RC building with OpenSees Hugo Rodrigues, André Furtado, António Arêde, Humberto Varum, Marin Grubnisic, Tanja Sipos…... 109
27 Modelling in-plane and out-of-plane response of infilled frames through a fibre macro-model F. Di Trapani, P.B. Shing, L. Cavaleri………………………………………………………………………… 113
28 Evaluation of seismic fragility of infilled reinforced concrete frames subject to aftershocks F. Di Trapani, M. Malavisi, G. Bertagnoli, V.I. Carbone…………………………………………………….. 117
29 Simplified macro-modelling approach for infill masonry wall in-plane and out-of-plane behaviour using OpenSees André Furtado, Hugo Rodrigues, António Arêde, Humberto Varum………………………………………. 121
30 Modelling the out-of-plane behaviour of URM infills and the in-plane/out-of-plane interaction effects Paolo Ricci, Mariano Di Domenico, Gerardo M. Verderame………………………………………………. 125
31 Nonlinear combination of intensity measures for response prediction of RC buildings Alessandra Fiore, Fabrizio Mollaioli, Giuseppe Quaranta, Giuseppe C. Marano………………………... 130
32 Numerical investigation on the seismic behaviour of repaired and retrofitted Chinese bridge piers using OpenSees Davide Lavorato, Alessandro V. Bergami, Camillo Nuti, Bruno Briseghella, Junqing Xue, Angelo M. Tarantino, Giuseppe C. Marano, Silvia Santini……………………………………………………………… 134
33 An OpenSees material model for the cyclic behaviour of corroded steel bar in RC structures Davide Lavorato, Riccardo Tartaro, Alessandro V. Bergami, Camillo Nuti………………………………. 136
34 Modelling with fibre beam elements for load capacity assessment of existing masonry arch bridges M. Laterza, M. D’Amato, V. M. Casamassima, M. Signorelli………………………………………………. 138
35 A new FEM approach for FRP-strengthened RC frames Mohsen Rezaee Hajidehi, Giovanni Minafo, Giuseppe Giambanco………………………………………. 142
36 Use of OpenSees for the validation of a simplified procedure for the seismic assessment and retrofit of steel concentric braced frames Alessandro Rasulo, Ernesto Grande………………………………………………………………………….. 146

OpenSees Days Europe 2017
1st European Conference on OpenSees
Porto, Portugal, 19–20 June 2017
ROBUST AND EFFICIENT NONLINEAR STRUCTURAL ANALYSIS
USING THE CENTRAL DIFFERENCE TIME INTEGRATION SCHEME
Reagan Chandramohan1, Jack W. Baker2, and Gregory G. Deierlein3
1 Lecturer
University of Canterbury, Christchurch, New Zealand
2 Associate Professor
Stanford University, Stanford, CA, USA
3 Professor
Stanford University, Stanford, CA, USA
Keywords: explicit scheme; central difference scheme; implicit scheme; Newmark average ac-
celeration scheme; numerical non-convergence; nonlinear structural analysis; collapse simula-
tion; incremental dynamic analysis
Abstract. The explicit central difference numerical time integration scheme is demonstrated to
be a robust and efficient alternative to commonly used implicit schemes like the Newmark av-
erage acceleration scheme for nonlinear structural response simulation. Numerical non-con-
vergence issues, which are frequently encountered using the Newmark average acceleration
scheme, are shown to introduce conservative biases in the estimated structural capacity and
hamper the efficiency of analysis. They are shown to be responsible for the underestimation of
the median collapse capacity of a 9-storey steel moment frame building by 10%. Despite re-
quiring shorter analysis time steps, the time taken to conduct an incremental dynamic analysis
using the central difference scheme is 73% lower than using the average acceleration scheme.
1
Reagan Chandramohan, Jack W. Baker, and Gregory G. Deierlein
1 INTRODUCTION
Nonlinear response history analysis has witnessed increased adoption in seismic design and
assessment practice in recent years [1], [2], especially for the design and assessment of tall and
important structures. In current research and practice, nonlinear structural response simulations
are almost exclusively conducted using implicit numerical time integration schemes, of which,
the Newmark average acceleration scheme is the most popular. Implicit schemes are, however,
inherently iterative in nature and often fail to converge to a solution when used to simulate the
response of structures under intense earthquake ground motions, at or close to their ultimate
collapse limit states. The use of implicit schemes, therefore, possesses the potential to introduce
conservative biases in the estimated structural capacity. Nevertheless, numerical issues like
non-convergence typically receive little attention in comparison to structural modelling and
ground motion selection considerations. This study proposes the use of the explicit central dif-
ference time integration scheme as a robust and efficient alternative to the Newmark average
acceleration scheme for nonlinear structural analysis.
2 NEWMARK AVERAGE ACCELERATION SCHEME
The Newmark average acceleration scheme is the most widely used numerical time integra-
tion scheme for response history analysis. The reason for its popularity is its unconditionally
stable nature, which permits the use of relatively large analysis time steps. Being an implicit
scheme, it enforces equilibrium at the end of each time step which makes it inherently iterative
in nature, and convergence of the iterations is not guaranteed. Numerical non-convergence is,
in fact, a frequently encountered phenomenon, and the likelihood of encountering non-conver-
gence increases when analysing complex structural models under long and intense ground mo-
tions. Upon encountering numerical non-convergence, a series of workarounds is typically
employed to overcome it, including trying different solution algorithms and other time integra-
tion schemes, decreasing the analysis time step, and raising the convergence tolerance [3]–[5].
These strategies are not always successful, but are computationally intensive and can hamper
the efficiency of the analysis if invoked too frequently. If all attempts fail, it is common practice
to declare structural collapse, although often incorrectly as demonstrated in this study and oth-
ers (e.g., [4], [6]).
3 CENTRAL DIFFERENCE SCHEME
The central difference scheme is an explicit scheme since it enforces equilibrium at the be-
ginning of each time step. Being non-iterative in nature, it effectively sidesteps the issue of
numerical non-convergence. This makes it a popular choice when conducting simulations that
involve large nonlinear deformations like blast and crash simulations [7], [8]. Structural re-
sponse simulations that involve large nonlinear deformations are, therefore, also expected to
benefit from using the central difference scheme, despite the longer duration of earthquake
loads when compared to impulse loads like blast and crash loads.
The most commonly cited drawback of the central difference scheme is its conditionally
stable nature, which limits the largest analysis time step it can be used with to Δ𝑡𝑚𝑎𝑥 = 𝑇𝑚𝑖𝑛 𝜋⁄ ,
where 𝑇𝑚𝑖𝑛 is the shortest modal period. This condition precludes the presence of any massless
degrees of freedom and extremely stiff elements or penalty constraints in the structural model,
which entails some additional effort during model creation. These requirements are, however,
not unique to the central difference scheme since they have also been linked to improved con-
vergence performance of implicit schemes [4], [9, Sec. 9.5.2].
The dynamic tangent matrix that needs to be factorised at each time step when using the
central difference scheme is a linear combination of just the mass and damping matrices. Since
2

Reagan Chandramohan, Jack W. Baker, and Gregory G. Deierlein
the mass matrix is typically constant, using a constant damping matrix (like a modal damping
matrix) would require the dynamic tangent matrix to be factorised only once during the entire
simulation, thereby vastly improving the efficiency of the scheme. When a simulation is con-
ducted in parallel by domain decomposition, this would also significantly minimise the com-
munication overhead between the processors. Since the duration of each analysis is known to
be proportional to the length of the accelerogram, it also permits the use of efficient static par-
allel load balancing techniques when analyzing response under different ground motions on
different processors.
4 COMPARISON OF ROBUSTNESS
A concentrated plastic hinge model of the 9-storey steel moment frame building designed as
part of the SAC Steel Project [10], was created in OpenSees. The hysteretic behaviour of the
plastic hinges was modelled using the Ibarra-Medina-Krawinkler bilinear hysteretic model [11],
and the destabilising 𝑃 − Δ effect of the adjacent gravity frame was captured using a pin-con-
nected leaning column. The collapse capacity of the frame was estimated separately using the
Newmark average acceleration and the central difference time integration schemes by conduct-
ing incremental dynamic analysis (IDA) [12] using 44 ground motions from the FEMA P695
[13] far-field record set.
Figure 1: Comparison of the IDA curves computed using the central difference and Newmark average accelera-
tion time integration schemes for one of the 44 ground motions
Upon encountering numerical non-convergence using the average acceleration scheme, the
following sequence of efforts were made to overcome it: (i) different solution algorithms were
tried; (ii) the analysis time step was sequentially decreased; and (iii) other implicit time-inte-
gration schemes (including some with algorithmic damping like the HHT-α scheme) were used.
If all efforts failed, structural collapse was declared as per conventional practice. For 12 out of
the 44 ground motions, the collapse intensity obtained using the average acceleration scheme
was found to be lower than that estimated using the central difference scheme by 10% or more.
The IDA curves for one of these ground motions is plotted in Figure 1. The IDA curves com-
puted using the two schemes are seen to be identical until they bifurcate at a certain intensity
level. This corresponds to the intensity level at which persistent numerical non-convergence
3

Reagan Chandramohan, Jack W. Baker, and Gregory G. Deierlein
was encountered using the average acceleration scheme, prompting the premature declaration
of structural collapse. The central difference scheme, on the other hand, was able to successfully
evaluate the response at that intensity level and a few others above it. The difference between
the collapse intensities estimated using the two schemes was lower than 1% for 29 out of the
44 ground motions. The net effect of the premature declaration of collapse for 12 of the 44
ground motions was an underestimation of the median collapse capacity by 10% using the av-
erage acceleration scheme. This clearly demonstrate the robust nature of the central difference
scheme, which can be attributed to its immunity against numerical non-convergence.
5 COMPARISON OF EFFICIENCY
The simulations were conducted using a time step of 5×10⁻³ s using the average acceleration
scheme, and 1.5×10⁻⁴ s using the central difference scheme. The time taken to analyse the struc-
ture under the ground motion recorded during the 1992 Landers earthquake at the Coolwater
station using the average acceleration scheme was 1.0 min when it was scaled to a low scale
factor where non-convergence was not encountered. The runtime, however, increased to 20.9
min at a higher scale factor where numerical non-convergence compelled the use of computa-
tionally intensive strategies to overcome it. The runtime using the central difference scheme
was only 3.3 min using a constant damping matrix that required only a single factorisation.
Thus we see that although the central difference scheme requires the use of a smaller analysis
time step, the system of equations can be solved more efficiently at each time step.
The time taken to conduct the entire IDA in parallel on 160 processors using dynamic load
balancing was 118 min using the average acceleration scheme and 32 min using the central
difference scheme. The 73% shorter runtime using the central difference scheme can be at-
tributed to the large number of instances where numerical non-convergence was encountered
using the average acceleration scheme, forcing the use of computationally intensive steps to
overcome it. Thus, the central difference scheme is seen to be a competitive alternative to the
Newmark average acceleration scheme, not just in terms of robustness, but also in terms of
efficiency. These findings are consistent with other previous studies like [14]–[16].
6 CONCLUSION
The central difference time integration scheme is demonstrated to be a robust and efficient
alternative to the Newmark average acceleration scheme for nonlinear structural analysis. Its
robustness is attributed to its non-iterative nature, which renders it immune to numerical non-
convergence issues. Numerical non-convergence was shown to be responsible for the underes-
timation of the median collapse capacity of a 9-storey steel moment frame building by 10%
when using the average acceleration scheme. The time taken to conduct IDA using 44 ground
motions was shown to be 73% lower using the central difference scheme due to the large num-
ber of instances numerical non-convergence was encountered using the average acceleration
scheme, thereby necessitating the use of computationally intensive workarounds to overcome
it.
The only drawback of the central difference scheme is its conditionally stable nature which
imposes restrictions on the analysis time step and entails additional effort during model creation
to assign mass (or moment of inertia) to all degrees of freedom and avoid the use of stiff ele-
ments or penalty constraints.
With the inevitable gradual shift towards more complex structural models and statistically
rigorous analysis procedures involving large numbers of ground motions and structural model
realisations, it is imperative that adequate attention is paid to the accuracy and efficiency of the
numerical solution strategies employed to conduct the simulations.
4

Reagan Chandramohan, Jack W. Baker, and Gregory G. Deierlein
REFERENCES
[1] Eurocode, “Eurocode 8: Design of structures for earthquake resistance - Part 1: General
rules, seismic actions and rules for buildings,” European Committee for
Standardization, Brussels, Belgium, 2004.
[2] FEMA, “Seismic Performance Assessment of Buildings, Volume 1 - Methodology,”
Federal Emergency Management Agency, Washington, D.C., 2012.
[3] D. Vamvatsikos and C. A. Cornell, “Applied Incremental Dynamic Analysis,” Earthq.
Spectra, vol. 20, no. 2, pp. 523–553, 2004.
[4] C. B. Haselton, A. B. Liel, and G. G. Deierlein, “Simulating structural collapse due to
earthquakes: Model idealization, model calibration, and numerical solution
algorithms,” in ECCOMAS Thematic Conference on Computational Methods in
Structural Dynamics and Earthquake Engineering (COMPDYN), 2009.
[5] A. Hardyniec and F. A. Charney, “A new efficient method for determining the collapse
margin ratio using parallel computing,” Comput. Struct., vol. 148, pp. 14–25, Feb.
2015.
[6] Y. Araki and K. D. Hjelmstad, “Criteria for assessing dynamic collapse of elastoplastic
structural systems,” Earthq. Eng. Struct. Dyn., vol. 29, no. 8, pp. 1177–1198, Aug.
2000.
[7] D. Lawver, R. Daddazio, D. Vaughan, M. Stanley, and H. Levine, “Response of AISC
Steel Column Sections to Blast Loading,” in ASME Pressure Vessels and Piping
Conference, 2003, pp. 139–148.
[8] G. Dundulis, R. F. Kulak, A. Marchertas, and E. Uspuras, “Structural integrity analysis
of an Ignalina nuclear power plant building subjected to an airplane crash,” Nucl. Eng.
Des., vol. 237, no. 14, pp. 1503–1512, Aug. 2007.
[9] K.-J. Bathe, Finite Element Procedures. Upper Saddle River, NJ: Prentice Hall, 1996.
[10] FEMA, “State of the art report on systems performance of steel moment frames subject
to earthquake ground shaking,” Federal Emergency Management Agency, Stanford,
CA, 2000.
[11] L. F. Ibarra, R. A. Medina, and H. Krawinkler, “Hysteretic models that incorporate
strength and stiffness deterioration,” Earthq. Eng. Struct. Dyn., vol. 34, no. 12, pp.
1489–1511, Oct. 2005.
[12] D. Vamvatsikos and C. A. Cornell, “Incremental dynamic analysis,” Earthq. Eng.
Struct. Dyn., vol. 31, no. 3, pp. 491–514, Mar. 2002.
[13] FEMA, “Quantification of Building Seismic Performance Factors,” Federal Emergency
Management Agency, Washington, D.C., 2009.
[14] J. F. McNamara, “Solution Schemes for Problems of Nonlinear Structural Dynamics,”
J. Press. Vessel Technol., vol. 96, no. 2, p. 96, May 1974.
[15] M. J. Mikkola, M. Tuomala, and H. Sinisalo, “Comparison of numerical integration
methods in the analysis of impulsively loaded elasto-plastic and viscoplastic
structures,” Comput. Struct., vol. 14, no. 5–6, pp. 469–478, Jan. 1981.
[16] Y. M. Xie, “An assessment of time integration schemes for non-linear dynamic
equations,” J. Sound Vib., vol. 192, no. 1, pp. 321–331, Apr. 1996.
5

OpenSees Days Europe 2017
1stEuropean Conference on OpenSees
Porto, Portugal, 19–20June 2017
TWO NEW ELEMENTS TO OPENSEES
Pereiro-Barceló, Javier1, Fernández-Baños, Manuel2
1Cype Ingenieros S.A.
Avda. Eusebio Sempere, 5 – 03003 Alicante, España
e-mail: [email protected]
2 Cype Ingenieros S.A.
Avda. Eusebio Sempere, 5 – 03003 Alicante, España
e-mail: [email protected]
Keywords: 6-node triangle, Timoshenko, Shape function, structural analysis.
Abstract. Opensees is a well-known framework to perform non-linear earthquake analysis.
Cype has integrated Opensees as calculation engine in its new structural analysis programs
(StruBIM). With the purpose of keeping all functionalities of previous calculation engine, two
new elements have been developed for Opensees: A one-dimensional elastic 2 node bar and a
6-node triangular shell element. Both support a wide kind of loads, local eccentricities, and
stiffness multipliers. One-dimensional element calculates sectional forces and deflections at
any inner points of the element without adding new nodes. Shell element supports thick sec-
tions and it works for non-linear analysis.
6

Pereiro-Barceló, Javier; Fernández-Baños, Manuel
1 INTRODUCTION
Opensees is a well-known framework to perform linear or non-linear analysis, developed
at University of California, Berkeley. Its use is widespread all over the world mainly to simu-
late seismic behavior in structures.
Cype has integrated Opensees as calculation engine for StruBIM Analysis, StruBIM De-
sign and StruBIM Foundations. These programs are in charge of analyzing, designing and
checking structures, including their foundations. To fulfill this, Cype has extended OpenSees
in some ways and one of them is creating two new finite elements, which will be explained in
the following sections.
2 ONE-DIMENSIONAL ELEMENT
A 2-node one-dimensional elastic finite element has been created for OpenSees (Figure
1.a). It follows Timoshenko’s theory. Next, the properties of this element are shown:
2.1 Loads
The element supports point, trapezoidal (even in a portion of the length) and temperature
(uniform or gradient) loads. Shear deformability must take into consideration to obtain fixed
ends forces. The followed procedure is shown below:
A fully fixed ends beam in considered. It bears a load 𝑃(𝑥) which causes two moment re-
actions 𝑀𝑎 and 𝑀𝑏. The bending moment in any position 𝑥 can be decomposed by the sum of
the bending moment in a pinned equivalent isostatic beam due to 𝑃(𝑥) (𝑀𝑃), 𝑀𝑎 and 𝑀𝑏 .
Taking into account Castiglinao’s theorem to calculate the rotations at the ends of the isostatic
beam and operating, the expressions of reaction moments 𝑀𝑎 and 𝑴𝒃 are displayed in (1) [1].
The rest of reactions can be obtained by stating equilibrium.
𝑀 =1
𝛾{𝑚 [∫ 𝑀𝑃 (1 −
𝑥
𝐿)𝑑𝑥
𝐸𝐼
𝐿
0+
1
𝐿∫ 𝑄𝑐 𝑑𝑥
𝐺𝐴𝑣
𝐿
0] + 𝑛 [−∫ 𝑀𝑃 𝑥
𝐿
𝑑𝑥
𝐸𝐼
𝐿
0+
1
𝐿∫ 𝑄𝑐 𝑑𝑥
𝐺𝐴𝑣
𝐿
0]} (1)
where:
𝜸𝟏 = ∫ (𝟏 −𝒙
𝑳)𝒅𝒙
𝑬𝑰
𝑳
𝟎
, 𝜸2 = ∫𝒙
𝑳(𝟏 −
𝒙
𝑳)𝒅𝒙
𝑬𝑰
𝑳
𝟎
, 𝛾3 = ∫ (𝑥
𝐿)3 𝑑𝑥
𝐸𝐼
𝐿
0
, 𝛾4 = ∫ (1
𝐿2)𝑑𝑥
𝐺𝐴𝑣
𝐿
0
𝛾 = (𝛾1 + 𝛾4)(𝛾3 + 𝛾4) − (𝛾2 − 𝛾4)2,
𝑚 = (𝛾3 + 𝛾4) for 𝑀𝑎 and (𝛾2 − 𝛾4) for 𝑀𝑏 ; 𝑛 = (𝛾2 − 𝛾4) for 𝑀𝑎 and (𝛾1 + 𝛾4) for 𝑀𝑏
𝐸:Young modulus, 𝐺:Shear modulus, 𝑨𝒗: Shear area, 𝑳: Length of the element
2.2 Local eccentricities
A local eccentricity is understood to mean a way to change the relative position of local ax-
is in one-dimensional elements. This allows to model for example, that top or bottom face of a
beam coincides with a slab face. Besides, in steel structures allows to model complex joints
between bars. Local eccentricities are modeled as multipoint constraints where master DOF
are related to slaves ones according to local eccentricities dx, dy and dz [2].
7
Pereiro-Barceló, Javier; Fernández-Baños, Manuel
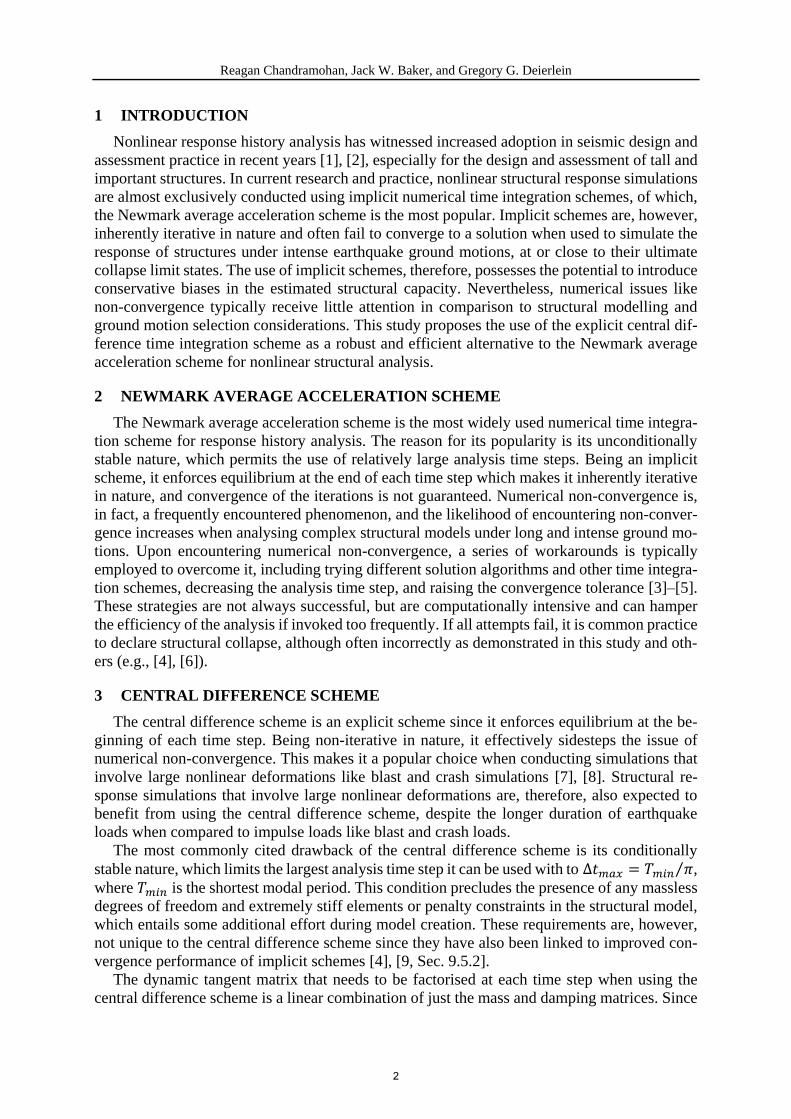
2.3 Sectional forces
Finite elements just get sectional forces at its nodes. If more positions are required, inner
nodes must be added. If elements are elastic, this addition can be avoided by stating equilibri-
um of the element. This way, taking the nodal forces after the analysis, sectional forces are
obtained by adding the effect of inner element loads at each longitudinal location where user
wants to know the value.
2.4 Deflections
As Timoshenko theory is followed to build this element, displacements and rotations are
the sum of two terms: displacements and rotations due to bending moment and ones due to
shear.
Deflections are obtained at inner points of element by integrating the following differential
equations:
𝐸𝐼𝑑2𝑦(𝑥)
𝑑𝑥2= 𝑀(𝑥) (2)
𝐺𝐴𝑣𝑑𝑦(𝑥)
𝑑𝑥= 𝑉(𝑥) (3)
2.5 Stiffness modifiers
Stiffness modifiers are inputs to reduce stiffness in some elements.
Figure 1: New elements: (a) One-dimensional element (displacements), (b) Shell element (displacements)
3 SHELL ELEMENT
A 6-node triangular element has been created with membrane and plate behavior (Figure
1.b). Stiffness can be modified in each membrane or plate component. It works for both linear
and non-linear analysis. It has quadratic shape functions and supports thick shells [3].
3.1 Loads
Trapezoidal and temperature loads are available in shell element. The equations of these
loads are (7-8), which are integrated numerically:
𝒇𝑡𝑟𝑎𝑝(𝑒)
= ∫∫ 𝑵𝑇𝒃𝑡𝑑𝐴𝐴(𝑒)
(4)
𝒇𝑡𝑒𝑚𝑝(𝑒)
= ∫∫ 𝑩𝑇𝑫𝜺𝟎𝑡𝑑𝐴𝐴(𝑒)
(5)
(a) (b)
8

Pereiro-Barceló, Javier; Fernández-Baños, Manuel
where:
𝑵: Shape function, 𝑩: Derivative matrix, 𝑫: Constitutive matrix, 𝒃: Distributed load in the
element area vector, 𝜺𝟎: Initial strain vector due to temperature, 𝑡: shell thickness
3.2 Local eccentricities
As in the case of one-dimensional element, this shell element has local eccentricities as
inputs. The explanation is the same as in the previous elements.
3.3 Coplanarity
Shell element has as input parameters if each node is or not coplanar. If node is, a ficti-
tious stiffness is assigned to the rotational DOF (Degree of Freedom) which is perpendicu-
lar to the element.
3.4 Linear optimization
Shell element works for both linear and non-linear analysis. However, it is optimized if
linear analysis is being performed. This optimization makes that stiffness matrix is just
evaluated once in the whole analysis.
3.5 Stiffness modifiers
Stiffness can be modified in each membrane or plate component.
4 CONCLUSIONS
Two new elements have been created to Opensees: One-dimensional and shell elements.
One-dimensional element supports a wide variety of loads, local eccentricities, stiffness
modifiers, and obtains sectional forces and deflections at inner points of the elements
without adding new nodes.
Shell element is a 6-node triangular element with membrane and plate behavior. It sup-
ports linear and non-linear analysis and thick sections. It supports trapezoidal and tem-
peratures loads, local eccentricities and stiffness modifiers. It can manage coplanarity and,
if analysis is linear, it is optimized to that effect.
Elements will be uploaded to OpenSees repository soon.
REFERENCES
[1] J. M. Canet, Resistencia de Materiales y Estructuras, Centro internacional de Métodos
Numéricos en Ingeniería, CIMNE, Barcelona, 2012.
[2] C.A. Felippa Introduction to Finite Element Methods, Department of Aerospace Engi-
neering Sciences and enter for Aerospace Structures, University of Colorado, USA,
2004.
[3] E. Oñate, Cálculo de Estructuras por el Método de Elementos Finitos, 1th Edition, Cen-
tro internacional de Métodos Numéricos en Ingeniería, Universitat Politècnica de Cata-
lunya, Barcelona, 1992.
9

OpenSees Days Europe 2017
1st European Conference on OpenSees
Porto, Portugal, 19–20 June 2017
OPENSEES SOFTWARE ARCHITECTURE FOR SUBSTRUCTURE-
BASED SEISMIC SIMULATION METHOD FOR PARTIALLY-
NONLINEAR STRUCTURES
Ming Fang1, Jian Wang2, and Hui Li3
1 Key Lab of Structures Dynamic Behavior and Control of the Ministry of Education, Harbin Institute
of Technology, Harbin 150090, China
E-mail: [email protected]
2 Key Lab of Structures Dynamic Behavior and Control of the Ministry of Education, Harbin Institute
of Technology, Harbin 150090, China
E-mail: [email protected]
3 Key Lab of Structures Dynamic Behavior and Control of the Ministry of Education, Harbin Institute
of Technology, Harbin 150090, China
E-mail: [email protected]
Keywords: Substructure modeling; Model reduction; Partially-nonlinear structure; Hybrid
simulation; OpenSees.
Abstract. The finite-element software framework OpenSees is extended to provide the abilities
of model reduction and hybrid numerical analysis in the substructure-based seismic simulation.
Based on the Craig-Bampton method, a number of linear and nonlinear substructures are grad-
ually updated according to the varying topology of structural components. The model reduction
is only performed for linear substructures by retaining the dominant substructure modes, while
the nonlinear substructure remains its original form. At the high level of OpenSees framework,
a new transient analysis class is created to implement the substructure generation, mode selec-
tion and formation of hybrid coordinate governing equations based on the bridge pattern. At
the low level of OpenSees framework, a new abstract layer is created to represent the time-
varying substructures based on the adapter pattern.
10

Ming Fang, Jian Wang and Hui Li
1 INTRODUCTION
Normally, reducing or concentrating the damages in the prescribed components or members
of the structure is a desirable performance objective in seismic design. As the desirable perfor-
mance objective requires, the damage is concentrated in weaker members and the main struc-
ture remains in elastic or light damaged phase, hence the entire structure can be properly
designed to be a partially-nonlinear structure. The weaker members that enter nonlinear phase
are difficult to be a priori known due to the randomness of earthquake inputs. Recently, an
adaptive modified Craig-Bampton method (AMCB)[1] has been proposed as a substructure-
based model order reduction method that can divide the entire structure into the linear and non-
linear substructures. The main idea is to retain a small number of vibration modes to capture
the predominant vibrational characteristics of linear substructures in modal space, while non-
linear substructures remain the original form in physical space. Since the AMCB method is able
to generate time-varying substructures adaptively, it has the potential to simulate the partially-
nonlinear structures with an acceptable computational cost, and it is more feasible to implement
such a substructure-based method in the open source software OpenSees. In the last two decades,
OpenSees[2] has drawn more attention and becomes one of the most popular software for nu-
merical seismic simulation due to its great flexibility and extensibility. The architecture of
OpenSees is designed according to the software design pattern provided by Gamma et al[3].
Based on such a design pattern, the architecture of OpenSees is organized to sustainably inte-
grate the newest research outcomes.
The objective of this study is to implement a substructure-based seismic simulation method
for the partially-nonlinear structures in OpenSees. New classes are created to implement the
solution of hybrid governing equations and the substructure generation. Some existing classes
are modified to merge the new classes with the original software architecture.
2 ADAPTIVE MODIFIED CB METHOD
The Craig-Bampton (CB) method has been modified to make model reduction for an a priori
partitioned partially-nonlinear structure in hybrid coordinates by condensing the DOFs of the
linear substructures. For the structures subject to earthquake excitation, the nonlinear substruc-
ture cannot be a priori known due to the randomness of earthquake risk. Hence the partition of
substructures cannot be made before the seismic analysis. In order to overcome such a short-
coming, the AMCB method inserts the modified CB method into each step of the conventional
time step integration (TSI) method. At each time step, the distribution of nonlinear components
is determined so that the substructure partition can be conducted step by step, thus the modified
CB method can perform the model reduction at each time step.
3 IMPLEMENTATION OF AMCB METHOD IN OPENSEES
The implementation of the AMCB method requires important changes at both low level and
high level of OpenSees framework. These changes involve the creation of a few new classes
and the modification of a few existing classes, as shown in Fig. 1 (new classes are shown in red;
modified classes are shown in blue). The SUB_Structure is created as a class that represents a
layer of abstraction at the low level of OpenSees framework. To implement the substructure-
based AMCB method, the SUB_Structure provides an additional abstraction layer between
AnalysisModel and its component objects. Thus, the governing equations for linear and non-
linear substructures in the AMCB method can be formed by calling the methods defined in
SUB_Structure. On the other side, the AMCBAnalysis, which is a subclass of Analysis, is cre-
11

Ming Fang, Jian Wang and Hui Li
ated as a nonlinear transient analysis at the high level of OpenSees framework. The AMCBA-
nalysis inherits behaviors from Analysis and incorporates some new numerical procedures,
which include substructure generation, mode selection and formation of governing equations in
hybrid coordinates. In order to merge the new classes with the original software architecture
together, the OpenSees framework is necessarily adapted by modifying a few existing classes.
Fig. 1. Class diagram of the AMCB implementation in OpenSees
4 VALIDATION
A 20-story steel high-rise building[4] has been employed to validate the implementation of
AMCB in OpenSees. The lateral load-resisting system of the building is comprised of steel-
perimeter Moment-Resisting-Frames (MRFs). An in-plane frame in the weak direction of the
building with five bays is developed in the OpenSees program. A group of simulation cases are
elaborately designed for this steel frame structure. Four strong ground motions, i.e., El Centro,
Kobe, Northbridge and Hachinohe, are used as the seismic inputs for the structure along the
weak direction. The peak ground acceleration (PGA) is scaled to 310 gal and 620 gal.
To measure the differences in the results between the AMCB scheme and TSI method, the
error quantities are defined as the root mean square errors of the differences between the roof
displacement curves and the maximum relative error of the envelope of the story-drift ratios. In
addition, the errors of simulation results are summarized in Table 1. The maximal error of the
roof displacement is approximately 0.72 mm, and the maximal error of the story-drift ratio is
approximately 1.22%. As the intensity of the earthquake input increases, the variations in the
errors of both the envelope of story-drift ratio and roof displacement are acceptable.
Table 1 Errors of simulation results
Ground motion inputs PGA
(gal)
Roof displacement
(mm)
Envelope of story-drift ratio
(%)
El Centro 310 0.26 1.22
620 0.25 0.27
Kobe 310 0.05 0.51
620 0.45 0.55
Northbridge 310 0.11 0.73
620 0.40 0.49
Hachinohe 310 0.43 0.65
620 0.72 0.91
The total number of DOFs in hybrid coordinates for the proposed AMCB scheme is an im-
portant index to assess the effect of the model reduction. Fig. 2 describes the variations in the
ratio of the hybrid DOFs in the AMCB scheme to the DOFs of the non-reduced model under
12

Ming Fang, Jian Wang and Hui Li
the El Centro earthquake with a PGA of 310 gal. The reduction ratios of the DOFs at the last
time step for all simulated cases are listed in Table 2. The DOFs of the entire structure are
reduced to at least 41% and 72% during the earthquake with PGAs of 310 gal and 620 gal,
respectively. The number of DOFs in hybrid coordinates varies following the gradual variation
in the nonlinear components, which is presented in physical DOFs, while the variation in the
modal DOFs represents the variation in the numbers and types of linear substructures.
Table 2 Ratios of hybrid DOFs to the entire model DOFs
Ground motion inputs PGA (gal) Hybrid DOFs Modal DOFs Physical DOFs
El Centro 310 0.41 0.11 0.30
620 0.72 0.11 0.61
Kobe 310 0.42 0.08 0.34
620 0.72 0.11 0.61
Northbridge 310 0.57 0.16 0.42
620 0.74 0.10 0.64
Hachinohe 310 0.54 0.12 0.42
620 0.77 0.09 0.68
Fig. 2. Variation of reduced DOFs in hybrid coordinates
5 CONCLUSIONS
The OpenSees is extended to perform the substructure-based simulation with the abilities
of the model reduction and hybrid numerical analysis for the partially-nonlinear structures.
The new classes SUB_Structure and AMCBAnalysis are created to implement the adaptive
modified Craig-Bampton method.
In this study, the calculation error of the story-drift ratio is no more than 1.22%, while the
number of DOFs is reduced to approximately 41% under the El Centro earthquake.
6 REFERENCES
[1] M. Fang, J. Wang, H. Li, An adaptive numerical scheme based on Craig-Bampton method
for dynamic analysis of tall buildings. The Structural Design of Tall and Special Buildings,
(In revision).
[2] F. Mckenna, G.L. Fenves, Open system for earthquake engineering simulation (Open-
Sees). Pacific Earthquake Engineering Research Center, University of California, 2013.
[3] E. Gamma, R. Helm, R. Johnson, J. Vlissides, Design patterns: elements of reusable ob-
ject-oriented software, Addison-Wesley, Reading, Mass, 1995.
[4] Y. Ohtori, R.E. Chirstenson, J.B.F. Spencer, Benchmark Control Problems for Seismi-
cally Excited Nonlinear Buildings. Journal of Engineering Mechanics, 130:366-85, 2004.
13

OpenSees Days Europe 2017
1st European Conference on OpenSees
Porto, Portugal, 19–20 June 2017
VIRTUAL HYBRID SIMULATION TESTS ACCOUNTING FOR
EXPERIMENTAL ERRORS
Gidewon G. Tekeste1,2, António A. Correia1 and Aníbal G. Costa2
1 Laboratório Nacional de Engenharia Civil
Av. do Brasil 101, 1700-066 Lisboa
e-mail: {[email protected], [email protected]},
2 University of Aveiro
Campus Universitário de Santiago, 3810-193 Aveiro
e-mail: {[email protected], [email protected]}
Keywords: OpenFresco, Laboratory errors, ExpSignalFilter class, Shake table model,
MATLAB/SIMULINK, Maximum likelihood method
Abstract. Hybrid simulation (HS) or on-line testing is a technique that involves the partition-
ing of a test specimen into subdomains. A numerical program solves the equation of motion of
a discretized subdomain, while the remaining part of the specimen, more complex or of un-
known behavior, is tested in a laboratory using dynamic actuators. Such testing framework
requires robust and efficient hardware and a transparent numerical software that can talk to
any laboratory control program. To implement this communication, OpenFresco (OF) has
been used in many HS tests. The main challenge in real-time HS testing are the errors origi-
nating from the laboratory (servo-hydraulic actuator system and data acquisition). The accu-
racy desired from HS tests can be significantly altered by such errors or they may even lead
to instability issues. Currently, LNEC is developing a real-time HS testing facility with the
objective of simulating, among other, soil-structure interaction response using both a shake
table and an additional actuator. Hence, to mitigate the subsequent effect of such errors, a
full computer simulation of HS was performed. This test rehearsal uses OpenSees (OS) and
OF along with a MATLAB/SIMULINK model of a shake table. OS was used as a computa-
tional driver while the OF was using SimUniaxialMaterials control to mimic the response of
the physical element. The ExpSignalFilter class of OF was adopted to model the experimental
errors using a White Gaussian Noise (WGN). The parameters of this class were estimated
through an offline procedure using the identified shake table dynamics modeled in
SIMULINK. The error signal (SIMULINK model output versus OS trial displacements) was
fitted to a normal distribution using the Maximum Likelihood (ML). The parameters were
then used to generate 50 realizations of virtual hybrid tests. The WGN generated by ExpSig-
nalFilter, in each realization, was computed internally using the Box-Muller transformation.
After performing the statistics of the responses, the effect of experimental errors on the re-
sponses was assessed. The approach can be easily implemented in a PC without a target ma-
chine and the solution to the expected errors using compensation techniques can be studied
virtually.
14
Gidewon G. Tekeste, António A. Correia and Aníbal G. Costa
1 INTRODUCTION
Hybrid simulation is an experimental technique that involves the partitioning of a reference
structure into two subdomains: the computational and physical part. The more complex part
of the structure is tested in a laboratory while the remaining part is modeled numerically in a
finite element software. At the interface boundary of the subdomains, compatibility or equi-
librium is enforced – the traditional method being compatibility. Servo-hydraulic actuators are
commonly used to impose the displacements (referred as trail displacements hereinafter)
solved by the computational driver at the interface nodes. New energy dissipation devices and
other complex details in structures can be tested at full scale using this scheme [1].
2 PARAMETRIC SYSTEM IDENTIFICATION OF UNIAXIAL SHAKETABLE
The uniaxial shake table (ST1D) at Laboratório Nacional de Engenharia Civil (LNEC) is
driven by a servo-hydraulic actuator capable of applying forces up to 200KN. The shake table
is position-controlled by an analog servo-controller using a proportional gain in the inner loop.
The analytical model for the ST1D system can be obtained by combining the mathematical
models of the controller, the servo-valve (dynamics and flow characteristics), the hydraulic
actuator (continuity and force balance equations), and the platen (mass and friction properties)
[2]. The servo-valve model assumes a first-order transfer function. This suffices for the opera-
tional frequency range of ST1D [3]. The non-linear general flow equation of the actuator [4]
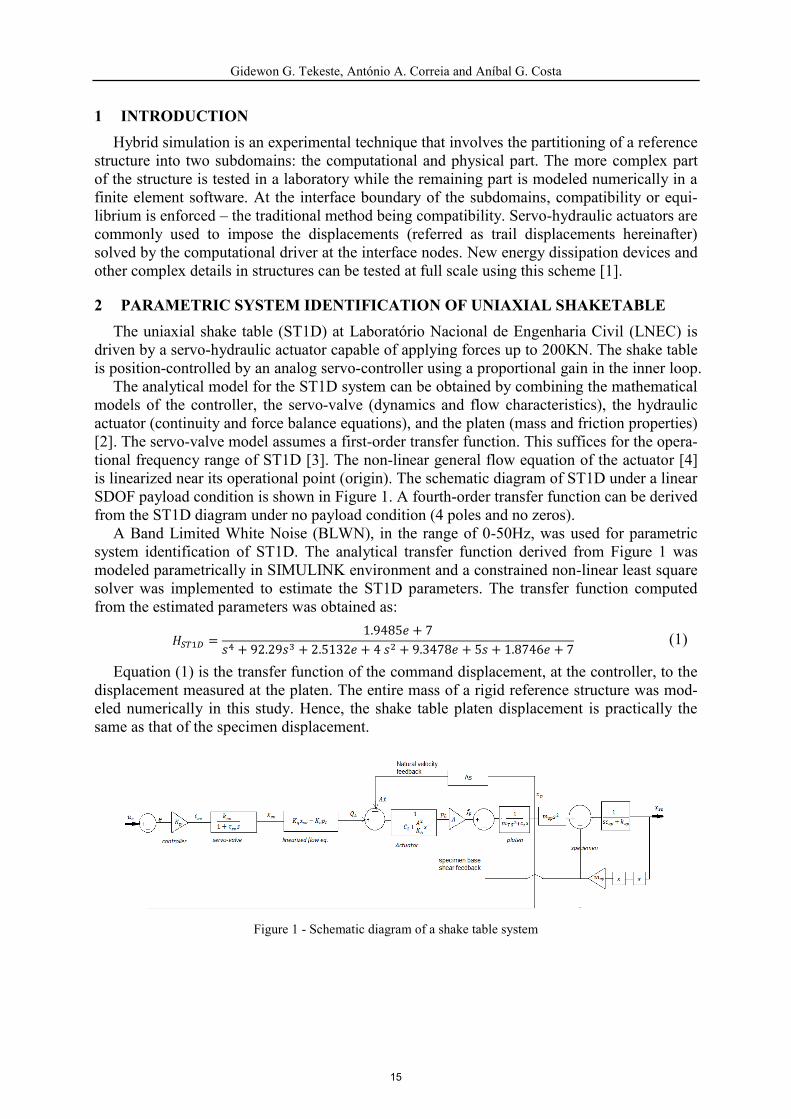
is linearized near its operational point (origin). The schematic diagram of ST1D under a linear
SDOF payload condition is shown in Figure 1. A fourth-order transfer function can be derived
from the ST1D diagram under no payload condition (4 poles and no zeros).
A Band Limited White Noise (BLWN), in the range of 0-50Hz, was used for parametric
system identification of ST1D. The analytical transfer function derived from Figure 1 was
modeled parametrically in SIMULINK environment and a constrained non-linear least square
solver was implemented to estimate the ST1D parameters. The transfer function computed
from the estimated parameters was obtained as:
𝐻𝑆𝑇1𝐷 =1.9485𝑒 + 7
𝑠4 + 92.29𝑠3 + 2.5132𝑒 + 4 𝑠2 + 9.3478𝑒 + 5𝑠 + 1.8746𝑒 + 7 (1)
Equation (1) is the transfer function of the command displacement, at the controller, to the
displacement measured at the platen. The entire mass of a rigid reference structure was mod-
eled numerically in this study. Hence, the shake table platen displacement is practically the
same as that of the specimen displacement.
Figure 1 - Schematic diagram of a shake table system
15

Gidewon G. Tekeste, António A. Correia and Aníbal G. Costa
3 VIRTUAL HYBRID SIMULATION USING OPENFRESCO
The Open-source Framework for Experimental Setup and Control (OpenFresco) is an envi-
ronment-independent software framework that connects finite element models with laboratory
control and data acquisition systems. The ExperimentalControl is the one among the four OF
abstractions that is responsible for communicating the finite element software with a variety
of control and data acquisition systems [5]. The ExperimentalControl class also allows a fully
simulated (virtual) HS through SimUniaxialMaterial and SimDomain experimental control
objects. In the former control object, a material model simulates the force that the load cell of
an actuator would measure for a given set of displacements. On the other hand, the SimDo-
main control object makes available to OpenFresco all the OpenSees element, material and
section libraries [6].
The OpenFresco software framework also offers the ExpSignalFilter (ESF) objects that are
used to modify the signals that are going back and forth of the control system. The ESFError-
Simulation filter object is capable of modeling experimental errors through undershoot, over-
shoot, and a Gaussian white noise. In the latter, a randomly distributed Gaussian error is
defined in OpenFresco using a mean value and a standard deviation (referred hereinafter as
error parameters). The Box-Muller transformation is used to generate WGN using uniform
deviates. The virtual HS performed in this paper assumes a Gaussian white noise error in
modeling the experimental errors. This is mainly due to an amplitude-dependent behavior of a
servo-hydraulic actuator that arises from its inherent non-linearity combined with a non-linear
response of a test specimen.
During the virtual hybrid test, the SimUniaxialMaterial control object was used to simulate
the response of the experimental element and the ESFErrorSimRandomGauss filter object was
adopted to model the experimental errors. The error parameters that should be defined in OF
were estimated using the identified shake table transfer function. The transfer function oper-
ates offline, receiving a vector of trial displacements from OS after each complete analysis of
the structure. The process started by assigning zero values to the error parameters in OF dur-
ing the first run. The vector of trial displacements of OS from the previous run were then ap-
plied to the SIMULINK model of ST1D as shown in Figure 2. The trial displacements were
deducted from the SIMULINK output displacement. The resulting signal was fitted into a
normal distribution using the Maximum Likelihood (ML) method and the error parameters
were estimated. To ensure the consistency property of ML, its estimates were compared with
estimates from the method of moments. The process was followed by performing fifty virtual
HS tests using the same estimated error parameters in OF. The statistics, mainly the mean and
the standard deviation for each time-step, of the responses was performed. Average of the re-
sponses from the fifty realizations were used to define the system responses. These responses
were compared with their error-free counterparts to analyze the effects of the modeled error.
The reference structure is a one-bay frame with fixed supports at the base. A truss element
connects the two vertical columns (see Figure 3).
Figure 2 - SIMULINK model of ST1D
Figure 3 - Partitioning of the test structure during HS
16

Gidewon G. Tekeste, António A. Correia and Aníbal G. Costa
The two columns are experimental elements, while the truss element is a numerical ele-
ment. Nodes 3 and 4 are free to rotate allowing the experimental control, at the interface
boundary, to be a one-actuator control. The structure was subjected to the El Centro ground
motion that is scaled to 0.3 g PGA and a time-step of 0.02 sec. An implicit Newmark integra-
tion scheme with a fixed number of iterations (five) was adopted during the analysis.
The repeatability of the error model was verified because the same value of standard devia-
tion was attained throughout the test for both forces and displacements, see Figure 4 (top left).
It is evident from Figure 4 (bottom left and right) that the ST1D delay introduces a negative
damping effect, and hence a smaller dissipation of energy, similarly to the undershoot depict-
ed in the same figure. The outcome is a reasonably good simulation of the system response,
which can be further improved by compensation techniques.
Figure 4 – Coupling force (μ, σ) of the 50 realizations (top left), subspace synchronization plot (bottom left) and
top column hysteresis (right)
4 CONLUSIONS
The paper briefly discussed the potential of OS and OF in performing virtual HS using a
realistic ST1D model. Results show the coupled effect of delay and gain errors. Although an
online procedure was possible, a simple offline method was found to be applicable with fewer
resources. Online techniques will be addressed in future developments.
REFERENCES
[1] V. Saouma and M. Sivaselvan, Hybrid simulation: Theory, Implementation and
Applications. Taylor & Francis, 2008.
[2] J. E. Carrion and B. F. Spencer, Model-based Strategies for Real-time Hybrid Testing.
NSEL Report Series. Report No. NSEL-006, lllinois, USA, 2007.
[3] MOOG, Electrohydraulic Valves... A Technical Look - Datasheet, 2002.
[4] H. E. Merrit, Hydraulic control systems. John Wiley & Sons, Inc., 1967.
[5] A. H. Schellenberg, S. A. Mahin, and G. L. Fenves, Advanced Implementation of
Hybrid Simulation. PEER Report 2009/104, California, USA, 2009.
[6] A. Schellenberg, H. K. Kim, Y. Takahashi, G. L. Fenves, and S. A. Mahin, OpenFresco
Command Language Manual: OpenFresco v2.6. Tech. report, California, USA, 2009.
17

OpenSees Days Europe 2017
1st European Conference on OpenSees
Porto, Portugal, 19–20 June 2017
NUMERICAL MODELLING OF CONCRETE-FILLED STEEL
TUBULAR MEMBERS IN OPENSEES
Y. Jiang1, 2, A. Silva1, 2, L. Macedo1, J. M. Castro1 and R. Monteiro2
1 Department of Civil Engineering, Faculty of Engineering, University of Porto
Rua Dr. Roberto Frias s/n, 4200-465 Porto, PORTUGAL
e-mail: [email protected], [email protected], [email protected] and [email protected]
2 Istituto Universitario di Studi Superiori di Pavia
Palazzo del Broletto - Piazza della Vittoria n.15, 27100 Pavia, Italy
e-mail: [email protected]
Keywords: OpenSees, Concrete Filled Steel Tube, Concentrated Plasticity Model, Seismic
Performance
Abstract. The research study documented in this document details an accurate and efficient
numerical model for concrete-filled steel tubes (CFST) in OpenSees. The feasibility of both
Distributed Plasticity (DP) and Concentrated Plasticity (CP) models was assessed based on
comparisons with experimental test data. One of the main conclusions obtained pertains the
high level of accuracy with the use of the CP model, as it is able to accurately simulate the
cyclic response of CFST members. Two moment-resisting framed systems, namely steel and
composite frames, were designed in accordance with Eurocode 8 and their seismic performance
was evaluated on the basis of the proposed model. The analytical results allowed concluding
about the better seismic performance of the composite system in comparison with the steel
equivalent, as shown by the results of fragility assessment through Incremental Dynamic Anal-
ysis (IDA).
18

Y. Jiang, A. Silva, L. Macedo and J. M. Castro
1 INTRODUCTION
The use of concrete filled steel tube (CFST) member in construction practice has become
widespread over recent decades. Confinement effects, that improve both the strength and duc-
tility of the core material, as well as the constraint offered by the core to the encasing steel tube,
which minimizes the influence of local buckling, are some of the advantages of these members.
As a consequence, the capacity and seismic performance of structures can be improved by the
use of CFST members in detriment of reinforced concrete or steel-only solutions. The main
purpose of the research study detailed herein is the development of an accurate model for CFST
members in OpenSees, and to access the influence of CFST members on the seismic perfor-
mance of moment-resisting frames.
2 MODELLING OF CFSTS IN OPENSEES
Two types of beam-column elements were considered to model CFST members in OpenSees,
namely Distributed Plasticity (DP) and Concentrated Plasticity (CP) models. In order to inves-
tigate the bending behaviour of long CFST columns, 16 circular rubberized CFST specimens
which, were recently tested [1] at the University of Porto, were used to calibrate the aforemen-
tioned models.
2.1 Distributed Plasticity (DP) Model
The DP model is a beam-column model with fibre sections distributed along the element.
The modelling of fibre section is made directly, and is compatible with both 2D and 3D frame
models. However, composite effects (e.g. confinement effect) and local buckling phenomena
are not accurately captured by this model.
Figure 1: Fibre section mesh details of a circular CFST
member
Figure 2: Lateral force-displacement curve compar-
ison between test data and the DP model results
Figure 1 shows the mesh details of the fibre section adopted. The concrete and steel parts
were assigned with material models concrete01 and Steel01 with uniaxial properties, respec-
tively. Figure 2 shows the comparisons between the numerical results of the DP model and the
test data for specimen No.7 [1]. As shown in the figure, by using the uniaxial properties of the
materials, the capacity of the CFST members is underestimated by the DP model, as the model
does not consider the confinement effects of the concrete. The DP model also fails to predict
strength deterioration effects of the CFST member under cyclic loading. Therefore, by using
the DP model the ductility of the CFST member under cyclic loading is overestimated, which
19

Y. Jiang, A. Silva, L. Macedo and J. M. Castro
will result in inaccurate simulation of the seismic behaviour of a global structural system. Hence,
the DP model based on uniaxial material properties is not suitable for modelling CFST members.
2.2 Concentrated Plasticity (CP) Model
The CP model consists of an elastic beam member and two nonlinear springs lumped at the
two ends. This approach is often adopted for 2D frame analysis but its extension to 3D analysis
is not trivial due to the need to account for interaction effects. The behaviour of the nonlinear
springs should be calibrated based on existing data, either from tests or from more accurate
models (e.g. detailed 3D finite element model). Thus, the CP model has the ability to represent
both concrete confinement effects and the strength degradation of the hysteretic response.
The ModIMKPeakOriented material available in OpenSees was adopted as the nonlinear
spring of the CP model. The CalTool [2] (Figure 3) framework was used to calibrate the input
parameters of the CP model. The target of the calibration was the analytical results of a 3D
CFST model in ABAQUS. Figure 4 shows the comparison of the calibrated CP model results
with the results of the ABAQUS model. As shown, the CP model is in good agreement with the
target in what concerns ultimate capacity, loading/unloading stiffness and strength degradation.
Figure 3: The CalTool Figure 4: The cyclic behaviour comparison
between the CP model in OpenSees and the
3D model from Abaqus
3 SEISMIC PERFORMANCE ASSESSMENT OF A COMPOSITE FRAME
A 5-storey building structure was designed with two frame solutions, namely a composite
frame and a steel frame. The composite frame was materialised with CFST columns and IPE
beams, whilst the remainder was designed with HEB columns and IPE beams. Both HEB and
IPE designate H-shaped and I-shaped European steel open sections, respectively. The design
provisions of Eurocode 8 [3] were followed to design the two frames. Besides the CFST mem-
bers, the IPE and HEB members were also modelled with a CP approach, which were coupled
with the Bilin material.
The seismic performance assessment of the two frames was conducted using Incremental
Dynamic Analysis (IDA). A group of 30 ground motions from real earthquake events were
selected and scaled with the SelEQ tool [4] to have a spectra shape compatible with Eurocode
8 spectrum.
Figure 5 shows the fragility curves of the two frames under the limit state of collapse, which
was considered as the point where the slope of the IDA curve reduces to 10% of the initial value.
20

Y. Jiang, A. Silva, L. Macedo and J. M. Castro
As shown in the figure, the composite moment-resisting frame exhibits a better seismic perfor-
mance in comparison to the steel frame, with much lower probabilities of exceedance under the
same intensive measure level.
Figure 5: The fragility curve comparison between the steel frame and the composite frame under the collapse
limit state
4 CONCLUSIONS
By developing the model for CFST member and evaluating the seismic performance of com-
posite frame in OpenSees, the following conclusions could be drawn:
The DP model with uniaxial material properties is not suitable for modelling CFST mem-
ber, as the model is not able to account for concrete confinement effects and local buckling
of the steel tube;
The CP model is able to simulate well the cyclic response of CFST members under flexure,
both in terms of member capacity and strength deterioration effects;
The composite frame studied, materialised with CFST columns instead of equivalent steel
member, showed better seismic performance than the steel frame, as shown by the com-
parison of the collapse fragility curves.
REFERENCES
[1] A. Silva, Y. Jiang, J. M. Castro, N. Silvestre, R. Monteiro. Experimental assessment of
the flexural behaviour of circular rubberized concrete-filled steel tubes. Journal of Con-
structional Steel Research, 122, 557-570, 2016.
[2] L. Macedo. Performance-based seismic design and assessment of steel moment frame
buildings. PhD Thesis University of Porto, 2017.
[3] CEN. Eurocode 8: Design of structures for earthquake resistance, part 1: general rules.
Seismic actions and rules for buildings, European Committee for Standardization, Brus-
sels, 2004.
[4] L. Macedo and J. M. Castro. SelEQ: An advanced ground motion record selection and
scaling framework. Advances in Engineering Software, 2017. DOI: 10.1016/j.adveng-
soft.2017.05.005.
21

OpenSees Days Europe 2017
1st European Conference on OpenSees
Porto, Portugal, 19–20 June 2017
OPTIMIZED SEISMIC DESIGN OF
STEEL FRAMES USING OPENSEES
João Nogueira1, Luis Macedo2, and José Miguel Castro3
1 Faculdade de Engenharia da Universidade do Porto
Rua Dr. Roberto Frias, s/n, 4200-465 Porto - Portugal
email: [email protected]
2 Faculdade de Engenharia da Universidade do Porto
Rua Dr. Roberto Frias, s/n, 4200-465 Porto - Portugal
email: [email protected]
3 Faculdade de Engenharia da Universidade do Porto
Rua Dr. Roberto Frias, s/n, 4200-465 Porto - Portugal
email: [email protected]
Keywords: Design, Optimization, Harmony Search Algorithm, Software
Abstract. This paper describes the concept and development of a software tool that allows the
automatic design and optimization of steel frames under the effect of gravitational and seismic
loads. The software was developed using Python as a programming language and OpenSees as
the structural analysis framework. The design checks are carried out in accordance with
Eurocodes 3 and 8. A metaheuristic algorithm was used in order to optimize the design. The
results obtained lead to the conclusion that it is possible to obtain economically viable solutions
using automated methods.
22

J. Nogueira, L. Macedo and J. M. Castro
1. INTRODUCTION
Civil engineering is an activity of great responsibility, as errors could result on large
economical and human losses, as well as a significant impact on the environment and culture.
Therefore, it is essential that every decision can be supported by standards and regulations, as
thorough as possible. Even though there are dozens of commercial software dedicated to civil
engineering, there is still a lack in software that allows not only the design according to
eurocodes but also the structural optimization and support research related to the development
of new design approaches.
This paper describes the concept and development of a software that allows the automatic
and optimal design of steel frames under gravity and seismic loads. This software was
developed using Python as a programming language, and OpenSees [1] as the structural analysis
framework. The paper ends with a case study that shows a comparison between the solution
obtained on this paper and a solution obtained through a conventional design approach.
The analysis of the steel frames was developed in accordance with Eurocode 3, and the
seismic analysis in accordance with Eurocode 8. The remaining actions and other basic
requirements were defined following Eurocode 0.
2. OPTIMIZATION PROBLEM
2.1 Problem formulation
The objective of this software is to optimize the design of steel frames. Being cost one
of the most common criterion in structural design, it was adopted as the objective of the
optimization process. In steel structures, cost is mainly a function of the weight of the structure,
but also of other factors like fabrication, erection, connections, etc. Since the other factors
exceeded the scope of this paper, the objective function was defined as follows:
Minimize W = ∑ 𝛾𝑖 ∗ 𝐿𝑖 ∗ 𝐴𝑖
𝑁𝑒
𝑖=1
(1)
where W is the weight of the structure, Ne is the number of elements, 𝛾𝑖 is the material density
of member i, Li is the length of member i and Ai is the cross-section area of member i. Eurocodes
3 and 8 establish several design criteria, such as maximum values of stress, displacement, etc.
Hence, the design process consists of a constrained problem. Pezeshk et al. [2], and later Camp
et al. [3], proposed transforming the unconstrained problem into a constrained problem using a
penalty function. In this formulation, the constraint violation function was defined to adapt the
penalty as a function of the various coefficients
𝐶 = 5 ∗ ∑𝐶𝑖
∑ 𝐶𝑖61
∗ 𝐶𝑖
6
𝑖=1
= 5
∑ 𝐶𝑖61
∗ ∑ 𝐶𝑖2
6
𝑖=1
(2)
where Ci is a penalty coefficient i. These penalty criteria were defined with both the objective
of implementing the design checks prescribed in the Eurocodes and to obtain sustainable
solutions. The penalty coefficient is obtained as a function of six partial coefficients, each of
them corresponding to the ratio of sum of unmet criteria for the total number of design checks.
C can vary between 0 and 5. Six penalty ratios were defined: (1) EC8 damage limitation state,
23

J. Nogueira, L. Macedo and J. M. Castro
(2) EC8 ultimate limit state, (3) EC8 local ductility condition, (4) EC 3 verifications, (5) cross-
section area reduction with height and (6) interstorey drift sensitivity coefficient verification.
2.2 Harmony Search Optimization
The harmony search algorithm (HS) is one of the most recently developed metaheuristic
optimization technique, which is based on the concept of music improvisation process involved
in search for a better harmony [4]. This algorithm was first developed by Geem et al. [5] with
static parameters and later improved by Mahdavi et al. [6] and Kumar et al. [4] who developed
expressions to change the main parameters dynamically during the process. Several
applications of HS to steel frames can also be found [7-8].
For the development of this software, a variation of the expressions proposed by
Mahdavi et al. [6] for the Bandwidth (BW) and the expressions proposed by Kumar et al. [4]
for the Pitch Adjustment Rate (PAR) and Harmony Memory Consideration Rate (HMCR) were
implemented.
The algorithm was implemented considering two stopping limits. The first one defines
the maximum number of iteration during which adaptive parameters are used (Nadaptive), then
the maximum number of iterations (Nmax) with static parameters. Hence, the parameters evolve
as represented in Fig. 1. The second stopping criterion was defined so that it concludes the
design if the best structure was not changed for 20% of the maximum number of iterations.
Fig. 1 - Parameters used in this software
BW was set between 1 and 20% of the possible sections’ list, PAR was set between 0.01
and 0.99, and HMCR was set between 0.7 and 0.99. The Harmony memory was set to 2.5 times
the number of variables.
3. DESCRIPTION OF THE SOFTWARE
3.1 System architecture
The proposed software for optimized design of steel frames is organized in 4 modules dedicated
to: (1) create and manage the data model, (2) interact with Opensees to perform the structural
analysis, (3) verify the resistances of the elements and (4) the module that implements the
optimization algorithm, which is responsible for controlling the process. The algorithm was
developed in Python and the Opensees models are dynamically generated resorting to a
template engine available in Python.
3.2 Design of the software
All structural analyses are performed using Opensees and considering P-Δ effects, in
accordance with Section 5.2.1 of EC3. Therefore, the geometry of the structure in the Opensees
24

J. Nogueira, L. Macedo and J. M. Castro
model is always affected by the imperfections for global analysis defined in Section 5.3.2 of
EC3. The results of the forces on the nodes are then parsed in Python and stored in the data
model.
The seismic analysis is performed through the lateral force method of analysis. It is worth noting
that this approach has limitations that should be taken into account, particularly when dealing
with tall frames or frames irregular along the height.
The verification module was conceptualized in a way which not only allowed it to be extended
to other structural types (e.g., RC, composite) but also to be used independently from the
software.
4. APPLICATION EXAMPLES
In order to demonstrate the efficiency of the software and its synergy with OpenSees, a
comparison between optimized design of frames and frames designed in a conventional way
[9] will be presented.
The structure designed is a three-bay, five-storey planar steel frame. The structural elements
are grouped as shown in Fig. 2 with the objective of ensuring a structure adequate for
construction. For this case, a penalty function exponent of 2 was considered and the remaining
parameters were obtained via the expressions presented in Section 2.
The following material properties were considered: yield stress, fy, equal to 275 MPa, Young’s
modulus, E, equal to 210 GPa, distortion modulus, G, equal to 81 GPa, Poisson coefficient
equal to 0.3 and a specific weight, 𝛾, of 77 kN/m3. Concerning the loads, the structure is
subjected to residential loads and a peak ground acceleration of 0.3g, the soil is of type B
according to EC8 definition, damping is 5% and the class of importance is II.
European IPE sections were used for the beams and European HEB sections were used for the
columns.
The interstorey drift sensitivity coefficient was limited to 0.2 in order to allow a direct
comparison with the results obtained by Macedo [9]. The results are presented in Table 1.
Table 1 – Comparison between manual and automated design
Sections Weight
(ton)
DCM
q = 4
Manual [ref] HEB340, HEB400, HEB280, HEB340, HEB280, HEB340,
IPE360, IPE360, IPE330, IPE300, IPE300 14.10
Automated HEB240, HEB340, HEB220, HEB280, HEB140, HEB180,
IPE400, IPE400, IPE360, IPE300, IPE270 11.12
DCH
q = 6.5
Manual [ref] HEB400, HEB450, HEB340, HEB360, HEB340, HEB360,
IPE400, IPE400, IPE400, IPE330, IPE300 16.20
Automated HEB280, HEB400, HEB240, HEB360, HEB180, HEB240,
IPE500, IPE450, IPE400, IPE300, IPE270 13.59
The software conducted to structures 21.1% and 16.1% lighter than the manual design, resulting
in savings of 2.98 and 2.61 tons of steel, respectively.
25

J. Nogueira, L. Macedo and J. M. Castro
Fig. 2 – Structure geometry and groups of elements (left) and comparison between manual and automated
design (right)
5. CONCLUSIONS
This paper presented a new software tool for the optimized design of steel frames. The software
is powered by the OpenSees structural analysis framework. The results obtained demonstrate
the level of efficiency that can be achieved with the application of optimization algorithms in
structural design.
6. REFERENCES
1. PEER, OpenSEES: Open System for Earthquake Engineering Simulation.
Berkeley,CA, 2006.
2. Pezeshk, S., C. Camp, and D. Chen, Design of nonlinear framed structures using genetic
optimization. Journal of Structural Engineering, 2000. 126(3): p. 382-388.
3. Camp, C.V., B.J. Bichon, and S.P. Stovall, Design of steel frames using ant colony
optimization. Journal of Structural Engineering, 2005. 131(3): p. 369-379.
4. Kumar, V., J.K. Chhabra, and D. Kumar, Parameter adaptive harmony search
algorithm for unimodal and multimodal optimization problems. Journal of
Computational Science, 2014. 5(2): p. 144-155.
5. Geem, Z.W., J.H. Kim, and G. Loganathan, A new heuristic optimization algorithm:
harmony search. Simulation, 2001. 76(2): p. 60-68.
6. Mahdavi, M., M. Fesanghary, and E. Damangir, An improved harmony search
algorithm for solving optimization problems. Applied Mathematics and Computation,
2007. 188(2): p. 1567-1579.
7. Degertekin, S., Optimum design of steel frames using harmony search algorithm.
Structural and Multidisciplinary Optimization, 2008. 36(4): p. 393-401.
8. Hasançebi, O., F. Erdal, and M.P. Saka, Adaptive harmony search method for structural
optimization. Journal of Structural Engineering, 2009. 136(4): p. 419-431.
9. Macedo, L., Performance-based seismic design and assessment of steel moment frame
buildings, PhD Thesis University of Porto, 2017.
0
2
4
6
8
10
12
14
16
18
DCM (q = 4) DCH (q = 6,5)
Wei
ght
(t)
Manual Automated
26

OpenSees Days Europe 2017
1st European Conference on OpenSees
Porto, Portugal, 19–20 June 2017
AUTOMATIC CALIBRATION OF HYSTERETIC MODELS THROUGH
MULTIPLE RESPONSES
Corrado Chisari1, Gianvittorio Rizzano2, Claudio Amadio3, and Massimo Latour4
1 University of Salerno
via Giovanni Paolo II, 132 – 84084 Fisciano (SA) - Italy
e-mail: [email protected]
2 University of Salerno
via Giovanni Paolo II, 132 – 84084 Fisciano (SA) - Italy
3 University of Trieste
piazzale Europa, 1 – 34127 Trieste - Italy
4 University of Salerno
via Giovanni Paolo II, 132 – 84084 Fisciano (SA) - Italy
Keywords: Genetic Algorithms, Software, Discrepancy, Multi-objective optimization.
Abstract. This paper describes MultiCal, a software package recently developed by the authors
which is able to calibrate parameters of several hysteretic models implemented in OpenSees,
by fitting experimental generalized strain-stress curves. The calibration is performed by means
of a multi-objective optimization procedure directly interfaced with OpenSees software, in
which discrepancy between experimental and numerical responses is minimized. Up to six ex-
perimental responses may be utilized to increase robustness of the calibration, and for each
one different quantities of interest can be fitted (raw data, energy, envelope). The applicability
of the procedure is demonstrated by real-world examples involving steel components.
27

Corrado Chisari, Gianvittorio Rizzano and Claudio Amadio
1 INTRODUCTION
Material models with different degrees of sophistication are implemented in general structural
software codes, and specifically OpenSees [1]. In particular, hysteretic models are able to sim-
ulate many phenomena occurring under cyclic loading conditions: stiffness and strength degra-
dation, pinching, crack/gap opening and closing, low-cycle fatigue. These models are called
phenomenological because they simulate the phenomenon and not the underlying physics. In
this respect, they can be applied to a wide range of structural elements, as they can represent
relationships as force-displacement of rods, moment-rotation of beam-to-column joints, base
shear-top displacement of buildings, etc. without conceptual differences. Recognizing this, in
OpenSees they are all grouped under the uniaxialMaterial label.
Even though phenomenological models have great potential for dynamic analyses thanks to low
computational cost, they have the important drawback that the parameters involved in the hys-
teretic behavior often lack physical meaning, and thus their calibration may become problem-
atic. A feasible approach to calibration involves curve fitting of experimental responses, which
in turn can be solved with either trial-and-error techniques and expert judgement, or more effi-
cient numerical optimization procedures. In [2], the authors proposed a methodology to perform
calibration of the smooth model by Sivaselvan and Reinhorn [3]. Among the main findings of
such work, multi-objective calibration accounting for both monotonic and cyclic tests was
found to add robustness, since fitting of a single cyclic response may provide incorrect calibra-
tion of parameters, due to ill-posedness of the inverse problem.
In this paper, MultiCal, a software package specifically designed to calibrate model param-
eters for hysteretic models, is described. Some examples are also illustrated to show the poten-
tial and the application range of the software.
2 MULTI-OBJECTIVE CALIBRATION
Calibration (or parameter identification) of a numerical model means finding the set of pa-
rameters �̃� such that the computed response given by a simulation of a test yc(p) is as close as
possible to the experimental response yexp. When NT calibration tests are performed, this implies
solving the optimization problem:
�̃� = arg min𝒑∈𝑷
{𝜔1(𝒑), … , 𝜔𝑁𝑇(𝒑)} (1)
where 𝜔𝑖(𝒑) =‖𝒚𝒆𝒙𝒑,𝒊−𝒚𝒄,𝒊(𝒑)‖
‖𝒚𝒆𝒙𝒑‖ is the discrepancy function measuring the inconsistency be-
tween the experimental and computed quantities for the i-th test, and P the set of all possible
parameter combinations. The minimization of ω may be accomplished by using different opti-
mization methods. In this work, the solution of (1) is obtained by means of the Non-dominated
Sorting Genetic Algorithms II, NSGA-II [4].
In the context of multi-objective optimization, the concept of Pareto optimality replaces the
usual notion of optimality. A solution is referred to as Pareto optimal if it is not dominated by
any other solution. The ensemble of all Pareto optimal solutions is said Pareto Front PF, and it
represents the general solution of (1). At the end of the analysis, a unique compromise solution
𝒑𝒄𝒐𝒎𝒑𝒓 may be extracted from the Pareto Front, according to the rule:
𝒑𝒄𝒐𝒎𝒑𝒓 = arg min𝑝∈𝑷𝑭
‖𝝎(𝒑) − 𝝎𝒖𝒕𝒐𝒑𝒊𝒂‖ (2)
where 𝝎(𝒑) = [𝜔1(𝒑), … , 𝜔𝑁𝑇(𝒑)]
𝑇 and 𝝎𝒖𝒕𝒐𝒑𝒊𝒂 is the vector of the minimum discrepan-
cies.
28

Corrado Chisari, Gianvittorio Rizzano and Claudio Amadio
3 STRUCTURE OF THE CODE
The authors developed MultiCal, a software code to solve problem (1), written in C# and di-
rectly interfacing with OpenSees. With the aim of facilitating the user, the solver is equipped
with a pre-processor able to generate the input files for the optimization, given the curves to fit
and the model to calibrate. The software code can be downloaded at www.multical.unisa.it.
3.1 Models implemented
To date, six OpenSees hysteretic models are implemented in the software. Three of them are
present in the standard library: Bilin, BoucWen, Hysteretic. Other three are composed of ele-
mentary springs in series/parallel: flag-shaped, degrading flag-shape and L-stub models. An
additional model [3], for the calibration of which it is necessary to interface with Seismostruct
software [5], is also implemented but it will not be discussed here.
3.2 General workflow
After installing the software, the user can optionally run the pre-processor from the command-
line with the command:
multical -t -c curve1.csv -c curve2.csv … -m modelName (3)
where curve1.csv, curve2.csv, … are up to six experimental curves to fit, saved in two-column
csv file, with standard delimiter “,”. The two columns respectively contain generalized strain
and stress. The delimiter may be changed to delim adding the option “-d delim” to the command
(3). Command (3) will generate the needed input files in the current directory. They can be
modified with a text editor if needed, and afterwards the analysis is launched with the command:
multical -c curve1.csv -c curve2.csv … -m modelName (4)
where the absence of -t option means that the solver is not run in template-generator mode. The
--nozip argument is optional and can be used to limit the output size.
3.3 Input files
Three input text files are needed for the analysis. They can be created from scratch, or by run-
ning the pre-processor as explained in the previous subsection.
GA_Parameters.txt contains the Genetic Algorithms parameters.
InputParameters.txt contains variation ranges for the material parameters to calibrate.
They can be defined as constant, variable in a range, or mathematical combination of other
parameters.
OutputParameters.txt contains the definition of the objectives. For each curve to fit it is
possible to evaluate (and minimize) the error (i) in the generalized stress history, (ii) in the
energy history, or (iii) in the envelope curve.
3.4 Output files
The solver will create a folder where all output files are contained. Together with a copy of the
input files (useful to keep track of the input for further assessment), they are:
ProjectLabel.csv contains the database of the processed solutions, identified by a numeri-
cal ID label. ProjectLabel is a specified in GA_Parameters.txt. The database contains input
and output variables and progressive analysis time. It is updated every GA generation.
29

Corrado Chisari, Gianvittorio Rizzano and Claudio Amadio
ParetoFront.csv is similar to the previous file, but it contains the additional information
regarding the domination front of each individual, and thus is generated only at the end of
the analysis.
Compromise_XY is a copy of the folder representing the compromise solution chosen per
definition (2). It contains OpenSees input and output files as well as the csv files with the
computed counterparts of curves curve1.csv, etc. mentioned in (4). XY is the numerical ID
label of the solution during the analysis.
4 EXAMPLES
4.1 Hollow-section steel member
The set of open and hollow cross-section beams investigated experimentally in [6] was used
as an experimental database for the calibration of three phenomenological models implemented
in OpenSees, namely Bilin, BoucWen, Hysteretic. In particular, the results concerning the
250×250×8 square hollow section will be presented here. A 1865mm-long cantilever beam was
tested in pure bending according to monotonic and AISC cyclic protocol. The calibration of the
three models was then performed according to the moment-rotation curve for the monotonic
test, and energy-time curve for the cyclic test.
Figure 1. Results of the calibration of a hollow-section profile.
As Genetic Algorithms have a strong stochastic component, it is suggested to repeat the analysis
more than once to verify its robustness. The uncertainty range resulting from ten runs of the
calibration, together with the experimental results, is displayed in Figure 1. It is possible to
notice that all three models fit remarkably well and with low uncertainty both experimental
responses.
4.2 Self-centering dissipative base joint
The second example regards the characterization of an innovative dissipative base joint, in
which the dissipation is demanded to special friction pads, while the self-centering feature is
assigned to a pre-stressed steel bar. A cyclic test according to AISC protocol was performed,
with an axial force applied at the top of the column equal to 0.25 times the column plastic
capacity. Herein, the simulated response of both flag-shaped and degrading flag-shaped phe-
30

Corrado Chisari, Gianvittorio Rizzano and Claudio Amadio
nomenological models are investigated. The calibration was performed onto the cumulated en-
ergy and the envelope of the curve. From Figure 2, it is possible to notice that, unlike the simpler
flag-shaped model, the degrading flag-shape is able to capture stiffness degradation and yield
point shifting.
Figure 2. Performance of non-degrading and degrading flag-shaped model in simulating the dissipative
joint response.
4.3 L-stub
The last example regards an innovative type of angle to be used in substitution of hold-down
in cross-laminated timber panel buildings [7]. The force-displacement response model of the
angle has been calibrated onto the data coming from a monotonic and a variable-amplitude
cyclic test (Figure 3, top row), and validated against fixed-amplitude cyclic tests (Figure 3,
bottom row).
Figure 3. Results of the calibration of the innovative dissipative angle.
5 CONCLUSIONS
In this paper, a software for the automatic calibration of hysteretic uniaxial models imple-
mented in OpenSees by means of multi-objective optimization has been described. The appli-
cation to several examples regarding steel components has shown the feasibility and generality
of the approach. Further extensions will regard the implementation of more numerical models
into the software.
31

Corrado Chisari, Gianvittorio Rizzano and Claudio Amadio
REFERENCES
[1] OpenSees, “Open System for Earthquake Engineering Simulation,” 2010. [Online].
Available: http://opensees.berkeley.edu/wiki/index.php/Main_Page. [Accessed 12
October 2016].
[2] C. Chisari, A. B. Francavilla, M. Latour, V. Piluso, G. Rizzano and C. Amadio, “Critical
issues in parameter calibration of cyclic models for steel members,” Engineering
Structures, vol. 132, pp. 123-138, 2017.
[3] M. V. Sivaselvan and A. M. Reinhorn, “Hysteretic models for deteriorating inelastic
structures,” J. Eng. Mech., vol. 126, no. 6, pp. 633-640, 2000.
[4] K. Deb, A. Pratap, S. Agarwal and T. Meyarivan, “A Fast and Elitist Multiobjective
Genetic Algorithm: NSGA-II,” IEEE Transactions on Evolutionary Computation, vol. 6,
no. 2, pp. 182-197, 2002.
[5] Seismosoft, “SeismoStruct v7.0 – A computer program for static and dynamic nonlinear
analysis of framed structures,” 2014. [Online]. Available: http://www.seismosoft.com.
[Accessed 13 April 2016].
[6] M. D'Aniello, R. Landolfo, V. Piluso and G. Rizzano, “Ultimate behavior of steel beams
under non-uniform bending,” Journal of Constructional Steel Research, vol. 78, pp. 144-
158, 2012.
[7] M. Latour and G. Rizzano, “Cyclic behavior and modeling of a dissipative connector for
cross-laminated timber panel buildings,” Journal of Earthquake Engineering, vol. 19, no.
1, pp. 137-171, 2015.
32

OpenSees Days Europe 2017
1st European Conference on OpenSees
Porto, Portugal, 19–20 June 2017
ADVANTAGES OF USING BAYESIAN INFERENCE
FOR MODEL CALIBRATION IN OPENSEES
Ádám Zsarnóczay1
1 Budapest University of Technology and Economics
Kmf. 85. Műegyetem rkp. 3-9. Budapest, 1111
e-mail: [email protected]
Keywords: Markov Chain Monte Carlo, uncertainty quantification, posterior distribution, ma-
terial model, Steel4
Abstract. Imperfect model calibration is a source of uncertainty rarely quantified in contem-
porary seismic performance assessment. Calibration using Bayesian inference yields models
with random variables as parameters that allow direct consideration of model uncertainty. The
paper presents a simple methodology based on the Markov Chain Monte Carlo approach to
sample the posterior distribution of model parameters. Two modeling scenarios are presented
using numerical models of buckling restrained braces as an example. The influence of empirical
data on calibrated parameters and the consideration of uncertainty due to simplified model
behavior are briefly discussed. The computational efficiency and flexibility of OpenSees heavily
contributes to the simple implementation of the calibration methodology using one of the open-
source Bayesian statistical modeling frameworks. Considering the obvious advantages of un-
certainty quantification and the simplicity of its application with OpenSees, the author argues
that Bayesian inference should be used more often for numerical model calibration in earth-
quake engineering research.
33

Ádám Zsarnóczay
1 INTRODUCTION
Numerical models became the primary means of solving problems in structural engineering.
Models of various complexity are available for a large range of tasks in several software for
numerical analysis. OpenSees is one of many software that use the finite element method (FEM)
to formulate and solve structural engineering problems. It stands out with its open-source, com-
munity-driven development. That approach makes it a flexible tool that rapidly adapts to the
needs of its users. The efficient control of OpenSees using Tcl code is another important feature
that becomes especially useful for large-scale parametric studies. This paper presents such a
study where OpenSees is controlled by an algorithm developed in Python to gain a better un-
derstanding of model uncertainty.
Model uncertainty is the component of result uncertainty caused by imperfect representation
of the real behavior in a numerical environment. It might stem from insufficient or erroneous
empirical data available for model calibration or a simplified model that is used to describe a
complex phenomenon. Model uncertainty is rarely quantified in contemporary seismic perfor-
mance assessment. Calibration is typically performed with optimization methods that minimize
the error between measured, empirical data and simulated results. These methods produce one
best set of parameters. Instead of finding a single optimal set of values, we can obtain more
information if those parameters are considered random variables and we estimate the likelihood
of all of their possible sets of values. This is achieved through Bayesian inference.
This paper briefly demonstrates that information gained through a Bayesian approach can
help us answer the following questions on model calibration:
Does the empirical data describe the investigated structural behavior with sufficient com-
plexity to allow for calibration of every model parameter?
How to quantify the uncertainty that stems from using a simple model to simulate a more
complex behavior?
Numerical material model calibration in OpenSees is used as a vehicle to demonstrate that
answering the aforementioned questions is not difficult and seeking those answers can lead to
better models and more meaningful results. The numerical simulation of buckling-restrained-
brace (BRB) behavior is selected as an example of a complex calibration problem. OpenSees
offers several numerical materials for modeling BRB elements. An extended version of
BoucWen [1], SteelBRB [2], and Steel4 [3] are popular choices in recently published papers.
Steel4 is selected for this paper, because the author has the most experience with that model
and can demonstrate the behavior of several fundamentally different materials with it.
2 METHODOLOGY
Results in this study were generated using a simple approach to present a methodology that
can easily be adopted by fellow researchers. There are several areas of improvement available.
More advanced methods offer improved computational efficiency, but their application pro-
vides the same kind of insight.
The objective of a Bayesian approach to model calibration is to describe the likelihood of all
possible sets of model parameters (θ) that are consistent with the available empirical data (X).
The prior distribution of parameter likelihood p(θ) is available a priori; it is based on previous
experience and engineering judgement. When empirical data becomes available through exper-
iments, that new information can be used to update our knowledge about the parameters. The
likelihood of the empirical data given a set of model parameters is expressed by the p(X|θ)
conditional distribution. Using this knowledge, the updated probability distribution function of
the parameters, the so-called posterior distribution, is calculated with Bayes’ Theorem:
34

Ádám Zsarnóczay
p(𝜽|𝐗) =p(𝐗|𝜽)p(𝜽)
p(𝐗)=
p(𝐗|𝜽)p(𝜽)
∫ p(𝜽)p(X|𝜽)d𝜽𝜽
(1)
Although its calculation is straightforward, the posterior distribution can be very complex
and computationally challenging to sample efficiently. A popular solution to this sampling
problem is the application of a Markov Chain that is designed to have a stationary distribution
that equals the posterior distribution [4]. After a sufficiently large number of steps, a random
walk on such a Markov Chain will produce samples of the posterior distribution. This feature
is exploited by the Markov Chain Monte Carlo (MCMC) methods. Markov Chains were created
for this research using the Metropolis-Hastings algorithm. More advanced, gradient-based
methods are also available in the literature that provide better convergence speed and sample
multi-modal distributions more efficiently.
Probabilistic calculations were performed with the PyMC3 module [5] using Python code.
OpenSees calculated a set of response quantities (i.e. axial force and nodal displacement) from
an SDOF model that corresponds to a given set of material parameters. Those response quanti-
ties were used to determine the p(X|θ) distribution during every step of the random walk on the
Markov Chain. The number of steps required for calibration is in the range of 5000-500000,
depending on the number of calibrated parameters. Therefore, the computational efficiency of
OpenSees is an important asset for the presented work. Even complex models were calibrated
within one hour using a regular PC. An HPC-based approach could reduce this time signifi-
cantly.
The applied methodology is not limited to material model calibration. It is applicable to the
investigation of any parameter of any problem formulated in an OpenSees model. More com-
plex models with large number of degrees of freedom will lead to longer computation times.
Besides optimization of the MCMC method, there are other improvements available for such
cases (e.g. response surface method) that can make a Bayesian approach feasible.
3 ANALYSES AND DISCUSSION
Material model calibration in the following discussion is performed against numerical results
instead of experimental data. The true model that can generate the data used for calibration is
called the reference model in the following discussion. Because the reference model is known
when reference data is generated numerically, the agreement between calibrated and reference
models can be investigated in several loading scenarios. The author believes that this approach
provides more insight into the various forms of error and uncertainty in model calibration than
a single experimental result would do. Reference results are from a numerical buckling re-
strained brace element model that had previously been calibrated to an experimental result
(C500W-II in [6]). Measurement error is included in the reference data by adding white noise
to the simulated force values.
The quality of a numerical model is evaluated through its accuracy and its precision. Accu-
racy refers to the closeness of the simulated value to the reference result; precision refers to the
uncertainty in the simulated values. Because the reference model is not available when calibra-
tion is performed against experimental results, it is often difficult to quantify the accuracy of
the calibrated model in loading scenarios that differ from the one described by empirical data.
Hence, it is recommended to use several different experimental results to improve the accuracy
of a numerical model. Model precision can be inferred from the posterior distribution of the
calibrated parameters. The scatter of results in the desired analysis can also be directly investi-
gated, because samples from the posterior distribution are readily available.
The questions raised in the Introduction are discussed briefly in the following paragraphs.
35

Ádám Zsarnóczay
3.1 Quality of the empirical data
Model A in Fig. 1 shows an example scenario with low quality empirical data. Although the
Steel4 material can model non-symmetric nonlinear kinematic and isotropic hardening, the
available data does not provide sufficient information to identify all model parameters. Fig. 1a
confirms that the response of the calibrated model is in good agreement with the reference data
in spite of the large uncertainty in some of its parameters. The histograms in Fig. 1b illustrate
the marginal distributions of six key model parameters based on the posterior distribution func-
tion. The red lines indicate the reference values of the parameters. On the one hand, the initial
stiffness (E0), the yield stress (fy), and the kinematic hardening ratio (bk) were successfully
identified with sufficiently small uncertainty. On the other hand, the ratio of ultimate over yield
stress limit (fu), the saturation point for isotropic hardening (ρi), and the initial isotropic hard-
ening ratio (bi) are neither accurate, nor precise representations of their reference values. Their
variance is orders of magnitude beyond the practically acceptable range.
The consequences of such large uncertainty are emphasized by Figs. 1c and 1d. The former
shows the response of a large number of models sampled from the posterior distribution against
the reference response under a more demanding load history. The stress-strain curves are more
saturated where several samples produce identical results. Thus, more saturated points of the
curves are more likely representations of the calibrated material. Fig. 1d shows a similar com-
parison using the strain response of SDOF models to dynamic loading. The X component of
the 12012 Northridge ground motion record from the Far Field set of FEMA P695 was used as
input motion. Note the scatter of maximum strain values and the even larger uncertainty in the
residual strain at the second part of the ground motion.
Model B results in Fig. 2 show that a better designed experiment can provide empirical data
that is sufficiently complex to calibrate the numerical model. Comparison of the histograms in
Fig. 2b and Fig. 1b highlight the significant reduction in the variance of ρi and fu parameters.
Figure 1: Calibration results for model A: stress-strain plots of the model against reference data (a) and a more
demanding reference response (c); marginal distributions of key parameters (b); dynamic response of the refer-
ence and the calibrated model (d)
36

Ádám Zsarnóczay
Figure 2: Calibration results for model B: stress-strain plots of the model against reference data (a); marginal dis-
tributions of key parameters (b); dynamic response of the reference and the calibrated model (c)
Although the calibrated parameters are not perfectly accurate, they are sufficiently close to
the reference values to approximate the reference behavior with negligible error in the dynamic
analysis (Fig. 2c). Note that the red reference curves in Figs. 1d and 2c are not available when
calibration is performed against experimental results. The advantage of knowing the posterior
distribution is that we can review the variance of each parameter and the scatter of dynamic
results and quantify the precision of the model even without knowing the reference results.
3.2 Complexity of the numerical model
Properly designed experiments can provide sufficiently detailed and high quality empirical
data. A more challenging problem that researchers often have to tackle is to describe complex
structural behavior with a simplified material model. Model C illustrates this case with a mate-
rial capable only of bilinear behavior through kinematic hardening. Such a simple material can-
not accurately follow the nonlinear non-symmetric reference behavior with a single set of
parameters. Instead, it can be calibrated to several responses that shall exhaustively demonstrate
the important features of the reference behavior that we aim to simulate. Fig. 3 shows an exam-
ple: besides the familiar load history in Fig. 3a, two additional load histories were used for
calibration. The additional protocols contain fewer load cycles with larger displacement ampli-
tudes. Such responses are common in BRB elements under large intensity seismic excitation.
The calibrated responses drawn from the combined posterior distribution of the model cover all
three sets of reference data with sufficient accuracy at the cost of reduced precision.
Histograms in Fig. 4a confirm that consideration of the three sets of reference data leads to
significant uncertainty in the hardening ratio (bk) of the material. Note that the uncertainty in
the initial stiffness (E0) is not high, because its optimal value is similar for the three load histo-
ries. Figs. 4b and 4c show that the reference dynamic analysis result is in good agreement with
the numerical simulations corresponding to the posterior distribution. Fig. 4c highlights the
Figure 3: Calibration results for model C: stress-strain plots of the model against three sets of reference data
37

Ádám Zsarnóczay
Figure 4: Calibration results for model C continued: marginal distributions of key parameters (a); dynamic re-
sponse of the reference and calibrated model shown for the entire duration (b) and a magnified view in the neigh-
borhood of the maximum strain (c)
accuracy and the precision of the simulated response in the neighborhood of the maximum
strain during the ground motion. The simulated model can capture both the maximum and the
residual strain with sufficient accuracy. The example of model C illustrates that a simple mate-
rial model might be used to simulate complex behavior if the uncertainty due to simplification
is properly considered. The desire to reduce such uncertainty shall be the primary motivation
behind using a more advanced material model.
4 CONCLUDING REMARKS
This paper presented a brief overview of two scenarios where a Bayesian approach can pro-
vide advantages over conventional parameter calibration methods. Other benefits of using
Bayesian inference when working with numerical models (e.g. analysis of correlated parame-
ters, multi-modal parameter distributions, etc.) had to be omitted for brevity. Several frame-
works are available for Bayesian statistics that can use external FEM environments for response
evaluation. The computational efficiency and flexibility of OpenSees make it an optimal envi-
ronment for such a task. Considering the obvious advantages of uncertainty quantification and
the simplicity of its application with OpenSees, the author argues that Bayesian inference
should be used more often for numerical model calibration in earthquake engineering research.
REFERENCES
[1] T.L. Karavasilis, S. Kerawala, E. Hale, Hysteretic model for steel energy dissipation de-
vices and evaluation of a minimal-damage seismic design approach for steel buildings, J.
Constr. Steel Res. 70, 358–367, 2012
[2] A. Zona, A. Dall'Asta, Elastoplastic model for steel buckling-restrained braces, J. Constr.
Steel Res. 68, 118–125, 2012
[3] Á. Zsarnóczay, L.G. Vigh, Eurocode conforming design of BRBF – Part II: Design pro-
cedure evaluation, J. Constr. Steel Res. 135, 253-264, 2017
[4] W.R. Gilks, S. Richardson, D. Spiegelhalter, Markov Chain Monte Carlo in Practice,
Chapman and Hall/CRC, Taylor & Francis Inc., 1996
[5] J. Salvatier, T.V. Wiecki, C. Fonnesbeck, Probabilistic programming in Python using
PyMC3, PeerJ Computer Science 2, e55 https://doi.org/10.7717/peerj-cs.55, 2016
[6] Á. Zsarnóczay, Experimental and Numerical Investigation of Buckling Restrained Braced
Frames for Eurocode Conform Design Procedure Development, Ph.D. Dissertation at
Budapest University of Technology and Economics, 2013
38

OpenSees Days Europe 2017 1st European Conference on OpenSees
Porto, Portugal, 19–20 June 2017
RESIDUAL FIRE RESISTANCE OF STEEL FRAMES ASSESSED USING A MULTI-HAZARD ANALYSIS FRAMEWORK IN OPENSEES
Mian. Zhou1, Liming. Jiang2, Suwen Chen3 and Asif.Usmani2
1 Department of Mechanical, Aerospace and Civil Engineering, Brunel University, London, UK
e-mail: [email protected]
2 Department of Building Services Engineering, Hong Kong Polytechnic University, Hong Kong SAR
[email protected], [email protected],
College of Civil Engineering, Tongji University, Shanghai, China
Keywords: OpenSees, Multi-hazard, Cementitious passive fire protection, Fire resistance, steel frame structure
Abstract. Damage to cementitious coatings used for passive fire protection (PFP) may result from seismic loadings. Even moderate earthquakes may pose a major hazard to the structural integrity of a steel frame with potentially severe consequences in the event of fire. The fire may occur immediately after an earthquake or after a considerable period of time has elapsed but the damage to the PFP has remained undiscovered and unrepaired. With an added heat transfer module and thermo-mechanical analysis module, OpenSees now has the capacity to perform the structural analysis for the effects of cascading seismic and fire events in a seamless fashion. This paper presents a case study of assessing the residual fire resistance of multistory steel frames following a moderate earthquake. This work showcases Opensees’ capability for multi-ple hazard analysis, with a practical application of assessing the post-earthquake residual fire resistance of steel frames with cementitious coating as PFP.
39

Mian. Zhou, Liming. Jiang, Suwen. Chen and Asif. Usmani
1 INTRODUCTION
The paper presents a case study of residual fire resistance of multistory steel frames follow-ing moderate earthquake loading, using two equivalent seismic steel frame designs: a steel mo-ment resisting frame(SMRF); and the other steel concentrically braced frame (SCBF), based on “FEMA P-751, NEHRP Recommended Provisions: Design Examples” [1].
Cementitious fire resistant coatings are a popular PFP for steel frame buildings and are adopted for the two frames. Given these coatings are specifically designed to be lightweight and are naturally fragile, it is a reasonable concern that the fire resistance of such buildings may be compromised after a period in use, especially if this period has included one or more of moderate loading events that may locally damage or remove the coatings (such as windstorms, earthquakes). Due to its unappealing appearance, the PFP is usually covered by architectural finishes allowing little access for integrity inspection which usually is required after moderate earthquakes. Therefore desktop-based assessment using finite element tools, supported by ex-perimental data on material damage mechanism is considered the best engineering solution to evaluate the residual fire resistance of the buildings with such PFP system.
A multi-hazard analysis framework in Opensees can be utilized to fulfill this task. The loca-tion and degree of PFP damage were assessed based on the seismic analysis results using a damage index established experimentally [2,3,4]. A 2-D cross-sectional heat transfer analysis was performed to determine the temperature development over time in the fully protected and unprotected steel members subjected to Standard Fire of the duration required by local building regulations. This was followed by a thermo-mechanical analysis to evaluate the residual fire resistance capacity of the frames. All three analyses were performed sequentially using Open-Sees. The work represents a vital step towards developing an integrated simulation tool called "SiFBuilder" [5] in that it implements a multi-hazard simulation (restricted to fire following earthquakes) allowing automated multi-hazard analyses with minimal user effort and input.
2 STRUCTURAL DESCRIPTIONS & MODELLINGS
The structural models are designed for a seven-story office building in Los Angeles Califor-nia [1]. The Canoga Park record of the 1994 Northridge earthquake from OpenSees library was adopted, with a ground motion reduction factor = 0.65 applied to the 0.4g Peak Ground Accel-eration (PGA) to achieve the desired moderate earthquake level, which restricted structural be-haviour to elastic region in this case study.
3 DAMAGE TO CEMENTITIOUS PFP
The tensile strain was selected as the damage index, with an upper bound=0.198%, a lower bound=0.135%. When the tensile strain at the interface of the structure member and coating exceeds the selected level, the PFP is deemed completely failed.
4 SEISMIC ANALYSIS AND MODELLING SENSITIVITY
Time history analysis was performed. Because the PFP damage relies on the strain results at an element level, the evaluation is sensitive to structure member’s relative stiffness ratios. Sen-sitivity study was carried out on the SMRF with four different types of analytical models to investigate its impact on the damage estimation: 1) Central line to central line model; 2) Panel zone included model; 3) Panel Zone+ Reduced Beam Section; 4) Leaning columns.
The sensitivity study results suggested Model 1 was conservative for its underestimation of connection stiffness. The inclusion of the p-delta effect generated by the inner gravity columns using Leaning Columns showed little impact because structure essentially behaved within the
40

Mian. Zhou, Liming. Jiang, Suwen. Chen and Asif. Usmani
elastic range in this case. All models suggested PFP damage appear around the beam-column connections at the floors of high inner-story drift ratios, and at columns bases. The model 3 results were adopted for damage evaluation.
For SCBF, high strains were observed in braces however they do not have any bearings on the fire resistance of braced frame, hence SCBF was not included in the following analysis.
5 DAMAGE MAP & SELECT FIRE SCENARIO
A damage map of the cementitious PFP in the SMRF was therefore established. Guided by the map, the ground compartment framed by Pier 2 & 3 was selected as the fire location because bottom column failure would be the most perilous. A two hours fire defined by the Standard fire curve was selected as the fire load because a 2h fire resistance is required for structural elements of office buildings over 30m tall by BS9999:2008, Table 25[6].
Figure 1: Damage Map Figure 2: Heat Transfer & Thermal Loading Application
6 HEAT TRANSFER ANALYSIS
Because compartment fire assumes uniform gas temperature, a two dimensional cross sec-tion heat transfer analysis for a protected and a fire exposed cross section is sufficient to provide the temperature–time development in the members. The heat transfer analysis was performed using OpenSees heat transfer module, which provides the temperature history of the beams, recorded at each fiber throughout the cross section depth, shown in Figure.2. The thermal prop-erties used for the Cementitious PFP are: λ=0.05W/m/K, ρ=350kg/m3, cp=1100J/k/kg.
7 THERMO-MECHANICAL ANALYSIS
7.1 Thermal analysis modelling
The same structural model as developed for seismic analysis was used, with necessary mod-ifications made to facilitate thermo-mechanical analysis. Temperature-dependent steel material SteelECThermal was used which is developed based on the stress-strain curve for steel at ele-vated temperatures provided in Eurocode 3 [7]. Displacement based element – dispBeamCol-umn2dThermal was used for all structural members.
No re-segmentation is required for thermal loading application because OpenSees thermal modules offers the Thermal Action Wrapper function. As shown in Figure 2: four nodal thermal loads are applied to the column by defining the application point’s position using length ratios. A mixed order interpretation will be applied automatically for the transition area.
41

Mian. Zhou, Liming. Jiang, Suwen. Chen and Asif. Usmani
7.2 Results
The deformed shapes of the SMRF at 4 different time points are presented in Figure 3. The evolutions of vertical reactions at column bases are plotted in Figure 4. At T=0s, the defor-mation is due to dead and live load. As heated up to T=1200s, Pier 3 shows clear upward ex-pansion, dragging its connected floor beams with it, which induces uplift tension into the adjacent Piers 2&4. This phenomenon is reflected in the base reactions, where axial loads de-crease in Pier 2&4 but increase in Pier 3. The Pier 3’s overall stiffness still retains at this stage. At about T=1545s, substantial deformation and curvature are observed in Pier 3.This progres-sion manifests in the base reactions as axial loads starts rising in Pier 2&4 while dropping dra-matically in Pier 3. The analysis terminated at T=2300s due to large deformation in Pier 3.
Figure 3: Deformed Shape Figure 4: Vertical Base Reaction Development
8 CONCLUSIONS
The analysis results of the selected fire scenario demonstrated the post-earthquake PFP dam-age can cause significant structural damage in a subsequent fire, which in the worst case may lead to structural collapse due to column failure. Using its native and developed modules, Open-Sees capability for simulating structural response under multi-hazards has been demonstrated.
REFERENCES
[1] National Institute of Building Sciences Council and Building Seismic Safety Council, “FEMA P-751: 2009 NEHRP Recommended Seismic Provisions: Design Examples,” no. September, p. 916, 2012.
[2] S. Chen, L. Jiang, A. Usmani, G.-Q. Li, and C. Jin, “Damage mechanisms in cementitious coatings on steel members under axial loading,” Constr. Build. Mater., vol. 90, pp. 18–35, 2015.
[3] S. Chen, L. Jiang, and A. Usmani, G.-Q. Li ,“Damage mechanisms in cementitious coatings on steel members in bending,” Proc. ICE - Struct. Build., vol. 168, no. Volume 168, Issue 5, pp. 351–369(18), 2015.
[4] Y.Wang, Experimental studies on damage mechanisms in cementitious coatings on structural members under complex loadings (MSC thesis). College of Civil Engineering, Tongji University (in chinese); 2016
[5] L. Jiang, X. Dai, A. Usmani and P. Kamath, OpenSees based integrated tool for modelling structures in fire, Proc. of the 1st International Conference on Structural Safety under Fire and Blast, Glasgow, 2-4 Sept. 2015.
[6] Code of Practice for Fire Safety in the Design, Management and use of Buildings. BSI Standards BS9999:2008
[7] Eurocode 3: Design of Steel Structures. General Rules-Structural Fire Design. BSI Standards, BS EN 1993-1-2:2005, (2002)
T=0s, Scale =250 T=1200s, Scale =250
T=1545s, Scale =250 T=2300s, Scale =30
42

OpenSees Days Europe 2017 1st European Conference on OpenSees
Porto, Portugal, 19–20 June 2017
MODELLING STRUCTUES IN FIRE USING OPENSEES - AN INTEGRATED APPROACH
Liming Jiang and Asif Usmani
Department of Building Services Engineering, The Hong Kong Polytechnic University Hung Hom, Kowloon, Hong Kong
e-mail: [email protected], [email protected]
Keywords: Structure in fire, OpenSees, computational modelling, heat transfer, integrated analysis.
Abstract. Recent developments in modelling structural response to fires is presented, which includes our ongoing work on thermo-mechanical analysis of frames using beam-column and shell elements, a heat transfer module built in OpenSees, and the ‘SIFBuilder’ project providing an integrated solution to ‘structures in fire’ modelling. The class hierarchy has been discussed regarding the thermal action for structural members and the beam-column and shell elements, which is followed by a few ex-amples in order to demonstrate the capabilities added. The heat transfer module is explained in detail with its class structure and the available Tcl commands, which now enable heat transfer analysis for complex fire scenarios. The ‘SIFBuilder’ project aiming to set up an integrated computational environment for modelling structural re-sponse to fire is discussed and demonstrated. An overview is provided of the solution strategy from fire modelling to structural response in an integrated manner and dis-plays the great potential of OpenSees as a research tool and eventually a design tool in the field of fire safety engineering.
43

L. Jiang and A. Usmani
1 INTRODUCTION
In a prescriptive design approach regime, the global behaviour of structures is largely ig-nored, since the traditional design strategy for structural fire safety was based on Standard Fire tests with respect to the performance of isolated members. Meanwhile, fire models for the design practice in compartmented buildings have been evolving from uniform fire models to non-uniform models as the use of large open-plan compartments becomes common. More-over, new structural materials and structural sections are gradually implemented in the built environment, which improve the structural performance but also challenge existing design tools. In this context, the need has been identified for a comprehensive simulation tool, which should be able to deal with complex fire scenarios and enable researchers to undertake a range of simulations with the minimum of effort to construct their numerical models. We have cho-sen OpenSees as a suitable platform to provide the aforementioned capability.
The work was initiated in 2009 at Edinburgh University [1], aiming to enable the whole ‘structures in fire’ analysis within the “SiFBuilder” framework. As shown in Figure 1, the de-veloped modules include a collection of fire models, a heat transfer module, thermo-mechanical codes distributed into original projects, and the SIFBuilder project to integrate the modules. Further details of the development are provided in the following section and also available on http://openseesforfire.github.io.
Figue 1. OpenSees development for modelling structure in fire
2 DEVELOPMENTS UNDERTAKEN FOR THERMO-MECHANICAL ANALYSIS
The capability of performing thermo-mechanical analysis within OpenSees is achieved with thermo-mechanical beam-column elements and shell elements, which receive tempera-ture data from the corresponding type of thermal action.
Figure 2. Classes developed for thermo-mechanical analysis using shell elements
44

L. Jiang and A. Usmani
Beam-column elements, widely used in modelling steel frames have been extended to ac-count for the thermal loading, which requires modification to the state determination process and the ability to receive temperature data. The development of uniaxial materials and fibre based sections for thermo-mechanical analysis of frames have simultaneously been undertak-en. To model reinforced concrete slabs as a part of a composite floor system in fire, thermo-mechanical shell elements can be used, which possesses a class hierarchy as shown in Figure 2. The layered solution is adapted from the code developed by Lu et al. [4] and has been en-hanced to include temperature dependent effects. All the thermal action classes have been en-hanced by PathTimeSeriesThermal to accept time-dependent temperature variation, and the non-uniform thermal action can be applied to both frame and shell elements.
3 DEVELOPMENTS UNDERTAKEN FOR HEAT TRANSFER ANALYSIS
A variety of well-established fire models are integrated into OpenSees, to provide its users the freedom of using different types of idealised fire scenarios, which include uniform fires in terms of gas temperature distribution such as standard fire (ISO-834), hydro-carbon fire and parametric fire. Compared to uniform fire models, more advanced non-uniform fire models are also included which address the spatial non-uniformity caused by the localised fire [2] or travelling fire [3]. The major part of the C++ code for heat transfer analysis was written by Y.Q. Jiang during his PhD study in Edinburgh University. Further developments were then carried out by the author to implement non-uniform fire models and SIFBuilder tool and providing Tcl commands for users which is facilitated by a mesh package.
The heat transfer classes were written following the basic OpenSees architecture, which uses a HeatTransferDomain to store all the HeatTransferNodes and HeatTransferElements, as well as the HeatFluxBCs to define the heat loss of a structural member to the ambient envi-ronment and the heat input resulting from the fire exposure. When defining a heat transfer analysis explicitly with Tcl commands, a meshing tool is employed to define heat transfer en-tities, fire models, and all the operations upon it. The heat transfer codes can also be implicitly called by the SIFBuilder tool to provide thermal action definition for structural analysis.
Figure 3. Development for heat transfer analysis in OpenSees
4 DEVELOPMENTS UNDERTAKEN FOR INTEGRATED MODELLING
SIFBuilder can enable analysts to obtain the structural response automatically with the ap-plication of the fire load on the structure in the same manner as any other form of load and so provide a performance- based structural fire engineering tool. A script based user input capa-bility based on Tcl provides considerable flexibility and scope due to its programmable nature. Procedural scripts are written to specify geometry, materials, loads, heat transfer parameters, fire type, analysis procedures, solution algorithm and output requirements using Tcl com-mands. A SIFModel is first created to store the building information, for which the typical
45

L. Jiang and A. Usmani
user input script includes: (1) model type definition (2D or 3D); (2) geometry of the structure; (3) cross section and its embedded materials; (4) boundary conditions; (5) structural and fire loadings; (6) mesh control parameters; and (7) output request supported by SIFRecorders. A typical input may be defined as shown in Figure 4. The SIFBuilder tool relies on SIFModel to hold building information in order to sequentially perform analyses for mechanical loads and fire load, which call the heat transfer module to estimate the temperature profile at each step, and automatically define thermal action for the structural finite elements. An example show-ing a 222 frame (as plotted in Figure 1) subjected to uniform and non-uniform fires is pre-sented to demonstrate the capability of SIFBuilder.
Figure 4. Input sequence for SiFModel
5 CONTINUING WORK
The refinement of SIFBuilder and the addition of new features to it are still ongoing. Hy-brid simulation techniques are also being explored with OpenSees and OpenFresco to enable more in-depth simulations of structural response to fires.
6 CONCLUSIONS
Developments of modelling ‘structure in fire’ are presented, which include the thermo-mechanical components, the heat transfer module and the integrated tool SIFBuilder .
Heat transfer analysis can now be performed in OpenSees for various uniform and non-uniform design fire scenarios. Beam-column and shell elements are now available for modelling composite structures in fire. SIFBuilder as an integrated tool facilitates users to model structures in fire with minimal input and enables flexible extension for re-searchers.
REFERENCES
[1] A. Usmani, J. Zhang, J. Jiang, Y. Jiang, and I. May, Using Opensees for Structures in Fire, Journal of Structural Fire Engineering., 3(1), 57–70, 2012.
[2] CEN, EN 1991-1-2:2002: Eurocode1: Actions on Structures. General actions-actions on structures exposed to fire, London, UK.
[3] J. Stern-Gottfried and G. Rein, Travelling fires for structural design-Part II: Design methodology, Fire Safety Journal, 54, 96–112, 2012.
[4] X. Lu, L. Xie, H. Guan, Y. Huang, and X. Lu, A shear wall element for nonlinear seis-mic analysis of super-tall buildings using OpenSees, Finite Elements in Analysis and Design, 98, 14–25, 2015.
46

OpenSees Days Europe 2017
1st European Conference on OpenSees
Porto, Portugal, 19–20 June 2017
IMPLEMENTATION OF FIRE MODELS IN OPENSEES
Xu Dai1, Yaqiang Jiang2, Liming Jiang3, Stephen Welch1, and Asif S. Usmani3
1 BRE Centre for Fire Safety Engineering, the University of Edinburgh, UK
emails: [email protected], [email protected]
2 Sichuan Fire Research Institute, Ministry of Public Security, Chengdu, P. R. China
email: [email protected]
2 Department of Building Services Engineering, Hong Kong Polytechnic University, Hong Kong
emails: [email protected], [email protected]
Keywords: Structures in Fire, Compartment fires, Realistic Fire Loading, Performance-based
Design, OpenSees, Software Architecture.
Abstract. In the modern routine design of structures, computational modelling of the structural
behaviour under natural and man-made hazards has become more and more important. The
capabilities of analysing the structural performance under such hazards (e.g. snow, wind,
earthquake, impact) have been widely utilized into the mainstream of nonlinear finite element
method (NFEM) based software, such as SAP, ANSYS, ABAQUS etc. However, there are very
limited software options to characterize fire impact on structures. In general, there are two
types of computer programs for simulating structural behaviours in fire: research-oriented and
business-oriented. The former such as SAFIR, VULCAN, and ADAPTIC address specific mod-
elling problems, because of a limited number of users and a small team of developers. The latter
such as ABAQUS, ANSYS and LS-DYNA are used commercially by researchers and industry
across the world. Nevertheless, limited access to source codes, lack of transparency of the com-
putational framework, high cost of purchase and maintenance are major limitations.
In 2009, OpenSees was adopted at the University of Edinburgh for further development to en-
able it to perform structural fire analysis. Facilitated by its open-source nature, a large number
of thermal capabilities have been added to the framework by Usmani et al. [1]. Significant
contributions in terms of heat transfer and fire modules have been made to the framework in
developing the ‘Thermal’ version of OpenSees [2]. After verifying and validating the thermo-
mechanical analysis of OpenSees [3], [4], users are able to model structures under extreme
thermal actions (such as those resulting from fire conditions) through defining arbitrary non-
uniform temperature distributions across and along an element. This paper reviews the existing
fire modules in OpenSees, including uniform compartment fire models and localised fire models.
The latest development of advanced fire modules, i.e. smoke zone models and travelling fire
models are introduced. Finally, a case study using the FIRM zone model in OpenSees is inves-
tigated, for validating its results against the original FIRM-QB software package [5], and fur-
ther exploring the thermal impact from different fire scenarios using OpenSees.
47

Xu Dai, Yaqiang Jiang, Liming Jiang, Stephen Welch, and Asif S. Usmani
1 A REVIEW OF EXISTING FIRE MODELS IN OPENSEES
Conventional structural fire design codes are based on isolated single structural members
with simply-supported boundary conditions under standard fire test exposures, which refers to
a heating curve such as ISO-834 standard fire, or ASTM-E119 fire. The standard fire curve
along with external fire curve, and hydrocarbon fire curve are categorized as nominal fire curves
in Eurocode [6]. This type of fire curve is basically a time-temperature relationship, which
stands for the case of a fully developed fire in a compartment (see Fig. 1(a)). All the above-
mentioned fire curves are added in the OpenSees fire module as NominalFireEC1 class [2].
Different from the nominal fire curves, the parametric fire curves [6] which consider fire growth
rate, fire load density, and characteristics of the compartment (e.g. thermal boundaries, open-
ings, geometric quantities, etc.) are also added in OpenSees as ParametricFireEC1 class [2].
Figure 1(a): Three different nominal fire curves in Eurocode; Figure 1(b): Localised fire model in Eurocode. [7]
Although these fire models are relatively simple, they are still widely used for both research
and design purposes in fire safety engineering. A user defined fire curve (UserDefinedFire class)
[2] is also included in the OpenSees fire module for providing more flexibility. These idealised
uniform fire models are all assumed to have the same temperature distribution in the entire
compartment at a specific time.
Further, in the case of isolated fuels burning in a large space (e.g. vehicles burning in a car
park), localised fire models are regarded to be appropriate for simulating such burning scenarios.
The Hasemi localised fire model (adopted in the Eurocode [6], see Fig. 1(b)), Alpert ceiling jet
model [8], SFPE handbook-based localised fire model [9], and a user defined idealised local
fire model, are added in OpenSees fire module as LocalizedFireEC1 class, AlpertCeilingJet-
Model class, LocalizedFireSFPE class, Idealised_Local_Fire class respectively [2], [10]. These
localised fire models, in their mathematical nature, are all correlational equations between in-
cidental heat fluxes on the structural surfaces and radial distance from the fire source.
2 ZONE MODELS AND TRAVELLING FIRE MODELS IN OPENSEES
In a prescriptive structural fire design code, the fire exposure is usually constrained by the
code with limited room for discussion (e.g. nominal fire curves in Eurocode). In a performance-
based structural fire design code, the practitioners have greater flexibility and the fire is usually
related to realistic fire loadings (e.g. localised fire models, zone models, and travelling fire
models, etc.). The newly added two zone model classes, ZoneModel_ASET, ZoneModel_FIRM,
enable the fire module in OpenSees to simulate the transient generation of a hot smoke layer
upon the compartment ceiling. The transient height and temperature of the smoke layer are
calculated according to a set of ordinary differential equations (ODEs) based on the mass and
energy conservations (see Fig. 2(a)) [5].
48

Xu Dai, Yaqiang Jiang, Liming Jiang, Stephen Welch, and Asif S. Usmani
Figure 2(a): Fire problem modelled using FIRM zone model [5]; Figure 2(b): Plan view – extended travelling
fire method framework.
The difference between ZoneModel_ASET and ZoneModel_FIRM is that, ZoneModel_FIRM
can handle the compartment with vertical natural ventilations, however ZoneModel_ASET is
basically filling the smoke in a ‘box’ without considering any significant openings.
More recently, a very active research frontier on performance-based structural fire design
named ‘travelling fires’, is evolving [11]. This type of fire scenario is developed for character-
ising large compartment fires, which may burn locally and tend to move across entire floor
plates over a period of time. An extended travelling fire method (ETFM) framework was de-
veloped by Dai et al. [12], and further implemented into OpenSees fire module [13]. This ETFM
framework is based on a mobile version of Hasemi’s localized fire model combined with a
simple smoke layer calculation – the FIRM zone model. The ETFM_TravellingFire class is
added to the OpenSees fire module to calculate the spatially and temporally non-uniform heat
fluxes for different structural elements, produced from the ‘summation’ of the heat fluxes from
the FIRM zone model and Hasemi localised fire model. TravellingFireFuel class is included to
account for the uniformly distributed meshed fuel cells, and TravellingFireFuel_Iter class is
introduced for looping over all the meshed fuel cells (i.e. TravellingFireFuel) to check if the
fuel is currently on fire, or not, at each time step, then aggregating them as the entire burning
fuel area.
Core
Origin
of
fireTravelling fire trajectory
Open plan office floorplate
No fire ingress – fire resistant
island with partitions
20
120
220
320
420
520
620
720
0 300 600 900 1200 1500 1800 2100 2400
Sm
oke
tem
per
ature
( C
)
Time (seconds)
100 MJ/m^2, Transport 230 MJ/m^2, Hospital
300 MJ/m^2, Theatre 420 MJ/m^2, Office
600 MJ/m^2, Shopping centre 780 MJ/m^2, Dwelling
780 MJ/m^2, Dwelling - FIRM-QB software
Figure 3: Smoke temperature evolution with various fuel load densities
49

Xu Dai, Yaqiang Jiang, Liming Jiang, Stephen Welch, and Asif S. Usmani
3 A CASE STUDY USING FIRM ZONE MODEL IN OPENSEES
To validate the results produced from the OpenSees FIRM zone model against the original
FIRM-QB software package due to Janssens [5], and to further explore the thermal impact from
different fire scenarios, a case study is performed. The investigated compartment floor area is
468m2, with the clear floor height 3.85m. The total vent widths of this large compartment are
28m. The soffit height and sill height are 3m and 1m respectively. A ‘base line scenario’ of the
fires is assumed with fuel load density ( 𝑞𝑓,𝑘 ) 570 MJ/m2, heat release rate per unit area (𝑅𝐻𝑅𝑓)
500 KW/m2, and fire spread rate (𝑣) 10 mm/s. Different fire scenarios are generated with chang-
ing 𝑞𝑓,𝑘 , (100-780MJ/m2) but keeping the other two values as constants. Figure 3 shows that
the results generated from OpenSees agree well with FIRM-QB software, and illustrates the
smoke temperature evolution with various fuel load densities according to Eurocode 1 [6].
4 REFERENCES
[1] A. Usmani, J. Zhang, J. Jiang, Y. Jiang, and I. May, Using OpenSees for structures in
fire, J. Struct. Fire Eng., vol. 3, no. 1, pp. 55–70, 2012.
[2] Y. Jiang, Development and application of a thermal analysis framework in OpenSees
for structures in fire, PhD Thesis, The University of Edinburgh, 2012.
[3] J. Jiang and A. Usmani, Modeling of steel frame structures in fire using OpenSees,
Comput. Struct., vol. 118, pp. 90–99, 2013.
[4] J. Jiang et al., OpenSees software architecture for the analysis of structures in fire, J.
Comput. Civ. Eng., vol. 29, no. 1, 2015.
[5] M. L. Janssens, An Introduction to Mathematical Fire Modeling, CRC Press, 2000.
[6] Eurocode1: Actions on Structures - Part 1-2: General Actions - Actions on Structures
Exposed to Fire. European Standard EN 1991-1-2, CEN, Brussels, 2002.
[7] J. Franssen, V. Kodur, and R. Zaharia, Designing Steel Structures for Fire Safety. CRC
Press, 2009.
[8] R. L. Alpert, Calculation of response time of ceiling-mounted fire detectors, Fire
Technol., vol. 8, no. 3, pp. 181–195, 1972.
[9] B. Y. Lattimer, Heat fluxes from fires to surfaces, in SFPE Handbook of Fire
Protection Engineering, Third Edit., National Fire Protection Association, 2002.
[10] L. Jiang, Development of an integrated computational tool for modelling structural
frames in fire considering local effects, PhD ThesisThe University of Edinburgh, 2016.
[11] X. Dai, S. Welch, and A. Usmani, A critical review of ‘travelling fire’ scenarios for
performance-based structural engineering, Fire Saf. J., no. SI:IAFSS 12th Symposium,
2017.
[12] X. Dai, L. Jiang, J. Maclean, S. Welch, and A. Usmani, A conceptual framework for a
design travelling fire for large compartments with fire resistant islands, in Proceedings
of the 14th International Interflam Conference, 2016, pp. 1039–1050.
[13] X. Dai, L. Jiang, J. Maclean, S. Welch, and A. Usmani, Implementation of a new
design travelling fire model for global structural analysis, in the 9th International
Conference on Structures in Fire, 2016, pp. 959–966.
50

G. Di Gangi, C. Demartino, G. Monti
OpenSees Days Europe 2017 1st European Conference on OpenSees
Porto, Portugal, 19–20 June 2017
TIMBER SHEAR WALLS: NUMERICAL ASSESSMENT OF DAMPING
OF SHEATHING-TO-FRAMING CONNECTIONS
G. Di Gangi 1, C. Demartino 3, G. Monti 2,3
1 Department of Structural and Geotechnical Engineering, Sapienza University of Rome, Via Antonio Gramsci, 53, Italy
e-mail: [email protected]
2 Department of Structural and Geotechnical Engineering, Sapienza University of Rome, Via Antonio Gramsci, 53, Italy
e-mail: [email protected]
3 College of Civil Engineering, Nanjing Tech University, Nanjing 211816, PR China
e-mail: [email protected]
Keywords: timber shear walls; sheathing-to-framing connections; plastic behavior of connections; energy dissipation of connections; axial contribution of hold-down devices.
Abstract
The performances related to connections used in timber shear walls are investigated in this paper. Analytical and numerical models developed in the literature have shown that the cru-cial aspects affecting the overall behavior of shear walls are the connections between timber frame (studs and horizontal joists) and sheathing panel, as well as the base connections. Non-linear static analysis and cyclic analysis on a parametric numerical model are performed, particularly assessing the energy dissipation ensured by the sheathing-to-framing connections.
1 INTRODUCTION
Timber light-framed constructions are mostly used in North America, New Zealand and Europe. Especially in North America, most housing and commercial structures used wood as main structural material till the 20th century. Historically, for buildings, two types of light-frame have been used: (i) balloon and (ii) platform framing [1].
In this work, the second type is deeply investigated. Platform framing buildings have dis-continuous vertical framing members (studs) connected using plates that support floor joists for each storey, with a shear wall underneath. The dimensions of the frame, usually, are based on the size of the sheathing panel, which is made by different materials like OSB (Oriented Strand Board), plywood, gypsum, GLG (Glued Laminated Guadua) bamboo [2], fiber board and so on. The experimental tests demonstrated that the structural behavior of the shear wall
51

is mainly influenced by the connections, such as sheathing-to-framing, base and stud-joist joints. Metal fasteners (e.g., nails, screws or staples) are used to connect the timber frame with the sheathing panel, subjected to in-plane shear force. The uplift of the shear wall, due to its rigid rotation, is controlled by hold-downs, while its rigid translation by angle-brackets [3][4].
2 STATE OF ART AND CODE FRAMEWORK The racking capacity of a shear wall is evaluated when it is subjected to a horizontal force
applied at the top. An extensive overview of past research is provided by van De Lindt [5] and Kirkham et al. [6]. An elastic model of a fully anchored shear wall unit was proposed by Källsner and Girhammar [7] to describe its behavior under racking loads (Figure 1, a). More-over, they proposed also a generalized and extended method for determining the upper and lower bounds of the plastic load-carrying capacity of shear wall [8], providing a simple graph-ical method to determine the center of rotations of all fasteners belonging to the different edg-es of the wall (Figure 1, b).
Figure 1 Distribution of the force on the sheet according to: (a) the linear elastic model proposed by Källsner
and Girhammar (2009); (b) the plastic upper bound method used in Källsner and Girhammar (2009).
A similar approach, based on the static theorem, is used in the European Standard EN 1995
(Eurocode 5 [9], § 9.2.4.2), where the design load-carrying capacity ,v RdF that represents the design racking resistance, under a horizontal force ,v EdF acting at the top of the cantilevered panel, is determined following a simplified method. The sum of the design racking load-carrying capacity of the different wall panels that make up the wall is considered, assuming a distribution of pure shear flow along the perimeter of the frame and the sheathing panel.
Casagrande et al. (2016) developed a simplified numerical model, called UNITN, to pro-vide a simplified tool to evaluate the elastic response of light timber frame and cross laminat-ed timber shear walls [4]. Starting from the analytical developments of Källsner et al. (2009), they defined the horizontal displacement of a light timber frame wall subjected to a horizontal force as a sum of different contributions and sources, as follows:
sh h a pD = D +D +D +D (1)
where shD is the contribution given by sheathing-to-framing connections, hD is due to the rigid-body rotation of the shear wall, aD is due to the rigid-body translation and pD is due to the shear deformation of the sheathing-panel. In Gattesco et al. (2016), experimental tests of different configurations of shear walls were performed, to validate their proposed numerical model [10]. The specimen, identified as PLS8, was used as reference to implement the model in OpenSees, taking into account the experimental results of the nailed connections.
52

G. Di Gangi, C. Demartino, G. Monti
3 MODELING OF TIMBER SHEAR WALL A parametric numerical model, to assess the energy dissipation of sheathing-to-framing
connections, was implemented in OpenSees. Thanks to this model, a comparison among the results obtained by different experimental tests already performed in literature, was possible.
3.1 Mechanical model In the numerical model, the input parameters are length and height of the wall and number
of nails (or their spacing), as well as the number of vertical studs. Once these parameters are assigned, the number of elements (beam, shell, zero-length)
used to define the shear wall are automatically updated, allowing a quick assessment of the wall response under the applied horizontal force. In this numerical simulation, the frame ele-ments were modelled using elasticBeamColumn elements. The input data of experimental set up in Gattesco et al. (2016), for the specimen called PLS8, were used. The sheathing panel is represented by stiff plane stress elements (shell), with mesh size varying with the number of nails. The perimeter nodes of the shell are connected by zero-length elements to the nodes of the frame. The bottom nodes at the corners have two different boundary conditions: (i) con-strained at the base, simulating a rigid connection with the foundation; (ii) connected with nodes at ground by zero-length elements, to simulate the presence of hold-downs. The tag of nodes starts with a number that identifies the layer they belong to. Layer number 2 includes the fictitious nodes used to insert internal releases between the end of vertical studs and the horizontal joists elements. This is in agreement with the model proposed by Källsner and Gir-hammar [7]. Layer number 4 includes the perimeter nodes belonging to the frame, while layer 6 includes nodes belonging to the shell and tag of shell elements. Finally, layer 8 includes the nodes linked to the zero-length elements that represent the hold-downs devices (Figure 2).
Figure 2 A scheme of the numerical model implemented in OpenSees. On the left, the model without
hold-downs; on the right, the model with hold-downs. In this example, L is 1900 mm and H is 2600 mm.
53
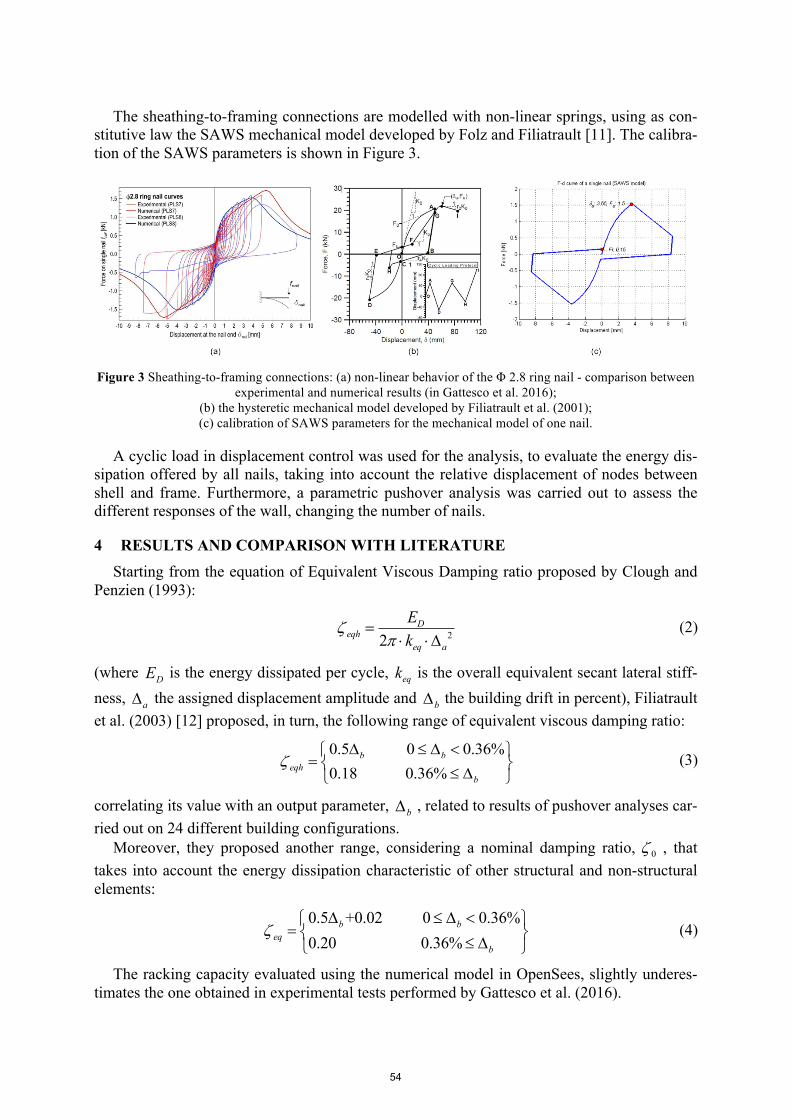
The sheathing-to-framing connections are modelled with non-linear springs, using as con-stitutive law the SAWS mechanical model developed by Folz and Filiatrault [11]. The calibra-tion of the SAWS parameters is shown in Figure 3.
Figure 3 Sheathing-to-framing connections: (a) non-linear behavior of the Φ 2.8 ring nail - comparison between
experimental and numerical results (in Gattesco et al. 2016); (b) the hysteretic mechanical model developed by Filiatrault et al. (2001); (c) calibration of SAWS parameters for the mechanical model of one nail.
A cyclic load in displacement control was used for the analysis, to evaluate the energy dis-sipation offered by all nails, taking into account the relative displacement of nodes between shell and frame. Furthermore, a parametric pushover analysis was carried out to assess the different responses of the wall, changing the number of nails.
4 RESULTS AND COMPARISON WITH LITERATURE Starting from the equation of Equivalent Viscous Damping ratio proposed by Clough and
Penzien (1993):
22D
eqheq a
Ek
zp
=× ×D
(2)
(where DE is the energy dissipated per cycle, eqk is the overall equivalent secant lateral stiff-ness, aD the assigned displacement amplitude and bD the building drift in percent), Filiatrault et al. (2003) [12] proposed, in turn, the following range of equivalent viscous damping ratio:
0.5 0 0.36%0.18 0.36%
b beqh
b
zD £ D <ì ü
= í ý£ Dî þ (3)
correlating its value with an output parameter, bD , related to results of pushover analyses car-ried out on 24 different building configurations.
Moreover, they proposed another range, considering a nominal damping ratio, 0z , that takes into account the energy dissipation characteristic of other structural and non-structural elements:
0.5 +0.02 0 0.36%0.20 0.36%
b beq
b
zD £ D <ì ü
= í ý£ Dî þ (4)
The racking capacity evaluated using the numerical model in OpenSees, slightly underes-timates the one obtained in experimental tests performed by Gattesco et al. (2016).
54

G. Di Gangi, C. Demartino, G. Monti
Figure 4 A comparison of the Force-Displacement curves, related to the overall behavior of the timber shear
wall: (a) without internal releases; (b) with internal releases; (1,3) without hold-downs; (2,4) with hold-downs.
The value of Equivalent Viscous Damping ratio, considering the absence of hold-downs, is in line with ranges proposed by Filiatrault et al. (2003), but it is worth noting that the overall behavior of the timber shear wall is substantially influenced by the presence of internal re-leases between the ends of the studs and the horizontal joists, as shown in Figure 4.
Moreover, also the configuration assumed by the loading path of the nails is different (Figure 5), and in correspondence of the most stressed fasteners, placed at the corners, the value of the force is around 2 kN.
Figure 5 The configuration of the loading path of the nails: (a) considering the model without internal releases;
(b) considering the presence of internal releases.
Considering the presence of the hold-downs, the loading path has, in both cases, the same configuration but the value of the force on the fasteners placed at corners is around 1 kN.
5 CONCLUSIONS AND FUTURE DEVELOPMENT Starting from the assessment of the behavior of the sheathing-to-framing connections, us-
ing the parametric numerical model implemented in OpenSees, it was highlighted that the presence of internal releases between the framing elements sensibly affects the overall re-
55

sponse of the wall in terms of racking capacity and stiffness. The presence of hold-downs at bottom corners also makes the system more flexible, allowing reaching higher values of dis-placement of the wall, under the applied horizontal force.
The main goal of this work is to correlate the value of the Equivalent Viscous Damping ra-tio with the input parameters related to the shear wall, using the capacity-design strategy: to avoid failure of sheathing-to-framing connections, which are difficult to replace after an earthquake, by concentrating the energy dissipation on the hold-downs devices.
Moreover, different models considering either the presence of openings, or more than one shear wall per one storey, or more than one storey, will be developed. In this way, a q-factor will be defined for this type of structures, thus obtaining the related design response spectrum.
REFERENCES [1] J. Wacker, Use of wood in buildings and bridges, in Wood Handbook – Wood as an
Engineering Material, chapt. 17. Forest Products Laboratory – United States Depart-ment of Agriculture Forest Service – Madison, Wisconsin, 2010.
[2] S. Varela, J. Correal, L. Yamin, F. Ramirez, Cyclic Performance of Glued Laminated Guadua Bamboo-Sheated Shear Walls, Journal of Structural Engineering, Vol. 139, No. 11, 2028-2037, November 1, 2013.
[3] T. Sartori, R. Tomasi, Experimental investigation on Sheathing-to-framing connections in wood shear walls, Engineering Structures 56, 2197-2205, 2013.
[4] D. Casagrande, S. Rossi, T. Sartori, R. Tomasi, Proposal of an analytical procedure and a simplified numerical model for elastic response of single-storey timber shear-walls, Construction and Building Materials 102, 1101-1112, 2016.
[5] J. W., van de Lindt, Evolution of Wood Shear Wall Testing, Modeling, and Reliability Analysis: Bibliography, in Practice Periodical on Structural Design and Construction, 9, 44-53, 2004.
[6] W. J. Kirkham, R. Gupta, T. H. Miller, State of the Art: Seismic Behavior of Wood-Frame Residential Structures, in Journal of Structural Engineering, 2013.
[7] B. Källsner, U. A. Girhammar, Analysis of fully anchored light-frame timber shear walls-elastic model, in Materials and Structures 42, 301-320, 2009.
[8] B. Källsner, U. A. Girhammar, Plastic models for analysis of fully anchored light frame timber shear walls, in Engineering Structures 31, 2171-2181, 2009.
[9] EN1995-1-1:2004. Design of timber structures Part 1-1: General-common rules and rules for building, Brussels, Belgium: CEN, European Committee for Standardization, 2004.
[10] N. Gattesco, I. Boem, Stress distribution among sheathing-to-frame nails of timber shear walls related to different base connections: Experimental tests and numerical modelling, in Construction and Building Materials 122, 149-162, 2016.
[11] B. Folz, A. Filiatrault, Cyclic Analysis of Wood Shear Walls, in Journal of Structural Engineering 127, 433-441, 2001.
[12] A. Filiatrailt, H. Isoda, B. Folz, Hysteretic damping of wood framed buildings, in Engi-neering Structures 25, 461-471, 2003.
56

OpenSees Days Europe 2017
1st European Conference on OpenSees
Porto, Portugal, 19–20 June 2017
STUDY OF THE DYNAMIC SOIL-ABUTMENT-SUPERSTRUCTURE
INTERACTION FOR A BRIDGE ABUTMENT
Davide Noè Gorini1 and Luigi Callisto2
1 Sapienza University of Rome
Via Eudossiana 18
2 Sapienza University of Rome
Via Eudossiana 18
Keywords: Dynamic Soil-Structure Interaction, OpenSees numerical modelling, parallel
computing.
Abstract. The abutment is the part of a bridge that has a more significant dynamic interac-
tion with the soil; the behaviour of the abutment is also influenced by the interaction with the
superstructure, producing a reciprocal time-dependent exchange of inertial forces between
them. This note illustrates a finite element description of the coupled dynamic interaction of
an abutment with the bridge structure and with the soil, occurring in the occasion of a severe
seismic event. The computation procedure was entirely implemented in OpenSees with the
aim to investigate the dynamic response of the specific abutment of the Pantano viaduct,
which would be used as an accessing facility to the still unbuilt Messina Strait suspension
bridge, in Italy. The potentiality and versatility of OpenSees were used to reach an accurate
numerical modelling of both the soil and the structure. The mechanical behaviour of the soil
was reproduced through the Manzari and Dafalias hardening plasticity constitutive model,
that was calibrated in order to reproduce the experimental laboratory data. The abutment
was regarded as an elastic structure, while the dynamic interaction of the abutment with the
superstructure was studied by means of two approaches of increasing complexity and accura-
cy. Parallel computing, obtained with the OpenSeesSP interpreter, was needed to optimize the
computation time for the non-linear time domain analyses. The strategy solution presented
herein is useful in that it enhances the current capability to evaluate the dynamic behavior of
bridge structures, implementing a coupled soil-structure interaction analysis that considers
explicitly the propagation of seismic waves in the foundation soils ant their interaction with
the structure.
57

Davide Noè Gorini and Luigi Callisto
1 INTRODUCTION
The Pantano viaduct was designed as the approaching structure to the Messina Strait sus-
pension bridge (Italy) on the Sicilian side of the bridge. As shown in Figure 1, the Pantano
viaduct starts at the terminal structure of the suspension bridge and ends on a massive abut-
ment situated on the Messina side. The subsoil is constituted by a thick deposit of Messina
gravels, down to a depth of 245 m from the abutment foundation, followed by Continental
Deposits extending down to the bedrock, located at a depth of 445 m. The site of the bridge is
characterized by a high seismicity due to the presence of several segmentations of active
faults. The viaduct is a girder bridge composed of three curved decks, a central railway and
two lateral roadways, supported by five piers, by the terminal structure of the suspension
bridge and by the abutment. The bridge was designed to transmit most of the longitudinal
seismic forces to the abutment that consequently will be loaded by large seismic forces. In the
following, the methodology adopted to investigate the dynamic behaviour of the full soil-
abutment-superstructure system will be presented, focusing mainly on the modelling tech-
nique of the soil-structure interaction models.
Figure 1: (a) longitudinal section of the Pantano viaduct and of the Messina Strait suspension bridge; (b) geome-
try of the abutment of the Pantano viaduct.
2 NUMERICAL MODELLING
The system modelling and response computations were performed by using the open
source Finite Element analysis framework OpenSees [1] while the mesh of the models was
generated and visualized through the pre/postprocessor software GID [2]. The full three-
dimensional soil-structure interaction model, depicted in Figure 2, is composed of 400300 el-
ements for a whole extension of 353.5257.0 m2 in plan and 128.5 m in depth.
The abutment of the Pantano viaduct, represented in Figure 1, is a massive reinforced con-
crete structure resting on a foundation slab, that in turn is in contact with the Messina gravels.
Because of its large strength compared to the superstructure and the soil, it is reasonable to
assume that the abutment exhibits an elastic response under seismic conditions. Hence, every
structural member was modelled through the ShellMITC4 element [3] with elastic behaviour,
using constitutive parameters relative to a C32/40 strength class concrete in the European
standards. A Rayleigh damping was adopted for the elements of the abutment, calibrated in
order to consider a damping ratio not greater than 5% for all the significant modes of the
abutment.
All the soil domain was discretized through the SSPbrickUP eight node hexahedral elements
[4] in which a mixed displacement-pressure formulation is used. The advanced hardening
plasticity model developed by Manzari and Dafalias (MD model) [5] was chosen to get an
abutment wall
backfill
embankment
foundation
diaphragm wall
Messina gravels
Sicilia side
Calabria
abutmentPantano viaduct terminal structure
Messina gravels Coastal deposits
sea level
Messina Strait bridge
5
13
.4
6
17
(a) (b)
400
58

Davide Noè Gorini and Luigi Callisto
Figure 2: mesh of the three-dimensional soil-structure model
accurate response of the soil under cyclic loading and to predict the development of excess
pore water pressures during the earthquake. The parameters of the constitutive model were
calibrated against experimental data. It is important to observe that the MD model can repro-
duce with sufficient accuracy the mechanical behaviour of the soil only in a specific range of
strain. More in detail, a calibration based only on monotonic laboratory tests leads to a con-
siderable overestimation of the excess pore water pressure under cyclic conditions and, as a
result, an inaccurate prediction of the mechanical response in undrained conditions. To over-
come this issue, the calibration was aimed to obtain a good match with the experimental
trends under cyclic conditions and, at the same time, to have a reasonable static response in
the range of strain of interest for the problem under examination. The MD model is able to
reproduce the effective energy dissipation as a function of the strain level, however an addi-
tional small damping ratio was introduced using the Rayleigh formulation only to attenuate
the effects of spurious high frequencies.
Behind the wall of the abutment two zones can be distinguished: the backfill and the em-
bankment. The former is the part directly in contact with the abutment and is made of a soil-
cement mix to have a large stiffness and to avoid the development of significant plastic strains.
Therefore the backfill was modelled as an elastic-perfectly plastic material, with a Young’s
modulus of 106 kPa that respects technical provisions on the stiffness, a Poisson’s ratio of 0.2,
an angle of shearing resistance of 38° and a cohesion equal to 200 kPa. Moreover, the Ray-
leigh damping model was associated with the elements of the backfill calibrated on the fre-
quency content of the seismic input. Conversely, the embankment is a partially saturated soil,
with the presence of negative pore water pressure (suction) providing non-zero stiffness and
strength at small stress levels. The mix design for the soil of the embankment was chosen to
have a stiffness and a degree of compaction greater than the correspondent limit values im-
posed by technical provisions. The MD model was adopted to simulate the behaviour of the
embankment with an appropriate calibration of the parameters, in which the effect of the suc-
tion was modelled as a modest increment of the material stiffness. As done for the soil do-
59

Davide Noè Gorini and Luigi Callisto
main, a small Rayleigh damping was added to these elements to stabilized the dynamic time
stepping.
The bridge has three curved decks, two lateral roadways designed as continuous steel box
girder beams and a central railway composed of a mixed steel-concrete beam for each span,
that are supported by five piers with a reinforced concrete box section. All the decks are con-
nected to the abutment by a series of bearings that impede the relative displacements with the
abutment. The dynamic interaction between the abutment and the bridge structure was initial-
ly modelled by applying equivalent static forces at the top of the abutment. At a successive
stage, a more rigorous method was introduced, conceived to reproduce the frequency-
dependent transmission of the dynamic interaction forces between the abutment and the su-
perstructure through a transfer tensor, which represents the global effects of the multi-
directional dynamic response of the superstructure.
A staged analysis procedure was adopted with gravity loads applied first and followed by the
dynamic simulation, in which the use of the parallel computing was needed to get reasonable
computation times. During the seismic excitation, the Lysmer and Kuhlemeyer absorbing
boundaries [6] were applied along the lateral boundaries of the model, implementing an au-
tomatic procedure to set the dashpots with their properties, while the seismic input, applied at
the base of the model, resulted from a deconvolution analysis in order to limit the vertical ex-
tension of the numerical model. In this way, the seismic actions reaching the abutment derive
from the combined effect of the propagation of the seismic waves through the soil and the dy-
namic interaction of the soil with the structure.
3 CONCLUSIONS AND PERSPECTIVES
The numerical procedure exposed herein is part of an ongoing research on the dynamic re-
sponse of bridge abutments, starting from the case study of the Pantano viaduct. The purpose
of this research is to define useful tools and methods for dealing with the complex soil-
abutment-superstructure interaction and to explore the dissipative capabilities deriving from
the interaction between the soil and the abutment.
REFERENCES
[1] F.T. McKenna, Object-oriented finite element programming: Frameworks for analysis,
algorithms and parallel computing. Ph. D. dissertation, Univ. of California, Berkeley,
Calif, 1997.
[2] N.D. Diaz, P.S. Amat, GID the personal pre/postprocessor user’s manual, version 5.0.
CIMNE, Barcelona, Spain, http://gid.cimne.upc.es, 1999.
[3] E.N. Dvorkin, K.J. Bathe, A continuum mechanics based four node shell element for
general nonlinear analysis. Eng. Comput., 1, 77-88, 1984.
[4] O.C. Zienkiewicz, T. Shiomi, Dynamic behaviour of saturated porous media; the gener-
alised Biot formulation and its numerical solution. International Journal for Numerical
Methods in Geomechanics, 8, 71-96, 1984.
[5] Y.F. Dafalias, M.T. Manzari, Simple Plasticity Sand Model Accounting for Fabric
Change Effects. Journal of Engineering Mechanics. , 130(6), 622-634, 2004.
[6] J. Lysmer, R.L. Kuhlemeyer, Finite dynamic model for infinite media. Journal of Engi-
neering Mechanics Division. , 95(4), 859-877, 1969
60

Smail Kechidi, Aires Colaço, Mário Marques, José M. Castro and Pedro A. Costa
OpenSees Days Europe 2017
1st European Conference on OpenSees
Porto, Portugal, 19–20 June 2017
MODELLING OF SOIL-STRUCTURE INTERACTION IN OPENSEES:
A PRACTICAL APPROACH FOR PERFORMANCE-BASED
ENGINEERING
Smail Kechidi1, Aires Colaço2, Mário Marques2, José M. Castro2 and Pedro A. Costa 2
1 Faculty of Engineering, University of Porto
Rua Dr. Roberto Frias s/n, 4200-465 Porto, Portugal
2 Faculty of Engineering, University of Porto
Rua Dr. Roberto Frias s/n, 4200-465 Porto, Portugal
{aires,pacosta,miguel.castro,mariom}@fe.up.pt
Keywords: Soil-structure interaction, Lumped-parameter model, OpenSees, Nonlinear dy-
namic analysis, Site effect.
Abstract. In this paper, a numerical tool based on the Monkey-tail fundamental lumped-pa-
rameter model is proposed for the simulation of the dynamic soil-structure interaction (SSI).
The proposed model has been implemented in the OpenSees finite element environment where
the input parameters are merely function of the soil properties. The ease of use, accuracy and
versatility of the proposed model is demonstrated in order to encourage its use within, among
others, the practicing engineers’ community. Furthermore, the influence of the SSI and local
soil conditions (i.e., site effect) on the seismic performance of two 5-storey steel moment-resist-
ing frames, has been investigated. Preliminary results shed light on the influence of the ge-
otechnical conditions on the structural seismic response and its dependence on the fundamental
period of vibration, seismic intensity level and soil stiffness, which are not taken into account
by the current European design codes.
61

1 INTRODUCTION
Structures supported by shallow foundations are subjected to inertial loading due to earth-
quake ground motion and eventually the foundation may undergo sliding, settling and rocking
movements. If the capacity of the foundation is mobilised, the soil-foundation interface would
dissipate significant amount of vibrational energy, resulting in a reduction in structural force
demand. This energy dissipation and force demand reduction may enhance the overall perfor-
mance of the structure, if potential consequences such as excessive tilting, settlement or bearing
failure are accounted for in the formulation of numerical models. Despite these two potential
benefits, building codes discourage designs that consider mobilisation of the foundation’s ca-
pacity. This lack of acceptance to embrace the soil-structure interaction (SSI) may stem from
the lack of well-calibrated modeling tools coupled with parameter selection protocols cast in a
simplistic manner. In this paper, a practical modelling tool of the SSI for a seismic performance
assessment, is presented. The model has been implemented in OpenSees [1] following a sim-
plistic approach where its parameters are related to the soil properties. Subsequently, to provide
insights into the impact level of the SSI and site effect on the structural seismic behaviour, the
performance of two 5-storey steel moment-resisting frames (MRFs) has been assessed.
2 SOIL-STRUCTURE INTERACTION MODELLING
The model adopted herein represents the frequency dependent SSI of a massless foundation
where the ground is simulated by a range of spring and dashpots-masses following a lumped-
parameter formulation. The lumped values represent the stiffness, inertial effect and damping
generated from the SSI phenomenon. Among the different models available in literature, the
present study adopts the “Monkey-tail” fundamental lumped-parameter model [2]. The latter
requires five parameters (K, C0, C1, M0 and M1) to be defined for each degree of freedom as
depicted in Figure 1.
a) b)
Figure 1: Monkey-tail model: a) problem description and b) structural system (adapted from [1]).
2.1 Model implementation in OpenSees software
In this study, OpenSees has been adopted to implement the above described model. In order
to check the accuracy of the proposed model and establish a certain reliability for its use in
further parametric studies, a validation process should be carried out. For this purpose, two
single-degree-of-freedom (SDOF) systems, as shown in Figures 2a and 3a were selected and
then analysed considering the SSI effect in their bases using the above described lumped pa-
rameter model.
a) b)
Figure 2: a) SDOF (m=94 ton; c=9.3E05 kN.s/m; k=9.3E07 kN/m) and b) comparison of results obtained
from OpenSees (black) and the frequency domain analysis using Matlab (grey) for Vs30=180.
62

Smail Kechidi, Aires Colaço, Mário Marques, José M. Castro and Pedro A. Costa
The time-history response of the mass, produced by a ground motion record selected based
on specific soil and structure conditions, can be seen in Figures 2b and 3b. An acceptable cor-
relation rate is observed between the results obtained from the proposed lumped-parameter
model and those obtained from analyses carried out in the frequency domain using Matlab soft-
ware.
a) b)
Figure 3: a) Oscillator system and b) comparison of results obtained from OpenSees (black) and the fre-
quency domain analysis using Matlab (grey) for Vs30=180.
3 CASE STUDY
In this section, the influence of the local soil conditions and SSI on the seismic performance
of two steel MRFs, is assessed. The first building, denoted by GB, has been designed to merely
resist gravity loads in accordance with the provisions of Eurocode 3 [3]. The second building,
designated by SB3, has been seismically designed according to Part 1 of Eurocode 8 [4] con-
sidering a behaviour factor “q” equal to 4 (Araújo [5]). Three different analysis methodologies
which are considered in this study. The first one, identified as approach I, is a typical structural
analysis where the SSI is neglected and the site effects are incorporated in the ground motion
record selection i.e., through the consideration of the soil factor in the calculation of the re-
sponse spectrum. The second analysis (approach II) incorporates the SSI and the ground motion
records are selected following the same technique adopted in the first analysis. In the last anal-
ysis (approach III), along with the incorporation of the SSI, the effect of the local soil conditions
is taken into account as well.
a) b)
Figure 4: a) Interstorey drifts (% of the storey height) for GB and b) SB3 (right) frames considering type I
and II approaches and seismic intensity levels associated with TR=475 years (top) and TR=2475 years (bottom).
Figure 4a (top) shows a similar trend of deformation for the different analyses where the
upper limit corresponds to the curve of the rigid case (approach I) except for the section of the
plot corresponding to the lower stories. Moreover, it is found that the maximum values of the
interstorey drift are located at the second storey. Comparing now the results obtained for both
seismic intensity levels (i.e., 10% and 2% probability of exceedance in 50 years), a similar trend
can be seen in Figure 4a (bottom). In fact, there is a low dispersion of the results for the GB
63

frame (subfigures 4a) and the increase thereof for the SB3 frame, particularly with respect to
the case of a low soil stiffness (subfigures 4b). Furthermore, there is a significant increase at
the level of deformations, being associated to an increase of the plastic deformations of the
frames members coupled with some structural related reasons.
In order to reveal the effect of the local site conditions on the structural response, the results
obtained with approach II can now be directly compared with those recorded using approach
III, considering the same average soil stiffness. Figure 5 represents the interstorey drift curves
obtained for both approaches and for two seismic intensity levels (TR equal to 475 and 2475
years). As far as approach III is concerned, the two curves are plotted, one corresponding to the
homogeneous profile (red) and the other (green) related to the average value of the curves re-
ferring to ten geotechnical profiles.
a) b)
Figure 5: Comparison of the interstorey drift values (% of the storey height) obtained for the SB3 frame con-
sidering approach II and III for seismic intensity levels associated with TR=475 years (top) and TR=2475 years
(bottom) for: a) Vs30=360 m/s and b) Vs30=180 m/s.
The analysis of Figure 5 indicated that there is a common trend between the two adopted
seismic intensity levels, where the main differences stemmed from the soil stiffness. Clear dis-
crepancies are observed between the two different cases of approach III. When considering a
value of 360 m/s for the soil stiffness parameter (Vs30), approach II gives rise to an outer enve-
lope of the interstorey drift curves excluding the top floor. This finding is no longer valid when
the value of Vs30 is reduced to 180 m/s where the soil amplification plays a crucial role leading
to higher interstorey drift curves obtained following approach III than those obtained from ap-
proach II.
REFERENCES
[1] PEER. OpenSees: Open system for earthquake engineering simulation, Pacific Earth-
quake Engineering Research Center, University of California, Berkeley, CA, 2006.
[2] L. Ibsen, M. Liingaard, Lumped-parameter models. Aalborg University, 2006.
[3] EN 1993-1-1. Eurocode 3: Design of steel structures - Part 1.1: General rules and rules
for buildings. European Committee for Standardization, Brussels, CEN, 2005.
[4] EN 1998-1, Eurocode 8. Design of structures for earthquake resistance, Part 1: general
rules, seismic actions and rules for buildings. European Committee for Standardization,
Brussels, CEN, 2005.
[5] M. Araújo, Seismic safety assessment of existing steel buildings, Civil Engineering De-
partment, Faculty of Engineering, University of Porto, Porto, 2013.
64

OpenSees Days Europe 2017
1st European Conference on OpenSees
Porto, Portugal, 19–20 June 2017
IMPLEMENTATION AND FINITE-ELEMENT ANALYSIS OF SHELL
ELEMENTS CONFINED BY THROUGH-THE-THICKNESS UNIAXIAL
DEVICES
Salvatore Sessa1, Roberto Serpieri2, and Luciano Rosati1
1 University of Naples Federico II – Department of Structures for Engineering and Architecture
via Claudio 21, 80125, Napoli, Italia
e-mail: {Salvatore.sessa2, rosati}@unina.it
2 Università degli Studi del Sannio – Department of Engineering
Piazza Roma 21, 82100, Benevento, Italia
Keywords: OpenSees, Shell, Through-the-Thickness, Confinement, Jacketing.
Abstract. This contribution presents the implementation in OpenSees of an integration pro-
cedure based on a recently developed theory concerning stress integration along the chords
of a shell element reinforced with uniaxial transverse links. Such a model has been developed
in order to account for transverse confinement effects induced by through-the-thickness jack-
eting of masonry and reinforced concrete existing structures. In particular, transverse con-
finement induces a triaxial stress state in the core material of the shell increasing the stress
spherical part and resulting in strength and ductility increments. In order to perform struc-
tural analyses with reduced computational costs, the presented tool permits to compute the
response of plane elements confined by uniaxial devices. To this end, the implemented object
accounts for the mutual interaction of uniaxial reinforcements with a triaxial core by means
of equilibrium and compatibility equations involving several object classes of the OpenSees
framework. Integration of the triaxial stress state along the thickness of a shell element is
therefore performed by numerically solving the equilibrium/compatibility equation system.
The adopted implementation strategy is summarized and modeling features are discussed. In
conclusion, numerical examples show some possible applications of the proposed tool in
common structural design practices.
65

Salvatore Sessa, Roberto Serpieri and Luciano Rosati
1 INTRODUCTION
The use of confinement devices in the retrofit of masonry and reinforced concrete struc-
tures has become a very popular approach for its capability of improving structural strength
and ductility. More recently, use of confinement retrofit techniques has been extended also to
the retrofit of planar structural elements. In particular, masonry panels in existing buildings
are also confined by employing Through-the-Thickness reinforcing links connecting external
reinforced render layers Jacketing the panel (TTJ) [1].
To model TTJ devices, a formulation of TTJ Shell (TTJS) has been proposed by the au-
thors in a recent research paper [2]. It consists of an Equivalent Single Layer Mindlin First-
order Shear Deformation Theory (ESL-FSDT) endowed by enhanced kinematics coupling the
stress-strain states of a shell triaxial core material and of uniaxial transverse confining devices.
The present contribution briefly presents the TTJS formulation and illustrates the underly-
ing implementation strategy in OpenSees of an MITC shell element based upon the TTJS the-
ory. Numerical results and validation schemes are also presented.
2 THROUGH-THE-THICKNESS JACKETED SHELL THEORY
The TTJS theory [2] enhances in a simplest possible way an ordinary ESL MITC formula-
tion. Its main idea is to enforce a set of equilibrium and compatibility equations, representing
the interaction between the links and the core material over a generic transverse segment of
the shell, named Shell Chord. For a shell core made of n layers these equations are:
Compatibility: ∑ 𝜀33𝑖 𝑡𝑖
𝑛
𝑖=1
= 𝜀𝑇𝑇 ∑ 𝑡𝑖
𝑛
𝑖=1
; Equilibrium: 𝜎33𝑖 + 𝜇𝑇𝜎𝑇𝑇 = 0; 𝑖 = 1. . 𝑛 (1)
where 𝜀33𝑖 and 𝜎33
𝑖 are the strain and stress components at the i-th layer along the direction or-
thogonal to the shell middle plane, 𝜀𝑇𝑇 and 𝜎𝑇𝑇 are the uniaxial strain and stress of the con-
finement devices, 𝑡𝑖 is the thickness of the i-th layer and 𝜇𝑇 is the percentage area of the ties.
The i-th layer refers to a specific class of triaxial material providing stress components σjki as
functions of εjki and its derivative.
The compatibility condition in (1) enforces the deformation 𝜀𝑇𝑇 to be equal to the trans-
verse stretching of the shell core and the equilibrium condition enforces the core stress com-
ponent 𝜎33𝑖 to be in equilibrium with the term 𝜇𝑇𝜎𝑇𝑇 representing the uniaxial stress resultants
of the ties. In such a way, Eqs. (1) describe the interaction of all layers with the uniaxial ties
where the role of transverse confinement is to contrast the transversal stretching of the shell,
acting proportionally to the stiffness of the confinement devices.
A set of routines integrating the mechanical state of the Shell Chord according to Equa-
tions (1) have been implemented in OpenSees v. 2.5.0 complying with its object-oriented ar-
chitecture. In brief, the essential steps for the integration of an ESL-FSDT MITC formulation
are the following. First, strain components along the shell chord are computed by shape func-
tions. Next, the relevant stress state is evaluated layerwise by the constitutive routines, and,
finally, the stress state is integrated in order to obtain generalized forces at the nodes. Solution
of compatibility and equilibrium equations in (1) is performed by a Newton-Raphson algo-
rithm. Finally, generalized stress components are computed by summation.
From a computational point of view, integration of generalized stress in performed at each
Gauss point of the relevant finite element. The TTJS implementation in OpenSees uses the
ShellMITC4 element, a 4-noded, three-dimensional shell with 6 Degrees Of Freedom (DOFs)
per node. Such an element is linked to instances of a Section object which defines the layers’
66

Salvatore Sessa, Roberto Serpieri and Luciano Rosati
geometry and performs the stress integration. Consistently with the OpenSees philosophy, the
TTJS algorithm has been implemented as a subclass of Section, as shown in Figure 1: it re-
ceives from the parent object the values of the generalized strains and returns the values of the
generalized stress and the tangent operator.
Figure 1 OpenSees parent (green) and child (blue) classes involved in the TTJS analysis
3 NUMERICAL RESULTS
The first numerical example herein reported consists of a reinforced concrete shear wall
with steel transverse reinforcements. Core layers are modeled as an elastic – perfectly plastic
Drucker Prager material while ties are elastic – perfectly plastic uniaxial rod elements. Results
of a second application, the Scordelis Lo roof subject to vertical loads, are also reported show-
ing the behavior of the TTJS in capturing coupling between flexural and membrane behavior.
Global structural responses in the two tests are shown in Figure 1 and Figure 4, respective-
ly, in terms of load-displacement relationships and distributions of the confining stress 𝜎𝑇𝑇.
Figure 2 Load-displacement responses of the shear wall test (left) and Scordelis-Lo roof (right).
The load-displacement curves show that increase of the percentage of transverse confine-
ment 𝜇𝑇 results in higher post-elastic stiffness and strength of the structures. Conditions of
plane stress and plane strain represent natural boundaries for the responses relevant to all pos-
sible confinement ratios, as shown in Figure 2.
The strength increment turns out to be the result of confinement increasing the spherical
part of the triaxial stress. As well known, this effect is beneficial in pressure-dependent fric-
tional materials and it is found to be ordinarily captured by the employed Drucker-Prager
model, as shown by the family principal stress paths plotted in Figure 3 as function of 𝜇𝑇.
Figure 4 shows that peak values of the confining stress 𝜎𝑇𝑇 are clustered in the compres-
sive regions. This issue highlights the benefits of using shells instead of beam elements for
analyzing confined shear walls: a beam accounts for confinement by assuming an average
strength increment uniformly distributed among the cross section. On the contrary, Figure 4
clearly shows that distribution of confinement effects depend on geometry and loads.
67
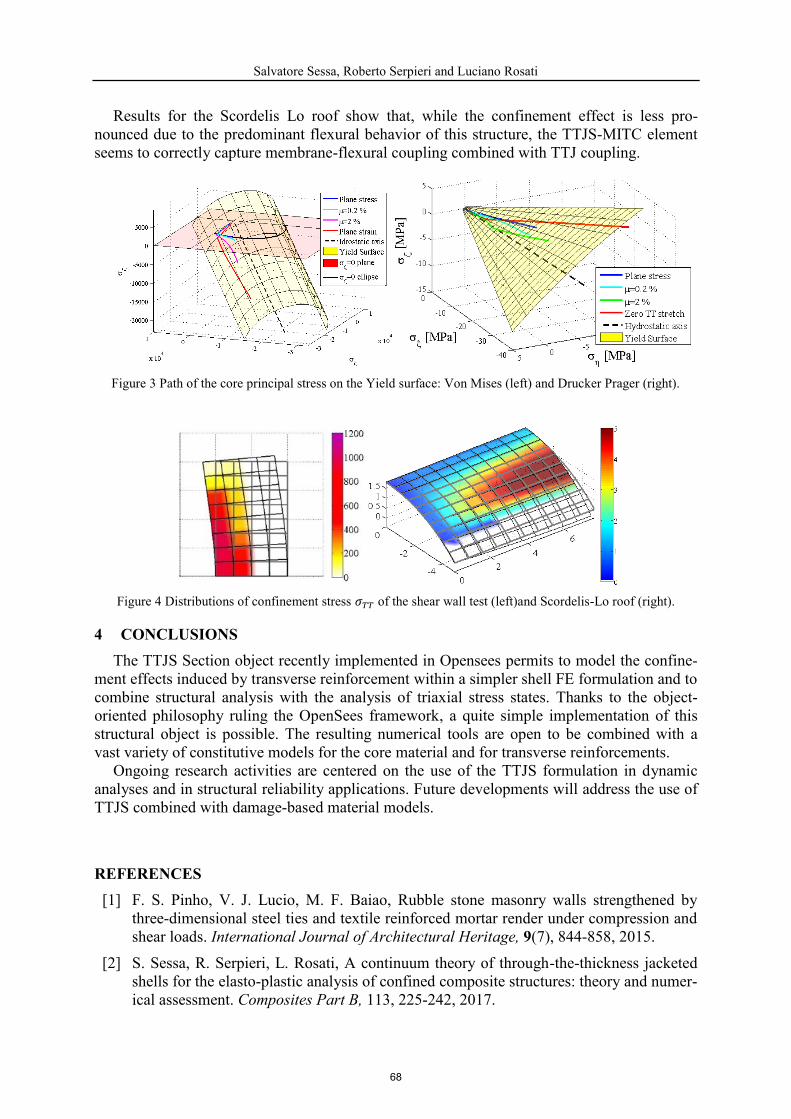
Salvatore Sessa, Roberto Serpieri and Luciano Rosati
Results for the Scordelis Lo roof show that, while the confinement effect is less pro-
nounced due to the predominant flexural behavior of this structure, the TTJS-MITC element
seems to correctly capture membrane-flexural coupling combined with TTJ coupling.
Figure 3 Path of the core principal stress on the Yield surface: Von Mises (left) and Drucker Prager (right).
Figure 4 Distributions of confinement stress 𝜎𝑇𝑇 of the shear wall test (left)and Scordelis-Lo roof (right).
4 CONCLUSIONS
The TTJS Section object recently implemented in Opensees permits to model the confine-
ment effects induced by transverse reinforcement within a simpler shell FE formulation and to
combine structural analysis with the analysis of triaxial stress states. Thanks to the object-
oriented philosophy ruling the OpenSees framework, a quite simple implementation of this
structural object is possible. The resulting numerical tools are open to be combined with a
vast variety of constitutive models for the core material and for transverse reinforcements.
Ongoing research activities are centered on the use of the TTJS formulation in dynamic
analyses and in structural reliability applications. Future developments will address the use of
TTJS combined with damage-based material models.
REFERENCES
[1] F. S. Pinho, V. J. Lucio, M. F. Baiao, Rubble stone masonry walls strengthened by
three-dimensional steel ties and textile reinforced mortar render under compression and
shear loads. International Journal of Architectural Heritage, 9(7), 844-858, 2015.
[2] S. Sessa, R. Serpieri, L. Rosati, A continuum theory of through-the-thickness jacketed
shells for the elasto-plastic analysis of confined composite structures: theory and numer-
ical assessment. Composites Part B, 113, 225-242, 2017.
68

OpenSees Days Europe 2017
1stEuropean Conference on OpenSees
Porto, Portugal, 19–20June 2017
OPENSEES INTEGRATED IN A BIM WORKFLOW AS
CALCULATION ENGINE
Pereiro-Barceló, Javier1, Fernández-Baños, Manuel2
1Cype Ingenieros S.A.
Avda. Eusebio Sempere, 5 – 03003 Alicante, España
e-mail: [email protected]
2 Cype Ingenieros S.A.
Avda. Eusebio Sempere, 5 – 03003 Alicante, España
e-mail: [email protected]
Keywords: Open BIM, workflow, Opensees, structural analysis.
Abstract. Using Open BIM (Building Information Modeling) technology, it is possible to im-
plement a collaborative, multidisciplinary and multiuser workflow that allows for project de-
velopment in an open, coordinated and simultaneous manner amongst the intervening
technical agents. In this workflow, proposed by Cype, the project is solved in an iterative
mode by progressively solving its different models. Opensees is integrated in this workflow as
calculation engine to perform structural analysis.
69

Pereiro-Barceló, Javier; Fernández-Baños, Manuel
1 INTRODUCTION
Open BIM is a global proposal to achieve user collaboration in the design, execution and
maintenance of buildings, based on an exchange of information using standard formats (IFC)
and an open workflow.
Using this technology, it is possible to implant a collaborative, multi-disciplinary and mul-
ti-user workflow, which allows for projects to be developed in an open, coordinated and sim-
ultaneous manner amongst the various technical users or intervening agents, and is completely
independent from the applications and platforms used for its development.
Cype has integrated Opensees within Open BIM workflow as calculation engine for Stru-
BIM Analysis, StruBIM Design and StruBIM Foundations.
2 OPEN BIM WORKFLOW
The following table explains the stages of Open BIM workflow:
Stages Description
Start of the
BIM Project
-An IFC format file must be generated based on a 3D model produced by
any architectural modeling software.
Specialized
applications
-All the applications that are compatible with the Open BIM workflow im-
port the IFC model. All intervening agents receive the same geometry and
architecture.
BIM model
update
-If any changes are made to the initial model, all the applications can un-
dergo an updating process. This guarantees that no information is lost.
IFC file export -The applications can also export a file in IFC format. This way, the BIM
project is enriched and completed upon accepting all this information.
BIM model
consolidation
-The information making up the BIM model increases using IFC files gen-
erated by all the applications and defines the complete BIM project.
Table 1: Open BIM workflow
3 STRUCTURAL ANALYSIS AND DESIGN IN OPEN BIM FLOW
The stages to carry out the analysis and design of structures are perfectly delimited:
Structural model.
Generation, edition and analysis of analytical model.
Design and check of structural elements.
Generation of layouts and reports.
3.1 Structural model
Structural model is made up by structural elements such as beams, columns, ties, shells, etc.
In order to perform the Structural analysis and design, it is necessary to gather some initial
information from the architectural model. Conventional structural BIM software expects to
gather this information from the BIM model. This flow implies that the structural analysis
tool is able to read the structural elements and add the information that cannot be described in
the modeling tool.
In contrast to this traditional trend, Cype proposes that the structural modeling tools inte-
grated in the Open BIM workflow do not import structural elements but the elements of the
BIM model that affect the structure. That is, from the architectural model the software imports
70

Pereiro-Barceló, Javier; Fernández-Baños, Manuel
the shape of the building (height between floors and contours of floors, gaps and position of
columns…), then the user models the structural elements and its properties.
3.2 Generation, edition and analysis of analytical model
Cype has developed a program to generate, edit and perform structural analysis: StruBIM
Analysis. This program forms part of StruBIM suite, which is a group of structural programs,
each one related to one stage of structural design.
Sequential version of OpenSees has been used as calculation engine in StruBIM analysis
(Figure 1), offering the same functionality that the previous engine. For this purpose several
extensions have been implemented in OpenSees: two new finite elements (one-dimensional
and shell) [1-3], a new constraints manager, MUMPS (Multifrontal Massively Parallel Sparse
Direct Solver) [4], etc. Besides, multiple instances of sequential OpenSees are used to in-
crease parallelism without using MPI.
Figure 1: Structural analysis with StruBIM analysis plus OpenSees: (a) Analytical model, (b) Calculating with
OpenSees, (c) Deflections results, (d) Mz moments in columns
3.3 Design and check of structural elements
StruBIM Design is responsible of designing and checking columns, beams, slabs and walls
according to ACI Codes (Figure 2.a). It imports the analytical model results from StruBIM
Analysis or from an xml file with a specific format. Besides, it is able to manage a local ana-
lytical model of each floor to design tendons, slabs and beams. It uses OpenSees as calcula-
tion engine. Analogously to StruBIM Design, Cype has created StruBIM Foundations to
design foundation elements (Figure 2.b).
(a) (b)
(c) (d)
71

Pereiro-Barceló, Javier; Fernández-Baños, Manuel
Figure 2: Design with StruBIM suite plus OpenSees: (a) Slabs design, (b) Foundations design
4 CONCLUSIONS
Cype proposes that the structural modeling tools integrated in the Open BIM workflow
should not import structural elements but the elements of the BIM model that affect the
structure, therefore no information is lost.
OpenSees has been integrated in the Open BIM workflow which is a global proposal to
achieve user collaboration in the design, execution and maintenance of buildings, based
on an exchange of information using standard formats (IFC). The high performance of
OpenSees plus the speed and convenience of BIM models make a powerful combination
to deal with structural design.
OpenSees is integrated in StruBIM suite to carry out the analysis of analytical models of
structures. New elements, constraints handler and solver has been added to OpenSees to
be able to model every aspect of a building. A new strategy for parallel processing has
been implemented.
OpenSees will soon provide StruBIM with the possibility of performing dynamic and
non-linear analysis of complex structures which would became very difficult to model
without the capabilities that StruBIM offers.
REFERENCES
[1] E. Oñate, Cálculo de Estructuras por el Método de Elementos Finitos, 1th Edition, Cen-
tro internacional de Métodos Numéricos en Ingeniería, Universitat Politècnica de Cata-
lunya, Barcelona, 1992.
[2] C.A. Felippa Introduction to Finite Element Methods, Department of Aerospace Engi-
neering Sciences and enter for Aerospace Structures, University of Colorado, USA,
2004.
[3] C.A. Felippa Finite Element Methods in Dynamics, Department of Aerospace Engineer-
ing Sciences and enter for Aerospace Structures, University of Colorado, USA, 2004.
[4] MUltifrontal Massively Parallel Solver (MUMPS), Users’s guide, March 21, 2017.
(a) (b)
(c)
72

OpenSees Days Europe 2017 1st European Conference on OpenSees
Porto, Portugal, 19–20 June 2017
A NEW GRAPHICAL USER INTERFACE FOR OPENSEES
Vassilis K. Papanikolaou1, Theocharis Kartalis-Kaounis1, Evangelos Protopapadakis1, and Theocharis Papadopoulos1
1 Lab of R/C and Masonry Structures, School of Civil Engineering, Aristotle University of Thessaloniki, Greece P.O. Box 482, Thessaloniki 54124, Greece
e-mail: [email protected] (V.K. Papanikolaou)
Keywords: OpenSees, GiD, Graphical User Interface (GUI), Open Source
Abstract. The objective of this paper is to present a new graphical user interface that has been recently developed for OpenSees, which seamlessly connects the OpenSees solver with the gen-eral pre/post-processor GiD. This interface, available as open-source, is easily installed in the GiD graphical environment and provides an extended set of user dialogs and tools to efficiently create model geometry, assign materials, elements and boundary conditions, select various analysis options and finally invoke the OpenSees solver to execute the analysis. The interface automatically transforms the bulk of numerical results produced by OpenSees to a GiD-com-patible format, for the user to take advantage of the versatile GiD graphical postprocessor, which includes a deformed shape viewer with animation capabilities, force/stress/strain vectors and contours, line diagrams and x-y graphs. At the present state of development, all standard and a few advanced modeling capabilities of OpenSees are supported, which renders the inter-face a promising alternative to the cumbersome code-based modeling, considerably shortening the respective learning curve, especially for new and inexperienced users.
73

Vassilis K. Papanikolaou et al.
1 INTRODUCTION The Open System for Earthquake Engineering Simulation (OpenSees), developed as open-
source at the PEER Center [1] is an increasingly popular analysis platform in earthquake engi-neering research, since it provides a robust solver with numerous standard and advanced con-stitutive laws, finite element types, boundary conditions and analysis capabilities. It has a large established user base, allowing the end-user not only to take advantage of its advanced features but also actively contribute to its current state of development. However, both the analysis solver and the produced result files are text-based, which requires a prior knowledge of TCL coding, even for building simple models. More importantly, the bulk of numeric results, espe-cially when large in size, require the development of ad-hoc postprocessing tools (e.g. in MATLAB or other languages) for easier interpretation via plotting or visualization. The above shortcomings are often a deterring factor for new and inexperienced users to adopt OpenSees in their research, usually resorting to other software packages with graphical capabilities.
Taking the above disadvantage into consideration, the authors have recently developed a new interface (http://gidopensees.rclab.civil.auth.gr) that seamlessly connects the OpenSees solver with the general pre/postprocessor GiD, developed by the International Center for Nu-merical Methods in Engineering (CIMNE) [2], which not only provides a complete graphical environment for finite element pre/postprocessing, but also a TCL-based scripting language for generating custom input files, compatible with any text solver available. Moreover, by translat-ing the produced result files into a specified format and importing them to the graphical post-processor, all the standard graphical postprocessing features e.g. deformed shape view, contours and x-y plots are readily available. Similar implementations have been developed for other analysis packages as well (e.g. [3]). It should be stated here that the GiD software is distributed commercially, however its evaluation version has a generous 1010 node limit, which is more than adequate even for large frame models, rendering the full version necessary only for models with a large number of shell or brick elements (e.g. geotechnical and SSI problems).
Figure 1: Comparison between OpenSees and GiD+OpenSees learning curves
The advantage of the present interface is depicted in Fig. 1 in a comparison between the learning curve of OpenSees alone and a considerably shorter one using the present interface. At the current state of development there exists a balance point above which the OpenSees user will no longer be benefited from the interface, due to the current limitations in terms of sup-ported materials and elements. However, since the interface is provided as open-source i.e. open to user contributions, it is believed that future versions will contain the complete OpenSees
74

Vassilis K. Papanikolaou et al. functionality, shifting this balance point to infinity. Nevertheless, the interface already provides the ability to manually edit the created data file (.tcl) before analysis (e.g. for adding any un-supported commands), execute the analysis and graphically postprocess the results.
2 INTERFACE STRUCTURE The basic interface structure is depicted in Fig. 2. The model is created in the GiD graphical
preprocessor using a standard point’n’click procedure for geometry (points, lines, surfaces, vol-umes) with the aid of various user dialogs containing the native OpenSees commands for de-fining and assigning model and analysis properties, together with a robust mesher provided by the preprocessor itself.
Figure 2: Interface structure
After completing the model, a single button press creates the OpenSees-compatible model data file and invokes the solver for running the analysis. The result output/recorder files (.out) are automatically translated to the required format and automatically imported in the postpro-cessor. The model is subsequently opened in the postprocessing environment, where all stand-ard visual and graphic tools are available.
3 INTERFACE FEATURES Table 1 contains a list of all available features at the current state of development (v2.1.0,
15/5/2017). More additions are already planned for upcoming releases. Figure 3 depicts two models created using the present interface, viewed in the GiD postprocessor.
4 CLOSURE The herein presented GiD+OpenSees interface provides a promising alternative to the native
code-based modeling process, making OpenSees accessible to a broader audience of research-ers in the field of earthquake engineering. Provided as open-source, it is continually improving to reach even higher levels of functionality in the near future.
75

Vassilis K. Papanikolaou et al.
Table 1: Interface features (v2.1.0)
Materials Standard Uniaxial Materials -Elastic -Elastic Perfectly Plastic -Elastic Perfectly Plastic with Gap Uniaxial Steel Materials -Steel01 -Reinforcing Steel Uniaxial Concrete Materials -Concrete01 -Concrete02 -Concrete04 -Concrete06 Other Uniaxial Materials -Viscous Multidimensional (nD) Materials -Elastic Isotropic -Elastic Orthotropic -J2Plasticity -Damage2p -PressureIndependMultiYield -PressureDependMultiYield Section Force-Deformation -Fiber -Plate Fiber -Elastic Membrane Plate Combined Materials -Parallel -Series -Section Aggregator
Elements ZeroLength Elements Truss Corotational Truss Elastic Beam-Column Elastic Timoshenko Beam-Column Force-Based Beam-Column Displacement-Based Beam-Column Triangular (Tri31) Quadrilaterals (Quad) Shell (ΜΙΤC4) Standard Brick Element (stdBrick)
Analysis Types Eigenvalue Linear Static Nonlinear Static (Pushover) - Load control - Displacement control - Monotonic or Cyclic Linear Transient Nonlinear Transient - Uniform ground motion excitation - Uniform sine excitation - Multi support ground motion excitation - Multi support sine excitation
Restraints On single nodes On line nodes On surface nodes
Loads Forces - On single nodes - On line nodes - On surface nodes - Uniform forces on frame elements Displacements - On single nodes Ground motion - Ground motion from record on single nodes - Sine ground motion
Constraints Body constraints (equalDOF) on nodes Body constraints (equalDOF) on line nodes Rigid diaphragm
Damping Global Rayleigh damping Rayleigh damping on specific regions - On nodes - On elements
Masses On single nodes On line nodes On surface nodes
Figure 3: Postprocessor examples (left: 3D elastic analysis of a truss crane on elastic soil, right: 2D dynamic analysis of an inelastic frame on elastic soil – soil-structure interaction)
REFERENCES [1] F. McKenna, G.L. Fenves, M.H. Scott, Open System for Earthquake Engineering Simu-
lation. Pacific Earthquake Engineering Research Center, 2017. [2] A. Coll, R. Ribó, M. Pasenau, E. Escolano, J.S. Perez, A. Melendo, A. Monros, GiD v.13
Customization Manual, CIMNE, 2017. [3] V. Cervenka, L. Jendele, J. Cervenka., ATENA Program Documentation. Part 1: Theory
2017.
76

OpenSees Days Europe 2017
1st European Conference on OpenSees
Porto, Portugal, 19–20 June 2017
MODELLING OF A SHEAR REINFORCED FLAT SLAB BUILDING
FOR SEISMIC FRAGILITY ANALYSIS
Brisid Isufi1, Ildi Cismasiu2, António M. P. Ramos3 and Válter J. G. Lúcio4
1 PhD Student, Faculdade de Ciências e Tecnologia, Universidade NOVA de Lisboa
Quinta da Torre, Campus Universitário, 2829-516 Caparica
e-mail: [email protected]
2 UNIC, Faculdade de Ciências e Tecnologia, Universidade NOVA de Lisboa
Quinta da Torre, Campus Universitário, 2829-516 Caparica
e-mail: [email protected]
3 CERIS, Faculdade de Ciências e Tecnologia, Universidade NOVA de Lisboa
Quinta da Torre, Campus Universitário, 2829-516 Caparica
e-mail: [email protected]
4 CERIS, Faculdade de Ciências e Tecnologia, Universidade NOVA de Lisboa
Quinta da Torre, Campus Universitário, 2829-516 Caparica
e-mail: [email protected]
Keywords: flat slab, fragility, OpenSees, shear studs, IDA.
Abstract. Flat slabs are generally not recommended for buildings in seismic regions, espe-
cially due to the risk of punching failures that can lead to progressive collapse if no measures
are taken. Nonetheless, they are often used, even in regions with moderate to high seismicity.
Shear stud reinforcement has been shown by various researchers to be among the most effec-
tive measures to prevent punching failures in flat slabs under vertical and lateral loading.
The presented work is part of a research that aims to assess the adequacy of flat slabs rein-
forced with shear studs for use in a low rise building subjected to seismic actions. Herein,
preliminary results from seismic fragility assessment are presented. The nonlinear behavior
of the building is modelled in the OpenSees platform with special consideration of the slab-
column connections, including the degradation due to cyclic loading and loss of unbalanced
moment transfer capacity due to punching failure. The hysteretic model of the connections is
calibrated using laboratory test results obtained on a specimen subjected to constant gravity
loads and reversed lateral cyclic loading. Fragility curves are derived using Incremental Dy-
namic Analysis (IDA) for a set of synthetic ground motions. A simple local damage index is
used to estimate damage in each connection and a global index, corresponding specifically to
damage in the flat slabs, is evaluated. Concrete compressive strength, steel yield strength and
the gravity loads are considered as random variables to account for the structural capacity
uncertainties. The preliminary results showed that punching failures were avoided and the
shear reinforcement was effective in reducing damage to the flat slabs for the considered
building.
77

Brisid Isufi, Ildi Cismasiu, António M. P. Ramos and Válter J. G. Lúcio
1 INTRODUCTION
Fragility analysis is used in this research to assess the adequacy of shear stud reinforce-
ment for use in a low rise flat slab building in which the slabs and the connections are part of
the lateral force resisting system. The OpenSees [1] platform was chosen to perform a total of
1920 dynamic nonlinear time history analyses under a set of 64 Eurocode 8 [2] spectrum
compatible accelerograms. Eight peak ground acceleration levels, starting from 0.05g up to
0.40g with a 0.05g step were considered. For each ground acceleration level, 8 synthetic ac-
celerograms were generated using SeismoArtif [3]. Thirty nonlinear dynamic time history
analyses were performed for each of the 64 accelerograms. The concrete strength, reinforce-
ment yield strength and gravity loading were considered as random variables with prescribed
probability distribution functions. Variables were sampled using the Latin Hypercube tech-
nique. OpenSees proved to be a suitable platform for the fragility analysis because it allowed
automation in the modelling process, in sampling of the variables and in post-processing.
Two main issues need to be addressed in the structural modelling of flat slabs for fragility
analysis when dynamic nonlinear history analyses are involved. First, the model should be
able to capture the punching failure mode of flat slabs. Secondly, the model should adequately
represent the load-deformation relationship of slab-column connections, which typically ex-
hibit significant pinching. In order to adequately represent the loss of unbalanced moment
transfer in the slab-column connection, the available Joint2D element [4] was used in combi-
nation with the Pinching4 [5] uniaxial material to model the joints as rotational springs. Pre-
vious research related to fragility analysis of flat slabs includes [6], [7] and [8].
2 MODELLING AND ANALYSIS
A 2D frame of a three story flat slab building with five bays is considered (Figure 1). The
building corresponds to the prototype building used for the reversed lateral cyclic loading test
of a flat slab-column connection at Faculdade de Ciências e Tecnologia, Universidade NOVA
de Lisboa in Portugal. The gravity load applied to the specimen was approximately equal to
50% of the concentric punching shear resistance of the specimen without shear reinforcement
and it was kept constant throughout the test. The laboratory specimen was able to attain a 4.0%
drift ratio before a sudden punching failure caused an immediate drop in the unbalanced mo-
ment transferred through the connection. Integrity reinforcement was provided to the speci-
men and it is assumed that the building also has integrity reinforcement that prevents
progressive collapse once a punching failure occurs.
Figure 1: OpenSees model of the frame
It is assumed that punching shear failure at the exterior connections cannot occur, due to
the presence of a beam and larger column dimensions. However, flexural failures are possible
at the exterior connections and a plastic hinge is modelled at the end of the slab ele-
ment (Figure 1). As a result of concentrating the nonlinearity to the joints, the slabs itself are
modelled as elastic elements with cross section dimensions equal to those of the tested speci-
78

Brisid Isufi, Ildi Cismasiu, António M. P. Ramos and Válter J. G. Lúcio
men (width 1850mm and depth 150mm). Nonlinear fiber elements are used to model the col-
umns.
(a) (b)
Figure 2: a) Model used for calibration; b) comparison of experimental and numerical results
The interior slab-column joints are calibrated using the model shown in Figure 2-a, which
adequately simulates the boundary conditions imposed by the test setup described in detail in
[9]. From Figure 2-b it can be observed that the model is able to capture important aspects of
the behavior of the tested specimen, such as pinching behavior, the backbone response and a
close fit to the actual unloading response for low to medium range drift ratios.
3 RESULTS
The results of the simulation were processed in terms of maximum roof displacements and
damage indices versus ground accelerations. The first were used as estimators of global col-
lapse of the building, based on reference values from a pushover analysis. Local damage indi-
ces were defined as the ratio between the maximum joint rotation during the analysis and the
ultimate rotation of the flat slab-column connection limited by punching failure. The overall
damage indices were then estimated based on a weighting process on the basis of energy dis-
sipation, similarly to the procedure described in [10] for the overall Park and Ang Damage
Index. Four damage states specific for the flat slabs under consideration were defined based
on the damage observed in the laboratory specimen for various slab-column joint rotation lev-
els.
Figure 3: Fragility curves referring to damage in the flat slabs and an indicative global collapse curve
An estimate of the probability of exceedance for each damage state is evaluated for each
ground acceleration level, based on the results of the IDA. The fragility curves are then repre-
sented by the lognormal cumulative distribution functions that best fit to the point estimates of
-80 -60 -40 -20 0 20 40 60 80
-60
-40
-20
0
20
40
60
-4% -3% -2% -1% 0% 1% 2% 3% 4%
-120
-80
-40
0
40
80
120
Laboratory
OpenSees
drift ratio (%)
unbala
nced
mom
ent(k
Nm
)
horizonta
lfo
rce
(kN
)
horizontal displacement (mm)
0.00 0.05 0.10 0.15 0.20 0.25 0.30 0.35 0.400.0
0.2
0.4
0.6
0.8
1.0
light moderate
excessive total global colapse
pro
ba
bili
tyofexce
edance
ground acceleration (g)
79

Brisid Isufi, Ildi Cismasiu, António M. P. Ramos and Válter J. G. Lúcio
the same damage level by means of the “least squares”. Similarly, an indicative curve corre-
sponding to global collapse of the building is derived based on maximum roof displacements
observed during the IDA. It is plotted in Figure 3 alongside the flat slab fragility curves in or-
der to compare the damage state of the flat slabs in relation to the probability of global col-
lapse (governed by the failure of the columns).
4 CONCLUSIONS
Analytical model-based fragility curves were developed for a three story building with flat
slabs calibrated using the reversed lateral cyclic loading test of a flat slab-column connection.
OpenSees was used to perform modelling, sampling of input variables, nonlinear time history
analyses and part of the post-processing of results. For the building under consideration, it
was shown that the global structural behavior is not governed by punching of the flat slabs.
Due to the presence of shear reinforcement, punching failures occurred at large drifts, in
which the capacity of the vertical elements was exhausted. For the analyzed building, the
punching shear reinforcement with shear studs was not only effective in the prevention of
brittle punching failures, but it also contributed in the limitation of damage to the flat slabs.
REFERENCES
[1] "OpenSees," Pacific Earthquake Engineering Research Center, [Online]. Available:
http://opensees.berkeley.edu. [Accessed 12 January 2017].
[2] CEN, EN 1998-1, Eurocode 8: Design of structures for earthquake resistance - Part 1:
General rules, seismic actions and rules for buildings, CEN, 2004.
[3] SeismoSoft, "SeismoArtif," SeismoSoft, [Online]. Available:
http://www.seismosoft.com/seismoartif. [Accessed 20 02 2017].
[4] A. Altoontash, Simulation and damage models for performance assessment of
reinforced concrete beam-column joints (PhD thesis), Standfort, California, USA:
Stanford University, 2004.
[5] L. N. Lowes, N. Mitra and A. Altoontash, "A Beam-Column Joint Model for Simulating
the Earthquake Response of Reinforced Concrete Frames, PEER Report 2003/10,"
Pacific Earthquake Engineering Research Center, Berkeley, California, USA, 2004.
[6] M. A. Erberik and A. S. Elnashai, "Fragility analysis of flat-slab structures,"
Engineering Structures, vol. 26, p. 937–948, 2004.
[7] M. B. D. Hueste and J.-W. Bai, "Seismic retrofit of a reinforced concrete flat-slab
structure: Part II — seismic fragility analysis," Engineering Structures, vol. 29, p.
1178–1188, 2007.
[8] H. Aslani and E. Miranda, "Fragility assessment of slab-column connections in existing
non-ductile reinforced concrete buildings," Journal of Earthquake Engineering, vol. 9,
no. 6, pp. 777-804, 2005.
[9] A. F. O. Almeida, M. M. Inácio, V. J. Lúcio and A. Pinho Ramos, "Punching behaviour
of RC flat slabs under reversed horizontal cyclic loading," Engineering Structures, vol.
117, no. June, p. 204–219, 2016.
[10] Y. J. Park, A. H.-S. Ang and Y. K. Wen, "Damage-Limiting Aseismic Design of
Buildings," Earthquake Spectra, vol. 3, no. 1, pp. 1-26, 1987.
80

OpenSees Days Europe 2017 1st European Conference on OpenSees
Porto, Portugal, 19–20 June 2017
NON-LINEAR DYNAMIC ANALYSES OF A 60’S RC BUILDING COLLAPSED DURING L’AQUILA 2009 EARTHQUAKE
Maria Gabriella Mulas1 and Paolo Martinelli1
1 Politecnico di Milano, Department of Civil and Environmental Engineering Piazza Leonardo da Vinci 32, 20133, Milano, Italy
e-mail: {mariagabriella.mulas,paolo.martinelli}@polimi.it
Keywords: seismic collapse, RC non-ductile frame, obsolete code, shear failure, OpenSees platform, 3D nonlinear model.
Abstract. This study presents the numerical simulation of the partial seismic collapse of a building during 2009 L'Aquila earthquake (Italy). The 7-story building was designed in the early ‘60s and is characterized by a reinforced concrete frame structure. In elevation, above a first basement and a ground floor, three wings rise. The collapse affected the North wing, where three separate collapse mechanisms were identified. All the columns at ground story failed with a weak-story mechanism in North-South direction. Three columns, located near the interface with the other wings, failed on the full height. In the same area, subjected to strong distortions due to the difference in vertical displacements following the weak-story mechanism, a third collapse mechanism involved (at stories 1-4) a beam supporting a non-structural wall inserted in recent renovation works. Previous investigations explained why the collapse was confined to the North Wing, providing the knowledge of the building to the date of the earthquake in terms of geometry, material properties, gravity loads and seismic input to the site. The building structural response during the earthquake as well as the sequence of the different mechanisms and their possible interdependence are investigated here. Nonlinear dynamic analyses on OpenSees adopt a refined 3D nonlinear FE model with beam-columns fiber elements and the components of the ground motion at site. Results up to the collapse onset satisfactorily simulate the identified collapse mechanisms clarifying the interaction and the likely sequence among the different mechanisms and the role played by the three wings during the earthquake.
81

M.G. Mulas and P. Martinelli
1 INTRODUCTION
During the April 6th 2009 earthquake of L’Aquila (Italy), a partial collapse causing a high death toll took place on a reinforced concrete (RC) building hosting an University dorm, 6 km away from the epicenter. This is one of the cases of failure of RC buildings in the urban area of L’Aquila (EERI Special Report 2009 [1]). The 7-story building including two underground stories had an irregular T-shaped plan composed of three nearly rectangular “wings” connected through a common stairwell (Fig. 1a). The building was designed in 1965, adopting the equiv-alent lateral forces approach of the Italian codes of 1937 and 1962. The collapse is connected to a complex building history involving several changes of property and intended use. The orig-inal design of the structural frame system was affected by an error that was brought to the light neither in the two changes of property nor in the design phase of the refurbishment intervention of 1999-2001.
Figure 1: The student dorm building: (a) aerial view before the earthquake; (b) view before demolition of the
collapsed North wing and (c) front view from XX Settembre Street after the removal of unsafe elements.
The partial collapse was limited to the North wing facing XX Settembre Street (Fig. 1a). Previous studies conducted for legal reasons [2], pinpointed the existence of multiple mecha-nisms in this wing. First, the failure of all ground floor columns, which triggered a weak/soft story mechanism in the North-South (N-S) direction (Fig. 1b). Then, at the interface with the other wings, failure of three columns along the whole height of the building and mid-span fail-ure at floors 1-4 of the beam connecting columns 18 and 29 (see Fig. 1c). The beam was affected by the insertion of a non-structural wall during the renovation works. The lack of flexural strength of ground story columns was detected as the main cause of the collapse.
Given the availability of material properties, acting loads and geometric data on both the structure and the steel reinforcement, the collapse sequence is investigated through non-linear
82

M.G. Mulas and P. Martinelli
dynamic analyses on a 3D numerical model of the whole building. The analyses have been performed with the OpenSees platform [3], using the accelerograms at the site. In [4] the col-lapse sequence of the North wing was simulated, and the role of the non-structural wall was examined. This paper summarizes the main findings obtained in [4] and [5].
2 NUMERICAL MODELLING OF THE BUILDING
The simulation of the seismic collapse is performed with the open–source platform Open-Sees [3]. The beam–column fiber element with distributed inelasticity and force formulation, based on the Navier–Bernoulli’s hypothesis, is selected for the FE model [6]. The geometric nonlinearity is included through a P–Δ formulation. Uniaxial material laws describe the hyster-etic response of the materials. The modified Kent–Park model describes the response of the concrete fibers in compression. For concrete in tension, a linear elastic branch is followed by a linear softening branch up to zero stress to include the effect of tension stiffening. The well-known nonlinear model of Menegotto and Pinto is used for the steel fibers.
A comprehensive 3D model reproduces the building configuration of April 6th 2009 in terms of geometry, masses and stiffness of structural elements. One nonlinear fiber beam–column element is used for both columns and beams of the main resisting frames in each wing (denoted with solid lines in Figure 2b). Floors are modeled as rigid diaphragms. The FE model has 1835 nodes and 805 elements. Among them, 449 are nonlinear beam elements. Figure 2a presents a schematic view of the nodes and elements layout. The average values of material properties coming from on-site and laboratory tests are used for the unconfined concrete. The low amount of stirrups in both columns and beams and the lack of longitudinal reinforcement along the long sides of the rectangular cross-sections limit the confinement effect.
3 RESULTS AND CONCLUSIONS
The building first mode (T1=0.99 s) mainly involves a translation along the N-S direction with a small torsional component. The second (T2=0.95 s) and fourth (T4=0.93 s) mode combine a translation of the floors in the N–S direction and a predominant torsional component. The third mode (T3=0.38 s) involves a translation of the floors in both the E–W and N–S directions without torsional component. The response to the ground motion is analyzed first in terms of nodal displacements in Figure 2b. The orbits of the displacements at the top floor in the X-Z plane are analyzed for the corner nodes and for those corresponding to the two interior columns collapsed over the entire height of the building (within a red circle in Figure 2b). The prevailing displacement component is directed along the Z axis (N-S direction). This is the direction both of the North wing frames, the only ones to resist significantly to horizontal forces in this direc-tion, and of the first mode shape. Due to the rigid diaphragm assumption, the corner nodes of the three wings move in a similar way. In spite of the displacement magnitude, columns in the East and West wings have not suffered significant damage, since their reinforcement layout is designed to withstand moments about the Z-axis and their weak axis is aligned on the strongest earthquake direction (Z-axis in Fig. 2b). Consequently, these columns are not highly stressed despite high displacement values detected at the top floor. A not negligible torsional effect is also visible in Figure 2b.
To evaluate the structural response, internal forces are compared to the corresponding re-sistances. The variable truss model proposed in the Italian code is adopted to assess the shear capacity. For the ground story columns of the North Wing, the shear demand exceeds the ca-pacity in closely spaced time instants, indicating their almost simultaneous failure. Moreover, the analysis of shear force and bending moment time histories has pointed out that the ultimate shear capacity is reached before the complete development of flexural resistance. The numerical
83

M.G. Mulas and P. Martinelli
analyses have highlighted a weak-story mechanism, which caused the crushing of columns at ground story. This result, as the pattern of displacements along the N-S direction (the strong direction of the main frames of the North Wing), is in excellent agreement with the situation observed immediately after the earthquake. The numerical results indicate that the building de-veloped a bidirectional resistance, but the demand was not distributed as the masses in each wing. The East and West wings attract around 80% of the total base shear Vx along the E-W direction. A completely different trend was observed along the N-S direction, where the North wing attracts more than 50% of the total shear actions Vz.
It is concluded that the time-histories analyses have simulated successfully the collapse mechanisms. The result is remarkable because no model updating or tuning of the parameters was pursued. Further studies should address the simulation of the incremental collapse, taking into account the large relative displacements arising at the interior edge of the North wing.
Figure 2: (a) FE model for the whole structure: view in the Z-Y plan, North (right) and East (left) wings; (b) rep-
resentation of the displacement orbits at the top floor. Columns collapsed along the height within red circles.
REFERENCES
[1] EERI Special Earthquake Report. Learning from Earthquakes. The Mw 6.3 Abruzzo, Italy, Earthquake of April 6, 2009. June 2009.
[2] M.G. Mulas, F. Perotti, D. Coronelli, L. Martinelli, R. Paolucci. The partial collapse of “Casa dello Studente” during L’Aquila 2009 earthquake. Engng Fail Analysis, 2013(34): 566-584.
[3] F. McKenna, G.L. Fenves, M.H. Scott. Open system for earthquake engineering simulation. Univ. of California, Berkeley, Calif.; 2000. <http://opensees.berkeley.edu> [25.11.16].
[4] M.G. Mulas, P. Martinelli. Numerical simulation of the partial seismic collapse of a 60’s RC building. Submitted for possible publication to J. Perf. Constr Fac, ASCE, Jan. 2017.
[5] M.G. Mulas, P. Martinelli, S. Capriotti. Non-linear dynamic analyses of a RC frame building collapsed during L’Aquila 2009 earthquake, Compdyn 2017, accepted.
[6] E. Spacone, F.C. Filippou, F.F.Taucer. Fibre beam–column model for non-linear analysis of R/C frames. Part I: formulation. Earthq Eng Struct Dyn 1996a; 25 (7): 711–25.
84

OpenSees Days Europe 2017 1st European Conference on OpenSees
Porto, Portugal, 19–20 June 2017
A GENETIC ALGORITHM AIMED AT OPTIMISING SEISMIC RETROFITTING OF EXISTING RC FRAMES
C. Faella, R. Falcone, C. Lima, E. Martinelli
Department of Civil Engineering, University of Salerno Via Giovanni Paolo II, 132 – Fisciano (SA), Italy
e-mail: [email protected]; [email protected]; [email protected]; [email protected]
Keywords: Seismic retrofitting, Optimisation, RC frames, Steel bracings, Confinement
Abstract. This paper presents a novel numerical procedure based on a dedicated genetic al-gorithm aimed at selecting the “optimal” retrofitting solution among the technically feasible ones obtained by combining structure- and member-level techniques. Specifically, both steel bracing systems, considered as structure-level intervention, and FRP-confinement of under-designed RC members, thought-out as member-level technique, are taken into account for achieving the retrofitting objectives within the conceptual framework of a multi-level Perfor-mance-Based approach. OpenSEES is one of the main “characters” of the numerical procedure, as it is intensively utilised for running the analyses that are needed for determining the seismic performance of the RC frame under consideration strengthened by means of a set of structure- and member-level interventions representing the generic “individual” of the current “genera-tion” of the genetic algorithm. The paper focusses on describing the interactions between Open-SEES and the aforementioned genetic algorithm implemented by the Authors in Matlab. Specifically, the main data structures and subroutines are outlined with the aim to show how input and output operations in/from OpenSEES are handled. Particularly, the paper describes how basic mechanisms inspired to the well-known Theory of Evolution by Charles Darwin are transposed to the problem under consideration. It is worth highlighting that executing the Non Linear Static (NLS) analyses requested for assessing the actual effect of seismic strengthening interventions represents the most computationally demanding and time consuming operation in the whole numerical procedure. Therefore, the paper gives some details about some specific measures taken in implementing the numerical procedure with the aim to enhance computa-tional efficiency without affecting simulation accuracy.
85

C. Faella, R. Falcone, C. Lima, E. Martinelli
1 INTRODUCTION
Seismic retrofitting of existing RC structures can be achieved by means of either member- or structure-level techniques. The former aims at increasing capacity in under-designed mem-bers (i.e. FRP confinement of columns), the latter are rather intended at introducing new sub-structures (i.e. steel bracings systems) intended at reducing seismic demand on the existing frame. In principle, those techniques may be also combined with the aim to obtain a synergy in reaching the target performance objectives [1]. However, no well-established rules are currently available for choosing their “optimal” combination, as the solution of this complex optimization problem would require meta-heuristic numerical methods. The general procedure proposed herein is based on a genetic algorithm [2] inspired to the Darwin’s “evolution of species” con-cept [3]. It is developed in Matlab and OpenSEES [4] is employed in performing the NonLinear Static Analyses (NSA) needed for quantifying the values of the objective function for each combination of member- and structure-level techniques. The present paper focuses on the role of OpenSEES within the present numerical procedure and the influence of alternative modelling choices on the resulting computational effort.
2 OVERVIEW OF THE GENETIC ALGORITHM
The optimal retrofitting solution xopt is obtained by combining member- and structure-level techniques by solving the following constrained problem:
arg min opt tot penCx x x (1)
subjected to the respect of the Limit State function gLS,i
, , , 0 1... LS i LS i LS i LSg C D i nx x x , (2)
where CLS,i and DLS,i are, respectively, the capacity and the demand at the i-th relevant Limit State under consideration. Moreover, Ctot(x) represents the total cost of intervention and Φpen
is the penalty function intended at increasing the nominal cost of those technical solutions that do not respect the retrofitting objective (Eq. 2). The main steps of the proposed meta-heuristic strategy are shown in the conceptual flow-chart of Figure 1.
Figure 1: Flow-chart of the optimization procedure
The vector x collects the design variables: it consists of both FRP confinement of RC col-umns (member-level technique) and concentric X-shape steel bracings (structure-level tech-nique). Fig. 2 describes a generic array of bits corresponding to the codified version of a generic combination of member- and structure-level techniques under consideration.
86

C. Faella, R. Falcone, C. Lima, E. Martinelli
Figure 2: Example of binary genotype describing a retrofitting intervention
An initial “population” of n individuals x is randomly generated at the beginning of the pro-cedure. Nonlinear Static Analyses (NSA) are performed on the models obtained by merging the existing RC frame and the intervention described by each one of the aforementioned individuals. The analysis results are elaborated with the aim to determine a “fitness function” measuring the capability of each individual to achieve the target performance objectives. This function is used for obtaining the next generation individuals by means of selecting three fundamental operators, namely selection, crossover and mutation, intended at reproducing the key evolutionary mech-anisms. Specifically, the “selection” operator selects “parents” based on the “survival of the fittest” principle: individuals with higher fitness function values have higher probability of sur-viving and reproducing their features in the next generation. Then, “crossover” combines seg-ments of the selected individuals into new “offspring” solutions by commuting their genetic information. Finally, “mutation” randomly changes the value of single bits (from 0 to 1 or vice versa). Once the second generation of individuals is created the procedure goes on iteratively, until convergence is achieved. It is worth highlighting that parallel computing is adopted for carrying out the NSA requested for quantifying fitness functions across the current generation.
3 FIRST RESULTS ON THE COMPUTATIONAL EFFICIENCY
Two different approaches can be used for simulating mechanical nonlinearity of frame ele-ments: concentrated plasticity and spread plasticity models. In concentrate plasticity models, inelastic resources are concentrated at the end element in the so-called "plastic-hinges" region, while the central part of the beam is simulated by a linear elastic element (Fig. 3,a). Otherwise, a fiber approach is used in distributed plasticity models. In this case, the structural element is discretized into a number fibers which account for material nonlinear behaviour and sectional integration is performed at the Gauss quadrature integration points (Fig. 3,b). OpenSEES allows to simulate distributed plasticity elements by means of both force- and displacement-based for-mulation related to the different approach used for solving the static problem. In this paper only force-based distributed plasticity elements (namely “nonlinearbeamcolumn”) with five Gauss points are taken into account and the results are compared with the ones obtained by modelling RC elements with plastic-hinges approach (namely “beamWithHinges” command).
(c)
Figure 3. “Plastic-hinges” (a) and “fiber” models (b); in plane configuration of the analyzed structure (c)
Chromosome =
Member-level technique(Ncol x 2 bits)
Structure-level technique(Nbeam x 3 bits)
Lpi
Linear Elasticnode i node j
LpjL
user-defined sections
(a)
X
Y
4.00 4.00
6.00
5.00
fiber
s
e
Gauss points
(b)
L
87

C. Faella, R. Falcone, C. Lima, E. Martinelli
A simple 3D three-storey RC frame (Fig. 3,c) is considered as a preliminary case-of-study. The two aforementioned models are analyzed and the computation time needed to execute NSA is compared (Fig. 4). Both stiffness and post-elastic branch obtained by means of the two models are significantly different. The slope of hardening branch and the maximum strength are higher in the fiber model (Fig. 4,a). However, the computational effort needed by the spread plasticity model (Fig. 4,b) is 40 % higher than the corresponding time required for carrying out the same non-linear static analysis on the plastic-hinges model.
(a) (b)
Figure 4. Pushover curves (a) and comparison of the computational time (b)
4 CONCLUSION
A rational procedure intended at optimizing seismic retrofitting of existing structures by combining member- and structure-level techniques is being developed by the authors. Despites the limitations of the current state of development it is a promising tool for approaching a sub-ject of high relevance. Current research is devoted at enhancing the computational efficiency of the programming code. In fact, almost 94% of the total computational time of the procedure is taken by seismic analysis in OpenSEES, whereas the 6% only refers to pre- and post-pro-cessing operations handled by the genetic algorithm. Different modelling strategies are actually under investigation by considering various approaches in simulating nonlinearity of RC mem-bers, steel bracings, floor diaphragms and so on. The first results herein outlined about the non-linear simulation of beam and column elements encourage the authors at using concentrated plasticity elements.
REFERENCES
[1] E. Martinelli, C. Lima, C. Faella, Towards a rational strategy for seismic retrofitting of RC frames by combining member- and structure-level techniques. SMAR2015 – Third Conference on Smart Monitoring, Assessment and Rehabilitation of Civil Structures, An-talya (Turkey), September 6-9, 2015.
[2] J.H. Holland, Adaptation in natural and artificial systems. Ann Arbor, University of Michigan Press, Michigan 1975.
[3] C. Darwin, On the Origin of Species by means of Natural Selection or the Preservation of Favored Races in the Struggle for Life (The Origin of Species). Murray, London 1859.
[4] S. Mazzoni, F. McKenna, M.H. Scott, G.L. Fenves, et al., OpenSEES command language manual. Pacific Earthquake Engineering Research (PEER), 2006.
0
30
60
90
120
150
180
0 50 100 150 200 250 300
Vb [kN]
Dtop [mm]
X-direction Fiber Model
X-direction Plastic Hinge Model
Y-direction Fiber Model
Y-direction Plastic Hinge Model
0
0.3
0.6
0.9
1.2
1.5
Plastic Hinges Model Fiber Model
TimeTimePHM
88

OpenSees Days Europe 2017
1st European Conference on OpenSees
Porto, Portugal, 19–20 June 2017
NUMERICAL MODELLING OF RC COLUMNS WITH PLAIN
REINFORCING BARS
J. Melo1, H. Varum1, and T. Rossetto2
1 Civil Engineering Department, Faculty of Engineering, University of Porto, Porto, Portugal
{josemelo, hvarum}@fe.up.pt
2 EPICENTRE, Department of Civil, Environmental & Geomatic Eng., University College of London,
UK
Keywords: RC columns, plain reinforcing bars, bond-slip, numerical modelling.
Abstract. The earthquakes induce cyclic loading on the existing reinforced concrete (RC)
structures that may lead to bond degradation and significant bar slippage. The bond-slip mech-
anism is reported to be one of the most common causes of damage and even collapse of existing
(RC) structures subjected to earthquake loading. RC structures with plain reinforcing bars,
designed and built prior to the enforcement of the modern seismic-oriented design philosophies,
are particularly sensitive to bond degradation. However, currently perfect bond conditions are
typically assumed in the numerical analysis of RC structures.
This paper describes the numerical modelling of the cyclic response of two RC columns, one
built with deformed reinforcing bars and another with plain bars, both with structural detailing
similar to that typically adopted in pre-1970s structures. The numerical models were developed
on the OpenSees framework and calibrated with the available tests results. The bond-slip effects
were included in the models developed resorting to a simple modelling strategy. Several linear
fiber elements were used and the numerical results were compared to the experimental results.
89

J. Melo, H. Varum and T. Rossetto
1 INTRODUCTION
In the analysis of RC structures, perfect bond is usually assumed, i.e. considering compati-
bility between concrete and reinforcement strains at each structural member point. However,
this assumption is only correct for early loading stages and low strain levels. For large loads,
cracking and bond failure will occur and bar slippage takes place in the structural elements [1].
Considering the assumption of perfect bond conditions may lead to predicted lateral defor-
mation significantly smaller than the real element deformation or to predicted lateral stiffness
larger than the existing element stiffness [2]. Bond-slip effects should therefore be included in
the numerical models of structural analysis to represent more accurately the elements response
as stated [3].
The numerical modelling of the cyclic response of two analogous RC columns is here pre-
sented. One with deformed reinforcing bars and another with plain bars, both with structural
detailing similar to that typically found in RC structures designed and built before the 1970s
(that is, without specific details for seismic demands). For each column, different models and
linear elements were used in the OpenSees numerical models. Attention was given to the effects
of bar slippage, which were incorporated in the OpenSees models resorting to a simple model-
ling strategy. The results of the cyclic tests previously conducted on the columns were used to
calibrate the adopted models. After describing the models, comparisons are established between
the numerical and experimental results to conclude about their adequacy to simulate the col-
umns response, and about the importance of including the effects of bar slippage.
2 SPECIMENS DETAILING AND NUMERICAL MODELS
2.1 Specimens detailing and material properties
The specimen detailing and material properties can be found in [4]. Specimen CPA-3 and
specimen CD were built with plain and deformed reinforcing bars, respectively. Both specimens
have the same geometry dimensions and amount of steel reinforcement and were built in full-
scale. The imposed loading conditions and the lateral displacement history (dc) are shown in
Figure 1. The lateral displacements were imposed at 1.7m from the column base (see Figure
1a). The axial load (N) was kept constant during the tests and equal to 305kN. The axial load
imposed by the testing setup is centered at the column’ base and consequently P-delta effects
are not considered.
a) b)
Figure 1. a) Support and loading conditions idealized; b) imposed lateral displacement history.
2.2 Numerical modelling with OpenSees
For each column specimen, four nonlinear models were developed, namely: i) with nonlin-
earBeamColumn element, i.e. with distributed plasticity; ii) with BeamWithHinges element, in
which the plasticity is concentrated over specified hinge lengths at the element ends; iii) with
Co
lum
n
1.7
0m
F
N
cdc
-90
-75
-60
-45
-30
-15
0
15
30
45
60
75
90
To
p d
isp
lace
men
t, d
C (
mm
)
Step
-5
-4
-3
-2
-1
0
1
2
3
4
5
Dri
ft (
%)
90

J. Melo, H. Varum and T. Rossetto
nonlinearBeamColumn element and zero-length section element; and, iv) with BeamWith-
Hinges element and zero-length section element. The zero-length section element was incorpo-
rated to simulate the bar slippage effects associated with the strain penetration and the bond-
slip mechanism.
In the numerical models, the Concrete02 model and Steel02 model were adopted for the
concrete and steel reinforcement, respectively. It should be noted that the elastic part of the
BeamWithHinges element was modelled using an elastic material with the same elastic modulus
of the concrete. The Concrete02 model was also assigned to the concrete fibres of the zero-
length section element. All model parameters can be found in [4].
3 NUMERICAL RESULTS
3.1 Numerical results of the specimen with plain reinforcing bars
The comparison of the experimental force-drift diagrams for the column with plain reinforc-
ing bars with those obtained from the numerical models under investigation is shown in Fig-
ure 2. The best-fit to the experimental results was obtained by the OpenSees model with
concentrated plasticity (BeamWithHinges element) and considering bar slippage (zero-length
section element).
Figure 2: Comparison between the experimental and numerical force-drift diagrams of specimen CPA-3
3.2 Numerical results of the specimen with deformed reinforcing bars
Figure 3 compares the experimental force-drift diagrams with those obtained from the nu-
merical models under investigation. As concluded for the specimen with plain bars, the best-fit
to the experimental force-drift response was obtained with BeamWithHinges element and zero-
length section element.
-90 -75 -60 -45 -30 -15 0 15 30 45 60 75 90-50
-40
-30
-20
-10
0
10
20
30
40
50
OpenSees
NonLinear Beam-Column Element
Forc
e, F
C (
kN
)
Displacement, dC (mm)
Exp
Num
-5 -4 -3 -2 -1 0 1 2 3 4 5
Drift (%)
-90 -75 -60 -45 -30 -15 0 15 30 45 60 75 90-50
-40
-30
-20
-10
0
10
20
30
40
50
Forc
e, F
C (
kN
)
Displacement, dC (mm)
Exp
Num
-5 -4 -3 -2 -1 0 1 2 3 4 5
OpenSees
NonLinear Beam-Column Element
Zero-Length Element
Drift (%)
-90 -75 -60 -45 -30 -15 0 15 30 45 60 75 90-50
-40
-30
-20
-10
0
10
20
30
40
50
OpenSees
BeamWithHingesElement
Forc
e, F
C (
kN
)
Displacement, dC (mm)
Exp
Num
-5 -4 -3 -2 -1 0 1 2 3 4 5
Drift (%)
-90 -75 -60 -45 -30 -15 0 15 30 45 60 75 90-50
-40
-30
-20
-10
0
10
20
30
40
50
Forc
e, F
C (
kN
)
Displacement, dC (mm)
Exp
Num
-5 -4 -3 -2 -1 0 1 2 3 4 5
OpenSees
BeamWithHinges Element
Zero-Length Element
Drift (%)
91

J. Melo, H. Varum and T. Rossetto
Figure 3: Comparison between the experimental and numerical force-drift diagrams of specimen CD
4 CONCLUSIONS
All developed models, generally, provided a satisfactory simulation of the experimental
force-drift diagrams. However, any of the models could properly capture the strength deg-
radation, nor the stiffness of the reloading branches, nor the pinching effect.
For both column specimens, a better agreement between the numerical and experimental
results (in terms of force, stiffness and energy dissipation) was obtained considering the
non-linearity concentrated in the plastic hinge regions. This was particularly relevant for
the column with plain reinforcing bars, namely in terms of stiffness evolution and energy
dissipation.
REFERENCES
[1] G. Monti, E. Spacone, Reinforced concrete fiber beam element with bond-slip. Journal
of Structural Engineering, 126, 6:654-661, 2000.
[2] H.G. Kwak, Improved numerical approach for the bond-slip behavior under cyclic loads.
Structural Engineering and Mechanic, 5, 5:663-677, 1997.
[3] J. Melo, C. Fernandes, H. Varum, H. Rodrigues, A.G. Costa, A. Arêde, Numerical mod-
elling of the cyclic behaviour of RC elements built with plain reinforcing bars. Engineer-
ing Structures, 33, 2:273-286, 2011.
[4] Melo J. Characterization of the cyclic behaviour of reinforced concrete elements with
plain bars. PhD thesis, Aveiro University, Portugal, 2014.
-75 -60 -45 -30 -15 0 15 30 45 60 75-50
-40
-30
-20
-10
0
10
20
30
40
50
OpenSees
NonLinear Beam-Column Element
Forc
e, F
C (
kN
)
Displacement, dC (mm)
Exp
Num
-4 -3 -2 -1 0 1 2 3 4
Drift (%)
-75 -60 -45 -30 -15 0 15 30 45 60 75-50
-40
-30
-20
-10
0
10
20
30
40
50
Forc
e, F
C (
kN
)
Displacement, dC (mm)
Exp
Num
-4 -3 -2 -1 0 1 2 3 4
OpenSees
NonLinear Beam-Column Element
Zero-Length Element
Drift (%)
-75 -60 -45 -30 -15 0 15 30 45 60 75-50
-40
-30
-20
-10
0
10
20
30
40
50
OpenSees
Beam With Hinges Element
Forc
e, F
C (
kN
)
Displacement, dC (mm)
Exp
Num
-4 -3 -2 -1 0 1 2 3 4
Drift (%)
-75 -60 -45 -30 -15 0 15 30 45 60 75-50
-40
-30
-20
-10
0
10
20
30
40
50
Forc
e, F
C (
kN
)
Displacement, dC (mm)
Exp
Num
-4 -3 -2 -1 0 1 2 3 4
OpenSees
Beam With Hinges Element
Zero-Length Element
Drift (%)
92

OpenSees Days Europe 2017
1st European Conference on OpenSees
Porto, Portugal, 19–20 June 2017
IMPROVED DRIFT ASSESSMENT APPROACH FOR STEEL
MOMENT FRAMES UNDER REALISTIC EARTHQUAKE LOADING
Borjan S. Petreski1, Mihail A. Garevski1*
1 Institute of Earthquake Engineering and Engineering Seismology
Todor Aleksandrov Str., 165, P.O. Box 101, 1000 Skopje, Republic of Macedonia
e-mail: [email protected] *e-mail: [email protected]
Keywords: steel structures, MRFs, concentrated plasticity, OpenSees, stiffness deterioration,
performance based assessment.
Abstract. This research studies an improved performance based assessment method of steel
moment resisting frames (MRFs) through alternative modelling of the structure subjected to
realistic earthquake loading. The improvement is evaluated through a comparison of two dif-
ferent modelling approaches for design and assessment of the MRFs. The initial approach for
modelling of the steel frame is the distributed plasticity approach using fibre discretization of
nonlinear beam - column elements. On the other hand, the improved method is represented via
the lumped plasticity modelling characterized by elastic beam - column elements ending with
plastic hinges. For the distributed plasticity approach a bilinear steel material is used while
for the plastic hinges of the concentrated plasticity approach, a stiffness deterioration model is
applied by means of the OpenSees software framework. To simulate the realistic earthquake
loading two sets of seven far-field ground motion records scaled to match the Eurocode 8 (EC8)
design spectra are used, representing both the medium seismicity and the high seismicity sce-
narios. Both sets are used in three separate analyses denoting three different performance tar-
gets to control the level of drift at design level earthquake, near collapse and collapse level
earthquake. The structure investigated is a three bay, six story steel moment frame designed
following the Eurocode 8 provisions. For the sake of complying with the Eurocode 8 require-
ments for the limitation of the inter-story drifts, the frame subjected to the high-hazard scenar-
ios is slightly modified. The performance evaluation presented focuses on the use of the floor
drifts as the basic parameters for performance assessment. The story drift is the only parameter
used in this discussion as the intent is to evaluate the performance of the structures according
to current guidelines and procedures. Alternatively, in order to obtain more information about
the behaviour of the structure and to compare the new findings with already existing work in
the field, some other structural characteristics are being recorded in the analyses performed
such as the floor accelerations and beam rotations. In the end, the focus is set on the relations,
similarities and deviations between the recorded inter-story drifts (maximum and residual), and
the existing requirements and recommendations in the European and American codes of prac-
tice.
93

Borjan S. Petreski, Mihail A. Garevski
1 INTRODUCTION
There are plenty of research findings on the evaluation of the realistic drifts of the steel
MRFs and their comparison with the existing codes of practice. It is shown that EC8 require-
ments regarding the drift are a lot more rigorous than the provisions in other earthquake design
codes, specifically characterized by the stability factor (θ). This factor, as a result of the strict
drift and stability constraints and the sensitivity of the moment resisting frames to the lateral
deformation effects, can often govern the design, resulting in over-strength which reduces the
ductility demand of the structure and affects the loads acting on it, especially if a high ductility
factor is adopted [1]. Other research investigating the structural behaviour of steel moment re-
sisting frames also observed that EC8 provisions are highly conservative while the US provi-
sions seem to under-predict the global and maximum drift modification factors. It also points
out the oversimplified nature of drift demand criteria adopted in the design codes, particularly
in the European codes of practice [2].
In this research paper an improved approach for evaluating the steel moment frames’ behav-
iour is implemented in order to tackle the deficiency in the assessment of this type of structures.
Using the finite element program OpenSees, a six story – three bay moment resisting frame is
modelled and analyzed.
2 DEFINITION OF MODELS AND ANALYSIS PROCEDURES
2.1 Distributed plasticity model
Firstly, the modelling is performed using the nonlinear beam - column elements with dis-
tributed plasticity and a bilinear steel material from the OpenSees database [3] for both the
beams and the columns. These elements permit the spread of plasticity along the element using
pre-defined number of Gauss points and are quite useful for capturing the axial force-moment
interaction. On the other hand, their main characteristic is the fibre discretization which is very
sensitive and needs pre-calculations.
2.2 Concentrated/Lumped plasticity model
Consequently, the same frame model is constructed using the elastic beam - column elements
ending with zero-length plastic hinges modelled by a stiffness deteriorating steel material. The
deterioration model used [4] presents the breakthrough of the use of the deteriorating stiffness
models in the field of earthquake engineering. This model which is afterwards improved to refer
to the asymmetric element hysteretic performance, incorporating varying rates of cyclic deteri-
oration in the two separate loading directions is shown in Fig. 1.
Figure 1. – IK deterioration model: (a) monotonic curve; (b) basic modes of cyclic deterioration and associated
definitions [5]
94

Borjan S. Petreski, Mihail A. Garevski
The stiffness deteriorating springs in the concentrated plasticity model are placed only at the
ends of the beams as the intention is to limit the occurrence of plastic hinges during realistic
earthquake loading in the beams of the structure (weak beam – strong column rule).
2.3 Scenario and intensity based performance assessment
According to the scenario based performance assessment, two sets of seven acceleration
records are chosen as realistic earthquake loading to represent the medium seismicity (MH) and
high seismicity (HH) scenarios. They are extracted from the database and scaled to match the
EC8 elastic spectra for the two hazard scenarios with PGA = 0.25g and PGA = 0.35g.
Regarding the intensity levels, three levels of transient dynamic loading are considered. In
EC8 the levels of the seismic action on structures are defined as the design earthquake scenario
considering 100% intensity of the ground motion and near collapse scenario represented with
175% of the ground motion intensity. Additionally, collapse level subjecting the structure to
350% increased realistic ground motion is performed.
3 MATERIAL STIFFNESS DETERIORATION EFFECT
It is not satisfactory to state that the comparison of the two frames is only due to the different
plasticity modelling of the structural elements. Another essential segment of the full image
about the study is the stiffness and strength deterioration material property assigned to the hinge
elements of the concentrated plasticity approach. In order to clarify the differences that the
deterioration model generates in the steel moment frame response evaluation, a simple pushover
analysis is performed. The results of the analysis are shown in Fig. 2.
Figure 2. Pushover analysis curves
The general contrast between the approaches compared in the study can be observed from
the graph above. Until the roof displacement measures about 3% of the total building height
(0.66 m), the three frames behave similarly, but after that displacement limit the strength and
stiffness deterioration of the material in the lumped plasticity model starts influencing the push-
over curve and the base shear capacity of the investigated frame starts decreasing.
4 CONCLUDING REMARKS
Eventually, the lumped and distributed plasticity models’ drift demands vary differently at
different performance levels investigated. In general, the lumped plasticity model experiences
greater drift demand which might be negligible within the lower loading intensity degrees. The
95

Borjan S. Petreski, Mihail A. Garevski
main difference between the models is evaluated to occur at greater levels of inelasticity repre-
sented with more intense seismic loads and total drift value of around 3% shown in Fig. 3. That
value presents the global frame’s stiffness degradation zone when the strength and stiffness
deterioration property of the lumped plasticity hinge regions occurs.
Figure 3. Comparison of floor drift distribution along the height at 350% intensity level (MH)
Model Total frame drift (%) Total frame displacement (m)
Distributed
2.71226000
0.597
Lumped
3.02523857
0.666
Table 1. Comparison of total frame drift at 350% intensity level (MH)
In the end, general compliance of the models with previous study parameters and design
codes provisions is observed. The elastic behaviour of the structure satisfies the European code
limitations which it is being designed for. Also, based on FEMA 273 recommendations [6] the
MH and HH frames fit in the same performance level classes for the equivalent intensity level
transient analyses according to the maximum and residual drift limit indicators.
REFERENCES
[1] A. Elghazouli, Assessment of European seismic design procedures for steel framed struc-
tures. Bulletin of Earthquake Engineering. 8 (1), 65-89, 2010.
[2] M. Kumar, P. Stafford, A. Elghazouli, Influence of ground motion characteristics on drift
demands in steel moment frames designed to Eurocode 8. Engineering Structures. 52,
502-517, 2013.
[3] OpenSees – OpenSees Version 2.4.3., http://opensees.berkeley.edu/index.php, 2015.
[4] L. F. Ibarra, R. A. Medina, H. Krawinkler, Hysteretic models that incorporate strength
and stiffness deterioration. Earthquake Engineering and Structural Dynamics. 34 (12),
1489-1512, 2005.
[5] D. G. Lignos, H. Krawinkler. Deterioration modeling of steel components in support of
collapse prediction of steel moment frames under earthquake loading. Journal of Struc-
tural Engineering 137.11: 1291-1302, 2010.
[6] ATC. Seismic Performance Assessment of Buildings, 90% Draft. ATC-58-1, Applied
Technology Council edition. Redwood City, California, 2011.
96

OpenSees Days Europe 2017
1st European Conference on OpenSees
Porto, Portugal, 19–20 June 2017
ASSESSMENT OF THE SEISMIC PERFORMANCE OF STEEL
FRAMES USING OPENSEES
Sara Oliveira1, Filippo Gentili1, Ashkan Shahbazian1, Hugo Augusto1, Ricardo Costa1,
Carlos Rebelo1, Yukihiro Harada2 and Luís Simões da Silva1
1 ISISE, Department of Civil Engineering, University of Coimbra, Portugal
Rua Luís Reis Santos - Pólo II, Coimbra, Portugal
e-mail: [email protected]
{filippo.gentili, shahbazian}@uc.pt
{hugo.augusto, rjcosta, crebelo, luisss}@dec.uc.pt
2 Department of Architecture, Chiba University, Japan
1-33 Yayoi, Inage, Chiba, Japan
e-mail: [email protected]
Keywords: steel structures, beam-to-column joints, component method, macro-elements, dual
concentrically braced frames, OpenSees.
Abstract. The prediction of the behavior of beam-to-column steel joints is an important task in
order to achieve economical and sustainable structures. The steel joints play a crucial role in
the overall seismic behavior of steel frame structures, since the deformations in the panel zone
of the beam-to-column joint region significantly affect the seismic behavior of steel joints.
Therefore, an accurate modelling of the beam-to-column joint is essential. This paper aims at
assessing the seismic performance of Dual Concentrically Braced Frames (D-CBF) through
static and incremental dynamic nonlinear analyses. The parametric study was carried out on
ten D-CBF where structural properties as number of stores, number of bays and the length
span were varied. The analyses were implemented in OpenSEES using appropriate models for
the nodal zones.
97

Sara Oliveira et al.
1 INTRODUCTION
The RFCS project EQUALJOINTS (European Commission Directorate General for Re-
search and Innovation) has been carried out research on the seismic behavior of steel beam-to-
column joints at European level, aimed at predicting deformation capacity and cyclic perfor-
mance of certain connections typologies commonly used in Europe. The dual concentrically
braced frames (D-CBF) are one of the typical frames selected to study and estimate the seismic
demand of the semi-rigid partial strength joints in the European project and presented in this
paper.
This paper briefly describes the estimation of the seismic demand of the semi-rigid partial
strength joint in typical D-CBF on bases of non-linear static analysis (pushover analysis) and
nonlinear time history analysis. Numerical models were created by Gentili et al. [1] in order to
perform the analysis using Open System for Earthquake Engineering Simulation (OpenSees)
[2]. This paper presents the modelling alternative in which the internal node joints are repre-
sented by a “scissor”-type model.
2 SIMPLIFIED NUMERICAL MODELS
2.1 Parametric study on D-CBF
A parametric study was carried out only considering the scissor model (see right side of
Figure 1) for ten D-CBF studied to cover various structural configuration with different number
of stories and bays and length of spans (presented in Table 1). The D-CBF were designed within
the scope of the EQUALJOINTS projects with the following aspects considered in the design:
(i) an inverted “V” (Chevron) configuration was chosen, (ii) the dual frame was designed using
a behavior factor q=2.5 and (iii) square hollow sections were selected for the braces. Also,
according to EN 1993-1-1 [3], member strength and stability verifications were performed for
the seismic action effects defined in EN 1998-1 [4].
The D-CBF (see left side of Figure 1) were designed with braces located at the central bay
of each frame for both the 3-bay and the 5-bay frame configurations. For each configuration,
the following joint typologies were considered: (i) EH-S: Full-strength with strong panel zone,
(ii) ES-B-E: Equal-strength with balanced panel zone, (iii) E-B-P(0.6): Partial-strength with
balanced panel zone, and (iv) E-B-P(0.8): Partial-strength with weak panel zone.
Frame Name Structural Configuration
D-CBF-6-3-6-MH-a D-CBF, 6-storey, 3-bay, 6m span, PGA=0.25g
D-CBF-6-3-6-HH-a D-CBF, 6-storey, 3-bay, 6m span, PGA=0.35g
D-CBF-6-3-8-MH-a D-CBF, 6-storey, 3-bay, 8m span, PGA=0.25g
D-CBF-6-3-8-HH-a D-CBF, 6-storey, 3-bay, 8m span, PGA=0.35g
D-CBF-6-5-6-HH-a D-CBF, 6-storey, 5-bay, 6m span, PGA=0.35g
D-CBF-12-3-6-MH-a D-CBF, 12-storey, 3-bay, 6m span, PGA=0.25g
D-CBF-12-3-6-HH-a D-CBF, 12-storey, 3-bay, 6m span, PGA=0.35g
D-CBF-12-3-8-MH-a D-CBF, 12-storey, 3-bay, 8m span, PGA=0.25g
D-CBF-12-3-8-HH-a D-CBF, 12-storey, 3-bay, 8m span, PGA=0.35g
D-CBF-12-5-6-HH-a D-CBF, 12-storey, 5-bay, 6m span, PGA=0.35g
Table 1: Designed dual concentrically-braced frames (D-CBF) [1].
The connection springs representing the connection were assumed to have with an elastic-
plastic behavior with 1% post-yield hardening. The plastic rotation capacity of the connection
component pre-capping was assumed to be 18 mrad (ASCE 21-13, Table 9-6, yield bolts, 2014).
In OpenSees the connection behavior was implemented by assigning a Bilin material (modified
98
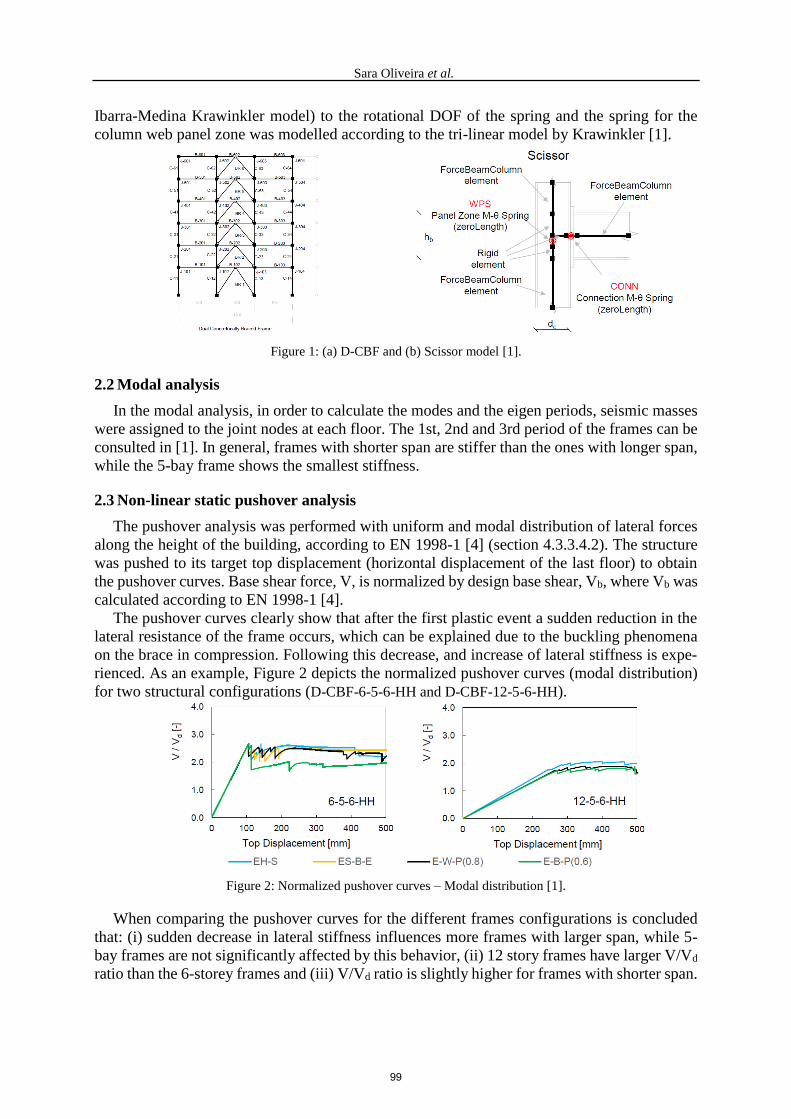
Sara Oliveira et al.
Ibarra-Medina Krawinkler model) to the rotational DOF of the spring and the spring for the
column web panel zone was modelled according to the tri-linear model by Krawinkler [1].
Figure 1: (a) D-CBF and (b) Scissor model [1].
2.2 Modal analysis
In the modal analysis, in order to calculate the modes and the eigen periods, seismic masses
were assigned to the joint nodes at each floor. The 1st, 2nd and 3rd period of the frames can be
consulted in [1]. In general, frames with shorter span are stiffer than the ones with longer span,
while the 5-bay frame shows the smallest stiffness.
2.3 Non-linear static pushover analysis
The pushover analysis was performed with uniform and modal distribution of lateral forces
along the height of the building, according to EN 1998-1 [4] (section 4.3.3.4.2). The structure
was pushed to its target top displacement (horizontal displacement of the last floor) to obtain
the pushover curves. Base shear force, V, is normalized by design base shear, Vb, where Vb was
calculated according to EN 1998-1 [4].
The pushover curves clearly show that after the first plastic event a sudden reduction in the
lateral resistance of the frame occurs, which can be explained due to the buckling phenomena
on the brace in compression. Following this decrease, and increase of lateral stiffness is expe-
rienced. As an example, Figure 2 depicts the normalized pushover curves (modal distribution)
for two structural configurations (D-CBF-6-5-6-HH and D-CBF-12-5-6-HH).
Figure 2: Normalized pushover curves – Modal distribution [1].
When comparing the pushover curves for the different frames configurations is concluded
that: (i) sudden decrease in lateral stiffness influences more frames with larger span, while 5-
bay frames are not significantly affected by this behavior, (ii) 12 story frames have larger V/Vd
ratio than the 6-storey frames and (iii) V/Vd ratio is slightly higher for frames with shorter span.
99

Sara Oliveira et al.
2.4 Incremental dynamic analysis
In order to evaluate the inelastic behavior the frames, an incremental dynamic analysis (IDA)
was carried out for two sets of 7 acceleration records. The acceleration records were extracted
from PEER NGA database, from European and Middle East events. The first set of 7 records
represents medium seismic hazard (MH) using the following criteria: magnitude M from 5.0 to
6.5, distance fault 10 to 100 km and target spectrum with PGA0=0.25 g. The second set of 7
records represents a high seismic hazard (HH) using the following criteria: magnitude M higher
than 6.5, distance fault from 20 to 100 km target spectrum with PGA0=0.35 g. for both cases
was considered a shear wave velocity from 180 to 800 m/s, EN 1998-1 Type 1 Soil C and
minimization of DRMS over a period range from 0.2 to 2.0 s. Verifications were carried out for
the three limit states: Damage Limitation, Significant Limitation and Near Collapse intensity.
The local behavior of DCBFs is analyzed in terms of maximum (i) connection rotation, (ii)
panel rotation and (iii) beam rotation. The values are compared with threshold proposed in
ASCE 41-13 in each limit state, which revealed that although the observed beam rotation satis-
fies always the criteria, the seismic demand for the connections is too high for many frames
with 12 stories. As an example, the IDA curves for interstory drift ratio vs. ground motion
intensity level are presented, in Figure 3, for two structural configurations (D-CBF-6-5-6-HH and
D-CBF-12-5-6-HH).
Figure 3: IDA curves in terms of max interstory drift ration for D-CBF [1].
3 CONCLUSIONS
In this paper, s parametric study was carried out aimed to assess the behavior and the seismic
demand on beam-to-column steel joints of typical frame typologies, the D-CBF. Ten D-CBF
with different values of selected parameters, such as, the level of seismic hazard, building height,
span length and number of bays. The parametric study was performed through a pushover and
dynamic analysis.
REFERENCES
[1] F. Gentili, A. Shahbazian, C. Rebelo L. Simões da Silva, The role of joint modelling on
the seismic performance of steel frames. Journal of Constructional Steel Research, (sub-
mitted in 11.10.2016).
[2] F. McKenn, G Fenves, M Scott, B. Jeremic, Open System for Earthquake Engineering
Simulation (OpenSees). Pacific Earthquake Engineering Research Center, UCA, 2000.
[3] CEN, EN 1993-1-8. Eurocode 3: Design of steel structures, Part 1-8. Design of joints.
European Committee for Standardisation, Brussels: 133, 2005.
[4] CEN, EN 1998-1. Eurocode 8 – Design of structures for earthquake resistance. Part 1:
General rules, seismic actions and rules for buildings. European Committee for Stand-
ardisation, Brussels, 2004.
100

OpenSees Days Europe 2017
1st European Conference on OpenSees
Porto, Portugal, 19–20 June 2017
DEVELOPMENT OF AN OPENSEES MODEL FOR COLLAPSE RISK
ASSESSMENT OF ITALIAN-CODE-CONFORMING STEEL SINGLE-
STOREY BUILDINGS
F. Scozzese1, A. Zona1, A. Dall’Asta1
1 University of Camerino
School of Architecture and Design, Viale della Rimembranza, 63100 Ascoli Piceno, Italy
{fabrizio.scozzese, alessandro.zona, andrea.dallasta}@unicam.it
Keywords: Steel Structures, Nonlinear Static and Dynamic Analyses, Concentric Brace Mod-
els, Buckling Modelling, Second Order Effects, Seismic Risk.
Abstract. This paper aims at evaluating the risk of collapse in single-storey steel buildings
designed according to the current Italian Seismic Design Code. A set of case studies made by
buildings having different geometries and located in sites having different seismic hazard is
modelled and subsequently analysed within the OpenSees software framework. An accurate
structural model is developed and an insight into the main modelling aspects is given, in order
to share with the OpenSees community the main modelling strategies adopted. The model de-
veloped here accounts for both mechanical and geometrical nonlinearities: the former by adopt-
ing a distributed plasticity model for beams, columns, and concentric braces; the latter by using
a corotational coordinates transformation for all the elements. The out-of-plane buckling phe-
nomenon on compressed lateral bracing systems is simulated by assigning proper local imper-
fections (i.e., initial curvature) to the braces and including the gusset plates deformability and
relevant post-elastic behaviour. Since the seismic design follows capacity design principles,
hysteretic behaviour of the joints is not considered as joints are no-dissipative elements. In
addition, due to the geometry of beams, columns and braces, yielding in shear is excluded and
a linear elastic behaviour in shear is used in the model. Push-Over analyses are used for a pre-
liminary evaluation of the nonlinear behaviour under increasing horizontal loads. Afterwards,
multi-record incremental dynamic analyses are performed for 10 increasing seismic intensities.
101
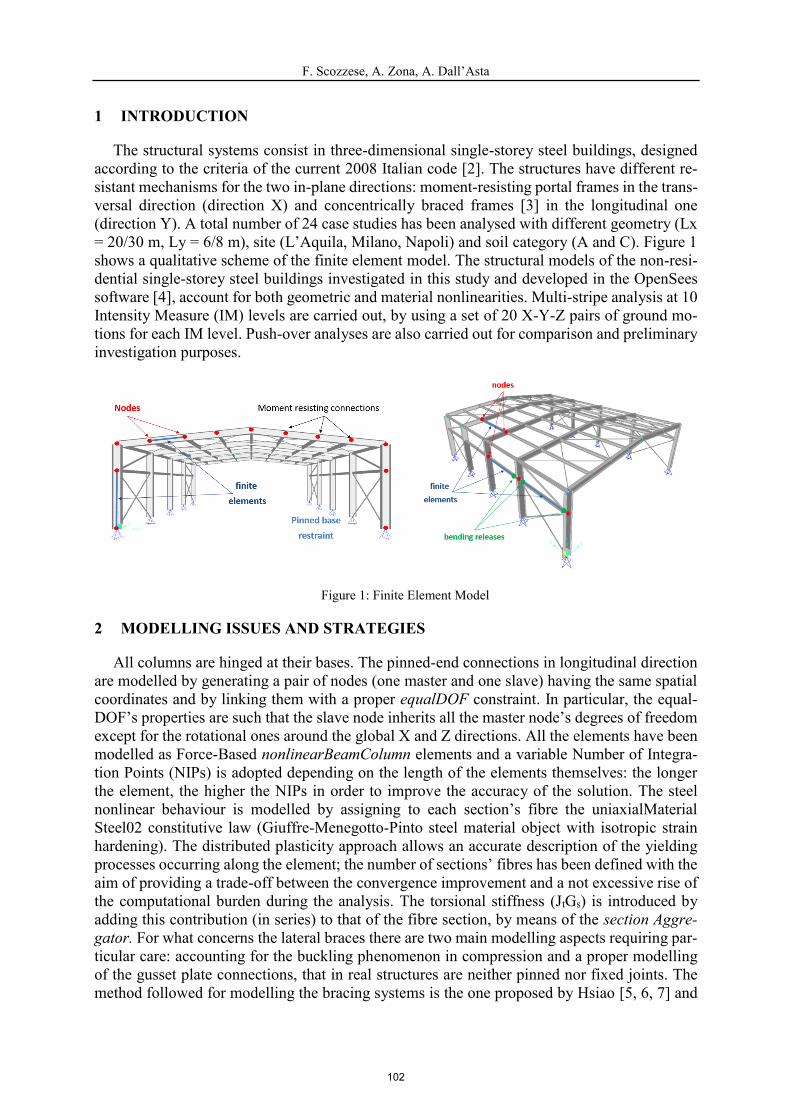
F. Scozzese, A. Zona, A. Dall’Asta
1 INTRODUCTION
The structural systems consist in three-dimensional single-storey steel buildings, designed
according to the criteria of the current 2008 Italian code [2]. The structures have different re-
sistant mechanisms for the two in-plane directions: moment-resisting portal frames in the trans-
versal direction (direction X) and concentrically braced frames [3] in the longitudinal one
(direction Y). A total number of 24 case studies has been analysed with different geometry (Lx
= 20/30 m, Ly = 6/8 m), site (L’Aquila, Milano, Napoli) and soil category (A and C). Figure 1
shows a qualitative scheme of the finite element model. The structural models of the non-resi-
dential single-storey steel buildings investigated in this study and developed in the OpenSees
software [4], account for both geometric and material nonlinearities. Multi-stripe analysis at 10
Intensity Measure (IM) levels are carried out, by using a set of 20 X-Y-Z pairs of ground mo-
tions for each IM level. Push-over analyses are also carried out for comparison and preliminary
investigation purposes.
Figure 1: Finite Element Model
2 MODELLING ISSUES AND STRATEGIES
All columns are hinged at their bases. The pinned-end connections in longitudinal direction
are modelled by generating a pair of nodes (one master and one slave) having the same spatial
coordinates and by linking them with a proper equalDOF constraint. In particular, the equal-
DOF’s properties are such that the slave node inherits all the master node’s degrees of freedom
except for the rotational ones around the global X and Z directions. All the elements have been
modelled as Force-Based nonlinearBeamColumn elements and a variable Number of Integra-
tion Points (NIPs) is adopted depending on the length of the elements themselves: the longer
the element, the higher the NIPs in order to improve the accuracy of the solution. The steel
nonlinear behaviour is modelled by assigning to each section’s fibre the uniaxialMaterial
Steel02 constitutive law (Giuffre-Menegotto-Pinto steel material object with isotropic strain
hardening). The distributed plasticity approach allows an accurate description of the yielding
processes occurring along the element; the number of sections’ fibres has been defined with the
aim of providing a trade-off between the convergence improvement and a not excessive rise of
the computational burden during the analysis. The torsional stiffness (JtGs) is introduced by
adding this contribution (in series) to that of the fibre section, by means of the section Aggre-
gator. For what concerns the lateral braces there are two main modelling aspects requiring par-
ticular care: accounting for the buckling phenomenon in compression and a proper modelling
of the gusset plate connections, that in real structures are neither pinned nor fixed joints. The
method followed for modelling the bracing systems is the one proposed by Hsiao [5, 6, 7] and
102

F. Scozzese, A. Zona, A. Dall’Asta
consist in simulating the nonlinear out-of-plane rotational behaviour of the gusset plate connec-
tions by means of a rotational nonlinear spring located at the physical end of the brace. The
nonlinear spring is modelled in OpenSees through a zero-length element having the out-of-
plane rotational degree of freedom represented by a Steel02 material with properly calibrated
properties. In order to simulate the buckling of the lateral braces during the compression phases,
each brace is discretized into a certain number of nonlinear (with distributed plasticity) sub-
elements and a sinusoidal curvature is assigned by modifying parametrically the coordinates of
the nodes of the intermediate sub-elements (see Figure 2). This initial curvature, representing
the local imperfection of the diagonal brace, has the role of triggering the buckling by furnishing
a preferential buckling shape to the element. The value of the initial imperfection is chosen in
such a way to furnish a buckling axial force consistent with the ultimate value Nb,Rd provided
by the Italian code of practice [1, 2] (i.e., 1
,M
y
Rdb
fAN
)
Figure 2: X brace NL springs and sub-elements and initial imperfections
3 NONLINEAR ANALYSIS: MAIN RESULTS
3.1 Push-Over analysis
A preliminary investigation of the nonlinear lateral behaviour of the structure is carried out
by means of nonlinear static analysis (push-over). As shown in Figure 3, the model developed
in OpenSees experiences both wide excursions in the steel post yielding range and buckling
with significant global post-elastic stiffness reduction.
Capacity curve Push-Over Y Deformed configuration: lateral view N- curve for X-cut-brace
Figure 3: system deformation and N- curve for the compressed X-cut-brace for the case of analysis PO Y.
3.2 Incremental Dynamic Analysis
The results of the incremental dynamic analysis confirm the significant excursions in the
nonlinear range as for example shown in Figure 4, where the two results are related to an IM=8
seismic event: cyclic response for a cut X-brace and the corresponding gusset plate Moment-
Rotation plot. The fact that the gusset plate undergoes plastic deformations is in witness of the
need of its inclusion in the model in order to properly account for both buckling and second
order effects.
103
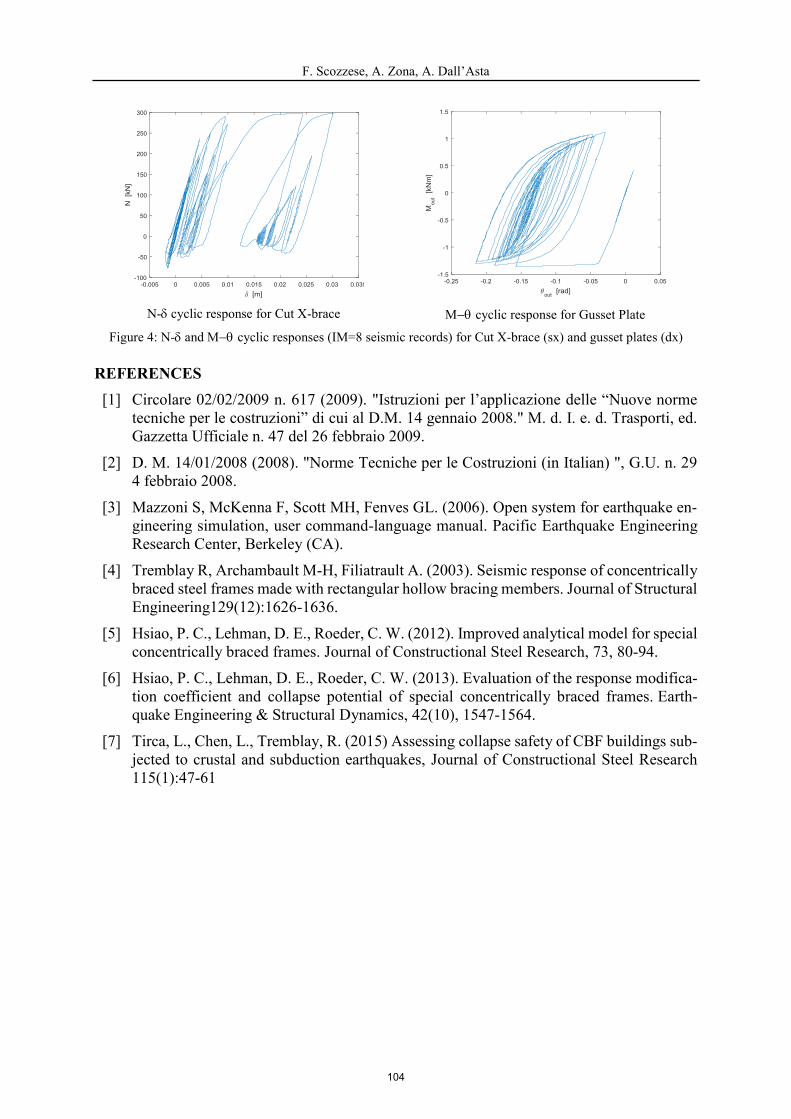
F. Scozzese, A. Zona, A. Dall’Asta
N- cyclic response for Cut X-brace cyclic response for Gusset Plate
Figure 4: N- and cyclic responses (IM=8 seismic records) for Cut X-brace (sx) and gusset plates (dx)
REFERENCES
[1] Circolare 02/02/2009 n. 617 (2009). "Istruzioni per l’applicazione delle “Nuove norme
tecniche per le costruzioni” di cui al D.M. 14 gennaio 2008." M. d. I. e. d. Trasporti, ed.
Gazzetta Ufficiale n. 47 del 26 febbraio 2009.
[2] D. M. 14/01/2008 (2008). "Norme Tecniche per le Costruzioni (in Italian) ", G.U. n. 29
4 febbraio 2008.
[3] Mazzoni S, McKenna F, Scott MH, Fenves GL. (2006). Open system for earthquake en-
gineering simulation, user command-language manual. Pacific Earthquake Engineering
Research Center, Berkeley (CA).
[4] Tremblay R, Archambault M-H, Filiatrault A. (2003). Seismic response of concentrically
braced steel frames made with rectangular hollow bracing members. Journal of Structural
Engineering129(12):1626-1636.
[5] Hsiao, P. C., Lehman, D. E., Roeder, C. W. (2012). Improved analytical model for special
concentrically braced frames. Journal of Constructional Steel Research, 73, 80-94.
[6] Hsiao, P. C., Lehman, D. E., Roeder, C. W. (2013). Evaluation of the response modifica-
tion coefficient and collapse potential of special concentrically braced frames. Earth-
quake Engineering & Structural Dynamics, 42(10), 1547-1564.
[7] Tirca, L., Chen, L., Tremblay, R. (2015) Assessing collapse safety of CBF buildings sub-
jected to crustal and subduction earthquakes, Journal of Constructional Steel Research
115(1):47-61
104

OpenSees Days Europe 2017
1st European Conference on OpenSees Porto, Portugal, 19–20 June 2017
Evaluating the use of OpenSees for Lifetime Seismic Performance
Assessment of Steel Frame Structures
John Hickey1, Brian Broderick
2, and Terence Ryan
3
1 Department of Civil, Structural& Environmental Engineering, Trinity College Dublin
e-mail: [email protected]
2 Department of Civil, Structural& Environmental Engineering, Trinity College Dublin
3 Department of Civil Engineering and Materials Science, University of Limerick
Keywords: Concentrically Braced Frame, Lifetime Seismic Performance Assessment,
Behaviour Factor, Model Validation
Abstract. The overall aim of this work is to examine the influence of structural design
procedure on the lifetime seismic performance of steel Concentrically Braced Frames
(CBFs). Under dissipative seismic design principles, bracing members are allowed to behave
inelastically under infrequent, high-intensity earthquakes; in Eurocode 8 based design the
extent of this inelasticity is effectively controlled by the behaviour factor, q. Increasing the
behaviour factor results in greater ductility demand and structural damage, however doing
so allows for reduced member sizes and consequently lower initial costs. As CBFs designed
in accordance with modern codes are unlikely to collapse but may experience significant
damage at various hazard levels, a comprehensive lifetime seismic performance assessment
procedure is required to compare the full costs of different frame designs. This paper focuses
on the structural analysis section of this procedure, in particular the ability of OpenSees to
capture the complex cyclic response of CBFs. The modelling assumptions made are assessed
using results from a series of shake table tests on a full-scale model CBF. The impact of these
modelling assumptions, and the resulting inaccuracies, on the performance assessment
procedure is then investigated. Finally, the lifetime seismic performances of a set of case
study CBFs designed to Eurocode 8 using various behaviour factors are evaluated. It is
shown that expected repair costs and downtime increase with the design value of the
behaviour factor.
105
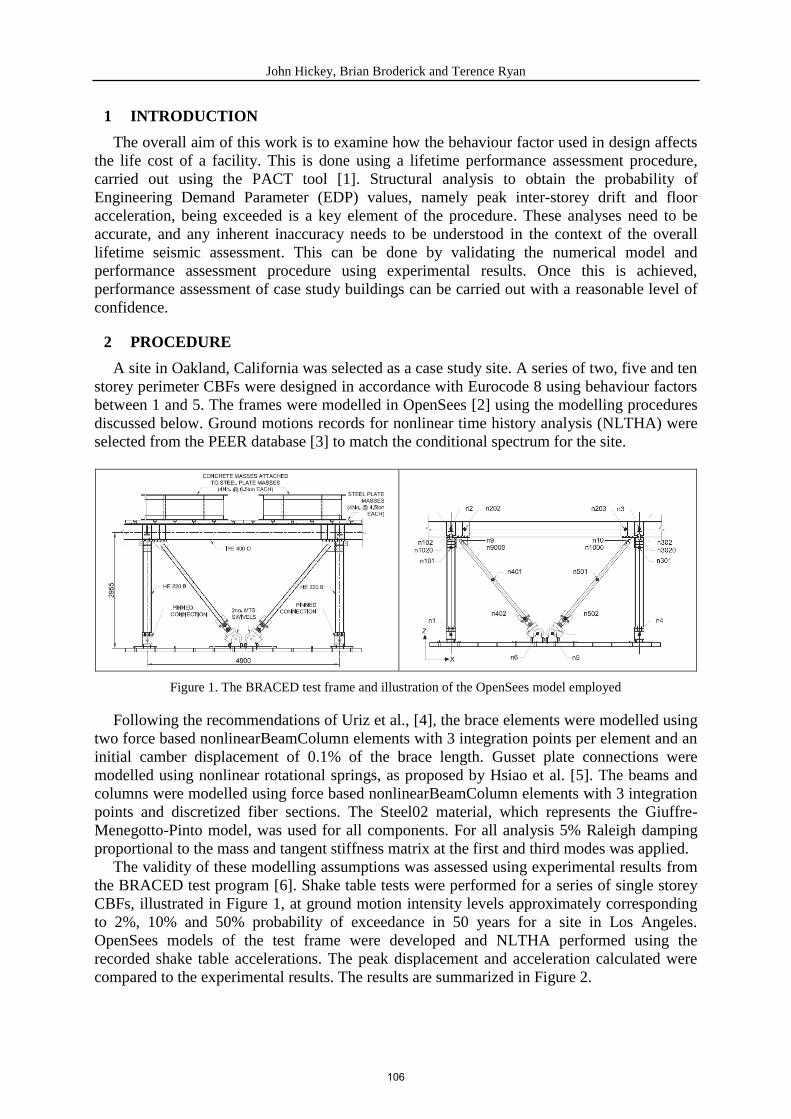
John Hickey, Brian Broderick and Terence Ryan
1 INTRODUCTION
The overall aim of this work is to examine how the behaviour factor used in design affects
the life cost of a facility. This is done using a lifetime performance assessment procedure,
carried out using the PACT tool [1]. Structural analysis to obtain the probability of
Engineering Demand Parameter (EDP) values, namely peak inter-storey drift and floor
acceleration, being exceeded is a key element of the procedure. These analyses need to be
accurate, and any inherent inaccuracy needs to be understood in the context of the overall
lifetime seismic assessment. This can be done by validating the numerical model and
performance assessment procedure using experimental results. Once this is achieved,
performance assessment of case study buildings can be carried out with a reasonable level of
confidence.
2 PROCEDURE
A site in Oakland, California was selected as a case study site. A series of two, five and ten
storey perimeter CBFs were designed in accordance with Eurocode 8 using behaviour factors
between 1 and 5. The frames were modelled in OpenSees [2] using the modelling procedures
discussed below. Ground motions records for nonlinear time history analysis (NLTHA) were
selected from the PEER database [3] to match the conditional spectrum for the site.
Figure 1. The BRACED test frame and illustration of the OpenSees model employed
Following the recommendations of Uriz et al., [4], the brace elements were modelled using
two force based nonlinearBeamColumn elements with 3 integration points per element and an
initial camber displacement of 0.1% of the brace length. Gusset plate connections were
modelled using nonlinear rotational springs, as proposed by Hsiao et al. [5]. The beams and
columns were modelled using force based nonlinearBeamColumn elements with 3 integration
points and discretized fiber sections. The Steel02 material, which represents the Giuffre-
Menegotto-Pinto model, was used for all components. For all analysis 5% Raleigh damping
proportional to the mass and tangent stiffness matrix at the first and third modes was applied.
The validity of these modelling assumptions was assessed using experimental results from
the BRACED test program [6]. Shake table tests were performed for a series of single storey
CBFs, illustrated in Figure 1, at ground motion intensity levels approximately corresponding
to 2%, 10% and 50% probability of exceedance in 50 years for a site in Los Angeles.
OpenSees models of the test frame were developed and NLTHA performed using the
recorded shake table accelerations. The peak displacement and acceleration calculated were
compared to the experimental results. The results are summarized in Figure 2.
106

John Hickey, Brian Broderick and Terence Ryan
The impact of these modelling inaccuracies on lifetime performance assessment was then
examined. Using PACT, performance assessment was carried out for a single-storey building
with the BRACED test frame as the seismic resisting element. This was done using EDPs
obtained from the experimental testing program and from the OpenSees NLTHA. It was
demonstrated that the use of the numerically-calculated EDPs led to expected repair and
downtime costs being underestimated relative to the costs obtained using the experimental
EDPs. In PACT, a factor, βm, can be included to account for uncertainty in structural
modelling. Put simply, this works by increasing the standard deviation of the distribution used
in the PEER equation to assess the performance. When the recommended βm value of 0.5 is
included in the assessment for the numerical EDPs, the performance metrics estimated using
the numerical and experimental EDPs are similar, as illustrated in Table 1.
Figure 2. Ratio of numerically calculated EDPs from OpenSEES to experimental EDPs for seven shake table
tests from the BRACED project: (a) peak drift, (b) peak acceleration
Input EDPs
Modelling
Uncertainty
Factor: βm
Annualized
Repair
Cost
($/ft2)
Annualized
Downtime
(Days)
Numerical 0 0.823 0.93
Numerical 0.5 0.907 1.08
Experimental 0 0.938 1.13
Table 1: Performance assessment results for the BRACED test frame obtained from PACT
3 SUMMARY OF RESULTS
Figure 3. Median values of (a) Peak Inter-storey Drift, (b) Peak Floor Acceleration, for 5 storey CBFs at each
intensity level recorded from time history analysis.
107
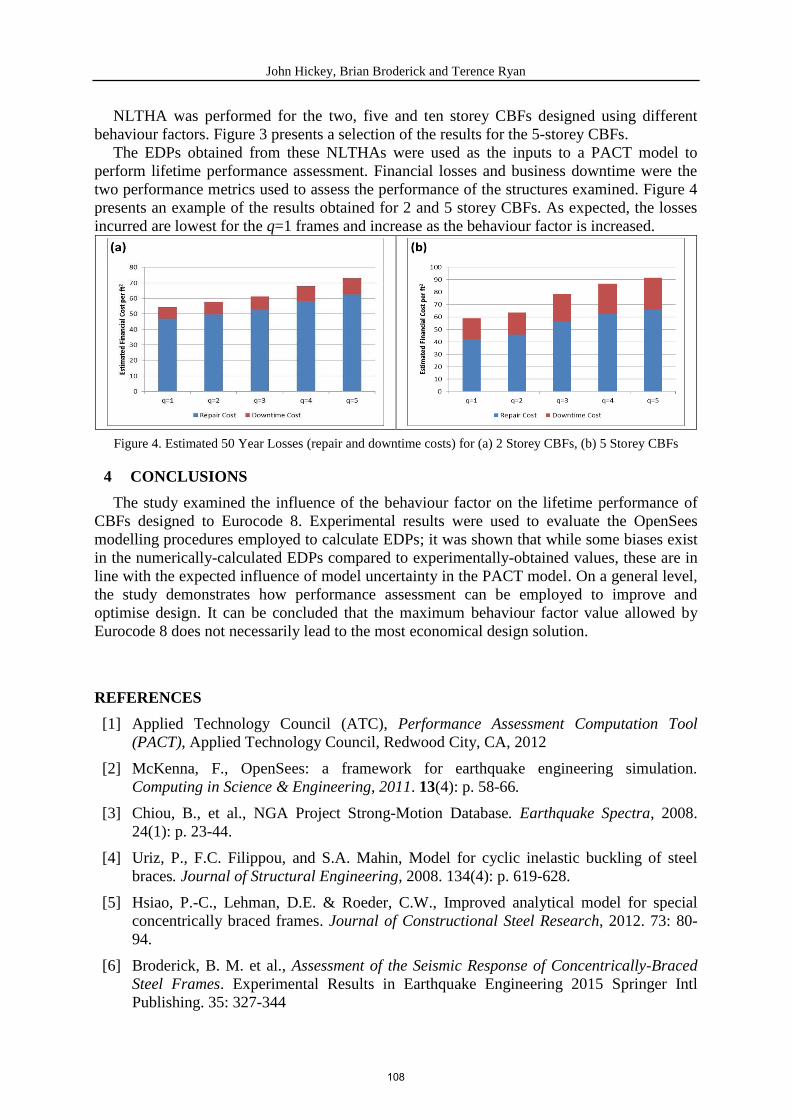
John Hickey, Brian Broderick and Terence Ryan
NLTHA was performed for the two, five and ten storey CBFs designed using different
behaviour factors. Figure 3 presents a selection of the results for the 5-storey CBFs.
The EDPs obtained from these NLTHAs were used as the inputs to a PACT model to
perform lifetime performance assessment. Financial losses and business downtime were the
two performance metrics used to assess the performance of the structures examined. Figure 4
presents an example of the results obtained for 2 and 5 storey CBFs. As expected, the losses
incurred are lowest for the q=1 frames and increase as the behaviour factor is increased.
Figure 4. Estimated 50 Year Losses (repair and downtime costs) for (a) 2 Storey CBFs, (b) 5 Storey CBFs
4 CONCLUSIONS
The study examined the influence of the behaviour factor on the lifetime performance of
CBFs designed to Eurocode 8. Experimental results were used to evaluate the OpenSees
modelling procedures employed to calculate EDPs; it was shown that while some biases exist
in the numerically-calculated EDPs compared to experimentally-obtained values, these are in
line with the expected influence of model uncertainty in the PACT model. On a general level,
the study demonstrates how performance assessment can be employed to improve and
optimise design. It can be concluded that the maximum behaviour factor value allowed by
Eurocode 8 does not necessarily lead to the most economical design solution.
REFERENCES
[1] Applied Technology Council (ATC), Performance Assessment Computation Tool
(PACT), Applied Technology Council, Redwood City, CA, 2012
[2] McKenna, F., OpenSees: a framework for earthquake engineering simulation.
Computing in Science & Engineering, 2011. 13(4): p. 58-66.
[3] Chiou, B., et al., NGA Project Strong-Motion Database. Earthquake Spectra, 2008.
24(1): p. 23-44.
[4] Uriz, P., F.C. Filippou, and S.A. Mahin, Model for cyclic inelastic buckling of steel
braces. Journal of Structural Engineering, 2008. 134(4): p. 619-628.
[5] Hsiao, P.-C., Lehman, D.E. & Roeder, C.W., Improved analytical model for special
concentrically braced frames. Journal of Constructional Steel Research, 2012. 73: 80-
94.
[6] Broderick, B. M. et al., Assessment of the Seismic Response of Concentrically-Braced
Steel Frames. Experimental Results in Earthquake Engineering 2015 Springer Intl
Publishing. 35: 327-344
108

OpenSees Days Europe 2017 1st European Conference on OpenSees
Porto, Portugal, 19–20 June 2017
BLIND TEST PREDICITON OF AN INFILLED RC BUILDING WITH OPENSEES
Hugo Rodrigues1, André Furtado2A, António Arêde2Band Humberto Varum2C, Marin Grubnisic3A and Tanja Sipos3B
1 RISCO – School of Management and Technology, Polytechnique Institute of Leiria Leiria, Portugal
2 CONSTRUCT-LESE, Faculty of Engineering of University of Porto Porto, Portugal
e-mail: A: [email protected]; B: [email protected]; C: [email protected]
3 University of Osijek, Faculty of Civil Engineering Osijek, Osijek, Croatia
e-mail: A: [email protected]; B: [email protected]
Keywords: Blind Prediction, infilled RC structures, Seismic behaviour, Numerical modelling.
Abstract. Over the last years the seismic behaviour of infilled reinforced concrete (RC) struc-tures have been focus of innumerous experimental and numerical studies. A big effort is being made by the scientific community with the aim of increase the knowledge regarding the seismic response of these type of structures and improve the numerical modelling accuracy to predict their expected behaviour. In 2015, a blind prediction contest was organized by the Faculty of Civil Engineering Osijek with main goal of invite the technical and scientific community to predict the nonlinear seismic behaviour of a 1:2.5 scaled 3D building structure. The three-storey infilled RC structure was subjected to ten incremental earthquake sequence on a shake table test. The blind numerical analyses were performed knowing only the specimen geometry, reinforcement detailing, material characteristics and the actual ground motions recorded dur-ing the testing. In this context and, in view of the author’s participation success, the present paper mainly aims at presenting the key aspects of the adopted numerical methodology (and related difficulties) which proved to yield good results, while also providing some insight re-garding key problems in numerical simulations of infilled RC structures seismic behaviour.
109

Hugo Rodrigues, André Furtado, António Arêde, Humberto Varum, Marin Grubnisic and Tanja Sipos
1 INTRODUCTION
In the context of seismic scientific testing works developed in the last years and in particular resorting to shaking tables, which usually happens with the objective of providing additional information not available from simpler experimental tests. In 2015, the FRAmed–Masonry Composites for Modeling and Standardization (FRAMA) Blind Prediction Contest 2014 [1] pretended to evaluate different modelling strategies proposed by different international teams/experts that were challenged to predict the experimental response of a scaled three storey infilled RC structure that will be subjected to ten increased and scaled ground motions where the authors team became in the first position. This paper aims at describing the modelling strat-egy adopted by the authors namely in terms of the RC structure and infill masonry walls mod-elling. Along the manuscript it will be discussed the aspects which are both critical and difficult to evaluate, regarding a three storey RC structure seismic behaviour. Along the present manu-script, the global teams’ blind prediction results will be presented.
2 EXPERIMENTAL CAMPAIGN
2.1 Specimen description
The experimental program associated with the FRAMA Blind Prediction Contest [10] initi-ative was performed in DYNLAB at IZIIS shaking table with the support of University of Osi-jek (Croatia) and is briefly described in this chapter. It basically involved of a 1:2.5 scaled infilled RC structure (Figure 1) under uniaxial ground motions with increasing intensity. The shake-table test specimen was a 1:2.5 scale model that contains two parallel connected planar frames, with two bays and three storeys, making the structure of the gross dimensions of 4.6 m in length, 2.8 m in width and 3.9 m in height. The RC structured is filled with masonry walls with openings in certain bays. The structure has been designed for medium ductility levels ac-cording to the EC8 provisions
Figure 1 – 3 storey masonry-infilled RC frame and reinforcement details Lateral views.
Thick slabs were added at the floor and roof levels to reproduce the correct gravity mass of the
specimen. These slabs were attached with hinge connections to the transverse beams protruding
from the plane frame, so that they would not introduce unrealistic moment restraints to the RC
frame. Three sets of additional masses will be placed on top of the slab at each floor. Each set
contains four steel ingots with overall dimensions of 23.5×14×150 cm. The specimen was built
from beginning of June till the end of July 2015. The mock–up was cast in–situ in five distinct
phases. First, the foundations were concreted and afterwards columns, beams and slabs at each
floor in fazes two through four. Finally RC frames were filled with hollow clay masonry units.
Concrete reinforcing steel, mortar and masonry samples were taken to characterize their me-
chanical behaviour.
110

Hugo Rodrigues, André Furtado, António Arêde, Humberto Varum, Marin Grubnisic and Tanja Sipos
2.2 Ground motion and test sequences
The specimen was subjected to ten different one-directional ground-motions recorded at the Herceg Novi station during the April 15th, 1979 Montenegro earthquake. The earthquake had a moment magnitude of 6.9 and a hypocentral depth of 12 km. To account for the fact that the structure is constructed at 1:2.5 scale, the record was scaled in time by reducing the duration by a factor 1/√2.5. The record was base line corrected and then scaled to match the different levels of peak ground acceleration (0.05g, 0.10g, 0.20g, 0.30g, 0.40g, 0.60g, 0.70g, 0.80g, 1g, 1.2g) that was used as input signals for the shake table test.
3 MODELLING STRATEGY AND NUMERICAL RESULTS
The authors participated in the FRAMA contest by carrying out an numerical modelling
prediction by using the OpenSees software [2]. Three specific issues were assumed by the au-
thors as important to consider in the numerical modelling process i) consideration of the open-
ings effect in the infills strength and stiffness reduction; b) consideration of the infills out-of-
plane behaviour for the panels distributed in the central alignment along the direction Y-Y; c)
taking into account past numerical and experimental studies carried out by different authors, it
was assumed for the RC a viscous damping of ξ=2%. For the numerical modelling of the RC
elements lumped-plasticity model was applied (with plastic-hinge length equal to the larger
dimension of the elements section). Fiber discretization was assumed to represent the behaviour
at the section level, where each fiber was associated with a uniaxial stress-strain hysteretic be-
haviour. Regarding the infill masonry walls numerical modelling it was adopted the Furtado et
al. proposal [3] as illustrated in Figure 2.
a) b)
Figure 2 – Numerical modelling strategy to represent: (a) infill masonry wall through equivalent double-diagonal strut element (b) RC element modelling using lumped-plasticity element approach.
The prediction of the RC structural elements under an earthquake requires the consideration
of the nonlinearity of the material, namely the uniaxial material stress-strain hysteretic response. For this contest, the authors adopted the uniaxial material model Concrete 02 available on the OpenSees library. The uniaxial model steel 02 was adopted for the steel reinforcement. For the numerical simulation of the non-linear behaviour of infill masonry Furtado et al [3] model was adopted, which is an equivalent double-strut model that is able to represent the in-plane behav-iour of the infill panels with and without openings and the interaction with the out-of-plane behaviour through a removal algorithm. Regarding the infills numerical modelling the authors considered the infills openings by applying a reduction factor of the infills strength capacity and initial stiffness. The authors decided to apply a reduction factor given by the ratio between the openings area and the infill panel area that will reduce the parameters cracking force Fc,
111

Hugo Rodrigues, André Furtado, António Arêde, Humberto Varum, Marin Grubnisic and Tanja Sipos
yielding force Fy, maximum strength Fmax, and initial stiffness K1. The cracking drift (dc) was reduced for 0.05%, yielding drift (dy) for 0.12% and maximum drift dmax to 0.25%. The remain-ing infill panels numerical parameters were determined as suggested by Furtado et al [3] with-out reduction factors. Eighty-one percent of the infill panel mass was considered concentrated in the two central nodes of the numerical model and bending stiffness values were considered. In Figure 3a it is illustrated the comparison between the experimental and numerical relative
displacements of the storey 2 subjected to a ground motion with pga=1g with a good match.
From the ten different intensity levels (0.05g, 0.1g, 0.2g, 0.3g, 0.4g, 0.6g, 0.7g, 0.8g, 1g and
1.2g) simulated, it can be observed in Figure 3b that the error obtained on 5 different levels was
lower than 10 and only for pga=1.2g the error was higher than 30. It is observed that the error
is progressively increasing with the increasing pga demand, however for pga=0.4g the error is
slightly above of those observed before which reach an ErrorE-RMS=11.86. From the analysis of
the error obtained for each displacement in each storey (Figure 3c) it can be observed that the
error obtained in the prediction of the 3rd storey displacement is around 2-2.5 times higher than
the obtained for the 1st storey and 1.25-1.5 times the ones achieved for the 2nd storey.
a)
b)
c)
Figure 3 – Numerical modelling strategy to represent: (a) infill masonry wall through equivalent double-diagonal strut element (b) RC element modelling using lumped-plasticity element approach.
4 CONCLUSIONS
A blind prediction contest of the seismic response of a three storey scaled infilled RC structure that was subjected to ten scaled and progressively increased ground motions was carried out. From this manuscript, it can be concluded that the three different aspects must be given on this type of structures: a) the infills masonry walls contribution in terms of stiffness and strength must be considered; b) consideration of the infill panels openings through the reduction of the infills strength properties and the reduction of the drift parameters in the hysteretic behaviour; c) the viscous damping made an important role in the seismic response of the specimen.
REFERENCES
[1] V. Sigmund, P. Brana, D. Dzakic, M. Galic, G. Gazic, M. Grubisic, et al., "FRAmed–MAsonry Composites for Modeling and Standardization, FRAMA, International Benchmark within Research Project, Faculty of Civil Engineering Osijek, Josip Juraj Strossmayer University of Osijek, Croatia,," 2014.
[2] F. Mckenna, G. Fenves, M. Scott, and B. Jeremic, "Open System for Earthquake Engineering Simulation (OpenSees)," ed. Berkley, CA, 2000.
[3] A. Furtado, H. Rodrigues, A. Arêde, and H. Varum, "Simplified macro-model for infill masonry walls considering the out-of-plane behaviour," Earthquake Engineering & Structural Dynamics, vol. 45, pp. 507-524, 2016.
0 5 10 15 20 25 30 35-60
-50
-40
-30
-20
-10
0
10
20
30
40
50
60Storey Level: 2
ErrorE-RMS
=5.281
ErrorE=0.001
ErrorRMS
=5.280
pga=1g
Re
lative
dis
pla
ce
me
nt
(mm
)
Time (s)
Experimental Numerical
0 1 2 3 4 5 6 7 8 9 10 11
0
5
10
15
20
25
30
Individual ErrorE-RMS
Cumulative ErrorE-RMS
Intensity level
Indiv
idu
al E
rror E
-RM
S
0
50
100
Cum
ula
tive
Err
or E
-RM
S
1 2 3 4 5 6 7 8 9 10
0
2
4
6
8
10
12
14
16
In
div
idu
al E
rro
rE-R
MS
Intensity level
Storey 0-1 Storey 1-2 Storey 2-3
112
OpenSees Days Europe 2017
1st European Conference on OpenSees
Porto, Portugal, 19–20 June 2017
MODELLING IN-PLANE AND OUT-OF-PLANE RESPONSE OF
INFILLED FRAMES THROUGH A FIBER MACRO-MODEL
F. Di Trapani1, P.B. Shing2 and L. Cavaleri3
1Politecnico di Torino
Department of Structural, Geotechnical and Building Engineering
2University of California, San Diego
Department of Structural Engineering
3University of Palermo
Dipartimento di Ingegneria Civile, Ambientale, Aerospaziale, dei Materiali
Keywords: Masonry infills, in-plane, out-of-plane, arching action, macro-model.
Abstract. A new fiber macro-model for the simulation of combined in-plane and out-of plane
response of infilled frames subjected to seismic actions is presented in the paper. The model
consists of 4 pinned struts (two diagonals, one horizontal and one vertical) modeled with the
nonlinear beam/column fiber-section elements available in OpenSees. The model is particu-
larly suitable to predict the out-of-plane response as fiber-section elements can account for
the coupling between axial load and bending moment occurring because of the arching
mechanism developed by the infills beyond the first cracking. Moreover the model can ac-
count for the effect of the reciprocal damaging accumulated both in-plane and out-of-plane
during shakings. The procedure for the identification of the struts is presented in the paper
and is validated with experimental test data from different authors. The proposed model may
be used as a computationally-light and effective tool for the assessment of the response of 3D
structures subjected to ground motions acting in arbitrary directions.
113

F. Di Trapani, P.B. Shing, L. Cavaleri
1 INTRODUCTION
Infill-frame interaction under in-plane (IP) and out-of-plane (OOP) seismic loads is still a debated issue. Different approaches and theories have been proposed to account the presence of infills in structural models. One of the most effective ways is the use of one (or more) equivalent diagonal struts, reproducing stiffening and strengthening action (e.g. [1-3]). Re-search on this topic has been mainly addressed to the evaluation of the in plane response of infilled frames, while the issue of the assessment of the out-of-plane response and its recipro-cal dependence on the in-plane damage is currently not solved in a satisfactory way.
Theoretical and experimental studies [4-6] have shown that masonry infills have signifi-cant out-of-plane resistance because of the arching mechanism, which develops because of the confining action exerted by the boundary frames. From the aforementioned and other studies one can conclude that OOP resistance: depends on the compressive strength of masonry rather than tensile strength; decreases with the square of the slenderness ratio of the infills; depends on a 2-way arching effect. Moreover in-plane and out-of-plane responses are mutually influ-enced as a function the damaging occurred in each direction. In consideration of this most of the analytical expressions proposed to predict the OOP maximum load (qa) of the infill refer to the following proportionality law:
2
t
h
fq m
a (1)
where fm is the compressive strength of masonry and h/t the slenderness ratio of the infill. On the other hand, only a few recent modelling approaches (e.g. [7,8]) have been pro-
posed in order to define an integrated IP-OOP macro-model to use for 3D simulations. The aforementioned modelling approaches have however the limit of using fictitious ex-
pedients to simulate the arching mechanism. In the current paper is proposed the use of fiber-section elements as equivalent struts. An integrated four-strut macro-model is proposed to simultaneously account for in-plane and out-of-plane response of infilled frames. Fiber sec-tion elements can account directly the arching mechanism as the can model the coupling be-tween axial-load and bending moment occurring at the cracked stage of the cross-section. Validation tests with experimental data are finally presented.
2 PROPOSED MACRO-MODEL
The proposed model consists of 4 pinned fiber-section beam-column elements (each one divided in two parts). A scheme of the model is illustrated in Fig. 1. Concrete type (Con-crete02) stress-strain laws are used for the struts. Since the struts have no tension, cracking occur after the elastic stage. Fiber-section elements can account for the coupling between axi-al force and bending moment occurring at the cracked stage and hence for the arching mecha-nism. The diagonal struts are thought to provide the whole in-plane response of the infill and a significant portion of the OOP capacity. The horizontal and vertical struts do not influence the in-plane response but provide a complementary OOP contribution which simulates the 2-way generation of the arching mechanism. The struts do not have a common mid-span node (four different mid-span nodes are defined). Relative displacements are free to occur in x-z plane but all the mid-span nodes are constrained to the same displacement along z direction in such a way that each strut can provide its contribution to the OOP response. The identification of the struts is carried out starting from the definition of the diagonals, which are initially di-mensioned by fixing their width (wd) as 1/3 of the internal diagonal length (a) and their thick-ness as the actual thickness (t). An equivalent stress-strain relationship is instead assigned to the fibers by converting the force-displacement curve resulting for the infilled frame and de-fined as in [9].
114

F. Di Trapani, P.B. Shing, L. Cavaleri
Figure 1: The proposed four-strut macro-model.
In this identification process the peak strength fmd0 of the diagonal strut results generally lower than the actual compressive strength of masonry fm0. This would reduce the OOP strength capacity of the diagonals, since OOP resistance depends on the actual compressive strength. This is compensated by defining the fictitious dimensions d
w~ (surrogate width) and t~
(surrogate thickness) as:
dd
md
m wt
twt
f
ft ~
~;~
0
0 (2)
with the specification that the resulting area of the cross-section remains unchanged.
The horizontal and vertical struts, which provide the residual OOP, have the actual thick-
ness t of the infill and the actual strength fm0 of the masonry. The widths of the two struts are
obtained as the difference of the height and the length of the panel and the horizontal and ver-
tical projections of the diagonals initial width on the infill perimeter.
sin
ww;
cos
whw d
vd
h (3)
The four-strut model defined according to the aforementioned procedure can account
simultaneously IP and OOP response and explicitly considers arching mechanism. Moreover
reciprocal in-plane/out-of-plane damage can be simulated.
3 VALIDATION TESTS
Validation tests were carried out comparing numerical prediction with experimental test
results from different authors. The simulation of the experimental tests was made in OpenSees
[10] after implementing the model with the proposed procedure. A first comparison regarded
tests by Angel (1994) [4] who investigated full-scale, single-story, single-bay reinforced con-
crete frames infilled with different typologies of infills. Specimens were firstly subjected to
in-plane cycles up to first cracking, then an air-bag was used to apply an out-of-plane mono-
tonic pressure. Other validation tests were made with experimental data by Dawe and Seah
(1989) [5] and Flanagan and Bennett (1999) [6] who investigated steel infilled frames. In [4]
no prior in-plane damaging was applied, while in [5] the OOP load was applied cyclically.
For all the tests the comparison between experimental results and OpenSees simulation
have shown the capacity of the model to predict out-of-plane stiffness, ultimate load and dis-
placement capacity. Moreover the proposed model has proved to adequately account also mu-
tual in-plane / out-of-plane damaging effects.
Further tests of the model have also shown that prior in-plane damage delays the capacity
of the infill to gain out-of-plane stiffness, while the out-of-plane maximum load is not sub-
stantially reduced.
115

F. Di Trapani, P.B. Shing, L. Cavaleri
4 CONCLUSIONS
The paper presented a new simplified macro-model for the evaluation of in plane and out-
of-plane responses of infilled frames in seismic simulations. The model consisted of four fi-
ber-section struts (two diagonals, one horizontal, one vertical) opportunely defined. Nonlinear
beam-column elements are able to account for the arching mechanism actually developed by
the infills. Validation tests were carried out comparing numerical predictions with the results
of several experimental tests on reinforced concrete and steel infilled frames. The model has
proved to be a suitable tool, predicting with sufficient accuracy the OOP response of masonry
infills both in terms of stiffness, ultimate load and displacement capacity. The model has also
shown to be particularly accurate in predicting the effect of in-plane damaging to the out-of-
plane response. Results have shown that if in-plane damage occurs previously or simultane-
ously, the stiffening capacity of the panel is delayed but the out-of-maximum resistance is not
significantly reduced.
REFERENCES
[1] R.J. Mainstone, Supplementary note on the stiffness and strength of infilled frames, Build-
ing Research Station, Current Paper CP 13/74, UK.
[2] P.G. Asteris, L. Cavaleri, F. Di Trapani, V. Sarhosis, A macro-modelling approach for the
analysis of infilled frame structures considering the effects of openings and vertical loads,
Structure and Infrastructure Engineering, 12(5), 551-566, 2016.
[3] L. Cavaleri, F. Di Trapani, Cyclic response of masonry infilled RC frames: Experimental
results and simplified modeling, Soil Dyn. and Earthquake Eng., 65, 224–242, 2014.
[4] R. Angel, Behavior of reinforced concrete frames with masonry infill walls. PhD thesis.
University Illinois at Urbana-Champaingn, Illinois, 1994.
[5] J.L. Dawe, C.K. Seah, Out-of-plane resistance of concrete masonry infilled panels, Can. J.
Civ. Eng 16(6), 854-864, 1989.
[6] R.D. Flanagan, R.M. Bennet, Bidirectional behavior of structural clay tile infilled frames.
J. Struct. Eng. (ASCE), 125(3), 236-244, 1999
[7] S.A. Hashemi, K.M. Mosalam, Seismic Evaluation of Reinforced Concrete Buildings In-
cluding Effects of Infill Masonry Walls. Pacific Earthquake Engineering Research Cen-
ter, PEER 2007/100, 2007
[8] S. Kadysiewski, K.M. Mosalam, Modeling of Unreinforced Masonry Infill Walls Consid-
ering In-plane and Out-of-Plane Interaction, Pacific Earthquake Engineering Research
Center, PEER 2008/102, 2009
[9] P.B. Shing, A.Stavridis, Analysis of Seismic Response of Masonry‐ Infilled RC Frames
through Collapse, ACI Structural Journal, 297(7), 1-20, 2014.
[10] F. McKenna, G.L. Fenves, M.H. Scott, Open system for earthquake engineering simula-
tion, University of California, Berkeley, CA, 2000.
116
OpenSees Days Europe 2017
1st European Conference on OpenSees
Porto, Portugal, 19–20 June 2017
EVALUATION OF SEISMIC FRAGILITY OF INFILLED
REINFORCED CONCRETE FRAMES SUBJECT TO AFTERSHOCKS
F. Di Trapani1, M. Malavisi1, G. Bertagnoli1 and V.I. Carbone1
1Politecnico di Torino
Department of Structural, Geotechnical and Building Engineering
Corso Duca degli Abruzzi 24 - Torino
[email protected], [email protected], [email protected]
Keywords: OpenSees, Incremental Dynamic Analysis, Fragility Curves, Infilled Frames, Re-
inforced concrete
Abstract. Masonry infills strongly interact with primary framed structures in presence of
seismic loads. Depending on the regularity of the distribution in plan and over the height, and
on the geometrical and mechanical properties of the infill/frame system they can reduce or
amplify structural damage due to mainshocks and aftershocks. The paper presents an assess-
ment framework to determine fragility curves of reinforced concrete bare and infilled frames
subject previous earthquake induced damage. Mainshock ground motions are defined using
spectrum-compatible accelerograms having return period associated with different limit
states. Aftershocks are defined as spectrum compatible signals and are scaled in amplitude to
different intensity levels. Incremental dynamic analysis (IDA) is carried out in OpenSees us-
ing signals composed of a fixed part (mainshock) and a variable part (aftershock). After-
shocks are varied in amplitude in order to assess the response of the pre-damaged structure
to earthquakes having different intensity levels. Fragility curves are derived for bare and in-
filled framed structures, considering the cases of no pre-damaging, low pre-damaging, and
high pre-damaging. Results show that the response of infilled frames to the aftershocks signif-
icantly depends on the damage experienced during the mainshock. For the cases of low pre-
damaging (low-intensity mainshock) seismic response has resulted less sensitive to further
shakings. Conversely, infilled frames severely damaged by mainshock achieved collapse in
correspondence of intensity levels f the aftershocks significantly lower than those of the
mainshock.
117

F. Di Trapani, M. Malavisi, G. Bertagnoli, V.I. Carbone
1 INTRODUCTION
Masonry infills are typically used as partition walls in reinforced concrete and steel struc-
tures. Although they are usually not included in structural models, it has been observed that
they radically change structural response to lateral loads induced by seismic events. Depend-
ing on the regularity of their distribution in plan an over the height, the contribution of mason-
ry infill can be beneficial or not to the overall response. On the one hand if infills are regularly
distributed in plan and over the height, they can effectively reduce structural damage to pri-
mary structures and dissipate energy from seismic input. On the other hand, irregular distribu-
tions are often the cause of additional inelastic demand, as the case of soft-storey mechanism.
In the case of strong infills associated with non-seismically designed frames, the interaction
between infills and frames may also lead to local brittle failures. This is the case of shear fail-
ure of joints and column ends. Different methods can be used to model the presence of infills
in structural models. Among these the use of equivalent struts replacing infills [1-3] has been
widely adopted in seismic simulations, as it allows accurately accounting inelastic response of
infills with relatively low computational costs. In most cases the influence of masonry infills
has been assessed using nonlinear static analysis [4] or dynamic analysis [5] referring to an
initial undamaged state of the structure. However, severe earthquakes are generally followed
by a sequence of shakings which can reach also considerable intensities. Another case is that
of structures which have been slightly damaged by previous weak earthquakes and undergo
severe shaking in a second time. In both cases masonry infills influence the response to the
aftershocks differently from how they have influenced the response to the mainshock. This is
due to the fact that the damage state induced by the first earthquake has changed their stiff-
ness and residual strength capacity. In consideration of this, this paper investigates the influ-
ence of masonry infills in the seismic fragility of reinforced concrete structures which have
undergone previous seismic damage of different entity. The assessment framework proposed
provides using incremental dynamic analysis (IDA) with ground motion signals composed of
a reference fixed mainshock, and a variable aftershock scaled in amplitude. A prototype 4-
storey reinforced concrete frame actually tested by other authors [6], has been used as refer-
ence structure to perform numerical simulations. Results were provided in terms of fragility
curves, which have been obtained for bare and infilled frames. In particular the evaluation of
the fragility curves was carried out for the intact state and for a damaged state resulting from
mainshocks having different intensities.
2 THE CASE STUDY
The case study considered is a real scale prototype building subjected to pseudo dynamic
tests in the ELSA laboratory [6]. The specimen is a four-storey three-bay RC infilled frame,
designed without seismic details to be representative of typical RC buildings realized from
1960s to the 1980s in Southern Europe. The bare frame and the infilled frame configurations
have been considered (Fig. 1). Design details can be found in [4,6]
a) b)
Figure 1: Prototype case study: a) bare frame; b) infilled frame. Image from [4].
118

F. Di Trapani, M. Malavisi, G. Bertagnoli, V.I. Carbone
3 OPENSEES MODELLING
The model of the prototype structure has been realized in OpenSees [7]. Beam and column
elements were modeled with force-based nonlinear beam-column elements. The fiber cross-
section of RC elements considered different stress-strain relationships for confined core con-
crete, unconfined cover concrete and steel rebars. Infills were modeled as compression only
trusses with a concrete type (Concrete02) law. The identification of the geometry of the struts
has been performed according to [2], while the definition of the stress-strain parameters, iden-
tifying the nonlinear response followed the correlation rules proposed in [8].
4 DEFINITION OF THE INPUT
For the aftershocks, a set of 30 artificial ground motion records have been defined to match
spectrum-compatibility criteria of the target spectrum associated with seismic hazard of the
city of L’Aquila (Italy). The return period was 1950 years. Two different levels of mainshock
ground motions were used as initial part of the signal. The latter were obtained by scaling a
further artificial spectrum-compatible record to the return periods of 50 and 475 years. Incre-
mental dynamic analyses were carried subjecting the reference structural models (bare and
infilled) to input signals defined to account for the three following conditions. Condition A
(no pre-damaging) was defined by simply subjecting the structural models to the aforemen-
tioned 30 accelerograms scaled to 10 different scale factors. Condition B (low pre-damaging)
consisted in subjecting the models to the aforementioned 30 signals modified by placing the
50 years return period mainshock before the aftershocks (Fig. 2a). Only the aftershock portion
of the signal was scaled to perform IDA. Condition C (high pre-damaging) was the same of B,
but the 475 years return period mainshock was used instead (Fig. 2b).
Figure 2: Definition of input signals: a) Condition B signals; b) Condition C signals.
5 FRAGILITY ASSESSMENT AND RESULTS
IDA curves were defined using the peak ground acceleration (PGA) as intensity measure
(IM) and the maximum interstorey drift at the first floor as damage measure (DM). The defi-
nition of fragility curves was carried out by evaluating the distribution of peak ground accel-
erations achieved at an interstorey drift of 2%, considered as collapse limit state (as also
suggested by FEMA technical code).
Results have shown that if local failure of RC frame does not occur because of an excess of
shear demand, the presence of infill reduces the probability of collapse. In particular, consid-
ering the results of intact (bare and infilled frame) structures (Condition A), it can be observed
that infills significantly limit structural damage to primary structures at the lowest intensities,
and reduce inelastic demand at of the largest intensities. Results of mainshock/aftershock
119

F. Di Trapani, M. Malavisi, G. Bertagnoli, V.I. Carbone
analyses have highlighted that low pre-damaging (Condition B) is entirely absorbed by the
infills. This will induce a pre-damaged infilled frame structure to be less sensitive to the sub-
sequent aftershocks (probably because of the period elongation due to cracking) with respect
to the undamaged structure. Conversely if severe damage is achieved during the mainshock
(Condition C), collapse occurs at very rapidly when as the intensity level tends to that of the
mainshock.
6 CONCLUSIONS
The presence of masonry infills in reinforced concrete structures may reduce seismic vul-
nerability if the latter are regularly distributed and local shear failure is inhibited. IDA based
fragility assessment of intact and pre-damaged bare and infilled structures have highlighted
that the ability to resist to aftershock events depends on the level of damage achieved during
the mainshock. If the level of pre-damage is low, the structure shows a lower sensitivity even
to strong aftershocks. Conversely if pre-damage level is significant, the structure is less sensi-
tive to aftershocks of medium to low intensity but rapidly reaches collapse if a given intensity
threshold is exceeded. The post-earthquake observation of the level of damage of infilled
frame structures plays a key role in defining priorities in emergency conditions especially in
presence of aftershock following a major seismic event.
REFERENCES
[1] R.J. Mainstone, Supplementary note on the stiffness and strength of infilled frames, Build-
ing Research Station, Current Paper CP 13/74, UK.
[2] P.G. Asteris, L. Cavaleri, F. Di Trapani, V. Sarhosis, A macro-modelling approach for the
analysis of infilled frame structures considering the effects of openings and vertical loads,
Structure and Infrastructure Engineering, 12(5), 551-566, 2016.
[3] L. Cavaleri, F. Di Trapani, Cyclic response of masonry infilled RC frames: Experimental
results and simplified modeling, Soil Dyn. and Earthquake Eng., 65, 224–242, 2014.
[4] M. Dolšek, P. Fajfar, The effect of masonry infills on the seismic response of four storey
reinforced concrete frame - a deterministic assessment, Eng. Structures, 30, No. 7, 1991-
2001, 2008.
[5] P.B. Shing, A.Stavridis, Analysis of Seismic Response of Masonry‐ Infilled RC Frames
through Collapse, ACI Structural Journal, 297(7), 1-20, 2014.
[6] E.C. Carvalho, E. Coelho, Seismic assessment, strengthening and repair of structures.
radECOEST2- ICONS report no. 2, European Commission—Training and Mobility of
Researchers Programme, 2001.
[7] F. McKenna, G.L. Fenves, M.H. Scott, Open system for earthquake engineering simula-
tion, University of California, Berkeley, CA, 2000.
[8] F. Di Trapani, L. Cavaleri, G. Bertagnoli, G. Mancini, D. Gino, M. Malavisi, Definition of
a fiber macro-model for nonlinear analysis of infilled frames. 6th International Confer-
ence on Computational Methods in Structural Dynamics and Earthquake Engineering,
Rhodes, Greece, June 15-17, 2017.
120

OpenSees Days Europe 2017 1st European Conference on OpenSees
Porto, Portugal, 19–20 June 2017
SIMPLIFIED MACRO-MODELLING APPROACH FOR INFILL MASONRY WALL IN-PLANE AND OUT-OF-PLANE BEHAVIOUR
USING OPENSEES
André Furtado1A, Hugo Rodrigues2, António Arêde1Band Humberto Varum1C
1 CONSTRUCT-LESE, Faculty of Engineering of University of Porto Porto, Portugal
e-mail: A: [email protected]; B: [email protected]; C: [email protected]
2 RISCO – School of Management and Technology, Polytechnique Institute of Leiria Leiria, Portugal
Keywords: Infill Masonry Walls, Seismic Behaviour, In-Plane, Out-Of-Plane, Numerical mod-elling
Abstract. Over the last years the seismic behaviour of infilled reinforced concrete (RC) struc-tures have been focus of innumerous experimental and numerical studies. A big effort is being made by the scientific community with the aim of increase the knowledge of the seismic response of this type of structures and improve the numerical modelling accuracy to predict their ex-pected behaviour. One of the main challenges in earthquake risk mitigation is the assessment of existing buildings not designed according to modern codes and the development of effective techniques to strengthen these structures. Particular attention should be given to RC frame structures with masonry infill panels, as demonstrated by their poor performance in recent earthquakes in Europe. Understanding the seismic behaviour of masonry-infilled RC frames presents one of the most difficult problems in structural engineering. Analytical tools to evalu-ate infill–frame interaction and the failure mechanisms need to be further studied. This research intends to present a simplified macro-model that takes into account the combined in-plane and out-of-plane behaviour of the infill panels when subjected to seismic loadings that can be used in the software OpenSees. Detailed considerations regarding this numerical modelling ap-proach will be presented along the manuscript.
121

André Furtado, Hugo Rodrigues, António Arêde, Humberto Varum
1 INTRODUCTION
Understanding the seismic performance of constructions, in general, has been a concern of the scientific community for quite long. Recent earthquakes demonstrated the importance and influence of the infill masonry (IM) walls in the seismic behaviour of reinforced concrete (RC) structures. Recently, some experimental studies have been carried out in order to characterize the infills seismic behaviour and it was observed that the out-of-plane (OOP) capacity of the IM walls is reduced with the increasing in-plane (IP) demands, which allow to conclude that this combined IP-OOP behaviour in the numerical modelling of such elements must be taken into account [1]. Aiming at providing ever more insight to this particular area, several method-ologies and techniques were developed. Different techniques are available in the literature to simulate the response of infilled frames, from refined micro-models to simplified macro-mod-els. The macro-models are simpler than the micro-models insofar as they require a smaller number of variables, such as the interaction between brick and mortar. They allow us to repre-sent the global behaviour of the IM and its influence in the structural response of the buildings when subjected to earthquakes in a much smaller period of time, and furthermore they reduce the computational demand.
In the present research paper a simplified macro-model that considers the IP and OOP be-haviour of the IM walls is presented for the computer software OpenSees [2]. This numerical model takes into account also an element removal algorithm that allows the removal of elements during an earthquake simulation, including the interaction of IP and OOP behaviour.
2 DESCRIPTION OF THE PROPOSED MASONRY INFILL WALL NUMERICAL MODEL APPROACH
In the light of field observations, it is intended that the numerical models are a fundamental tool to understand the IM behaviour when subjected to horizontal cyclic loadings. The macro-model presented here, to be used in the software framework OpenSees [2], is based on the Rodrigues et al. [24] proposal, which is an improvement of the commonly used equivalent bi-diagonal strut model. In this model, each masonry infill wall is simulated by four diagonal struts with rigid behaviour, and a central element where the non-linearity hysteresis is concentrated (Figure 1), and the two central nodes with panel mass. The numerical model can be defined with the available elements and materials in the OpenSees library [3], namely the five elements adopted can be BeamWithHinges elements or alternatively four elastic BeamColumns for the diagonal struts and one non-linear BeamColumn for the central element. This numerical model is designed to represent the IM wall’s non-linear behaviour when subjected to biaxial cyclic loading, such as in-plane and out-of-plane. These two components are modelled independently although when subjected to this biaxial cyclic action they interact through an element removal algorithm that is implemented, as will be described in the next section.
Figure 1 – Masonry infill wall proposed simplified macro-model.
122
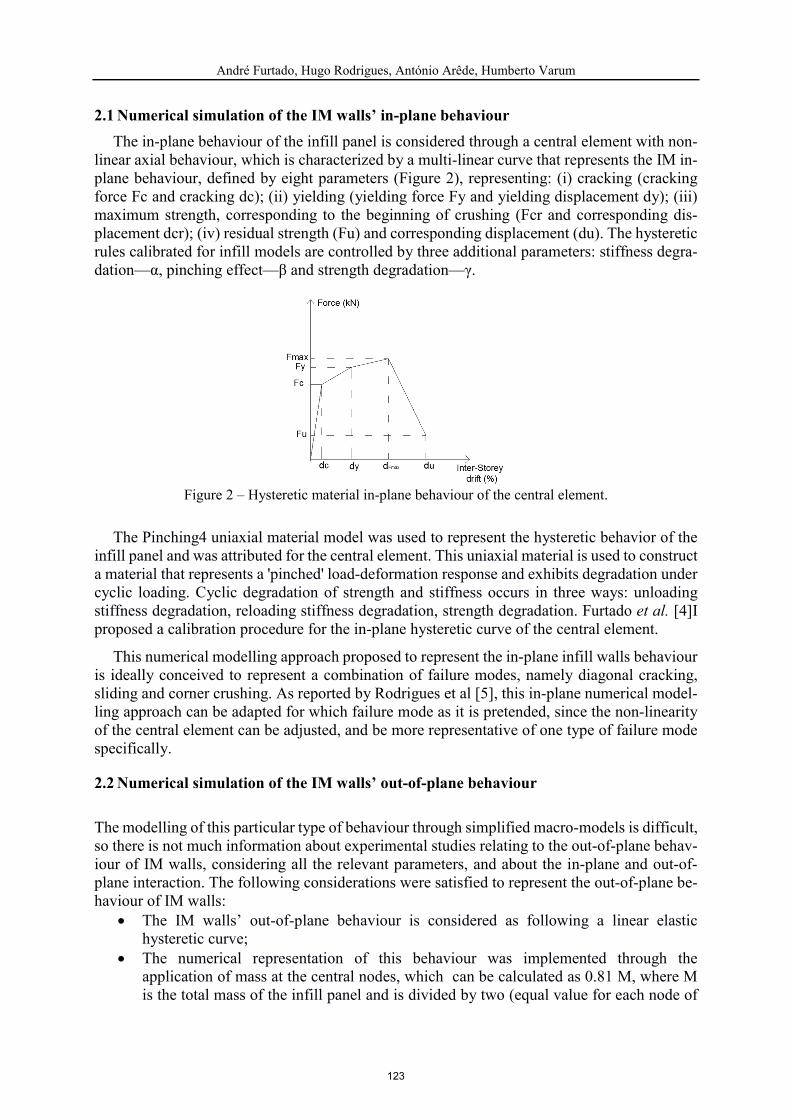
André Furtado, Hugo Rodrigues, António Arêde, Humberto Varum
2.1 Numerical simulation of the IM walls’ in-plane behaviour
The in-plane behaviour of the infill panel is considered through a central element with non-linear axial behaviour, which is characterized by a multi-linear curve that represents the IM in-plane behaviour, defined by eight parameters (Figure 2), representing: (i) cracking (cracking force Fc and cracking dc); (ii) yielding (yielding force Fy and yielding displacement dy); (iii) maximum strength, corresponding to the beginning of crushing (Fcr and corresponding dis-placement dcr); (iv) residual strength (Fu) and corresponding displacement (du). The hysteretic rules calibrated for infill models are controlled by three additional parameters: stiffness degra-dation—α, pinching effect—β and strength degradation—γ.
Figure 2 – Hysteretic material in-plane behaviour of the central element.
The Pinching4 uniaxial material model was used to represent the hysteretic behavior of the infill panel and was attributed for the central element. This uniaxial material is used to construct a material that represents a 'pinched' load-deformation response and exhibits degradation under cyclic loading. Cyclic degradation of strength and stiffness occurs in three ways: unloading stiffness degradation, reloading stiffness degradation, strength degradation. Furtado et al. [4]I proposed a calibration procedure for the in-plane hysteretic curve of the central element.
This numerical modelling approach proposed to represent the in-plane infill walls behaviour is ideally conceived to represent a combination of failure modes, namely diagonal cracking, sliding and corner crushing. As reported by Rodrigues et al [5], this in-plane numerical model-ling approach can be adapted for which failure mode as it is pretended, since the non-linearity of the central element can be adjusted, and be more representative of one type of failure mode specifically.
2.2 Numerical simulation of the IM walls’ out-of-plane behaviour
The modelling of this particular type of behaviour through simplified macro-models is difficult, so there is not much information about experimental studies relating to the out-of-plane behav-iour of IM walls, considering all the relevant parameters, and about the in-plane and out-of-plane interaction. The following considerations were satisfied to represent the out-of-plane be-haviour of IM walls:
The IM walls’ out-of-plane behaviour is considered as following a linear elastic hysteretic curve;
The numerical representation of this behaviour was implemented through the application of mass at the central nodes, which can be calculated as 0.81 M, where M is the total mass of the infill panel and is divided by two (equal value for each node of
123

André Furtado, Hugo Rodrigues, António Arêde, Humberto Varum
0.405 M). Assuming that the model has the same natural period as the original infill wall, the OOP mass and bending stiffness values were determined as suggested by Furtado et al. [6]
In order to obtain a realistic representation of the behavior of the infill in the panels when sub-jected to biaxial loadings, a masonry walls element removal algorithm. The IM walls are con-sidered as collapsed if they reach the in-plane and out-of-plane interaction drift limits. After that, the algorithm removes the five elements and the corresponding central nodes and respec-tive masses. The modelling strategy layout scheme for the implementation of the IM wall in OpenSees and the respective function of the element removal algorithm are illustrated in Figure 3.
Figure 3 – IM wall displacement interaction law – element removal implementation.
3 CONCLUSIONS
This research paper presents a simplified macro-model that simulates the IP and OOP behaviour of IM walls when subjected to seismic loadings. This model is adapted from the typical bi-diagonal strut model which considers the interaction between the infill and the surrounding RC frames. The numerical model was developed in order to associate the IP and OOP behaviour in the response of the IM walls during an earthquake. When the numerical model reaches the drift limits, the IM walls are removed through an element removal algorithm. REFERENCES
[1] A. Furtado, H. Rodrigues, A. Arêde, and H. Varum, "Experimental evaluation of out-of-plane capacity of masonry infill walls," Engineering Structures, vol. 111, pp. 48-63, 2016.
[2] F. Mckenna, G. Fenves, M. Scott, and B. Jeremic, "Open System for Earthquake Engineering Simulation (OpenSees)," ed. Berkley, CA, 2000.
[3] Pre-standard and commentary for the seismic rehabilitation of buildings F. E. M. Agency, 2000.
[4] A. Furtado, H. Rodrigues, and A. Arêde, "Modelling of masonry infill walls participation in the seismic behaviour of RC buildings using OpenSees," International Journal of Advanced Structural Engineering (IJASE), vol. 7, pp. 117-127, 2015.
[5] H. Rodrigues, H. Varum, and A. Costa, "Simplified Macro-Model for Infill Masonry Panels " Journal of Earthquake Engineering, vol. 14, pp. 390 - 416, 2010.
[6] A. Furtado, H. Rodrigues, A. Arêde, and H. Varum, "Simplified macro-model for infill masonry walls considering the out-of-plane behaviour," Earthquake Engineering & Structural Dynamics, vol. 45, pp. 507-524, 2016.
P Displacement limits IM wall numerical
displacement
OO
P d
isp
lace
me
nt
(m)
IP displacement (m)
OO
P d
isp
lace
me
nt
(m)
IP displacement (m)
P
P
P
124

OpenSees Days Europe 2017
1st European Conference on OpenSees
Porto, Portugal, 19–20 June 2017
MODELLING THE OUT-OF-PLANE BEHAVIOUR OF URM INFILLS
AND THE IN-PLANE/OUT-OF-PLANE INTERACTION EFFECTS
Paolo Ricci1, Mariano Di Domenico1, and Gerardo M. Verderame1
1 University of Naples Federico II
Department of Structures for Engineering and Architecture
Via Claudio 21 – 80125 – Naples - Italy
(paolo.ricci, mariano.didomenico, verderam)@unina.it
Keywords: URM infills, out-of-plane, in-plane/out-of-plane interaction, macro-model
Abstract. Unreinforced masonry infills are non-structural elements subjected, during seismic
action, to in-plane and out-of-plane displacement and acceleration demands. In-plane and out-
of-plane seismic responses of such elements are not independent as in-plane damaging reduces
out-of-plane capacity and vice-versa. This phenomenon is called in-plane/out-of-plane interac-
tion. In this paper, a macro-modelling strategy aimed at accounting for both in-plane both out-
of-plane behaviour of unreinforced masonry infill walls is presented. Out-of-plane strength re-
duction due to in-plane damaging is modelled. Out-of-plane stiffness reduction due to in-plane
displacement demand and vice-versa is also considered, in order to correctly estimate acceler-
ation demand during seismic motion. A routine aimed at removing infills from the structural
model during non-linear time-history analyses at the attainment of the in-plane or of the out-
of-plane collapse condition is defined. The proposed modelling strategy has been implemented
in OpenSees in order to allow users to model the in-plane and out-of-plane behaviour of infills,
as well as their degrading rules, adopting any material model. The effect of taking into account
or neglecting in-plane/out-of-plane interaction phenomena on the results of non-linear time-
history analyses by applying the proposed model is shown through the seismic assessment of
an example RC frame in a non-linear dynamic framework.
125

Paolo Ricci, Mariano Di Domenico and Gerardo M. Verderame
1 INTRODUCTION
In the Mediterranean area, Reinforced Concrete (RC) buildings are usually provided of Un-
reinforced Masonry (URM) infill wall panels. When subjected to the seismic action, these non-
structural elements are sensitive to the displacements produced in the In Plane (IP) direction
and to the acceleration in the Out Of Plane (OOP) direction. IP displacements can damage infill
walls with significant effects in terms of repairing costs for RC buildings after earthquakes.
OOP acceleration can produce infills’ collapse by their overturning, which is a great risk for
life safety as well as an obstacle to escape/rescue operations during seismic emergency [1]. IP
and OOP responses of infills are not independent as in-plane damaging reduces out-of-plane
capacity and vice-versa. This phenomenon is called IP/OOP interaction. Modelling strategies
for the OOP behaviour of URM infills and the IP-OOP interaction were proposed by Hashemi
and Mosalam [2], Kadysiewski and Mosalam [3], Furtado et al., [4], Longo et al. [5], Shing et
al. [6], Oliaee and Magenes [7].
In this work, a new infill macro-model accounting for IP-OOP interaction is proposed and
applied through Incremental Dynamic Analyses on a simple example frame, in order to show
the effects of IP-OOP interaction in the seismic capacity assessment of RC frames.
2 PROPOSED MODELLING STRATEGY
The proposed empirical-based model has been implemented in OpenSEES. First, the OOP
force-displacement behaviour relationship should be defined, for example, through the semi-
empirical approach proposed by the Authors in [8]. Hereafter, the above-defined OOP behav-
iour relationship will be mentioned as the IDR=0 backbone. Then, n IDRs (IDRi, with i=1, …,
n) should be set as discrete IP damage thresholds. Through degradation-modelling relationships,
as the ones proposed by the Authors in [8], it is possible to define n OOP backbones, corre-
sponding to the n IDRs: each one of these curves, which will be mentioned hereafter as
IDR=IDRi backbone, represents the OOP behaviour that the infill will exhibit from the moment
the IP IDR demand exceeds the damage threshold represented by IDRi (see Figure 1).
(a) (b)
Figure 1. Proposed modelling strategy of the IP-OOP interaction. Active and mutually-neutralizing OOP back-
bones for IDR<IDR1 (a); active, mutually-neutralizing and removed backbones for IDR between IDR1 and IDR2
(b).
As shown in Figure 2, each infill should be represented by a diagonal element representing the
IP behaviour of the infill. Each of these elements is connected through a pinned joint to the
surrounding frame and is provided of a central node connected to a second central node in which
the mass participating to the first OOP vibration mode of the infill is lumped: generally, it can
be assumed equal to the 81% of the panel total mass [3]. The connection between these central
nodes is ensured by 2n+1 plastic hinges. First, a plastic hinge carrying the IDR=0 backbone
must be defined (in the following example, a Hysteretic Material is used to this aim). Then, for
126

Paolo Ricci, Mariano Di Domenico and Gerardo M. Verderame
each IDR=IDRi backbone, a couple of plastic hinges must be defined: the first one, which will
be called “i-th real plastic hinge”, models the OOP behaviour defined by the considered IDRi
backbone; the second one, which will be called “i-th auxiliary plastic hinge”, behaves according
to the force-displacement relationship defined by the IDR=IDRi backbone mirrored with re-
spect to the displacements axis. This goal can be achieved in OpenSEES by defining the “aux-
iliary” backbones through a Parallel Material that is referred, with scale factor equal to -1, to
the constitutive relationship used to define the corresponding “real” backbone. This means that
the OOP force for a given OOP displacement in the i-th real plastic hinge is always equal and
opposite to the OOP force at the same displacement in the i-th auxiliary plastic hinge. This also
means that as long as all plastic hinges are part of the infill model, the panel OOP behaviour is
the one defined by the IDR=0 backbone, while the effects of the other plastic hinges are mutu-
ally neutralizing.
Figure 2. Graphical representation of the proposed modelling strategy.
Integral part of the proposed model is a routine that removes from the structural model the IDRi-
1 real plastic hinge and the IDRi auxiliary plastic hinge when the IP IDR exceeds the previously
defined damage threshold represented by IDRi. In this way, as soon as the IDR exceeds IDRi
and as long as the IDR is lower than the successive IP damage threshold IDRi+1, the panel OOP
behaviour is defined by the IDR=IDRi backbone “contained” in the ith real plastic hinge, while
the effects of the remaining plastic hinges are still mutually neutralizing. Moreover, if the OOP
displacement exceeds the ultimate displacement associated to the IDR=IDRi backbone, all the
elements representative of the infill wall are removed from the structural model. An explanatory
version of the removal routine is shown in Figure 3.
The IP strength and stiffness can be modelled, together with the whole infill removal due to
the attainment of the IP ultimate displacement, through a procedure very similar the one ex-
plained in the previous lines for the modelling of the infill OOP behaviour.
3 EXAMPLE APPLICATION
The proposed model is applied to a one-leaf URM infill of a simple one-bay one-storey RC
frame. Example applications carried out on multi-bays multi-storeys RC frames are shown in
[9]. The example infill is 2.8 m high, 3.6 m wide, 0.10 m thick. Masonry compressive and
tensile strength and elastic modulus were assumed equal to 2.4, 0.30 and 2500 N/mm2, respec-
tively. The infill IP behaviour was modelled according to Panagiotakos and Fardis [10], The
OOP behaviour was modelled accordingly to [8]. OpenSEES code has been used to carry out
Incremental Dynamic Analyses (IDAs) on a model accounting for IP/OOP interaction (W/
127

Paolo Ricci, Mariano Di Domenico and Gerardo M. Verderame
Model) and on a model in which the interaction was not active (W/O model). The frame was
subjected to the 22 bidirectional records of the ATC-63 Far-field Ground Motion Set [12].
Figure 3. Removal routine simplified schema.
The IDA curves for all records and for W/ and W/O Models are shown in Figure 4 together
with median IDA curves.
(a) (b) (c)
Figure 4. IDA curves for W/O (a), W/ (b) models with median IDA curves for both models (c).
Now, let us consider a specific ground motion (Ground Motion 14 of the ATC-63 set) and
the corresponding IDA curves obtained for W/ and W/O Models (Figure 5). At “check point”
A, for a PGA in the IP direction equal to 0.30 g, the displacement demands in both the IP and
the OOP direction caused no interaction phenomena. At “check point” B, for a PGA in the IP
direction equal to 1.60 g, the displacement demands in both the IP both the OOP direction
produced the infill’s strength and stiffness degradation, but not the infill collapse and removal
from the structural model. The maximum IDR demand passed from about 1.8% for W/O Model
to about 2.7% for W/ Model. At “check point” C, for a PGA in the IP direction equal to 2.10 g,
the displacement demands in both the IP and the OOP direction produced the infill’s strength
and stiffness degradation and then the infill collapse and removal from the structural model.
The infill removal produced a significant variation in the IP displacement time history: the
maximum IDR demand passed from about 2.9% for W/O Model to about 5.9% for W/ Model.
Figure 5. IDA curves for Ground Motion 14.
0 2 4 60
0.5
1
1.5
2
2.5
maximum IDR [%]
PG
A in
th
e IP
dir
ectio
n [g
]
Median IDA
0 2 4 60
0.5
1
1.5
2
2.5
maximum IDR [%]
PG
A in
th
e IP
dir
ectio
n [g
]
Median IDA
0 2 4 60
0.5
1
1.5
2
2.5
maximum IDR [%]
PG
A in
th
e IP
dir
ectio
n [g
]
w/ removal
w/o removal
128

Paolo Ricci, Mariano Di Domenico and Gerardo M. Verderame
4 CONCLUSIONS
This work is focused on the OOP behaviour of URM infills and on the effects of IP damage
on it and vice-versa, i.e., on the IP/OOP interaction.
A new macro-modelling strategy based on the proposed empirical relationships is presented.
Details on the model implementation in OpenSEES are reported. The proposed model is applied
on a case-study one-bay one-storey RC infilled frame in a non-linear incremental framework.
At increasing seismic excitation level, accounting for infills’ capacity degradation due to
IP/OOP interaction seems to be unavoidable in order to estimate correctly the expected dis-
placement demand.
REFERENCES
[1] S. Taghavi, E. Miranda, Seismic performance and loss assessment of nonstructural
building components. Proceedings of 7th National Conference on Earthquake Engi-
neering, Boston, United Stated of America, July 21-25, 2002.
[2] S.A. Hashemi, K.M. Mosalam, Seismic evaluation of reinforced concrete buildings in-
cluding effects of infill masonry walls. PEER Center, 2007.
[3] S. Kadysiewski, K.M. Mosalam, Modelling of unreinforced masonry infill walls con-
sidering in-plane and out-of-plane interaction. PEER Center, 2009.
[4] A. Furtado, H. Rodrigues, A. Arede, H. Varum, Simplified macro-model for infill ma-
sonry walls considering the out-of-plane behaviour. Earthquake Engineering & Struc-
tural Dynamics, 45.4, 507-524, 2015. DOI: 10.1002/eqe.2663.
[5] F. Longo, G. Granello, G. Tecchio, F. da Porto, C. Modena, A masonry infill wall model
with in-plane out-of-plane interaction applied to pushover analysis of RC frames. Pro-
ceedings of the 16th IBMAC, Padua, Italy, June 26-30, 2016.
[6] P.B. Shing, L. Cavaleri, F. Di Trapani, Prediction of the out-of-plane response of infilled
frames under seismic loads by a new fiber-section macro-model. Proceedings of the
16th IBMAC, Padua, Italy, June 26-30, 2016.
[7] M. Oliaee, G. Magenes, In-plane out-of-plane interaction in the seismic response of
masonry infills in RC frames. Proceedings of the 16th IBMAC, Padua, Italy, June 26-
30, 2016.
[8] M. Di Domenico, P. Ricci, G.M. Verderame, Empirical unreinforced masonry infill
macro-model accounting for in-plane/out-of-plane interaction. COMPDYN 2017,
Rhodes Island, Greece, June 15-17, 2017.
[9] P. Ricci, M. Di Domenico, G.M. Verderame, Empirical-based infill model accounting
for in-plane/out-of-plane interaction applied for the seismic assessment of EC8-
designed RC frames. COMPDYN 2017, Rhodes Island, Greece, June 15-17, 2017.
[10] T.B. Panagiotakos, M.N. Fardis, Seismic response of infilled RC frames structures. 11th
World Conference on Earthquake Engineering, Acapulco, Mexico, June 23-28, 1996.
[11] Federal Emergency Management Agency. Quantification of building seismic perfor-
mance factors. Applied Technology Council ATC-63 Project Report, FEMA P695,
Washington DC, USA, 2009.
129

OpenSees Days Europe 2017
1st European Conference on OpenSees
Porto, Portugal, 19–20 June 2017
NONLINEAR COMBINATION OF INTENSITY MEASURES FOR
RESPONSE PREDICTION OF RC BUILDINGS
Alessandra Fiore1, Fabrizio Mollaioli2, Giuseppe Quaranta3, and Giuseppe C. Marano4,1
1 Department of Science of Civil Engineering and Architecture, Technical University of Bari
Via Orabona 4, 70125 Bari, Italy
{alessandra.fiore, giuseppecarlo.marano}@poliba.it
2 Department of Structural and Geotechnical Engineering, Sapienza University of Rome
Via Gramsci 53, 00197 Rome, Italy
3 Department of Structural and Geotechnical Engineering, Sapienza University of Rome
Via Eudossiana 18, 00184 Rome, Italy
4 College of Civil Engineering, Fuzhou University
Xue Yuan Road, Fuzhou 350108, China
Keywords: Engineering demand parameter, Evolutionary Polynomial Regression, Intensity
measure, Reinforced concrete building, Seismic assessment.
Abstract. Estimating the seismic demand as function of the earthquake intensity is a critical
issue in performance-based assessment of structures and infrastructures. This requires proper
functional relationships between intensity measures (i.e., parameters that characterizes the
severity of the seismic ground motion) and engineering demand parameters (i.e., parameters
that quantify the expected damage and losses in structural or non-structural systems). Exist-
ing models have been obtained by performing conventional linear regressions over data car-
ried out from numerical simulations. Conversely, this work proposes a set of new nonlinear
models obtained by combining multiple intensity measures, in order to enhance the prediction
of the seismic response of fixed base or base-isolated reinforced concrete buildings subjected
to ordinary and pulse-like earthquakes. Numerical data were first generated by means of non-
linear dynamic analyses performed using OpenSees. The data-driven calibration of the final
nonlinear regression models has been performed using the Evolutionary Polynomial Regres-
sion technique.
130

A. Fiore, F. Mollaioli, G. Quaranta and G. C. Marano
1 INTRODUCTION
The present study illustrates new formulations able to correlate engineering demand pa-
rameters (EDPs) with given intensity measures (IMs) for reinforced concrete (RC) buildings.
In this perspective, two multi-storey RC buildings are considered, namely a fixed-base build-
ing and a base-isolated building. The seismic response is calculated through non-linear dy-
namic analyses, taking into account ordinary and pulse-like seismic records. Nonlinear data-
driven models able to correlate the selected IMs and the considered EDPs are obtained by
means of an advanced regression method, namely the Evolutionary Polynomial Regression
technique (EPR) [1][2].
2 STRUCTURAL MODELS AND SEISMIC INPUT
The selected case-study is a six-storey, three-bay framed RC building with a fixed base or
retrofitted with a base-isolation system. The superstructure is representative of existing build-
ings located in a high seismic zone. The inter-storey high is 3.5 m while the span length of the
beams is 6 m. The periods of the first three modes of vibration of the fixed-base structure are
equal to 1.17 s, 0.4 s and 0.24 s. A non-degrading stiffness model has been implemented to
simulate the constitutive law used for representing the cyclic response of the isolation system.
In this regards, the elastic strength Fd is set equal to 0.03 times the seismic weight W of the
structure. The elastic limit displacement Dy is assumed equal to 0 mm (as for friction pendu-
lum isolators) whereas four values of the post-elastic stiffness Kd are considered. They are
calculated in such a way to obtain isolation periods T equal to 3.0, 3.5, 4.0 and 4.5 s. A total
of 139 seismic ground motion (GM) records is selected from the Next Generation of Attenua-
tion Project Database of the PEER dating back to 2005. These accelerograms are used as in-
put dynamic loading for non-linear dynamic analyses. This database is divided into two
groups, i.e. ordinary GMs (80 records) and pulse-like near-fault GMs (59 records). The struc-
tural response is evaluated by means of OpenSees 2.2.2.
3 INTENSITY MEASURES AND ENGINEERING DEMAND PARAMETERS
3.1 Engineering demand parameters
The EDPs considered in this study are the following:
Maximum Inter-story Drift Ratio (MIDR), i.e. the maximum value of the peak inter-
story drift ratio (drift normalized by the story height) over all the stories;
Maximum Floor Acceleration (MFA), i.e. the maximum value of the peak floor abso-
lute acceleration over all stories of the superstructure.
The MIDR is a dimensionless quantity whereas the unit used for MFA is [m/s2].
3.2 Intensity measures
The IMs explored in this study are classified into two groups. The first group includes non-
structure-specific IMs calculated directly from ground motion time-histories. It is divided into
three sub-groups: i) acceleration-related (i.e., peak ground acceleration PGA, Arias intensity
AI, cumulative absolute velocity CAV, compound acceleration-related IM Ia), ii) velocity-
related (i.e., peak ground velocity PGV, compound velocity-related IM Iv, cumulative abso-
lute displacement CAD, incremental velocity IV, specific energy density SED), iii) displace-
ment-related (i.e., peak ground displacement PGD, compound displacement-related IM Id,
incremental displacement ID) non-structure-specific IMs. The second group includes struc-
ture-specific IMs obtained from response spectra of ground motion time-histories depending
131

A. Fiore, F. Mollaioli, G. Quaranta and G. C. Marano
on the period of the structure. Structure-specific IMs are divided into two groups: i) IMs ob-
tained from the response spectral ordinate at certain periods (i.e., spectral acceleration at iso-
lation period Sa, relative input energy at isolation period EIr, absolute input energy at isolation
period EIa) and ii) IMs carried out from the integration of response spectra over a defined pe-
riod range (i.e., acceleration spectrum intensity ASI, velocity spectrum intensity VSI, Housner
intensity IH, relative input equivalent velocity spectrum intensity VEIrSI, absolute input equiv-
alent velocity spectrum intensity VEIaSI, modified ASI MASI, modified VSI MVSI, modified
IH MIH, modified VEIrSI MVEIrSI, modified VEIaSI MVEIaSI). Length and time units used for
the IMs are [cm] and [s], respectively. The interested reader can found further details about
the adopted IMs elsewhere, e.g. Refs. [3][4] and the reported literature.
4 RESPONSE PREDICTION BASED ON NONLINEAR MODELS
4.1 Prediction of Maximum Inter-story Drift Ratio
Nonlinear formulations of the MIDR as function of multiple IMs have been calibrated by
means of the EPR technique. A very good compromise between complexity and accuracy is
achieved by means of the formulations listed hereafter.
Fixed-base building, ordinary GMs (COD=94.36%):
0.33 7 3 2
aMIDR 0.014728 IV S 6.6417 10 PGA VSI AI (1)
Fixed-base building, pulse-like GMs (COD=88.28%):
EIa8 0.33
EIr
a
a
V SIMIDR 4.789 10 CAD VSI MVSI MV SI ln
S
0.00041743 VSI S
(2)
Base-isolated building, ordinary GMs (COD=83.26%):
6
3
6 0.33 0.33
v Ia H
1MIDR 2.3688 10 SED MASI ln
SED
9.2246 10 I E I 0.062274 ln AI VSI
(3)
Base-isolated building, pulse-like GMs (COD=92.11%):
0.33 25 0.33aPGD S
MIDR 1.9566 10 0.010218 VSI 0.0016844 PGACAV
(4)
4.2 Prediction of Maximum Floor Acceleration
Moreover, suitable nonlinear formulations of the MFA as function of multiple IMs have
been calibrated using the EPR technique. The best compromise between complexity and accu-
racy is obtained by means of the formulations listed hereafter.
Fixed-base building, ordinary GMs (COD=92.82%):
0.33
a H
3 0.33
a
MFA 0.0099258 ASI 0.12824 S ln I
0.080633 PGA S ln PGA
(5)
Fixed-base building, pulse-like GMs (COD=85.95%):
132

A. Fiore, F. Mollaioli, G. Quaranta and G. C. Marano
2 3
a
2
5 2 0.33
EIa
PGA AI I MVSIMFA 0.44302 ln 0.001986 PGV IV
CAD
3.5837 10 PGA V SI ln PGA
(6)
Base-isolated building, ordinary GMs (COD=59.55%):
3
Ir a 0.33
3
E I PGV MVSIMFA 0.0035592 0.69413 VSI
CAV IV
0.001581 PGA
(7)
Base-isolated building, pulse-like GMs (COD=62.79%):
0.330.33 Ia
v a
0.33
0.330.33H
v
IV EMFA 0.0025771 I S MASI ln
PGA
0.0077503 PGA ln VSI
CAV MI 0.47974 ln AI I
MASI
(8)
5 CONCLUSIONS
The main goal of this work was the calibration of suitable models able to estimate the
seismic demand for fixed-based and base-isolated RC buildings under ordinary or pulse-like
near-fault ground motions using most common IMs. The proposed nonlinear models obtained
by combining multiple IMs have a very good predictive capability. In some cases, it is signif-
icantly larger than the accuracy level that can be achieved by means of existing linear models.
6 ACKNOWLEDGMENTS
Fabrizio Mollaioli and Giuseppe Quaranta acknowledge the support from Sapienza Uni-
versity of Rome through the project “Smart solutions for the assessment of structures in seis-
mic areas”. Their work is also framed within the research project DPC-ReLUIS 2017.
REFERENCES
[1] O. Giustolisi, D.A. Savic, Advances in data-driven analyses and modelling using EPR-
MOGA. Journal of Hydroinformatics, 11, 225-236, 2009.
[2] A. Fiore, G. Quaranta, G.C. Marano, G. Monti, Evolutionary Polynomial Regression-
based statistical determination of the shear capacity equation for reinforced concrete
beams without stirrups. Journal of Computing in Civil Engineering, 30(1), 04014111,
2016.
[3] F. Mollaioli, A. Lucchini, Y. Cheng , G. Monti, Intensity measures for the seismic re-
sponse prediction of base-isolated buildings. Bulletin of Earthquake Engineering, 11,
1841-1866, 2013.
[4] H. Ebrahimian, F. Jalayer, A. Lucchini, F. Mollaioli, G. Manfredi, Preliminary ranking
of alternative scalar and vector intensity measures of ground shaking. Bulletin of Earth-
quake Engineering, 13(10), 2805-2840, 2015.
133

OpenSees Days Europe 2017
1st European Conference on OpenSees
Porto, Portugal, 19–20 June 2017
NUMERICAL INVESTIGATIO ON THE SEISMIC BEHAVIOR OF
REPAIRED AND RETROFITTED CHINESE BRIDGE PIERS USING
OPENSEES
Davide Lavorato1, Alessandro V. Bergami1, Camillo Nuti1, Bruno Briseghella2, Junqing Xue2,
Angelo M. Tarantino3, Giuseppe C. Marano2, Silvia Santini1
1 Dept. of Architecture, University of Roma Tre
Largo G.B. Marzi 10, Rome, Italy
{davide.lavorato, alessandro.bergami, camillo.nuti, silvia.santini}@uniroma3.it
2 College of Civil Engineering, Fuzhou University
Fuzhou, Fujian 350108
{Bruno, junqing.xue, marano}@fzu.edu.cn
3Dept. of Engineering,
University of Modena and Reggio
Via Università 4, 41121 Modena
Keywords: repair, retrofitting, existing RC bridge, OpenSees, numerical simulation, UHPFRC,
FRP, SCC
Abstract. Numerical investigations were carried out to study the seismic behavior of Chinese
RC (Reinforced Concrete) bridge piers with seismic deficiencies repaired and retrofitted by
rapid interventions after seismic damage. Some 1:6 scaled pier specimens designed on the base
of Chinese codes [1]-[3] were repaired and retrofitted using two different procedures and then
tested by cyclic tests in the lab of Fuzhou University ([4]-[12]). The first procedure uses a self-
compacting concrete (SCC) jacket to restore the damaged concrete parts, new longitudinal
rebar parts to the partial substitution of the damaged rebars and a carbon Fiber Reinforced
Polymer (CFRP) wrapping to assure the seismic improvements. The second procedure uses an
ultra-high performance fiber reinforced concrete (UHPFRC) with steel or polymeric fibers to
restore the damaged concrete parts and to improve the seismic pier capacity and new longitu-
dinal rebar parts to the partial substitution of the damaged rebars allowing time and cost saving.
Numerical finite element models of the 1:6 scaled piers repaired and retrofitted by the two
procedures were built in OpenSees [13] to investigate the seismic behavior of these specimens.
These numerical results were compared with the experimental ones to understand better the
experimental behavior observed.
134

Davide Lavorato et al.
REFERENCES
[1] JTG D60-2004 Chinese code. General code for design of highway bridges and culverts.
[2] JTG D62-2004 Chinese code. Code for design of highway reinforced concrete and pre-
stressed concrete bridge and culverts.
[3] JTG/T B02-01-2008 Chinese code. Guidelines for seismic design of highway bridges.
[4] Albanesi T, Lavorato D, Nuti C, Santini S. Experimental program for pseudodynamic
tests on repaired and retrofitted bridge piers. European Journal of Environmental and
Civil Engineestrip, Paris: Lavoisier,Vol. 13 - No. 6/2009; 2009, 671-683.
[5] Lavorato D., Nuti C. Pseudo-dynamic tests on reinforced concrete bridges repaired and
retrofitted after seismic damage. Engineering Structures,94, 2015, 96-112.
[6] Albanesi T., Lavorato D., Nuti C., Santini S. Experimental tests on repaired and retrofitted
bridge piers. In Proceedings of the International FIB Symposium, 2008, 673-678.
[7] Lavorato D., Nuti C. Seismic response of repaired bridges by pseudo dynamic tests.
Bridge Maintenance, Safety, Management and Life-Cycle Optimization - Proceedings of
the 5th International Conference on Bridge Maintenance, Safety and Management. Penn-
sylvania, USA, 11-15 July 2010.
[8] Lavorato D., Nuti C., Santini S. Experimental Investigation of the Seismic Response of
Repaired R.C. Bridges by Means of Pseudodynamic Tests. IABSE Symposium, Large
Structures and Infrastructures for Environmentally Constrained and Urbanised Areas,
Venice, 22-24 September 2010.
[9] Lavorato D., Nuti C. Pseudo-dynamic testing of repaired and retrofitted r.c. bridges, Pro-
ceedings of Fib Symposium Concrete Engineering for Excellence and Efficiency, Czech
Republic, Prague, 8-10 June 2011.
[10] Lavorato D., Bergami AV., Nuti C., Briseghella B., Tarantino AM., Santini S., Huang Y.,
Xue J. Seismic damaged Chinese rc bridges repaired and retrofitted by rapid intervention
to improve plastic dissipation and shear strength. Proceedings of 16WCEE 2017, Santi-
ago Chile, January 9th to 13th 2017.
[11] Lavorato D., Nuti C., Briseghella B., Santini S., Xue J A repair and retrofitting interven-
tion to improve plastic dissipation and shear strength of Chinese rc bridges. Proceedings
of IABSE Conference – Structural Engineering: Providing Solutions to Global Chal-
lenges September 23-25 2015, Geneva, Switzerland
[12] Lavorato D., Nuti C., Briseghella B., Santini S., Xue J. A rapid repair technique to im-
prove plastic dissipation of existing Chinese RC bridges. Proceedings of ACE 2015 Ad-
vances in Civil and infrastructure Engineering, International Symposium Vietri sul Mare,
Italy, 12-13 June 2015
[13] McKenna F., Fenves G.L., Filippou F.C. OpenSees: Open System for Earthquake Engi-
neering Simulation. Pacific Earthquake Engineering Research Center. USA; 2002.
135

OpenSees Days Europe 2017
1st European Conference on OpenSees
Porto, Portugal, 19–20 June 2017
AN OPENSEES MATERIAL MODEL FOR THE CYCLIC BEHAVIOUR
OF CORRODED STEEL BAR IN RC STRUCTURES
Davide Lavorato1, Riccardo Tartaro2, Alessandro V. Bergami1, Camillo Nuti1
1 Dept. of Architecture, University of Roma Tre
Largo G.B. Marzi 10, Rome, Italy
{davide.lavorato, alessandro.bergami, camillo.nuti}@uniroma3.it; [email protected]
Keywords: rebar, corrosion, buckling, material model, existing RC structures, OpenSees
Abstract. A nonlinear uniaxial material model for steel bars was developed and implemented
in OpenSees to model the nonlinear behavior of reinforced concrete (RC) columns damaged by
corrosion and subject to cyclic loading. The corrosion of longitudinal and transversal steel
reinforcements in RC column is detrimental to the seismic response of structural elements as:
(i) the mechanical characteristics of the longitudinal rebars (maximum and yielding strengths,
maximum available steel deformation) are smaller than the ones of the uncorroded rebar; (ii)
the longitudinal rebar shows different behaviors in tension or in compression; (iii) the corro-
sion of transversal reinforcement can change the slenderness of the longitudinal rebar and so
the rebar buckling in compression can be more detrimental. The proposed model can include
these effects of corrosion by the proper definition of the input characteristics for corroded re-
bars. The model can be used to investigate the impact of a corroded rebar on the inelastic
response of existing RC columns damaged by corrosion. The results of this model were verified
by comparison among numerical and experimental behaviors of corroded reinforcement in RC
sections.
136

Davide Lavorato, Riccardo Tartaro, Alessandro V. Bergami and Camillo Nuti
REFERENCES
[1] Albanesi T, Lavorato D, Nuti C, Santini S. Experimental program for pseudodynamic
tests on repaired and retrofitted bridge piers. European Journal of Environmental and
Civil Engineestrip, Paris: Lavoisier,Vol. 13 - No. 6/2009; 2009, 671-683.
[2] Lavorato D., Nuti C. Pseudo-dynamic tests on reinforced concrete bridges repaired and
retrofitted after seismic damage. Engineering Structures,94, 2015, 96-112.
[3] Albanesi T, Lavorato D, Nuti C. Prove sperimentali monotone e cicliche su barre di
acciaio inox. Proceedings of National Conference Sperimentazione su materiali e
strutture. Venezia, Italy; 2006, p. 357-366 [in Italian].
[4] Lavorato D., Nuti C. Seismic response of repaired bridges by pseudo dynamic tests.
Bridge Maintenance, Safety, Management and Life-Cycle Optimization - Proceedings of
the 5th International Conference on Bridge Maintenance, Safety and Management. Penn-
sylvania, USA, 11-15 July 2010.
[5] McKenna F., Fenves G.L., Filippou F.C. OpenSees: Open System for Earthquake Engi-
neering Simulation. Pacific Earthquake Engineering Research Center. USA; 2002.
[6] Zhou Z., Lavorato D., Nuti C., Marano G.C. A model for carbon and stainless steel rein-
forcing bars including inelastic buckling for evaluation of capacity of existing structures
COMPDYN 2015 - 5th ECCOMAS Thematic Conference on Computational Methods in
Structural Dynamics and Earthquake Engineering
[7] Zhou Z., Nuti C., Lavorato D. Modified Monti-Nuti model for different types of reinforc-
ing bars including inelastic buckling. Proceedings of Opensees days Italy 10-11 and ACE
2015 Advances in Civil and infrastructure Engineering, International Symposium Vietri
sul Mare, Italy, 12-13 June 2015.
[8] Zhou Z., Lavorato D., Nuti C. Modeling of the mechanical behavior of stainless reinforc-
ing steel, Proceedings of the 10th fib International PhD Symposium in Civil Engineering.
UNIVERSITÉ LAVAL, CANADA, July21–23, 2014. ISBN 978-2-9806762-2-2
137
OpenSees Days Europe 2017 1st European Conference on OpenSees
Porto, Portugal, 19–20 June 2017
MODELING WITH FIBER BEAM ELEMENTS FOR LOAD CAPACITY ASSESMENT OF EXISTING MASONRY ARCH BRIDGES
M. Laterza1, M. D’Amato2, V. M. Casamassima2 and M. Signorelli2
1 University of Basilicata - DICEM Via Lazazzera, 75100 Matera, Italy
e-mail: [email protected]
2 University of Basilicata - DICEM Via Lazazzera, 75100 Matera, Italy
e-mail: [email protected], [email protected], [email protected]
Keywords: Non linear fiber beam, OpenSees, Masonry arch bridge, Pushover.
Abstract. In this work non-linear beam elements with fibre cross-section approach has been adopted for modelling the multi-span masonry arch bridges and evaluating the ultimate capac-ity. This numerical model approach is validated by some recent experiments on masonry prisms under eccentric compression, where it has been demonstrated that the classical hypothesis that plane sections remain plane after deformation is still valid also in the non-linear range, when cracks initiation occurs. This approach is then applied for modelling the main arch of the Ital-ian ancient brick masonry arch bridge. Then, it is also discussed the effect on the ultimate of the C-FRP reinforcement on the ultimate capacity.
138

M. Laterza, M. D’Amato, V. M. Casamassima and M. Signorelli
1 INTRODUCTION
The conservation and safety assessment of old masonry arch bridges represent nowadays a research field of considerable interest. When handling with these structures, which have been designed with empirical rules and have been subjected in time to an increase in service loading, there is a definite need of simple tools to be used for assessment and determination of the load-carrying capacity. To date it is more copious the bibliography concerning the theoretical aspects for dimensioning and modelling the brick arches. Rankine, Stephenson, and Baker (Heyman, 1982) [1] proposed empirical methods for calculating the arch thickness, the intermediate piers and many other dimensions. In order to determine the load capacity several numerical assess-ment packages and computer-based applications have been proposed as, for example, RING (1992) [2]. In literature also works based on yield design of masonry arches (Heyman, 1982) [1] have been published, such as the contributions of Gilbert and Melbourne (1994) [3]. With this approach, it is assumed a plastic behavior of the material, although the masonry, as demon-strated during laboratory tests, shows a softening branch after the peak strength with a limited ductility. Nevertheless, this method is still largely applied when the possible failure due to the material crushing is also taking into account, since it represents the simplest assumption for avoiding solution convergence problems. The influence of the limited ductility on the load car-rying capacity of masonry arch bridges may be found, for example, in de Felice (2007) [4]. While a complete and more refined bridge simulation should be preferable, a general modelling may reveal excessively time-consuming from a computational point of view, especially when many spans are present. The aim of this paper is to propose an approach for preliminary assess-ment of multi-span masonry arch bridges that makes use of non-linear incremental analysis, using beam elements. This modelling approach is validated by some recent experiments on masonry prisms under eccentric compression, where it has been demonstrated that the classical hypothesis that plane sections remain plane after deformation is still valid also in the non-linear range, when cracks initiation occurs, de Felice 2007 [4]. The use of beams with fibre cross-section has become current for the analysis of reinforced concrete structures, but, as far as the author knows, has never been used for structural analysis of masonry arches.
2 FIBER BEAM ELEMENTS MODEL AND NUMERICAL RESULTS
The numerical model has been implemented into OpenSees (2009) [5], by using rectilinear fibers beams having the unit width section reported in Figure 1.
Figure 1: Fiber section of the arch and uniaxial stress-strain relationships assigned to the fibers of masonry and CFRP.
Analyses methods based on plane section assumption may be found also in Chen (2002) [6], and CNR-DT 200/R1 (2013) [7]. The backfill passive pressure is as well taken into account
139

M. Laterza, M. D’Amato, V. M. Casamassima and M. Signorelli
with the classical assumption that the magnitude of the horizontal backfill pressure is propor-tional to the vertical weight pressure exerted by the backfill material, in according to the work of Gelfi (2002) [8].The masonry material has been modelled with an uniaxial elastic-perfectly plastic relationship having strength only in compression Figure 1, with infinite ductility for avoiding solution convergence problems during the numerical simulations. On the other hand, the infinite ductility will permit of evaluating, in the case of main arch typology, the ultimate carrying load although this assumption may lead, as demonstrated in de Felice, (2009) [9], to an overestimation of the actual arch capacity. However, for the aim of this work this assumption is considered acceptable. The CFRP wraps are supposed to be completely bonded with resin and continuously applied along the width and the longitudinal length of the arch, starting from the impost. They have a Young’s modulus of 230000 MPa, a rupture tensile strength of 4800 MPa and, in this study, a total thickness of 0.33 mm (two layers of CFRP). The reinforcement has been modelled as an additional layer with an elastic uniaxial stress-strain law only in tension, having an axial strength fdd evaluated in accordance with CNR-DT 200/R1 (2013) [7], and corresponding to the debonding failure from the masonry support. In this study, the fdd strength is equal to 316 MPa. After reaching the maximum strength fdd the CFRP material law suddenly reduces (Figure 1), for simulating the fibers detachment invalidating the plane section assump-tion. As regards as the masonry compressive strength is concerned, the following values are assumed for the two simulated knowledge levels: Limited Knowledge Level (KL1) and Full Knowledge Level (KL) with compressive strength equal to 2.40 MPa and 3.20 MPa rispectivley and confidence factor CF 1.35 for KL1 and 1 for KL3. The investigations are performed by varying the debonding strength between the CFRP wraps and the masonry support as shown in Figure 2. The numerical simulations are conducted by imposing an increasing monotonic dis-placement in correspondence of the key and haunch sections, until the arch failure.
Figure 2: Vertical carrying capacity evaluated with respect to the haunch and key section
The obtained results are shown in Figure 2, where the ultimate carrying capacity without any
reinforcement is also plotted (indicated with a dashed line). The analyses are conducted by
140
M. Laterza, M. D’Amato, V. M. Casamassima and M. Signorelli
applying at first all the weights along the arch, and then by imposing an increasing vertical force at the monitored section.
3 CONCLUSIONS
An approach for a preliminary estimate of the load-carrying capacity of masonry arch bridges that takes is presented and applied to an ancient italian masonry arch bridge.The results clearly show that all the diagrams have a linear branch, confirming that the CFRP wraps modify only the main arch ultimate capacity. In particular, the higher the debonding strength the higher the ultimate carrying capacity. One of the advantages of the proposed approach is that it makes use of available general-purpose engineering software, having recourse to analysis methods accepted and widely used in other fields of structural engineering and consistent with the phi-losophy of modern design and assessment codes. In conclusion, the paper makes a contribution towards the development of analysis tools for assessing and preserving existing masonry arch bridge.
REFERENCES
[1] Heyman J., 1982. The masonry arch. Ellis Horwood Ltd., Chichester, England. ienkie-wicz, R.C. Taylor, The finite element method, Vol. I, 4th Edition. McGraw Hill, 1989.
[2] RING, 1992. Masonry arch bridge analysis software: Theory & Modelling Guide. Limit-state Ltd, http://www.limitstate.com/ring.
[3] Gilbert M., Melbourne C., 1994. Rigid-block analysis of masonry structures. The Struc-tural Engineer, Vol. 72, pp. 356–361.
[4] de Felice G., 2007. Load-carrying capacity of multi-span masonry arch bridges having limited ductility, in Proceedings of ARCH’07, 5th International Conference on Arch Bridges, Madeira, Portugal.
[5] OpenSees, 2009. Open System for Earthquake Engineering Simulation, http:// open-sees.berkeley.edu.
[6] Chen J. F., 2002. Load-bearing capacity of masonry arch bridges strengthened with fibre reinforced polymer composites, Advances in Structural Engineering, Vol. 5(1), pp. 37-44.
[7] CNR-DT 200 R1/2013. Istruzioni per la Progettazione, l’Esecuzione ed il Controllo di Interventi di Consolidamento Statico mediante l’utilizzo di Compositi Fibrorinforzati, Materiali, strutture di c.a. e di c.a.p., strutture murarie. (In italian).
[8] Gelfi P., 2002. Role of Horizontal Backfill Passive Pressure on the Stability of Masonry Vaults, International Journal for Restoration of Buildings, Aedificatio Verlag, Freiburg, Vol. 8(6), pp. 573-589.
[9] de Felice G., 2009. Assessment of the load-carrying capacity of multi-span masonry arch bridges using fibre beam elements, Engineering Structures, Vol. 31, pp. 1634–1647.
141

OpenSees Days Europe 2017
1st European Conference on OpenSees
Porto, Portugal, 19–20 June 2017
A NEW FEM APPROACH FOR FRP-STRENGTHENED RC FRAMES
M. Rezaee Hajidehi1, G. Minafò1, and G. Giambanco1
1 Università degli Studi di Palermo, Dipartimento di Ingegneria Civile, Ambientale, Aerospaziale, dei
Materiali (DICAM)
Viale delle Scienze, Ed.8, Palermo, Italy
{mohsen.rezaeehajidehi, giovanni.minafo, giuseppe.giambanco}@unipa.it
Keywords: RC frame, FRP sheet, FEM procedure, OpenSess modelling.
Abstract. Owing special mechanical properties has made Fiber Reinforced Polymer (FRP) as
one of the best strengthening materials for Reinforced Concrete (RC) structures. The effect of
externally applied FRP sheets on RC elements has been the topic of many experimental inves-
tigations. On the other hand, simulating the behavior of RC structures strengthened by means
of externally bonded FRP sheets is yet to be scrutinized. In this work, a new Finite Element
(FE) procedure for inelastic analysis of RC structures has been enriched to account the pres-
ence of externally bonded FRP sheets on RC sections. The proposed FE procedure works in the
framework of lumped plasticity. It is able to identify the exact location of plastic hinges and
imposes rotational discontinuities in the position of plastic hinges. The yield domain of the
FRP-strengthened sections is constructed based on the hypothesis of strain linearity and taking
into account the debonding failure between FRP sheet and concrete substrate. Numerical ap-
plications are presented for unstrengthened and strengthened RC frames. Pushover analysis
has been carried out on numerical applications and the results are compared to each other. In
order to verify the results of the numerical applications, the same models are built and analyzed
in OpenSees, which proves the integrity of the FE procedure and its applicability for FRP-
strengthened RC frames.
142

M. Rezaee Hajidehi, G. Minafò, G. Giambanco
1 INTRODUCTION
So far, many strengthening techniques have been invented to repair or structurally improve
the behavior of reinforced concrete (RC) structures. Thanks to their unique features such as
high strength-to-weight ratio, long term durability, high corrosion resistance and ease of instal-
lation, FRP sheets have gained wide applicability in many engineering areas specially structural
engineering that many research studies are devoted to better understand the various applications
of FRP sheets and its effectiveness on the performance of RC structures.
Literature survey has shown that, up to date, many experimental and theoretical studies have
been performed to investigate the behavior of FRP-strengthened RC structures. Studying the
effect of CFRP and GFRP on the flexural and shear behavior of RC beam elements [1], strength-
ening full-scale structures [2], and investigating the role of FRP sheets on the ductility enhance-
ment of brittle RC structures [3] are some of these experimental studies. However, in spite of
tremendous theoretical studies that have been carried out and have mainly focused on the struc-
tural analysis of FRP-strengthened RC structures, and aspects related to the bonding behavior
between FRP sheet and concrete substrate, still exist some modelling issues that need to be dealt
with such as simulating the behavior of RC structures strengthened by means of FRP sheets.
Performing nonlinear static analysis on RC structures with FRP-retrofitted joints considering
lumped plasticity method [4], and modelling an eight-story RC frame with flexural strengthen-
ing [5] are some modelling cases.
The weak beam-strong column principle is the basis of any strengthening method that makes
the structure adequately ductile by evolving the plastic hinges in the beam elements. To fulfil
the above aspect in the numerical procedure adopted for nonlinear static analysis of FRP-
strengthened frames, distributed plasticity models can be implemented. However, high compu-
tational cost has made these models less efficient. On the other hand, lumped plasticity models
with low computational effort thanks to the employment of elasticity in the mid-span of the
elements and concentrating the nonlinearity in the extreme segments has gained applicability.
However, the model is less appropriate for the structures in which the position of the plastic
hinges cannot be anticipated.
An application of a recently proposed FE procedure [6] is presented here. The proposed FE
procedure runs nonlinear static analysis on RC frames. It works on the framework of lumped
plasticity and is able to find the exact position of plastic hinges along the beam/column elements.
In this work, the FE procedure is updated to account the FRP-strengthening on RC sections.
The analysis of the strengthened sections is carried out based on the Italian Guidelines [7].
Numerical applications are presented to test the efficiency of the FE procedure for strengthened
RC frame and the results are verified by OpenSees code [8].
2 MODELLING EXAMPLE
A two-floor one-bay RC frame, which was modelled by Rezaee Hajidehi et al. [6] is strength-
ened by means of externally bonded CFRP sheets. For the purpose of validation, the identical
FRP-strengthened frame is modelled in OpenSees using elements with distributed plasticity
framework, Force-Based (FBE) and Displacement-Based (DBE) elements. The cross sections
of the elements are meshed using 20 X 20 elements and Concrete02, Steel02 and Elastic mate-
rials are assigned. The full detail of the model is presented in figure 1. The results of the push-
over analysis for strengthened model are presented in figure 2 and compared with the results of
OpenSees. As it is shown in figure 2, for the Opensees model with DBE, at least 16 sub-ele-
ments are needed to produce acceptable results, while by only assigning 3 integration points the
error of the FBE Opensees model will be negligible.
143

M. Rezaee Hajidehi, G. Minafò, G. Giambanco
Figure 1: (a) The full description of the model, (b) details of the fiber section in OpenSees
and (c) comparison of the N-M interaction domain for unstrengthened (black) and
strengthened (blue) domains.
3 CONCLUSION REMARKS
An application of the FE procedure proposed by Rezaee Hajidehi et al. [6] is presented in
this work. Based on the results of the numerical application and the results of Opensees code,
the following conclusions are drawn:
1. As shown in figure 1c, the interaction domain, which was built according to CNR-
DT200, is in good correlation with the domain generated using fiber section in Open-
sees. This proves the efficiency of the procedure for taking into account the FRP-
strengthening in RC sections.
2. Comparing the results of the pushover analysis demonstrates the capability of the
proposed FE procedure for FRP –strengthened RC frames.
3. DBE models are computationally more expensive compared to FBE models. In order
to obtain reasonable results using DBE elements, 16 sub-elements are implemented
that progressively increases the computational time.
144

M. Rezaee Hajidehi, G. Minafò, G. Giambanco
Figure 2: Comparison of the pushover load vs. top displacement curves for (a) DBE models with different
number of elements and (b) FBE models with different number of integration points.
REFERENCES
[1] D. Kachlakev, D. McCurry, Behaviour of full-scale reinforced concrete beams retrofitted
for shear and flexural with FRP laminates. Composites Part B: Engineering, 31(6), 445-
452, 2000.
[2] U. Meier, Strengthening of structures using carbon fiber/epoxy composites. Construction
and Building Materials, 9(6), 341-351, 1995.
[3] S. Mahini, H. Ronagh, A new method for improving ductility in existing RC ordinary
moment resisting frames using FRPs. Asian Journal of Civil Engineering (Building and
Housing), 8(6), 581-595, 2007.
[4] A. Niroomandi, A. Maheri, MR. Maheri, S. Mahini, Seismic performance of ordinary
RC frames retrofitted at joints by FRP sheets. Engineering structures, 32(8), 2326-2336,
2010.
[5] HR. Ronagh, A. Eslami, Flexural retrofitting of RC buildings using GFRP/CFRP – A
comparative study. Composites Part B: Engineering, 46, 188-196, 2013.
[6] M. Rezaee Hajidehi, A. Spada, G. Giambanco, The multiple slope discontinuity beam
element for nonlinear analysis of RC framed structures. Submitted to Meccanica, May
2017.
[7] Research Council of Italy, Guide for the Design and Construction of Externally Bonded
FRP Systems for Strengthening Existing Structures-CNR-DT200R1-2013. Advisory
Committee on Technical Regulations for Constructions, Rome, 2013.
[8] S. Mazzoni, F. McKenna, MH. Scott, GL. Fenves, et al., Opensees command language
manual. Pacific Earthquake Engineering Research (PEER) center, 2006.
145

OpenSees Days Europe 2017 1st European Conference on OpenSees
Porto, Portugal, 19–20 June 2017
USE OF OPENSEES FOR THE VALIDATION OF A SIMPLIFED PROCEDURE FOR THE SEISMIC ASSESSMENT AND RETROFIT OF
STEEL CONCENTRIC BRACED FRAMES
Alessandro Rasulo1 and Ernesto Grande2
2 University of Cassino and Southern Lazio, Dept. Civil and Mechanical Engineering, Italy via G. Di Biasio 43, 03043 – Cassino (FR)
e-mail: [email protected]
2 University “Guglielmo Marconi”, Dept. of Sustainability Engineering, Italy via Plinio 44, 00193 - Roma
e-mail: [email protected]
Keywords: Fiber Section; Corotational Transformation; Dynamic non-linear analysis; CBFs; Seismic Assessment; Seismic Retrofit; Displacement Based Design.
Abstract. Concentric braced frames (CBFs) is one of the most used structural typology for steel buildings. Indeed, the truss mechanism, which activates in presence of lateral forces due to wind or earthquake loads, leads to levels of lateral stiffness significant higher in comparison to other structural typologies such as moment resisting frames (MRFs). On the other hand, the possible occurrence of buckling phenomena in the members of CBFs, which are prevalently subjected to axial forces, can lead to either fragile global failure mechanisms, when buckling occurs in beams, columns and local failures affects the connections, or to a significant reduc-tion of the global ductility and energy dissipation of CBFs, when buckling only involves diag-onal members. For these reasons, for a long time CBFs were not included among structural typologies of steel buildings to be used in seismic prone area. Design codes followed elastic concepts, principally assuring that the strength of each CBFs’ member was adequate to resist the external loads neglecting the contribution of diagonal in compression. Only in recent years, CBFs have been considered as a seismic resistant structural typology. In particular the capac-ity design approach inspiring the modern codes suggests provisions aimed to assure to CBFs a ductile ultimate mechanism, characterized by the yielding (reasonably distributed along the building height) of diagonals, whilst the buckling of beams and columns is prevented.
In the present extended abstract, in continuity with the previous studies performed by the Au-thors, in which a retrofit procedure for CBFs is developed and applied to some cases of study, OpenSEES (Open System for Earthquake Engineering Simulation) is used for the non-linear time-history of some CBFs in order to demonstrate the ability of the proposed procedure to carry out suitable retrofitting interventions.
146

1 INTRODUCTION Recent studies together with experimental evidences have pointed out criticisms and poten-
tialities of steel concentric braced frames (CBF) in seismic areas. In particular, it has been ob-served that plastic mechanisms characterized by the yielding of diagonals while preventing the yielding/buckling of beams and columns and the failure of connections, lead to good perfor-mances of CBFs in terms of ductility and energy dissipation. The Authors in previous papers ([1], [2]) have illustrated an assessment and retrofit procedure for CBFs. In the retrofit proce-dure different strategies are considered, all based on the substitution of diagonals with new standard profiles able to improve the global seismic performance in terms of lateral stiffness, damping and energy dissipation. The reliability of the proposed approach has been evaluated considering some realistic X-braced frames. In particular non-linear time-history (NLTH) anal-yses have been applied to obtain the seismic response of both the non-retrofitted and retrofitted braced frames.
2 CASE STUDY STRUCTURES The case study structures are three and five-story buildings with a structural resistant sys-
tem composed of four X-braced frames arranged along each principal direction of the plan (Figure 1). The case studies are characterized by the same plan (dimensions 27x11 m with six bays along x-direction and two bays along y-direction) and by equal story height dimension equal to 3.5 m. All the buildings have been designed according to [3], an old Italian code which does not provide specific regulations for CBFs, by considering an intermediate seismicity level equivalent to a peak ground acceleration ag=0.07g. The columns and the beams are character-ized by wide flange sections (HE and IPE European profiles) and the diagonals are composed of two coupled L profiles. A steel grade S235 (fy=235MPa) characterizes all members.
3 NUMERICAL APPLICATIONS The braced frames have been analyzed by performing non linear time history (NLTH) anal-
yses through the OpenSEES computer program [4]. In particular, the diagonals composing the frames are modeled following Uriz et al. [5]. Each diagonal is schematized through two (or more) force-based non-linear beam-column elements with spread plasticity and fiber formula-tion. The geometrical configuration of the elements composing the brace provides a displace-ment for the middle joint devoted to account the initial camber (see figure 2 for reference). The analysis have been performed averaging the NLTH results obtained by using seven real accel-erograms selected from the PEER NGA-Database [6]. Their selection was guided in order to assure the matching, without scaling, in average, with the EC8 [7] Type 1 elastic response spec-trum for ground Type A with peak ground acceleration (PGA) equal to 0.30 g (eve if they were subsequently scaled to comply with regulatory prescriptions). The main results obtained from NLTH analyses are presented (figure 3) in terms of inter-story drift profiles. They are derived for each accelerogram by selecting at each story the maximum value of the inter-story drift (grey thin lines). In the same plots are also reported the average inter-story drift profile (continuous black thick line) and the inter-story drift corresponding to the attainment of the maximum plastic deformation of diagonals at the selected limit state (δy/h=9εy L/cos(θ)/h; dash-dot line) and the inter-story drift corresponding to the yielding of diagonals (δy/h=εy L/cos(θ)/h; dotted line). By examining the plots, it is possible to observe that both for three and five story frames the proposed procedure allows to obtain structural solution which satisfies the requirements corresponding selected limit state, that is the maximum plastic elongation of diagonals.
147

a) b)
Figure 1: a) plan; b) braced frames
Figure 2: Schematic representation of the FEM model for diagonal braces. Left: Fiber model sections, Right: Element arrangement with middle point displacement.
Figure 3: Results derived from NTH analyses. Above: 3-story; Below: 5-story-CBF.
BRACED FRAMES
X
Y
5.5
5.5
11
IPE300 IPE300
IPE300 IPE300
HEA220 HEA220 HEA220 HEA220
HEA240 HEA240 HEA240 HEA240 HEA240 HEA240
HEA220 HEA220 HEA220 HEA220
IPE3
00
IPE3
00
IPE3
00
IPE3
00
IPE1
40
IPE1
40
IPE1
40
IPE1
40
IPE1
40
IPE1
40
IPE1
40
IPE1
40
IPE1
40
IPE1
40
4.5 4.5 4.5 4.5 4.5 4.5
27
2L60x6
2L60x6
2L60x6
2L60x6
2L60x6
2L60x6
HEA
220
HEA
200
HEA
220
HEA
200
5.5
3.5
3.5
3.5
10.5
2L60x8
2L60x8
2L60x8
2L60x8
2L60x8
2L60x8
HEA
220
HEA
200
HEA
220
HEA
200
5.5
3.5
3.5
3.5
2L60x8
2L60x8
2L60x8
2L60x8
HEA
200
HEA
200
3.5
3.5
-8 -6 -4 -2 0 2 4 6 80
0.5
1
1.5
2
2.5
3CBF3p-as built
interstory drift [%]
stor
ey
-8 -6 -4 -2 0 2 4 6 80
0.5
1
1.5
2
2.5
3CBF3p-retrofitted: K=cost
interstory drift [%]
stor
ey
-8 -6 -4 -2 0 2 4 6 80
0.5
1
1.5
2
2.5
3CBF3p-retrofitted: omega=1
interstory drift [%]
stor
ey
-8 -6 -4 -2 0 2 4 6 80
0.5
1
1.5
2
2.5
3
3.5
4
4.5
5CBF5p-as built
interstory drift [%]
stor
ey
-8 -6 -4 -2 0 2 4 6 80
0.5
1
1.5
2
2.5
3
3.5
4
4.5
5CBF5p - retrofitted K=cost
interstory drift [%]
stor
ey
-8 -6 -4 -2 0 2 4 6 80
0.5
1
1.5
2
2.5
3
3.5
4
4.5
5CBF5p - retrofitted Kold omega=1
interstory drift [%]
stor
ey
148
4 CONCLUSIONS The approach proposed in this paper aims at to provide a fine element validation of a simple
procedure for the retrofit of CBFs. Indeed the retrofit procedure has been validated on several case studies (with different story numbers) through non-linear time history analyses with a set of spectrum compatible accelerograms. The examined cases have shown the following aspects: - the preliminary phase of assessment is particularly effective in recognizing the potentialdeficiencies of CBFs, to examine the efficacy of the retrofit intervention and to analyze thelevel of optimization of the obtained retrofitting solution through an iterative process;- the propose approach allows to examine different retrofitting solutions for improvingthe seismic response of CBFs taking into account the relevant design parameters affecting thestructural response;- the performed FE analyses have shown the capability of the proposed approach in fur-nishing reliable retrofitted solutions for CBFs both in terms of limitations corresponding to theselected limit states and in terms of prediction of the seismic response;- merging the fiber section model and the corotational transformation, both available inOPENSEES, it has been possible to model the post-buckling cyclic behavior of steel diagonalsand, then, to account for this important phenomenon in the developed NLTH analyses.
ACKNOWLEDGEMENTS The first Author wishes to acknowledge the contribution by the EU funded project LIQUEFACT “Assessment and mitigation of liquefaction potential across Europe: a holistic approach to protect structures / infrastructures for improved resilience to earthquake-induced liquefaction disasters” (Project ID: 700748, Funded under: H2020-EU.3.7. “Secure societies - Protecting freedom and security of Europe and its citizens”).
REFERENCES [1] E. Grande, A. Rasulo, 2013. “Seismic Assessment of Concentric X-Braced Steel Frames”.
Engineering Structures, vol. 49, pp. 983-995.[2] E. Grande, A. Rasulo , 2015. “A simple approach for seismic retrofit of low-rise concen-
tric X-braced steel frames”. Journal of Constructional Steel Research, vol. 107C, pp. 162-172,
[3] Ministero dei Lavori Pubblici – Decreto Ministeriale del 16 gennaio 1996. Norme tecni-che per le costruzioni in zone sismiche; 1996 [in Italian].
[4] OpenSees - Open system for earthquake engineering simulation. Pacific Earthquake En-gineering Research Center, University of California, Berkeley 2006.
[5] P. Uriz,, F.C. Filippou, S.A. Mahin, 2008. “Model for cyclic inelastic buckling for steelmember”. Journal of Structural Engeenering, ASCE Vol. 134(4), pp. 619–628.
[6] European Committee for Standardization – Eurocode 8. Design of structures for earth-quake resistance. Part 1: General rules. EN1998-1-2004. CEN, Brussels: Seismic Actionsand Rules for Buildings.
[7] PEER - NGA Database 2010. http://peer.berkeley.edu/nga/earthquakes.html
149