
ons Assis and Systems - Institute of Public Utilities
384
As Di ons Assis and Systems G p ic 1 i ssi io
-
Upload
khangminh22 -
Category
Documents
-
view
0 -
download
0
Transcript of ons Assis and Systems - Institute of Public Utilities
As Di ons
Assis and Systems
G
p
ic 1 i ssi io
is report was prepared by the National Regulatory Research lnsti (NRRI) under contract to the Public Utilities Commission of Ohio (PUCO). views and opi ons the authors do not necessarily state or reflect the Views, opinions, or policies of the PUCO or the NRRI.
Reference to trade names or specific commercial products~ commodities services in this report does not represent or constitute an endorsement,
recommendation or favoring by the PUCO or the NRRI of the specific commercial product, commodity or service.
ABSTRACT
is was undertaken the estimati whether is s gni negative impact on service type
age es as a result of using a measured rate structure tele-phone. fi 1y, the question was whether the use of such a rate s re would alter telephone us in su as to significantly
in
ali r ty commun services provided. In question of measured service impact, studies comparisons
es, one with a flat rate structure (Ci ) and one measured rate structure (Cleveland), were
ior to undertaking the main of Cl was done of organizations in Columbus,
and Ci nnat; a Ohio, a city whi
y instituted measured rates. pil changes in qu onnaire
In addition to suggesting the pilot study yielded i orga ons in e the resu pil s
results do give insight
i i
resulted in in the C1
nements to the main on about the initi measu red rate
be considered impact of
pilot affect
s ies iza-
The case studies examined three like organizations in each city Two techniques were used to obtain information: the nominal group technique and interviews with upper level administration. The results of the case studies indicate only limited differences between the two cities with respect to the ways in which the telephone is used. The case studies did indicate that if measured rates were imposed on the organizations in Cincinnati, local telephone usage would be evaluated more closely and the telephone would more clearly be viewed as an economic resource with a cost. That is, the organization would examine programs that require extensive use of local telephone service and evaluate the telephone and alternative means of communication in terms of cost/benefit analyses. This potential reaction is similar to organizational behavior which already exists in Cleveland. This is, the Cleveland organizations tend to evaluate the costs and benefits of telephone usage in structuring the delivery of their services. The results of the case studies can be found in Chapter 5.
The survey technique involved lengthy interviews with organizations in Cleveland and Cincinnati. In all cases the interviews were conducted with the person in the organization who had knowledge of- the organization1s telephone usage.
The survey results suggest occasional differences between the cities for various strata. In particular, the libraries, charities and schools were most likely to exhibit variations, and the same strata tended to exhibit more reaction to measured rates (both hypothetically and in reality). However, there was no consistent pattern of response indicating any substantial negative impact from measured ratese Also, some data collected suggest that differences observed in some strata may be due to factors other than the telephone rate structure, such as management discretion. There was no significant difference between the cities with respect to the reasons for local telephone usage, and the importance of the telephone was equally evident in both cities.
In addition to directly comparing the responses obtained in both cities, the responses were restratified on the basis of various factors. The purpose of this restratification was to determine whether significant differences between cities might become apparent if each of the factors was isolated. Chapter 7 contains the results and discussion of the restratifications. The results indicate again only limited differences between Cincinnati and Cleveland, and no consistent pattern of differences.
The telephone company in each city was requested to collect and supply traffic data both for the entire city and for specific organizations. The results of the analyses that were done suggest there could be a significant difference between the cities in the actual quantity of usage, though this is not a certain conclusion. esses in the data collection, along with potential weaknesses in the methodol employed, limit the conclusions which can be drawn. A detailed scussion of the traffic data is contained in Chapter 8.
iv

In , most test procedures d not indicate a i cant between Clevel C, in the ity of services provided by soci ce data suggests that total usage is t could conclude that over long run measured
1; of service could reduce the these organizations.
v
organi ons. two ci es.
service will not number outgoing

servi ceo a chronol
v i

Chapter 1
Chapter 2
Chapter 3
Ch 4
Chapter 5
TABLE OF CONTENTS
page ABSTRACT. . . . . . . . . . . . . . . . . . . .. iii
INTRODUCTION. . . . . . . . . . . . . . ...
SOME PERSPECTIVES ON MEASURED RATE SERVICE. ". A. Theoretical Basis - Marginal Cost Pricing B. The Issues. ~
C. Other Studies ..
METHOD"AND SCOPE OF STUDY .... A. Surveys ...... . B. Design of the Survey Sample. C. Telephone Usage Data .. D. Case Studies .....
THE COLUMBUS PILOT STUDY .. Summary and Conclusions.
CASE STUDIES -- CINCINNATI AND EVELAND. A. Selecting the Organization .. B. Method. . .. ...... . C. Analysis and Interpretation D. Results of the Interviews with Senior
Administrative Staff ......... .
ix
5
5
8
12
17
19
21
24
24
25
43
Chapter 6
Chapter 7
Chapter 8
Table of Contents (continued)
COMPARISON OF USE OF TELEPHONE SERVICE UNDER A FLAT RATE STRUCTURE (CINCINNATI) WITH A MEASURED RATE STRUCTURE (CLEVELAND) --THE MAIN STUDY ......... . A. Introduction........ .. B. Organizational Characteristics . C. Size of Population Affected by
Organizations ........ . D. Size, Cost, and Management of Telephone
page
57 57
60
80
Operations . . . . . . . . . . . . . . . .. 82 E. Calling Characteristics of Organizations 86 F. Other Modes of Communication. . . . . . 93 G. Importance of Telephone Service. . . . . 93 H. Impact of r~easured Rate Service (Cleveland). 101 I. The Hypothetical Impact of Measured Rates
on the Operation of an Organization (Cincinnati) . . . . . . . . . . . . . . . . 106
RESTRATIFICATION OF SAMPLE - A FURTHER ANALYSIS OF THE MAIN STUDY DATA. . . . . . . . . . . . . . 113 A. Restratification based on IIYes li Responses
to Question 3 -- Are Outgoing Calls Necessary? . . . . . . . . . . . . . . . 113
B. Restratification based on IIYes" Responses to Question 8 -- The Relationship Between Quality of Service and Price. . . . . . . 115
C. Restratification by Budget Data. . . . . 118 D. Restratification by Number of Employees . 123 E. Restratification by Percent Professional ... 131 F. Restratification by Number of Lines 137
TELEPHONE USAGE DATA. . . . .
A. Aggregate Traffic Data. B. Local Call Count Data ..
x
145
146
Ch 9
Appendix A
Appendix B
Appendix C
x 0
Appendix E
Appendix F
x G
e
SUMMARY . . . . . A. Conclusions. B. Policy Al ves
nued)
page
153
153
161
WORK STATEMENT FOR A STUDY OF THE IMPACT OF MEASURED TELEPHONE RATES ON USAGE BY NONPROFIT COMMERCIAL CUSTOMERS .......... A-l
BRIEF PROJECT CHRONOLOGY. . • . • . . • • B-1
QUESTIONNAIRES USED IN STUDY. . . . . . . . . c-1
SUMMARY OF RESULTS PI . • • • • • D-1
THE NOMINAL GROUP TECHNIQUE. . . . . . . . . . . E-1
SUMMARY RESULTS OF MAIN EVELAND AND CINCI )............ F-l
DEMOGRAPHIC CONSI • • • • • • • G- 1

prima
divi
i , the prici
CHAPTER 1
INTRODUCTION
lyon the basis of ii va lue of service. II
service been formulated is, customers were
i classes, and the rate was a function both of the cost of supplying ass the 'Ival ue of
that class (dema ). The result was a subs tan-
ree ice discrimi on mayor not have reflected
ave
s
ti
t actual cost incurred by a ratepayerls us
n
t
VI/ i n a s e use
ice
d
areas.
T
P c
lowance;
ass,
years, however?} reflect more accu
such a techni e in related to the number of
, and distance. As a number
c tenn us ve pr i c i ng 01 0 r',
measured service ephone s
than on a
company a charge
example,
1s
as in Oh
rate
ce at
1
y
calls,
rst
are
0,
s ness
a toward pricing individual
of a class. Ful1-
try would require length of calls, time
on of this goal, lemented in many
cing is
service rates. II
i vidual to (i . e. , number
A
servi ce i a at a 1 call
Clevela 1s an i ni
ce in
exchange is $16.45 per month plus 9¢ for each call in excess of the
initial allowance of 80 calls per month.'
Use of measured service rate structures gives the ratepayer greater
control over his total bill. In addition, such rates should move the rate structure closer to the marginal cost pricing standard long
by economists for its economic efficiency (see Chapter 2, pages 6 and 7). However, since telephone bills for some would rise (while for others they would drop) under an accurately calculated MRS standard, it has been alleged that such a rate structure may force changes in the opera
tions of public or social service (and other) institutions. 2 The prima objective of this study is to determine whether the use of measured rates
as opposed to flat rates does in fact significantly affect the delivery of social services to a community.
The potential impact of measured rate service on social service organizations is an important question. These organizations fill a unique niche in our society. They provide goods and services (education,
roads, protection, etc.) that are essentially public in nature, i.e., goods that would not be purchased and supplied in optimum amounts from
private firms. In some cases these organizations also serve to help meet society1s goals of equity among its citizens.
Unlike typical business enterprises, public or social service type organizations cannot directly pass onto their customers or clients the full cost of providing service to the public. Instead, these services are typically funded either through taxes or contributions or
'See PUCO No.3, Exchange Rate Tariff, Section 2, 2d Revised Sheet No.9, August 13, 1976.
2For the purpose of this study, social service type organizations were divided into the following strata: local government agencies, state government agencies, hospitals, schools, universities, charities libraries.
2
Since changes in cost 'rough increased pri ces, some recave
; nc ciency, and/or anti
In irness, its ld
ness may have the abil ity or \Fi/i 1
in short run. However)} rm a i ng increased cost (i n
us
or qual i
be instantly 11 occur-service.
a -it making busicos
on of i ng its prof; t-
a , an op on open to the al serv"i ce
ci
can vices
nn, 1 i ke the soc; agency, can
mentioned, the objective a difference in i
increase effi-is to see if one
of al ser-di telephone rate
s
id to a community as a result 3 res.
e
measu red ci es: measu
re~ a all
s the Ci
areas c .!
es
utilizes a survey service. The study was and, Cincinnati, C
effects of
major Ohio has used a
structure since 1919. Ci uses a flat rate struc-umbus recently a measu rate structure for
rs. eus Ohio Bell
1
ephone Company, a ephone . )
pil ot study was fi d
usefulness of su
Cinei rates
ating s
x A r wo s
x B a
3
in
C· 1
4
umbus areas are is served
was used major study has recently
servi Ce re
Upon completion of the pilot study, a questionnaire was and used in both the Cincinnati and Cleveland metropolitan areas,
tra In
to us
ic
8.
ta were collected by the telephone companies in area. tion, case studies of several 1 i ke agencies were compl
ne more fully the effects of rate structure on
Comparable public service type i es were i in
Ci nnat; and, and agencies were aced into seven trata (see footnote 2, pg. 2) a statistical sign1
was
The su questionnaire sought data on amounts and ons
of customer usage under each of the rate structures. i
from the survey were used to infer' the impact of measured service p cing on telephone usage by public service institutions.
were so used to evaluate any impact on the quality of service as possible delays in service caused by using alternate forms of
communica on, "lost revenue, or other impacts related to telephone u e. In addition, total budgets and telephone budget data were
collected and examined to estimate the extent of fiscal constrai on these agencies.
T following chapter briefly explains the cal is
measured rate service and discusses the perceived advantages and disadvantages. It also contains summaries of two previous studies
measured rate structures. Chapter 3 explains the methodologies ampl and scope of full study. Chapter 4 explains the Col slot
e
discusses its results. Chapter 5 discusses the and results case es conducted in Cleveland and Cinci The
a the Cl and-Cincinnati survey are contai in Ch 6. 7 contains a further analysis of the ta
from evela and Cincinnati surveys. In 8~ Ir-/e scuss
t us Chapter 9 ns the us ons f rom the study.
4
2
SOME PERSPECTIVES ON MEASURED RATE SERVICE
is s serv; ceo
is concerned one is, how sign; cant, if 1 ~
a rate re on Neve ess, since u
1
rev i f!\N
tion, a review ce can be
A.
in Section C.
or s
soc; over measu
rst, recover i
s rm earn a new (a ir , that s re
In to ons.
ce discrimination i ire some adjus more ne s as ci
rn.
i 1 e ves are eas 11y s a 1
is so easily c 1s us
5
measu rate such
agencies. , it is
serv; ceo In
measured
general es have
true costs; necessary
the icing the fimL
are d
lic mi t
r rate.
em e-i eve goals
in a perfectly

nction ,hi ly ve economy, margi
s 11 usual d the greatest effici r
ci il e
a
t
consumer
r is given time are us
i.e. it could
cos t measu res
as a e.
en resources that max zes
consumers. resource
extra cost ing
t is a measure of the ue
t resources us (or r rtuni ty costs). to its ma rgi
this output
en consumers
e
at a price equ
to use resources a ue consumer
are in
ternaue
resources us If the ice were greater than margi iven consumer's response to higher ices), less of the would
and a less than optimal amount resources ~\loul d to its production. At prices below
consumers would natu ly increase r pu rchases, a t resources would go to that
cost the timum resource 1 on s c r soc; 1
rm's standpoint~ marginal cost icing means
e it i un i t produced the fi rm 11 recei ve i revenues s ci cover increased costs. The rational firm waul not,
0 course oose where price is less cost. T ght prefer to
t rna s earn mo y
tenn t t ei on or
ould d ice rna cost thus
E . 1
6
not excessive 2 accu ma cost pricing can , y'i d an
p it, 3
meri s
margi in
problems a va ety
p
on of soci
consumer ve
i ng ci
re is
ci achi
cost pricing is not rsu lie utili es.
is scarce resources, low for
finn a just t excessive operations.
scuss ons es the
ve economy, iee, true and complete
all firms and may be difficult the obvious and fficult
accurately defini measu ng marginal costs, there are definitional and theoreti ems associated with
cost pricing for the utili es. t one example of these ses from the that inal cost is essential a short-
i.e., the change in vari e costs for producing one addi-run ti
of
unit. Utilities, however, a high proportion
cos there arises the problem of how to treat depreciation, cost capital and other significant long-run costs under a marginal
cost s 4
i1 e rna i nal ici as an economic i it i e or possi e to utilize fully such a
prici mechanism. Nevertheless, on grounds alone, attempts move towa an imate margi -lei should encouraged
use
rna i
is assume were in a loss losses.
measured
lci Under
rm is in a ition,
75.
s e rv ice i jus t sua s
more eommo y us
cost
7
on. ci
at price
If rm would min
t maintain
ze

s re, is an ave costs for a 9 consumers
t ec in for servi ceo
n rs in a certain ass servi ce
same mo less extent to i v senti ceo asses eus are use
basis servi
eus tome
Diva 1 servi ee. I! is" ice
c
c t
ue
rate i 1 e us;
d
di
some av cost
va ations in use so moves a s i
ue servO] ce
P ci to
e
are scuss
(1 )
consumer
a to Di
towa
s
1011\1 i
y
rna
s
consumer d
extra sati
an
his s are i evi
B.
on
measu ef summa
rate services.
is
to measu rate service over his bill. consumer -1 s
one amount of money (at goal
to maxi his ues to consumer,
so extra s
a ast
ve is to as
ere consumer
a or ncome constra nt* is en are
consumer is
on.
is
pri
des i
in a manner so as
ty . Us e of fl at
prevent
rates for
the pu ase y
telephone service is one
example of such a rrier consumerls equili urn. rate
s ce gives
ratepayer eli s wo
(2)
ti in p ce
servi ce s Thi s prov;
e
(3)
ex i bil i to consumer expendi re 10\J;/s
the s on an cost.
that measu red service) as men~
i ous section, moves the telephone company oser i nal cost and begins the movement away
(a standa that creates greater price disc economic eff; ency from the s i
costs of providing telephone service d
high rate of infl on that now plagues
ins tance, over those
of capital itself in the 1970s more previous decades. 5 The Bell System suggests
service will allow custQ~er to control costs.
alternative is to raise ices, a course tern has reluctantl pursued du
es rate actions consumers and regula
ion customers th little price flexibi
ce hel ps tel offers customers an option whi the cost their basic service.
6 i Ii I onal
9
measu
cover p
a ue
(4) ndi us of services is
d vi iding those services. Us
ervices c
1s
increase
s ce, in i costs woul ncreases in revenue. us
7
( ) A
of measu
mos s
o users
(6)
clos y
is
earn revenues
a
i
measu on
~I p. 3.
ins
on
va ous
extent i
ses. It is use
users.
amounts to a S1
services,
ces r 1
idi
es are more 1 i
cos
1a
a measu
rate service as reasons
is a ief revi ew
ce
., P 6.
10
t
serv"i ces
i er users
ess i 1 i es
us more
i.8
re cite dis-
ld
or di
ainst its emen-

(1) The implementation a measured rate pricing re force changes in the operations of social and/or public service organizations that could, in turn, result in a decl'ine in the ality of services provided to a community. It is argued that implementation of measured rate service will result in high telephone the aforementioned organizations that cannot pass on their cost as can profit-maki businesses. It is alleged that the increase in ng costs would be significant enough to affect 'the quantity and qual;
programs, services, etc., that they offer.
(2) A frequent and serious criticism of the telecommuni ons industry is that the costs of providing telephone service are well defined. Further, the insufficient availability of cost data prohibits
a objective analysis of the costs on which measured rate service is based. However, critics of measured rate service defy the telecommunications industry to produce satisfactory cost data.
(3) There are increased costs and, thus~ potentially higher rates associated with a measured rate pricing structure. These increased cos derive from the need for recording messages in central ces and the even more complex accounting and billing procedures that
measured rate service necessitates. 9
(4) Measured rate service may result in variations in telephone usage relative to economic fluctuations. Consequently, telephone
company revenues would become unstable unless there was sufficient growth offset the cyclical variations.
(5) Contrary the view of the industry that a sign; revenue loss is occurring as a result of competi on, critics measured service allege IIthat exis ng competition in ca=
tions services results in a y small loss of revenues
New England Telephone ili es Control Authori
11
1 7.
l?b"d 1 1 .
in
1
what they d have paid under measured rate service, while continui to pay the fl rate tariff. Customers were surveyed regarding reactions to measured rate service before the first duplicate billing was received~
A second opi on survey was conducted after at least two duplicate billings were received. While the duplicate billing had no appreciable effect on telephone usage,13 it did significantly alter opinions.
The first survey indicated that only 16% of the resident; cus mers had a preference for measured rate serivce, while the second survey
(following least two duplicate billings) indicated 32% (of residen-tial customers) preferred measured rates. 14 Similarly the first survey reported 34% perceived measured rates as being more fair than flat rates and this figure increased to 48% on the second survey.15 For business customers those who preferred measured rates increased from 4% to 30% from the first to the second survey.16
The survey also provided some evidence of potential changes in the patterns of telephone usage. The second survey showed a change from 47% to 56% in the number of residential customers 0 would reduce
telephone us if their marginal rate billings were higher their flat rate charges. 17 In fact, 70% of all customers (in the second survey) indicated they would decrease telephone usage, as opposed to 56% from the first survey.18
1
arges remembered that customers were still paying
the survey period.
timony Mr. Ellard in the matter of General Telephone Ill; s, Exhibit No.1, Chart 8.
15Ibid ., Chart 11.
16Ibid ., p. 107.
12.
18Ibid ., Chart 13.
13
fl
Average ls 113.
Average Mi Per Call 2.94
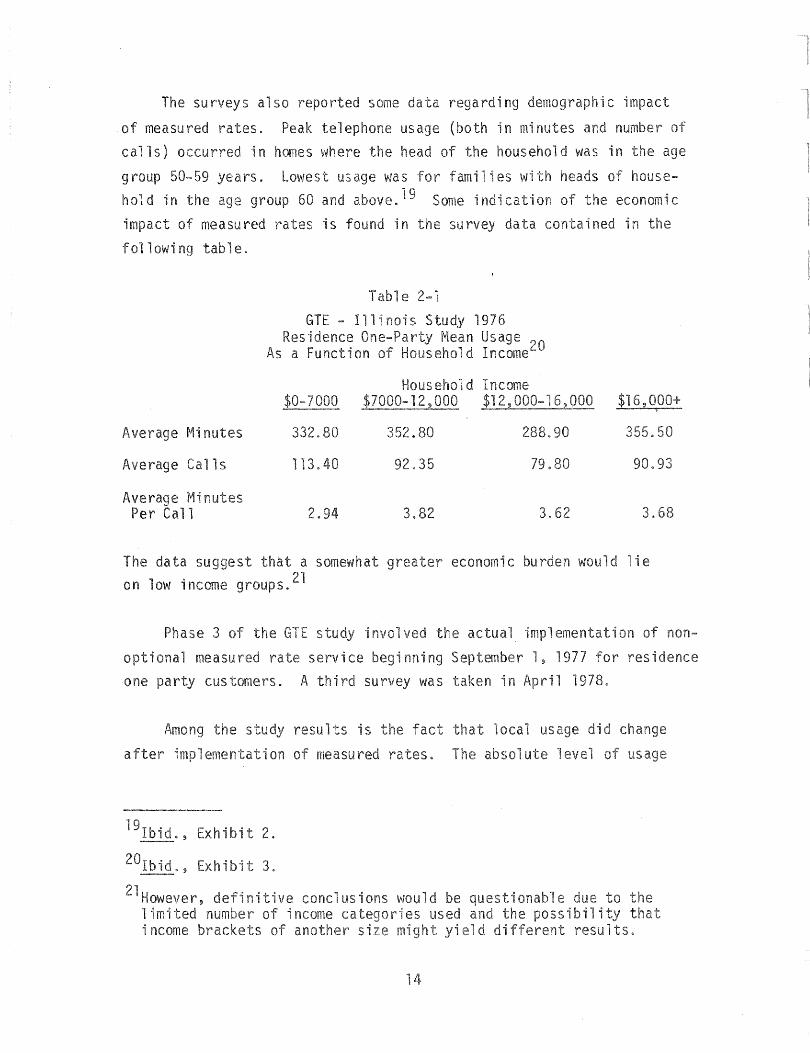
The da su a on low income
se 3 s opt; measu service one eus rs. A i su
Among resul is
a on measu
ibit 2.
ibit 3.
d
.35
3.82 3.
e
r 1 ,
was i 1
rates.
e
14
3.
d 1 i e
ion
7
1978.
did
i b i 1 i results
res;
us
non-
has been reduced, as has the variance in usage. However, there has I
been little change in the hou y pattern of use. Further, after e-mentation, the survey showed that 44% preferred measu rates~ 42% fl rates, 12% indifferent, and 2% uncertain. 22
Southern New England Telephone Study
Southern New England Telephone, in conjunction with 1 ephone Laboratories, conducted a study of usage sensitive pricing in ne electronic switching system (EES) offices in Connecticut. 23 The results were presented before the Public Utilities Control Authority (PUCA) of Connecticut in February 1977. As with the GTE study, no substantial data were collected on social service type agencies. Also, some results were somewhat contradictory results obtained in the GTE study. A review of two studies is still useful, however, for general insights gained, and also to point up the need for more definitive studies of all the issues surrounding usage sensitive pricing.
In the SNET study usage data were collected daily (24 hours a day for 1 year) and analyzed on a sample of 3,043 customers. 24 The demographic characteristics of the sample group (e.g., income, race, etc.) were generally consistent with 1970 census data for the area. The following are just a few of the study results.
22Gerald, Cohen "Implementing onal age Sensitive ci Ii
Proceedings of the First NARUC Biennial Regulatory Information Conference~ October 1978.
23Southern England Tel Study, ordered in October 1975 by, and presented to, the Public Utilities Author"ity of Connecticut in February 1977.
241748 Resi Lines and 1295 Business Lines
15
(1 ) income income
families made r 1s hi but minutes call were greater low
(2) Bla s , as 2.6 nificantly
acks) .
1 were not races (5.0 ites,
(4) i nesses (on the average) made more than twi ce as c ls month than residents, t the average nutes per 1 for businesses was less than f that residents. Thus, was no signifi difference in
usage.
(5) A June 1976 survey of Conne2ti 55% measured 0 subsc bers
25Southern New land ephone
16
CHAPTER 3 METHOD AND SCOPE OF STUDY
As previously stated, the primary objective of this study is to determine whether the use of a measured rate structure has any significant impact on the quality and or quantity of services provided to a
community by its public or social service agencies. The term quality is somewhat nebulous--its precise interpretation being subject to one1s
individual perceptions. Within the context of this study, quality was defined to refer to the following: first, how effective is an agency in either remedying a problem it is designed to remedy, and/or addressing a need it was designed to meet; second, and not mutually exclusive of
effectiveness in providing the service, is efficiency. Is the service provided in a timely manner? Is it performed in a reasonable time period, and at a reasonable cost? While more could be said about the meaning of quality as it relates to individual agencies, these general
statements suffice for the needs of this study.
Quantity refers essentially to the number of clients served, number of problems resolved, number of services provided--with the specific
meaning being a function of the objectives of the particular organization.
It is quite valid to pursue the issue of measured rate service (MRS) impact on these social agencies. In part, the need for study arises from the public's concern for such organizations. However, the issue
17

goes
p
is, . .(: 1 ! a
do 1 i
S
of
1
create
p
an pu
are
Since
cons ve
on
In ich
catego
m
ace
h
amount su in va
ei
ices
on to
r
inn stu
es or 5
, . .-;:: ,..J
'1· ,1 C
i
ere
inion.
contrast i
!I> one i nCl
one rson;
i
s caul e services
es or
it t a
rst S was to t
ons were
on i i1
ne
y seven
o er to be su strata
ass; OriS could used, t e seven were lci y
osen wer'e:
(1 )
(2) S
(3) s
(4) s ( 5 ) Un i ve rs i t e s (6) es (7) Lies
ve
ncies (ci es
1
i on
on
Having selected the strata, the next step was to define the popula
tion within each stratum. A variety of sources was used for this. The Yellow Pages listings of the telephone book (for each city) were used to define the populations of the library, university, charity, local government, and state government strata. The Ohio Educational Directory for 1978-79, published by the Ohio Department of Education, was used for delineating the school stratum. The population of the Hospital stratum was defined from the listings in A Guide to the Health Care Field 1978, published by the American Hospital Association.
The study focuses on the Cleveland and Cincinnati metropolitan areas. Cleveland is a measured rate service area, and Cincinnati utilizes a flat rate. Since the two areas have many similar demographic features, but different rate structures, it was felt that study results from each metropolitan area would provide useful compari sons. 1
The main study consists of a three-part approach: (1) surveys of sample groups in each stratum for each city; (2) quantitative count data and general usage data on subsets of those interviewed; (3) case studies of selected agencies so as to obtain more detailed information and to help check the validity of the survey results.
A. Surveys
Survey questions were designed to provide information about the following subjects for each agency surveyed.
(1) The significant reasons for telephone usage, and the importance of the telephone in accomplishing the major function(s) of the organization;
'See Appendix G, IIDemographic Considerations, II for a summary of the demographic characteristics of Cleveland and Cincinnati.
19
(2) The calling characteristics of the organization, e.g., ratio of incoming to outgoing calls, personal vs. business calls etc.;
(3) The size and costs of current telephone operations;
(4) The importance of other means of communication;
(5) Organizational characteristics;
(6) The size of the population served by the organization;
(7) The impact of measured rate service.
Before proceeding to survey the agencies in Cleveland and Cincinnati, a pilot study was done in Columbus. Any survey runs the risk of bias and ambiguity in its design, that could then nullify the usefulness of its results. One way of minimizing this risk is to do a pilot study and test the questionnaire itself. Problems with a
questionnaire can arise from several sources. The following are some primary causes of bias and error. One, the questions themselves, may be ambiguous, or they may be worded in such a way as to elicit ambiguous responses. Two, the questions may be arranged in such an order that they elicit self-serving responses. Three, relevant questions may be omitted and/or irrelevant questions included. A pilot study provides an opportunity to discover these problems and thus refine the questionnaire for greater accuracy.
As a result of the Columbus pilot study, a number of revisions were made in the questionnaire for use in Cincinnati and Cleveland (copies of the two questionnaires are contained in Appendix C):
I
some questions were rephrased to clear up existing ambiguities;
some questions were dropped altogether;
Polimetrics 2 observed that while the interviewer contacted that person in the called organization who was responsible for handling telephone services,
2Polimetrics was subcontracted to do the actual interviewing. See p. 22 for a fuller discussion of their role.
20
often the interviewee didnUt have immediate (if any) access to all the "lnfonnation needed to complete the survey. For example~ the person in charge of telephone services may not know the number of people employed on a part-time basis by the organization; an estimate of the budget for the organization; or what percentage of the organization's staff could be considered professionals, clerical. It was suggested that, for the main study, a letter be sent to all organizations that would be called informing them of sUY'vey and the types of information that would be asked of them.
The pilot study was also used to help determine valid sample sizes for the surveys in Cleveland and Cincinnati. Sample sizes for the main study were based upon the pil study responses to the five questions tested below.
An
areas.
percent in each stratum who answered that their organization could not accomplish its main function without making outgoing phone calls;
percent in each stratum answered that the quality of service their organization provides would decline if the price of a telephone call increased;
percent in each stratum who answered that besides the telephone, mail was a mode of communication used by their organization;
percent in each stratum who answered that, in those situations where ei the telephone or another mode of communication are equally appropriate, the telephone is used most often;
percent in each stratum who answered that if the telephone could not be used, there would be significant delays in the service or benefits provided by their o rg ani z a t ion.
B. Design of the Survey Sample
ini al plan was to sample to 800 es in ci Since the total population in the seven strata in cities
consisted of about 1,500 agencies, the sample size was a sig cant proportion of the entire popu1 on. Therefore in making estimates
21
about proportions of the populations answering questions specific ways, considerable precision could be gained by using a sampling plan without replacement rather than one using replacement (replacement means that
a sample element could be selected again). This meant that our sample of agencies responding in a certain way to a question would follow a hypergeometric distribution rather than the binomial distribution. There are advantages and disadvantages to each of these sampling plans. The one resulting in the hypergeometric distribution offers greater precision for given amounts of data, but the binomial distribution, being more tractable, leads to a number of standard statistical procedures for testing hypotheses about differences between strata and/or cities. It was decided that, considering the cost of data, the best plan was to maximize precision; therefore, the "without replacement" plan was adopted.
Since it was anticipated that final analysis of results would consist of identifying and testing for Significant differences between cities and between cities within strata, a test procedure was needed. The procedure devised consisted of establishing a 95% confidence interval for the proportion of a given population responding in a specific way to a question, and for the population to which a comparison was to be made, similarly to establish a 95% confidence interval. If these confidence intervals did not overlap, the difference between the proportion of the two populations to be statistically significant. If they overlap by more than .01, one declares no significant difference. Finally, if they overlap by .01 or less, the difference in proportion is declared marginal. The main reason for the marginal category is that the approximation procedures were used to establish the confidence interval. 3 The exact locations of interval endpofnts was not known precisely.
3Leo , Katz, IIConfidence Intervals for the Number Showing a Certain Characteristic in a Population When Sampling Is Without Replacement,1I Americar:L?_tat~t'L~al _Ji~.i.Q.c;_'LatJon._~Q..l:J!,_nal, June 1953, pp. 256-261.
22
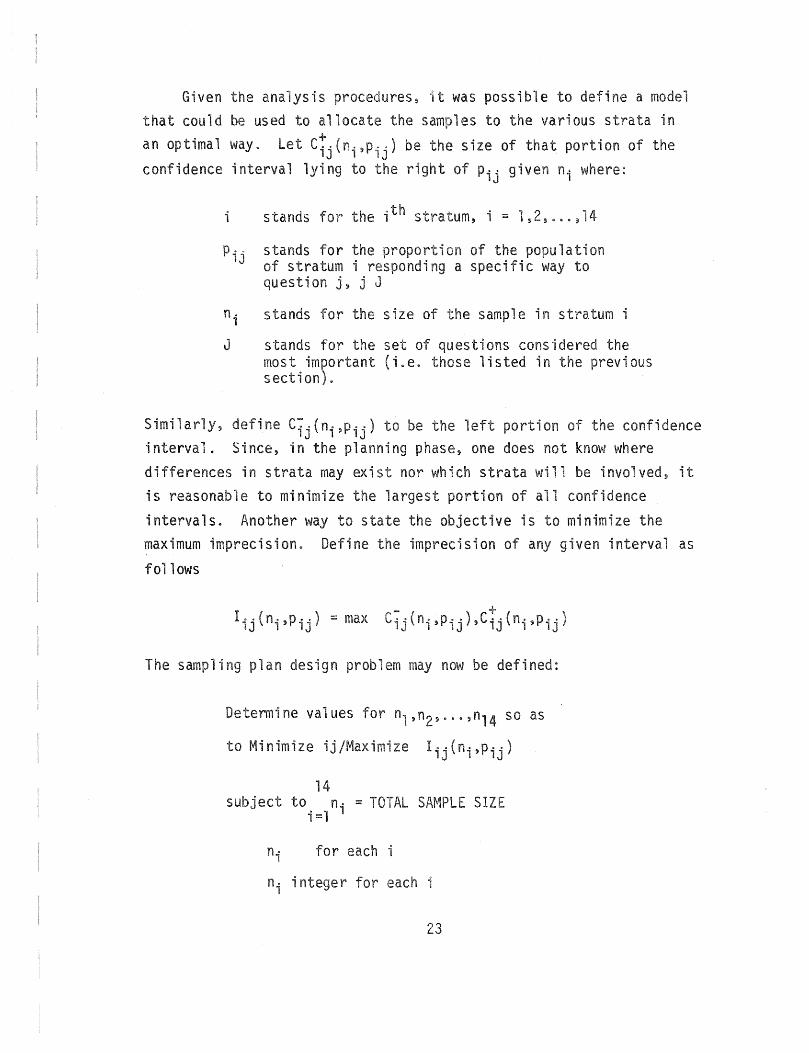
Given the analysis procedures, it was possible to define a model that could be used to allocate the samples to the various strata in
an optimal way. Let C+'"J.(n.,p .. ) be the size of that. portion of the 1 lJ
confidence interval lying to the right of Pij given ni where:
i
n· 1
J
stands for the ,th stratum~ i = 1,2,eeo,14
stands for the proportion of the population of stratum i responding a specific way to question j, j J
stands for the size of the sample in stratum i
stands for the set of questions considered the most important (i.e. those listed in the previous section).
Similarly, define C: .(n.,p .. ) to be the left portion the confidence lJ 1 lJ
interval. Since, in the planning phase, one does not know where differences in strata may exi nor which strata 11 be involved, it
is reasonable to minimize the largest portion of all confidence
intervals. Another way to state the objective is to minimize the maximum imprecision. Define the imprecision of any given interval as
follows
The sampling plan design problem may now be defined:
Determine values for n"n2, ... ,n14 so as
Minimize ij/Maximize Iij(ni,Pij)
subject to i
14 ni = TOTAL SAMPLE SIZE
for each i
integer for each
The pilot study results were used to estimate the values for Pij that may be encountered. The problem was then solved by a dynamic programming technique. 4 The resulting sample sizes served as ideal
targets for actual sample sizes. Of course, in a telephone interview process there is little control over whether each interview is successfully completed, so that obtaining an actual sample exactly equal in size to the optimal sample is unlikely. The optimal sample size is the best goal, however.
General usage information and exchange information were obtained from Ohio Bell (for Cleveland) and Cincinnati Bell. In addition, the two companies were given a list of names and numbers from the survey strata to be sampled so as to obtain an objective measure of their
usage. A sample from the middle of September to the end of October 1979 was taken. The data from Ohio Bell and Cincinnati Bell were used for analysis and correlation with survey results.
D. Case Studies
Six agencies were selected for the case study approach. While this sample number was too small to make statistical inferences, the
case study approach yields information which aids in the understanding of the effects of measured rate service on an organization1s opera
tions. The case studies involved personal interviews of the senior administration of selected agencies and a nominal group process with
a group of program directors and implementors. The approach allowed for more substantive questions and answers than were possible with the
telephone surveys. Three similar agencies in each of the two cities were selected for the case studies. By comparison of these organiza
tions, an attempt was made to delineate differences in operations that may be attributable to measured rate service.
24
CHAPTER 4 THE COLUMBUS PILOT STUDY
The Columbus pilot study was undertaken for the purpose of testing the questionnaire and the survey techniques to be used in the ClevelandCincinnati study. It provided information that led to refinements in the approach of the later study. It also generated information yielding general insights into telephone usage by the public/social service type agencies in Columbus. The sample size in Columbus was small, and technically not statistically valid, so the survey responses cannot, by themselves, be used to justify any given policy decision. However, the responses are interesting and useful to a limited extent. The survey results give an indication of the dimensions of the impact of measured rate service on the organizations interviewed. They also indicate some of the adjustments made by organizations and als'o suggest the parameters of a situation in which measured rates might have a significant negative impact.
The results of the pilot study suggest that there has been no adverse impact due to the change to measured rates. Organizations sampled in Columbus are now evaluating telephone service as a resource with a cost. This lead to more efficient use telephone service and improved intra-organizational location
telephone costs.
25
A total of 101 organizations were surveyed in Columbus. l The organizations were distributed among the strata in the following manner.
Strata
Charities Hospital s Libraries Local government School s
State government Universities and colleges
Sample Size
20
5
11
24
21
15 5
The sample sizes were detennined by estimating the percentage of the total population represented by the population of anyone stratum. This percentage was then applied to the number of interviews to be
conducted. The resulting number became the sample size for a given stratum, with the restraint that no sample size be smaller than five.
Again, it should be stressed that these are not statistically valid sample sizes (the primary objective was not to survey Columbus but to reduce problems in the Cleveland-Cincinnati study), and therefore the survey results are useful only for insights gained. A discussion of the results of the key questions follows. Complete survey results can be found in Appendix D.
The importance of the telephone itself to the agencies is clearly seen by their answers to three questions (3, 15, 16). Of the 101 organizations surveyed, 91 responded that they could not accomplish
their main purpose without the telephone. For 61 organizations, most of their contacts with the public take the form of incoming calls.
"00 samples were completed by Polimetrics, and one sample was done by the Institute because it represented a large group of organizations.
26
Eighty-four organizations responded that there would be significant delays in the service or benefits provided if the phone could not be used. The need for the telephone is well established. The question remains whether the change to measured rates has a significant negative effect on the performance of these organizations.
When asked to identify the three most significant reasons for placing local telephone calls, 66 of the organizations mentioned calls involving a service or program provided by the organization. 2 General business calls and calls within organizations were the second and third most frequently cited reasons. Since this study is concerned with the impact on the quality of service provided, more detailed observations were made of these 66 organizations. It should be mentioned that only two of these 66 also mentioned personal calls as a significant reason
for telephone usage. Cross-tabulations were compiled in order to examine the responses of these 66 agencies to other questionso
Fifty-nine of the 66 reported that their organizations could not accomplish their main function without making local outgoing phone calls. If the telephone could not be used, 53 of the 66 claimed that significant delays (11 claimed that minor delays) would result in the service or benefits provided by their organizations.
Twenty-four of the 66 (34 of 101) claimed that the quality of service would decline if the cost of a call increased. It is interesting to note that when asked if the change from flat to measured rates affected the organization's ability to serve the public, only 14 (of the 101) responded lIyes. 1I This apparent contradiction in
2Note : the results of all responses to this question can be fau on pg. 191, Appendix Do However, the figures in the Appendix represent the total number of responses and therefore differ from those discussed here that represent number of organizations.
27

responses to the two questions has several possible explanations
including: (1) the change to measured rates may not have increased telephone costs for some organizations; (2) the response may be simply
the natural response to any suggested price increase; (3) the agency may have responded to higher costs by increasing efficiency.
Of primary interest among the various questions asked were those responses relating to the impact of the change to measured rate service on the various organizations. These will be discussed in the following paragraphs.
The organizations were asked whether they were on measured rates. Sixty-nine responded they were on measured rates, 13 believed they were
on flat rates, and 19 either did not know or did not respond. Thus, 32 organizations were unaware that they are subject to measured rates.
There are several possible explanations. One possible explanation is, of these 32, 18 are schools, and schools are subject to a topping rate.
That is, their billings are based on the measured rate structure until the billing reaches a specified maximum. Under the topping rates, the
telephone billing may not exceed this maximum. (That is, having reached the maximum, additional calls will be at zero cost to the subscriber.)
It is possible that the topping rate structure may have led some schools to believe they are on a flat rate standard. A second possible explan
ation is that the change to measured rates may have had no significant impact on the organization1s telephone bills and therefore was unnoticed.
Third, it is possible that the particular person interviewed simply lacked the necessary information. Fourth, the billing procedures (e.g.,
for some city or county organizations) may be such that a particular agency is unaware of its individual telephone bill, i.e., an agency
, whose bills might be paid by the parent department. Those who were unaware of the measured rate structure were asked to respond hypotheti-
cally to those questions relating to measured rates.
28
The niza ons were asked measured rates have them.
More than one response was accepted from each interview, but a number of organizations either did not know or made no response to this estion. A total of 75 responses representing 68 organizations were recorded;
T e 4-1 contains the results. even or 39.71% organizations reported that there had been no change in the
their agency as a result of measured rates. Eighteen or 26.47%
that their costs had risen. most frequent responses occu in the 'library stratum (5 of 11 or 45%) and the hospital stratum (4 5 or 80%) .
Eigh or 26.47% of those responding reported that their organiza-tion had changed or would change their method of operation. 18
represented all strata but the s stratum. The most frequently
mentioned change referred to reduction in the use of telephone. This included simply being IImore careful II about using the telephone, limiti
the use of the telephone, designating certain lines for outgoing calls, and actual monitoring of telephone use. Some organizations reported
they were less apt to install new lines or to move equipment because of the higher costs. One organization reported that measured rates enabl them to recognize more easily when and where add; onal lines were needed. It is interesting to note that some organizations ced a
change in incom; ls, e.g., requ ng to hold, rather than call back, ng up lines more. There were more spec; c
responses from the charities and 1; es. Some charities mentioned they were using fewer volunteers in office and others they
were making no more calls from the office for residential fu drives. T 1i es are discus in the 1 parag ,since they were expanded upon in e to another on. za-tions or 17.65% reported a in this meant 1s were no 10
calls were limited, or a was pers calls.
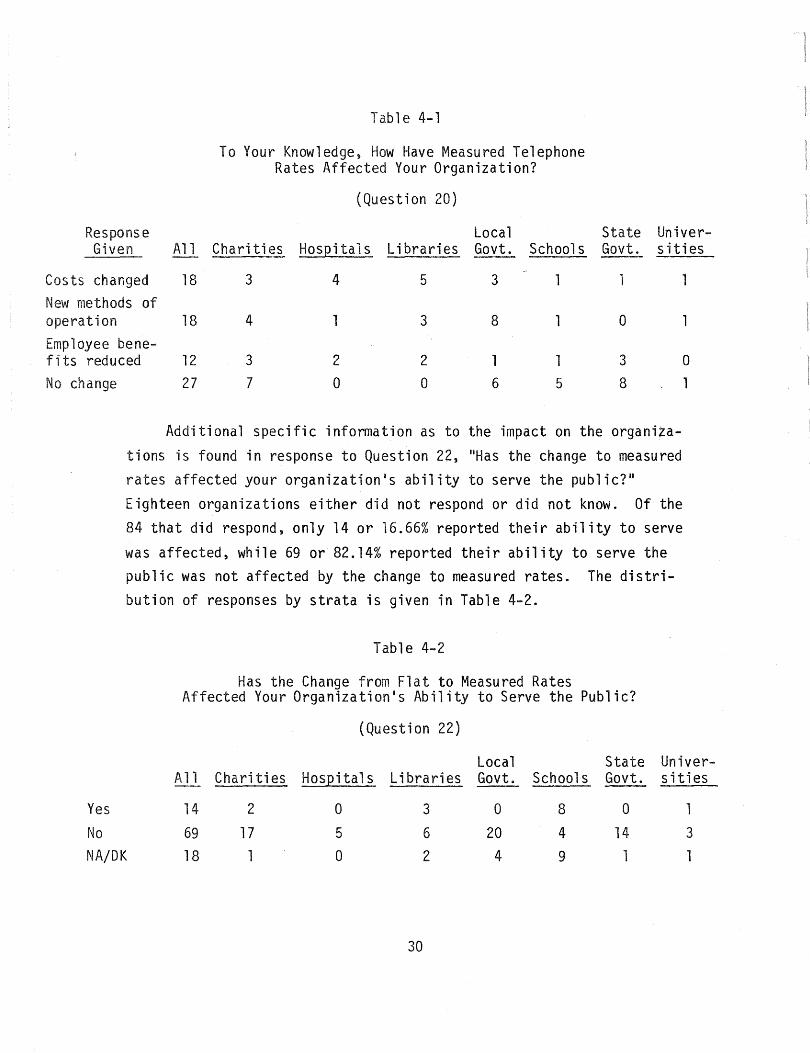
Table 4-1
To Your Knowledge, How Have Measured Telephone Rates Affected Your Organization?
(Question 20)
Response Local State Univer-Given All Charities Hos~itals Libraries Govt. Schools Govt. sities
Costs changed 18 3 4 5 3
New methods of operation 18 4 1 3 8 0 Employee bene-f; ts reduced 12 3 2 2 1 3
No change 27 7 0 0 6 5 8
Additional specific information as to the impact on the organizations is found in response to Question 22, IIHas the change to measured rates affected your organization1s ability to serve the public?1I
Eighteen organizations either did not respond or did not know. Of the 84 that did respond, only 14 or 16.66% reported their ability to serve
was affected, while 69 or 82.14% reported their ability to serve the public was not affected by the change to measured rates. The distribution of responses by strata is given in Table 4-2.
Table 4-2
Has the Change from Flat to Measured Rates Affected Your Organization's Ability to Serve the Public?
(Question 22)
0 1
Local State Univer-All Charities HosQitals Libraries Govt. Schools Govt. sities
Yes 14 2 0 3 0 8 0 No 69 17 5 6 20 4 14 3
NA/DK 18 1 0 2 4 9 1 1
30
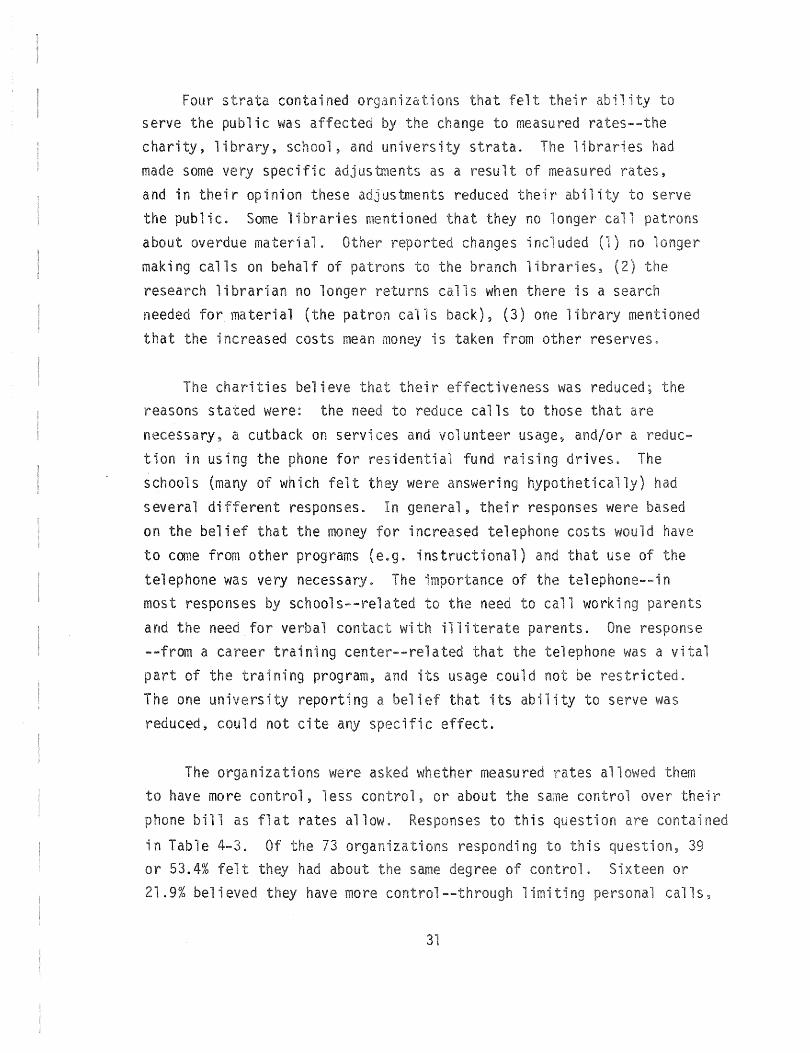
Four strata contained serve the public was affected charity, 1 i brary, school, and made some ve specific us and in r opinion these the public. Some libraries about materi making calls on behalf of
research librarian no longer
niza ons that felt r il1 by change to measured university strata. 1 i
as a result of measu ustments reduced their
they no 1
changes i uded (1) no to branch 1 i es, (2)
rns 1 s when there is a needed for material (the patron calls back), (3) one library
serve
that the increased costs mean is taken from other reserves.
The charities believe their veness was reasons stated were: the need to calls to e that are necessary, a cutback on services us ,and/or a tion in using the phone for resident; nd raising d ves The schools (many of which felt were answering several different responses. In general, their responses were on the bel; that the money for increased telephone costs would to come from other programs (e.g. instructional) and that use
telephone was very necessary. The importance telephone--in most responses by schools--related to call worki
r
and the need for ve --from a career training
parents. e telephone was a vi
part of the training program, and i coul d res The one universi l"eport i i i ability to serve was reduced, d not cite
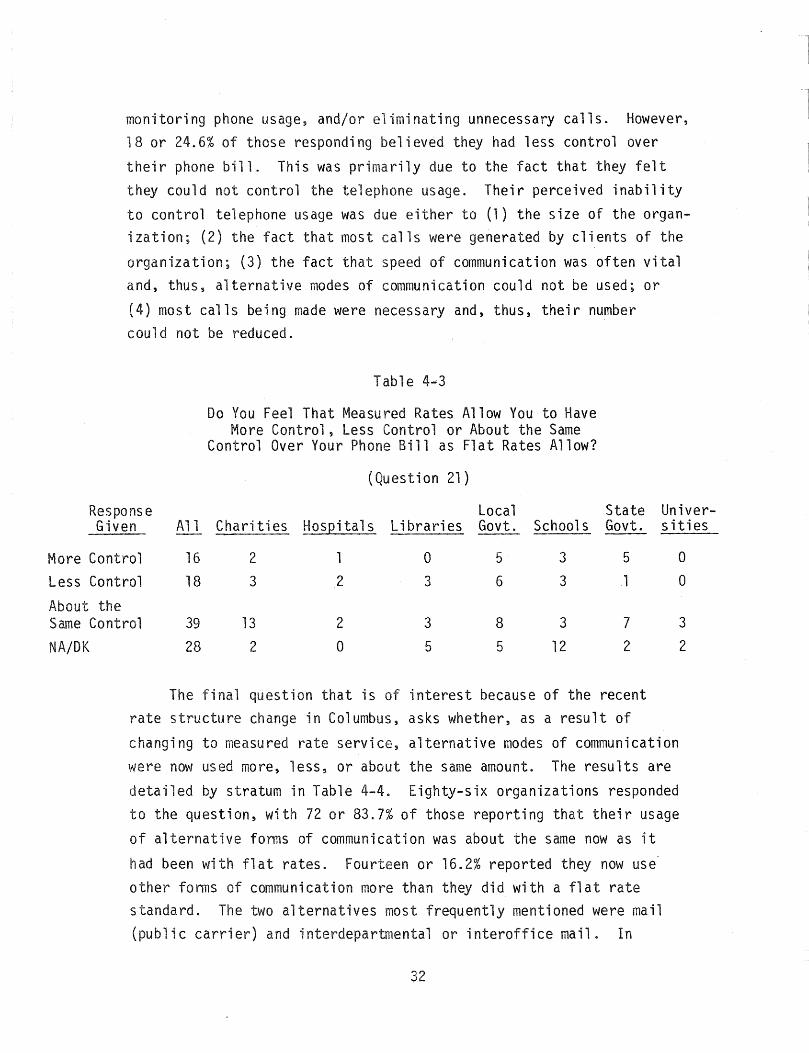
The organizations were as measu 1 have more control, less 1, or about r
phone 11 as
in Table 4-3. 73 organi is on~
or 53.4% t they had about xteen or 21.9% believed they have more 1 ls
More Less
monitoring phone usage, and/or eliminating unnecessary calls. However, 18 or 24.6% of those responding believed they had less control over
the; r phone bill. Thi s was prima ri ly due to the fact that they felt they could not control the telephone usage. Their perceived inability to control telephone usage was due either to (1) the size of the organization; (2) the fact that most calls were generated by clients of the
organization; (3) the fact that speed of communication was often vital and, thus, alternative modes of communication could not be used; or
(4) most calls being made were necessary and, thus, their number could not be reduced.
Response Given All
Control 16
Control 18
Table 4 ... 3
Do You Feel That Measured Rates Allow You to Have More Control, Less Control or About the Same
Control Over Your Phone Bill as Flat Rates Allow?
(Question 21)
Local Charities Hospitals Libraries Govt. Schools ----
2 0 5 3
3 2 3 6 3
State Govt.
5
1
Univer-sities
0
0
About the Same Control 39 13 2 3 8 3 7
NA/OK 28 2 0 5 5 12 2
The final question that is of interest because of the recent rate structure change in Columbus, asks whether, as a result of
changing to measured rate service, alternative modes of communication were now used more, less, or about the same amount. The results are
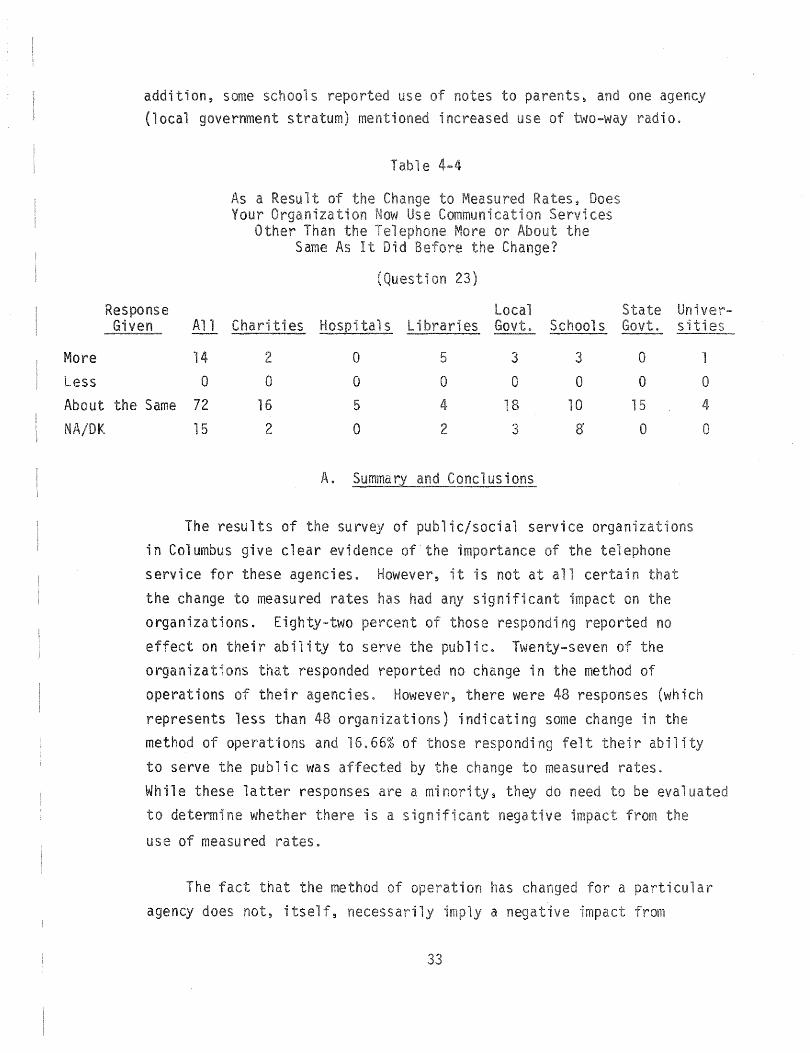
detailed by stratum in Table 4-4. Eighty-six organizations responded to the question~ with 72 or 83.7% of those reporting that their usage
of alternative forms of communication was about the same now as it
had been with flat rates. Fourteen or 16.2% reported they now useother forms of communication more than they did with a flat rate standard. The two alternatives most frequently mentioned were mail (public carrier) and interdepartmental or interoffice mail . In
32
3
2
More Less
About
add; on, some s use notes (local government stratum) menti
Response Given All
14
0
the Same 72
15
a Result Your
o
Charities
2
0
16
2
A.
o o 5
o
on
Libraries
5
0
4
2
one i o.
ces
Local State Govt. Schools
3 3 0
0 0 0
18 10 15
3 g 0
The results of the su in Columbus give elear evi
ie/social service orga ons
of the i telephone service for these agencies. However, it is not at certain the change to measured rates on organizations. Eighty-two e ng reported no effect on their ability to serve the publ"ic. Twenty-seven organizations responded reported no change in the method operations their agencies. However, there were 48 es represents less than 48 organizations) indicati some method operat ions 16.6 r
to serve the public was While these latter responses are a to determine
use of measu
The agency
is a signifi
, i tse 1 ,
ve
on a
a ve
0
4
0
ar
measu Each change , nega v y
exam; ned to determi ne it does, in iza on. were
A
i ence n cons i za t ions. c 1 s cou 1 d
i . e. ~ If
d
a
e
oned , or
eva to !il some mi t
del ivery
s ly a rna
the service provided discuss those major
ions 22,
was
to ic
services. In
i
a receive benefits pay make
veness of e~ empl de is benefit in same
benef;
Many organiza ons reported a reduction in ruse p inS! is change~ i f, does not necessarily
rse on organ; ons. It is ear now more conscious tel manner in i
u rega rded as a pas; ve result. To
1s are 1m; orga za on on resources.
t r veness is are (
libraries\) . ) . It is e
it is di cult concl i 1 i to serve
d ni It could be more i this as a e cient 1 ion of cost the service; i . e. ,
r the 1s a to hi own service.
an
it is
more
e-
s are
e
Ji. l-
now
es
drives.
that the use
thout more
have r'educed
the office deta il i
A few teers and one reside al fu
respons e is di cult to eval in of prov; by ch ty.
survey results) is at is
fund drive 1s
on
tuted. homes of
i ruse un-organize
ion, is
services
?
work of the volunteers who are no longer used in the office vi to the delivery service and, if SOli is this wo be"ing done someone
else or not bei done? Also, before a judgment is made rega ng significance of is response, one d want wh the
mentioned above, charity, in making one of the accurate analysis of the changes in cost versus the changes
A few organizations they were less 1 i y
new lines or to move equipment. Again, this i awareness the ue resources us "j
Presumably, the new lines~ etc., were not viewed as vi there is more efficiency in the use of funds. decision
or not to install new telephone i
differently from the decision purchase new
These decisions should on a t is equipment tal to the performance of the agency 11 have
benefits.
in
ve
an ts.
ins
an result.
install
iOl!sly, h
Seve carrier)
n tions an use rna i 1 ( 1 i c
e, cost less
typistis pub 1 i c
ce rna il .
it is not at 1
iation on er rna il mi t
1 .
less costly in some cases.
is
e ves
cost can
ons their cos sen as a result to measu l"ed rates. Whether cos ve impact depends on c t can incr'ease, times of gh i
c on cos
base; i. e. ~
P i
on
11 .
1
increase revenue sing suffici y
dget the increase in
1 or in part through an income government~ state universi es, or
federal gave' ...... .., .... """", ...... ) have some asti in r revenues are more 1i y to rise as cos
if it is a progress income tax}.
taxes) the libraries (dependent ) less
are dependent on contributions have a
cos
ies r revenue se
lyon
i ct-revenue growth pattern (though many the su are
sources). To the extent that revenue growth in costs, a cost increase cannot necessarily
cons i
In g
increase. It t
ncrease. 9.65. If
3
exami n1 the cost increase relative to revenue on d ven mag
remembered that the nature numbe f"'S is su y a rcentage change may represent a
example, one library (not incl in y ave before measured rates as
measu service as
increase is quite large, cost increase represents a rather
lic i1
Columbus & Franklin
1
.10
of izationis
that the higher cost can be met
of the group's operation.
gher cos will a the i cost
i
ve (1 )
is a
ci
impact y in revenue,
i bil i
in some
cases ( )
eff; ci ency, or (3) pass i cost on cl-j or customer
In summa ry, measu have on most of ies su
use of measured rates has in rna cases to a awareness telephone usage, more us an oca~
tion for some
costs of nizations.
us It has so increas cos
survey results pinpoint any examples signifi
adverse effects from the use measu rates. results do suggest a description of the parameters of a situation in su
a negative impact waul d occur. The follow; ng desc su s i-
bility. measured rates to have a s nifi e, an
organization would need to be dependent on the tel service to the public (e.g., schools and others
persons, counseling groups or services basis th the public). In addition,
be in a i on such that i revenues were tion to
the i
possi
cost for be met
would
) ;
in or cost ere in
The extent to i
impact, met.
on
costs ( costs could
savings ( increased the
ose usage could not some phase
on sian
1 i i
on a on would
in
) were h er
is
ve
y


CHAPTER 5 CASE STUDIES--CINCINNATI AND CLEVELAND
The case studies sought information on the purposes an organiza-tion, the purposes for making local telephone calls, and the organizations l
standards or measures of quality. The organizations selected for the case studies were also included in the telephone interview studies that sought the same type of information. However, while telephone survey interviewed individuals in separate, organizationally subordi units (such as branches of a library), the case study method used a nominal group technique (see Appendix E for a description of a common nominal group technique) with group members being program rectors as well as some subordinate unit personnel. Even though some of the same type of information was gathered in case study as in the telephone survey, there were some significant differences. For example, both approaches asked for reasons for mak1 local telephone calls. In the questionnaire approach, each individual was requested to list two reasons, while in the case studies as many as 50 reasons were 11
a group and then ranked by several criteria. There was group sm . working in the case studies that would be absent in indivi tel interviews.
This chapter is divided into sections. on A a discussion of the process of select; organizations
pation in the case studies. That is followed by a brief
each case was conducted, a on in; an interpretation of the results is given~ and finally resul interviews wi senior administrative is reported.
39
on
ns ci-
was cons; n ne if a case ons in would s
In this manner, three organizations in Cincinnati and three like organizations in Cleveland were selected for the case study~ All organizations were approached for their voluntary cooperation. 1
agreed to participate with the proviso that specific resul would not be purposely tied to any specific organization or indivi in the final report~
B. Method
The method for conducting the case study consisted of a modified form of the nominal group technique together with a separate interview of a senior administrator.
The formation of the group was at the pleasure of the top administrators of the organizations. Specifically it was requested that the group consist of program planners, directors, or implementors and representatives from subordinate organizational unitso It was so requested that the group consist of from 8 to 10 persons.
During the first silent generation, each group member was asked make a list of responses to the first group task was to:
IIIdentify programs (or tasks, jobs, projects~ activities, services, etc.) that require or make use of outgoing telephone calls. 1I
After a li of responses, henceforth called II ties,1I was generated by the group during the round robin and consolidating phase, the members were asked to select eight items from the list according to each of three criteria. They were asked to rank individual eight-item list according to the three ter1a. s produced three separate rank-ordered listings ranked by the 1 criteria:
41
(1) in i i i
In on were a s
If
twas i
or
in~ "I i st call II i
i n~ can-is me there were
a:
1 ) i measure as an i on is ish;
i
, a x via
vi
it ons
ip
i ons were 1 an tis
an .. adverse or beneficial effect on an activity would have a similar effect upon the corresPQnding quality measure.' Correspondence is not intended to mean that the quality measure is a direct measure of quality for that activity, but only'that there is some connection, however loose, between the two.
The rankings of individuals ~ithin a group were tested statistically to determine if they were in substantial agreement. This intragroup test is done by testing the null hypothesis that the statistic known as coefficient of concordance is zero. If the null hypothesis is not accepted then one is justifie9 i,n summing the individual ranking to determine a group1s composite ranking of the items. These tests have no interpretation except to lend val idity to the results. The
g roup I s compos i te rank i ngs are t,ested on an, intergroup, fntercri teri on, and intercity -basis in order to identify differences that may be
attr'ibutaple to telephone rate differences. These results are presented in the next section.
C~ Analysis and Interpretation
One mus t 'recognize that any exp'erimental, des ign that coll ects data
in Cincinnati and Cleveland and compares the two has the inherent weakness that the effects of di fferences ,i n telephone rate structure are compounded with effects of differences in the cities themselves. The case studies have the added weaknesses of also compounding with the
effects of differences in the organizations themselves and the effects of differences in the composition of the groups. An attempt was made to
minimize both of these effects by selecting organizations of relatively equal function and size in the two cities and by requesting six program
managers, and/or implementors and two representatives of subordinate units to be the group members in each organization. As it turned out,
the research team was pleased with the consistency of group membership except in Organization 3, Cleveland, where only four members were provided. However, those four members were a close match with the members in Case 3, Cincinnati, but the limited number reduced the breadth of representativeness and caused some problems in the ranking procedures.
43

The main element of data gathered in each organization is a rank ordered list~ ranked by specified criteria. The following coding scheme will be used to refer to these elements: organization number, city
on, list description, criteria. For example, 2SAE would refer to the list in the second (2) organization in the city in the south part
of the state (S meaning Cincinnati); the list being an activity (A)
list ranked by effect (E). The organizations are numbered in each city
so that if they match in function and size, they will have the same number. Table 5-1 gives all code definitions:
Organ; za t i on No.
1 - Not identified 2 "" II
3 ..,
II
II
Table 5-1 Codes
S - Cincinnati N - Cleveland
List Description
A - Activity Q - Quality
Criteria
I - Impo~tance
F - Frequency E - Effect
Table 5-2 lists the codes that summarize -all lists developed during the case study. The 1 eft and ri gh t col umns~,,,~ll us tra,te the match i ng pa irs.
Table 5-2 Summa ry of Lists
--lSAI INAI
INAF lSAE INAE lSQI INQI lSQE INQE
2SAI 2NAI 2SAF 2NAF 2SAE 2NAE 2SQI 2NQI 2SQE 2NQE
3SAI 3NAI 3SAF 3NAF 3SAE 3NAE 3SQI 3NQI 3SQE 3NQE
44
Two es were taken the results. consisted nonparametric correlations and concordance concordance tes were performed on each 1; if there was sufficient agreement among members
t establishment of a compos te group represent a concordance coeffici
o to 1. A ue of 0 would i as no communi between rankers, and a value of 1 would imply
rankers in the group. The t suffie;
rst
just;
to
ne
reement
a
10% significance test of the null hypothesis, HO: is
is II rejected, II one is jus fi in establ i rank i ngs, a compos i te ilgroup rank i . II I f the
rej ected (henceforth referred to as lIaccepted II) the evi to conclude that a
s p to some "true ranking. 11 In fact, evidence that there is a
that there is only a .10 probability is actually true.
ite
rej
is
sig
a null 1 i
is
It should be pointed out that even in e cases ere HO is accepted, our procedure will be to a i
proceed to the next stage of ysis.
as one established a re t members. Of course, the result is
resu 1 ts than those
group.
subsequent analysis would be interpreted in r terms tained from rankings es lished reement in
The second s of statis is consi correl at ions between group c
example, would be i
s INA! a INAF. If a ue 1 (mea ng perfect pas; ve those activi es on the list are most are so
on-
ones
c
are A
no at on
i nst
s
r' its own ever Also i
c
rest! 1 t
row
h
su most ill
ce
ire
a
lis
1n
1 "I
high
ue
an effort
1 i
be
ephone use. If
ivities on
null
Sign; cance s
on) are most
e=·
is
is 11 consist an on ze patterns or
-in ci es. In most cases niza on
are not di'rectly or ence of c 1
makeup of the 1 is ts.
gives an accounti of the number items on list on, in, and consolidation
e. Also given is coeff-j C1
vi i ngs of
nificance t. Column i
n ons. s "ign;
even a 20%
one rna rgi 1 i
y ng cases s most
measu res, in
ram. is ks lis
in re are e
i
is
null in
i
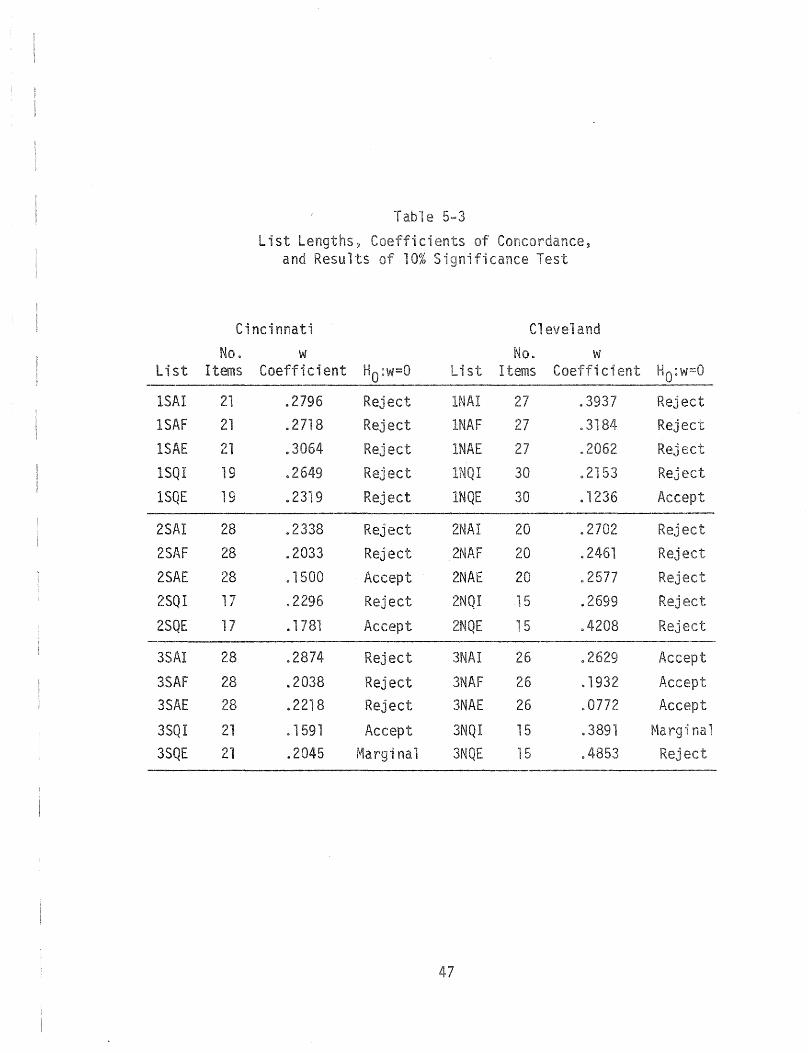
e
List a.nd Resul
Cincinnati Cl No. w
List Items Coefficient
lSAI 21 .2796 lSAF 8 27 lSAE 21 .3064 27
lSQI 19 .2649 I
lSQE 19 .2319 INQE 30
2SAI 28 .2338 20
2SAF 28 02033 Rej 20
2SAE 28 .1500 Accept 2NAE 20 .2577
25Q1 17 .2296 2NQI 15
2SQE 17 . 1781 15
3SAI 28 .2874 Reject 3NAI 26 3SAF 28 .2038 Rej 3NAF • 1932
3SAE .2218 Reject 3NAE 26 .0772
3SQ1 21 . 1591 Accept 3NQI 15 1
3SQE 21 .2045 nal 3NQE 15
47
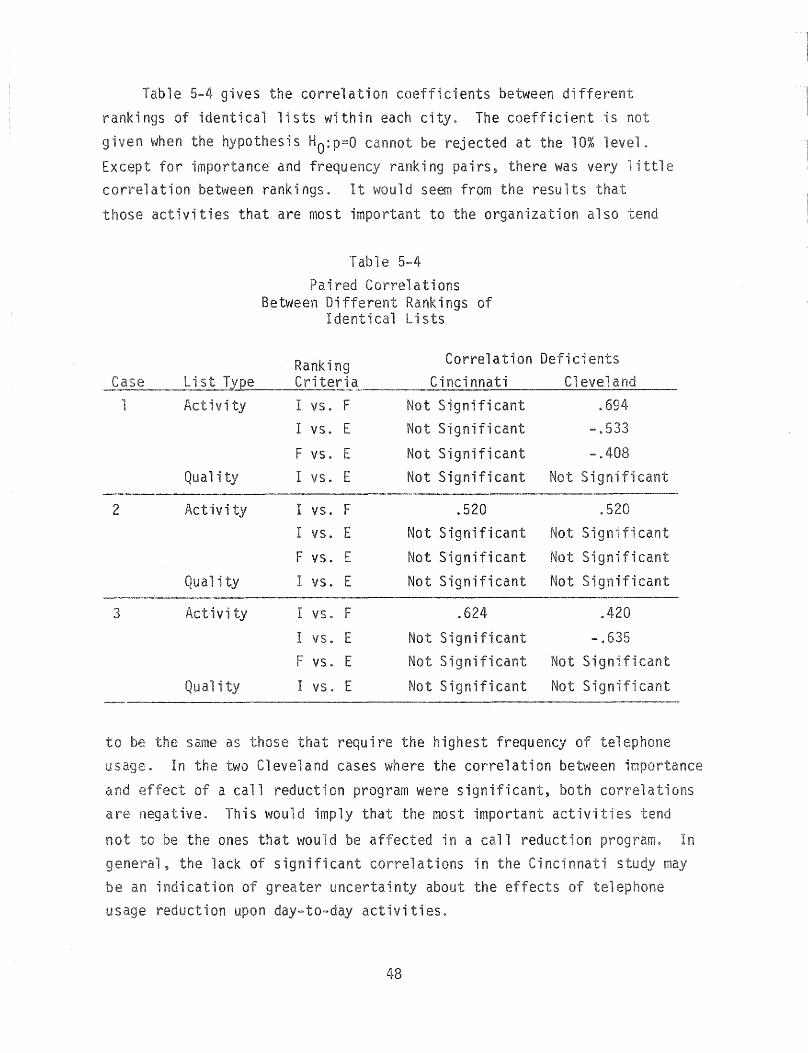
Table 5-4 gives the correlation coefficients between di ings of identical lists within each city. The coefficient is not
given en the hypothesis HO:p=O cannot be rejected at the 10% Ex t for impo nee and frequ rank i ng pa irs, there was very 1 i e cation between rankings. It would seem from the results
activities that are most important to the organ;
Case List Type 1 Activi ty
Qual i ty
2 Activity
1e 5-4
Paired ations Between Different Rankings of
Identical Lists
Ranking Correlation Criteria Cincinnati I vs. F Not Significant I vs. E Not Significant
F vs. E Not Significant I vs. E Not Significant
I vs. F .520
on so
Deficients Cleveland
.694
-.408 Sign;
.520
I vs. E Not Significant Significant
3
to
a are
Qu
same as
F vs. E Not Significant Signifi
I vs. E Not Significant Not Signifi
I vs. F .624 .420
I vs. E Not Significant -.635
F vs. E Not Significant Not Sign;
I vs. E Not Significant Not Sign;
e that require the highest frequency Cleveland cases where the correlation between
1 reduction program were significant, bo This would imp the most important activi
n to ones that would be affected in a reduction general, the lack of significant ations in Cinci be an i cat"ion uncertainty the us reduction n day-to-day ivi es.
48
cant
The s larity of Case 2 results the two ci es is interes in that both were state agencies that perform standardi ons as
directed centrally from Columbus. One simila cases in bo cities is the fact of no ation
quality measures and the a ion ram If, as indicated, these correl
the quality measures that waul
from zero,
call reductions are independent of their impo is means effort to
local telephone calls may adversely qual; ce rega rdl ess of how important i was.
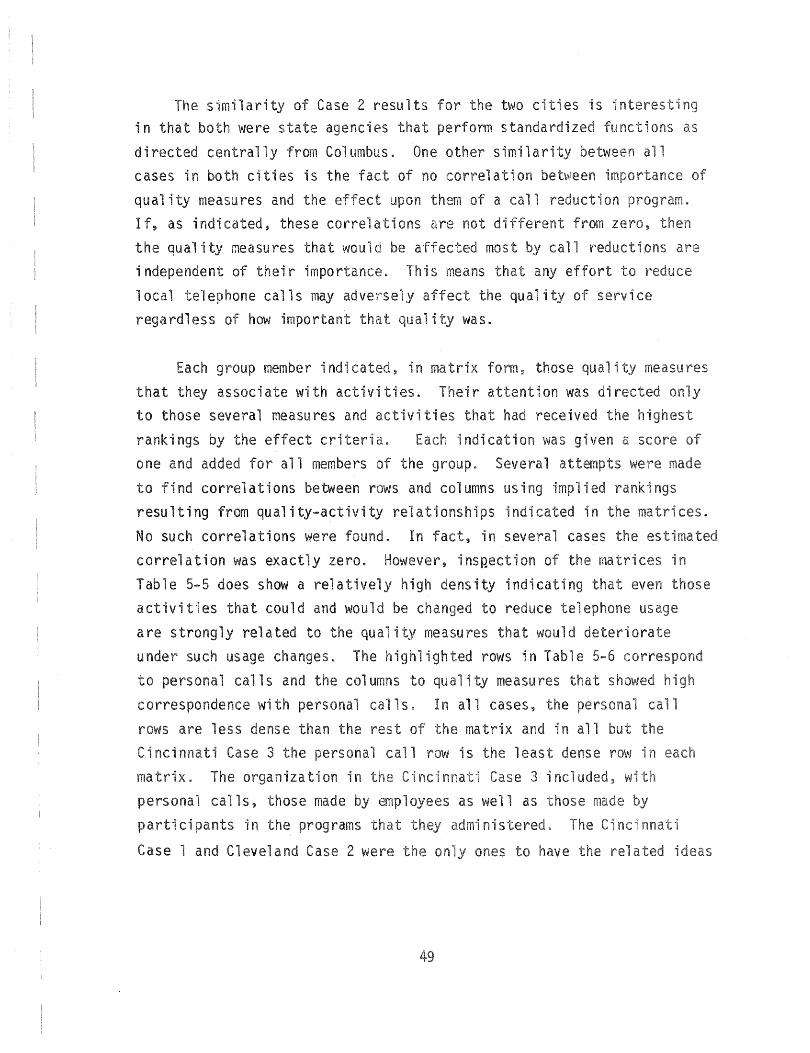
Each group member indicated, in rna x , those i measures
that they associate th vities. Their attention was y
to those several measures and vi es received the hi rankings by the effect teria. indication was given a score one and added for all members of the group. Several
to find correlations between rows and umns usi i ed i
resulting from quality-activity relationships "indicated in the ces.
No such correlations were found. In fact, in several cases correlation was exactly zero. , insQection of ces in
Table 5-5 does show a rela vely high ity indicati e activities that could and would be to us
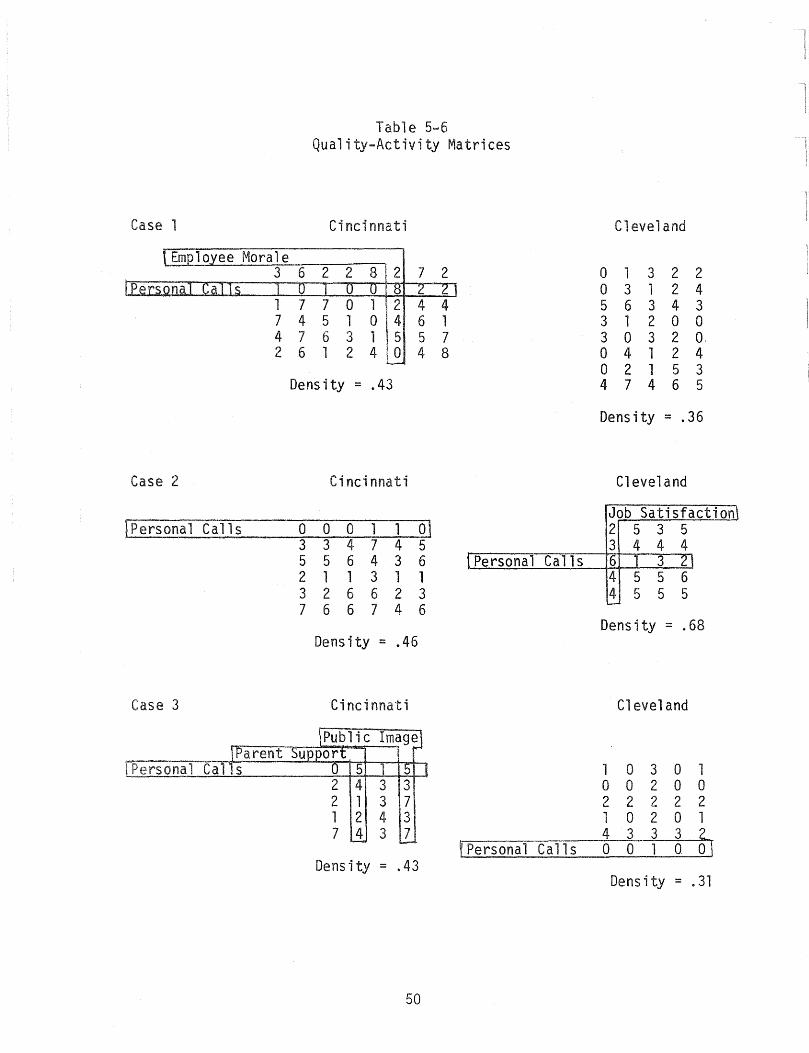
are strongly related to the qu ity me3sures that would orate under such usage changes. The highlighted rows in Table 5-6
to personal 1s and the columns to qu ity measures that
correspondence with personal calls. In all cases,
rows are less dense than the matrix Cine; 3 the is least ma The o rg ani z a t ion in 3
pers ls, those made as well as participants in rams nis Cincinnat
Case 1 and and 2 were y ones
Case 1
1 7 4 2
Case 2
[Persona 1 Calls
Case 3
7 4 7 6
Table 5-6 Quality-Activity Matrices
Cincinnati
2 2 8 ' 2 7 2
7 0 1 '2 4 4 5 1 0 4 6 1 6 3 llJ] 5 7 1 2 4 ! 0 4 8
Dens ity :: .43
Cincinnati
0 0 0 1 1 0' 3 3 4 7 4 5 5 5 6 4 3 6 \Personal Calls 2 1 1 3 1 1 3 2 6 6 2 3 7 6 6 7 4 6
Density:: .46
Cincinnati
tPersonal Calls Dens i ty :: .43
50
Cleveland
0 1 3 2 2 0 3 1 2 4 5 6 3 4 3 3 1 2 0 0 3 0 3 2 O. 0 4 1 2 4 0 2 1 5 3 4 7 4 6 5
Density:: .36
Cleveland
Job Satisfaction\ 2 5 3 5 3 4 4 4 6 1 3 2\ 4 5 5 6 4 5 5 5 '--
Dens i ty :: .68
Cleveland
1 0 3 0 1 0 0 2 0 0 2 2 2 2 2 1 0 2 0 1 4 3 3 3 2 0 0 1 0 0\
Dens i ty :: .31
of e ion on r i 1 i r <I
oyee was an i
9 serv'i ceo In s e persona 1 d
P 1s on of as it was s i 1 on e of discussion a t
they icy i nst i ng e
loss in t'ime a 1 i ne, i ng some users of r e through. No on was made that measu were a in
i
now proceed with is, an on t i vi 1 i to detect s 1m; 1 a a e measured rates. This 11 be on a bas is.
The act i v i ty 1 i for two cities were rema y
s one stri ng ons an extens ve
p ram users of the; Y' to tiona it was case an would an outgoing call in order an answer In C1 is was not the case as administration had i
gui long its ld take to answer a on so had If the
were given an answer. i
has e a es,
i i
i
is s1 e
p rams in us so y
p lace receives s ion from
In the case of this organiza on, there are a number of subordinate
o tions a central administration, all of which exchange
records and infomlation concerning their activities and concerning users of their services. In Cincinnati several activities were mentioned
that had to do th ve fication of their records and requesting instruction about the sposition of i rmation. In Cleveland, such activities were not mentioned although a highly important activity category in C1 and was general management subordinate units. Both cities
1 i sted pers management as the second most important activi ty that 9 outgoi telephone calls ile acquisition of materials was lis first in Cleveland and sixth in Cincinnati. Both cities listed a n r of special programs aimed benefiting particular segments of t local population. Although some of these programs were similar, e city d several unique programs. Collectively, these programs ranked fau in frequency of telephone use in both cities.
As noted before, personal calls were mentioned in Cincinnati but not in Cleveland, and Cincinnati was experimenting with a new procedure
one of their standard functions that seemed to require a great deal of calling. It was ranked first in frequency of telephone use but was low in the importance rank; It was also listed first as a program
would ve the la t change in a call reduction program.
Cleveland had no similar procedure and would not consider it because of the cost of 1ng.
equal; lists in two cities did not differ in general content. e a list tended to contain specific and measu rab 1 e
a es could so have productivity measures. The Cin-e; list included more ge items that would themselves be
difficult measure, such as public image, morale, absence of com-plaints.
It is interesting
telephone i ew
note that the most mentioned activity in
r strata containing the Case 1 organ-iza on was the same item lis first in both cities. The second
52
most mentioned activity in the telephone interview was contact between subordinate organizations and the central organization. This category corresponds to several highly ranked but more specific items listed in the cases such as general management of subordinate organization, personnel management, infonnationjdata exchange.
It would appear from the accumulation of all of this information that, other than in minor details discovered in the cases, there is relatively little difference in what these organizations do and how they do it with respect to telephone usage. Except as noted, the differences that do exist are inconsequential in their effect upon the overall quality of the services being provided. At least this study has turned up no data to the contrary.
Case 2 .. There was no perceptible difference in the activity 1 ists in the two cities. The Cincinnati list was longer and more detailed but all items would fit well under the more categorical list developed in Cleveland. Furthermore, the same items appeared at the top of the importance ranking and the frequency of calls ranking. Personal calls were listed in both cities and were ranked slightly higher on the frequency list in Cleveland than in Cincinnati. Both cities put personal calls as the most affected activity in the event of a call reduction program. As mentioned earlier, these organizations are state agencies, and in their case do not provide any services directly to the public. Instead, they relay policies from Columbus to the local agencies that do provide a direct service. They then help in the clarification and administration of policy and perform certain quality control checks.
They do contact the public to resolve difficulties and investigate certain issues. Their activities and procedures are centrally determined in Columbus and are relatively standard. The cost of local telephone service does not seem to have been an important consideration in the
design of their procedures.
If the cost of local service became a significant enough factor to cause a call reduction program to be implemented, both ci es indicated that response time, timeliness and accuracy of reports, and
53
ng deadlines were among i icators of ality that would
s
as 1y Cleve"land lis
factor and
job satisfaction and public
icators that would be most affected su a progr'am.
was s
in, it i i ing to ephone su ) the most contact i ents, cus tomers, most common response was
in the strata mentioned reason to make calls
, and employees. The ing other governmental agencies.
results were not different the two cities and agree with highest rated activities listed in the case studies in that the more
detailed activi es developed in the case studies would fit logically in either of the two categories given above.
services provided these two organizations are
d1 by the public. Both organizations had a number of special p rams aimed specific segments the population such as the elderly,
h capped, children, and disadvantaged. Most of these services are
organized and involved groups thus involving a great deal of planning, s ling, arrangements, user contact. This sometimes required the
a of trans on especi 1y for the elderly~ handicapped, a others. Also, both programs use of a large number of vol un-
the need for telephone contacts on a regular thus increasi basis. The list activities generated these two organizations had
no
Cincinnati frequ ass ;g
n
were was
was one that
Three of the five activities in the consisted of special programs and event
ling. Volunteer contact was sixth while general on was first. so first in Cleveland was
onal communication, but arrangement and scheduling Od enough complaint investigation
a e to program inquiries
It s ld i this Cleveland case only members the nomi nal group technique
all with different jobs. This did not seem to affect the quality of the lists generated during the round robin phase as it was just as long and wide ranging as the one generated in Cincinnati. However, the rank orders obtained from the Cleveland group may be suspect.
Although~ again there was no perceptible difference in what these two organizations do nor in their use of the telephone to do it, there is a significant difference in procedure. Both organizations have subordinate units serving different parts of their respective cities and in Cincinnati many programs are planned, arranged (including volunteer and participant contact), scheduled, and executed by these subordinate units. In Cleveland, all of these activities except the execution are done centrally. There is almost no need to make outgoing calls in the subordinate units in Cleveland except to contact the central administration (a centrex call for some units).
Both organizations mentioned the same sorts of things or measures of quality and were in general agreement about the effect of a call reduction program on these measures.
In the telephone questionnaire, the stratum that these cases came from listed only two purposes for using the telephone with relatively high frequency (no difference between the cities). Those responses were classified in the categories contact clients, customers,
patrons, employees, and information (exchanged, acquired, sought). These two categories could certainly have described the more detailed results at the top of both ci est lists.
D. Results of the Interviews with Senior Administrative Staff
This section of the chapter requires some qualifi ons.
interviews th upper 1 administrators are not intended to be statistically sig ficant samples of our population. In fact, the entire chapter should be viewed in the same light.
As mentioned above, we selected several IIlike li organizations in Ci nnat; and Cleveland, in each organization we used the nominal 9 technique that was discussed above. In addition, we interviewed
an upper level administrator asking many of the same questions used in our telephone survey_ The most sig ficant result from the interviews
related to the IIthought process. I! In every organization under flat rates, the upper level administrator stated that he would reevaluate programs that used the telephone for local calls if the rate structure changed to measured rates. The reevaluation would consider using bulk
mail or other means instead of local telephone calls. However, in mos t cases, many felt that programs ~NOU 1 d not change. The key va ri ab 1 e
for our purposes is cost. Organizations switching from flat to measured s ce would, probably for the first time, view local telephone service
as a resource with a cost.
Another significant finding (that again relates to cost) with respect to quality of service relates to response time. Most of the
organizations under flat rates believed that the only reduction in quality of service provided by the organization would be in delayso
These delays would be due to using alternative means of communication. However, the key element in the quality of service effect is still the
uation of programs. Programs that require a quick response time P y would still use the telephone. In the measured rate area, the
lack of quick response time due to measured service was not evident. In dition, most organizations did not feel that going from measured
serv ce rate structure to a flat rate structure would affect the quality service. Further, these organizations would not immediately add
sees due to a change in structure. Probably the most significant fi when we analyze all responses by organization is that the rate
structure of local telephone service is not a major consideration, although switching to a measured rate structure does upgrade the
consi ration given telephone services as a resource.
56
CHAPTER 6
COMPARISON OF USE OF TELEPHONE SERVICE UNDER A FLAT RATE STRUCTURE (CINCINNATI) AND A MEASURED
RATE STRUCTURE (CLEVELAND)--THE MAIN STUDY
A. Introduction
The initial constraints of the project indicated that 800 interviews would be the most appropriate. We determined that 800 interviews were optimal given the length of the interviews conducted in the CQJumbus pilot study, the total time frame of the project, and the total dollars available for the project. Using the statistical method described in Chapter 3, we developed a program to yield the optimal size of the sample given the size of the population and the desir~d confidence interval. The analysis indicated that the 800 interviews would be required;, 346 interviews in Cincinnati and 454 in Cleveland. The population size of the individual strata dictated the results. It was felt that the results of the sample division were also appropriate on demographic grounds, that is, more samples in the large metropolitan area. Table 6-1 is a summary of the sample size that was attempted in each area.
57
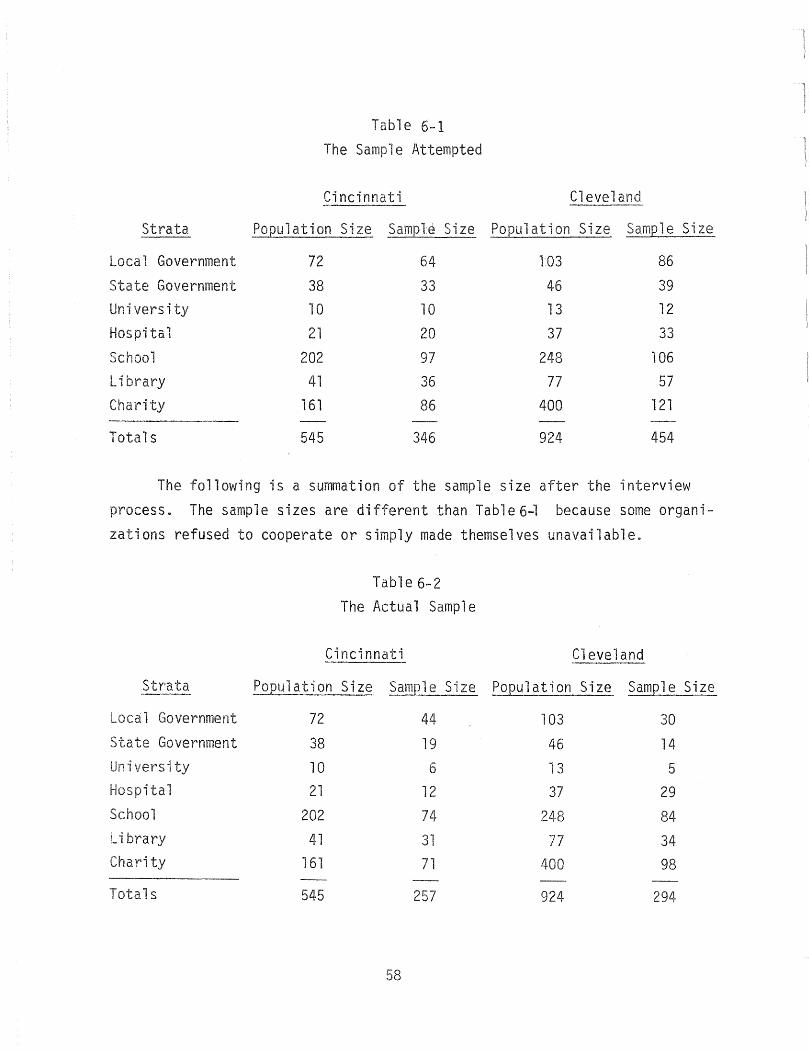
Table 6-1 The Sample Attempted
Cincinnati Cleveland
Strata Population Size Sample Size Population Size Sample Size
Local Government 72 64 103 86
State Government 38 33 46 39 University 10 10 13 12 Hospital ..." 1"\1"\ 37 33 '-I LU
School 202 97 248 106 Library 41 36 77 57 Charity 161 86 400 121
Totals 545 346 924 454
The following is a summation of the sample size after the interview process. The sample sizes are different than Table 6-1 because some organ izations refused to cooperate or simply made themselves unavailable.
Table 6-2
The Actual Sample
Cincinnati Cleveland
population Size SamQle Size Population Size Sample Size
1 Government 72 44 103 30 Government 38 19 46 14
iversity 10 6 13 5 tal 21 12 37 29
School 202 74 248 84 Library 41 31 77 34 Charity 161 71 400 98
Totals 545 257 924 294
58

Clearly, Cincinnati had a better response rate -- 342 interviews were attempted and 257 were completed while in Cleveland 458 responses were attempted and 294 completed. Table 6-3 compares the attempted sample to the actual sample achieved.
Strata Local Government State Government University Hospital School Library Charity
Totals
Table 6-3 Comparison of Attempted Sample to Actual Sample
Cincinnati Cleveland Attem~ted ComEleted Atteml2ted Com121eted
64 44 86 30
33 19 39 ' II 1'+
10 6 12 5
20 12 33 29
97 74 106 84 36 31 57 34 86 71 121 98
346 257 454 294
As one can see, there is no distinct pattern, other than 74% of the organizations interviewed tn Ctnci'nnati responded and 64% of the organizations in Cleveland responded. In general, the organizations in Cincinnati were more cooperative than those tn Cleveland 1n the interview phase. However, we do not view the problem as stgntftcantly affecting the results of this study. The total population for the study was 1 ,469. A total of 551 samples was completed. Therefore, our sample represents 38% of the total population, a significant per~ent. In addition, we should note that some organizations interviewed served or represented more than one organization. That means that the sample represents more than 38% of the population.
The following sections, Band C, on organizational characteristics and size of the population affected by the organizations are presented in order to strate that two cities are comparable. Sections C through G demonstrate that there are few differences in the way the telephone is used to provide the ces of the organizati'on. The nal sections H and I show that a change in rate ture will probably not affect the lity of service provided by social service type organizations.
59
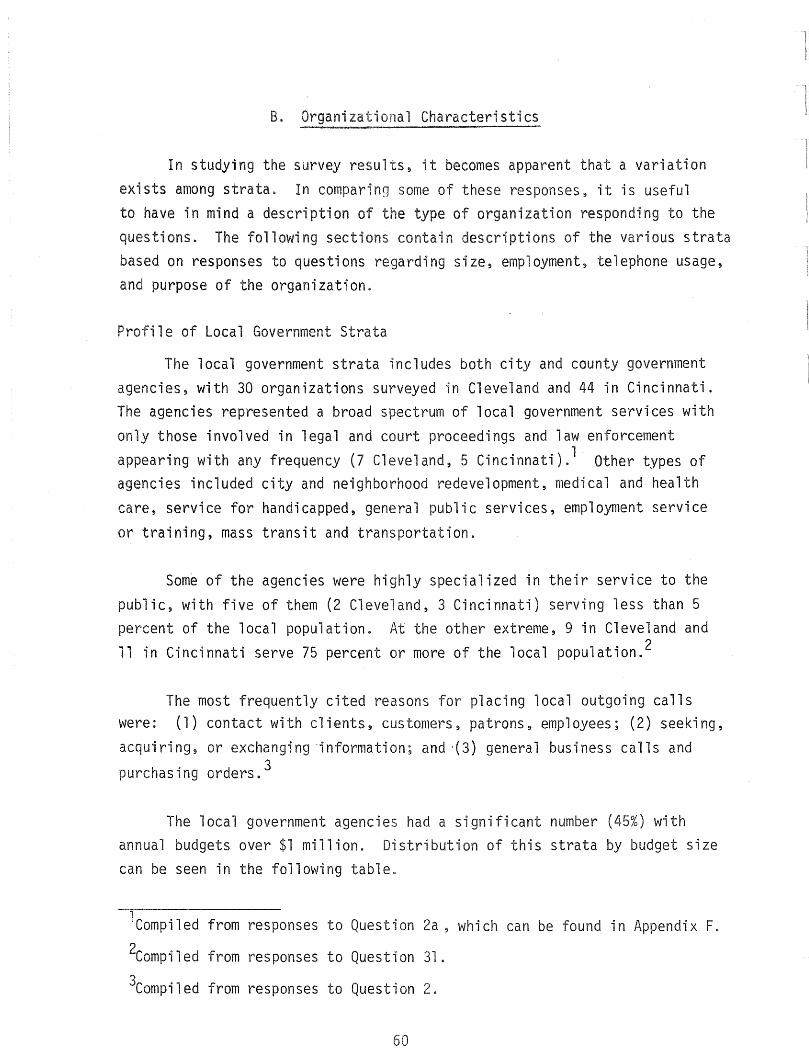
B. Organizational Characteristics
In studying the survey results, it becomes apparent that a variation exists among strata. In comparing some of these responses, it is useful to have in mind a description of the type of organization responding to the questions. The following sections contain descriptions of the various strata based on responses to questions regarding size, employment, telephone usage, and purpose of the organization.
Profile of Local Government Strata
The local government strata includes both city and county government agencies, with 30 organizations surveyed in Cleveland and 44 in Cincinnati. The agencies represented a broad spectrum of local government services with only those involved in legal and court proceedings and law enforcement appearing with any frequency (7 Cleveland, 5 Cincinnati).' Other types of agencies included city and neighborhood redevelopment, medical and health care, service for handicapped, general public services, employment service
or training, mass transit and transportation.
Some of the agencies were highly specialized in their service to the public, with five of them (2 Cleveland, 3 Cincinnati) serving less than 5 percent of the local population. At the other extreme, 9 in Cleveland and 11 in Cincinnati serve 75 percent or more of the local population. 2
The most frequently cited reasons for placing local outgoing calls were: (1) contact with clients, customers, patrons, employees; (2) seeking, acquiring, or exchanging 'information; and '(3) general business calls and
purchasing orders. 3
The local government agencies had a significant number (45%) with annual budgets over $1 million. Distribution of this strata by budget size can be seen in the following table.
'Compiled from responses to Question 2a , which can be found in Appendix F.
2Compi 1 ed from responses to Question 31 .
3Compiled from responses to Question 2.
60

Table 6-4 Local Government
Estimated Annual Budget*
Under $25,000- $100,000- $500,000- Over $25,000 $100,000 $500,000 $1 million $1 million
Cleveland 0 2 6 5 9
Cincinnati 1 3 11 5 18
*Source: Responses to Question 29.
The typical local government agency in each city operates with less than 500 full-time employees and less than 50 part-time employees .. Also, typi ca l1y, --50' 'lH~r-ce-rit --or -Tess a-fe-11prores'si anal sTr- aifo-50 perceYlt--or less are II cl erica1. 11 Details of the employment characteristics are found in the fotlow-ing tables. It should be mentioned that three of the local government agencies also use volunteers.
Table 6-5 Local Government
Number of Full-Time Employees*
Cleveland Cincinnati
Less than 100
13
; 32
100-500
13
9
*Source: Responses to Question 24.
Table 6-6 Local Government
500-1000
1
2
Number of Part-Time EmElo~ees*
Less than 50- 100- 500-None 50 100 250 1000
Cleve1and 12 9 3 1 a Ctncinnati 14 19 1 1 2
*Source: Responses to Question 25.
61
Over 1000
2
1
Seasoned or Variable
3
3
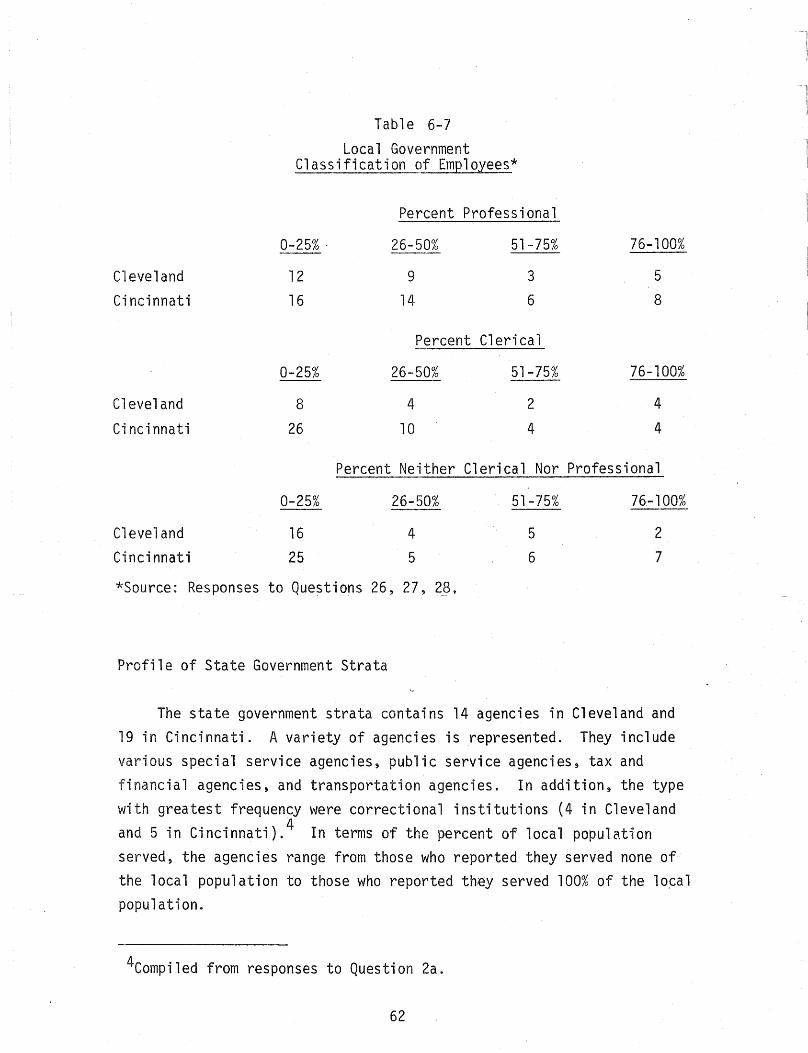
Cleveland Cincinnati
Cleveland
Cincinnati
Table 6-7 Local Government
Classification of Employees*
Percent Professional
0-25% ' 26-50% 51-75%
12 9 3
16 14 6
Percent Clerical
0-25% 26-50% 51-75%
8 4 2
26 10 4
76-100%
5 8
76-100%
4
4
Percent Neither Clerical Nor Professional
Cleveland Cincinnati
0-25%
16 25
26-50%
4
5
*Source: Responses to Questions 26~ 27, 28,
Profile of State Government Strata
51-75%
5
6
76-100%
2
7
The state government strata contains 14 agencies in Cleveland and 19 in Cincinnati. A variety of agencies is represented. They include various special service agencies, public service agencies, tax and financial agencies, and transportation agencies. In addition, the type with greatest frequency were correctional institutions (4 in Cleveland and 5 in Cincinnati).4 In terms of the percent of local populCttion served, the agencies range from those who reported they served none of the local population to those who reported they served 100% of the lo~al
population.
4Compiled from responses to Question 2a.
62
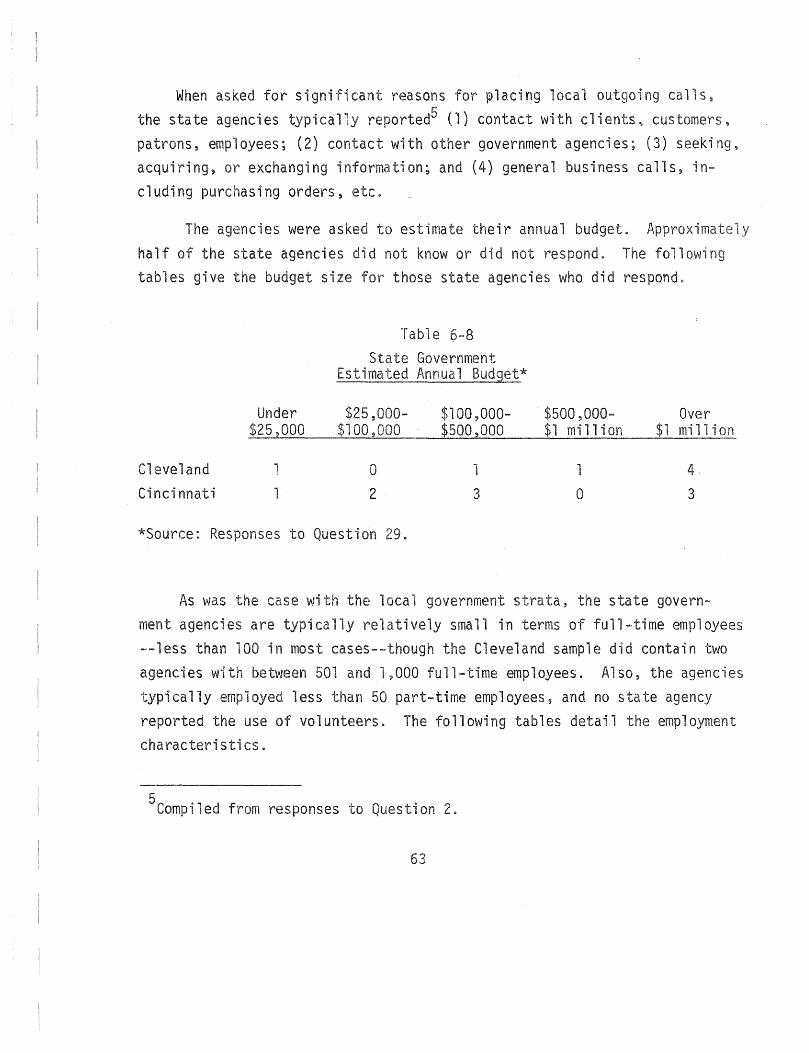
When asked for signi cant reasons for placing local outgoing calls the state agencies typically reported5 (1) contact with cl'ients, customers~ patrons, employees; (2) contact with other government agencies; (3) seeking, acquiring, or exchanging information; and (4) general business calls, including purchasing orders, etc.
The agencies were asked half of the state agencies
estimate their annual budget. Approx d not know or did not respond. The followi
tables give the budget size for those state agencies who did respond.
Table 6-8
State Government Estimated Annual Budget*
Under $25,000- $100,000- $500,000- Over $25,000 $100,000 $500,000 $1 million $1 million
Cleveland 1 0 1 1 4 Cincinnati 1 2 3 0 3
*Source: Responses to Question 29.
As was the case with local government strata, the state govern-
y
ment agencies are typically atively small in terms of full-time employees --less than 100 in most cases--though the Cleveland sample did contain two agencies wi between 501 and 1,000 full-time employees. Also, the agencies typically oyed less than 50 part-time employees, and no s te agency reported the use of volunteers. The following tables detail the employment characteristics.
5Compiled from responses to Question 2.
63
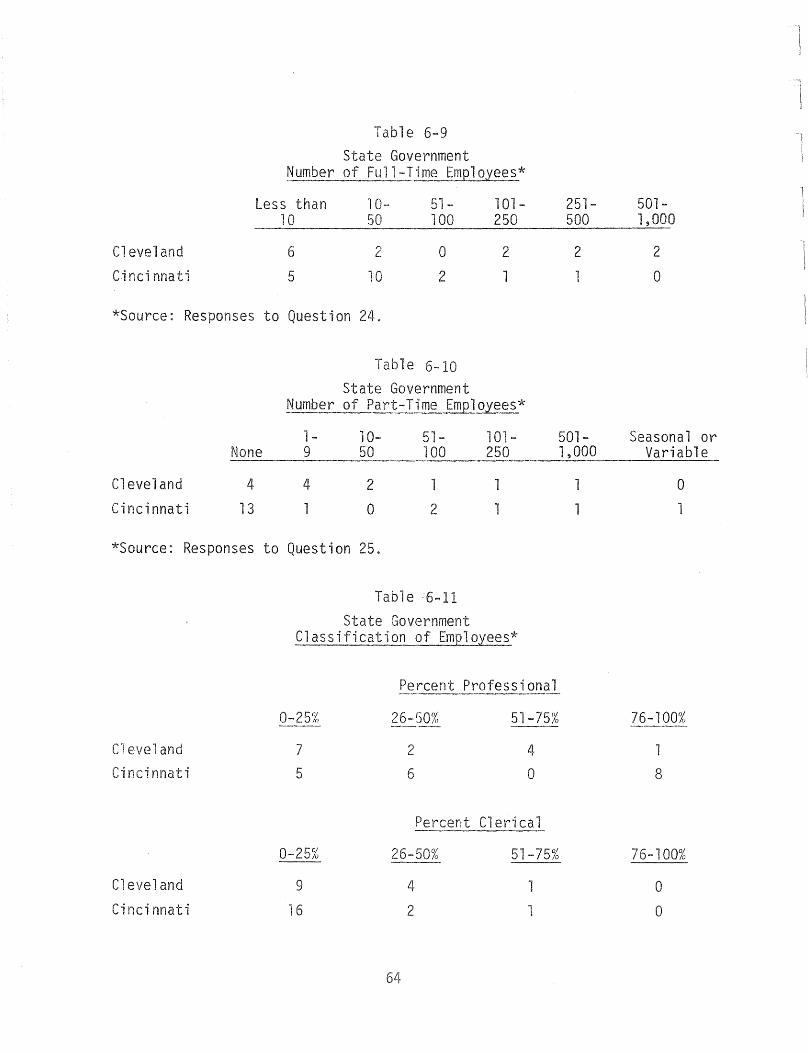
Table 6-9 State Government
~umber of Full-Time Employees*
Less than 10- 101-10 50 100 250
Cleveland 6 2 0 2
C-inei nnati 5 10 2 1
*Source: Responses to Question 24.
Table 6-10
State Government Number of Part-Time EmQloyees*
1- 10- 51- 101-None 9 50 100 250
Cleveland 4 4 2 Cincinnati 13 1 0 2
*Source: Responses to Question 25.
and C'i nei nnat i
Cleveland
Cincinnati
Table 11 State Government
Classification of Employees*
0-25% 26-50% 51-75% -- ... ---~--.- ---7 2 4
5 6 0
Percent Clerical
0-25% 26-50% 51-75%
9 4 1
16 2 ... !
64
251- 501-500 1,000
2 2
1 0
501- Seasonal or 1,000 Variable
0
1
76-100% ----
8
76-100%
0
0
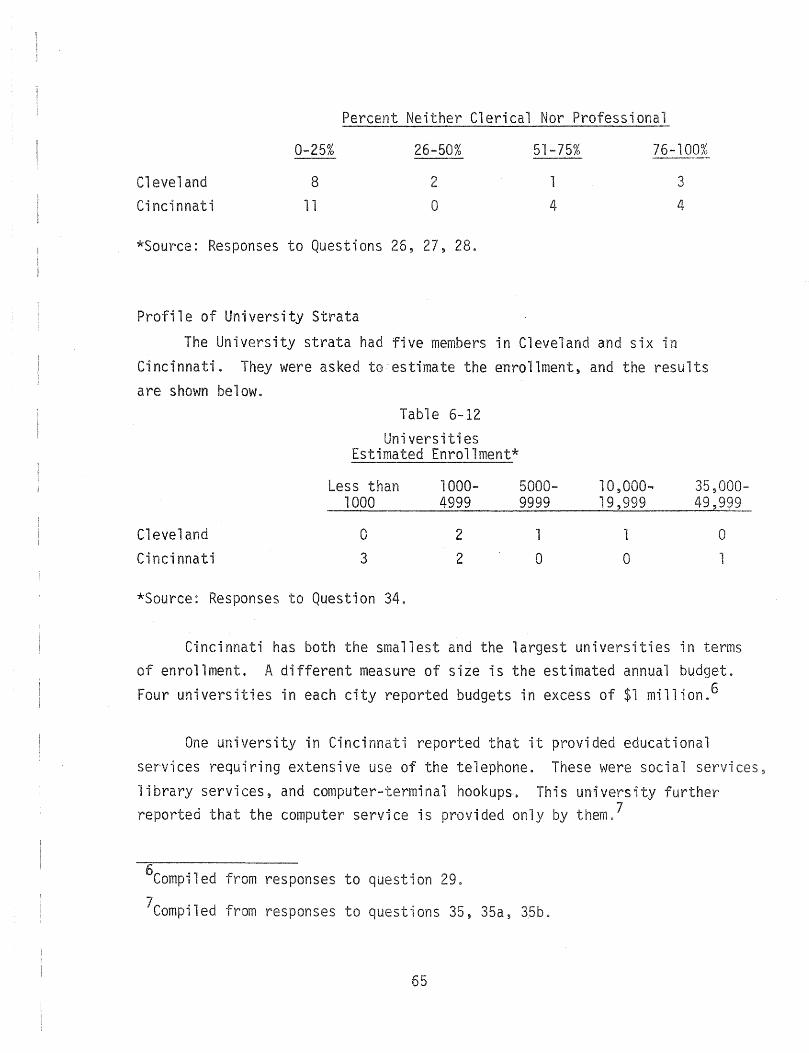
Percent Neither Clerical Nor Professional
Cleveland Cincinnati
0-25%
8
11
26-50% ---2
o
*Source: Responses to Questions 26,27,28.
Profile of University Strata
51-75% 76-100% ---3
4 4
The University strata had five members in Cleveland and six in Cincinnati. They were asked to estimate the enrollment, and the results are shown below.
TabUle 6-12
Universities Estimated Enrol1ment*
Less than 1000
1000-4999
5000-9999
10,000 ... 19,999
35,000-49,999
Cleveland Cincinnati
o 3
*Source: Responses to Question 34.
2
2
1
o 1
o o 1
Cincinnati has both the smallest and the largest universities in terms of enrollment. A different measure of size is the estimated annual budget.
Four universities in each city reported budgets in excess of $1 million. 6
One university in Cincinnati reported that it provided educational
services requiring extensive use of the telephone. These were social services~
library services, and computer-terminal hookups~ This university further reported that the computer service is provided only by them. 7
6Compiled from responses to question 29.
7Compiled from responses to questions 35, 35a, 35b.
65
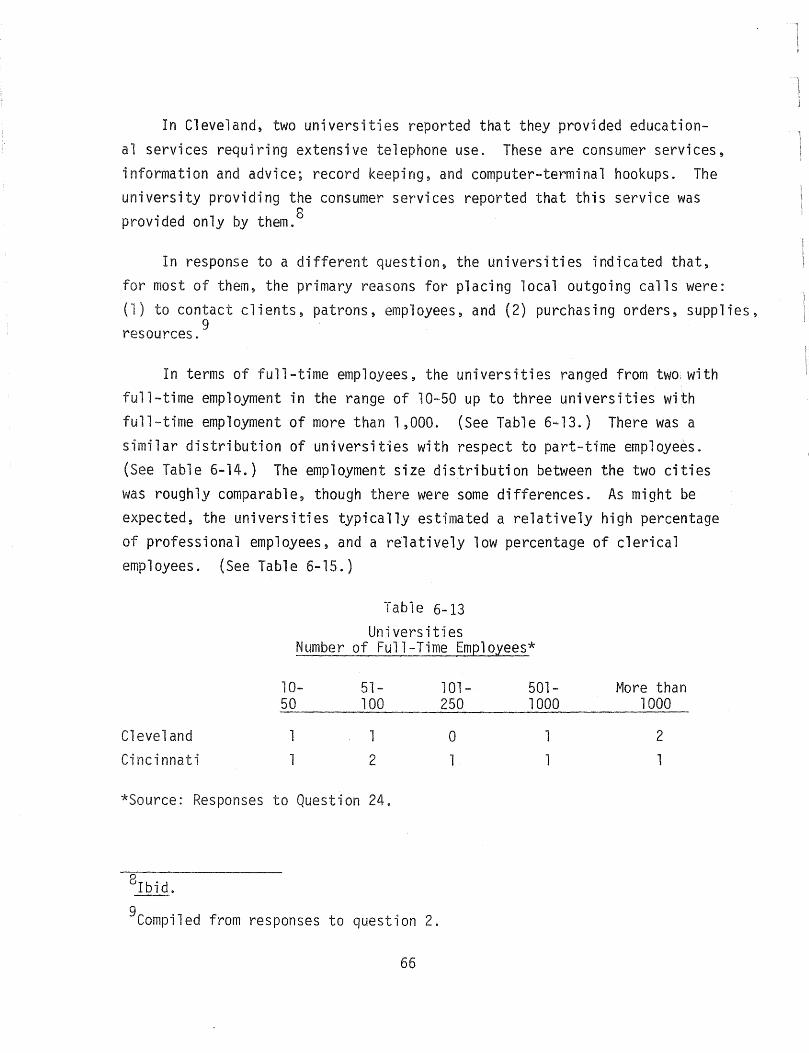
In Cleveland, two universities reported that they provided educational services requiring extensive telephone use. These are consumer services, information and advice; record keeping~ and computer-terminal hookups. The university providing the consumer services reported that this service was provided only by them. 8
In response to a different question, the universities indicated that, for most of them, the primary reasons for placing local outgoing calls were: (1) to contact clients~ patrons~ employees~ and (2) purchasing orders, supplies,
9 resources.
In terms of full-time employees, the universities ranged from two, with full-time employment in the range of 10-50 up to three universities with full-time employment of more than 1,000. (See Table 6-13.) There was a similar distribution of universities with respect to part-time employees. (See Table 6-14.) The employment size distribution between the two cities was roughly comparable, though there were some differences. As might be expected, the universities typically estimated a relatively high percentage of professional employees, and a relatively low percentage of clerical employees. (See Table 6-15.)
Table 6-13 Universities
Number of Full-Time Employees*
Cleveland Cincinnati
10-50
1
51-100
1
2
*Source: Responses to Question 24.
8Ibid .
9Compiled from responses to question 2.
66
101-250
o
501-1000
More than 1000
2
1
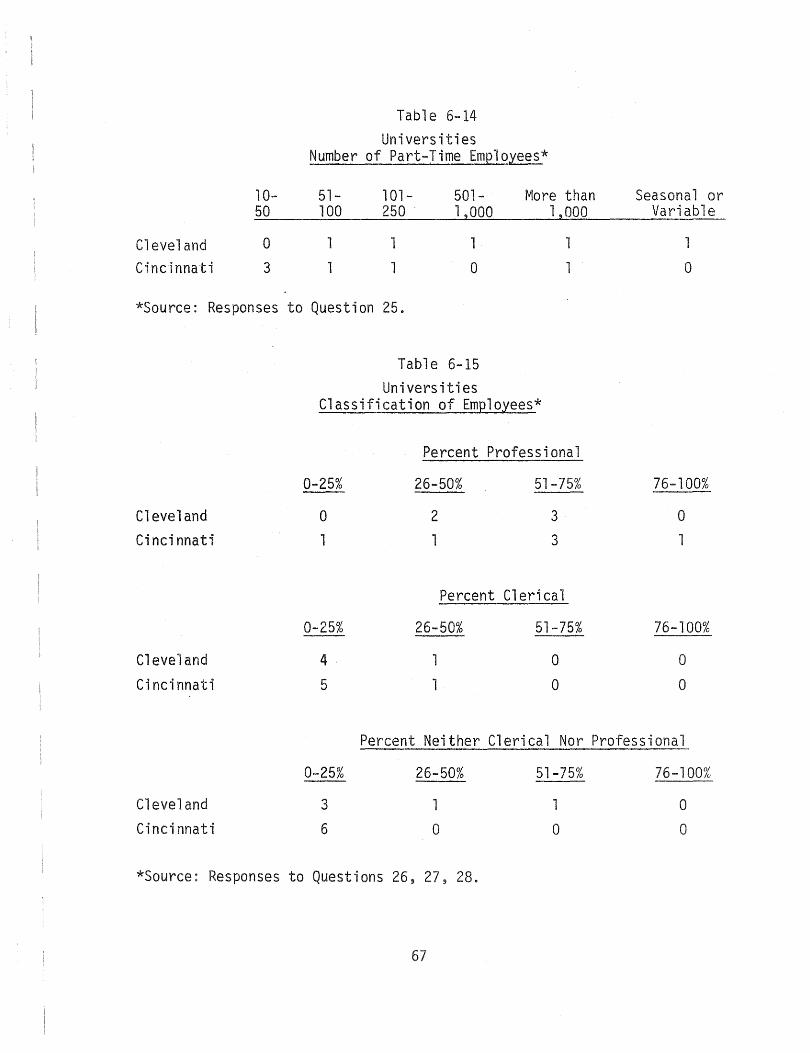
Cleveland Cincinnati
10-50
0
3
Table 6-14 Universities
Number of Part-Time Employees*
51- 101- 501- More than 100 250 1,000 1,000
1 1 1
1 1 0
*Source: Responses to Question 25.
Cleveland Cincinnati
Cleveland Cincinnati
Table 6-15 Universities
Classification of Employees*
0-25%
o 1
0-25%
4·
5
Percent Professional
26-50%
2 1
51-75%
3
3
Percent Clerical
26-50%
1
1
51-75%
o o
Seasonal or Variable
o
76-100%
o 1
76-100%
o o
Percent Neither Clerical Nor Professional
Cleveland Cincinnati
0-25%
3
6
26-50%
o
*Source: Responses to Questions 26,27,28.
67
51-75%
o
76-100%
o o
Profile of Hospital Strata Twenty-nine hospitals in Cleveland and 12 in Cincinnati were inter
viewed. In terms of size (as measured by number of patients or families treated annually), the strata in each city were roughly comparable, and the strata did include hospitals of all sizes. Each city contained one hospital that was quite large i.e., treating between 200,000 and 500,000 patients annually. In addition, each city had relatively small hospitals of less than 5,000 patients annually (4 in Cleveland, 2 in Cincinnati). The remaining hospitals represented size ranges between the two mentioned.'O
Twelve Cleveland hospitals and eight in Cincinnati reported they provided services requiring extensive use of the telephone. However, no one service was reported with any great frequency. The highest frequency reported was emergency room service cited by four hospitals in Cleveland as requiring extensive telephone use. The highest frequency in Cincinnati was two hospitals that cited regular hospital routine (as did two hospitals in Cieveland). Other uses cited by one or two hospitals in each city included outpatient service, home health care programs, visiting nurse service, physical therapy, etc. ll
When asked for two significant reasons for placing outgoing calls (Question 2), the hospitals typically cited either' contact with clients, patrons,_ customers, employees, or general business calls, including purchase orders, calls relating to billing, accounts, payroll, collections. Only seven hospitals (six in Cleveland, one in Cincinnati) mentioned client (patient) use.
The hospitals were also asked for information regarding budget and employment. Of those responding to the budget question (Question 29), all hospitals in Cincinnati and 75 percent of those in Cleveland reported budgets of greater than $1 million.
10Compiled from responses to question 33.
l1Compiled from responses to questions 32 and 32a.
68

There is greater variation in hospitals in terms of employment size, though the size distribution per city is roughly comparable. The hospitals ranged from those that· have between 10 and 50 full-time employees (3 hospitals) to those with more than 1,000 fu-l1~time employees (10 hospitals). There appears to be some difference between the cities with respect to types of employees, i.e., almost 80 percent of the Cleveland hospitals report that
50 percent or less of their employees are professional, whereas 80% of Cincinnati hospitals reported that more than 50 percent of their employees could be classed as professional. The following tables detail these employment characteristics.
Table 6-16 Hospitals
Number of Full-Time Employees*
10- 51- l01- 251-50 100 250 500
Cleveland 2 3 4 4
Cincinnati 1 . a 1 2
*Source: Responses to Question 24.
Table 6-17 Hospitals
Number of Part-Time Employees*
1- 10- 51- 101- 251-9 50 100 250 500
Cleveland 2 8 1 3 2
Cincinnati 1 3 0 2 1
*Source: Responses to Question 25. **Volunteers and variable part-time.
69
501- Over lOOO 1000
6 6
3 4
501-1000 Other**
2 4
0 0
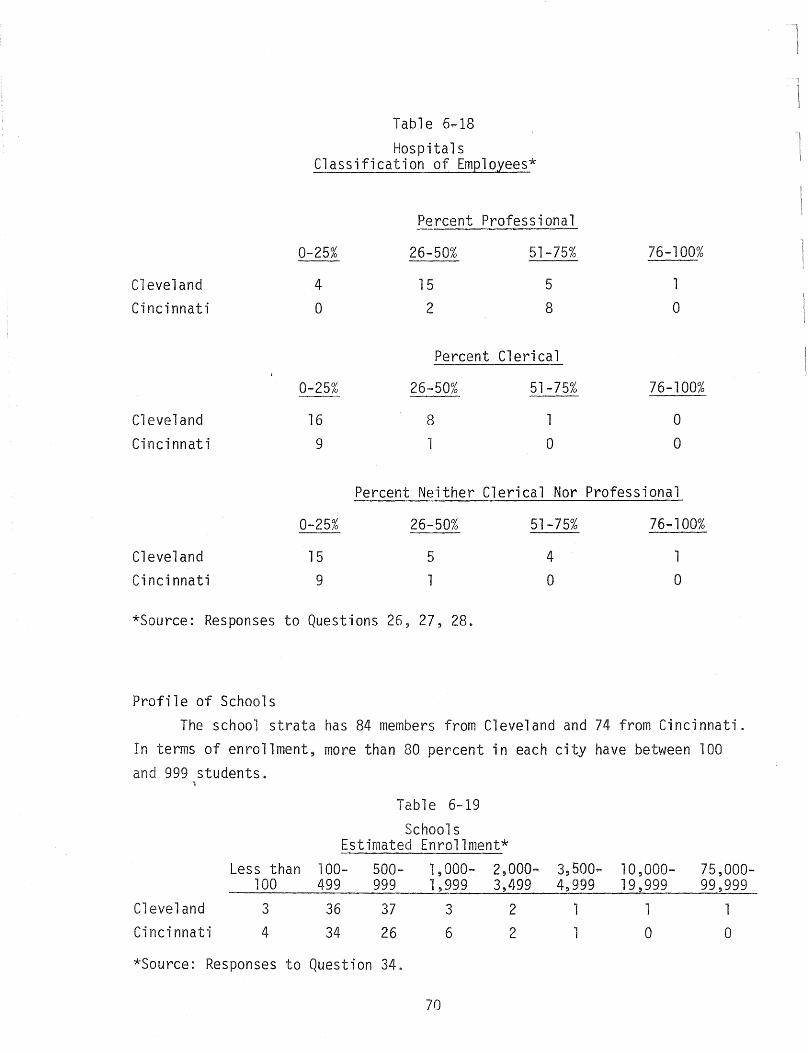
Cleveland Cincinnati
Cleveland Cincinnati
Cleveland Cincinnati
*Source: Responses
Profile of Schools
Table 6 ... 18
Hospitals Classification of Employees*
Percent Professional
0-25% 26-50% 51-75%
4 15 5
0 2 8
Percent Clerical
0-25% 26-50% 51-75%
16 8
9 0
Percent Neither Clerical Nor
0-25% 26-50% 51-75%
15 5 4
9 1 0
to Questions 26, 27, 28.
76-100%
1
0
76-100%
0
0
Professional
76-100%
0
The school strata has 84 members from Cleveland and 74 from Cincinnati. In terms of enrollment, more than 80 percent in each city have between 100
and 999 students.
Less than 100
Cleveland 3
Cincinnati 4
*Source: Responses to
Table 6-19
Schools Estimated Enrollment*
100- 500- 1,000- 2,000-499 999 1,999 3,499
36 37 3 2 34 26 6 2
Question 34.
70
3!J500 ... 10,000- 75,000-4,'999 19,999 99,999
1 1 1
0 0
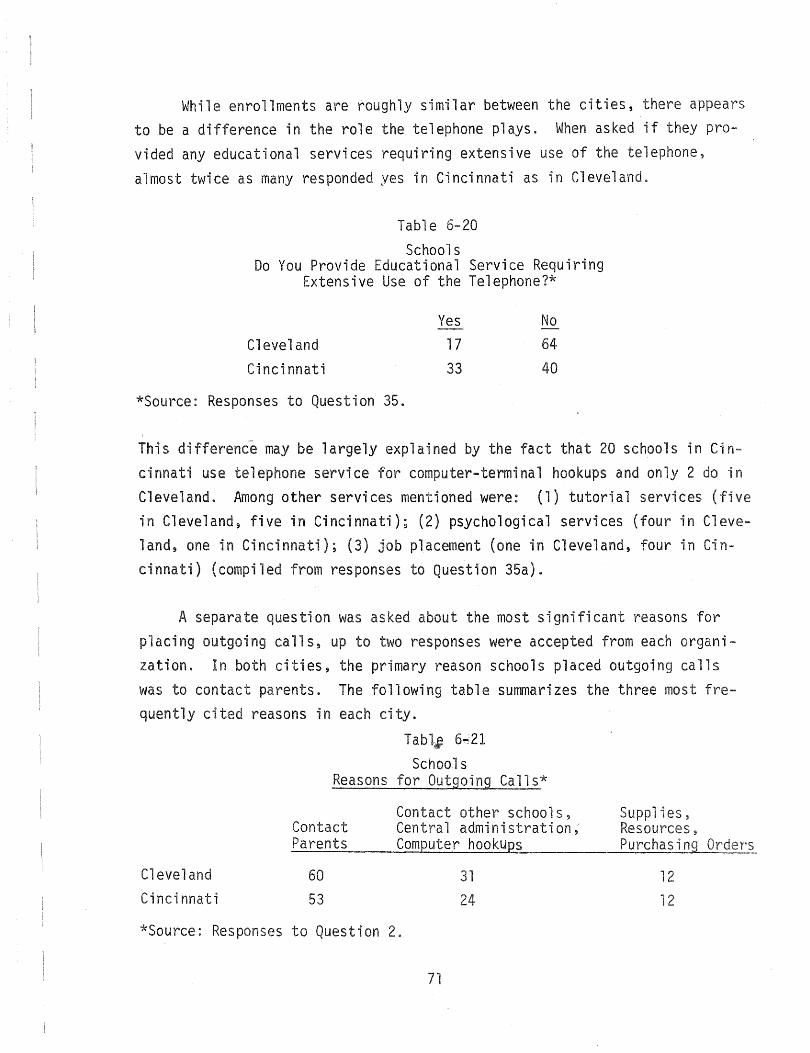
While enrollments are roughly similar between the cities, there appears to be a difference in the role the telephone plays. When asked if they provided any educational services requiring extensive use of the telephone,
almost twice as many responded yes in Cincinnati as in Cleveland.
Table 6-20
Schools Do You Provide Educational Service Requiring
Extensive Use of the Telephone?*
Cleveland Cincinnati
*Source: Responses to Question 35.
Yes 17
33
No
64
40
This differen~~ may be largely explained by the fact that 20 schools in Cin
cinnati use telephone service for computer-terminal hookups and only 2 do in Cleveland. Among other services mentioned were: (1) tutorial services (five in Cleveland, five in Cincinnati); (2) psychological services (four in Cleveland, one in Cincinnati); (3) job placement (one in Cleveland, four in Cincinnati) (compiled from responses to Question 35a).
A separate question was asked about the most significant reasons for p"lacing outgoing calls, up to two responses were accepted from each organization. In both cities, the primary reason schools placed outgoing calls was to contact parents. The following table summarizes the three most frequently cited reasons in each city.
Cleveland Cincinnati
Tabl,G 6~21
Schools Reasons for Outgoing Calls*
Contact other schools, Contact Central administration, Parents ComQuter hookuQs
60 31
53 24
*Source: Responses to Question 2.
71
Suppl ies, Resources, Purchasing Orders
12
12

Further description of the members of the school strata is found in their answers to questions regarding budget and employment. Budget data are contained in the following table.
Table 6-22
Schools Estimated Annual Budget*
Under $25,000- $100,000- $500,000- Over $25,000 $100,000 $500,000 ' $1 million $1 million
Cleveland 2 10 11 ~ /I oJ '"t
Cincinnati 8 7 27 6 6
*Source: Responses to Question 29.
Half the schools in Cincinnati reported a budget between $100,000 and $500,000 while most schools in Cleveland reported a budget of either $25,000-
$100,000 or $100,000-$500,000.
The typical school in each city might be described as having between 10 and 50 full-time employees and less than 10 part-time employees. Typically, more than 50 percent are professional and twenty-five percent or less are clerical. Employment characteristics are contained in the following tables.
Table 6-23
Schools Number of Full-Time Em~l0.lees*
Less than 10 10-50 51-100 101-250
Cleveland 4 58 18 3 Cincinnati 2 52 14 6
*Source: Responses to Question 24.
72
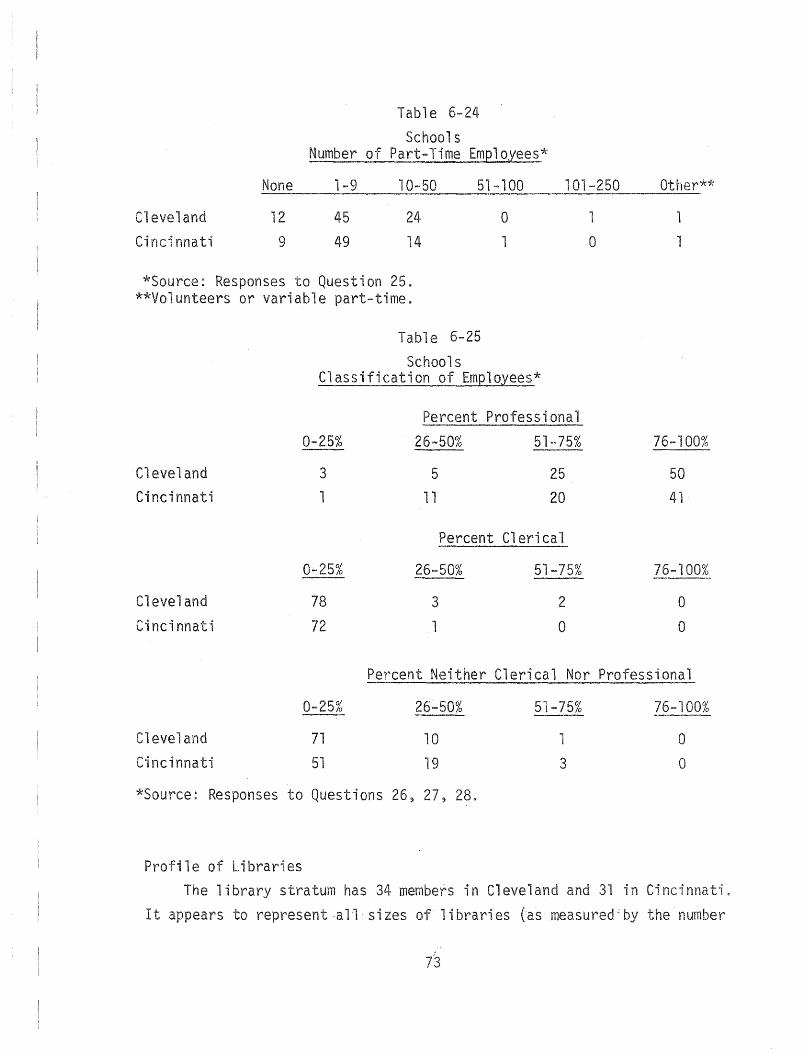
Table 6-24 Schools
Number of Part-Time EmQl o~ees'k
None 1-9 10-50 51-100 101-250
Cleveland 12 45 24 0 Ci nnati 9 49 14 1
*Source: Responses to Question 25. **Volunteers or variable part-time.
Cleveland Cincinnati
Cleveland Cincinnati
Table 6-25
Schools Classification of Employees*
Percent Professional
0-25% 26-50% 51-75%
3 5 25 1 11 20
Percent Clerical
0-25% 26-50% 51-75%
78 3 2
72 1 0
1
0
Other**
1
1
76-100%
50 41
76-100%
0 0
Percent Neither Clerical Nor Professional
Cleveland ncinnati
0-25%
71 51
26-50%
10
19
*Source: Responses to Questions 26, 27, 28.
Profile of braries
51-75% 76-100% ---1 0
3 0
The library stratum has 34 members in Cleveland and 31 in Cinei I t appears to represent -,-- sizes of 1 i brari es (as measured: the· number
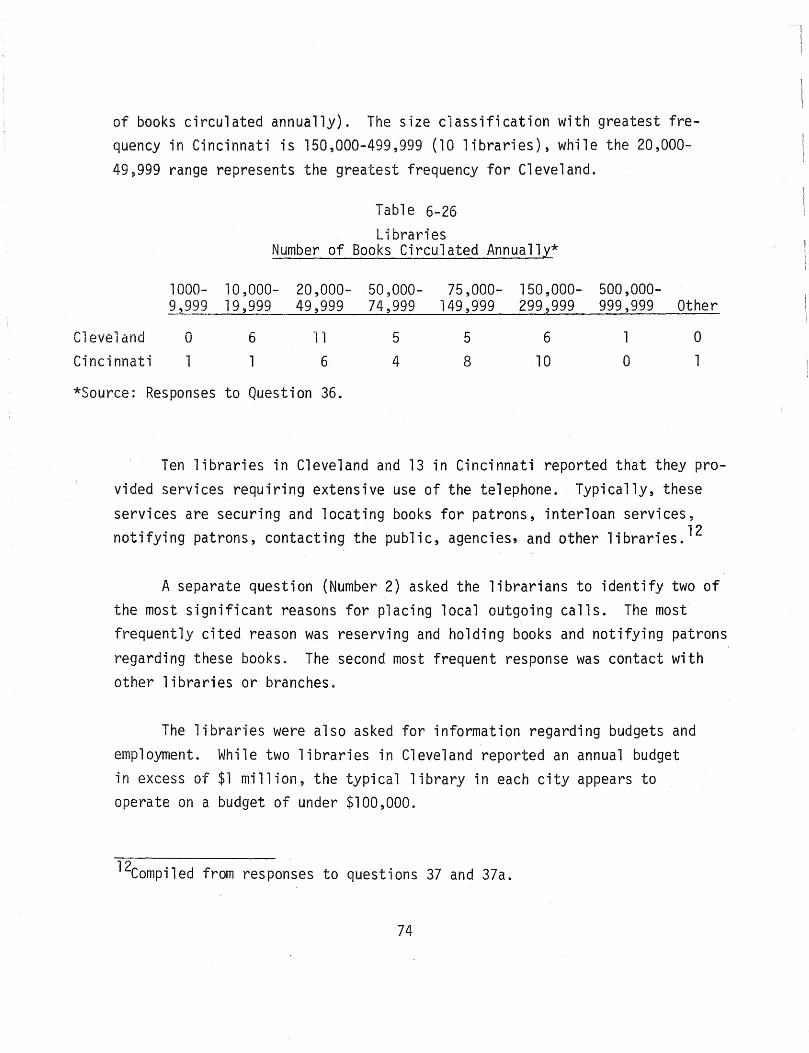
of books circulated annually). The size classification with greatest frequency in Cincinnati is 150,000-499,999 (10 libraries), while the 20,000-49,999 range represents the greatest frequency for Cleveland.
Table 6-26 Libraries
Number of Books Circulated Annually*
1000- 10,000- 20,000- 50,000-9,999 19,999 49,999 74,999
75,000- 150,000- 500,000-149,999 299,999 999,999 Other
Cleveland o Cincinnati
6 11
6
*Source: Responses to Question 36.
5
4
5
8
6
10 1
o o 1
Ten libraries in Cleveland and 13 in Cincinnati reported that they provided services requiring extensive use of the telephone. Typically, these services are securing and locating books for patrons, interloan services, notifying patrons, contacting the public, agencies, and other libraries. 12
A separate question (Number 2) asked the librarians to identify two of the most significant reasons for placing local outgoing calls. The most frequently cited reason was reserving and holding books and notifying patrons
regarding these books. The second most frequent response was contact with other libraries or branches.
The libraries were also asked for information regarding budgets and employment. While two libraries in Cleveland reported an annual budget in excess of $1 million, the typical library in each city appears to operate on a budget of under $100,000.
12Compiled from responses to questions 37 and 37a.
74
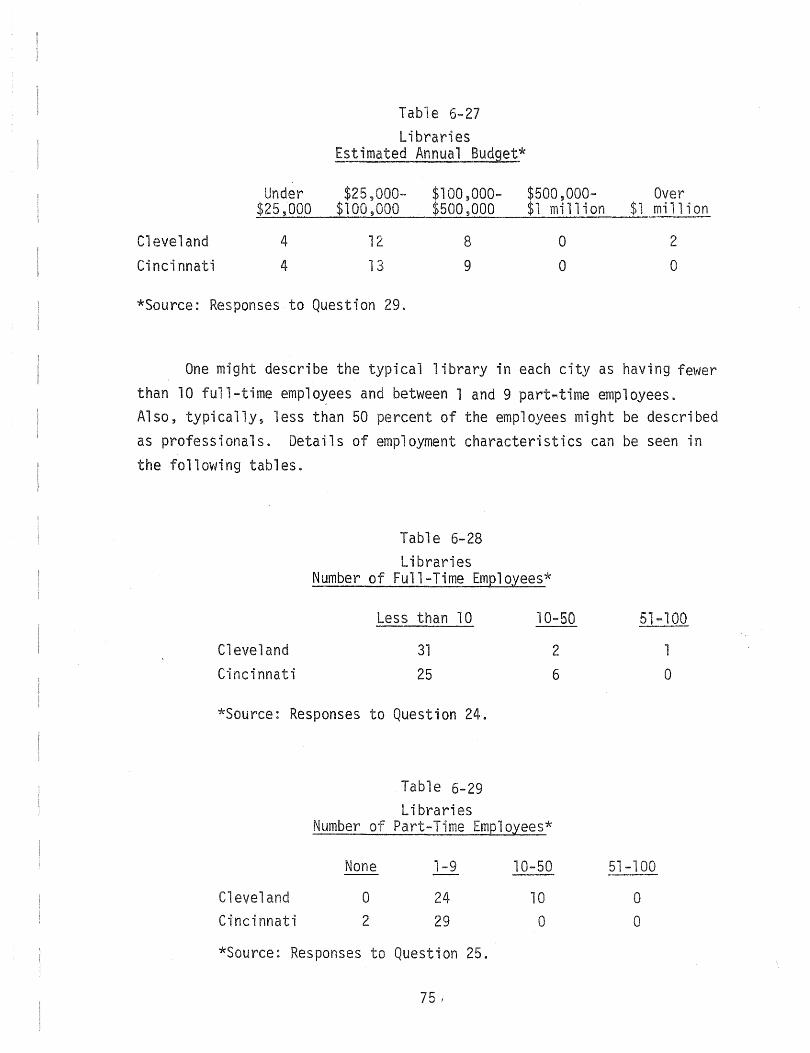
Table 6-27 Libraries
Estimated Annual Budget*
Under $25,000- $100,000- $500,000- Over $25,000 $100,000 $500,000 $1 million $1 million
Cleveland 4 12 8 ° 2
Cincinnati 4 13 9 a a
*Source: Responses to Question 29.
One might describe the typical library in each city as having fewer
than 10 full-time emplo~ees and between 1 and 9 part-time employees. Also, typically, less than 50 percent of the employees might be described as professionals. Details of employment characteristics can be seen in the following tables.
Tabl e 6-28 Libraries
Number of Full-Time Employees*
Cleveland Cincinnati
Less than 10
31
25
*Source: Responses to Question 24.
Table 6-29 Libraries
la-50
2
6
Number of Part-Time Employees*
Cleveland Cincinnati
None
o 2
1-9
24
29
*Source: Responses to Question 25.
75,
10-50
10
°
51-100
o o
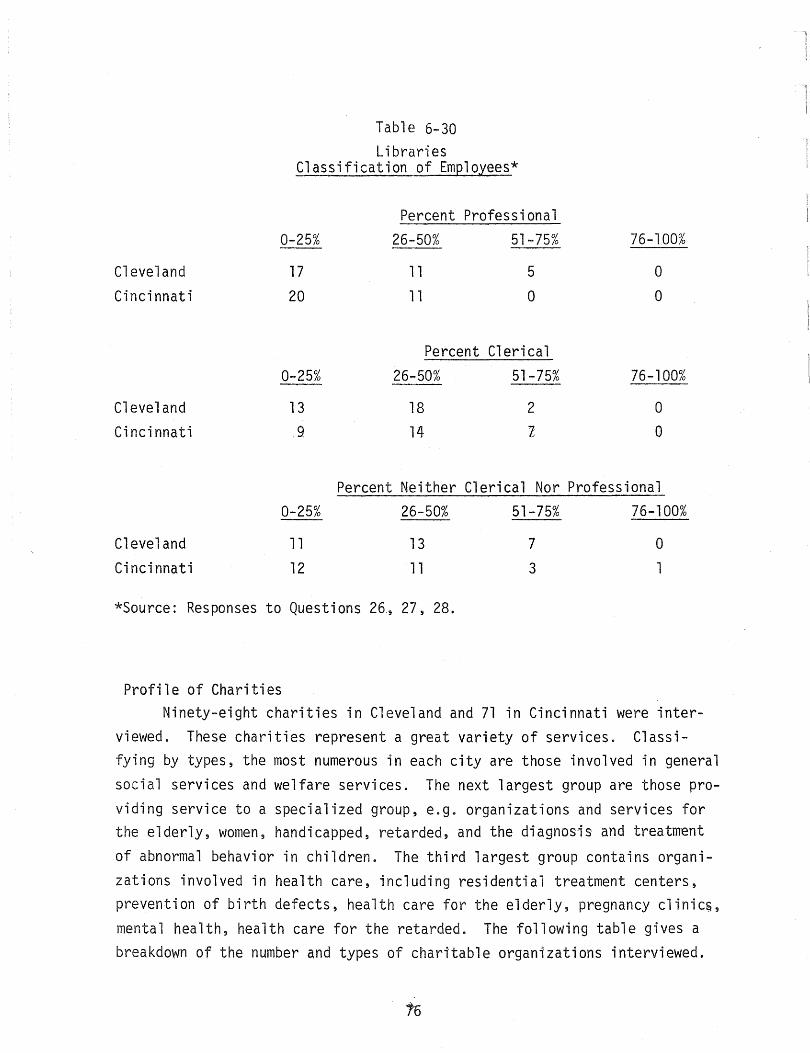
Cleveland Cincinnati
Cleveland Cincinnati
Table 6-30 Libraries
Classification of Employees*
0-25%
17 20
0-25%
13 9
Percent Professional 26-50%
11 11
51-75%
5
o
Percent Clerical 26-50%
18 14
51-75%
2
Z
76-100%
o o
76-100%
o Q
Percent Neither Clerical Nor Professional 0-25% 26-50% 51-75% 76-100%
Cleveland 11 13 7 0 Cincinnati 12 11 3 1
*Source: Responses to Questions 26, 27, 28.
Profile of Charities Ninety-eight charities in Cleveland and 71 in Cincinnati were inter
viewed. These charities represent a great variety of services. Classifying by types, the most numerous in each city are those involved in general social services and welfare services. The next largest group are those providing service to a specialized group, e.g. organizations and services for the elderly, women, handicapped, retarded, and the diagnosis and treatment
of abnormal behavior in children. The third largest group contains organizations involved in health care, including residential treatment centers, prevention of birth defects, health care for the elderly, pregnancy clinics, mental health, health care for the retarded. The following table gives a breakdown of the number and types of charitable organizations interviewed.
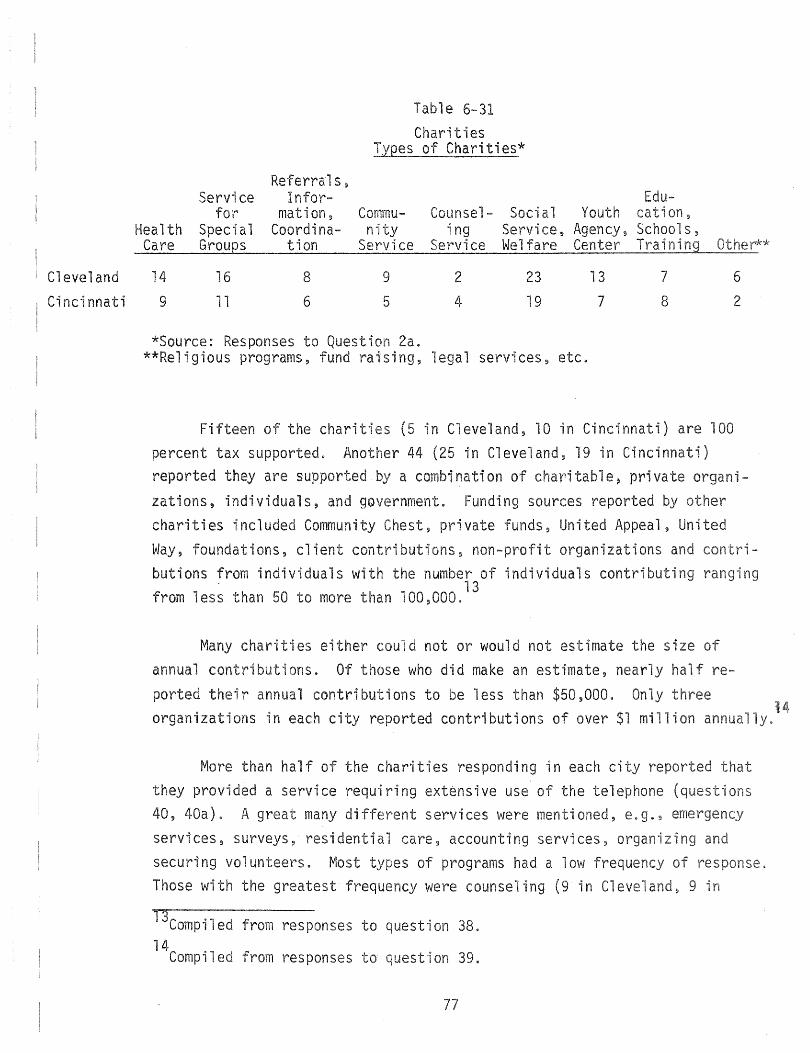
Cleveland
Cincinnati
ce
Health Special
s, Infor
Table 6-31
Charities Types of Charities*
Edu-mation,
Coordina- nity Counsel- Soc; Youth cation,
1ng Service, Agency, Schools, Care Groups tion Service Service Welfare Center Training Other'**
14 16
9 11
8
6
9
5
*Source: Responses to Question 2a.
2
4
23
19
**Religious programs~ fund ra sing, legal services, etc.
13
7
7
8
Fifteen of the charities (5 in eveland, 10 in Cincinnati) are 100
percent tax supported. Another 44 (25 in Cleveland, 19 in Cincinnati)
6
2
reported they are supported a combination of table~ private organi-
zations, individuals, and government. Funding sources reported by other charities included Community Chest, private funds, United Appeal, United
Way, foundations, client contributions, non-profit organizations and butions from indi duals with the number of individuals contributing ing from less than 50 to more than 100,000.
13
Many charities either could not or would not estimate the size of ions. Of those who did make an estimate, nearly half re-
ported r annual contributions to be less than $50,000. y
organizations in each city reported contributions of over million
More than half of the charities responding in each ci reported they provided a service requi ng extensive use of the telephone (questions 40, 40a). A great many di fferent s ces were menti 9 e. g. services, surveys, resident; care, accounting services, organizi
I4 ly.
securing volunteers. Most types of programs had a low frequency see Those with the greatest frequency were counseling (9 in Cl , 9 in
13Compiled from responses to question 38.
14 . d Complle· from responses ion 39.
77
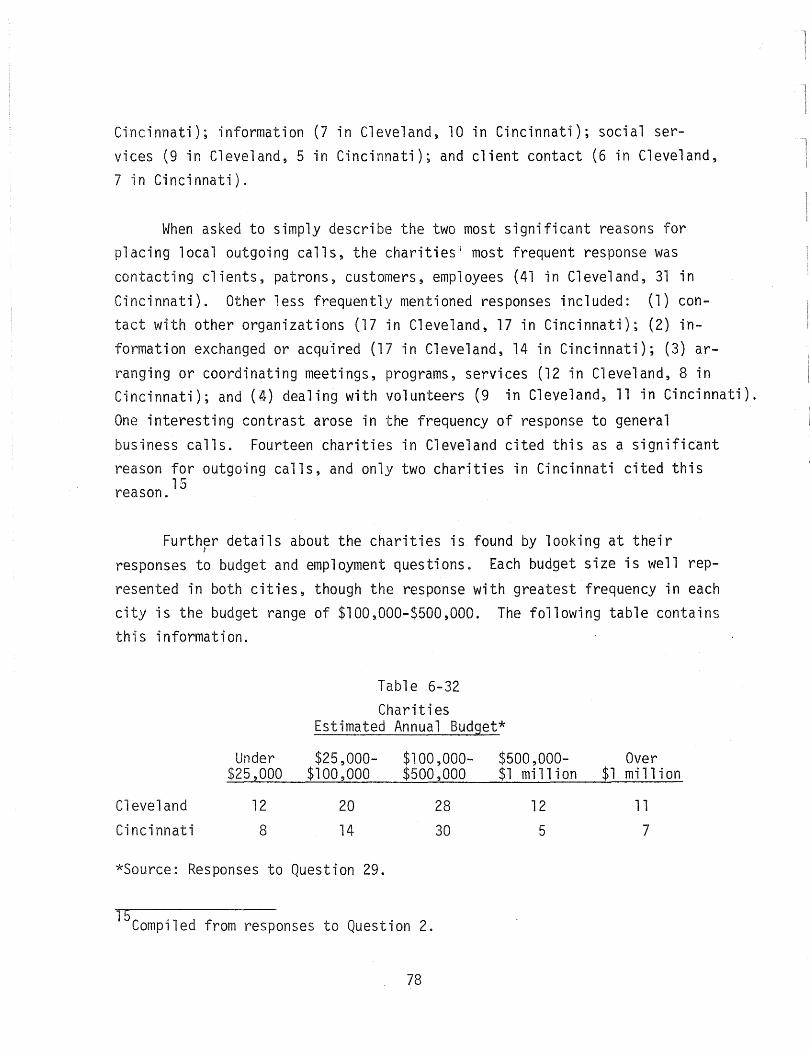
Cincinnati); information (7 in Cleveland, 10 in Cincinnati); social services (9 in Cleveland, 5 in Cincinnati); and client contact (6 in Cleveland, 7 in Cincinnati).
When asked to simply describe the two most significant reasons for placing local outgoing calls, the charities! most frequent response was contacting clients, patrons~ customers, employees (41 in Cleveland, 31 in Cincinnati). Other less frequently mentioned responses included: (1) con-tact with other organizations (17 in Cleveland, 17 in Cincinnati); (2) information exchanged or acqulred (17 in Cleveland, 14 in Cincinnati); (3) arranging or coordinating meetings, programs, services (12 in Cleveland, 8 in Cincinnati); and (4) dealing with volunteers (9 in Cleveland, 11 in Cincinnati).
One interesting contrast arose in the frequency of response to general business calls. Fourteen charities in Cleveland cited this as a significant reason for outgoing calls, and only two charities in Cincinnati cited this
15 reason.
Further details about the charities is found by looking at their I
responses to budget and employment questions. Each budget size is well rep-
resented in both cities, though the response with greatest frequency in each city is the budget range of $100,000-$500,000. The following table contains this information.
Table 6-32 Charities
Estimated Annual Budget*
Under $25,000- $100,000- $500,000- Over $25,000 $100,000 $500,000 $1 million $1 million
Cleveland 12 20 28 12 11
Cincinnati 8 14 30 5 7
*Source: Responses to Question 29.
-15 C '1 d f Q . 2 amp1 e rom responses to uestlon .
78
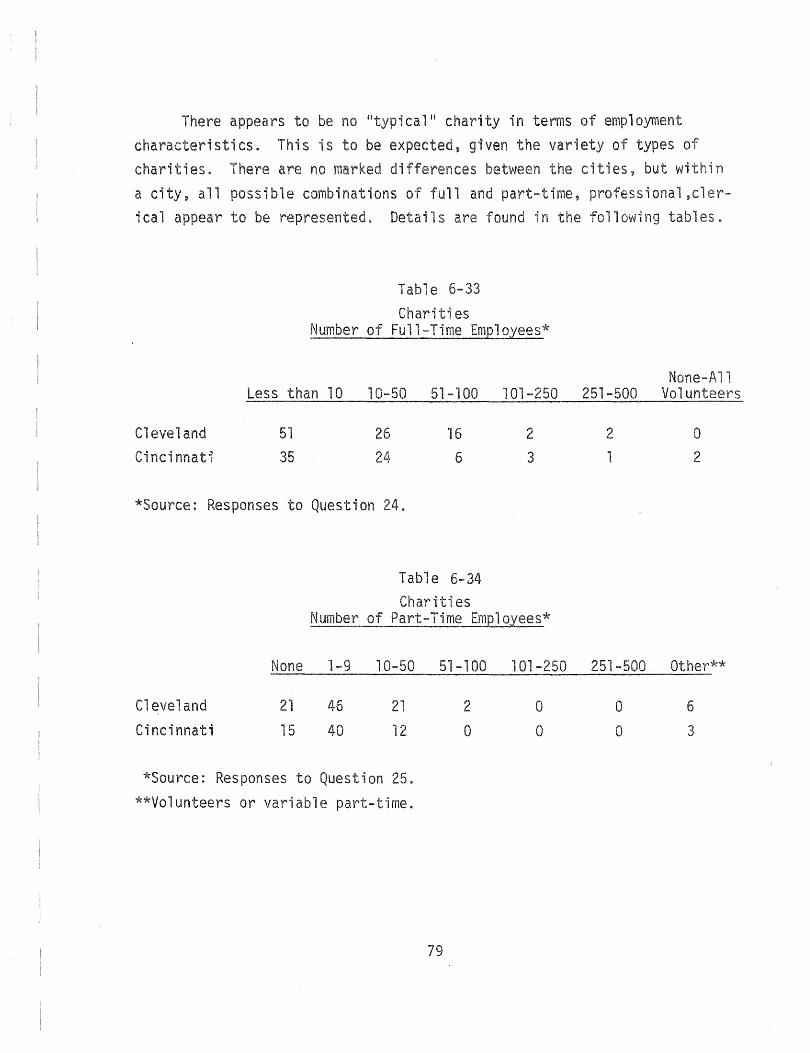
There appears to be no "typical l' charity in terms of employment characteristics. This is be expected. given the variety of types charities. are no d1 cities, but n a city, all possible comb; ions of full and part-time, professional, er-ieal appear be represented. Details are found in foll ng tables.
Table 33
Charities NllmheV' n.of l='nll_Timo j:"mnln.\/etC:Ic:* 1'Q'4,.AU&.J' I VI II VII '" ~ I;lfi'-' ~u~t'avJ "-"-'
None-All Less than 10 10-50 51-100 101-250 251-500 Volunteers
Cleveland Cincinnati'
51
35
26 16
6
2
3
*Source: Responses to Question 24$
Table 6-34 Charities
Number of Part-Time EmQloyees*
2
1
o 2
None 1-9 10-50 51-100 101-250 251-500 Other**
Cleveland Cincinnati
21 15
46
40
21
12
*Source: Responses to Question 25. **Volunteers or variable me
79
2
o o o
o o
6
3
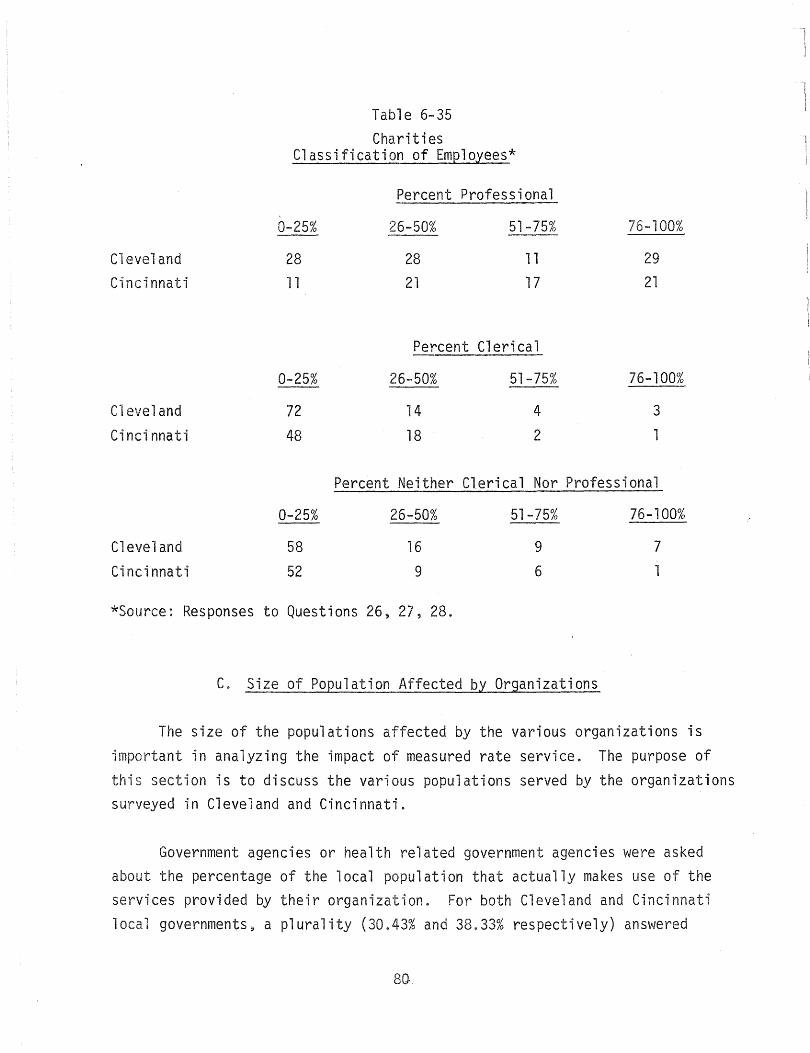
Cleveland Cincinnati
Cleveland
Cincinnati
Table 6-35 Charities
Classification of Employees*
0-25%
28 11
0-25%
72
48
Percent Professional
26-50%
28 21
Percent
26-50%
14
18
51-75%
11 17
Clerical
51-75%
4
2
76-100%
29
21
76-100%
3
1
Percent Neither Clerical Nor Profes s i ona 1
0-25% 26-50% 51-75% 76-100%
Cleveland 58 16 9 7
Cincinnati 52 9 6
*Source: Responses to Questions 26, 27, 28.
C. Size of Population Affected by Organizations
The size of the populations affected by the various organizations is important in analyzing the impact of measured rate service. The purpose of this section is to discuss the various populations served by the organizations surveyed in Cleveland and Cincinnati.
Government agencies or health related government agencies were asked about the percentage of the local population that actually makes use of the services provided by their organization. For both Cleveland and Cincinnati local governments, a plurality (30.43% and 38.33% respectively) answered
80.

the figure was 0-20%0 For s governments, a plurality maj ty (45.45% and 54.55% respectively), answered 0-20% in both Clevel and Cincinnati respectively.16
With respect to hospitals, clinics~ or health-related government agencies only, we asked about how many patients (incl ng inpati outpatients), were treated annually_ For Cleveland, 73.33% treated greater than or equal to 5,000 patients in the hospital strata. For ncinnati, this figure was 73%.17
Schools or universities only were asked approximately how many students were enrolled during the past academic year. With respect to the school strata, 90.48% in Cleveland had less than 1,000 students enrolled. For Cincinnati, this figure was 87.67%. With respect to the university strata, 100% of those surveyed in Cleveland had greater than or equal to 1,000 students. In Cincinnati~ the figure was 50%.18
The libraries were asked their approximate annual circulation. Fifty percent replied annual circulation was greater than (or equal to) 50,000.
In Cincinnati, 70.97% replied they had an annual circulation of greater (or equal to) 50,000 books. 19
Finally, we asked charities to approximate the number of people contributing to their respective organizations, and to estimate their total contributions. The majority in both Cleveland and Cincinnati, 55.84% and 61.82% respectively, replied that contributions came from other funds, for example the United fund. In Cleveland and Cincinnati the majority, .71% and 73.33% respectively, stated that their total contributions were less
than $200,000. 20
16See Appendix F, Question 17 , Question No. 33. 1 bid., Question No. 34. 19Ibid ., Question No. 36.
2°ibid., Question Nos. 38 and 39.
for a data summary of
81
D. Size, Cost and Management of Telephone Operations
The size, cost, and management of telephone operations are important considerations in the assessment of the impact of a measured rate pricing structure. The purpose of this section is to discuss these variables in light of our chosen strata in Cleveland and Cincinnati. Costs of telephone oper'ations may necessitate size limitations with respect to telephone sets and telephone lines. Costs may also necessitate management policies and operational procedures.
We begin our discussion with the size of telephone operations. Of particular interest to us is the number of telephone sets and lines servicing each organization. In both Cleveland and Cincinnati, a similar plurality for all strata combined was observed with 1-5 telephone sets servicing the organization. In Cleveland, that plurality was 42.61%. For Cincinnati, that figure was 42.52%. While this similarity is striking,
. there are some notable differences within the individual strata~ particularly
with respect to the local and state government strata. In Cleveland, 30% of 21 local government and none of state government had over 100 telephone sets.
With respect to the telephone lines, we observed again for all strata combined, similar percentages between cities. The plurality of telephone lines for both cities was 1 line or greater than 10 lines. For Cleveland, this com
plurality was 48.45%. For Cincinnati, this figure was 42.52% However, fferences existed between the two cjties in many of the strata. 22
As previously noted, management policies and operational procedures may be necessitated by costs of telephone service considerations. We now
21See Appendix F, Question No.4 for a data summary of the results.
Ibid., Question No.5.
82
turn toward a ons
usage. For cinnati
scussion of policies and procedures~ Each of surveyed was whether they kept records on ephone 1 comb'ined!j 40.69% in Cleveland and 44 in Cin-
records. 23
phone calls were by 41.77% and 37.22% all combined for Cleveland and Cincinnati~respectively, as one of~the foci policies governing the use of telephones. General policies were mentioned as another method of controlling telephone usage by the various organizations surveyed. 24 least 50% of these pol icies \rJere made by chief executives in each strata and versi
in each city, wtth the exception of libraries in both cities i'n Cincinnati. ~5
Of i to study was ons and they occurred.
importance of telephone service respect considerations.
We as each organization whether
aus changes in telephone Such changes might imply the
cost and/or operational
i r telephone usage was di -,--,--"-,, Yf'L"',
from one ago. all strata comb; the responses
striking simil ties. overwhelming maj said nno" in and~ this figure was .40%.
is fi was 82.47%. However, wi fferences in some of the
strata, state government. universities, and 11 es. government, in Cleveland~ and .00% in Cincinnati
fferently from the way "it d In eveland, 60.00% of the versi es used the while for Cincfhnati this gure was zero.
231 bi d. , Question No. 10
24Ibid~, on No. 11 .
25r . d ~.,1 Question No. 12.
83
respect to libraries, 32.35% and 9.68% used the telephone differently in Cleveland and Cincinnati respectively.26
The reasons for these changes included an increase in the volume of calls for all strata combined. This percentage was 30.91% in Cleveland and 30.36% in Cincinnati. Other major reasons given included in increase in iness (28.18% and 17.86% in Cleveland and Cincinnati, respectively), and policy changes (14.55% and 16.07% in Cleveland and Cincinnati, respectively).27
Further, we asked each organization whether it used the telephone differently now from the way it did five years ago. Again, for all strata combined, similarities existed. In Cleveland, 38.30% replied that they did use the telephone differently from the way it did five years ago. In Cincinnati, this figure was 33.90%. This time, however, wide differences did not include state government as was the previous case. Instead, we see hospitals showing a substantial increase in affirmative replies. With respect to this strata, 55.56% replied they use the phone differently from the way it did five years ago in Cleveland. For Cincinnati, this figure was 33.33%.28
Major reasons cited for these changes included increases in the volume of calls, new communications systems in service, increases in business, and policy changes. 29
Management policies and operational procedures necessitated by cost considerations, may include specific budgets for telephone service. This is our next subject of discussion.
26 1bid ., Question No. 17.
27 Ibid ., Question No. 17a.
28 Ibid ., Question No. 18.
29 Ibid ., Question No. 18a.
84
We asked each organi ion whether it had a fic budget for
servi ce. in, strata combined, the similarities between phone
and ncinnati are Specific budgets for tele-
the organi several of
libraries.
sted in
ons in
In 78.57%, 37.93%, and 35.71%
the organ; ions in Cleveland and 64.98%
wide differences existed in y government, hospitals, schools, these four strata respectively, 75.00%,
figures were 53.33%,91.67%, they had specific budgets. For Cincinnati, 56.25%, and 7.69%.30
For those organizations replied yes in the preceding paragraph~ importance of telephone costs in the operation of the respective organions can be implied by the flexibili of the telephone budget. For all
combi ,80.28% and 79. of the organizations in Cleveland and
Cincinnati, respectively, repli that their ephone budgets were flexible. An overwhelmi majority in each in both cities with the exceptions of hospi 1s in Cincinnati (in is case 50.00% said the budget was flexible),
said that the budget was flexible. 31
Whether to their knowledge the budget had ever been exceeded, was the
subject of another question. similar in their responses
55 56% in and and
exceed~d.
ons
I bid. ~ Que s t i on . 30 a . 32
Ibid., Question
~ Question . 30c.
In this case, the two cities were again quite 1 combined. According to 52.73%
i, respectively, the budget had been
their budgets, wide dispersion
in both cities as to how many times budgets
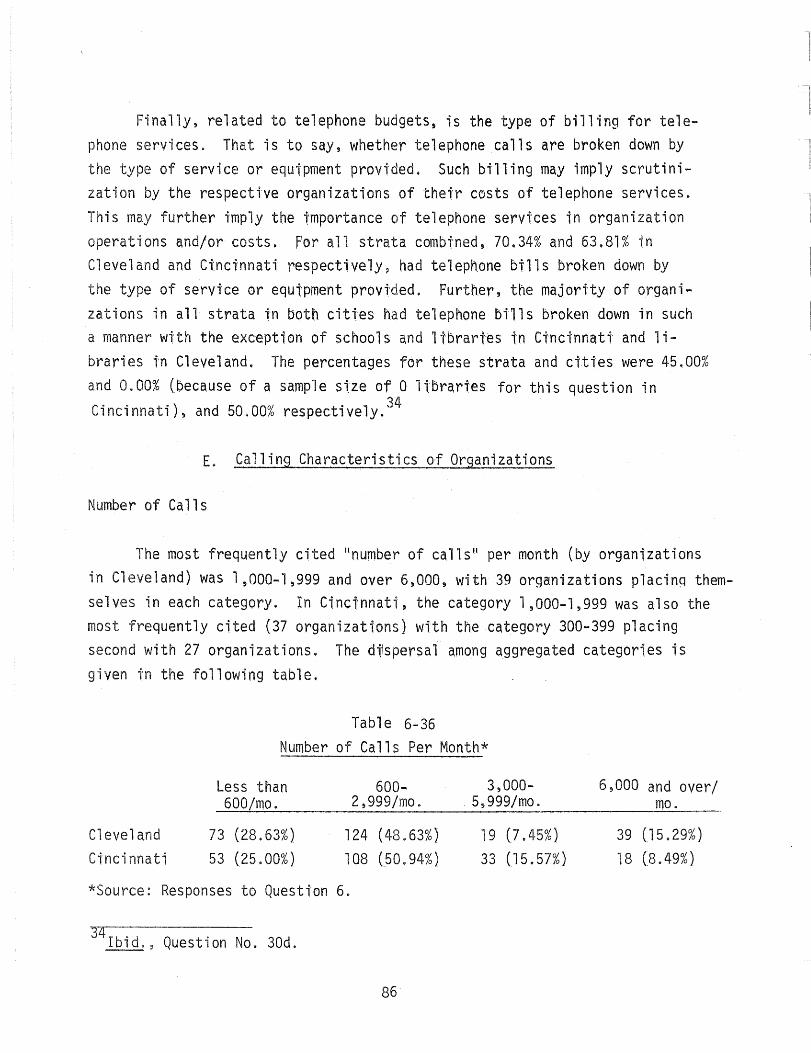
Finally, related to telephone budgets, is the type of billing for telephone services. That is to say, whether telephone calls are broken down by the type of service or equipment provided. Such billing may imply scrutinizatian by the respective organizations of thetr costs af telephone services. This may further imply the tmportance of telephone servtces in organization operations and/or costs. For all strata combi'ned, 70~34% and 63.81% in Cl eve 1 and and Ctnc;'nnat i respective 1y ~ had tel eph,one of 11 s broken down by the type of serVice or equi'pment provi"ded. Further, the majority of organi ... zations in all strata in both cities had telephone bills broken down in such a manner wtth the exception of schools and ltbrartes in Cincinnati and libraries tn Cleveland. The percentages for these strata and ctti'es were 45.00% and 0.00% (because of a sample size of 0 ltbrartes for this question in Cincinnati)~ and 50.00% respectively.34
E. Calling Characteristics of Organizations
Number of Calls
The most frequently cited "number of calls " per month (by organizations in Cleveland) was 1,000-1,999 and over 6,000, with 39 organizations placinq themselves in each category. In Cincinnati, the category 1 ,000-1~999 was also the most frequently cited (37 organizattons) with the category 300-399 placing second with 27 organizations. The d~spersal among aggregated categories is given in the following table.
Table 6-36 Number of Calls Per Month*
Less than 600- 3,000-600/mo. 2,999/mo. 5,999/mo.
Clevel and 73 (28.63%) 124 (48.63%) 19 (7.45%) Cincinnati 53 (25.00%) 108 (50 ~ 94%) 33 (15.57%)
*Source: Responses to Question 6.
34Ibid.9 Question No. 30d.
86
6,000 and over/ mo.
39 (15.29%) 18 (B. 49%)
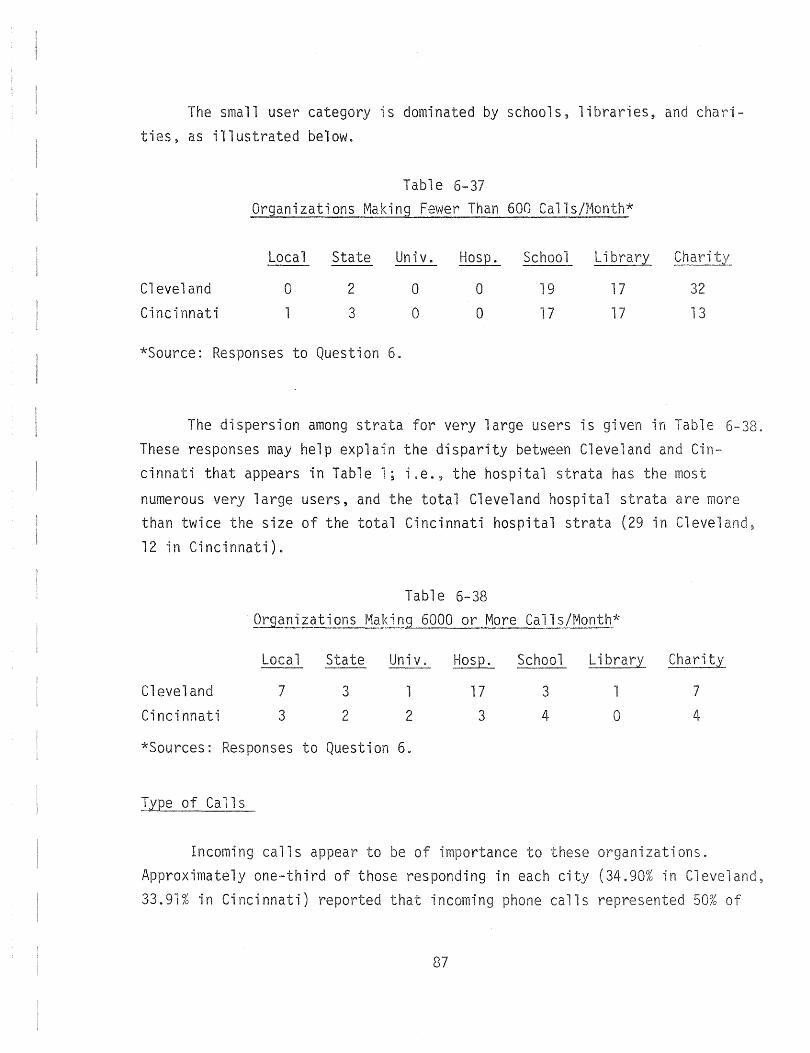
The small user category is dominated by schools, libraries, and cha
ties, as illustrated below.
Table 6-37 ~Organi zat ions Making Fewer Than
Local State Univ. HosQ.
Cleveland 0 2 0 0
Cincinnati 1 3 0 0
*Source: Responses to Question 6.
600 Call s/r,1onth*
School LibrarJ:
19 17
17 17
32
13
The dispersion among strata for very large users is given in Table 38.
These responses may help explain the disparity between Cleveland and Cincinnati that appears in Table 1; i.e., the hospital strata has the most
numerous very large users, and the total Cleveland hospital strata are more than twice the size of the total Cincinnati hospital strata (29 in Clevel
12 in Cincinnati).
Cleveland
Cincinnati
Table 6-38 Organizations Making 6000 or More Calls/Month*
Local State Univ. Hasp. School LibrarJ: Charity
7
3
3
2
1
2
17
3
3
4 o 7
4
*Sources: Responses to Question 6.
Type of Calls
Incoming calls appear to be of importance to these organi ions. Approximately one-third of those responding in each city (34.90% in Cleveland, 33.91% in Cincinnati) reported that incoming phone calls represented
87

the organization's phone calls (Question 7). More than half of those re-s ng in each city indicated that incoming calls represent 50-75% of the
ization's ephone ls. Table 6-39 gives further information about the importance of incoming calls.
eveland
ncinnati
"Ie '6-39
\~hat Percentage of Phone Call s Are Incom; ng*
less than 25% 25--49% 50-74% 75-100% Tot. Resp.
6 (2.35%) 34 (13.33%) 149 (58.43%) 66 (25.88%) 255 (100%)
4 (1.74%) 26 (11.30%) 134 (58.26%) 66 (28.70%) 230 (100%)
: Responses to Question 7.
It is somewhat interesting to note that three organizations (two in , and one in Cincinnati) reported that 100% of their calls are
incoming. Those responses representing the greatest frequency among all were in the category 50-75% (inclusive) of all calls are incoming.
A iled distribution of the strata responses is found in the following e.
Table 6-40
What Percent of Calls Are Incoming?*
Local State Univ. HosQ. School Library Charity
and 4 0
1 4 0
and 9 3
ncinnati 31 12 4
and 3 2 0
Cincinnati 7 1 0
: Responses to Quest"j on 7.
Less than 50%
4 8
0 4
50-75% (inclusive)
12 65
6 56
Greater than 75%
3 8
0 14
88
5
5
22
16
3
8
18
16
52
47
13
4
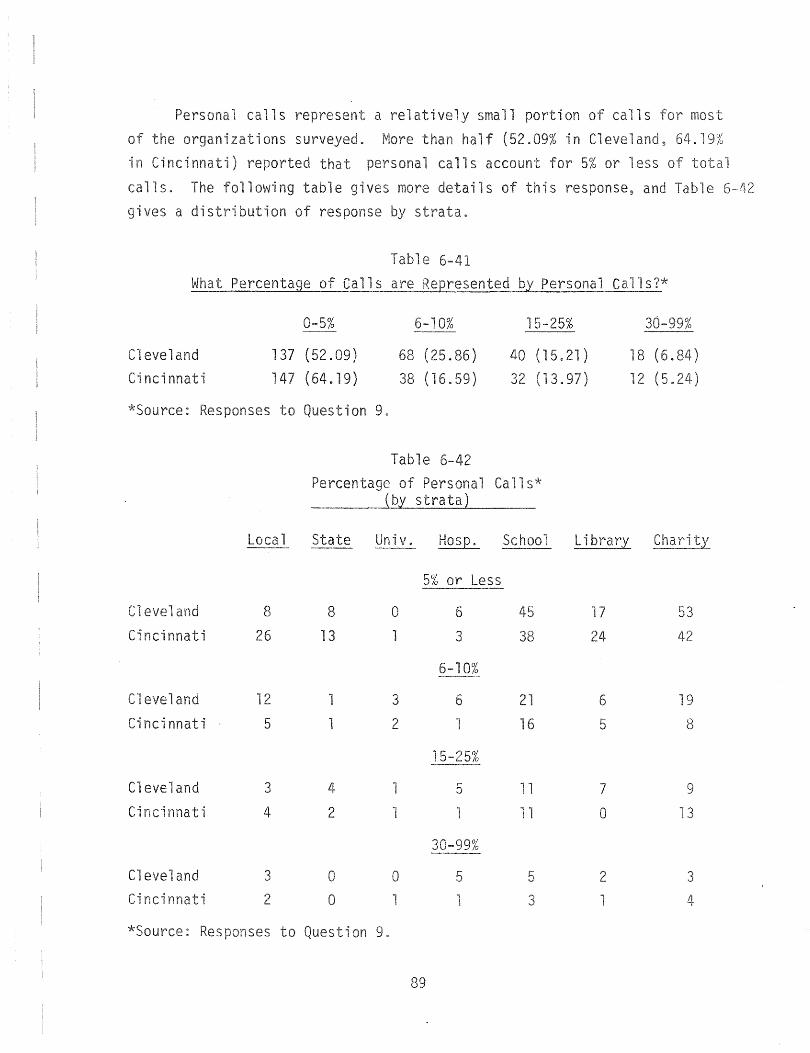
1 calls represent a rel vely small portion of 1s most organiz ions surveyed. than half (52.09% in Clevel 1 ..
in Cincinnati) reported that personal calls account for 5% or less
calls. The lowing table gives more details of this response~ and e
gives a di bution of response by strata.
Table 6-41
What Percentage of Calls are Represented by Personal Calls?*
0-5% 6-10% 15-25%
(15.21) 32 ( 3.97)
30--99%
eveland Cincinnati
137 (52.09) 147 (64. 19)
*Source: Responses to Question 9.
-~-"~-~
68 (25.86) 38 (16.59)
Table 6-42
Percentage of Pers Call (by strata)
Local State iVa HaSp. School
5% or Less ----.-
and 8 8 0 6 45
Cincinnati 26 13 1 3 38
6-10% ---_.
evel 12 3 6 21
ncinnati 5 2 16
5%
eveland 3 4 5 11
n nnati 4 2 1 11
30-99%
Cleveland 3 0 0 5 5 ncinnati 2 0 3
*Source: Responses to Question 9.
89
Library
17 24
6
5
7
0
2
18 (6.
12 (5.
53
19
8
9
13
3
Changes ;n Telephone Usage
The organizations were asked whether they use the telephone differently now than the way they did one year ago. Also, they were asked whether the
ephone is used differently now than five years ago. Seventy-five or 25.60 percent of those responding in Cleveland reported they use it differently now
one year ago. Forty-four or 17.53% of the respondents in Cincinnati reported a change in usage in the past year. Of those who reported a change -in usage today over usage a year ago, 68 percent in Cleveland and 68.18 percent
respondents in Cincinnati were in three strata--schools, libraries, and charities. 35
When asked whether there had been changes in usage over the past five
years, 72 (38.30 percent of respondents) in Cleveland and 60 (33.90 percent) in Cincinnati reported there had been changes. Again, approximately twothirds of the responses (66.67 in Cleveland and 63.33 in Cincinnati) were from one of three strata - schools, libraries, and charities. 36 Tables 6-43
and 6-44 detail these responses. Increase in the volume of calls accounted for 30 percent of the responses in both cities as to how telephone usage has changed in the past year. Nineteen percent of respondents in Cleveland and fourteen percent in Cincinnati reported changes due to new communication systems. It is interesting to note that 28% in Cleveland reported changes due to increase in business, while only 17 percent in Cincinnati reported
s. Most of this difference is explained by differences in response in three strata ~-hospitals, libraries, and charities. 37
Approximately two-thirds of the changes over the past five years in each city occurred for one of the same three reasons i.e.~ increase in volume of calls, new communication systems in service or increase in business. One contrast between cities involves policy changes. In Cleveland, 19.38% reported policy changes while in Cincinnati only 12.79% reported policy changes.
35Compiled from responses to question 17.
36Compiled from responses to question 18.
37compiled from responses to question 17a.
90
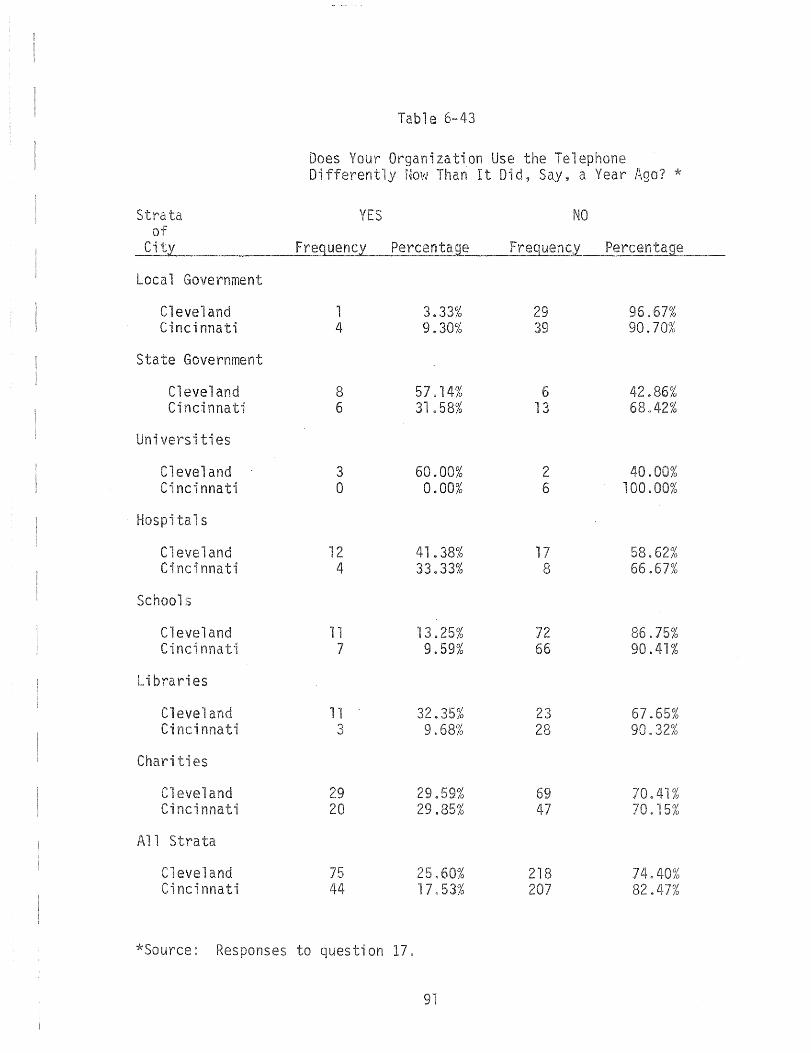
Local Government
Cleveland Cincinnati
State Government
Cleveland Cincinnati
vers"i es
Cleveland Cincinnati
Hospi 1s
Cleveland Cincinnati
School
Cleveland Ci
Libraries
Clevel Cincinnati
es
C1 ;
Cincinnati
*Source: Responses
Table 43
1 3.33% 4 9.30%
8 57 . 14% 6 .58%
3 60.00% 0 0.00%
12 .38% 4 33.33%
11 13.25% 7 9.59%
11 32. 3 9.68%
29 20 .85%
25. 17 53%
ques on 17.
on Use the 1 ltD i d, Say, a
29
6 13
2 6
17 8
72 66
23 28
218
*
.67% 90.70%
.86% 68 .. 42%
58. 66.
86.75% .41%
67. 90.
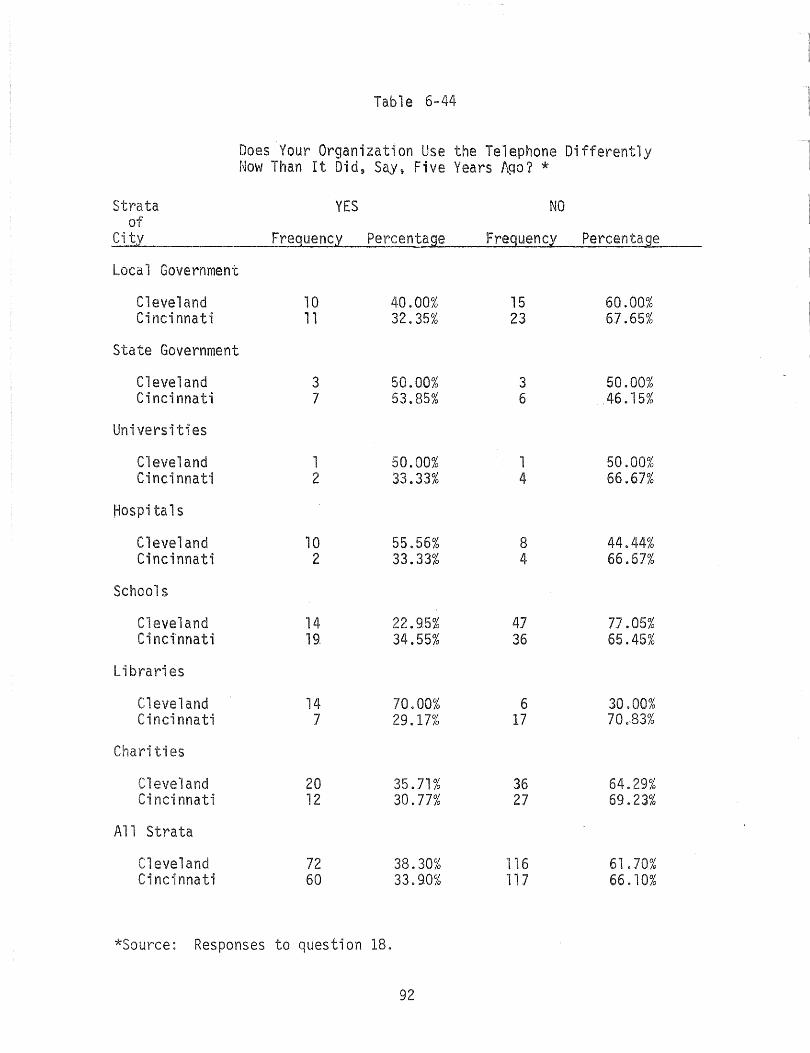
Table 6-44
Does Your Organization Use the Telephone Differently Now Than It Did, Say, Five Years A~o? *
Strata YES NO
City Frequency Percentage Frequency Percentage
Local Government
Cleveland 10 40.00% 15 60.00% Cincinnati 11 32.35% 23 67.65%
State Government
Cleveland 3 50.00% 3 50.00% Cincinnati 7 53.85% 6 .46. 15%
Universities
Cleveland 1 50.00% 1 50.00% Cincinnati 2 33.33% 4 66.67%
Hospitals
Cleveland 10 55.56% 8 44.44% Cincinnati 2 33.33% 4 66.67%
Schools
eveland 14 22.9.5% 4] 7].05% Ci nci.nnati 19- 34.55% 36 65.45%
Libraries
eveland 14 70.00% 6 30.00% Cincinnati 7 29.17% 17 70 . .83%
es
eveland 20 35.71% 36 64.29% Cincinnati 12 30.77% 27 69.23%
All Strata
eveland 72 38.30% 116 61.70% ncinnati 60 33.90% 117 66.10%
*Source: Responses to question 18.
92
A second con ch mayor not have some rel ionship to use
of measured rates---is that 5 10 percent in Cleveland reported that economic
incentives icated increased use of the ephone, 11e 11. in Cinci
i ndi d-ltions Oi"
is response. elements
Because of budgetary factors, overall c con-d in uenced this res se,
rate service in ncinnati can on anations
be vi as one many si e ex-
F. Other Modes of Communication
Operational cost consi ons re the use other
communication an organization. In this ion, we briefly discuss
those other modes and their usage.
~~odes communication ephone i ie,
mail, personal, media, in-house message ivery, none,
stratum in es, with the exception of s in both~ ei a urality or majority said that other ,than the telephone they used mail as
a mode of communication. With respect to the hospi strata, other than
the telephone, the majority in each e1 ic means as a
communication.
j
It is interesti ephone or ty in
to note, in situations where mode of communication is equally appropriate,
in both cities the ephone. 39
G. Importance of Telephone Serv ice
There were numerous reasons given aci organizations interviewed. The or reasons given usi
3BC '1 ,omp' from responses to question l8a.
Appendix F, Question Nos. 1 and 14 for the
ther ma-
service for outgoing calls were to:
1. Contact other organizations; 2. Contact clients, customers, patrons or employees; 3. Obtain supplies or resources; 4. Obtain or exchange information; 5. Contact parents; 6. Library services such as reserving books or holding books; 7. General business ca115. 40
In general, the response was as expected - outgoing telephone calls relate to just about anything. The reasons range from business to personal
calls, with the vast majority being related to the function or business of the organization. Most of the organizations that we are dealing with here provide the community with mostly personal services.
The main function of most of the organizations that were analyzed was
to provide some type of personal service to the individual. As one might
suspect, telephone service played a necessary role in the provision of the
service. About 88.5 percent of the organizations interviewed view the telephone service, specifically for outgoing calls, as a necessary factor in accom
plishing the main function of the organization. 41 Table 6-45 contains the results. We should note that in Cincinnati, 85 percent of the organizations
ew outgoing telephone calls as necessary to the accomplishment of the
main function of the organization, and in Cleveland 91.5% believe the teleservice is necessary. From a statistical standpoint, the'\-"e is 'no
difference in the two cities.
The importance of the telephone is also demonstrated by the fact that
83% all organizations42 stated that significant delays in service or
provided to the public would result if the telephone could not be used. However, it is also interesting to note that 17% stated that minor
ays or no delays in service would result if the telephone could not be used. Table 6-46 presents the results.
~.
A list of all reasons can be found in Appendix F, Question No.2. 41 Ibid . 42--
See Question No. 16.
94

Table 6-45
Are Outgoing 15 Necessary Accomplish The Main Function of Your Organ; on? *
YES NO
~ Frequency Percentage Frequency Percentage
Local Government
Clevel 29 .67% 1 3.33% Cincinnati 37 86.05% 6 13.95%
State Government
Clevel 13 1 0 o. Cincinnati 17 89.47% 2 10.53%
iversities
Cleveland 5 100.00% 0 0.00% Cincinnati 5 83.33% 1 16.67%
Hospitals
evel 27 93. 10% 2 6. . __ ~Jncinnati 11 91.67% 1 8.33%
Schools
Cleveland 74 88.10% 10 11 . C'incinnati 55 75.34% 18 24.66%
Libraries
Clevel 29 85.29% 5 14. % Cincinnati 25 80.65% 6 19.35%
ties
7
1 Strata
Cleveland
*Source: Responses to ques on 3.
95
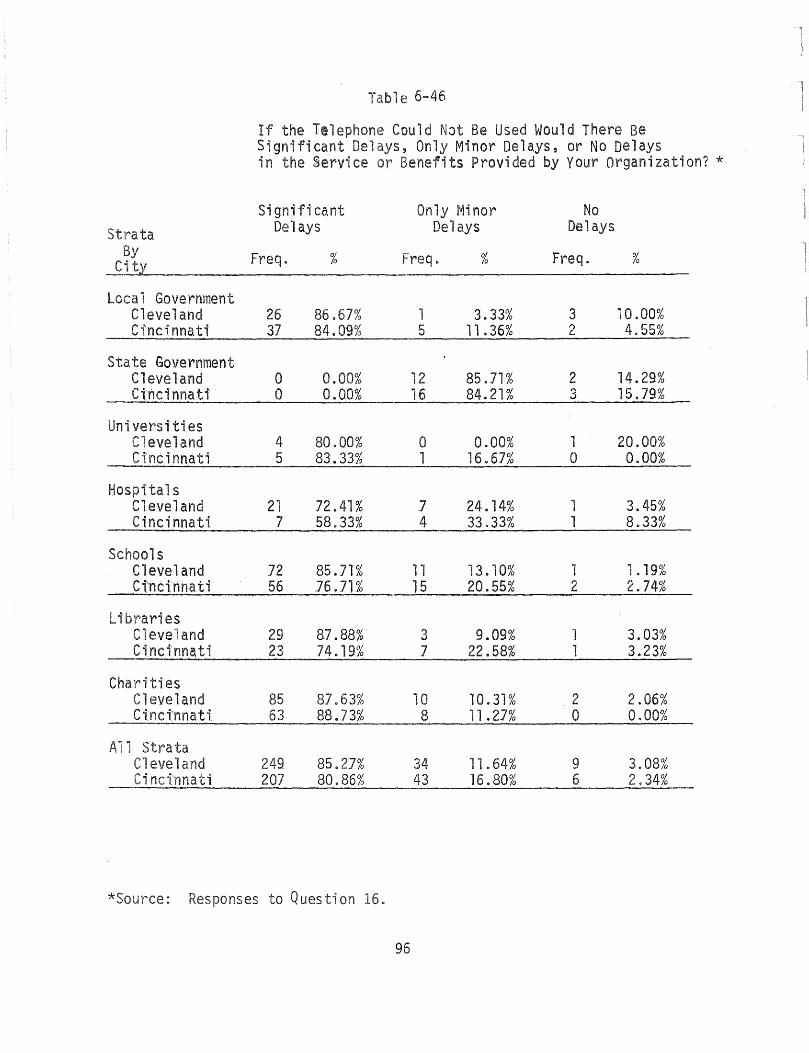
Table 6-46
If the Telephone Could Not Be Used Would There Be Significant Delays, Only Minor Delays, or No ays in the $ervice or Benefits Provided by your organization? *
S1 gn; fi' cant Only Minor No
Strata Delays Delays Delays By Freq. % Freq. % Freq. %
C'it~
Local Government Cleveland 26 86.67% 3.33% 3 10.00% Ci'ncinnati 37 84.09% 5 11.36% I) 4.55% (..
State Government Cleveland 0 0.00% 12 85.71% 2 14.29% Cincinnati' 0 0.0.0.% 16 84.21% 3 15.79.%
Univers;' ti es Cleveland 4 80.00% 0 0.00% 1 20.00% Cincinnati 5 83.33% 1 16.67% 0 0.00%
Hospitals Cleveland 21 72.41% ] 24. 14% 1 3.45% Cincinnati, ] 58.33% 4 33.33% 1 8.33%
Schools Cleve.l and 72 85.]1% 11 13.10% 1 1.19% Ctnttnna ti 56 ]6 .Jl % 15 20.55% 2 2.74%
braries Cleveland 29 8J .88% 3 9.09% 1 3.03% C inc tD_na ti 23 74. 19% 7 22.58% 1 3.23%
Cha ties Cleveland 85 8.7.63% 10 10.31% 2 2.06% Ctnci'nnati 63 88.]3% 8 11.2]% 0 0.00%
1 ta Cleveland 249 85.2]% 34 11.64% 9 3.08% Cinci'nnati 207 80.86% 43 16.80% 6 2.34%
*Source: Responses to Question 16.
96
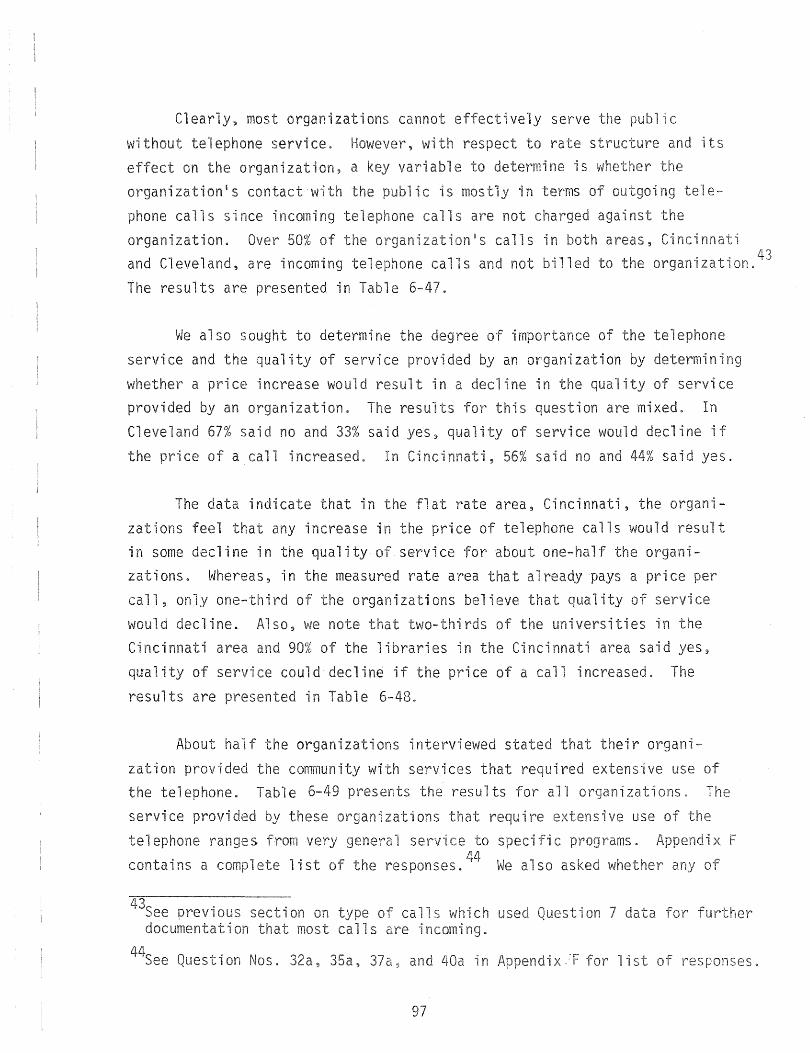
C1 Y'!J most organizations cannot y serve the ic
ceo respect to its
organization, a e determine is
organ; on's t in e-
phone ca"li s s nce incoming
organization. Over 50% and Cleveland, are incoming
The results are presented in
1s are not
s 1 sin 1s and not 11 ed
nst the ncinn
the organi
We also sought to determine the i telephone
ce and quality of service ded by an organization by determini
whether a price increase wo d res t in a ine in ity ce provided by an organization. res ts s question are mixed.
Clevel 67% said no and 33% said yes" quality of service d decline if
the ce of a increased In Cinci i , 56% said no and 44% said s.
The data indicate that in the flat rate area, Cincinnati, the organi-
zations feel that any increase in the ce tel calls would res t in some decline in the quality service f organi-zations. Whereas, in the measured rate area that 'pays a price
1 ~ only one-thi of organ; ons believe ce
dine. Also, we that rds of the universi es in ncinnati area of the libraries in the Cinci area said yes,
quality of ce could decline if the ce of a
resul are in Table 6-48.
About f the organi ons i ewed stated r i-
ion 'j community services that requi lve use the telephone. Tab 1 e 6-49 presents 1
service ire extensive use
telephone s
contains a complete list responses. We also as
43" . t' ~.ee oreVlOUS sec 10n on type u 011 7 documentation most 1s are i
ion Nos. X :1=" " , 1 i
on.
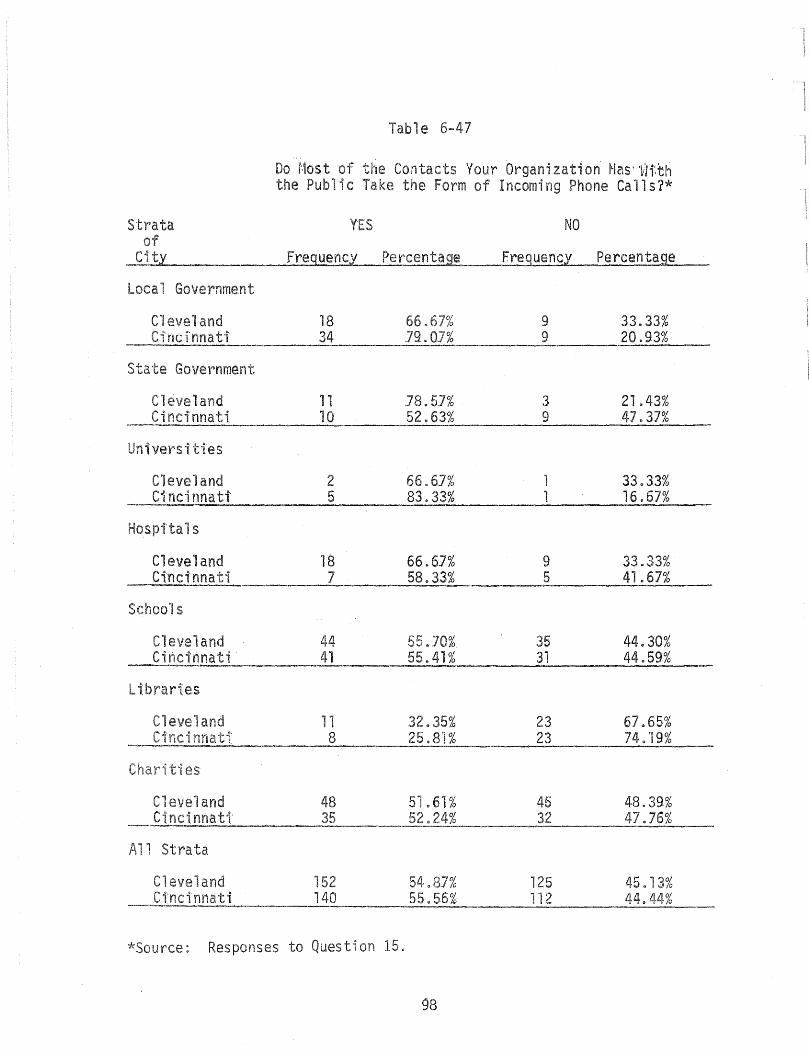
e 6-47
Organ; on Has"1I1fth Incoming Phone Cal1s?*
Strata NO
Government
and 18 9 33.33% Cinci'nnati 34 ]9.0]% 9 20.9.3%
Government
11 3 21.43%
11 67.65%
es
48 48.39%
45. 13%
to Question
98
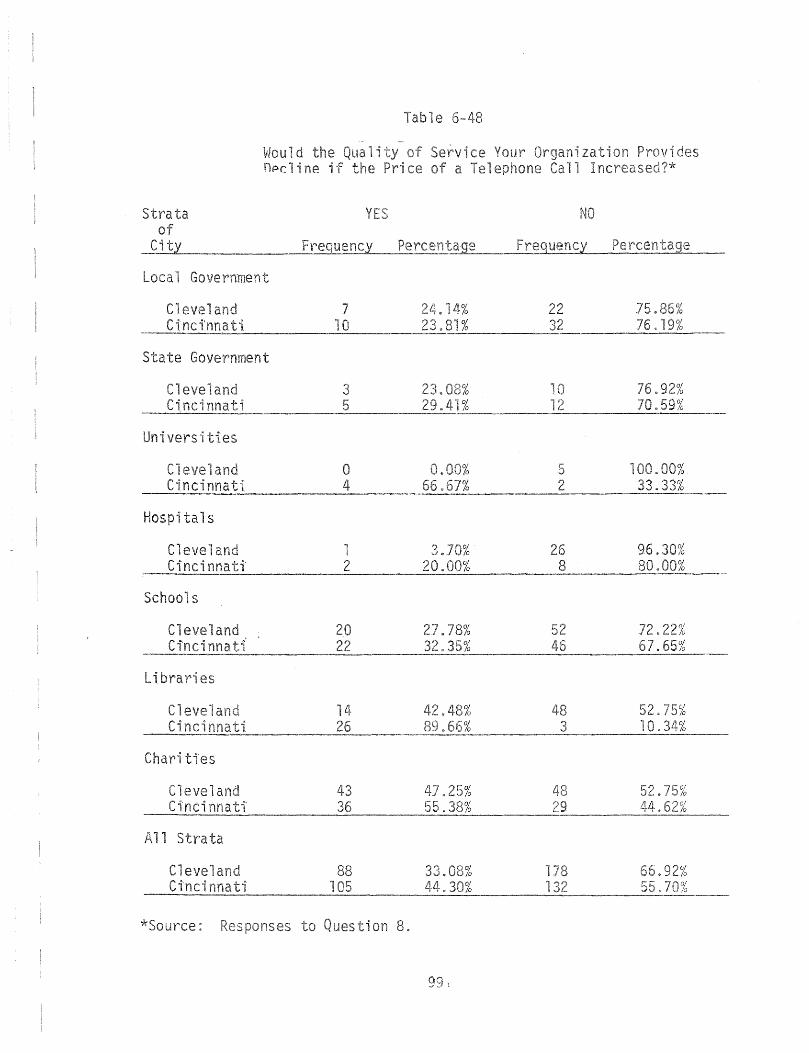
Stra
Cincinnati
Hospitals
s
es
]
3
a 4
1
14
66.67%
1 1 1
Ques on 8.
5 2
1 33 33%
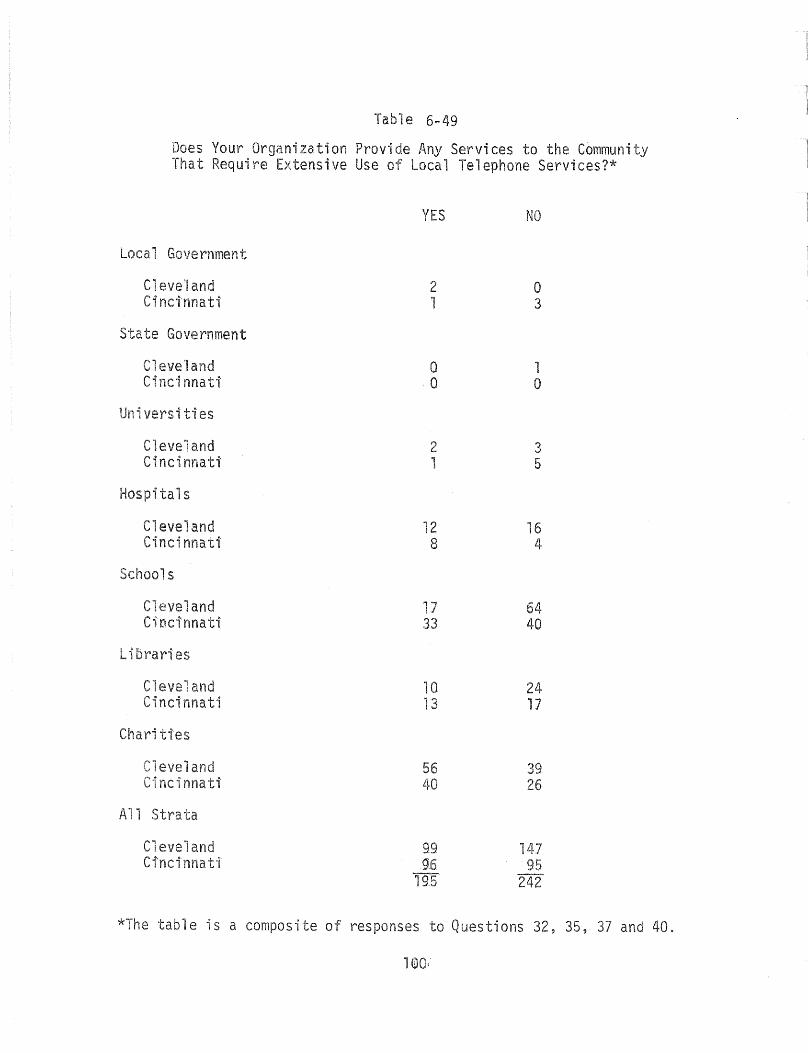
Government
State Government
iversities
evel Cincinnati'
pitals
Cleveland ncinnatt
Schools
and C-,nclnnati
es
Organ"' on re Extensive
Tabl e 6-49
Any Services to the Community Local Telephone Services?*
YES
2 1
Q
·0
2 1
12 8
17 33
10 13
56
1
o 3
1 o
3 5
16 4
64 40
24 17
26
e is a composite of responses to Questions 32, 35, 37 and 40.
ive use were services
organization. types
areas~ from
rams or serv ces provi over a
s c.
H. --~----------------------------~-----.--~
Seven questions were
meas rates. Since
Ci nnati is on a
eons is
ions were as
s
Thi
s ceo said n.o.
in i
res sing or ,costs are now a concern.
Eleven responses ( of whi were
indicated that service has decreased,
or the need to divert from
i
a
ng cos responses i
1 im;
patrons;
from measured fl
so as
rates would
s , 15
ix F, on
Appendix F, Ques on
i 1 es to on
on.
costs are
schools, 1 i braries ~ es)
a res onls
s
personal calls
on
d 1 ess
10
t
in
to
e
po 1 icy. These
a pay
as ous in us i
a is res
es.
ces
4 reported ce to the public would increase with a flat rate stand-dard!l and 5 reported that policy Nould change. These potential policy changes took the form limiting or monitoring calls if costs increased, and one response viewed the prospect of a change to at rates as being more of a burden. 48 All responses, by strata, to is question are found in Table 6-50.
The organizations were also asked to describe the impact of a change
from measured rates to higher flat rates (Questions 23 and 23a). Forty-six ( .99%) reported that such a change would affect the way the organization served the public. This response is slightly larger than the number who said that a change to flat rates (without specifying the size of the change) would affect their organization. The response by strata is contained in Table 6-51. When asked to describe the impact of higher flat rates, the most frequently mentioned effect (21, or 43.73% of responses) related to decreased phone usage. This included cutting back on usage, reducing the number of phone lines, and reducing personal usage. Some of these responses indicate the organizations
lack full understanding of flat rate standard. However, the overall response
of reduced usage indicates sensitivity to the fact that telephone service is a resource to be used wisely_ The second most frequent response (10 or 20.83%
of all responses) indicated a budget impact. This included the belief of greater savings with a flat rate, and again the need to divert funds from
. t t' t 49 prlmary purposes 0 opera 1ng cos s.
Another question related to whether the organizations felt that measured
rates gave them more, less, or about the same control over their telephone
bill. Nearly two-thirds of those responding (113, or 63.48%) felt the degree
of control was about the same as it would be with flat rates. Only 18 (10.11%) felt they had less control while 47 (26.40%) said they had greater control.
results are detailed by strata in Table 6-52. Those who felt they had either more or less control were asked to explain why they felt this way. More than one response could be given, and a total of 70 responses were recorded. The most frequent responses (33) related to the fact that under measured rates,
48 A complete list of responses can found in Appendix F Question 20a.
49 A complete list of responses can be found in Appendix F, Ques on 23a.
loe

Strata
1 Government
Univers i. t;:es
Cleveland
Hospitals
Cl a.nd
Schools
C1
and
Chari es
C1 and
Strata
evel
Table 50
Would a Change from Measured Way Your Organization
5.88%
1 16.6]%
0 0.00%
2 8.70%
11 23.40%
6 37.50%
15 21 .
36 57%
*Compiled from Question 20, Cleveland
103
Fl th~ Publ;
NO
16
5
5
36
10
148
y
94. 12%
83.33%
100.00%
91.30%
62.50%
.43%
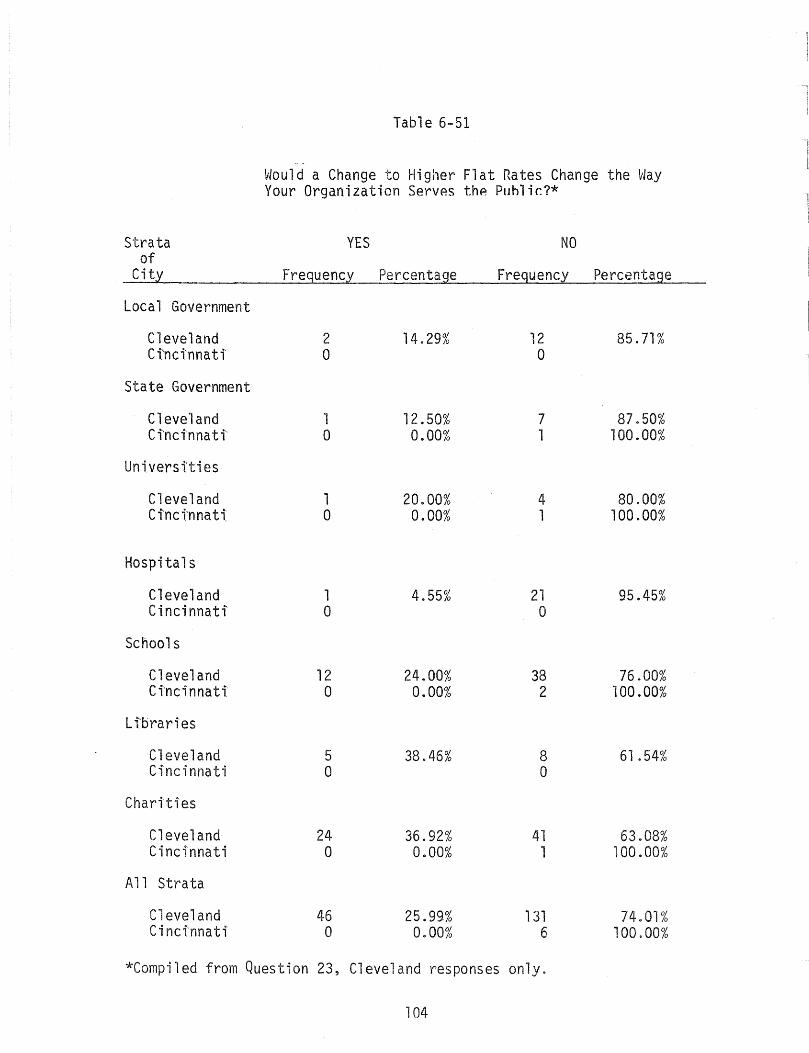
Strata of
City
Local Government
Cleveland C tnc i'nna t i'
State Government
Cleveland Ctncinnatt'
Universi'ties
Cleveland C tnc i'nna t i:
Hospitals
Cleveland Cincinnati'
Schools
Cleveland C tncinnat;.
L tbraries
C"eveland Cincinnati
Charities
Cleveland Cincinnati
All Strata
Cleveland Cincinnati
Table 6-51
~ -
Would a Change to Higher Flat Rates Change the Way Your Organization Servps thp Puhlir.?*
YES
Frequency Percentage
2 o
1 o
1 o
1 o
12 o
5 o
24 o
46 o
14.29%
12.50% 0.00%
20.00% 0.00%
4.55%
24.00% 0.00%
38.46%
36.92% 0.00%
25.99% 0.00%
NO
Frequency Percentage
12 o
7 1
4 1
21 o
38 2
8 o
41 1
131 6
85.71%
87.50% 100.00%
80.00% 100.00%
95.45%
76.00% 100.00%
61 .54%
63.08% 100.00%
74.01% 100.00%
*Compiled from Question 23, Cleveland responses only.
104
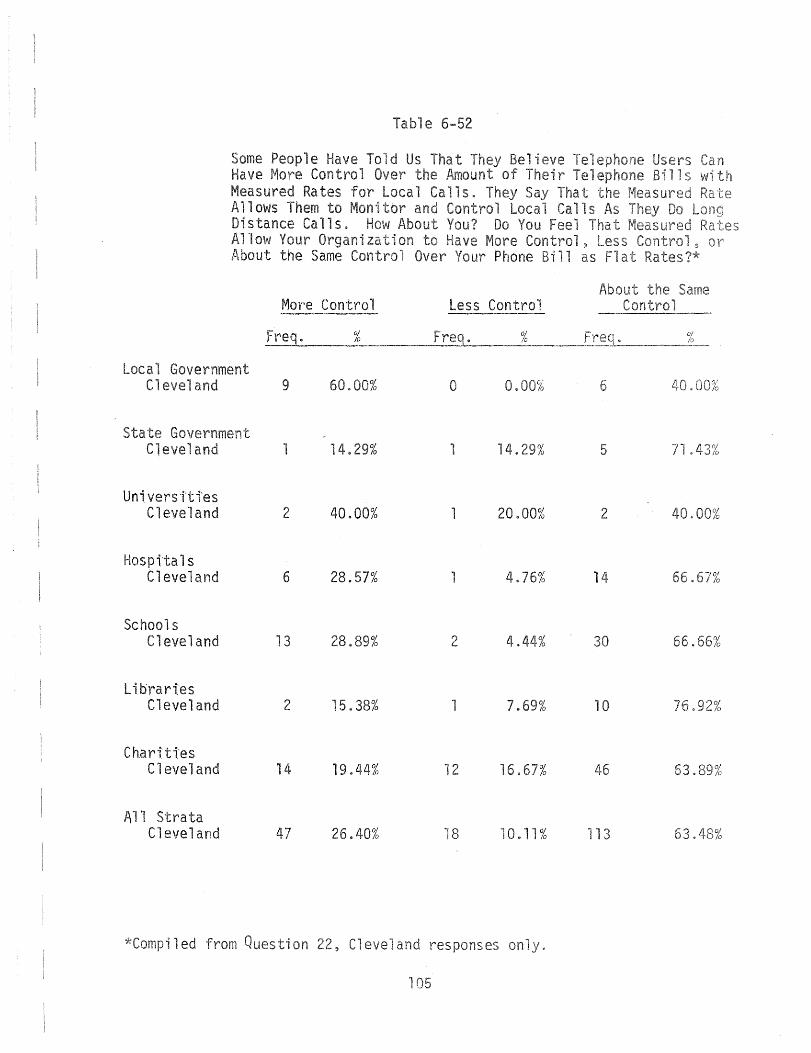
Table 6-52
People Con
Measured Ra Allows Them to
stance Calls. low Your
About the Same
More Control
%
Government C1 and 9 60.00% 0 O.
*Compiled from on 22~ es y.
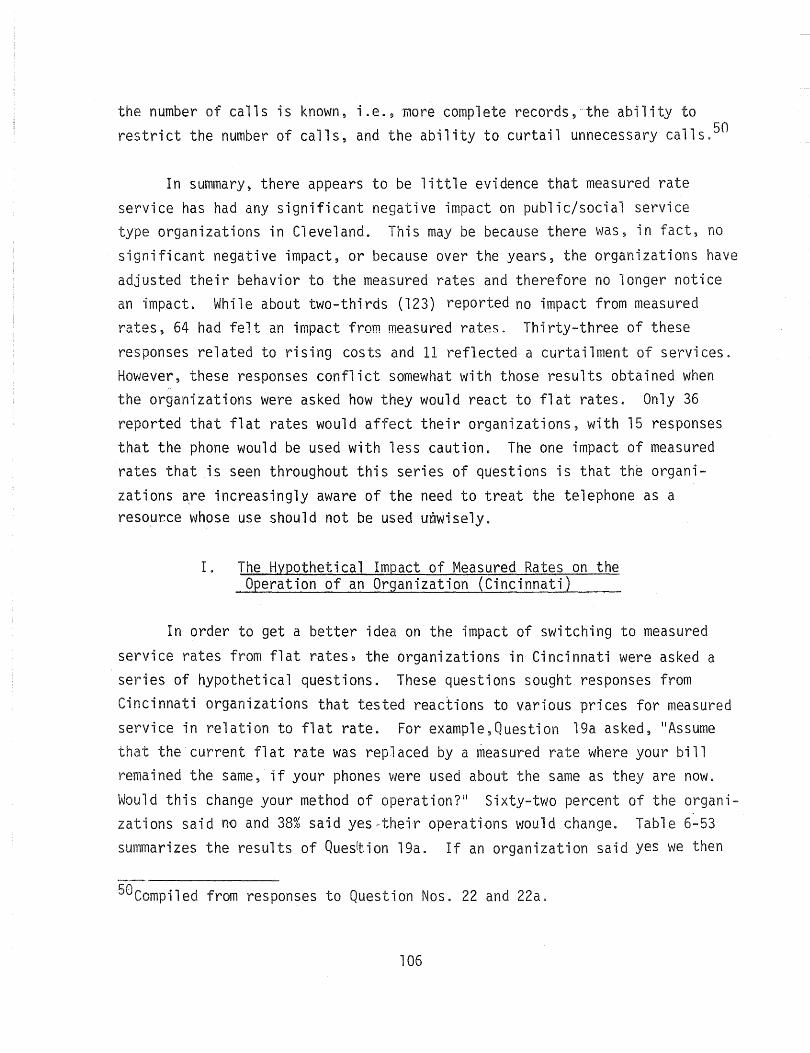
the number of call sis known, i. e., more complete records, "the abi 1 i ty to restrict the number of calls, and the ability to curtail unnecessary calls. 50
In summary~ there appears to be little evidence that measured rate
service has had any significant negative impact on public/social service type organizations in Cleveland. This may be because there was, in fact, no
significant negative impact, or because over the years, the organizations have
adjusted their behavior to the measured rates and therefore no longer notice an impact. While about two-thirds (123) reported no impact from measured rates, 64 had felt an impact from measured rates. Thirty-three of these
responses related to rising costs and 11 reflected a curtailment of services. However, these responses conflict somewhat with those results obtained when the organizations were asked how they would react to flat rates. Only 36
reported that flat rates would affect their organizations, with 15 responses that the phone would be used with less caution. The one impact of measured rates that is seen throughout this series of questions is that th~ organi
zations ~re increasingly aware of the need to treat the telephone as a resoucce whose use should not be used u~~isely.
I. The Hypothetical Impact of Measured Rates on the Operation of an Organization (Cincinnati)
In order to get a better idea on the impact of switching to measured
service rates from flat rates, the organizations in Cincinnati were asked a series of hypothetical questions. These questions sought responses from
Cincinnati organizations that tested reactions to various prices for measured service in relation to flat rate. For example,Question 19a asked, "Assume that the current flat rate was replaced by a ~easured rate where your bill remained the same, if your phones were used about the same as they are now.
Would this change your method of operation?" Sixty-two percent of the organizations said nD and 38% said yesfrtheir operations would change. Table 6-53
summarizes the results of Ques~ion 19a. If an organization said yes we then
50Compiled from responses to Question Nos. 22 and 22a.
106
versi
s
es
*Compi 1 us i
7
8
3
2
10
16
on • 1
e 53
.59%
.00%
28.57%
8
1
5
5.
.88% 123
nci ses
%
y.
asked the organization to tell us how their operation would change. The
most common answer was that outgoing calls would be reduced. This answer indicates that the question could have been misunderstood since we stated that total charges remained the same and usage remained the same. Alter
natively, the response could indicat~ that rather than the total bill being the controlling factor, the fhange from a flat rate structure to a >
measured rate structure in itself induced a change in behavior. Another
response by organizations was that the change in rate structure would initiate organizational policies with respect to telephone use. This is a clear indication that a change in rate structure could elevate the consideration
given to the telephone as a resource.
In addition, we sought responses from organizations switching from
at rates to measured rates where their telephone bill went up or down. Question 19c asked, IIAssume that the current flat rate was replaced by a measured rate where your bill increased 20% if your usage remained the same.
Would this change your method of operation?" To help clarify the question, the interviewers were instructed to tell the respondents that "by reducing usage the bill could be reduced. 1I The majority of organizations (65 percent) stated they would change their operation; 35 percent said no. The
results for all strata are presented in Table 6-54.
Again, we questioned those organizations that said yes to determine how their method of operation would change. The majority again stated that outgoing telephone calls would be reduced and/or services would be cut. However, people also felt that because of the price increase a switch
to other modes of communication would be considered. Again, we can conclude from this question that organizations would be giving more consideration to the telephone as a valuable resource.
We then asked the organizations in Cincinnati through question 1ge
what changes would result from a 20% decrease in their telephone bill. The
majority response was that no changes would be made. Ninety percent said no and 10 percent said yes (See Table 6-55). The yes respondents were again asked what changes would be made, and the primary response was the out-
108
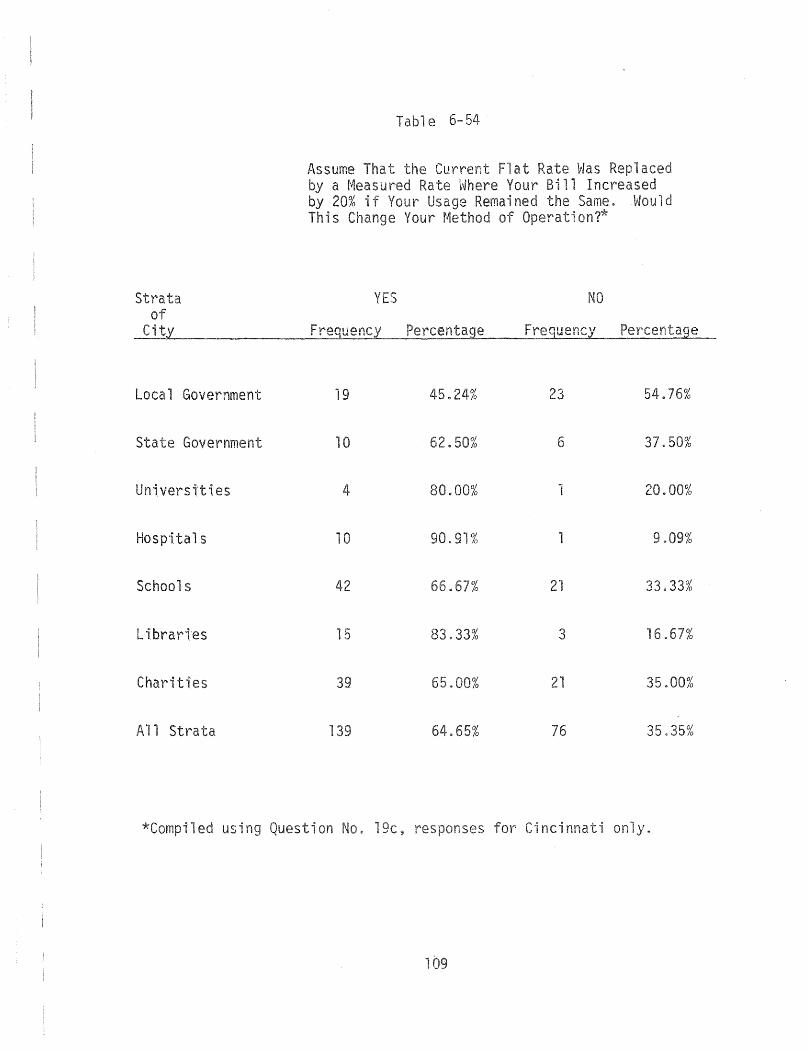
Strata of
Local Gover'nment
Government
Uni.verstties
Hospttals
Schools
L i.braries
Charit
1 Strata
sume t by a t'1easu by 20% if This Change
19
10
4
10
42
15
*Compiled using Question No. 1
Table 6-54
45. 54.76%
6 37.50%
80. 1 20.00%
% 1 9.09%
66.
.33% 3 16.67%
.00%
64.65% 76
ncinnati y
1
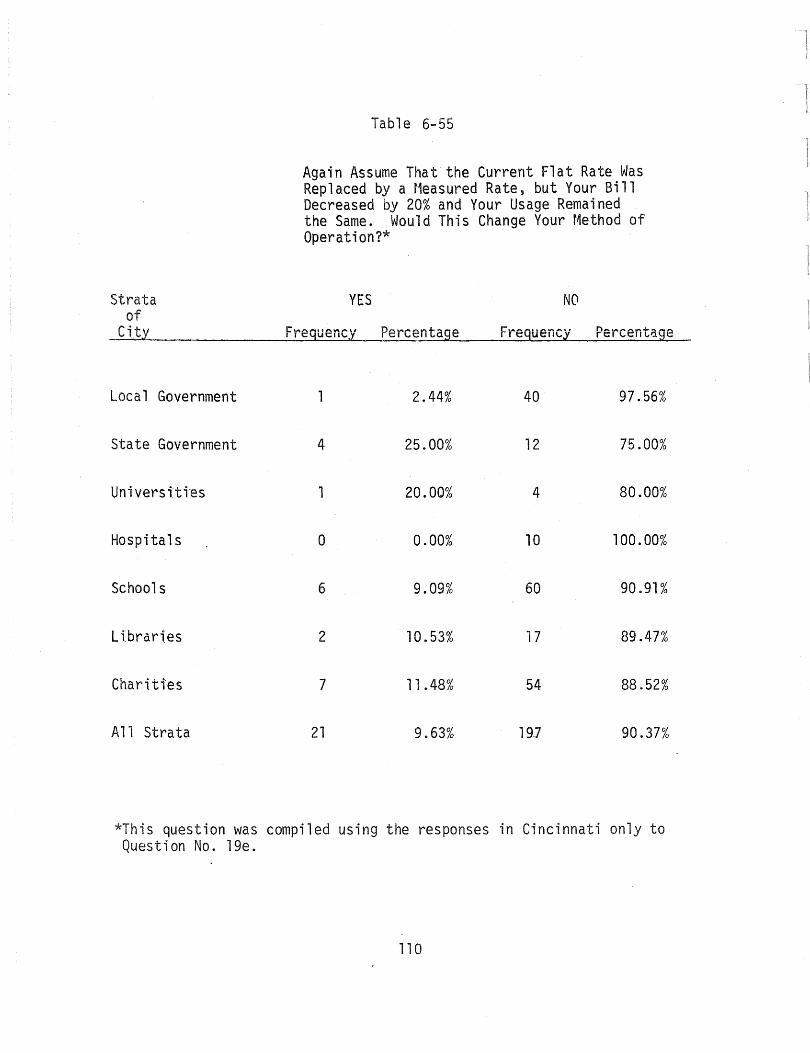
Strata of
City
Local Government
State Government
Universtttes
Hospitals
Schools
L tbrari.es
Chari ti'es
All Strata
Table 6-55
Again Assume That the Current Flat Rate Was Replaced by a t1easured Rate, but Your Bill Decreased by 20% and Your Usage Remained the Same. Would This Change Your Method of Operation?*
YES NO
Frequency Percentage Frequency Percentage
2.44% 40 97.56%
4 25.00% 12 75.00%
1 20.00% 4 80.00%
0 0.00% 10 100.00%
6 9.09% 60 90.91%
2 10.53% 17 89.47%
7 11.48% 54 88.52%
21 9.63% 19] 90.37%
*This question was compiled using the responses in Cincinnati only to Question No. 1ge.
110
going calls would be increased. Specifi 1y, organ; ions
increase in ing ca.lls d be in foY'm of se in ce local
i di service. One can ephone budget di y peri
i e usion d drawn is organizations in nci are sensi ve service. , an ve conclusion is that they sensi ve to ce increases. stituted a change from fl to measured rates~
changes d res t if the rate desi decreased
indi the organ would give more consideration to telephone service as a. It could also mean that it is possible, through a to measured rates, to increase efficiency of 1
only through technology, but through increased awareness users.
stated
1 1 s. In ce as
d be more if one in-
onal 1 .
e resource.
responsiveness

CHAPTER 7
IF! ION OF SAMPLE A FURTHER ANALYSIS OF THE MAIN STUDY DATA
A.
In order to gain a better understanding of the measu
service on quality service, we cross-tabulated ques ons. Qu on 3, iHAre ing calls necess~ to accomplish the main nc-tion of your nization?" was cross-tabulated all other ons.
es estion 3 determine whether were consistent in their answers and to determine how e-
p ated to ali of ce these i-
zations.
d
a ci organ
n
1e resource such as ephone can
ated to the ity of service because there are 1ng quality, the data does indicate that in
is used extens
fi is
ons 0 answe
Y to provide the services
en we
on 3
ne
i
n to accompli rna in fu ion of ci es, the majority of ephone service use is incoming. In most ons, lover 50% us
113
1s
an
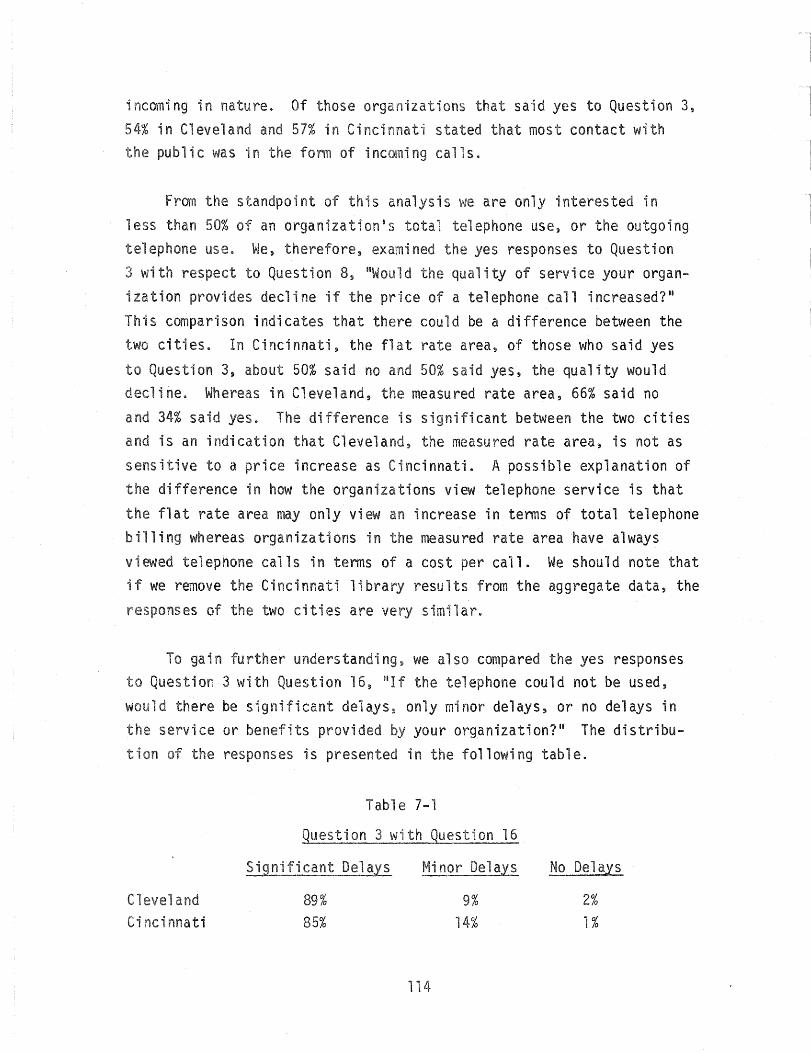
incoming in nature. Of those organizations that said yes to Question 3, 54% in Cleveland and 57% in Cinc; stated that most contact with
public was in the form of incoming calls.
Fran the standpoint of this analysis we are only interested in less than 50% of an organizationis total ephone use, or the outgoing
yes responses to Question quality of service your organ-
ephone useo We, therefore, ned
3 with respect to Question 8, "Would ization provides decline if the price of a telephone call increased?1I
This comparison indicates that there could be a difference between the cities. In Cincinnati, the flat rate area, of those who said yes
to on 3, about 50% said no 50% said yes, the quality would decline. Whereas in Cleveland, the measured rate area, 66% said no
a 34% said yesc The difference is significant between the two cities and is an indication that Cleveland, the measured rate area, is not as
sensitive to a price increase as Cincinnati. A possible explanation of the difference in how the organizations view telephone service is that
the flat rate area may only view an increase in terms of total telephone billing whereas organizations in the measured rate area have always
vi~/ed telephone calls in terms of a cost per call. We should note that if we remove the Cincinnati library results from the aggregate data, the
es the two cities are very similaro
gain further understanding, we also compared the yes responses Question 3 with Qu on 16, "If the telephone could not be used,
would there be significant delays, only minor delays, or no delays in service or ts provided your organization?1I The distribu-
tion responses is presented in the following table.
Cl a nnati
Table 7-1
Question 3 with Question 16
Significant Delay~
00% 85%
Minor Delays
114
9% 14%
No Delays
2% 1%
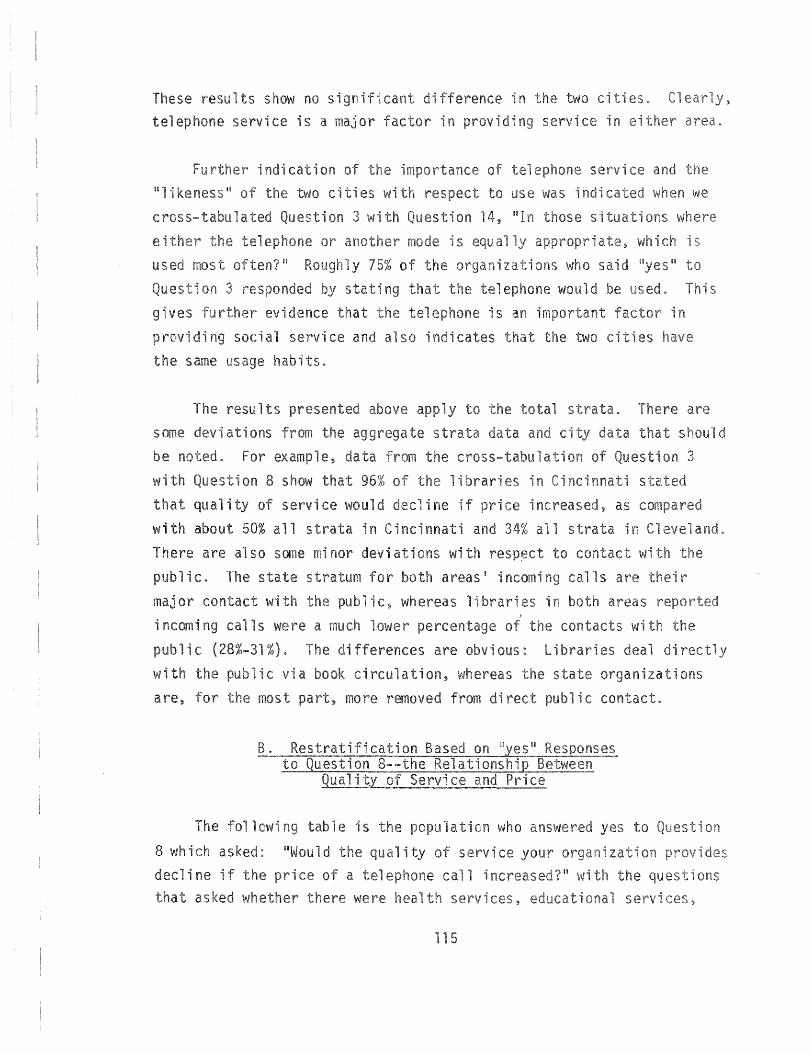
ei
us
ep
gives
p di
same us
s no signi is a
on
hits.
ci
on
so i
results y
some ons
be
w 1
wi abo 50% 1 s in are so some
lie. s s r major lie,
i ncomi ls wel"'e a ower
"I i c %). differences are wi lie via rcula on, are, most ;; more
1e s on 8 i ;
decline if a 1 i
as were services,
115
s
i
c es
are
d
strata in
r
ons
s "I

library services, or charitable services provided to the community that require extensive use of local telephone services.'
Table 7-2
Questions of Extensive Use
Cleveland Cincinnati
46% 38%
No
54% 62%
The responses suggest only minimum difference between the two cities. We can interpret the responses as i icating that of those organizations that felt that quality of service would decline, more than 50% of the organizations do not provide services that use the local telephone service extensively. A further examination of the strata indicates that of the 50% who do provide services that require extensive use of the local telephone service, about 50% of these organizations are charities in both areas. Therefore, only 25% of the sample, if we exclude charities, felt that quality of service would decline if price increased and also provide services that require extensive use of the telephone.
One last additional observation: with respect to individual strata data, the data suggest that there could be a difference in the services provided by organizations between the two areas that relate to quality of service provided by an organization and local telephone
usage for those organizations. Although it is impossible to determine the idity difference, the hospital, school, and library strata di a difference between the cities. In each of the stratum the organizations in Cincinnati stated that they provided more services than Cleveland that require extensive use the telephone. Again we
should point out that the number of servations answering both questions is ite small relative to the population, therefore no conclusion can
lThese questions include Question numbers 32, 35, 37, and 40.
116
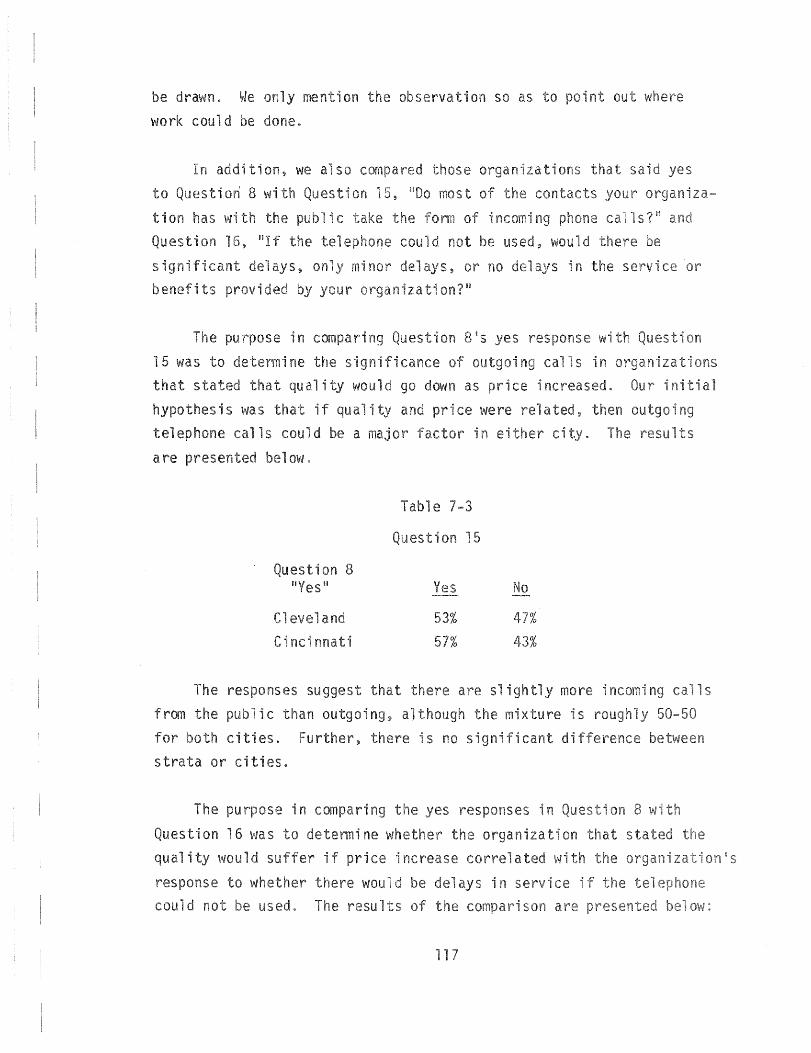
wo d
to
tion
In
y me on on so as to i
tion, we so iza
8
on 16, ill f could not sign;
b
Cine;
es su that from outgo;
ci es. s ties~
in
ne
, or no on1 91
57%
in
are ightly more
s no signi
xture is
es in
iza
ice increase
d us would
results ice
son re
117
s
i or
on
i
results
ls
on 8
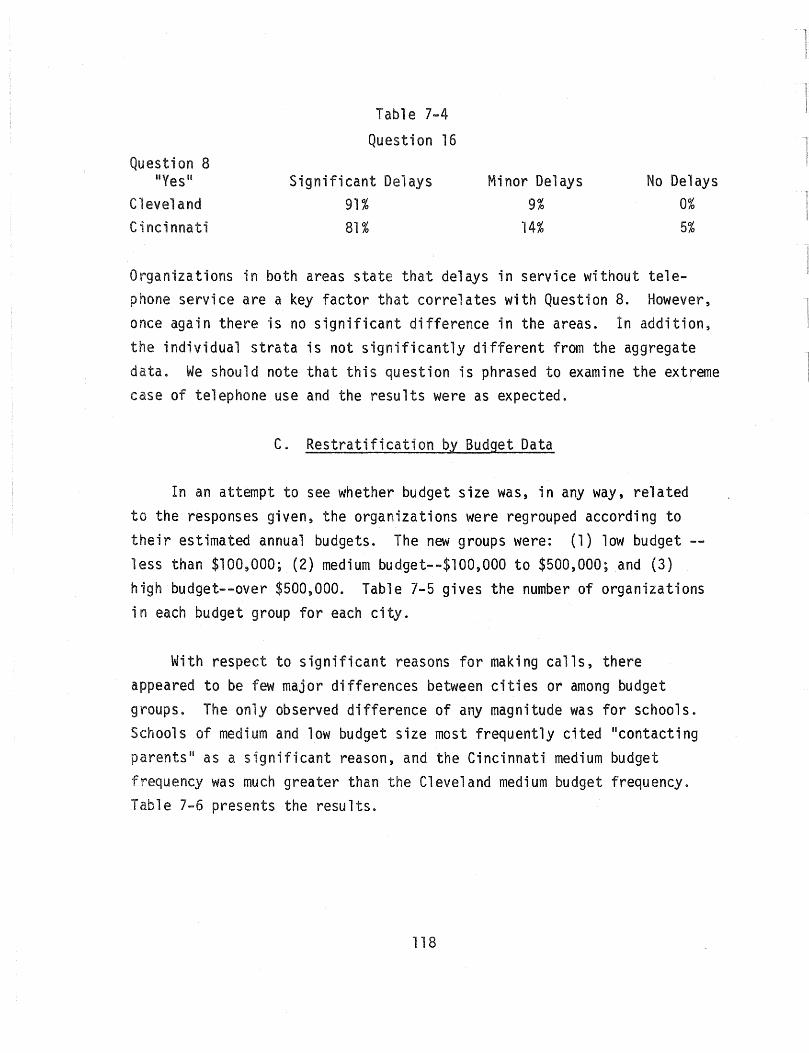
Question 8 "Yes ll
Cleveland Cincinnati
Table 7 ... 4
Question 16
Significant Delays 91% 81%
Minor Delays 9%
14%
No Del ays 0% 5%
Organizations in both areas state that delays in service without telephone service are a key factor that correlates with Question 8. However, once again there is no significant difference in the areas. In addition, the individual strata ;s not significantly different from the aggregate data. We should note that this question is phrased to examine the extreme case of telephone use and the results were as expected.
C. Restratification by Budget Data
In an attempt to see whether budget size was, in any way, related to the responses given, the organizations were regrouped according to their estimated annual budgets. The new groups were: (1) low budget -less than $100,000; (2) medium budget--$lOO,OOO to $500,000; and (3) high budget--over $500,000. Table 7-5 gives the number of organizations in each budget group for each city.
With respect to significant reasons for making calls, there appeared to be few major differences between cities or among budget groups. The only observed difference of any magnitude was for schools. Schools of medium and low budget size most frequently cited IIcontacting parents" as a significant reason, and the Cincinnati medium budget frequency was much greater than the Cleveland medium budget frequency. Table 7-6 presents the results.
118
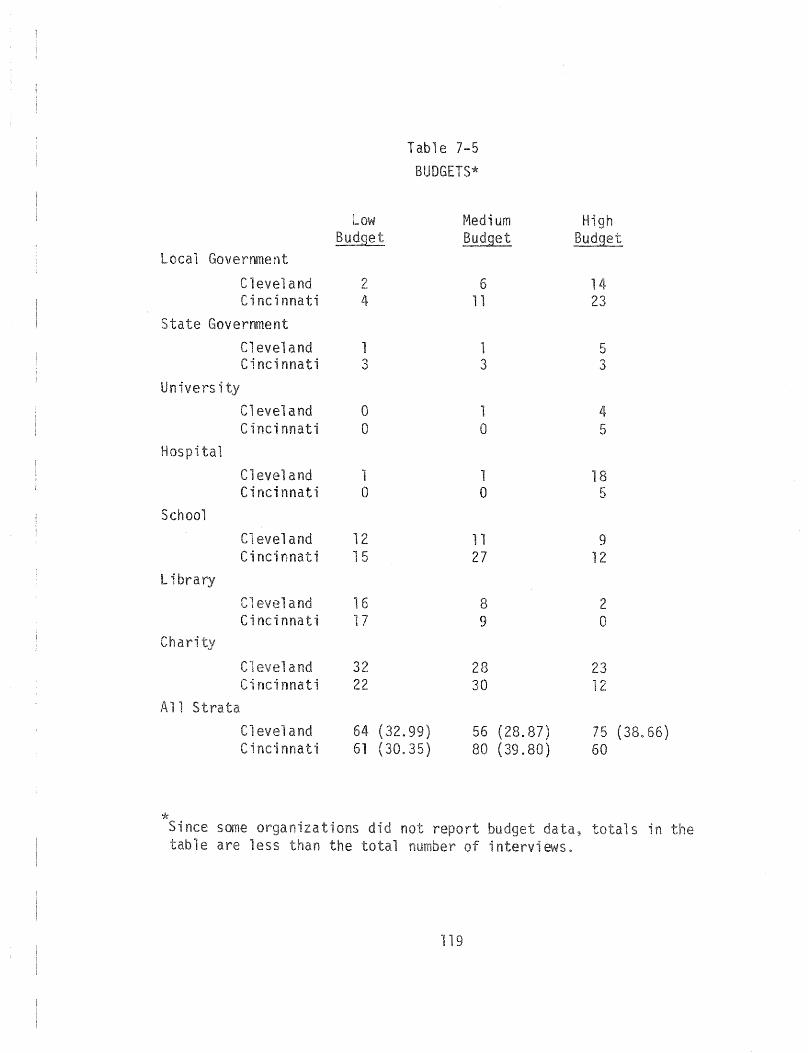
Local Gover'nment
Cleveland Cincinnati
State Government
Un rs i
Hospital
School
Libra
ari
All
inee le
Cleveland Cincinnati
Cleveland Cincinnati
Cleveland Cincinnati
eveland Cincinnati
C1 and C'i nnati
and
and Cinei
Table 7-5 BUDGETS*
Low Medium High ~
2 6 14 4 11 23
1 1 5 3 3 3
0 1 4 0 0 5
1 1 18 0 0 5
12 11 9 15 27 12
16 8 2 17 9 0
32 28 22 30 12
(32.99) 56 (28.87) 75 66) 61 (30.35) (39.80) 60
s in
119
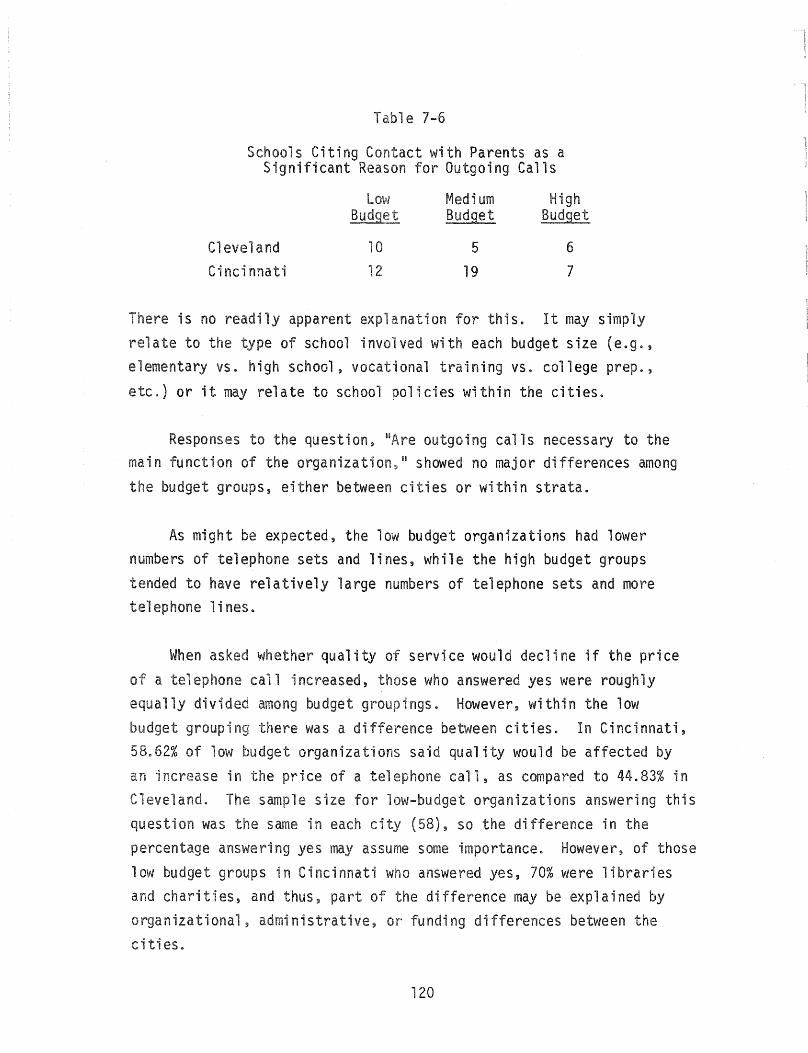
Table 7-6
Schools Citing Contact with Parents as a Significant Reason for Outgoing Calls
Cleveland Cincinnati
Budge_~
10
12
Medium Budget
5
19
High Budget
6
7
There is no readily apparent expl nation for this. It may simply relate to the type of school involved with each budget size (e.g., elementary vs. high school, vocational training vs. college prep.,
etc.) or it may relate to school policies within the cities.
Responses to the question, IIAre outgoing calls necessary to the main function of the organization, II showed no major differences among the budget groups, either between cities or within strata.
As might be expected, the low budget organizations had lower numbers of telephone sets and lines, while the high budget groups tended to have relatively large numbers of telephone sets and more telephone lines.
When asked whether quality service would decline if the price a ephone call increased, those who answered yes were roughly
equally divided among budget groupings. However, within the low budget group; there was a difference between cities. In Cincinnati, 5 62% of low dget organizations said quality would be affected by an increase in the ice of a telephone call, as coo1pared to 44.83% in Cleveland. The sample size for low-budget organizations answering this question was same in each ci (58), so the difference in the percentage answering yes may assume some importance. However, of those low budget groups in Cincinnati answered yes, 70% were libraries and charities, and thus, part of the difference may be explained by o nizational, administrative, or funding differences between the cities.
120

There were some interesting (perhaps unexpected) responses to
the question IIAre there policies governing the use of the telephone in
your organization?1I While many different responses were given, two of those appearing with great frequency were looked at relative to the
budget question. Those two responses were (1) no policies; and (2)
personal calls prohibited.
The low-budget and medium-budget organizations were more likely
to respond no policies. In particular, the low-budget and mediumbudget charities gave this response more often than high-budget
charities, as can be seen in the following table.
Tabl e 7-7
Budget Classification of Organizations Reporting No Policies
All Strata Charities Low Budget
Cleveland 17 10 Cincinnati 17 10
Medium Budget Cleveland 20 11 Cincinnati 25 11
High Budget
Cleveland 11 4 Cincinnati 4 1
High-budget organizations were more likely than low-budget agencies to respond that personal calls were prohibited. (See following table.)
Table 7-8
Budget Classification of Organizations Prohibiting Personal Calls
Cleveland Cincinnati
Low Bud~et
8
5
121
Medium Budget
5
8
High §ud9.£!.
19
12
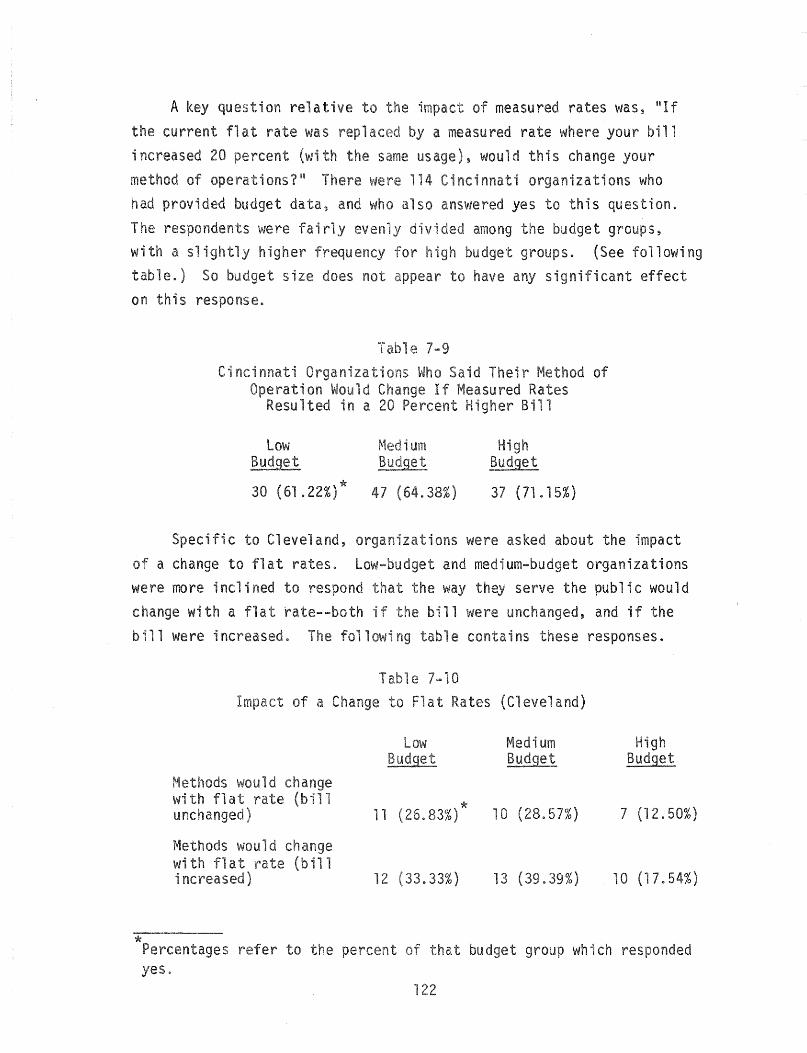
A key question
the current flat a ve of measured rates was, lilf
a by a measured rate where your bill increased 20 "",....""".. .... ,,, the same us ), would this change your method of ope were 114 Ci organiza ons who had provided budget yes to this question. T respondents were irly y i among the budget groups, with a slightly h frequ dget group s. (See fo 11 ow; ng table.) So budget size does not any significant effect on this response.
e
ons 0 d Their Method of ld Change If Measured Rates
in a Percent Higher Bill
High Budget
30 (61.22%)* 47 (64.38%) 37 (71. 15%)
Specific to Cleveland, organizations were asked about the impact
a change to flat rates. dget and medium-budget organizations were more inclined to respond the way they serve the public would change with a flat rate--both if 11 were unchanged, and if the bill were increased foll e ins these responses.
with flat i )
a T 10
11 ( )*
12 ( .33%)
(Cl and)
Medium High ?mudget Budget
10 (28.57%) 7 (12.50%)
13 ( %) 10 (17.54%)
whi responded
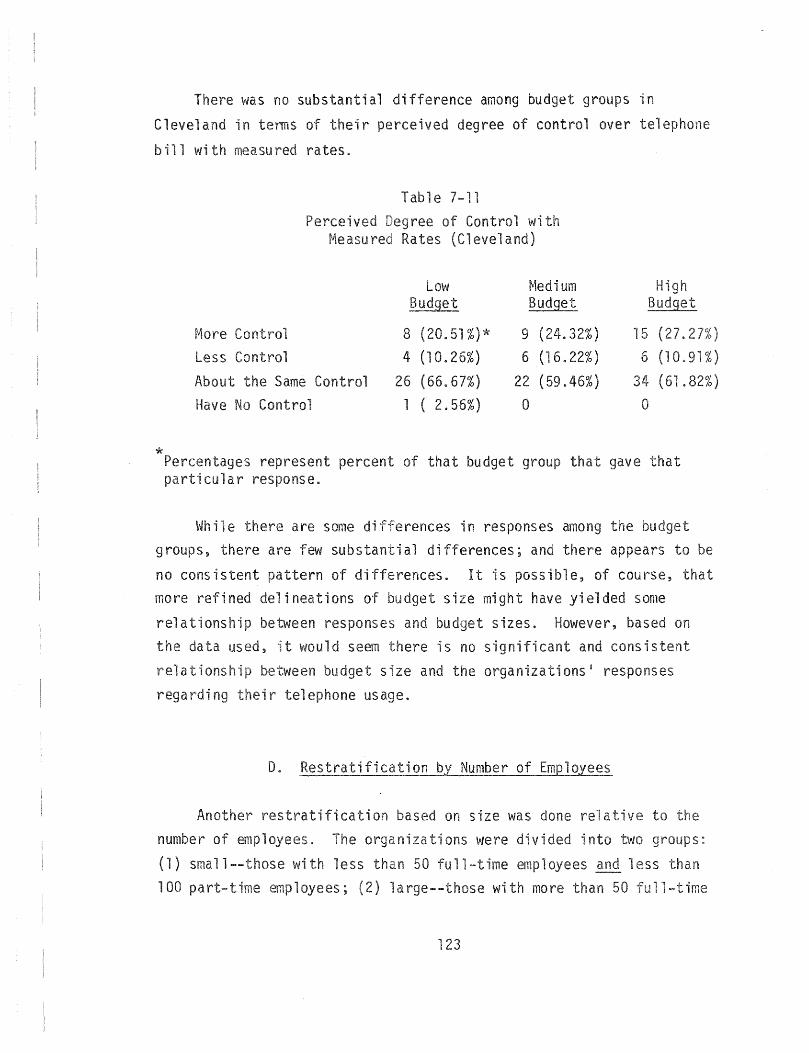
There was no substantial difference among budget groups in
Cleveland in terms of their perceived degree of control over telephone
bill with measured rates.
Table 7-11
Perceived Degree of Control wi Measu Rates (Cleveland)
Low ~1ed i um High Budget Budget Budget
fv10r'e Control 8 /rill"\ '-'Ol)-L ~LU.::>17o x- 9 (24.32%) 15 (27.27%)
Less Control 4 (10.26%) 6 (16.22%) 6 (10.91%) About the Same Control 26 (66.67%) 22 (59.46%) (61.82%) Have Control 1 ( 2.56%) 0 0
'* Percentages represent percent of that budget group that gave that rticular response.
Wh il e there are some di fferences in responses among the dget groups, there are few substantial differences; and there appears to be
no consistent pattern of differences. It is possible, of course, that more refined delineations dget size might have yielded some
relationship between responses and budget sizes. However, based on the data us ,it would seem there is no significant and consistent
relationship between budget size and the organizations' responses
regarding r telephone usage.
D. Restratification by Number of Employees.
Another restratifi on based on size was done a ve to
number of empl The niza ons were divided into two s:
(1) small wi less than 50 full-time employees and less 100 part-time employees; (2) large--those with more than 50 11-t
123
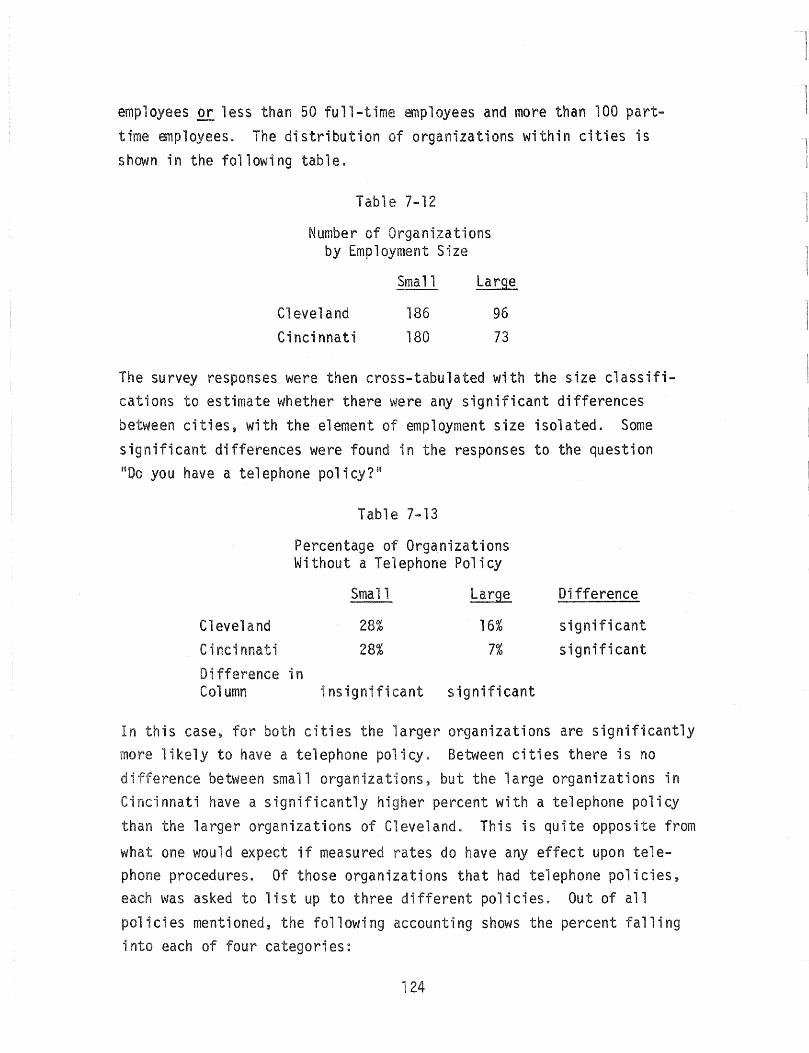
employees or less than 50 full-time employees and more than 100 parttime employees. The distribution of organizations within cities is shown in the following table.
Table 7-12
Number of Organizations by Employment Size
Small Large
Cleveland Cincinnati
186
180
96
73
The survey responses were then cross-tabulated with the size classifications to estimate whether there were any significant differences between cities, with the element of employment size isolated. Some significant differences were found in the responses to the question tlDo you have a telephone policy?91
Cleveland Cincinnati Difference Column
Table 7-13
Percentage of Organizations Without a Telephone Policy
Small Large
28% 16% 28% 7%
in insignificant significant
Difference
significant significant
In this case, for both cities the larger organizations are Significantly more likely to have a telephone policy. Between cities there is no difference between small organizations, but the large organizations in Cincinnati have a significantly higher percent with a telephone policy than the larger organizations of Cleveland. This is quite opposite from
what one would expect if measured rates do have any effect upon telephone procedures. Of those organizations that had telephone policies, each was asked to list up to three different policies. Out of all policies mentioned, the following accounting shows the percent falling into each of four categories:
124

Small Organ izati ons
Large
Cleveland Cincinnati
o rg a n -I z a t ion s
Cleveland Cincinnati
Table 7-14
Type of Telephone Policies
Policies About Personal Calls
50% 42%
47% 47%
Policies About Long Distance Calls
23% 28%
25% 25%
Policies About Non-emp 1 oyee
. Call s
7% 8%
5% 7%
All
20% 22%
23% 21 %
In this instance, one cannot discern any difference within cities between organization sizes or within organization sizes and between cities. It appears from the results of this question that measured rates do not motivate policies against personal calls but that other factors do, such as concern for personal calls taking away from worker production time.
Another question, which yielded some significant differences on employment size, asked IIWhat percentage of local calls are personal?"
Table 7-15
Proportion of Responses Regarding the Percentage of Personal Calls
0-5% 1 Organ; ons
Cleveland 52% Cincinnati 70%
Small Organizations
Cl and 58% Cincinnati 67%
Large Organizations
Cleveland 40% Cincinnati 53%
6-10%
26% 18%
23% 16%
31% 19%
125
greater than 10%
22% 21 %
19% "17%
29% 28%
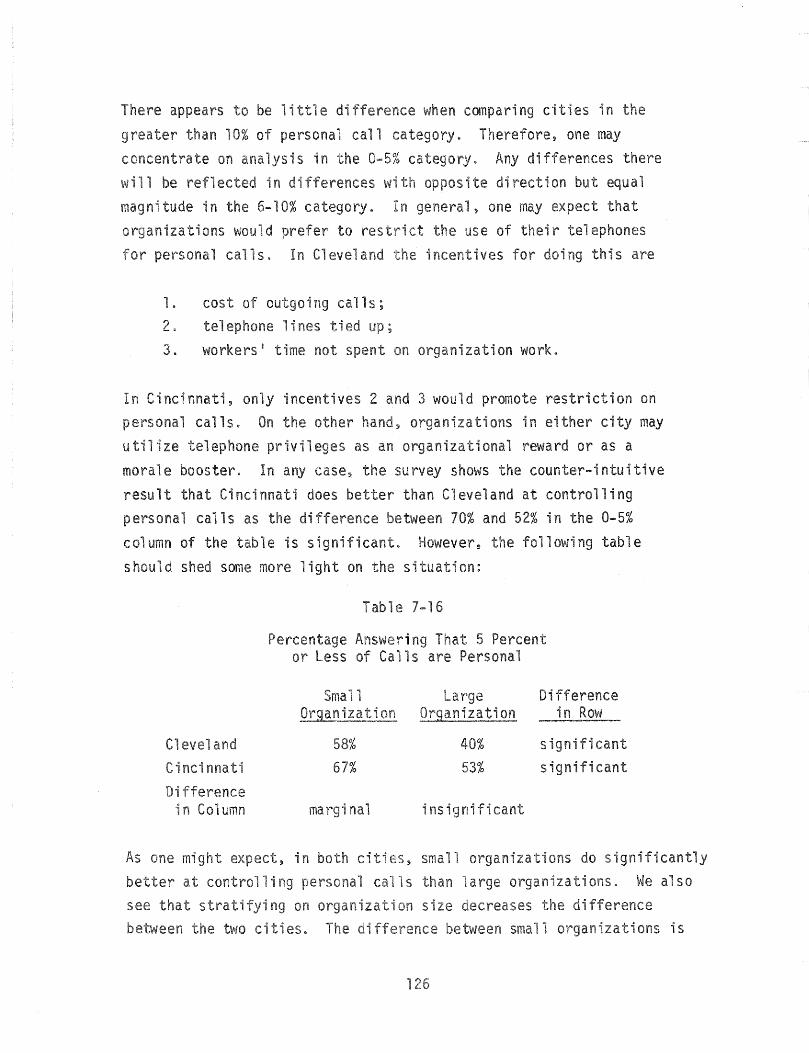
There appears be 11 e
9 1 of personal c on is in wi 11 in di
tude in the 6-10% izations would
personal 1 s . In Cl
1 . cost outgoi 2. telephone 1 i nes
3. workers! time
call
1s;
comparing cities in category_ Therefore, one may
Any differences there on but equ
, one may expect that r telephones
yes for ng thi s are
on ni on work.
In Cincinnati, only incentives 2 d promote restriction on pers calls. On other niza ons in either city may u lize telep privil as an nizational reward or as a
e booster. In any case, the survey shows the counter-intuitive result that Cincinnati does better than Cleveland at controlling personal calls as the di 70% and 52% in the 0-5% c umn of the le is signi However, the foll ng table s d shed some more light on situation:
T le 16
5 or Less of Calls are Personal
Ci fference
in Col urnn
one might 11 in
58% 67%
rna i
es~
s
1
40% 53%
insignifi
1
1
sign; cant significant
ons do significantly ons. al so
small ons is
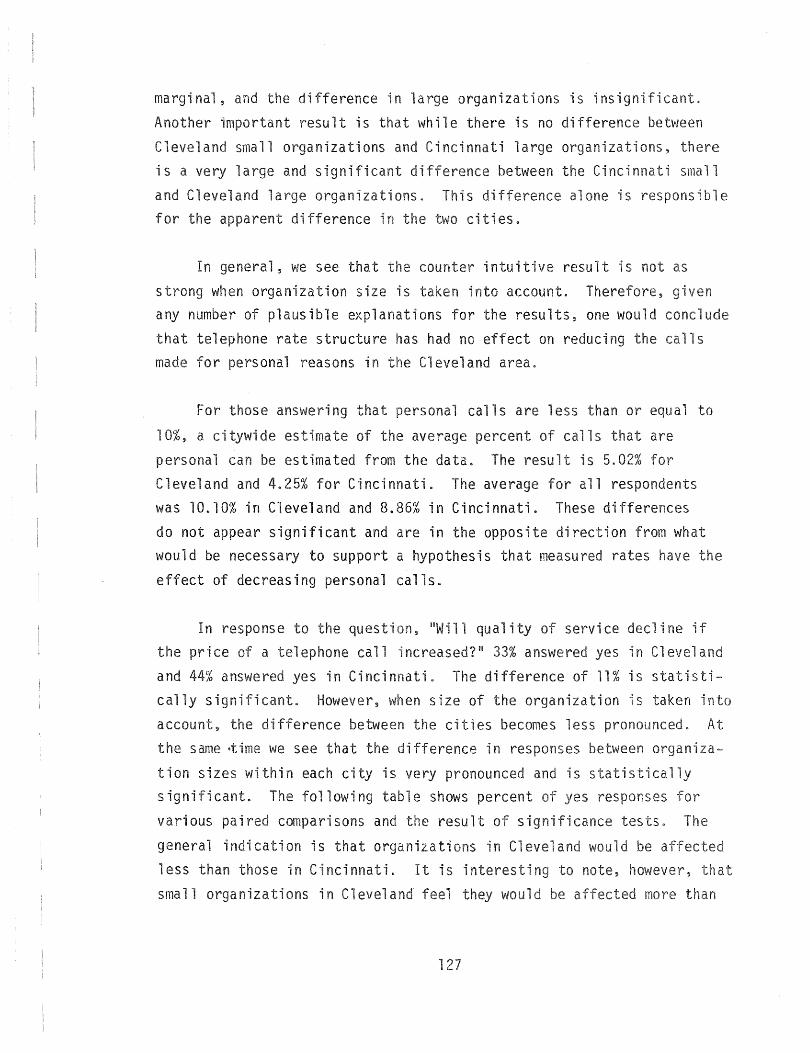
marginal, and the difference in large organizations is insignificant.
Another important result is that while there is no difference between Cleveland small organizations and Cincinnati large organizations, there is a very large and significant difference between the Cincinnati small
and Cleveland large organizations. is difference one is responsible for the apparent difference i the two ties.
In general, we see that counter intuitive result is not as
strong when organization size is taken into account. Therefore, given any number of plausible explanations for the results, one would concl that telephone rate structure has had no effect on reducing the 1s made for personal reasons in the Cleveland area.
For those answering that personal calls are less than or equal to
10%, a citywide estimate of the average percent of calls that are
personal can be estimated from the data. The result is 5.02% for Cleveland and 4.25% for Cincinnati. The average for 1 respondents was 10.10% in Cleveland and 8.86% in Cincinnati. These differences do not appear significant and are in the opposite direction from what would be necessary to support a hypothesis that measured rates have
effect of decreasing personal calls.
In response to the question, iiWill quality of service decl"ine if the price of a telephone call increased?" 33% answered yes in Clevela
and 44% answered yes in Cincinnati. The difference of 11% is statistically significant. However, when size of the organization is taken into
account, the difference between the cities becomes less pronounced. At the same ·time we see that the di fference in responses between organi za
tion sizes thin each city is very pronounced and is statis cally significant. The following e shows percent of es
various paired comparisons and the result signi cance tests. e
general indication is that organiza ons in Clevel would less than those in Cincinnati. It is interesting to note, r, at
small organizations in Clevela feel they would be more
127
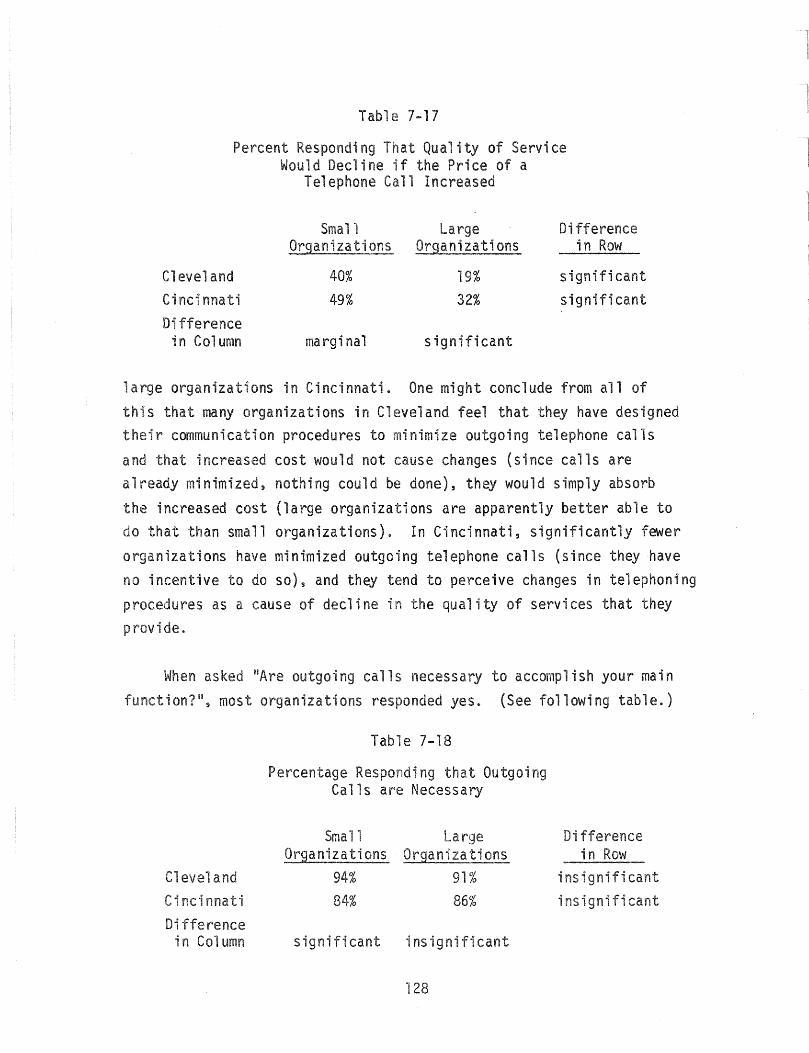
Table 7-17
Percent Responding That Quality of Service Would Decline if the Price of a
Telephone Call Increased
Small Large Difference Organizations Organizations in Row
Cleveland 40% 19% significant Cincinnati 49% 32% significant Difference in Column marginal significant
large organizations in Cincinnatio One might conclude from all of this that many organizations in Cleveland feel that they have designed t r communication procedures to minimize outgoing telephone calls
and that increased cost would not cause changes (since calls are already minimized, nothing could be done), they would simply absorb
the increased cost (large organizations are apparently better able to do that than small organizations). In Cincinnati, significantly fewer organizations have minimized outgoing telephone calls (since they have no incentive to do so), and they tend to perceive changes in telephoning procedures as a cause of decline in the quality of services that they p rov; de.
When asked 'iAre outgoing calls necessary to accompl ish your main fu io01 01
, most organizations responded yes. (See following table.)
Cleveland Cincinnati Difference
in Column
Table 7-18
Percentage Responding that Outgoing Calls are Necessary
Small Large Organiza ti ons Organ; za ti ons
94% 91% 84% 86%
significant insignificant
128
Difference in Row
insignificant insignificant
We see that organization size is unrelated to dependence
the telephone, but there appears to somewhat more dependence in small ons in Cleveland than small organ; ons n Cinci
The employment size had some impact on to
II I f the telephone cou 1 d not us \\lOU 1 d there sign;
only minor del ,or no in service i
on?lI.
on
A signifi y higher proportion of the small organizations in Cleveland felt that no telephone service would cause sign;
delays in service than the on in Cincinnati of the ization. There was no difference in the la n1 ons. It
should be noted that the percent of small orga zations indi minor delays reversed for the two cities so as to almost y
n-
cancel the difference in !lsignificant delayll responses. , in both cities, better than 98% the small organizations felt
would be some sort of delay.
The organizations were asked to report the r sets and lines that they have. As one might expect, the handsets and lines is correlated to the organ; ions size over 90% of the small organiza ons hav; 25 or r
having fewer than 7 lines. Of the la organizations 89% have 11
or more hands and about 83% have 5 or more lines. The di
in any of these figures between the two cities is not signi cant.
S y, as one might , the number c ls is related to organ; on size. it so
it is not related to ci
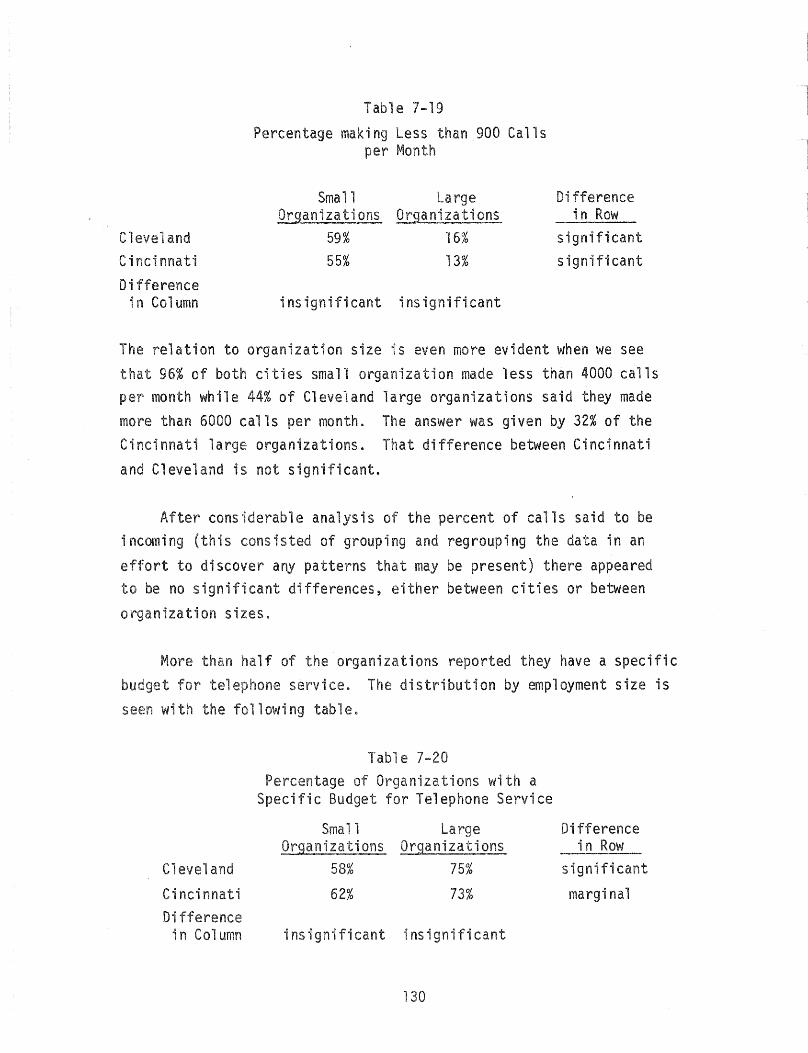
Cleveland Ci nnati Difference
in Column
Table 7-19
Percentage making Less than 900 Calls per Month
Small rge Organizations Organizations
59% 16% 55% 13%
insignificant insignificant
Difference in Row
significant significant
The relation to organization size s even more evident when we see that 96% of both cities small orga zation made less than 4000 calls per month while 44% of Cleveland large organizations said they made more than 6000 calls per month. The answer was given by 32% of the Cincinnati large organizations. That difference between Cincinnati
and Cleveland is not sign; cant.
After considerable analysis of the percent of calls said to be incoming (this consisted of grouping and regrouping the data in an
effort to discover any patterns that may be present) there appeared be no significant differences, either between cities or between
o nization sizes.
t for seen with
eveland
Cincinnati Difference
in Column
f of organizations reported they have a specific service. The distribution by employment size is
table.
Table 7-20 Percentage of ons with a
Specific Budget for Telephone Service
Small rge Organizations Organizations
58% 75%
62% 73%
insignificant insigni cant
130
fference in Row
significant
margi nal
The large organizations in both cities are slightly more likely
to have a specific budget for telephone use than small organizations The difference in Cleveland is more significant than the difference
in Cincinnati. Since budgeting is a formal mechanism to control a system, these results are intuitive in that one would expect larger organizations to make use of formal control procedures. When asked
if these budgets were flex; e a yes response was almost unifor'mly 80% in both cities and organizations sizes. When asked if these
budgets had been exceeded, a ightly higher percent of both organization sizes in Cincinnati answered ilyes" than their counterparts in
Cleveland. However, these fferences were not significant and
averaged about 50-55% over two cities. It is most likely that these telephone budgets would include long distance calls, and from these resu -I ,i t mus t be conj ectu that they are respons i b 1 e for
the great majority of incidents of budgets being exceeded.
E. Restratification by Percent Professional
In this section are the results of analysis after stratifying the questionnaire responses according to the percent of full-time staff that were considered professional. Two strata were defined: (1) less than 50% full-time employees are professional, designated by the
symbol Po and (2) greater than or equal to 50% of full-time employees
are professional ~ designated by the symbol Pl. Table 7-21 gives the percent those organizations interviewed in each of the original strata
that fall into the new strata. One may note the large percentage of
schools that were classified as Pl and the large percentage of 1; es
class; ed as PO. Since both of these are relatively large strata, differences between and Po VIIi thi n a city (and there were few) tended to be due to differences between schools and libraries. Also
the differences between ci es within P1 tended to be due di
between the two cities' 001 systems, and differences wi in to be due to differences between the two cities l library systems.
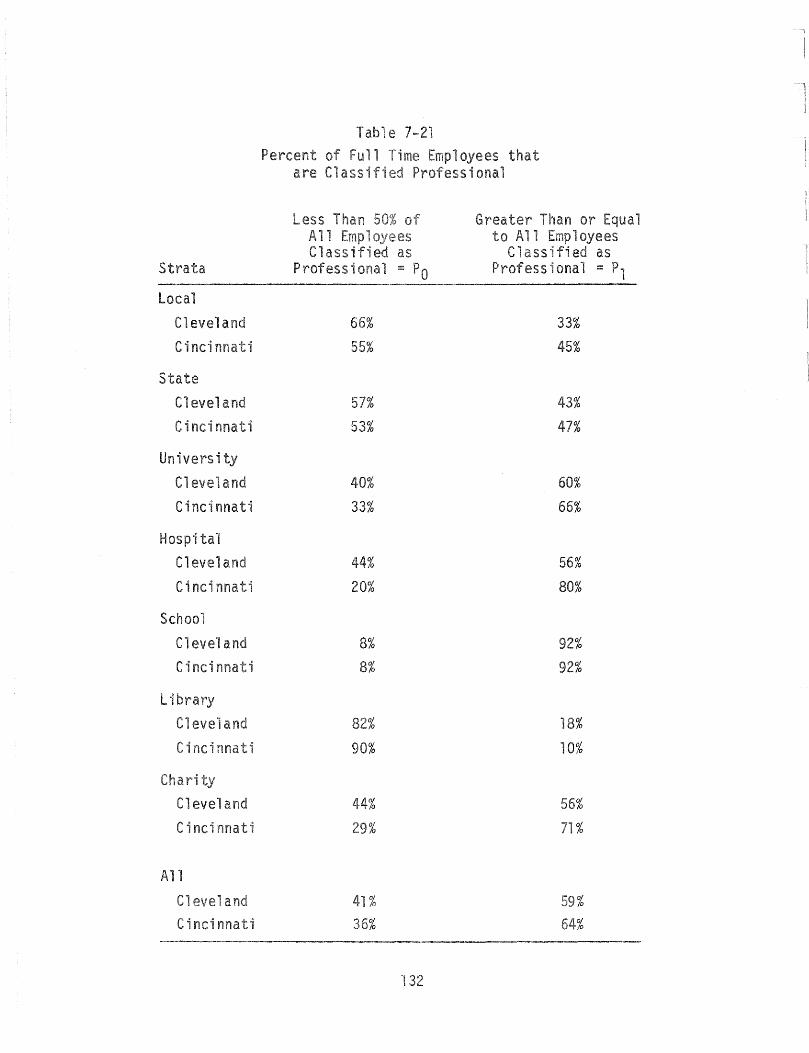
Strata
Local Cleveland Cinei
State Clevela Cinei
Univers i Cl a
Cincinnati
Hosp; tal Clevel Cinci
School
Cl eve'l a
Cine;
Li
Cine;
evela C i nci
All
a Ci
less
11 ass;
All Class;
Profess;
66%
57% 53%
40% 33%
20%
%
e 7-21
1
that
Greater or 1 oyees
Class; ed as Professional = P,
33%
45%
43% 47%
60%
66%
56%
80%
92%
92%
18% 10%
56%
71 %
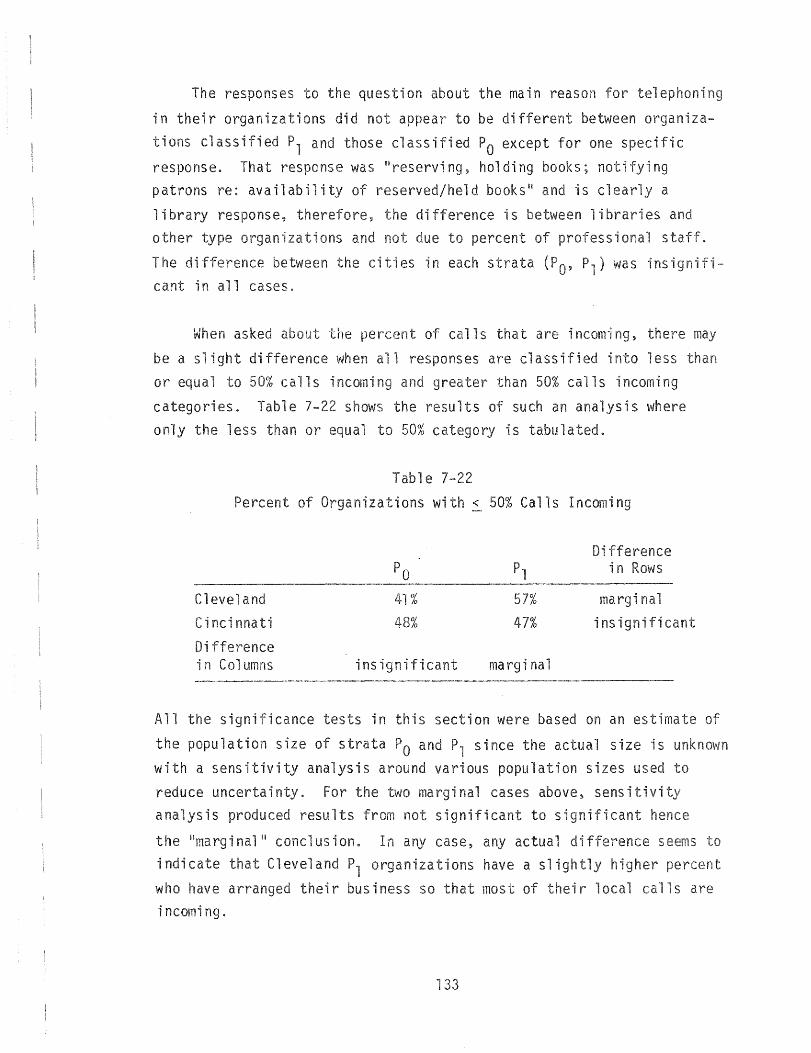
The responses to the qu on about the main reason for tel ng
-j n thei r organ i za ons di d not appea r to be fferent between organ; za
tions classified Pl and those classified Po except for one speci c
response. response was iireserving, holding books; notifying patrons re: availabili of reserved/held s!l and is c1 a
library response, therefore, difference is between 11
other type to percent of profess; s
The between es in each strata (PO' P,) was insigni cant in all cases.
When asked about the of calls that are ng, there
be a slight difference when 1 es are assifi i less or equa 1 50% c 1s i greater 50% calls incoming
catego es. only the less
Table shows the results such an analysis ere or 50% category is tabul
Table 7-22
of ni ons with < 50% Calls Incorn;
fference Po Pl in
Cleveland % 57% margi nal
Cincinnati 47% insignificant
Difference in Columns insignificant margi nal
All the signi cance tests in
the population size of strata
is section were based on an es
P, since the actual size is with a sensi vity anal is
reduce uncertainty. For
va ous popul on sizes used to
i cases above~ sensi ivi anal is ced resul sign; cant sign;
the "marginal ll conclusion. In case, indi Cleveland organizations have who have arranged incoming.
r business so most of i r 1
1
1 s re
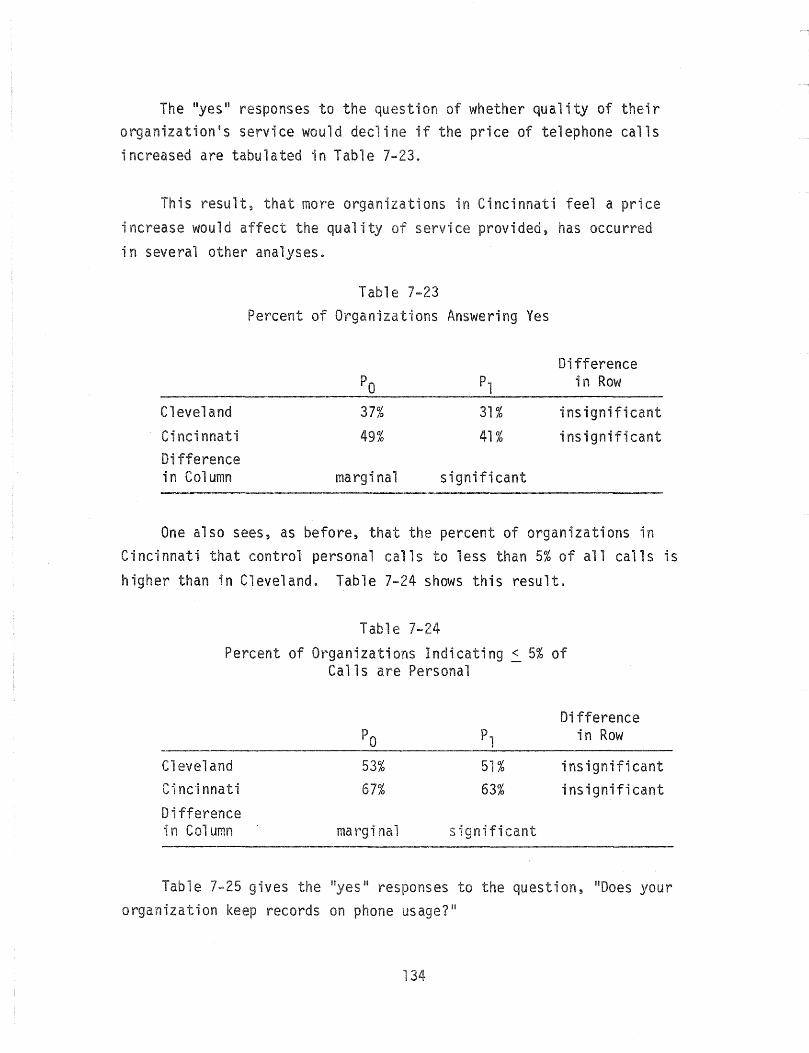
The lIyes" responses to the question of whether quality of their organization1s service would decline if the price of telephone calls increased are tabulated in Table 7-23.
This result, that more organizations in Cincinnati feel a price increase would affect the quality service provided, has occurred in several other analyses.
Table 7-23 Percent of Organiza ons Answering Yes
Difference Po PI in Row
Cleveland 37% 31% insignificant Cincinnati 49% 41 % insignificant Difference in Column margi nal significant
One also sees, as before, that the percent of organizations in Cincinnati that control personal calls to less than 5% of all calls is
higher than in Cleveland. Table 7-24 shows this result.
Table 7-24 Percent of Organizations Indicating < 5% of
Calls are Personal
Difference Po Pl in Row
eveland 53% 51 % insignificant Cincinnati 67% 63% insignificant Difference in Column margi nal significant
Table 7-25 gives the "yes 81 responses to the question, !lOoes your organization keep records on phone usage?"
134
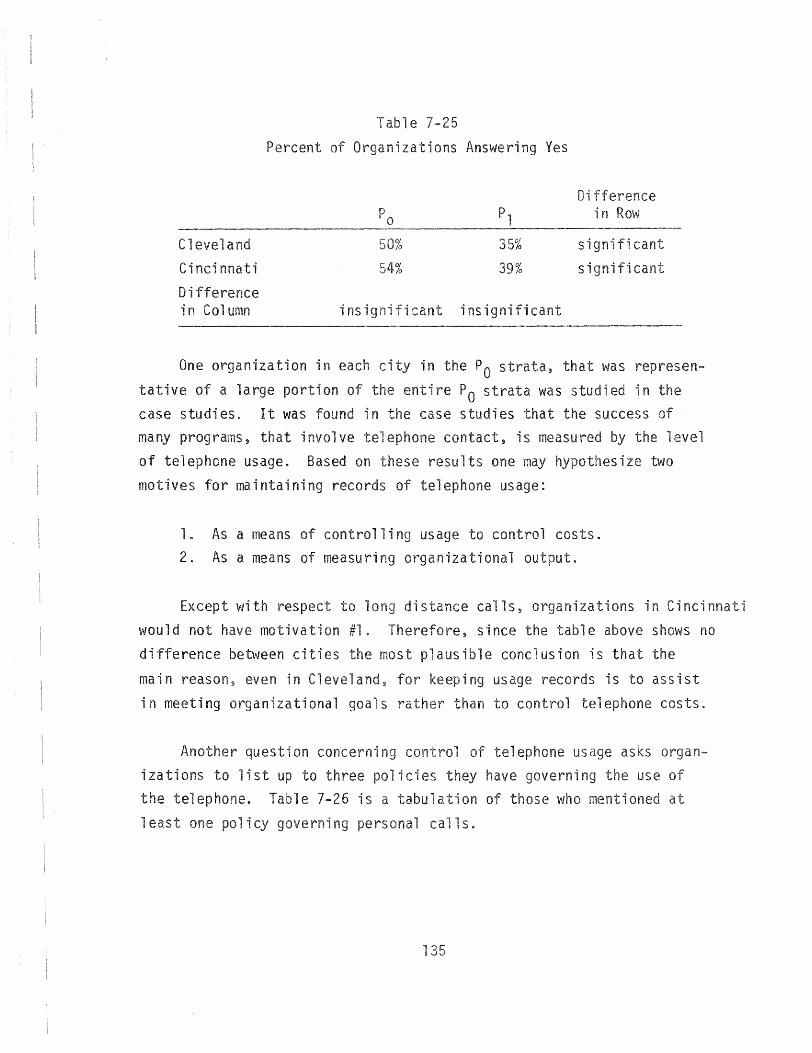
Cleveland Cincinnati
Difference in Column
Table 25
Percent of Organizations Answering Yes
35%
39%
insigni cant insignificant
fference in Row
signifi signi cant
One organization in each ty in the Po strata, that was represen
tative of a large portion of the entire Po strata was studied in the case studies. It was found in the case studies that the success of many programs, that involve telephone contact, is measu by the level
of telephone usage. Based on these results one may hypothesize two motives for maintaining records of telephone usage:
1. As a means of controlling usage to control costs. 2. As a means of measuring organizational output.
Except with respect to 1
would not have motiva on #1.
distance calls, organizations in Cincinnati
Therefore, since the table above shows no difference between cities the most ausible conclusion is that the
main reason~ even in Cleveland, for keeping usage records is to assist
in meeting organizational goals rather than to control telephone costs.
Another question concerni telephone usage as n-izations to list up to three poli have governing use the telephone. Table 7-26 is a tabul on those who menti at
1 one 1 s .
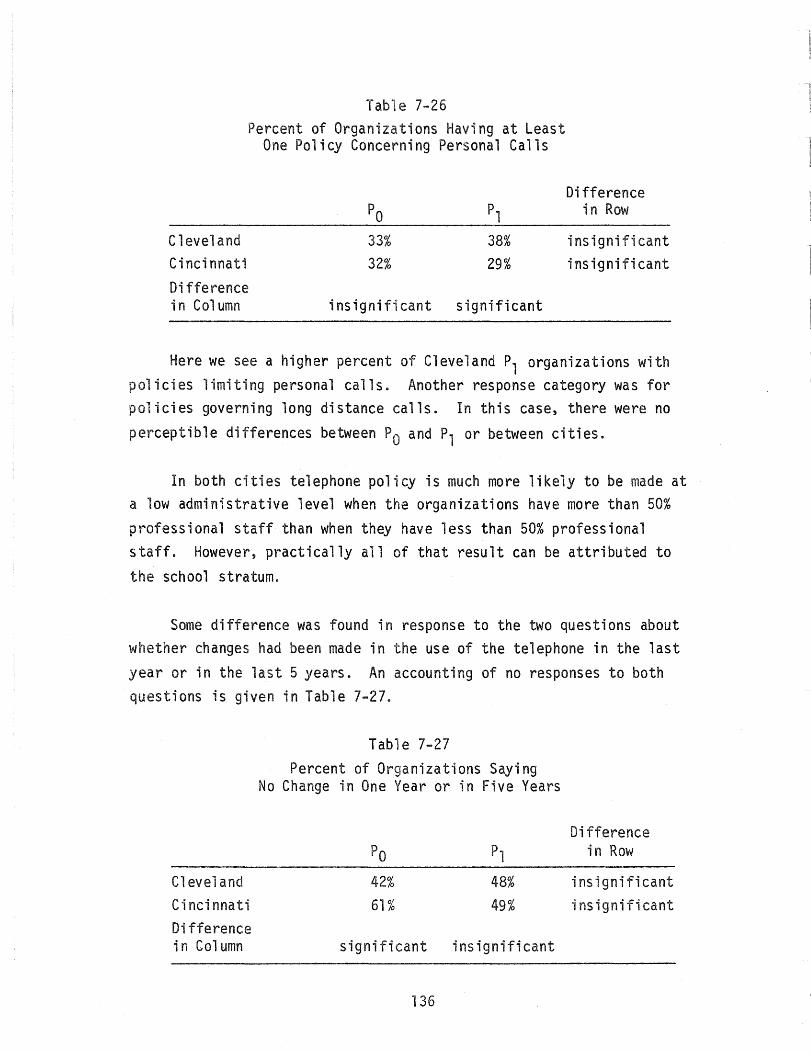
Cleveland Cincinnati Difference in Column
Table 7-26 Percent of Organizations Having at Least
One Policy Concerning Personal Calls
33% 32%
38% 29%
insignificant significant
Difference in Row
insignificant insignificant
Here we see a higher percent of Cleveland Pl organizations with policies limiting personal calls. Another response category was for policies governing long distance calls. In this case, there were no
perceptible differences between Po and Pl or between cities.
In both cities telephone policy is much more likely to be made at a low administrative level when the organizations have more than 50%
professional staff than when they have less than 50% professional staff. However, practically all of that result can be attributed to the school stratum.
Some difference was found in response to the two questions about whether changes had been made in the use of the telephone in the last year or in the last 5 years. An accounting of no responses to both questions is given in Table 7-27.
Cleveland Cincinnati Difference in Column
Table 7-27 Percent of Organizations Saying
No Change in One Year or in Five Years
Difference in Row
42% 48% insignificant 61% 49% insignificant
significant insignificant
136
Much of the difference
be the illi II S
had made in last a rea had not. Since most
it tends dominate the resul
The distri tior! among the number
was some va
the major reasons given the
given
With plish the main
di
to
i or
ve 1 i
among
1
the es in
ere
s ls in
cities r those lines is ven in
za
size
oing
i
on?li~
es
s
i
d
1s
was no
es
za ons
r
strata
to accom-
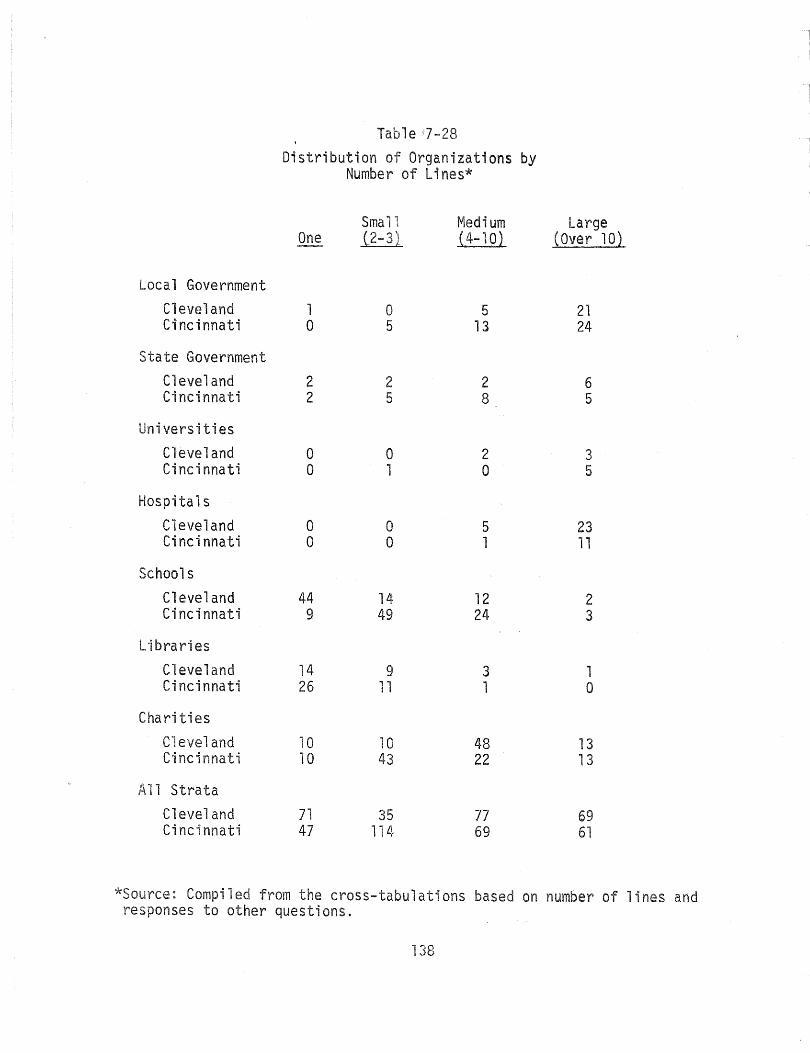
Table "7-28 Distribution of Organizations by
Number of Lines*'
Smal Medium Large One (2-3) (.4-10 ) COver 10)
Local Government Cleveland 1 0 5 21 Cincinnati 0 5 13 24
State Government Cleveland 2 2 2 6 Cincinnati 2 5 8 5
Universities Cleveland 0 0 2 3 Cincinnati 0 1 0 5
Hospitals Cleveland 0 0 5 23 Cincinnati 0 0 1 11
Schools Cleveland 44 14 12 2 Cincinnati 9 49 24 3
Libraries Cleveland 14 9 3 1 Cincinnati 26 11 1 0
Charities Cleveland 10 10 48 13 Cincinnati 10 43 22 13
1 Strata Cleveland 71 35 77 69 Cincinnati 47 114 69 61
*Source: Compiled from the cross-tabulations based on number of lines and responses to other questions.
138
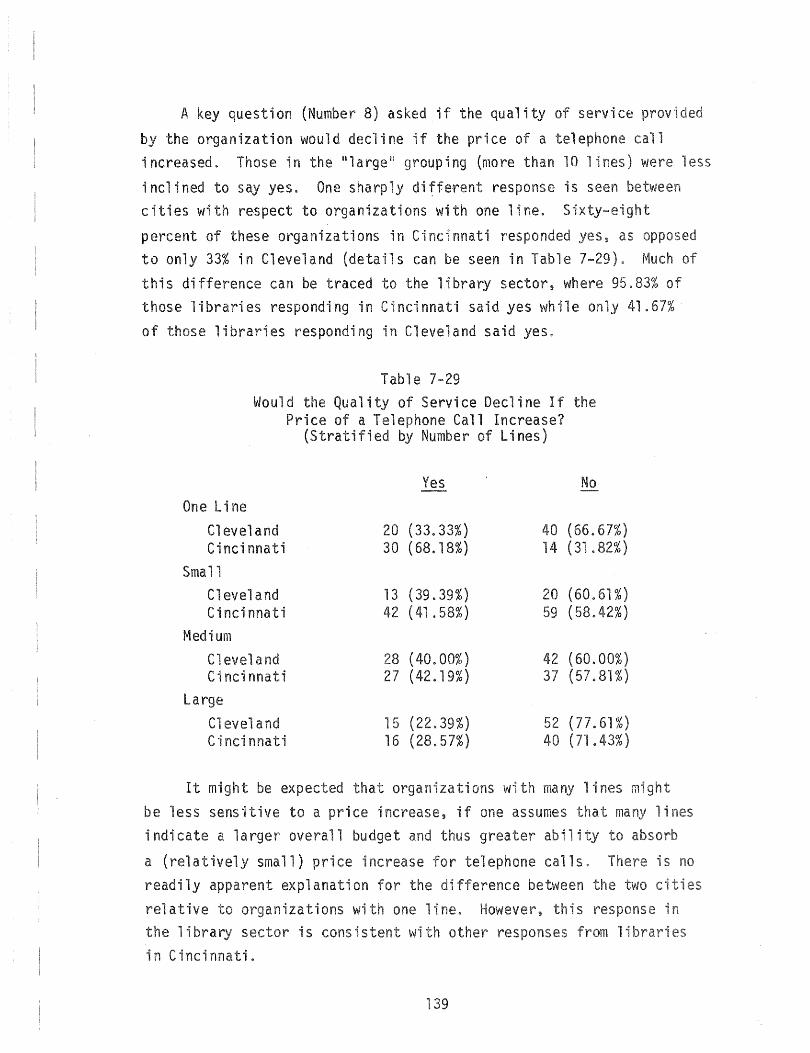
A key question (Number 8) asked if the quality of service
by the organization would decline if the price of a telephone increased. Those in the III a rge II group i ng (mo re than 10 1 i nes) were 1 ess
i ncl i ned to say yes. One sha rp ly di fferent response is seen cities with respect to organizations with one line. S1 t
percent these organizations in Cincinnati responded ,as to only 33% in Cleveland (details can be seen in Table 7-29). this difference can be traced to the library sector, where 95.83% those libraries responding in Cincinnati said yes while 41.67% of those libraries responding in Cleveland said yes.
Table 7-29 Would the Quality of Service Decline If
Price of a Telephone Call Increase? (Stratified by Number of Lines)
Yes One Line
Cl evel and 20 (33.33%) 40 Cincinnati 30 (68.18%) 14
Small Cleveland 13 (39039%) Cincinnati 42 (41.58%)
Medium Cleveland 28 (40.00%) Cincinnati 27 ( .19%) 37
Large Cl and 15 (22.39%) 52 Cincinnati 16 (28.57%) 40
No
(66.67%) (31.82%)
(60.61%) (58.42%)
(60.00%) (57.81%)
(77.61%) ( .43%)
It might be expected that organizations with many lines ght be less sensi ve a price increase, if one assumes lines i ndi a larger overall dget and greater
a ( atively small) price increase r telephone calls. readily apparent expl on the fference
ative the 1 i brary in Cine;
nizations with one line. However, is is consistent with
139
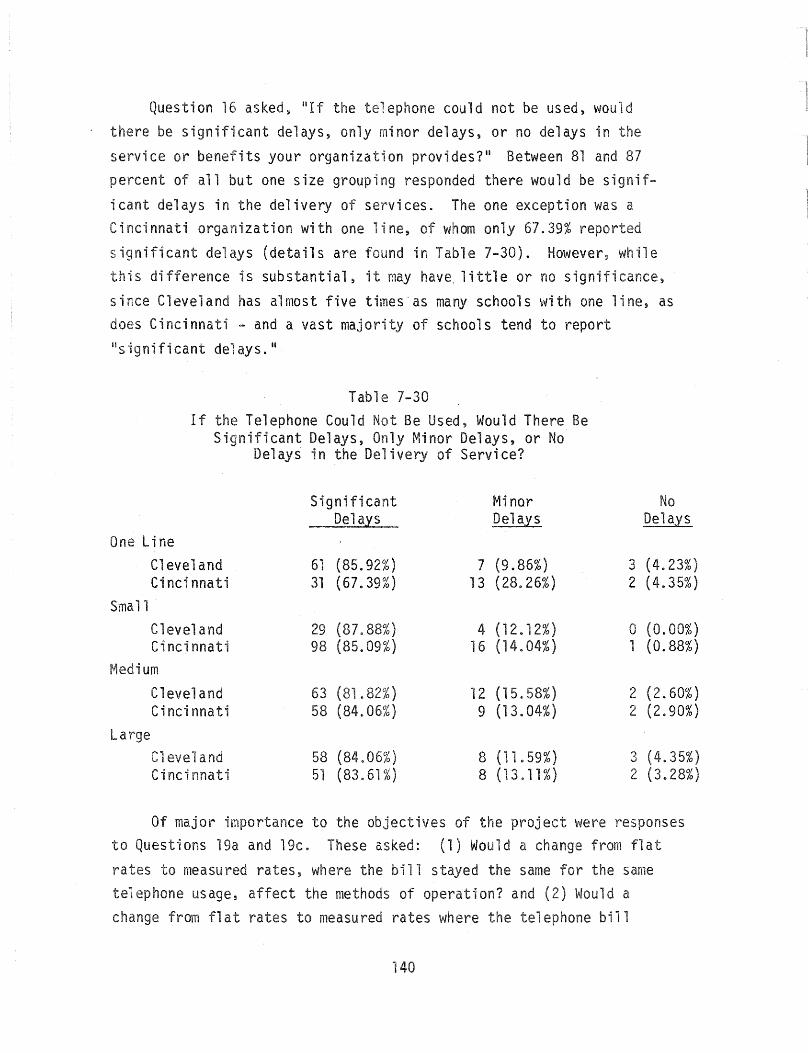
Question 16 asked~ "lf the telephone could not be used, would there be significant delays, only minor delays, or no delays in the service or benefits your organization provides?1I Between 81 and 87 percent of all but one size grouping responded there would be signif
icant delays in the delivery of services. The one exception was a Cincinnati organization with one line, of whom only 67.39% reported
significant delays (details are found in Table 7-30). However, ile this difference is substantial, it may have, little or no significance,
since Cleveland has almost five times as many schools with one line, as does Cincinnati - and a vast majority of schools tend to report "significant delays. II
Table 7-30 If the Telephone Could Not Be Used, Would There Be
Significant Delays, Only Minor Delays, or No Delays in the Delivery of Service?
Significant ~1i nor DelaoYs Del ays
One Line Cleveland 61 (85.92%) 7 (9.86%) Cincinnati 31 (67.39%) 13 (28.26%)
Small Cleveland 29 (87.88%) 4 (12.12%) Cincinnati 98 (85.09%) 16 (14.04%)
~1ed i urn Cleveland 63 (81.82%) 12 (15.58%) Cincinnati 58 (84.06%) 9 (13.04%)
Large Cleveland 58 (84.06%) 8 (11.59%) Cincinnati 51 (83.61%) 8 (13.11%)
No Delays
3 (4.23%) 2 (4.35%)
0 (0.00%) 1 (0.88%)
2 (2.60%) 2 (2.90%)
':)l (4.35%) ..;
2 (3.28%)
Of major importance to the objectives of the project were responses to Questions 19a and 19c. These asked: (1) Would a change from flat
rates to measured rates, where the bill stayed the same for the same telephone usage, affect the methods of operation? and (2) Would a change from flat rates to measured rates where the telephone bill
140
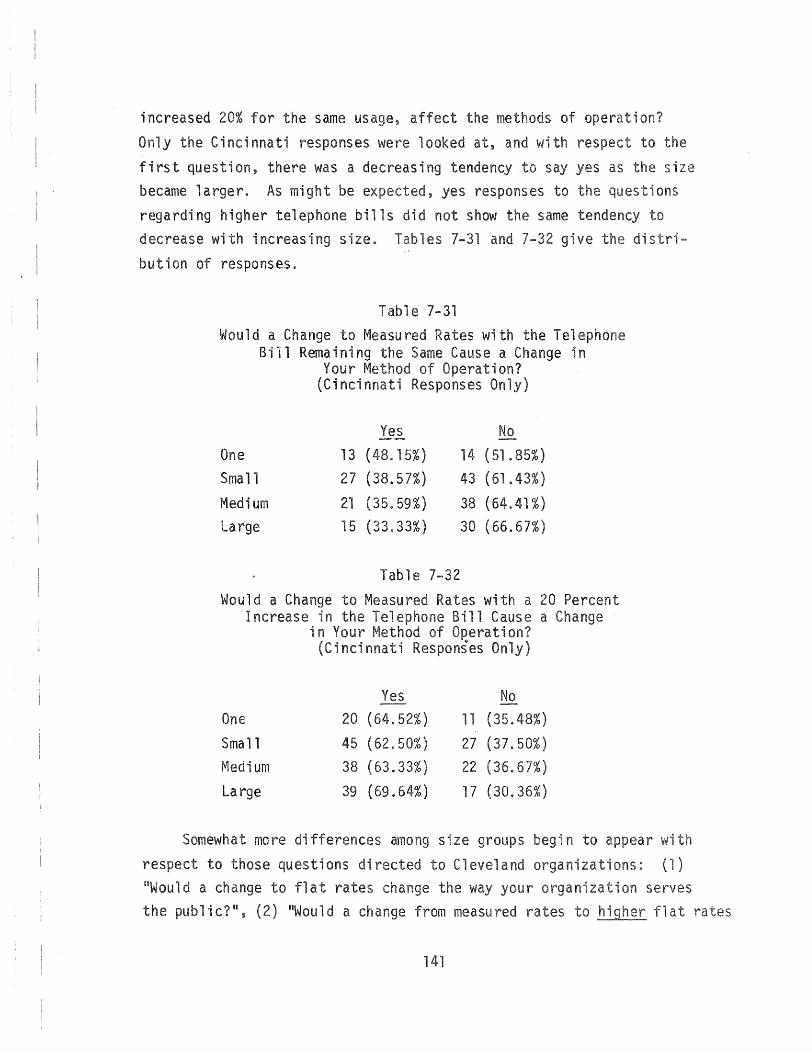
increased 20% for the same usage, affect the methods of operati
Only the Cincinnati responses were looked at, and with respect to
first question, there was a decreasing tendency say as size became larger. As might be , yes responses to qu ons
regarding higher telephone bills did not show the same tendency to decrease with increasing sizea les 7-31 7-32 give
bution of responses.
Tabl e 7-31 Would a Change to Measured Rates with the telephone
Bill Remaining the Same Cause a Change in Your Method of Operation?
(Cincinnati Responses Only)
Yes No
One 13 (48.15%) 14 (51 .85%) Small 27 (38.57%) 43 (61.43%) Med; um 21 (35.59%) 38 (64.41 %) Large 15 (33.33%) 30 (66.67%)
Table 7-32
Would a Change to Measured Rates with a 20 Percent Increase in the Telephone Bill Cause a Change
in Your Method Operation? (Cincinnati Responses Only)
One
Small r"'edi um Large
Somewhat more
20
45 38
39
Yes (64.52%) 11
(62.50%) 27 (63.33%) 22
( .64%) 17
arno size
respect to those questions directed to Cl I!Would a change to flat rates change the
No
(35.48%)
(37.50%) (36.67%)
(30.36%)
s beg; n
and orga your
the public?lI, (2) IIWould a change from measured
141
ons: (1) on serves
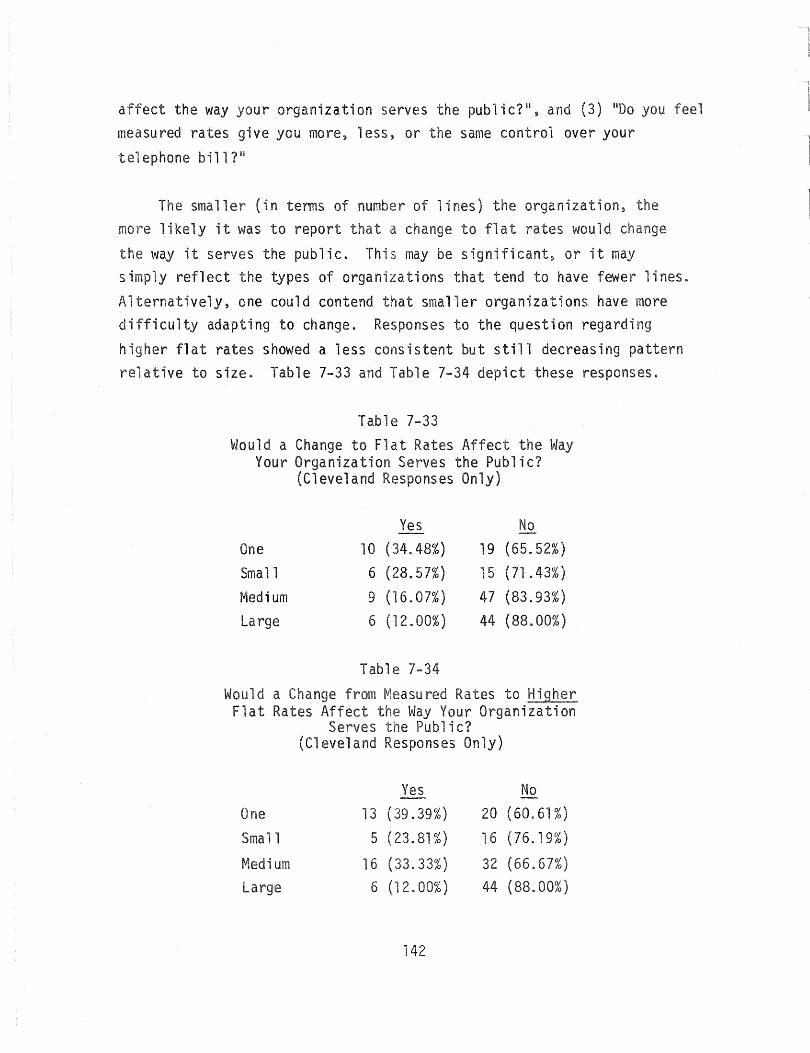
affect the way your organization serves the public?!!, and (3) 1100 you feel measured rates give you more, less, or the same control over your teOI ephone bill ?IO
The smaller (in terms of number of lines) the organization, the more likely it was to report that a change to flat rates would change
way it serves the public. This may be significant, or it may simply reflect the types of organizations that tend to have fewer lines.
Alternatively, one could contend that smaller organizations have more difficulty adapting to change. Responses to the question regarding
higher flat rates showed a less consistent but still decreasing pattern relative to size. Table 7-33 and Table 7-34 depict these responses.
Table 7-33 Would a Change to Flat Rates Affect the Way
Your Organization Serves the Public? (Cleveland Responses Only)
Yes No One 10 (34.48%) 19 (65.52%)
Small 6 (28.57%) 15 (71.43%)
Medium 9 (16.07% ) 47 (83.93%) Large 6 (12.00%) 44 (88.00%)
Table 7-34
Would a Change from Measured Rates to Higher Flat Rates Affect Way Your Organization
Serves Public? (Cleveland Responses Only)
Yes No
One 13 (39.39%) 20 (60.61%)
Small 5 (23.81%) 16 (76.19%)
Medium 16 (33.33%) 32 (66.67%) Large 6 (12.00%) 44 (88.00%)
142
Responses to the qu on rega ng rceived degree of control
wi measu rates show a ous relative line and
size (as measu by number of 1 i nes ) . ons than 10 lines were most 1 i Y same time, organiza ons with more 10 lines were most likely more than 10 lines were least i y control th measured as wi
1 i nes ·Iess
say they flat rates·.
more more
no clear explanation for results, but the following are offered as two possible explanations: (1) There is no cons; onship
between number of lines responses to these qu ons; or (2) ile there may a consistent rela onship between number of lines and
responses, this possible rel onsh"ip is obscured by the types of organizations represented in size , e.g., s, 11 es
and charities are predominant among those with one line 2-3 lines and these strata have tended to be most sensitive change throughout the survey. By way contrast, the major; of the other strata have either 4-10 lines or more than 10 lines. the extent the purpose of orga za on influences es, is will tend to overshadow any relationship to size or number 1 i nes.
1


1 .
a
C 8 T E USAGE
thru iss were reques
ts indicate
, minimal amounts provided by o Bell and Ci
in usage. is a di ... · ... r'''''"''n'"'r.
request was c routi y
es for their own engineering studies. These data cons;
traffic figures for each ce in
1 seconds). These gures are busy hour, sy season measure-Accompany; data was a request the number of cus
ass, associated with each dentral office.
second request was on the number local 15
y selected organizations. This request was a simple
in and area since they routinely 1 s
Cincinnati Bell had to wri and implement s i
and re our sample to ces.
outset this , it was ful t is
traffic data would prov; i ti evidence to
apparent from tionnaire c data ra; ons e ques ons
answe this me e a number wea in rllf c
ta and some potential "'Jea ses in models ana 1 is.
time of s study d t e1im; on wea
1
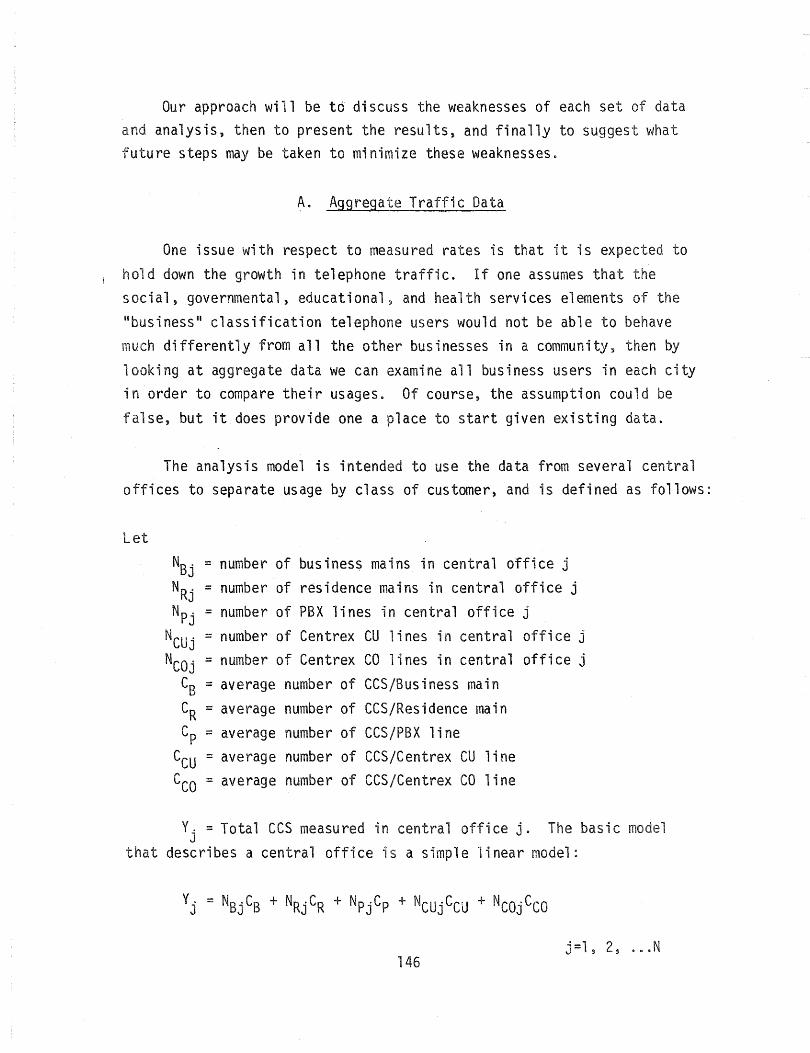
Our approach will be t6 discuss the weaknesses of each set of data and analysis, then to present the results, and finally to suggest what future steps may be taken to minimize these weaknesses.
A. Aggregate Traffic Data
One issue with respect to measured rates is that it is expected to hold down the growth in telephone traffic. If one assumes that the social, governmental, educational, and health services elements of the "business" classification telephone users would not be able to behave much differently from all the other businesses in a community, then by looking at aggregate data we can examine all business users in each city in order to compare their usages. Of course, the assumption could be false, but it does provide one a place to start given existing data.
The analysis model is intended to use the data from several central offices to separate usage by class of customer, and is defined as follows:
Let NBj = number of business mains in central office j
NRj = number of residence mains in central office j Npj = number of PBX lines in central office j
NCUj = number of Centrex CU lines in central offi ce j
NCOj = number of Centrex CO lines in central office j CB = average number of CCS/Business main CR = average number of CCS/Residence main Cp = average number of CCS/PBX line
CCU = average number of CCS/Centrex CU 1 i ne
Cco ::: average number of CCSjCentrex CO 1 i ne
Yj = Total CCS measured in central office j. The basic model that describes a central office is a simple linear model:
j:::l, 2, ..• N 146
We presume the values of , Cp~ cU' Ceo to be constant t own)
over the e ty (N offices) but 11 use the ~i
NCUj ; j=l, ••. N) squares the values parameters.
are a of es in is
1. The only traffic avail e are
may not be 1 i cative the day-to-day, arou us
patterns. It is, how€yer, indicative
p havi the greatest i on tel con-figuration and capacity decisions.
2. results may not apply to the soc;
and heal services ements of the communi
3. The parameters of the model may not be i amount
their dependence may vary greatly from office office.
4~ The data values (Y" Y2, ... , YN) may not be
5. The total figures not distinguish
outgoing calls as they simply measure how line is in
use. is means that every local call is double
in system. This double counting in i f is no em except that localized calling patterns may cause
counting to be nonuniformly spread over it is total clear at effect is
hold time per 1 an i rement
in r to exami ne measu
charge is based on r of 1s and 1 s.
7. It is unknown whether one ci is CCS figures more
less proportion of local calls
147
Items 1 and 2 may limit the ility to interpret the results while
6 and 7 would have the same effect without additional data. Items 3, 4,
a 5 will have the effect of increasing the variability of, and possibly
biasing the estimates of, the model parameters (CB, CR' Cp~ CCU' CCO )' Furthermore, they would limit the availability of standard statistical
techniques that could assess the amount of variability and bias in the estimates. The total effect of this is to increase over uncertainty
about the results.
In addition to the inherent weaknesses in the approach~ there were some weaknesses in the specific data used.
1. Only one busy season of data was used.
2. The count on number of customers by class came from data gathered at a time other than the busy season traffic data, although two sources were available and used to screen central offices where
substantial changes had occurred.
3. It is difficult to ascertain from telephone company personnel precisely what traffic is counted, the extent of double counting
and other technical considerations. Much more study of their precise traffic measurement techniques is needed if this type
of analysis is to continue to be pursued.
4. The traffic data obtained from Cincinnati were for all offices in metropolitan area, while the traffic data in Cleveland was
primarily from offices in the Cleveland city area.
Again, these items increase uncertainty about the results of any analysis but are such that given enough time they could be resolved ..
The results of the least squares fit to 17 data points (central offices) in Cincinnati and 19 in Cleveland are given in Table 8-1. No figure is given for Cleveland CCU since there were no Centrex CUls in
148
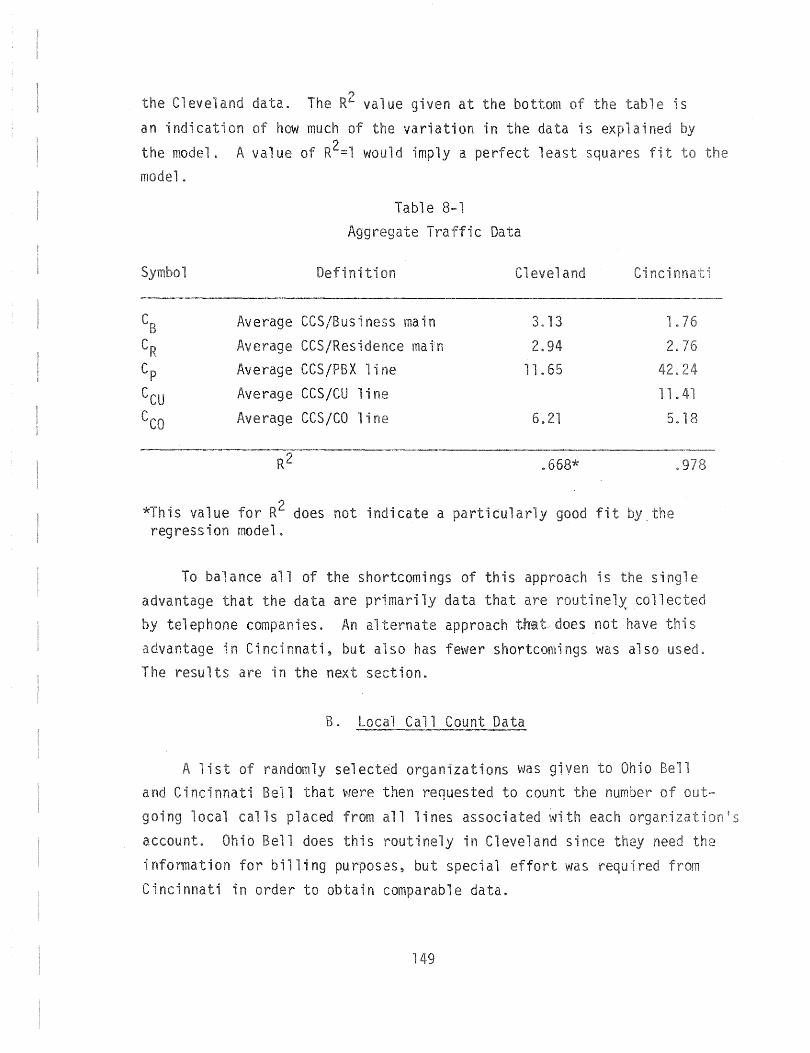
C data. The ue given at the bottom e is
an how much of variation in the data is ai
A value R2=1 would imply a perfect ares t
Table 8-1
Aggregate Traffic Data
Defini on evel
Average CCS/Business main 3.13 1 .
Average CCS/Res; rna ? <-. 2.
Cp Average CeS/PBX line 11 .
Average CCS/CU 1 i ne 11 .
Ceo Average CCS/Ca line 6.21 5.18
.668*
is value for R2 does not indicate a rticularly good fit regression model.
To balance all of the shortcomings of this advantage that the data are primarily data that are
hone companies. approach
is si
nel,x call
ntage in Cincinnati, but so has fewer shortcomings was so us The results are in the next ion.
B. local Call Count Data
A list of randomly selected organizations \!IJas given io
a Ci nnati Bell that were then requested to count the
9 ng local calls placed from 1 lines th
account. 10 B 1 is routi y in Clevel
rmation for billing purposes, but al was i
Cincinnati in order to obtain comparable data.
149
e
1
In this case, the analysis will consist of simple averages. Out of the seven weaknesses of the previous approach, only numbers 3 and 4 may remain, although they are probably not as likely to be a problem.
Again, the data may have some shortcomings as the original list was of necessity modified in the Cincinnati area to include only i.a few of
those organizations who are in ES5 offices. The basic weaknessp~ ~~~
1. One would be uncertain about the representativeness of the samples taken, especially in Cincinnati.
2. Only month in Cleveland and one and one half months in Cincinnati were used for actual counting. Although these were the same periods of time, a much more thorough study would be needed where data are collected for at least a year in order to eliminate localized seasonal effects.
The count results are given in Table 8-2. The last row of city-wide averages was computed without universities and hospitals as they appear to be special cases when one sees the order of magnitude of difference between the two cities. It is al~o known that Cleveland local government is on a centrex system that may account for its large difference from the Cincinnati local government.-
It is interesting to note that the ratio between counts in Cincinnati and Cleveland does not differ substantially from similar ratios between the Cp for the two cities in the aggregate data model even with all of its inherent weaknesses. However, the value for Cs in Cleveland runs counter to expectation and to the results of the count data. It is also interesting to note that differences in traffic counts do not translate into perceived differences in procedures and uses of the telephone that could be measured by the questionnaire.
150
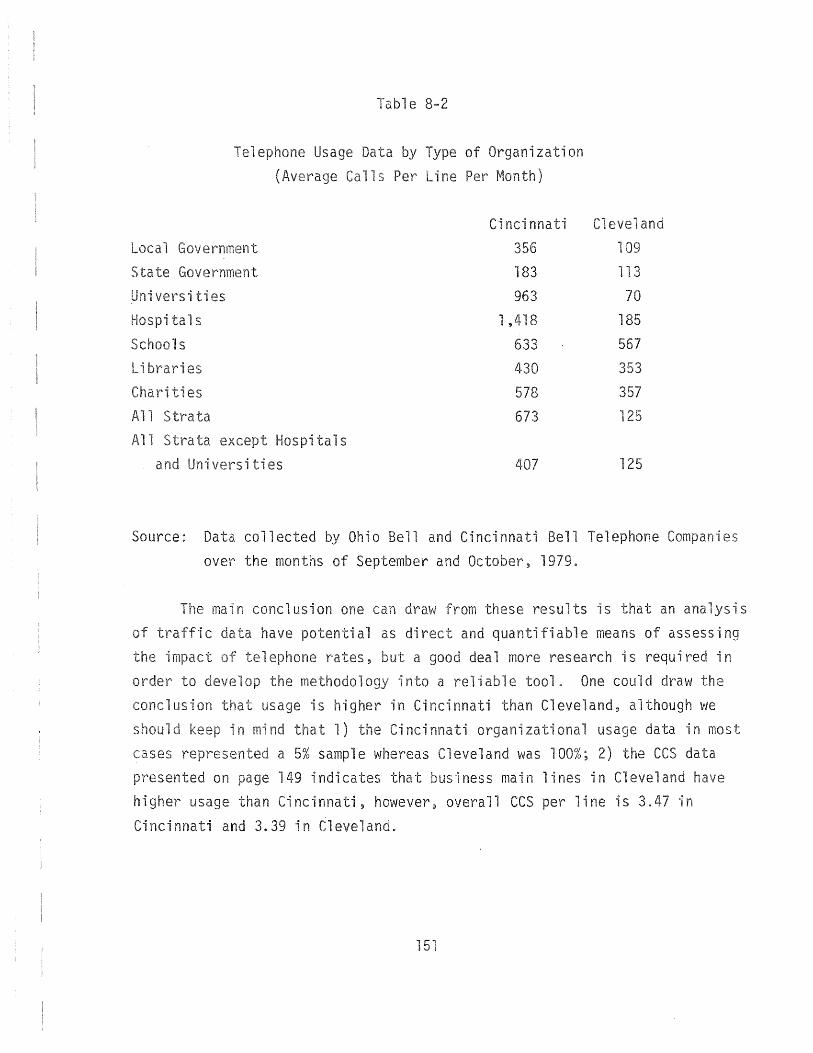
i vers i t-i es
ita 1 s
ls
es
es
t
ephone Usage
(Average
e 8-2
by Type of Organization
1s Per Line Per Month)
nci nna ti
356
183
963
1 ,418
633
4·30
578
673
1
113
70
185
567
and
357
125
Hos tals iversi es 407 125
Source: Data collected by Ohio Bell and Cincinnati Bell Telephone Companies
over the months of September and October, 1979.
main conclusion one can these resul is an anal
c have paten al as direct and quanti able means of assessi rates, a good deal more research is requi in
methodol into a e tool. One could draw conclusion usage is hig in Cincinnati than Cleveland, although we
that 1) Cincinnati organizational usage data in most cases a 5% sample whereas eveland was 100%; 2) the data
149 indicates that iness main lines in evel higher usage than ncinnati, however, overall CCS per line is 3.47 in
ncinnati 3. in Cl
151
s

CHAPTER 9 SUr1MARY
A. Cone 1 us ions
stated before, this project was undertaken for the
es mati impact of measured rate telephone service on the publi soc; service type agencies. The project methodology consisted marily
and interview techniques, with some statistical testing of of su resul
a re hi
It should be emphasized that the validity of the study results
dependent on the accuracy organizational responses. p attempted to eliminate all sources of bias which d
led. The sample size and identity were selected by proven The res were carefully constructed, studied, tested and
T iews were undertaken by a professional organization with ex-pert se in '1 ew techniques.
pilot study indicates that those organizations th can, ustments when measured rates are rst impl In
appears be very little difference in the in
ephone is used aid provision of soc; services. i
us"ion is so 1 cated of ive
s al differences between procedures and rams in Cinei Clevela
153

However, in specific instances, there are differences between the two cities. For example, there seems to be a difference in organizational style with some Cleveland institutions opting for very strong central administrations and central control while Cincinnati tends to
let subordinate units be more autonomous. We do not consider this difference in degree of centralization to be only a response to measured telephone rates. However, the case studies revealed that the Cleveland organizations do take advantage of this central control in a way that
probably has the effect of limiting the number of outgoing telephone .... a11 (" (.;,... m~n" .... """ ..... · ... ",m ............... roo'" ... e~t"" .. l'··\ 11'-iU .... t ' ... ltl ... U....l.:I.£:I.£:ltl·r'"';::;-rlt"e ·I·~ "" 01,;;) \loC., IIQI~ I-'Iu~:pald;:) Ollt: Uli \... II rOl lYle" ........ , ...... "" oJ
seen in the libraries in the two cities. In Cleveland) policies have been established to minimize the need to call patrons. Not so in Cincinnati; in fact, they are currently experimenting with a program of making telephone calls to retrieve overdue books. Cleveland probably would not consider such a program because of the cost of telephoning as well as employee time involved when a call produces a busy, not home, wrong person, wrong number, etc. There was no evidence that any of these specific differences would cause a difference in the quality of the services being provided.
As discussed in Chapter 3, quality was understood to include 1)
effectiveness in remedying problems and efficiency i.e. achieving objec
tives in a reasonable time period and at a reasonable cost. Quality can also include the satisfaction of the client population being served by
the agency and the ability to achieve any possible improvements in fulfilling the agency's objectives. Thus, measured rates would be considered to have a negative impact if the fact of its use significantly reduced effectiveness, efficiency, client satisfaction and/or the ability to improve service. Since this project involved interviews with the organizations only, there is no way to evaluate client satisfaction and
compare client satisfaction between like agencies in the two cities. One
might infer, from the absence of comments about client dissatisfactions, that telephone rate structures have not had substantial impact on the degree of client satisfaction. However, a more certain conclusion could
y be reached by surveys of the client populations.
154
Simila y, with respect the ability to improve service~
J methodology was such that only limited infonnation could However~ one persistent response from the surveys does ate is
aspect of ity. That iS$ the use measured rates the o niza cns more conscious of the value of the ephone as a resou
This in rn tends increased evaluation of tel us S a result should viewed as a positive impact since i
awareness of costs and the resultant more accurate cost-benefit es s d lead to improved usage of any organization1s limited resources.
Compa ri sons between respons es "' n the two cit i es ded '1 on
th to effectiveness and efficiency. One way to i
impact from measured rates on the effectiveness of the organizations is
estimate whether there is a substantial difference in the services by like organizations in one ci as opposed in
other city_ If such a difference does ex; ,then the a ses that the difference is due to the type of telephone
in stence. However, in fairness it should be mentioned that factors tradition, differing needs, differing fu
d so be responsible for fferences in services
case studies show there was rema ci es in listings of ities for all three types
one ki fference e 1, p. 53) was result ines es ished by the management of that particular Cl
ncy and had the effect of merely altering the method of service, than affecting the extent of service.
su es Question 2 (identify two sign; cant outgoing 1s) were quite si~ilar.
re
ons.
these responses s no sign; cant difference in es
es 1 s were some
for i ividual s differences were as lows:
155
1. Local Government responses to IIContact with other organizations li•
A significantly higher percentage of Cincinnati local governments cited this as a major reason for calls, than did local governments in Cleveland. While one could attribute this to the use of flat rates in Cincinnati, it would be equally valid to hypothesize that this is due to differences in local government organizational structures between the two cities.
2. Hospital responses to ilOther Oi reasons. Again, Cincinnati had a significantly higher percentage of responses to this category. Given the variations in types of programs and services offered by individual hospitals, it would be difficult to conclude that this difference is due to telephone rate structures.
3. University responses to IIOther ii reasons. Cleveland universities had a significantly higher percentage of responses in this category, than did Cincinnati. Again, however, it should be remembered that individual universities tend to develop unique characteristics to serve the needs of their particular student bodies, and there are wide variations in sizes and types of universities. Thus, again, it would be difficult to conclude that telephone rate structures are responsible for differences ;n the responses.
Thus, from the evidence collected, there appears to be little dif
ference between like organizations in the two cities in terms of services offered.
The project also collected information relative to the effect of te"lephone usage on efficiency. It would seem that the greatest potential impact on efficiency would relate to the possibility that higher tele
phone costs might lead to the use of alternate modes of communication a that this, in turn, would create delays in providing the service.
There are several sources of infoITIlation in the project which relate to is.
The case studies reported that those activities that are the most
important are also those that require the highest frequency of telephone
usage. However~ the case studies also indicate that there was no significant correlation between the importance of an activity and the effect of a call reduction program for four of the six cases. In those
156
t
cases
e i
would
su communi
ests
does y ma
t one
cities \ftJ3S
comr.lU
o
ence in
Ii, were rema
h
i
n
of measu
use
o es
s resource an
cos vs
v~as s 19n;
the most a 1
ation, the on was
rtant activities are not the ones on program.
ons ating to ephone. Confi
other modes
S1 i di
types of communi on
a signifi difference
on
or
e
es l use media, and a substantially higher
1 i
did es repo
I1cinnati 11
is as an ternative es.
qu situations ei
can
is equ y similar
,whi is used most showed y one signi
strata. in, the one difference
ere Cincinnati libraries had a signi e to use rna i 1 •
measu rates on ciency more in service through use of
y summar;
(p. 58) .
in results use of
communi on. would
y as a
pass i b 11 i
However,
use
ch
view the
pas; ve
i
as a uate
iv es
roughout surveys interviews, there were persistent themes. One is that significant differences between citites with es 1 the questions.
A istent theme is is
to these organiza ons with provision their services. re than 85% orga za ci es responded that
c 1s are necessary to accomplish main function the organization. There was no significant di "in responses between cities any strata except the schools. stratum a sign; cantly higher
r of and schools ing calls are , than
did Cincinnati schools.
third persistent theme is cos are a vi concern, and t the use measured rates creates an increased awareness of the
ephone as a resource with a cost attached. Slightly more half the organizations in each ci responded that the quality of service
provided would not decline if the price of a telephone call increased. However, a substantial numbel" did respond that qual ity would decl ine.
Of those responding that qual <ity d decline, there was a sign; cant difference between cities for only two strata -- the universities and
libraries. In strata Cincinnati percentage response was s nificantly higher. Given
most strata, it could be inferred
la ty of responses between ci es
the response is more related to the fact of increased than to the type rate structure.
T restratifi ons ve somewh more infoi"mation as to the identity f those who i would ine if price increased. The re-
s fications that the orga zations who feel qual ity d ine are more inclined to have less 10 tel lines, are
classified as "small ll in terms of them do
It is i nteres t i question indi
nifi y.
services
to that budget size d
58
emp 1 oyees extens ive use
more
restratification on is influence es
50%

In summa resu"1 oeeas; ent di es. was, however' , no consi p d would igni lve
in cit es, are cos se are mo s ni s re
ins ere measu rates 9 some n t ev "is not clear that there is
cons i e tINa factors must One, as di us in 4, a sign; negative impact
t ephone us is
to cannot be ther
on~ (2) increased revenues, or increa ci in some area ion. is si ion,
t costs would come from those er ion za on or the
us
ere is no evidence in data col1 t su a si on sen In pass bi 1 'i r, s considered. One~ cost can increase~ it s di ewi increased tel cos y
resource necess a costs
a
n a
sidize high of e za ons
t
i
a IS
su
at
users are
!b measu
i 1 i
are h
ews increases in the cost of organization. Either the organiza on
su as increased ci
s
usu
Fu s ld
resul in the
could
i
s
a
To cons
(1)
(2)
(3) Those i can ephone usage
not warrant the
(4) Those ich can and do over telephone usage.
The study would indicate three categories but precise
be determi ned.
one possi
not lar measu red
e proj
1y
iza ons
which
fferent ich are
discussion es:
ra of their siness not calls and therefore would
measu red rates.
ra of their business have no 1s can therefore not
rates.
exerci se the savings
over d
modifications exerc; se control
most organiza ons are in the first stribu on among those three cannot
Under this assi ion tern one may now address some of the 9 -issues ition that measured
gives iza ons n1 allocate and control their resources is would nizations in categories 3
a 4 so ate result d a price increase in 3 a i
success of changes the phil it is more use
most. is y if rate is commen-surate with cost service. If ce is too hi in categories 2 service in
ry 1 4. If ce s ow in
4 would
t
p
T
Ins tute.
in this serv t r
su
of
d
us
t;
rates
an -j
s "Idi i
if
i eus"]
nt
to
i
v
B
i
y
reo
a r~e
resou I"ces. ina'!
are an
is
1 i c
y
55 on
i
1
n
c if
us
ce "in es 2
lve it is y
serv"l
at was i
ternative
ul ilities
(1978) e
on on measu would
ill es Commission p
contain i
in at rate s res or
cos is
2
y
t
c
is a i-
is an
c int ts
sens ve s res
s
outweigh the costs in the long run. The introduction of usage sensitive pricing will ultimately help to achieve the goal of cost sensitive rate structures.
The policy alternative to exempt social service type organizations selectively needs to consider and compare the economic efficiency losses with any gains achieved by selective exemption. In Chapters 5, 6, 7, and 8 we presented the results of our study in the two different areas -Cleveland, the measured rate area, and Cincinnati, the flat rate area. As stated in these chapters, there are very few significant differences in the use of the telephone to provide social services. Not surprisingly, when an area switches rate structures the telephone service, as a resource with a cost -- is given more consideration. But over time it appears that the cost of telephone service in the measured rate area is given little consideration. Still, since telephone service is a relatively small portion of most organizations· total budget, it is often given less consideration than costs that are rapidly escalating, such as energy costs. The result is that an organization should take the real cost of telephone service into consideration.
Most of our discussion thus far has centered on the fact that the services provided by social service organizations in both cities are similar and that: (1) a switch to measured service in Cincinnati would not significantly effect the quality of the service provided and (2) that in Cleveland the measured rate structure has not affected the quality of service provided by these organizations. The next logical question is whether measured service could decrease telephone usage in Cincinnati. Based on the data in Chapter 8 we can tentatively conclude that measured service could reduce calling volume in Cincinnati. Both the CCS data and organization usage data indicate that usage is higher in Cincinnati. The overall CCS per line in Cincinnati is 3.47 and in
Cleveland it is 3.39. CCS per line, of course, represents all users in the exchange sampled and both incoming and outgoing calls in each city exchange. However, the organization traffic data sample also indicates
162

that us is hi in Ci in eveland. Average calls line e was 673 whereas in C1
15 given 1 imitation n 8, there is an i on
is in nnati than in Clevel Measured service maki ons aware of cost 1 in Cincinnati could reduce us
i ons.
1


APPENDIX A
WORK STATEi~ENT
FOR A STUDY OF THE IMPACT OF MEASURED TELEPHONE RATES ON USAGE
BY NON-PROFIT COMMERCIAL CUSTOMERS
A-l

Rates on Usage
Non-Profit Commerci Customers
the
ic Uti ities Commission of Ohio 180 t Broad Street
umbus, Ohio 43215
r~ay 2 ~
A-3

WORK STATENENT FOR A PROPOSED STUDY ON
IMPACTS OF MEASURED USE TELEPHONE SERVICE
Background
There has been a general trend in the pricing of telecommunications
services toward reflecting the actual cost of providing the service.. One
of the rate structures used to make the price of local telephone service
reflect the cost is measured servi~e pricing. M~asured service pricing
structures require the individual to pay for local telephone service
based on his usage rather than on a flat rate related to average usage.
It is argued that the ratepayer has fr'lOre control over his total bill
under measured service pricing since he can control use. It has been
al1eged'that measured service pricing may force changes in the operations
of social service (and other) institutions which could result in a decline
in the quality of service provided a community ..
.Qbject ive
The pr-imary objective of thi s proposed study is to determine \I/hether
using ~easured rates instead of flat rates affects the manner in which
social services are provided to a community_ If there is a significant
effect on the quality of social services a quantifications of the effect
will be presented.
Scope of the Work
The magnitude of demand changes that occur \,rith different rate struc
tures shall be inferred from a comparative analysis of current usage
patter'ns of selected customers on measured service and selected customers
A-5
on t ra serv ceo a vii 11 su
(1 ua rneasu servi ce ons~ Cincinna
ceo In ·1 t ion su , a s e of tel
use in
i llone us age ~
1 i C \"101 fare nc es 1 be identi ed and su
r h story us age s i es ~ e su rvey "' 1 deve 1 data
on ar;lOU va ations of cus \ .... us under each of the alternative
rate e data will be used to infer the impact of measured
T I
d
o
c
i n9 on the telephone usage of soc"lai service institutions ..
may ulso used to eval cost savings, delay in service
rnate fon~s of communications, lost revenu and
tences OJ n e use of local tel hone service due to ~ate structure
rf.:nces~ Soc al services in
11 be examined to a t ex ten t , i f any,
related services are provided in e flat rate area ich
i 2 neasured service area.
r2 3. o er soci S2fV ce agencies v/ill a-Iso be inter-
ne r me rat on th respect to telephone
r 0 er communications) budgets will
to determine the effect of any fiscal constraints
e ncies. a e"! opment of each ar'ea 11
yzed in order to ne e campa tabi ity of areas
ternat-jv Y j e adjus triit:::nts t to be e em
A-

ci
s
a
11 assess the e
cus rs in umbus area to
servi cee
1 es a 1 "I give
ve s ces we
1 es
taken
ces
ces Immunization Services
Servi ces atric S ces itals
Health rvices rams
su
11 be
1 i
Education and Protection Agencies ions Departments
Finance
i nit i a 1 vii 11 s tu dy e umbus area to
our su for the Cinei i a Cl
s dy wi 11 i a discussion 10 Bell
service agencies to determine the availabil i
7
t ~"-
ion measu
r
i
~
i1
areas .. at
a 1 su
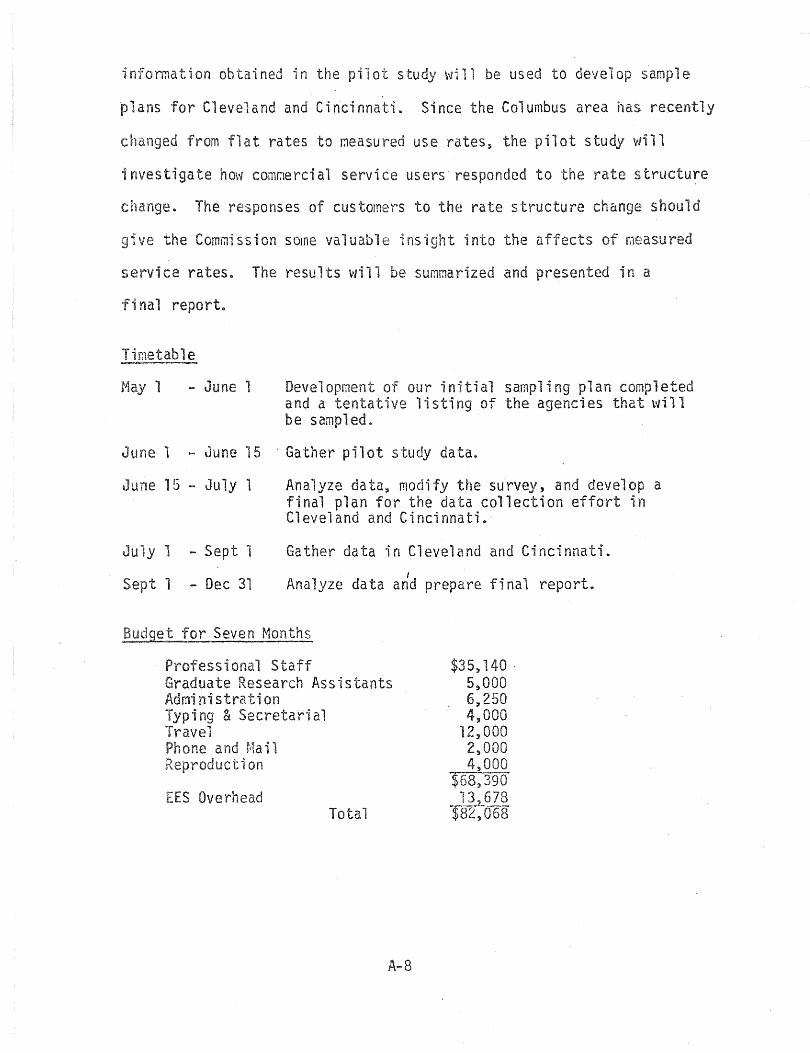
nfonnation obtained in the pi"lot study \\1111 be used to develop sample
ans for Cleveland and Cincinnati. Since the Columbus area has recently
changed from flat rates to r.1easured use rates, the pilot study vlill
'I nvestigate hm'l comr.lercial service users' responded to the rate structure
change. The responses of customers to the rate structure change should
give the Commission some valuable insight into the affects of measured
service rates. The results will be summarized and presented in a
nal report ..
Tir:1etable
Nay 1 - June 1 Development of our initial sampling plan completed and a tentative listing of the agencies that will be sampled"
ne 1 - June 15 'Gather pilot study data.
June 15 - July 1
July 1 - Sept 1
Sept 1 - Dec 31
Analyze data, modify the survey, and develop a final plan for the data collection effort in Cleveland and Cincinnati.
Gather data in Cleveland and Cincinnati. f
Analyze data and prepare final report.
Budget for Seven Months
Professional Staff $35, 140 . 5~OOO 6,250 4,000
Graduate Research Assistants Administration Typing & Secretarial Travel Phone and t·la i 1 Reproduction
EES Overhead Total
A-8
12,000 2,000 4,000
$68~390 13,678
$82,068

B
1


was in
sessions
r"'ates
were:
popula on "ity,
1 es universities), social
ta 1 ), in and, nci
2. in , as 1 as some general
resul
3
case
ic ans
i aus
later ~!
i
n
ysis
1) a
ews. A small
\rias ana 1
t
B
se
ces.
users
es) ,
8S),
Columbus~
users i
onnaire was
i
i
i ly,
cal
a more 1
n
re was
Initial meetings were held wi officials of Ohio Bell and ncinnati Bell lephone companies ch time they offered
assistance and cooperation in ng tative and gaining
access to other records and information.
June 1979
We again met with the representatives from the Ohio Bell and ncinnati Bell lephone companies to discuss their ability to provide
information and their capability measure certain telephone lines in order to get an objective measure usage. We provided them a list
names and numbers to be sampled in each area.
The pilot study was started by Polimetrics this month and was completed by July. We provided them a revised questionnaire that we discussed with them, and they arranged the final test questionnaire under our supervision. In addition, we defined our sample plan and sample population for the Columbus area and provided Polimetrics with the names and numbers of the sample individualse
We continued to refine and ne our sample size and population
for the Cleveland and Cincinnati areas.
A library for measured ce literature was initiated to p build a rm theoretical basis for our report. We also attended
on measured services the Ohio Senate. We did this in order in data that may ready be avail e~ The data gathering effort
also included the seeking of data evant to demographics area.
8-4
July 1
We n met wi representatives Ohio 1 nc
Bell lephone companies times duri discuss
information received by us from them and make sample plan. In i on, they prav; us
e ans i ion and exchange informatione We reworked (Cleveland and Ci nnati) and provided them with a names
numbers. We also worked out the dates of the survey. Cinc; 11 agreed to sample lines from the middle August to
September. Ohio Bell agreed to sample lines during the 111ng cycle. The September 11;ng cycle of Ohio Bell will i
from the middle of August. It was th only minor modifications.
t the data be
pilot study survey was completed during the month.
meetings with Polimetrics personnel to discuss their with the survey. In addition, we have performed a i
the data to check for inconsistencies and errors; been referred back to Polimetrics correction. A
some the literature and several similar studies was
e
d
ems
ems
s
month. In addition, authors of a ephone company were
determine if additional information is available. oped a model for determining CCS usage by customer class; ion
on main stations the month and have tested
5
t' ;;:;

August 1979
The analysis of the pilot study data was started. The initial findings were presented to the PUCO in Au~ust. A complete tabulation of the data was given to PUCO and a project IIm1dterm li report was presented to PUCOe
The main data collection effort in Cincinnati and Cleveland was started. We reworked our orignial questionnaire using the infonnation gained from the pilot study in Columbus. A revised sample list was developed and delivered to Polimetrics, that performed the interview function for the Institute. In addition, WATS lines were ordered from the telephone companies for use in the interview process. An optimization model was developed that determines optimal size of strata samples with a constraint of total sample size.
September 1979
The analysis of the pilot study data continued du~ing the month.
The main data collection effort in Cincinnati and Cleveland is still in progress. The collection effort was completed in the second week in October.
Several organizations have been interviewed in Cincinnati and Cleveland involving selected members of our sample population. This involved in-depth questioning by NRRI staffe The information obtained from these interviews will be utilized in case studies. Generally, cooperation was good; however, we experienced some problems in setting up the interviews.
In addition, the actual collection of data by the telephone companies was started during the month.
October 1979
The ysis and drafting of the section of the final report on the Columbus pilot study continued during month~
The lection data for main study in Cleveland Cincinnati was completed during the month. The ta were reviewed for errors
As mentioned in September, several organizations were being interviewed in Cincinnati and Cleveland for case study purposes; this method of data collection was concluded in October~ and we have analyzed the data obtained from these interviews.
November and December 1979
The majority of the work completed during these months related to the data analysis and writing of the final report. Several sections of the report were completed during the month of November, including a section on the results of the Columbus pilot study. The final report on the project is scheduled for delivery in early January.
B-J


APPENDIX C
QUESTIONNAIRES USED IN THE STUDY
C-1

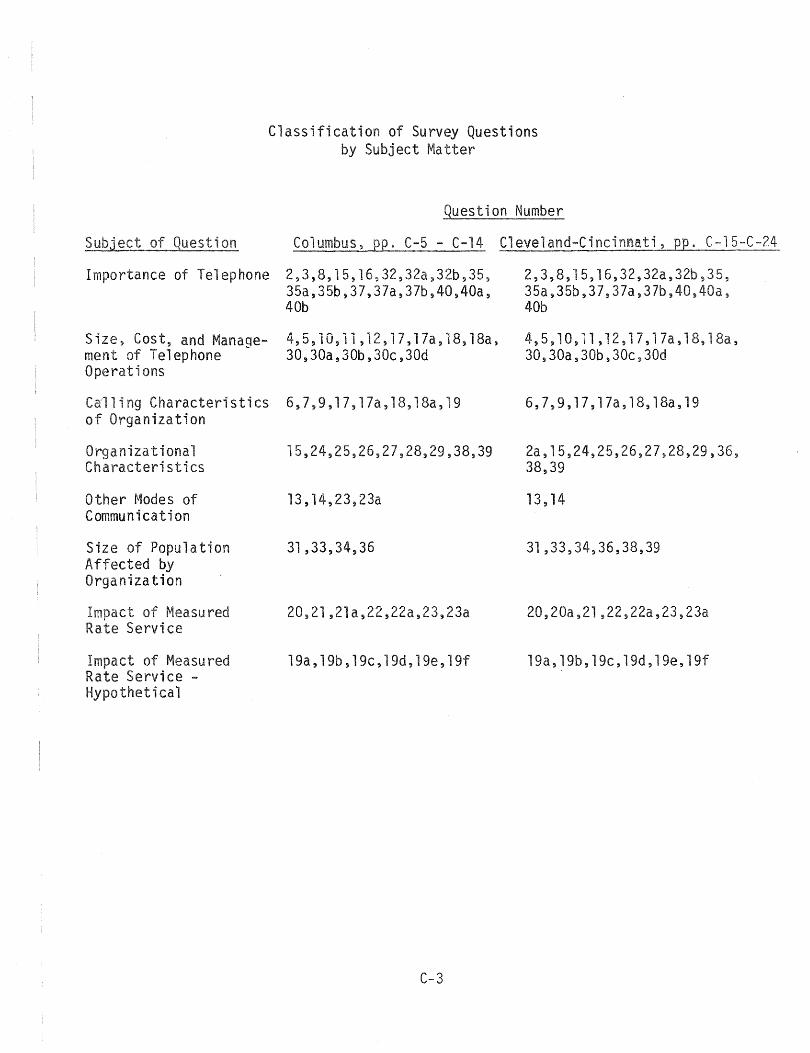
Subject of Question
Importance of Telephone
~lze, Cost, and Manaqement of Telephone -Operati ons
C((lling Characteristics of Organization
o rg ani z at ion a 1 Characteristics
Other ~1odes of Communication
Size of Population Affected by o rg ani z a t ion
Impact of Measured Rate Servi ce
Impact of Measured Rate Service -Hypo thet i ca 1
Classification of Survey Questions by Subject Matter
Question Number
Columbus, pp. C-5 - C-14 Cleveland-Cincinnati, pp. C-15-C-24
2,3,8,15,16~32,32a,32b,35, 35a,35b,37,37a,37b,40,40a, 40b
4,5,lO,1',12,17,17a,18,18a, 30,30a,30b,30c,30d
6,7,9,17,17a,18,18a,19
15,24,25,26,27,28,29,38,39
13,14,23,23a
31,33,34,36
20,21,21a,22,22a,23,23a
19a,19b,19c,19d,1ge,19f
C-3
2,3,8,15,16,32,32a,32b,35, 35a,35b,37,37a,37b,40,40a, 40b
4, 5, i 0, 11 , i 2, 1 7 , 1 7 a , 1 8, 1 8a , 30,30a,30b,30c,30d
6,7,9,17,17a,18,18a,19
2a,15,24,25,26,27,28,29,36~ 38,39
13, 14
31,33~34,36,38,39
20,20a,21,22,22a,23,23a
19a,19b,19c,19d,1ge,19f

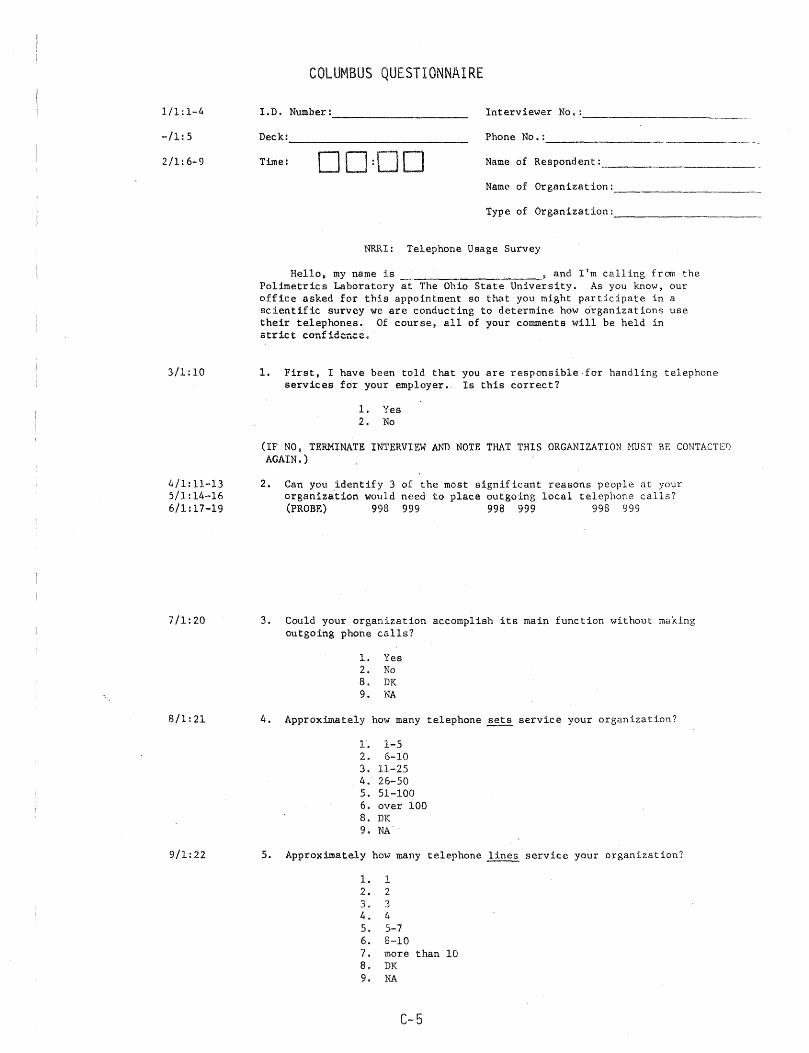
1/1:1-4
-/1:5
2/1:6-9
3/1:10
4/1:11--13 5/1:14-16 6/1:17-19
7/1:20
8/1:21
9/1:22
COLUMBUS QUESTIONNAIRE
I.D. Number: ________________________ _ Interviewer No.: __________________ __
Deck: ___________________________ __ Phone No. : ________ _
Time: 00:00 Name of Respondent: ____________________ __
Name of Organization:
Type of Organization: ___________________ _
NRRl: Telephone Usage Survey
Hello, my name is 1 and I'm calling from the Polimetrics Laboratory at The Ohio State University. As you know, our office asked for this appointment so that you might participate in a scientific survey we are conducting to determine how organizations use their telephones. Of course, all of your comments will be held in strict confidence.
1. First, I have been told that you are responsible ,for handling telephone services for your employer., Is this correct?
1. Yes 2. No
(IF NO, TERMINATE INTERVIEW AND NOTE THAT THIS ORGANIZATION MUST BE CONTACTED AGAIN. )
2. Can you identify 3 of the most significant reasons people at your organiza'tion would need to place outgoing local telephone calls? (PROBE) 998 999 998 999 998 999
3. Could your organization accomplish its main function without making outgoing phone calls?
1. Yes 2. No 8. DK 9. NA
4. Approximately how many telephone sets service your organization?
1. 1-5 2. 6-10 3. 11-25 4. 26-50 5. 51-100 6. over 100 8. DK 9. NA
5. Approximately how many telephone ~ service your organization?
1. 1 2. 2 3. 3 4. 4 5. 5-7 6. 8-10 7. more than 10 8. DK 9. NA
C-5
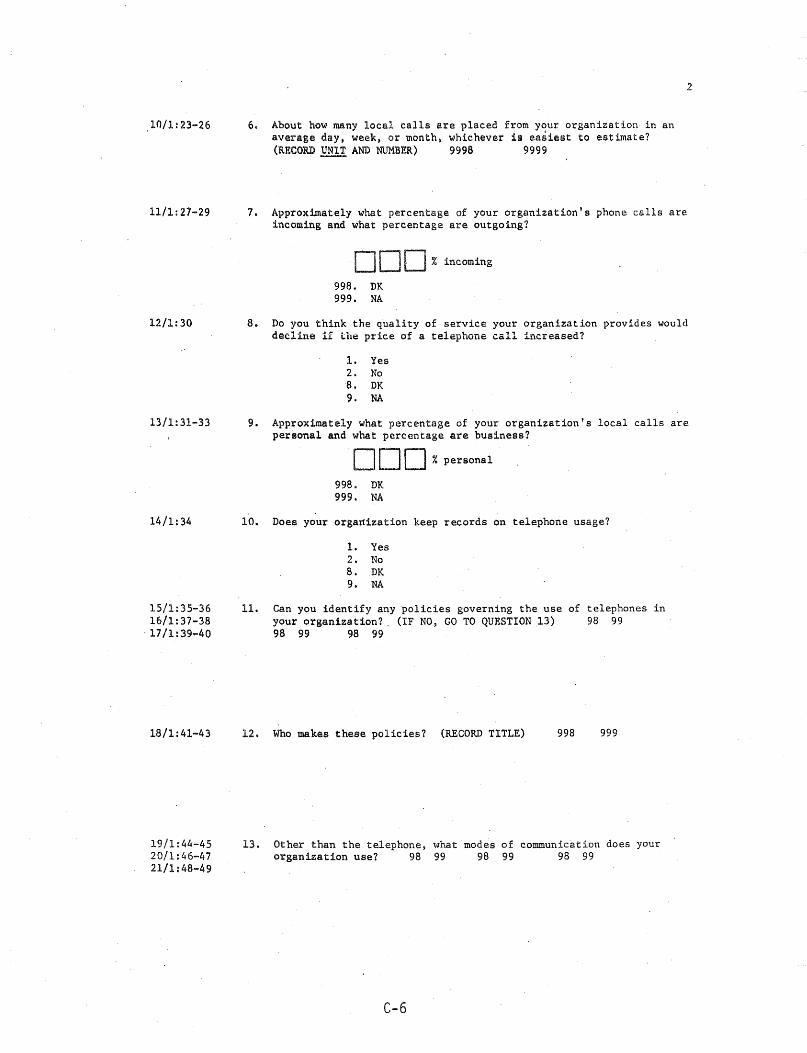
10/1: 23-26
11/1:27-29
12/1:30
13/1:31-33
14/1:34
15/1: 35-36 16/1:37-38 17/1:39 .... 40
18/1:41-43
19/1:44-45 20/1:46-47 21/1:48-49
6. About how many local calls a.re placed from your organization in an average day. week, or month. whichever is easiest to estimate? (RECORD !lli.!! AND NUMBER) 9998 9999
7. Approximately what percentage of your organization I s phone calls are incoming and what percentage are outgoing?
DOD % incoming
998. DK 999. NA
2
8. Do you think the quality of service your organization provides would decline if the price of a. telephone call increased?
1. Yes 2. No '8. DK 9. NA
9. Approximately what percentage of your organization's local calls are personal and what percentage are business?
o 0 0 % personal
99B. DK 999. NA
10. Does your orgatlization keep records on telephone usage?
1. Yes 2. No 8. DK 9. NA
11. Can you identify any policies governing the use of telephones in your organization?, (IF NO, GO TO QUESTIONl3) 98 99 98 99 98 99
12. Who makes these policies? (RECORD TITLE) 998 999
13. Other than the telephone, what modes of communication does your organization use? 98 99 98 99 98 99
C-6
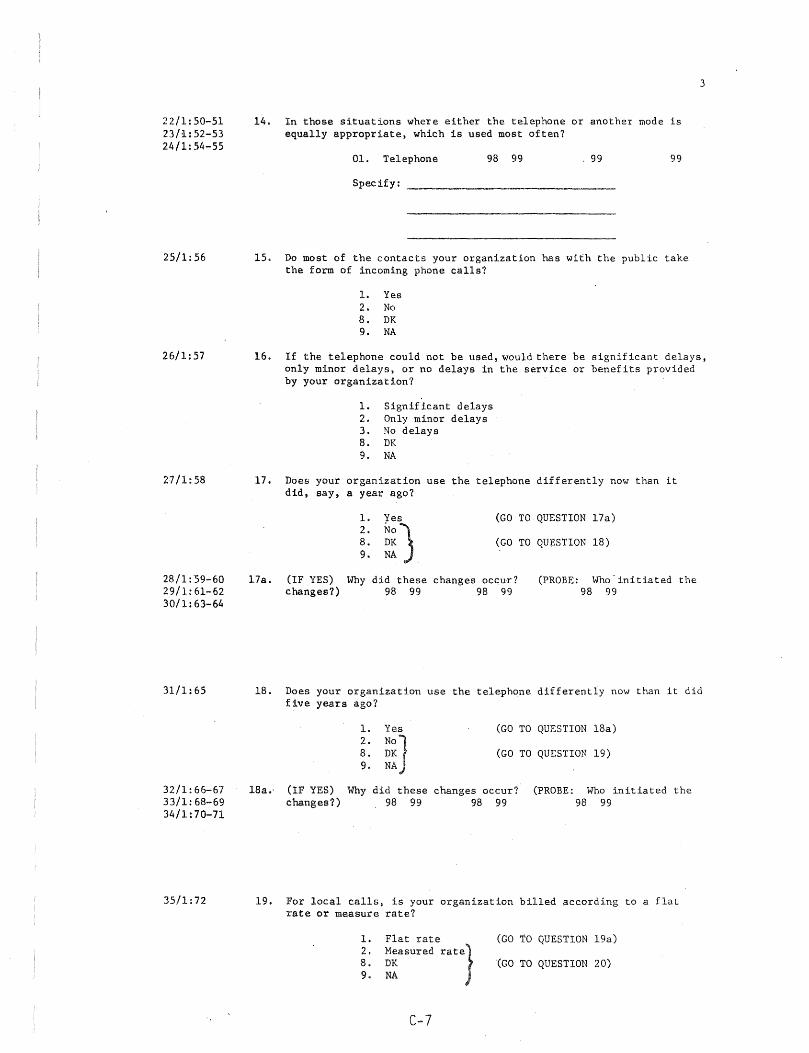
22/1:50-51 23/:1.:52-53 24/1:54-55
25/1:56
26/1:57
27/1:58
28/1:'59-60 29/1:61-62 30/1:63-64
31/1:65
32/1: 66-67 33/1:68-69 34/1:70-71
35/1:72
14. In those situations where either the telephone or another mode is equally appropriate, which is used most often?
01. Telephone 98 99 99 99
Specify:
15. Do most of the contacts your organization has with the public take the form of incoming phone calls?
1. Yes 2. No 8. DK 9. NA
3
16. If the telephone could not be used, would there be significant delays, only minor delays, or no delays in the service or benefits provided by your organization?
1. Significant delays 2. Only minor delays 3. No delays 8. DK 9. NA
17. Does your organization use the telephone differently now than it did. say, a year ago?
17a. (IF YES) changes?)
~: ~~Sj 8. DK 9. NA
(GO TO QUESTION l7a)
(GO TO QUESTION 18)
tVhy did these changes occur? (PROBE: Who-initiated the 98 99 98 99 98 99
18. Does your organization use the telephone differently now than it did five years ago?
18a.' (IF YES) changes?)
1. Yes
~: ~~J 9. NA
(GO TO QUESTION l8a)
(GO TO QUESTION 19)
lfuy did these changes occur? (PROBE: Who initiated the 98 99 98 99 98 99
19. For local calls, is your organization billed according to a flat rate or measure rate?
1. Flat rate 2. Measured rate} 8. DK 9. NA
C-7
(GO TO QUESTION 19a)
'(GO TO QUESTION 20)
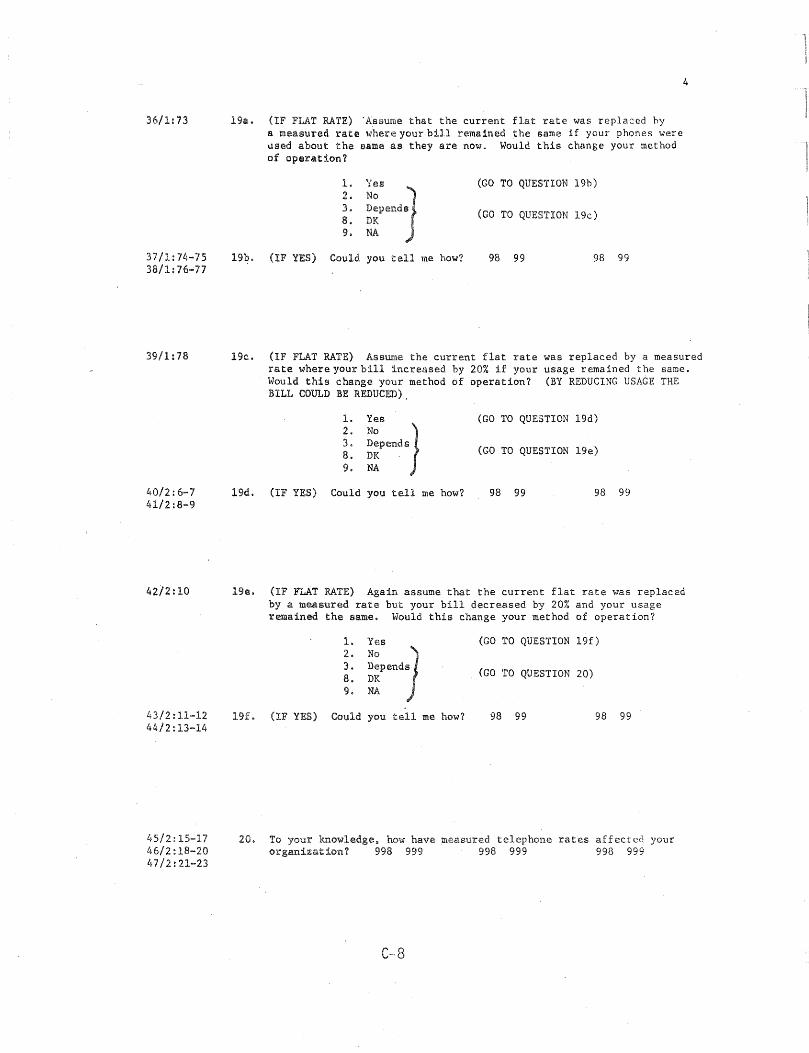
36/1:73
37/1:74-75 38/1: 76 ... 77
39/1:78
1.10/2: 6-7 41/2:8-9
42/2:10
43/2: 11-12 44/2: 13-14
45/2:15-17 46/2:18-20 47/2:21-23
19a. (IF FLAT RATE) 'Assume that the current flat rate was replaced hy a measured rate where your bill remained the same if your phones were used about the SE.une as they are now. Would this change your method of operation?
1. 2. 3. 8. 9.
19b. (IF YES) Could you tell me how?
(GO TO QUESTION 19b)
(GO TO QUESTION 19c)
98 99 98 99
4
19c. (IF FLAT RATE) Assume the current flat rate was replaced by a measured rate where your bill increased by 20% if your usage remained the same. \.Jould this change your method of operation? (BY REDUCING USAGE THE BILL COULD BE REDUCED).
1- Yes (GO TO QUESTION 19d) 2.
No } 3, Depends (GO TO QUESTION 1ge) 8. DK .
9. NA
19d. (IF YES) Could you tell me how? 98 99 98 99
1ge. (IF FLAT RATE) Again assume that the current flat rate was replaced by a measured rate but your bill decreased by 20% and your usage remained the same. Would this change your method of operation?
t ~::endJ 8. DK 9. NA
(GO TO QUESTION 19f)
(GO TO QUESTION 20)
19f. (IF YES) Could you tell me how? 98 99 98 99
20. To your knowledge. how have measured telephone rates affected your organization? 998 999 998 999 998 999
C-8
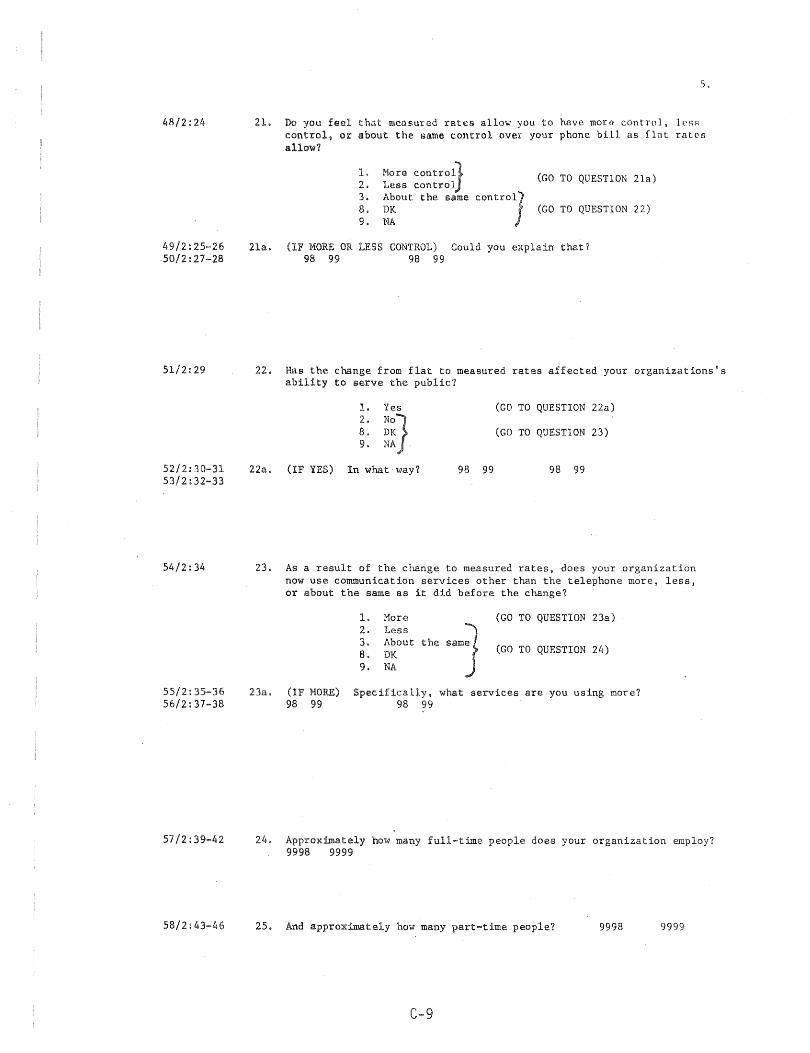
48/2:24
49/2:25-26 50/2:27-28
51/2:29
52/2:30-31 53/2:32-33
54/2:34
55/2:35-36 56/2:37-38
57/2:39-42
58/2:43-46
5.
21. Do you feel that measured rates allow you to have more cOntrol, lesR control, or about the same control over your phone bill as flat rates allow?
2. 3. 8. 9.
~10ro contrOl} Less control About the same contrOl] DK NA
(GO TO QUESTION 218)
(GO TO QUESTION 22)
21a. (IF MORE OR LESS CONTROL) Could you explain that? 98 99 98 99
22. Has the change from flat to measured rates affected your organizations's ability to serve the public?
1. Yes (GO TO QUESTION 22(1) 2.
N°7 8. DK (GO TO QUESTION 23) 9. NA ,
22a. (IF YES) In what way? 98 99 98 99
23. As a result of the change to measured rates. does your organization now use communication services other than the telephone more. less, or about the same as it did before the change?
23a. (IF MORE) 98 99
1. More (GO TO QUESTION 23a) 2. Less
the sam1 3. About (GO TO QUESTION 24) 8, DK
9. NA
Specifically, what services are you using more? 98 99
24. Approximately how many full-time people does your organization employ? 9998 9999
25. And approximately how many part-time people? 9998 9999
C-9
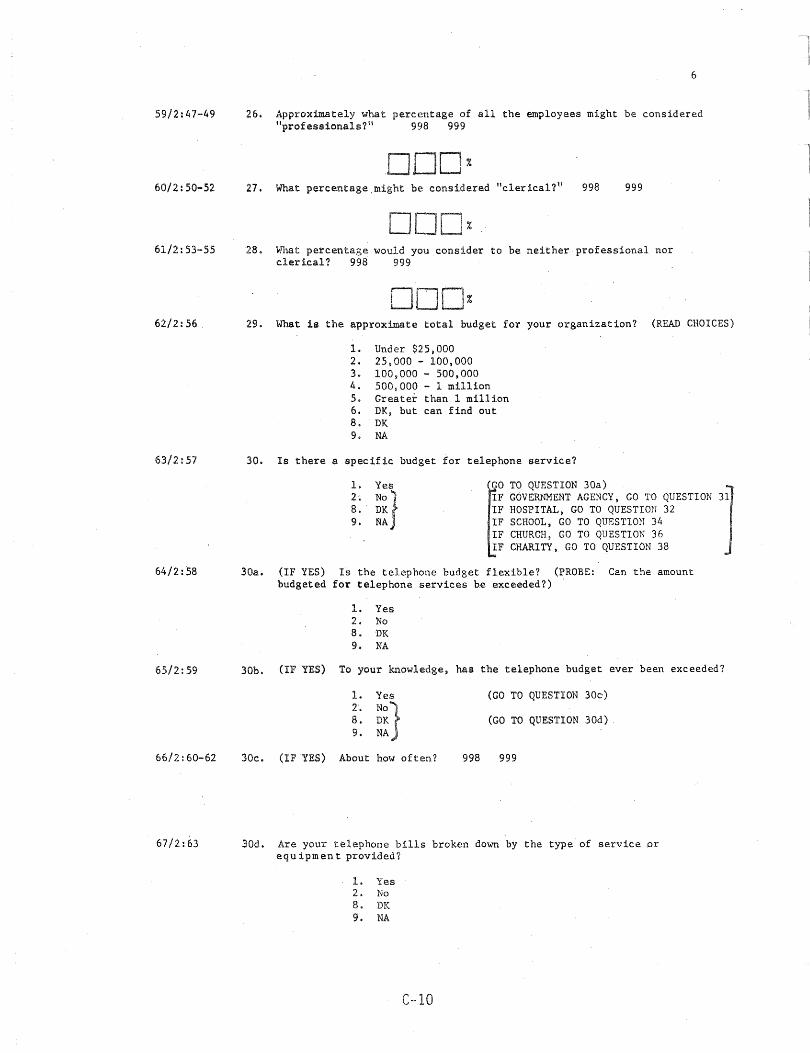
59/2:47-49
60/2:50-52
61/2:53-55
62/2:56
63/2:57
64/2:58
65/2:59
66/2:60-62
67/2:63
6
26. Approximately what percentage of all the employees might be considered "professionals?" 99B 999
27. What percentage ,might be considered l'c l er ical?'! 998 999
28. What percentage would you consider to be neither professional nor clerical? 998 999
29. What is the approximate total budget for your organization? (READ CHOICES)
1. Under $25,000 2. 25,000 - 100,000 3. 100,000 - 500,000 4. 500,000 - 1 million 5. Greater than 1 million 6. DK~ but can find out 8. DK 9. NA
30. Is there a specific budget for telephone service?
30a.
1. 2~
B. 9.
~~SJ DK NA ~
o TO QUESTION 308) I. F GOVERNMENT AGENCY,. GO TO QUESTION IF HOSPITAL, GO TO QUESTION 32 IF SCHOOL. GO TO QUESTION 34 IF CHURCH, GO TO QUESTION 36 IF CHARITY, GO TO QUESTION 38
(IF YES) Is the telephone budget flexible? (PROBE: Can the amount budgeted for telephone services be exceeded?)
1. Yes 2. No 8. DK 9. NA
30b. (IF YES) To your knowledge, has the telephone budget ever been exceeded?
L Yes
2. NO} 8. DK 9. NA
30e. (IF YES) About how often?
(GO TO QUESTION 30c,)
(GO TO QUESTION 30d) ,
998 999
30d. Are your telephone bills broken down by the type of service Dr equipment provided?
1. Yes 2. No 8. DK 9. NA
C-I0
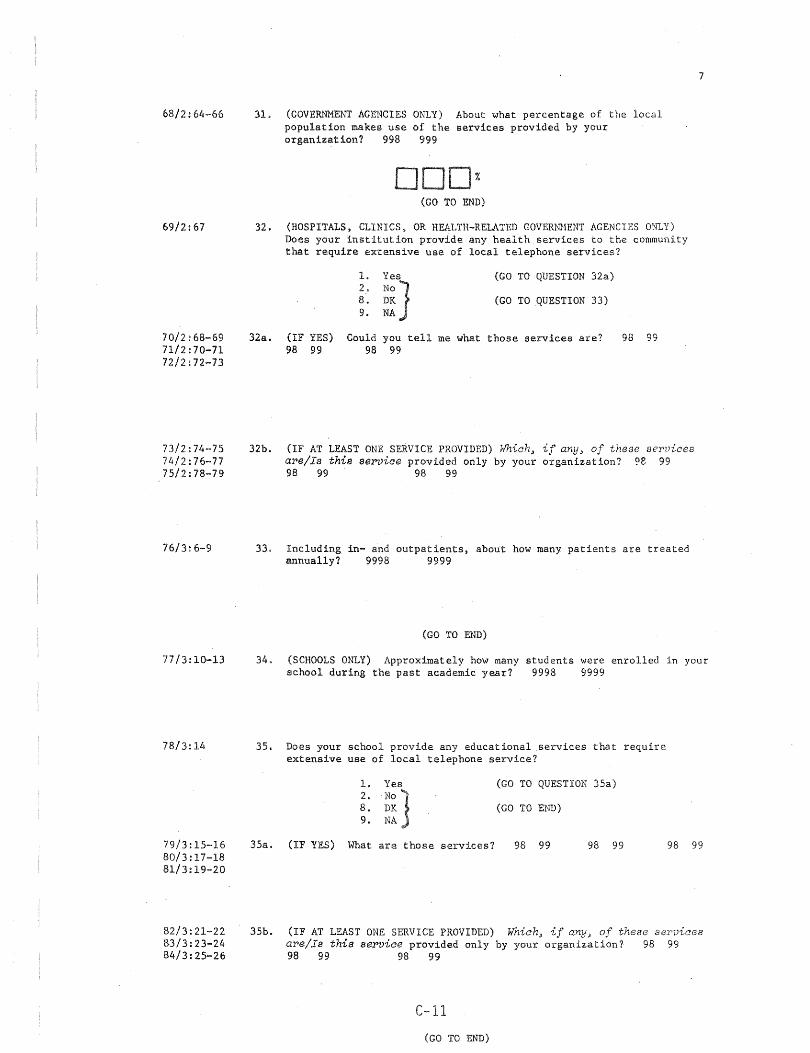
68/2:64-66
69/2:67
70/2: 68-69 71/2: 70-71 72/2: 72-73
73/2: 74--75 74/2: 76-77 75/2:78-79
76/3:6-9
77/3: 10-13
78/3:14
79/3:15-16 80/3:17-18 81/3:19-20
82/3:21-22 8-3/3:23-24 84/3:25-26
31. (GOVERNMENT AGENCIES ONLY) About what percentage of the local population makes use of the services provided by your organization? 998 999
00 %
(GO TO END)
32. (HOSPITALS, CLINICS, OR HEALTH-RELATED GOVERNHENT AGENCIES OWLY) Does your institution provide any health services to the community that require extensive use of local telephone services?
1. 2. 8. 9.
~~s] DK NA
(GO TO QUESTION 32a)
(GO TO QUESTION 33)
32a. (IF YES) Could you tell me what those services are? 98 99 98 99
98 99
32h. (IF AT LEAST ONE SERVICE PROVIDED) Which) if any, of these services are/Is this se'l'V-ice provided only by your organization? ge 99 98 99 98 99
33. Including in- and outpatients, abau·t how many patients are treated annually? 9998 9999
(GO TO END)
7
34. (SCHOOLS ONLY) Approximately how many students were enrolled in your school during the past academic year? 9998 9999
35. Does your school provide any educational services that require extensive use of local telephone service?
1. Yes (GO TO QUESTION 35a) 2.
No J 8. DK (GO TO END) 9. NA
35a. (IF YES) What are those services? 98 99 98 99 98 99
35b. (IF AT LEAST ONE SERVICE PROVIDED) Which~ if anYJ of these services are/Is this se1'Vice provided only by your organization? 98 99 98 99 98 99
C-l1
(GO TO END)

85/3:27-30
86/3:31
8
36. (CHURCHES ONLY) How many people are in your congregation? 9998 9999
37, Does your church provide em)' sacial services that require extensive use of local telephone services?
1. 2. 8. 9.
(GO TO QUESTION 3513.)
(GO TO END)
87/3: 32-33 - . 3701. (IF YES) What are those servic.es? 98 99 88/3:34-35
98 99 98 99
89/3:36-37
90/3:38-39 91/3: 40-l~1 92/3:42-43
93/3:44-47
94/3:48-52
95/3:53
96/3:54-55 97/3: 56-57 98/3:58-59
:60-61 :62-63
101/3:64-65
37b. (IF AT LEAST ONE SERVICE PROVIDED) Which., if any, of these servicea are/Is thia 8eFvice provided only by your organization? 98 99 98 99 98 99
(GO TO END)
38. (CHARITIES ONLY) Approximately how many people contribute to your charity annually? 9998 9999
39. Could you give me a rough idea of how much those contributions come to? 99998 99999
40. Does organization provide any services that require extensive use local telephone services?
1. 2. 8. 9.
40a. (IF YES) What are those services?
(GO TO QUESTION 40a)
(GO TO END)
98 99 98 99 98 99
40b. AT LEAST ONE SERVICE PROVIDED) Which J any~ of these services are/Is this service provided only by your organization? 98 99 98 99 98 99
(GO TO E~"'D)
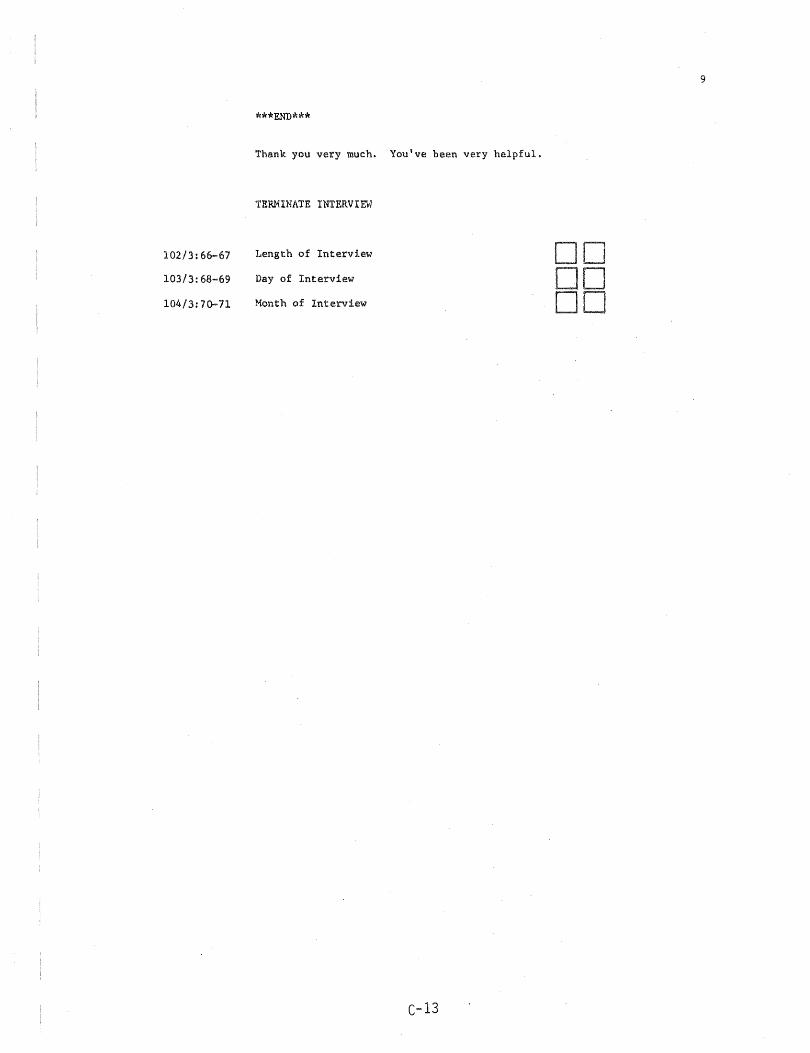
102/3: 66-67
103/3:68-69
104/3: 70-11
***END***
Thank you very much. You've been very helpful.
TERMINATE INTERVIEW
Length of Interview
Day of Interview
Month of Interview
C-13
DO DO DO
9


1/1:1-3
/1:4
2 : 5-8
3/1:9
4 : 10
5/1:11-13 6/1:14-16
CI INNATI
ID Number:
Deck:
Time:
QUESTIONNAI TELEPHONE 2
Interviewer Number:
Phone Number:
Name of Respondent:
Name of Organization:
[INTERVIEWER: Code type of organization here]
1. City Government 2. County Government 3. State Government 4. University s. Hospital 6. School 7. Library 8. Charity
Hello, my name is and I'm calling from the Polimetric.s Laboratory at The Ohio State University. As you know, our office asked for this appointment so that you might participate in a scientific survey we are conducting to determine how organizations use their telephones. Of course, all of your conrnents will be held in strict confidence.
1. First, I have been told that you are responsible for handling telephone services for your employer. Is this correct?
1. yes 2. no
[IF NO, TERMINATE INTERVIEW, FIND OUT WHO IS IN CHARGE AND MAKE A NOTE TO RECONTACT AGENCY IN FUTURE]
2. Can you identify 2 of the most significant reasons people at your organization would need to place outgoing local telephone calls? (PROBE) 998 999 998 999
7/1:17-19 2a. What is the main function of your organization? 998 999
1:20 3. Are outgoing calls ~";""""'';'''''':::''''':''-'''''d- to accomplish the main function of your organization?
1. yes 2. no 8. DK 9. NA
C-15
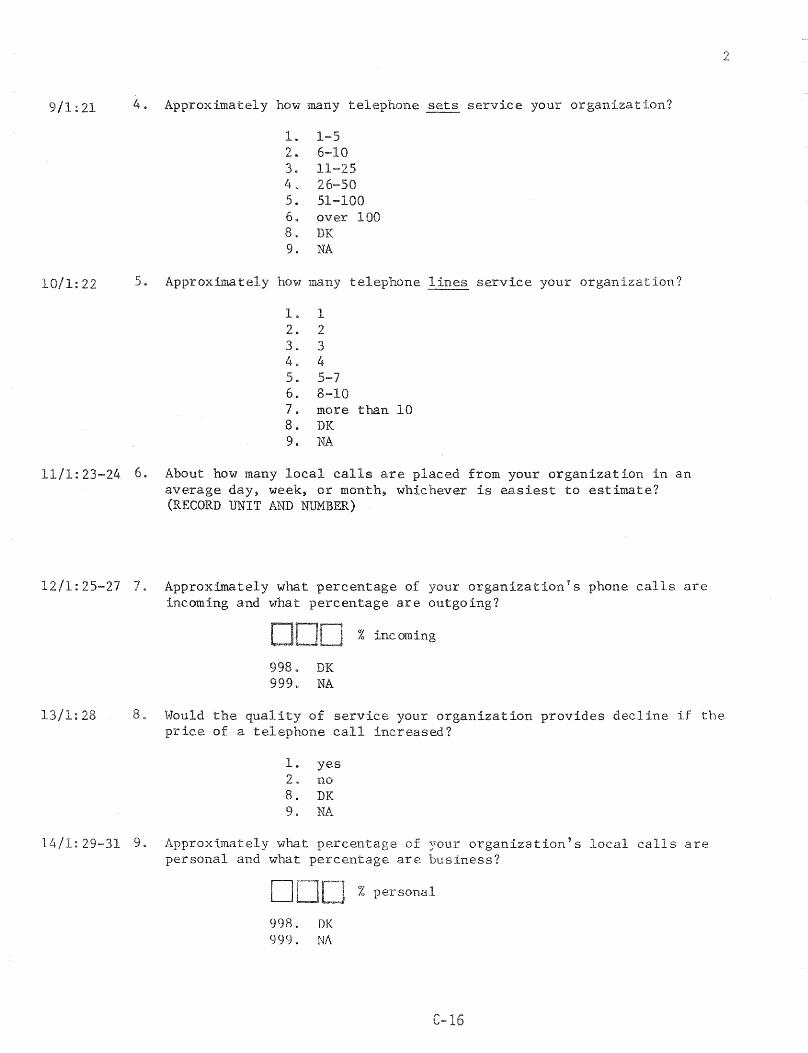
9/1:21 4& Approximately how many telephone sets service your organization?
1. 1-5 2. 6-10 3. 11-25 4. 26-50 5. 51-100 6. over 100 8~ DK 9. NA
10/1:22 5. Approxima tely how many telephone 1 --- service your organization?
1. 1 2. 2 3. 3 4. 4 5. 5-7 6. 8-10 7. more than 10 8. DK 9. NA
11/1:23-24 6. About how many local calls are placed from your organization in an average day, week, or month, whichever is easiest to estimate? (RECORD UNIT AND NUMBER)
12/1: 25-27 7. Approximately what percentage of your organization v s phone calls are incoming and what percentage are outgoing?
% incoming
998. DK 999. NA
2
13/1:28 8. Would the qual of service your organization provides decline if the price of a telephone call increased?
1. yes 2. no 8. DK 9. NA
14/1: 29-31 9. Approximately what percentage of your organizationVs local calls are personal and what percentage are business?
DD % personal
99R. DK 999. NA
c-
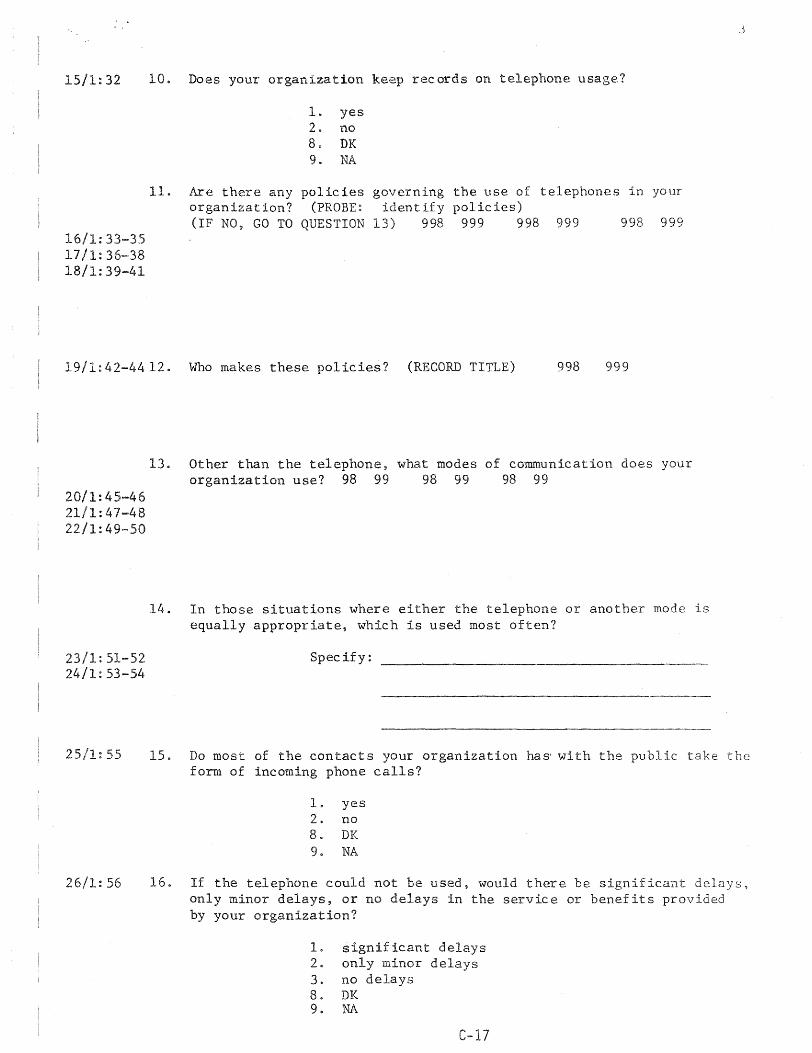
15/1:32
16/1:33-35 17/1:36-38 18/1:39-41
10. Does your organization keep records on telephone usage?
1. yes 2. no 8. DK 9. NA
11. Are there any polic ies governing the use of telephones in your organization? (PROBE: identify policies) (IF NO, GO TO QUESTION 13) 998 999 998 999 998 999
j
19/1:42-4412. Who makes these policies? (RECORD TITLE) 998 999
20/1: 45-46 21/1:47-48 22/1:49-50
13. Other than the telephone, what modes of communication does your organization use? 98 99 98 99 98 99
14. In those situations where either the telephone or another mode is equally appropriate, which is used most often?
23/1:51-52 Specify: 24/1:53-54
25/1:55
26/1:56
15. Do most of the contacts your organization has' with the public take the form of incoming phone calls?
1. yes 2. no 8. DK 9. NA
16. If the telephone could not be used, would there be significant delays, only minor delays, or no delays in the service or benefits provided by your organization?
1. significant delays 2. only minor delays 3. no delays 8. DK 9. NA
C-17
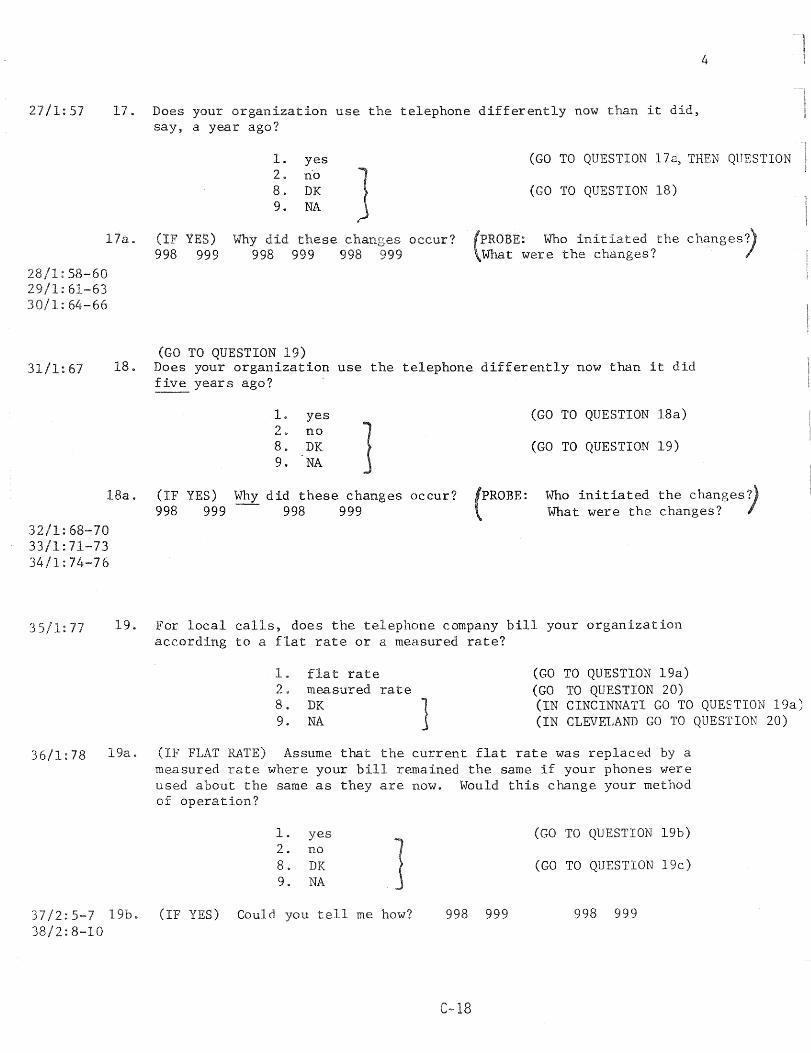
2"7/1:57 17. Does your organization use the telephone differently now than it did, say, a year ago?
4
1. yes (GO TO QUESTION 173, THEN QUESTION 2. no 8. DK 9ti NA J (GO TO QUESTION 18)
17a. (IF YES) 998 999
Why did these changes occur? 998 999 998 999 (
PROBE: Who initiated the changes?) What were the changes? I
28/1:58-60 29/1:61-63 3D/I: 64-66
31/1:67 (GO TO QUESTION 19)
18. Does your organization use the telephone differently now than it did five years ago?
1. yes (GO TO QUESTION 18a) 2. no 8. DK (GO TO QUESTION 19) 9. NA
l8a. (IF YES) Why did these changes occur? Who initiated the changes?) What were the changes? I
32/1:68-70 33/1:71-73 34/1:74-76
998 999 998 999
35/1:77 19. For local calls, does the telephone company bill your organization according to a flat rate or a measured rate?
1. 2. 8. 9.
flat rate measured rate DK NA ]
(GO TO QUESTION 19a) (GO TO QUESTION 20) (IN CINCINNATI GO TO QUE~'TION 19a) (IN CLEVELAND GO TO QUESTION 20)
36/1:78 19a. (IF FLAT RATE) Assume that the current flat rate was replaced by a measured rate where your bill remained the same if your phones were used about the same as they are now. Would this change your method of operation?
1. yes 2. no 8. DK 9. NA ]
37/2: 5-7 19b. (IF YES) Could you tell me how? 38/2:8-10
(GO TO QUESTION 19b)
(GO TO QUESTION 19c)
998 999 998 999
C-18
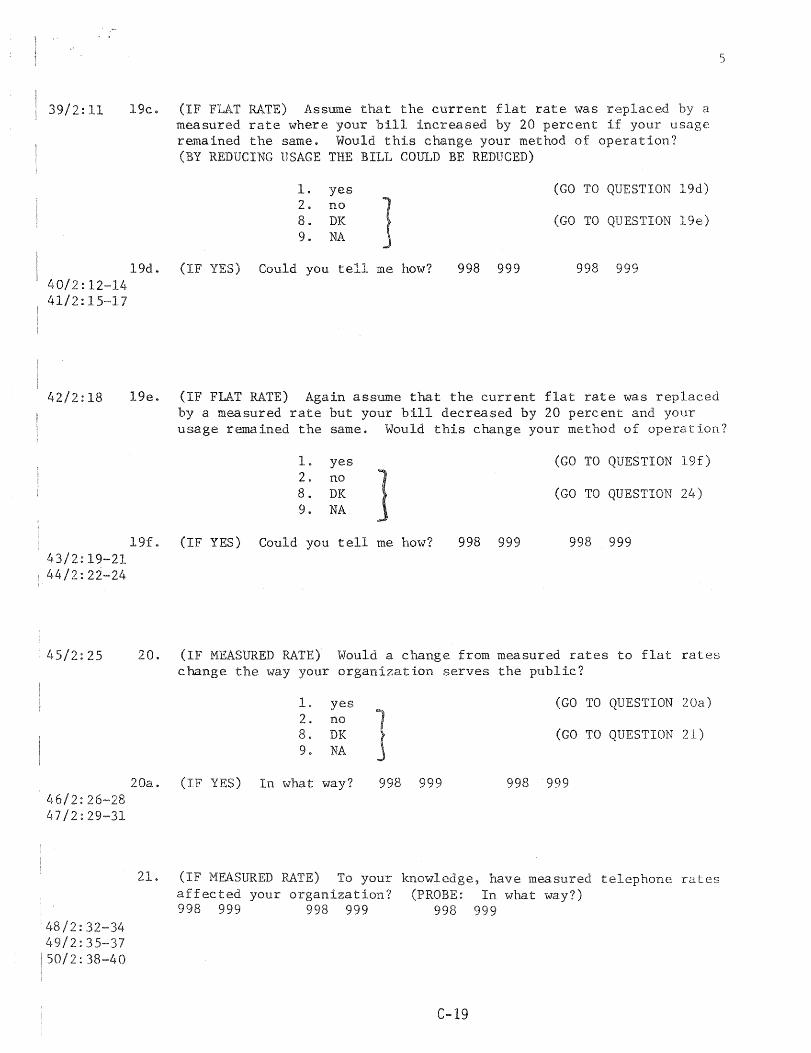
39/2:11 19c. (IF FLAT RATE) Assume that the current flat rate was replaced by a measured rate where your bill increased by 20 percent if your usage remained the same. Would this change your method of operation? (BY REDUCING USAGE THE BILL COUI.D BE REDUCED)
1. yes (GO TO QUESTION 19d) 2. no 8. DK (GO TO QUESTION 1ge) 9. NA
19d. (IF YES) Could you tell me how? 40/2:12-14
998 999 998 999
41/2:15-17
42/2:18 1ge. (IF FLAT RATE) Again assume that the current flat rate was replaced by a measured rate but your bill decreased by 20 percent and your usage remained the same. Would this change your method of operation?
1. yes (GO TO QUESTION 19f) 2. no 8. DK (GO TO QUESTION 24) 9. NA
19f. (IF YES) Could you tell me how? 43/2:19-21
998 999 998 999
44/2:22-24
45/2:25
46/2:26-28 47/2:29-31
48/2:32-34 49/2:35-37 50/2:38-40
20. (IF MEASURED RATE) Would a change from measured rates to flat rates change the way your organization serves the public?
1. yes (GO TO QUESTION 20a) 2. no
1 8. DK (GO TO QUESTION 21) 9. NA
20a. (IF YES) In what way? 998 999 998 999
21. (IF MEASURED RATE) To your knowledge, have measured telephone rates affected your organization? (PROBE: In what way?) 998 999 998 999 998 999
C-19
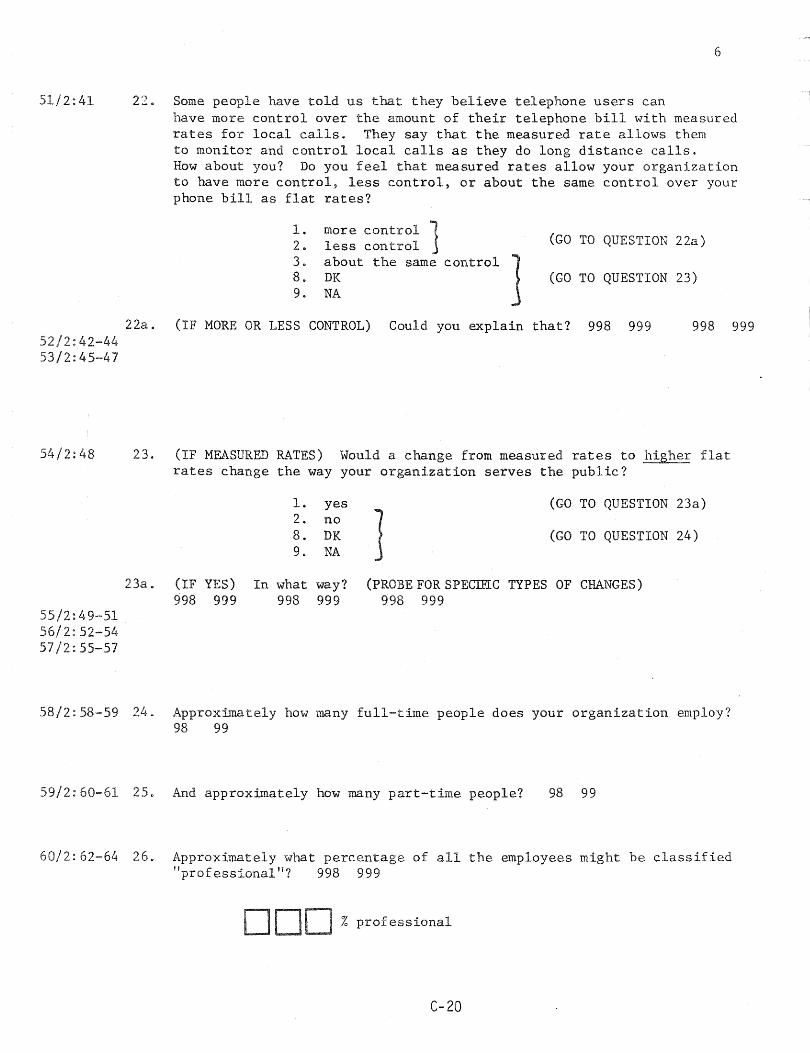
51/2:41
2:42-44 53/2:45-47
54/2: 48
55/2:49-51 56/2:52-54 57/2:55-57
6
22. Some people have told us that they believe telephone users can have more control over the amount of their telephone bill with measured rates for local calls$ They say that the measured rate allows them to monitor and control local calls as they do long distance calls. How about you? Do you feel that measured rates allow your organization to have more control, less control, or about the same control over your phone bill as flat rates?
1. more control 1 (GO 2. less control TO QUESTION 22a)
3. about the same control
1 8. DK (GO TO QUESTION 23) 9. NA
22a. (IF MORE OR LESS CONTROL) Could you explain that? 998 999 998 999
23. (IF MEASURED RATES) Would a change from measured rates to higher flat rates change the way your organization serves the public?
23a. (IF YES) 998 999
1. yes 2. no 8. DK 9. NA
In what way? 998 999
(GO TO QUESTION 23a)
} (GO TO QUESTION 24)
(PROBE FOR SPECmC TYPES OF CHANGES) 998 999
58/2: 58-59 24. Approxima tely how many full-time people does your organization employ? 98 99
59/2:60-61 25. And approximately how many part-time people? 98 99
60/2:62-64 26. Approximately what percentage of all the employees might be classified "professional"? 998 999
c=J c=J % professional
C-20

7
27. What percentage might be classified Hclerical"? 998 999
61/2:65-67 % clerical
28. What percentage would you classify as neither "professional" or "clerical"? 998 999
62/2:68-70 %
63/2:71 29. wnat is the approximate total budget for your organization? (READ
1. under ,000 2. $25~OOO - $100,000 3. $100,000 - $500,000 4 $500,000 - 1 million 5. greater than 1 million 6. DK~ but can find out 8. DK 9. NA
64/2:72 30. Is there a specific budget for telephone service?
65/2:73 30a.
66/2:74 30b.
30c 67/2:75-77
(IF YES) budgeted
(IF YES) ever been
(IF YES)
Is
1. 2. 8. 9.
yes no DK NA
the telephone budget
(GO TO QUESTION 30a)
(IF GOVERNMENT AGENCY, GO TO QUESTION 3 (IF HOSPITAL, GO TO QUESTION 32) (IF HEALTH RELATED GOVERNMENT AGENCY, GO
TO QUESTION 31 and 32) SCHOOL OR UNIVERSITY GO TO Q1JESTION 34) LIBRARY~ GO TO QUESTION 36) CHARITY, GO TO QUESTION 38)
flexible? (PROBE: Can the amount for telephone services be exceeded?)
1. yes 2. no 8 DK 9. NA
To your knowledge, has the h;ldget for telephone services exceeded?
1. yes 2. no } 8. DK 9. NA
(GO TO QUESTION 30e)
(GO TO QUESTION 30d)
About how often? 998 999
21
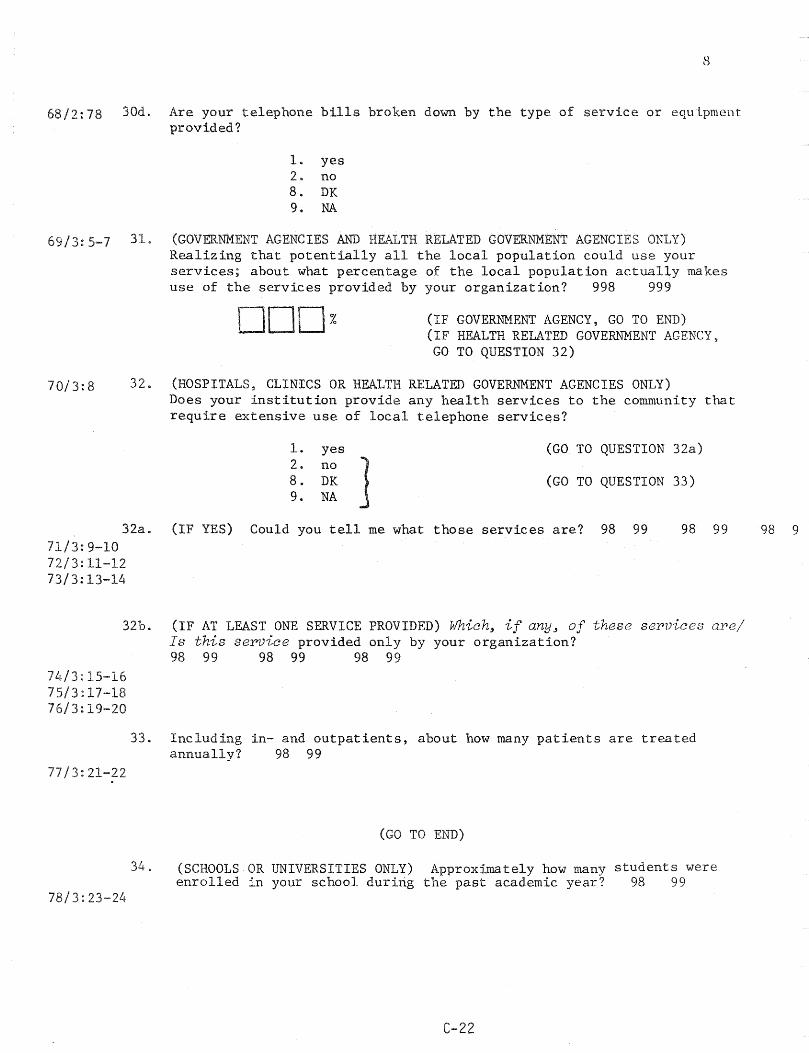
8
68/2:78 30d. Are your telephone bills broken down by the type. of service or equIpment provided?
1. yes 2. no 8. DK 9. NA
69/3:5-7 31. (GOVERNMENT AGENCIES AND HEALTH RELATED GOVERNMENT AGENCIES ONLY) Realizing that potentially all the local population could use your services; about what percentage of the local population actual+y makes
70/3:8
use of the services provided by your organization? 998 999
(IF GOVERNMENT AGENCY, GO TO END) (IF HEALTH RELATED GOVERNMENT AGENCY,
GO TO QUESTION 32)
328 (HOSPITALS, CLINrCS OR HEALTH RELATED GOVERNMENT AGENCIES ONLY) Does your institution provide any health services to the community that require extensive use of local telephone services?
1. 2. 8. 9.
yes no DK NA
(GO TO QUESTION 32a)
J (GO TO QUESTION 33)
32a. (IF YES) Could you tell me what those services are? 98 99 71/3:9-10
98 99
72/3:11-12 73/3:13-14
32b. (IF AT LEAST ONE SERVICE PROVIDED) Which~ if any~ of these services ape/ Is this service provided only by your organization?
74/3:15-16 75/3:17-18 76/3:19-20
77/3:21-22
78/3:23-24
98 99 98 99 98 99
33. Including in- and outpatients, about how many patients are treated annually? 98 99
(GO TO END)
34. (SCHOOLS OR UNIVERSITIES ONLY) Approximately how many students were enrolled in your school duririg the past academic year? 98 99
C-22
98 9
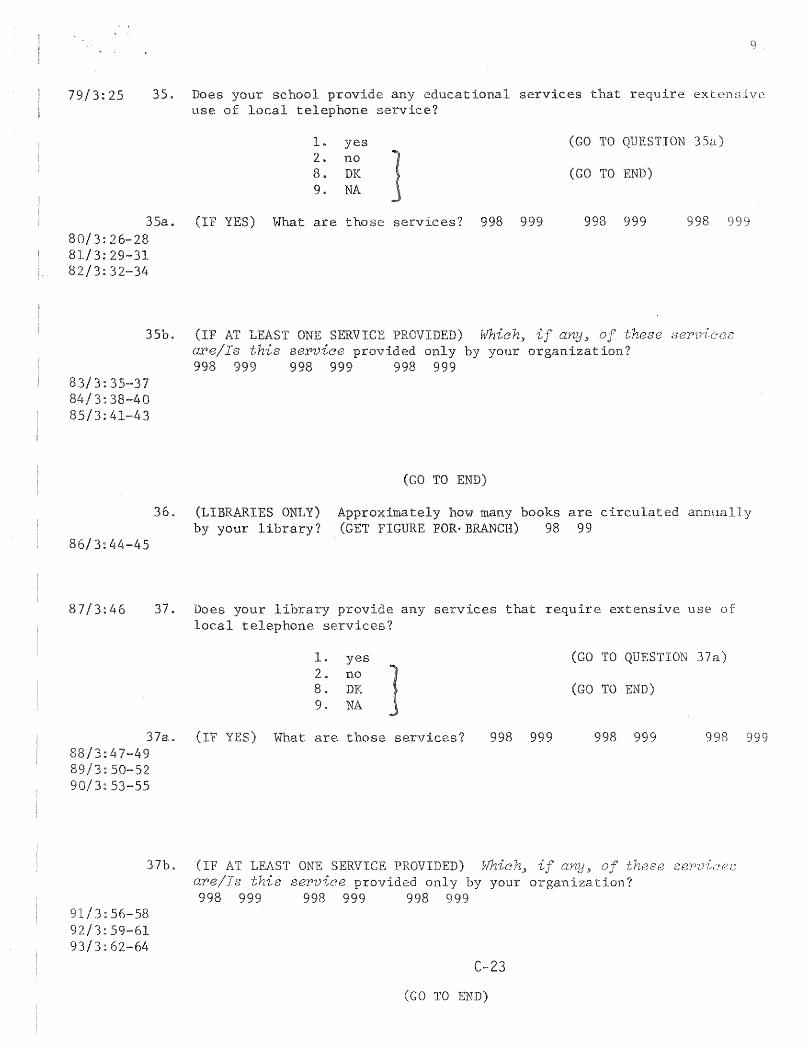
79/3:25 35 Does your school use of local
1. yes
any educational services that service?
(GO TO
2. no 1 8. DK 9. NA
(GO TO END)
35a. (IF YES) What are those services? 998 999 80/3:26-28
998 999
81/3:29-31 82/3:32-34
35b. (IF AT LEAST ONE SERVICE PROVIDED) h~ich3 if anYj of these
83/3: 3 5-~ 37 84/3:38-40 85/3:41-43
86/3:44-45
36.
are/Is this service only by your organization? 998 999 998 999 998 999
(LIBRARIES ONLY) by your library?
(GO TO END)
Approximately how many books are circulated (GET FIGURE FOR· BRANCH) 98 99
9
extensive:
35a)
998 999
87/3:46 37. Does your library any services that require extensive use of local telephone services?
1. yes (GO TO QUESTION 2. no ] 8. DK (GO TO END) 9. NA
37a. (IF wnat are those services? 998 999 998 999 88/3:1.~7-49
3:50-52 90/3:53-55
37b. (IF AT LEAST ONE SERVICE PROVIDED) Which" any., of
91/3:56-58 92/3:59-61 93/3:62-64
ape/Is this sepvice provided only by your organization? 998 999 998 999 998 999
C-23
(GO TO END)
37a)
998 999
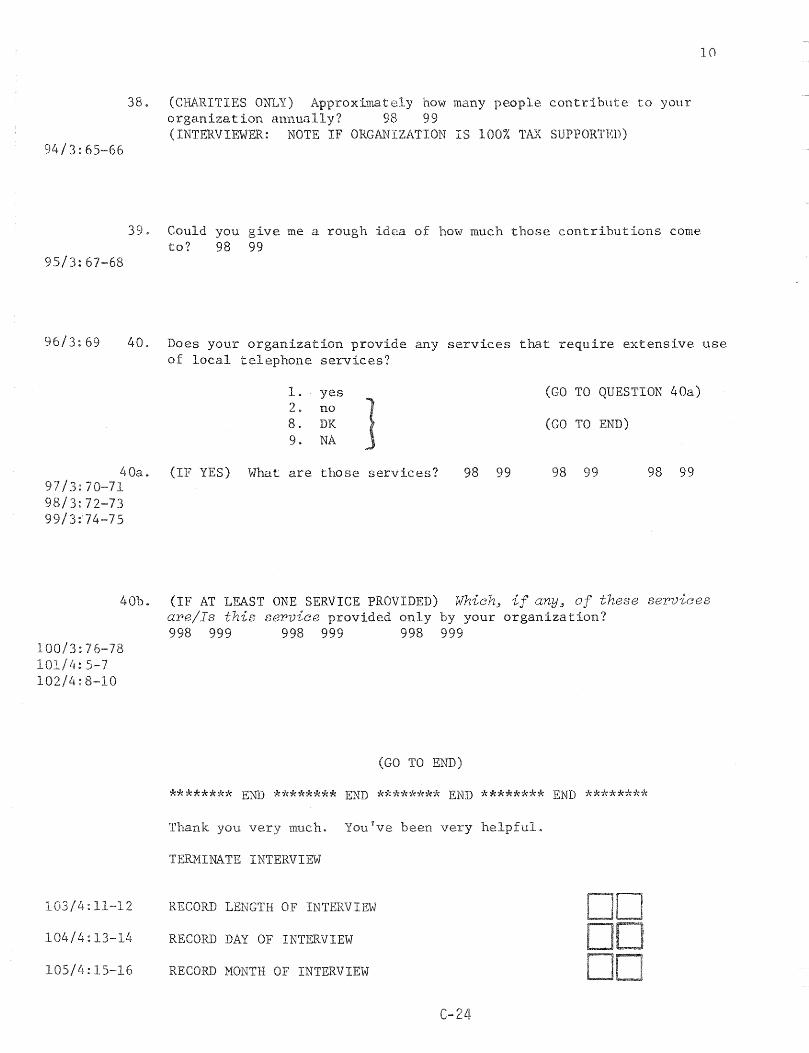
lO
38. (CHARITIES ONLY) Approximately how many people contribute to your organization annually? 98 99 (INTERVIEWER: NOTE IF ORGANIZATION IS 100% TAX SUPPORTED)
94/3:65-66
39. Could you give me a rough idea of how much those contributions come to? 98 99
95/3:67-68
96/3:69 40. Does your organizarlon provide any services that require extensive use of local telephone services?
1. yes (GO TO QUESTION 40a) 2. no
J 8. DK (GO TO END) 9. NA
40a. (IF YES) What are those services? 98 99 98 99 98 99 97/3:70-71
3:72-73 99/3:74-75
40b. (IF AT LEAST ONE SERVICE PROVIDED) Which> if any~ of these services are/Is this service provided only by your organization?
100/3:76-78 101/4:5-7 102/4:8-10
103 :11--12
104/4:13-14
105/4:15-16
998 999 998 999 998 999
(GO TO END)
'l'*****'k* END ******** END *****"~** END ******** END *'10"'***,''0'"
Thank you very much. Youfve been very helpful.
TERMINATE INTERVIEW
RECORD LENGTH OF INTERVIEW
RECORD DAY OF INTERVIEW
RECORD MONTH OF INTERVIEW
C-24

APPENDIX 0
SUMMARY OF RESULTS OF THE PILOT STUDY
D-1

Columbus Pilot Study Report
A pilot study was conducted in Columbus. The pilot study had two
purposes: (1) to test the questionnaire that would be used in the
main study in Cleveland and Cincinnati for clarity, ambiguities, etc.,
and (2) to gather data to be used in determining the sample sizes for
the main study.
The remainder of this section is devoted to reporting the data
obtained from the pilot study. The data will be presented on a
question~by-question basis with percentages reported for all data
collected and by each strata.
0-3
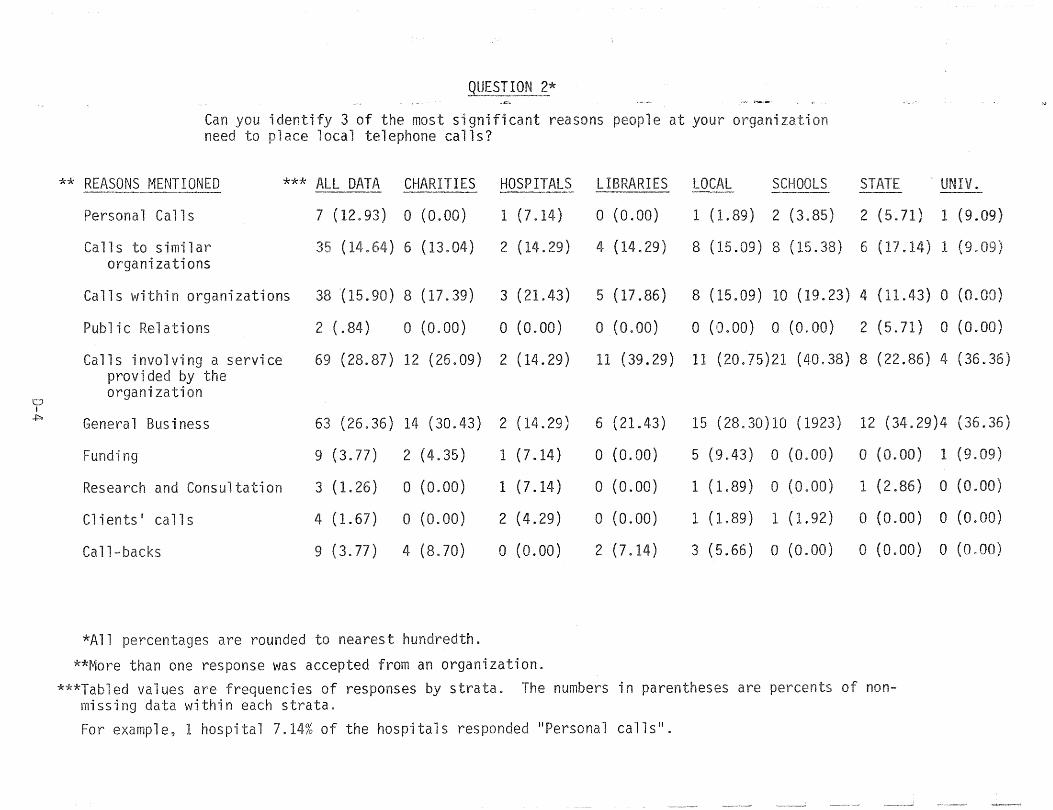
t:J i
..j::;:,
QUE~} ION 2_* .... ~-..
Can you identify 3 of the most significant reasons people at your organizatlon need to olace local telephone calls?
** REASONS MENTIONED *** ALL DATA CHARITIES HOSPITALS LIBRARIES LOCAL SCHOOLS STATE ----- -- ---
Personal Calls 7 (12.93) a (0.00) 1 (7.14) a (0.00) 1 (1.89) 2 (3.85) 2 (5.71) 1 (9.09)
Calls to similar (14. ) 6 (13.04) 2 (14.29) 4 (14.29) 8 (15.09) 8 (15.38) 6 ( .14) 1 (9~ '\ J
organizations
Calls within organizations 38 {15.90) 8 (17.39) 3 (21.43) 5 (17.86) 8 (15.09) 10 (19.23) 4 (11.43) 0 (0.
Public Relations 2 (.84) a (0.00) o (0.00) o (0.00) o (0. 00) o (0.00) 2 (5.71) a (0.00)
Calls involving a service 69 (28.87) 12 (26.09) 2 (14.29) 11 (39.29) 11 (20.75)21 (40.38) 8 (22.86) 4 (36. provided by the organization
General Business 63 (26.36) 14 (30.43) 2 (14.29) 6 (21.43) 15 (28.30)10 (1923) 12 (34.29)4 (36.36)
Funding 9 (3.77) 2 (4.35) 1 (7.14) o (0.00) 5 (9.43) a (0.00) a (0.00) 1 (9 G 09)
Research and Consultation 3 (1*26) o (0.00) 1 (7.14) a (0.00) 1 (1.89) o (0.00) 1 (2.86) a (0.00)
Clients· calls 4 (1.67) o (0.00) 2 (4.29) a (0.00) 1 (1.89) 1 (1.92) o (0.00) o (0.00)
Call-backs 9 (3.77) 4 (8.70) o (0.00) 2 (7.14) 3 (5.66) a (0.00) o (0.00) a (0.00)
*All percentages are rounded to nearest hundredth.
**More than one response was accepted from an organization. ***Tabled values are frequencies of responses by strata. The numbers in parentheses are percents of non
missing data within each strata. For example, 1 hospital 7.14% of the hospitals responded IIPersonal calls".
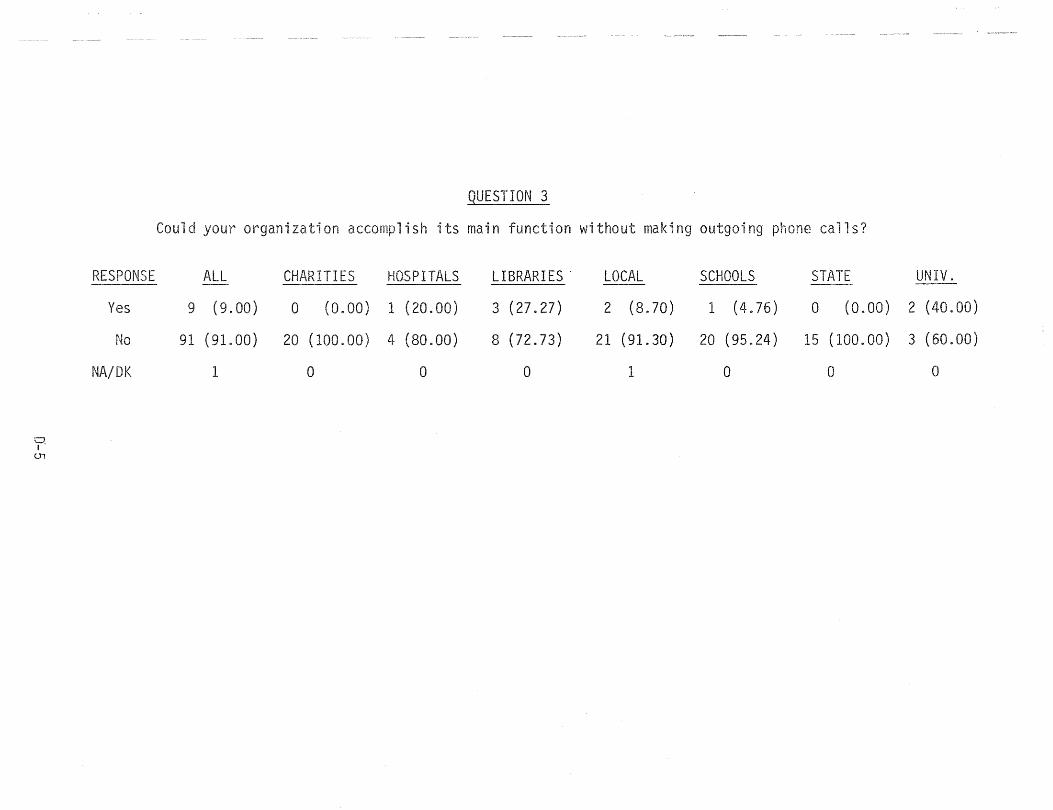
o I'
(JI
RESPONSE
Yes
No
NA/DK
QUESTION 3
Could your organization accomplish its main function without making outgoing phone calls?
ALL CHARITIES HOSPITALS
9 (9.00) a (0.00) 1 (20.00)
91 (91.00) 20 (100.00) 4 (80.00)
1 o o
LIBRARIES'
3 (27.27)
8 (72.73)
o
LOCAL SCHOOLS STATE UNIV.
2 (8.70) 1 (4.76) o (0.00) 2 (40.00)
21 (91.30) 20 (95.24) 15 (100.00) 3 (60.00)
1 o a a
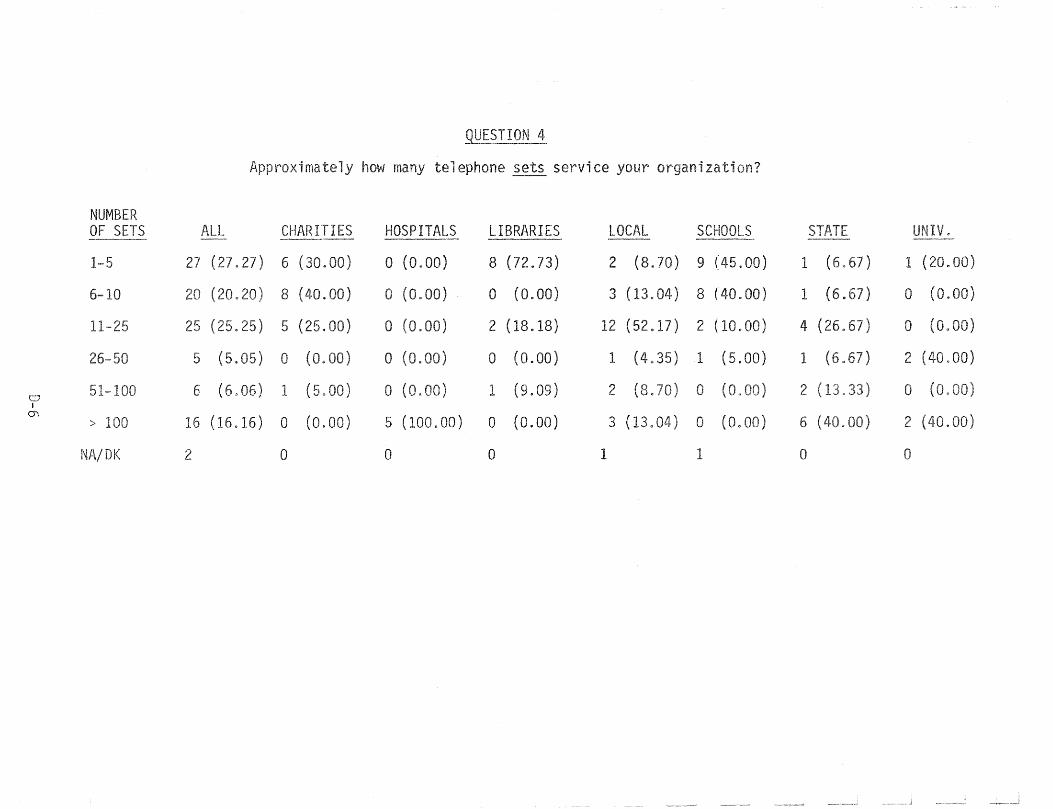
4
many telephone sets service your oroani on?
NUMBER SETS ALL IES HOSPITALS LIBRARIES LOCAL SCHOOLS STATE ----- _.- ----- ---
5 27 (27.27) 6 ( .00) o (0.00) 8 (72.73) 2 (8.70) 9 (45.00) 1 (6.67) 1 (20.
. 20) 8 (40.00) o (0 . ) 0 (0.00) 3 (13.04) 8 (40.00) 1 (6. ) 0 (0. )
1 5 ( .00) o (0.00) 2 (18.18) 12 (52.17) 2 (10.00) 4 (26 67) 0 (0
5 (5. 0 (0.00) o (0.00) 0 (0.00) 1 (4.35) 1 (5.00) 1 (6. ) 2 (40.
6 (6. 1 (5. \ o (0. ) 1 (9.09) 2 (8. ) 0 (0. ) 2 ( ) 0 (0, ) . i"" m
16 (16.16) > 1 nn 0 (0.00) 5 (100.00) a (0.00) 3 (13.04) 0 (0.00) 6 ( . ) 2 (
DK 2 a 0 0 1 1 a 0
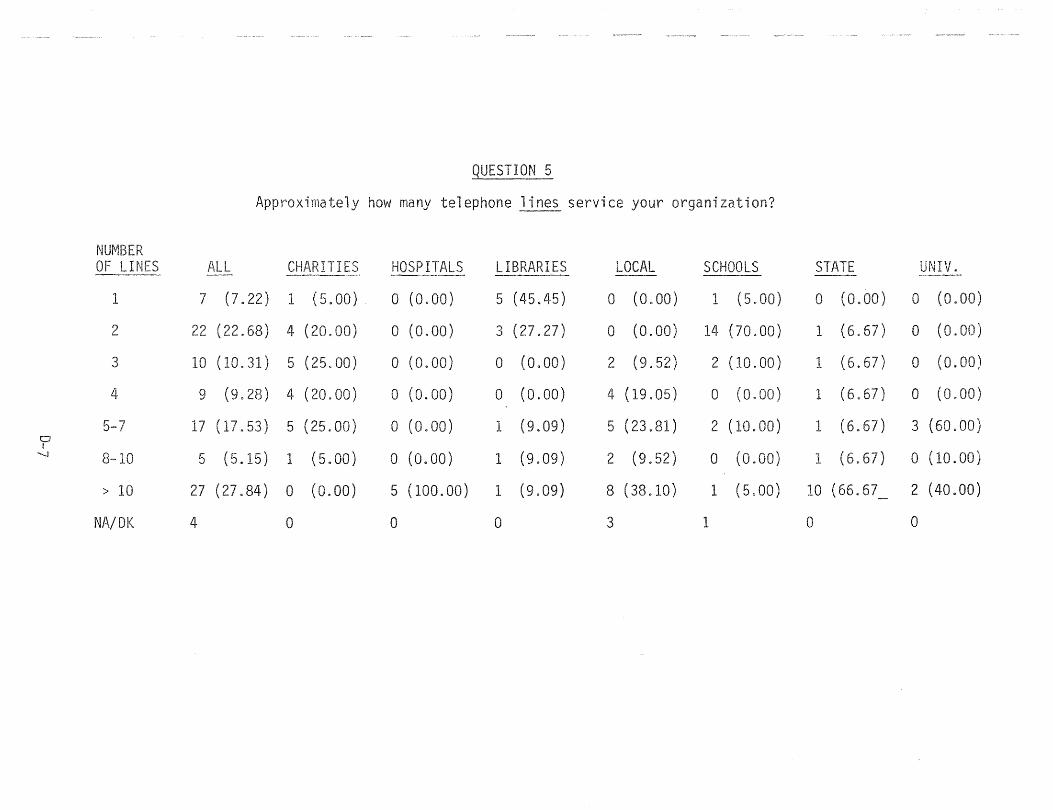
QUESTION 5
Approximately how many telephone lines service your organization?
NUMBER OF LINES ALL CHARITIES HOSPITALS LIBRARIES LOCAL SCHOOLS STATE UNIV. --- --
I 7 (7. 1 (5.00) o (0.00) 5 (45.45) 0 (0.00) 1 (5.00) a (0.00) 0 (0.00)
2 ( .68) 4 (20 00) o (0.00) 3 (27.27) a (0.00) 14 (70.00) 1 (6.67) 0 (0. )
3 10 (10. ) 5 (25.00) o (0.00) 0 (0.00) 2 (9.52) 2 (10.00) 1 (6.67) 0 (0.00)
4 9 (9.28) 4 (20.00) a (0.00) a (0.00) 4 (19.05) a (0.00) 1 (6.67) a (0.00)
7 ( .53) 5 (25.00) a (0.00) 1 (9.09) 5 (23.81) 2 (10.00) 1 (6.67) 3 (60.00) 0 I
'" () f'I 5 (5.15) 1 (5.00) a (0.00) 1 (9.09) 2 (9.52) a (0.00) "1 (6.67) a (10.00) .!.
> III 27 (27.84) 0 (0.00) 5 (100.00) 1 (9.09) 8 (38.10) 1 (5.00) 10 (66.67 2 (40.00) -
NA/DK 4 0 0 0 3 1 0 0
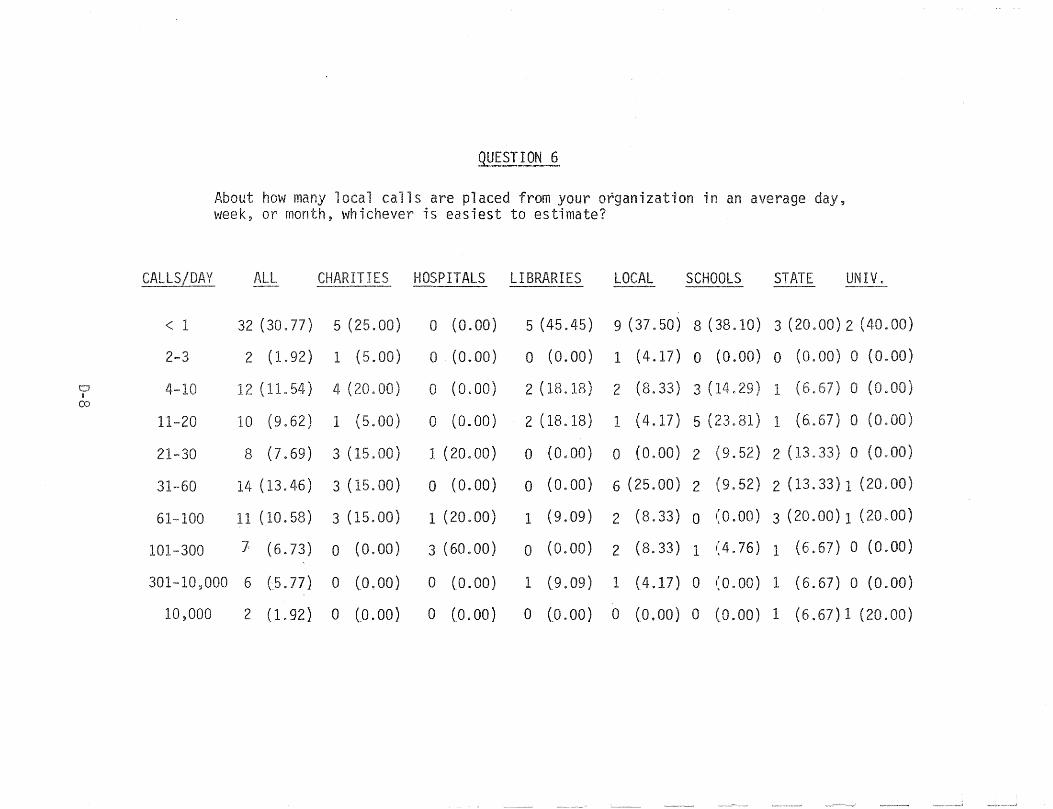
0 i
CD
CALLS/DAY
< 1
2-3
11-20
21-30
31-60
61-100
101-300
QUESTION !.
About how many local calls are placed from your organization in an average day, week, or month, whichever is easiest to estimate?
ALL CHARITIES HOSPITALS LIBRARIES LOCAL SCHOOLS STATE UNIVe ---- --- --
32 (30.77) 5 (25.00) o (0.00) 5 (45.45) 9 (37.50) 8 (38.10) 3 (20.00) 2 (40.00)
2 (1.92) 1 (5.00) o (0.00) o (0.00) 1 ( 4 . 17) 0 ( 0 . 00) 0 ( 0 . 00) 0 (0 ~ 00 )
12 (11.54) 4 (20. ) o (0.00) 2 (18.18) 2 (8.33) 3 ( .29) 1 (6. ) 0 (0
10 (9.62) 1 (5. 00) o (0.00) 2 (18.18) 1 ( 4. 17) 5 (23.81) 1 ( 6,.67) 0 (0. 00 )
8 (7.69) 3 (15.00) 1 (20.00) o (0.00) o ( 0 . 00) 2 ( 9 . 52) 2 (13. 33) 0 (0. 00 )
14 (13.46) 3 (15.00) o (0. 00) a (0.00) 6 (25.00) 2 (9.52) 2 (13.33) 1 (20.00)
11 (10.58) 3 (15. 00) 1 (20.00) 1 (9.09) 2 ( 8. 33) 0 ( a .00) 3 (20.00) 1 (20. 00 )
7, (6.73) o (0. 00) 3 (60.00) o (0. 00) 2 ( 8. 33) 1 ( 4 . 76) 1 ( 6 . 67) 0 (0. 00 )
301-10,000 6 (5.77) o (o.oo) a (0.00) 1 (9. 09) 1 (4.17) a ( 0 . 00) 1 ( 6 . 67) 0 (0. 00 )
10,000 2 (1.92) ° CO.OO) a (0. 00) a (0.00) o ( ° . 00) a (0. 00 ) 1 ( 6 . 67) 1 (20. 00)
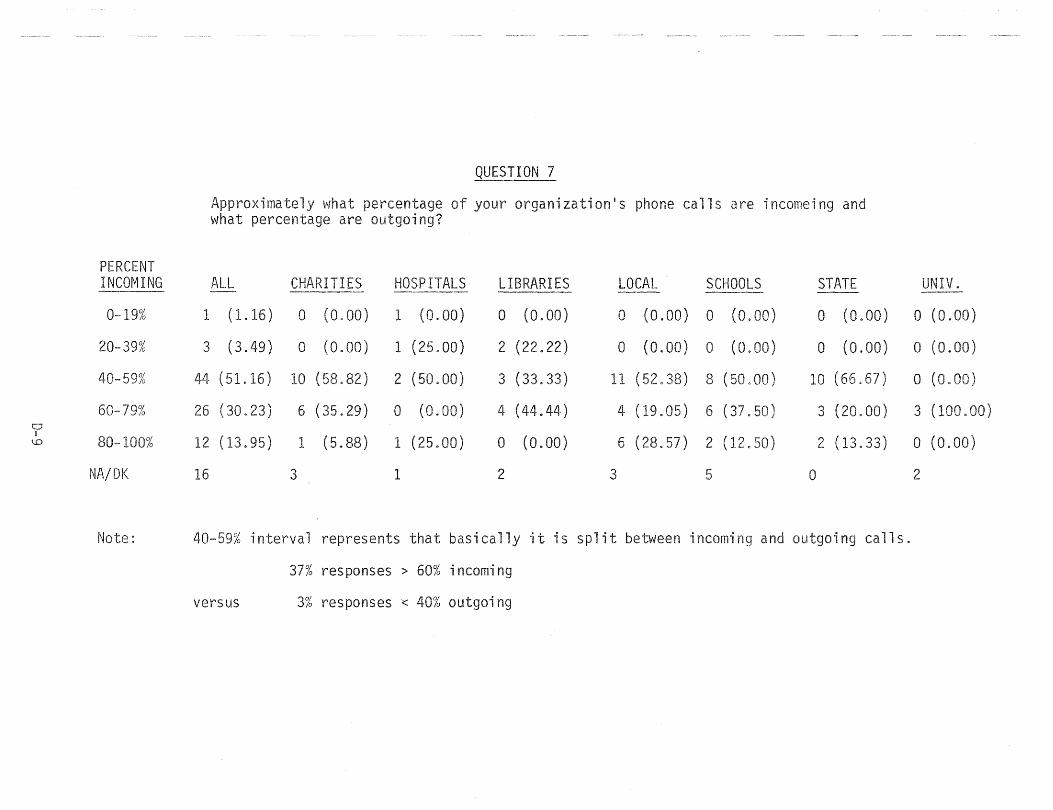
.QUESTION 7
Approximately what percentage of your organizationis phone calls are incomeing and what percentage are outgoing?
PERCENT INCOMING ALL CHARITIES HOSPITALS LIBRARIES LOCAL SCHOOLS STATE UNIV. --
19% 1 ( 1. 16) a (0. 1 (0.00) 0 (0.00) a (0.00) a (0.00) 0 (0.00) o (0.00)
20-39% 3 (3.49) 0 (0.00) 1 (25.00) 2 (22.22) a (0.00) a (0. ) a (0.00) a (0.00)
(51.16) 10 (58.82) 2 (50.00) 3 (33.33) 11 (52.38) 8 (50.00) 10 (66.67) o (0.
60- 26 (30.23) 6 (35.29) a (0.00) 4 (44.44) 4 (19.05) 6 (37.50) 3 (20.00) 3 (100.00) 0 I ill RIl- (13.95) l (5.88) 1 (25.00) 0 (0.00) 6 (28.57) 2 (12. ) 2 (13.33) a (0.00)
NA/DK 16 3 1 2 3 5 0 2
Note: 40-59% interval represents that basically it is split between incoming and outgoing calls.
37% responses> 60% incoming
versus 3% responses < 40% outgoing
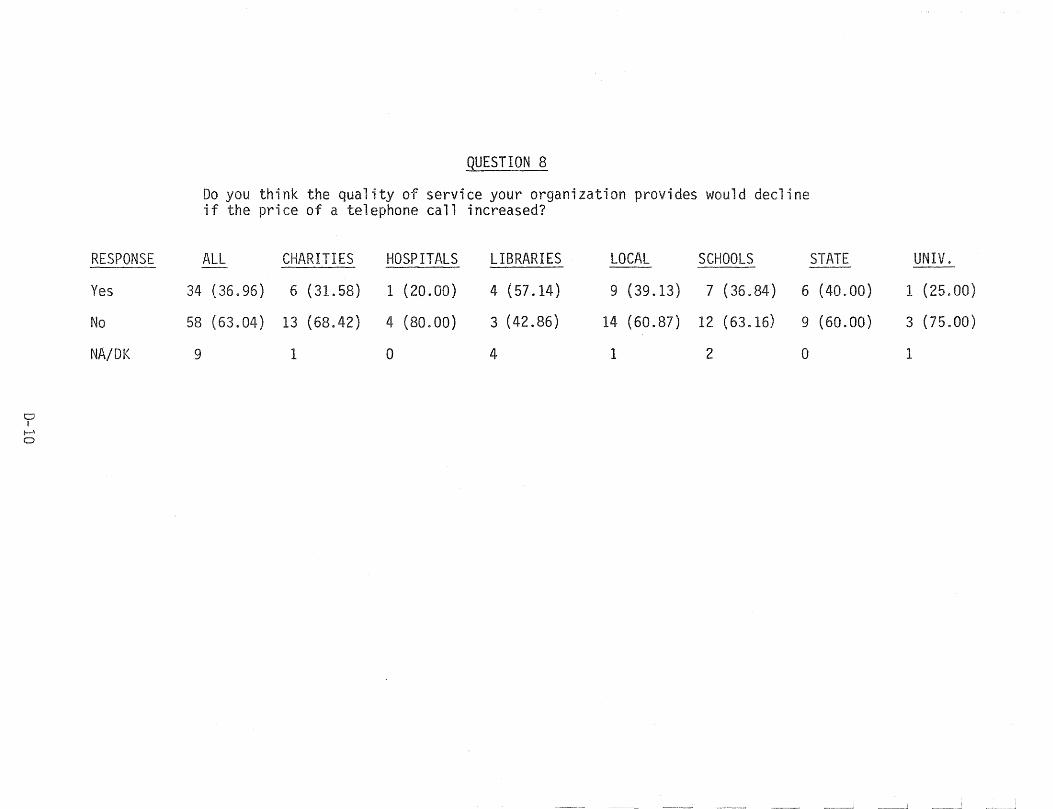
CJ I
1--' o
RESPONSE
Yes
No
NA/DK
QUESTION 8
Do you think the quality of service your organization provides would decline if the price of a telephone call increased?
ALL CHARITIES HOSPITALS LIBRARIES LOCAL SCHOOLS STATE UNIV.
34 (36.96) 6 (31.58) 1 (20.00) 4 (57.14) 9 (39.13) 7 (36.84) 6 (40.00) 1 (25.00)
58 (63.04) 13 (68.42) 4 (80.00) 3 (42.86) 14 (60.87) 12 (63.16) 9 (60.00) 3 (75.00)
9 1 0 4 1 2 0 1

QUESTION 9
what percentage of your organ; on s local 1 i
are business?
PERCENT ES HOSPITALS LIBRARIES LOCAL ----- ----- ---
3 (3.30) 1 (5. o (0 00) o (0.00) 1 (4.55) o (0. 1 (6.67) o (0.
1- (24.18) 8 (42.11) a (0.00) 4 (36.36) 3 ( .64) 2 ( 4 f , \ .67) 1 (
3 (5.26) 2 ( 2 (18.18) 8 (36.36) 5 (31. (13. ) o (0.
lU/o 19 ( .88) 5 ( .32) 1 ( .00) 2 (18.18) 5 (22.73) 2 ( 3 (20.00) 1 ( . ) f-' I-' 3 (3.30) a (0.00) a (0. 00) 1 (9.09) o (0.00) o (0. 1 (6. 1 (25. )
16 (17.58) 2 (18.18) a (0.00) 2 (18.18) 4 (18.18) 4 (25. 4 (26. a (0.00)
40- 3 (3.30) a (0.00) a (0.00) a (0.00) a (0.00) 2 ( o (0.00) 1 (25.00)
1 (1. ) a (0.00) o (0.00) a (0.00) a (0. 00) 1 (6.25) a (0.00) a (0.00)
80- 2 (2.20) a (0.00) 1 (25.00) o (0.00) 1 (4.55) o (0. o (0.00) o (0.00)
NA/DK 10 1 1 0 2 5 0 1
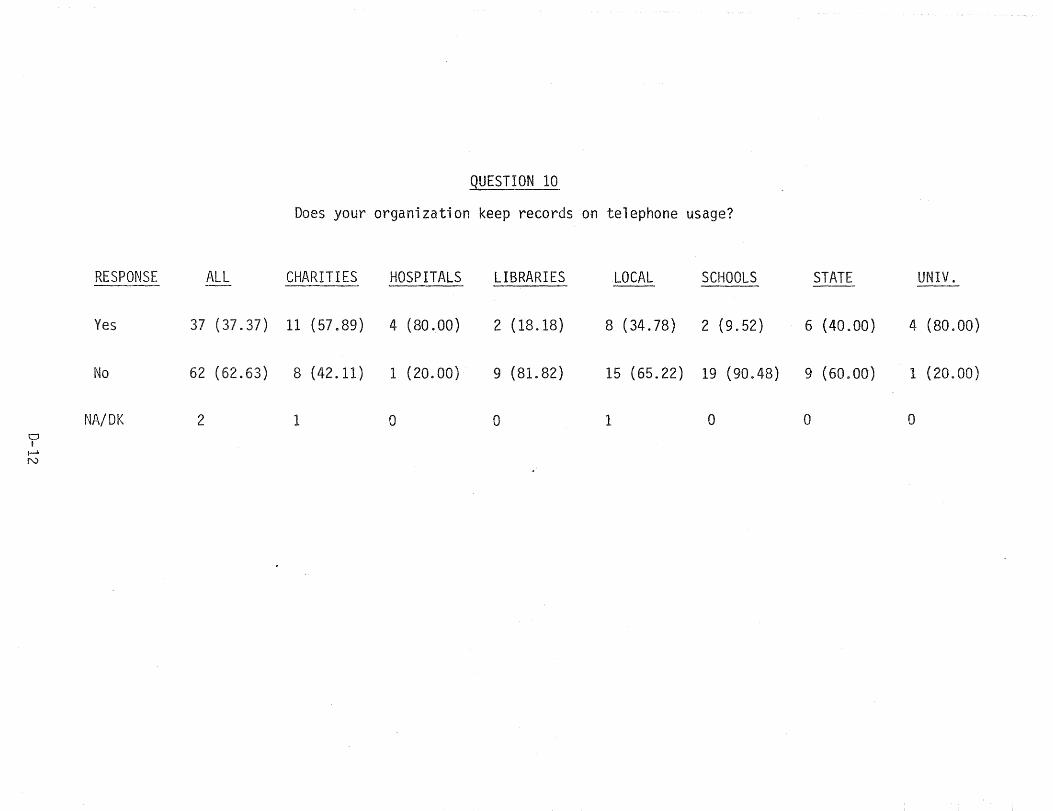
QUESTION 10
Does your organization keep records on telephone usage?
RESPONSE ALL CHARITIES HOSPITALS LIBRARIES LOCAL SCHOOLS STATE UNIV. --- ---
Yes 37 (37.37) 11 (57.89) 4 (80.00) 2 (18.18) 8 (34.78) 2 (9.52) 6 (40.00) 4 (80.00)
No 62 (62.63) 8 (42.11) 1 (20.00) 9 (81.82) 15 (65.22) 19 (90.48) 9 (60.00) 1 (20.00)
NA/DK 2 1 0 0 1 0 0 0 0 I
I-' N
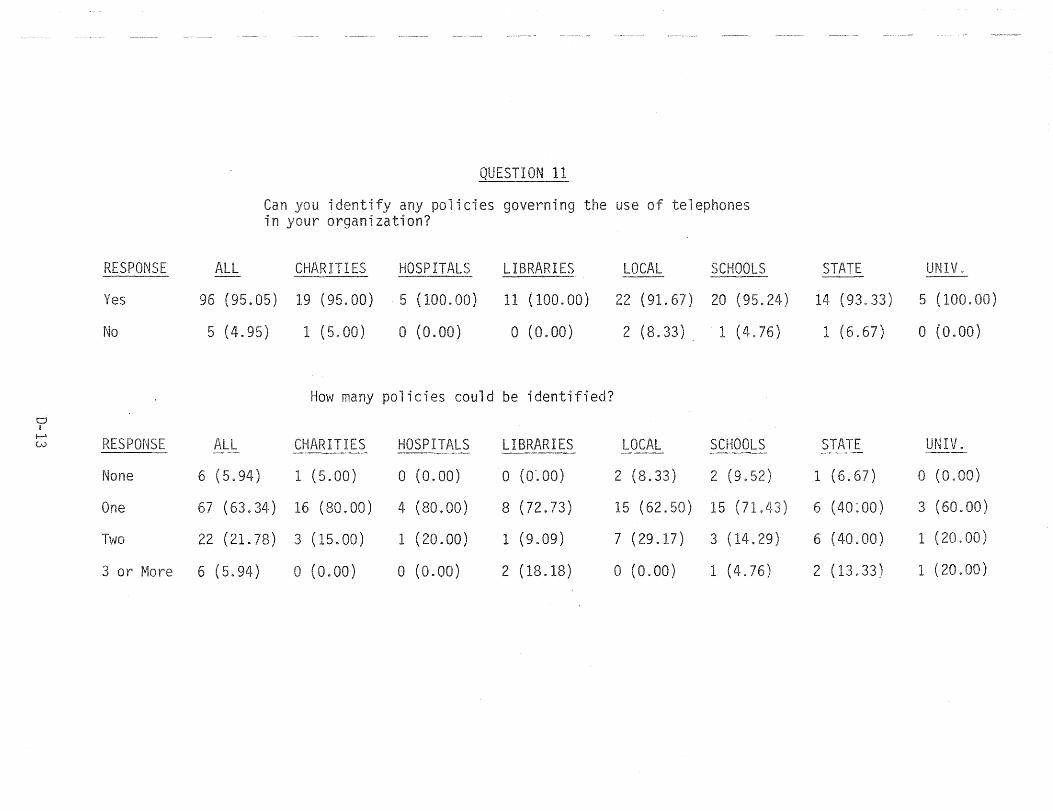
QUESTION 11
Can i fy any pol; es governing the use of ephones in your organization?
RESPONSE ALL CHARITIES HOSPITALS LIBRARIES LOCAL SCHOOLS STATE UNIV.
Yes (95.05) (95.00) 5 (100.00) 11 (100.00) 22 (91. ) 20 (95.24) 14 (93. 5 (
No 5 (4.) 1 (5.00) a (0.00) a (0.00) 2 (8.33). 1 (4.76) 1 (6.67) o (0.00)
How many policies could be identified? 0 I
I--'
RESPONSE ALL CHARITIES HOSPITALS LIBRARIES LOCAL SCHOOLS w ----- -.- -----> -- ----""-_.
None 6 (5.94) 1 (5.00) a (0.00) a (0".00) 2 (8.33) 2 (9. ) 1 (6.67) o (0.00)
One 67 (63.34) (80.00) 4 (80.00) 8 (72.73) 15 (62.50) 15 (71. 6 (40:00) 3 (60.00)
Two 22 (21.78) 3 (15.00) 1 (20.00) 1 (9.09) 7 (29.17) 3 (14.29) 6 (40.00) 1 (20. 00)
3 or 6 (5.94) o (0.00) o (0.00) 2 (18.18) a (0.00) 1 (4. , 2 (13.33) 1 (20. 00) j
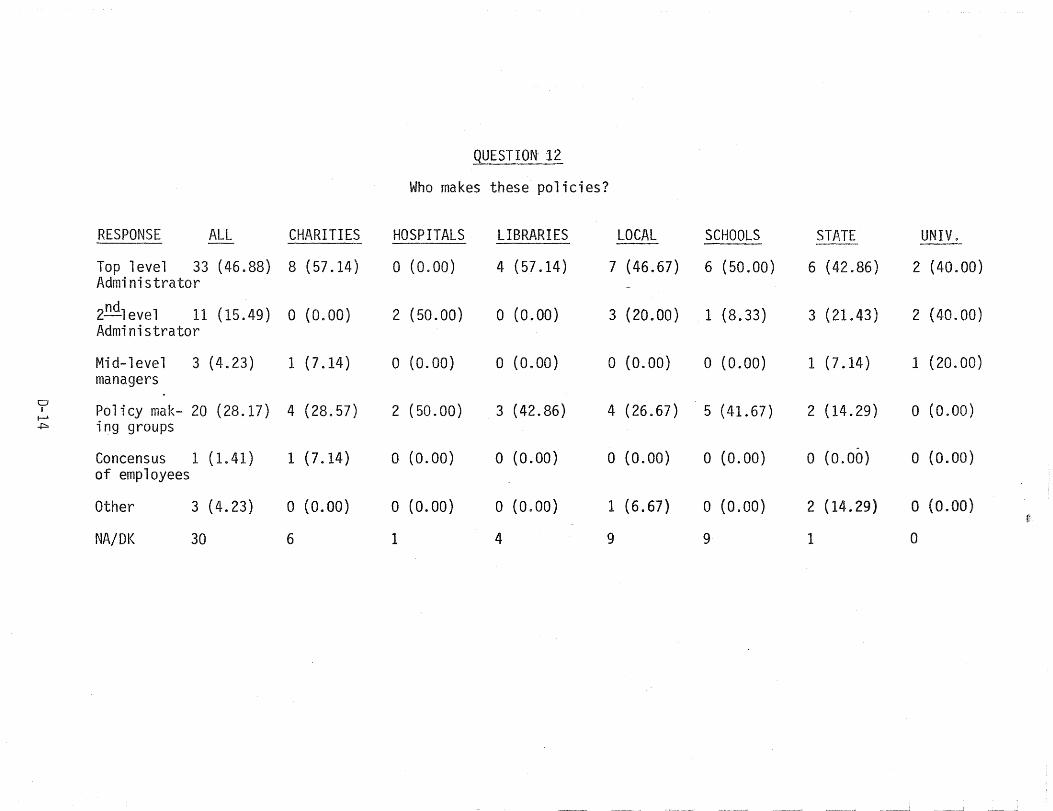
QUESTION 12
Who makes these policies?
RESPONSE ALL CHARITIES HOSPITALS LIBRARIES LOCAL SCHOOLS STATE UNIV. ----Top level 33 (46.88) 8 (57.14) o (0.00) 4 (57.14) 7 (46.67) 6 (50.00) 6 (42.86) 2 (40.00) Administrator
2ndlevel 11 (15.49) o (0.00) 2 (50.00) o (0.00) 3 (20.00) 1 (8.33) 3 (21.43) 2 (40.00) Administrator
Mid-level 3 (4.23) 1 (7.14) o (0.00) a (0.00) o (0.00) o (0.00) 1 (7.14) 1 (20. 00) managers
0 Policy mak- 20 (28.17) 4 (28.57) 2 (50.00) 3 (42.86) 4 (26.67) 5 (41.67) 2 (14.29) a (0.00) I I-' ~ ing groups
Concensus 1 (1.41) 1 (7.14) o (0.00) a (0.00) a (0.00) a (0.00) a (0.00) a (0.00) of employees
Other 3 (4.23) a (0.00) a (0.00) o (0.00) 1 (6.67) a (0.00) 2 (14.29) a (0.00) If
NA/DK 30 6 1 4 9 9 1 a
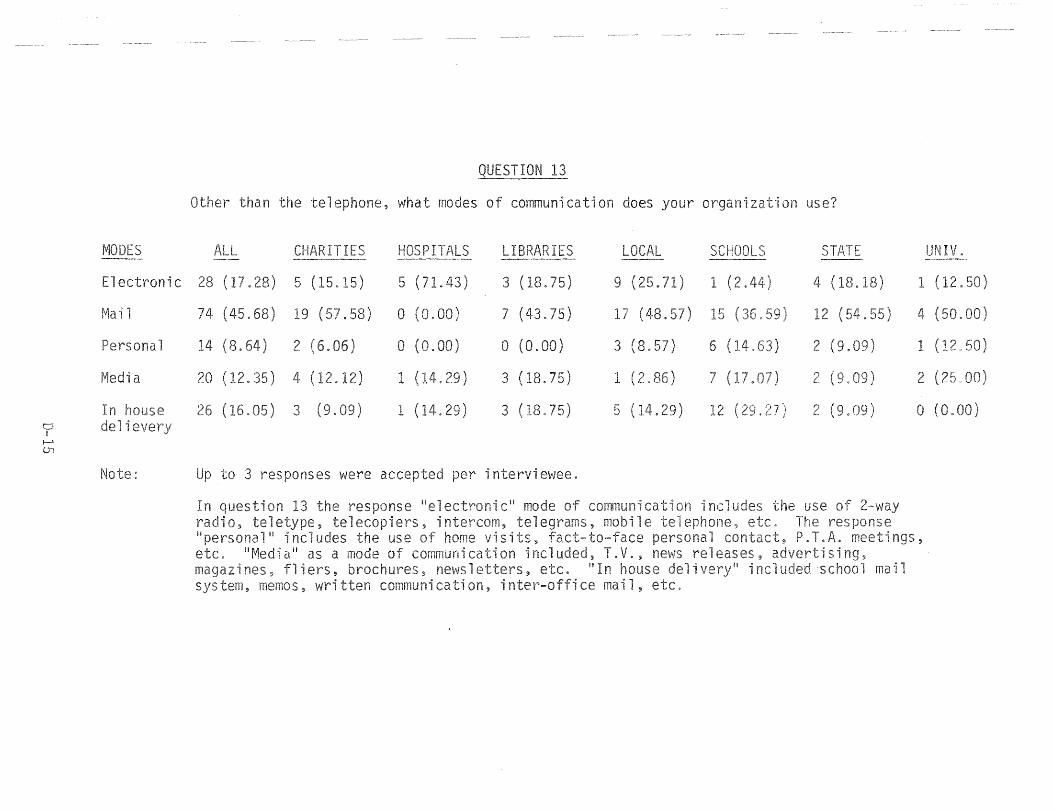
to 3 es were i ewee.
on, i
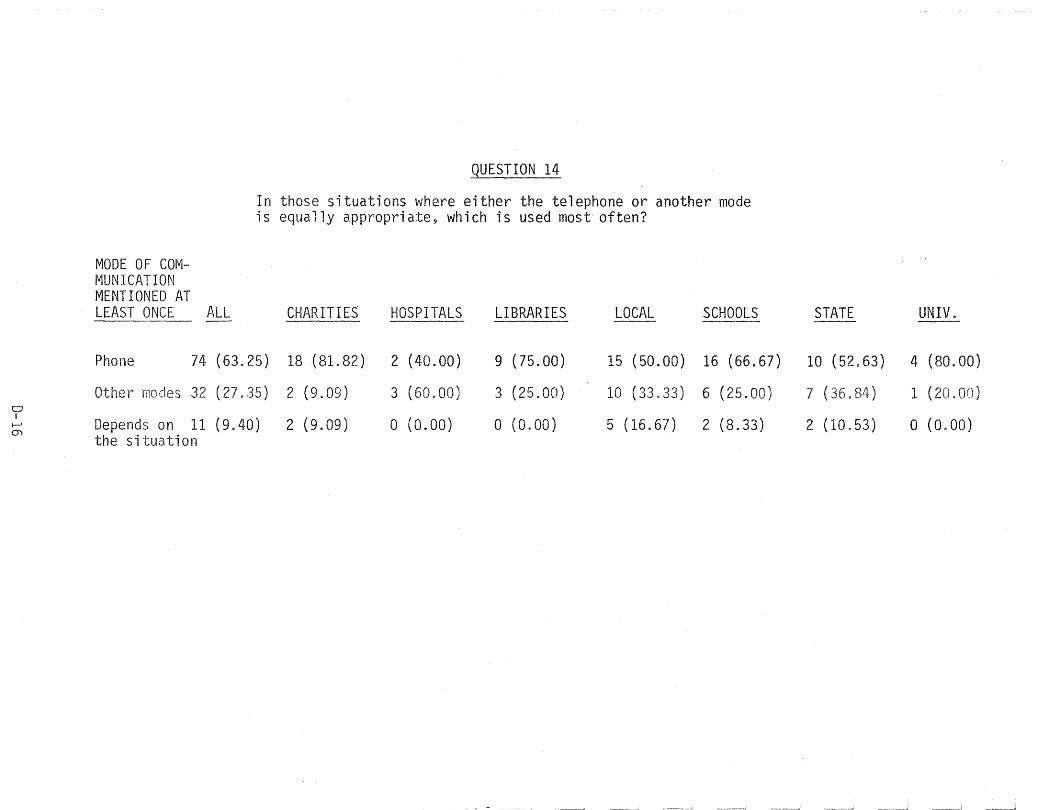
CJ I
j-J
01
MODE OF COM-MUNICATION MENTIONED AT LEAST ONCE
Phone
Other
Depends on
QUESTION 14
In those situations where either the telephone or another mode is equally appropriate, which is used most often?
ALL CHARITIES HOSPITALS LIBRARIES LOCAL SCHOOLS
74 (63.25) 18 (81. 82) 2 (40.00) 9 (75.00) 15 (50.00) 16 (66.67)
(27. ) 2 (9.09) 3 (60.00) 3 (25.00) 10 (33 . .33) 6 (25.00)
11 (9.40) 2 (9.09) o (0.00) o (0.00) 5 (16.67) 2 (8.33) the situation
STATE UNIV.
10 (52.63) 4 (80.00)
7 ( ) 1 ( \
)
2 (10.53) o (0.00)
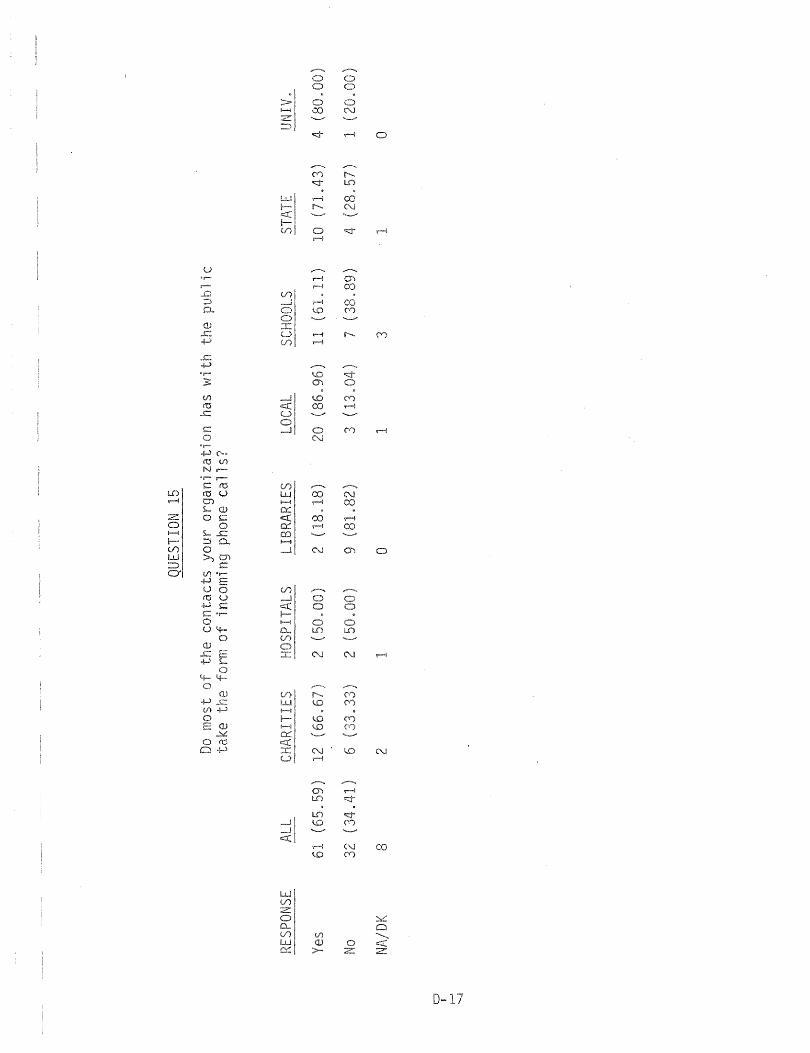
o
~
U ,-"I \--1
"...-j
....... , ....... M
.-I
C ,,-1 0
(',,'
Vi
LO .-I
Z 0 1---1
~I C'J O'l 0
0'1
N N
co
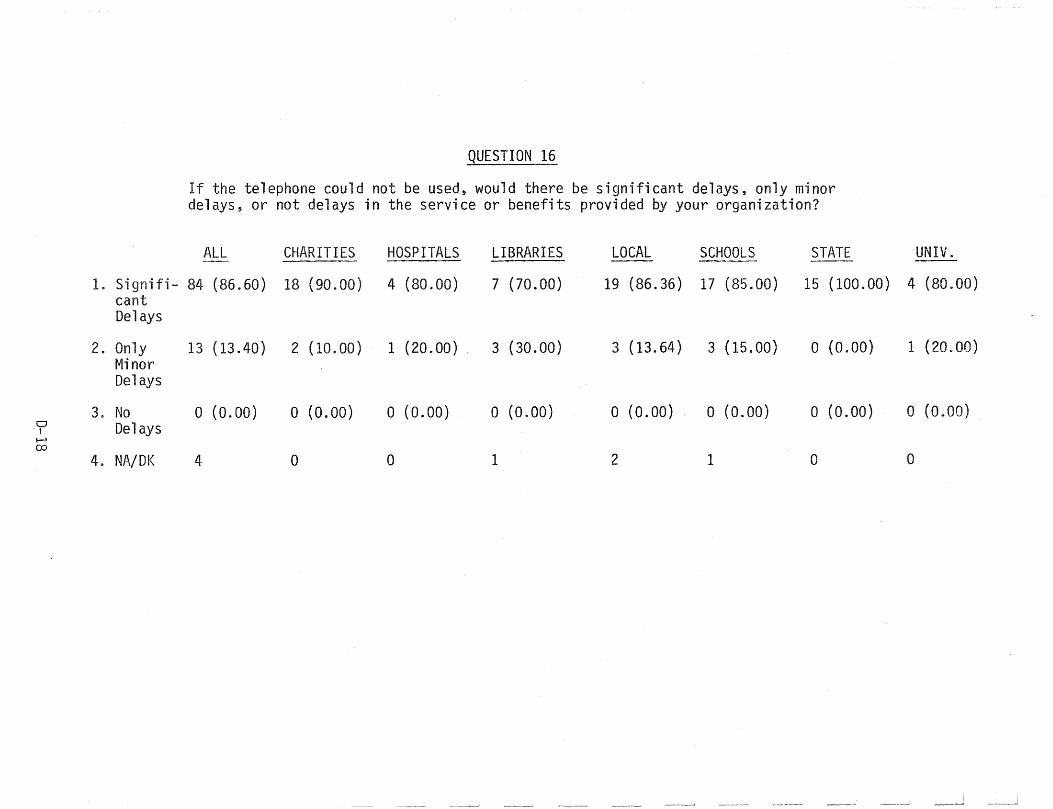
Cl I
I-' co
QUESTION 16
If the telephone could not be used, would there be significant delays, only minor delays, or not delays in the service or benefits provided by your organization?
ALL CHARITIES HOSPITALS LIBRARIES LOCAL SCHOOLS STATE --- ---
I. Signifi- 84 (86.60) 18 (90.00) 4 (80.00) 7 (70.00) 19 (86.36) 17 (85.00) 15 (100.00) cant Delays
2. Only 13 (13.40) 2 (10.00) 1 (20.00) 3- (30.00) 3 (13.64) 3 (15.00) o (0.00) Minor Delays
3. No o (0.00) a (0.00) a (0.00) o (0.00) a (0.00) a (0.00) a (0.00) Delays
4. NA/DK 4 0 a 1 2 1 0
UNIV ..
4 (80.00)
1 (20.00)
o (0.00)
0
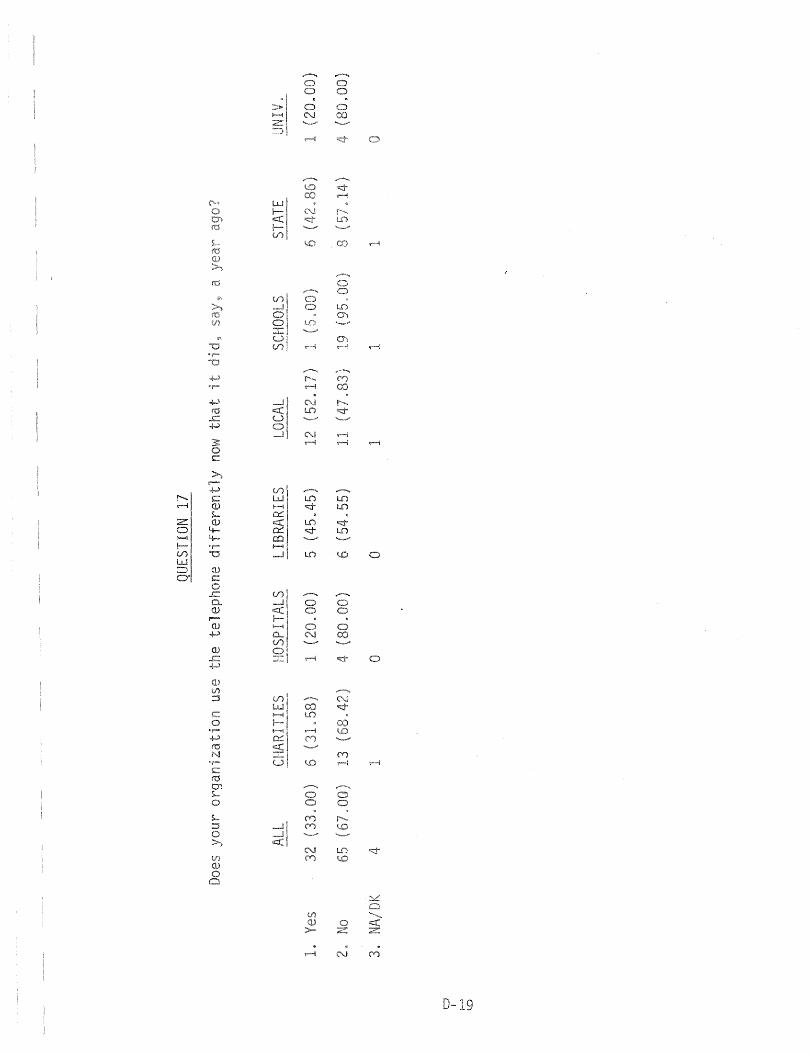
.p
~I
o
o
o
0-
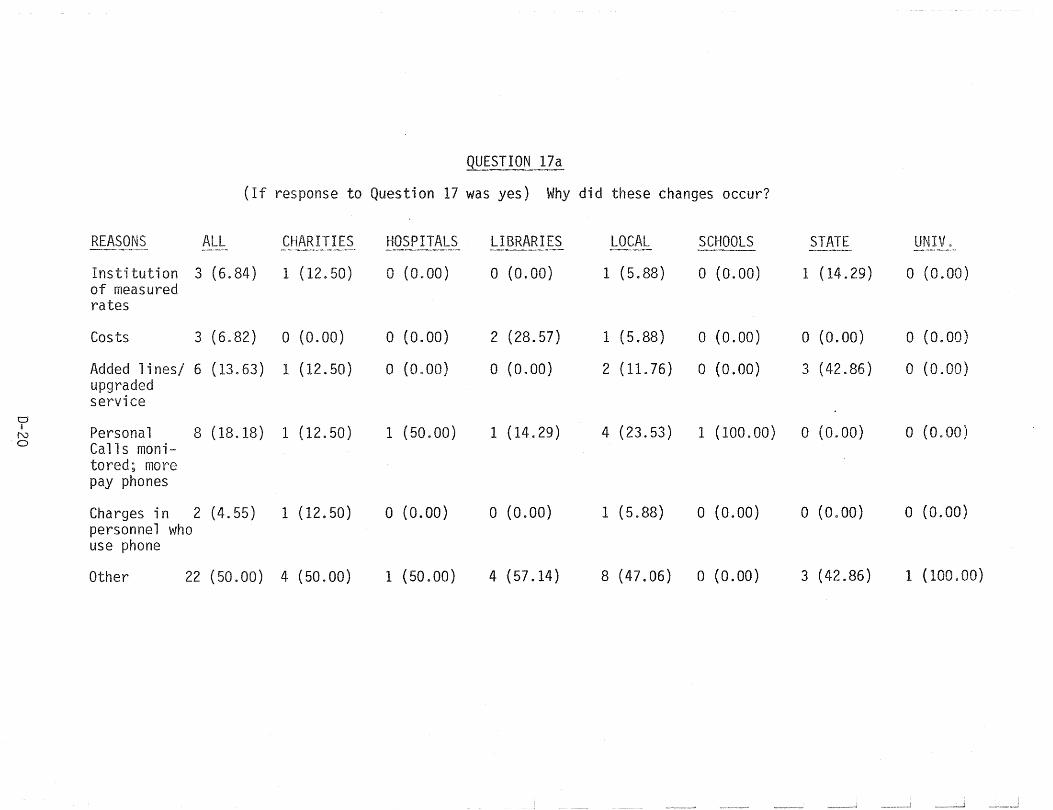
QUESTION 17a
(If response to Question 17 was yes) Why did these changes occur?
REASONS ALL CHARITIES HOSPITALS LIBRARIES LOCAL SCHOOLS STATE UNIV. -- ----Institution 3 (6.84) 1 (12.50) a (0.00) o (0.00) 1 (5.88) a (0.00) 1 (14.29) a (0.00) of measured rates
Costs 3 (6.82) a (0.00) o (0.00) 2 (28.57) 1 (5.88) o (0.00) a (0.00) o (0.00)
Added linesj 6 (13.63) 1 (12.50) o (0.00) o {a. 00) 2 (11.76) a (0.00) 3 (42.86) o (0.00) upgraded service
CJ i Personal 8 (18.18) 1 (12.50) 1 (50.00) 1 (14.29) 4 (23.53) 1 (100.00) a (0.00) o (0.00) N
0 Calls moni-tored; more pay phones
Charges in 2 (4.55) 1 (12.50) a (0.00) a (0.00) 1 (5.88) a (0.00) a (0.00) a (0.00) personnel who use phone
Other 22 (50.00) 4 (50.00) 1 (50.00) 4 (57.14) 8 (47.06) a (0.00) 3 (42.86) 1 (100.00)
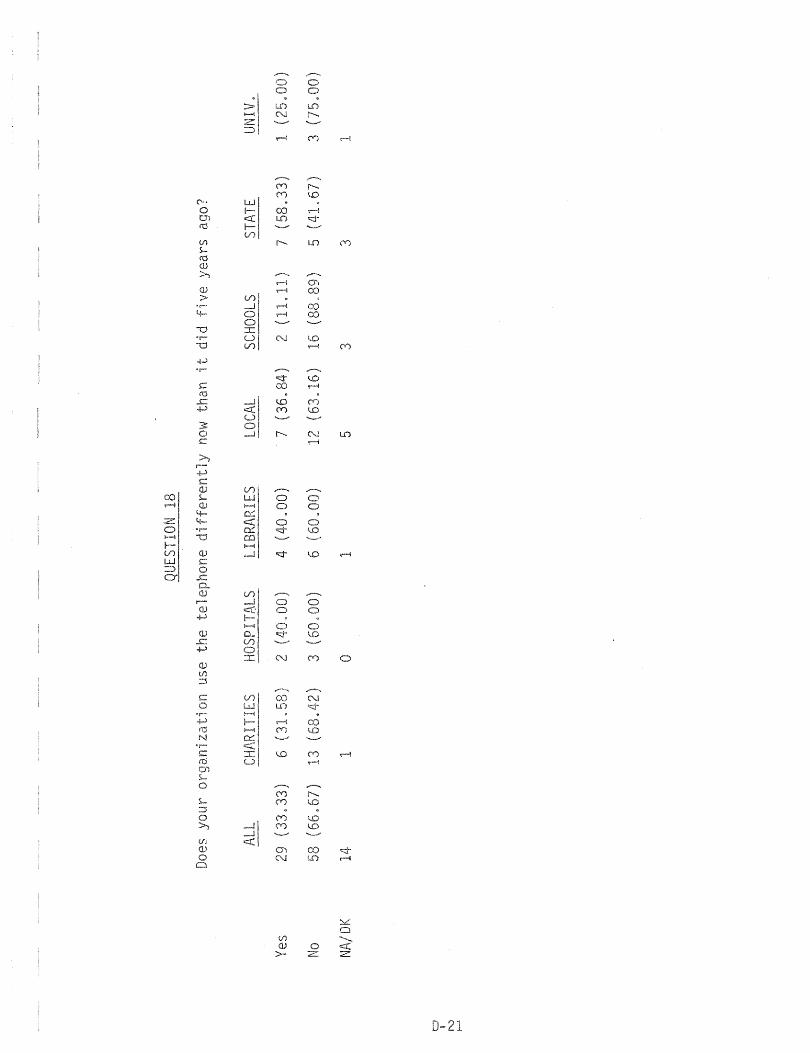
r--.. (V)
....-l Q) ,-. >
.-l
....-l
-a N
M
+-'
N
N M 0 OJ tf}
:'3
C 0
.-l
i..O M ....-l ....-l
$...
21
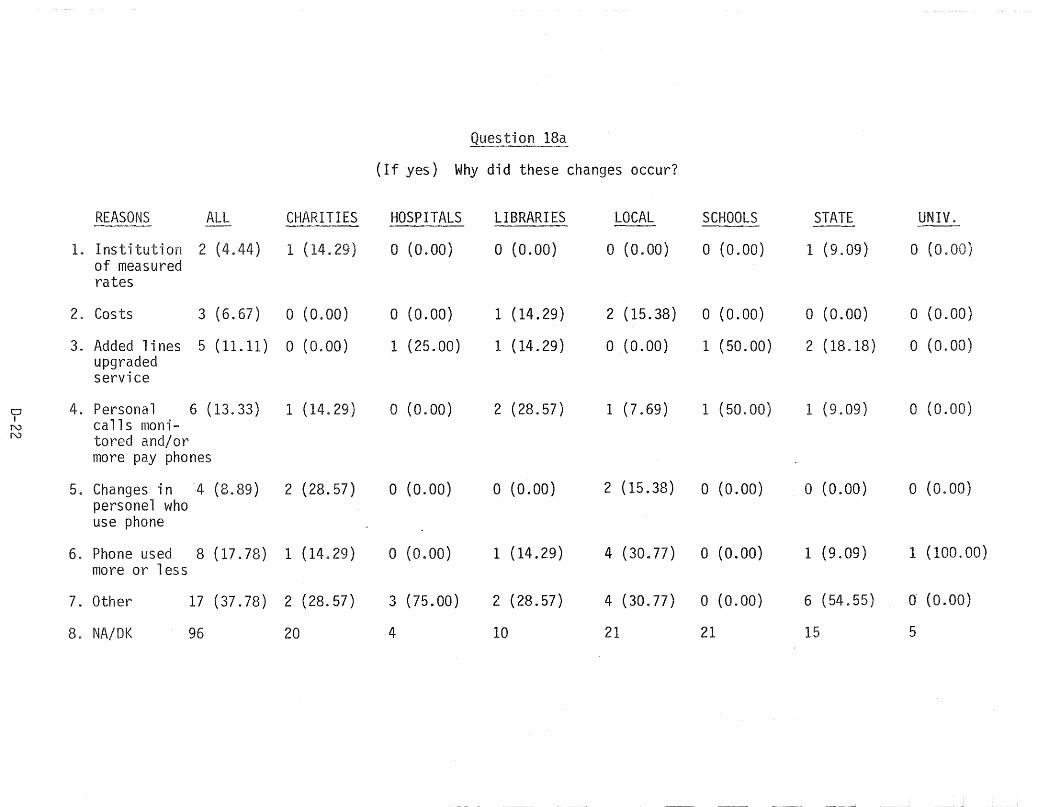
.Question 18a
(If yes) Why did these changes occur?
REASONS ALL CHARITIES HOSPITALS LIBRARIES LOCAL SCHOOLS STATE UNIV. ---I. Institution 2 (4.44) 1 (14.29) o (0.00) a (0.00) a (0.00) a (0.00) 1 (9.09) o (Oc
of measured rates
2. Costs 3 (6.67) a (0.00) o (0.00) 1 (14.29) 2 (15.38) a (0.00) a (0.00) a (0.00)
3. Added lines 5 (11.11) a (0.00) 1 (25.00) 1 (14.29) a (0.00) 1 (50. 00) 2 (18.18) a (O~OO) upgraded service
CJ 4. Personal 6 (13.33) 1 (14.29) a (0.00) 2 (28.57) 1 (7.69) 1 (50. 00) 1 (9. 09) o (0.00) , calls moni-N
N tored and/or more pay phones
5. Changes in -4 (8.89) 2 (28.57) o (0.00) a (0.00) 2 (15.38) o (0.00) o (0.00) a (0.00) personel who use phone
6. Phone used 8 (17.78) 1 (14.29) o (0.00) 1 (14.29) 4 (30 .. 77) o (0.00) 1 (9.09) 1 (100.00) more or less
7. Other 17 (37.78) 2 (28.57) 3 (75.00) 2 (28.57) 4 (30.77) o (0.00) 6 (54.55) 0' (0.00)
8. NA/DK 96 20 4 10 21 21 15 5
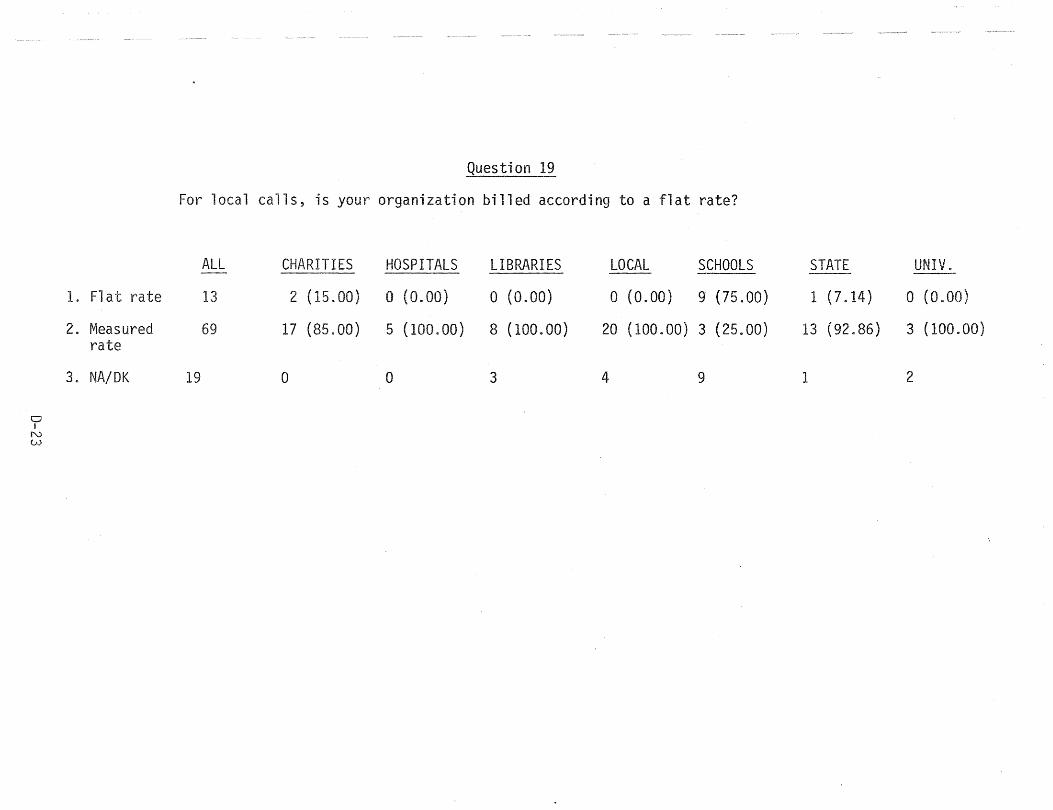
Question 19
For local calls, is your organization billed according to a flat rate?
ALL CHARITIES HOSPITALS LIBRARIES LOCAL SCHOOLS STATE UNIV. ---I. Flat rate 13 2 (15.00) o (0.00) o (0.00) o (0.00) 9 (75.00) 1 (7.14) o (0.00)
2. Measured 69 17 (85.00) 5 (100.00) 8 (100.00) 20 (100.00) 3 (25.00) 13 (92.86) 3 (100.00) rate
3. NA/DK 19 0 0 3 4 9 1 2
a I
N W
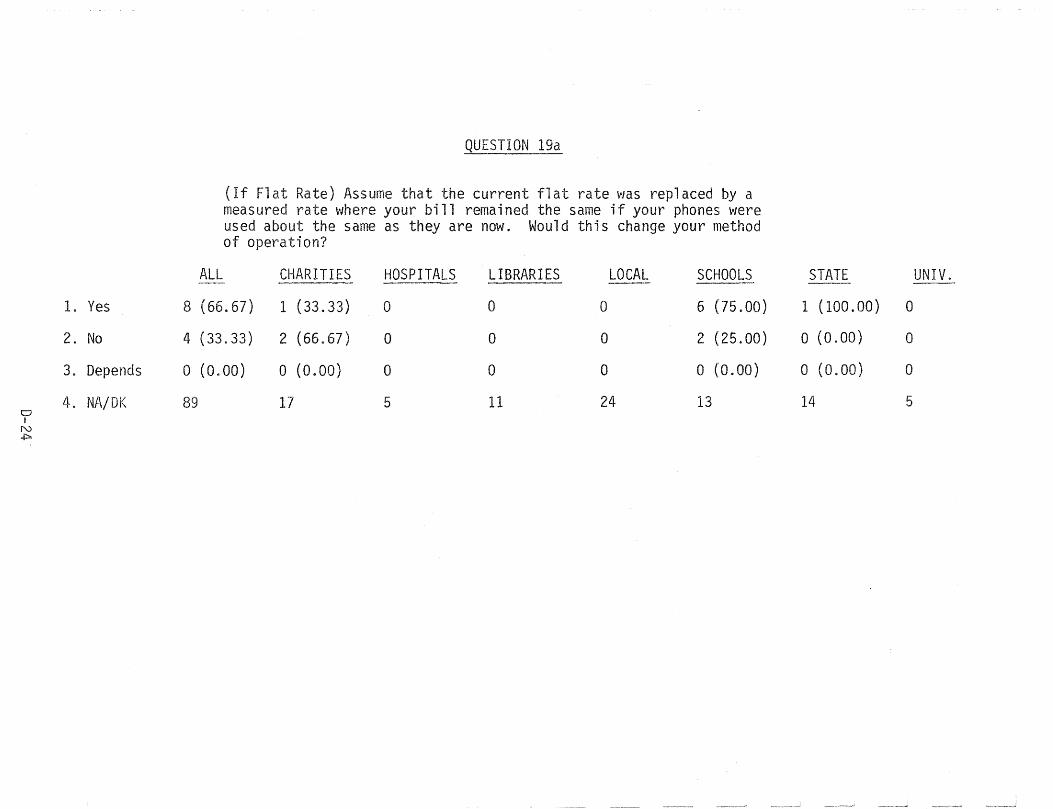
QUESTION 19a
(If Flat Rate) Assume that the current flat rate was replaced by a measured rate where your bill remained the same if your phones were used about the same as they are now. Would this change your method of operation?
ALL CHARITIES HOSPITALS LIBRARIES LOCAL SCHOOLS STATE UNIV. --- ---
I. Yes 8 (66.67) 1 (33.33) 0 0 0 6 (75.00) 1 (100.00) a
2. No 4 (33.33) 2 (66.67) a a a 2 (25. 00) a (0.00) a
3. Depends o (0.00) a (0.00) 0 0 a a (0.00) a (0.00) a
0 4. NA/DK 89 17 5 11 24 13 14 5
I N ..j::::>
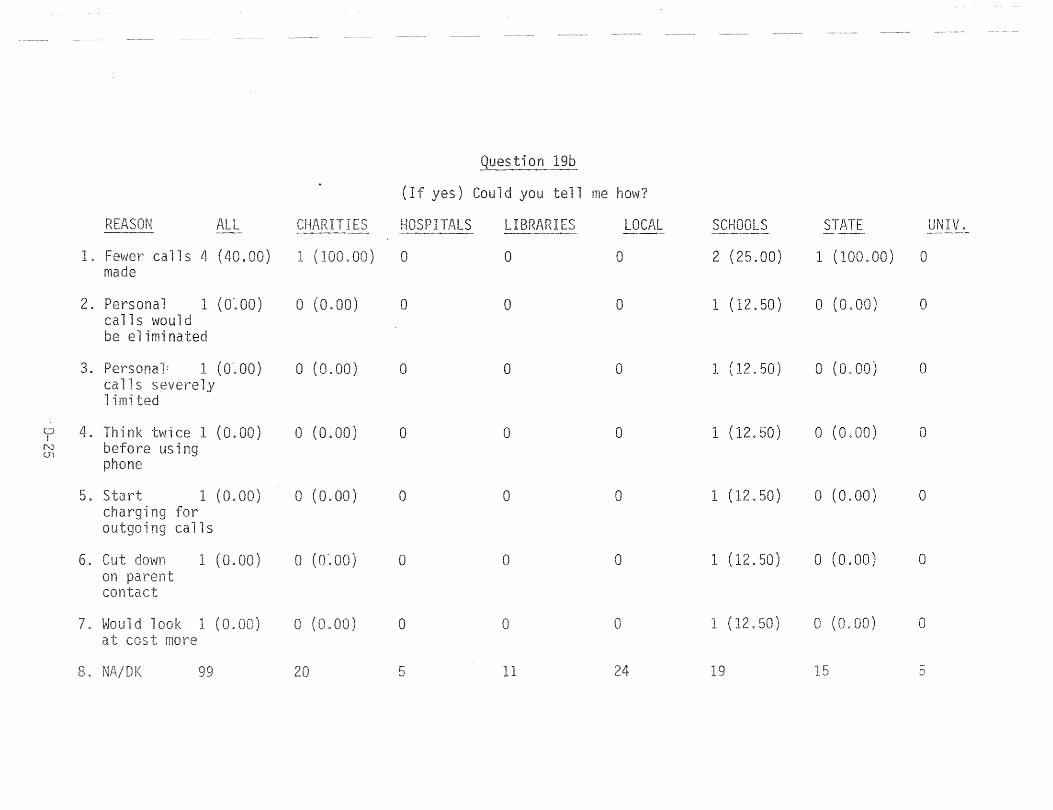
guestion 19b
(If yes) Could you tell me
LIBRARI LOCAL ----- ----. - -.-
1. calls 4 ( . ) 1 0 a 0 c~ ( .00) 1 .00) 0 made
2. 1 (0".00) o (0.00) 0 a 0 1 (12.50) o (0. 0
3. 1 (0".00) a (0.00) a a 0 1. (12.50) o (0.00) 0 y
4. ink ce 1. (0 o (0.00) 0 0 0 1 (12. o (0. ) 0 ~
N <.n
5. 1 (0. o (0.00) 0 0 0 1 (12. ) o (0.00) 0
ls
6. 1 (0. o (0",00) 0 0 0 1 ) o (0 <,00) 0
7. (0. o (0. o o a 1 ( . o (0. o
8. 5 1 5
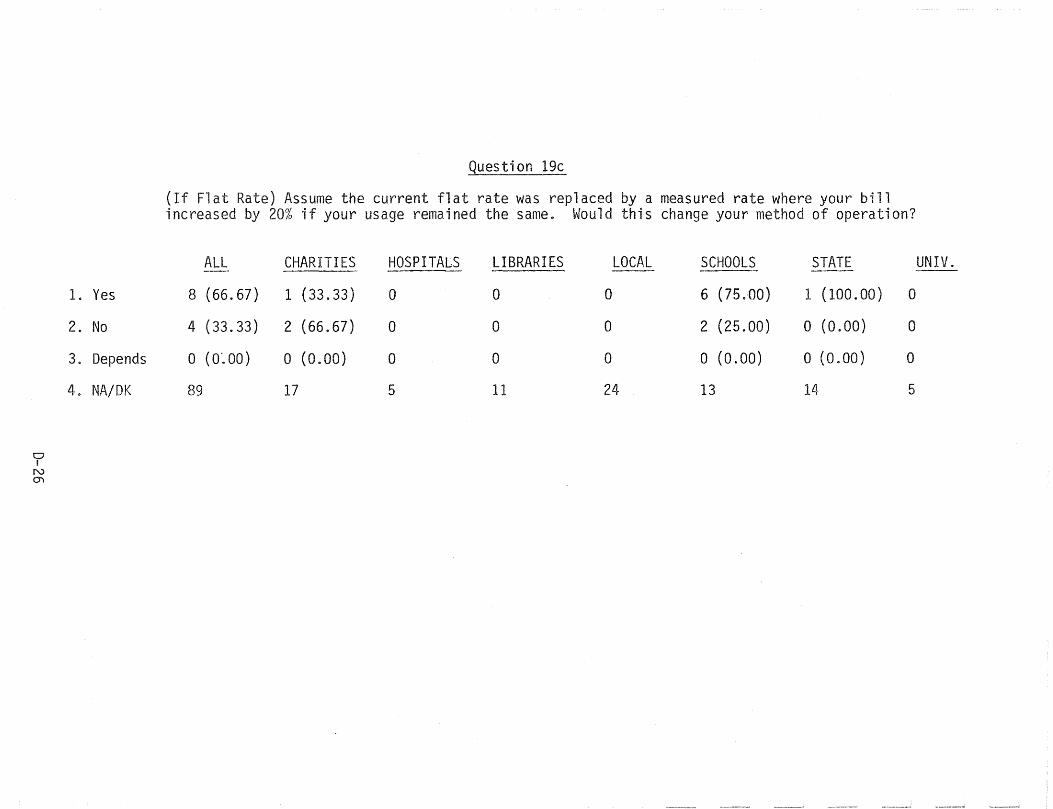
o I
N m
I. Yes
2. No
3. Depends
4. NA/DK
.Question 19c
(If Flat Rate) Assume the current flat rate was replaced by a measured rate where your bill increased by 20% if your usage remained the same. Would this change your method of operation?
ALL CHARITIES HOSPITALS LIBRARIES LOCAL SCHOOLS STATE UNIV. ---8 (66.67) 1 (33.33) a 0 0 6 (75.00) 1 (100.00) 0
4 (33.33) 2 (66.67) 0 a 0 2 (25.00) o (0.00) 0
a (0'.00) o (0.00) 0 0 0 a (0.00) o (0.00) 0
89 17 5 11 24 13 14- 5
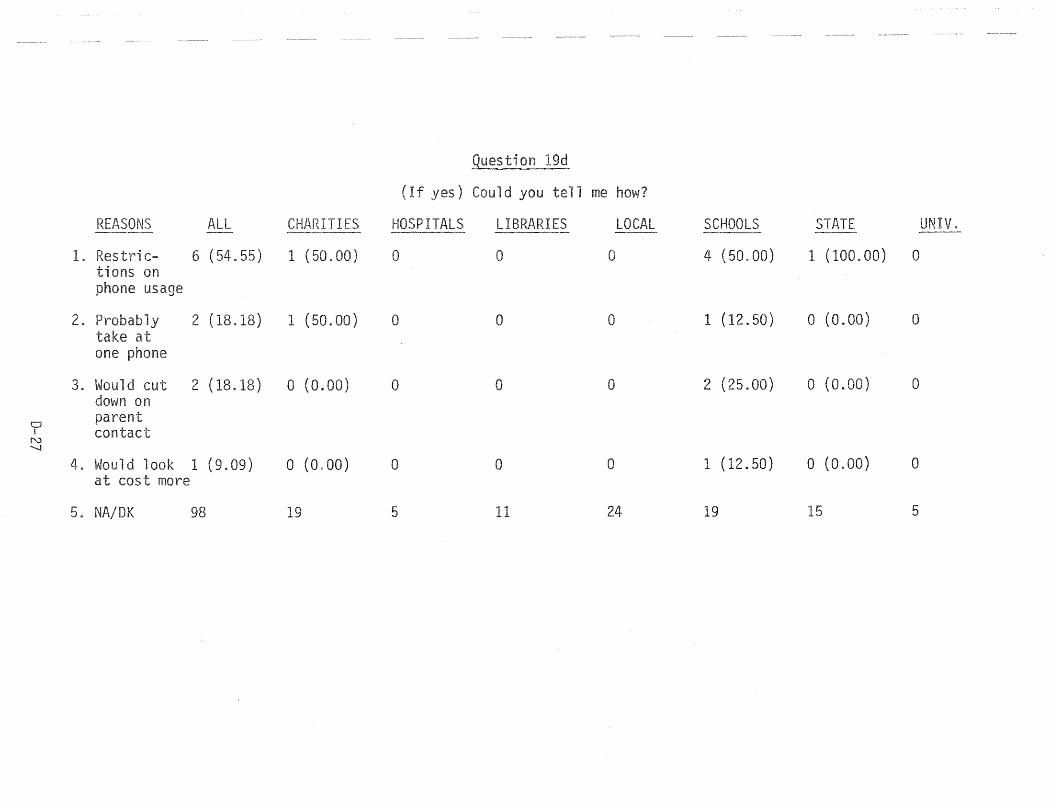
.Question 19d
(If ) Could you tell me
HOSPITALS LIBRARIES LOCAL SCHOOLS STATE -~~--.- ------ ------ ---~--- --"" ----- --"
1. Restric- 6 (54.55) 1 (50. 00) 0 0 0 4 (50.00) 1 (100.00) 0 ons on
phone usage
2. Probably 2 (18.18) 1 (50. 00) 0 a a 1 (12.50) o (0.00) 0 at
one phone
3. d 2 (18.18) o (0.00) 0 0 0 2 (25.00) a (0.00) 0 on
0 parent
i contact N """-J
4. Would 100k 1 (9.09) o (0.00) 0 0 0 1 (12.50) o (0.00) a at cost more
5. NA/DK 98 19 5 11 24 19 15 5
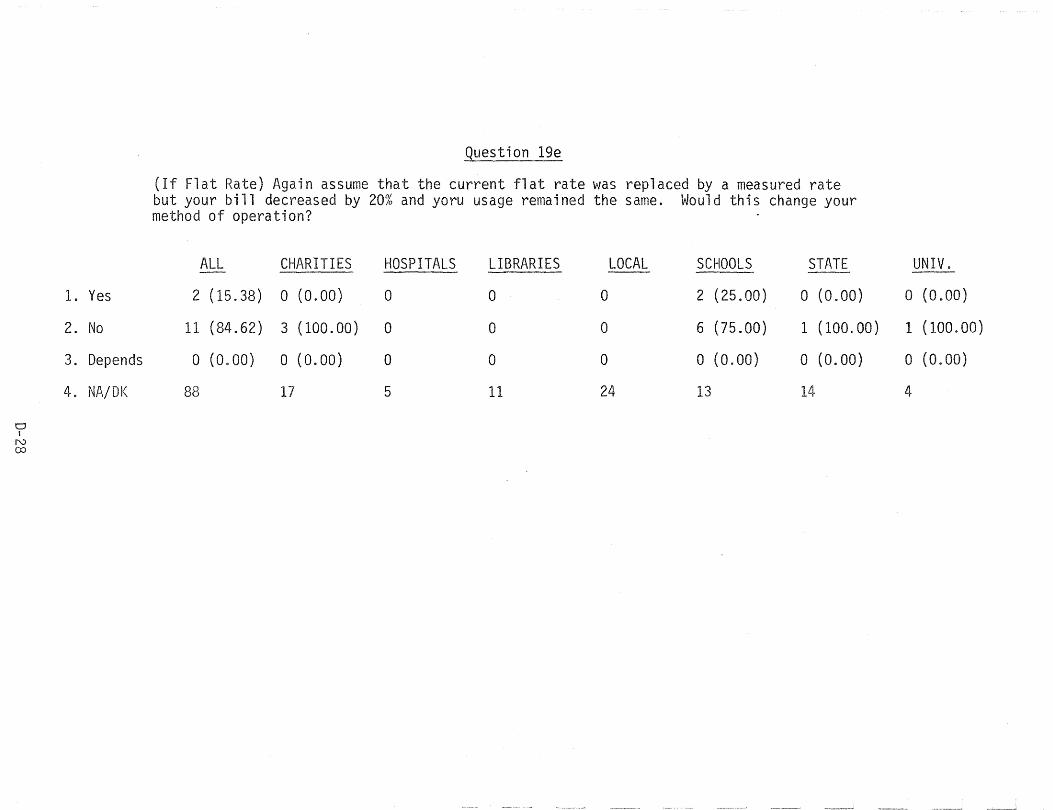
I. Yes
2. No
3. Depends
4. NA/DK
0 I
N co
Question 1ge
(If Flat Rate) Again assume that the current flat rate was replaced by a measured rate but your bill decreased by 20% and yoru usage remained the same. Would this change your method of operation?
ALL CHARITIES HOSPITALS LIBRARIES LOCAL SCHOOLS STATE ---
2 (15.38) a (0.00) 0 0 0 2 (25.00) a (0.00)
11 (84.62) 3 (100.00) 0 0 a 6 (75.00) 1 (100.00)
a (0.00) a (0.00) a a a a (0.00) a (0.00)
88 17 5 11 24 13 14
UNIV.
a (0.00)
1 (100.00)
a (0.00)
4
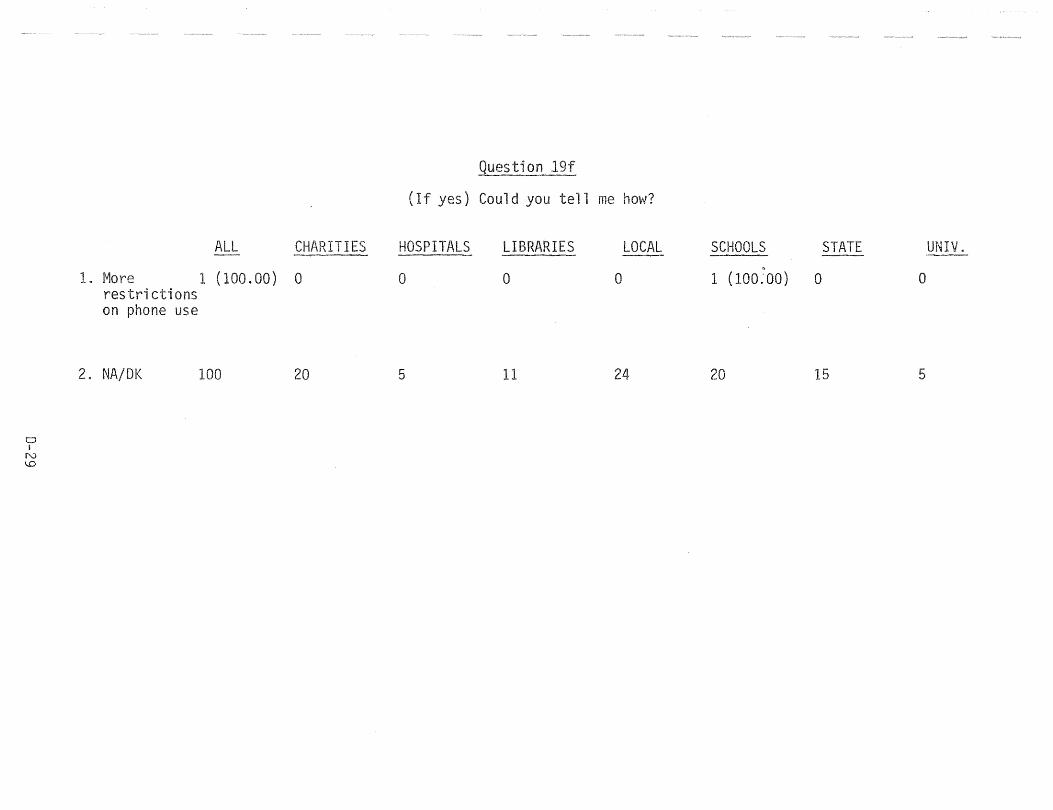
o I
N \..0
ALL CHARITIES
1. More 1 (100.00) 0 restrictions on phone use
2 NA/DK 100 20
Question 19f
(If yes) Could you tell me
HOSPITALS
a
5
LIBRARIES
o
11
LOCAL SCHOOLS STATE UNIV.
o 1 (100~OO) 0 a
24 20 15 5
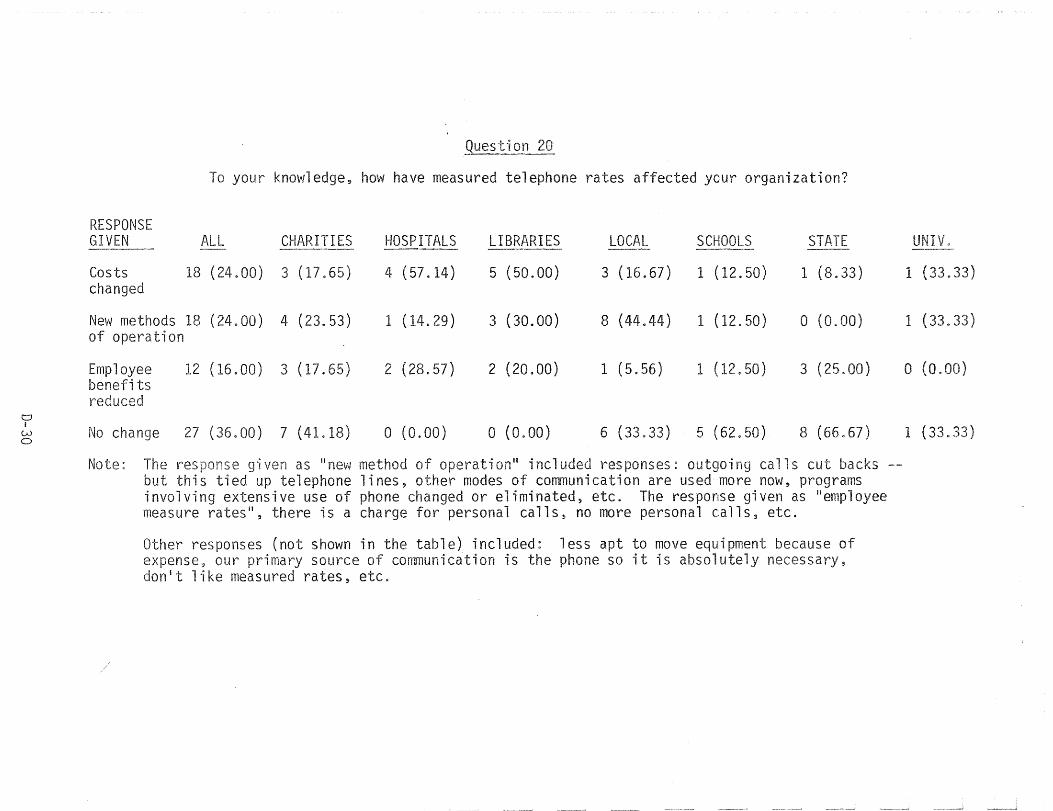
o I
W o
RESPONSE GIVEN
Costs changed
To your knowledge,
ALL CHARITIES
18 (24.00) 3 (17.65)
New methods 18 (24.00) 4 (23.53) of operation
Employee benefits
12 (16.00) 3 (17.65)
No change 27 (36.00) 7 (41.18)
Question
have measured telephone rates affected your organization?
HOSPITALS LIBRARIES LOCAL SCHOOLS STATE
4 (57.14) 5 (50.00) 3 (16.67) 1 (12.50) 1 (8.33)
1 .29) 3 (30.00) 8 (44.44) 1 (12.50) a (0.00)
2 (28.57) 2 (20.00) 1 (5.56) 1 (12.50) 3 (25.
o (0.00) o (0. 00) 6 (33.33) 5 (62.50) 8 (66.67)
Note: The res given as II new method of operation!! included responses: outgloing calls cut but this tied up telephone lines, other modes of corrmunication are used more now, programs involving extensive use of phone changed or eliminated, etc. The response given as lIemployee measure rates il
, there is a charge for personal calls, no more personal calls, etc.
Other responses (not shown in the table) included: less apt to move equipment because of expense, our primary source of communication is the phone so it is absolutely necessary, don!t like measured rates, etc.
v.
1 (33.33)
1 (33~33)
o (0. )
1 (33.33)
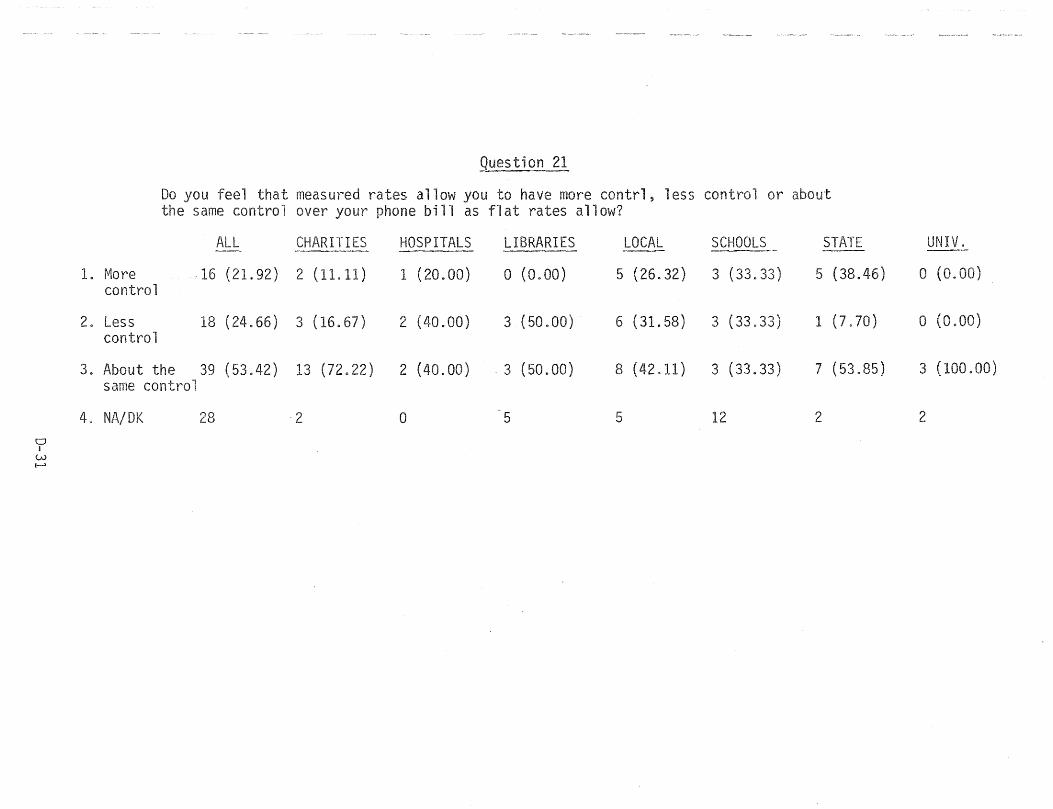
Question 21
Do you feel that measured rates allow you to have more contrl, less control or the same control over phone bill as flat rates allow?
ALL CHARITI HOSPITALS LIBRARIES LOCAL SCHOOLS STATE UNIV. ----
I. t~ore ·16 (21.92) 2 (11.11) 1 (20.00) o (0.00) 5 (26.32) 3 (33.33) 5 (38.4·6) o (0. control
2. Less 18 (24.66) 3 (16.67) 2 (40.00) 3 (50.00) 6 (31.58) 3 (33.33) 1 (7.70) o (0.00) control
3. About the 39 (53.42) 13 (72.22) 2 ( .00) 3 (50.00) 8 (42.11) 3 (33.33) 7 (53.85) 3 same control
4. NA/DK 28 ·2 0 5 5 12 2 2 CJ I
W !--'
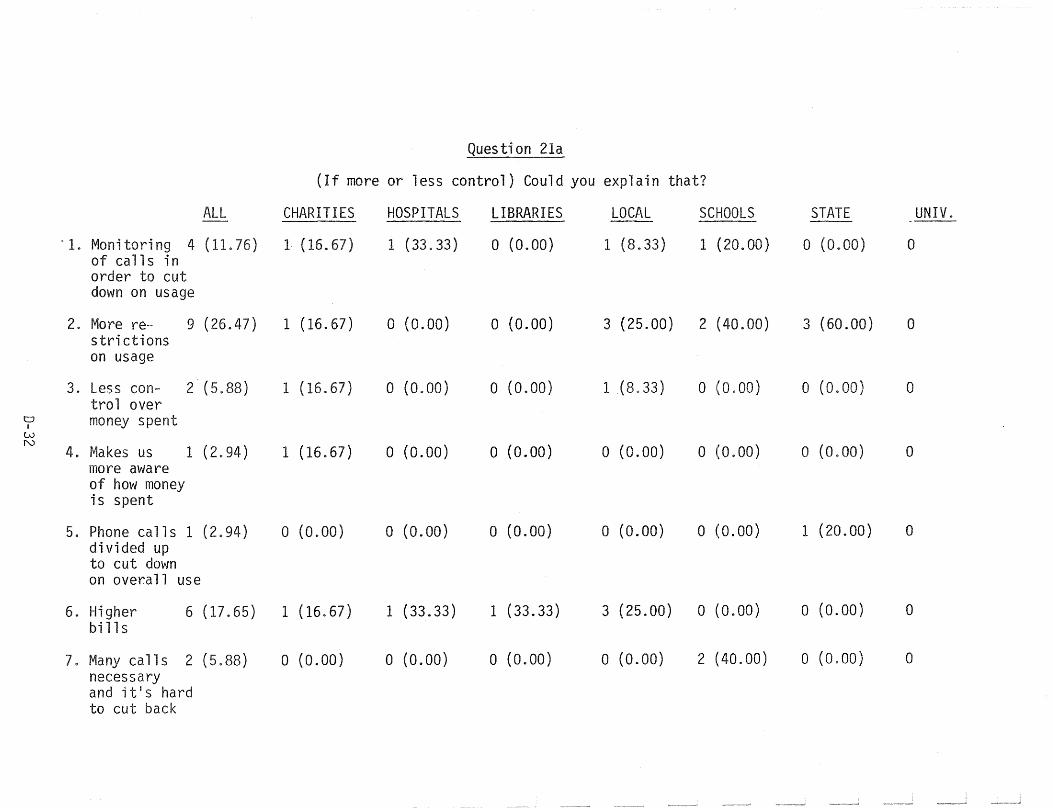
Question 21a
(If more or less control) Could you explain that?
ALL CHARITIES HOSPITALS LIBRARIES LOCAL SCHOOLS STATE UNIV. ---'1. Monitoring 4 (11.76) 1 (16.67) 1 (33.33) o (0.00) 1 (8.33) 1 (20.00) a (0.00) a
of calls in order to cut down on usage
2. More re- 9 (26.47) 1 (16.67) a (0.00) a (0.00) 3 (25.00) 2 (40.00) 3 (60.00) 0 strictions on usage
3. Less con- 2 (5.88) 1 (16.67) o (0.00) a (0.00) 1 (8.33) a (0.00) a (0.00) a trol over
CJ money spent I w N
1 (2.94) 1 (16.67) a (0.00) 4. Makes us a (0.00) a (0.00) a (0.00) a (0.00) 0 more aware of how money is spent
5. Phone calls 1 (2.94) a (0.00) a (0.00) a (0.00) a (0.00) o (0.00) 1 (20.00) a divided up to cut down on overall use
6. Higher 6 (17.65) 1 (16.67) 1 (33.33) 1 (33.33) 3 (25.00) a (0. 00) a (0.00) a bills
7. Many calls 2 (5.88) a (0. 00) a (0.00) a (0.00) a (0.00) 2 (40.00) a (0.00) a necessary and it1s hard to cut back
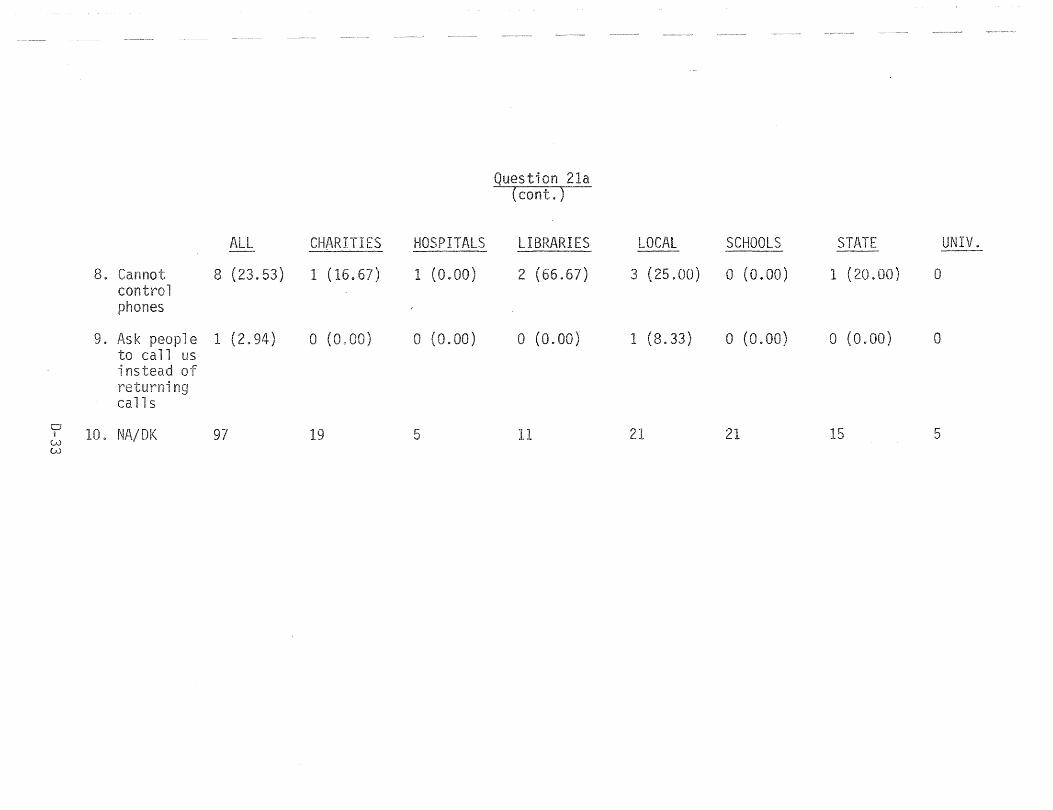
8. 8 ( .... v
control
9. 1 (2. o (0.
. NA/
HOSPITALS ---I (0.
o (0.
5
LIBRARIES
2 (66
a (a. DO}
11
LOCAL
3 (25.
1 (8.33)
21
SCHOOLS
o (0.00)
a (0.
UN ... v ~
1 ( a
o o. ) o
5
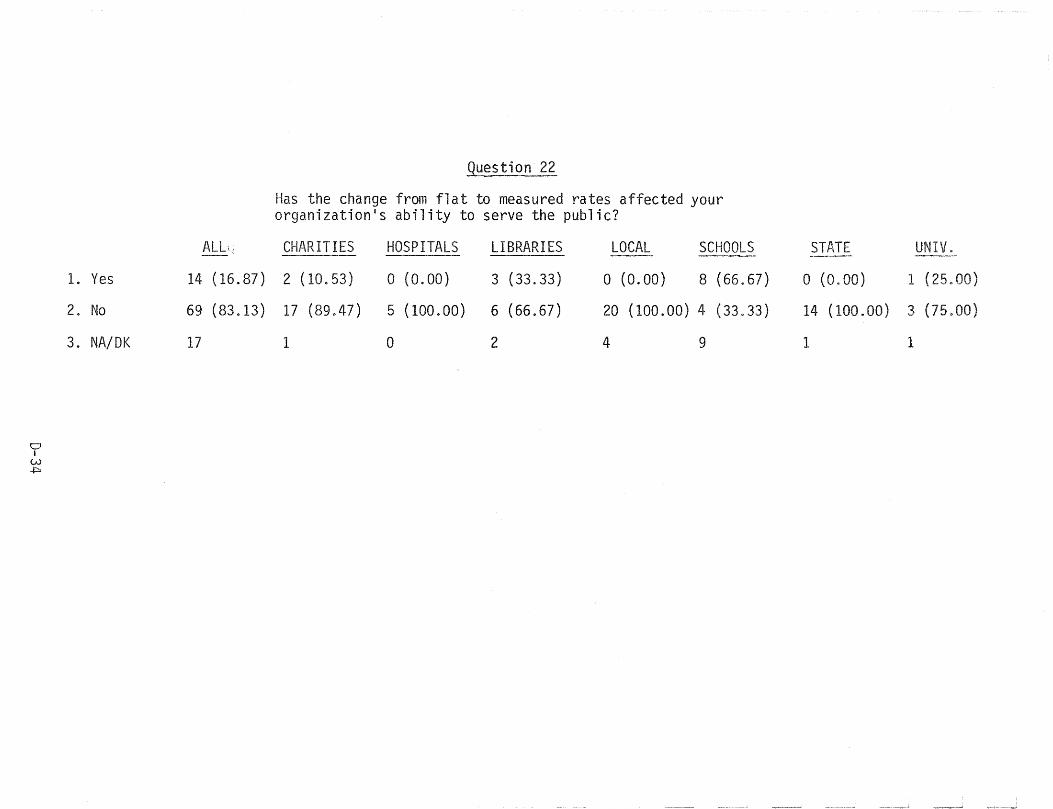
CJ I
W ..j::::.
1. Yes
2. No
3. NA/DK
ALL,
14 (16.87)
69 (83.13)
17
Question 22
Has the change from flat to measured rates affected your organization's ability to serve the public?
CHARITIES HOSPITALS LIBRARIES LOCAL SCHOOLS STATE
2 (10.53) o (0.00) 3 (33.33) a (0.00) 8 (66.67) a (0.00) 1 (25000)
17 (89.47) 5 (100.00) 6 (66.67) 20 (100.00) 4 (33.33) 14 (100.00) 3 (75.00)
1 a 2 4 9 1 1
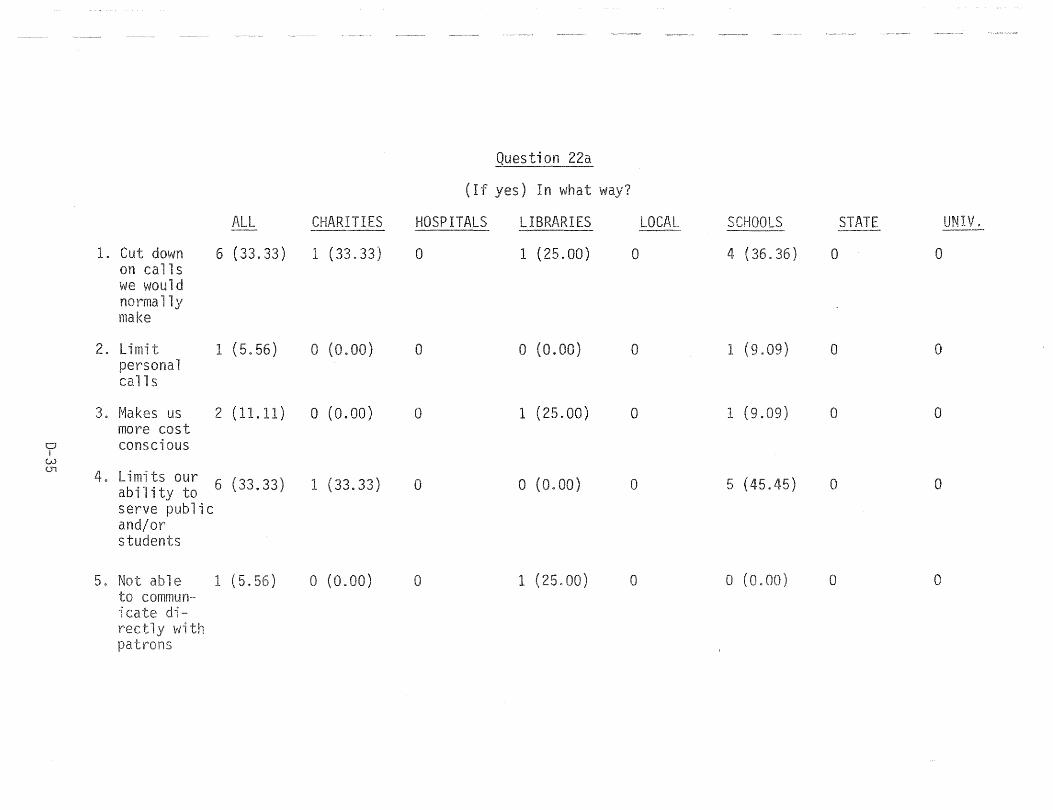
0 I
w U1
1.
2. Limit personal calls
3. Makes us
4.
5.
more cost conscious
mits our abili serve public
e to commun"-
CHARITI
6 ( .33) 1 (33.33)
1 (5.56) o (0.00)
2 (11.11) a (0.00)
6 (33.33) 1 (33.33)
1 (5. o (0.
Question 22a
(If yes) In way?
HOSPITALS
o
a
0
0
o
LIBRARIES
1 (25.00)
o (0.00)
1 (25. 00)
o (0. 00)
1 C-oJ.
o
0
0
0
o
LOCAL STATE
4 (36.36) o o
1 (9.09) 0 0
1 (9. 0 0
5 (45.45) 0 0
a (0 o o
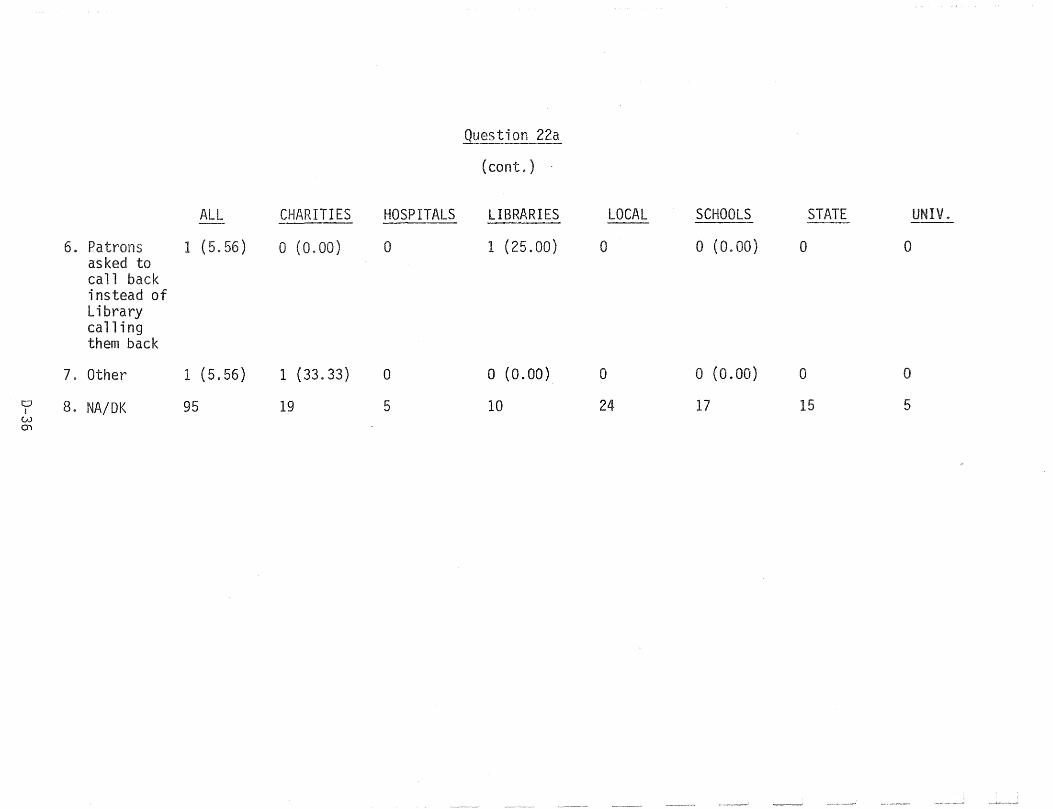
Question 22a
(cont.)
ALL CHARITIES HOSPITALS LIBRARIES LOCAL SCHOOLS STJi.TE UNIV. ---
6. Patrons 1 (5.56) o (0.00) 0 1 (25.00) 0 o (0.00) a 0 asked to call back instead of Library calling them back
7. Other 1 (5.56) 1 (33.33) a a (0.00) 0 o (0.00) 0 0
0 8. NA/DK 95 19 5 10 24 17 15 5 I 0) m
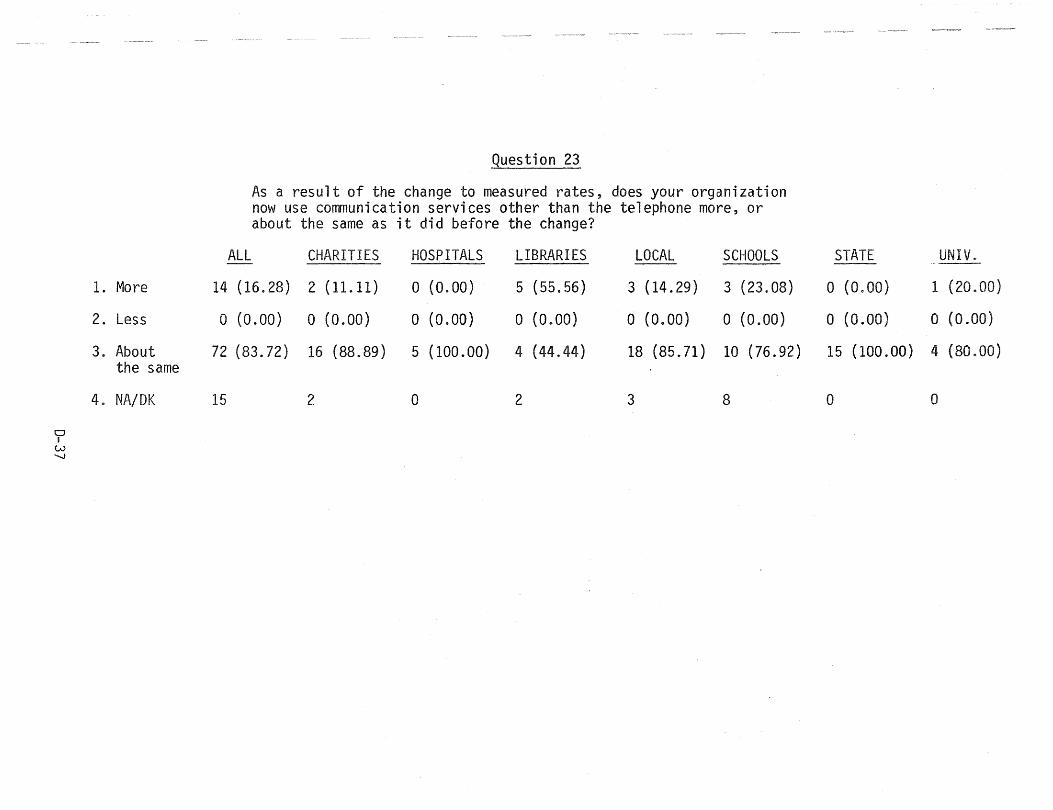
1. More
2. Less
3. About the same
4. NA/DK
CJ I
W -....J
Question 23
As a result of the change to measured rates, does your organization now use communication services other than the telephone more, or about the same as it did before the change?
ALL CHARITIES HOSPITALS LIBRARIES LOCAL SCHOOLS
14 (16.28) 2 (11.11) o (0.00) 5 (55.56) 3 (14.29) 3 (23.08)
o (0.00) o (0.00) o (0.00) a (0.00) o (0.00) o (0.00)
72 (83.72) 16 (88.89) 5 (100.00) 4 (44.44) 18 (85.71) 10 (76.92)
15 2 0 2 3 8
STATE UNIV.
o (0.00) 1 (20.00)
o (0.00) o (0.00)
15 (100.00) 4 (80.00)
0 0
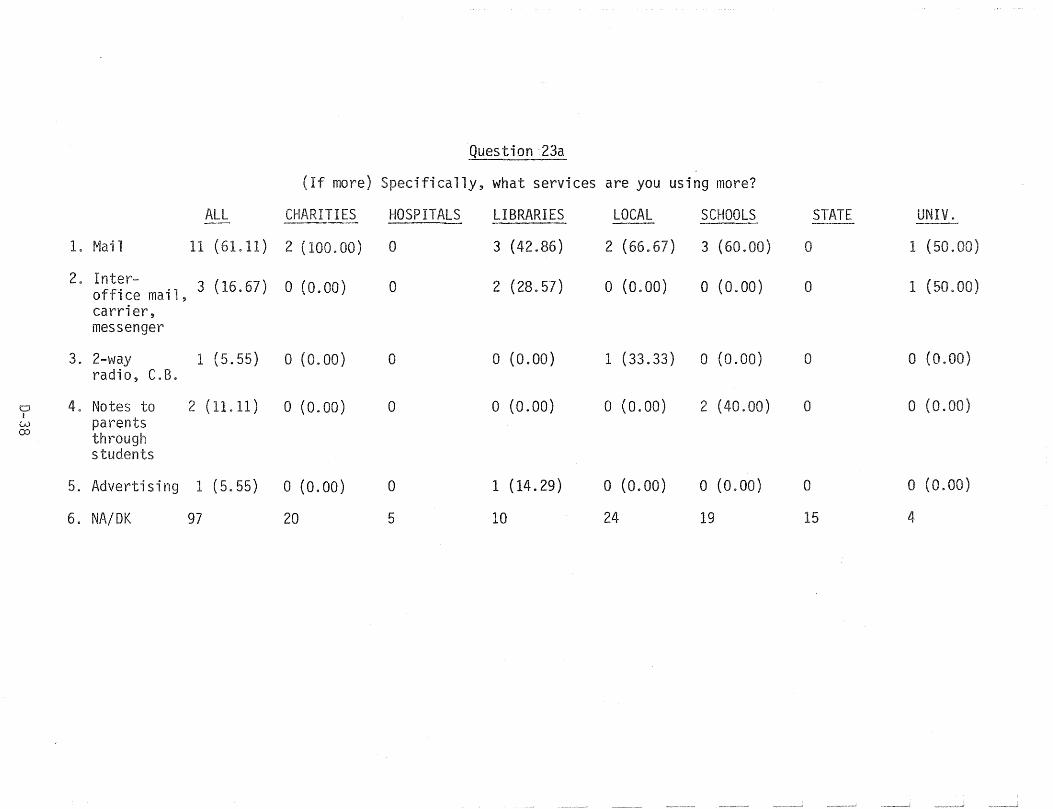
.Question 23a
(If more) Specifically, what services are you using more?
ALL CHARITIES HOSPITALS LIBRARIES LOCAL SCHOOLS STATE UNIV. --- ----I. Mai 1 11 (61.11) 2 (100.00) a 3 (42.86) 2 (66.67) 3 (60.00) 0 1
2. Inter- 3 (16.67) a (0. 00) a 2 (28.57) a (0.00) a (0.00) a 1 (50.00) office mail, carrier, messenger
3. 2-way 1 (5.55) a (0.00) 0 o (0.00) 1 (33.33) a (0.00) a o (0.00) radio, C.B.
0 4. Notes to 2 (11.11) o (0. 00) 0 a (0.00) o (0.00) 2 (40.00) a o (0.00) I parents w
co through students
5. Advertising 1 (5.55) a (0.00) a 1 (14.29) a (0.00) a (0.00) a a (0.00)
6. NA/DK 97 20 5 10 24 19 15 4
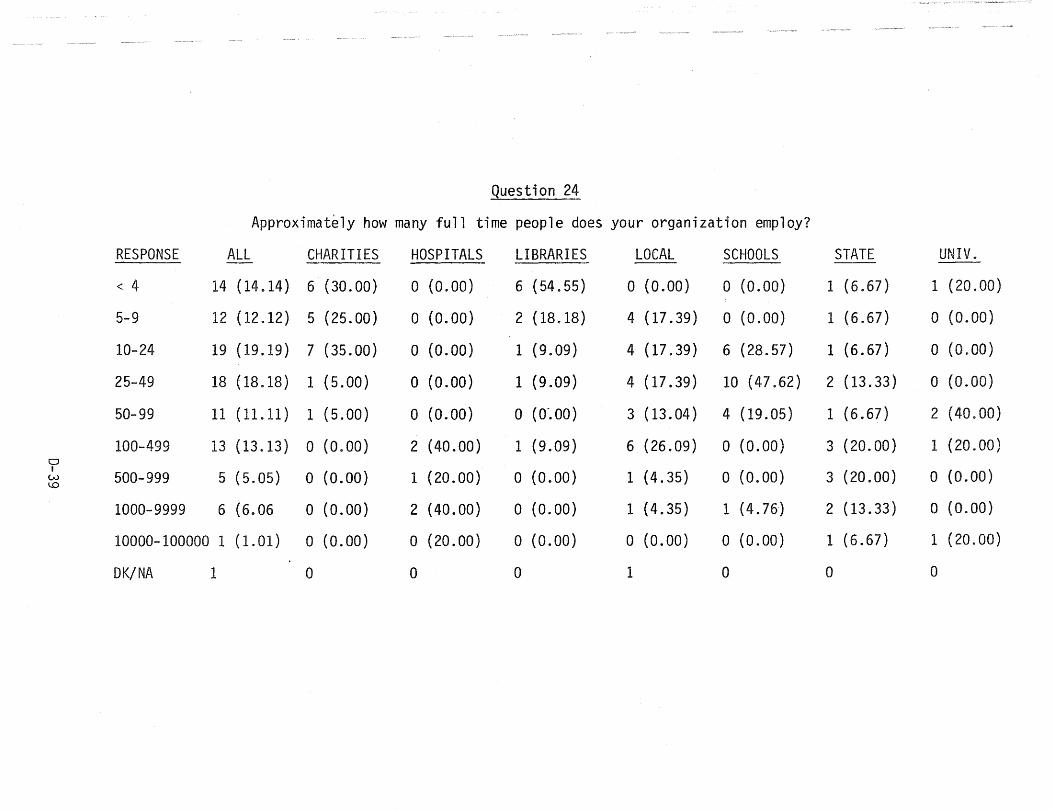
.Question 24
Approximately how many full time people does your organization employ?
RESPONSE ALL CHARITIES HOSPITALS LIBRARIES LOCAL SCHOOLS STATE UNIV.
< 4 14 (14.14) 6 (30.00) o (0.00) 6 (54.55) o (0.00) o (0.00) 1 (6.67) 1 (20.00)
5-9 12 (12.12) 5 (25.00) o (0.00) 2 (18.18) 4 (17.39) o (0.00) 1 (6.67) o (0.00)
10-24 19 (19.19) 7 (35.00) o (0.00) 1 (9.09) 4 (17.39) 6 (28.57) 1 (6.67) o (0.00)
25-49 18 (18.18) 1 (5.00) o (0.00) 1 (9.09) 4 (17.39) 10 (47.62) 2 (13.33) o (0.00)
50-99 11 (11.11) 1 (5.00) o (0.00) o (0'.00) 3 (13.04) 4 (19.05) 1 (6.67) 2 (40.00)
100-499 13 (13.13) o (0.00) 2 (40.00) 1 (9.09) 6 (26.09) o (0.00) 3 (20.00) 1 (20. 00) 0 I
5 (5.05) o (0.00) 1 (20.00) o (0.00) 1 (4.35) o (0.00) 3 (20.00) o (0.00) w 500-999 1..0
1000-9999 6 (6.06 o (0.00) 2 (40.00) o (0.00) 1 (4.35) 1 (4.76) 2 (13.33) o (0.00)
10000-100000 1 (1.01) o (0.00) a (20.00) o (0.00) o (0.00) o (0.00) 1 (6.67) 1 (20. 00)
DK/NA 1 0 0 0 1 0 0 0
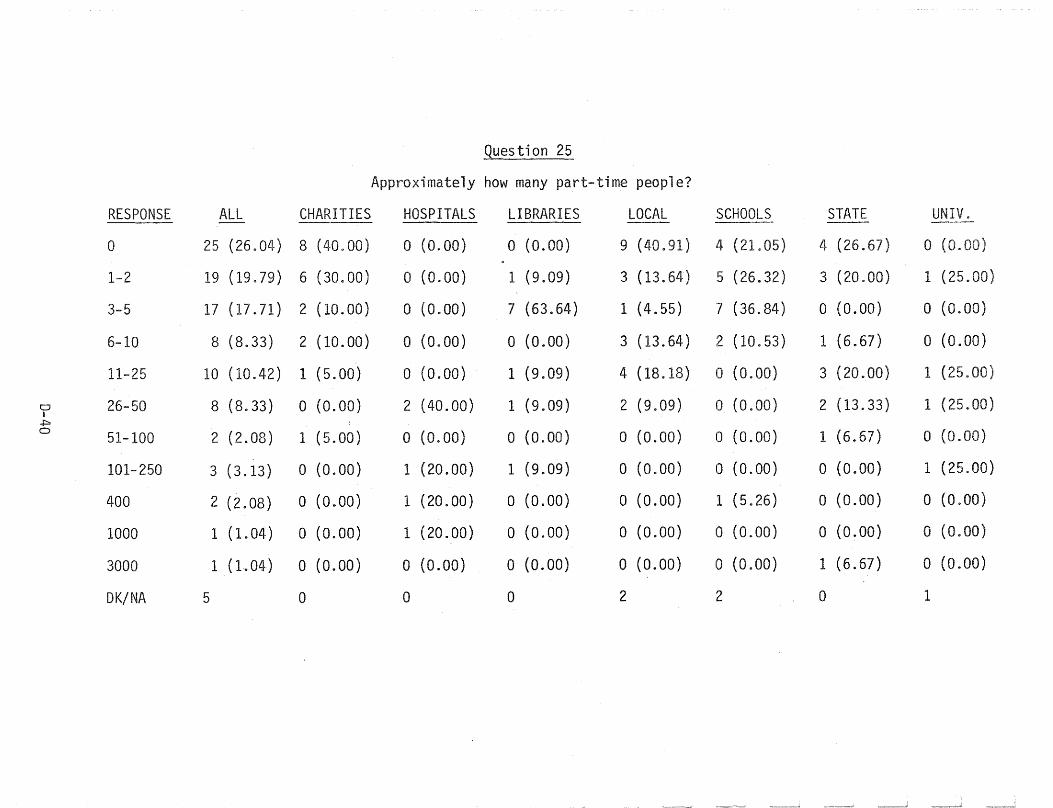
Question 25
Approximately how many part-time people?
RESPONSE ALL CHARITIES HOSPITALS LIBRARIES LOCAL SCHOOLS STATE UN
0 25 (26.04) 8 (40.00) o (0.00) o (0.00) 9 (40.91) j~ (21.05) 4 (26.67) o (0.00)
1-2 19 (19.79) 6 (30.00) o (0.00) 1 (9.09) 3 (13.64) !5 (26.32) 3 (20.00) 1 (25.00)
3-5 17 (17.71) 2 (10.00) o (0.00) 7 (63.64) 1 (4.55) "7 (36.84) o (0.00) o (0.00)
6-10 8 (8.33) 2 (10.00) a (0.00) o (0.00) 3 (13.64) :2 (10.53) 1 (6.67) o (0.00)
11-25 10 (10.42) 1 (5.00) a (0.00) 1 (9.09) 4 (18.18) o (0.00) 3 (20.00) 1 (25.00)
0 26-50 8 (8.33) o (0.00) 2 (40.00) 1 (9.09) 2 (9.09) o (0.00) 2 (13.33) 1 (25.00) I
+::> 0 51-100 2 (2.08) 1 (5. 00) a (0.00) a (0.00) o (0.00) o (0.00) 1 (6.67) o (0.00)
101-250 3 (3.13) o (0.00) 1 (20.00) 1 (9.09) a (0.00) o (0.00) o (0.00) 1 (25.00)
400 2 (2.08) o (0.00) 1 (20.00) o (0.00) a (0.00) 1 (5.26) o (0.00) o (0.00)
1000 1 (1.04) o (0.00) 1 (20.00) o (0.00) o (0.00) o (0.00) o (0.00) o (0.00)
3000 1 (1.04) o (0.00) a (0.00) o (0.00) a (0.00) o (0.00) 1 (6.67) o (0 .. 00)
DK/NA 5 0 a a 2 :2 a 1

Question 26
Approximately what percentage of all the employees might be considered "professionals!!?
PERCENT ALL CHARITIES HOSPITALS LIBRARIES LOCAL SCHOOLS STATE UNIV. --- --- ---
0-19 12 (12.37) 3 (15.00) o (0. 00) 1 (9.09) 7 (33.33) 1 (4.76) a (0.00) o (0.00)
20-39 15 (15.46) 3 (15.00) o (0.00) 7 (63.64) 3 (14.29) o (0.00) 2 (13.33) o (0.00)
40-59 18 (18.56) 2 (10.00) 4 (80.00) 2 (18.18) 3 (14.29) o (0.00) 6 (40.00) 1 (25.00)
60-79 22 (22.68) 7 (35~OO) 1. (20.00) 1. (9.09) 3 (14.29) 5 (23.81) 3 ( . 00) 2 (50 . )
80-100 30 (30.93) 5 (25.00) a (0.00) a (0.00) 5 (23.81) 15 (71.43) 4 (26.67) 1. (25.00) CJ ! DK/NA 4 a a 0 a 0 0 1 ~
I-'
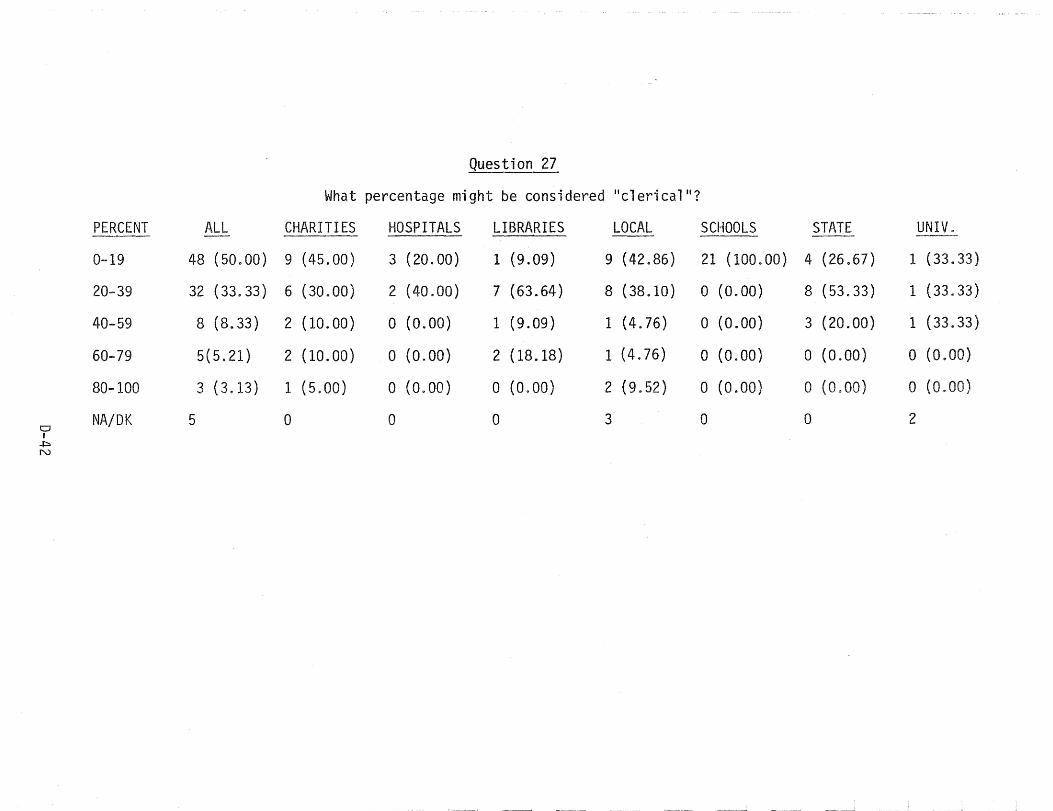
Question 27
What percentage might be considered "clerical"?
PERCENT ALL CHARITIES HOSPITALS LIBRARIES LOCAL SCHOOLS STATE UNIV~ --- ---
0-19 48 (50.00) 9 (45.00) 3 (20.00) 1 (9.09) 9 (42.86) 21 (100.00) 4 (26.67) 1 (33.33)
20-39 32 (33.33) 6 (30.00) 2 (40.00) 7 (63.64) 8 (38.10) a (0.00) 8 (53.33) 1 (33.33)
40-59 8 (8.33) 2 (10.00) o (0.00) 1 (9.09) 1 (4.76) a (0.00) 3 (20.00) 1 (33.33)
60-79 5(5.21) 2 (10.00) o (0.00) 2 (18.18) 1 (4.76) a (0.00) a (0.00) a (OgOO)
80-100 3 (3.13) 1 (5.00) o (0.00) o (0.00) 2 (9.52) a (0.00) a (0.00) o (0.00)
NA/DK 5 0
a 0 0 3 0 0 2 I
+::> N

Question 28
What percentage would you consider to be neither professional nor clerical?
PERCENT ALL CHARITIES HOSPITALS LIBRARIES LOCAL SCHOOLS STATE UNIV. ---
0-19 60 (61.86) 16 (80.00) o (0.00) 2 (18.18) 13 (59.09) 15 (71.43) 11 (73.33) 3 (100.00)
20-39 13 (13.40) 1 (5.00) 2 (60.00) 2 (18.18) 1 (4.55) 5 (23.81) 1 (6.67) o (0. 00)
40-59 13 (13.40) a (0.00) 2 (40.00) 7 (63.64) 2 (9.09) o (0.00) 2 (13.33) o (0.00)
60-79 6 (6.19) 2 (10.00) o (0.00) o (0.00) 3 (13.64) o (0.00) 1 (6.67) o (0.00)
80-100 5 (5.15) 1 (5.; 00) o (0.00) o (0.00) 3 (13.64) .1 (4.76) o (0.00) o (0.00)
0 DK/NA I
4 0 0 a 2 0 0 2 +::> w
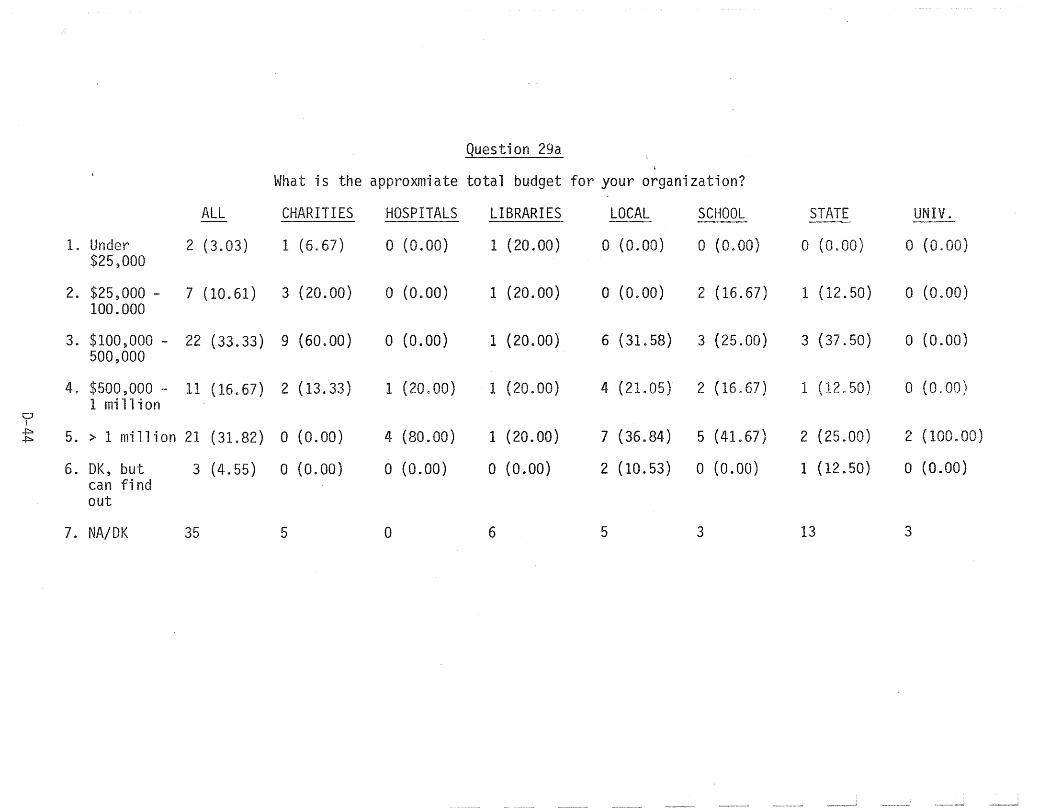
Question 29a \
~~hat is the approxmiate total budget for your organizat"ion?
ALL CHARITIES HOSPITALS LIBRARIES LOCAL SCHOOL STATE UNIV. ---I. Under 2 (3.03) 1 (6.67) o (0.00) 1 (20.00) o (0.00) ° (0.00) o (0.00) a (O~OO)
$25,000
2. $25,000 - 7 (10.61) 3 (20.00) a (0.00) 1 (20.00) o (0.00) 2 (16.67) 1 (12.50) o (0.00) 100.000
3. $100,000 - 22 (33.33) 9 (60. 00) a (0.00) 1 (20.00) 6 (31.58) 3 (25.00) 3 (37.50) o (0.00) 500,000
4. $500,000 - 11 (16.67) 2 (13.33) 1 (20. 00) 1 (20.00) 4 (21.05) 2 (16.67) 1 (12.50) a (0.00) 1 million
CJ I ~ 5. > 1 million 21 (31.82) a (0.00) 4 (80.00) 1 (20.00) 7 (36.84) 5 (41.67) 2 (25.00) 2 (100.00) ~
6. OK, but 3 (4.55) a (0.00) o (0.00) o (0.00) 2 (10.53) o (0.00) 1 (12.50) a (0.00) can find out
7. NA/DK 35 5 a 6 5 3 13 3
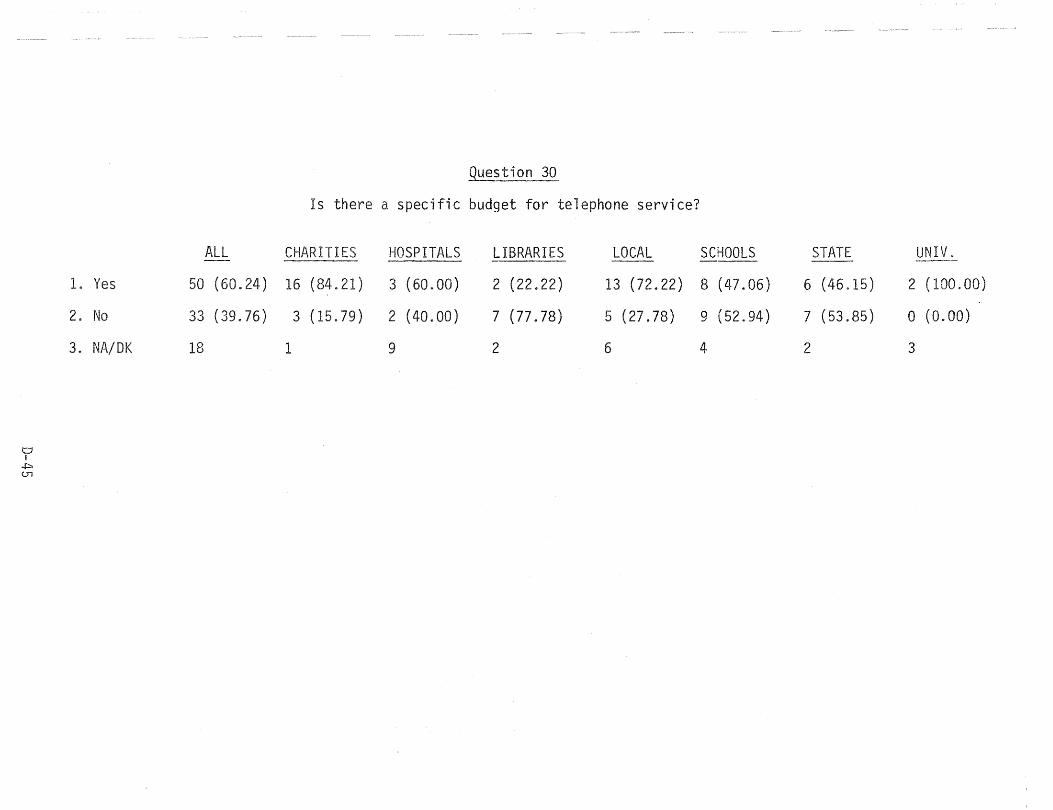
o i
.j::::. U1
I. Yes
2. No
3. NA/DK
ALL
50 (60.24)
33 (39.76)
18
Question 30
Is there a specific budget for telephone service?
CHARITIES HOSPITALS LIBRARIES LOCAL
16 (84.21) 3 (60. 00) 2 (22.22) 13 (72.22)
3 (15.79) 2 (40.00) 7 (77.78) 5 (27.78)
1 9 2 6
SCHOOLS STATE UNIV. ---
8 (47.06) 6 (46.15) 2 (100.00)
9 (52.94) 7 (53.85) o (0.00)
4 2 3
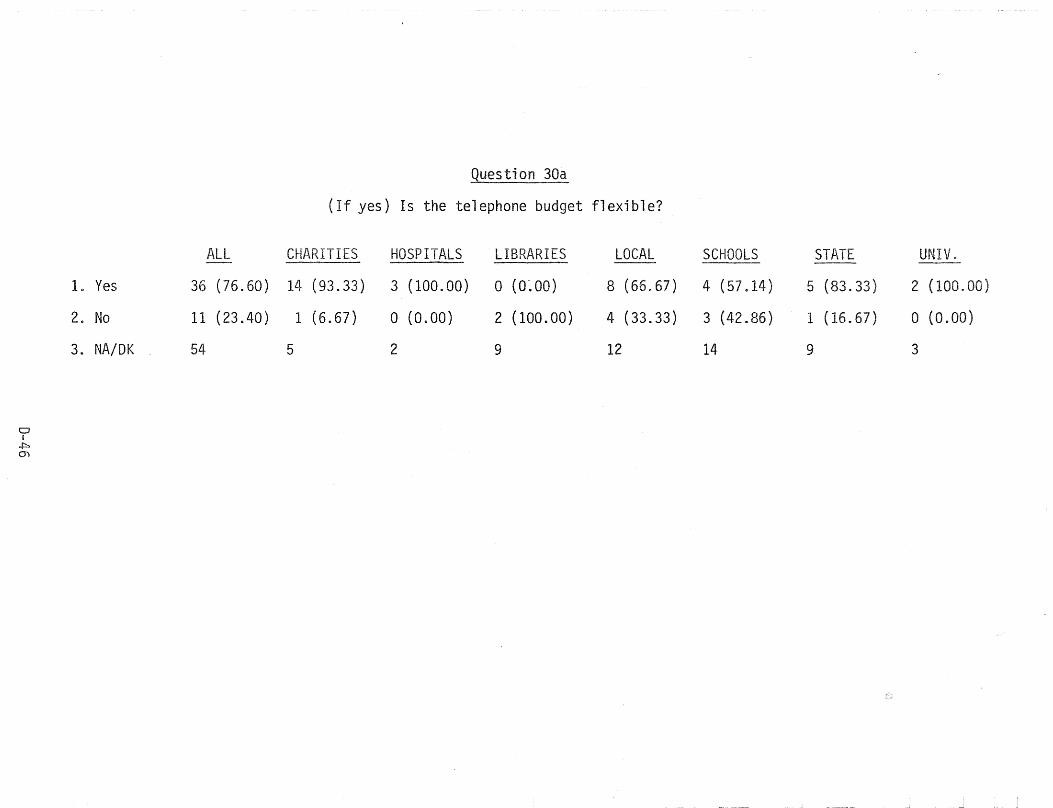
o I
..f::>. 0'1
I. Yes
2. No
3. NA/DK
ALL
36 (76.60)
11 (23.40)
54
.Question 30a
(If yes) Is the telephone budget flexible?
CHARITIES HOSPITALS LIBRARIES LOCAL
14 (93.33) 3 (100.00) a (0-. 00) 8 (66.67)
1 (6.67) a (0.00) 2 (100.00) 4 (33.33)
5 2 9 12
SCHOOLS STATE UNIV. ---4 (57.14) 5 (83.33) 2 (100.00)
3 (42.86) 1 (16.67) o (0. 00)
14 9 3
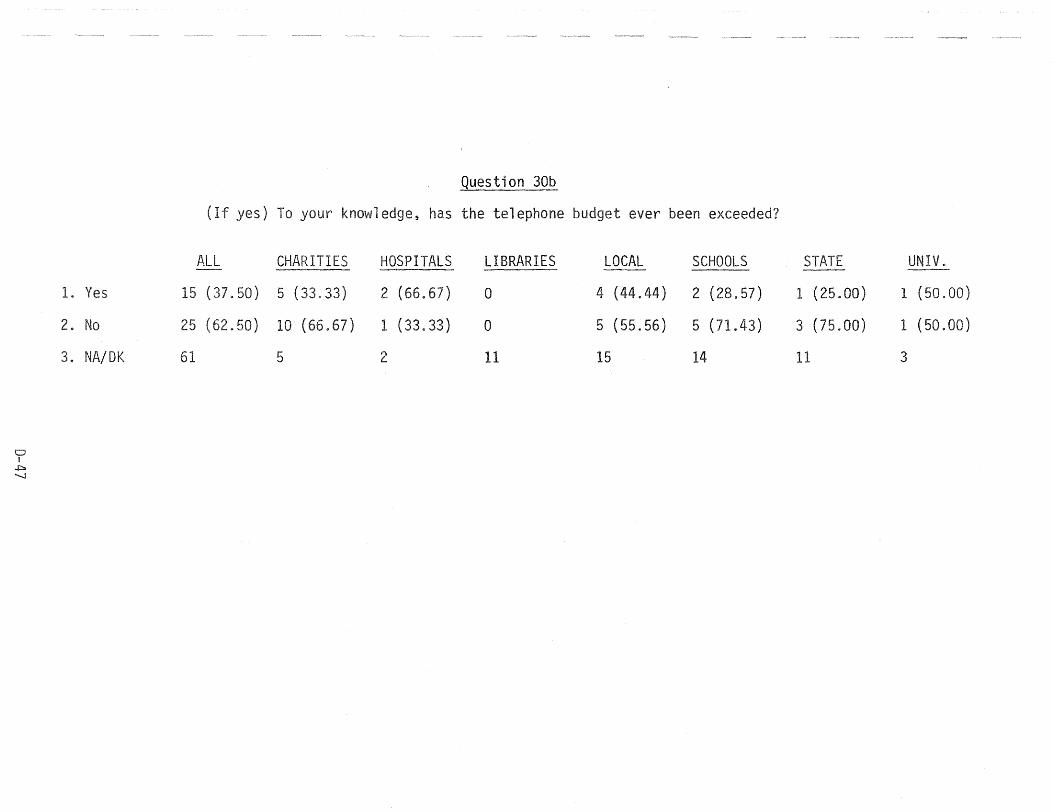
o I
..j:::::. '-.I
I. Yes
2. No
3. NA/DK
guestion 30b
(If yes) To your knowledge, has the telephone budget ever been exceeded?
ALL CHARITIES HOSPITALS LIBRARIES LOCAL SCHOOLS --- --15 (37.50) 5 (33.33) 2 (66.67) 0 4 (44.44) 2 (;~8.57)
25 (62.50) 10 (66.67) 1 (33.33) a 5 (55.56) 5 (71.43)
61 5 2 11 15 14
STATE UNIV.
1 (25.00) 1 (50.00)
3 (75.00) 1 (50. 00)
11 3
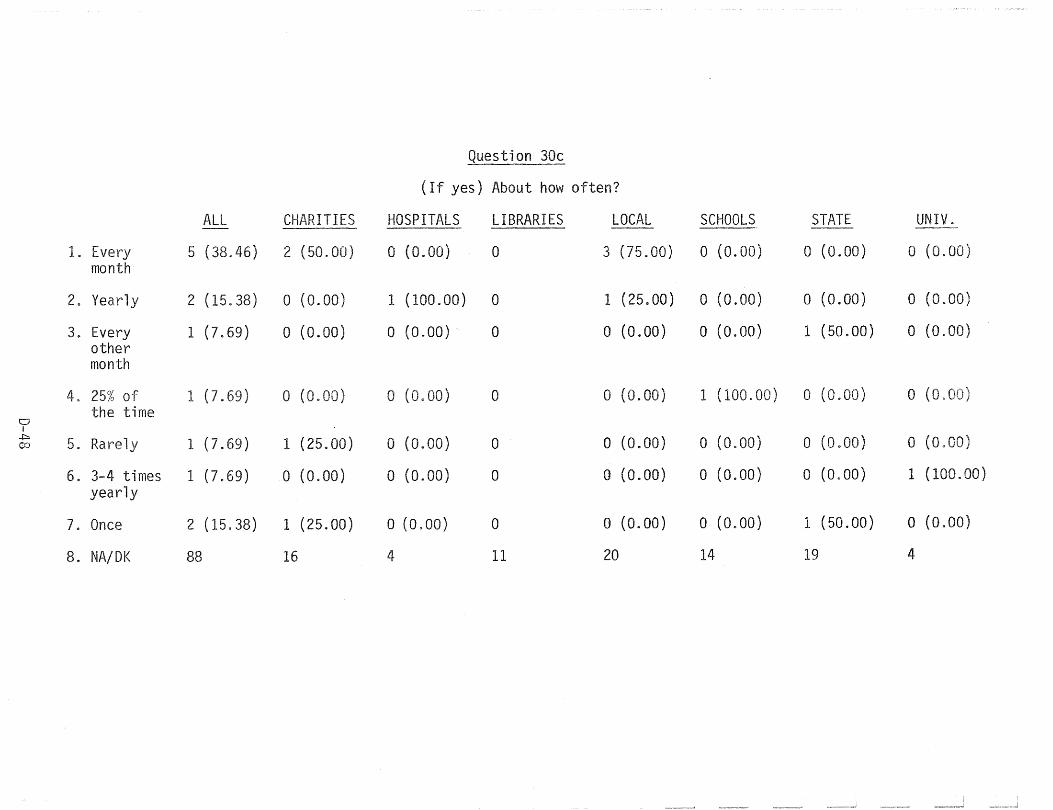
Question 30e
(If yes) About how often?
ALL CHARITIES HOSPITALS LIBRARIES LOCAL SCHOOLS STATE UNIV. ----
I. Every 5 (38.46) 2 (50.00) o (0.00) 0 3 (75.00) o (0.00) o (0.00) a (0. month
2. Yearly 2 (15.38) o (0.00) 1 (100.00) 0 1 (25000) o (0.00) o (0.00) o (0.00)
3. Every 1 (7.69) a (0. 00) a (0.00) a o (0.00) a (0.00) 1 (50.00) o (0.00) other month
4. 25% of 1 (7.69) a (0. ) o (0.00) a o (0.00) 1 (100.00) o (0. 00) o (0. the time
0 I
.f:::> 5. Rarely 1 (7.69) 1 (25.00) o (0.00) 0 o (0.00) a (0.00) o (0. 00) a (0 OJ
6. 3-4 times 1 (7.69) a (0.00) a (0.00) a o (0.00) a (0.00) o (0.00) 1 (100.00) yearly
7. Once 2 (15.38) 1 (25.00) a (0. 00) a o (0.00) a (0.00) 1 (50.00) a (0.00)
8. NA/DK 88 16 4 11 20 14 19 4
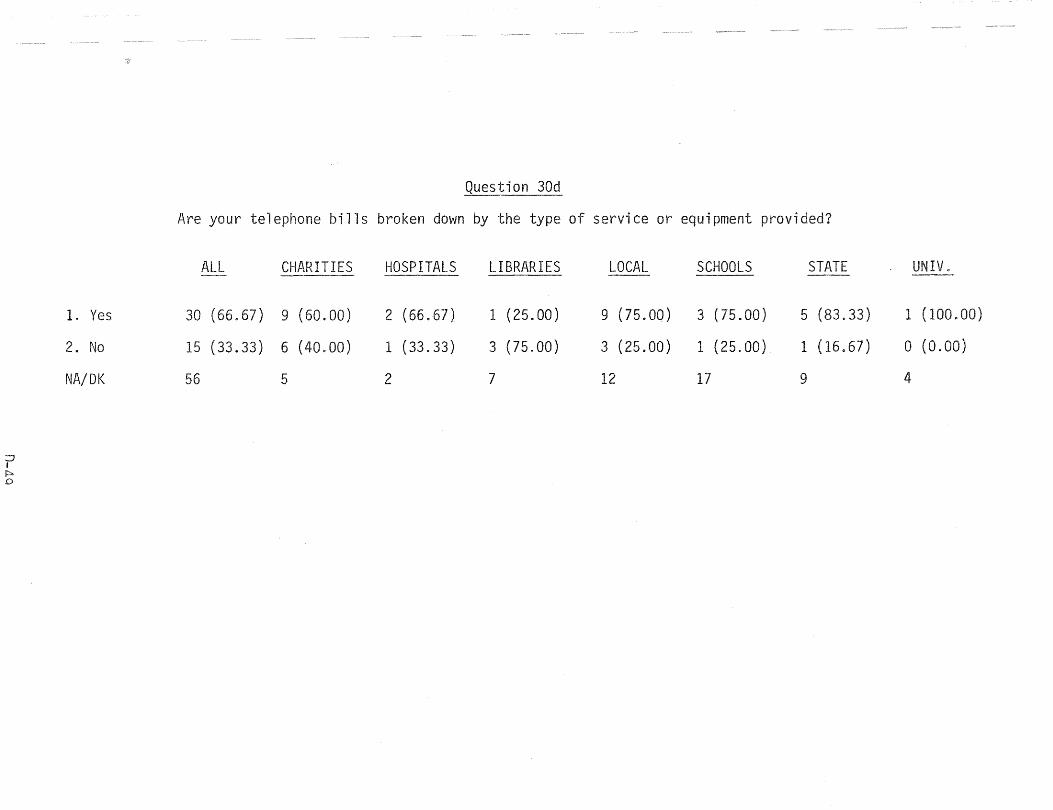
=:J I p,. o
I. Yes
2. No
NA/DK
Question 30d
Are your telephone bills broken down by the type of service or equipment provided?
ALL CHARITIES HOSPITALS LIBRARIES LOCAL SCHOOLS STATE UNIV. ---
30 (66.67) 9 (60.00) 2 (66.67) 1 (25.00) 9 (75.00) 3 (75.00) 5 (83.33) 1 (100.00)
15 (33.33) 6 (40.00) 1 (33.33) 3 (75.00) 3 (25.00) 1 (25.00) 1 (16.67) o (0.00)
56 5 2 7 12 17 9 4
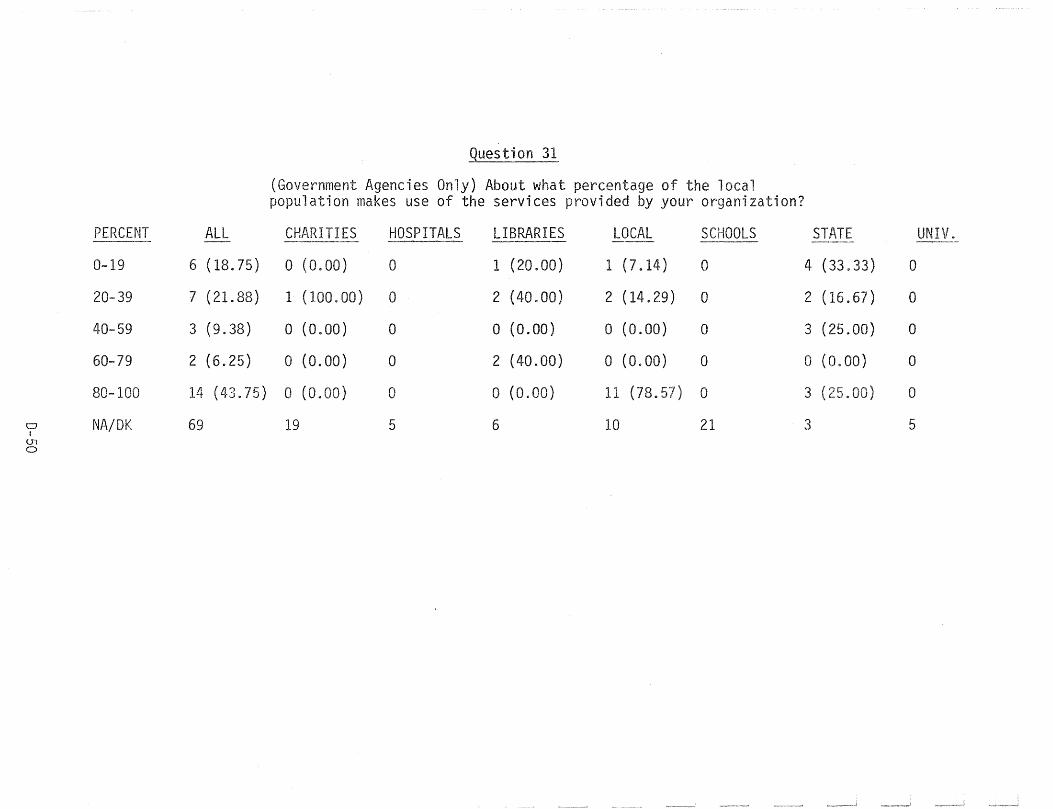
guestion 31
(Government Agencies Only) About what percentage of the local population makes use of the services provided by your organization?
PERCENT ALL CHARITIES HOSPITALS LIBRARIES LOCAL SCHOOLS STATE UNIV. ---,- -.--~- -'-~- -----
0-19 6 (18.75) o (0.00) 0 1 (20.00) 1 (7014) 0 4 (33.33) 0
20-39 7 (21.88) 1 (100.00) 0 2 (40.00) 2 (14.29) 0 2 (16.67) 0
40-59 3 (9.38) o (0.00) 0 o (0.00) o (0.00) a 3 (25.00) a
60-79 2 (6.25) o (0.00) 0 2 (40.00) o (0.00) 0 o (0.00) 0
80-100 14 (43.75) o (0. 0 o (0.00) 11 (78.57) 0 3 ( . ) 0
CI NA/DK 69 19 5 6 10 21 3 5 I
U1 0
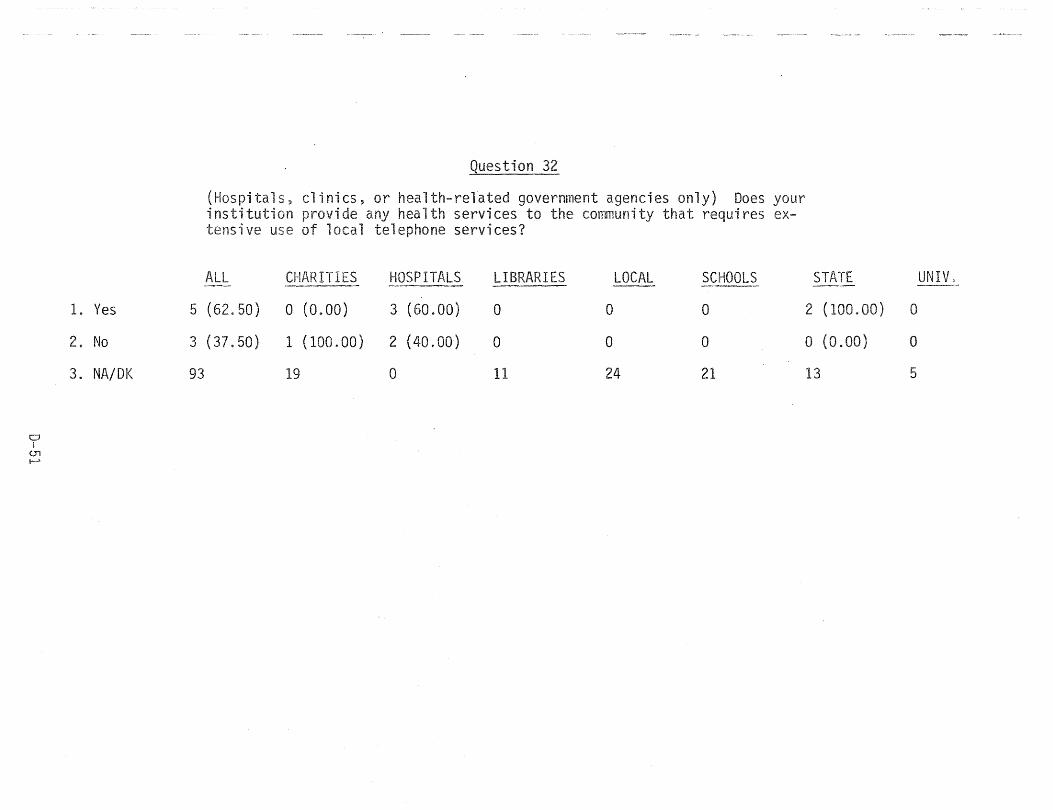
o I
U1 I--'
1. Yes
2. No
3. NA/DK
Question 32
(Hospitals, clinics, or health-related government agencies only) Does your institution provide any health services to the community that requires ex
ive use of local telephone services?
ALL CHARITIES HOSPITALS
5 (62.50) 0 (0.00) 3 (60.00)
3 (37~50) 1 (100.00) 2 (40.00)
93 19 0
LIBRARIES
o
o
11
LOCAL
o
o
24
SCHOOLS
o
o
21
STATE UNIV.
2 (100.00) a
o (0. 00) 0
13 5
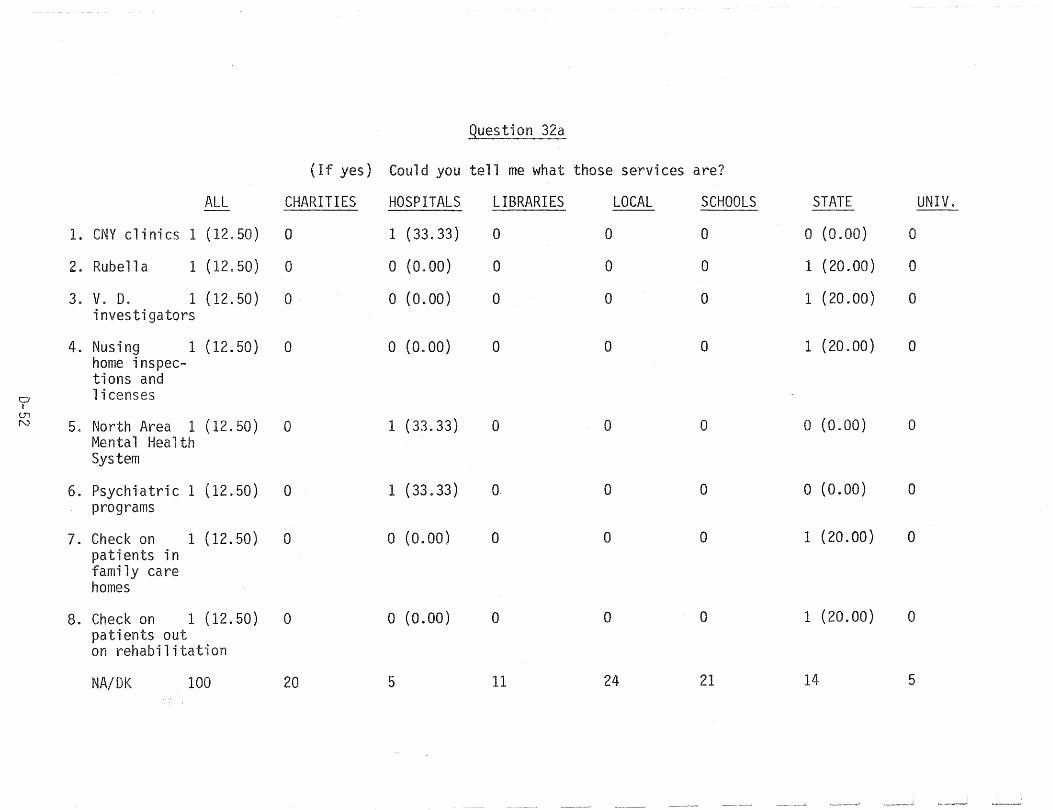
.Question 32a
(If yes) Could you tell me what those services are?
ALL CHARITIES HOSPITALS LIBRARIES LOCAL SCHOOLS STATE UNIV. ---I. CNY clinics 1 (12.50) 0 1 (33.33) 0 0 0 a (0.00) 0
2. Rubella 1 (12.50) 0 o (0.00) 0 0 0 1 (20.00) 0
3. V. D. 1 (12.50) 0 o (0.00) 0 0 0 1 (20.00) 0 investigators
4. Nusing 1 (12.50) 0 o (0.00) 0 a 0 1 (20.00) 0 home inspec-tions and licenses
I~
U1 rv 5. North Area 1 (12.50) 0 1 (33.33) 0 0 0 o (0.00) 0
Mental Health System
6. Psychiatric 1 (12.50) 0 1 (33.33) O. 0 a o (0.00) 0 programs
7. Check on 1 (12.50) a o (0.00) 0 0 0 1 (20.00) 0 patients in fami 1y care homes
8. Check on 1 (12.50) 0 o (0.00) 0 0 0 1 (20. 00) 0 patients out on rehabilitation
NA/DK 100 20 5 11 24 21 14 5
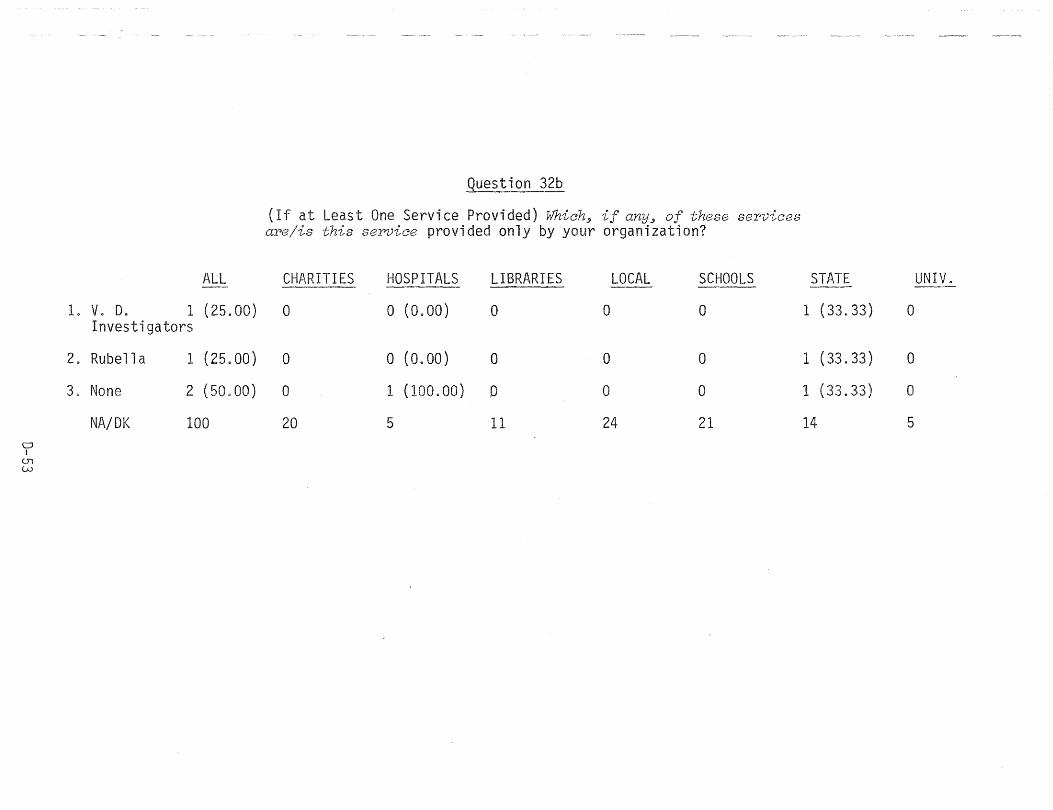
ALL
I. V. D. 1 (25.00) Investigators
2. Rubella 1 (25.00)
3. None 2 (50.00)
NA/DK 100 Cl I
U1 W
Question 32b
(If at Least One Service Provided) ¥mich3 if any~ of these services are/is this service provided only by your organization?
CHP\RITIES HOSPITALS LIBRARIES LOCAL SCHOOLS ---
0 o (0.00) 0 0 a
0 o (0.00) 0 0 a
0 1 (100.00) 0 0 0
20 5 11 24 21
STATE UNIV.
1 (33.33) 0
1 (33.33) 0
1 (33.33) 0
14 5
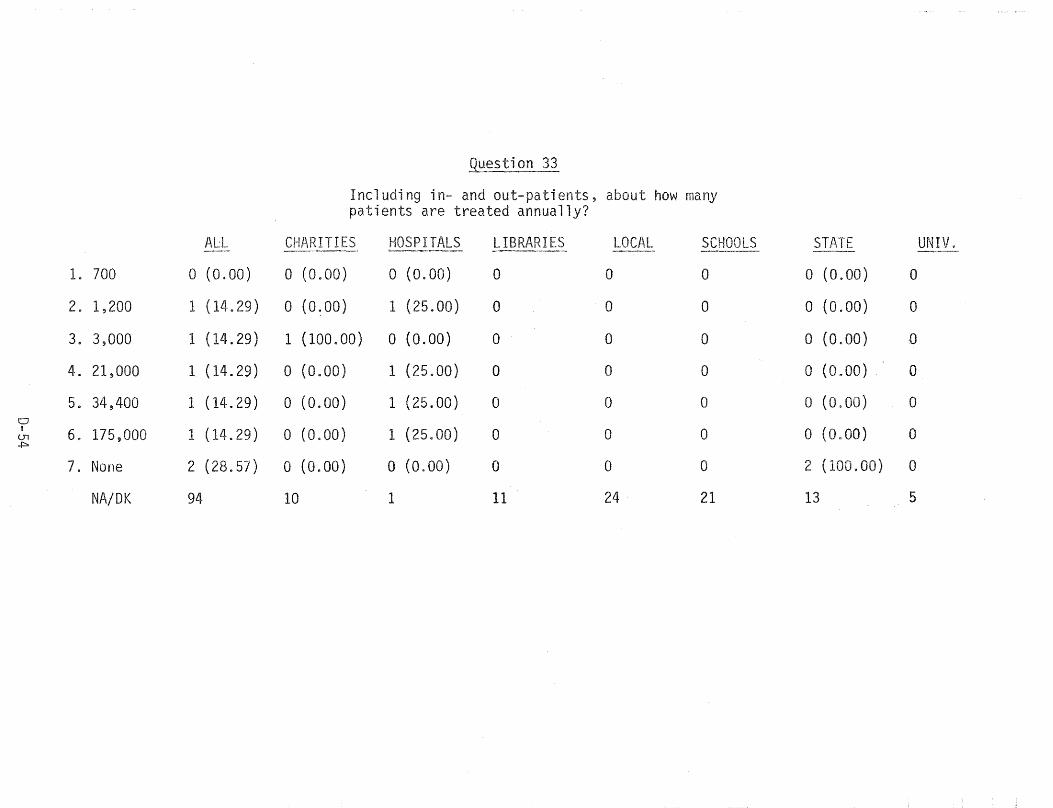
.Question 33
Including in- and out-patients, about how many patients are treated annually?
ALL CHARITIES HOSPITALS LIBRARIES LOCAL SCHOOLS STATE UN ~ ---- ----
I. 700 o (0.00) o (0.00) a (0.00) a 0 0 o (0.00) 0
2. 1,200 1 (14.29) o (O~OO) 1 (25.00) 0 0 0 o (0.00) 0
3. 3,000 1 (14.29) 1 (100.00) o (0.00) a ° a o (0.00) 0
4. 21,000 1 (14.29) o (0.00) 1 (25.00) 0 ° ° o (0.00) 0
5. 34,400 1 (14.29) o (0.00) 1 (25.00) a 0 ° a (0.00) 0 0 I 6. 175,000 1 (14.29) a (0.00) 1 (25~00) ° a a o (0.00) a U1
..f.::>
7. None 2 (28.57) o (0.00) o (0.00) 0 0 a 2 (100.00) 0
NA/DK 94 10 1 11 24 21 13 5

.Question 34
) Approximately how many students are school durinq the past academic year?
CHARITIES HOSPITALS LIBRARIES LOCAL SCHOOLS STATE UNIV. ---, ---
I. < 200 2 (7.69) 1 (100. 0 0 0 1 (5.00) 0 o (0. 00)
2. 201-300 1 (3 84) a (0.00) 0 0 0 1 (5.00) 0 o (0.00)
3. 301-400 9 (34.62) o (0.00) 0 0 0 9 (45.00) 0 o (0.
4. 1 (3. ) o (0. ) 0 0 a 1 (5.00) a o (0.
5. 501-600 3 (11.54) o (0.00) 0 0 0 3 (15.00) 0 o (0.00)
01 6. 60 700 3 (11.54) o (0.00) a 0 0 2 (10.00) a 1 (20.00)
0'1
7. 701-800 3 (11.54) o (0.00) a 0 0 3 (15.00) 0 o (0.00)
8. 2,000 1 (3.84) o (0.00) 0 0 0 o (0.00) 0 1 (20. 00)
9. 3~000 1 (3.84) o (0.00) ° ° 0 ° (0.00) ° 1 (20.00)
10. 6,000 1 (3 84) ° (0.00) 0 0 0 o (0.00) 0 1 (20.00)
11. 55,000 1 (3.84) o (0.00) 0 0 0 o (0.00) a 1 (20.00)
12. NA/DK 75 19 5 11 24 1. 15 0

o I
(J1 CJ)
1. Yes
2. No
3. NA/DK
Question 35
Does your school provide any educational services that require extensive use of local telephone service?
ALL CHARITIES HOSPITALS LIBRARIES LOCAL SCHOOLS
7 (25.93) o (0.00) 0 0 0 6 (30.00)
20 (74.07) 1 (100.00) 0 0 0 14 (70.00)
74 19 5 11 24 1
STATE UNIV.
0 1 (20.00)
0 4 (80.00)
14 0
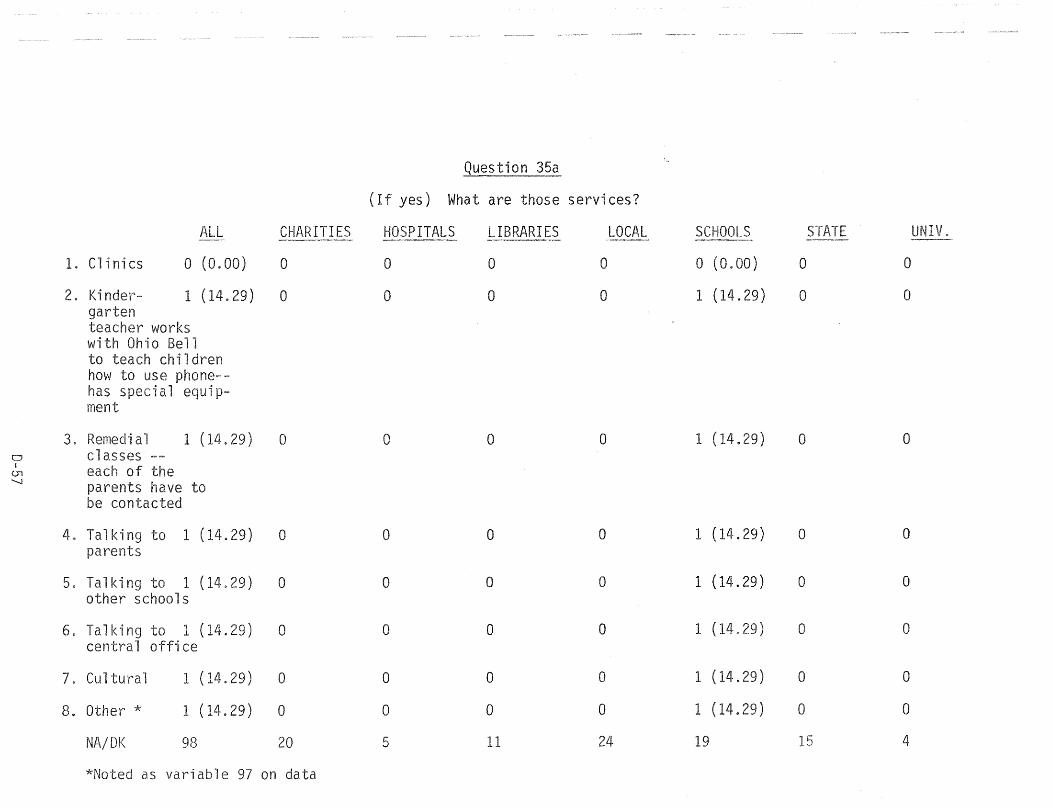
.Question 35a
( I f yes) What are those services?
ALL CHARITIES HOSPITALS LIBRARIES LOCAL SCHOOLS STATE UNIV. ---- ~-,-,- --- --......--,-~
1. Clinics a (0.00) 0 0 0 0 a (0.00) 0 0
2. Kinde¥'- 1 (14.29) 0 0 a 0 1 (14.29) 0 0 garten teacher works with Oh-io Bell to teach children how to use phone--has s al ment
3. Remedial 1 ( .29) 0 0 0 0 1 (14.29) 0 0 0 classes -I each of (J1 '-l parents have to
be contacted
4. Talking to 1 (14.29) 0 0 0 0 1 (14.29) 0 0 parents
5. Talking to 1 (14.29) 0 0 0 0 1 (14.29) 0 0 other schools
6. Talking to 1 ( .29) 0 0 0 0 1 (14.29) 0 0 central office
7. Cultural 1 (14.29) 0 0 0 0 1 (14.29) 0 0
8. Other * 1 (14.29) 0 0 0 0 1 (14.29) 0 0
NA/DK 98 20 5 11 24 19 15 4
*Noted as variable 97 on data
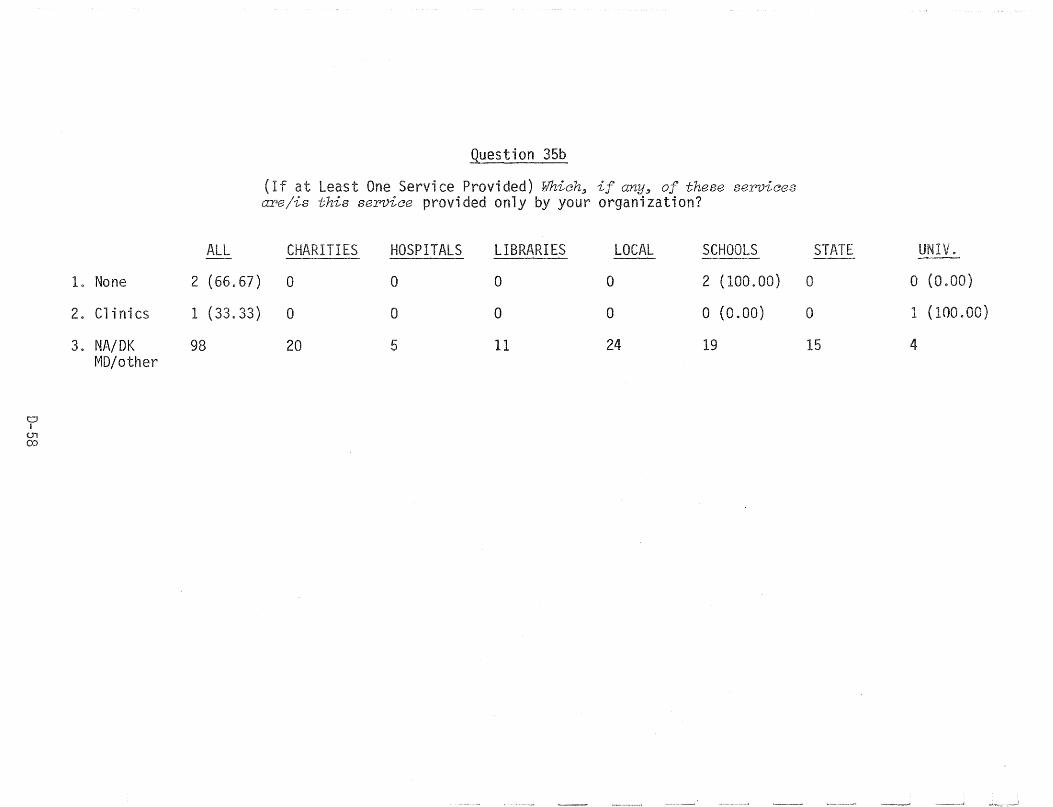
o I
U1 (X)
1. None
2. Clinics
3. NA/DK MD/other
ALL
2 (66.67)
1 (33.33)
98
Question 35b
(If at Least One Service Provided) Which3 if anY3 of these services are/is this service provided only by your organization?
CHARITIES HOSPITALS LIBRARIES LOCAL SCHOOLS ---a 0 0 a 2 (100.00)
0 a a 0 a (0.00)
20 5 11 24 19
STATE UNIV.
a o (0.00)
a 1 (100.00)
15 4
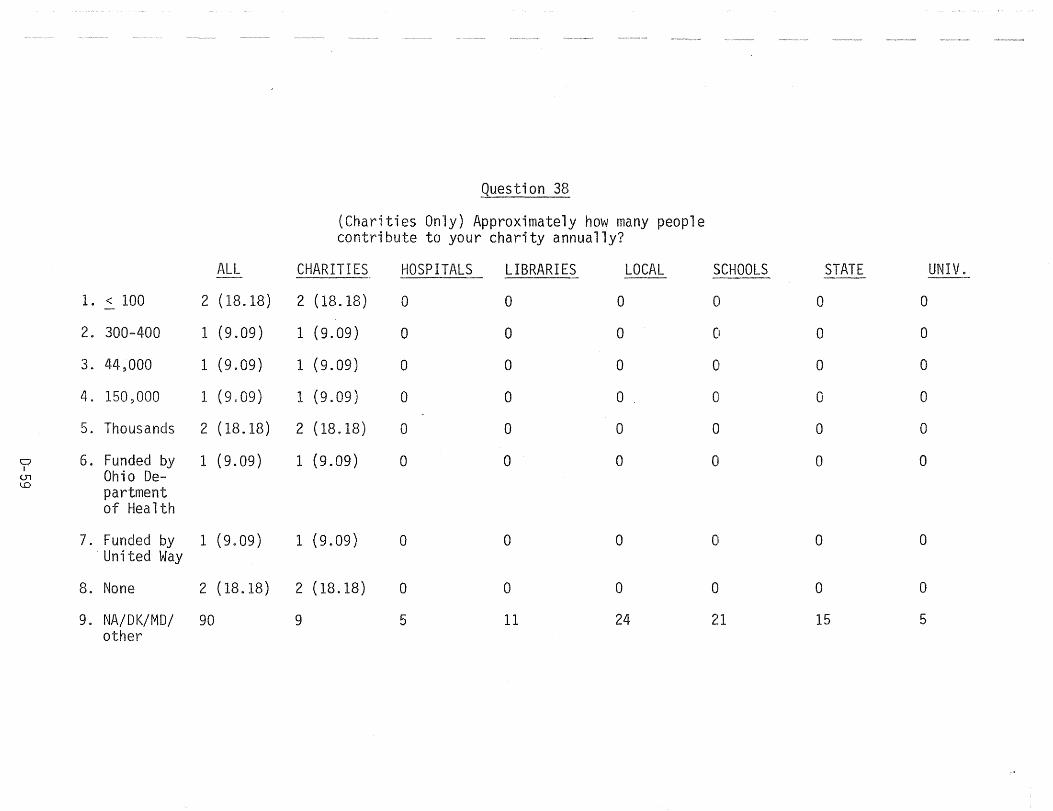
.Question 38
(Charities Only) Approximately how many people contribute to your charity annually?
ALL CHARITIES HOSPITALS LIBRARIES LOCAL SCHOOLS STATE UNIV.
1. < 100 2 (18.18) 2 (18.18) 0 0 0 0 0 0
2. 300-400 1 (9.09) 1 (9.09) 0 0 0 0 0 0
3. 44,000 1 (9.09) 1 (9.09) 0 0 0 0 0 0
4. 150,000 1 (9.09) 1 (9.09) 0 0 0 0 0 0
5. Thousands 2 (18.18) 2 (18.18) 0 0 0 0 0 0
0 6. Funded by 1 (9.09) 1 (9.09) 0 0 0 0 0 0 I
Ohio De-U1 1.0 partment
of Health
7. Funded by 1 (9.09) 1 (9.09) 0 0 0 0 0 0 United Way
8. None 2 (18.18) 2 (18.18) 0 0 0 0 0 0
9. NA/DK/MD/ 90 9 5 11 24 2~ 1 15 5 other
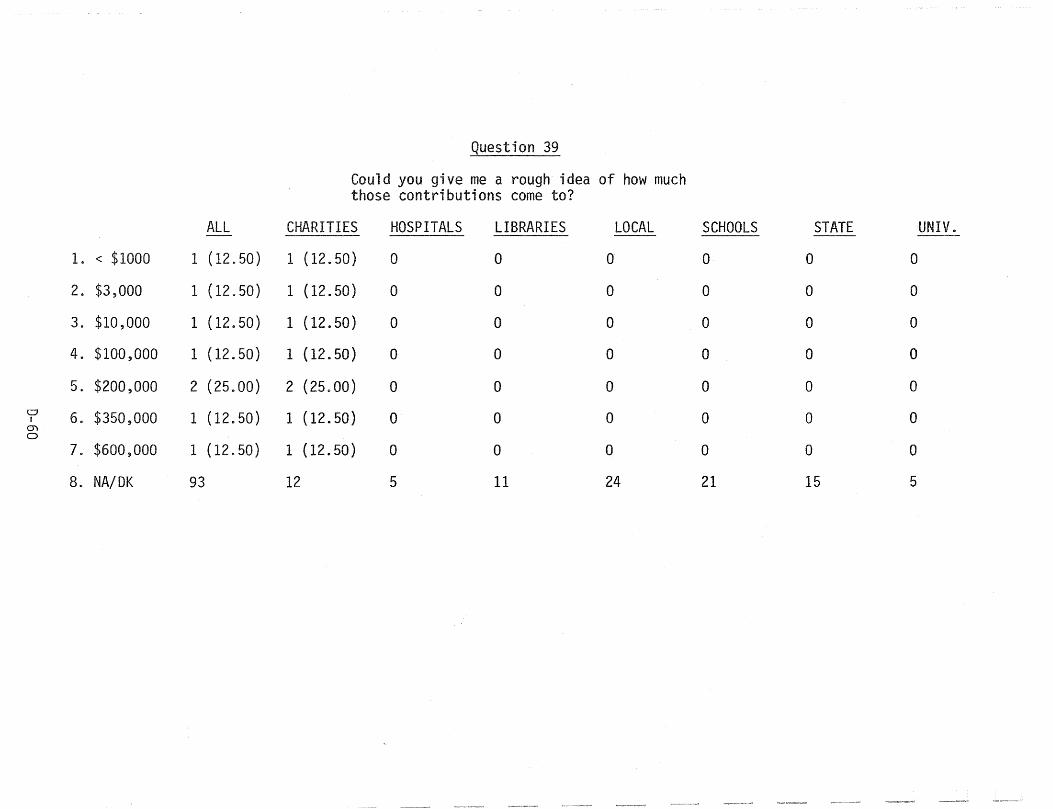
Question 39
Could you give me a rough idea of how much those contributions come to?
ALL CHARITIES HOSPITALS LIBRARIES LOCAL SCHOOLS STATE UNIV. --I. < $1000 1 (12.50) 1 (12.50) ° 0 ° ° ° ° 2. $3,000 1 (12.50) 1 (12.50) ° ° ° ° ° ° 3. $10,000 1 (12.50) 1 (12.50) ° ° ° 0 ° ° 4. $100,000 1 (12.50) 1 (12 .. 50) ° ° ° ° ° ° 5. $200,000 2 (25.00) 2 (25.00) ° ° ° ° 0 °
0 6. $350,000 1 (12.50) 1 (12.50) ° ° ° ° ° ° ! O't 0
7. $600,000 1 (12.50) 1 (12.50) 0 ° ° 0 0 ° 8. NA/DK 93 12 5 11 24 21 15 5
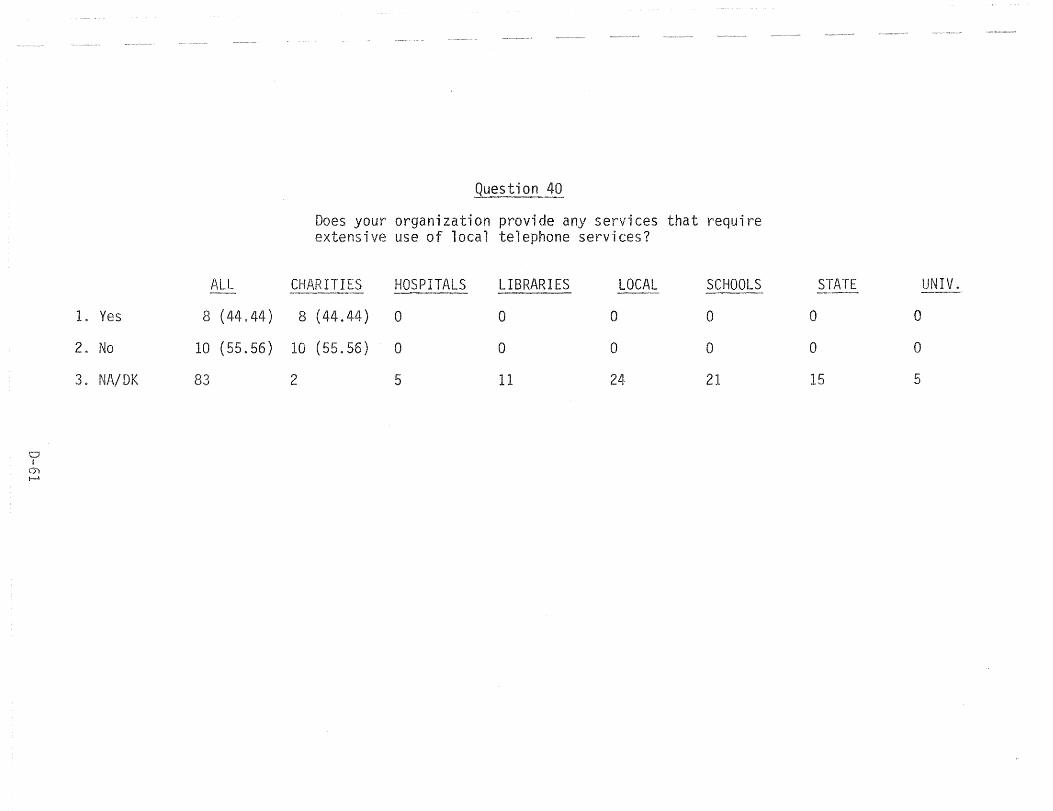
0"1 ........
1. Yes
2. No
3. NA/DK
ALL
8 (44.44)
10 (55.56)
83
Question 4Q
Does your organization provide any services that require ive use of local telephone services?
CHARITIES HOSPITALS LIBRARIES LOCAL SCHOOLS STATE UNIV. --- --"
8 (44.44) 0 0 0 0 0 0
10 (55.56) 0 0 0 0 0 0
2 5 11 24 21 15 5
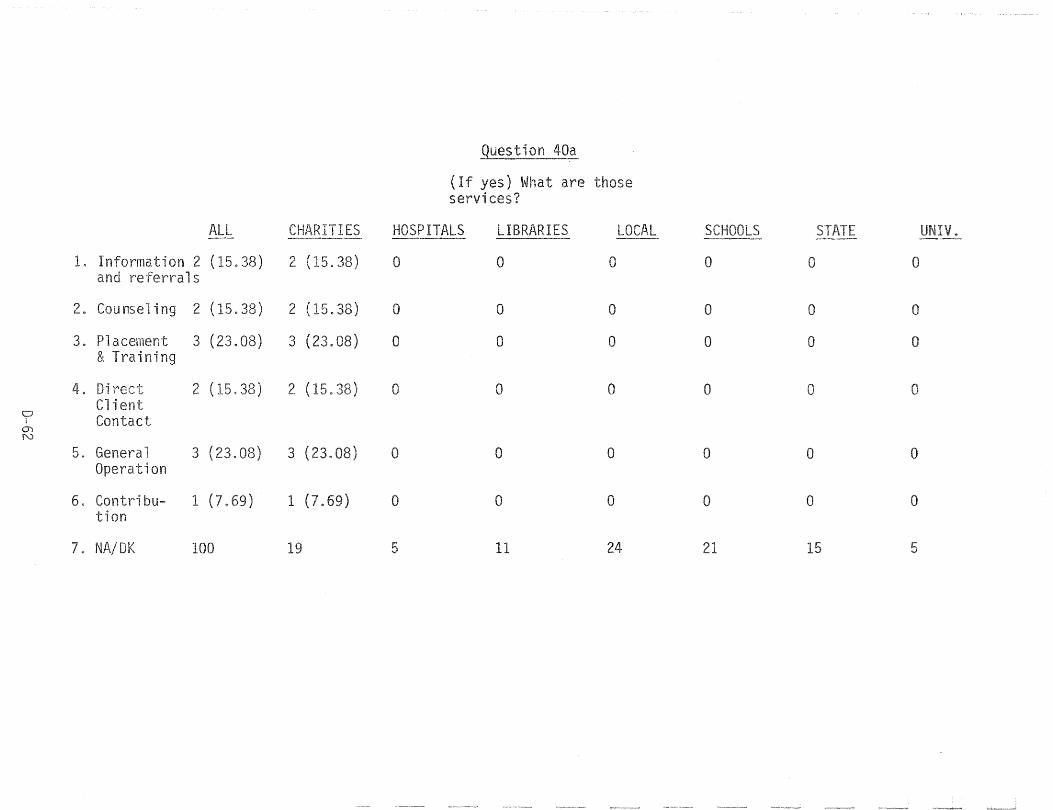
Que~tion 40a
yes) What are servi
ALL ES HOSPITALS LIBRARIES SCHOOLS ---- -'~.-
1. Information 2 (15. 2 38) 0 0 0 0 0 0 s
2. ing 2 (15. 2 5.38) 0 0 0 0 0 0
3. acement 3 (23.08) 3 a 0 0 a 0 0 & Training
4. 2 ( 2 ( ) 0 0 0 0 0 0 Client
0 Contact i
5. 3 08) 3 (23.08) 0 0 0 0 0 0 Operation
6. Contri 1 (7. 1 (7. 0 0 0 0 0 0
7. OK 100 5 11 24 21 15 5
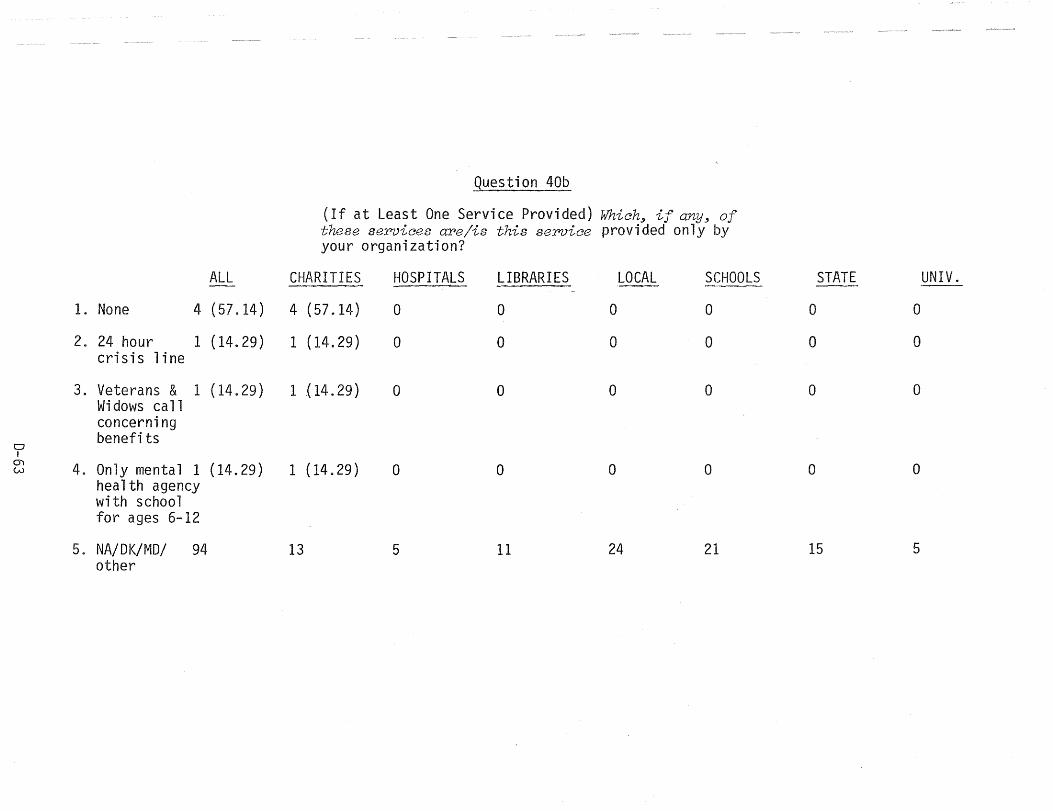
Question 40b
(If at Least One Service Provided) Which3 if anY3 of these services aPe/is this service provided only by your organization?
ALL CHARITIES HOSPITALS LIBRARIES LOCAL SCHOOLS STATE UNIV.
1. None 4 (57.14) 4 (57.14) 0 0 0 0 0 0
2. 24 hour 1 (14.29) 1 (14.29) 0 0 0 0 0 0 cri sis 1 i ne
3. Veterans & 1 (14.29) 1 (14.29) 0 0 0 0 0 0 Wi dows ca 11 concerning
D benefits
! Ci)
4. Only mental 1 (14.29) 1 (14.29) 0 0 0 0 0 0 w health agency with school for ages 6-12
5. NA/DK/MD/ 94 13 5 11 24 21 15 5 other


APPENDIX E
THE NOMINAL GROUP TECHNtQUE
E-1

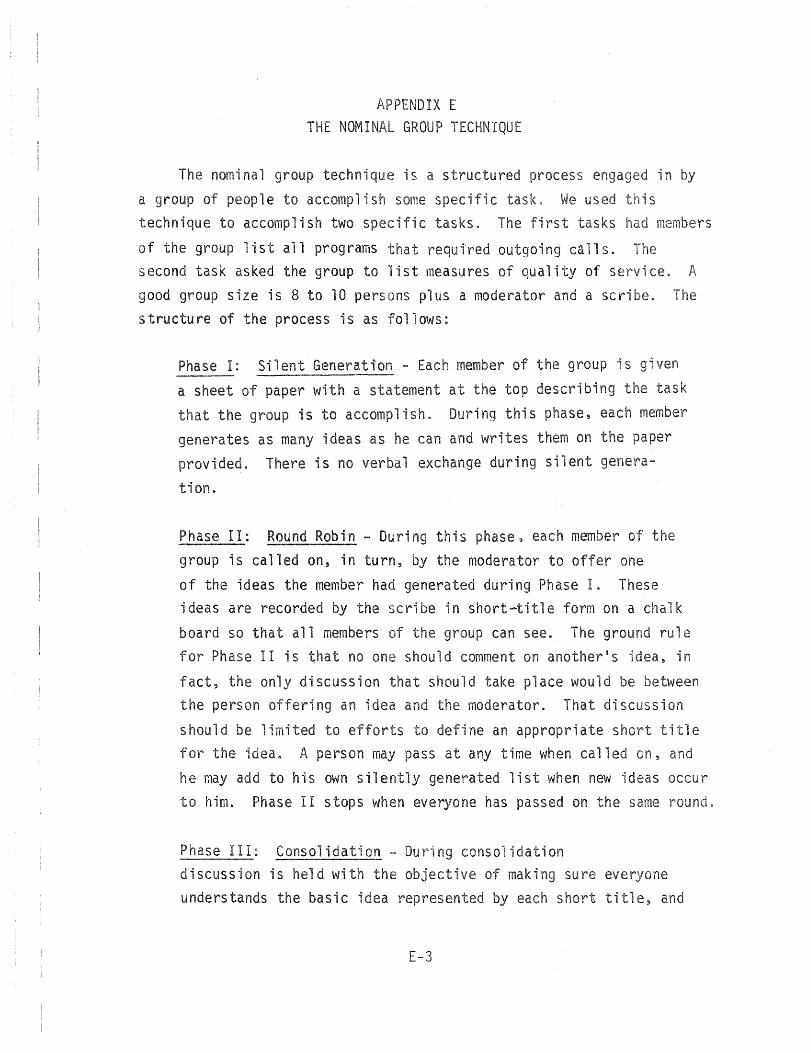
APPENDIX E THE NOMINAL GROUP TECHNIQUE
The nominal group technique is a structured process engaged in by
a group of people to accomplish some specific task. We us is technique to accomplish two specific tasks. The first tasks members
of the group list all programs that required outgoing calls. The second task asked the group to list measures of quality of service. A good group size is 8 to 10 persons plus a moderator and a scribe. The structure of the process is as follows:
Phase I: Silent Generati'on - Each member of the group is given
a sheet of paper with a statement at the top describing the task
that the group is to accomplish. During this phase, each member
generates as many ideas as he can and writes them on the paper
provided. There is no verbal exchange during silent genera
tion.
Phase II: Round Robin - During this phase, each member the group is called on, in turn, by the moderator to offer one
of the ideas the member had generated during Phase I. These ideas are recorded by the scribe in short-title form on a chalk
board so that all members the group can see. The ground rule for Phase II is that no one should comment on another1s idea, in
fact, the only discussion that should take place would be between the person offering an idea and the moderator. That discussion
should be limited to efforts to define an appropriate short ti e for the ideao A person may pass at any time when called on, and
he may add to his own silently gener'ated list when new ideas occur
to him. Phase I I s tops when everyone has passed on the same
Phase III: Consolidation - Du consolidation discussion is held with the objective of making sure everyone understands the basic idea represented by each short title, and
E-3
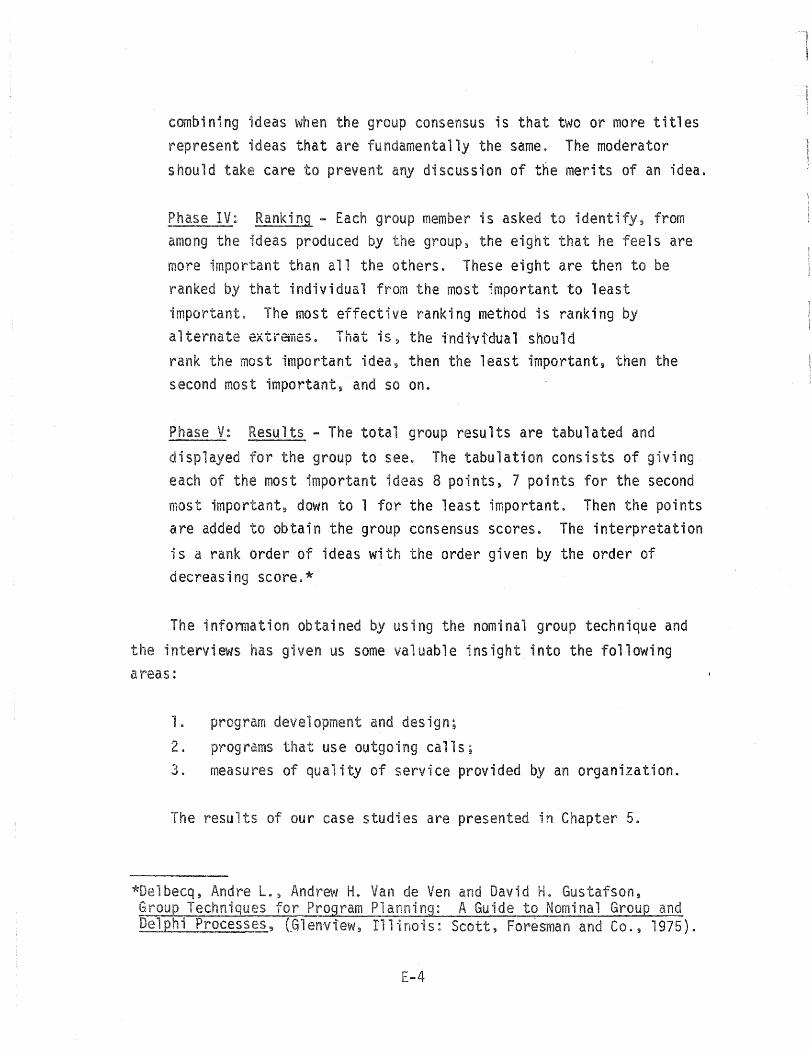
combining ideas when the group consensus is that two or more titles ideas that are fundamentally the same. The moderator
should care to prevent discussion of the merits of an idea.
Phase IV: Ranking ... Each group member is asked to identify, from among the ideas produced by group, the eight that he feels are more important than all the others. These eight are then to be ranked by that individual from the most important to least important The most effective ranking method is ranking by alternate extremes. That is, the i"ndfvi'dual sn.ould rank the most important idea, then the least important, then the second most important, and so on.
Phase V: Results - The total group results are tabulated and displayed for the group to see. The tabulation consists of giving each of the most important ideas 8 points, 7 points for the second most important, down to 1 for the least important. Then the points are added to obtain the group consensus scores. The interpretation
is a rank order of ideas with the order given by the order of decreasing score.*
The information obtained by using the nominal group technique and interviews has given us some valuable insight into the following
areas:
1. program development and design; 2. rams that use outgoing calls; 3. measures of quality of service provided by an organization.
resul of our case studies are presented in Chapter 5.
becq, Andre L., Andrew H. de Ven and David He Gustafson, Group Techniques f~r Program Planning: A Guide to Nominal Group and DelRhi Processes, CGlenvtew, Illinois: Scott, Foresman and Co.!) 1975}.
4

APPENDIX F
SUMMARY OF RESULTS OF MAIN STUDY: CLEVELAND AND CINCINNATI
F-l

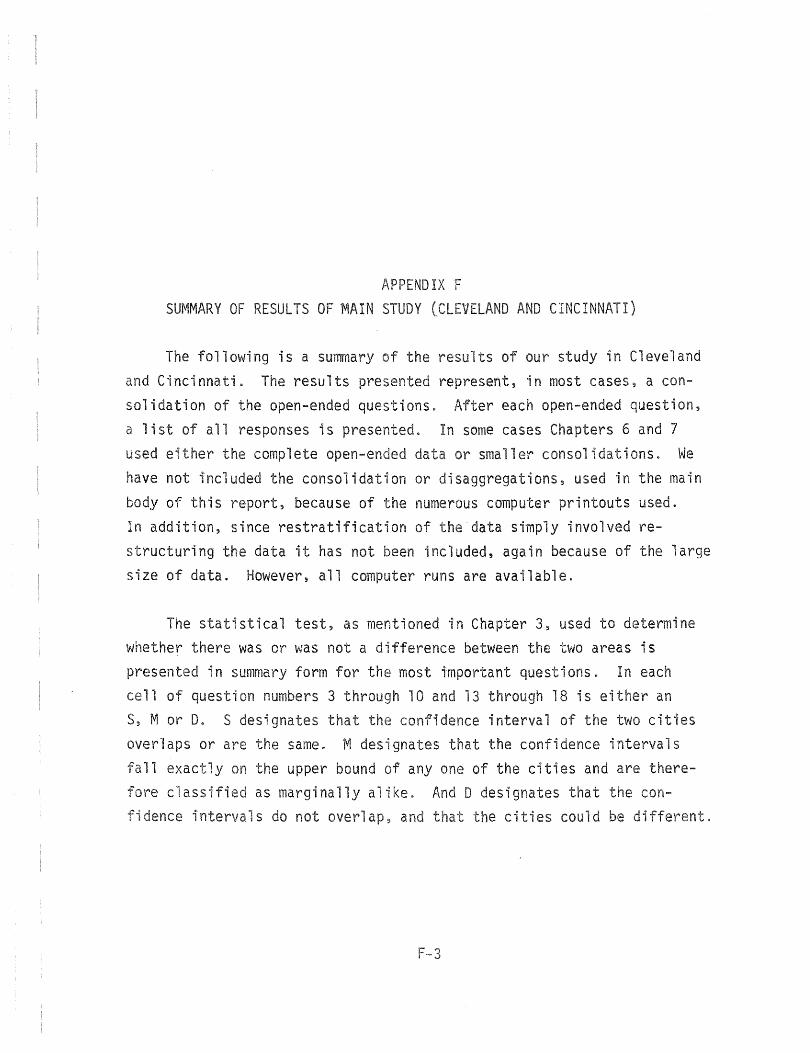
t~PPEND IX F SUMMARY OF RESULTS Of MAIN STUDY (CLEVELAND AND CINCINNATI)
The following is a summary of the results of our study in Cleveland Cincinnati~ The results presented represent, in most cases, a con
solidation of the open-ended questions. After each open-ended question, a 11 of all responses is presented. In some cases Chapters 6 and 7 used e"ither the complete open-ended data or smaller consolidations. We have not included the consolidation or disaggregations, used in the main body of this report, because of the numerous computer printouts used. In addition, since restratification of the'data simply involved restructuring the data it has not been included, again because of the large size of data. However, all computer runs are available.
The statistical test, as mentioned in Chapter 3, used to determine whether there was or was not a difference between the two areas is presented in summary form for the most important questions. In each
1 of question numbers 3 through 10 and 13 through 18 is either an S, M or D. S designates that the confidence interval of the two cities overlaps or are the same. M designates that the confidence intervals
1 exactly on the upper bound of anyone of the cities and are therefore assified as marginally alike. And 0 designates that the con-
dence intervals do not overlap, the cities could be different.
F-3

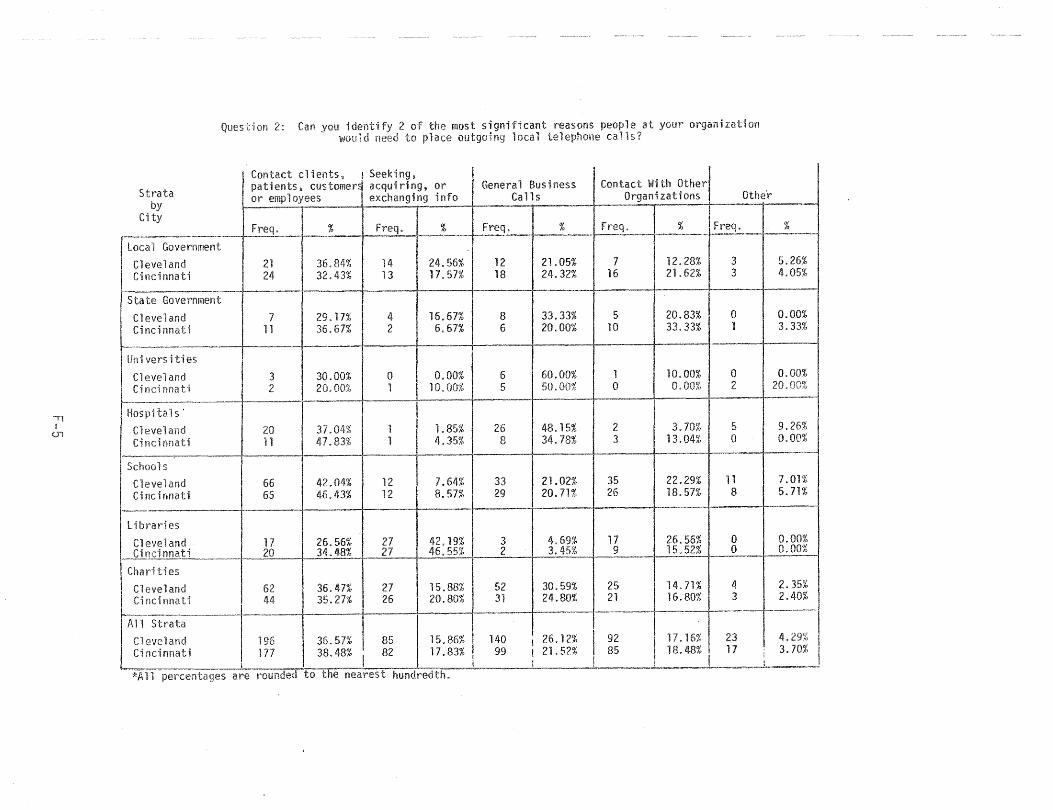
2 of the most significant reasons people at your oraol'llzatio!1 to l;lace outqoi local
Strata I ~;"~;P!~ie~~"~-"'-'l ~~:::~girg i:fO General BUSiness:!;;ntact With Other
by Ca 11 s 0 rga n i za ti ons I Othe'r
City Freq. 1._ --::== Fr.; ] "- % 'req I %
36.84% 14 24.56% 12 21.05% 7 12.28% 3 5. 32.43% 13 17.57% 18 24.32% 16 21.62% 3 4.
17% 4 16.67% 8 33.33% 5 20.83% 0 0.00% 67% 2 6.67% 6 20.00% 10 33.33% 1 3.33%
-_.
I 0.00% 6 60.00% 1 10.00% 0 0.00%
10.00% 5 50.00% 0 0.00% 2 20. +---.
m I \...r n::;vc; tUiiU "''-' v "" I I .. 85% 26 48.15% 2 3.70% 5 9.26%
- .. ____ I
8 34.78% 3 13. 0 0.00% -I
7.64% I 33 21.02% f 22. 11 7.01% 8.57% 29 20.71% 26 18.57% 8 5.71%
-t-0.00% 0.00%
47% 27 15.88~_52 t~59~ Z' __ ~'" r 4 -t 2.35% 27% 26 20.80% 31 24.80% 21 16.80% 3 2.40% -- -- -- -- -- --
26. 12% I 92 I 17. 16% 23 4.29% ,21,52% ! 85 18.48% 17 : 3.70%
are
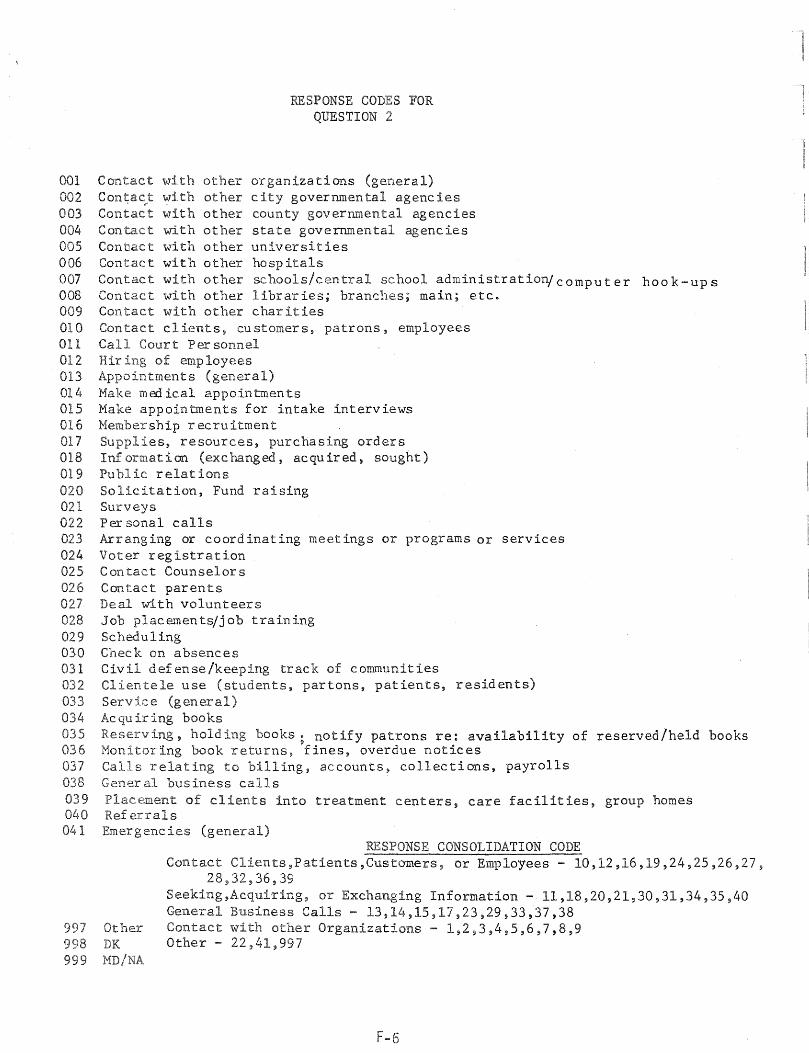
RESPONSE CODES FOR QUESTION 2
001 Contact with other organizations (general) C other city governmental agencies
003 Contact 'lA7ith other county governmental agencies 004 Contact with other state governmental agencies 005 Conbact with other universities 006 Contact with other hospitals 007 Contact with other schools/central school administration; computer hook-ups 008 Contact with other libraries; branches; main; etc. 009 Contact with other charities 010 Contact clients, customers, patrons, employees 011 Call Court Personnel 012 Hir of employees 013 Appointments (general) 014 Make medical appoin tmen ts 015 Make appointments for intake interviews 016 Membership recruitment 017 fes, resources, purchasing orders 018 Information (exchanged, acquired, sought) 019 Public relations 020 Solicitation, Fund raising 021 Surveys 022 Personal calls 023 Arranging or coordinating meetings or programs or services 024 Voter registration 025 Contact Counselors 026 Contact parents 027 Deal with volunteers 028 Job placements/job traini.ng 029 Scheduling 050 Check on absences 031 Civil defense/keeping track of communities 032 Clientele use (students, partons, patients, residents) 033 Service (general) 034 Acquiring books 035 Reserving, hold books; notify patrons re: availability of reserved/held books 036 Monitoring book returns, fines, overdue notices 037 Calls relating to billing, accounts; collections, payrolls 038 General business calls 039 'Placement of clients into treatment centers, care facilities, group homes 040 Ref errals 041 Emergencies (general)
997 Other 998 DK 999
RESPONSE CONSOLIDATION CODE Contact Clients,Patients,Customers, Or Employees - 10,12,16~19,24,25,26,27,
28,32,36,39 Seeking ,Acquiring, or Exchanging Information - 11,18,20,21,30,31,34,35,40 General Business Calls - 13,14,15,17,23,29,33,'37,38 Contact with other Organizations - 1,2,3,4,5,6,7,8,9 Other - 22,41,997
F-6
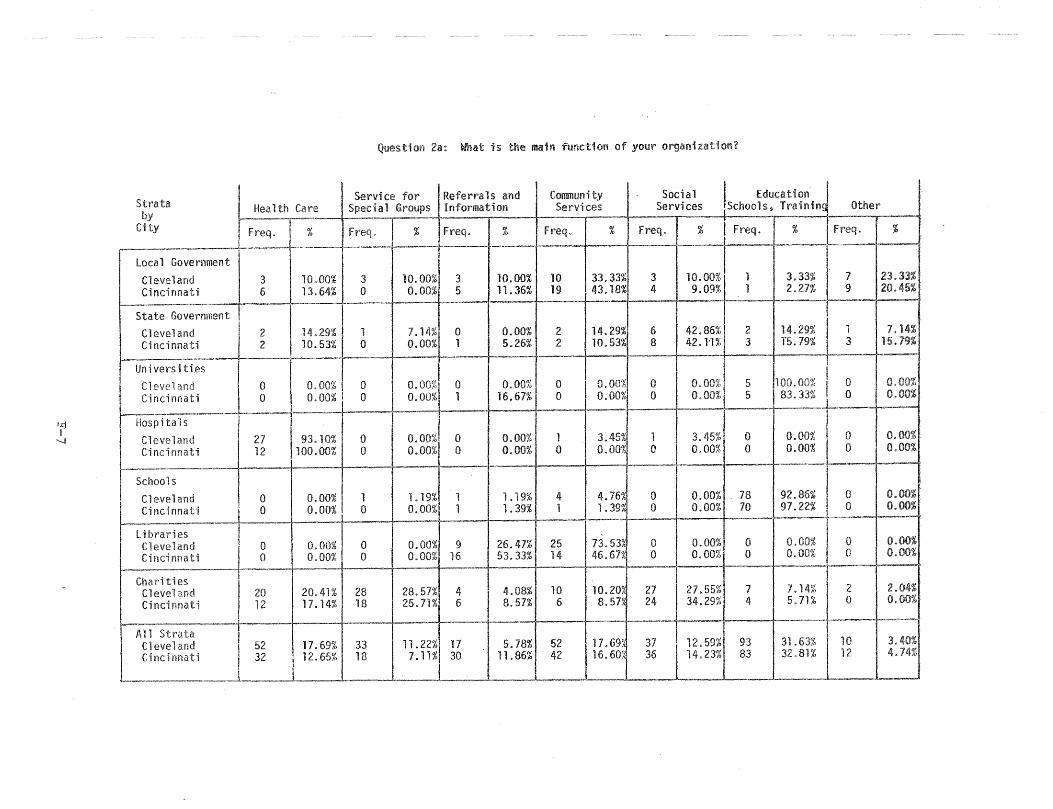
~.rj
I --.J
Strata by
City
All Strata Cleveland Cincinnati
2a: What is the main function of your organization?
Referrals and I' (:"~~cial I Education I !--______ ~. Information ~Vices 4$Ch001S, Tra~ ~ther
I ~r;-I Freq. l~ U_ f.F FrrMeqL. -.. ' % % Freq. .-+-----t--.. -.---f~-.. ---t-. ---
52 32
1 o
o o
o
o o
8
10.00% 0.00%
3 5
7.14%1 0 0.00% 1
o. a o. 1
0.00%11 0 0.00% a
1.19% 0.00%
o.OO%f 9 0.00% 16
28.57%1 4 25.71%1 6
n.22%1 17 7.11% 30
% Ft'eq.
10.00% I· 10 11.36% 19
0.00% 5.26%
0.00% 16.67%
0.00% 0.00%
1.19% 1.39%
2 2
o a
1 o
4 1
26.47% I 25 53.33%1 14
4.08% I 10 8.57% 6
5.78% 52 n 42
%
33.33% 43.18%
14.29% 10.53%
0.00% 0.00%
3. O.
~-'-:----t--· -.. -~ 3 110.00%1 1 I 3.33% 7 123 . 33% 4 9.09% 1 2.27% 9 20.45%
6 8
o o
1 a
o o
o o
27 24
37 36
.-/ I I ~....----l!-.-.---Ii
42.86~; 42.1'1%
o.oo~;
0.00%
3.45~; o.om;
~ I}U~W_1_ .. 5 /100.00% ,,! a 5 I 83.33% 0
o -.T::. o. 00% L, ~ o ~ 0
0.00%1 78 0.00% 70
a a
0.00% 0.00%
27. 55'h 34.29%
o o
7 4
0.00% 0.00%
7.14% 5.71%
o a
2 o
7.14% 15.19%
0.00% 0.00%
0.00% 0.00%
0.00% 0.00%
0.00% 0.00%
2.04% 0.00%
. I ~--t--·-~~~
12.59~hl 93 14.23% 83
31.63% 32.81%
10 12
3.40% 4.74%
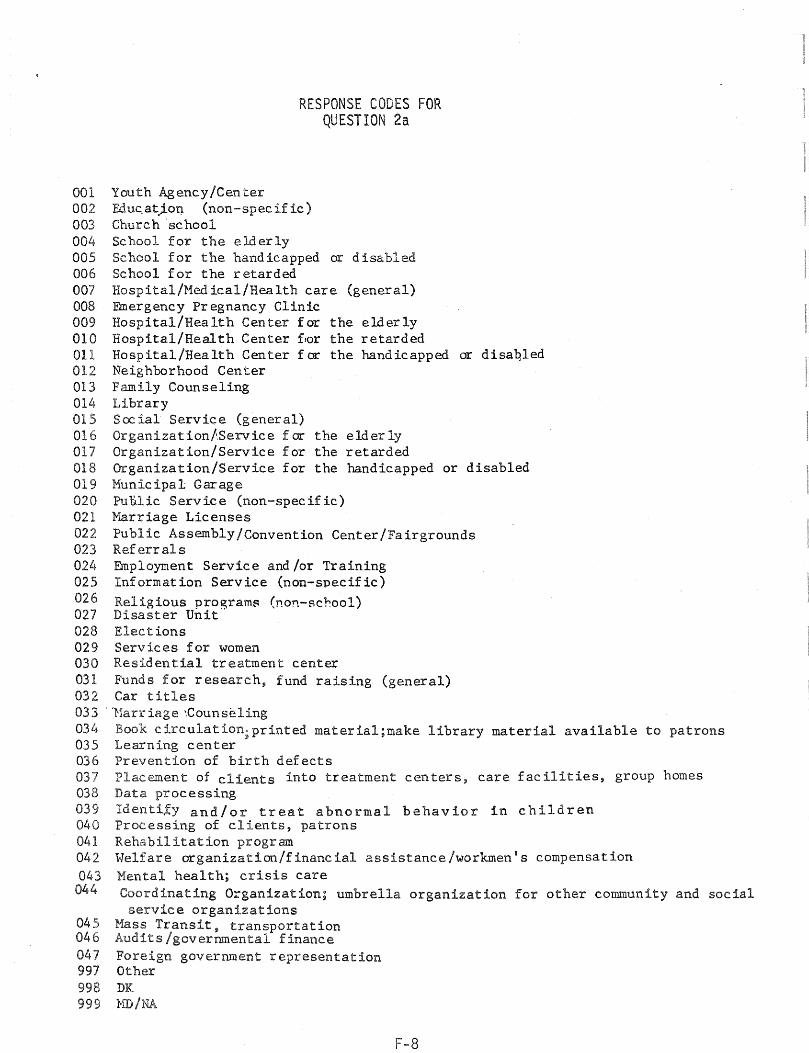
001 002 003 004 005 006 007 008 009 010 all 012 013 014 015 016 017 018 019 020 021 022 023 024 025 026 027 028 029 030 031 032 033 034 035 036 037 038 039 040 041 042 043
044
045 046 047 997 998 999
RESPONSE CODES FOR QUESTION 2a
Youth Agency/Center Educ.atJ-oI]. (non-specific) Church ·school School for the elderly School for the handicapped or disabled School for the retarded Hospital/Hed ical/Health care (general) Emergency Pregnancy Clinic Hospital/Health Center for the elderly Hospital/Heal th Center f,or the retarded Hospital/Health Center far the handicapped or disab,led Neighborhood Center Family Counseling Library Social Service (general) Organizationf,Service f or the elder 1y Organization/Service for the retarded Organization/Service for the handicapped or disabled Municipal Garage Put.1ic Service (non-specific) Marriage Licenses Public AssemblY/Convention Center/Fairgrounds Referrals Employment Service and /01' Training Information Service (non-specific) Religious programF (non-school) Disaster Unit·· Elections Services for women Residential treatment center Funds for research, fund raising (general) Car titles
. l1ar1' iage '.Counse.ling Book circulation;printed material;make library material available to patrons Learning center Prevention of birth defects Placement of clients into treatment centers~ care facilities, group homes Data processing Identi~y and/or treat abnormal behavior in children Processing of clients, patrons Rehabilitation program Welfare organization/financial assistance/workmen's compensation Mental health; crisis care Coordinating Organization; umbrella organization for other community and social service organizations
Mass Transit, transportation Audits/governmental finance Foreign government representation Other DK MD/NA
F-8
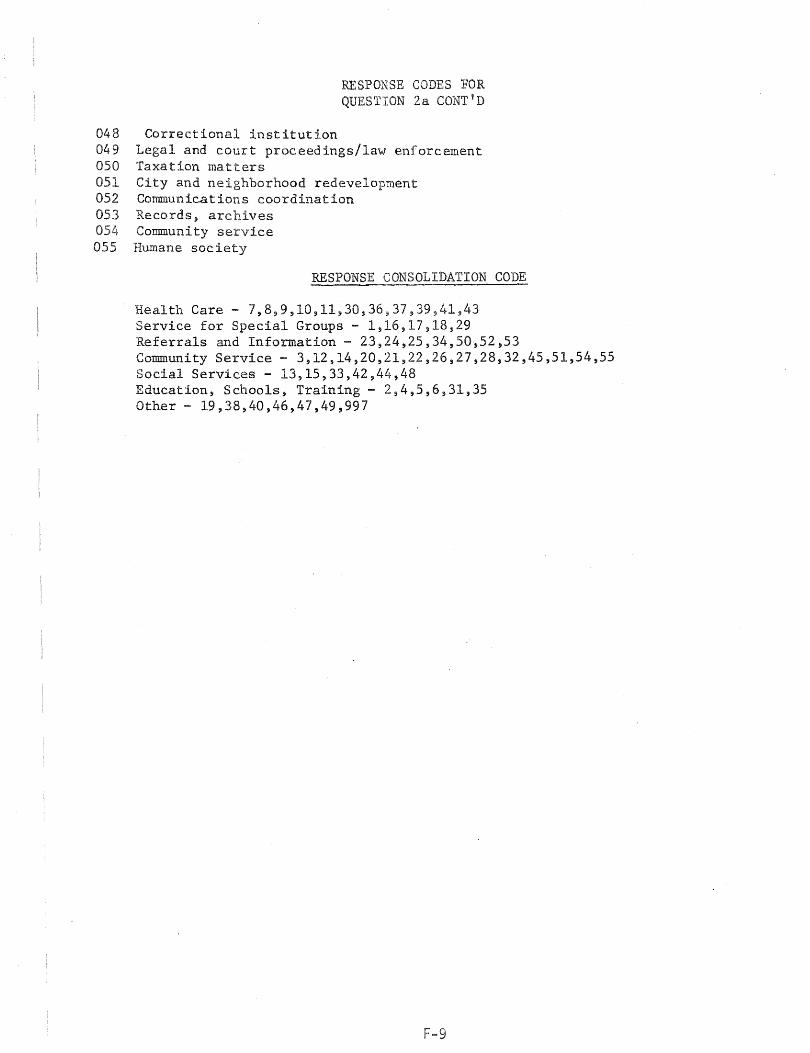
RESPONSE CODES FOR QUESTION 2a CONT'D
048 Correctional institution 049 Legal and court proceedings/law enforcement 050 Taxation matters 051 City and neighborhood redevelopment 052 Communications coordination 053 Records, archives 054 Community service 055 Humane society
RESPONSE CONSOLIDATION CODE
Health Care - 7,8,9,10,11,30,36~37,39,41,43 Service for Special Groups - 1,16,17,18,29 Referrals and Information - 23,24,25,34,50,52,53 Community Service - 3,12,14,20,21,22,26,27,28,32,45,51,54,55 Social Services - 13,15,33,42,44,48 Education, Schools, Training - 2,4,5,6,31,35 Other - 19,38,40,46,47,49,997
F-9
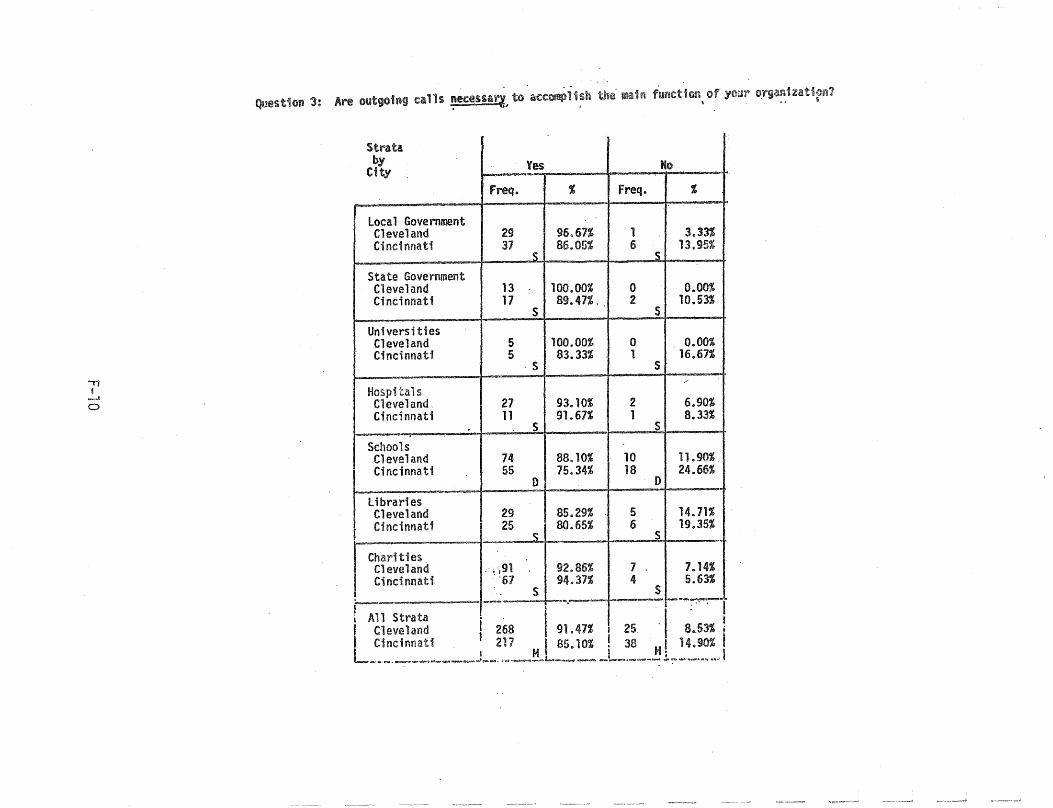
...,., !
.......lI
o
Question 3: Are outgoing calls necessatt to accomplish the ~1n function, of your
Strata by Yes No City
Freq. % freq. %
local Government Cleveland 29 96.61% 1 3.13% Cincinnati 31 86.05% 6 13.95%
s ~
State Government Cleveland 13 100.00% 0 0.00% Cincinnati 17 89.47% . 2 10.53%
S S
Universi ties Cleveland 5 100.00% 0 0.00% Cincinnati 5 83.33% 1 16.67%
S S /'
Hospitals Cleveland. 27 93.10% 2 6.90% Cincinnati 11 91.67% 1 8.33%
S S
Schools Cleveland 74 88.10% 10 11.90% Cincinnati 55 75.34% 18 24.66%
0 0
libraries Cleveland 29 85.29% . 5 14.71%
J Cincinnati 25 80.65% 6 19.35%
~ S
Char"'ities Cleveland . ,!';91 92.86% 1 . 1.14% Cincinnati '61 94.31% 4 5.63%
S S -- '-.-'~ ~--."'''-'''--''. ~
. A" ~A.. __ .A._
I Cleveland 1 268 I 91.47% ! 25 ·1 8.53% i' 1 Cincinnati. 217 (85.10%! 38 I 14.90% L_ . ..,.~o, ___ • ____ J_ ... , .......... _t!-1--___ .. _L_ •. __ -'!! 1.~ ........... ~~ .••.. 1
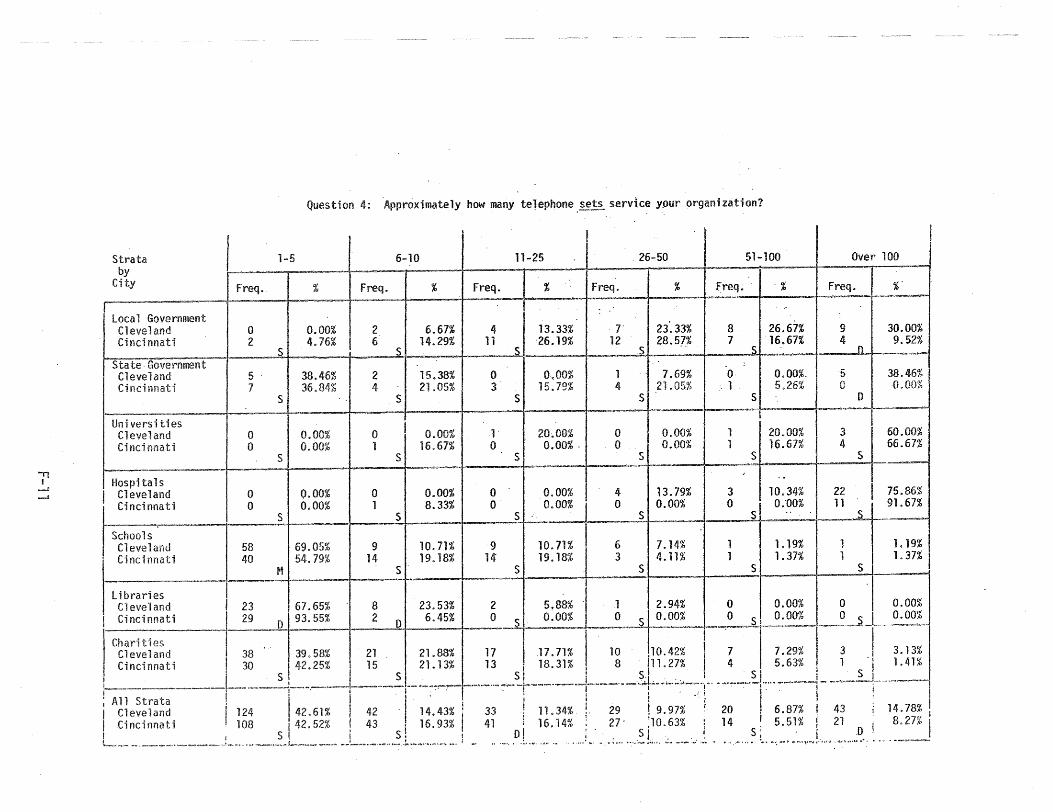
-n f
-.i
-..a
Strata by
City ~ .. '~
Local Government Cleveland Cincinnati
State Govel~nment Cleveland Cincinnati
Question 4: Approximately how many telephone ,sets service y.our organiization?
Freq.
o 2
1-5
S
%
0.00% 4.76%
5 - 38.46% 7 36.84%
S
0.00% 0.00%
6-10
freq. %
2 6
s 6.67%
14.29%
2 I 15.38% 4 - 21.05%
o i
S
0.00% 16.67%
Freq.
4 11
11-25
s
%
13.33% -26.19%
o I 0.00% 3 15)9%
1-o
S
20~OO% 0.·00% '
freq.
r 12
26-50
% ----t
2i.33% I 28.57%-S· -.
1 -I 7.69% 4 21005%
o o
S
0.00% 0.00%
51-100
Freq. - I- %
8 - I 26.67% 7 16.67%
s
0- I 0.00%--_ -, _ 5.26%
S
20.00% 16.67%
Over 100
Freq. j __ %_-_-I
9 4
5 o
3 4
D.
[)
30.00% 9.52%
38.46% -0.00%
60.00% 66.67%
U!li vers Hi es Cleveland Cincinnati
t----- .L I ~ t SI 51 ~ SI_ , I s r --
o o
s s
Hospitals Cleveland Ci rid noa t 'I
Schools Cleveland Cincinnati
o o
s
0.00% 0.00%
o 1
s
0.00% 8.33%
o o
s 0.00% 0.00%
4 o
s
13.79% 0.00%
3 o
s 10.34% 0.00%
40 54.79% 14 19.18% 14 19.18% 3 4.11% 1. 37%
22 11
.s
M S S S S S
75.86% 91.67%
1. 19% 1.37% E8 469 •05% 9 10.71% 9
110.71% 6 7.14% 1.19%
---~ I I -I libraries I U C~ev~land. I 23 67,65: 8 23.53% 2 5.88% 1 2.94: 0 0.00% 0 0.00%
~~~~--l_'-:: ___ D 93.55% 2 0 6.45% 0 sl O:~?% _~.~~~ ._!~~~ ___ ~O~~..sJ 0.00%
Charities I 1 . I I I I Cleveland 38' 39.58% 21 21.88% 17 I 11.71% 10 !1O.42% ! 7 7.29% 3 ( 3.13%
:_C_i nC_i n_n_a t_i __ l~~_~_~~: 25~~ __ ~,._ ~~_.~~.~ 3_ ~~ ~~_~~:~l% ~ __ ._~. _s)~~ :~~~_!. . .. ~_~!: .. 5~.~3% + _~~_~_' _41_%_,
; A 11 Strata ! I' I I' . I ! -: , 1 I I I C~ev~land. 1124 42.61% f 42 - 14.43% 33 11.34%;- 29 ~ 9.97% 20 : 6.87% ! 43 14.78%! I ClnClilnatl - 108 ,42.52%! 43 i 16.93% 41 16.14%;. 27- ;10.63% 14 ~ 5.51% ! 21 i 8.27% I ! I S I IS. 0 ! I SIS I . I _D . L..,...", .... --. --.., ...,-...._~_ .............. _-"" ............. ~~!_ ..... to •• .... '"._...,..I ......... .f-..,. . ..,.~"--... ................... __ l __ .... _, ... _ •. _ ..... ~ ........ ""'................. .... _ ...... ~ ..•• ~ ......... .,.'... ',' ............. 0 : ....... '.'._ .~,.", .: ... _ .. _ :w' ... ~ ........ ', , ..... ", ........ A-: ..... '1' .. t>',., .... .t l":.~I·oof .. ~."'~.' ... .. r', .. -- - ---~-
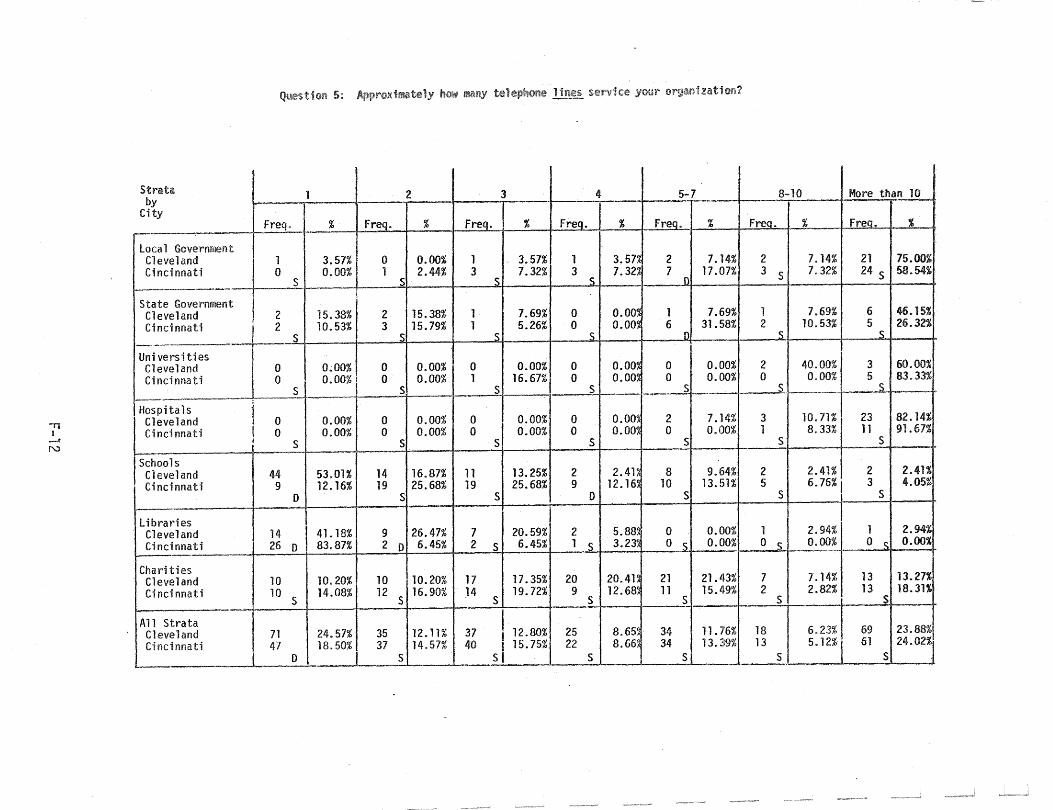
'l"1 I
......II
f'\..')
Strata by
City
local Government Cleveland Cincinnati
State Government Cleveland Cincinnati
----Un; versities Cleveland Ci nci nnati
----~-
Hospitals
Cincinnati ~e1and
I Schools Cleveland
. Cincinnati
Libraries Cleveland Cincinnati
1---.
Charities Cleveland Cincinnati
An Strata Cleveland Cincinnati
5:
J
~ 1
freq. %
1 3.57% 0 0.00%
S I :
I 15.38% I 2
I 2 10.53% S
I 0,00% I 0
I 0 0.00% i S
i I 0 0.00%
0 0.00% j
S
44 53.01% I 9 12.16% I
0
14 \ 41. 18% 26 0 83.87%
10 10.20% . 10 S 14.08%
71 24.57% 47 18.50%
0
how mtUi,Y
2 3
freq. % f~ %
0 0.00% 1 3.57% 1 2.44% 3 7.32%
S s
2 15.38% 1 7.69% 3 15.79% 1 5.26%
S S
0 0.00% 0 0.00% 0 0.00% 1 16.67%
S S
0 0.00% 0 0.00% 0 0.00% 0 0.00%
S S
14 16.87% 11 13.25% 19 25.68% 19 25.68%
S S
9 26.47% 7 20.59% 2 0 6.45% 2 S 6.45%
10 10.20% 17 17.35% 12 16.90% 14 19.72%
S S
I 35 12.11% 37 i 12.80% 37 14.57% 40 S I 15.75%
S
$~r,rI ce your
4 J
5-7 8-10 More than 10
freq. % Freo. % freo. % _ Freij. %
1 3.5n 2 7.14% 2 7.14% 21 15.00% 3 ~ 7. 32~ 7 n 17.07% 3 S 7.32% 24 S 58.54%
0 O.OO~ 1 7.69% 1 7.69% 6 46.15% 0 o.oo~ 6 31. 58% 2 10.53% 5 26.32%
S I) S S
40.QO% I 3 0 O.OO~ 0 0.00% 2 60.00% 0 o.om 0 0.00% 0 0.00% 5 83.33%
S S S S
10.71% 1 23 0 o.om 2 7.14% 3 82.14% 0 0.00~ 0 0.00% 1 8.33% 11 91.67%
S S S s
2 2. 41~ 8 9.64% 2 2.41% 2 2.41% 9 12. 16~ 10 13. !51% 5 6.76% I 3 4.05%
0 S S S
I 2 5.8m 0 0.00% 1 2.94% 1 2.94% 1 S 3.23~ o s 0.00% o S 0.00% o s 0.00%
20 20. 41~ 21 21.43% 7 7.14% 13 13.27% 9 12. 68~ 11 15.49% 2 2.82% 13 18.31%
S S S S
25 8.65~ 34 11. j'6% 18 6.23% 69 23.88% 22 8.66~ 34 13.3:9% 13 5.12% 61 24.02%
S S S S --
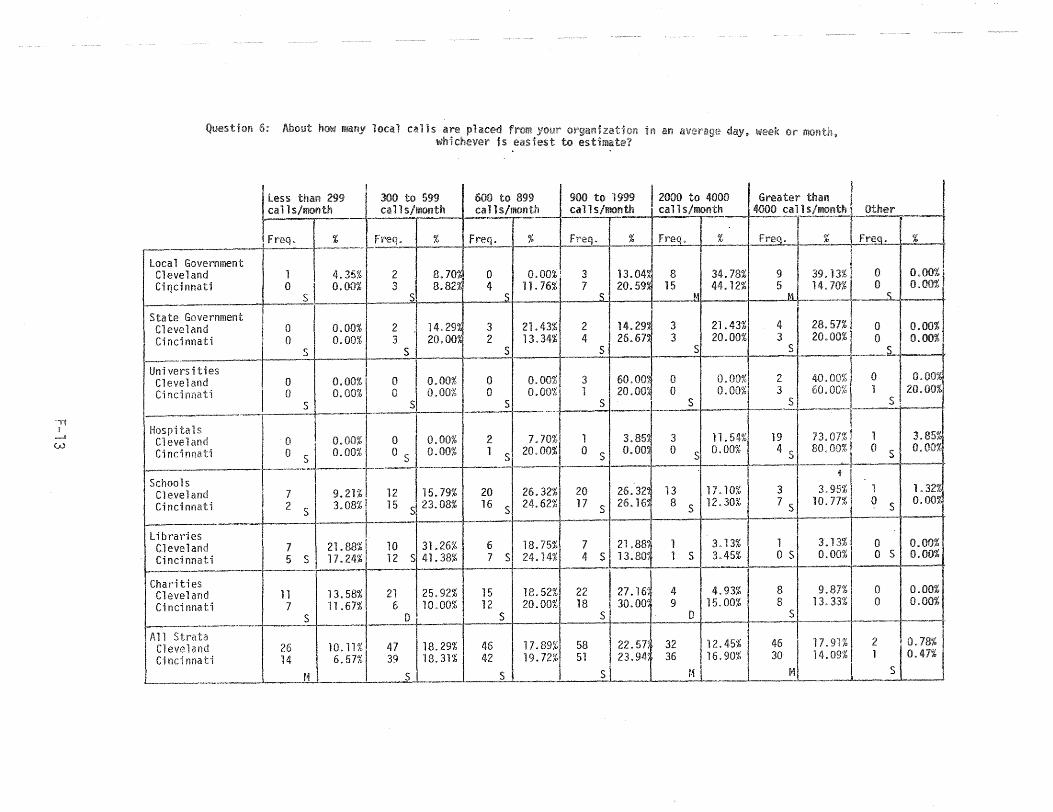
QUestlon 6: About many local calls are in al'! ilveragl~ or
~ I
600 to 899 900 to 1999 I 2000 to 4000 less than 299 300 to 599 Greater than C.l1s/month~ calls/month calls/month calls/month calls/month 4000 calls/mofl'th ' Other
,Freq. t % Freq. % Freq. % r",q. % Freq. % Freo. % Freq. t ""-'--J] .--. Local Government Cleveland 1 4.35% 2 8.70~ o 0.00%: 3 13.04~ 8 34.78% 9 39.13% o 0.00%
Cir}cinnati 0 S I_~'OO% ~ 3 51 8.821 4 n . 76% 7 20. 59~ 15 44. 12% 5 14.70% o 0.00% S ~ _ M M "
State Government I Cleveland I 0 0.00% 2 14.29~ 3 21.43% 2 14.29~· 3 21.43% 4 I 28.57% o 0.00% Cincinnati I 0 0.00% 3 20.00% 2 13.34% 4 26.6n 3 20.00% 3 20.00% o 0.00%
~ S 5 S S S S S _
~-.-. ~--.-~~-
Universities I o 0.00% 3 60.00~ 0 0.00% 2 40.00% ,OO~ Cleveland 0 0.00%\ 0 0.00%
Cincinnati I 0 0.00% I 0 0.00% o 0.00% 1 20.00D 0 0.00% 3 60.00% 1 I ,001 S S S S s !
_ S ..• ---L S ~---- .. ---- "---~-»~
......fi
W
Hospitals 73. 17% t5% Cleveland o 0.00% 0 0.00% 2 7.70% 1 3,85~ 3 1'1.54% 19 1
Ci fie; nna ti o S O~OO% t-- 0 S
0.00% 1 S 20.00% ° S
o.om 0 s 0,,00% 4 S 80.00% 0 S 0.00%
1--" .,
Schools Cleveland 7 9.21%1 12 15.79% 20 26.32% 20 26.321 13 11.10% 3 3. i% 1 1.3211
Cincinnati 23.08% 16 S 24.62% 17 S
26. 16~ B S 12 .. 30% 7 S 10. 0 S
O.OO~
- ~-
L ibY'aries I C.l eve 1 and 7 21.88% I 10 31. 26% 6 18.75% ~21.8m 1 3 .. 13% 1 3.13% 0 0.00%
Cincinnati 5 S 17 .24% I 12 S 41. 38% 7 sl 24. 14% 4 S 13.8m 1 S 3 .. 45% o S 0.00% o S 0.00% r-' -,,- -Charities 9'~l! Cleveland 11 13.58% 21 25.92% 15 18.52% 22 27.16 4 4 .. 93% 8 0.00%
Cincinnati 7 11.67% 6 10.00% 12 20.00% 18 30.000 9 15.00% 8 13.33%. ° 0.00%
S 0 S S D S I--
.. -~ All Strata
Cleveland 26 10.11% 47 18.29% 46 17.89% 58 22.57 32 12.45% -.:1 17,91%1 2 I 0.78% Ci nci I1nati 14 6.57% 39 18.31% 42 19.72% 51 23.94 36 16.90% . 30 14.09% . 1
t4 S S S t·, £'i I S
0.47%
-~~
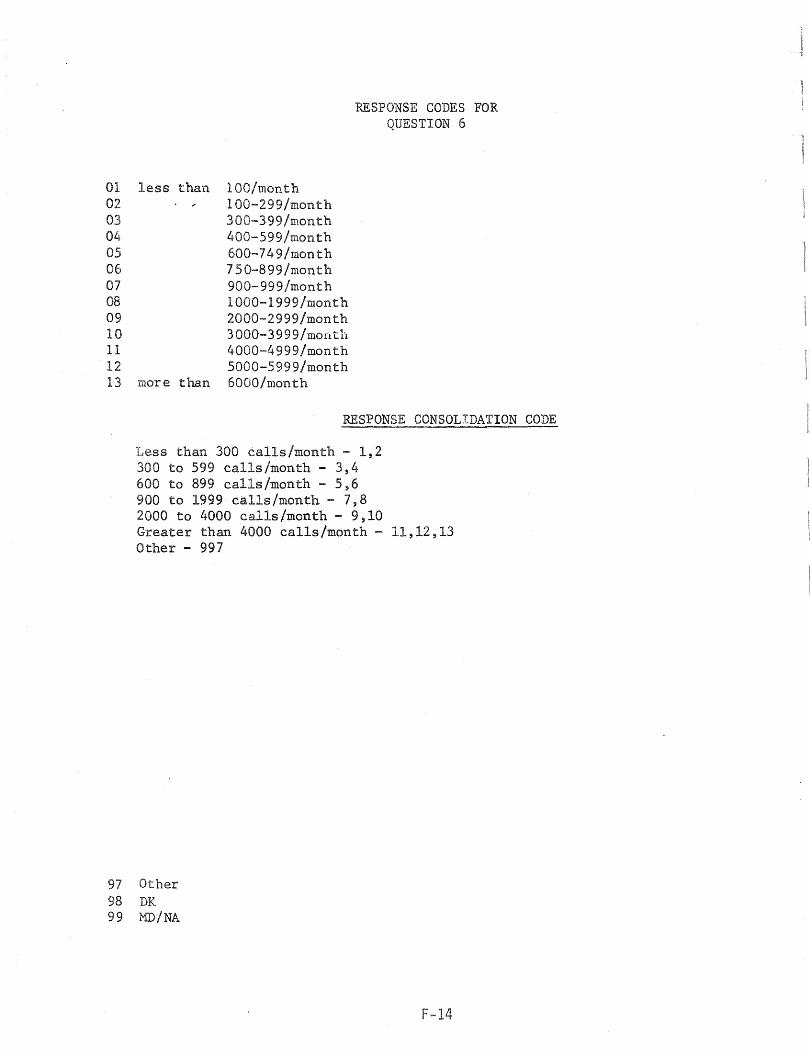
01 02 03 04 OS 06 07 08 09 'In .&.v
11 12 13
less than
more than
lOO/month lOO-299/month 300-399/month 400-599/month 600-749/month 7S0-899/month 900-999/month 1000-1999/month 2000-2999/month 3000-3999/month 4000-4999/month 5000-5999/month 6000/month
RESPONSE CODES FOR QUESTION 6
RESPONSE CONSOLIDATION CODE
Less than 300 calls/month - 1,2 300 to 599 calls/month - 3,4 600 to 899 calls/month - 5,6 900 to 1999 calls/month - 7,8 2000 to 4000 calls/month - 9,10 Greater than 4000 calls/month - 11,12,13 Other - 997
97 Other 98 DK 99 MD/NA
F-14
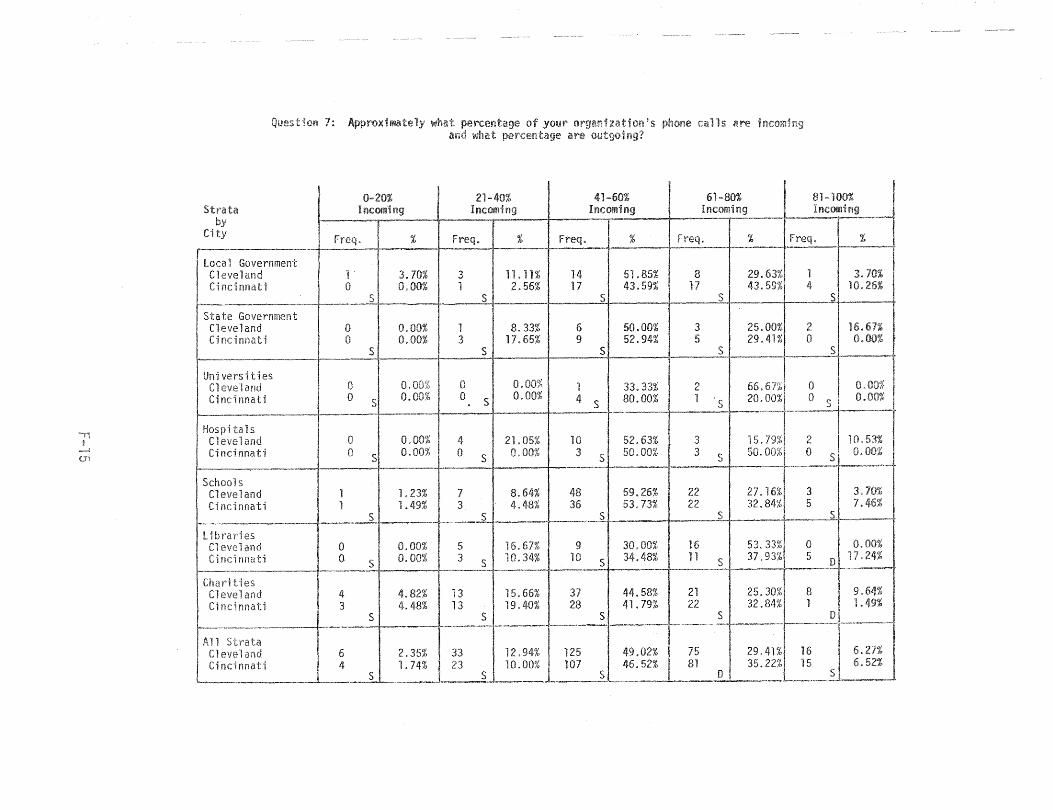
Strata
Government Cleveland Ci nei nnati
State Government Cleveland Cincinnati
Universities and
Cincinnati
Hospita 1 s Cleveland Cincinnati
Schoo 1 Cleveland Ci m:i I1l1at;
Libraries Cleveland Cincinnati
Charities eveland
Ci nci nnati
7: as cal'ls
0-20% 21-40% 41-60% 61-80% 81-100% Incoming Incoming Incoming Incoming
freq. +- % Freq. % Freq. % %
1-11 -=r 3 11.11% 14 51.85% 8 29. o 0,00% I 1 2.56% 17 43.59% 17 43.
S
o 0.00% 1 1~33% II 6 50.00% 3 25.00%1 2 16.61% o 0.00% 3 17.65% 9 52.94% 5 29.41%1 0 0.00%
(} 1 33. 2
o 0-
o I o S
4 S 80. 1 S
1. 7 8.64% 1. 3 4,48%
4 82% 13 15.66% 37 21 8 9. 3 48% 13 1 q 40'Z:?R 22 1 1.
6 35% 4 .74%
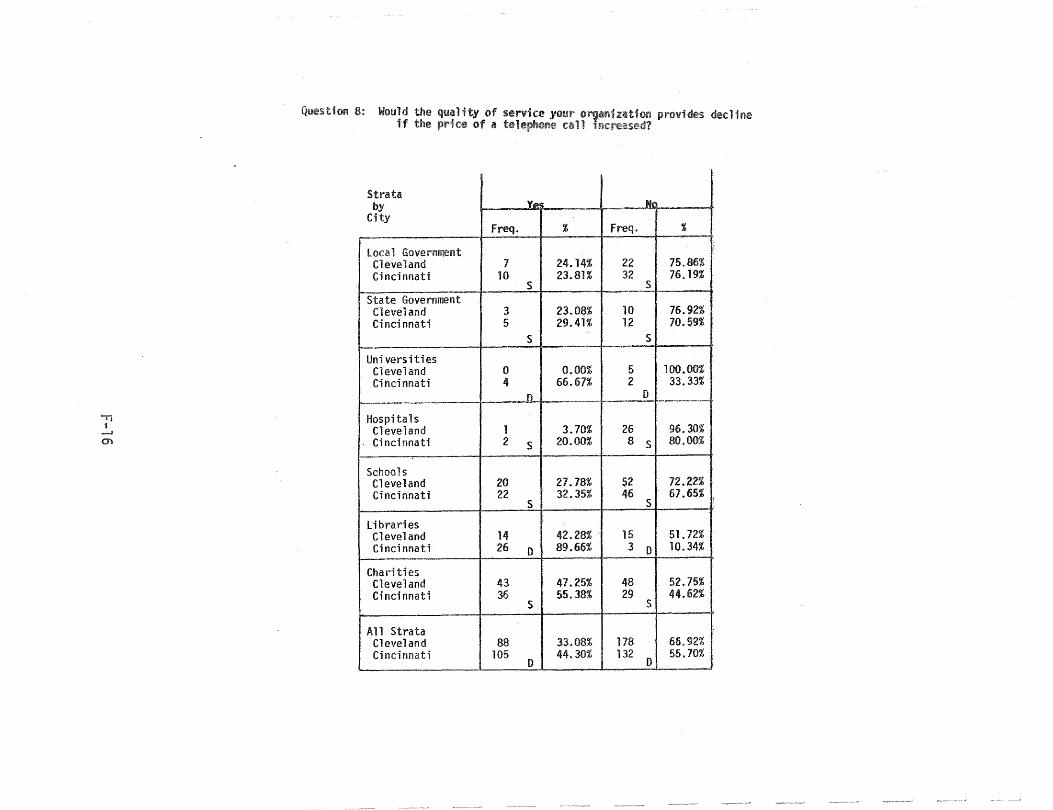
..." I
....;...,I
O'l,
Question 8: Would the Quality of service your if the price of a
provides dl!cline h~f':!"t'!;;'tfi)td?
Strata I by Y!P1t N~
City Freq. % Freq. %
Local Government Cleveland 7 24. 14% 22 75.86% Cincinnati 10 23.81% 32 76.19%
S S State Government Cleveland 3 23.08% 10 76.92% Cincinnati 5 29.41% 12 70.59%
S S
Un; versities Cleveland 0 0.00% 5 100.00% Ci nci nnati 4 66.67% 2 33.33%
~. n D
~-. -
Hospitals Cleveland 1 3.70% 26 96.30% Cincinnati 2 S 20.00% 8 S 80.00%
Schools Cleveland 20 27.78% 52 72.22% Cincinnati 22 32.35% 46 67.65%
S S
libraries Cleveland 14 42.28% - 15 51. 72% Cinci nnati 26 [) 89.66% 3 D 10.34%
Charities Cleveland 43 41.25% 48 52.75% Cinci nnati 36 55.38% 29 44.62%
S S
All Strata Cleveland 88 33.08% 178 66,92% Cincinnati 105 44.30% 132 55.70%
0 D
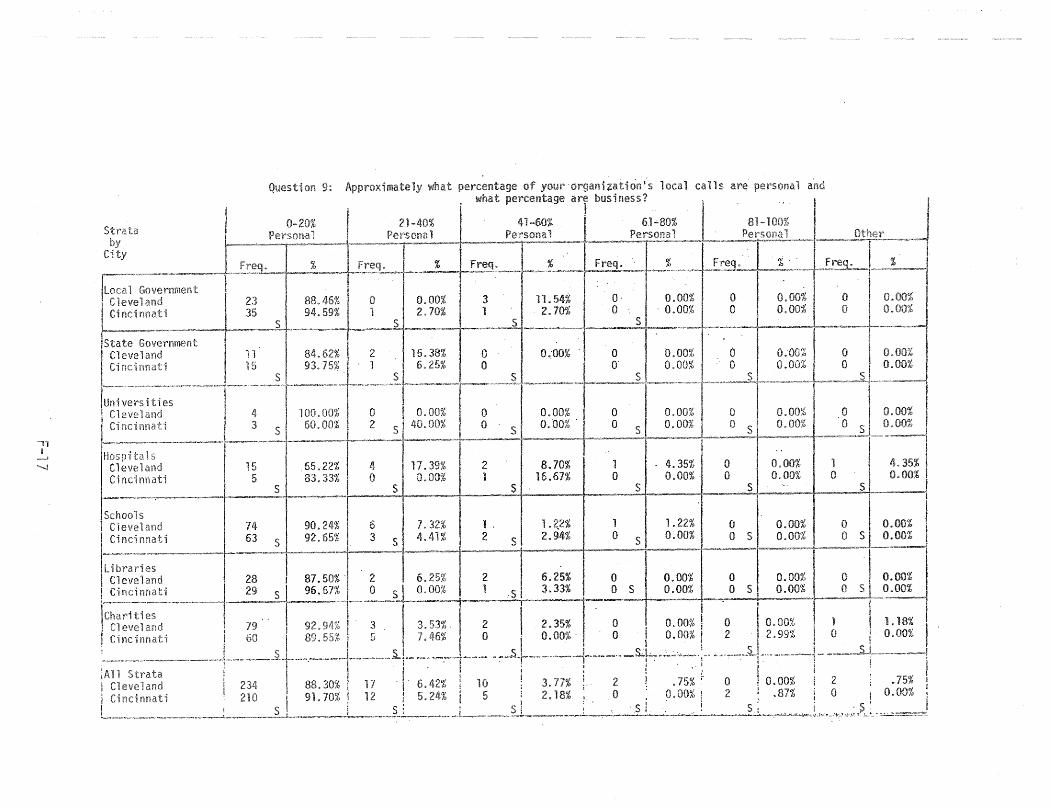
9: ca11s are n,(.Ol1f'<::n"':l and
0.00% 3 1l. ~.UU' lJ U.UU70 I 0 2.70% 1 2. -~ 0 - S - 0.00% 0 0.00% 0
15.38% 0 0,00% 0 0.00% 0 0.00% 0 0.00% 6.25% 0 0 0.00% a 0.00% 0 0.00%
S
4
S I 100.00% I 0 0.00% 0 0.00% 0 0.00% 0 0.00% 0 0.00% 3 60.00% 2 S 40.00% 0 S
0.00% ' 0 S 0.00% 0 .- 0.00% 0 ", 0.00% 1
I 4 1 17• 39% 2 8.70% I 1 4.35% I 0 J O.OO~~ I 1 4.35% -J 15 65.22% 1
5 83.33% 0 0.00% 1 16.67% 0 0.00% 0 0.00% 0 S S
74 90.24% 6 l.i;Z'K> I 1.22% a 0.00% I 0 I 0.00% I
63 92.65% 3 S 2.94% 0 S 0.00% 0 S 0.00% 0 51 0.00%
28 6.25% 0 0.00% 0 0.00% 29 ~.33% a s 0.00% a s 0.00%
I 79 3 2.35% a 0.00% ! 0 0.00% 1.18%
0.00% 0 0.00% ! 2 2.99% 0 0.00%
234 88.30% i 17 'j' 6.42% 10 3.77% 2 .75% i- 0 !
91. 70% ! 12 I ~ ?il'Y- r; ? _ lA'Z: 0 0.00% ; 2

-n I
--' 00
UH2'I<l);t-'ln~ 10: Does
Strata Yes No I by City I
freq. % freq. %
J local Government Cleveland 12 41.38% 11 58.62% Cincinnati 20 45.45% 24 54.55%
S S
State Government Cleveland 7 50.00% 7 50.00% Cincinnati 9 47.37% 10 52.63%
S S
I Uni versities 4 80.00% 1 reo. 00% ~level.nd
Cinci~nati 4 66.67% 2 33.33%
I S S
i Hospitals Cleveland
--J-2s 75.86% 7 24.14%
Cincinnati 66.67% 4 33.33% S
Schools I
I Cleveland ! 13 15.66% 70 84.34% Cincinnati I 11 S 23.29% 56 S 76.71%
..
~ libraries
_01
!
Cleveland 54.55% 15 45.45% j Cincinnati ._-c_l .. _~7 0 87.10% 4 12.90%
I Charities I
I 4? I 4::L 1n~ l'1 /:>VI'> 1 iUlli
Cincinnati 29 . I' 40:85%,' 42 I ~:: ~~~ I ___ -+ __ .....:S~I _ -'--T' -_... sl 1
All Strata I I ! Cleveland 118' 40.69% 1 172 59.31% i
I Cincinnati I 114 S! 44.53% ! 142 S I 55.47% t
'-_. _______ J_ .. ~ __ ~ .. _. ___ .. ~.~_ .• ~ ............ _. '""" _. _ : __ .. _ .. _. _~._ -! __ ._ .. _ ......... _I
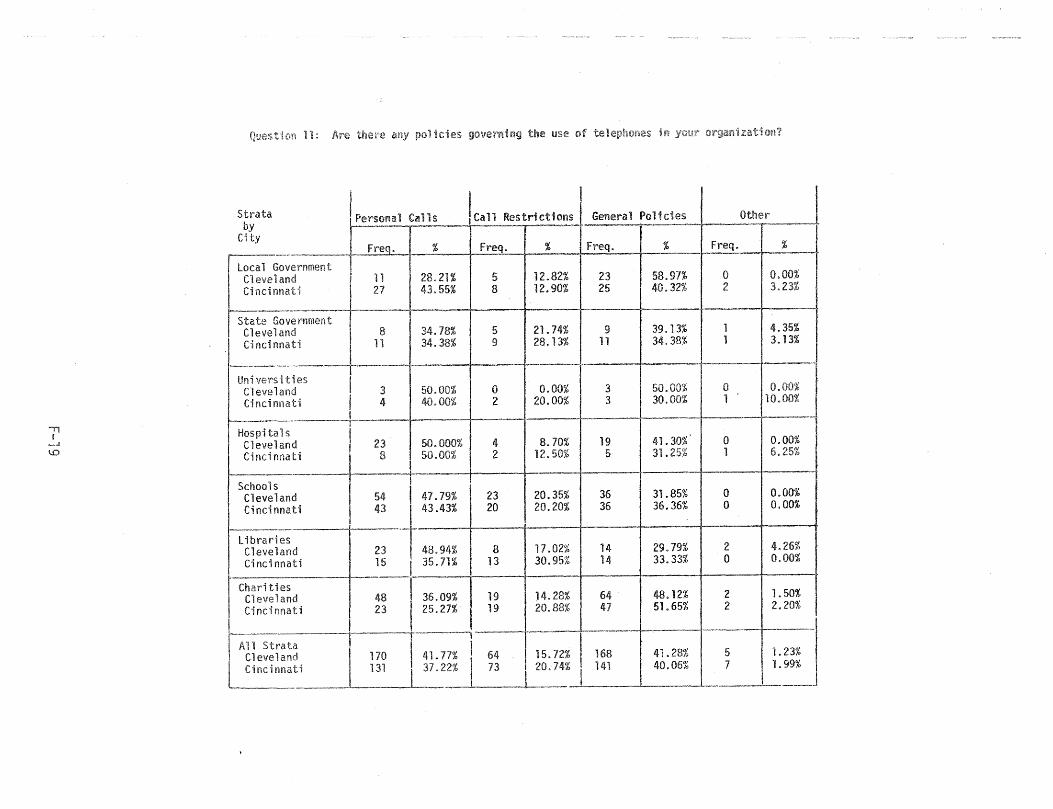
ill
11 lcies the use of
General Pol Other Strata by
City r-----~-"----~~ Freq. % I Freq. I % I Freq. % L£.!'eq. %
f'. UUVI::! mllt::!1
and
f' UUVCIIiIUCH
and Ci rid nnati
Un i ve rs i ties Cleveland Cincinnati
s Cleveland Cincinnati
11
11
3 4
23 8
28.21% 43.55%
34.78% 34.38%
50.00% 40.00%
50.000% 50.00%
5 8
5 9
o 2
4 2
12.82% 12.90%
21.74% 28.13%
0.00% 20.00%
8.70% 12.50%
23 25
9 11
3 3
19 5
58.91% 40.32%
39.13% 34.38%
50.00% 30.00%
41. 30% 31.25%
o 2
o 1
o 1
0.00% 3.23%
4.35% 3.13%
0.00% 10.00%
0.00% 6.25%
Schools Cleveland 54 I 47.79% 23 I 20.35% 36 31.85% 0 0.00% Cincinnati 43 I 43.43% 20 20.20% 36 36.36% 0 0.00%
libraries I Cleveland 23 I 48.94% 8 11.02% 14 29.79% 2 4.26% Cincinnati 15 35.71% I 13 30.95% 14 33.33% 0 0.00%
r Charities I I . I
Cleveland 48 I 36.09% 19 H.28% 64 48.12% Cincinnati 23 I 25.27% 19 20.88% 41 51.65%
~ I .
--··-----'--~---r--~--l·--- ---.--~---~
All Strata 1 I I Cleveland 170 41. 77$ I 64 lls.72% 168 41.28% L ChH::irma~~__ 131 I 37.22% I 73 to. 74%_1 _1~6%
2 1.50% 2 2.20%
5 ~. 1.~ 2:---7 1099%
_______ J
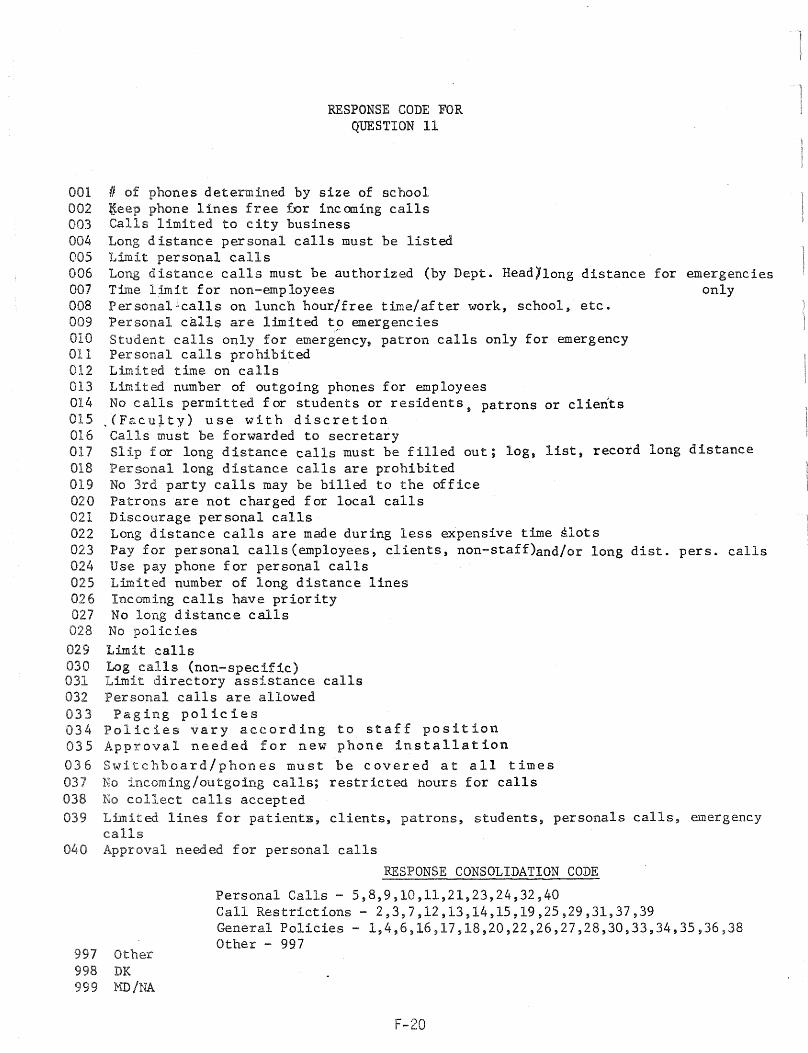
RESPONSE CODE FOR QUESTION 11
001 # of phones determined by size of school 002 ~eep phone lines free for incoming calls 003 Calls limited to city business 004 Long distance personal calls must be listed 005 Limit personal calls 006 Long distance calls must be authorized (by Dept. HeadJlong distance for emergencies 007 Time limit for non-employees only 008 Personaltcalls on lunch hour/free time/after work, school, etc. 009 Personal calls are limited t9 emergenc ies 010 Student calls only for emergency, patron calls only for emergency all Personal calls prohibited 012 Limited time on calls 013 Limited number of outgoing phones for employees 014 No calls permitted for students or residents, patrons or clients 015 .(Facu~ty) use with discretion 016 Calls must be forwarded to secretary 017 Slip for long distance calls must be filled out; log, list, record long distance 018 Personal long distance calls are prohibited 019 No 3rd party calls may be billed to the office 020 Patrons are not charged for local calls 021 Discourage personal calls 022 Long distance calls are made during less expensive time slots 023 Pay for personal calls(employees, clients, non-staff)and/or long dist. pers. calls 024 Use pay phone for personal calls 025 Limited number of long distance lines 026 Incoming calls have priority 027 No long distance calls
No policies 029 Limit calls 030 Log calls (non-specific) 031 Limit directory assistance calls 032 Personal calls are allowed 033 Paging policies 034 Policies vary according to staff position 035 Approval needed for new phone installation 036 Switchboard/phones must be covered at all times 037 No incoming/outgoing calls; restricted hours for calls 038 No collect calls accepted 039 Limited lines for patientE, clients, patrons, students, personals calls, emergency
calls Approval needed for personal calls
997 Other 998 DK 999 MD/NA
RESPONSE CONSOLIDATION CODE
Personal Calls - 5,8,9,10,11,21,23,24,32,40 Call Restrictions - 2,3,7,12,13,14,15,19,25,29,31,37,39 General Policies - 1,4,6,16,17,18,20,22,26,27,28,30,33,34,35,36,38 Other - 997
F-20
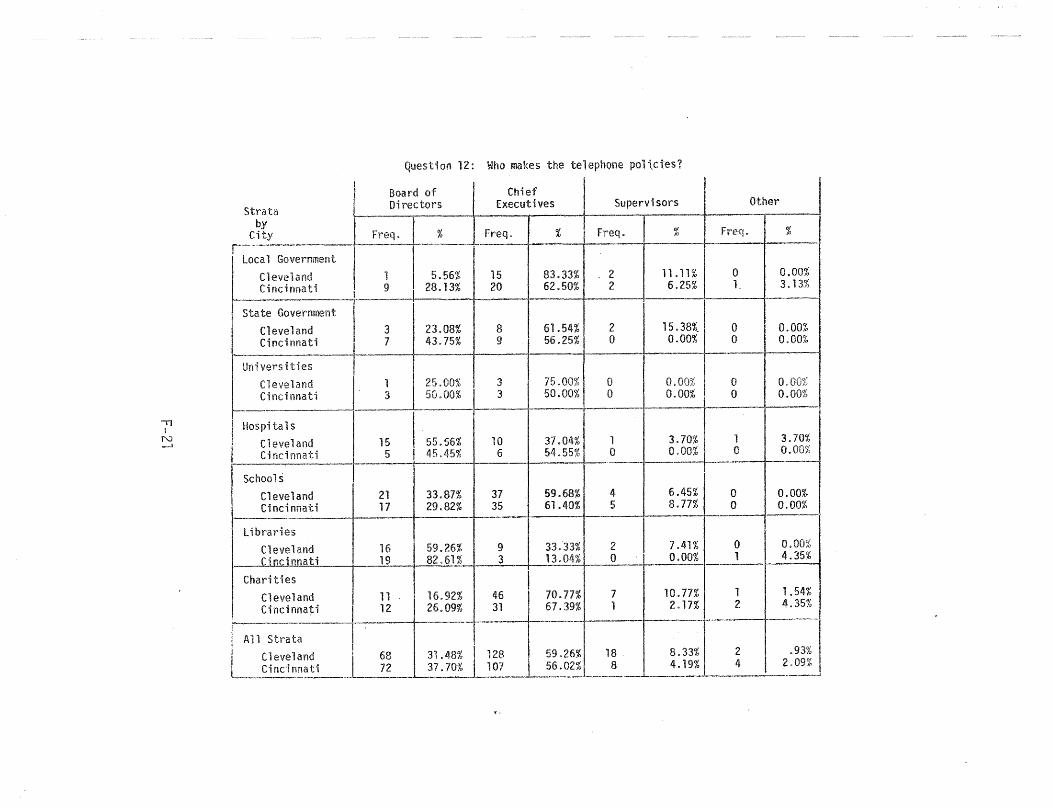
." I
N .....l
Strata by
City r-"'"--~-"--"---
! Local Government
Question 12: Who makes the telephone poHctes~
Board of Di rectors
Freq. I %
Chief Executives
Freq. %
Supervisors r~-"----""----- --I Freq. I %
Other
Freq. %
~ Cleveland I 1 . 2 n .11% ~ I 0.00%
. Cincinnati ~ .. _._9 _ 2 6.25% ~ 3.13~
State Government
Cleveland I. 3 I 23.08% 8 61.54%! 2 15.38%.," 0 0.00% ~ 41.7;'t 9 56.25% 0 0.00% 0 0.00%
Cincinnatl _ a' I 3 75 .00% 00% I 0 0,00%
0.00% ' I U25'.O~070 I 50.00%1 0 ~O. a L' Cleveland. . 3 50.00% I 3 ___ .
-----!-~
, -- - 3.70% 1 I Hospitals I 55 r.:6 01/o 10 3/.04~0 1 0.00% 0 ---l j
15. :J 54. 55~" Cleveland. ~ 1 45,45% 6 I ___ _ Cincinnat1 ~ I I I
3.70% 0.00%
- i
Schools Cleveland Ci nei nnati
librades
21 17
33.87% 29.82%
37 59.68% 35 61.40%
4 5
6.45% 8.77%
o o
0.00% 0.00%
Cleveland 16 59.26% 9 33.33%1 2 I 7.41% I 0 0.00% I -.lin.ctnnati 19 82.61% 3 13.:Q.4% o· I 0.00% 1 4.35%
Charities
Cleveland Cincinnati
11 12 26.09% 31 67.39% 1 2.17%
16.92%+ 46 II 70 0 lE% 7 I 10.77%
All Strata - -. ---.......---,-
1 2
1.54% 4.35%
~------"----------I------~----- ~ . Cleveland 68 31.48% I 128 59.26%1 18. I 8.33% I 2 I .93% Cincinnati 72 37.70~7 _~~~ 8 , 4.19% "_,_4_1_~~09%_-.:
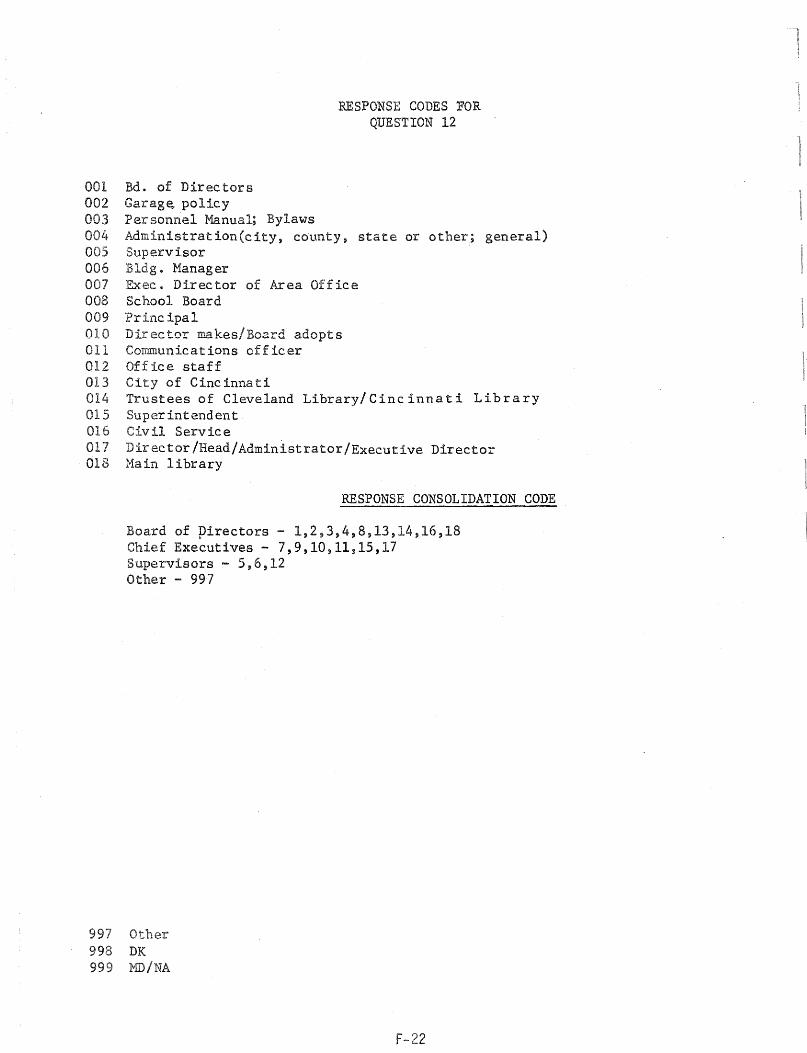
RESPONSE CODES FOR QUESTION 12
001 Bd. of Directors 002 Garag~ policy 003 Per sonnel Manual; Bylaws 004 Administrat ion(city, county, state or other); general) 005 Supervisor 006 • Manager 007 Exec. Direc tor of Area Office 008 School Board 009 Pr inc ipa 1 010 Director makes/Board adopts 011 Cow~unications officer 012 Office staff 013 City of Cincinnati 014 Trustees of Cleveland Library/Cinc innati Library 015 Superintendent 016 Civil Service 017 Director/Head/Administrator/Executive Director 018 Main library
RESPONSE CONSOLIDATION CODE
Board of pirectors - 1,2,3,4,8,13,14,16,18 Chief Executives - 7,9,10,11,15,17 Supervisors - 5,6,12 Other - 997
997 Other 998 DK 999 MO/NA
F-22
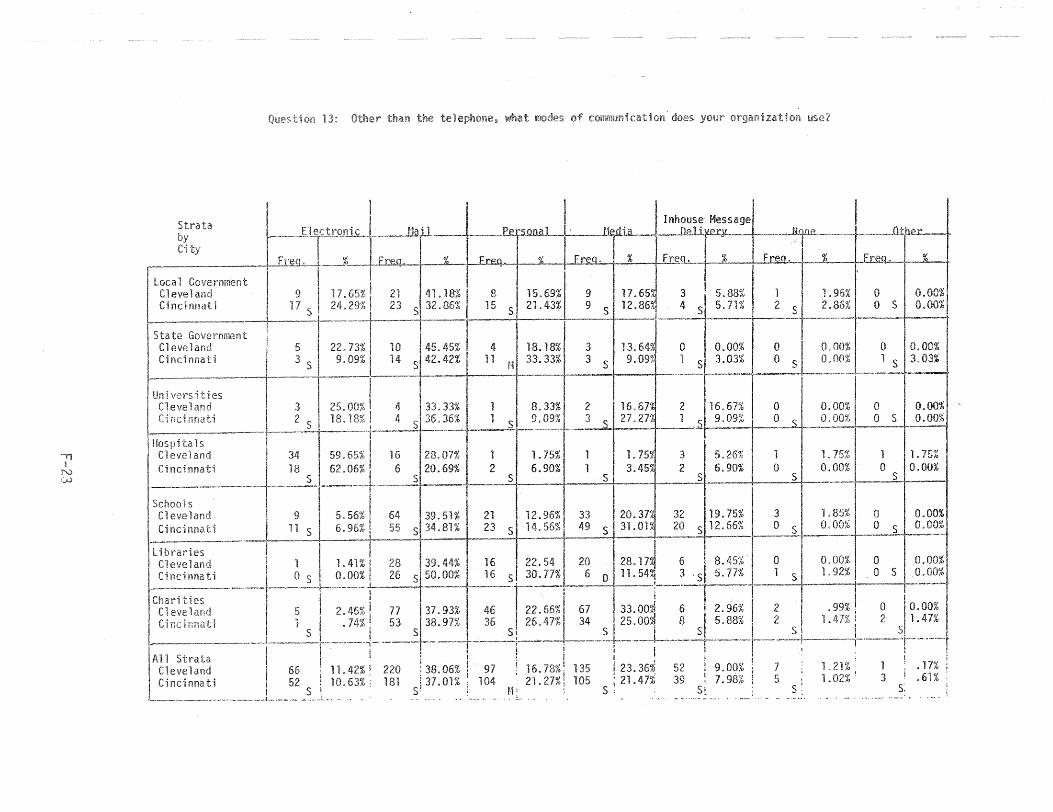
Strata
ty
Cleveland Ci nci nnati
State Governmprl
Cleveland Cincinnati
Uni Cleveland Ci nnati
Strata Cleveland Cincinnati
9 17 S
9 11 S
0
t;re'hat of
0
0
"-i- L t ~- - ! -~:' -, ,
~ !-;:::I-:: 137 •93%-1 4~F2.66%1-:- 33'~OJ-:·F:6% 1-2 1 I .74%, 53 38.97% 36 26.47%1 34 25.00~ 8 5.88%, 2
S I" s:. SiS I
66 1 L 42% ~ 220 38.06% 97 16.73% 135 23.36% 52 9.00% 7 52 10.63% : 181 37.01% 104 21.27% 105 21.47% 39 j',98% 5
S S r·1= S S
1.96% 0 l 0.00% 2.86% 0 S 0.00%
0.00% 0 sl 0.00% 1 S
1. 21% 1 1. 02% ~ 3
S ......... n· ... • _~.
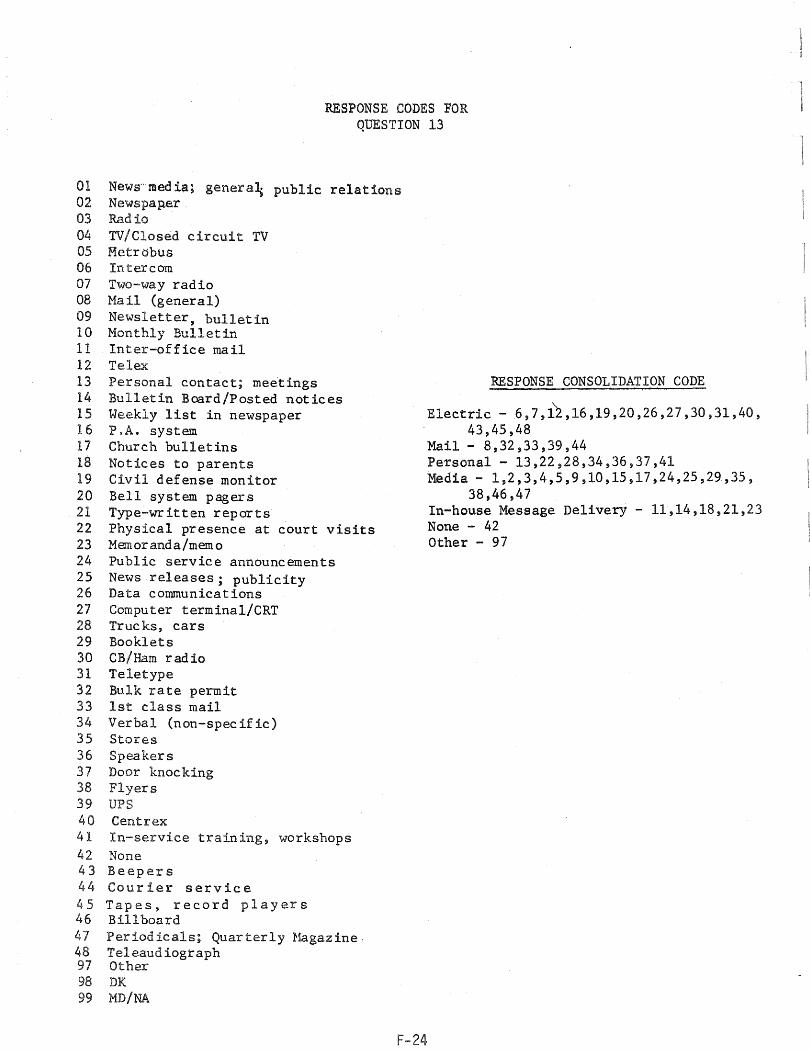
RESPONSE CODES FOR QUESTION 13
01 News"med ia; genera~ public relations 02 Newspaper, 03 Radio 04 TV/Closed circuit TV 05 Hetr bbus 06 Intercom 07 Two-way radio 08 Mail (general) 09 Newsletter, bulletin 10 Monthly Bulletin 11 Inter-office mail 12 Telex 13 Personal contact; meetings 14 Bulletin Board/Posted notices 15 Weekly list in newspaper 16 P.A. system 17 Church bulletins 18 Notices to parents 19 Civil defense monitor 20 Bell system pagers 21 Type-written reports 22 Physical presence at court visits 23 Memoranda/memo 24 Public service announcements 25 News releases; publicity 26 Data communications 27 Computer terminal/CRT 28 Trucks, cars 29 Booklets 30 CB/Ham radio 31 Teletype 32 Bulk rate permit 33 1st class mail 34 Verbal (non-specific) 35 Stores 36 Speakers 37 Door knocking 38 Flyers 39 UPS' 40 Centrex 41 In-service training, workshops 42 None 43 Beepers 44 Courier service 45 Tapes, record players 46 Billboard 47 48 97 98 99
Periodicals; Quarterly Hagazine. Teleaudiograph Other DK MD/NA
F-24
RESPONSE CONSOLIDATION CODE
Electric - 6,7,1~,16,19,20,26,27,30,31,40, 43,45,48
Mail - 8,32,33,39,44 PeTsona1 - 13,22,28,34,36,37,41 Media - 1,2,3,4,5,9,10,15,17,24,25,29,35,
38,46,47 In-house Message Delivery - 11,14,18,21,23 None - 42 Other - 97
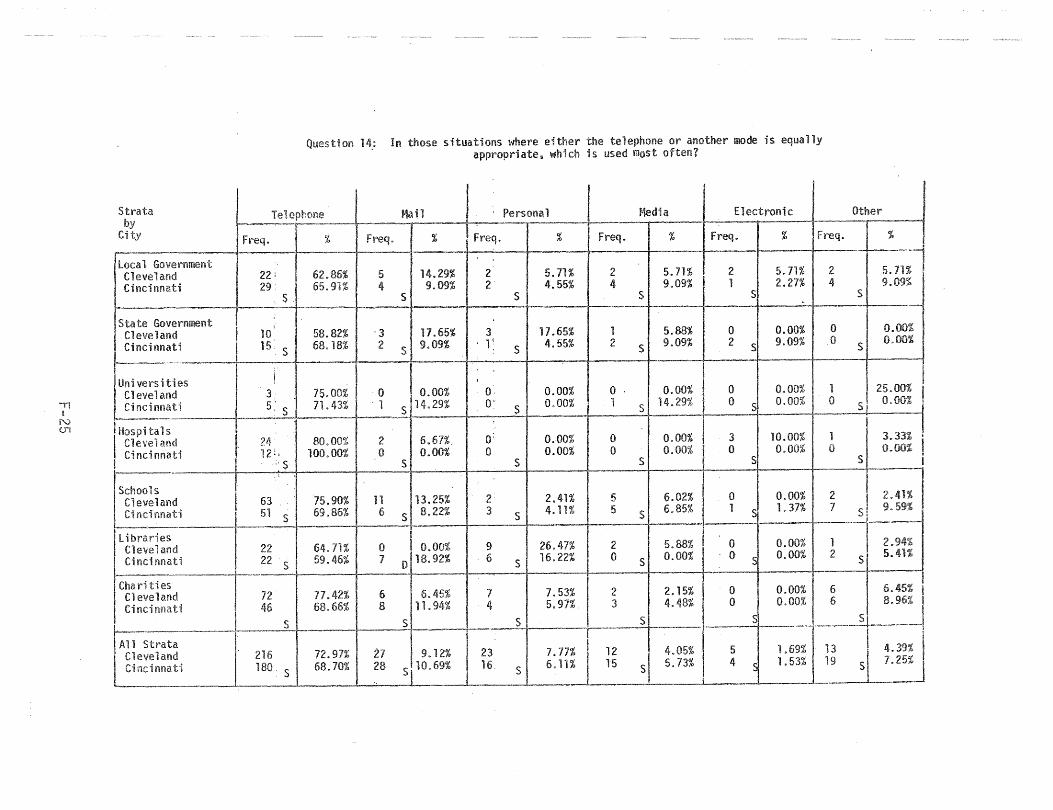
Question
I
In those situations where either the telephone or another mode is equally appropriate, which is lIsed most often?
Strata .ephoneMail ' Personal Media Electronic Other ... - ---.-----~-. r·~------r----I~·--""T------4--·-·-~---·-~
Freq. % Freq. % Freq. % Freq. %
local Government Clevela,nd 22: 5 14.29% 2 5.71% 2 5.71% 2 5.71% 2 5.11% Cincinnati 29 4 9.09% 2 4.55% 4 9.09% i 1 2.27% 4 9.09%
f-------.------~- S SiS s S
State Government ~J Cleveland 58.82% '3 17.65% 3 11.65% 1 5.88% 0 0.00% 0 O.~ Cincinnati 15 S 68.18% 2 S 9.09% . l' S 4.55% 2 5 9.09% 2 5 9.09% .0 S o.om.
Universi ! I I C~ev~land 3, 15.00; 0 0.00% 0: 0.00% 0 . 0.00% 0 0.00: 1 I 25.~ f
I C'lnCl. 5, S 11.43", . 1 S 14.29% 0 S 0.00% 1 S 14.29% 0 S 0.00% 0._ $1 0.00% I'
I tals i II Cleveland 24 80.00% 2 6.67%, 0: 0.00% a 0.00% 3 10.00% 1 3.33% i I Cincinnati 12 1, 100.00% 0 0.00% 0 0.00% 0 0.00% 0 0.00% 0 O.OO'"i ! 1 ____ -----t----'....;' S~--_ _l, S S S S S I
Schools -----'1 C~ev~land. 63 75.90% 11 13.25% 2 2.41% 5 6.02% 0 0.00% 2 I 2.41% C·ln(;HUu~tl S 69.86% () S 8.22% 3 S 4.11% 5 S 6.85% 1 S 1.37% 7 51 9.591
--Libraries I C~eveland. 64.71% 9 26.47% 2 5.88% I 0 0.00: 1 2.94% CHId nnatl S 59.46% 0 6 S 16.22% 0 S 0.00% ,0 S 0.00% 2 S 5.41<t:
..... ........-
Charities Cleveland 72 77.42% 6 6.45% 7 7.53% 2 2.15% 0 0.00% 6 6.45% Cincinnati 46 68.66% 8 11.94% 4 5.97% 3 4.48% 0 0.00% 6 8.96%
S S S S 5 S ---,.,-i---"---- i-----.-.. -f.-.----!--.~--- .. --~~-'---~
Strata 216 72.91% 21 1 7.77% I 12 4.05% 5 1.69% 13 4.39% 180
5 68.70% 28 ;1 6.11% I 15 5\ 5.73% I 4 S 1.53% 19 S 7.m
~_ L-____ ~ ______ ~ ____ ~ __ --~
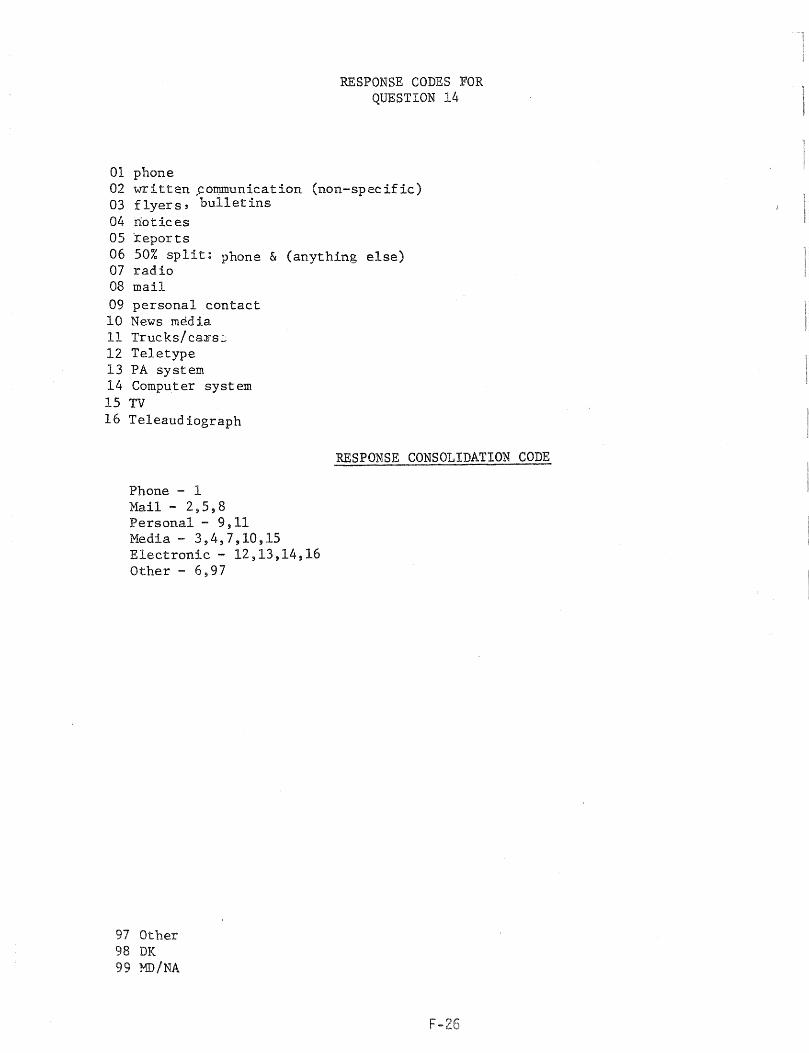
01 phone
RESPONSE CODES FOR QUESTION 14
02 written ~ommunication (non-specific) 03 flyers, bulletins 04 notices 05 reports 06 50% split: phone & (anything else) 07 radio 08 mail 09 personal contact 10 News media 11 Truc.ksicB::5's'::': 12 Teletype 13 PA system 14 Computer system 15 TV 16 Te1eaudiograph
Phone - 1 Mail - 2,5,8 Personal - 9,11 Media - 3,4,7,10,15 Electronic - 12,13,14,16 Other - 6,97
97 Other 98 DK 99 MDiNA
RESPONSE CONSOLIDATION CODE
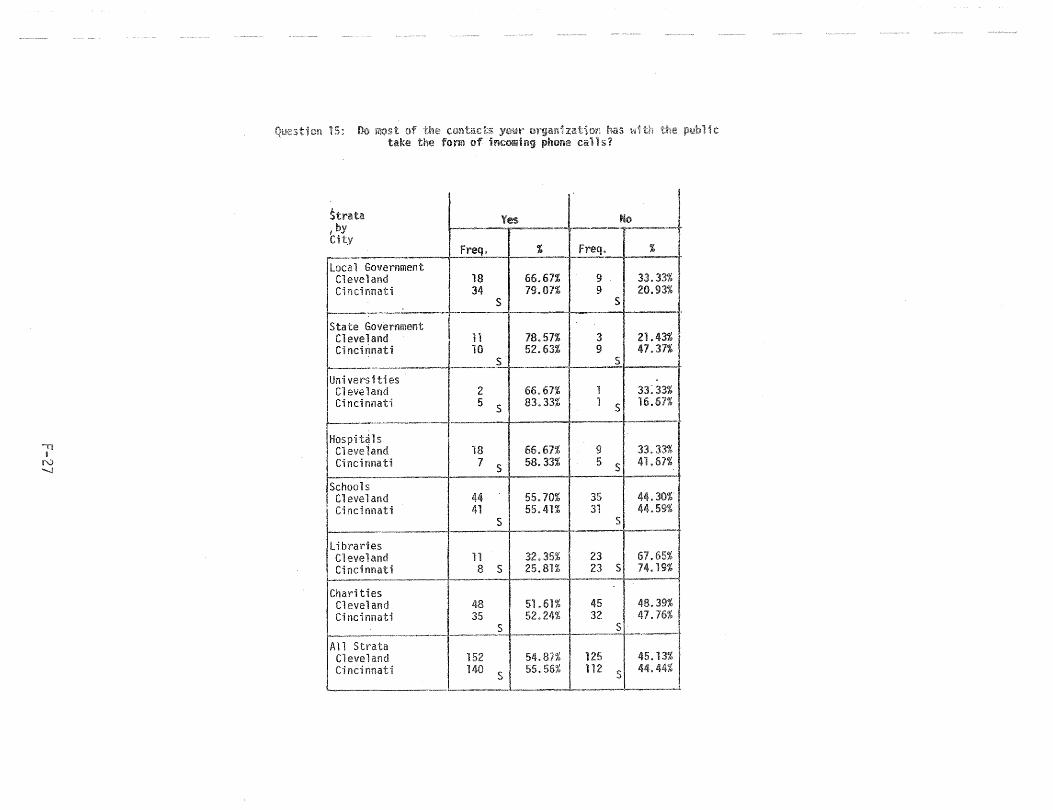
00 it
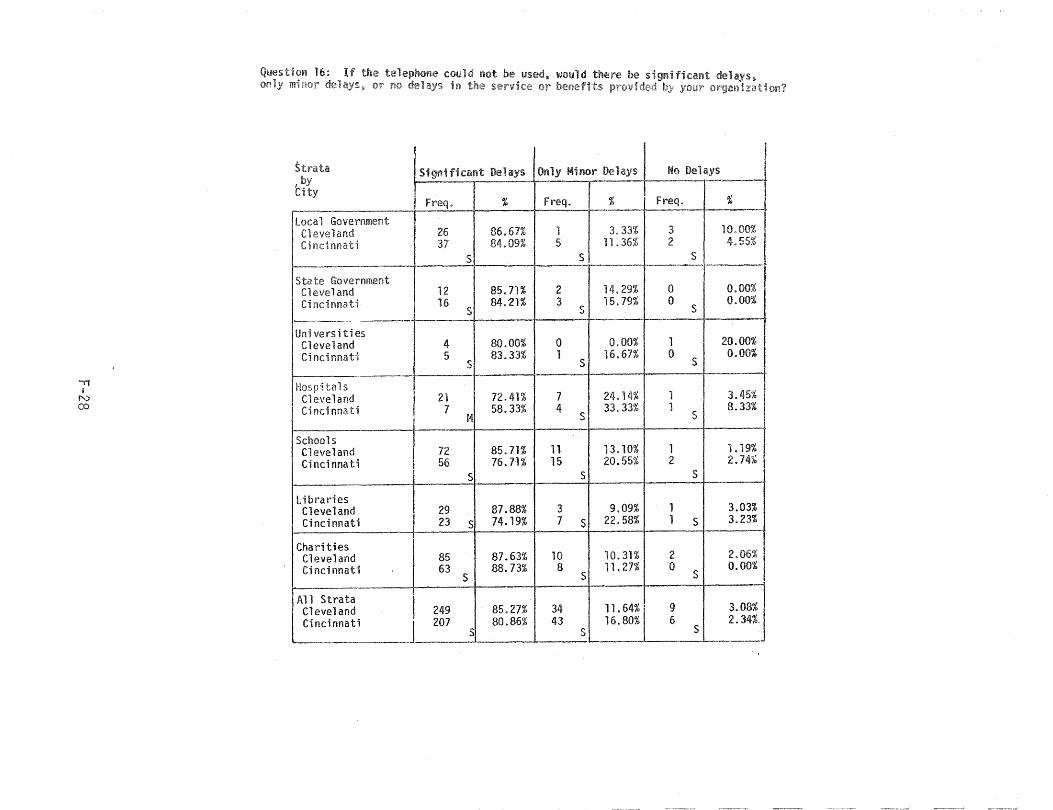
.." I
N co
~--
Local Government Cleveland C'i nei I1nat i
------' State Government Cleveland Cincinnati
I Un; vers i ti os Cleveland Cincinnati
~ .' 1 !'IOSPl ta s Cleveland Ci nei nna ti
1----Schools Cleveland Cincinnati
Libraries Cleveland Cincinnati
Charities Cleveland Cincinnati
All Strata
Cincinnati l Cleveland
cou 1 d not be used ~ WOI) 1 d tlun"e be in the or
Significant Delays Only Mlnor Delays I No Delays
! ,--.------
freq. % Freq. % Freq. % --f------
26 86.61% 1 3.33% 3 10.0mb 37 84.09% 5 11.36% 2 4.55%
-~ S I s
12 85.71% 2 14.29% 0 0.00% 16 84.-21% 3 15.19% 0 0.00%
S S S 1-. --
4 80.00% 0 0.00% 1 20.00% 5 83.33% 1 16.67% 0 0.00%
S S S --I-. .. --~-
21 72.41% 7 24.14% 1 3.45% 7 58.33% 4 33.33% 1
S 8.33%
f4 S -
I 72 85.71% n 13.10% 1 1.19% 56 76.7-1% 15 20.55% 2 2.74%
S S S
29 87.88% 3 9.09% 1 3.03% 23 S 74.19% 7 S 22.58% 1 S 3.23%
85 87.63% 10 10.31% 2 2.06% 63 88.73% 8 11.27% 0 0.00%
S S S
I 249 85.27% 34 11.64~ 9 ~ I 207 S 80.86% 43 16. 80% 6 2.34%. S S
~~-~~~-~
~_~ _____ L.-. ___
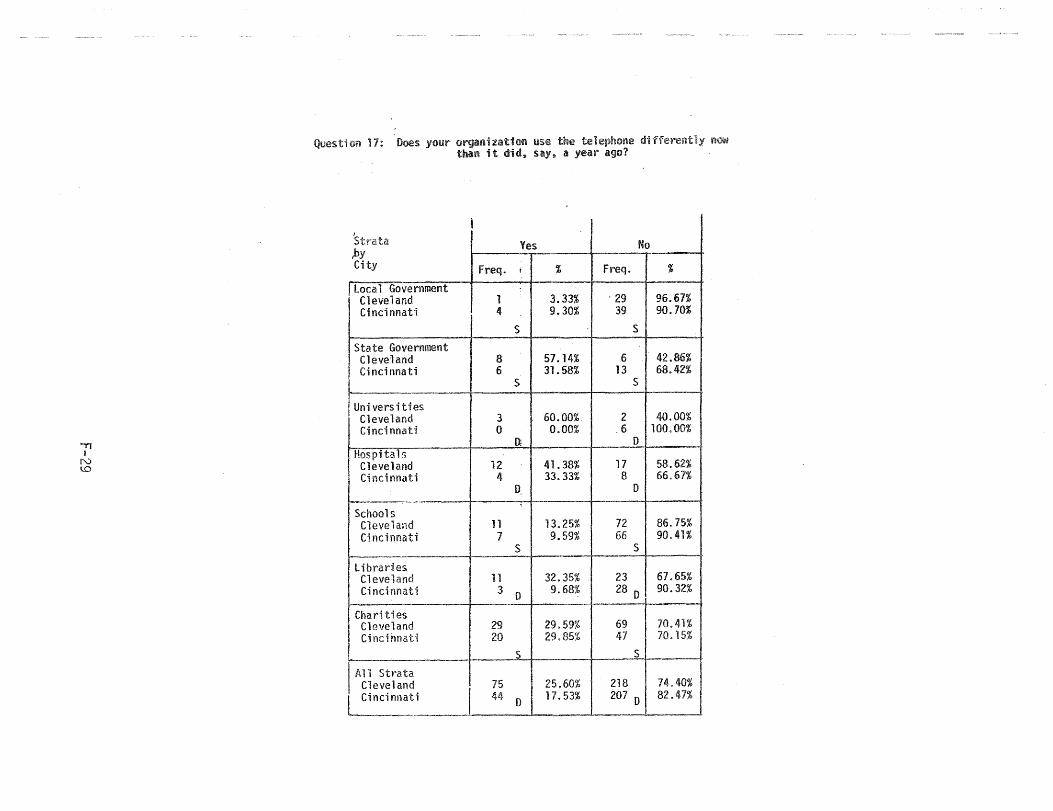
." I
N ~
Question 11: Ooos your organization use the di than it did" S,I}", a year ago?
i I ,by
Yes No
City freq. ! % freq.
local Government Cleveland 1 3.33% . 29 Cincinnati 4 9.30% 39
S S
State Government Cleveland 8 57.14% 6 Cincinnati 6 31.58% 13
S S I-~
Un; vers Hies Cleveland 3 60.00%. 2 Cinei rmat·j 0 0.00% .6
(} D Hospitals
Cleveland 12 41.38% 17 Cincinnati 4 33.33% 8
D. D f---.
Schools Cleveland n 13.25% 72 Cincinnati 7 9.59% 66
S S
l ibrar:ies Cleveland 11 32.35% 23 Cincinnati 3 0
9.68% 28 D
Clla ri ti es Cleveland 29 29.59% 69 Cincinnati 20 29.85% 47
I
_£ S
I All Strata Cleveland 15 25.60% 218
I Cincinnati 44 0 17.53% 207 0
..
rmw
%
96.67% 90.70%
42.86% 68.42%
40.00% 100.00%
58.62% 66.67%
86.15% 90.41%
67.65% 90.32%
70.41% 70.15%
74.40% 82.47%
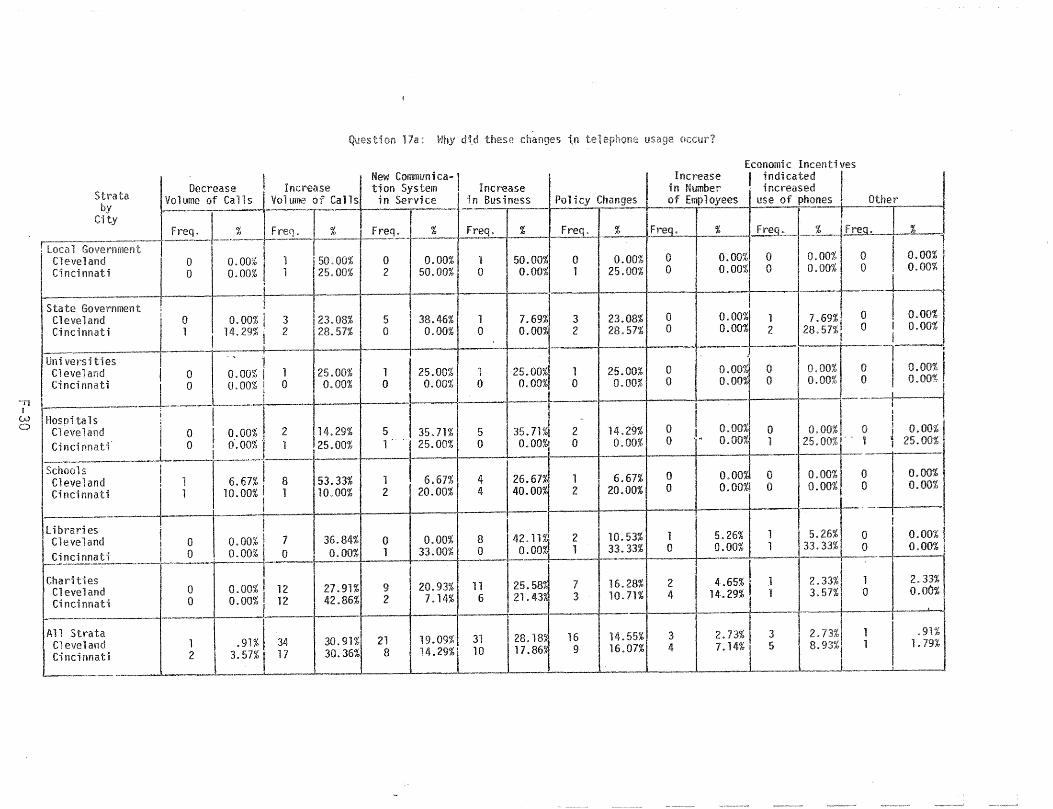
17'1 : ~ihy dtd these changes i.n usage occur?
Economic Incentives
~ I I N:w communica-I ± Increase' I indicated~ ~
St t Decrease Increase tlOn System Increase in Number' - increased ra a Volume of Calls Volume of c.I1
T in Service ~ Busine~~. Policy Ch""ges of Empl~ees ~nes. Other _
..------ _._ ~J_.!.. ~o ~. __ ....!.':"--".:.l_~eqo]~_Freq:----i--_% __ Freq.l % Freq. I % iFreq. L~f , loca 1 Governmen t
Cleveland I 0 0.00% 1 {' 50.00% 0 0.00% 1 50.00% ~ ~.~~,-Cincinnati ~ O.OO~ 2~.00% 2 50.00% 0 0.00%1 1 I 25.~O% ° I 0.00%1 0 I 0000%.1 0 _L~~
t.· I I I r--l ~J C~ev~land. ~I 0 0,.00% I 3 /23.08% 5 II 38.46% 1 7.69;%4 3 23.08% 0 0.00% 1 7.69%1 0 . 0.00% CHIC1nnatl 1 I 14.29% i 2 28.57% 0 0.00% 0 0.00 2 28.57% 0 0.00% 2 28.57%1 0 i 0.00% i' I I
Ui1i;;rsit~ ---'r;' 11 I I . --,-- 'I' C~ev~land. I 0 0.00% I 1 25.00% 1 25.00% 1 25.00%1 1 25.00% 0 o.oo~ 0 0.00% 0 I 0.00% CHlCHmatl I 0 LO.oO% I 0 0.00% 0 0.00% 0 0.00% 0 0.00% 0 o.oo%! 0 0.00% 0 I 0.00%!
_---.. ---1-------,- .. -_oll L I :----- I _11 . I r I I I
~ I Hosoitals l - I Cleveland. I 0 I 0.00%. 2 14.29% 5 135.71% 5 35.71%1 2 14.29% 0 I 0.00% 0 0.00%1 0 i 0.00% Cin~irmati _____ L 0 i 0.00%'1 1 25.00% 1 - , 25.00% 0 0.00% 0 0.00% ~.« 0.00% 1 25.00%'"' 1 25.00%
Schools i -ll I l' 1 Cleveland ! 1 6.67%, 8 53.33% 1 6.67% 4 26.67% 1 ,6.67% 0 0.00% 0 0.00% 0 0.00% Cincinnati +_1 __ 10.00% I I 10.00% 2 20.00% 4 40.00%, 2 20.00% 0 --t 0.00%1 0 0.00% 0_ I 0.00%
libraries I I I. I
I , __ O_ .• ~%. ~ I ~OO% 1 . 33.00% 0 --.-!l:00 1 33.3~,-. 0 O~O% 1 __ :.~. 33% 0 0.00%
Charities I I I I Cleveland 0 0.00% 12 27.91% 9 20.93% 11 25.5m 7 16.28% 2 4,.65%.1 2.33% 1 2.33% Cincinnati 0 0.00%112 42.86% 2 7.14% 6 21.43~ 3 10.71% 4 14·.29% 1 3.57% 0 D.OO,,;
1- ' -~' ;;r" _. I All Strata r ! '
Cleveland I '91%[~-.1·~ 30.91% 21 19.09%131 28.181 16 14.55%1 3 t.~.73% ·3J2.73%1 1 .91% ~~_ 2 3.57%~O.36% 8 14.29%1 10 17.861 9 16.0n
L 4 7.1l ~93~ __ 1_~
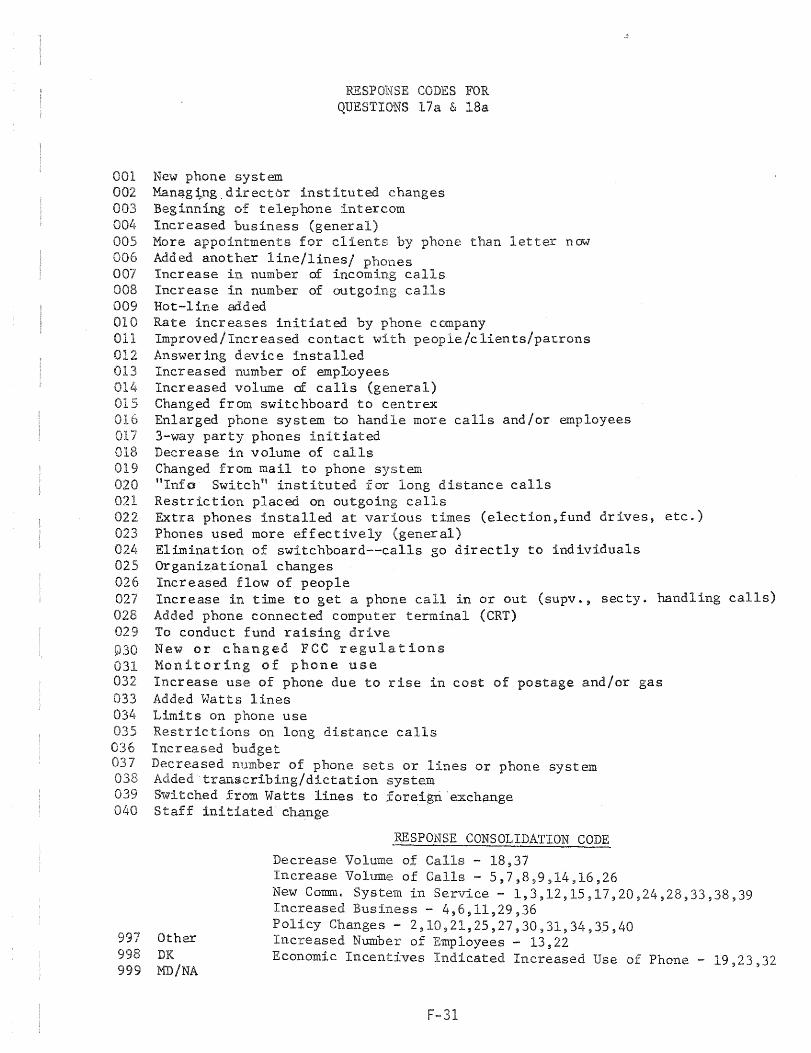
001 002 003 004 005 006 007 008 009 010 011 012 013
01.5 016 017
019 020 021 022 023 024 025 026 027 028 029
031
034
036 037 038 039 040
RESPONSE CODES FOR QUESTIONS 17a & 18a
New phone system Man~g~ng.directbr instituted changes Beginning of telephone intercom Increased business (general) More appointments for clients by phone than letter now Added another line!linesl phones Increase in number of incoming calls Increase in number of outgoing calls Hot-line added Rate increases initiated by phone company Improved/Increased contact with people/clients/patrons Answering device installed Increased number of employees Increased volume dE calls (general) Changed from switchboard to centrex Enlarged phone system to handle more calls and/or employees 3-way party phones initiated Decrease in volume of calls Changed from mail to phone system "Info Switch" instituted f or long distance calls Restriction placed on outgoing calls Extra phones installed at various times (election,fund drives, etc.) Phones used more eff ec tive1y (gener a1) Elimination of switchboard--calls go directly to individuals Organizational changes Increased flow of people Increase in time to get a phone call in or out (supv., secty. handling calls) Added phone connected computer terminal (CRT) To conduct fund raising drive New or changed FCC regulations Monitoring of phone use Increase use of phone due to rise in cost of postage and/or gas Added Watts lines Limits on phone use Restrictions on long distance calls Increased budget Decreased number of phone sets or lines or phone system Added transcribing! dictation syste_ID. Switched from Watts lines to !oreigri·exch~nge Staff initiated change
RESPONSE CONSOLIDATION CODE
Decrease Volume of Calls - 18,37 Increase Volume of Calls - 5,7,8,9,14,16,26 New Camm. System in Service - 1,3,12,15,17,20,24,28,33,38,39 Increased Business - 4,6,11,29,36
997 Other DK
999 MD/NA
Policy Changes - 2,10,21,25,27,30,3l,34~3.5,40 Increased Number of Employees - 13,22 Economic Incentives Indicated Increased Use of Phone - 19,23,32
F-31
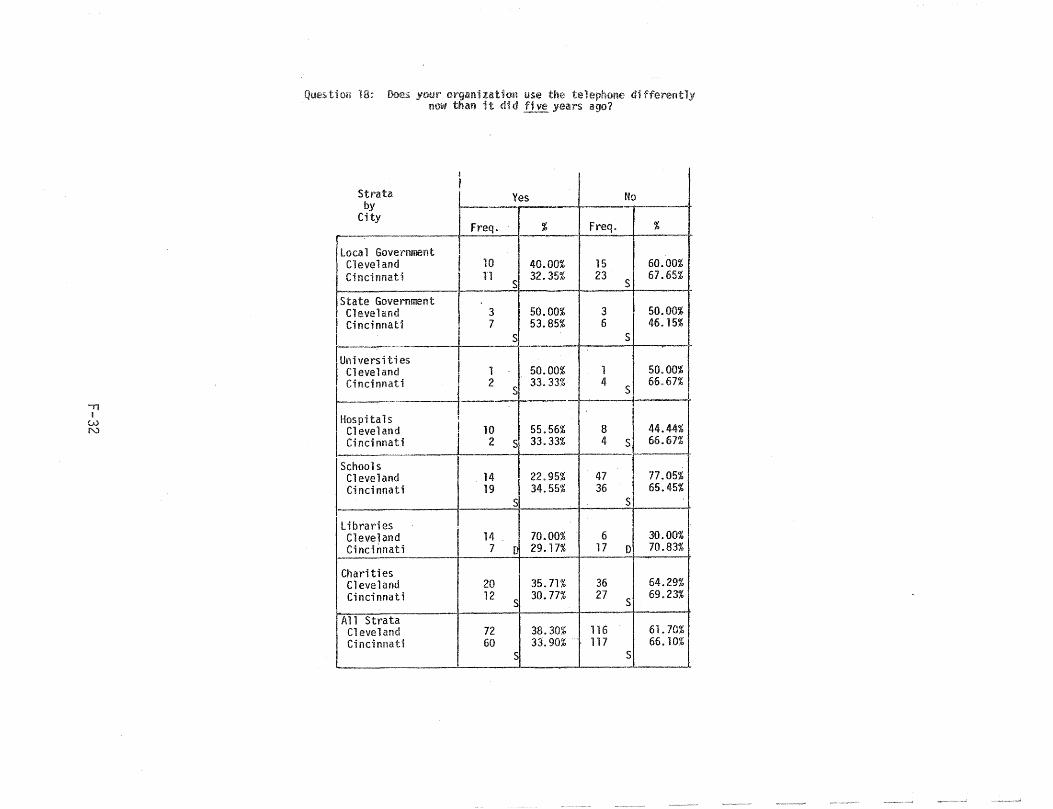
11 I
W N
18: Does
I
I Strata ~ by
City .~ ........ _~. _. _____ freq.
loca 1 Government I Cleveland 10 Cincinnati ~ n
State Government Cleveland 3 Cincinnati i 7
I i
luniversities I Cleveland . 1 I Cincinnati ~ 2
IHosPitals !
10 I Cleveland ! Cincinnati i 2
Schools I Cleveland 14 Ci nd nnati 19
Libraries Cleveland 14 Cincinnati 7
Charities Cleveland 20 Cincinnati 12
All Strata Cleveland 72 Cincinnati 60
------
use the diFT~r~n~
years ago?
Yes No
% freq . %
40.00% 15 60.00%
S 32.35% 23
S 67.65%
50.00% 3 50.00% 53.85% 6 46. 15%
s s
50.00% 1 50.00%
S 33.33% 4
S 66.67%
55.56% 8 44.44% S 33.33% 4 S 66.67%
-------22.95% 47 77.05% 34.55% 36 65.45%
S S
70.00% 6 30.00% [ 29.17% 17 0 70.83%
35.71% 36 64.29%
S 30.77% 27
S 69.23%
38.30% 116 61.70% 33.90% 117 66.10%
S S
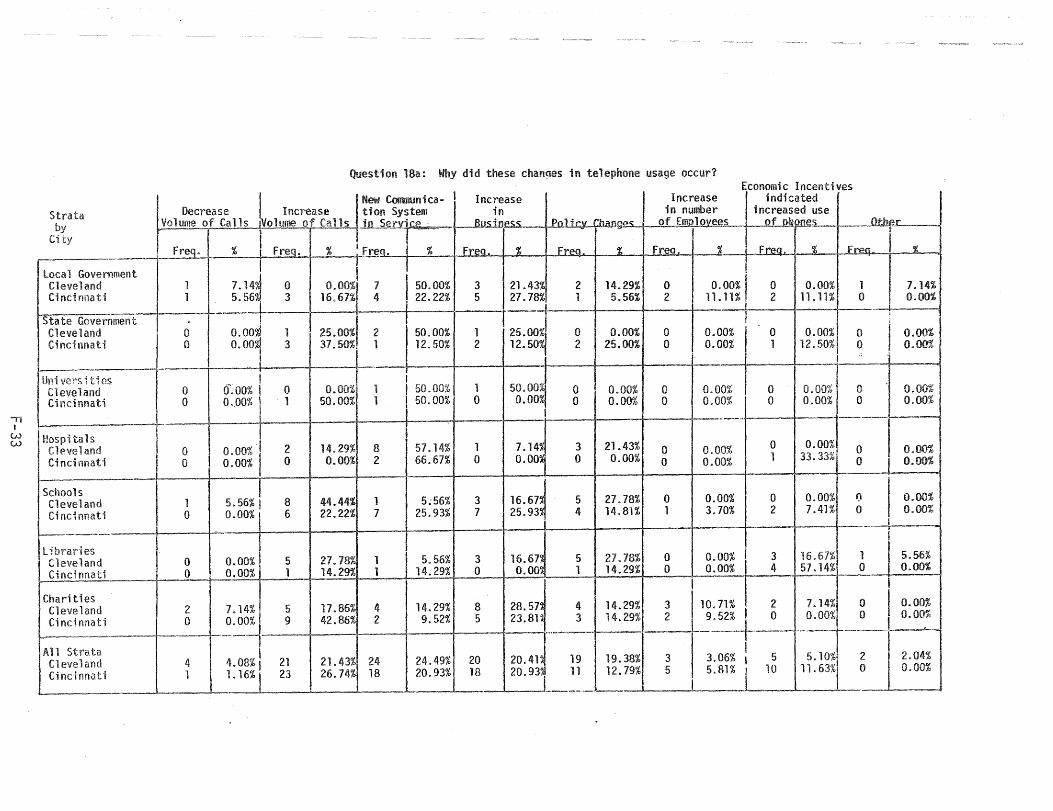
tAl W
Strata
local Government Cleveland Cincinnati
Question 18a: Why did these chan~es in telephone usage occur? Economic Incentives.
F I ~
New' Comunica- 1 Increase Increase I indicated Decrease Increase tion System in in number increased us.e
Volume of callLiV01Uil'e-.J!!J&l1S .ilLServ;rp· ~p« Pn~lI"S--....-!!L Ei10Y~ ::~ngL-l_JItil!'L--~
_ Freq._ t I Fre.. t I FreQ. % Freo. I % Freo % Free. %_1 f~q __ ~ 1--1 Freo I •
~ I {i I I
1 7. ~4J 0 O.OO~i 7 I 50.00% 3 121.43% 2 14.29% 0 0.00% I 0 0.00% 1 i 7.14% 1 5.56~ 3 16.67%1 4 ,22.22% 5 27.78% 1 5.56% 2 11.11%. 2 11.11% 0 ,0.001-
~State Government . ! I I +-- I -1 C~ev~1and. I 0 O.OO~ 1 2S.0cn 2 50.00% 1 25.00~ofl no 0.00% 0 O'0j-% . 0 0.00% 0 0.00% ClnCHll1atl 0 O. 00~ 3 31.50%1 1 12.50% 2 12.50 2 25.00% 0 0.00% 1 12.50% 0 0.00%
: I i I --I I ± . lIni ve\AS iti es I ! I Cleveland 0 (LOO% I 0 O.OO'i~ 1 1 50.00% 1 50.0m 0 0.00.% 0 0.00% 0 0.00% 0 ·1 0.00% 1 Cincinnati 0 0 .. 00% I 1 50.00% 1 I 50.00% 0 a.om
l 0 0.00% 0 0.00% 0 0.00% 0 0.00<];
! I ' --.. --, tals
and Cincinnati
o o
0.00% ",I 2 14.29% 8 II 57.14% 1 7.14~ 3 21.43% 0 0 00% 0 0.00% 0 I 0 00"" 0.00% 0 0.00% 2 66.67% 0 -0.001 0 0.00% 0 0:00% 1 33.33% 0 t 0:00%
Schools I ~" I" Cleveland 1 5.56% I 8 44.44% 1 5:56% 3 16.67 5 27.78% 0 0.100% 0 0.00% t) 0.00% ~~tl 0 0.00% I 6 22.22% 7 25.93% 7 25.93 4 14.81% 1 3.70% 2 7.41% 0 i 0.00%
libraries I I Cleveland 0 0.00% 5 27.78% 1 L 5.56% 3 16.67~ 5 21.18% 0 0.00% 3 16.67% 1 5.56%
I- Cincinnati, __ .. _ 0 0.00% 1 14.29% 1 14.29% 0 o.om 1 14.29% 0 O'~O%I 4 57.14% 0 0.00%
. . I ~ I r I Charltles I I Cleveland 2 7.14% 5 17.86% 4 14.29% 8 28.57 4 14.29% 3 10.71% 2 7.14% 0 0.00%
~~~.~.~,~_ati .. _._ .~.~----~~.~Ol% __ 9 42.86% 2 1 9.52% 5 ~3.81J" . ___ "_3 __ 14.29% ~~_I ~~_52"1.+~_~.-;~~_~ All Strata I I ~-j Cleveland 4 I 4.08% I 21 21.43% 24 24.49% 20 20.41 19 19.38% 3 3.06% I 5 5.10%1 2 2.04%
I Cincinnati _ . 1 1.16%1 23 26.74% 18 20.93% 18 20.93j __ ~~. 12.19% 5 5.81% J 10 11.63%1 0 0.00%
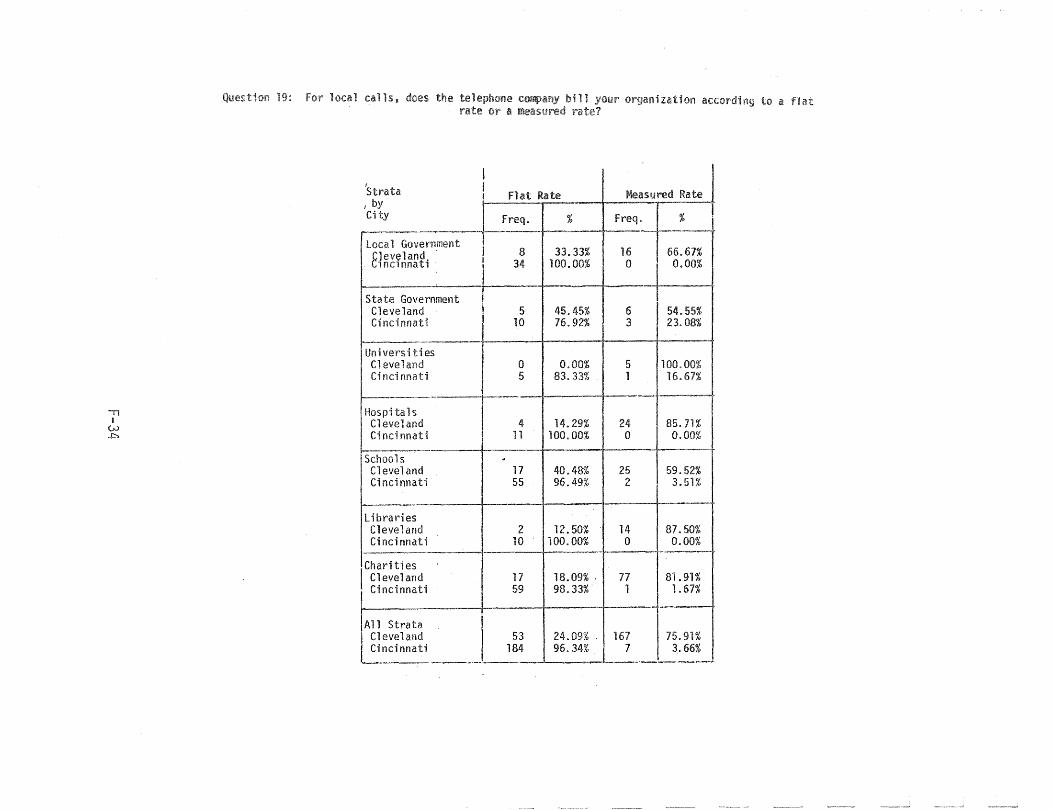
Question 19: For local calls g does organization ~rrn~~inn to a flat rate a mtl>,*",u!t"ii:llfi
I i I Strata flat Rate Measu! I by
I
City freq. % Freq. .",
oed :ate 1
............. -'----'--------.-----~ --- ----local Government
I 8 33.33% 16 66.67% El evel and. ' l!lClnnatl
,I 34 100.00% 0 00%
- ! State Government 1 Cleveland 5 45.45% 6 54.55% Cincinnati 10 76.92% 3 23.08%
~
Uni vers iti es Cleveland 0 0.00% 5 100.00% Cincinnati 5 83.33% 1 16.61%
~tals--1 1-----
Cleveland 4 14.29% 24 85.71% Ci nei nnati I 11 100.00% 0 0.00%
Schools q
Cleveland 17 40.48% 25 59.52% Cincinn-ati 55 96.49% 2 3.51%
librari es Cleveland 2 12.50% 14 87.50% Cincinnat'j 10 100.00% 0 0.00%
-Chariti es ' I Cleveland 17 18.09% ' 71 81. 91 % Cincinnati 59 98.33%' 1 1.67%
All Strata CI eveland 53 24.09% ' 167 75.91% Cincinnati 184 96.34% 7 3.66%
,. ---.
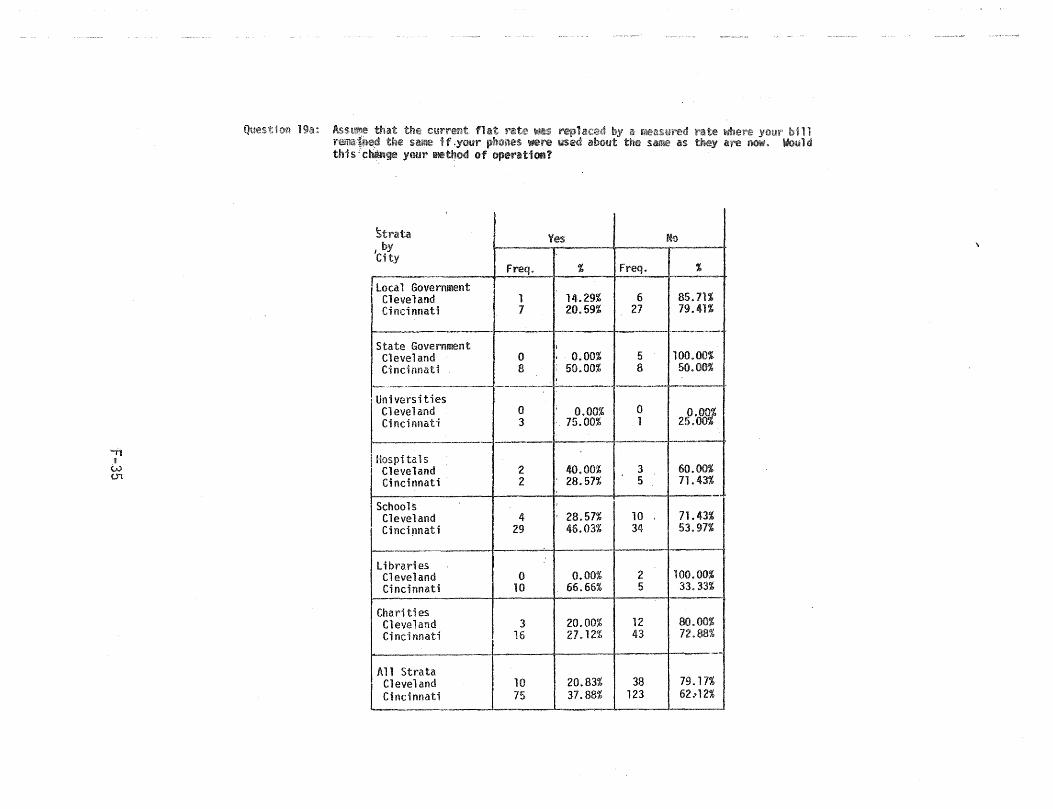
""11 1
W U1
Question 19a:
Strata I by City
local Government Cleveland Cincinnati
-State Government
Cleveland Cincinnati
f-.-
Uni vers Hies Cleveland Cincinnati
I Hospitals I Cleveland
Cincinnati"
Schools Cleveland Cinci,mati
C-----'
librat'ies Cleveland Cincinnati
Charities Cleveland Ci nei nnat;
All Strata Cleveland Cincinnati
~Y~ ._,..--,--
Freq. % Freq.
1 14.29% 6 7 20.59% 27
j
0 0.00% 5 8 50.00% 8
-.-"" -" --'-0 0.00% 0 3 ' 75.00% 1
---
"2 40.00% 3 2 ' 28.57% 5
: 28.57X ~ 4 29 46.03% 34
0 0.00% 2 10 66.66% 5
3 20.00% 12 16 27.12% 43
10 20.83% 38 75 37.88% 123
No ""
%
85.71% 79.41%
100.00% 50.00%
~.~---
O'&r/ 25.
-----
60.00% 71.43%
"'
71.43% 53.97%
100.00% 33.33%
80.00% 72.88%
79.17% 62.-12%
~.;..
where your are now.

Question 19b; Could you ten me bow ,rour were cnanged?
Switch to Reduce other means of Increase
calling volume Polky changes Budget change commull i ca t i 011 Service Cut Service Other -
Freq. % Freq. % Freq. % Freq. % Freq. % Freq. % Freq. % ,---""""''''- - - -
local Government
Cleveland 0 0.00% 0 0.00% 1 100.00% 0 0.00% 0 0.00% 0 0.00% 0 0.00% Cincinnati 6 66.67% 2 22.22% 0 0.00% 1 11.11% 0 0.00% 0 0.00% 0 0.00%
1------- ---- r----.-!-.--
State Government Cleveland 0 0.00% 0 0.00% 0 0.00% 0 0.00% 0 0.00% 0 0.00% 0 0.00% Ci nci I1nat-j 5 55.55% 0 0.00% 1 11.11% 1 11.11% 0 0.00% 0 0.00% 2 22.22%
Universities Cleveland 0 0.00% 0 0.00% 0 0.00% 0 o.OO%L 0 0.00% 0 0.00% 0 0.00% Cincinnat-i 2 22.22% 0 0.00% 1 33.33% 0 0.00% 0 0.00% 0 0.00% 0 0.00%
.""..,.".,,,,,,,, .. . "'---r'" .",.""""""""-_.- '-''''''''''''''''"=:=~ -.-.-1--------" ~ .. -';'''.'%'''''-
Hospitals Cleveland 0 0.00% 0 0.00% 1 100.00% 0 0.00% 0 0.00% 0 0.00% 0 0.00%
Cincinnati 0 0.00% 2 100.00% 0 0.00% 0 0.00% 0 0.00% 0 0.00% 0 o.om; - - -- --- f.-o--- --1-----_._- .
~.--.--- -Schools
Cleveland 1 16.67% 3 50.00% 1 16.67% 0 0.00% 0 0.00% 0 0.00% 0 0.00% Cincinnati 10 31.25% 13 40.63% 7 21.88% 0 0.00% 0 0.00% 2 6.25% 0 0.00%
-Li braries
Cleveland 0 0.00% 0 0.00% 0 0.00% 0 0.00% 0 0.00% 0 0.00% 0 0.00% C; nd nnati 4 36.36% 3 36.36% 0 0.00% 1 9.09% 0 0,00% 2 18.18% 1 9.09%
-.-Charities
Cleveland 1 25.00% 2 50.00% 1 25.00% 0 0.00% 0 0.00% 0 0.00% 0 0.00%
Cincinnati 8 40.00% 4 20.00% 2 10.00% 2 10.00% 0 0.00% 1 5.00% 3 15.00%
-A 11 Strata
Cleveland 2 16.67 5 41. 67% 4 33. 33~ 0 0.00% 1 8.33% 0 0.00% 0 0.00%
Cincinnati 35 40.70% 24 27.91 11 12.79~ 5 5.81% 0 0.00% 5 5.81 6 6. g8"~
,,~I!......,
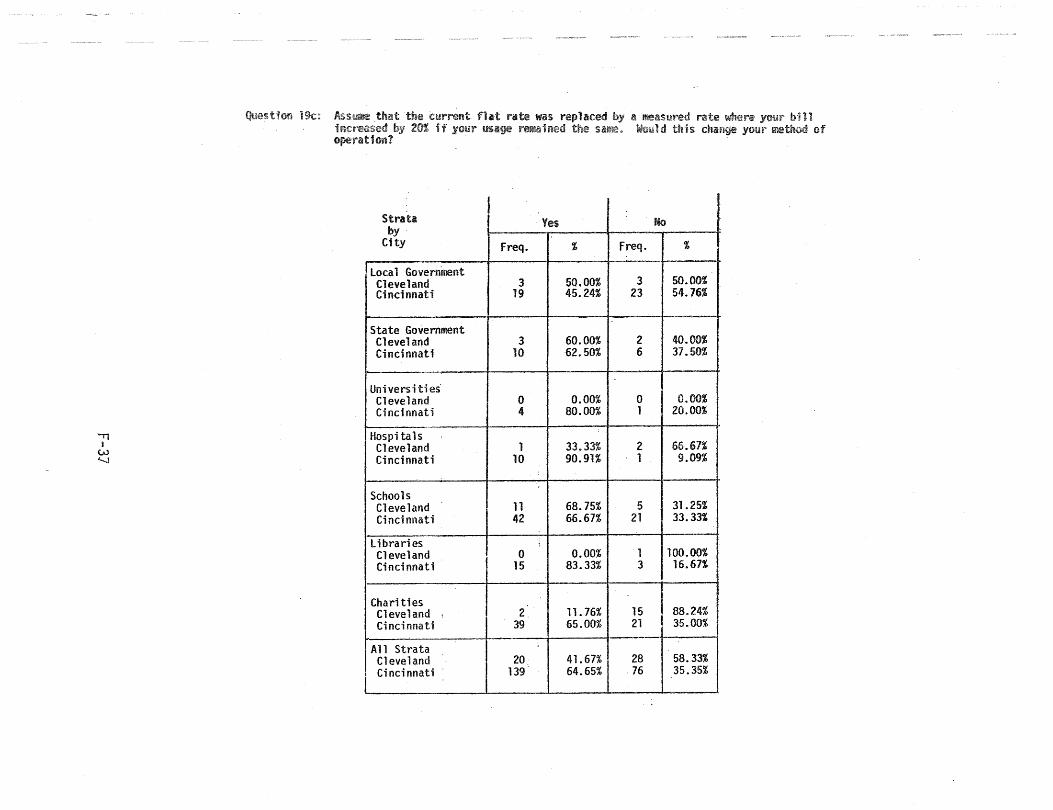
"Ti I
W ...... J
19c: Ass;~ Uu~t 'the current flat nlIte was replaced by a measured rate where your Mn hu:::reased 2m: if YOMr usage re¥r.alned the sa~}2. Would this change your If'~thod of operation?
Strata Yes No by
City freq. % Freq. %
loca 1 Government Cleveland 3 50.00% 3 50.00% Cincinnati 19 45.24% 23 54.16%
State Government Cleveland 3 60.00% 2 40.00% Cincinnati 10 62.50% 6 37.50%
Universities' Cleveland 0 0.00% 0 0.00% Ci nci nnat i 4 80.00% 1 20.00%
Hospi tals Cleveland 1 33.33% 2 66.61% Cincinnati 10 90.91% 1 9.09%
Schools Cleveland 11 68.75% 5 31.25% Cincinnati 42 66.67% 21 33.33%
libraries Cleveland 0 0.00% 1 100.00% Cincinnati 15 83.33% 3 16.67%
I Charities Cleveland ' 2 11. 76% 15 I 88.24% Cincinnati 39 65.00% 21 35.00%
I All Strata - -
;
Cleveland 20 41. 67% 28 58.33% I l Cincinnati 139 64.65% ,76 35.35% I 'I
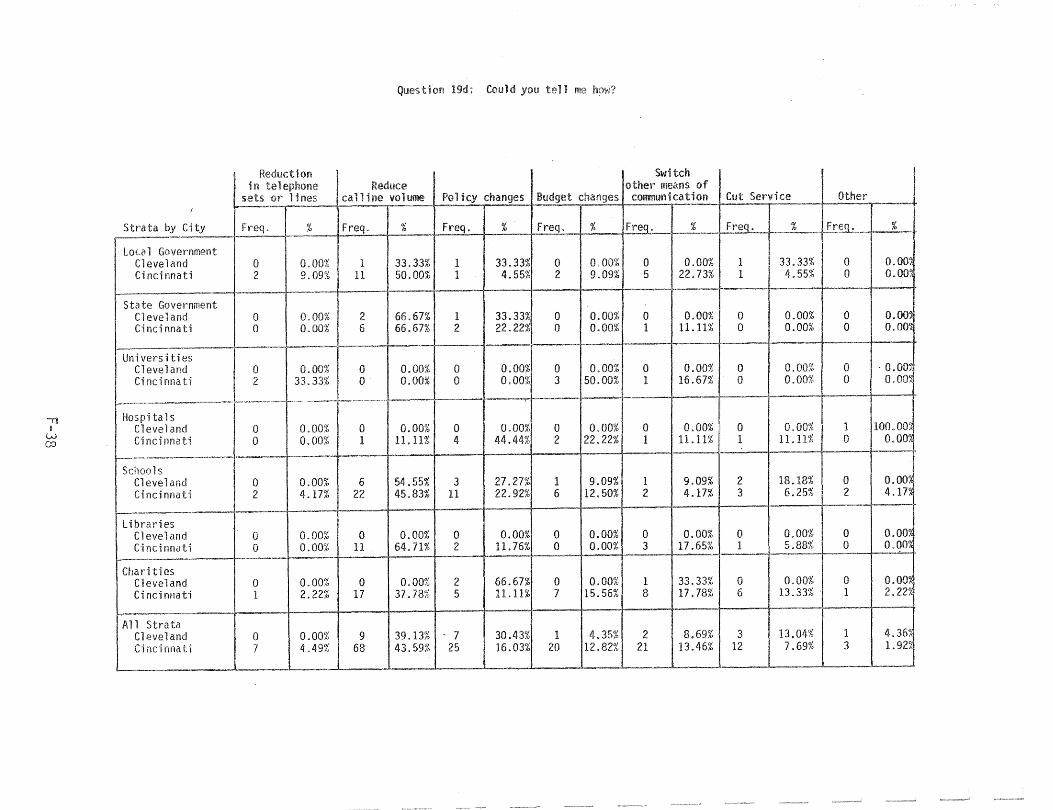
.." I
W co
19d: Could you tell
Reduction Switch
LOther in Reduce other means of sets or ines can ine volume Po 1 icy changes Bud~et changes communication Cut Sen/ice
I .. ------ -"-,,---= .1--.
Strata by City freq. % Freq. % Freq. % Freq. % Freq . % Ft~eq. % Freq. r----~------. _"- -.-"-~-- f--
local Government Cleveland 0 0.00% 1 33.33% 1 33.33% 0 0.00% a 0.00% 1 33.33% a Ci nci nnati 2 9.09% 11 50.00% 1 4.55% 2 9.09% 5 22.73% 1 4.55% 0
f...------ --. --~~-r_. -.......... ~ ..... ...,.,..,,-1--.
State Government Cleveland 0 0,00% 2 66.67% 1 33.33% 0 0.00% 0 0.00% 0 0.00% 0 Cincinnati 0 0.00% 6 66.67% 2 22.22% 0 0.00% 1 11.11% 0 0.00'; 0
--.---,,---~ ----'-'~-- --- ,'-,
Universities Cleveland 0 0.00% 0 o.~ 0
0.00% 0 o,om~ 0 0.00% 0 0.00% 0 Cincinnati 2 33.33% 0 _~~_OO% ._~O 0.00~0 3 50.00% 1 16.67% 0 O.OO;~ 0
...... .-,,--, ~.~,-. -- -~
[lI! I-Iospita 1 s I Cleveland 0 0.00% 0 0.00% 0 0.00% 0 0.00% 0 0.00% i 0 0.00% 1 Ci ncinnati 0 0.00% 1 11. 11% 4 44.44% 2 22.22% 1 11.11% • 1 11.11% 0
i----.
Schools Cleveland 0 0.00% 6 54.55% 3 27.27% 1 9.09% 1 9.09% 2 18.18% 0 Cincinnati 2 4.17% 22 45.83% 11 22.92% 6 12.50% 2 4.17% 3 6.25% 2
----"_. ---libraries
Cleveland 0 0.00% 0 0.00% 0 0.00% 0 0.00% 0 0.00% 0 0.00% 0 Cincinnati 0 0.00% 11 64.71% 2 11. 76% 0 0.00% 3 17.65% 1 5.88% 0
'------.--~--~---
Charities Cleveland a 0.00% 0 0.00% 2 66.67% 0 0.00% 1 33.33% a 0.00% 0 Cincinnati 1 2. 22~0 17 37.78% 5 11.11% 7 15.56% 8 17.78% 6 13.33% . 1
,.- -.-.---All Strata
Cleveland 0 0.00% 9 39.13% - 7 30.43% 1 4.35% 2 8.69% 3 13.04% 1 Cincinnati 7 4.49% 68 43.59% 25 16.03% 20 12.82% 21 13.46% 12 7.69% 3
-,~ ._- -"
%
D.om .om
o~ 0.00
. O.OO~
d 100.00~ 0.00
0.00% 4 .17~
o.om O.OO?
~.~J 2.22?
r--'-
4.36~ 1.92?'
1........---
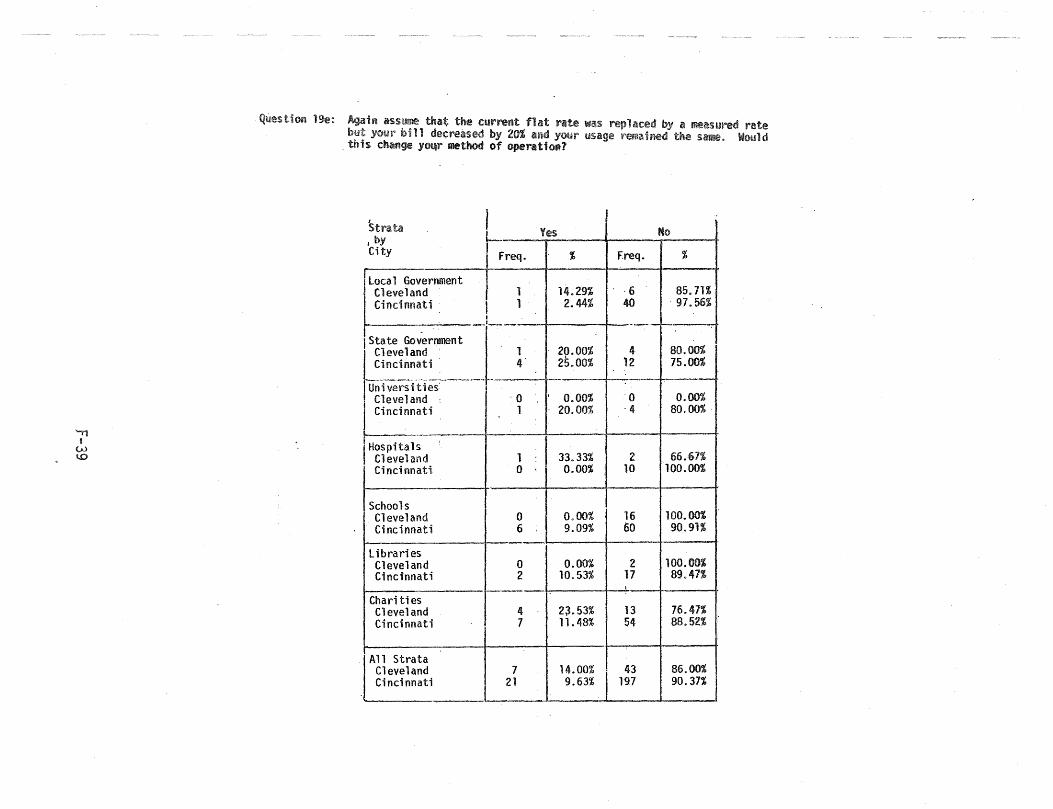
1ge: Aoain assume that the current flat rate w~s your bill d~creased by 20i and your usage ~~~~_bA.
. this change yoqr method of operation?
a meas utr>ed rate s~ .. Would
Strata ,
Yes No I by ~req. City % freq. %
r Ilocal Government 1 14.29% . ·6 85.71% Cleveland
Cincinnati I 1 2.44% 40 ' 97.56% I l ____
-I State Government
1 20.00% 4 80.00% ~veland Cincinnati 4' 25.00% 12 75.00% ~------------
Universities i Cleveland 0 ' 0.00% 0 O.OM I Cincinnati 1 20.00% -4 80.0mb'
i I Hospitals : I Cleveland 1 33.33% 2 66.67% Cincinnati 0 0.00% 10 100.00%
Schools Cleveland 0 0.00% 16 100. om Cincinnati 6 9.09% 60 90.91%
libraries Cleveland 0 0.00% 2 100.00% Cincinnati 2 10.53% 17 89.41%
I
Charities Cleveland 4 23.53% 13 76.47% Cincinnati 7 11. 48% 54 88.52%
I All Strata Cleveland 7
14.00% ~! 86.00% I _ Ci~cinna~~ ___ ~ 21 9.63% 197 90.37%
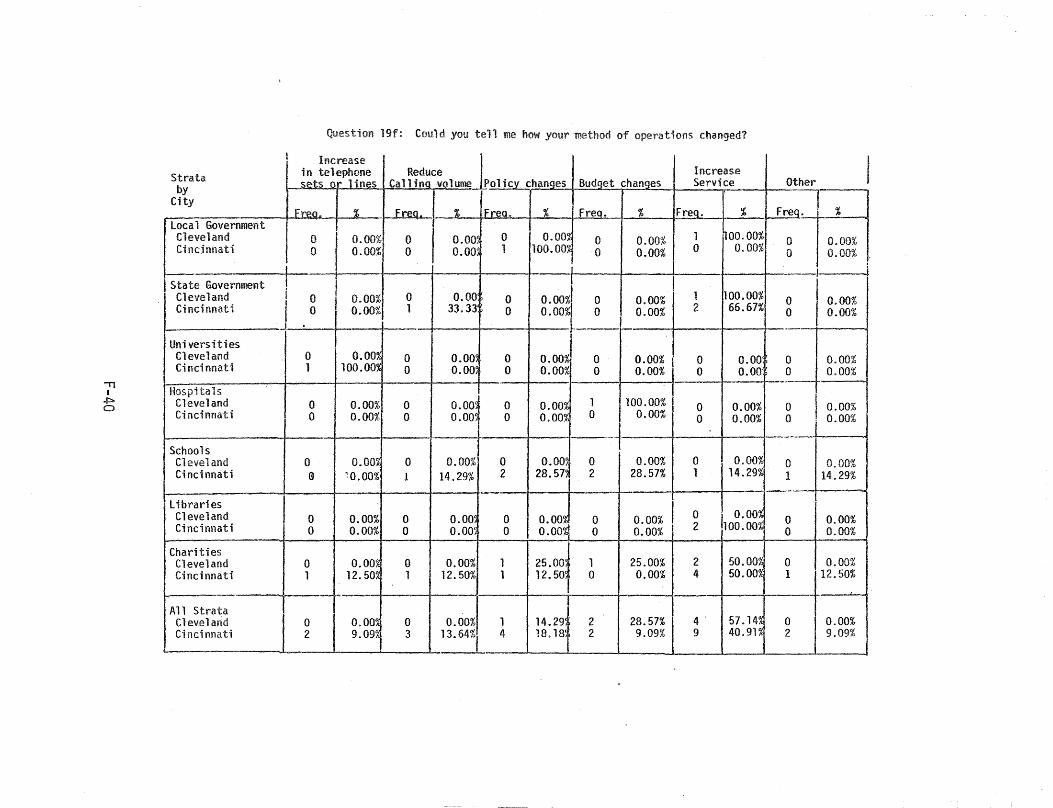
-n I
+::> o
Question 19f: Could you tell me how your lllethod of operations chan'ged?
Increase Strata by
City
Service Other
Free. I % FreG. % % _~~_. [ce9... loca 1 Government I
Cleveland 0 0.00% 0 I 0.003 0 O.OO~ 0 f 0.00% I 1 Cincinnati 0 0.00% 0 _'~_~L~_~'OOl 1 100.001 0 0.00% 0
I' II
%
hoo.OO% 0.00%
Freq. %
o 0.00% o 0.00%
S~~!~e~~~~rnme"t r-~-I 0.00% 0 o.~l 0 0 0.00% ~00.00% 0 0.00% Cincinnati i 0 0.00% 1 33.33f 0 66.67% 0 0.00%
-! . !
-H O.OO~ 0 O.OO~ 0 0.00% 0 0 0.00 0 i 0.00%
f __ . 1 100.00~ 0 0.00.0 0.00% 0 0 0.00 _.O-t 0.00%
Hospitals I
Universities Cleveland Cincinnati
Cleveland 0 0.00% 0 0.00 0 O.OO~ 1 0 0.00% 0 I 0.00% Cincinnati 0 0.00% 0 o.oo~ 0 0.00% 0 0 0.00% 0 ! 0.00%
I Schools I r I I ~: .-Cleveland Cincinnati
libraries Cleveland Cincinnati
Charities Cleveland Cincinnati
o G
o o
o 1
0.00% :0.00%
0.00% 0.00%
o.om 12.502
o 1
o o
o 1
0.00% 14.29%
o.om 0.00~
0.00% 12.50%
o 2
o o
O.OO~ 0 28.57i 2
0.00% 0.00%
o o
1 o
0.00% 28.57%
0.00% 0.00%
25.00% 0.00%
o 1
o 2
2 4
0.00% 14.29%
II' 0.00% 100.00%
50.00% 50.00%
o I 0.00% 1 14.29%
o o
o 1
0.00% 0.00%
0.00% 12.50%
All Strata Cleveland Cincinnati
25.00J 12. 501
~ i ,- . 1 I 4
1
0 I 0.00 0 0 0 00%1 . 2 _ 9.09 3 13.64%1
1 4
14.29 18.18
2 2
28.57% 9.09%
4' 9
57.14% 40.91%
o 2
0.00% 9.09%
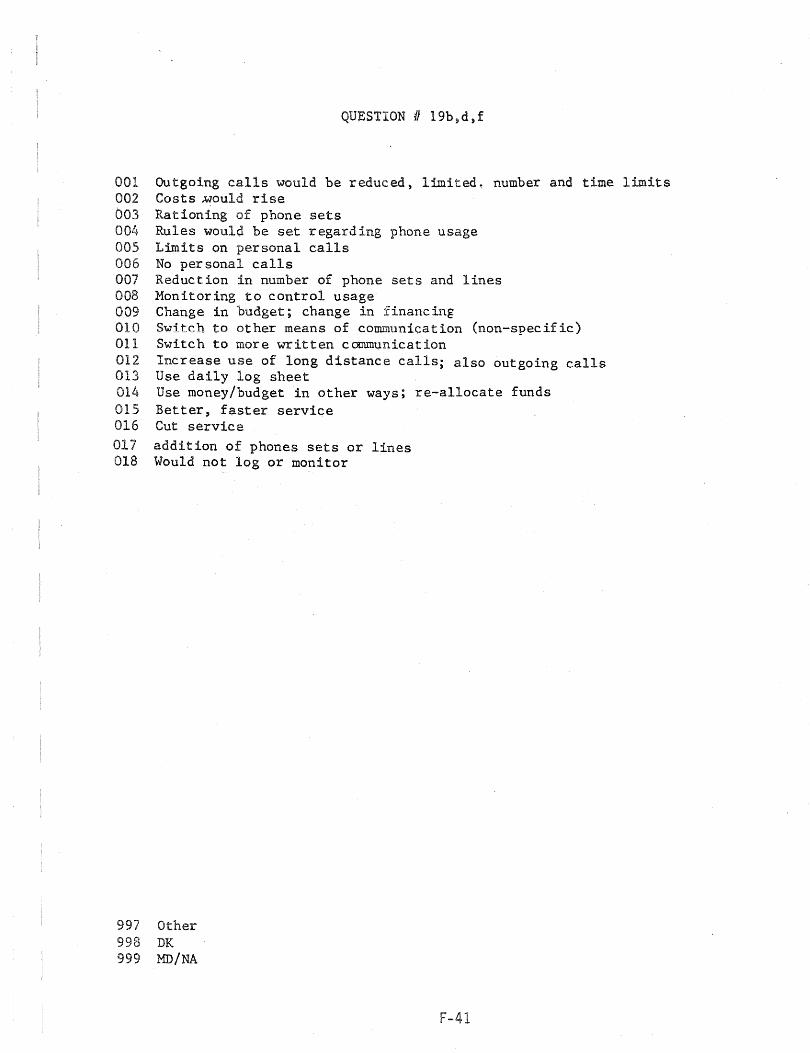
QUESTION # 19b,d,f
001 Outgoing calls would be reduced, limited~ number and time limits 002 Costs Mould rise 003 Rationing of phone sets 004 Rules would be set regarding phone usage 005 Limits on personal calls 006 No personal calls 007 Reduction in number of phone sets and lines 008 Monitoring to control usage 009 Change in budget; change in financing 010 Switch to other means of communication (non-specific) 011 Switch to more written communication 012 Increase use of long distance calls; also outgoing calls 013 Use daily log sheet 014 Use money/budget in other ways; re-allocate funds 015 Better, faster service 016 Cut service
017 addition of phones sets or lines 018 Would not log or monitor
997 Other 998 DK 999 MD/NA
F-41
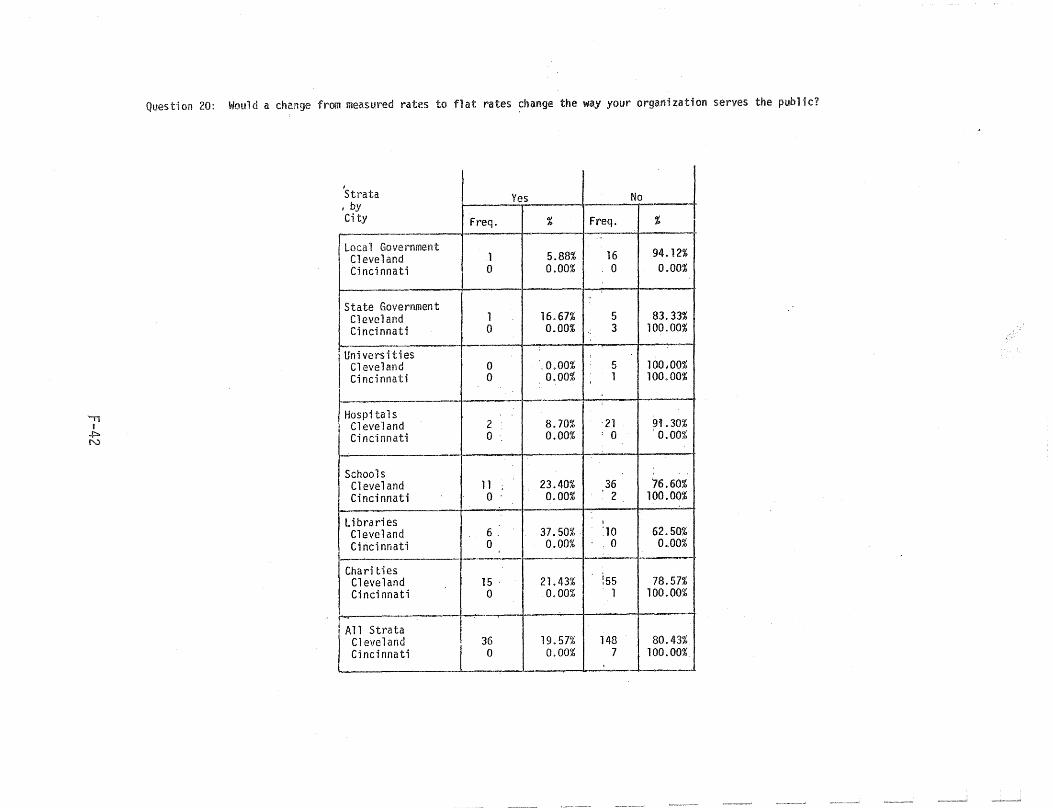
-n I
..j::>. N
Question 20: Would a change from measured rates to flat rates ~hange the way your organization s;erves the public?
I
'Strata Yes No I by City Freq. % Freq. %
-Loca 1 Government Cleveland 1 5.88% 16 94.12%
Ci nd nnati 0 0.00% . 0 0.00%
State Government Cleveland 1 16.67% 5 83.33% Cincinnati 0 0.00% 3 100.00%
Un; versities Cleveland 0 '.0.00% 5 100.00% Cincinnati 0 0.00% 1 100.00%
Hospi tals Cleveland 2 8.70% '21 9i.30% Cincinnati o . 0.00% ; 0 ' 0.00%
Schools , Cleveland 11; 23.40% 36 76.60% Cincinnati o . 0.00% . 2 100.00%
L i brari es I
Cleveland 6. 37.50% :10 62.50% Cincinnati 0 0.00% 0 0.00%
-Chari ties
. l55 Cleveland 15 . 21.43% 78.57% Cinci nnati 0 0.00% 1 100.00%
I All Strata Cleveland 36 19.57% 148 80.43% Cincinnati 0 0.00% 7 100.00%
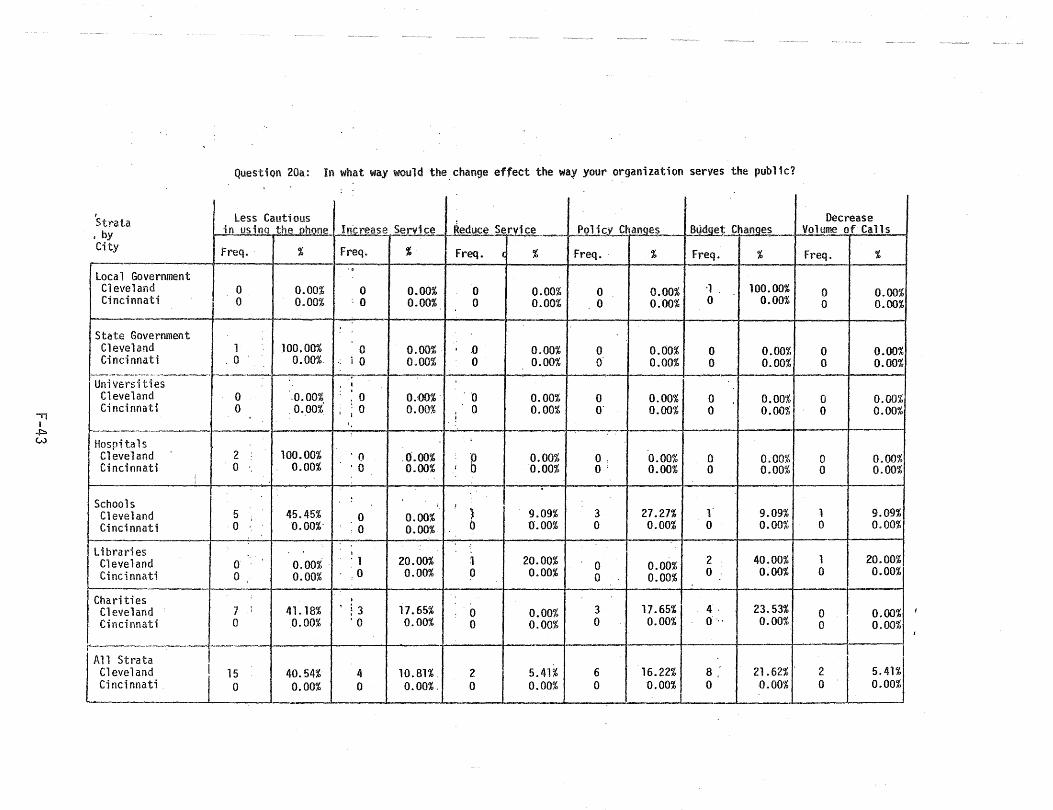
II I
+::> w
Question 20a: In what. way would the change effect the way your organization serves the public?
I less Cautious Strata in us i I1Q the J2!J9n~~ Increase Service Reduce Service Policy Changes Budget ChanQes • by
City Freq. % Freq. % freq. ( % freq. - % freq. % r---' ,. local Government
I Cleveland 0 0.00% 0 0.00% 0 0.00% 0 0.00% '1 , 100.00% Cincinnati 0 0.00% -, 0 0.00% 0 0.00% 0 0.00% 0 0.00%
State Government ' -
Cleveland 1 100.00% 0 0.00% - .0 0.00% 0 0.00% 0 0.00% Cincinnati _0 0.00%- .: i 0 0.00% 0 0.00% 0 0.00% 0 0.00% -------.. ---_ .. _", --
Universities , I
Cleveland 0 .0.00% . : 0 0.00%- ''0 0.00% 0 0.00% 0 0.00% Cincinnati 0 _ 0 •. 00%' t ; 0 0.00% 0 0.00% o· 0.00% 0 0.00%
! :
Hospitals Cleveland 2 100.00% '0 .0.00% D 0.00% O. 0.00% 0 0.00% Cincinnati -0 0.00% ;0 0.00% : b 0.00% 0: 0.00% 0 0.00%
!
Schools ! ;
~ Cleveland 5 45.45% 0 0.00% 9.09% 3 27.27% l 9.09% Cincinnati o ' 0.00%' 0 0.00% 0 0'.00% 0 0.00% 0 0.00%
Libraries I
2 40.00% Cleveland 0 0.00% . 1 20.00% 1 20.00% 0 0.00% Cincinnati 0 0.00% ' : 0 0·00% 0 0.00% 0 0.00% 0 0.00%
Charities I
Cleveland 7 ,; 41. 18% ' ! 3 17.65% 0 0.00% 3 17.65% 4, 23.53% Cincinnati 0 0.00% '0 0.00% 0 0.00% 0 0.00% 0" 0.00%
I L# Strata Cleveland I 15 40.54% 4 1O.B1% 2 5.41% 6 16.22% 8 .- 21.62% ' Cincinnati. 0 0.00% 0 0.00%. 0 0.00% 0 0.00% 0 0.00% ______ J _____
--
Decrease Volume of Calls
Freq. %
0 0.00% 0 0.00%
0 0.00% 0 0.00%
0 0.00% 0 0.00%
0 0.00% 0 0.00%
I
I
1 9.09% 0 0.00%
1 20.00% 0 0.00%
0 0.00% 0 0.00%
2 5.41% 0 0.00%
---
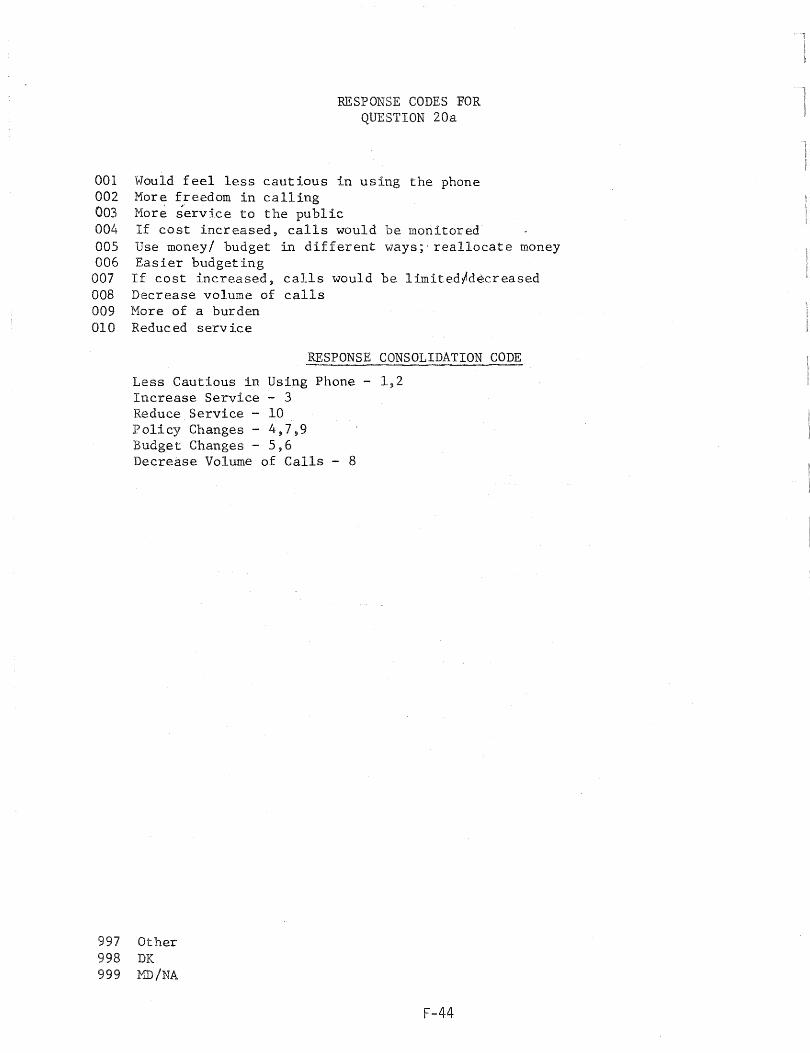
RESPONSE CODES FOR QUESTION 20a
001 Would feel less cautious in using the phone 002 More freedom in calling 003 More service to the public 004 If cost increased, calls would be monitored 005 Use money/ budget in different ways;- reallocate money 006 Easier budgeting
007 If cost increased, calls would be limited~d~creased 008 Decrease volume of calls 009 More of a burden 010 Reduced service
RESPONSE CONSOLIDATION CODE
Less Cautious in Using Phone - 1,2 Increase Service - 3 Reduce Service - 10 Policy Changes - 4,7,9 Budget Changes - 5,6 Decrease Volume of Calls - 8
997 Other 998 DK 999 MD/NA
F-44
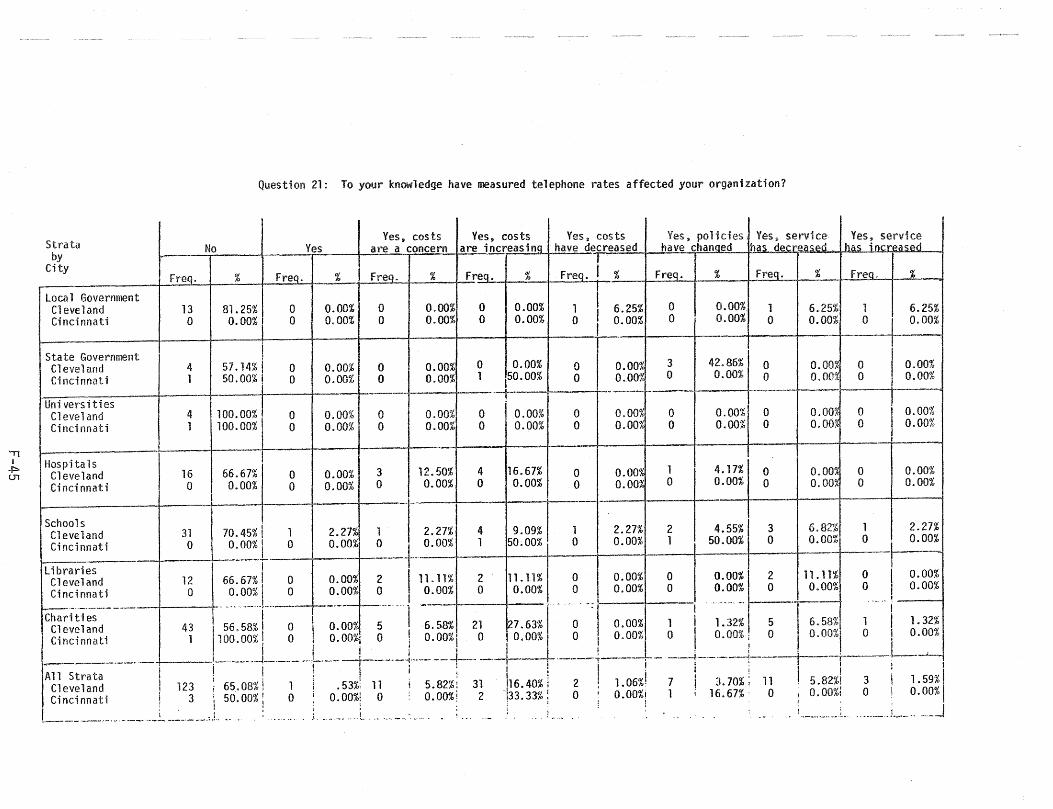
'Tj I
.p. tr1
Question 21: To your knowledge have measured telephone rates affected your organization?
Strat Yes~ costs Ves, costs Yes» costs Yes, policies Yes~ service y .-
City 'I Freq. % FreQ. % FreQ. % Fr~ % Freq. % Freq. % FreQ. %
Yes", service has increased
FreQ. %
b a No Yes are a concern are increaslno have decreased have ranged has decreas.d
I I
Local Government Cleveland 13 81.25% 0 0.00% 0 0.00% 0 0.00% 1 II' 6.25% 0 01.00% 1 6.25% 1 I 6.25% Cincinnati 0 0.00% I 0 0.00% 0 0.00% 0 0.00% 0 I 0.00% 0 01.00% 0 0.00% 0 i 0.00%
I ," I j
State Government I I I I I Cleveland 4 57.14% I 0 0.00% 0 0.00% 0 0.00% 0 o .. oor 3 4~:ggi I 0 . o.om. 0 I 0.00% Cincinnati 1 50.00%! 0 0.00% 0 0.00% 1 150 •00% 0 0.001 0 ~ 0 O.OOl 0 1 0.00%
u~~~~~~!~~es I 4 1100.00% 1.1 0 0.00% - 0 0.00% O'~ 0' -:: --0--- O.OO%I_-:-~.O:l· 0 II 0000%-..1 Cincinnati 1 100.00% I 0 0.00% 0 0.00% 0 0.00% 0 O.OO~ 0 0.00% 0 o.om 0 0.00%
I I --I
I--- r~-Hospitals I Cleveland I 16 66.67% I 0 0.00% 3 12.50% 4 16.67% 0 0.00~ 1 I 4.17% I 0 Cincinnati 0 0.00% 0 0.00% 0 0.00% 0 0.00% 0 0.00% 0 0.00% 0
0.00% 0.00%
o o
0.00% 0.00%
Schools I ------, I' -~ Cleveland 31 70.45% I 1 2.27% 1 I 2.27% 4 9.09% 1 2.27% 2 4.55% 3 6.82% 1 I 2.27% Cincinnati 0 0.00% I 0 O.OOC! 0 +' 0.00% 1 50.00% I 0 0.00% 1 50.00% 0 0.00% 0 . 0.00%
\ibraries -----,. -- .. !. t------Cleveland 12 66.67% \' 0 0.00% 2 111. 11% 2 11.11% 1\ 0 0.00% 0 {)I. 00% I 2 11.11% 0 I 0.00% Cincinnati 0 0.00% 0 0.00% 0 I 0.00% 0 0.00% 0 0.00% 0 01.00% 0 0.00% 0 i 0.00%
1--.-_ .. _-'--- ..... __ .... , ..... - 1 .: .. ' .... . "", .'1.- I
Charities I I . I I Cleveland 43 56.58% 0 1 0 •00% 5 6.58% 21 27.63% 0 0.00% 1 1.32% 5 6.58% 1 I 1.32% Cincinnati 1 I 100.00% ! 0 ! O.OOX; 0 0.00%1 0 0.00% ,0 0.00% 0 I O.OO%! 0 0.00%1 0 1 0.00%
..__----_ .. --_. !------.J-.--- . ...i __ ._ -+----1 .. ----- -J---.. --"~---l--.---~-.-J.- --~-.-.-.-J.--_f. i .L.--'---.., All Strata ! I ! I j ; I!! : I Cleveland 123 \ 65.08% I 1 .53%; 11 ! 5.82%i 31 Ih6.40% l 2 1.06%! 7 :1. 70%; 11 . 5.82%1 3 1.59%\ Cincinnati 3 50.00% I 0 0.00%1 0 O.OO%! 2 -,33.33% l 0 O.OO%! 1 16.67%' 0 t 0.00%1 0 0.00%1
____ . ___ .;J.. ...: . 1 ....... _ ..... L . __ . __ ' .. _... '. ! ... __ ." •..•. ~-..... _ .. _ .. L~._ .... --J
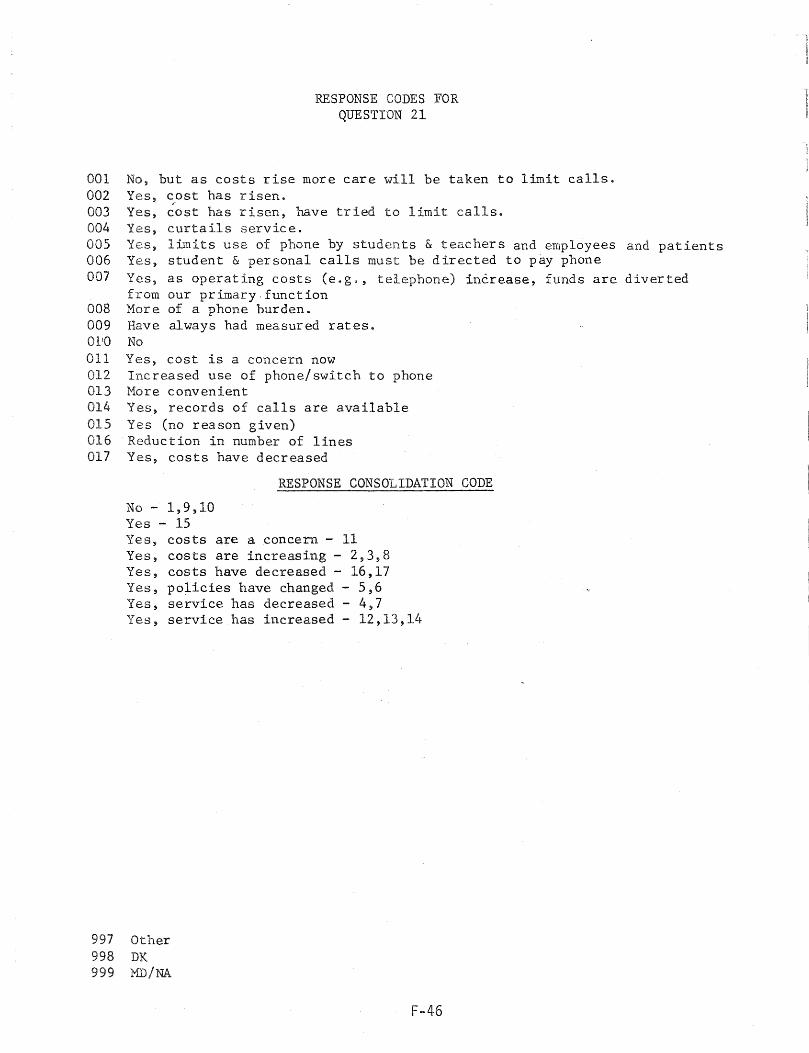
RESPONSE CODES FOR QUESTION 21
001 No, but as costs rise more care will be taken to limit calls. 002 Yes~ cost has risen. 003 Yes, ~ost has risen, have tried to limit calls. 004 Yes, curtails service. 005 Yes, limits use of phone by students & teachers and employees and patients 006 Yes, student & personal calls must be directed to pay phone 007 Yes, as operating costs (e.g., telephone) increase~ funds are diverted
from our primary.function 008 More of a phone burden. 009 Have always had measured rates. 01'0 No 011 Yes, cost is a concern now 012 Increased use of phone/switch to phone 013 More convenient 014 Yes, records of calls are available 015 Yes (no reason given) 016 Reduction in number of lines 017 Yes, costs have decreased
RESPONSE CONSOLIDATION CODE
No - 1,9,10 Yes - 15 Yes, costs are a concern - 11 Yes, costs are increasing - 2,3,8 Yes, costs have decreased - 16,17 Yes, policies have changed - 5,6 Yes, service has decreased 4,7 Yes, service has increased - 12,13,14
997 Other 998 DK 999 MD/NA
F-46
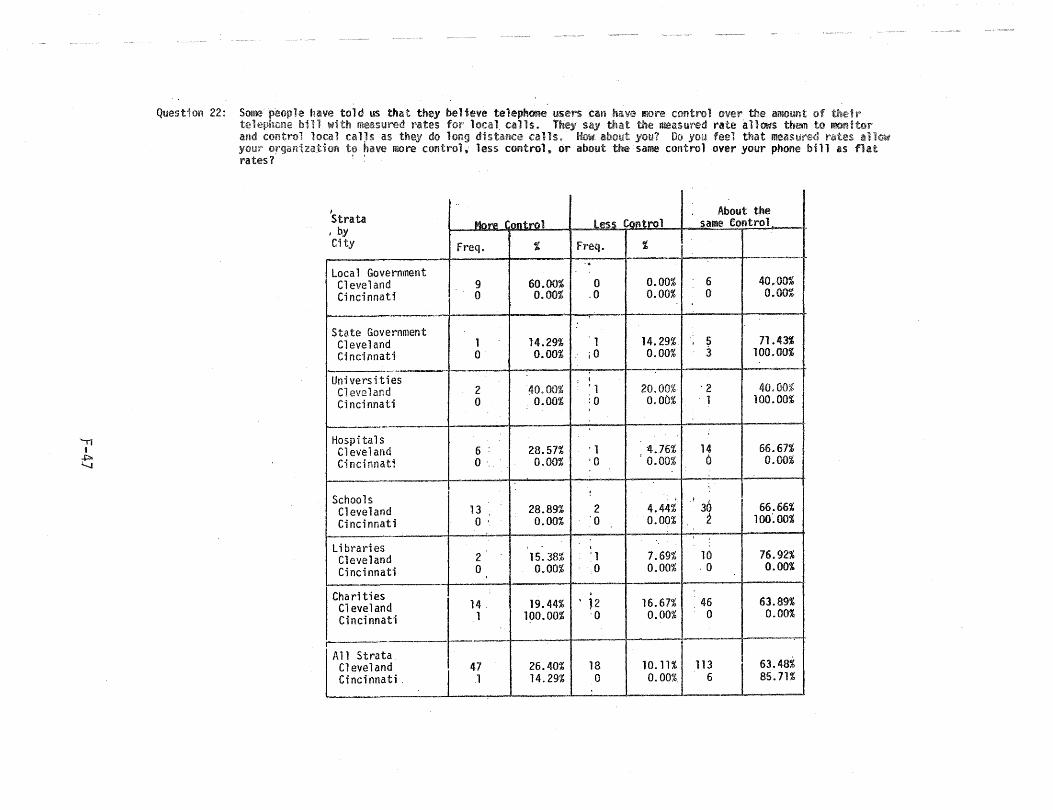
"TI I
~
Question 22: have told us that they believe telephooe user'S Cilli have more control over the amount of the·ir bHl with measured rates for local calls. They say that the measured f'ate allows them to monitor
and control local calJs as they do long clhtlUlce calls. How- about you? 00 you feel that measl&t-ed t~ates allow your orgardzation have more canh'ol,. less control .. or about the same control over your phone bin as fiat rates? .
.. I About the Strata.
I by More (:ontro 1 Less Control same control
-
City freq. <II Freq. % ,. -.
Local Government - I
Cleveland 9 60.00% 0 0.00% 6 40~OO% I
Cincinnati 0 0.00% .0 0.00% 0 .0.00% •
State Government Cleveland 1 14.29% 1 14.29% I 5 - 71.43% I
Cincinnati 0 0.00% iO 0.00% 3 100.00% I
Universities , I
Cleveland 2 AO.OO% . 1 20.00% '2 40.00% Cincinnati 0 0.00% :0 0.00% . 1 100.00%
Hospitals Cleveland 6 . 28.57% . 1 4.76% 14 66.67% Cincinnati o .. 0.00% '0 ' 0.00% 6 0.00%
Schools !
: I , . I
Cleveland 13 28.89% 2 4.44% 30 66.66% Cincinnati o : 0.00% ·0 0.00% 2- l00~Om'
' 0 o·
Li brari as I
Cleveland 2 15.38% : 1 7.69% 10 76.92% Cincinnati 0 0.00% .0 0.00% .0 0.00%
Chari ties
~i I
Cleveland 19.44% ' 12 16.67% 46 63.89%
Cincinnati 100.00% '0 0.00% 0 0.00% i
I ~
I All Strata I
Cleveland j
4
i . 26.40% 18 10. 11% 113
I 63.48% I
Cincinnati, 14.29% 0 0.00%. 6 85.71% I
! __ I
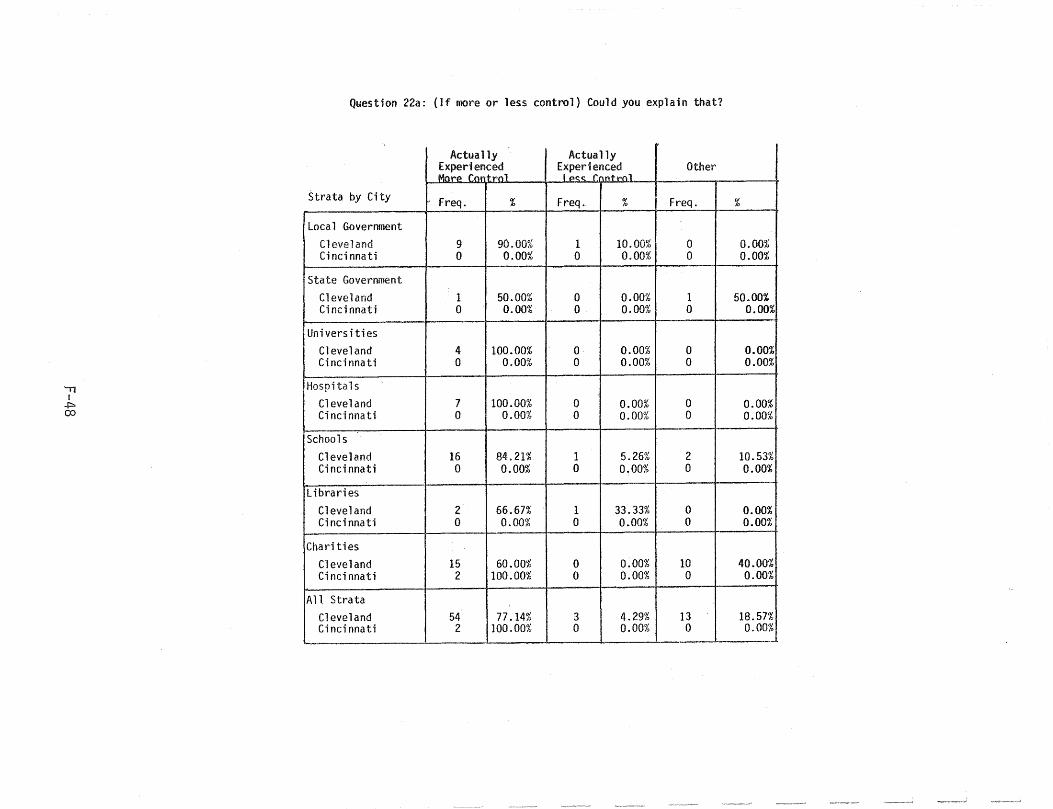
.." !
..(::>. 00
Question 22a: (If more or less control) Could you explain that?
Actually Actually Experienced Experienced Other Mn rp f.nf1 t rol I p~~ r,lntl"'(\ 1
Strata by City Freq. % Freq. % Freq.
Local Government Cleveland 9 90.00% 1 10.00% 0 Cincinnati 0 0.00% 0 0.00% 0
State Government Cleveland 1 50.00% 0 0.00% 1 Cincinnati 0 0.00% 0 0.00% 0
Universities Cleveland 4 100.00% 0 0.00% 0 Cincinnati 0 0.00% 0 0.00% 0
Hospita 1 s Cleveland 7 100.00% 0 0.00% 0 Cincinnati 0 0.00% 0 o.omi: 0
Schools Cleveland 16 84.21% 1 5.26% 2 Cincinnati 0 0.00% 0 0.00% 0
Libraries Cleveland 2 66.67% 1 33.33% 0 Cincinnati 0 0.00% 0 0.00% 0
Charities Cleveland 15 60.00% 0 0.00% 10 Cincinnati 2 100.00% 0 0.00% 0
All Strata Cleveland 54 77 .14% 3 4.29% 13 Cincinnati 2 100.00% 0 0.00% 0
--- --
%
0.00% 0.00%
50.00% 0.00%
0.00%1 0.00%
0.00% O.OO%i
I I
10.53%1 0.00%1
0.00% 0.00%
40.00% 0.00%
18.57% 0.00%
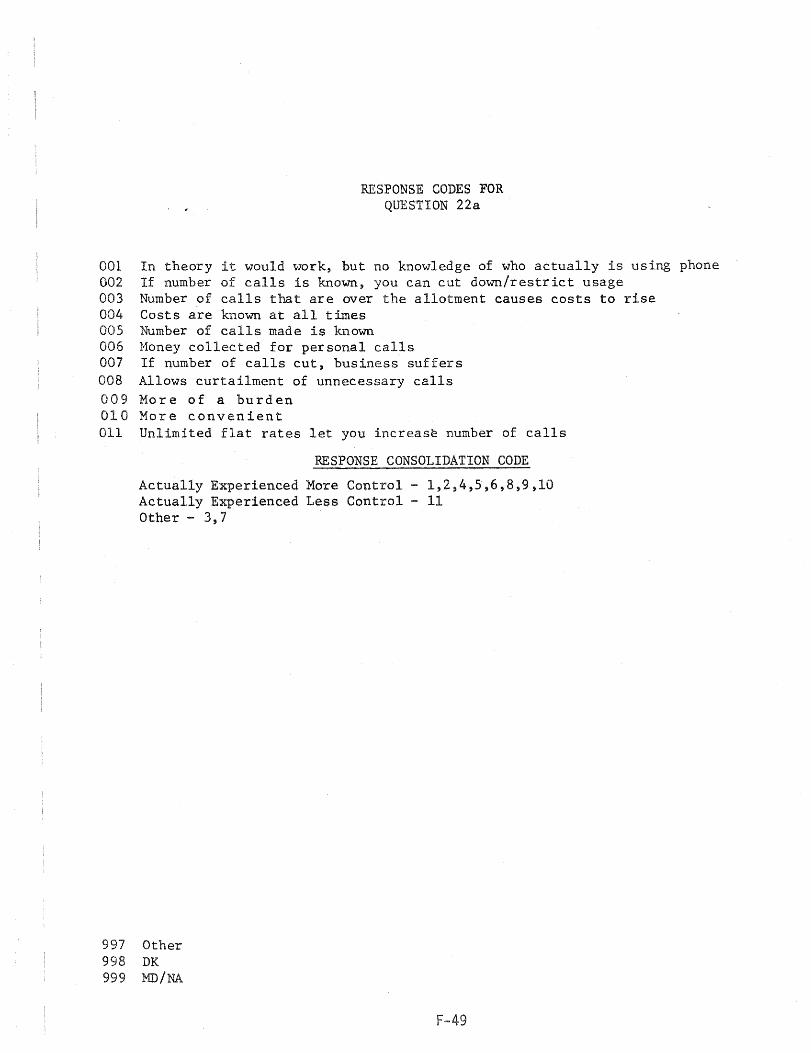
RESPONSE CODES FOR QUESTION 22a
001 In theory it would work, but no knowledge of who actually is using phone 002 If number of calls is known, you can cut down/restrict usage 003 Number of calls that are over the allotment causes costs to rise 004 Costs are known at all times 005 Number of calls made is known 006 Money collected for personal calls 007 If number of calls cut, business suffers 008 Allows curtailment of unnecessary calls 009 More of a burden 010 More convenient 011 Unlimited flat rates let you increase number of calls
RESPONSE CONSOLIDATION CODE
Actually Experienced More Control - 1,2,4,5,6,8,9,10 Actually Experienced Less Control - 11 Other - 3,7
997 Other 998 DK 999 MD/NA
F-49
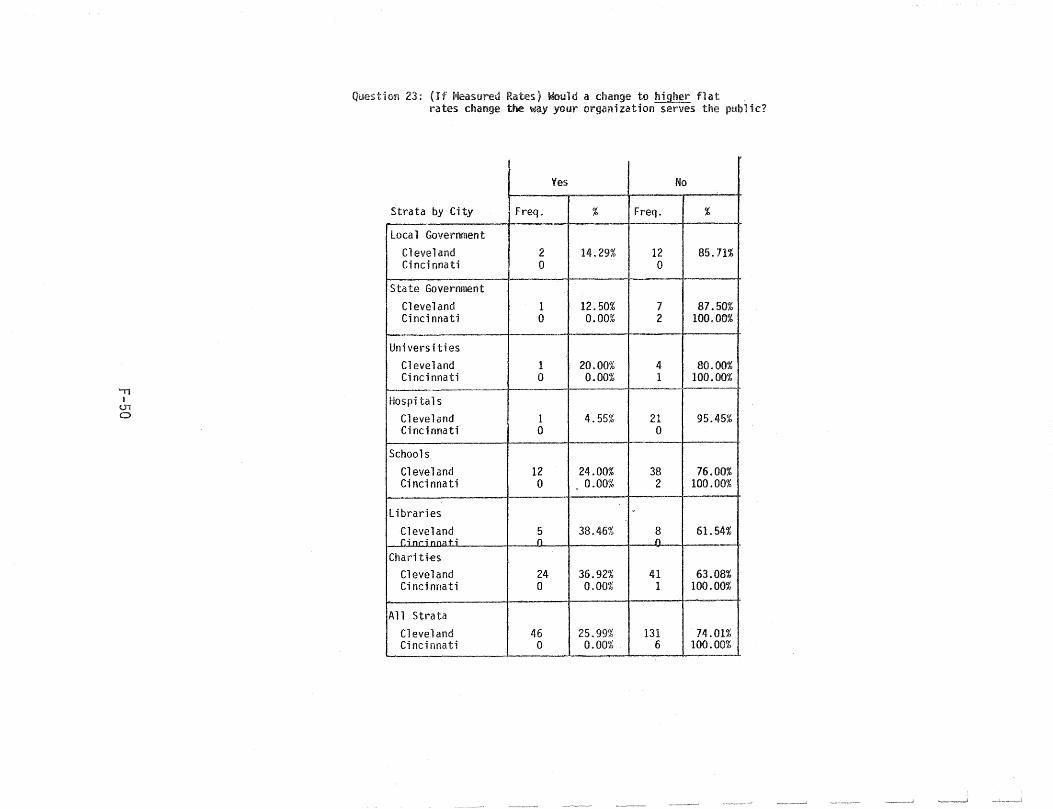
'II I
U1 a
Question 23:: (If Meastn~ed Would a change to higher flat ra tes change the way your organ i za t i on serves thE! public?
Yes No I
-~ I
Strata by City Freq. % Freq. % I
-l Local Government I
Cleveland 2 14.29% 12 85.;71% i
Ci nci nna ti 0 0 I
87.5:-State Government
Cleveland 1 12.50% 7 Ci nci nnati 0 0.00% 2 100.00%
Universities
Cleveland 1 20.00% 4 80.00% Cincinnati 0 0.00% 1 100.00%
------ ------- .. ....,......,-.",.-~ ... ,.,.
Hospitals
Cleveland 1 4.55% 21 9504.5% Cincinnati 0 0
Schools
Cleveland 12 24.00% 38 76.00% Cincinnati 0 0.00% 2 100.00%
Libraries .
Cleveland 5 38.46% 8 61. 54% Cinr:i nnFl ti n n
Chari ti-es
Cleveland 24 36.92% 41 63.08% Cincinnati 0 o.om~ 1 100.00%
All Strata
Cleveland 46 25.99% 131 74.01% Cincinnati 0 0.00% 6 100.00%
--
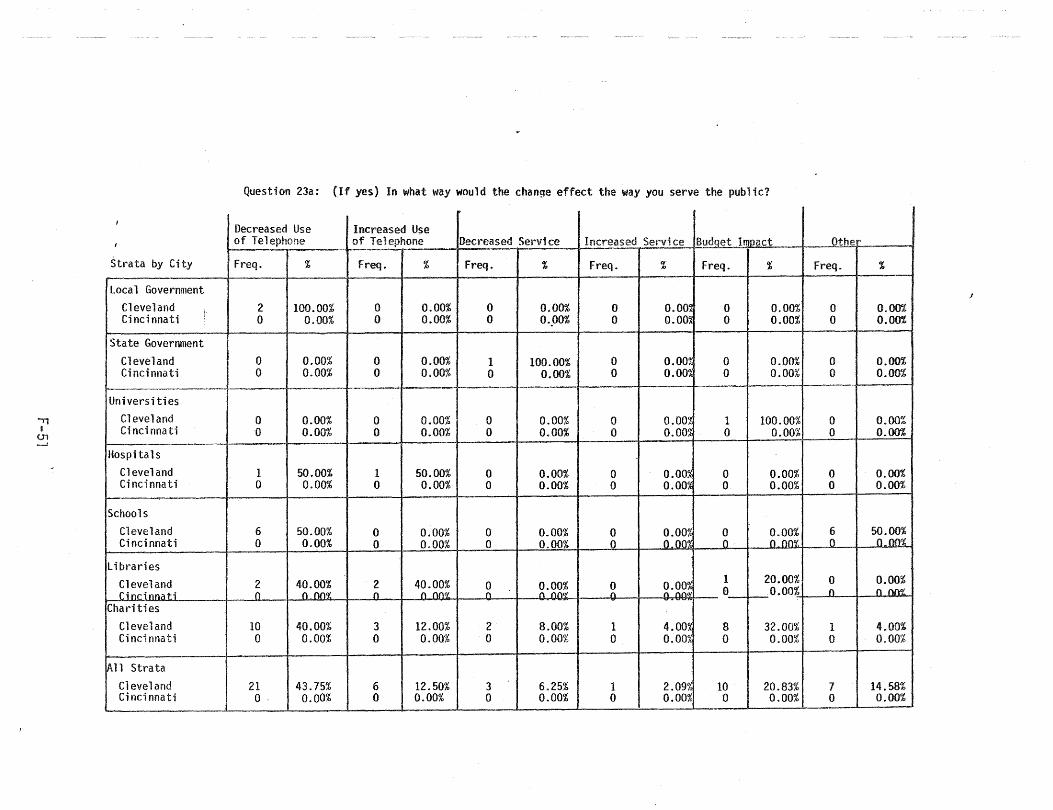
"i1 I
01
I
I
Strata by City
Local Government Cleveland Cincinnati
State Government Cleveland Cincinnati
I----~-.-------- . Universities
Cleveland Cincinnati
Hospitals Cleveland Cincinnati
Schools Cleveland Ci nci nnati
Libraries Cleveland Cincinnati
Charities Cleveland Cincinnati
~11 Strata Cleveland Cincinnati
Question 23a: (If yes) In what way would the change effect the way you serve the public?
Decreased Use Increased Use of Telephone of Telephone Decreased Service Increased Service Budqet Ir iDdct P~~.---Freq. % Freq. % Freq. % Freq. 0/ Freq. % Freq. % 10 - I
J
2 100.00% 0 0.00% 0 0.00% 0 O.OO~ 0 0.00% 0 o.om; 0 0.00% 0 0.00% 0 0'.00% 0 0.000 0 0.00% 0 o.om;
0 0.00% 0 0.00% 1 100.00% 0 O.OO~ 0 0.00% 0 0.00% 0 0.00% ° 0.00% 0 0.00% 0 o.om 0 0.00% 0 0.00%
..
I
0 0.00% 0 0.00% 0 0.00% 0 0.00% 1 100.00% 0 0.0<Y.l£ 0 0.00% 0 0.00% 0 0.00% 0 0.00% 0 0.00% 0 O.om
1 50.00% 1 50.00% 0 0.00% 0 0.00% 0 0.00% 0 0.00% 0 0.00% 0 0.00% 0 0.00% 0 0.00% 0 0.00% 0 O.QO'1,
6 50.00% 0 0.00% 0 0.00% 0 0.00% 0 0.00% 6 50.QO'1, 0 0.00% 0 0.00% 0 0.00% 0 0.00% 0 o om 0 000'%
2 40.00% 2 40.00% 0 0.00% 0 O.OO~ 1 20.00% 0 0.00%
0 o flfl~ fl n nn'l 0 n nn'l' n n nnOi a 0.00% n n om: -
10 40.00% 3 12.00% 2 8.00% 1 4.00~ 8 32.00% 1 4 .. 00% 0 0.00% 0 0.00% 0 0.00% 0 o.om 0 0.00% 0 0.00%
I
21 43.75% 6 12.50% 3 6.25% 1 2.09% 10 20.83% 7 14.58% J O· 0.00% 0 0.00% 0 0.00% 0 0.00% 0 0.00% 0 0.00%
.--- .. -~~
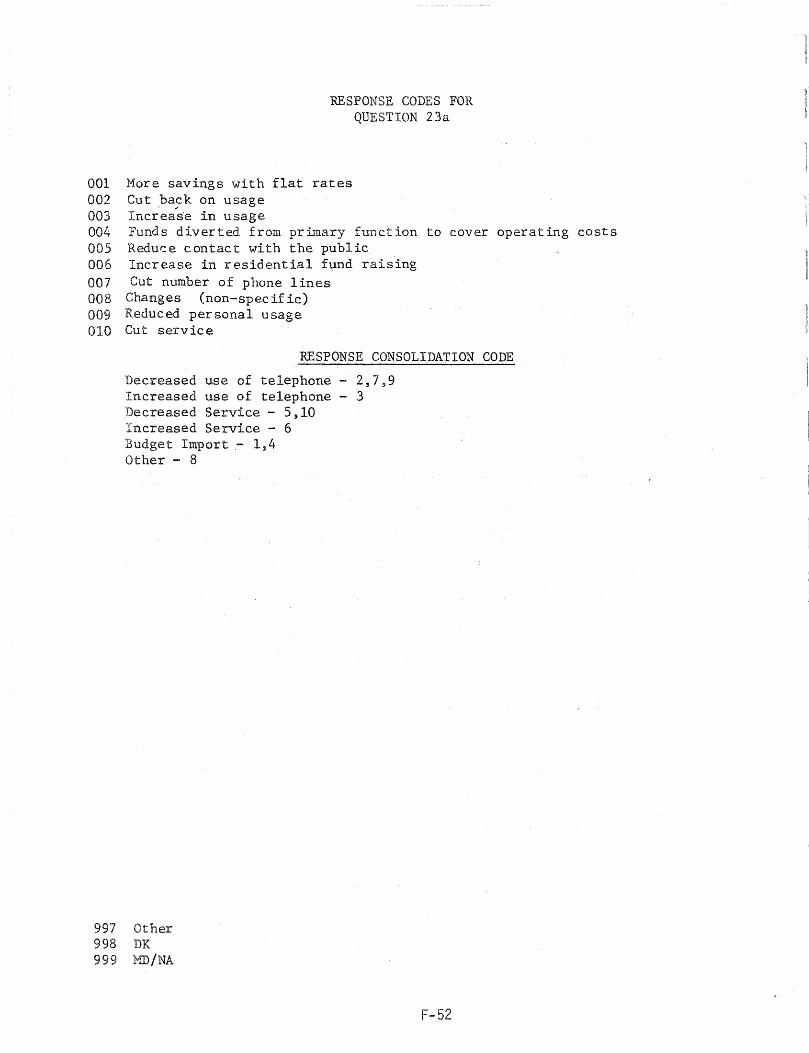
RESPONSE CODES FOR QUESTION 23a
001 More savings with flat rates 002 Cut back on usage 003 Incr"ea"se "in usage 004 Funds diverted from primary function to cover operating costs 005 Redu~e contact with the public 006 Increase in residential f~nd raising 007 Cut number of phone lines 008 Changes (non-,spec if ic) 009 Reduced per sonal usage 010 Cut service
RESPONSE CONSOLIDATION CODE
Decreased use of telephone - 2,7,9 Increased use of telephone - 3 Decreased Service - 5,10 Increased Service - 6 Budget Import - 1,4 Other - 8
997 Other 998 DK 999 !!ID/NA
F-52
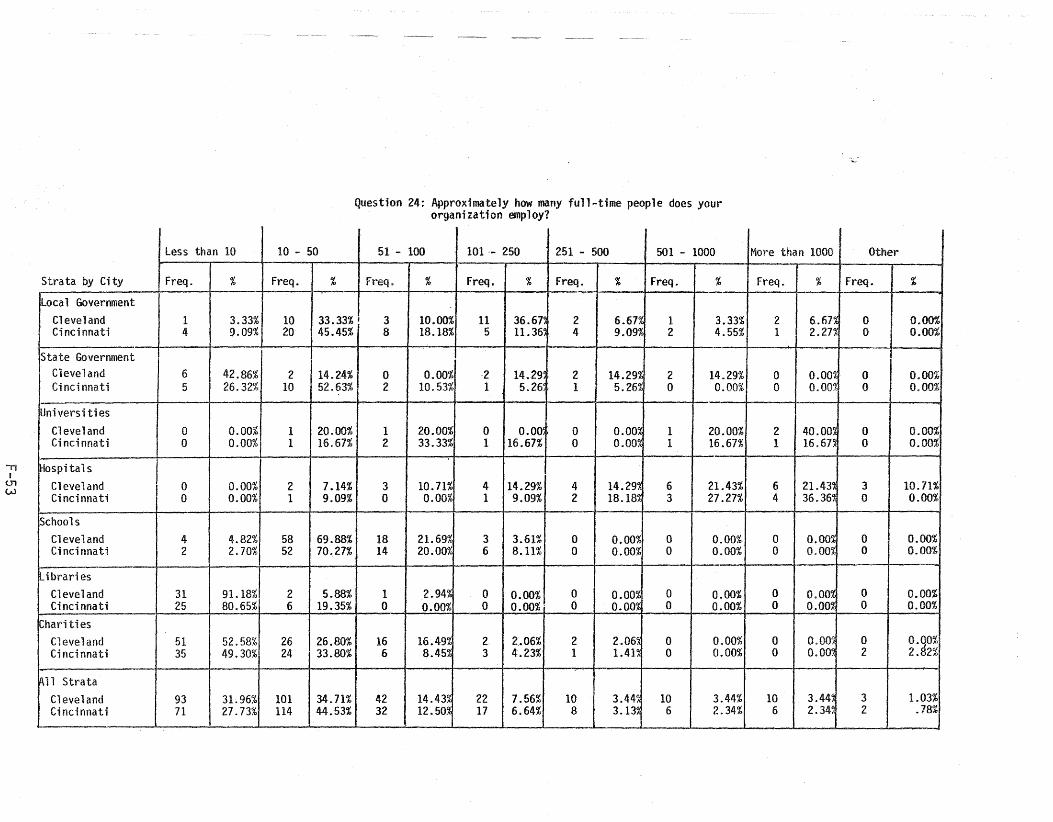
." u
U1 W
Stra ta by Ci ty
local Government Cleveland Cincinnati
State Government Cleveland Cincinnati
Uni vers Hi es Cleveland Cincinnati
Hospitals Cleveland Cincinnati
Schools Cleveland Cincinnati
... ibraries Cleveland Cincinnati
Charities Cleveland Cincinnati
All Strata Cleveland Cincinnati
--
less than 10
Freq. %
1 3.33% 4 9.09%
6 42.86% 5 26.32%
0 0.00% 0 0.00%
0 0.00% 0 0.00%
4 4.82% 2 2.70%
31 91.18% 25 80.65%
51 52.58% 35 49.30%
93 31. 96% 71 27.73%
--
10 - 50
Freq. %
Question 24: Approximately how many full-time people does your organization employ?
51 - 100 101·- 250 251 - 500 501 - 1000
freq. % Freq. % Freq. % freq. %
10 33.33% ! 3 10.00% 11 36.67"' 2 6.6n 1 3.33% 20 45.45% 8 18.18% 5 11.36~ 4 9.09% 2 4.55%
2 14.24% 0 0.00% -2 14.29 2 14.29% 2 14.29% 10 52.63% 2 10.53% 1 5.26' 1 5.26% 0 0.00%
1 20.00% 1 20.00% 0 o.oa 0 0.00'% 1 20.00% 1 16.67% 2 33.33% 1 16.67% 0 0.00% 1 16.67%
2 7.14% 3 10.71% 4 14.29% 4 14.29~ 6 21.43% 1 9.09% 0 0.00% 1 9.09% 2 18.18~ 3 27.27%
58 69.88% 18 21. 69% 3 3.61% 0 0.00% 0 0.00% 52 70.21% 14 20.00% 6 8.11% 0 0.00% 0 0.00%
0.00%1 2 5.88% 1 2.94~ 0 0 0.00% 0 0.00% 6 19.35% 0 0.00% 0 o.om;· 0 0.00% 0 0.00%
26 26.80% 16 16.49~ 2 2.06% 2 2.06~ 0 0.00% 24 33.80% 6 8.45~ 3 4.23% 1 1.41~ 0 0.00%
101 34.71% 42 14.43% 22 7.56% 10 3.44~ 10 3.44% 114 44.53% 32 12.50% 11 6.64% 8 3.13~ 6 t~. 34%
---- --_.- ---
-~
More than 1000 Other
Freq. % Freq. %
2 6.67% 0 0.00% 1 2.2n 0 0.00%
0 o.om 0 0.00% 0 D.Om 0 0.00%
2 40.0m 0 0.00%, 1 16.6n 0 0.00%:
j
I 6 21.43'l 3 10.71% 4 36.36:t 0 O.oot
0 O.oO~ 0 0.00% 0 O.OO~ 0 0.00%
0 O.OO~ 0 0.00% 0 O.OO~ 0 0.00%
0 O.OO~ 0 0.00%, 0 O.OO~ 2 2.82%
10 3.44~ 3 1.03% 6 2.34~ 2 .78%
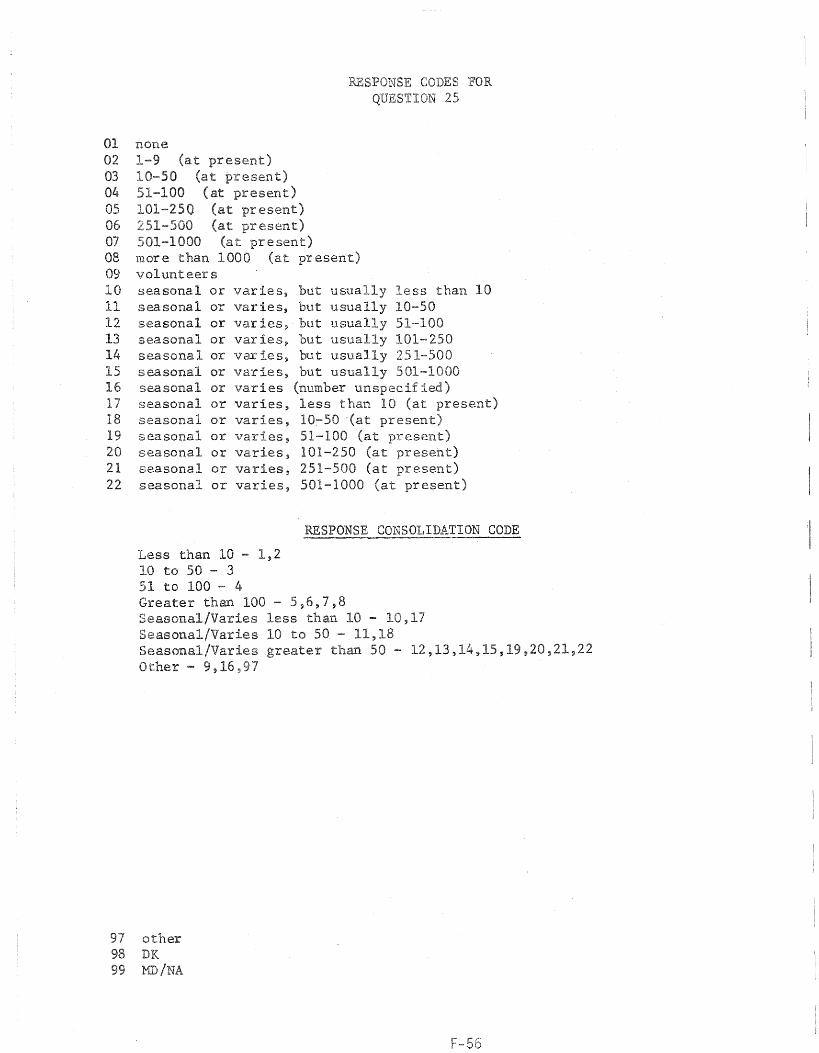
RESPONSE CODES FOR
01 norle 02 03 04 ) 05 present) 06 present) 07 pre 08 more than 1000 (at present) 09 volunteers
25
10 seasonal or varies, but u less than 10 11 seasonal or varies, but usually 10-50 12 seasonal or varies~ but usually 51-100 13 seasonal or varies, but 101-250 14 seasonal or varies, but usually 251-500 15 seasonal or varies, but usually 501-1000 16 seasonal or varies (number unspecified) 17 seasonal or varies, less than 10 (at present) 18 seasonal or varies, 10-50 (at present) 19 seasonal or varies, 51-100 (at 20 seasonal or varies~ 101-250 (at present) 21 seasonal or varies, 251-500 (at present) 22 seasonal or varies, 501-1000 present)
RESPONSE CONSOLIDATION CODE
Less than 10 - 1,2 10 to 50 - 3 51 to 100 - 4 Greater than 100 - 5,6,7,8
97 other DK
99 }4.D
less than 10 - 10,17 10 to 50 - 11,18
than 50 - 12,13, ,15,19,20,21,22
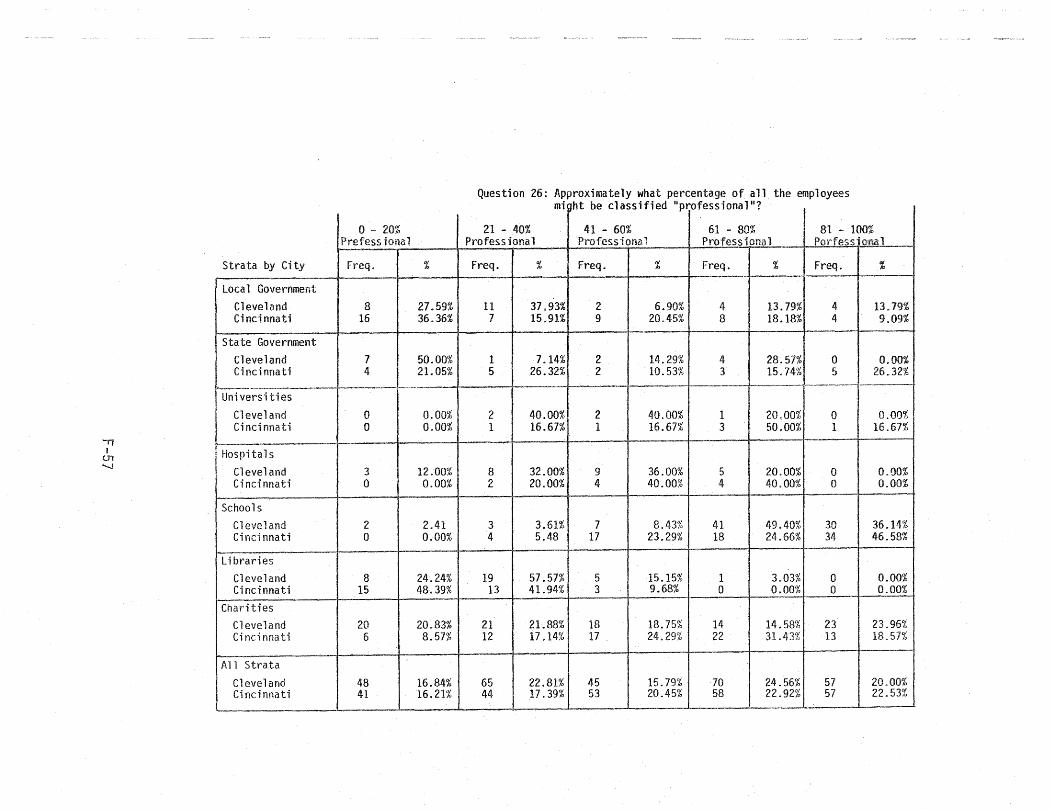
." I
en -.....J
Strata by City
Local Government Cleveland Cincinnati
State Government Cleveland Cincinnati
-. -"' .... ""'......".,...,,...,,,.-.---.......---~", Universities
Cleveland Cincinnati
_. Hospitals
Cleveland Cincinnati
Schools Cleveland Cincinnati
Libraries Cleveland Ci nci nnati
Charities Cleveland Cincinnati
All Strata
Cleveland Cincinnati
-
o - 20% Prefess 10na 1
Freq. %
8 27.59% 16 36.36%
7 50.00% 4 21.05%
f------.- ~--
0 0.00% 0 0.00%
3 12.00% 0 0.00%
2 2.41 0 0.00%
8 24.24% 15 48.39%
20 20.83% 6 8.57%
48 16.84% 41 16.21%
Question 26: Approximately what percentagl~ of all the employees mql - - ~ - . -- - -. ht be classified II profess'ional"?
21 - 40% 41 - 60% 61 - 80% 81 - 100% Professional Profess 10na 1 Profe~~~_~~ PClY'fess' OM 1
Freq. % Freq. % Freq. % Freq. %
11 37.93% 2 6.90% 4 13.79% 4 13.19% 7 15.91% 9 20.45% 8 18.18% 4 9.09%
1 7.14% 2 14.29% .!j. 28.57% 0 0.00% 5 26.32% 2 10.53% :3 15.74% 5 26.32%
-~ -------'._-- ----~- _ •. _--- '-.--~---------
2 40.00% 2 40.00% 1 20.00% 0 0.00% 1 16.67% 1 16.67% 3 50.00% 1 16.67%
-
8 32.00% 9 36.00% 5 20.00% 0 0.00% 2 20.00% 4 40.00% ,q. 40.00% 0 0.00%
3 3.61% 7 8.43% 41 49.40% 30 36.14% 4 5.48 17 23.29% 18 24.66% 34 46.58%
19 57.57% 5 15.15% 1 3.03% 0 0.00% 13 41. 94% 3 9.68% 0 0.00% 0 0.00%
21 21.88% 18 18.75% 14 14.58% 23 23.96% 12 17.14% 17 24.29% 22 31.43% 13 18.57%
65 22.81% 45 15.79% 70 24.56% 57
I 20.00%
44 17.39% 53 20.45% 58 22.92% 57 22.53% _. __ . -~ ,
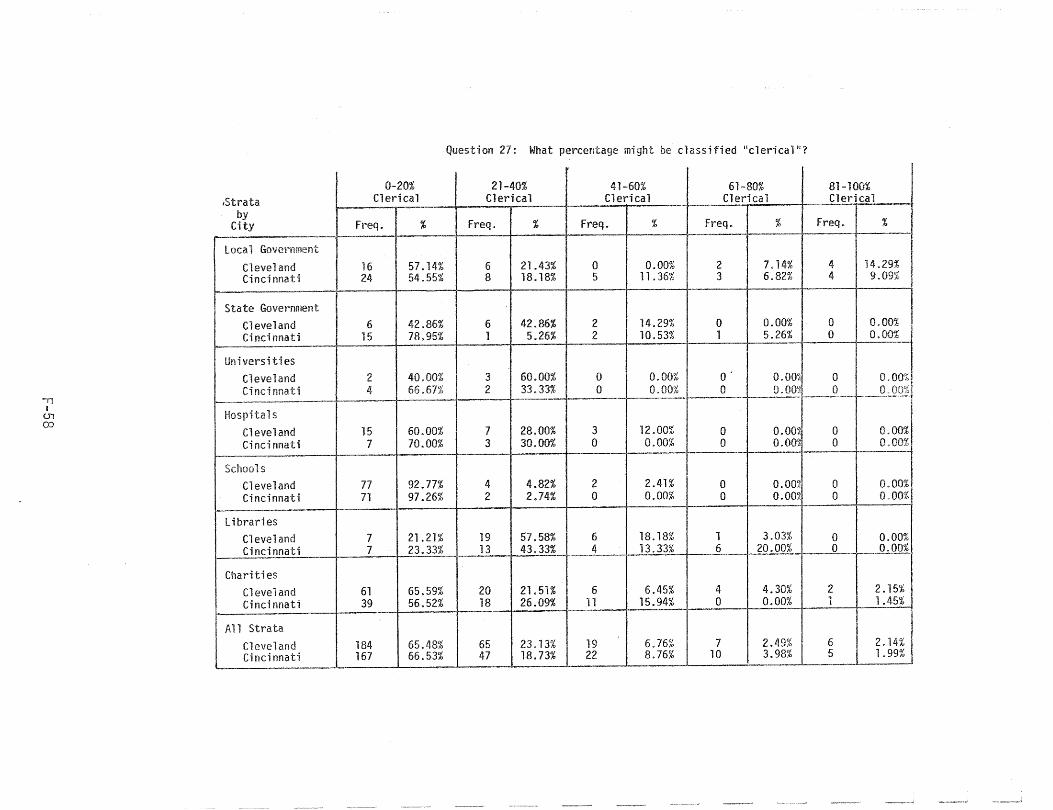
-n i
U1 00
8trata by
City
local Government
Clevel and Cincinnati
State Government Cleveland Cincinnati --
Universities Cleveland Cinci nnati
I-----.. ---.. ~----------
Hospitals Cleveland Cincinnati
--Schools
Cleveland Cincinnati
-Libraries
Cleveland Cinci nnati
Chariti es
Cleveland Cincinnati
All Strata Cleveland Cincinnati
0-20% C1 eri ca 1
Fl~eq. %
16 57.14% 24 54.55%
6 42.86% 15 78.95%
2 40.00% 4 66.67%
-~-...
15 60.00% 7 70.00%
77 92.77% 71 97.26%
7 21.21% 7 23.33%
61 65.59% 39 56.52%
184 65.48% 167 66.53% ----~-
Question 27: What percentage might be classified uc1erical"?
21-40% 41-60% 61-80% 81-100% Clerical Clerical Clerical Clerical '-
Freq. % Freq. % Fn~q. % Freq. % ~- \--._._----1------~-"--.. -
6 21.43% 0 0.00% ') 7.14% 4 14.29%
I t.
8 18.18% 5 11.36% 3 6.82% 4 9.09'% - --,.....-
0.00% 0 0.001: I 6 42.86% 2 14.29% ()
1 5.26% 2 10.53% 11 5.26% 0 O'~~ -
o . 001 0 I 0 . 00% 3 60.00% 0 0,00% 0' 2 33.33% 0 0.00% 0 o.oo~ 0 O.OO%!
<~~ . --
~or~--~: 7 28.00% 3 12.00% 0 o.o~ 0 o.J 3 30.00% 0 0.00% 0
4 4.82% 2 2.41% 0 0.00 0 0.00% 2 2.74% 0 0.00% 0 O.OO~ 0 0.00%
19 57.58% 6 18.18% 1; 3.03% I 0 D.OOl: 13 43.33% 4 13.33% 6 20.00% 0 ,_+ __ <hQQ!
20 21. 51% 6 6.45% L~ 4.30% 2 2.15% 18 26.09% 11 15.94% () 0.00% 1 1.45%
65 23.13% 19 6.76% jf 2.49% 6 2,14% 47 18.73% 22 8.76% 10 3.98% 5 1.99%

" I <..n 1.0
Strata by
City
Local Government Cleveland Cincinnati
State Government Cleveland Cincinnati
Universities Cleveland Cincinnati
Hospitals
Cleveland Cincinnati
Schools Cleveland Cincinnati
Libraries Cleveland Cincinnati
Charities Cleveland Cincinnati
1-0--
All Strata Cleveland Cincinnati
Question 28: What percentage would you classify as neither "professional ll nor "clerical"?
0-20% 21-40% 41-60% 61-80% 81-100% 1------
Freq. % Freq. % Freq. % Freq. % Freq. %
:
15 55.56% 5 18.52% 4 14.81% 1 3.10% 2 7.41% 24 55.81% 3 6.98% 5 11.63% 6 13.95% 5 11.63%
8 57.14% 1 7.14% 1 7.14% 1 7.14% 3 21.43% 11 57.89% 0 0.00% 3 15.79% 1 5.26% 4 21.05%
-
2 40.00% 1 20.00% 2 40.00% 0 0.00% 0 0.00% 6 100.00% 0 0.00% 0 0.00% 0 0.00% 0 0.00%
-
12 48.00% 6 24.00% 6 24.00% 0 0.00% 1 4.00% 9 90.00% 1 10.00% 0 0.00% 0 0.00% 0 0.00%
66 80.49% 12 14.63% 4 4.88% 0 0.00% 0 0.00% 47 64.38% 19 26.03% 5 6.85% 2 2.74% 0 0.00%
11 35.48% 6 19.35% 12 38.71% 2 6.45% 0 0.00% 11 40.74% 4 14.81% 10 37.04% 1 3.70% 1 3.70%
54 60.00% 13 14.44% 10 11.11% 6 6.67% 7 7.77% 50 73.53% 8 11. 76% 7 10.295£ 2 2.94% 1 1.47%
---'-~~-f.--. r---"----
168 61. 31 % 44 16.06% 39 14 .23% 10 3.65% 13 4.74% 158 64.23% 35 14.23% 30 12.20% 12 4.88% 11 4.47%
--
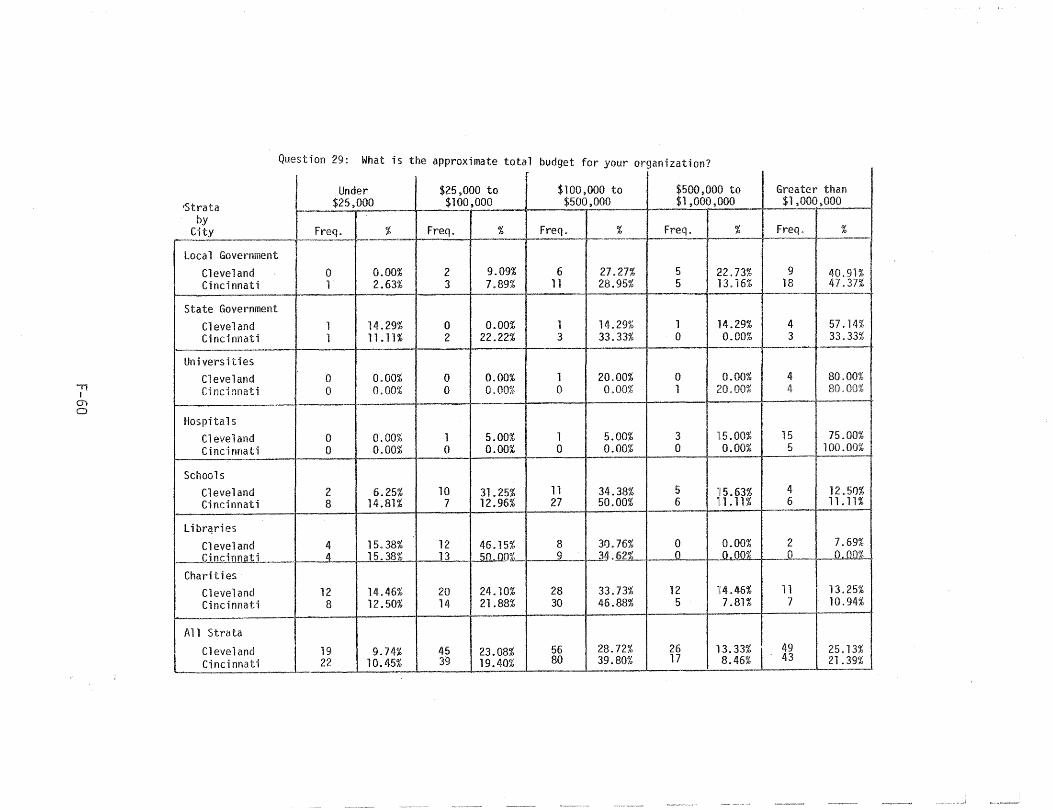
." I
01 a
'Strata by
City ,........-.
Local Government Cleveland Cincinnati
State Government Cleveland Cincinnati
1----
Un; vers Hies Cleveland Cincinnati
Hospitals Cleveland Cincinnati
Schools Cleveland Cincinnati
Ubrqries
Cleveland _.£incionati
Charities Cleveland Cincinnati
All Strata
Cleveland Cincinnati
Question 29: What is the approximate total budget for your organization?
Under $25,000 to $100,000 to $500,000 to $25.000 $100,000 $500,000 $1,000.000
1--
~req % Freq. % Freq. % Freq. % - -< --
0 0.00% 2 9.09% 6 27.27% 5 ~!2. 73% 1 2.63% 3 7.89% 11 28.95% 5 113.16%
1 14.29% 0 0.00% 1 14.29% 1 114.29% 1 11.11% 2 22.22% 3 33.33% 0 0.00%
0 0.00% 0 0.00% 1 20.00% 0 0.00% 0 0.00% 0 0.00% 0 0.00% 1 ;W.OO%
0 0.00% 1 5.00% 1 5.00% 3 1:5.00% 0 0.00% 0 0.00% 0 0.00% 0 0.00%
2 6.25% 10 31.25% 11 34.38% 5 :15.63% 8 14.81% 7 12.96% 27 50.00% 6 n.11%
4 15.38% 12 46.15% 8 30.76% 0 0.00% 4 15.38% 13 50.00%_ __ 9_ .. _ ~.Q2L 0 JWlQ1
12 14.46% 20 24.10% 28 33.73% 12 114.46% 8 12.50% 14 21.88% 30 46.88% 5 7.81%
19 9.74% 45 23.08% 56 28.72% 26 B.33% I 22 10.45% 39 19.40% 80 39.80% 17 8.46%
---'----
!
Greater than
I $l_~OOO ,DOD
Freq. % I _______ ._J
9 40.91% 18 47.37%
4 57.14% 3 33.33%
4 80.00% 4 80.00%
15 75.00% 5 100.00%
4 12.51)% 6 11.11%
2 7.69% 0 JlJlQ1.
11 13.25% 7 10.94%
49 25.13% 43 21.39%
.. --
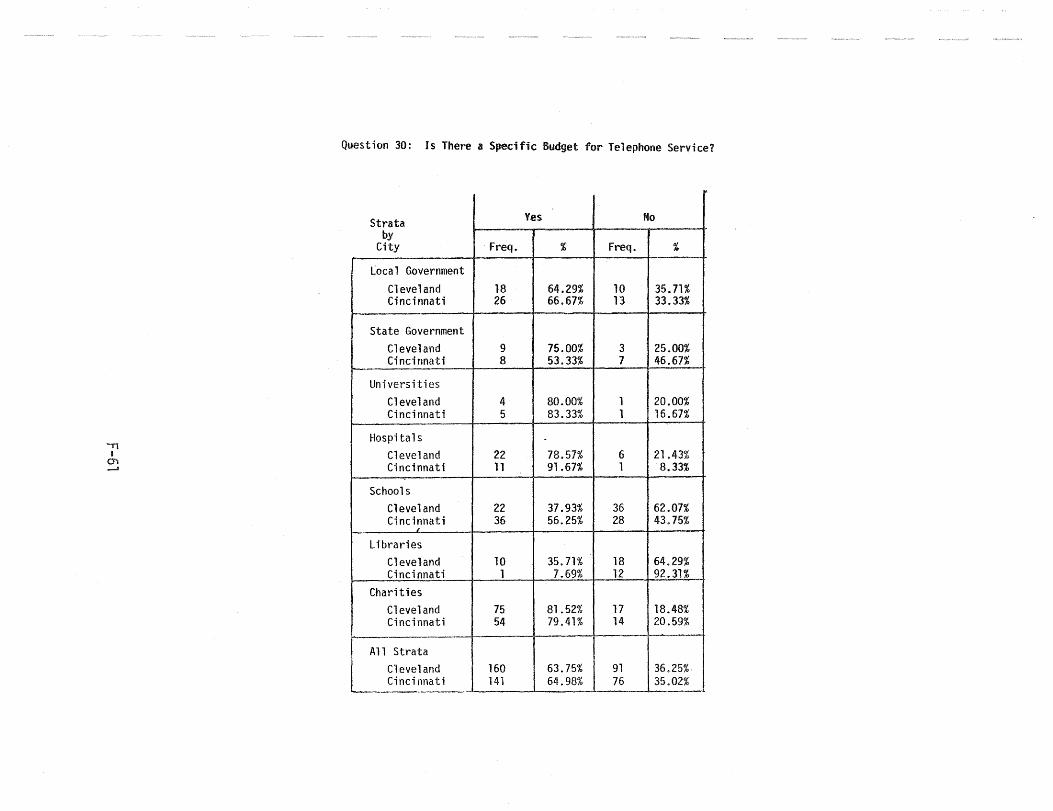
.." I
01 --'
Question 30: Is There a Specific Budget for Telephone Service?
Strata Yes No by
City Freq. % Freq. %
Local Government
Cleveland 18 64.29% 10 35.71% Cincinnati 26 66.67% 13 33.33%
State Government Cleveland 9 75.00% 3 25.00% Cincinnati 8 53.33% 7 46.67%
Universities Cleveland 4 80.00% 1 20.00% Cincinnati 5 83.33% 1 16.67%
Hospitals Cleveland 22 78.57% 6 21.43% Cincinnati 11 91.67% 1 8.33%
Schools Cleveland 22 37.93% 36 62.07% Cincinnati 36 56.25% 28 43.75% ,
Libraries Cleveland 10 35.71% 18 64.29% Cincinnati 1 7.69% 12 92.31%
Charities Cleveland 75 81.52% 17 18.48% Cincinnati 54 79.41% 14 20.59%
1---.
All Strata Cleveland 160 63.75% 91 36.25% Cincinnati 141 64.98% 76 35.02%
_.L_. ~~~-- .-----.~---- ----_.
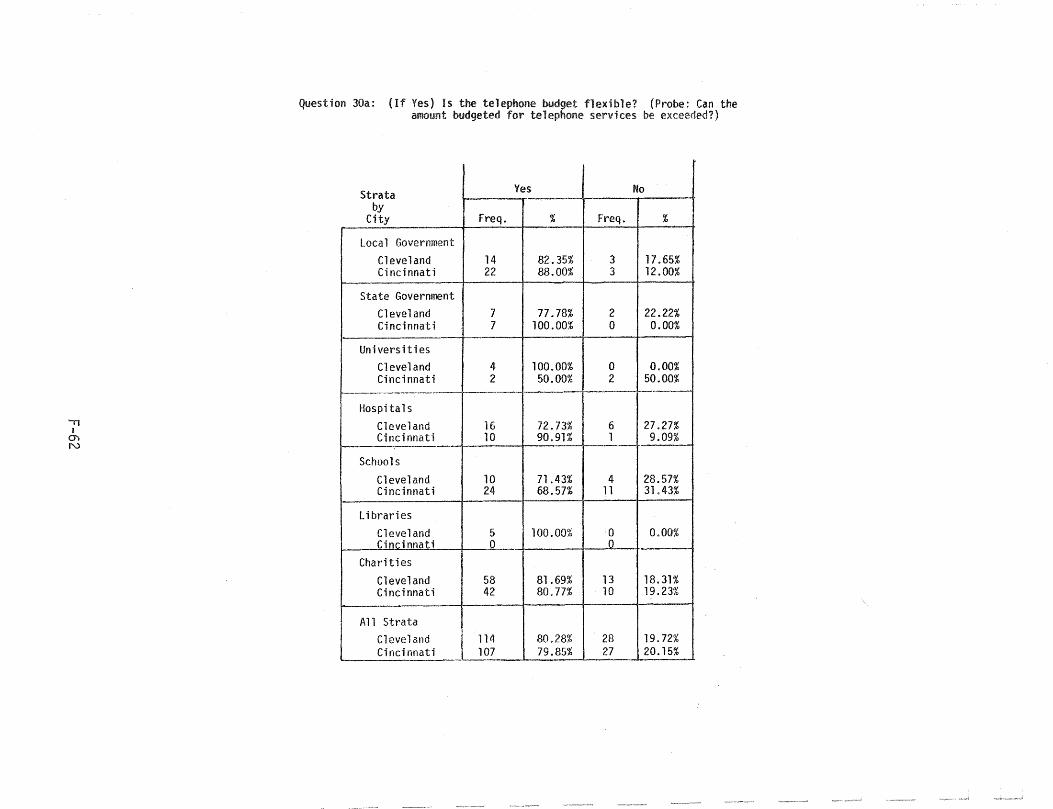
.., I
Q')
N
Question 30a: (If Yes) Is the telephone budget flexible? (Probe: Can the amount budgeted for telephone services be exceeded?)
Strata Yes No
by City Freq. % Freq. %
local Government Cleveland 14 82.35% 3 17.65% Cincinnati 22 88.00% 3 12.00%
State Government Cleveland 7 77.78% 2 22.22% Cincinnati 7 100.00% 0 0.00%
Uni vers iti es Cleveland 4 100.00% 0 0.00% Cincinnati 2 50.00% 2 50.00%
I------,--~. -_ .. _-> :--. - .... -~- --.--Hospita 1 s
Cleveland 16 72.73% 6 27.27% Cincinnati 10 90.91% 1 9.09%
Schools Cleveland 10 71.43% 4 28.57% Cincinnati 24 68.57% 11 31.43%
Libraries Cleveland 5 100.00% ;0 0.00% Cincinnati 0 0
Charities Cleveland 58 81.69% 13 18.31% Cincinnati 42 80.77% 10 19.23%
All Strata Cleveland I 114 80.28% 28 19.72% Cincinnati 107 79.85% . __ ?~ ____ 2_~~_?~ __ ._
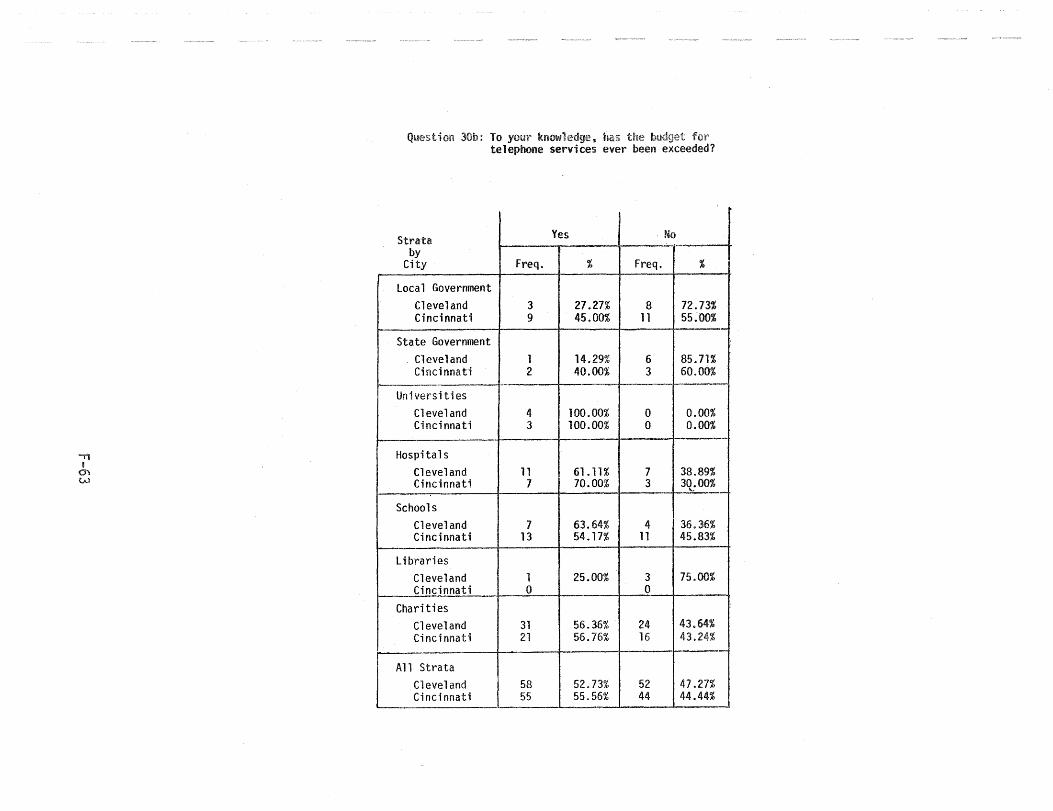
." I
()')
W
Question JOb: To your Imowledge, has the budget for telephone services ever been exceeded?
Strata Yes No by
City Freq. % Freq. %
local Government Cleveland 3 27.27% 8 72.73% Cincinnati 9 45.00% 11 55.00%
State Government Cleveland 1 14.29% 6 85.71% Cincinnati 2 40.00% 3 60.00%
Universities Cleveland 4 100.00% 0 0.00% Cincinnati 3 100.00% 0 0.00%
Hospitals Cleveland 11 61.11% 7 38.89% Cincinnati 7 70.00% 3 30.00% ... ,
Schools Cleveland 7 63.64% 4 36.36% Cincinnati 13 54.17% 11 45.83%
Libraries Cleveland 1 25.00% 3 75.00% Cincinnati 0 0
Charities Cleveland 31 56.36% 24 43.64% Cincinnati 21 56.76% 16 43.24%
All Strata Cleveland 58 52.73% 52 47.27% Cincinnati 55 55.56% 44 44.44%
~
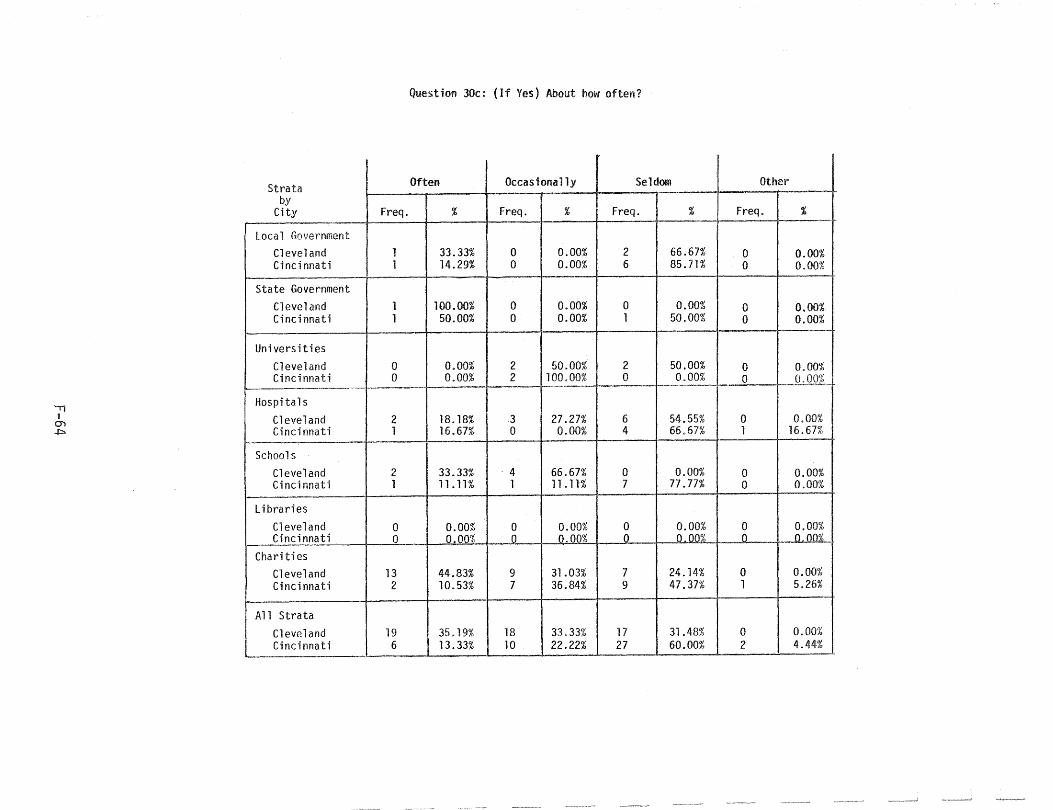
'11 I
C))
+::a
Strata by
City
Local Government Cleveland Cincinnati
State Government Cleveland Cincinnati
Un i ve rs it i es Cleveland Cincinnati
-.--------------Hospitals
Cleveland Cincinnati
1-.
Schools Cleveland Cincinnati
Libraries Cleveland Cincinnati
Chariti es Cleveland Cincinnati
All Strata Cleve1and Cincinnati
Question 30c: (If Yes) About how often?
Often Occasionally Seldom
Freq. % Freq. % Freq. %
1 33.33% 0 0.00% 2 66.67% 1 14.29% 0 0.00% 6 85.71%
1 100.00% 0 0.00% 0 0.00% 1 50.00% 0 0.00% 1 50.00%
0 0.00% 2 50.00% 2 50.00% a 0.00% 2 100.00% 0 0.00%
-,--~-1-----"--1------- -.--- '--------f---"-'-"-~~- ,
2 18.18% 3 27.27% 6 54.55% 1 16.67% 0 0.00% 4 66.67%
2 33.33% . 4 66.67% 0 0.00% 1 11.11% 1 11 .11% 7 77.77%
0 0.00% 0 0.00% 0 0.00% 0 0.00% 0 0.00% 0 0,00%
13 44.83% 9 31.03% 7 24.14% 2 10.53% 7 36.84% 9 47.37%
-
19 35.19% 18 33.33% 17 31.48% 6 13.33% 10 22.22% 27 60.00%
- -L--------.~-____ \-.
Other I
Freq. %
0 0.00% 0
0 0.00% 0 0.00%
0 0.00% 0 0.00%
0 0.00% 1 16.67%
0 0.00% 0 0.00%
0 0.00% 0 .....,..!LJlQ.1..._
0 0.00% 1 5.26%
0 0.00% 2 4.44% I
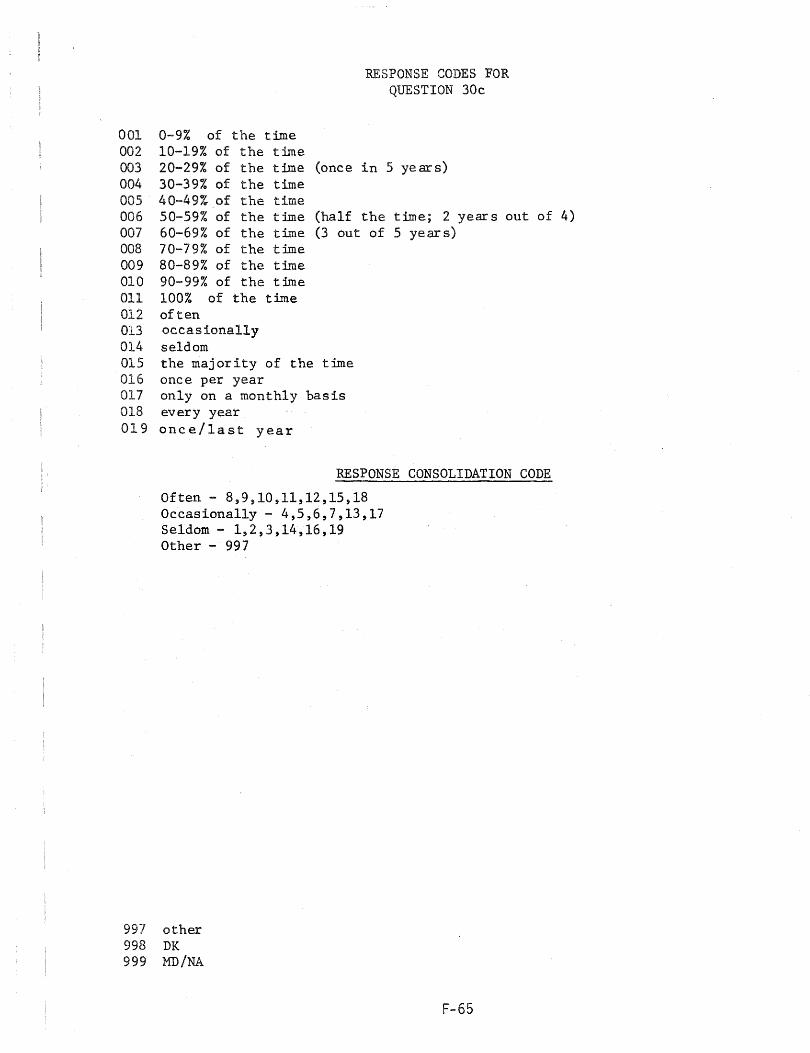
RESPONSE CODES FOR QUESTION 30c
0-9% of the time 10-19% of the time
001 002 003 004 005 006 007 008 009 010 011
20-29% of the time (once in 5 years) 30-39% of the time 40-49% of the time 50-59% of the time 60-69% of the time 70-79% of the time 80-89% of the time 90-99% of the t:!me 100% of the time
012 often 013 occasionally 014 seldom
(half the (3 out of
015 the majority of the time 016 once per year 017 only on a monthly basis 018 every year 019 once/last year
time; 2 year s 5 years)
out of 4)
RESPONSE CONSOLIDATION CODE
Often - 8,9,10,11,12,15,18 Occasionally - 4,5,6,7,13,17 Seldom - 1,2,3,14,16,19 Other - 997
997 other 998 DK 999 MD/NA
F-65
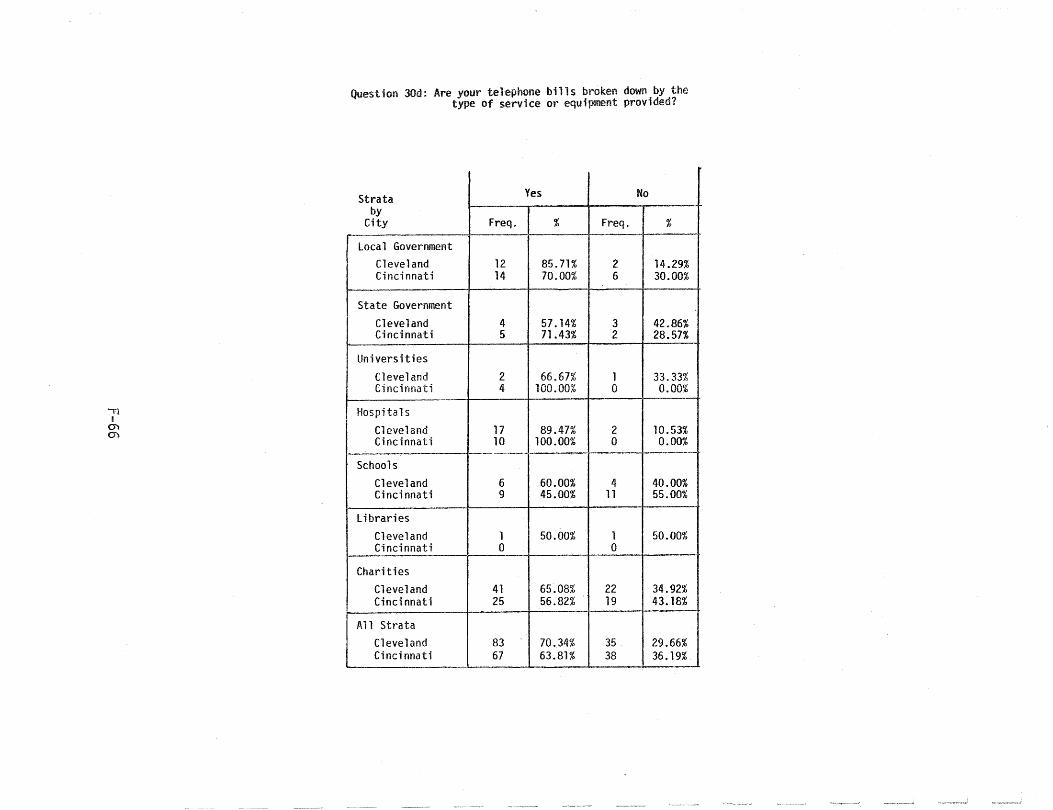
." I
m OJ.
Question 3Od: Are your telephone bills broken down by the type of service or equipment provided?
Strata Yes No by
City Freq. % Freq. % -
Local Government Cleveland 12 85.71% 2 14.29% Cincinnati 14 70.00% 6 30.00%
State Government Cleveland 4 57.14% 3 42.86% Cincinnati 5 71.43% 2 28.57%
Universities Cleveland 2 66.67% 1 33.33% Cincinnati 4 100.00% 0 0.00%
Hospitals
Cleveland 17 89.47% 2 10.53% Cincinnati 10 100.00% 0 0.00%
-----.------~~.- ---Schools
Cleveland 6 60.00% 4 40.00% Cincinnati 9 45.00% 11 55.00%
Libraries Cleveland 1 50.00% 1 50.00% Cincinnati 0 0
Charities Cleveland 41 65.08% 22 34.92% Cincinnati 25 56.82% 19 43.18%
All Strata Cleveland 83 70.34% 35 29.66% Cincinnati 67 63.81% 38 36.19%
~---~ - ----~---
i
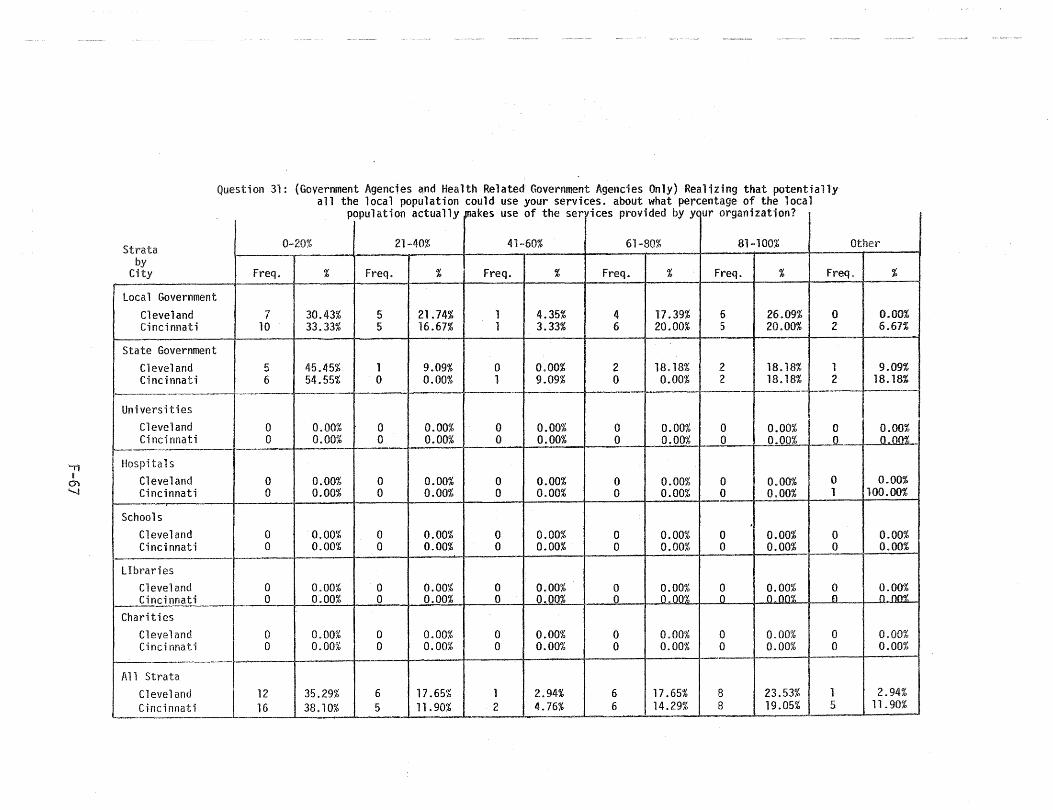
'Tl I
O"i ""-..I
Question 31: (Government Agencies and Health Related Government Agencies Only) Realizing that potentially all the local population could use your services. about what percentage of the local
populatlon actuallY ~aKes use or toe ser .. d b\l \/nllV' 1"Ilr'O;;Vd7:l1't;nn? l1ces proVlae~ ~., J ~. v. ;, ...... __ v, .......
Strata 0-20% 21-40% 41-60% 61-80% 81-100% Other
by City Freq. % Freq. % Freq. % Freq. % Freq. % Freq. %
Local Government C1eveland 7 30.43% 5 21. 74% 1 4.35% 4 17 .39% 6 26.09% 0 O.M Cincinnati 10 33.33% 5 16.67% 1 3.33% 6 20.00% 6 20.00% 2 6.67%
State Government Cleveland 5 45.45% 1 9.09% 0 0.00% 2 18.18% ,2 18.18% 1 9.09% Cincinnati 6 54.55% 0 0.00% 1 9.09% 0 0.00% 2 18.18% 2 18.18%
;"--'_ .. ,--"_._--- 1---'--- , .. - f---- --Universities
Cleveland 0 0.00% 0 0.00% 0 0.00% 0 0.00% 0 0.00% 0 0.00% I
Cincinnati 0 0.00% 0 0.00% 0 0.00% 0 0.00% 0 0.00% 0 0,00% -, -Hospita 1 s
Cleveland 0 0.00% 0 0.00% 0 0.00% 0 0.00% 0 0.00% 0 0.00% Cincinnati 0 0.00% 0 0.00% 0 0.00% 0 0.00% 0 0.00% 1 100.00%
Schools Cleveland 0 0.00% 0 0.00% 0 0.00% 0 0.00% 0 0.00% 0 0.00% Cinci nnati 0 0.00% 0 0.00% 0 0.00% 0 0.00% 0 0.00% 0 0.00%
LIbraries Cleveland 0 0.00% 0 0.00% 0 0.00% 0 0.00% 0 0.00% 0 0.00% Cincinnati 0 0',00% 0 0.00% 0 0.00% 0 o (lOX 0 0,00% 0 n no~
Charities Cleveland 0 0.00% 0 0.00% 0 0.00% 0 0.00% 0 0.00% 0 0.00% Cine; rmati 0 0.00% 0 0.00% 0 0.00% 0 0.00% 0 0.00% 0 0.00%
All Strata Cleveland 12 35.29% 6 17.65% 1 2.94% 6 17.65% 8 23.53% 1 2.94% Cincinnati 16 38.10% 5 11. 90% 2 4.76% 6 14.29% B 19.05% 5 11. 90%
.... ~.-.. .. _----- -~---

....., B
O"l 00
Question 32: (Hospitah j Clinics or Health Relate,d Goven'lmel1t Agencies Does your institution provide any health services to the commu-
nity that require extensive use of local telephone services?
Yes No Strata
by City freq. % fre~l. %
local Government Cleveland 2 100.00% 0 0.00% Cincinnati 0 0.00% 3 100.00%
State Government Cleveland 0 0.00% 1 100.00% Cincinnati 0 0.00% 0 0.00%
Un-i vers it j es Cleveland 0 0.00% 0 0.00% Cincinnati 0 0.00% 0 0.00%
Hospitals
Cleveland 12 42.86% 16 57.14% Cinci nnati 8 66.67% 4 33.33%
Schools
Cleveland 0 0.00% 0 0.00% Cinci nnati 0 0.00% 0 0.00%
libraries Cleveland 0 0.00% 8 R~RR~ f.i . i n n nno/
~ ~~
Charities Cleveland 1 50.00% 1 50.00% Cincinnati 0 0.00% 0 0.00%
All Strata Cleveland 15 45.45% 18 54.55% Cincinnati 8 53.33% 7 46.67%
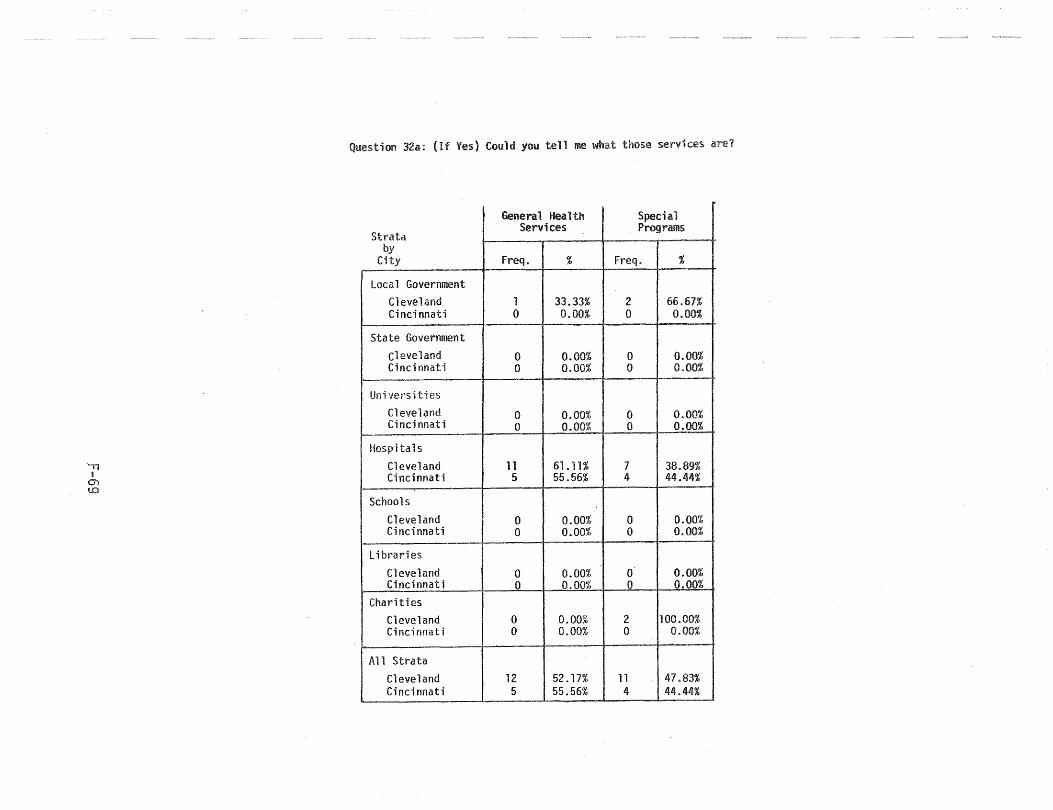
-1"1 i
0)
1.O
Question 32a: (If Yes) Could you ten me what those services ar"e?
General Health Special Services Programs
Strata by
City Freq. % Freq. %
local Government Cleveland 1 33.33% 2 66.67% Cincinnati 0 0.00% 0 0.00%
State Government Cleveland 0 0.00% 0 0.00% Cincinnati 0 0.00% 0 0.00%
Un; vers Hies
Cleveland 0 0.00% 0 0.00% Cinci nnati 0 0.00% 0 0.00%
Hospitals Cleveland 11 61 .11 % 7 38.89% Cincinnati 5 55.56% 4 44.44%
Schools Cleveland 0 0.00% 0 0.00% Cincinnati 0 0.00% 0 0.00%
~
libraries Cleveland 0 0.00% 0 0.00% Cincinnati 0 0.00% 0 0.00%
Charities Cleveland 0 0.00% 2 100.00% Cincinnati 0 0.00% 0 0.00%
All Strata Cleveland 12 52.17% 11 47.83% Cincinnati 5 55.56% 4 44.44%
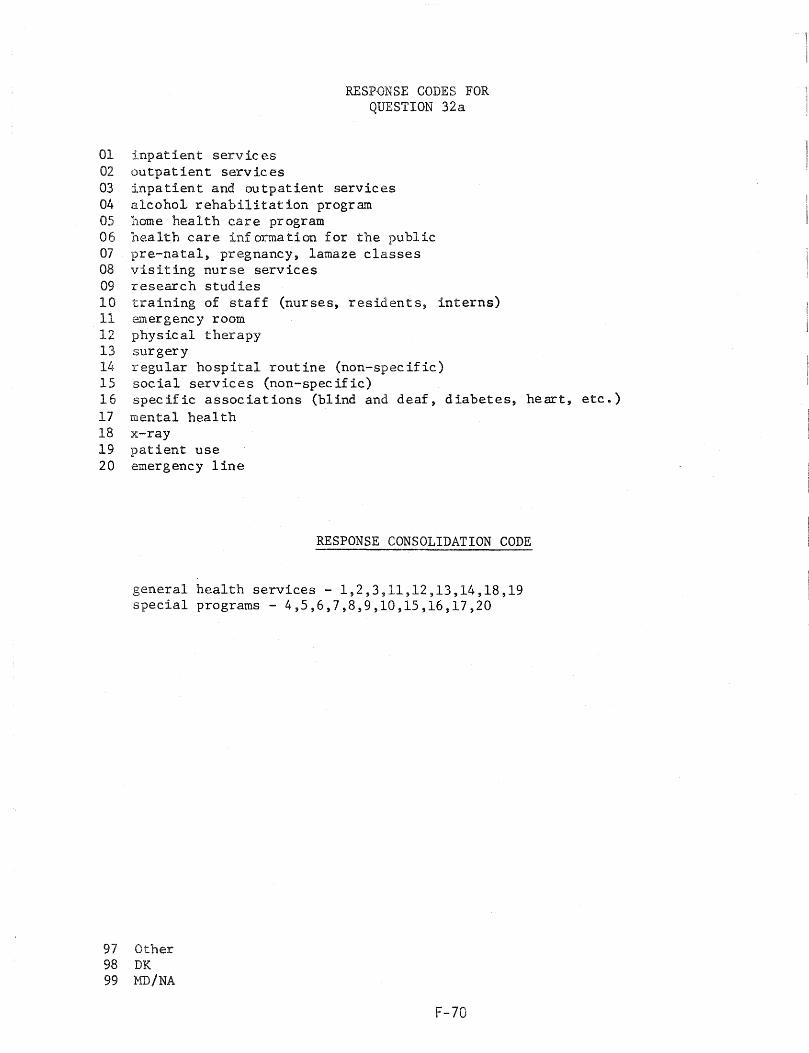
RESPDNSE CODES FOR QUESTION 32a
01 inpatient services 02 outpatient services 03 inpatient and outpatient services 04 alcohol rehabilitation program 05 home health care program 06 health care information for the public 07 pre-natal, pregnancy, lamaze classes 08 visiting nurse services 09 research studies 10 training of staff (nurses, residents, interns) 11 emergency room 12 physical therapy 13 surgery 14 regular hospital routine (non-specific) 15 social services (non-specific) 16 specific associations (blind and deaf, diabetes, heart, etc.) 17 mental health 18 x-ray 19 patient use 20 emergency line
RESPONSE CONSOLIDATION CODE
general health services - 1,2,3,11,12,13,14,18,19 special programs - 4,5,6,7,8,9,10,15,16,17,20
97 Other 98 DK 99 MD/NA
F-70
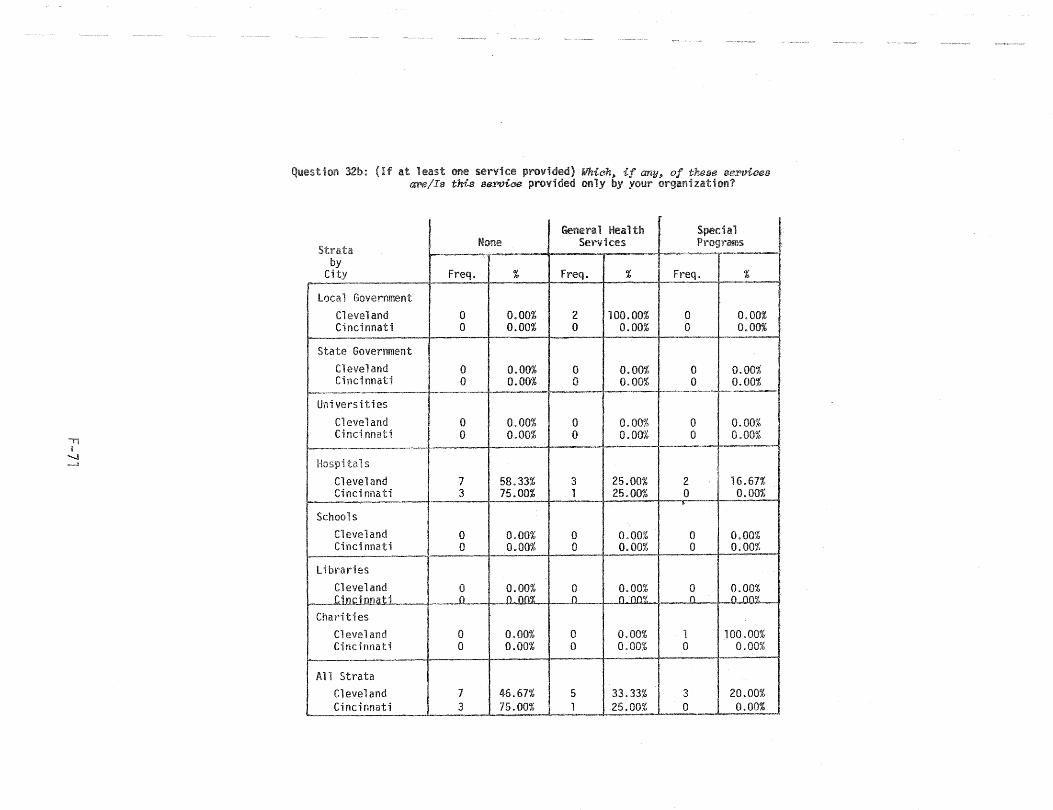
32b: Of at least one service provided) Whiah$> if any:. of the8e 8(JPviaes aPe/Is this service provided only by your organization?
General H4 Special Strata
None Services Prog!rams ---"-r'~--~'
by City Freq. % Freq. % Freq. %
local Government Cleveland 0 0.00% 2 100.00% 0 0.00% Cincinnati 0 0.00% 0 0.00% 0 0.00% ,
Government Cleveland 0 0.00% 0 0.00% 0 0.00% Cincinnati 0 0.00% 0 0.00% . 0 0.00% -- ~----r-'~--~--~-- ."~~,..,.
versities Cleveland 0 0.00% 0 0.00% 0 0.00% Cinci nnati 0 0.00% 0 0.00% 0 0.00%
-- -tals
Cleveland 7 58.33% 3 25.00% 2 Cincinnati 3 75.00% 1 25.00% 0 0.00%
Schools Cleveland 0 0.00% 0 0.00% 0 0.00% Cincinnati 0 0.00% 0 0.00% 0 0.00%
-librades
Cleveland 0 0.00% 0 0.00% 0 0.00% Cine] noat] ° _0,00% f) n nn'7.: n n Ofl'7.:.
Charities Cleveland 0 0.00% 0 0.00% 1 100.00% Cincinnati 0 0.00% 0 0.00% 0 0.00%
All Strata
Cleveland 7 46.67% 5 33.33% 3 20.00% Cincinnati 3 75.00% 1 25.00% 0 0.00%
-.-.. -~~--.--

RESPONSE CODE FOR QUESTION 32b
01 none 02 all 03 inpatient services 04 outpat~ent services 05 inpatient and outpatient services 06 alcohol rehabilitation program 07 home health care program 08 health care information for the public 09 pre-natal, pregnancy, lamaze classes 10 visiting nurse services 11 research studies 12 training of staff (nurses, residents, interns) 13 ffnergency room 14 physical therapy 15 surgery 16 regular hospital routine (non-specific) 17 social services (non-specific) 18 specific associations (blind and deaf) diabetes, heart, etc.)
RESPONSE CONSOLIDATION CODE
general health services - 2,3,4,5,13,14,15,16 special programs - 6,7,8,9,10,11,12,17,18 none - 1
97 . other 98 DK 99 MD/NA
F-72
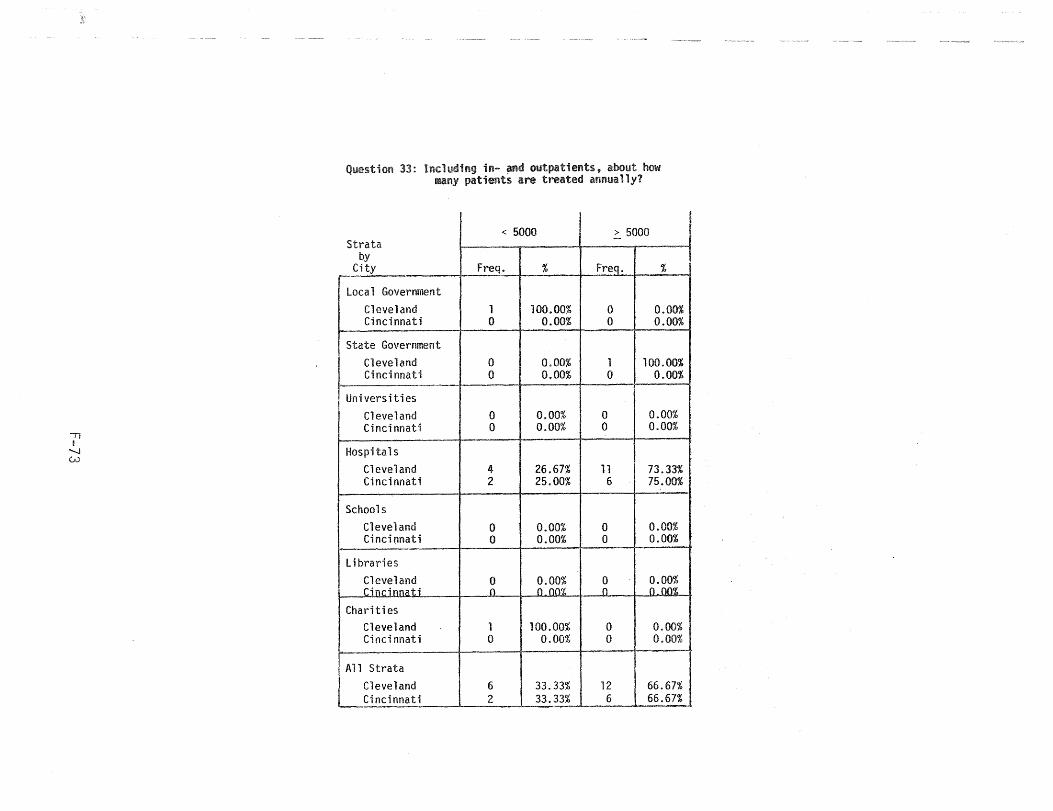
11 I
"'--J W
-
Question 33: Including in- ~nd outpatients, about how many patients are treated annually?
< 5000 > 5000 Strata
by City Freq. % Freq. %
Local Government Cleveland 1 100.00% 0 0.00% Cincinnati 0 0.00% 0 0.00%
State Government Cleveland 0 0.00% 1 100.00% Cincinnati 0 0.00% 0 0.00%
Uni vers iti es Cleveland 0 0.00% 0 0.00% Cincinnati 0 0.00% 0 0.00%
Hospitals Cleveland 4 26.67% 11 73.33% Cincinnati 2 25.00% 6 75.00%
Schools Cleveland 0 0.00% 0 0.00% Cincinnati 0 0.00% 0 0.00%
libraries Cleveland 0 0.00% 0 0.00% Ci • fl' :i 0 O.OO'b n 0.00%
Chariti es Cleveland 1 100.00% 0 0.00% Cincinnati 0 0.00% 0 0.00%
All Strata
Cleveland 6 33.33% 12 66.67% Cincinnati 2 33.33% 6 66.67%
-
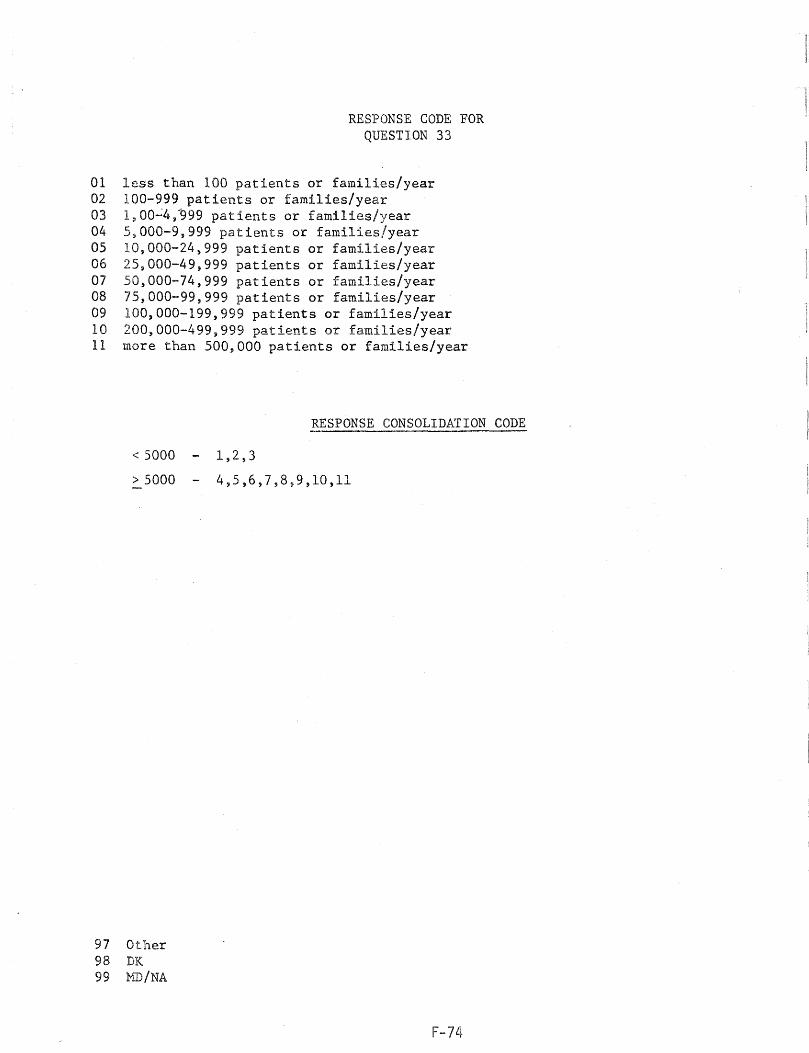
RESPONSE CODE FOR QUESTION 33
01 less than 100 patients or families/year 02 100-999 patients or families/year 03 1,OO~4,~99 patients or families/year 04 5~OOO-9,999 patients or families/year 05 10,000-24,999 patients or families/year 06 25,000-49,999 patients or families/year 07 50,000-74,999 patients or families/year 08 75,000-99,999 patients or families/year 09 100,000-199,999 patients or families/year 10 200 7 000-499,999 patients or families/year 11 more than 500,000 patients or families/year
< 5000
> 5000
97 Other 98 DIe 99 't!ill/NA
RESPONSE CONSOLIDATION CODE
1,2,3
4,5,6,7,8,9,10,11
F-74
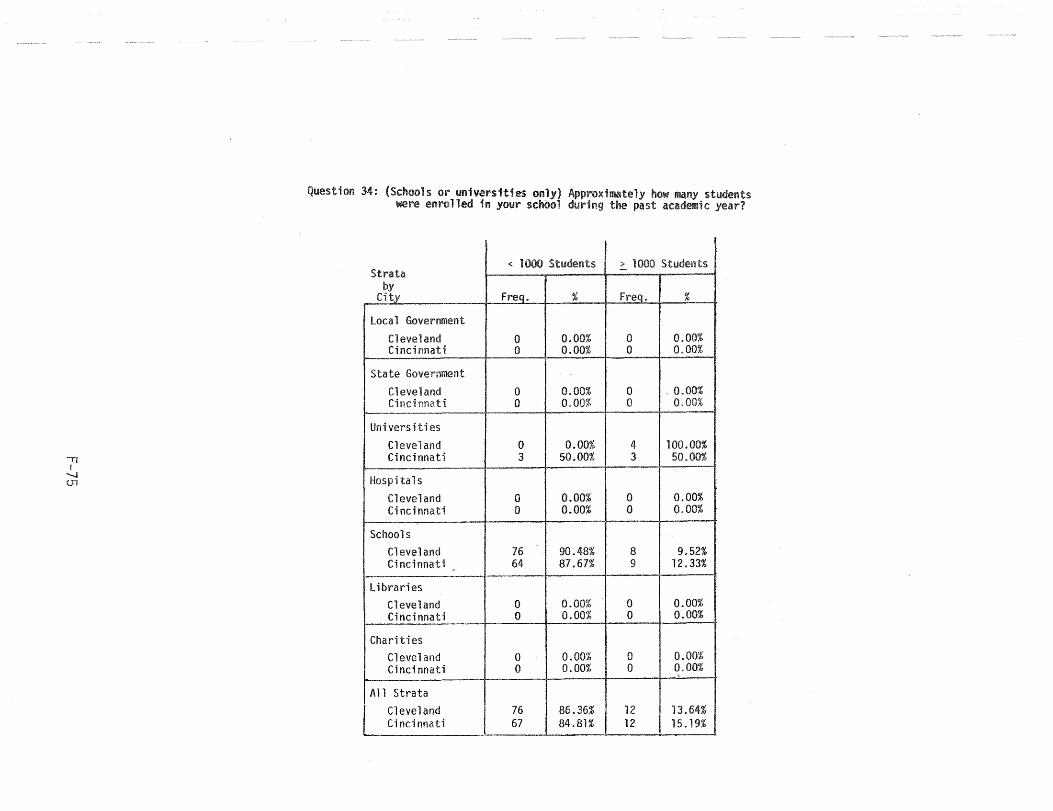
Question 34: (Schools or universities only) Approximately how ~ny students were enrolled in your schOol during the past academic year?
< H100 Students
, > 1000 Students
Strata -by
City Freq. % Freq. %
Local Government Cleveland 0 0.00% 0 0.00% Cincinnati 0 0.00% 0 0.00%
State Government
Cleveland 0 0.00% 0 0.00% Cincinnati 0 0.00% 0 0.00%
1-----
Uni vers iti es Cleveland 0 0.00% 4 100.00% Cincinnati 3 50.00% 3 50.00%
Hospitals !
Cleveland 0 0.00% 0 0.00% Ci nd nnati 0 0.00% 0 0.00%
Schools Cleveland 76 90.48% 8 9.52% Cincinnati 64 87.67% 9 12.33%
I Libraries
Cleveland 0 0.00% 0 0.00% Cinci nnati 0 0.00% 0 0.00%
Charities Cleveland 0 0.00% 0 0.00% Cincinnati 0 0.00% 0 0.00%
c -All Strata l Cleveland 76 86.36% 12 13.64%
Cincinnati 67 84.81% 12 15.19% ---.----~------.. ---.--
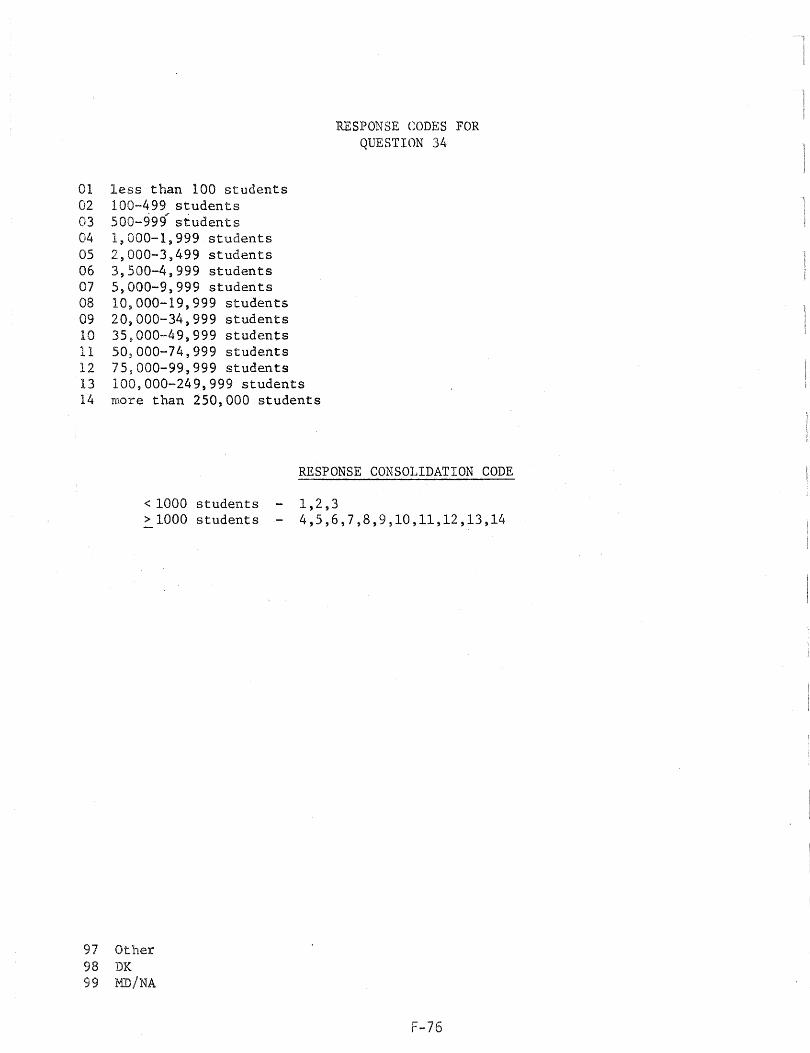
01 less than 100 students 02 100-499 students 03 500-999 students 04 1,000-1,999 students 05 2,000-3,499 students 06 3,500-4,999 students 07 5,000-9,999 students 08 10,000-19,999 students 09 20,000-34,999 students 10 35,000-49,999 students 11 50,000-74,999 students 12 75,000-99,999 students
RESPONSE CODES FOR QUESTION 34
13 100,000-249,999 students 14 more than 250,000 students
< 1000 students > 1000 students
97 Other 98 DK 99 MD/NA
RESPONSE CONSOLIDATION CODE
1,2,3 4,5,6,7,8,9,10,11,12,13,14
F-76
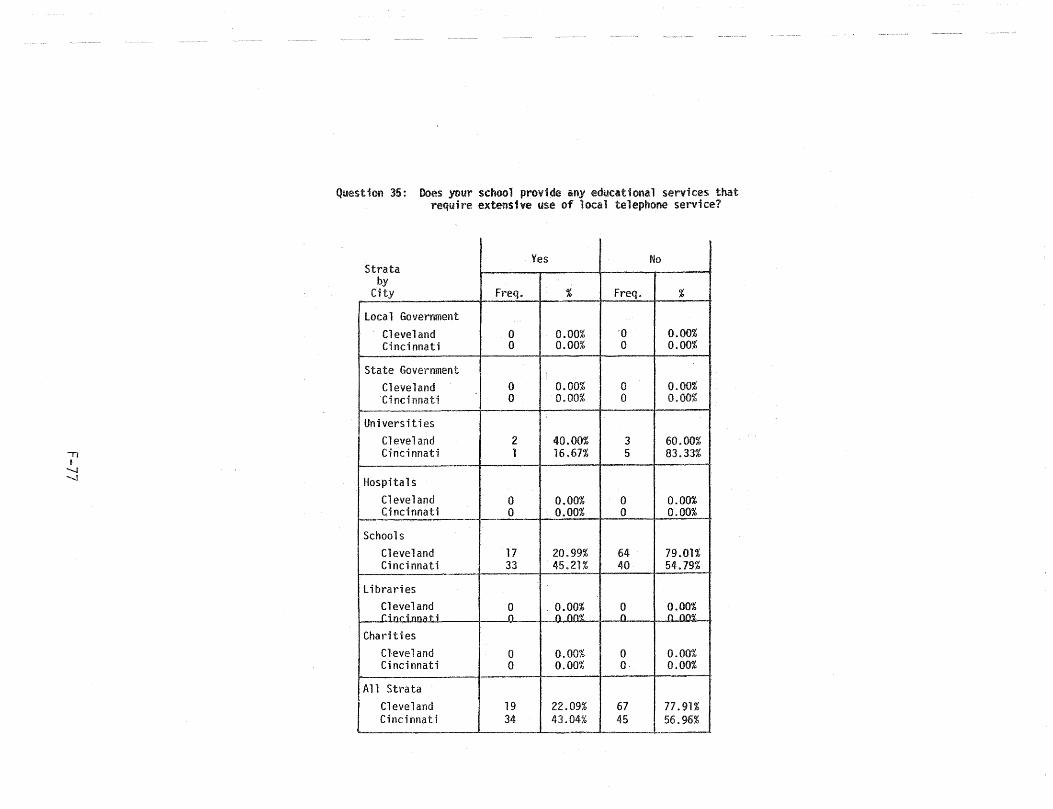
.." I
-.! -.!
Question 35: Does your school provide any educational services that require extensive use of local telephone service'll
Yes No Strata
by City Freq. % Freq. %
local Government Cleveland 0 0.00% '0 0.00% Cincinnati 0 0.00% 0 0.00%
State Government Cleveland 0 0.00% 0 0.00% Cinci nnati 0 0.00% 0 0.00%
--..
Univers it i es Cleveland 2 40.00% 3 60.00% Cincinnati 1 16.67% 5 83.33%
Hospital s Cleveland 0 0.00% 0 0.00% Cincinnati 0 0.00% 0 0.00%
Schools Cleveland 17 20.99% 64 79.01% Cincinnati 33 45.21% 40 54.79%
libraries Cleveland 0 0.00% 0 0.00% rinrinn~f-i 0 o.on'! n n nn'!
Charities Cleveland 0 0.00% 0 0.00% Cincinnati 0 0.00% 0 0.00%
All Strata L Cleveland 19 22.09% 67 77.91% _ Cincinnati 34 43.04% 45 56.96%
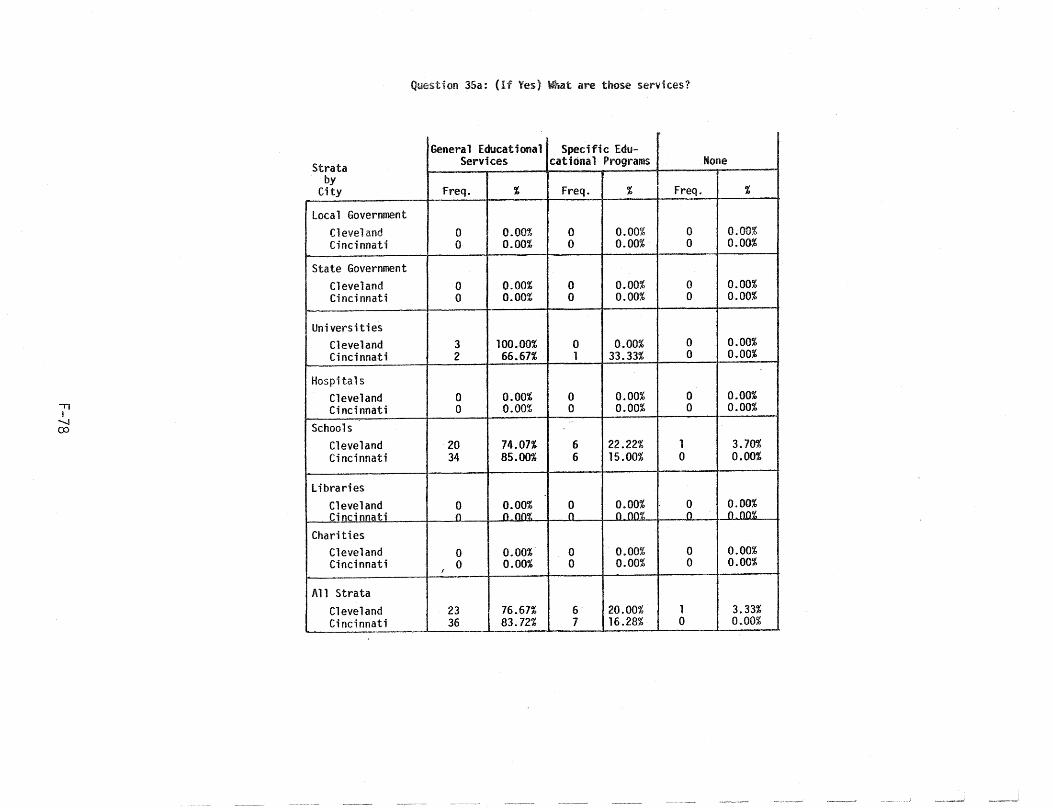
II B
"""-J 00
Strata by
City
local Government Cleveland Cincinnati
State Government Cleveland Cincinnati
Universities Cleveland Cincinnati
Hospitals Cleveland Cincinnati
Schools Cleveland Cincinnati
libraries Cleveland Cincinnati
Charities Cleveland Cincinnati
All Strata Cleveland Cincinnati
-
Question 35a: (If Yes) What are those services?
General Educational Specific Edu-Services cational Programs None
Freq. % Freq. % Freq. %
0 0.00% 0 0.00% 0 0.00% 0 0.00% 0 0.00% 0 0.00%
0 0.00% 0 0.00% 0 0.00% 0 0.00% 0 0.00% 0 0.00%
3 100.00% 0 0.00% 0 0.00% 2 66.67% 1 33.33% 0 0.00%
0 0.00% 0 0.00% 0 0.00% 0 0.00% 0 0.00% 0 0.00%
20 74.07% 6 22.22% 1 3.70% 34 85.00% 6 15.00% 0 0.00%
0 0.00% 0 0.00% 0 0.00% 0 o.om: 0 o.on'J:: n n.on'i:
0 0.00% 0 0.00% 0 0.00% 0 0.00% 0 0.00% 0 0.00%
~
23 76.67% 6 20.00% 1 3.33% 36 83.72% 7 16.28% 0 0.00%
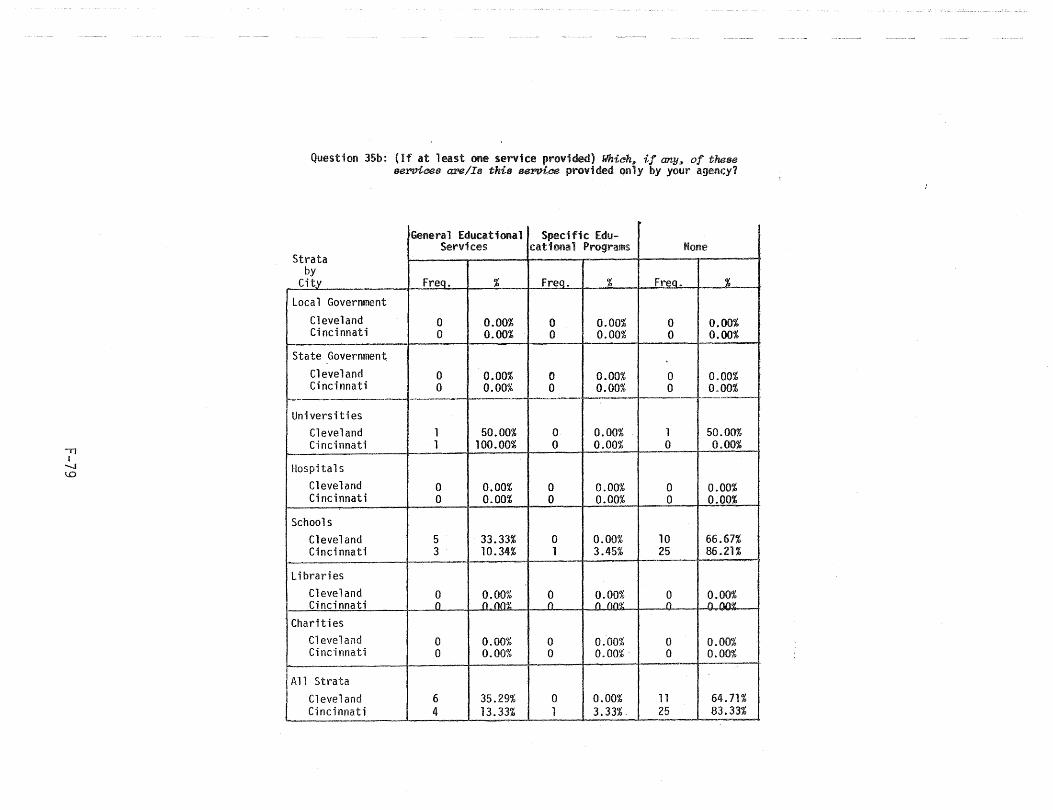
.." I
-...s ~
I
Question 35b: (If at least one service provided) ~i~h, if any, of t~~8e e8'1"'lJices a;pe/Is this s8wiee provided only by your agency?
General Educational Sped fic Edu-Services cational Programs None
Strata by
City Fre~. % FreQ. % FreQ. L-. Local Government
Cleveland 0 0.00% 0 0.00% 0 0.00% Cincinnati 0 0.00% 0 0.00% 0 0.00%
State Government Cleveland 0 0.00% 0 0.00% 0 0.00% Cincinnati 0 0.00% 0 0.00% 0 0.00% --- "" ......... =-=",
Universities Cleveland 1 50.00% 0 0.00% 1 50.00% Cincinnati 1 100.00% 0 0.00% 0 0.00% M __
Hospita 1 s Cleveland 0 0.00% 0 0.00% 0 0.00% Ci nci nnat i 0 0.00% 0 0.00% 0 0.00%
Schools Cleveland 5 . 33.33% 0 0.00% 10 66.67% Cincinnati 3 10.34% 1 3.45% 25 86.21%
libraries Cleveland 0 0.00% 0 0.00% 0 0.00% Cincinnati n n.n()~ () n flfI')! fI fI .00%--
Charities Cleveland 0 0.00% 0 0.00% 0 0.00% Cincinnati 0 0.00% 0 0.00% - 0 0.00%
All Strata Cleveland 6 35.29% 0 0.00% 11 64.71% Cincinnati 4 , ___ 1_ 3 .~3% ___ 1 3.33%. 25 83.33%
---__ L....-...
RESPONSE CODES FOR QUESTIONS 35a&b
001 tutorial services (reading, math) 002 psychological services 003 counseling (general) 004 consumer services (information and advice) 005 rec~rd~keeping (non-specific) 006 lunch-room services 007 health records 008 scheduling 009 supervising 010 computers; terminal hook-ups 011 secur ity 012 health personnel and services 013 community liaison work 014 reading instruction programs 015 none/no 016 social services 017 library services 018 client contact 019 distributing resources and supplies 020 recreation programs 021 Job placement
RESPONSE CONSOLIDATION CODE
general educational services - 1,3,4,5,6,7,8,9,10,11,12,13,16,18,19 specific educational programs - 2,14,17,20,21 none - 15
097 other 098 DK 099 MD/NA
F-80
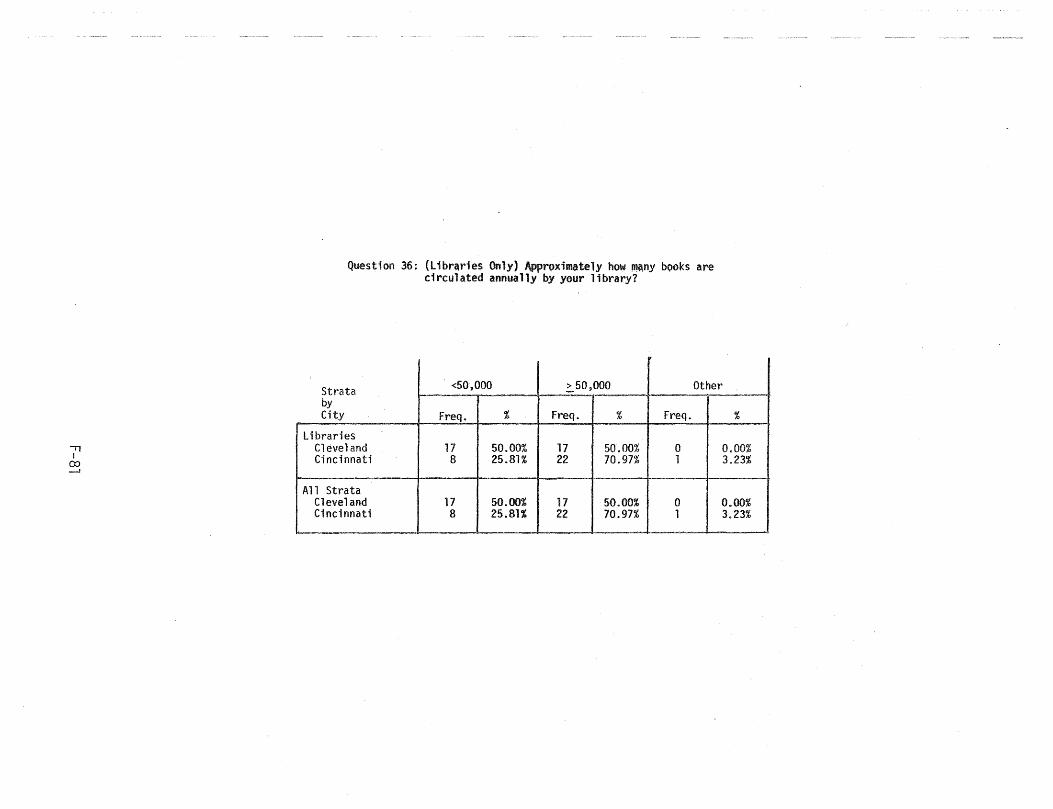
II I
co -J
Question 36: (libr~ries Only) Approximately how ffl~ny books are circulated annually by your library?
I
Strata <50,000 > 50.000 Other --~ v--'-_.-
by City Freq. % Freq. % Freq. %
-Libraries
Cleveland 17 50.00% 17 50.00% 0 0.00%
I Cincinnati 8 25.81% 22 70.97% 1 3.23%
All Strata i
Cleveland 17 50.00% 17 50.00% 0 0.00% I Cincinnati 8 25.81% 22 70.97% 1 ~ "'---~-----~----- - --'
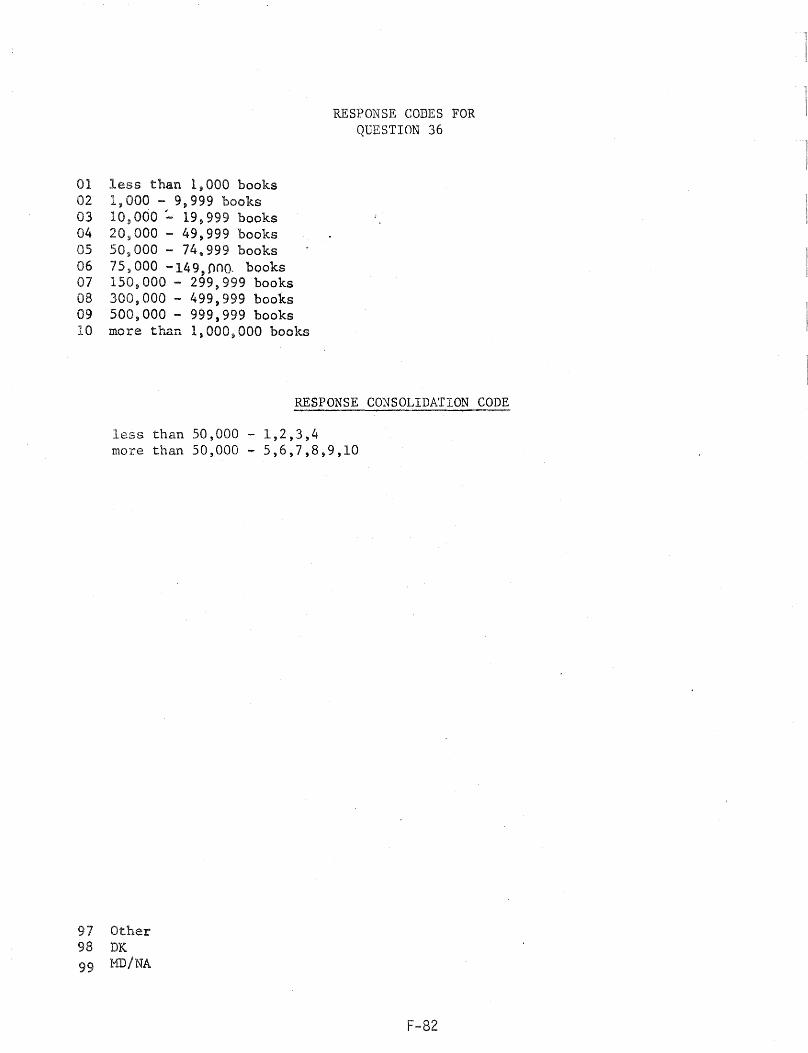
01 less than 1,000 books 02 1,000 - 9,999 books 03 lO~OOO ~ 19,999 books 04 20,000 - 49,999 books 05 50~OOO - 74.999 books 06 75~000 -149,000. books 07 150,000 - 299,999 books 08 300,000 - 499,999 books 09 500,000 - 999,999 books 10 more than 1,000,000 books
RESPONSE CODES FOR QUESTION 36
RESPONSE CONSOLIDATION CODE
less than 50,000 - 1,2,3,4 more than 50,000 ... 5,6,7,8,9,10
97 Other 98 DK 99 MIJ/NA
F-82
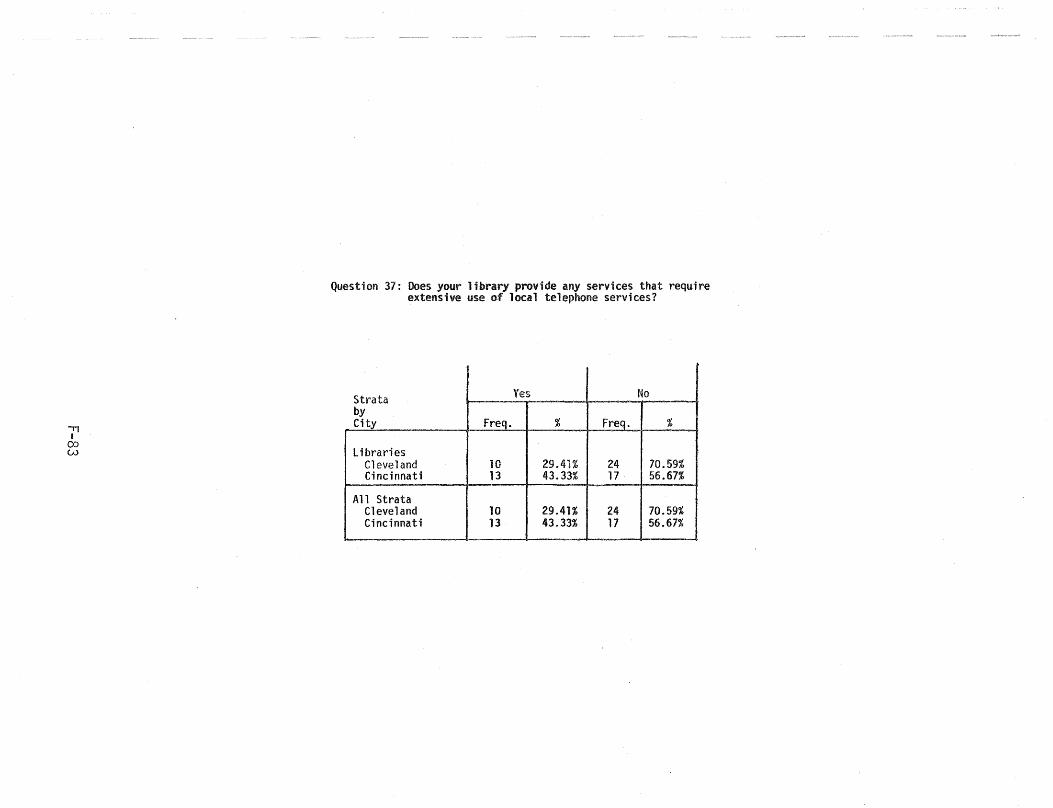
.." I
00 W
Question 37: Does your library provide any services that require extensive use of local telephone services?
Strata Yes No
by City Freq. % Freq . %
libraries Cleveland 10 29.41% 24 70.59% Cincinnati 13 43.33% 17 56.67%
All Strata Cleveland 10 29.41% 24 70.59% Cincinnati 13 43.33% 17 56.67%
- -- - - ---- -------- ~--- --------_ .......
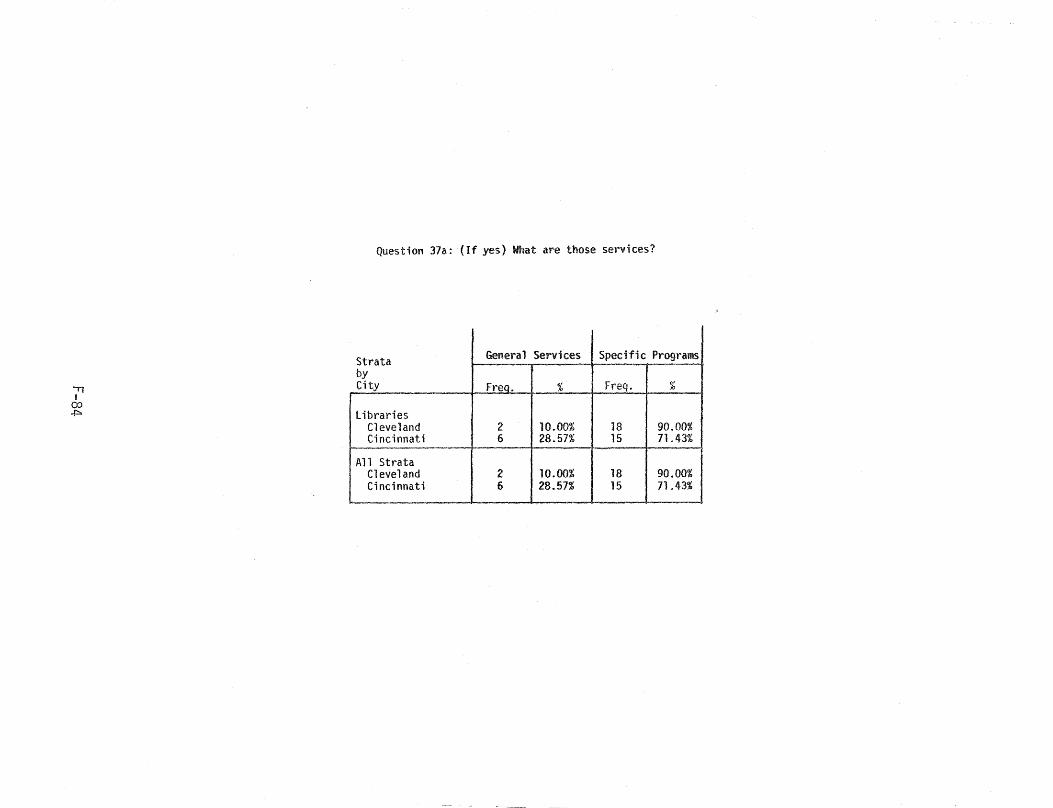
." I
(X) ~
Question 37a: (If yes) What are those services?
Strata General Services Specific programsj by ) City Freq . % Freq. %
libraries Cleveland 2 10.00% 18 90.00% Cincinnati 6 28.57% 15 71.43%
1=--.
All Strata Cleveland 2 10.00% 18 90.00% Cincinnati 6 28.57% 15 71.43%
-------~------------. -----------
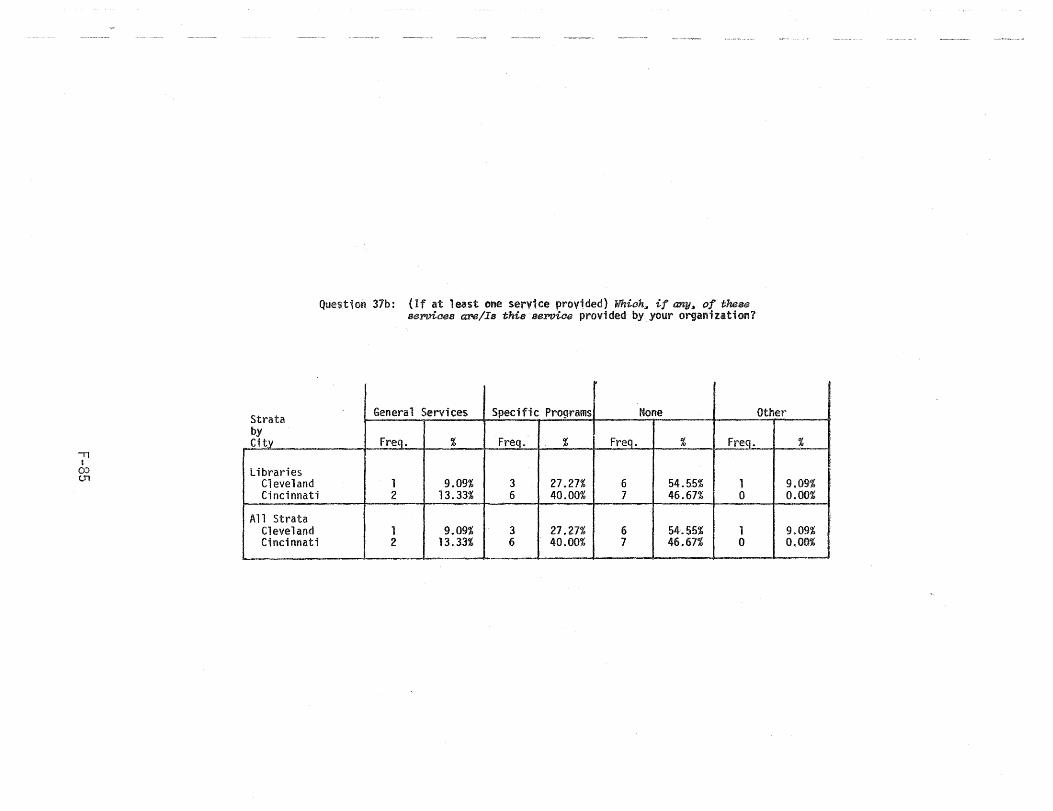
.,., I
00 U1
Strata by City
Libraries Cleveland Cincinnati
All Strata Cleveland Cincinnati
Question 31b: (If at least one servlce provided) Which, if Clrr:YIJ of these services are/Is this service provided by your organiz,ation?
General Services Specific Programs None
freq. % Freq. % Freq. % Freq.
1 9.09% 3 27.27% 6 54.55% 1 2 13.33% 6 40.00% 7 46.67% 0
1 9.09% 3 27.27% 6 54.55% 1 2 13.33% 6 40.00% 7 46.67% 0
.. ~- -.-~-~~--------
Other
%
9.09% 0.00% --9.09% 0.00%
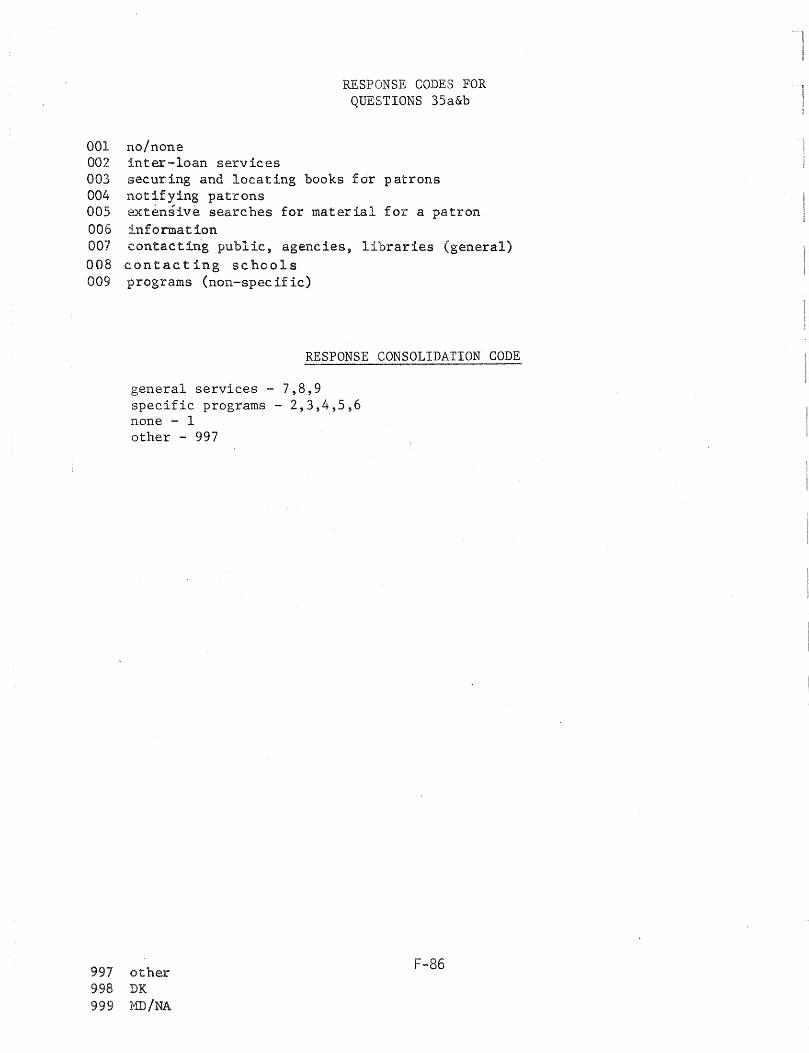
RESPONSE CODES FOR QUESTIONS 35a&b
001 no/none 002 inter-loan services 003 securing and locating books for patrons 004 notifying patrons 005 extensive searches for material for a patron 006 information 007 contacting public, agencies, libraries (general) 008 contacting schools 009 programs (non-specific)
RESPONSE CONSOLIDATION CODE
general services - 7,8,9 specific programs - 2,3,4,5,6 none - 1 other - 997
997 other 998 DK 999 l'fJJ/NA
F-86
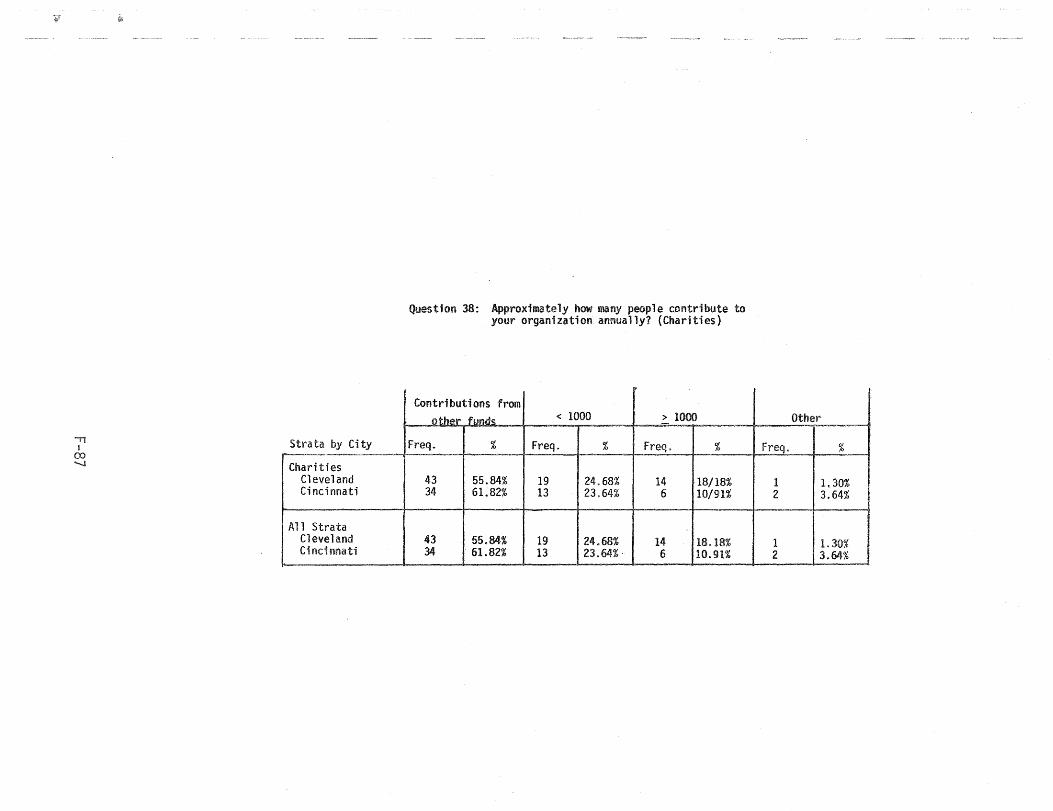
"II I
00 ........
Strata by City --"-'---'- .,
Charities Cleveland Cincinnati
All Strata Cleveland Ci nci nnati
Question 38: Approximately how many people contribute to your organization annually? {Charities}
Contributions from other funds < 1000 > 1000
~-
Freq. % freq. % Freq. ~; -43 55.84% 19 24.68% 14 18/18% 34 61.82% 13 23.64% 6 10/91%
43 55.84% 19 24.68% 14 HL18% 34 61.82% 13 23.64% . 6 10.91%
Other ~,
Freq. %
1 1.30% 2 3.64%
1 1.30% 2 3.64%
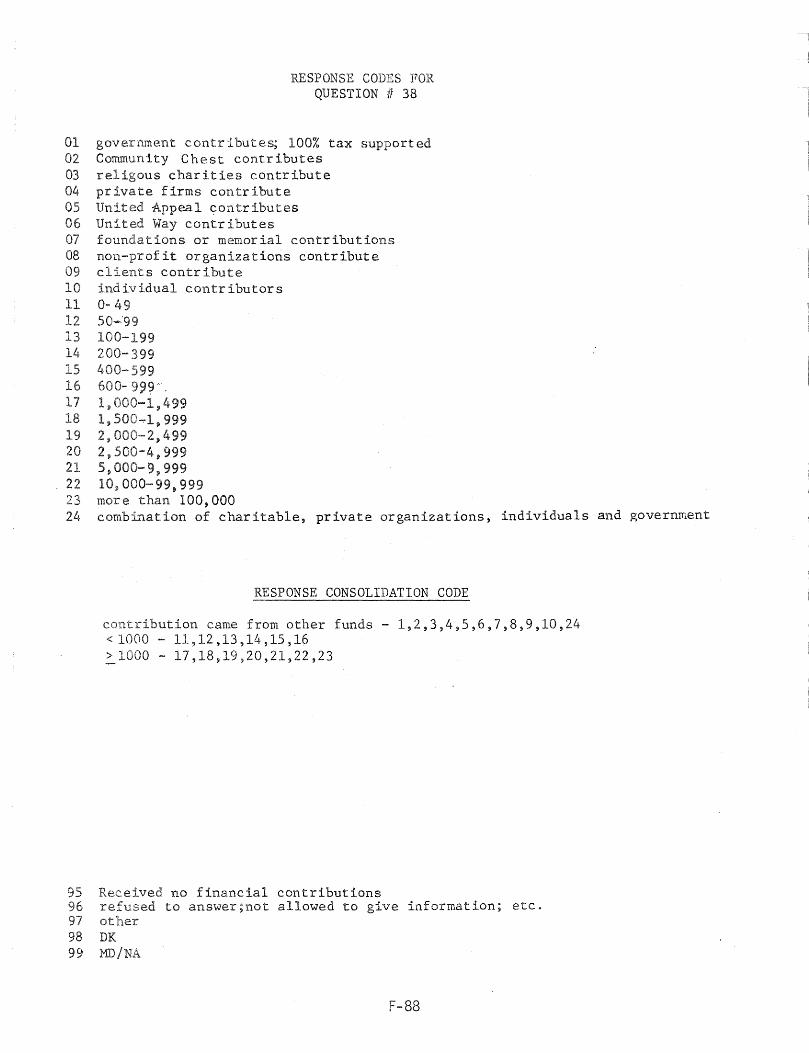
RESPONSE CODES FOR QUESTION II 38
01 government contributes; 100% tax supported Community Chest contributes
03 religous charities contribute 04 private firms contribute 05 United Appeal contributes 06 United Way contributes 07 foundations or memorial contributions 08 non-profit organizations contribute 09 clients contribute 10 individual contributors 11 0- 49 12 50-'99 13 100-199 14 200-399 15 400-16 600- 999'
l~ ,499 18 1,500-:-1,999 19 2$ 2~499 20 2\t500-4:>999 21 511000-9~999 22 000-99,999 23 more than 100,000 24 combination of charitable, private organizations, individuals and government
RESPONSE CONSOLIDATION CODE
contribution came from other funds - 1,2,3,4,5,6,7,8,9,10,24 < 1000 - 11,12,13,14,15,16 > 1000 - 17,18,19,20,21,22,23
95 Received no financial contributions 96 refused to answer;not allowed to give information; etc. 97 other 98 DK 99 MD/NA
F-88

11 I co !..O
Question 39: Could you give me a rough idea of how much those contrHHJ!tions come to?
> 200,000 < 200,000 < r.OOO~OOO ~ 1,000.000 Other
Strata by Ci ty freq. % Freq. % Freq. % Freq. %
Charities Cleveland 37 67.71% 7 11.86% 3 5.08% 12 20.34% Ci nci nnati 33 73.33% 6 13.33% 3 6.67% 3 6.67%
All Strata Cleveland 37 62.71% 7 11.86% 3 5.08% 12 20.34% Cinci nnati 33 73.33% 6 13.33% 3 6.67% 3 6.67%
--- --
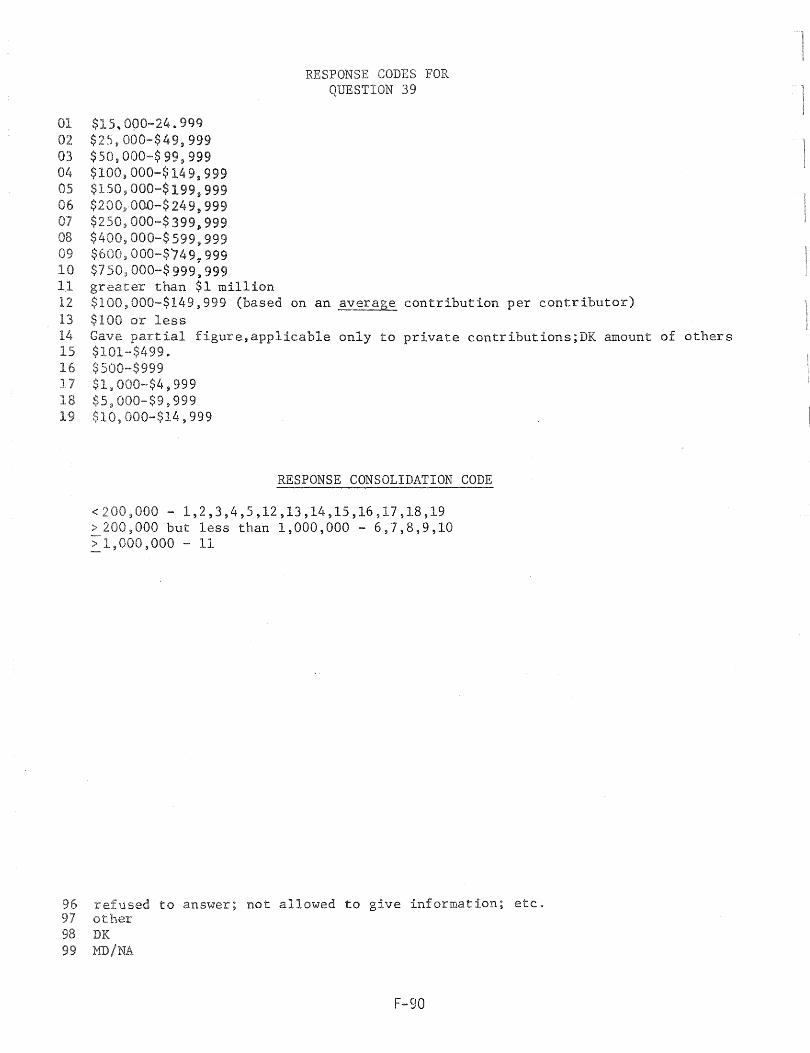
01 ~OOO-246999 $ ~OOO-$49~999 $ 50 OOO~·$ 99, 999
04 $ OOO-$149~999 05 000-$199,999
$200~,O()()-$ 249,999 07 50,000-$399,999 08 OOO-$599~999
000-$'749:999 10 000-$999,999
greater than $1 million
RESPONSE CODES FOR QUESTION 39
12 $100~000-$149,999 (based on an average contribution per contributor) $100 or less Gave partial figure,applicable only to private contributions;DK amount of others
15 $101-$499. 16 999 17 ,999 18 000-$9,999
$10)000-$14,999
RESPONSE CONSOLIDATION CODE
<200,000 - 1,2,3,4,5,12,13,14,15,16,17,18,19 > 200,000 but less than 1,000,000 - 6,7,8,9,10 ~ 1, 000, 000 - 11
refused to answer; not allowed to give information; etc. 97 other
DK 99
F-90
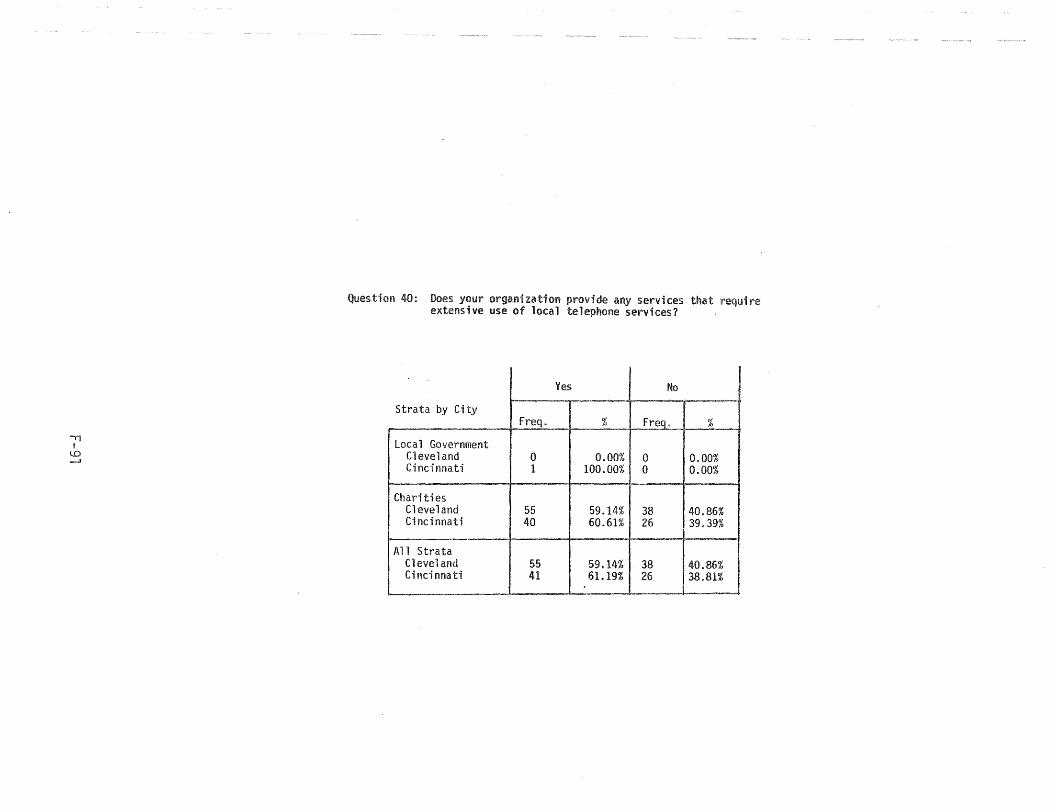
11 I ill .".,..l
Question 40: Does your organization provide any services that require extensive use of local telephone services?
Yes No
Strata by City freq. % Freq. %
Local Government
oooo%.J Cleveland 0 0.00% 0 Cincinnati 1 100.00% 0 0.00%
Charities Cleveland 55 59.14% 38 40.86% Ci nci nnat; 40 60.61% 26 39.39%
--An Strata
Cleveland 55 59.14% 38 40.86% Ci nci nna ti 41 61.19% 26 38.81%
... --
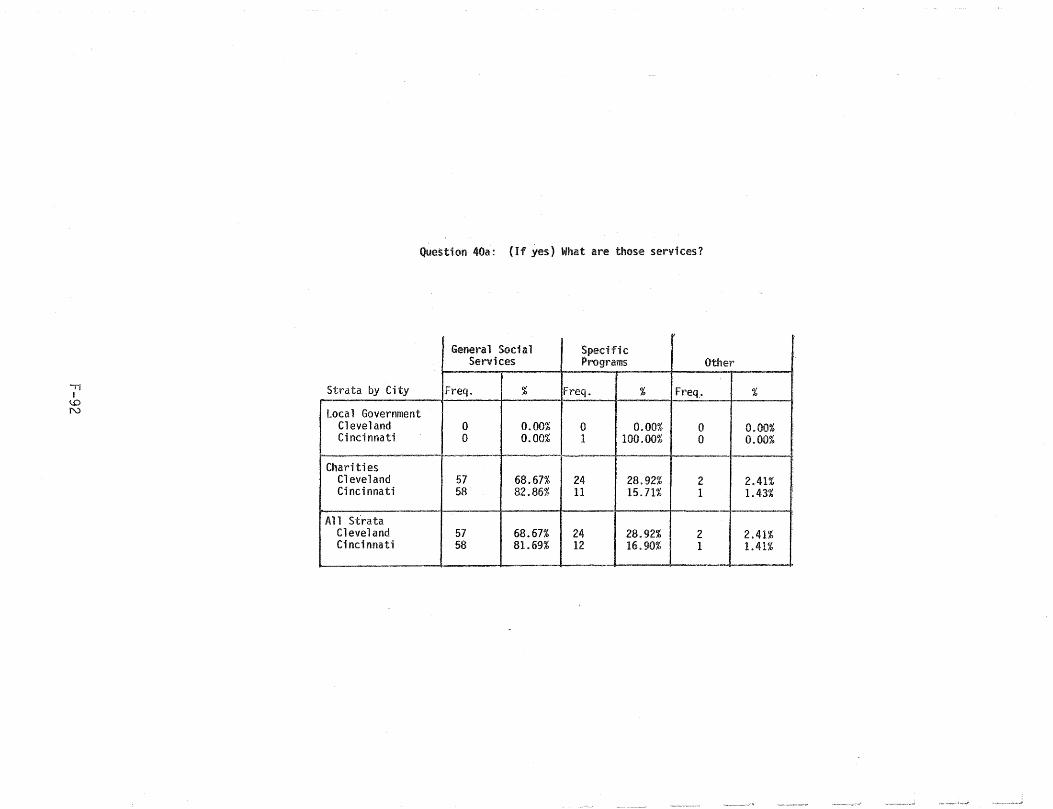
i1 I ~ N
Question 40a: (If yes) What are those services?
Genera 1 Sod a 1 Specific Services Programs
Strata by City freq. % Freq. % freq,.
Local Government Cleveland 0 0.00% 0 0.00% 0 Cincinnati 0 0.00% 1 100.00% 0
--I-----~ r--~--~ Charities
Cleveland 57 68.67% 24 28.92% 2 Cincinnati 58 82.86% 11 15.71% 1
All Strata Cleveland 57 68.67% 24 28.92% 2 Ci nci nnati 58 81.69% 12 16.90% 1
'---...
Other
%
0.00% O.O{)%
2.41% 1.43% ;
2.41% 1.41%
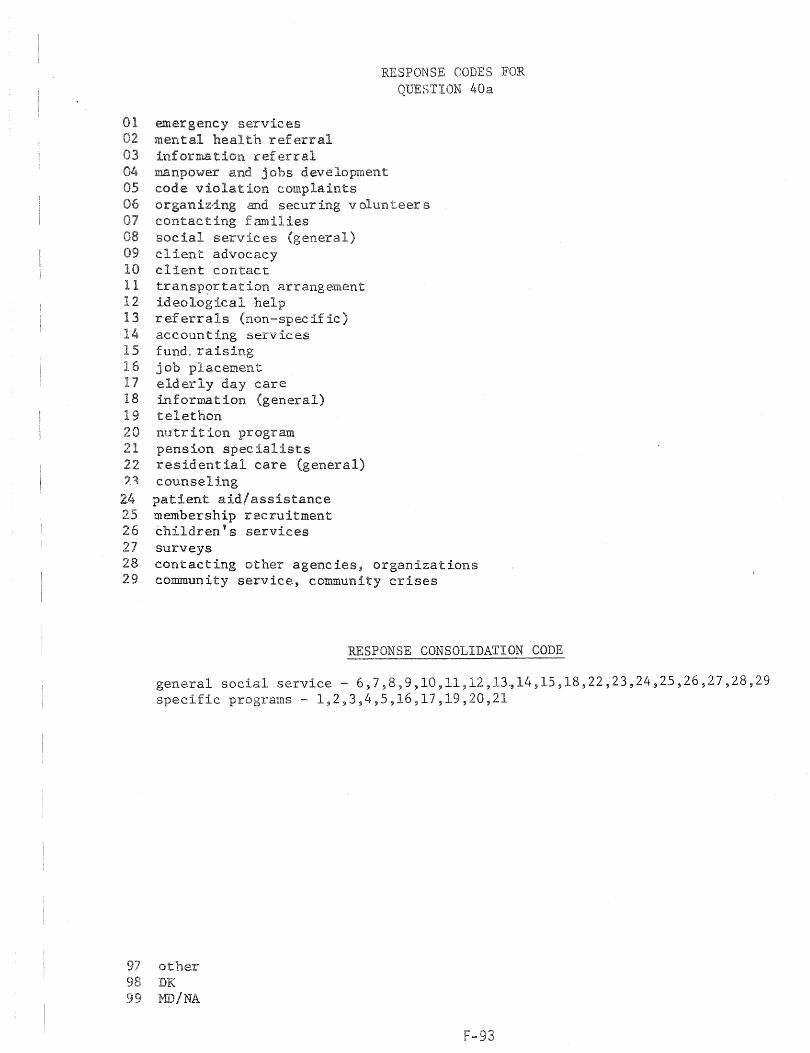
01 02
services ref
ref erral manpower and jobs cleve
05 code violation 06 organiz-ing and secur 07 contacting families 08 social services (general) 09 client advocacy 10 client contact 11 12 13 14 15 16 17 18 19 20 21 22 ,~
transp~rtation arrangement ideological help ref errals (non-spec if ic) accounting services fund. raising job placement elderly day care information (general) telethon nutrition program pension specialists residential care (general) counseling patient aid/assistance membership recruitment children's services surveys
RESPONSE CODES FOR 40a
s
25 26 27 28 29
contacting other agencies~ organizations community service, community crises
RESPONSE CONSOLIDATION CODE
general social service - 6,7~8~9910 11~12,13.,14,15,18,22,23,24,25,26,27,28,29 specific programs - 1,2,3,4,5,16,17,19,20,21
97 other DK
99 MD/NA

'11 i
1..0 ..(:':>.
Question 40b: (If at least one service provided) Whieh~ if any, of t}~se serpieeB aPe/is this serviee provided only by your organization?
Genera 1 Sod a 1 Specific Services Programs Othey' - ~-
Strata by City Freq. % Freq. % Freq. %
Charities Cleveland 11 18.97% 47 81.03% 0 0.00% Ci ncinnati 13 26.53% 34 69.39% 2 4.08%
All Strata Cleveland 11 18.97% 47 81.03% 0 0.00% Cincinnati 13 26.53% 34 69.39% 2 4.08%
-...
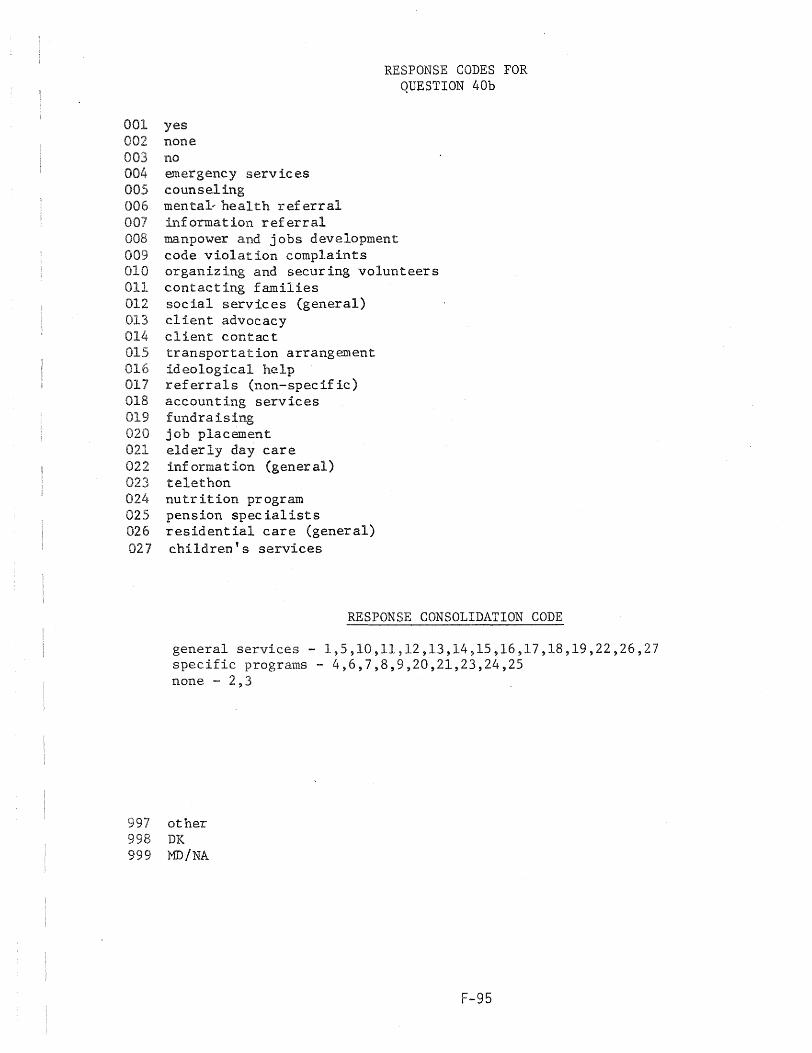
RESPONSE CODES FOR QUESTION 40b
001 yes 002 none 003 no 004 emergency services 005 counseling 006 mental .. health ref erral 007 information referral 008 manpower and jobs development 009 code violation complaints 010 organizing and securing volunteers all contacting families 012 social services (general) 013 client advocacy 014 client contact 015 transportation arrangement 016 ideological help 017 referrals (non-specific) 018 accounting services 019 fundraising 020 job placement 021 elderly day care 022 information (general) 023 telethon 024 nutrition program 025 pension specialists 026 residential care (general) 027 children's services
RESPONSE CONSOLIDATION CODE
general services - l,5,lO,ll,l2,l3,l4~15,l6,l7,l8,l9,22,26,27 specific programs - 4,6,7,8,9,20,21,23,24,25 none - 2,3
997 other 998 DK 999 MD/NA
F-95


APPENDIX G
DEMOGRAPHIC CONSIDERATIONS
G-l

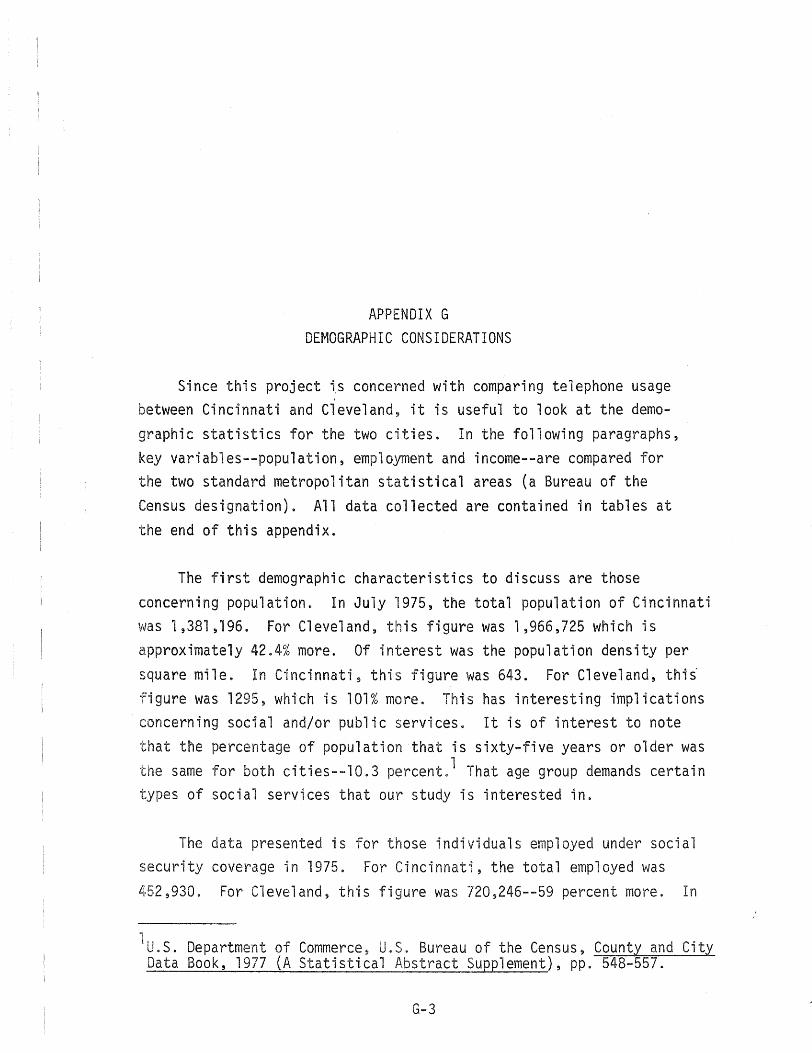
APPENDIX G DE~10GRAPHIC CONSIDERATIONS
Since this project is concerned with comparing telephone usage between Cincinnati and Cleveland, it is useful to look at the demographic statistics for the two cities. In the following paragraphs, key variables--population, employment and income--are compared for the two standard metropolitan statistical areas (a Bureau of the Census designation). All data collected are contained in tables at the end of this appendix.
The first demographic characteristics to discuss are those concerning population. In July 1975, the total population of Cincinnati was 1,381,196. For Cleveland, this figure was 1,966,725 which is approximately 42.4% more. Of interest was the population density per square mile. In Cincinnati, this figure was 643. For Cleveland, thii figure was 1295, which is 101% more. This has interesting implications concerning social and/or public services. It is of interest to note that the percentage of population that is sixty-five years or older was the same for both cities--10.3 percent. l That age group demands certain types of social services that our study is interested in.
The data presented is for those individuals employed under social security coverage in 1975. For Cincinnati, the total employed was
452,930. For Cleveland~ this figure was 720,246--59 percent more. In
1
!U.s. Department of Commerce~ U.S. Bureau of the Census, County and City Data Book, 1977 (A Statistical Abstract Supplement), pp. 548-557.
G-3
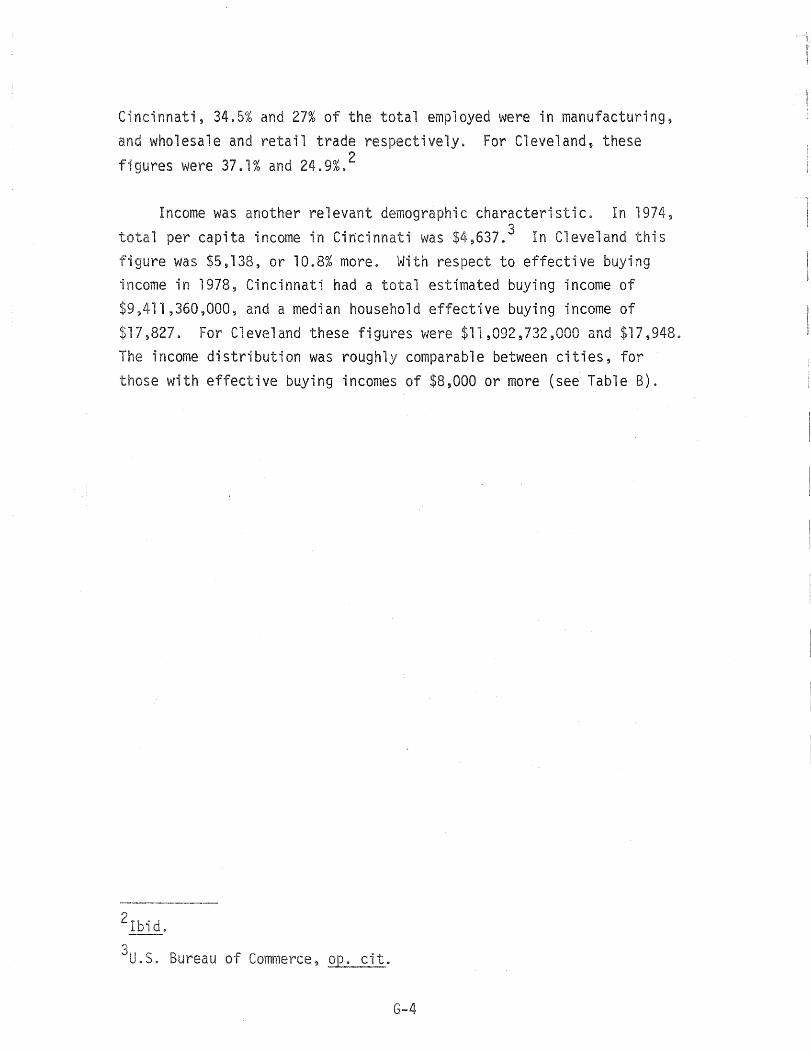
ncinnati, 34. and 27% of the total employed were in manufacturing, wholesale and retail trade respectively. For Cleveland, these
gures were 37.1% and 24.9%.2
Income was another relevant demographic characteristic. In 1974, per capita income in Cincinnati was $4,637. 3 In Cleveland this
figure was $5,138, or 10.8% more. With respect to effective buying income in 1978, Cincinnati had a total estimated buying income of $9 1,360,000, and a median household effective buying income of $17,827.
income distribution was roughly comparable between cities, for those with effective buying incomes of $8,000 or more (see Table B).
21 d.
3U.S. Bureau of Commerce, OPe cit.
G-4

TABLE A DEMOGRAPHIC CHARACTERIST1CS OF CINCINNATI AND CLEVELAND
Category
1. Land Area (Sq. Mi.)
2. Population (July 1975)
A. Total B. Per square mile C. 65 years (%) & over D. Change 1970-1975
Total (%)
3. Employment Social Security Coverage (1975)
A. Total B. In Manufacturing (%) C. In Wholesale & Retail
Trade (%) D. Payro 11 (mi 1 . dol.)
4. Public School Enrollment (1975)
5. Money Income
A. Per capita Income in 1974 (based on July 1, 1975 population) 1. Total (dollars) 2. Average annual
change 1969-1974 (%)
Cincinnati
2~149
1,381,196 643
10.3%
-.2%
452,930 34.5%
27.0% 4,711.3
268,947
4,637
7.4%
Cleveland
1,519
1,966,725 1,295
10.3%
-4.3%
720 9 246 37.1%
24.9% 7,926.9
389,910
5,138
6.9%
% More/Less in Cleveland
Cleveland 71% of Cincinnati
~42.4% more ~101.4% more
same
4.1% more
~59.0% more 2.6% more
2.1% less 68.2% more
~44.9% more
~10.8% more
.5% less
Source: U.S. Department of Commerce, U.S. Bureau of the Census, County and City Data Book, 1977 (A Statistical Abstract Supplement), pp. 548-557.
G-5
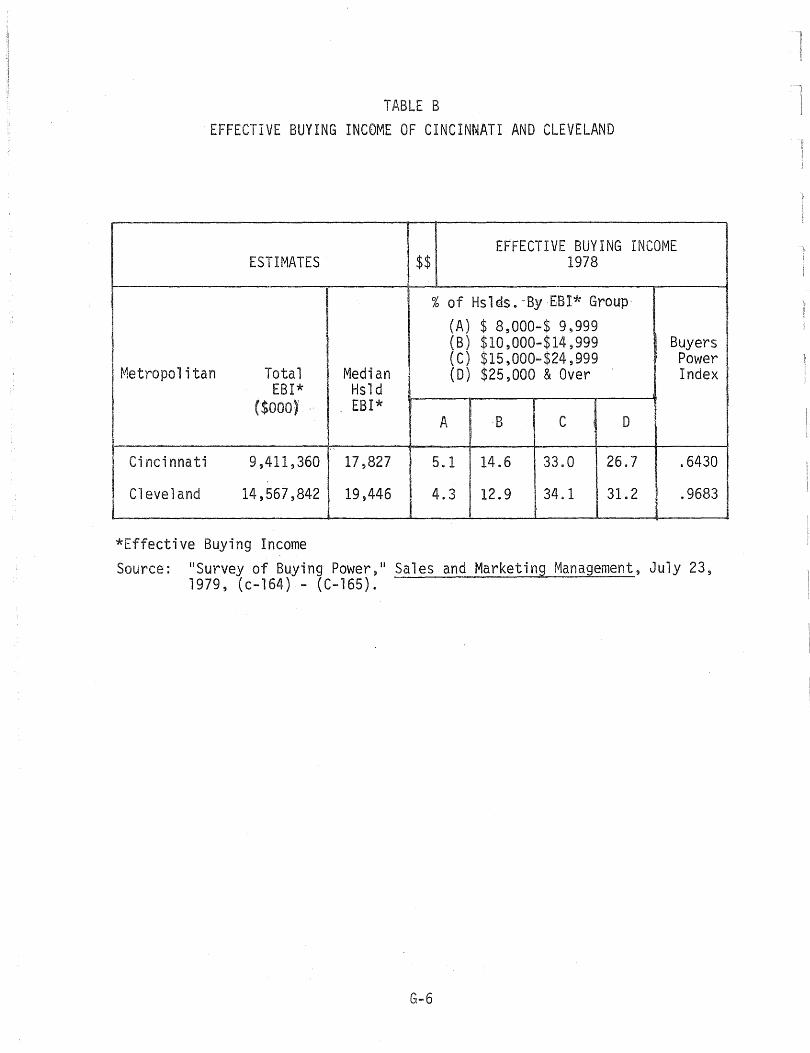
I
TABLE B EFFECTIVE BUYING INCOME OF CINCINNATI AND CLEVELAND
EFFECTIVE BUYING INCOME ESTIMATES $$ 1978
% of Hs 1 €Is. -ByEBI* Group' (A) $ 8,000-$ 9,999 (B) $10,000-$14,999 Buyers (C) $15~OOO-$24,999 Power
Metropolitan Total Median (D) $25,000 & Over Index EBI* Hsld
($OOO') EBI* A B C 0
Cincinnati 9,411,360 17,827 5.1 14.6 33.0 26.7 .6430
Cleveland 14,567,842 19,446 4.3 12.9 34.1 31.2 .9683
*Effective Buying Income Source: "Survey of Buying Power," Sales and Marketing Management, July 23,
1979, (c-164) - (C-165).
G-6