online hostel booking management information system
13
Australian Journal of Emergency Management 20 An information infrastructure for disaster management in Pacific island countries by Ken Granger, Australian Geological Survey Organisation DIRECTION COLLECTION PROCESSING DISSEMINATION ISSUE Figure 1: The information management cycle Introduction There is nothing more certain in the disaster management business than the fact that once a disaster starts to unfold, it is too late to start looking for the information needed to manage it. This paper 1 reports on a study into the information needs of disaster managers in Pacific Island Countries (PICs) and the nature of the information infrastructure needed to ensure delivery of that infor- mation. It addresses two key aspects. First, it provides a guide to follow by those engaged in disaster management and research in building their own project, national or regional disaster information collections. It is specifically targeted at the National Disaster Management Offi- cers (NDMO), regional agencies such as the South Pacific Applied Geoscience Commission (SOPAC) and aid donors. Second, it makes some observations on a range of technical and organisational issues, such as data formats, transfer standards and custodianship arrange- ments, that need to be considered in establishing and operating any modern information infrastructure. Key input to the study was gained through two workshops. The first was in Suva, Fiji, in October 1998 in conjunction with the 7 th IDNDR Pacific Regional Disaster Management Meeting and the second was held in Cairns in November 1998 in conjunction with a conference organised by the Centre for Disaster Studies at James Cook University. Data, information & knowledge Collections of data are raw material. They are of little value on their own, but begin to gain value when they are drawn together to create a body of information. Decisions can begin to be made once this has been done. Information, in turn, gains greater value and potency when it is integrated with other information (and experience) to generate knowledge. Sound decisions are based on knowledge. Wisdom, for disaster managers, emerges from learning the lessons of success and failure gained through managing actual disasters, and requires a store of know- ledge. It is clear that a large store of knowledge of disasters already exists in villages and communities throughout the Pacific. For modern disaster managers, it will need to be built through the formal analysis and assessment of actual events and the post-disaster debriefing process. One of the first systematic reviews of the need for information and the appli- cation of information technology in the disaster management field was under- taken by a subcommittee of the US Congress after the Mount Saint Helens volcano disaster of 1980 (US Congress 1983). That group described the develop- ment of ‘profiles of need’ and the identifi- cation of the ‘essential elements of information’ as integral parts of the information management process that lies at the heart of any information infrastructure. Information management Information management is a simple cyclical process with has four stages: direction, collection, processing (or collation) and dissemination (Figure 1). Direction The first steps in establishing any infor- mation management regime are to: • monitor the external environment to identify problems as they evolve and to be responsive to issues that are identi- fied from outside the ‘system’ • define the problems to be addressed • identify the information requirements that flow from them • identify who is to benefit from the information It is through this process that the elements of information and profiles of need discussed in the US Congress report (1983) are established and the broad nature of the information requirement becomes clear. Once the problem has been defined, the collection of information can be planned to satisfy the profiles of need and to assign responsibility for gathering and maintaining the infor- mation. In a disaster management context, delegation of responsibility for infor- mation collection and maintenance might parallel the responsibilities outlined in the disaster plan. For example, the agency with responsibility for the provision and management of emergency shelter would, as part of that, gather and maintain information on shelter resources and their status. Such an approach avoids the need to set up an information collection and management system completely separate from the disaster management system. A central point of control for directing the information management process is, none-the-less, needed within the disaster management process. This will need to interact with the wider local, provincial or national information management control arrangements to ensure that the disaster management information requi- rements and needs are adequately repre- sented in the wider process. Collection Implementation of the collection plan should focus on the essential elements of information that have been identified, with collection priorities flowing from the profiles of need. Working to the standards established by the directors of the information management system, infor- mation collectors need to employ all the data capture resources available to them. These include making use of existing information, which may have been developed for other purposes, such as land management or social planning, but which is also relevant to disaster manage- ment. Where data must be captured from scratch, remote-sensing technology, on satellites or aircraft, holds great potential in a disaster situation especially in remote areas, while global positioning systems (GPS) make accurate positioning very simple. The bulk of information collec-
-
Upload
independent -
Category
Documents
-
view
0 -
download
0
Transcript of online hostel booking management information system

Australian Journal of Emergency Management20
An information infrastructure for disastermanagement in Pacific island countries
by Ken Granger, Australian GeologicalSurvey Organisation
DIRECTION
COLLECTION
PROCESSING
DISSEMINATION
ISSUE
Figure 1: The information management cycle
IntroductionThere is nothing more certain in thedisaster management business than thefact that once a disaster starts to unfold, itis too late to start looking for theinformation needed to manage it.
This paper1 reports on a study into theinformation needs of disaster managersin Pacific Island Countries (PICs) and thenature of the information infrastructureneeded to ensure delivery of that infor-mation. It addresses two key aspects. First,it provides a guide to follow by thoseengaged in disaster management andresearch in building their own project,national or regional disaster informationcollections. It is specifically targeted atthe National Disaster Management Offi-cers (NDMO), regional agencies such asthe South Pacific Applied GeoscienceCommission (SOPAC) and aid donors.Second, it makes some observations on arange of technical and organisationalissues, such as data formats, transferstandards and custodianship arrange-ments, that need to be considered inestablishing and operating any moderninformation infrastructure.
Key input to the study was gainedthrough two workshops. The first was inSuva, Fiji, in October 1998 in conjunctionwith the 7th IDNDR Pacific RegionalDisaster Management Meeting and thesecond was held in Cairns in November1998 in conjunction with a conferenceorganised by the Centre for DisasterStudies at James Cook University.
Data, information & knowledgeCollections of data are raw material. Theyare of little value on their own, but beginto gain value when they are drawntogether to create a body of information.Decisions can begin to be made once thishas been done. Information, in turn, gainsgreater value and potency when it isintegrated with other information (andexperience) to generate knowledge.Sound decisions are based on knowledge.Wisdom, for disaster managers, emergesfrom learning the lessons of success andfailure gained through managing actualdisasters, and requires a store of know-ledge. It is clear that a large store ofknowledge of disasters already exists invillages and communities throughout thePacific. For modern disaster managers, it
will need to be built through the formalanalysis and assessment of actual eventsand the post-disaster debriefing process.
One of the first systematic reviews ofthe need for information and the appli-cation of information technology in thedisaster management field was under-taken by a subcommittee of the USCongress after the Mount Saint Helensvolcano disaster of 1980 (US Congress1983). That group described the develop-ment of ‘profiles of need’ and the identifi-cation of the ‘essential elements ofinformation’ as integral parts of theinformation management process thatlies at the heart of any informationinfrastructure.
Information managementInformation management is a simple
cyclical process with has four stages:direction, collection, processing (orcollation) and dissemination (Figure 1).
DirectionThe first steps in establishing any infor-mation management regime are to:• monitor the external environment to
identify problems as they evolve and tobe responsive to issues that are identi-fied from outside the ‘system’
• define the problems to be addressed• identify the information requirements
that flow from them• identify who is to benefit from the
informationIt is through this process that the
elements of information and profiles of
need discussed in the US Congress report(1983) are established and the broadnature of the information requirementbecomes clear. Once the problem hasbeen defined, the collection of informationcan be planned to satisfy the profiles ofneed and to assign responsibility forgathering and maintaining the infor-mation.
In a disaster management context,delegation of responsibility for infor-mation collection and maintenance mightparallel the responsibilities outlined in thedisaster plan. For example, the agencywith responsibility for the provision andmanagement of emergency shelter would,as part of that, gather and maintaininformation on shelter resources andtheir status. Such an approach avoids theneed to set up an information collectionand management system completelyseparate from the disaster managementsystem.
A central point of control for directingthe information management process is,none-the-less, needed within the disastermanagement process. This will need tointeract with the wider local, provincialor national information managementcontrol arrangements to ensure that thedisaster management information requi-rements and needs are adequately repre-sented in the wider process.
CollectionImplementation of the collection planshould focus on the essential elements ofinformation that have been identified,with collection priorities flowing from theprofiles of need. Working to the standardsestablished by the directors of theinformation management system, infor-mation collectors need to employ all thedata capture resources available to them.These include making use of existinginformation, which may have beendeveloped for other purposes, such asland management or social planning, butwhich is also relevant to disaster manage-ment.
Where data must be captured fromscratch, remote-sensing technology, onsatellites or aircraft, holds great potentialin a disaster situation especially in remoteareas, while global positioning systems(GPS) make accurate positioning verysimple. The bulk of information collec-
Autumn 2000 21
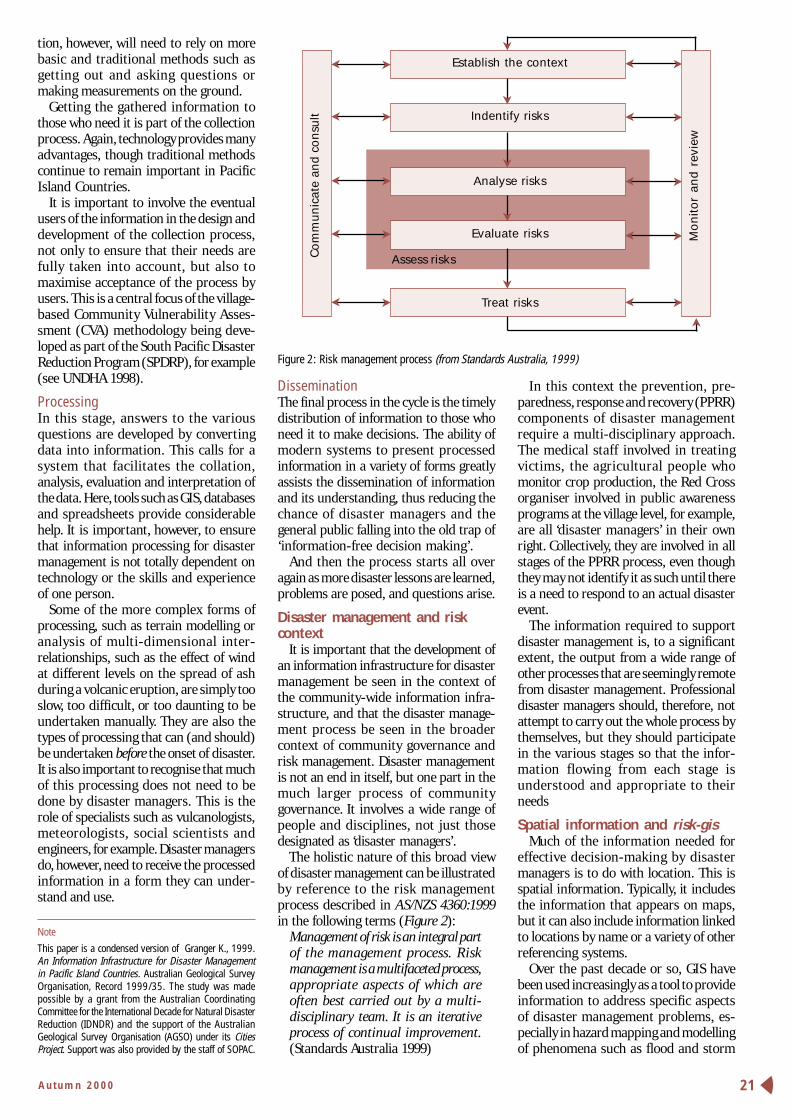
Figure 2: Risk management process (from Standards Australia, 1999)
tion, however, will need to rely on morebasic and traditional methods such asgetting out and asking questions ormaking measurements on the ground.
Getting the gathered information tothose who need it is part of the collectionprocess. Again, technology provides manyadvantages, though traditional methodscontinue to remain important in PacificIsland Countries.
It is important to involve the eventualusers of the information in the design anddevelopment of the collection process,not only to ensure that their needs arefully taken into account, but also tomaximise acceptance of the process byusers. This is a central focus of the village-based Community Vulnerability Asses-sment (CVA) methodology being deve-loped as part of the South Pacific DisasterReduction Program (SPDRP), for example(see UNDHA 1998).
ProcessingIn this stage, answers to the variousquestions are developed by convertingdata into information. This calls for asystem that facilitates the collation,analysis, evaluation and interpretation ofthe data. Here, tools such as GIS, databasesand spreadsheets provide considerablehelp. It is important, however, to ensurethat information processing for disastermanagement is not totally dependent ontechnology or the skills and experienceof one person.
Some of the more complex forms ofprocessing, such as terrain modelling oranalysis of multi-dimensional inter-relationships, such as the effect of windat different levels on the spread of ashduring a volcanic eruption, are simply tooslow, too difficult, or too daunting to beundertaken manually. They are also thetypes of processing that can (and should)be undertaken before the onset of disaster.It is also important to recognise that muchof this processing does not need to bedone by disaster managers. This is therole of specialists such as vulcanologists,meteorologists, social scientists andengineers, for example. Disaster managersdo, however, need to receive the processedinformation in a form they can under-stand and use.
DisseminationThe final process in the cycle is the timelydistribution of information to those whoneed it to make decisions. The ability ofmodern systems to present processedinformation in a variety of forms greatlyassists the dissemination of informationand its understanding, thus reducing thechance of disaster managers and thegeneral public falling into the old trap of‘information-free decision making’.
And then the process starts all overagain as more disaster lessons are learned,problems are posed, and questions arise.
Disaster management and riskcontext
It is important that the development ofan information infrastructure for disastermanagement be seen in the context ofthe community-wide information infra-structure, and that the disaster manage-ment process be seen in the broadercontext of community governance andrisk management. Disaster managementis not an end in itself, but one part in themuch larger process of communitygovernance. It involves a wide range ofpeople and disciplines, not just thosedesignated as ‘disaster managers’.
The holistic nature of this broad viewof disaster management can be illustratedby reference to the risk managementprocess described in AS/NZS 4360:1999in the following terms (Figure 2):
Management of risk is an integral partof the management process. Riskmanagement is a multifaceted process,appropriate aspects of which areoften best carried out by a multi-disciplinary team. It is an iterativeprocess of continual improvement.(Standards Australia 1999)
In this context the prevention, pre-paredness, response and recovery (PPRR)components of disaster managementrequire a multi-disciplinary approach.The medical staff involved in treatingvictims, the agricultural people whomonitor crop production, the Red Crossorganiser involved in public awarenessprograms at the village level, for example,are all ‘disaster managers’ in their ownright. Collectively, they are involved in allstages of the PPRR process, even thoughthey may not identify it as such until thereis a need to respond to an actual disasterevent.
The information required to supportdisaster management is, to a significantextent, the output from a wide range ofother processes that are seemingly remotefrom disaster management. Professionaldisaster managers should, therefore, notattempt to carry out the whole process bythemselves, but they should participatein the various stages so that the infor-mation flowing from each stage isunderstood and appropriate to theirneeds
Spatial information and risk-gisMuch of the information needed for
effective decision-making by disastermanagers is to do with location. This isspatial information. Typically, it includesthe information that appears on maps,but it can also include information linkedto locations by name or a variety of otherreferencing systems.
Over the past decade or so, GIS havebeen used increasingly as a tool to provideinformation to address specific aspectsof disaster management problems, es-pecially in hazard mapping and modellingof phenomena such as flood and storm
Establish the context
Indentify risks
Analyse risks
Evaluate risks
Treat risksC
om
mu
nic
ate
and
co
nsu
lt
Mo
nito
r an
d r
evie
w
Assess risks
Note
This paper is a condensed version of Granger K., 1999.An Information Infrastructure for Disaster Managementin Pacific Island Countries. Australian Geological SurveyOrganisation, Record 1999/35. The study was madepossible by a grant from the Australian CoordinatingCommittee for the International Decade for Natural DisasterReduction (IDNDR) and the support of the AustralianGeological Survey Organisation (AGSO) under its CitiesProject. Support was also provided by the staff of SOPAC.
Australian Journal of Emergency Management22
ISSUE IDENTIFICATION AND DIRECTION
DATA ACQUISITION
Hard copymaterial
Tabulardata
Vectordata
Rasterdata
DATA CAPTURE, CONVERSION & COLLATION
DBMS Vector datamanagement
Raster datamanagement
GIS
PROCESS MODELSspatial temporal
Existingmaterial
Tables, text,graphs
‘Dumb’maps
‘Smart’maps
Dynamicvisualisation
DISSEMINATION OF DIGESTED INFORMATION
Disastermanagers
Planners Engineers Others
COMMUNITY
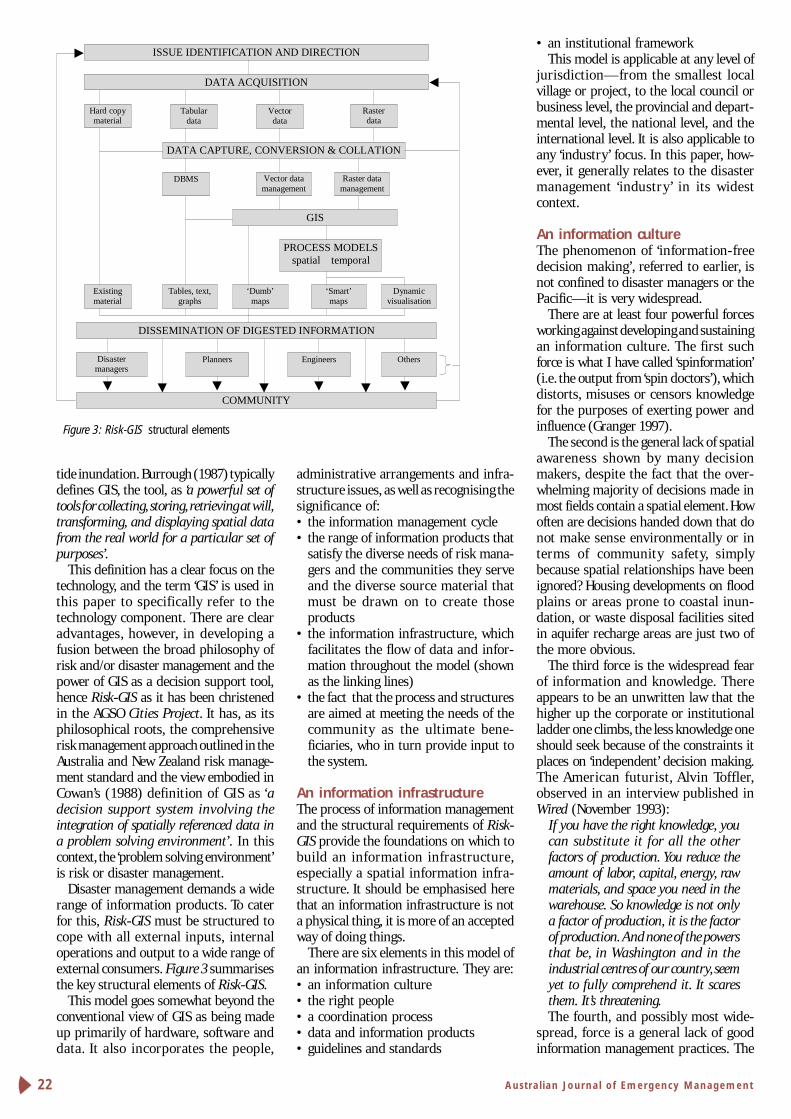
Figure 3: Risk-GIS structural elements
tide inundation. Burrough (1987) typicallydefines GIS, the tool, as ‘a powerful set oftools for collecting, storing, retrieving at will,transforming, and displaying spatial datafrom the real world for a particular set ofpurposes’.
This definition has a clear focus on thetechnology, and the term ‘GIS’ is used inthis paper to specifically refer to thetechnology component. There are clearadvantages, however, in developing afusion between the broad philosophy ofrisk and/or disaster management and thepower of GIS as a decision support tool,hence Risk-GIS as it has been christenedin the AGSO Cities Project. It has, as itsphilosophical roots, the comprehensiverisk management approach outlined in theAustralia and New Zealand risk manage-ment standard and the view embodied inCowan’s (1988) definition of GIS as ‘adecision support system involving theintegration of spatially referenced data ina problem solving environment’. In thiscontext, the ‘problem solving environment’is risk or disaster management.
Disaster management demands a widerange of information products. To caterfor this, Risk-GIS must be structured tocope with all external inputs, internaloperations and output to a wide range ofexternal consumers. Figure 3 summarisesthe key structural elements of Risk-GIS.
This model goes somewhat beyond theconventional view of GIS as being madeup primarily of hardware, software anddata. It also incorporates the people,
administrative arrangements and infra-structure issues, as well as recognising thesignificance of:• the information management cycle• the range of information products that
satisfy the diverse needs of risk mana-gers and the communities they serveand the diverse source material thatmust be drawn on to create thoseproducts
• the information infrastructure, whichfacilitates the flow of data and infor-mation throughout the model (shownas the linking lines)
• the fact that the process and structuresare aimed at meeting the needs of thecommunity as the ultimate bene-ficiaries, who in turn provide input tothe system.
An information infrastructureThe process of information managementand the structural requirements of Risk-GIS provide the foundations on which tobuild an information infrastructure,especially a spatial information infra-structure. It should be emphasised herethat an information infrastructure is nota physical thing, it is more of an acceptedway of doing things.
There are six elements in this model ofan information infrastructure. They are:• an information culture• the right people• a coordination process• data and information products• guidelines and standards
• an institutional frameworkThis model is applicable at any level of
jurisdiction—from the smallest localvillage or project, to the local council orbusiness level, the provincial and depart-mental level, the national level, and theinternational level. It is also applicable toany ‘industry’ focus. In this paper, how-ever, it generally relates to the disastermanagement ‘industr y’ in its widestcontext.
An information cultureThe phenomenon of ‘information-freedecision making’, referred to earlier, isnot confined to disaster managers or thePacific—it is very widespread.
There are at least four powerful forcesworking against developing and sustainingan information culture. The first suchforce is what I have called ‘spinformation’(i.e. the output from ‘spin doctors’), whichdistorts, misuses or censors knowledgefor the purposes of exerting power andinfluence (Granger 1997).
The second is the general lack of spatialawareness shown by many decisionmakers, despite the fact that the over-whelming majority of decisions made inmost fields contain a spatial element. Howoften are decisions handed down that donot make sense environmentally or interms of community safety, simplybecause spatial relationships have beenignored? Housing developments on floodplains or areas prone to coastal inun-dation, or waste disposal facilities sitedin aquifer recharge areas are just two ofthe more obvious.
The third force is the widespread fearof information and knowledge. Thereappears to be an unwritten law that thehigher up the corporate or institutionalladder one climbs, the less knowledge oneshould seek because of the constraints itplaces on ‘independent’ decision making.The American futurist, Alvin Toffler,observed in an interview published inWired (November 1993):
If you have the right knowledge, youcan substitute it for all the otherfactors of production. You reduce theamount of labor, capital, energy, rawmaterials, and space you need in thewarehouse. So knowledge is not onlya factor of production, it is the factorof production. And none of the powersthat be, in Washington and in theindustrial centres of our country, seemyet to fully comprehend it. It scaresthem. It’s threatening.The fourth, and possibly most wide-
spread, force is a general lack of goodinformation management practices. The
Autumn 2000 23
‘file and forget’ and the ‘why bother to file’approaches are said to be very much aliveand well in PICs—and elsewhere.
These barriers have got to be overcomebefore an information infrastructure canbecome a reality. Disaster managers needto remind themselves regularly of theobservation made by that other greatfuturist, Aldous Huxley, in his essay ProperStudies, that ‘facts do not cease to existbecause they are ignored.’
The right peopleGIS (the technology) is not a ‘black box’solution that only requires the rightbuttons to be pushed to obtain ‘the truth’.It requires people who not only unders-tand the technology of GIS and itsassociated systems, such as GPS andremote sensing, but who also understandthe real world problems they are trying tosolve with GIS (the disaster, naturalresource, planning, engineering andhuman services managers, for example).The ‘right’ people provide the input thatenergises the whole infrastructure. The‘right’ people are those who are competent,committed, cooperative and communi-cative.
Competent peopleCompetent people are those who haveand maintain the skills needed to do theirjob. This requires ongoing education andtraining, a fact well recognised in thedisaster management field.
Given the real-world, holistic nature ofdisaster management, as discussed earlier,and its place in community governanceprocesses, it is clear that professionaldisaster managers should, ideally, have abroad span of knowledge, but should theybe expected to have, for example, acompetency in, or understanding of thesciences associated with the varioushazard phenomena (geology, meteorology,hydrology, volcanology, etc); structural orcivil engineering; the demographic, social,economic and cultural aspects of thepeople that make up their communities;the psychology, sociology and politics ofdisaster; the logistic, communicationsand transport resources that support thecommunity; and/or all of these and more?
The Australian National EmergencyManagement Competency Standards(EMA 1995), developed for professionaland volunteer disaster managers, do nothelp to answer those questions definitively,but they do identify the need for emer-gency managers to be competent in theuse of (unspecified) information. Theycontain two explicit competency unitsrelating to information (Unit 10, Manageinformation, and Unit 11, Process infor-
mation). Both are ‘core’ (i.e. compulsory)competencies and are described in termsof the ‘processes of collecting, recording,verification, interpretation, structuring,collation and dissemination ofemergency management information’, i.e.they relate to the information cycledescribed previously.
The Australian competency standardalso contains reference to the use of GIS,as one of the activities under Unit 2, Assessvulnerability, a process described in thestandards as examining ‘the interactionof hazards, communities, agencies and theenvironment’.
There is another spectrum of com-petencies involving GIS. These range fromthe highly technical levels of professionalGIS analysts who have strong skills inprogramming and spatial modelling; tothose who use GIS to analyse spatial issuesas part of their core work; to those whosimply use GIS to display a map.
The Suva workshop clearly demon-strated that there is a good pool ofcompetent people ranging across thisspectrum of GIS use. At the professionaland applications end, most of these aregraduates from the University of SouthPacific (USP) in Suva, the PNG Universityof Technology (Unitech) in Lae or fromuniversities in Australia or New Zealand.USP offers a range of courses in discip-lines including earth science, geography,land management, sociology, populationstudies, environmental science andtourism. Some of these involve or caninclude training in the application of GIS.
While there may not be a large numberof NDMOs or their staff who have yetgained access to or experience in theapplication of GIS and other spatialtechnologies, there are certainly com-petent people available in most PICs toprovide that type of support to disastermanagers.
Committed peopleSkills alone do not guarantee a successfuluse of information or tools such as GIS(or indeed, disaster management). Thatrequires a strong measure of commitmentto the process involved. Again, it is clearthat there is a good resource of people inthe PICs who understand the issues andchallenges they are meeting in the GISand disaster management processes andwant to make a difference. They arededicated to solving the problems thatconfront their communities.
Communicative peopleCompetence and commitment are of littlevalue if the people with those attributesare not willing to pass on their knowledge.
In PICs, the widely dispersed populationand, at times, tenuous links call for specialefforts to be made to facilitate communi-cation. This requires the operation ofboth formal processes, such as workshopsand conferences; newsletters such asthose facilitated by SOPAC; and informalnetworks such as the GIS user groups thatexist in Suva and other centres.
Cooperative peopleIt is clear that no individual or organi-sation has all the answers, either in disastermanagement or in the use of GIS. Tomaximise the acknowledged benefits ofboth, it is essential that an environmentof cooperation both within organisationsand between organisations is stronglymaintained. There is clearly a strong levelof cooperation within and between thevarious NDMO organisations. That com-mitment is not, however, always experien-ced between organisations that develop,manage or look after spatial informationand GIS resources.
This situation is not peculiar to the PICs.In the multi-hazard risk assessmentundertaken by the AGSO Cities Project inCairns, data was assembled from at least35 different sources, most of whom, atthe time, did not share information withany of the others (Granger 1998). Somewere not even aware that the othersactually existed!
A coordination processPIC disaster managers clearly acknow-ledge that information is an essentialingredient to effective and sustainabledecision making at personal, organi-sational and jurisdictional levels. A cultureof information is well established in thiscommunity. The practice and experienceof using it, however, has yet to develop tothe same degree.
It is also clear that the informationneeded for decision making tends to bedeveloped, used and managed in an insularfashion (also by individuals and organi-sations), without much reference to others,who may have an interest in or need forthe same or very similar information.There are many instances of expensiveinformation collection programs beingundertaken by two or more differentagencies, more or less simultaneously andin the same community, without theknowledge of, or reference to, agencieswith similar needs.
There are solutions available to facilitatethe linkage of the many ‘islands’ ofinformation and thus break down thisinsularity. While many of these are builtround technology, the principles ofcoordination and cooperation, on which
Australian Journal of Emergency Management24
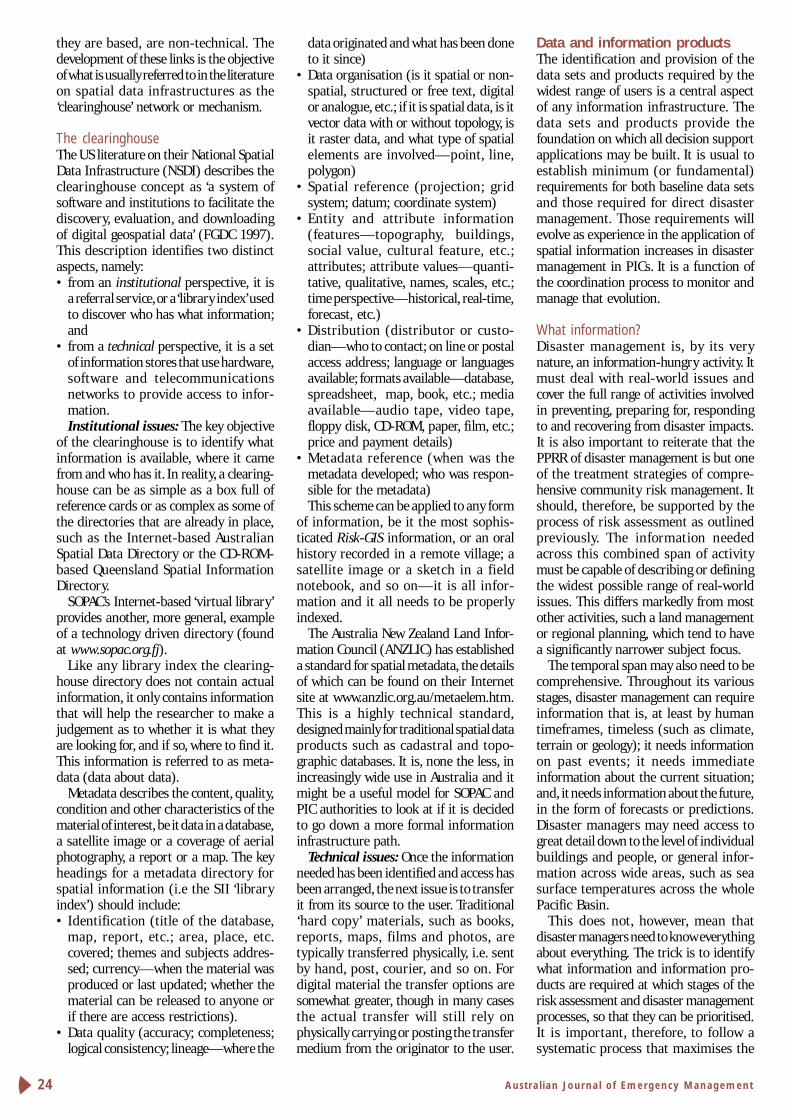
they are based, are non-technical. Thedevelopment of these links is the objectiveof what is usually referred to in the literatureon spatial data infrastructures as the‘clearinghouse’ network or mechanism.
The clearinghouseThe US literature on their National SpatialData Infrastructure (NSDI) describes theclearinghouse concept as ‘a system ofsoftware and institutions to facilitate thediscovery, evaluation, and downloadingof digital geospatial data’ (FGDC 1997).This description identifies two distinctaspects, namely:• from an institutional perspective, it is
a referral service, or a ‘library index’ usedto discover who has what information;and
• from a technical perspective, it is a setof information stores that use hardware,software and telecommunicationsnetworks to provide access to infor-mation.Institutional issues: The key objective
of the clearinghouse is to identify whatinformation is available, where it camefrom and who has it. In reality, a clearing-house can be as simple as a box full ofreference cards or as complex as some ofthe directories that are already in place,such as the Internet-based AustralianSpatial Data Directory or the CD-ROM-based Queensland Spatial InformationDirectory.
SOPAC’s Internet-based ‘virtual library’provides another, more general, exampleof a technology driven directory (foundat www.sopac.org.fj).
Like any library index the clearing-house directory does not contain actualinformation, it only contains informationthat will help the researcher to make ajudgement as to whether it is what theyare looking for, and if so, where to find it.This information is referred to as meta-data (data about data).
Metadata describes the content, quality,condition and other characteristics of thematerial of interest, be it data in a database,a satellite image or a coverage of aerialphotography, a report or a map. The keyheadings for a metadata directory forspatial information (i.e the SII ‘libraryindex’) should include:• Identification (title of the database,
map, report, etc.; area, place, etc.covered; themes and subjects addres-sed; currency—when the material wasproduced or last updated; whether thematerial can be released to anyone orif there are access restrictions).
• Data quality (accuracy; completeness;logical consistency; lineage—where the
data originated and what has been doneto it since)
• Data organisation (is it spatial or non-spatial, structured or free text, digitalor analogue, etc.; if it is spatial data, is itvector data with or without topology, isit raster data, and what type of spatialelements are involved—point, line,polygon)
• Spatial reference (projection; gridsystem; datum; coordinate system)
• Entity and attribute information(features—topography, buildings,social value, cultural feature, etc.;attributes; attribute values—quanti-tative, qualitative, names, scales, etc.;time perspective—historical, real-time,forecast, etc.)
• Distribution (distributor or custo-dian—who to contact; on line or postalaccess address; language or languagesavailable; formats available—database,spreadsheet, map, book, etc.; mediaavailable—audio tape, video tape,floppy disk, CD-ROM, paper, film, etc.;price and payment details)
• Metadata reference (when was themetadata developed; who was respon-sible for the metadata)This scheme can be applied to any form
of information, be it the most sophis-ticated Risk-GIS information, or an oralhistory recorded in a remote village; asatellite image or a sketch in a fieldnotebook, and so on—it is all infor-mation and it all needs to be properlyindexed.
The Australia New Zealand Land Infor-mation Council (ANZLIC) has establisheda standard for spatial metadata, the detailsof which can be found on their Internetsite at www.anzlic.org.au/metaelem.htm.This is a highly technical standard,designed mainly for traditional spatial dataproducts such as cadastral and topo-graphic databases. It is, none the less, inincreasingly wide use in Australia and itmight be a useful model for SOPAC andPIC authorities to look at if it is decidedto go down a more formal informationinfrastructure path.
Technical issues: Once the informationneeded has been identified and access hasbeen arranged, the next issue is to transferit from its source to the user. Traditional‘hard copy’ materials, such as books,reports, maps, films and photos, aretypically transferred physically, i.e. sentby hand, post, courier, and so on. Fordigital material the transfer options aresomewhat greater, though in many casesthe actual transfer will still rely onphysically carrying or posting the transfermedium from the originator to the user.
Data and information productsThe identification and provision of thedata sets and products required by thewidest range of users is a central aspectof any information infrastructure. Thedata sets and products provide thefoundation on which all decision supportapplications may be built. It is usual toestablish minimum (or fundamental)requirements for both baseline data setsand those required for direct disastermanagement. Those requirements willevolve as experience in the application ofspatial information increases in disastermanagement in PICs. It is a function ofthe coordination process to monitor andmanage that evolution.
What information?Disaster management is, by its verynature, an information-hungry activity. Itmust deal with real-world issues andcover the full range of activities involvedin preventing, preparing for, respondingto and recovering from disaster impacts.It is also important to reiterate that thePPRR of disaster management is but oneof the treatment strategies of compre-hensive community risk management. Itshould, therefore, be supported by theprocess of risk assessment as outlinedpreviously. The information neededacross this combined span of activitymust be capable of describing or definingthe widest possible range of real-worldissues. This differs markedly from mostother activities, such a land managementor regional planning, which tend to havea significantly narrower subject focus.
The temporal span may also need to becomprehensive. Throughout its variousstages, disaster management can requireinformation that is, at least by humantimeframes, timeless (such as climate,terrain or geology); it needs informationon past events; it needs immediateinformation about the current situation;and, it needs information about the future,in the form of forecasts or predictions.Disaster managers may need access togreat detail down to the level of individualbuildings and people, or general infor-mation across wide areas, such as seasurface temperatures across the wholePacific Basin.
This does not, however, mean thatdisaster managers need to know everythingabout everything. The trick is to identifywhat information and information pro-ducts are required at which stages of therisk assessment and disaster managementprocesses, so that they can be prioritised.It is important, therefore, to follow asystematic process that maximises the

Autumn 2000 25
Figure 4: Cities Project understanding of the risk management process
Table 1: Classification of hazards
efficiency of information managementand minimises duplication of informationcollection and, more importantly, gaps ininformation—hence the need for aninformation infrastructure.
Dividing the taskThere are many ways of systematicallydividing the task of information manage-ment. The scheme described here isbased on the experience we have gainedunder the AGSO Cities Project (Grangerand others 1999).
‘Risk’ is the outcome of the impact ofhazards on a community. The organi-sation of information can, therefore besplit between the two key factors:• the hazards and environments in which
they operate• the elements at risk and their charac-
teristics that make them more or lessvulnerable to disaster impact.This approach, however, does not take
account of the level of communityawareness and acceptance of risk that isan important component in risk com-munication and in the prioritisation ofrisk treatment options, and hence disastermanagement. This factor also needs to beincluded.
These components come together in theCities Project’s understanding of the riskmanagement process, and consequentlyour approach to information manage-ment. This is illustrated in Figure 4.
HazardsThe hazard phenomena that are mostrelevant in PICs can be divided into fourgroups, on the basis of their origin, asshown in Table 1.
Obviously, not all of these hazards areexperienced in all PICs. Frosts, forexample, are probably only an issue inPNG, whilst tropical cyclones are arelatively rare problem in PNG. Overall,however, most countries can potentiallybe affected by most of these hazards.
The information required by disastermanagers on hazard phenomena istypically confined to:• the history of hazard impacts and their
consequences• warnings or forecasts of an impending
hazard event• forecasts of the likely level of impact of
events of different probability (i.e.hazard scenarios).To provide that information on at least
the last two of these, however, hazardscientists require a wide range of data onthe respective phenomena and theenvironments they function in.
Hazard history: Information on thecommunity’s experience of hazard impacts
is, in my experience, perhaps the singlemost important resource that should beavailable to disaster managers. It repre-sents reality and helps to overcome theinherent problem that human memorytends to be significantly shorter than thereturn period of most hazard phenomena.
There are many sources for this infor-mation. The availability of well-managedcollections of such information, however,is highly variable and typically confinedto the larger PIC and internationalagencies, such as AGSO at www.agso.gov.au, the Australian Bureau of Meteo-rology at www.bom.gov.au, the NewZealand Institute for Geological andNuclear Sciences at www.gns.cri.nz, theUS Geological Survey at gldss7.cr.usgs.gov/neis/bulletin/bulletin.htm and the USNational Oceanographic and AtmosphericAdministration at www.ceos.noaa.gov.
Documentary records of disaster eventsin PICs can, in some areas, extend backto the mid-to-late 19th Century or (in rarecases) even as far back as the 16th Century.These records are found in the journalsof explorers, missionaries and othertravellers, official government reports andthrough contemporary press reports.
These reports are valuable because theyfrequently contain much information onthe consequences of the disaster and howthe affected community coped with theexperience, though they are largelypresented from the perspectives ofoutside observers.
Oral tradition, local myths and creationlegends can also provide evidence of suchevents. These records often containinformation on how the affected com-munity experienced the event and howthey responded. Typically, they areassociated with major events in specificnamed locations and can be of value as aguide to modern scientific investigation.
More detailed scientific records, espe-cially those in which instrument measure-ments are available, tend to date from the1940s at best. The availability of satellitedata on cyclones over much of the Pacificgenerally dates from the 1970s. Theinstrumental coverage of hazards such asearthquakes, volcanic eruptions, cyclones,severe storms and tsunamis is constantlyimproving, as is the number of resear-chers who take an interest in thosephenomena in the Pacific.
The ‘damage assessment workshops’
Atmospheric Earth Biological Human
tropical cyclones landslides human epidemics industrial accidents
tornadoes earthquakes plant epidemics transport accidents
storm surges tsunamis animal epidemics crime
floods volcanoes plagues political conflicts
frosts lahar bush fires structure failures
droughts erosion structure fire
severe storms ground failure contamination
Australian Journal of Emergency Management26
held in three PICs under the SPDRP in1997 and 1998 have established anexcellent framework on which to collectpost-event impact information. Thegeneric ‘initial damage report’ formsdeveloped for Cook Islands, Samoa andTonga, and the ‘drought assessment’ formsused in Fiji and Solomon Islands during1998, are very comprehensive. In the caseof Tonga, their form has been translatedinto Tongan and has been distributed toouter island District Officers. They wereused for the first time following CycloneCora in February 1999 (Angelika Planitz,SOPAC, personal communication).
It is, however, one thing to have theproforma in place, another to have it used,and yet another thing for the data collec-ted to be subsequently collated, analysedand preserved to ensure that the maxi-mum value can be gained from the effortof collecting it. At this stage completedforms tend to be accumulated at theNational Emergency Operation Centre inthe respective country.
It is worth observing that these proformaplace the PICs well ahead of most Aust-ralian jurisdictions, where there is a verypoor record of detailed and coordinatedpost-event studies. The most compre-hensive collection of post-event infor-mation for Australia is that collated by theNewcastle Region Library on the expe-rience of the 1989 earthquake in that city.It is a very good model for such collections.The Web site www.newcastle.infohunt.nsw.gov.au/librar y/eqdb/earthq.htmprovides details.
Warnings and forecasts: There are onlytwo hazard warning and forecastingservices that cover all PICs. They are theTropical Cyclone Warning Centre (TCWC)based in Nadi and the Pacific TsunamiWarning Centre (PTWC) based in Hawaii.The Pacific ENSO Applications Centre(PEAC) in Hawaii also provides forecastsof El Nino events, though their primaryclients are the US and former US Terri-tories. These centres have well-establishedprocedures and communications net-works to provide warning and tracking oftheir respective phenomena. Many of theactive volcanic centres close to populatedcentres are also monitored for activity, andwarnings of impending eruption areprovided. Perhaps the most compre-hensive of these is that centred on theRabaul Volcanological Observatory in PNG.
Apart from the system on Fiji’s RewaRiver, there appear to be no local flood-warning warning systems available in PIC.The dissemination of the warnings fromthe Rewa system to the communitiesunder threat relies on established tele-
communications systems, especiallybroadcast radio.
Hazard scenarios: Perhaps the mostfamiliar way of providing hazard infor-mation to disaster managers and othersis through the use of maps portraying theextent of the area likely to be affected byscenario events such as the ‘1:100 year’flood or storm tide, or the likely ash fallor blast areas for a given volcano. Theseare frequently referred to as ‘risk maps’,though they typically relate only to amodelled, or postulated, hazard scenario.
There are many hazard or site-specificstudies that contain hazard scenario (orprobability) information. These includean earthquake hazard assessment of Fiji(Jones 1997), seismic risk in the principaltowns of PNG (Gaull 1979), variousvolcanic disaster plans in PNG, SolomonIslands and Vanuatu and the Suva earth-quake risk management scenario pilotproject (SERMP) developed under SPDRP(Rynn 1997).
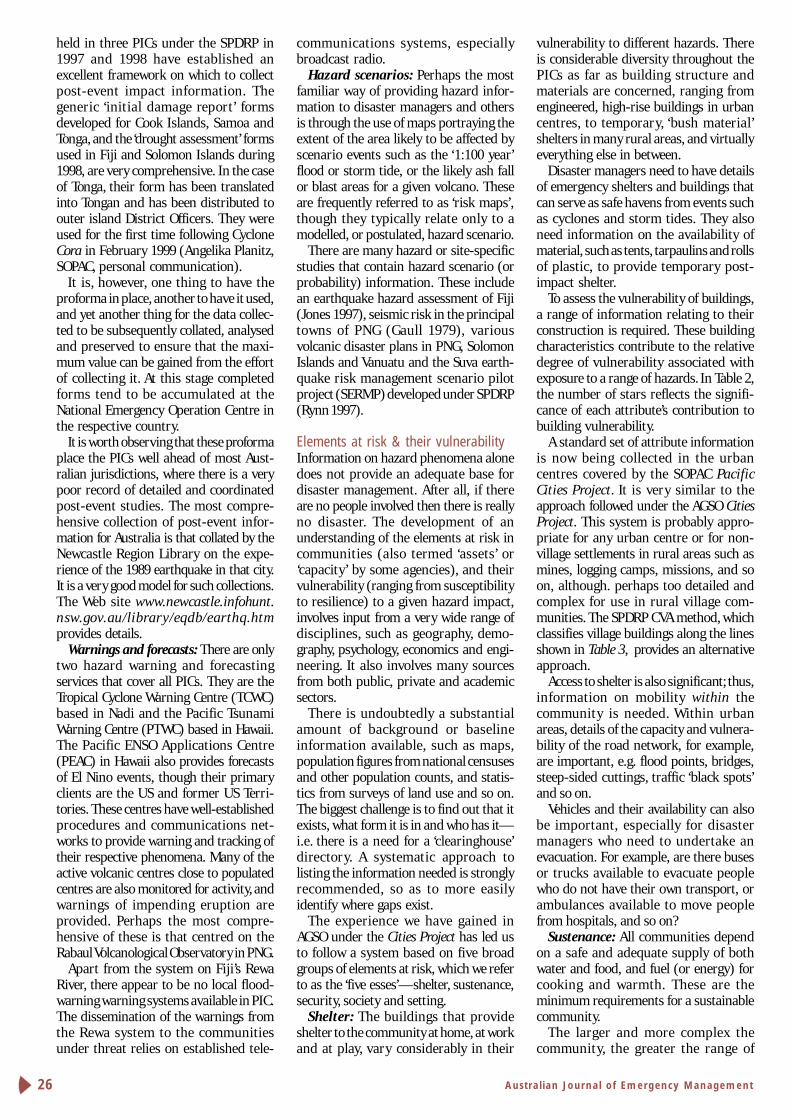
Elements at risk & their vulnerabilityInformation on hazard phenomena alonedoes not provide an adequate base fordisaster management. After all, if thereare no people involved then there is reallyno disaster. The development of anunderstanding of the elements at risk incommunities (also termed ‘assets’ or‘capacity’ by some agencies), and theirvulnerability (ranging from susceptibilityto resilience) to a given hazard impact,involves input from a very wide range ofdisciplines, such as geography, demo-graphy, psychology, economics and engi-neering. It also involves many sourcesfrom both public, private and academicsectors.
There is undoubtedly a substantialamount of background or baselineinformation available, such as maps,population figures from national censusesand other population counts, and statis-tics from surveys of land use and so on.The biggest challenge is to find out that itexists, what form it is in and who has it—i.e. there is a need for a ‘clearinghouse’directory. A systematic approach tolisting the information needed is stronglyrecommended, so as to more easilyidentify where gaps exist.
The experience we have gained inAGSO under the Cities Project has led usto follow a system based on five broadgroups of elements at risk, which we referto as the ‘five esses’—shelter, sustenance,security, society and setting.
Shelter: The buildings that provideshelter to the community at home, at workand at play, vary considerably in their
vulnerability to different hazards. Thereis considerable diversity throughout thePICs as far as building structure andmaterials are concerned, ranging fromengineered, high-rise buildings in urbancentres, to temporary, ‘bush material’shelters in many rural areas, and virtuallyeverything else in between.
Disaster managers need to have detailsof emergency shelters and buildings thatcan serve as safe havens from events suchas cyclones and storm tides. They alsoneed information on the availability ofmaterial, such as tents, tarpaulins and rollsof plastic, to provide temporary post-impact shelter.
To assess the vulnerability of buildings,a range of information relating to theirconstruction is required. These buildingcharacteristics contribute to the relativedegree of vulnerability associated withexposure to a range of hazards. In Table 2,the number of stars reflects the signifi-cance of each attribute’s contribution tobuilding vulnerability.
A standard set of attribute informationis now being collected in the urbancentres covered by the SOPAC PacificCities Project. It is very similar to theapproach followed under the AGSO CitiesProject. This system is probably appro-priate for any urban centre or for non-village settlements in rural areas such asmines, logging camps, missions, and soon, although. perhaps too detailed andcomplex for use in rural village com-munities. The SPDRP CVA method, whichclassifies village buildings along the linesshown in Table 3, provides an alternativeapproach.
Access to shelter is also significant; thus,information on mobility within thecommunity is needed. Within urbanareas, details of the capacity and vulnera-bility of the road network, for example,are important, e.g. flood points, bridges,steep-sided cuttings, traffic ‘black spots’and so on.
Vehicles and their availability can alsobe important, especially for disastermanagers who need to undertake anevacuation. For example, are there busesor trucks available to evacuate peoplewho do not have their own transport, orambulances available to move peoplefrom hospitals, and so on?
Sustenance: All communities dependon a safe and adequate supply of bothwater and food, and fuel (or energy) forcooking and warmth. These are theminimum requirements for a sustainablecommunity.
The larger and more complex thecommunity, the greater the range of

Autumn 2000 27
Table 2: Relative contribution of building characteristics to vulnerability
infrastructures and services that havebeen established to sustain it. Modernurban communities are highly dependenton their utility infrastructures such aswater and power supplies, sewerage, andtelecommunications. These so-calledlifelines, in turn, depend on each otherand other logistic resources, such as fuelsupply.
Power supply and telecommunicationsare overwhelmingly the most importantof all lifeline assets in terms of whatdepends on them, followed closely by fuelsupply, bridges, roads and water supply.Their significance to community sus-tainability, however, may be somewhatdifferent; e.g. people cannot survive forlong without a safe water supply, but theycan survive (albeit with some incon-venience) without the telephone, fuel, lightand even power for some time. Ports,airports and fuel supply are the mostexposed in terms of their dependence onthe widest range of other lifelines.
In most PIC villages, supplies of lightingkerosene and fuel can, to some extent,replace dependence on power, whilstwater sources such as roof catchment,wells and streams substitute for a reticu-lated water supply. In village communitiesthe sources of food can be very diverse,ranging from garden crops and fishing toanimals (such as pigs and cattle) and ‘bushtucker’ gathered from the surroundingcountryside. The availability of these maybe seasonal and in some communitiesthere may be traditional methods of foodstorage to cover times of hardship or tocover the seasons when produce is inshort supply. A good knowledge of thesefood sources and their susceptibility tohazards, such as drought, frost or pests, isevery bit as important as a knowledge ofthe availability of rice and tinned fish inan urban warehouse.
Security: The security of the com-munity can be measured in terms of itshealth and wealth and by the forms ofprotection that are provided.
To establish a better understanding ofhealth factors, information is needed on:• hospitals, nursing homes, clinics, aid
posts, doctors, nurses, dentists, x-rayservices, etc.
• endemic diseases and efforts to controlthem, e.g. inoculation and screeningcampaigns
• demographic characteristics, such asthe very young (under 5) and elderly(over 60 or 65)
• disabilities that reduce mobility or acapacity to cope with disaster andpeople who need to be accompaniedby carers.
To better understand economic factors,information is needed on:• the primary industries, such as com-
mercial crops and grazing, mining,fisheries, etc.
• basic processing industries, such assawmills, abattoirs, copra mills, basicore treatment, fish processing plants,etc.
• other secondary industries, such as shipbuilding, concrete batching plants andconstruction industries
• principal tertiary industries, includingbanks, insurance, clothing and footwearmanufacture, crafts, tourist industry,repair services, etc.
• the degree of dependence on subsis-tence agriculture and fishing, i.e. thesignificance of the informal economy
• in the more formal economy, infor-mation on issues such as household
income, unemployment and homeownership may be relevant
To better understand protection factors,information is needed on:• ambulance stations, fire stations, police
stations, defence force posts, etc.• engineered works, such as flood deten-
tion basins, levees, sea walls, etc.• traditional defences, such as mangrove
belts to protect the coastline, etc.• contact details for hazard specialists,
such as meteorologists, geologists,engineers, etc.
• contact details for key emergencyservices staff, including disaster mana-gers, police, fire service, military, etc.
• the resources available at the fire andpolice stations and military posts
• local, district and national disasterplans.It is particularly important to identify
Characteristic Flood1 Wind Fire Quake Volc2
Building age *** ***** ***** ***** ****Floor height or vertical regularity ***** * **** ***** ***Wall material *** *** ***** **** **Roof material **** ***** **** ****Roof pitch **** * *****Large unprotected windows ** ***** ***** ** ***Unlined eaves *** *****Number of stories **** ** * ***** *Plan regularity ** ** *** ***** ***Topography ***** **** **** *** ****1 Includes all forms of inundation hazard including storm surge and tsunami.2 Volcanic hazards including ash fall and blast.
Table 3: Example of a model building classification for village communities(based on UNDHA, 1998, Table 5.9, p. 39)
Type of building Use Material
Timber house class A Family Sawn timber, nails, fibro walls, corrugated iron roof
Timber house class B Family Bush timber, nails and bush rope, corrugated iron
Timber house class C Family Bush timber, bush rope, matting walls, thatch roof
Concrete block house Family Concrete block walls, corrugated iron roof
Kitchen shed Cooking Round poles, thatch roof
Toilet Toilet Round poles, matting walls, corrugated iron roof
Community hall Meetings Concrete frame and block walls, corrugated iron roof
School classroom School Sawn timber, fibro walls, corrugated iron roof
Church Meetings Concrete frame and block walls, corrugated iron roof
Note: The CVA methodology envisages such a classification be developed specifically for eachcommunity.

Australian Journal of Emergency Management28
those facilities and services, the loss ofwhich would magnify the impact of thedisaster on the affected community. These‘critical’ facilities, such as hospitals anddisaster management headquarters, maycall for additional protection or planningbecause of their significance to the widercommunity.
Society: Here we find most of the moreintangible, non-physical factors, such aslanguage, ethnicity, religion, nationality,community and welfare groups, edu-cation, disaster awareness, custom andcultural activities, and so on. These arethe aspects that define the social fabric ofthe community and the degree to whichcommunities, families and individuals arelikely to be susceptible or resilient to theimpact of disaster.
Information required to better defineand describe the social environment ofthe community can include considerationof:• community and official languages and
the levels of literacy in those languages• ethnic and racial groups and their inter-
relationships, tensions, etc.• religions represented in the community
and their inter-relationships, tensions,etc.
• cultural, social or religious constraintssuch as dietary restrictions, funeralrequirements, cultural taboos, etc.
• representation by NGOs such as RedCross, Saint Vincents, etc.
• contact details for key community andwelfare staff such as ministers/priests/pastors, NGOs, business leaders, tea-chers, parliamentarians, local coun-cillors, etc.
• contact details for traditional leaderssuch as chiefs and other custom leadersand community elders
• levels and availability of education andthe contact details of teachersSome of this information may be
available from the periodic censusesconducted nationally. However, the moredetailed information will rely very heavilyon site-specific studies, such as thoseenvisaged under the CVA methodology.
Setting: To place communities in abroader spatial and disaster managementcontext it is beneficial to develop infor-mation on factors, including:• the broad regional physical environ-
ment (climate, vegetation, geology, soils,land use, topography, elevation, etc.)
• population distribution and basicdemographic information
• external access, including links by road,rail, air, sea and telecommunicationsinfrastructures; the services that pro-vide that access, such as postal services,
airline and shipping service schedules,charter services, radio broadcast pro-gramming, etc.
• external sources of power and watersupply, such as remote hydro-electricand water supply dams
• administrative arrangements, includinglocal government, suburb, police dist-rict, electoral and other administrativeboundaries
• legal arrangements such as cadastre andland tenure.The broad administrative arrange-
ments under which disaster managementservices are provided (while well knownto insiders such as NDMOs) also need tobe well documented, especially foroutsiders.
Community awareness and riskacceptancePIC communities are said to have a goodlevel of awareness of the hazards thatcould have an impact on them. Certainly,where such events are fairly common(such as cyclones) or more obvious (suchas an active volcano), a strong level ofawareness is clearly the case. Where eventsare less frequent, such as tsunami andmajor earthquake, the level of awarenessis less well developed. For communities totake active steps to reduce risks, they mustobviously be aware that the risk exists andis real. This is central to determining issuessuch as risk tolerance or risk acceptance.To a large degree this is a key output of therisk assessment process.
In the approach to risk assessment setout in the Australia New Zealand riskmanagement standard (Standards Aust-ralia 1999), it is the practice to comparethe level of risk found during the assess-ment process with previously establishedrisk criteria, so that it can be judgedwhether the risk is ‘acceptable’ or not. Theacceptability factor is central to theprocess of risk prioritisation, and hencethe development of appropriate treat-ment strategies, including disaster plans.This is the first step in the allocation ofresources to risk mitigation, especially ifconsidered in a multi-hazard context.Under the AGSO Cities Project, and withour SOPAC Pacific Cities Project collea-gues, we are beginning to address thecomplex issue of comparing the risksposed by hazards with greatly differentimpact potential. In many coastal areas,for example, there is often a strong spatialcorrelation between the areas that aremost at risk from major inundationhazards (river flooding, storm tide andtsunami) and those in which deep softsediments are most likely to maximise
earthquake impact. Conversely these arethe areas that are at least risk fromlandslide impact and, to some degree,from severe wind impact. These issuesare, to a degree, able to be addressedscientifically by computing probabilitiesand modelling Risk-GIS scenario impacts,and so on.
This scientific approach, however, doesnot really tell us what the communityunderstands about the risks of disasterimpact and how they believe those risksmight be treated. It is here that thecommunity consultation process embed-ded in the CVA approach really comes intoits own. There are very few examples inthe international literature to serve as aguide to what type of questions need to beanswered in this process. One of the few Ihave encountered is the work undertakenin Cairns by Linda Berry of James CookUniversity. Her report (Berry 1996) in-cludes a copy of the questionnaire used tosurvey some 600 Cairns householdsregarding their understanding of the riskof storm surge and their preparedness tocope. While that questionnaire would needto be modified for use in PICs, it providesan excellent starting point.
Observations: During the Suva work-shop, PIC disaster managers were askedto complete a survey that asked them torate a comprehensive range of topicsaccording to their perceived need forinformation on those topics. The themesidentified as being needed by more than75% of respondents were:• hazard history (details of previous
earthquake, landslide, flood, cyclones,severe storms, drought etc.)
• population (census and estimates ofnumbers, age, sex, etc.)
• settlement type (city, town, village,hamlet, etc. names and locality)
• settlement structures (houses shops,schools, resorts, etc.)
• health services (hospitals, doctors,clinics, dentists, ambulance, etc.)
• welfare services (Red Cross, St Vincents,NGOs, etc.)
• agriculture (subsistence & other crops,livestock, storage, etc.)
• roads and streets (surface, capacity,bridges, etc.)
• telecommunications (phone, radio, TV,Web, mobile phone, etc)
• water supply (source, storage, treatment,reticulation, etc.)
• technical experts (GIS & computer staff,plant operators, builders, etc.)This result is remarkably similar to the
results of a similar survey I conductedwithin the police and emergency serviceagencies in Queensland in 1991.
Autumn 2000 29
Both surveys reflected a strong biastowards a response culture, rather thanembracing a broader risk managementculture. They also convey to me that thereis an expectation that extra informationwill be provided by other agencies should,or when, the disaster managers need it. Isuggest this is a very hazardous approachto disaster management, let alone riskmanagement, unless those agencies thatare expected to hold and manage that‘extra’ information see themselves as partof the disaster management process andare aware of the requirements of disastermanagers for their information.
As stated at the beginning of this paper,there is nothing more certain in thedisaster management business than thefact that once a disaster starts to unfold, itis too late to start looking for theinformation needed to manage it. Therisk management process tends to over-come this potential problem becausemuch of the information needed tomanage disasters has already beendeveloped in the risk assessment processand is in a form best suited to the needsof disaster managers.
National guidelines and standardsTo maximise the integration and exchangeof spatial data it is necessary to establisha range of standards and guidelines as anintegral part of the information infra-structure. Some of the more technicalstandards, such as the implementation ofthe national or regional spatial datum(such as WGS 84) may be mandated bylegislation, whilst others may be estab-lished by default (e.g. through the wide-spread use of a specific GIS, such asMapInfo). The guidelines and standardsdeveloped will need to cover transferstandards (detailed technical standardsto enable data to be moved from one GISenvironment to another without loss ofinformation); geographic guidelines andstandards (coordinate systems andprojections, location keys, such as prop-erty address; attribute content andclassification standards (e.g. standard soilor vegetation classifications); algorithmguidelines and standards to cover compu-tational operations of GIS such as slopeanalysis or DEM generation; and inter-pretation guidelines and standards tocover aspects of accuracy, uncertaintystatements, descriptions of ground truth-ing and so on.
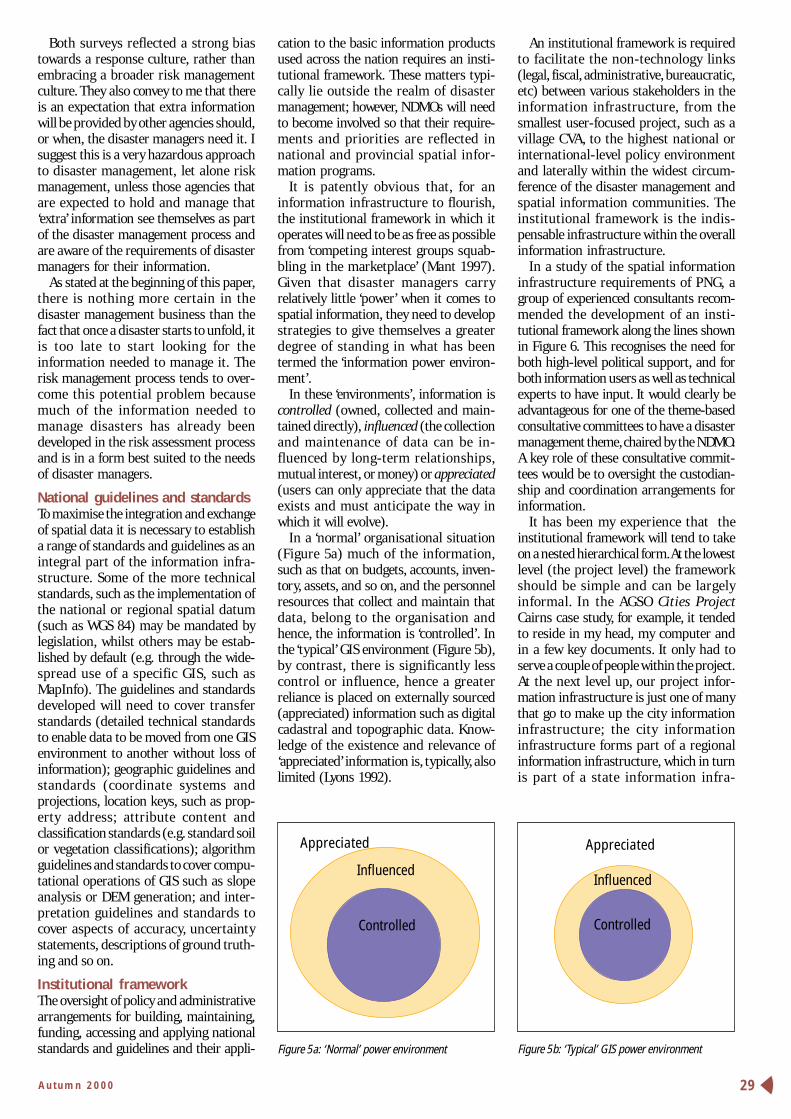
Institutional frameworkThe oversight of policy and administrativearrangements for building, maintaining,funding, accessing and applying nationalstandards and guidelines and their appli- Figure 5a: ‘Normal’ power environment
cation to the basic information productsused across the nation requires an insti-tutional framework. These matters typi-cally lie outside the realm of disastermanagement; however, NDMOs will needto become involved so that their require-ments and priorities are reflected innational and provincial spatial infor-mation programs.
It is patently obvious that, for aninformation infrastructure to flourish,the institutional framework in which itoperates will need to be as free as possiblefrom ‘competing interest groups squab-bling in the marketplace’ (Mant 1997).Given that disaster managers carryrelatively little ‘power’ when it comes tospatial information, they need to developstrategies to give themselves a greaterdegree of standing in what has beentermed the ‘information power environ-ment’.
In these ‘environments’, information iscontrolled (owned, collected and main-tained directly), influenced (the collectionand maintenance of data can be in-fluenced by long-term relationships,mutual interest, or money) or appreciated(users can only appreciate that the dataexists and must anticipate the way inwhich it will evolve).
In a ‘normal’ organisational situation(Figure 5a) much of the information,such as that on budgets, accounts, inven-tory, assets, and so on, and the personnelresources that collect and maintain thatdata, belong to the organisation andhence, the information is ‘controlled’. Inthe ‘typical’ GIS environment (Figure 5b),by contrast, there is significantly lesscontrol or influence, hence a greaterreliance is placed on externally sourced(appreciated) information such as digitalcadastral and topographic data. Know-ledge of the existence and relevance of‘appreciated’ information is, typically, alsolimited (Lyons 1992).
An institutional framework is requiredto facilitate the non-technology links(legal, fiscal, administrative, bureaucratic,etc) between various stakeholders in theinformation infrastructure, from thesmallest user-focused project, such as avillage CVA, to the highest national orinternational-level policy environmentand laterally within the widest circum-ference of the disaster management andspatial information communities. Theinstitutional framework is the indis-pensable infrastructure within the overallinformation infrastructure.
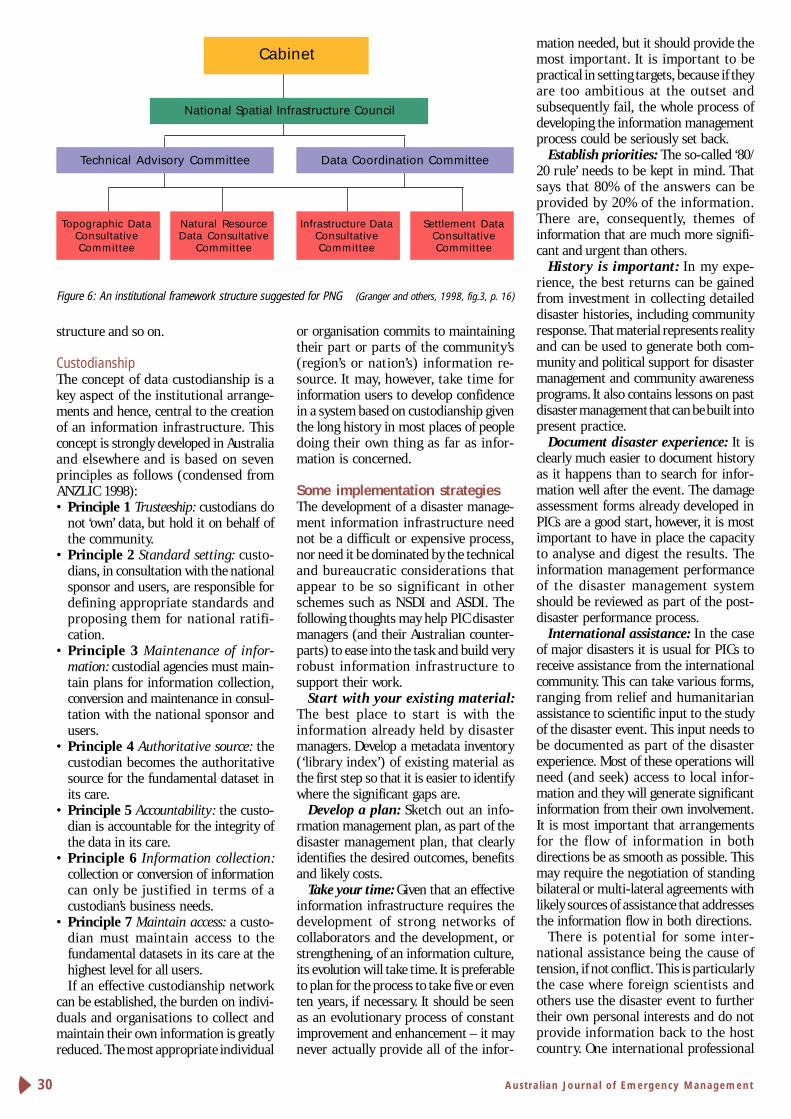
In a study of the spatial informationinfrastructure requirements of PNG, agroup of experienced consultants recom-mended the development of an insti-tutional framework along the lines shownin Figure 6. This recognises the need forboth high-level political support, and forboth information users as well as technicalexperts to have input. It would clearly beadvantageous for one of the theme-basedconsultative committees to have a disastermanagement theme, chaired by the NDMO.A key role of these consultative commit-tees would be to oversight the custodian-ship and coordination arrangements forinformation.
It has been my experience that theinstitutional framework will tend to takeon a nested hierarchical form. At the lowestlevel (the project level) the frameworkshould be simple and can be largelyinformal. In the AGSO Cities ProjectCairns case study, for example, it tendedto reside in my head, my computer andin a few key documents. It only had toserve a couple of people within the project.At the next level up, our project infor-mation infrastructure is just one of manythat go to make up the city informationinfrastructure; the city informationinfrastructure forms part of a regionalinformation infrastructure, which in turnis part of a state information infra-
Appreciated
Influenced
Controlled
Appreciated
Influenced
Controlled
Figure 5b: ‘Typical’ GIS power environment
Australian Journal of Emergency Management30
structure and so on.
CustodianshipThe concept of data custodianship is akey aspect of the institutional arrange-ments and hence, central to the creationof an information infrastructure. Thisconcept is strongly developed in Australiaand elsewhere and is based on sevenprinciples as follows (condensed fromANZLIC 1998):• Principle 1 Trusteeship: custodians do
not ‘own’ data, but hold it on behalf ofthe community.
• Principle 2 Standard setting: custo-dians, in consultation with the nationalsponsor and users, are responsible fordefining appropriate standards andproposing them for national ratifi-cation.
• Principle 3 Maintenance of infor-mation: custodial agencies must main-tain plans for information collection,conversion and maintenance in consul-tation with the national sponsor andusers.
• Principle 4 Authoritative source: thecustodian becomes the authoritativesource for the fundamental dataset inits care.
• Principle 5 Accountability: the custo-dian is accountable for the integrity ofthe data in its care.
• Principle 6 Information collection:collection or conversion of informationcan only be justified in terms of acustodian’s business needs.
• Principle 7 Maintain access: a custo-dian must maintain access to thefundamental datasets in its care at thehighest level for all users.If an effective custodianship network
can be established, the burden on indivi-duals and organisations to collect andmaintain their own information is greatlyreduced. The most appropriate individual
or organisation commits to maintainingtheir part or parts of the community’s(region’s or nation’s) information re-source. It may, however, take time forinformation users to develop confidencein a system based on custodianship giventhe long history in most places of peopledoing their own thing as far as infor-mation is concerned.
Some implementation strategiesThe development of a disaster manage-ment information infrastructure neednot be a difficult or expensive process,nor need it be dominated by the technicaland bureaucratic considerations thatappear to be so significant in otherschemes such as NSDI and ASDI. Thefollowing thoughts may help PIC disastermanagers (and their Australian counter-parts) to ease into the task and build veryrobust information infrastructure tosupport their work.
Start with your existing material:The best place to start is with theinformation already held by disastermanagers. Develop a metadata inventory(‘library index’) of existing material asthe first step so that it is easier to identifywhere the significant gaps are.
Develop a plan: Sketch out an info-rmation management plan, as part of thedisaster management plan, that clearlyidentifies the desired outcomes, benefitsand likely costs.
Take your time: Given that an effectiveinformation infrastructure requires thedevelopment of strong networks ofcollaborators and the development, orstrengthening, of an information culture,its evolution will take time. It is preferableto plan for the process to take five or eventen years, if necessary. It should be seenas an evolutionary process of constantimprovement and enhancement – it maynever actually provide all of the infor-
mation needed, but it should provide themost important. It is important to bepractical in setting targets, because if theyare too ambitious at the outset andsubsequently fail, the whole process ofdeveloping the information managementprocess could be seriously set back.
Establish priorities: The so-called ‘80/20 rule’ needs to be kept in mind. Thatsays that 80% of the answers can beprovided by 20% of the information.There are, consequently, themes ofinformation that are much more signifi-cant and urgent than others.
History is important: In my expe-rience, the best returns can be gainedfrom investment in collecting detaileddisaster histories, including communityresponse. That material represents realityand can be used to generate both com-munity and political support for disastermanagement and community awarenessprograms. It also contains lessons on pastdisaster management that can be built intopresent practice.
Document disaster experience: It isclearly much easier to document historyas it happens than to search for infor-mation well after the event. The damageassessment forms already developed inPICs are a good start, however, it is mostimportant to have in place the capacityto analyse and digest the results. Theinformation management performanceof the disaster management systemshould be reviewed as part of the post-disaster performance process.
International assistance: In the caseof major disasters it is usual for PICs toreceive assistance from the internationalcommunity. This can take various forms,ranging from relief and humanitarianassistance to scientific input to the studyof the disaster event. This input needs tobe documented as part of the disasterexperience. Most of these operations willneed (and seek) access to local infor-mation and they will generate significantinformation from their own involvement.It is most important that arrangementsfor the flow of information in bothdirections be as smooth as possible. Thismay require the negotiation of standingbilateral or multi-lateral agreements withlikely sources of assistance that addressesthe information flow in both directions.
There is potential for some inter-national assistance being the cause oftension, if not conflict. This is particularlythe case where foreign scientists andothers use the disaster event to furthertheir own personal interests and do notprovide information back to the hostcountry. One international professional
Cabinet
National Spatial Infrastructure Council
Technical Advisory Committee Data Coordination Committee
Topographic DataConsultativeCommittee
Natural ResourceData Consultative
Committee
Infrastructure DataConsultativeCommittee
Settlement DataConsultativeCommittee
Figure 6: An institutional framework structure suggested for PNG (Granger and others, 1998, fig.3, p. 16)
Autumn 2000 31
scientific association has seen the needto publish a protocol that sets outguidelines for professional conduct indisaster events for its members (IAVCEI1999). This is a valuable and long overdueinitiative.
Establish networks: The disastermanagement process can become ratherisolated and inward looking, especially ifit is not activated regularly. It can bedifficult to maintain the level of ‘profile’that guarantees attention or attractssupport. That inevitably has an impacton the degree to which informationmanagement and disaster researchprograms can attract support. The deve-lopment of partnerships with key datacustodians and research agencies is,therefore, very important. Similarly, it isimportant to involve as wide a crosssection of stakeholders as possible in theprocess. By involving agencies or busi-nesses that control critical facilities suchas hospitals, power supply or fuel supply,for example, in the total process, thechances of gaining access to theirinformation and political support isgreatly enhanced. NDMOs should aim toplace themselves at the centre of theirown web of networks, rather than beingon the edge of everyone else’s network.
Apply appropriate technology: Whilstthe ultimate objective may be to employRisk-GIS and other computer decisionsupport tools, it is not necessary to havesuch technology in place before startingto either use information or to build aninformation infrastructure. Hard copymaps, manuals, reports and so on, willalways be needed and used, regardless ofhow many computers are available. Thisis particularly the case with field opera-tions under disaster conditions becausecomputers may not be available or reliableunder those circumstances. It is impor-tant, however, that the hard copy materialprovided is the most accurate and currentavailable—hopefully produced from GISand so on.
Information packaging: Not everyoneneeds access to all of the availableinformation. It is, therefore, helpful todesign specific information products orpackages of products tailored for par-ticular users. Agencies that have specifiedroles under the disaster management plan,be it transport and logistics, health, welfareand so on, should identify their require-ments for information products as partof the overall disaster managementinformation infrastructure developmentprocess. Those separate products, how-ever, must be produced from the commonset of core information to ensure that all
participants are ‘singing from the samesheet of music’.
By following the scenario modellingapproach to risk assessment it is alsopossible to develop specific packages ofinformation relating to various disasterscenarios (e.g. different flood heights)and to have them prepared before thedisaster strikes.
Use case studies: It is much easier to‘sell’ the message of information andinformation infrastructures if theirbenefits can be demonstrated in a real-world case study. Having a worked-through example to demonstrate is farmore believable than a ‘dummy’ orartificial example. It is also human natureto want what the neighbour has, so beingable to demonstrate what one village ortown has done and the advantages thatthey have gained, tends to stimulate othervillages and towns to want the sameadvantages. Case studies are also veryuseful for disaster managers to share theirexperiences and to exchange ideas thatmight be useful in other areas. The workcompleted by the Pacific Cities Project inestablishing a broadly based informationinfrastructure for its case study citiesprovides an excellent starting point.
Cost/benefit: It is not always easy todemonstrate the costs and benefits ofinformation. In disaster managementterms, one useful approach is to demons-trate the potential savings that would flowfrom having the right information, orconversely, what the loss would be withoutthe information. This can be illustratedby the following observation from a studyundertaken by the Institution of Engi-neers, Australia (IEAust 1993).
The costs of data collection are usuallyreadily identifiable. The dollar bene-fits are generally less so. However asimple method is now available whichenables ready estimate of the benefitsachieved through utilisation of data.This method is based on the conceptthat the value of data is the value ofthe reduced uncertainty which resultsfrom the incremental use of data toimprove knowledge. Hence the dollarvalue of data can be directly deter-mined as being the dollar value of theimproved knowledge. The improvedknowledge being quantifiable in termsof reduction in risk of failure orminimisation of over-investment offunds.Invest wisely: I have seen many GIS
implementations that have turned out tobe financial and management disasters,more often than not because they investedmost of their resources in technology
rather than spreading it across infor-mation and people as well. A good rule ofthumb is to allocate 5 to 10% of the budgetto technology, 10 to 20% to people andthe remaining 70 to 85% for data.
There may be better long term returnsfrom investing in the training of a coupleof key NGO volunteers in the processesand benefits of information collectionand management, for example, than inupgrading computers in the disastermanagement headquarters to the latestsoftware. Providing a single computer foran NDMO office where no computercurrently exists will probably returngreater benefits than upgrading com-puters in an office which already hasseveral machines.
Think risk management: The focus ondisaster response is a natural and impor-tant aspect of the disaster manager’s role.It will, however, be greatly enhanced bytaking a broader view of their role toembrace the risk assessment and broaderrisk mitigation process as well. By takinga holistic view, disaster managers will bein a better position to influence thedirection of scientific research into boththe hazard phenomena and communityvulnerability. It is important to acknow-ledge that it is a complex world that welive in and no single person, organisationor science has the complete solution.
ConclusionsThe development of an informationinfrastructure to support disaster mana-gement in PICs has been identified as animportant objective. This study confirmsand reinforces the importance of:• information, especially spatial infor-
mation, as a critical decision makingresource for disaster managers
• the information management processas a core disaster management activity
• the value of information managementbeing supported by an informationinfrastructure, especially a SII
• building the disaster managementinformation infrastructure from theground up, but within the guidelinesand structures established at a nationallevel
• collaborating and cooperating with awide range or partners and stakeholdersin the disaster management and widerrisk management processMuch has already been achieved in
establishing disaster management infor-mation infrastructure in PICs, though alot of that effort has been undertaken byagencies such as SOPAC and foreignresearchers rather than by NDMOs andother national bodies. The foundations
Australian Journal of Emergency Management32
that have been established are sound andprovide an excellent base on which tobuild an appropriate and sustainableinformation infrastructure to addressissues from the village level to the level ofthe national capital and beyond. Thereare undoubtedly frustrations and prob-lems that will need to be addressed alongthe way. However, it is clear that NDMOsare committed to embarking on thisjourney. It is also clear that they will makea good job of it because they are com-mitted to the task.
ReferencesANZLIC 1998, Guidelines for Custodian-ship, Australia New Zealand Land Infor-mation Council, Canberra www.anzlic.org.au/custodn.
Berry L. 1996?, Community Vulnerabilityto Tropical Cyclones and Associated StormSurges: Case Study of the Cairns NorthernBeaches Townships, Centre for DisasterStudies, James Cook University, Cairns.
Burrough P.A. 1987, Principles of Geo-graphical Information Systems for Landresources Assessment, Oxford UniversityPress, Oxford, p. 6.
Cowan D.J 1988, ‘GIS versus CAD versusDBMS: what are the differences?’ Photo-grammetric Engineering and RemoteSensing Vol. 53, No. 10, pp. 1367–1370,American Society of PhotogrammetricEngineering and Remote Sensing, FallsChurch, Virginia.
EMA 1995, National Emergency Mana-gement Competency Standards, EmergencyManagement Australia, Canberra.
FGDC 1997, ‘Clearinghouse background’FGDC Home Page (http://fgdc.er.usgs.gov/fgdc.html), US Federal Geographic DataCommittee, Reston.
Gaull B.A 1979, Seismic Risk at the 20Principal Towns of Papua New Guinea,unpublished MSc thesis, University ofPapua New Guinea, Port Moresby.
Granger K. 1997, ‘Spinformation’, GISAsia Pacific, December 1997/January 1998,p.12, Pearsons professional, Singapore.
Granger K. 1998, ASDI (AustralianSpatial Data Infrastructure) From theGround Up: a Public Safety Perspective,Australia New Zealand Land InformationCouncil and AGSO, Canberra.
Granger K., Little R., Lyons K. &McAlpine J. 1998, PNG National GIS,Spatial Data & Systems, report of pro-ceedings and results of a workshopsponsored by the PNG National MappingBureau and the Office of National Planningand Implementation, Port Moresby.
Granger K., Jones T., Leiba M. and ScottG. 1999, Community Risk in Cairns: aMulti-Hazard Risk Assessment, AGSO,
Canberra.Huxley A. 1927, Proper Studies, Chatto
and Windus, LondonIAVCEI 1999b, ‘Professional conduct of
scientists during volcanic crises’, Bulletinof Volcanolog y, No. 60, pp. 323–334,Springer-Verlag.
IEAust 1993, At What Price Data?National Committee on Coastal andOcean Engineering, Institution of Engi-neers, Australia, Canberra.
Jones T. Probabilistic EarthquakeHazard Assessment for Fiji, AGSO Record1997/46, AGSO, Canberra.
Lyons K. 1992, Data Sets Required andissues Arising for the Use of GeographicInformation Systems by the Portfolio ofPolice and Emergency Services for theESMAP Project, unpublished report to theQueensland Department of EmergencyServices, Spatial Information Services,Montville.
Mant A. 1997, Intelligent Leadership,Allen & Unwin, St. Leonards.
Rynn J. 1997, Earthquake Risk Assess-ment: Suva Earthquake Risk ManagementScenario Pilot Project, report to the 6th
IDNDR Pacific Regional Disaster Mana-gement Meeting (Brisbane), Centre forEarthquake Research in Australia, Bris-bane.
Standards Australia 1999, Australia/NewZealand Standard AS/NZS 4360:1999 Riskmanagement, Standards Australia andStandards New Zealand, Homebush andWellington, p.7.
Toffler A 1993, ‘Shock wave (anti)warrior’, interview with Peter Schwartzin Wired 1:05, May, 1993.
UNDHA 1998, Guidelines for CommunityVulnerability Analysis: an Approach forPacific Island Countries, South PacificProgram Office of the United NationsDepartment of Humanitarian Affairs andthe United Nations Department forEconomic and Social Affairs, Suva.
US Congress 1983, Information Tech-nology in Emergency Management, reporton a hearing and workshop conductedby US Congressional Subcommittee onInvestigations and Oversight of the HouseCommittee on Science and Technology,Washington.
Obituary Notice
The head of disaster managementin PNG, Mr Ludwick KembuQPM, passed away unexpectedlyon 25 March 20 00 after a shortillness.
As Director-General of theNational Disaster ManagementOffice, Mr Kembu had beenleading profound changes inPNG’s disaster managementsystem and arrangements.He was an Assistant PoliceCommissioner immediatelybefore he was appointedas Director-General of thethen National Disasters andEmergency Services in early1998.
Mr Kembu led the organisationthrough a complete re-structure,its re-naming, the 1998 tsunamiresponse, the revision of theNational Disaster ManagementPlan, development of a five-yearbusiness plan, as well as parti-cipating in the final designprocedure for the PNG DisasterManagement Project. This projectis expected to commence laterthis year.
A forthright and dynamic man,Mr Kembu will be sadly missedby those who knew him andworked with him, and parti-cularly by him many friends andcolleagues in Australia.
Mr Ludwick Kembu QPM