One common thread: supply - Urner Barry
72
The conference was originally founded in 1976 to commemorate Urner Barry’s relocation to Toms River, NJ. Since then, the conference has become the premier event for the egg and poultry industries. On the inside 4 AEB’s team of advisors are proficient on all things related to eggs. Marketing programs are designed to increase the usage of egg products. 32 Unpredictable events disrupt the salmon market. Highs, lows, natural events and even work-related issues have taken this market on a ride. 54 Imported boneless beef balloons in cold storage. 2016 fast food features help to bolster movement of product during a traditionally lackluster time. 2015 was interesting to say the least. The prior year had sent prices across multiple protein categories to record highs due to disease outbreaks, strong exports and drought. Those record highs appeared to wear on retailers by the end of the year and as production recovered in the waning months of 2014, prices began to fall. In just a few short months, as we transitioned into 2015, multiple protein markets whipsawed from record highs to multi-year lows. The second half of 2014 brought about the beginning of a rally in the U.S. dollar which would continue into the end of the following year. The value of the dollar gained over 22 percent between June 2014 and December 2015. High currencies One common thread: supply Continued on page 66 THE SESSIONS This past spring Urner Barry hosted leading executives from the U.S. egg and poultry industries at Caesars Palace in Las Vegas for its annual Executive Conference and Marketing Seminar, the 40th edition of the event. result in increased purchasing power domestically and reduced purchasing power among our trade partners. Several of our protein markets, such as some of those in red meat and seafood, saw an increase in imports and a softening of exports as a result. When combined with recovering livestock numbers, this produced a glut of product on the domestic market. High production and sluggish exports left quite a bit of protein for the domestic market to consume. In 2014, it is estimated that the United States had 202 pounds of poultry and red meat available per capita. In 2015, that number shot up to 210.9 Continued on page 71 FOUR DECADES OF CONFERENCE SUCCESS … Urner Barry hosts 40 th Executive Conference “The Supermarket Guru” Phil Lempert addresses Urner Barry’s Executive Conference. VOLUME 11 • NUMBER 3 SUMMER 2016 PUBLISHED QUARTERLY the newsmagazine for the food industry professional MARKET ANALYSIS EDITION ANNUAL Coverage starts on page 11 Plenty of production, but where will it go?
-
Upload
khangminh22 -
Category
Documents
-
view
3 -
download
0
Transcript of One common thread: supply - Urner Barry

Easy-PeelAmerican Egg BoardHARD-BOILED
EGGS DIRECTIONS
1. Heat 1/2 to 1-inch of water into a large saucepan over high heat.
New method introduced by the
Carefully place steamer insert into pan over boiling water.
4.
Enjoy! These easy-to-peel eggs cook 30 percent faster than classic hard-boiling methods, giving you more time to enjoy your weekdays and weekends.
For recipe ideas and inspiration visit www.IncredibleEgg.org
2.
3. Carefully add eggs using large spoon (or tongs).
4.
5.
Continue cooking 12 minutes for large eggs (13 minutes for extra large eggs). Drain immediately and serve warm. or, cool completely under cold running water or in a bowl of ice water, then refrigerate.
The conference was originally founded in 1976 to commemorate Urner Barry’s relocation to Toms River, NJ. Since then, the conference has become the premier event for the egg and poultry industries.
On the inside4 AEB’s team of
advisors are proficient on all things related to eggs.
Marketing programs are designed to increase the usage of egg products.
32 Unpredictable events disrupt the salmon market.
Highs, lows, natural events and even work-related issues have taken this market on a ride.
54 Imported boneless beef balloons in cold storage.
2016 fast food features help to bolster movement of product during a traditionally lackluster time.
2015 was interesting to say the least. The prior year had sent prices across multiple protein categories to record highs due to disease outbreaks, strong exports and drought. Those record highs appeared to wear on retailers by the end of the year and as production recovered in the waning months of 2014, prices began to fall. In just a few short months, as we transitioned into 2015, multiple protein markets whipsawed from record highs to multi-year lows.
The second half of 2014 brought about the beginning of a rally in the U.S. dollar which would continue into the end of the following year. The value of the dollar gained over 22 percent between June 2014 and December 2015. High currencies
One common thread: supply
Continued on page 66
THE SESSIONSThis past spring Urner Barry hosted leading executives from the U.S. egg and poultry industries at Caesars Palace in Las Vegas for its annual Executive Conference and Marketing Seminar, the 40th edition of the event.
result in increased purchasing power domestically and reduced purchasing power among our trade partners. Several of our protein markets, such as some of those in red meat
and seafood, saw an increase in imports and a softening of exports as a result. When combined with recovering
livestock numbers, this produced a glut of product on the domestic market.
High production and sluggish exports left quite a bit of protein for the domestic
market to consume. In 2014, it is estimated that the United States had 202 pounds of poultry and red
meat available per capita. In 2015, that number shot up to 210.9
Continued on page 71
FOUR DECADES OF CONFERENCE SUCCESS …
Urner Barry hosts 40th
Executive Conference“The Supermarket Guru”
Phil Lempert addressesUrner Barry’s Executive
Conference.
VOLUME 11 • NUMBER 3SUMMER 2016
PUBLISHED QUARTERLY
the newsmagazine for the food industry professional
MARKET ANALYSIS EDITIONANNUAL
Coverage starts on page 11
Plenty of production, but where will it go?

2 • URNER BARRY’S REPORTER / VOL. 11, NO. 3 / SUMMER 2016

VOL. 11, NO. 3 / SUMMER 2016 / URNER BARRY’S REPORTER • 3
Main ingredients11 Ample grain and forage in 2016
12 The veal deal
14 Out like a lamb
16 Egg and egg products - Shifts from shortage to surplus
20 Chicken - Supply: about the only thing that’s guaranteed anymore
24 Turkey - Struggling meat and parts contrast solid whole bird market
28 Yellowfin tuna market - Desired stability
30 Tilapia stalls, pangasius keeps growing
32 Salmon - Volatility in the fresh farmed salmon market continues
34 Mahi market - Cautiously firm
36 Shrimp market - Consumption up, weather and disease still weigh on imports
40 Lobster market - A full year: menu adoption, lower Maine production, seasonal demand
42 King crab imports up, snow crab quotas are down; Crabmeat at the tail end of correction mode
44 Scallop market - A well-managed fishery pays off
46 Pork market - It all comes down to production
48 Mexican beef market - Looking to balance factors in 2016
52 Boxed beef market - Growing protein supplies add additional pressure to pricing
54 Imported boneless beef market - Quota, freezer stocks and unsettled demand create a volatile market
56 Domestic boneless beef market - Lean and fat get taken to the mat
57 Bye, by-products
News bites4 American Egg Board brings home the bacon with
Easter 2016 campaign
6 Spending some time with... Dr. Leah Dorman
8 Trans-Pacific Partnership seen needed to help exports; industry leaders say
10 U.S. hog processing capacity to grow significantly by 2018
59 Cattle and coffee carry Colombia
60 Certified Angus Beef - Increasing the odds
62 As currency exchange rates change, so can outlook for exports/imports
64 HPAI’s impact lends momentum to cage free shift
65 Behind the mask: what makes superfoods so super
70 What big ships and small profits mean for globalization
URNER BARRY’S REPORTER • VOL. 11, NO. 3 • SUMMER 2016
Center of the plate
Page 1Urner Barry hosts 40th Executive Conference
Page 1One common thread: supplyPublisher
Paul Brown Jr.
senior editor
Russ Whitman
Managing editor
Joe Muldowney
Contributors
Russell BartonJim Kenny
Bruce LongoBrian Moscogiuri
Gary MorrisonJake Muldowney
Michael RamsinghJocelyn Garcia-Rojas
Angel RubioAdam Sharkey
Bill SmithCurt ThackerTerence WellsNicole West
CoPy editors
Jamie ChadwickLinda Lindner
art direCtor
Glenn F. Juszczak
ProduCtion Manager
Chris Ashley
assoCiate designer
Maria Morales
advertising
Liz CuozzoJanice Schreiber
Terence Wells
subsCriPtion inforMation - 800-932-0617
the newsmagazine for thefood industry professional
Urner Barry’s Reporter (ISSN 1944771X) is published quarterly by Urner Barry Publications, 1001 Corporate Circle, Toms River, NJ 08755. Periodicals Postage Paid at Toms River, NJ 08755 and additional offices. POSTMASTER: Send address changes to Urner Barry’s Reporter, 1001 Corporate Circle, NJ 08755.
Subscription to Urner Barry’s Reporter is free. Mail subscription orders and changes to Urner Barry’s Reporter, Subscription Department, 1001 Corporate Circle, Toms River, NJ 08755 or call 800-932-0617.
Printed in the U.S.A. Copyright © 2016Tel. 732-240-5330 • Fax 732-341-0891
www.urnerbarry.com • [email protected]
Nothing may be reproduced in whole or partwithout written permission from the publisher.

4 • URNER BARRY’S REPORTER / VOL. 11, NO. 3 / SUMMER 2016
Kraft Heinz, General Mills, Barilla, Kroger, T. Marzetti and ConAgra, among others.
The event was headlined by a presentation from Bob Swientek, the
Editor-in-Chief of Food Technology Magazine titled “What is in My Food? Trust and Transparency. A roundtable discussion followed focusing on key interests such as egg replacers, cage free production, avian influenza, and nutrition.
AEB CEO & President Anne L. Alonzo shared her vision for AEB and Chairman Blair Van Zetten and Committee Chair Brian Joyer spoke to the egg farmers’ point of view on producing eggs in the current environment.
The American Egg Board considers this group to be its expert advisors in
Contributed by the American Egg Board
The American Egg Board’s (AEB) 2016 Easter Campaign brought home the Bacon—or, more appropriately, the Bacon Brothers—by taking over the Easter conversation and making it the holiday for eggs in the U.S.
In a comprehensive Easter campaign, AEB broke through the clutter by utilizing Hollywood icon Kevin Bacon and his brother Michael to wake people up to the benefits of eating eggs. The effort featured a variety of humorous music videos, print and digital advertising, and social media outreach. In addition, for this all-important egg decorating holiday, AEB introduced a new method to hard-boil eggs that saves time and makes eggs easier to peel, which consumers have identified as a primary barrier to consumption of hard-boiled eggs. This new “easy peel” technique was promoted via a series of how-to-videos and graphics, and amplified via social media.
The Easter Campaign culminated with AEB’s enhanced involvement in the 2016 White House
American Egg Board brings home the Easter Egg Roll. The American Egg Board continued its almost four decades of support with the presentation of the 39th Commemorative Egg to First Lady Michelle Obama on behalf of America’s egg farmers. America’s egg farmers also donated more than 30,000 hard-boiled eggs and contributed an educational exhibit entitled “The Egg’s Journey from Farm to Table” to engage the 35,000 attendees of this year’s Easter Egg Roll.
Together, these efforts drove buzz, interest and more than one billion media impressions. And more importantly, they were instrumental in helping to drive a 12% increase in egg sales (dozens) vs. the same period a year ago.
AMERICAN EGG BOARD HOSTS 17TH ANNUAL FOOD TECHNOLOGY ADVISORY COUNCILIn support of the American Egg Board’s ongoing efforts to connect and influence thought leaders in food manufacturing, AEB’s egg product marketing team conducted its 17th annual Food Technology Advisory Council meeting, May 5 and 6 in Chicago, Ill.
The council consists of experts from various segments of the industry such as food companies, egg product suppliers, academia and the trade press, who provide insight and thought leadership on AEB’s programs and activities in the egg product marketing arena. Attendees also share best practices from their respective companies.
Attendees for this year’s Council meeting included research and development and purchasing representatives from Tyson,
AEB positioned as Easter ‘eggspert’ …
Easy-Peel American Egg Board
HARD-BOILEDEGGS DIRECTIONS
1. Heat 1/2 to 1-inch of water into a large saucepan over high heat.
New method introduced by the
Carefully place steamer insert into pan over boiling water.
4.
Enjoy! These easy-to-peel eggs
cook 30 percent faster than
classic hard-boiling methods,
giving you more time to enjoy
your weekdays and weekends.
For recipe ideas and inspiration visit www.IncredibleEgg.org
2.
3. Carefully add eggs using large spoon (or tongs).
4.
5.
Continue cooking 12 minutes for large eggs (13 minutes for extra large eggs).
Drain immediately and serve warm. or, cool completely under cold running
water or in a bowl of ice water, then refrigerate.
White House Easter Egg Roll 2016 – Commemorative Egg presentation featuring Anne Alonzo, President & CEO of American Egg Board, and AEB chairman Blair Van Zetten.
Nobody knows eggs better than Bacon, Kevin and Michael Bacon.
They know one large egg is a nutritional powerhouse with 6 grams of
high-quality protein for 70 calories each. And they also know how
to sneak into your house to sing you a catchy egg song. Just yolking.
Visit IncredibleEgg.org for recipe ideas.
©2016 American Egg Board

VOL. 11, NO. 3 / SUMMER 2016 / URNER BARRY’S REPORTER • 5
matters relating to egg products and food formulating. Recommendations from the council help shape AEB’s egg product marketing programs designed to increase
bacon with Easter 2016 campaignthe usage of egg products in the food processing industry.
For 17 years, the American Egg Board has been hosting the Food Technology Advisory Council—in its early days, the American Egg Board would convene food companies to discuss issues and then seek the committee’s advice on how best to communicate programs and research being conducted by the American Egg Board.
Over time, the Council has evolved as a forum to seek industry expertise and assist America’s egg farmers in meeting industry needs.
The Council has helped the American Egg Board make advances in the following arenas, including:
• Researching the characteristics of eggs, resulting in an industry white paper, entitled “Eggs and GMO”;
White House Easter Egg Roll 2016educational exhibit.
America’s Largest Producer/Marketer of Fresh Eggs
Contact: Alan Andrews3320 Woodrow Wilson Ave. • Jackson, MS 39209
601-948-6813 • www.calmainefoods.com
Sustainable!
• Incorporating food safety messaging and addressing industry issues in the wake of product recalls and incorporating those messages into AEB communications vehicles;
• Providing more comprehensive research for food formulators, which resulted in a body of research on energy bars, eggs and sports nutrition, and even some technical topics like the deactivation of Alpha-amylase reaction;
• Advancing industry discussions around sustainability, supported by the Egg Industry Center’s 2013 50-year Sustainability Study, and interpreting those results for food manufacturers;
• Creating educational resources to help support customers of egg suppliers and provide information on technical egg functionality—one of the foundations of our program.UB

6 • URNER BARRY’S REPORTER / VOL. 11, NO. 3 / SUMMER 2016
agriculture’s contribution to antibiotic resistance, it is important that we continue to use antibiotics responsibly on the farm.
As a veterinarian, I also recognize the importance of antibiotics to the welfare of animals. I took an oath to protect animal health, prevent and relieve animal suffering and promote public health, which I take very seriously. Antibiotics are one of the most important tools that veterinarians and farmers use to protect both human health and animal health. Animal suffering could be an unintended consequence if antibiotics are disallowed in food animals. If retailers refuse to accept animals that have been responsibly treated with antibiotics, farmers could be forced to choose between allowing animal suffering and having no destination for their animals. Using as little antibiotics as possible, but as much as necessary to prevent, control or treat disease, is the ethical thing to do.
UBR: In addition to helping protect animal health, can’t it be argued that people and the planet itself are positively served by antibiotics?
RP: Responsible use of antibiotics helps keep animals and the environment healthy. When left untreated, sick animals grow more slowly, requiring more food and water. Thus, more grain must be grown for feed, which requires more fertilizer, water and acres of land. So, sick animals have a larger environmental impact, while healthy animals use fewer natural resources.
UBR: Why this tidal wave of consumer push back when it comes to treating sick animals and keeping them healthy?
RP: Consumers are interested now more than ever before in how their food is
Urner Barry’s Reporter recently sat down for a Q & A session with Dr. Leah Dorman, a member of the American Veterinary Medical Association, U.S. Animal Health Association and the National Institute for Animal Agriculture who is also trained as a Foreign Animal Disease Diagnostician to gain insight on her opinion on the responsible use of antibiotics in animal health issues.
Urner Barry’s Reporter: The responsible use of antibiotics is a hot topic these days, and one which can be easily misconstrued. Starting at ground level, what are antibiotics, and for what are they primarily used?
Dr. Leah Dorman: Animal antibiotics have been used by farmers for decades to
Spending some time with...
Dr. Leah Dormanmake food safer, prevent animal suffering, and lessen the burden on our planet. An antibiotic is a medication that kills bacteria or keeps them from multiplying (reproducing) or growing and are used to prevent, control or treat disease caused by bacteria.
UBR: The term Veterinary Feed Directive (VFD) is being used with increasing frequency in industry circles. Can you tell us a little bit about it and what role it can play in the well-being of animals in our care?
RP: A Veterinary Feed Directive (VFD), which is essentially a prescription from a veterinarian, will be required by January 2017 when treating animals with antibiotics (via livestock and poultry feed) that are important in human medicine. These same types of medications, added to water, will require a veterinary prescription. The VFD is another important part of the strategy to ensure responsible use of antibiotics in an effort to minimize agriculture’s contribution to antibiotic resistance.
UBR: You have been on record stating your strong convictions about the benefits of antibiotic use in animals. Could you elaborate?
RP: As a mom of three girls, it is vitally important to me to ensure that antibiotics are effective when I need them most: when one of my kids is sick. In order to minimize
Veterinarian, mother of three, talks openly about responsible antibiotics use ...
“Antibiotics are one of the most
important tools... to protect both
human health and animal health.”
800-367-0760
(563) 556-0760
Domestic, Import & Export
Randy, Cindy, Mark & Lisa
36 Bluff Street, PO Box 171Dubuque, IA 52004-0171
Fax 563-556-4131
Full Service Brokers of
BEEF, PORKVEAL &
POULTRY
479-968-1777(Fax) 479-967-1111
ALL CATEGORIES POULTRYRetail • Food Service • Industrial • Export
Professional Sales and Procurement Services
[email protected] P.O. 2061 • Russellville, Arkansas 72811EVERYTHING POULTRY SINCE 1979
Call Jim, Steven, Jason and Jeff

VOL. 11, NO. 3 / SUMMER 2016 / URNER BARRY’S REPORTER • 7
grown and raised. And why not? Food is necessary, personal and some would even say it’s intimate. Consumers are simply seeking peace of mind and assurance that what they are feeding their families is healthy. I welcome their questions and am committed to providing honest answers. I have my work cut out for me because there is a lot of misinformation swirling.
UBR: The Centers for Disease Control (CDC) has a list of antibiotic resistant threats. What are some of the most urgent threats, and do they relate to farm animals?
RP: The CDC identified the most concerning public health threats from antibiotic resistant bacteria. None of the most urgent threats have any relation to farm animals. On the broader list, which includes less urgent threats, only two of 18 involve bacteria associated with farm animals. Still, farmers, veterinarians and the animal health community have agreed to change the way antibiotics are used on the farm because we share the concern about antibiotic resistance.
UBR: What antibiotic alternatives are currently being explored and tested which seem to hold the most promise?
RP: The animal health community is continually researching and developing new ways to protect and improve animal health that may reduce the need for animal antibiotics in the future. More specifically, Phibro Animal Health has recently launched a nutritional supplement developed from a combination of natural compounds derived from plants, which has been shown to maintain and support immune function in poultry. Phibro also develops and offers vaccines that reduce the risk
of infection, which may also lead to a decrease in the need for antibiotics.
UBR: Food production, from the farm to the fork, has had to change dramatically to keep up with consumers’ growing interest and concern about the food they are eating. You were actually hired by Phibro Animal Health as part of the company’s commitment to open and candid dialogue about safe food production and animal welfare. You must entertain a lot of questions.
RP: I welcome the questions people have about their food and how it’s raised. Consumers today are skeptical of our food
Dr. Leah Dorman
system. The animal health community needs to embrace that skepticism and answer consumer questions openly and honestly, rather than be defensive about what we do. I’m proud to be a veterinarian and proud to work for a company like Phibro that recognizes the need to invite consumers into the conversation. Any day I have the opportunity to talk about food and agriculture is a really good day and animal agriculture has a wonderful story to tell!UB
Article contributed by Russell W. [email protected]
A full line trading and brokerage company in the meat industry
MCT Transportation, LLCA wholly owned subsidiary of Meat Commodities, Inc.
Meat Commodities, Inc.
Contact one of our sales representatives:
[email protected] 800-523-5382
Anthony AdamsBrian EamerJack Gartner
Tony OnekaRod Hessenius
Robby Hessenius
Duane ReeseTravis Engeman
Amanda BarkerAmy Ward
Established 1974 • Asheville, NC
SEEKING
an experienced sales person with a background in beef, pork or poultry
Must be willing to relocate to Asheville,
North Carolina
Contact: Andrew Gibson

8 • URNER BARRY’S REPORTER / VOL. 11, NO. 3 / SUMMER 2016
U.S. beef and pork in terms of value since 2012 on the former and 2006 on the latter. The same goes for volume with the exception of 2015 for beef.
656 77
1
985
897 1,
067 1,
287
1,13
4
1,17
3
1,19
7
1,06
8
0
200
400
600
800
1,000
1,200
1,400
2006 2007 2008 2009 2010 2011 2012 2013 2014 2015
Thou
sand
MT
Total U.S. Beef Exports (Including Variety Meat)Source: Urner Barry, USMEF
1,26
2
1,30
6
2,05
2
1,86
6
1,91
8
2,25
5
2,26
2
2,14
4
2,17
8
2,13
2
1,000
1,200
1,400
1,600
1,800
2,000
2,200
2,400
2006 2007 2008 2009 2010 2011 2012 2013 2014 2015
Thou
sand
MT
Total U.S. Pork Exports (Including Variety Meat)Source: Urner Barry, USMEF
If you have been watching any of the political debates this year, trade agreements have been in focus for the candidates. In general, a trade agreement is defined as an agreement resulting from collective bargaining on conditions of trade in goods and services between countries. They are typically used to increase trade opportunities by doing such things as removing quotas, tariffs or other taxes that are used to limit trade. Even if you haven’t heard of these things during the election cycle, anyone in the beef or pork sectors is well aware of the Trans-Pacific Partnership (TPP) and what it could mean for the industries.
The TPP is a deal in principle between the United States and 11 Pacific Rim nations that could create the largest free trade area in the world. These nations include: Australia, Brunei, Canada, Chili, Japan, Malaysia, Mexico, New Zealand, Peru, Singapore, the United States and Vietnam. While the agreement was made in October 2015, it still faces legal hurdles before being passed. The full text is available from the United States Department of Agriculture (USDA) and the Office of the U.S. Trade Representative (USTR).
TPP countries are already important trade partners for the U.S. meat industry. This new agreement is expected to not only spur additional business, but make the United States more competitive against other supplying countries—most notably Australia which is the United States’ largest competitor in the beef industry. The gorilla in the room is Japan, which is the largest export market for
Trans-Pacific Partnership seen needed to help exports; industry leaders say
Trade agreements make movement of goods and services easier …
©Tomwang112

VOL. 11, NO. 3 / SUMMER 2016 / URNER BARRY’S REPORTER • 9
Imports, however, will still be subject to an annual TPP-wide volume safeguard to guard against an unexpected surge in imports into Japan. It is similar for pork and pork products as well. Japan will eliminate nearly 80 percent of tariffs within the 16 years. Vietnam, with tariff rates of 20 percent for chilled-frozen muscle cuts and 15 percent for offal, will be eliminated in three to eight years.
The United States will also make concessions to other countries that will make exports to the U.S. easier as well.
No matter what side of the aisle you are on, there are some significant dollars for the industry at stake. TPP still needs to be ratified by participating governments so implementation is far from certain.UB
Article contributed by Gary Morrison | [email protected]
-
350
700
1,050
1,400
1,750
0
60
120
180
240
300
2006 2007 2008 2009 2010 2011 2012 2013 2014 2015
Million U
SD$Th
ousa
nd M
T
Volume ValueTotal U.S. Beef Exports (Including Variety Meat) to JapanSource: Urner Barry, USMEF
1,000
1,200
1,400
1,600
1,800
2,000
300
340
380
420
460
500
2006 2007 2008 2009 2010 2011 2012 2013 2014 2015
Thou
sand
MT
Volume ValueTotal U.S. Pork Exports (Including Variety Meat) to JapanSource: Urner Barry, USMEF
Million U
SD$
A big reason for this competiveness was the early year trade agreement—the Japan-Australia Economic Partnership Agreement which lowered the import tariffs to 28.5 percent for frozen Australian beef and 31.5 percent for chilled beef. This is much lower than the 38.5 percent tariff other countries face that have no trade agreement, including the United States.
28.5%31.5%
38.5% 38.5%
0%
10%
20%
30%
40%
Frozen Beef Chilled Beef
Australia U.S.Current Tariffs on Beef Exported to JapanSource: Urner Barry, USDA
The U.S. exported nearly $1.3 billion in beef and $1.6 billion in pork to Japan in 2015, down from $1.6 billion and $1.9 billion respectively in 2014. Everyone recognizes the importance of this market. Many believe the TPP will help U.S. exports remain competitive as many of the nations in this agreement already have existing trade agreements. And while Japan isn’t the only market that the U.S. doesn’t have an agreement with, it may be the most important. Others such as Vietnam and Malaysia will also be eyed.
If this agreement goes through, what provisions have been released to the benefit of U.S. exporters? Japan is said to lower tariffs for chilled-frozen beef from the current rate of 38.5 percent to 9 percent phasing down through 16 years. Tariffs on beef offal will be eliminated during the same 16 year period from the current rate of 21.3 percent, while tariffs on processed beef will also be eliminated from the current rate which is as high as 50 percent.
“The TPP is a deal in principle between the United States
and 11 Pacific Rim nations that could create the largest free
trade area in the world…”
Arrange a consultation by calling 800-932-0617 and ask about a FREE TRIAL
Featuring our premium online service:
C O M T E L L®
www.urnerbarry.com
MAKE SMARTER CHOICES.FASTER.EVERY DAY.
Market News . Quotations . Analysis
MarketandReport Notifications NowAvailable!

10 • URNER BARRY’S REPORTER / VOL. 11, NO. 3 / SUMMER 2016
The four plants, when up and running at normal speed, will add 34,000 to 36,000 heads of hogs to the daily processing capacity. Within a couple of years, that could grow by another 10,000 head. The combined investment in the facilities is expected to be nearly $800 million, and they will add over 4,000 jobs to the economy.
The addition to the processing capacity is expected to drive stronger demand for hogs and result in higher prices by late 2017 and 2018, unless producers boost output by a corresponding amount.
Some analysts warned that any increase in production needs to be in line with the coming aboard of the new facilities so that there is no surplus of supplies and a lack of processing capacity to absorb the animals. It is also imperative that the U.S. continue to expand its export sales in order to not overwhelm the domestic market with pork.
Current processing capacity is rated from about 445,000 to nearly 450,000 head a day. By autumn of 2018, it should reach about 480,000 head. On a 5 1/2-day work schedule, the industry would be able to process about 2.65 million head per week.UB
Article contributed by Curt [email protected]
The planned construction of three new pork plants and retooling of a former beef facility to process hogs will add significantly to the U.S. hog processing capacity over the next two years or so.
Large hog supplies last fall led to record large slaughter rates and essentially filled the current capacity for a number of weeks. The result was six-year lows in cash prices, record wide processing margins and a cautious outlook for prices again in late 2016.
Before the expansions begin, daily capacity has actually been reduced slightly since Carolina Pride in Greenwood, S.C., shut down its slaughter and fresh meats operations in mid-May. That plant had a
U.S. hog processing capacity to grow significantly by 2018
slaughter capacity of about 3,000 head.
The addition of four plants will boost the daily processing capacity by about 34,000 head initially and eventually by around 44,000 head. The first of these to begin operating is a 4,000 head-a-day facility in Windom, Minn., which plans to open late this year. Glen Taylor, owner of the Minnesota Timberwolves, is partnering with Minnesota hog producer Greg Strobel, to form Prime Pork.
The next plant scheduled to come on line will be the Seaboard-Triumph Foods facility located in Sioux City, Iowa. That plant is targeted to open in July of 2017 and will be able to process 10,000 to 12,000 hogs a day.
After that, in line to open will be a plant in Coldwater, Michigan, being built by Clemens Food Group, owners of Hatfield Quality Meats in Hatfield, Pennsylvania. The facility will be able to process about 10,000 head per day and is scheduled to open in late 2017.
The fourth plant to open will be the Prestage Farms facility, originally planned for Mason City, Iowa until the city council voted against it in early May. The company immediately began looking for another site, and at the time of this writing has not yet announced a location. The Prestage plant was to begin with one shift capable of processing about 10,000 hogs daily, and the company planned to add a second shift in about two years.
New pork plants on the horizon …
445 450460
472482
500
400
420
440
460
480
500
520
May 2016 Dec 2016 Jul 2017 Dec 2017 Jul 2018 Mid 2020
Thou
sand
s
Projected US Daily Hog Processing CapacityHeadsSource: Urner Barry
MidwestPoultryservices
Three generations ofexperience in fresh eggs.Midwest Poultry Services, L.P.
is an industry leaderwith a reputation built on
outstanding service.Call us to experience the difference.
Midwest Poultry Services, L.P.P.O. Box 307, Mentone, IN 46539
Phone: (574) 353-7651 • Fax: (574) 353-7223

VOL. 11, NO. 3 / SUMMER 2016 / URNER BARRY’S REPORTER • 11
By Jamie Chadwick | [email protected]
A record amount of corn supplies is expected based on higher beginning stocks and increased production heading into this crop year. Intentions for planted acreage of corn is notably large in 2016 and global inventory is already high coming off 2015.
In the Prospective Plantings report released in March by the USDA’s National Agricultural Statistics Service, corn planted for all purposes in 2016 was estimated to be up about 6 percent from the year prior. These intended acres would be the highest in the U.S. since 2013, and the third highest since 1944. Intended acreage for soybeans was relatively unchanged from the previous year, down less than one percent overall.
So far this season, corn planting progress in the 18 primary production states has exceeded that of the 5-year average rate. At the time of this writing, emergence progress is also ahead of year ago progress and the 5-year average. Growing conditions throughout much of April were optimal in most regions and supported planting and fieldwork conditions.
According to the May 2016 World Agricultural Supply and Demand Estimates report, U.S. feed grain supplies for 2016/2017 are projected up 4 percent from the previous year record, with increases in both beginning stocks and production. Corn supplies are projected at a record 16.3 billion bushels.
Corn production is projected at 14.4 billion bushels, up 829 million from last year. The 5.6 million acre increase in corn plantings more than offsets a small reduction in yield. The U.S. corn yield is projected at 168 bushels per acre, down just 0.4 bushels from the 2015/2016 crop.
Corn use in the U.S. is projected to be a record as well at 14.1 billion bushels, 4 percent higher than the previous year. Feed and residual use, according to WASDE data, was projected 300 million bushels higher based on higher production, lower expected prices, and further expansion in livestock numbers this coming year.
Exports could also improve for corn as the dollar is believed to have reached its peak, and domestic product is able to better compete pricewise in the global market. In
Ample grain and forage in 2016GRAIN MARKET
addition, adverse weather in major grain producing areas of South America, primarily Brazil and Argentina, may further promote U.S. export opportunities.
U.S. oilseed production for the 2016/2017 crop year is projected to be down 3.1 million tons to 112.9 million tons,
mainly due to lower soybean production. According to WASDE data, soybean production is projected at 3,800 million bushels, down 129 million from the 2015 crop on lower harvested area and trend yields. Higher beginning stocks, however, more than offset declines in production, with supplies still expected up 1.9 percent from the 2015/2016 crop year. In addition, global production of soybeans remains higher overall.
Finally, it’s hard to have a discussion on grains and livestock feed without looking at pasture and range conditions. The drought that, since roughly 2011, brought the nation’s cattle herd to its lowest level in over 60 years has drastically improved. For the week ending May 8th, 2016, pasture and rangeland conditions were rated overwhelmingly in fair to good condition in the USDA’s weekly Crop Progress report. Only 2% was rated very poor and 7% poor. 30% is fair, while 51% is rated in good condition. Lastly, 10% of pasture is considered to be in excellent condition. Conversely, for the same period in 2012, 17% of total pasture conditions were rated poor to very poor, with most southern states rated predominantly in that category.
With better forage and ample grain supplies, livestock producers’ and feeders’ relative cost of gain could be favorable in 2016.UB
2.75
3.25
3.75
4.25
4.75
5.25
J F M A M J J A S O N D
$/bu
shel
Omaha, US No 2 Yellow Corn Cash Price, High-Weekly
2014 2015 2016
Source: Urner Barry
Cash prices for corn are currently at multi-year lows.
Intensity D0 Abnormally Dry D3 Extreme Drought
D1 Moderate Drought D4 Exceptional Drought
D2 Severe Drought
The Dought Monitor focuses on broad-scale conditions. Local conditions may vary.Source: http://droughtmonitor.unl.edu/
May 13, 2014
U.S. Drought Monitor
May 12, 2015
May 10, 2016

12 • URNER BARRY’S REPORTER / VOL. 11, NO. 3 / SUMMER 2016
numbers will likely remain below 2015 levels throughout the remainder of the year.
Carcass weights are down significantly compared to this time last year. So far in 2016 carcass prices have trended lower each month. April’s monthly value was $357.98/cwt; down about 21% compared to the same month last year. Demand is still moderate at best.
Boxed cuts have almost all trended lower so far in 2016. April’s monthly average price, compared to the equivalent month last year, showed a decline for boneless legs of 4% while 4X4 loins and hotel racks were each down 14%. Despite depressed production numbers, prices continue to trend lower as demand is simply not strong enough.
Demand will likely continue to be flat to weaker. That being said, lower prices on the boxed cuts could help to bring about some additional buying interest. Supplies will likely continue to trend lower, while production is expected to drop about 10% in 2016.UB
By Bill Smith | [email protected]
Veal production has been in decline for decades, falling from 354 million pounds in 1996 to 81 million pounds in 2015. The unfortunate truth is that veal is largely considered a fine dining item; reserved for a special occasion. 2014 was a significant year for the veal complex as an almost perfect storm developed causing prices to skyrocket. The combination of feed prices and starter calves trading at huge premiums caused veal prices to climb to record high price levels. Competition from the beef industry for the starter calves was intense which lead to price increases of over 200%. Then in 2015, prices seemed to level off and maintain their higher price levels. So far in 2016 there has been some discounting on starter calves as demand from the beef industry is not as intense and prices have declined accordingly.
As we stated earlier, 2015 was a very strong year for the veal market with record high prices on the vast majority of items throughout the complex. Thus far in 2016, both boxed cuts and carcass prices have trended lower. Veal production is down roughly 7% compared to the equivalent time period in 2015. Values so far in 2016 have been weaker than anticipated largely due to increased availability and lower price points on starter calves. Production
50
150
250
350
'95 '97 '99 '01 '03 '05 '07 '09 '11 '13 '15
Mill
ion
lbs.
USDA Federally Inspected Production - Veal Yearly
Source: Urner Barry
The veal dealVEAL MARKET
9.5
10.5
11.5
12.5
Jan Feb Mar Apr May Jun Jul Aug Sep Oct Nov Dec
$/lb
.
UB Boxed Veal Cuts -348A Leg, TBS 3 -Piece 24/32
2013 2014 2015 2016
Source: Urner Barry
5.50
6.00
6.50
7.00
7.50
8.00
Jan Feb Mar Apr May Jun Jul Aug Sep Oct Nov Dec
$/lb
.
UB Boxed Veal Cuts -332 Loin, 4x4 Trmd 12/182013 2014 2015 2016
Source: Urner Barry
8.0
8.5
9.0
9.5
10.0
10.5
Jan Feb Mar Apr May Jun Jul Aug Sep Oct Nov Dec
$/lb
.
UB Boxed Veal Cuts -306 Hotel Rack,7-Rib 14/202013 2014 2015 2016
Source: Urner Barry
©Di
maS
obko
3.4
3.7
4.0
4.3
4.6
Jan Feb Mar Apr May Jun Jul Aug Sep Oct Nov Dec
$/lb
.
UB Carcass Veal -Hide-off, 255/315 NE 2013 20142015 2016
Source: Urner Barry
“The unfortunate truth is that veal is largely
considered a fine dining item; reserved for a
special occasion.”

VOL. 11, NO. 3 / SUMMER 2016 / URNER BARRY’S REPORTER • 13

14 • URNER BARRY’S REPORTER / VOL. 11, NO. 3 / SUMMER 2016
“The unfortunate reality though is that most Americans are not lamb enthusiasts.”
all up slightly (0-6%). Demand for lamb is traditionally impacted by the holidays. Buying interest is expected to increase in the fourth quarter as the Christmas holiday approaches.
Uncertainty lingers for lamb carcass and boxed lamb cut values for the remainder of 2016. Supplies will likely remain manageable. Demand is expected to be moderate at best. Competition from imported product is expected to continue.UB
By Bill Smith | [email protected]
Boxed lamb prices were mixed in 2015 when comparing prices to previous years. So far in 2016
most boxed cuts are trading at a discount when compared to the equivalent time period for 2015. Production in 2015 was down about 4% compared to 2014. Year-to-date sheep and lamb slaughter is down 2.9%. Demand is expected to be steady to a little more active in some areas for the remainder of the year.
Lamb carcass prices have trended lower thus far in 2016. If we use the 65/75 weight selection as a benchmark, the monthly average price has declined about 7% since the beginning of the year. January’s monthly average price was $3.14/lb. which was down about 8% compared to January last year. April’s monthly average price was $2.91/lb. which was off roughly 10% compared to the equivalent time period in 2015. Availability of the different weight selections was noticeable at different points in the year. As 2016 develops, prices are expected to level off and maybe even improve in some areas.
Boxed lamb cuts were mixed in Q1 2016. While production and slaughter figures have both declined so far this year, early indication is demand is not strong enough to expect significant price increases. That being said, grilling season is approaching which will likely help demand some. The unfortunate reality though is that most Americans are not lamb enthusiasts. According to the North American Meat Institute’s most recent U.S. Meat and Poultry Production and Consumption report, Americans consumed 0.6 pounds per capita of lamb and mutton in 2012—in comparison, per capita beef consumption was 57.4 pounds and chicken consumption was 81.3 pounds per person in 2012.
Racks opened 2016 with a monthly average price for January of $7.60/lb., down 9.5% relative to January 2015 levels. Monthly average prices for the first quarter of 2016 were all lower when compared to the equivalent month in 2015. Historically speaking prices are still generally strong, just lower than 2015 and 2014.
Loins are one of the few boxed lamb items that have showed strength in comparison to recent year pricing. Monthly average prices so far in 2016 have been roughly 1% higher when assessed against the equivalent monthly average price for 2015. Demand will likely improve as we head into grilling season.
Boneless leg prices opened 2016 with prices a little higher than 2015 but lower than 2014. Comparing monthly average price levels in 2016 to 2015, January, February and March prices were
Out like a lambLAMB MARKET
4.35
4.60
4.85
5.10
5.35
Jan Feb Mar Apr May Jun Jul Aug Sep Oct Nov Dec
$/lb
.
UB Boxed Lamb Cuts 232 Loin Trmd 4x4-(LTL)(SAvg)
2013 20142015 2016
Source: Urner Barry
4.45
4.65
4.85
5.05
5.25
5.45
5.65
Jan Feb Mar Apr May Jun Jul Aug Sep Oct Nov Dec
$/lb
.
UB Boxed Lamb Cuts 234 Leg, Boneless-(LTL)(SAvg)
2013 20142015 2016
Source: Urner Barry
5
6
7
8
9
Jan Feb Mar Apr May Jun Jul Aug Sep Oct Nov Dec
$/lb
.
UB Boxed Lamb Cuts204 Rack, 8-Rib, 7/Up-(LTL)(SAvg)
2013 20142015 2016
Source: Urner Barry
2.50
2.75
3.00
3.25
3.50
Jan Feb Mar Apr May Jun Jul Aug Sep Oct Nov Dec
$/lb
.
UB Carcass Lamb Y4+65/75 (TL)(SAvg)
2013 20142015 2016
Source: Urner Barry

VOL. 11, NO. 3 / SUMMER 2016 / URNER BARRY’S REPORTER • 15
PORT OF Problem Solved.Welcome to the ports that are ready to handle your shipping needs. North Carolina Ports is dedicated to finding logistics solutions for you. We offer unmatched flexibility and customization in cargo handling. And, we find unique answers for containerized cargo and non-standard cargo like bridge girders and wind turbines. Best of all, we’re always ready to answer your questions. How ready? Just give us a call, and we’ll show you how we can help your business succeed.
1.800.264.1079 / NCPorts.com
P O R T O F P R O G R E S S

16 • URNER BARRY’S REPORTER / VOL. 11, NO. 3 / SUMMER 2016
news about HPAI’s impact on U.S. layers and the record price of eggs.
EXPORTS STALLOver the last 5 years, the U.S. egg and egg products industries has gained an important foothold in the global marketplace. In fact, 2013 and 2014 were the best export markets ever seen. Total shell egg and egg product exports absorbed the production of more than 15 million layers in 2014, or 5% of all eggs produced. 2015 was on pace to break these records through the first quarter of the year, however, international bans, high prices, and product shortages hindered exports through the rest of the year. Though some countries like Canada continued to take U.S. eggs from unaffected states, total exports fell more than 30% in 2015, meaning almost 5 million less birds were needed to service international sales, even after the record start to the year.
IMPORTSSupply constraints and pricing motivated processors and egg product users alike to look for alternatives globally. By the end of June, the U.S. began to import shell eggs from Europe and Mexico. Imports peaked through the middle of September, when Europe sent more than 130 containers of shell eggs to U.S. processors. These shell eggs helped to ease the needs of the breaking industry and correlated with one of the most prolonged periods of market declines in recent history.
By Brian A. [email protected]
While last year’s egg market analysis was being written, the industry was still suffering losses from the largest outbreak of Highly Pathogenic Avian Influenza (HPAI) in the history of the United States. More than 34 of the nation’s 307 million egg laying hens would eventually be culled by the time the virus’ spread would stop. In the wake of this disaster, the egg industry was clearly set to face an uphill battle in dealing with supply shocks, high prices, and subsequent demand destruction, both domestically and abroad.
HPAI’S MARKET IMPACTThe virus markedly impacted egg processing plants located in the Central Flyway, as roughly 30 of the total 34 million layers lost were producing for the
Shifts from shortage to surplus
products sector. In other words, in just a few months time, 30% of production destined to become egg products was removed from the marketplace. Processors had no choice but to compete for any egg available to cover orders, purchasing eggs once destined for the cartoned market. Urner Barry’s breaking egg prices peaked at $2.35 per dozen in early June, then hit the all-time high of $2.37 per dozen in August.
The flow of eggs into the processing sector quickly tightened overall supplies. Midwest large prices hit an initial high of $2.62 per dozen in early June, then peaked at an all-time high of $2.88 per dozen in August. Retailers struggled to pass costs along initially, but consumers eventually began to see prices well over $3 per dozen for generic eggs at the shelf. They also were presented with signage about supply constraints and national
EGG AND EGG PRODUCT MARKET
-50
0
50
100
150
200
250
300
Apr-15 May-15 Jun-15 Jul-15 Aug-15 Sep-15 Oct-15 Nov-15 Dec-15
% C
hang
e
Midwest Large Breaking StockLiquid Whole Egg Dried Whole Egg
Post HPAI Markets
Source: Urner Barry
Contact Brent Booker (706) 652-2164PO Box 370, Gillsville, GA 30543
www.countrycharmeggs.com
Country Charm
Eggs, LLCProducers of
Carton, Graded Loose, Nest Run Eggs
Quality Eggs in the Southeast Since 1978
Eggs, LLC
C
ountry Char m
X _____________________________________Sign here for approval and fax to: 732-341-0891
Dated ____________________
Serving the Food Industryfor Four Generations withHigh Quality Egg Products
2 Papetti Plaza, Elizabeth, NJ 07206
Tel. (908) 351-0330www.debelfoods.comFax (908) 351-0334
Elliot P. Gibber, President

VOL. 11, NO. 3 / SUMMER 2016 / URNER BARRY’S REPORTER • 17
Breaking egg prices fell 51% from August 11th to October 14th, while Midwest large fell more than 43% from the $2.88 peak to $1.62 during the period.
DOMESTIC ADJUSTMENTSHPAI-related issues forced egg product buyers, from consumer goods manufacturers to QSR chains, to make adjustments in their usage. Major foodservice companies adjusted their offerings to include less egg. Breakfast corporations broke eggs in house instead of using liquid. There were even some companies that stopped making certain products that were heavily dependent on cheap egg products.
Egg replacers and reduction tactics gained traction across the U.S. and around the world. During peak AI issues, finished egg product usage was reportedly down upwards of 30%. Reductions were most pronounced in the egg white category, where buyers had seen back to back years of unprecedented highs around McDonald’s Egg White Delight launch and then 2015’s HPAI issue.
RETAIL SHIFTSAfter seeing margins shrink from the unexpected price hikes through the summer months, retailers began to pass costs along to consumers. Unprecedented generic egg prices presented shoppers with decisions at the egg case. There were times last year where specialty eggs, like cage-free, were actually cheaper than generic dozens, one of the fundamental drivers behind recent cage-free announcements.
Features were absent from the marketplace through much of the fall, but with processors no longer aggressively competing for shell eggs, planners attempted to promote eggs through the winter baking and holiday seasons. The Midwest large market rallied more than 45% when November ads began to break, topping at $2.35 before Thanksgiving. These advances stalled ad activity for December and the market corrected back to $1.11 per dozen through the beginning of January.
FLOCK REBOUNDSIndustry experts initially thought that it would take at least 18 months for flocks to fully return to pre-HPAI levels.
Though some impacted plants have yet to fully replace layers, these forecasts underestimated growth and expansion at unaffected facilities. In just a year’s time, production has rebounded to just 5 million hens short of pre-HPAI highs and forecasters project that number could exceed those levels by more than 13 million hens by the end of the year.
Rebounding production and demand adjustments were clearly evident during
Easter 2016. Traditionally known as the best single egg holiday of the year, the market responded by climbing 30% on average in the 6 weeks leading up to the holiday from 2000-2015. 2016’s Easter market was considered a bust by most involved, as prices failed to gain any traction and remained flat at $1.11 per dozen through the holiday marketing period.
CURRENT CONDITIONSProduction levels have almost fully returned to pre-HPAI norms, but demand has been slow to recover. Exports are beginning to return, but are hindered by adequate global stocks and the recent strength of the U.S. dollar. Egg product usage has begun to recover, though sales have yet to return to normal, especially in the ingredients category. Industry participants still suggest finished product business could be down between 15%-20%. Several major bakery buyers have told Urner Barry that they have found
Continued on page 18
220
250
280
310
340
0.50
0.90
1.30
1.70
2.10
1992 1994 1996 1998 2000 2002 2004 2006 2008 2010 2012 2014 2016
Layers in Millions
$/dz
n.
Average MW UB Large Average Egg Type Layers Projection
Source: Urner Barry, USDA, Projections by The Egg Industry Center
Actual Layers & Projection vs. Midwest Large Market
“Production levels have almost fully returned to pre- HPAI norms, but demand has been slow to recover.”
©M
irjan
a Rist
ic
ESTHERVILLE FOODS, INC.
Estherville, IA712-362-3527 SIOUXPREME
EGG PRODUCTS, INC.Sioux Center, IA
712-722-4787
SONSTEGARDof GEORGIA
Gainesville, GA770-534-5644 SUN RISE
FARMSHarris, IA
712-735-6010
SONSTEGARDFOODS, INC.Sioux Falls, SD 605-338-4642
SONSTEGARDFOODS, INC.Springdale, AR479-872-0700
P A C K E R S O FLIQUID,
FROZEN, DRIED& SHELL EGGS

18 • URNER BARRY’S REPORTER / VOL. 11, NO. 3 / SUMMER 2016
EGG AND EGG PRODUCT MARKET
ways to replace or reduce egg usage by as much as 50% and do not plan on returning because of recent supply issues and price volatility.
Retail demand has begun to rally around features, but there are still a number of chains who have yet to fully adjust prices from HPAI-related highs. Spreads between specialty eggs and generic eggs are normalizing though, motivating consumers back to more regular shopping patterns, especially where dozens are promoted below the dollar mark.
Given production trends and demand conditions, wholesale markets have hit some of the lowest levels seen in the last 10 years. Shell eggs to finished egg products have dipped well below longer term average levels and producers are struggling to recapture normal business volumes internationally and at home.
As we head into the summer months, the worst period for shell egg sales seasonally,
the egg industry faces another uphill battle. This time, the challenge will be to rekindle lost demand and grow sales to
absorb the additional layers expected to make their way into production by the end of the year.UB
Continued from page 17
800-377-3447www.nucalfoods.com
Eggs can’t get any fresher!
Serving the Western United States...
Our family farms dedication to excellence, integrity and quality
ensures that NuCal Foods and Rocky Mountain Eggs are your best source
for premium quality conventional and specialty eggs.
0.50
1.00
1.50
2.00
2.50
3.00
2006 2007 2008 2009 2010 2011 2012 2013 2014 2015 2016$/
dzn.
UB Midwest Large Market
Source: Urner Barry
“Given production trends and demand conditions, wholesale markets have hit some of
the lowest levels seen in the last 10 years.”
Dolphin Trading, Inc. is an exporter of
agricultural commodities with a focus on shell eggs
Our main areas are the Middle East, Europe,
Far East and Caribbean
Dolphin Trading, Inc.
P.O. Box 82191 Atlanta, GA 30354
PRIMARYAGRICULTURAL
PRODUCTS
FRESH SHELL EGGS
EGG PRODUCTS
APPLES
PEARS
CITRUS

VOL. 11, NO. 3 / SUMMER 2016 / URNER BARRY’S REPORTER • 19

20 • URNER BARRY’S REPORTER / VOL. 11, NO. 3 / SUMMER 2016
EXPORTSAt this time last year, we were all unaware of how truly damning Highly Pathogenic Avian Influenza (HPAI) would end up being for U.S. chicken exporters. While bird flu did not spread throughout the commercial chicken industry, it may as well have. The loss of some of our biggest trading partners via bans resulted in an increased supply of chicken, mainly dark meat, on the domestic market. Prices subsequently plummeted. Since about the start of 2016, export demand has steadily improved. Most of the trade bans that were put in place because of AI have since been lifted. As of May, the USDA is forecasting a year-over-year increase in chicken exports, both in terms of volume and value. However, it’s unlikely that exporters will get to see a market that matches that of 2014’s.
COLD STORAGEWhat isn’t immediately consumed, finds its way into cold storage. According to the USDA, chicken stocks through April 30th were 5 percent higher than in April of 2015, and 2 percent higher than the prior month. While total holdings are still less than they were in Q4 2015, 2016’s levels remain 26 percent higher on average than 2014’s. Breasts and breast meat are the leading category by far with over 186 million pounds inventoried; a 24 percent increase over last year. Leg quarter holdings have declined steadily since Q4 2015. In April, there were 109 million pounds in cold storage at month’s end, the second lowest level since June 2014. Wing stocks have climbed to 79 million pounds, 76 percent higher than April 2015.
BONELESS BREAST MEATAfter reaching $1.71/lb. in 2015, jumbo boneless/skinless breast meat values fell sharply during the winter months to $1.07/lb., its lowest level since 2008. Again, the market was flooded with additional product during a period when demand is historically light. So far this year, breast meat has not performed anywhere near as well as expected. In fact, at the time of this writing, jumbo breast meat was valued at its lowest level for the month of May since 2006. Processors are hopeful that summer demand will help to stabilize the market, but nothing’s a guarantee anymore, especially since supply is trending higher.
TENDERSTenders have certainly been an interesting item to watch in 2016. Demand, while mostly seasonal, has been stronger than expected. After months of seemingly “bucking the trend,” the spread between tenders and jumbo breast meat grew to its widest margin since 2000. Tenders had been trading at a premium for more than two years, but more recently their value topped out at
By Terence Wells | [email protected]
So far, 2016 has been a challenge for anyone who is trying to navigate the chicken industry. While the market has certainly had its ups, advances in head count and weight have at times proved debilitating to the undertone of the chicken complex.
A lot has changed in the last year and a half. In mid-2014, market values for most items reached multi-year highs. If asked to identify what drove prices lower, many might say, “increased slaughter.” While overproducing certainly impacts the performance of any commodity, it’s not the only reason why the chicken market has been under pressure over the last 12 to 18 months. Other factors such as competing meats, exports, disease, weather, oil and currency have, and continue, to play a major role.
PRODUCTIONThe U.S. Department of Agriculture’s (USDA) Chickens and Eggs report is one of the best tools industry observers have in determining future production. Through April, the number of pullets hatched for domestic supply flocks was higher by 6.9 percent YTD. According to the USDA’s Broiler Hatchery report, weekly egg set and chick placement figures have shown increases of 0.2 percent and 0.5 percent, respectively. While the year-over-year comparison of eggs and chicks does not show a dramatic difference, 2016’s numbers are still significantly higher than 2014’s.
SLAUGHTERYTD slaughter is averaging 157 million head per week in 2016, up 1.5 percent compared to last year. Average live weights have also climbed by about 0.1 lb. to 6.17 lbs. per bird, an increase of just under 1.5 percent. While this year’s average live weight does not appear to be significantly heavier than last year, it’s still heavier nonetheless (see chart below). Although the increases to head count and weight are moderate, when combined, they add up to 3 percent more ready-to-cook (RTC) weight.
Supply: about the only thing that’s guaranteed anymore
CHICKEN MARKET
151
153151
155
157
5.735.82
5.83
6.08
6.17
5.60
5.70
5.80
5.90
6.00
6.10
6.20
146
148
150
152
154
156
158
2012 2013 2014 2015 2016
Lbs. Per Bird
Hea
d in
Mill
ions
Young Chickens SlaughteredWeekly Average thru April
Head CountAvg. Live Wt.
Source: USDA, Urner Barry
1
Continued on page 22

VOL. 11, NO. 3 / SUMMER 2016 / URNER BARRY’S REPORTER • 21

22 • URNER BARRY’S REPORTER / VOL. 11, NO. 3 / SUMMER 2016
CHICKEN MARKET
more than $0.60 over that of breast meat. This phenomenon has stumped even some of the most experienced chicken industry professionals.
What we’ve learned may help to answer some of your questions, but likely not all
of them. While history suggests that buyers of tenders usually switch over to breast meat when the spread in values makes sense financially, it seems that some of them are not as likely to do this anymore. The reason why may very well be related to the quality of meat, or lack thereof, that’s coming from jumbo birds. A second explanation comes from the foodservice
sector. We’re all well aware of how popular wing-focused restaurants have become; similarly, there are several QSRs or fast food chains that feature tenders in their menus. They too have added plenty of units over the last few years and with that comes an increased demand for tenders.
WINGSWings are America’s favorite finger food, there’s no denying that. Sure, demand is still at its best during the fall and winter when football and basketball are in full swing, but it certainly isn’t limited to those months anymore.
Continued from page 20 Consumers are eating wings year-round and it’s clearly impacting the market. In 2015, more than 300 wing-focused restaurant units were added to the mix, and there’s more coming in 2016.
What may be the more interesting storyline here though, is that jumbo wings are now valued higher than small/medium sized wings. Since 2004, small/medium wings have regularly traded at a premium to jumbo wings. Only a handful of times during the last 12 years did jumbo wings actually surpass small/medium wings in value, the widest margin being $0.09. This past November, jumbo wings flew by small/medium and haven’t looked back since (chart 2). As previously mentioned, the number of wing-focused restaurant units continues to grow, therefore so does demand for jumbo wings. Because the industry is growing bigger birds and more of them, the availability of jumbo wings better suits those involved in the wing-focused restaurant sector. The spread between jumbo wings and small/medium wings reached as high as $0.23 in April.©
iStoc
kpho
to.co
m/N
ame
TRADERS OF A FULL LINE OF
FRESH & FROZEN POULTRY
PRODUCTSAlan Singer
25 West Union StreetAshland, MA 01721Tel. 508-231-1426 Fax 508-231-5256
Hector Perez320 Miracle Mile, Suite 202
Coral Gables, FL 33134Tel. 305-620-0700Fax 305-620-0366
Egil J. Brull Jr. Puerto Rico
Tel. 787-277-3000Fax 787-277-3002
35 YEARS OF NATIONAL SERVICE WITH PRIDE

VOL. 11, NO. 3 / SUMMER 2016 / URNER BARRY’S REPORTER • 23
“…the spread between tenders and jumbo breast meat grew to its widest
margin since 2000”0.75
1.00
1.25
1.50
1.75
2.00
Jan '14 Apr '14 Jul '14 Oct '14 Jan '15 Apr '15 Jul '15 Oct '15 Jan '16 Apr '16
$/lb
.Price Comparison Wings vs. Jumbo Wings
WingsJumbo Wings
Source: Urner Barry
2
LEG QUARTERSSo far in 2016, leg quarters have not been anywhere near as burdensome as they were last year, thanks in large part to the continued absence of HPAI. It’s been a long road to recovery, however, over the last several months and likely coinciding with most of the trade bans being lifted, demand for dark meat has steadily improved and so have the values. Still one of the most affordable protein options in today’s market, leg quarters offer buyers a great value for limited cost. Since the start of this year, fresh leg quarter prices have climbed $0.14 to $0.35/lb., an increase
of 67 percent. While the market seems to have slowed down some in recent months, dark meat is still very well supported. Barring any random acts of nature (i.e., AI), it should remain this way into the near future.
COMPETING MEATSNot only is there more chicken available, but now there’s more beef and pork too. The red meat industry is far removed from the supply shortages that restricted them in 2014. Market prices for many cuts have retreated considerably to multi-year lows; this comes just two years after many of
these very same cuts reached record highs. Healthy competition between red meat and poultry has been restored. While wholesale prices of beef and pork have come off considerably, many retailers have been slow to pass the savings on to the consumer. That’s why we continue to see more favorable beef and pork features in our weekly circulars, rather than chicken.
MARKET OUTLOOK Looking ahead, the USDA is forecasting an annual production increase of 2.6 percent (May) or 1.052 billion pounds. For the balance of 2016, one might draw the conclusion that if demand does not exceed expectations, then market values will remain in check.UB

24 • URNER BARRY’S REPORTER / VOL. 11, NO. 3 / SUMMER 2016
and, if not battling a ban, the strong dollar or deteriorating oil prices hurt some of the U.S. industry’s developing trade partners. With breast meat values booming and whole birds setting up for a record year, devalued parts and thigh meat didn’t raise as many eyebrows as they normally would in early 2016.
The early part of the fourth quarter found whole bird supplies giving buyers few options from which to choose. Consistent business patterns resulted in Urner Barry’s quotations hitting record heights by September where they remained until seasonable pressure started playing its role by Thanksgiving. From the all-time high of $1.40/lb., whole bird quotations declined $0.20 to $1.20/lb. by year’s end; $0.09 above 2014 and the highest closing value ever (chart 1). Breast meat prices left observers speechless by maintaining their all-time high market presence until the second week in December. Declining slaughter spurred by bird losses and greater numbers of heavy hens being raised, allowed trade sentiment rather than aggressive demand to provide support until finally giving way and losing $0.25/lb. in the year’s final weeks. Thigh meat started the quarter with little demand to prop up
By Russell W. Whitman | [email protected]
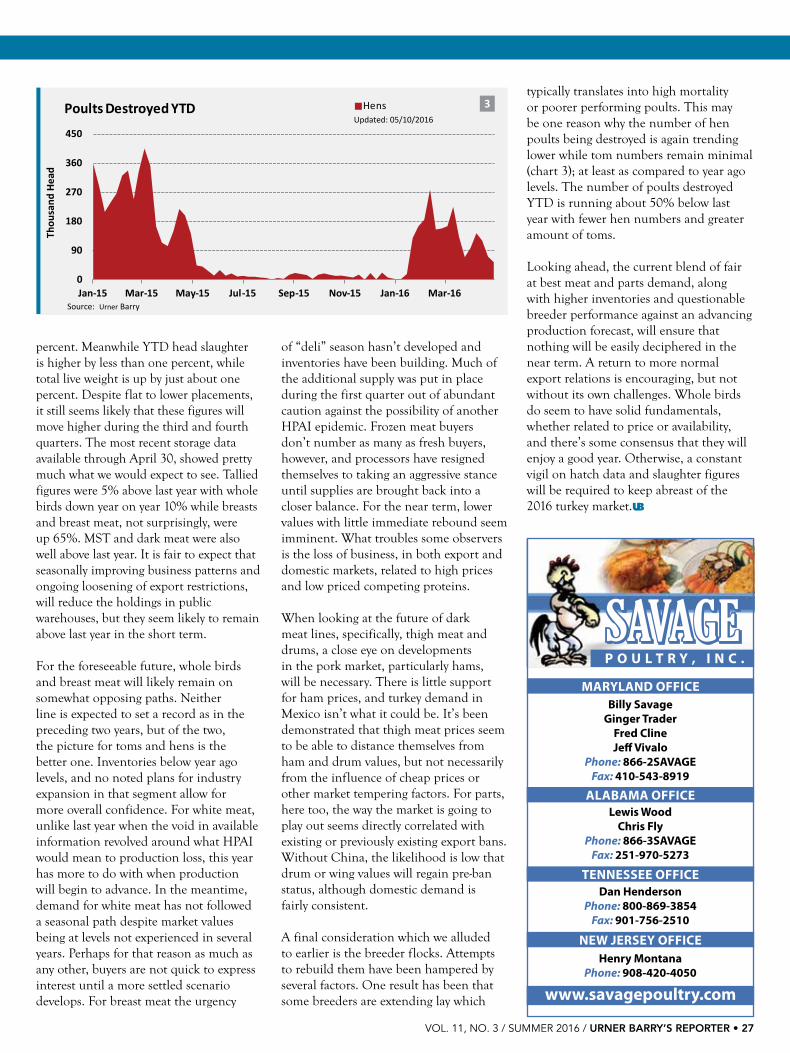
Thankfully, as it relates to production, 2016 is shaping up pretty much as anticipated and along more traditional lines as compared to a year ago. Without a reoccurrence of Highly Pathogenic Avian Influenza (HPAI) since the Indiana cases in December 2015, for the most part, available eggs and viable poults have been coming to slaughter without any significant or unexpected influences. Processors have regained some ability to be gender selective while slaughter numbers, as well as weights, are beginning to trend upward. The news that Mexico has lifted its avian influenza-based import restrictions on raw poultry from 14 of the 15 states previously impacted by trade bans, could not have been more welcome for the U.S. turkey industry.
A quick glance back at the close of 2015 found the third quarter markets heavily divided. On one side of the divide was whole birds, institutional breasts and breast meat, and they were immersed in record high markets. On the other side were parts and thigh meat which were suffering from AI-rooted export bans
TURKEY MARKET
4310UrnerBerryAd.indd 1 7/19/11 9:29 AM
Struggling meat and parts contrast solid whole bird market

VOL. 11, NO. 3 / SUMMER 2016 / URNER BARRY’S REPORTER • 25
values and found none through year’s end. Competing ham prices, ongoing export bans and an unfavorable dollar/peso relationship contributed to thigh meat retreating $0.20/lb. and still seeking placement opportunities.
As they had during the prior six months, parts struggled during the fourth quarter. Market values far underperformed what they are capable of in a normal export environment. If not rooted in various export bans, international currency and liquidity issues stifled potential through other non-traditional avenues.
Depending on how it is viewed, the quarter’s static condition was largely a result of AI. The domestic front was in a stalemate as more typical seasonal pressures on whole birds and breast meat never developed. Parts and thigh meat were unchanged to lower for the three months. Without export demand from China and other leading export destinations, parts had fewer channels to flow through and values remained pressured.
In the closing months of 2015 hatch figures were lower YoY; cumulatively declining about 4%. When taken with the rest of 2015, RTC production declined 2.3% while head count was down for the year 1.9%. Egg sets closed the year shy of 3% below 2014 while poult placements were a little under 2%. December 31 whole bird holdings closed at 53.6 million pounds; 10% below last year. Total turkey stocks were 200 million pounds, 4% below last year, but among the lowest totals in recent history.
At the start of the New Year, production was still lagging behind 2015 levels and market values remained historically high
for whole turkeys and breast meat. Parts and thigh meat remain depressed, only recently showing some life in the wake of the previously mentioned news out of Mexico. As the quarter wore on, low input costs helped ease some processor concerns, but buyers were still withdrawn and ignored breast meat offerings to the growing distress of those starting to build stocks. Forecasts of increased production, which would further enhance on hand supplies, were well entrenched in industry dialogue. And with further processors having to work through existing raw and Continued on page 26
1.0
1.1
1.2
1.3
1.4
Jan Feb Mar Apr May Jun Jul Aug Sep Oct Nov Dec
$/lb
.2014 20152016 '13-'15 avg.
UB Turkey, Toms,EastFrozen 16 Pound TL
Source: Urner Barry
1
CONTACT:Kent Puffenbarger, Patrick Fowler or Kate Prestage Poplin
www.PrestageFoods.comSt. Pauls, NC 28384 • 1-800-679-7198
• Retail and Export • • Fresh & Frozen • Whole birds • • Bone-in breast • Tray pack • • Map grind • Ground chubs • • Private label is available •
cooked inventories, even much lower prices failed to stimulate business. As a rule though, the first quarter of 2016 behaved pretty much as expected with most market quotations representing limited negotiated sales and lower trends through the end of March. Whole birds were a noted exception and reflected strong conditions. Despite advancing stocks of just about all the other lines, toms and hens remained in close balance. Without indications for any expansion in the whole bird arena, buyers surfaced and the market found support at $1.18, the highest first quarter market floor on record. Despite a slow drift in the Hatch Report figures towards advancing destruction of poults, it again was hen poults that fell out of favor, supplying further impetus to enter the whole bird market earlier than later. By the end of Q1, tom and hen values had turned the seasonable corner, but were well behind the frenetic pace established last year. Market values were running $0.14 above the same period in 2015. Thigh meat

26 • URNER BARRY’S REPORTER / VOL. 11, NO. 3 / SUMMER 2016
movement was very sluggish throughout the period. By April, with no additional HPAI incidences, breast meat values eroded further as various motivations prompted suppliers to be more vocal in their efforts.
So, Q1 2016 market performance was nothing to write home about, even though on paper whole birds and breast meats looked pretty good. However, with advancing production and little demand, breast meat stocks were growing along with inventories of parts and thigh meat. The export component helped keep pressure on wings and necks. Drums found some life in domestic placement opportunities and from Mexico by mid-April.
Buyers who were counting on steady production increases and no reoccurrences of AI to bring breast meat values back into more “traditional” territory, saw that come to fruition. In fact at the outset of the year, when available discounts of most all white oriented raw materials seemed so attractive
as compared to where they had hovered during most of last year, buying took place at such a clip that after the initial rush of low prices played their role, opportunities at even further discounts surfaced only to fall on deaf, less than needy ears (Chart 2).
By May the market had undergone significant corrections. Participants started to wonder if it wasn’t the time to recommence buying. Only retail-oriented
lines still hovered above 2015 price levels. In this arena, low inventories, and little if any anticipated expansion, drove buyers towards purchases at a fairly seasonal pace. Most parts, thigh meat and breast meat were well below a year ago. Drums, wings and thigh meat, which had been most severely impacted by trade bans, were still struggling, even at current market lows. Whole birds and consumer breasts had an excellent year last year and they continued to be well regarded by analysts. The strong position of hens is being aided by this past January’s record-high, market-low, at $1.18/lb. As of this writing, breast meat is $1.35 below last year but more noteworthy has corrected $3.45 since the start of 2016. So the market has stepped back; now what sellers are hoping is that buyers step up.
Looking ahead, the potential for the 2016 whole bird market to exceed last year’s record heights seems very low, although few will argue against it being another solid year. As for dark meat, the market has been depressed so far this year as competitive pressures from cheap hams, along with export bans and currency issues, has diminished both demand and support levels. Drums have been driven to five year lows while thigh meat values are as low as they’ve been since early 2013.
On the production front, Urner Barry Hatch Report figures suggest that slaughter increases will be slower in advancing than initial indications suggested. The latest hatch from early May projected forward 20 weeks for a tom, indicates that as far out as October additional kill doesn’t seem likely. The most recent USDA figures are forecasting RTC production to increase 6.8
TURKEY MARKETContinued from page 25
2.02.53.03.54.04.55.05.56.0
Jan Feb Mar Apr May Jun Jul Aug Sep Oct Nov Dec$/
lb.
2014 20152016 '13-'15 avg.
UB Turkey MeatBreast, Tom, Fresh
Source: Urner Barry
2
From the Farm to Deli, we are your Source
for Turkey!Buyers & Sellers
Domestic & International“Alliance Builders” of:
Whole Birds, Bone in Breasts, Raw Meats, Tray Pack Parts, Further Processed Products,
Turkey Hatching Eggs,Turkey Poults, Live Contracts
Jeff Stauffenecker • Carl WittenburgSara Almich
100 Prairie AvenueBrooten, MN 56316
Phone: 320-346-4033Fax: 320-346-4038
Toll Free: 1-877-BUY-TURK
www.PROTEINALLIANCE.com
VOL. 11, NO. 3 / SUMMER 2016 / URNER BARRY’S REPORTER • 27
P O U L T R Y , I N C .
Billy SavageGinger Trader
Fred ClineJeff Vivalo
Phone: 866-2SAVAGEFax: 410-543-8919
MARYLAND OFFICE
ALABAMA OFFICE
TENNESSEE OFFICE
NEW JERSEY OFFICE
SAVAGESAVAGE
www.savagepoultry.com
Lewis WoodChris Fly
Phone: 866-3SAVAGEFax: 251-970-5273
Dan HendersonPhone: 800-869-3854
Fax: 901-756-2510
Henry MontanaPhone: 908-420-4050
percent. Meanwhile YTD head slaughter is higher by less than one percent, while total live weight is up by just about one percent. Despite flat to lower placements, it still seems likely that these figures will move higher during the third and fourth quarters. The most recent storage data available through April 30, showed pretty much what we would expect to see. Tallied figures were 5% above last year with whole birds down year on year 10% while breasts and breast meat, not surprisingly, were up 65%. MST and dark meat were also well above last year. It is fair to expect that seasonally improving business patterns and ongoing loosening of export restrictions, will reduce the holdings in public warehouses, but they seem likely to remain above last year in the short term.
For the foreseeable future, whole birds and breast meat will likely remain on somewhat opposing paths. Neither line is expected to set a record as in the preceding two years, but of the two, the picture for toms and hens is the better one. Inventories below year ago levels, and no noted plans for industry expansion in that segment allow for more overall confidence. For white meat, unlike last year when the void in available information revolved around what HPAI would mean to production loss, this year has more to do with when production will begin to advance. In the meantime, demand for white meat has not followed a seasonal path despite market values being at levels not experienced in several years. Perhaps for that reason as much as any other, buyers are not quick to express interest until a more settled scenario develops. For breast meat the urgency
of “deli” season hasn’t developed and inventories have been building. Much of the additional supply was put in place during the first quarter out of abundant caution against the possibility of another HPAI epidemic. Frozen meat buyers don’t number as many as fresh buyers, however, and processors have resigned themselves to taking an aggressive stance until supplies are brought back into a closer balance. For the near term, lower values with little immediate rebound seem imminent. What troubles some observers is the loss of business, in both export and domestic markets, related to high prices and low priced competing proteins.
When looking at the future of dark meat lines, specifically, thigh meat and drums, a close eye on developments in the pork market, particularly hams, will be necessary. There is little support for ham prices, and turkey demand in Mexico isn’t what it could be. It’s been demonstrated that thigh meat prices seem to be able to distance themselves from ham and drum values, but not necessarily from the influence of cheap prices or other market tempering factors. For parts, here too, the way the market is going to play out seems directly correlated with existing or previously existing export bans. Without China, the likelihood is low that drum or wing values will regain pre-ban status, although domestic demand is fairly consistent.
A final consideration which we alluded to earlier is the breeder flocks. Attempts to rebuild them have been hampered by several factors. One result has been that some breeders are extending lay which
typically translates into high mortality or poorer performing poults. This may be one reason why the number of hen poults being destroyed is again trending lower while tom numbers remain minimal (chart 3); at least as compared to year ago levels. The number of poults destroyed YTD is running about 50% below last year with fewer hen numbers and greater amount of toms.
Looking ahead, the current blend of fair at best meat and parts demand, along with higher inventories and questionable breeder performance against an advancing production forecast, will ensure that nothing will be easily deciphered in the near term. A return to more normal export relations is encouraging, but not without its own challenges. Whole birds do seem to have solid fundamentals, whether related to price or availability, and there’s some consensus that they will enjoy a good year. Otherwise, a constant vigil on hatch data and slaughter figures will be required to keep abreast of the 2016 turkey market.UB
0
90
180
270
360
450
Jan-15 Mar-15 May-15 Jul-15 Sep-15 Nov-15 Jan-16 Mar-16
Thou
sand
Hea
d
Updated: 05/10/2016
Source: Urner Barry
3HensPoults Destroyed YTD

28 • URNER BARRY’S REPORTER / VOL. 11, NO. 3 / SUMMER 2016
many importers reporting plenty of offerings from overseas packers.
Let’s briefly remember the price hike in the frozen market that occurred in 2012. Prices spiked abruptly as imports in January of 2012 were virtually nil; in other words, the tuna market faced a temporary supply shock causing prices to skyrocket. However, imports in 2012 actually finished the year at near-record levels. As imports continued to grow and both replacement costs and prices in the U.S. trended down, prices for frozen steaks, loins, saku blocks, and other product forms regained stability. Tuna made it back to menus across the country as well as to retail cases. Total tuna frozen imports of steaks, loins, and other product forms—not whole fish—reached a record high of 56.7 million pounds in 2015. Imports through Q1 2016 are also at record levels (Chart 1).
Replacement costs and prices in the U.S. wholesale market have also remained quite steady since approximately late 2013 and early 2014. Still, floor price levels for replacement and the U.S. wholesale market did not return to the pre-supply shock levels. Rather, prices regained stability at a slightly higher level leading us to assume that demand strengthened and has remain strong and consistent ever since (Chart 2).
Turning our attention to the fresh market, fresh whole tuna imports ended 2015 at 34.2 million pounds, just below the 5-year average but without causing any market disruptions. As of Q1 2016, imports are up 11.8 percent compared to the first quarter of 2015, but are 5.5 percent below 2014 (Chart 3). Because imports seasonally peak in May, import volumes and domestic landings do not generally impact the market in January and February; however, both replacement and wholesale prices do reach a seasonal high in March, just as imports and domestic landings begin to increase due to a strengthening seasonal demand (Chart 4).
As we look at the total landings for domestic and imported yellowfin tuna we can see a trend in production. Imports and domestic landings typically peak from May to August due to increased production both domestically and abroad. When domestic landings peak, imports slightly contract, but overall total supplies of yellowfin tuna reach their highest levels during this time
By Angel Rubio and Nicole [email protected] | [email protected]
The yellowfin tuna market has enjoyed relative stability over the past three years or so as the market gradually adjusted from the supply shock of late 2011 and early 2012. The fresh and frozen markets have remained mostly steady for both replacement and wholesale prices since approximately June 2013. Granted, the fresh market will experience greater volatility due to seasonal catches and availability, but even so, seasonal prices have remained within historical bounds. The frozen market on the other hand, has seen imports grow noticeably reaching record highs in 2015. So far, strict law enforcement from Indonesian fishing agencies has not had an impact on supply availability, with
Desired stabilityYELLOWFIN TUNA MARKET
3.0
4.0
5.0
6.0
7.0
8.0
9.0
2009 2010 2011 2012 2013 2014 2015 20160
1
2
3
4
5
6
$/lb
.
Million lbs.
Record Linear Imports, '14 thru '16UB Avg. Quote vs. Imp $/lb.
Tuna Fz Fillet Imp VolFz Fill. Imp$/lb.UB avg 6,8 oz. 5-7 loin
Source: USDOC, Urner Barry
2
3.56
3.35
2.10
3.01
2.71
4.34
4.41
3.13
3.85
0.08
3.41
3.12
4.53
4.14
49.2
36.2
44.440.5
45.2
56.7
0
10
20
30
40
50
60
0.00.51.01.52.02.53.03.54.04.55.0
2010 2011 2012 2013 2014 2015 2016
Million lbs.
Mill
ion
Lbs.
Q1 Monthly Avg. ImportsSource: USDOC, Urner Barry
Q1 Avg. Jan Imports Total Yearly Imports 1
31.335.3 34.5 34.9 35.3 35.6
34.2
5.8 4.4 6.2 8.1 6.6 8.5
7.7 7.7
8.7
8.1
7.7
9.0
7.6
8.5
6.5
7.0
7.5
8.0
8.5
9.0
9.5
0
10
20
30
40
50
2009 2010 2011 2012 2013 2014 2015 2016
Million lbs.M
illio
n lb
s.
Fresh Whole Yellowfin Tuna ImportsYTD, Total + Dom Landings
Tot Imp Vol Dom Landings YTD Imports3
Source: USDOC, Urner Barry, NMFS

VOL. 11, NO. 3 / SUMMER 2016 / URNER BARRY’S REPORTER • 29
period (Chart 5). In years past, as supplies become plentiful into the summer months, we have seen a downward trend in tuna prices. Thereafter, demand for fresh tuna remains relatively stable throughout the year, particularly for higher grades.
Overall, the tuna market is currently enjoying stable supplies for both fresh and frozen product and (as a result) steady prices. This is rather good for importers, distributors, retailers, and foodservice operators as they can enjoy consistent margins and thus provide the consumer with a great tasting item throughout the year. In the end, consistent prices and availability is appealing to consumers.UB
3.90
4.40
4.90
5.40
5.90
6.40
6.90
2.0
2.5
3.0
3.5
4.0
4.5
Jan Feb Mar Apr May Jun Jul Aug Sep Oct Nov Dec
Mill
ion
lbs.
Imports+Dom Landings'11-'15 avg. UB $'11-'15 avg. Imp$/lb.
Fresh Whole Yellowfin TunaSeasonal Imports vs. Imp.$.lb and UB quotes
Source: USDOC, Urner Barry, NMFS
4
$/lb
.
2,49
9
2,51
5
3,05
1
3,16
4
3,67
1
3,25
0
3,13
6
2,92
7
2,65
3
2,70
3
2,55
3
2,90
2
499 390 372 361
416 632 711 784
727 849 444
415
0
1,000
2,000
3,000
4,000
5,000
Jan Feb Mar Apr May Jun Jul Aug Sep Oct Nov Dec
Thou
sand
lbs.
Dom. Landings
'12-'15 avg. ImportsAverage Monthly Imports+Domestic
Seasonal peak monthsSource: USDOC, Urner Barry, NMFS
5
“…the fresh market will experience greater volatility
due to seasonal catches and availability, but even so,
seasonal prices have remained within historical bounds.”
TRI-STATE AREA’S LARGESTINDEPENDENT SUPPLIER
Hunts Point Co-op Market, Building #E, Bronx, New York 10474
Telephone (718) 842-8500

30 • URNER BARRY’S REPORTER / VOL. 11, NO. 3 / SUMMER 2016
rather peculiar given its low price volatility compared to a number of other fresh seafood markets (e.g salmon, tuna). One explanation could be that only a handful of supplying companies control about two-thirds of imported volumes bound to the U.S. market, which increases selling power. In addition, most of these companies are either vertically integrated from farm to distribution, or are in some sort of joint venture with their farms, which allows them to limit the volume placed in the spot market and reduces volatility. In other words, this integration allows importers to market and plan production according to contracts or programs previously negotiated. Every now and then there are hiccups in supply, but these have been limited, sporadic and short-lived.
We now turn our attention to pangasius, which is scientifically a fish in the order of siluriformes and part of the catfish
By Angel [email protected]
Two of the most consumed fish species, tilapia and pangasius, are two of the few protein markets currently enjoying relative price stability at wholesale. The tilapia market has remained stable without major price hiccups throughout the first five months of 2016, particularly for frozen fillets. Fresh fillets have also remained mostly steady while import $/lb. has adjusted lower since January 2015. Pangasius has remained relatively steady since 2013, however, could be in for a ride as the USDA has taken over inspection duties from the FDA. As we approach the summer months, new tilapia harvests will provide a better picture of the market’s potential future. Regarding pangasius, we are still in the transition period time frame, so for now, things are relatively steady.
The tilapia market, led by frozen fillets mainly from China, has seen prices at the wholesale level decrease since June 2014. Only in January 2016 did prices in the U.S. finally stop dropping, ending an 18-month streak of consecutive price declines. Now that we are heading into the summer harvest time in China, it will be interesting to see what happens to prices. There seems to be an incentive for producers to harvest less tilapia as the import $/lb. fell in September 2015 to a level not seen since late 2010 (Chart 1). There are some reports out of China that restocking may be lower than last year. Now that prices have come down, there might be plenty of motivation for U.S. importers to increase purchases. Inevitably, if this is the case, fundamentals will suggest a price increase. The issue itself is really not whether prices are relatively high or low, but rather the marginal rate at which they move up or down. Sudden price hikes tend to occur because demand in the short term is, for the most part, inelastic; this means that previous commitment plans and budgets cannot adjust immediately to such changes, so the price is therefore absorbed. However, after some time, these budgets, plans and/or commitments adjust to these new relatively high price levels. It is at this point that volume demand tends to decrease. This
Tilapia stalls, pangasius keeps growing
was the case in 2015 when imports fell 4.5 percent from 2014 (Chart 2) as import $/lb. reached a record high in June and July 2014. Imports through Q1 in 2016 are 18 percent lower than in 2015. However paying too much attention to this number can be misleading since imports tend to drop steeply between February and March before they hit a seasonal low in April.
The fresh fillet market, on the other hand, has remained steady since it last adjusted downward during Q1 of 2015. Since then, prices reported in the U.S. wholesale market have hovered within listed levels. However, import $/lb. did adjust downward throughout all of 2015 until it hit its lowest level since April 2008 (Chart 3). Imported volumes have also been bouncing within 52 and 59 million pounds per year. Imports through Q1 of fresh fillets are down 5 percent compared to last year. The fresh tilapia market is
TILAPIA, PANGASIUS & CATFISH MARKET
0
10
20
30
40
50
1.30
1.50
1.70
1.90
2.10
2.30
2.50
2.70
2.90
2007 2008 2009 2010 2011 2012 2013 2014 2015 2016
Million lbs.$/
lb.
Volume*Import Value per lb.UB Pricing
Source: Urner Barry, USDOC
Linear Imp $/lb. vs All Sizes UB Quotations(weighted: 3-5s 65%, 5-7s 25%, 7-9, 10%)
1
371
352
364
348
335
340
345
350
355
360
365
370
375
2012 2013 2014 2015
MIll
ion
lbs.
Tilapia Frozen Fillet ImportsSource: USDOC
2

VOL. 11, NO. 3 / SUMMER 2016 / URNER BARRY’S REPORTER • 31
market even though it cannot legally be referred to as such. This year, the FDA completed transferring catfish inspection duties to the USDA’s Food Safety and Inspection Service (FSIS). The program was passed last November and requires that domestic and imported catfish of the siluriformes order be subject to mandatory inspection by the USDA. Although the program was engulfed in controversy for being duplicative and costly, primary inspection responsibilities for catfish were transferred to FSIS on March 1, 2016 for domestic producers and on April 15, 2016 for importers.
Under the law, domestic producers are required to have 24-hour continuous inspection at their processing plants. This is similar to USDA requirements for meat and poultry processors in the U.S. Overseas producers, meanwhile, must prove that their operations comply with U.S. food safety protocols. These operators are currently working under an 18-month grace period to get their facilities into compliance.
In late May 2016, the U.S. Senate fast tracked a vote to disapprove the USDA’s catfish inspection program. As of press time, Joint Resolution 28 was pending a vote by the House and a signature from the White House. The status quo for the program remains unchanged during the legislative procedures.
At the moment the market has not been impacted majorly. We have only witnessed a slight price increase fueled by uncertainty just prior to the transfer dates. The market has remained mostly steady with import volumes hitting a record high in 2015, as well as through Q1 of 2016. This uncertainty saw U.S. buyers import
record amounts of pangasius in January and February this year. For the quarter, imports reached 70.4 million pounds; 5.6 million pounds more than the previous record set in 2014 (Chart 4).
The domestic catfish market had remained mostly steady since last year’s report only to see prices firm on almost all sizes in early May. Processors reported low inventories and short raw materials after the depletion of the winter stock. Demand has been rated fair to moderate.
Overall, these markets are basically waiting for further developments to unfold. Market participants in the tilapia market are likely to be alert as we approach summer harvests in China and thus assess their buying positions. Pangasius processing plants and farms in Vietnam have less than 18 months to comply with FSIS requirements if pangasius is to be shipped to the U.S. after September 2017 and if Joint Resolution 28 fails to clear Congress and the White House. In the meantime, major seafood companies will pay close attention to these two markets as they represent two of the largest frozen fish fillet markets in the U.S.UB
“UNDER THE LAW,
DOMESTIC PRODUCERS
ARE REQUIRED TO HAVE
24-HOUR CONTINUOUS
INSPECTION AT THEIR
PROCESSING PLANTS.” 3.8
4.0
4.2
4.4
4.6
4.8
5.0
-5%
0%
5%
10%
15%
20%
25%
2008 2009 2010 2011 2012 2013 2014 2015 2016
Million Lbs.
% C
hang
e in
$/l
b. u
sing
Log
YTD Avg. Monthly ImportsImp $/lb, % ChgUB $/lb, % Chg
Price and Volume TrendMo. % chg in Imp $/lb - UB $/lb - Avg. Mo. Imports
Global decline in comm $
Mkt correction, and stability
Replacement dallingthroughout '15
3
0
5
10
15
20
25
30ja
nfe
bm
ar apr
may jun jul
aug
sep
oct
nov
dec
Mill
ion
lbs.
2014 20152016 '13-'15 avg.
Cyclical Behavior of Total Imports
44.1
64.9
59.0
70.4
- 30 60 90
2013
2014
2015
2016
Million lbs.
YTD Imports frozen fillets pangasius from Vietnam (Jan-Mar)
4
CUSTOMIZED INSURANCE PROTECTION FOR THE
FOOD INDUSTRY
Property and Liability Cargo & Warehouse
Earthquake, Flood and WindstormUSFDA Rejection & Lacey Act
Product Recall Foreign Travel
Call Ray Markley at
800-350-5647food@shorepointinsurance.comwww.shorepointinsurance.com
License #0247753

32 • URNER BARRY’S REPORTER / VOL. 11, NO. 3 / SUMMER 2016
output 13 percent from its original projections for the year. From a volume perspective, the full weight of the bloom has completely materialized. Reductions to volumes are expected to happen in the second half of the year, as many of the lost fish were of smaller sizes. Throughout the Lenten season the markets remained high, then a seasonal slide began after the Easter holiday. Supply looked
to be tightening up and pricing was trending higher into Mother’s Day when, another supply shock hit the market. A strike by artisanal fisherman in Chile brought production and harvesting to a halt. Urner Barry quotations were delisted for two weeks, the longest time the market had gone unquoted in the past 10 years. Coming out of the strike, pricing
began trending lower and volumes started to flow freely back into the marketplace.
Looking forward to the summer, there is a historical seasonal slowdown for the farmed salmon market. However, what will happen this year is yet to be seen.
WILD SALMONProjections out of Alaska for this year’s salmon harvest are down to 744 million pounds versus 2015’s estimation of 1.072 billion pounds. One factor that affects the projection total is odd and even years for pink salmon. We are on an even year where we typically see a smaller catch of pink salmon in comparison to the
odd years because of their two-year life cycle. Although the harvest projection is lower, the sockeye forecast for 2016 is reported to be the second largest within the last 20 years, and most of the sockeye caught will come out of Bristol Bay.
With the projected lower volumes of wild salmon out of Alaska coupled with the effects of the Chilean algae bloom, the salmon market as a whole could see upward pricing pressure for the second half of the year. However, higher price points are often met with pushback from buyers and a more moderated demand.UB
By Janice Schreiber and Angel [email protected] | [email protected]
FARMED SALMONThe U.S. farmed salmon market continues to see a volatile fresh sector. In 2015, the market saw plenty of supply from all origins; especially out of Chile and Canada. In 2014, wholefish volumes out of Canada were at historic lows, not even reaching 100 million pounds of imported fresh wholefish for the year. In 2015, Canadian volumes rebounded and surged to the highest volumes seen on record, 165 million pounds imported for the year; up 67.2 percent from 2014. 2016 is currently on track to be even higher. Imports for Canadian fresh wholefish are up 11.5 percent and the fresh wholefish category is up 10.6 percent year-to-date (YTD). European fresh wholefish imports are about the same to lower as compared to the same time a year ago. Combining Norway, Scotland and the Faroe Islands, imports are down 3.2 percent YTD through March.
FRESH CHILEAN FILLETS: WHERE THE RIDE BEGINSIn 2014 the Chilean fillet market saw a time that posted both higher imported volumes and higher prices. This was mainly due to a lack of fresh Canadian wholefish. In 2015, Chile also saw historic highs of imported fresh fillet volume; 214 million pounds which was a 5.2 percent YTD increase over 2014. Prices reacted to the increased volumes and pricing fell to under the three-year average for both Chilean fresh fillets and Canadian fresh wholefish throughout the year.
In 2016, Chilean fresh fillets continued to decline, but did adjust seasonally higher during the Lenten season. However, news of a toxic algae bloom broke in early March 2016, and pricing sky-rocketed. The bloom in Chile caused the loss of millions of salmon in the country. The event is expected to cut Chile’s
Volatility in the fresh farmed salmon market continues
SALMON MARKET
0.00.61.21.82.43.13.74.34.95.5
-5
10 15 20 25 30 35 40 45
Mar-09 Mar-10 Mar-11 Mar-12 Mar-13 Mar-14 Mar-15 Mar-16
$/lb.M
illio
n lb
s.
Fresh Atlantic Salmon Imports vs. UB Index Fr. Atl Sal Imp (Fillet Wght)
Salmon IndexSource: USDOC, Urner Barry
©ka
rand
aev

VOL. 11, NO. 3 / SUMMER 2016 / URNER BARRY’S REPORTER • 33
Camanchaca Inc. • 7200 N.W. 19th Street • Suite 410 • Miami, FL USA 33126 • 800.335.7553 • www.camanchacainc.comPesquera Camanchaca S.A. • El Golf 99-Piso 11 • Las Condes, Santiago, Chile • www.camanchaca.cl

34 • URNER BARRY’S REPORTER / VOL. 11, NO. 3 / SUMMER 2016
time this article goes to press, prices for frozen Mahi will have advanced significantly with the market holding a strong undertone (Chart 3).
Similarly, fresh Mahi shipments are also down compared to the prior fishing season. Fresh imports, which actually start in
October, totaled 7.8 million pounds through March, a difference of about 2.1 million pounds compared to 2015 (Chart 4). The figure is
also a five-year-low dating back to the 2010 and 2011 fishing season
(Chart 5).
Buyers say the declines in fresh and frozen Mahi shipments to the U.S. market are mostly because of fishing
shortages from major producers in Central and South America particularly
Ecuador and Peru.
A record El Niño season has been blamed for poor C&SA Mahi production this season. Warmer Pacific waters increased
By Angel Rubio, Michael Ramsingh and Nicole West
The Mahi market is in a conundrum this year. Data shows that Mahi shipments to the U.S. during the current fishing season are significantly lower compared to last year. U.S. importers, and many in the industry, blame supply shortages on El Nino-induced declines in landings from major suppliers in Central and South America.
Frozen Mahi imports to the U.S. are down 36 percent through the 2015-2016 fishing season, which runs from November to March (Chart 1). We came to this conclusion based on the fact that the fishing season starts around the first week of October in Ecuador and Peru and that the first shipments make it to the U.S. by November. The figure also represents a five-year low when looking at it on year-over-year comparison. Generally, Mahi imports peak by the first quarter of each calendar year before tailing off until the major fishing season starts up again in the fourth quarter (Chart 2). As a result, by the
Cautiously firmMAHI MARKET
30.5
16.2
30.8
20.322.8
32.9
21.0
5 yr. avg, 25.6
0
5
10
15
20
25
30
35
'09 -'10 '10 -'11 '11 -'12 '12 -'13 '13 -'14 '14 -'15 '15 -'16
Million lbs.
Mahi Frozen Fillet Imports Season YTD (Nov-Mar)
1
0
2
4
6
8
10
Nov Dec Jan Feb Mar Apr May Jun Jul Aug Sep Oct
Million lbs.
'11-'12 '12-'13'13-'14 '14-'15'15-'16
Cyclical Imports of Mahi Frozen Fillets (incl. fillets, portions, fletch, etc.)
last year
this year
2
©Erich Eggimann
GET CONNECTED!!Bringing Buyers and
Sellers together since 1967!
Processors • DistributorsBrokers • Traders
Retail Buyers Transportation Companies
Supply Companies2014 Osborne Road • Saint Marys, GA 31558
770-535-9901 Fax: 770-535-7385
www.npfda.org [email protected]
NATIONAL POULTRY & FOOD DISTRIBUTORS ASSOCIATION
Mission: To promote the Poultry and Food Dis-tributors, Processors, and Allied industries by bringing them together and providing a forum
to foster long term business relationships.

VOL. 11, NO. 3 / SUMMER 2016 / URNER BARRY’S REPORTER • 35
the abundance of naturally-occurring feeder fish in the traditional Mahi fishing grounds. This means that Mahi were especially difficult to land with traditional bait and line methods according to producers.
As a result, replacement and wholesale prices have moved up in the market. Import prices per pound for fresh whole fish are up 27 percent over last year’s levels with Urner Barry wholesale quotations up about 50 percent compared to last year (Chart 6). Replacement costs for frozen Mahi moved up 6.7percent or 29 cents on average; UB quotations have adjusted 9.6 percent higher or 46 cents on average taking 6, 9 oz portions and 3-5 skin-on natural fillets (Chart 3).
Still, the market is trending far differently compared to the 2010 and 2011 season when prices spiked because of poor inventories. At the time, wholesale prices shot up past $8.00 per pound, which priced Mahi out of the U.S. market for most of 2011.
Buyers are currently keeping a close eye on their Mahi inventories and are likely to do so for the remainder of the year. This will be especially true if imports trend lower into the second and third quarters now that the Mahi fishing season is over until October.UB
2.5
3.0
3.5
4.0
4.5
5.0
5.5
6.0
0
2
4
6
8
Nov-12 May-13 Nov-13 May-14 Nov-14 May-15 Nov-15 May-16
$/lb.
Mill
ion
lbs.
VolumeImp$/lbUB avg (3-5 fill 6 & 8 oz port)
Linear Imports of Mahi Frozen Fillets vs. PriceSource: Urner Barry, USDOC
3
9.3 9.9 9.7 9.9
7.8
5 yr. avg, 9.7
0
2
4
6
8
10
12
'11 -'12 '12 -'13 '13 -'14 '14 -'15 '15 -'16M
illion lbs.
Mahi Fresh Fillet Imports Season YTD (Oct -Mar)
4
0.0
0.5
1.0
1.5
2.0
2.5
Oct Nov Dec Jan Feb Mar Apr May Jun Jul Aug Sep
Million lbs.
'11-'12 '12-'13'13-'14 '14-'15'15-'16
Cyclical Imports of Mahi Fresh WholeMillions on lbs.
last year
this year
5
0
1
2
3
4
5
Jan Feb Mar Apr May Jun Jul Aug Sep Oct Nov Dec
Million lbs.
'11-'12 '13-'14'12-'13 '14-'15'15-'16
Cyclical Import $/lb. Mahi Fresh Whole Fish
6
“A RECORD EL NIÑO SEASON HAS BEEN BLAMED FOR POOR C&SA MAHI PRODUCTION THIS SEASON.”
For domestic inquiries, please contact Vincent Louis at
718-542-4401
Bronx, NY • Blue Springs, MO • Hope Mills, NC • Forest, MSSan Antonio, TX • Manchester, NH • Oceanside, CA
Domestic & International Suppliers of Perishable Food Products
CHICKEN • TURKEY BEEF • PORK • SEAFOOD

36 • URNER BARRY’S REPORTER / VOL. 11, NO. 3 / SUMMER 2016
By Paul Brown [email protected]
Shrimp consumption is up. Data indicates that shrimp consumption (2014) is at 4.0 lbs per capita, up from recent years, yet not a record.
In 2015 shrimp imports into the U.S. reached their second most all-time high behind only 2006 figures. Shrimp prices have receded from their 2013 highs. In 2014 the import price per lb. as reported by the U.S. Census for all shrimp was $5.37 per lb. That same figure for 2015 was $4.23; a 21% drop. For the first three months of 2016, import price is $4.10/lb, a further decline.
So with 2015 imports higher and prices lower there certainly is a good case to believe that shrimp consumption for 2015 was higher. Shrimp imports for the first quarter of 2016 are about even with last year’s record pace.
LOOKING AHEADTO THE REMAINDER OF 2016Although each shrimp supplying country’s production cycle is somewhat different, U.S. shrimp imports don’t start building until about May and peak in October as inventories are built for the holiday season. Asian shrimp imports, which represent about three quarters of the total, are led by India, Indonesia, and Vietnam. Thailand, which in the past had been the largest supplier to the U.S., has suffered with production problems related to disease, however, appears to be rapidly building its production.
South East Asia and India are all suffering from hot, drought conditions, apparently a result of El Nino. These conditions; especially the lack of rain, appear to be causing higher salinity levels in areas like Vietnam and the result everywhere is slower growth and increased disease issues.
India has become the leading supplier of shrimp to the U.S. market in recent years. Improved seasonal weather conditions and with it better shrimp production are expected in India. At the time of this writing, May production was mostly 31-40 count and smaller as partial harvests were
Consumption up, weather and disease still weigh on imports
SHRIMP MARKET
5.05.56.06.57.07.58.08.59.09.5
10.0
Jan Feb Mar Apr May Jun Jul Aug Sep Oct Nov Dec
$/lb
.
2012 2013 20142015 2016
Asian, Raw P&D, Tail-OnWhite, 16-20 Count
Source: Urner Barry
3.0
3.5
4.0
4.5
5.0
5.5
6.0
Jan Feb Mar Apr May Jun Jul Aug Sep Oct Nov Dec
$/lb
.
2012 2013 20142015 2016
HSLO Central & South AmericanWhite, 41-50 Count
Source: Urner Barry
1,16
6
1,30
1
1,22
8
1,24
4
1,20
9
1,23
2
1,26
8
1,17
6
1,11
2
1,25
1
1,29
3
297
$3.1
0
$3.1
5
$3.1
7
$3.2
7
$3.1
0
$3.4
2 $4.0
5
$3.8
0 $4.6
7 $5.3
7
$4.2
3
$4.1
0
0
1
2
3
4
5
6
0
200
400
600
800
1,000
1,200
1,400
'05 '06 '07 '08 '09 '10 '11 '12 '13 '14 '15 '16
Import $/lb.
MIll
ion
lbs.
Total U.S. Shrimp Imports All Types By Year & Avg. Import $/lb.Source: USDOC. Urner Barry
Q1
Continued on page 38
©Turbotroll
“India has become the leading supplier of shrimp to the U.S.
market in recent years.”

VOL. 11, NO. 3 / SUMMER 2016 / URNER BARRY’S REPORTER • 37

38 • URNER BARRY’S REPORTER / VOL. 11, NO. 3 / SUMMER 2016
taking place. It is anticipated that 26-30 count should be more available by mid-June followed by 21-25 count. Sometime in July production should turn to more 16-20 count and larger. Increased seasonal production of large count shrimp will not likely make it to the U.S. until late July/August.
Meanwhile, the market for 26-30 count and larger shrimp in all forms has been stronger. Limited replacement offerings from all areas have increased in price forcing importers to guard inventories with correspondingly higher offerings. Holes have developed in many inventories. Demand has also improved as buyers seek to cover needs ahead of the later than expected availability in the third quarter.
With reports of limited Chinese production due to disease, China has reportedly been actively buying from many sourcing
countries. As a result, there may be increased demand pressure on the improved seasonal availability, further unsettling the market.
Latin America supplies about one quarter of the imported shrimp to the U.S. market primarily from Ecuador, but also with significant quantities from Mexico, Peru and Honduras and a few other Central American countries.
The earthquake in Ecuador that devastated the area around Manabi had a serious effect on shrimp production in that area; however, the region produces a fraction of the total Ecuador supply. The earthquake’s damage to infrastructure and the redeployment of resources to relief efforts did provide a catalyst for an already firming market.
Strong Asian and especially Chinese demand has driven Ecuador replacement offerings higher. The U.S. spot market for 31-40 count and smaller shrimp firmed in April. Inventories were reportedly strained as current overseas replacement offerings have been generally disconnected from the current U.S. spot market. Larger count shrimp have also firmed in reaction to the higher Asian HLSO market and declining availability of Mexican shrimp.
Seasonal production of Mexican shrimp should begin in June with partial harvests of smaller count shrimp.UB
SHRIMP MARKETContinued from page 36
“SOUTH EAST ASIA AND INDIA ARE ALL SUFFERING FROM
HOT, DROUGHT CONDITIONS, APPARENTLY A RESULT OF EL NINO.”
SHRIMP SUPPLY SOLUTIONSFROMTHE SOURCE
14800 St.Mary’s Ln. Houston, TX [email protected]
C
M
Y
CM
MY
CY
CMY
K
Final selected advert.ai 1 12/11/15 3:00 pm

VOL. 11, NO. 3 / SUMMER 2016 / URNER BARRY’S REPORTER • 39
SeaWatch.com
Thirty Vessels at Sea
Milford, DE Shucking, Canning, Freezing and Distribution
New Bedford, MA Port Side Facility, Shucking and Industrial Freezing
Easton, MD Speciality Plant & HQ
• ChoppedClams• ClamJuice• Chowders• Bisques• BreadedClams• StuffedClams• SeafoodStuffing• Calamari
800-732-2526
Clams...SustainableAvailableVersatile

40 • URNER BARRY’S REPORTER / VOL. 11, NO. 3 / SUMMER 2016
straight year, we saw fewer shipments from Brazil (-12.9%). In fact, the 2015 import volume from Brazil is less than half of the 2010 volume.
Similarly, early in the year, the market for 8 oz. and smaller tails and 9 oz. and larger tails moved in distinctly different directions beginning in the second-half of 2015 and into 2016. Smaller tails firmed steadily, and mostly above the prior five year average, given the somewhat limited supply situation that existed. Meanwhile, larger tails were disproportionately well supplied and under continual selling pressure. Anecdotal evidence suggested that tail sizes skewed larger in 2015, and further weighing on larger tails was the notable decline in club store purchasing.
COLD WATER LOBSTERImports of cold water lobster tails from Australia, New Zealand and South Africa fell 24.2 percent in 2015. Individually, shipments declined 35.6 percent from Australia and 21.1 percent from South Africa; while New Zealand shipped 1.3 percent additional. In general, the market for South Africa tails was supported by the sharp cut in supplies.UB
By Jim [email protected]
NORTH AMERICAN LOBSTERThe live lobster market traded well above the prior five-year average for all of 2015, then moderated in 2016. There wasn’t a lot of fluctuation in the 2015 tail market, but prices have since fallen considerably. A late start to the spring season in Canada, and the robust appetite for whole raw and whole cooked by Chinese buyers, was price supportive. These actions also propped the tail market above the prior five-year average for the entirety of the year. Then, a robust fall season and still-favorable currency conversion weighed on the market; and lobster tail prices corrected 13.6 percent Jan-May.
To say lobster meat was a big storyline in 2015 would be a gross understatement; widespread menu adoption sent the claw and knuckle meat market from $18.50 in January 2015 to $28.00 by May 2016. This jump has been purely fueled by demand; import volume is up, and so is the average price paid by importers. Usage has grown so widespread, that even
A full year: menu adoption, lower Maine production, seasonal demand
LOBSTER MARKET
15
17
19
21
23
25
27
29
2011 2012 2013 2014 2015 2016
$/lb
.
UB Lobster Meat, Canada Cooked 2 lbs.Vacuum Pack, CK, Dry, FOB Mid-Atlantic
Source: Urner Barry
$28.15
3
5
7
9
11
13
J F M A M J J A S O N D
$/lb
.
UB Live Lobster, American1 1/4 lb, FOB New England
2014 20152016 3-Year
Source: Urner Barry
15.0
15.5
16.0
16.5
17.0
17.5
18.0
2011 2012 2013 2014 2015 2016
$/lb
.
Caribbean Lobster Tails 6 oz. 10 oz.
Source: Urner Barry
14
15
16
17
18
19
J F M A M J J A S O N D
$/lb
.
UB Lobster Tails, American4-5 oz.
2014 20152016 3-Year
Source: Urner Barry
non-traditional users such as McDonald’s and Panera Bread, offered lobster rolls on their menus.
Imports of North American lobster products from Canada grew 7.1% in 2015. Higher were the live (11.0%) and meat (4.8%) categories; while in-shell (mostly tails) product fell 2.5%.
For the second year in a row, Maine production decreased. After hitting a record high of 127.8 million pounds in 2013, the annual catch volume dipped to 124 million pounds in 2014 and then to 121 million pounds last year.
Exports of live Homarus from the United States to Canada fell 3.4 percent, from 68.6 to 66.3 million pounds. These shifts in trade were likely the result of currency exchange and increased demand from processors in the U.S.
WARM WATER LOBSTERImports of warm water lobster tails grew 10.3 percent in 2015, led by increases in shipments from Honduras (+28.1%), Bahamas (+18.7%) and Nicaragua (+14.7%). Meanwhile, for the second

VOL. 11, NO. 3 / SUMMER 2016 / URNER BARRY’S REPORTER • 41

42 • URNER BARRY’S REPORTER / VOL. 11, NO. 3 / SUMMER 2016
Many buyers, however, are scratching their heads when it comes to the current situation in the
Russian crab market. With imports clearly up, we need to ask why have prices also continued to increase?
With 16-20 count Russian red crab as an example, we see that the market has steadily risen throughout the second half of 2015 and thus far during 2016. Larger count sizes, 6-9s and 9-12 Russian red prices, have been flat for 2016. Many traders report that the reason for the uptick in pricing is due to high replacement costs out of Russia. Most of the smaller- to middle-sized crab is caught in the Sea of Okhotsk. The crab caught here is processed frozen and has also been going to live markets in Asia. Additionally, according to market sources, infrastructure in South Korea has improved the process of facilitating live crab from boats into the supply channels in Asia. This has created
King crab imports up, snow crab quotas are down; Crabmeat at the tail end of correction mode
By Janice Schreiber and Angel [email protected]
KING CRABImports started off 2016 with a bang. Through March of 2016 year-to-date (YTD) imports are up 163.9 percent. Thus far in 2016, 11.6 million pounds have been imported. The driver in this market is Russia which has sent 10.3 million pounds. In fact, 2016 import volumes are well above what the U.S. market has seen in the past three years.
Out of Alaska, the Bering Sea quota was exactly the same as last year and the 2015/2016 fishing season is complete. This market has been steady to about steady. King crab out of the Bering Sea is historically larger on 6-9s, 9-12s, and 12-14 count sizes. A price premium is historically seen in this market over the Russian red king crab.
CRAB AND CRAB MEAT MARKETS
4.0
4.4
4.8
5.2
5.6
6.0
6.4
-20
-10
0
10
20
30
40
50
Jan-11 Jul-11 Jan-12 Jul-12 Jan-13 Jul-13 Jan-14 Jul-14 Jan-15 Jul-15 Jan-16
$/lb.
Mill
ion
Lbs.
NF & Gulf Snow Crab vs Monthly ImportsSource: USDOC, Urner Barry
Exports Imports
NF GSTLW3
11.169.65
5.51
7.346.09
9.28
4.40
11.62
0
5
10
15
2009 2010 2011 2012 2013 2014 2015 2016
Million lbs.
YTD Frozen King Crab ImportsSource: USDOC
1
0.0
0.5
1.0
1.5
2.0
Jan Feb Mar Apr May Jun Jul Aug Sep Oct Nov Dec
Mill
ion
lbs.
2013 20142015 20163 yr avg
Cyclical Behavior (Crab Meat)Monthly Imports-China
Seasonally Low
4
9
10
11
12
13
14
15
16
J F M A M J J A S O N D
$/lb
.
'13-'15 avg 2014
2015 2016Red King Crab 16-20 count
Source: Urner Barry
2
©bhofack2

VOL. 11, NO. 3 / SUMMER 2016 / URNER BARRY’S REPORTER • 43
Your Direct Source
PREMIUM RED KING CRABTraceable • Sustainable
RED KING CRAB • SNOW CRABDUNGENESS CRAB • ALASKA COD
Phone: 206.284.1947E-mail: [email protected]: www.keyportfoods.com
additional competition for U.S. importers to purchase crab for the U.S. market.
The market is seeing a compression in the smaller-to mid-sized crab up towards larger count crab. As mentioned previously, 9-12 count Russian red crab has been flat, but compared to last year, pricing is up $1.33 or 8.9 percent. However, when you look at 16-20 count Russian red crab, the difference in price this year to last year is $4.35, a 41.8 percent increase. The same holds true for 20-24 count red crab, which is up 40.7 percent.
To return to our earlier point, imports are up, prices are up, and the explanation we are left with is that the increased imported crab coming to the U.S. market is larger in size. Although the market did see a price increase in 9-12 count crab, 6-9 count Russian red crab has seen a five percent decrease in price when compared to the same time last year. Mid-to-smaller sized crab prices are up around 40 percent with replacement costs reported to continue their lofty values, which could explain the holes buyers are currently seeing in the U.S. market.
SNOW CRABThe U.S. market for snow crab started 2016 in an extremely dry landscape. The 2015 Canadian season saw moderate to active demand throughout the year and Urner Barry quotations were removed at the end of February 2016, fairly early during the year. This left the market starved for crab. This issue was compounded when Alaska’s 2015/16 Opilio quota was reduced 40 percent from the prior season. Generally the Alaskan fishery begins in late January with crab hitting the market by the first week of February. Pricing in this market is currently $1.55 per pound higher than the same time period last year for 5-8 ounce clusters, a 32.3 percent increase. In addition to the quota cut out of Alaska, Canada’s snow crab quota was also
reduced by about 13 percent.
All of these factors contributed to a firm beginning to the Canadian snow crab season.
The market as of the end of May was strengthening. At the time of this writing, prices were $1.18 per pound higher compared to 2015 levels, and 25 percent higher on 5-8 ounce clusters out of Newfoundland. Market participants report an active demand while currently no one seems to be taking a robust stance in the market. Product, however, is moving well at these higher levels, again due to the starved market situation the Canadian season was greeted with.
CRAB MEATThe pasteurized crab meat market has experienced over a year of declining prices as it corrects itself from a price bubble that began in late 2013 and early 2014. Both the blue and red crab meat markets were affected, but into mid-Q2 2016, it appears prices are finally finding some stability.
Looking back at what happened in 2014 will make us understand where we are today. As we have noticed in other markets, like shrimp or salmon, supply shocks can cause markets to skyrocket, only to see prices adjust downward overtime. The pasteurized crab meat market has experienced a boom and bust from 2014 until Q1 2016.
From late 2013 into 2014, low imports from China of red swimming crabs—(and as we approached the fishing season in Indonesia) tight raw materials of blue swimming crab abroad—caused bidding to move up in order to secure product (Charts 4 & 5). The effects were immediately felt by importers, who also had to bid higher in order to get supplies from packers and thus absorbed higher prices. As importers passed these higher costs through higher prices in the U.S. wholesale market, distributors, retailers, and foodservice operators felt the crunch. In other words, in the short term, a supply shock will be absorbed by most in the distribution chain, which means that demand is generally inelastic. But
0.0
0.5
1.0
1.5
2.0
2.5
3.0
Jan Feb Mar Apr May Jun Jul Aug Sep Oct Nov Dec
Mill
ion
lbs.
2014 2015
2016 3 yr avgCyclical Behavior (Crab Meat)Monthly Imports-Indonesia
Seasonally Low
5
as restaurants, distributors, retailers, or basically end-users adjusted to higher prices and therefore reduced margins, volume demanded fell.
One of the issues this bubble creates is that as prices rise, incentives also expand to produce, import, and therefore sell more product. It was an issue because demand in the U.S. wholesale market did not keep up with replacement costs. For example, prices in the U.S.
“…many buyers are scratching their heads when it comes
to the current situation in the Russian crab market. With
imports clearly up, we need to ask why have prices also
continued to increase?”
Continued on page 58

44 • URNER BARRY’S REPORTER / VOL. 11, NO. 3 / SUMMER 2016
and 30/40 counts. This resulted in an elevated U10 market; one which remained in record territory throughout the entirety of 2015 and into 2016. Meanwhile, 10/20 and 20/30 count scallops moderated below 2014 levels, but remained above the prior five-year average.
U.S. TRADE (IMPORTS/EXPORTS)Imports of scallops into the United States fell 19 percent from a year ago; and 7 percent below the 5-year average. China continues to be the single largest supplier to the U.S., accounting for roughly 46 percent of the scallops imported into the U.S. However, in 2015, they shipped 14 percent fewer scallops than a year ago. Production issues and domestic consumption appear to be limiting availability.
The market for China origin bay scallops, regardless of size, strengthened in 2015. The lack of import flow has been price supportive, producing 52-week or all-time high markets. New season production, which is harvested at the end of 2015 and arrives in early 2016, appears to be comprised of mostly smaller count scallops. 80/120 and larger counts have ascended to recorded highs in 2016. 120/150 and 150/200 counts are available and have moderated.
Also plagued by production problems is the Peruvian fishery; where the result has been 67 percent fewer scallops shipped to the U.S. than last year. That’s a 4.4 million pound shortage. Other than China and Peru, also shipping fewer scallops to the U.S. are Canada (-12%), Japan (-26%) and Mexico (-10%). Meanwhile, we’ve seen increases from Argentina (+18%), the Philippines (+124%), France (+44%) and Chile (+145%).
Canadian landings data lags; the most recent data is for 2014 and shows an increase in scallops landed of eight percent. Anecdotally, sources have indicated that the 2015 season was largely in-line with 2014. Canada origin sea scallops spent the bulk of the year treading further into record-high territory. Brisk sales around
By Jim [email protected]
ATLANTIC SEA SCALLOP (DOMESTIC CATCH)Fishing Year (FY) 2015 landings totaled 34.12 million pounds, up 4.17 million pounds or close to 14 percent. Still, the figure remains well below the prior five year average of 46.81 million pounds.
The Atlantic sea scallop (Placopecten magellanicus) is one of the most valuable fisheries in the United States and is the most valuable wild scallop fishery in the world. It’s managed by the New
A well-managed fishery pays offEngland Fishery Management Council in cooperation with the Mid-Atlantic Fishery Management Council under the Atlantic Sea Scallop Fisheries Management Plan. They use a combined approach of effort limitation and rotating harvest areas, which maximizes scallop yields while protecting beds of young scallops.
The result of these management practices were FY2013 landings of 36.36 million pounds and FY2014 29.95 million pounds, where landings in the previous three years ranged 53.84 to 57.12 million pounds. According to the NEFMC Council Report, FY2016 provisions allow fishermen to receive allocations that are projected to result in landings of about 47 million pounds of scallops.
Anecdotal evidence suggests that the domestic fishery yielded more 10/20 and 20/30 count scallops, and less U10, U12
SCALLOP MARKET
“China continues to be the single largest supplier to the U.S.,
accounting for roughly 46 percent of the scallops imported into the U.S.”
4810 Williamsburg • P.O. Box 189 • Federalsburg, MD 21632Toll-Free: (800) 984-9524 • Phone: (410) 943-0200
Fax: (410) 943-0206 • E-mail: [email protected]
WE CAN HANDLE ALL YOUR TRANSPORTATION NEEDS!
Arrange for pickups
and deliveries
Drivers are independent
and professional
Work with any frozen products
Provide service in all 48
continental states
Specialize in LTL and
full truckloads
Call Toll Free for our California and Florida Division (888) 345-7441

VOL. 11, NO. 3 / SUMMER 2016 / URNER BARRY’S REPORTER • 45
the globe, and 1.1 million fewer pounds shipped to the U.S., were price supportive.
2015 exports of U.S. origin sea scallops lagged recent years. In fact, the export total has fallen in each of the last four years. Averaging 25 million pounds in the last five years and 20 million pounds in 2014, this year the U.S. only shipped 16.8 million pounds. That’s 16 percent less than 2014 and 34 percent below the 5-year average. Fewer landings and a strong U.S. Dollar have hampered exports.
Scallop net supply, what’s available for consumption in the U.S. market by simply calculating (Landings + Imports – Exports), fell 8 percent or 5.5 million pounds. The issue facing market participants has been the deterioration in net supply. Between 2009 and 2011, net supplies ranged 82.1 and 89.2 million pounds; in the following three years, 60.5 and 76.5 million pounds 71.5 million pounds; and in 2015, 66.2 million pounds. This situation has forced buyers to search far-and-wide for supply, or in some cases, restrict product offerings.UB
0.0
3.5
7.0
10.5
14.0
0
30
60
90
120
'03 '04 '05 '06 '07 '08 '09 '10 '11 '12 '13 '14 '15
$/lb.
Mill
ion
lbs.
Landings ImportsNet Supply Price 10/20 Dry
Net Scallops Supply vs. PriceSource: Urner Barry, NMFS
3.0
3.6
4.2
4.8
5.4
6.0
6.6
Jan-12 Jul-12 Jan-13 Jul-13 Jan-14 Jul-14 Jan-15 Jul-15 Jan-16 Jul-16
$/lb
.
60/80 Count 120/150 CountUB SCALLOPSChina, Bay, Cultured
Source: Urner Barry
NEW and UPDATED OFFERINGS from
The Beef Book Playing CardsCattle Breeds Poster
Notebook Charts The Beef BookThe Meat Buyer’s Guide® 8th Edition
NAMI Posters
800-932-0617shop.meatbuyersguide.com
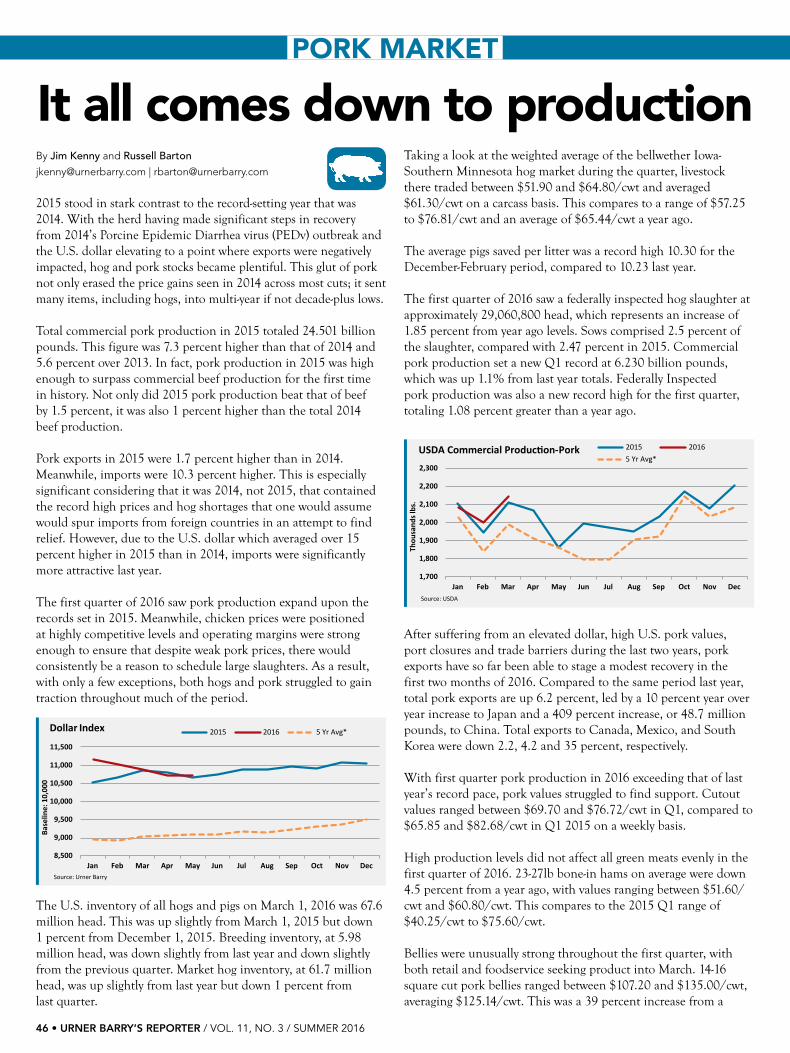
46 • URNER BARRY’S REPORTER / VOL. 11, NO. 3 / SUMMER 2016
Taking a look at the weighted average of the bellwether Iowa-Southern Minnesota hog market during the quarter, livestock there traded between $51.90 and $64.80/cwt and averaged $61.30/cwt on a carcass basis. This compares to a range of $57.25 to $76.81/cwt and an average of $65.44/cwt a year ago.
The average pigs saved per litter was a record high 10.30 for the December-February period, compared to 10.23 last year.
The first quarter of 2016 saw a federally inspected hog slaughter at approximately 29,060,800 head, which represents an increase of 1.85 percent from year ago levels. Sows comprised 2.5 percent of the slaughter, compared with 2.47 percent in 2015. Commercial pork production set a new Q1 record at 6.230 billion pounds, which was up 1.1% from last year totals. Federally Inspected pork production was also a new record high for the first quarter, totaling 1.08 percent greater than a year ago.
1,700
1,800
1,900
2,000
2,100
2,200
2,300
Jan Feb Mar Apr May Jun Jul Aug Sep Oct Nov Dec
Thou
sand
s lbs
.
2015 20165 Yr Avg*
USDA Commercial Production -Pork
Source: USDA
After suffering from an elevated dollar, high U.S. pork values, port closures and trade barriers during the last two years, pork exports have so far been able to stage a modest recovery in the first two months of 2016. Compared to the same period last year, total pork exports are up 6.2 percent, led by a 10 percent year over year increase to Japan and a 409 percent increase, or 48.7 million pounds, to China. Total exports to Canada, Mexico, and South Korea were down 2.2, 4.2 and 35 percent, respectively.
With first quarter pork production in 2016 exceeding that of last year’s record pace, pork values struggled to find support. Cutout values ranged between $69.70 and $76.72/cwt in Q1, compared to $65.85 and $82.68/cwt in Q1 2015 on a weekly basis.
High production levels did not affect all green meats evenly in the first quarter of 2016. 23-27lb bone-in hams on average were down 4.5 percent from a year ago, with values ranging between $51.60/cwt and $60.80/cwt. This compares to the 2015 Q1 range of $40.25/cwt to $75.60/cwt.
Bellies were unusually strong throughout the first quarter, with both retail and foodservice seeking product into March. 14-16 square cut pork bellies ranged between $107.20 and $135.00/cwt, averaging $125.14/cwt. This was a 39 percent increase from a
By Jim Kenny and Russell [email protected] | [email protected]
2015 stood in stark contrast to the record-setting year that was 2014. With the herd having made significant steps in recovery from 2014’s Porcine Epidemic Diarrhea virus (PEDv) outbreak and the U.S. dollar elevating to a point where exports were negatively impacted, hog and pork stocks became plentiful. This glut of pork not only erased the price gains seen in 2014 across most cuts; it sent many items, including hogs, into multi-year if not decade-plus lows.
Total commercial pork production in 2015 totaled 24.501 billion pounds. This figure was 7.3 percent higher than that of 2014 and 5.6 percent over 2013. In fact, pork production in 2015 was high enough to surpass commercial beef production for the first time in history. Not only did 2015 pork production beat that of beef by 1.5 percent, it was also 1 percent higher than the total 2014 beef production.
Pork exports in 2015 were 1.7 percent higher than in 2014. Meanwhile, imports were 10.3 percent higher. This is especially significant considering that it was 2014, not 2015, that contained the record high prices and hog shortages that one would assume would spur imports from foreign countries in an attempt to find relief. However, due to the U.S. dollar which averaged over 15 percent higher in 2015 than in 2014, imports were significantly more attractive last year.
The first quarter of 2016 saw pork production expand upon the records set in 2015. Meanwhile, chicken prices were positioned at highly competitive levels and operating margins were strong enough to ensure that despite weak pork prices, there would consistently be a reason to schedule large slaughters. As a result, with only a few exceptions, both hogs and pork struggled to gain traction throughout much of the period.
8,500
9,000
9,500
10,000
10,500
11,000
11,500
Jan Feb Mar Apr May Jun Jul Aug Sep Oct Nov Dec
Base
line:
10,
000
2015 2016 5 Yr Avg*Dollar Index
Source: Urner Barry
The U.S. inventory of all hogs and pigs on March 1, 2016 was 67.6 million head. This was up slightly from March 1, 2015 but down 1 percent from December 1, 2015. Breeding inventory, at 5.98 million head, was down slightly from last year and down slightly from the previous quarter. Market hog inventory, at 61.7 million head, was up slightly from last year but down 1 percent from last quarter.
It all comes down to productionPORK MARKET

VOL. 11, NO. 3 / SUMMER 2016 / URNER BARRY’S REPORTER • 47
year ago; a quarter in which bellies traded between $69.80 and $107.60/cwt.
Fresh 42 percent trimmings began the year at multi-year lows, ranging between $17.20 and $26.60/cwt, compared to $20.00 and $37.20/cwt last year. Fresh 72s ranged between $40.00 and $61.00/cwt, compared to $35.50 and $68.20 in Q1 2015.
Loin values continued to erode throughout the first quarter of 2016, a trend that began in May 2015 and carried-on with little interruption. Record Q1 pork production, competitively priced chicken and a lack of meaningful commitments from buyers weighed heavily on the market. In three months, the average market price on bone-in loins was $95/cwt, compared to $103 and $134 in Q1 2015 and Q1 2014, respectively. These trading ranges are not only a departure from the last two years, but also represent a significant discount to the 5-year average and five years preceding PEDv. Boneless loins progressed similarly. The concern is that the industry has suffered some longer-term demand destruction caused by the 2014 market action.
Similarly, pork butt values maintained a weak bias; also averaging below a year ago, the 5-year average and five years preceding PEDv. However, interest surfaced in March in seasonal form. Benefitting from their versatility, the market average increased between February and March as buyers both domestically and abroad stepped-up purchases. The buying interest resulted in an inverse relationship between loins and butts; the March averages were higher on butts than loins.
The exception to the trends above are spareribs. On an upward trajectory throughout the quarter, spareribs are trading at-or-above the 5-year average and five years preceding PEDv. Sparerib usage is robust and cutting-and-freezing activity supportive.
In 2015, the USDA calculates that there were 49.8 pounds of retail pork per capita. That is the availability of pork after calculating for production, imports and exports. This figure was 3.4 pounds higher than that of 2014. Given expectations for continued growth in pork production
through both efficiency gains and the development of new plants, the USDA estimates that 2016 will have 50.1 pounds of pork available per capita and 2017 will push domestic supplies even further at 51 pounds per capita. Essentially, this means that between 2014 and 2017, the industry relies on the American public to consume an additional 4.6 pounds of pork. While exports have improved from 2015, the extent of further growth remains
2016 (Proj): 50.1
2017 (Proj): 51
44
46
48
50
52
54
1995 1998 2001 2004 2007 2010 2013 2016
lbs.
Pork Disappearance Per Capita
Source: USDA
9009 Coldwater Road • Fort Wayne, Indiana 46825 • www.tippmanngroup.com
(260) 490-3000
@TippmannGroup
KEEPING IT COOL SINCE 1968
Tippmann Construction Interstate Warehousing• Design/build construction of multi-temperature warehouse and production facilities• New builds, expansions and renovations• Master site planning• Members of U.S. Green Building Council• Owner/operator experience & knowledge
• 5th largest PRW in United States• 100,000,000 cubic feet of cold storage space• SQF Level 2 certi�ed facilities• Customized distribution solutions• Retail and Foodservice consolidation programs• Comprehensive management development & training program
in question. That and the fact that the U.S. population does not appear to be poised for a sudden expansion has left sellers of domestic pork with the difficult task of figuring out how to market the additional product.UB

48 • URNER BARRY’S REPORTER / VOL. 11, NO. 3 / SUMMER 2016
“Weak beef prices in the U.S. will continue to put
downward pressure on the Mexican beef market...”
Looking to balance factors in 2016against the U.S. dollar. This situation persisted amid multi-year low beef prices in the U.S., but was short-lived until the first week of May 2016.
Furthermore, the fact of the matter is that feeder cattle prices in Mexico have also remained strong. This is rather relevant given that many packing plants in Mexico are, to some extent, vertically integrated—or are in some sort of joint venture with their own feedlots. In other words, if feeder cattle prices in general have remained high, large incentives exist for packing plants to pass that sustained high input cost when selling beef. The situation isn’t easy for many Mexican beef producers. Falling prices and production expansion in the U.S. are already having an impact on prices in the domestic Mexican beef market as well as in the export market. Still, opportunities are on the horizon. By the time this article is published, a Mexican delegation will have already finished a targeted visit to Saudi Arabia aiming to open a new set of markets in the region for Mexican beef. Low prices could also mean consumers might increase beef purchases.
Mexican beef exports reached a Q1 record of 45.9 thousand metric tons in 2016 (Chart 1). This represents an increase of 9 percent compared to the same time last year. Although this is a good sign for Mexican beef packers—as they take advantage of better prices, for the most part, compared to the Mexican domestic market—shipments to the U.S. also increased; this can also be a relatively not-so-good thing given the U.S. market as a destination now accounts for 92 percent of all Mexican beef exports, placing further pressure on one large market (Chart 2).
Imports, on the other hand, have been gradually declining over the years. On our
By Angel [email protected]
Mexican beef exports continue to grow amid production expansion and falling imports. Yet, beef net supply in Mexico reached a multi-year low through Q1 this year, which at first glance and fundamentally would suggest relative support to beef prices. This has been true despite a weakening U.S. beef market mainly due to a strong U.S. dollar, which has discouraged imports of U.S. beef into Mexico. A weak Mexican peso has also played a positive role for Mexican beef exporters as revenues in
Mexican pesos grow providing more incentive to increase shipments to the U.S. However, between March and April, net weekly U.S. beef sales to Mexico grew significantly compared to last year as the Mexican peso strengthened
www.mexicanbeef.org@MexicanBeef Mexican Beef Exporters Association
mexicanbeef.org
MEXICAN BEEF MARKET

VOL. 11, NO. 3 / SUMMER 2016 / URNER BARRY’S REPORTER • 49
last report, we illustrated that for the first time Mexico’s beef trade balance reached positive territory, and so far in Q1 this number reached + 6.3 thousand metric tons (Chart 3). This makes sense given that Mexico’s beef production continues to expand and a weak Mexican peso has discouraged imports. Yet, net beef supply, which takes total production and imports and subtracts exports, has actually contracted over the past few years (Chart 4). Fundamentally, this supports the argument of
47%
58%62%
57% 60%
79%84% 88%
92%
0%10%20%30%40%50%60%70%80%90%
100%
2008 2009 2010 2011 2012 2013 2014 2015 2016
Percentage of Mexican Beef Exports to U.S. Q1 Source: AMEG, SIAP 2
8.4 9.5 11.3
25.8
36.233.9 32.4
42.045.9
-5
10 15 20 25 30 35 40 45 50
2008 2009 2010 2011 2012 2013 2014 2015 2016
Thou
sand
MT
Mexican Beef Exports - Q1 Source: AMEG, SIAP 1
-20%-10%
0%10%20%30%40%50%60%70%
Dec-12 Jun-13 Dec-13 Jun-14 Dec-14 Jun-15 Dec-15 Jun-16
% C
hg
US Feeder Cattle CashFeeder Cattle Mex
% Change of Feeder Cattle PricesSource: CME, AMEG, SIAP
5
469.
1 475.
1
465.
3
452.
5
448.
0
459.
7
446.
9
441.
3
420
430
440
450
460
470
480
'09 '10 '11 '12 '13 '14 '15 '16
Thousand MT
Net Beef Supply in Mexico (Production+Imports-Exports)Source: AMEG, SIAP
Q1Total
4
1,96
9
1,96
4
1,94
2
1,88
0 1,90
9
1,88
7
1,85
8
1,800
1,820
1,840
1,860
1,880
1,900
1,920
1,940
1,960
1,980
'09 '10 '11 '12 '13 '14 '15
Thou
sand
MT
-59.4 -58.2
-36.7
-18.0 -15.9 -19.3-0.8
+6.3
-70
-60
-50
-40
-30
-20
-10
0
10
2009 2010 2011 2012 2013 2014 2015 2016
Thou
sand
MT
Mexican Beef Trade Balance Q1 Source: AMEG, SIAP 3
www.mexicanbeef.org
- 5%
0%
5%
10%
15%
20%
25%
30%
35%
Dec-12 Jun-13 Dec-13 Jun-14 Dec-14 Jun-15 Dec-15 Jun-16
% C
hg
US Beef IndexMex Cutout
% Change of Cutout PricesSource: CME, AMEG, SIAP
6
relatively strong prices in the Mexican domestic market over the past three years.
Another factor that has caused beef prices in Mexico to remain relatively strong over the last few years has been the sustained high prices for cattle. Now, we have to remember that the production structure of beef in Mexico is slightly different than that in the United States. Mexican beef packers are in some sort of vertically integrated form, or at least plants have Continued on page 50
a close relationship with their own feedlots. Therefore, the price of feeder cattle becomes quite relevant. And as we can see, feeder cattle prices in Mexico have remained high compared to prices in the U.S. (Chart 5), causing beef prices to remain strong (Chart 6).
However, the U.S. dollar relative to the Mexican peso, in addition to beef prices in the

50 • URNER BARRY’S REPORTER / VOL. 11, NO. 3 / SUMMER 2016
U.S., declined throughout March and April, opening the window for Mexican buyers to turn their heads and purchase U.S. beef. There were only anecdotal reports for such situations, but recent weekly data corroborated that in March, April and into the first week of May, net sales to Mexico grew 32 percent compared to the same period last year. These sales are commitments for future delivery (Chart 7). Still, actual shipments during this time grew by 12 percent, with the first week of April hitting a year high (Chart 8). During that week, prices for end cuts in the U.S. hit a multi-year low in
Continued from page 49
MEXICAN BEEF MARKETaddition to reaching a seventh straight week of weakening of the U.S. dollar against the Mexican peso, providing plenty of incentive for buyers in Mexico to take a strong buying position for U.S. beef. This situation started putting downward pricing pressure in the Mexican market on a few items, particularly shoulder clods, goosenecks, and inside rounds.
Production in the U.S. has been increasing over the past months and in May slaughter crossed the 600 thousand head barrier, something that had not happened since June 2014. This signifies that supplies in the U.S.
-
1,000
2,000
3,000
4,000
8-Ja
n
15-Ja
n
22-Ja
n
29-Ja
n
5-Fe
b
12-F
eb
19-F
eb
26-F
eb
5-M
ar
12-M
ar
19-M
ar
26-M
ar
2-Ap
r
9-Ap
r
16-A
pr
23-A
pr
30-A
pr
7-M
ay
Met
ric T
ons
Net '15 Net '16Net Sales Exports to Mexico 7
Net Sales '16 3,931
-
500
1,000
1,500
2,000
2,500
8-Ja
n
15-Ja
n
22-Ja
n
29-Ja
n
5-Fe
b
12-F
eb
19-F
eb
26-F
eb
5-M
ar
12-M
ar
19-M
ar
26-M
ar
2-Ap
r
9-Ap
r
16-A
pr
23-A
pr
30-A
pr
7-M
ay
Met
ric T
ons
2015 Exports 2016 ExportsBeef Exports to MexicoShipments
8
2016 Exports 1,904
are likely to continue growing and prices will remain low, everything else equal. This simply proves that the assumption we made in the previous report, which was that exchange rates would play a crucial role for the Mexican beef market was more or less correct. In addition, weak beef prices in the U.S. will continue to put downward pressure on the Mexican beef market. Moreover, opening new destinations for Mexican beef exports are also likely to help and ease the pressure on the U.S. market. Again, as we move forward, it will all depend if lower prices are passed on to the consumer aiming to reignite demand at that level.UB
Whether you are looking for the perfect speaker for your next meeting or conference, or are in need of insight from the top poultry, egg, red meat, and seafood market analysts and researchers in the world, look no further than UB Analytics.
Personalized Webinars, PowerPoints, Conference Calls, Live Presentations and White Papers.
Covering specifically the factors directly impacting your business.
Get detailed information on the items, statistics, and trends that matter to your audience the most.
For more information, call 800-932-0617 and schedule a consultation.
Customized packages are available.

VOL. 11, NO. 3 / SUMMER 2016 / URNER BARRY’S REPORTER • 51
Capistrano Alimentari Group, 100% Mexicancompany with 38 years of history and morethan 4,000 employees o�ers consumers qualityproducts and excellent service, thanks to itsinfrastructure and technology.We have brands that meet the needs of di�erentmarket segments.
Our hams, sausages, bacon and other productsare preferred by consumers because of itsdelicious taste and consistency.
www.capistrano.com.mx
18.8 cm.25
.8 cm
.

52 • URNER BARRY’S REPORTER / VOL. 11, NO. 3 / SUMMER 2016
It’s been good to be in the cattle sector over the last few years and the outlooks confirmed that. In the second half of 2015 and into 2016, however, larger production was a result of bigger supplies
and higher cattle weights, which averaged 1364 pounds on a live basis in 2015, or 30 pounds higher than the previous year, and closer to 1380 pounds so far in 2016. Favorable feed and energy costs as well as optimal weather also supported the trend. This has affected wholesale beef prices. Both the Urner Barry Choice and Select cutout dropped around 20 percent in 2015. The price pressure continues to be evident in the first part of 2016 as well.
350
400
450
500
550
Jan Feb Mar Apr May Jun Jul Aug Sep Oct Nov Dec
Mill
ion
lbs.
USDA F.I. Production, Beef (Weekly) 2013 20142015 20163-Yr-AvgSource: USDA
3
1.85
2.05
2.25
2.45
2.65
Jan Feb Mar Apr May Jun Jul Aug Sep Oct Nov Dec
$/lb
.
Yellow Sheet Choice Cutout Values 2014 2015 2016Source: Urner Barry
4
1.70
1.85
2.00
2.15
2.30
2.45
2.60
Jan Feb Mar Apr May Jun Jul Aug Sep Oct Nov Dec
$/lb
.
Yellow Sheet Select Cutout Values 2014 2015 2016Source: Urner Barry
5
So while we have laid the foundation of larger supplies and lower prices, there remains a struggle for sellers of boxed beef for a variety of reasons. First, there was a supply shock in 2015 across the pork and poultry industries, putting more meat and poultry
By Gary Morrison and Bruce Longo [email protected] and [email protected]
The cattle market in 2015 was defined by one word: volatility.
One way to measure the trading risk is to look at drawdown, or the peak-to-trough decline during a given period. The full drawdown for cash cattle in Kansas during the year was over 31 percent; with the majority of losses seen from January to the October period. The high was made the first of the year and prices crossed below 2014 levels during mid-summer. The fall and winter period saw another taxing period with prices down over 20 percent. To put this into perspective, in the last 10 years prior, the range of drawdown was 11.20 percent to nearly 21 percent, with an average of 15.70 percent. Again, 2015 was nearly double this average.
1.0
1.2
1.4
1.6
1.8
2.0
J F M A M J J A S O N D
$/lb
.
2013 20152014 10 yr avg
Cattle, Cash Price, KansasSource : Urner Barry, Cattle -Fax
29.6%
1
The question moving forward is this: will the cattle market see a repeat of the volatility from last year? Unless there is a black swan event, the most likely answer is probably not. It seems the cyclical high has been put in place, and prices will likely be lower, but the depth and breadth of the declines should be moderate.
The industry has transitioned from the liquidation phase into an expansion phase. There were 92 million head of cattle and calves on U.S. farms as of January 1, 2016, a 3 percent increase from the year prior and the highest level since 2011. Look for this trend to continue for at least a few years.
75
85
95
105
115
125
135
'50 '53 '56 '59 '62 '65 '68 '71 '74 '77 '80 '83 '86 '89 '92 '95 '98 '01 '04 '07 '10 '13 '16
Mill
ion
Head
January 1 - Cattle Inventory Data
Source: Urner Barry, USDA
2
Growing protein supplies add additional pressure to pricing
BOXED BEEF MARKET

VOL. 11, NO. 3 / SUMMER 2016 / URNER BARRY’S REPORTER • 53
supplies on the market than was expected as both bounced back better from PEDv and Highly Pathogenic Avian Influenza (HPAI), respectively. Production and supply is expected to grow moving forward but at a more moderate pace. The downward trend on prices across all protein lines will create competition.
It looks like there are headwinds for the beef industry against other proteins at the moment. While the spread between beef prices and other proteins has narrowed from record levels, the former is still trading higher than average. The UB Beef Index is over three times as much as the UB Chicken Index. While this is off four times from when we saw it not too long ago, it is still more than the norm. The same goes when looking at it versus the UB Pork Cutout. The spread has retrenched from the highs but is still above 2.5 times which was consistent resistance in the past.
2.0
2.5
3.0
3.5
4.0
4.5
2013 2013 2014 2014 2015 2015 2016
Beef/Chicken RatioSource: Urner Barry
6
1.5
2.0
2.5
3.0
3.5
4.0
2013 2013 2014 2014 2015 2015 2016
Beef/Pork RatioSource: Urner Barry
7
Then there was a slowdown at the West Coast ports at the beginning of 2015, and trade was stalled significantly as a result. In addition, there were trade-induced bans by many partners on competing proteins as a result of industry issues and, of course, there was an extremely strong U.S. dollar. All of these factors together took away the export market for the most part, a key distribution component. This was evident in the final data which saw beef volume nearly 11 percent lower in 2015 and value down about 12 percent. This was the first time since 2009 that value slipped on an annual basis.
0.75
2.05
3.35
4.65
5.95
7.25
300
500
700
900
1,100
1,300
2006 2007 2008 2009 2010 2011 2012 2013 2014 2015
Thou
sand
MT
Total U.S. Beef ExportsSource: United States Meat Export Federation
8
(Billion USD$)
So there is price pressure across the wholesale market. As we have shown, no protein is immune to it. Then there is the slowing export market. The final piece of the puzzle domestically is getting consumers to buy beef which would help the struggling industry. But if we look back to last year, we know retailers passed along prices to the consumer. While the USDA All-Fresh Retail price actually moderated as well in 2015, to the tune of nearly 2 percent, it did not keep pace with wholesale deflation. The spread between the retail data and the UB Beef Index (wholesale) is in a long-term uptrend. Consumers are just faced with cheap chicken and pork as opposed to beef.
2.5
2.7
2.9
3.1
3.3
3.5
3.7
3.9
4.1
2011 2012 2013 2014 2015 2016
$/lb
.
All Fresh Retail vs. UB Beef Index SpreadSource: Urner Barry, USDA
9
Other countries have been able to capture share from domestic sellers of beef. With production starting to expand slightly, it is going to be important to recapture that lost share. While supply growth is expected to be moderate, it is still there. The expectation coming into this year was that the beef industry would see lower imports and increased exports. So far in 2016, both have been proven wrong. So, this means the challenge now is squarely on increasing buying patterns in the United States until things return to a more normal pace elsewhere. As we have seen thus far, the increase in chicken and pork supplies has suppressed prices enough to widen the gap to beef. There are a few different prongs for the beef industry to attack that could help increase marketshare: export markets, retail demand and foodservice. Either way, the dynamics of an ever-changing market continue to keep participants on their toes and should make for a fun 2016.UB
“WHILE WE HAVE LAID THE FOUNDATION OF LARGER SUPPLIES AND LOWER PRICES, THERE REMAINS A STRUGGLE FOR SELLERS OF
BOXED BEEF FOR A VARIETY OF REASONS...”
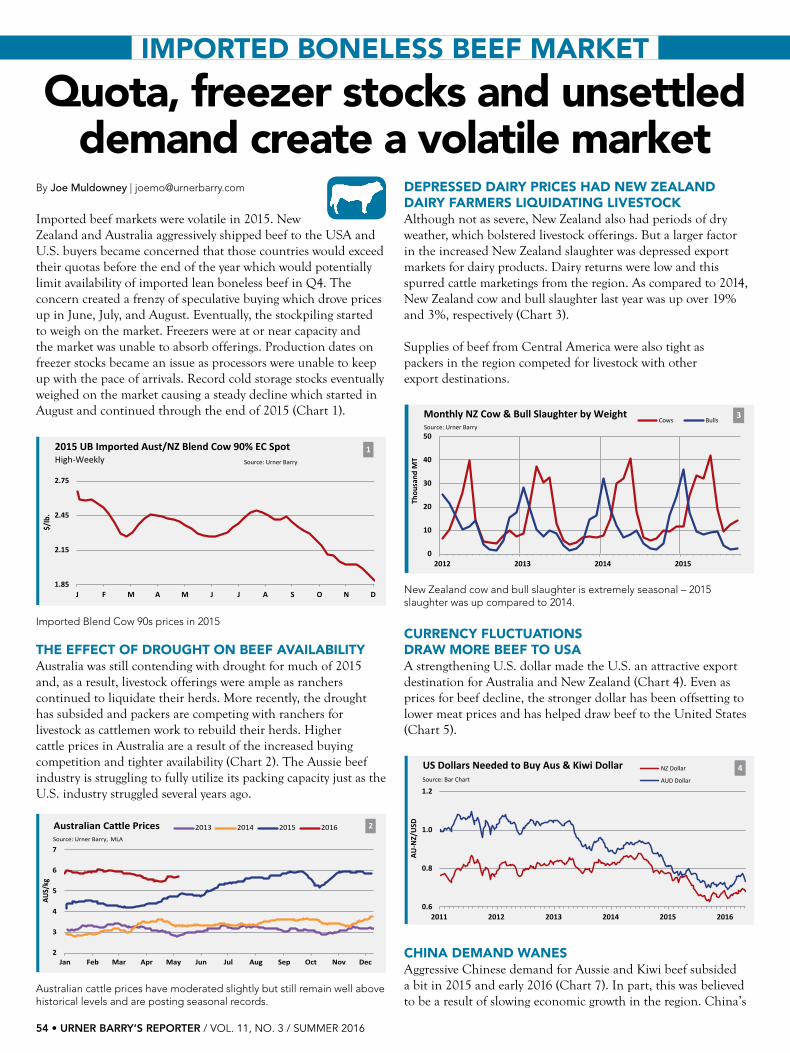
54 • URNER BARRY’S REPORTER / VOL. 11, NO. 3 / SUMMER 2016
DEPRESSED DAIRY PRICES HAD NEW ZEALAND DAIRY FARMERS LIQUIDATING LIVESTOCKAlthough not as severe, New Zealand also had periods of dry weather, which bolstered livestock offerings. But a larger factor in the increased New Zealand slaughter was depressed export markets for dairy products. Dairy returns were low and this spurred cattle marketings from the region. As compared to 2014, New Zealand cow and bull slaughter last year was up over 19% and 3%, respectively (Chart 3).
Supplies of beef from Central America were also tight as packers in the region competed for livestock with other export destinations.
0
10
20
30
40
50
2012 2013 2014 2015
Thou
sand
MT
Monthly NZ Cow & Bull Slaughter by WeightCows Bulls
Source: Urner Barry
3
New Zealand cow and bull slaughter is extremely seasonal – 2015 slaughter was up compared to 2014.
CURRENCY FLUCTUATIONS DRAW MORE BEEF TO USAA strengthening U.S. dollar made the U.S. an attractive export destination for Australia and New Zealand (Chart 4). Even as prices for beef decline, the stronger dollar has been offsetting to lower meat prices and has helped draw beef to the United States (Chart 5).
0.6
0.8
1.0
1.2
2011 2012 2013 2014 2015 2016
AU-N
Z/U
SD
US Dollars Needed to Buy Aus & Kiwi Dollar NZ Dollar
AUD DollarSource: Bar Chart
4
CHINA DEMAND WANESAggressive Chinese demand for Aussie and Kiwi beef subsided a bit in 2015 and early 2016 (Chart 7). In part, this was believed to be a result of slowing economic growth in the region. China’s
By Joe Muldowney | [email protected]
Imported beef markets were volatile in 2015. New Zealand and Australia aggressively shipped beef to the USA and U.S. buyers became concerned that those countries would exceed their quotas before the end of the year which would potentially limit availability of imported lean boneless beef in Q4. The concern created a frenzy of speculative buying which drove prices up in June, July, and August. Eventually, the stockpiling started to weigh on the market. Freezers were at or near capacity and the market was unable to absorb offerings. Production dates on freezer stocks became an issue as processors were unable to keep up with the pace of arrivals. Record cold storage stocks eventually weighed on the market causing a steady decline which started in August and continued through the end of 2015 (Chart 1).
1.85
2.15
2.45
2.75
J F M A M J J A S O N D
$/lb
.
2015 UB Imported Aust/NZ Blend Cow 90% EC Spot High-Weekly Source: Urner Barry
1
Imported Blend Cow 90s prices in 2015
THE EFFECT OF DROUGHT ON BEEF AVAILABILITYAustralia was still contending with drought for much of 2015 and, as a result, livestock offerings were ample as ranchers continued to liquidate their herds. More recently, the drought has subsided and packers are competing with ranchers for livestock as cattlemen work to rebuild their herds. Higher cattle prices in Australia are a result of the increased buying competition and tighter availability (Chart 2). The Aussie beef industry is struggling to fully utilize its packing capacity just as the U.S. industry struggled several years ago.
2
3
4
5
6
7
Jan Feb Mar Apr May Jun Jul Aug Sep Oct Nov Dec
AUS/
kg
Australian Cattle Prices 2013 2014 2015 2016Source: Urner Barry, MLA
2
Australian cattle prices have moderated slightly but still remain well above historical levels and are posting seasonal records.
IMPORTED BONELESS BEEF MARKET
Quota, freezer stocks and unsettled demand create a volatile market

VOL. 11, NO. 3 / SUMMER 2016 / URNER BARRY’S REPORTER • 55
wholesale beef prices are off of the tops that were posted in 2014 (Chart 6).
10%
20%
30%
40%
Jan '10 Jan '11 Jan '12 Jan '13 Jan '14 Jan '15 Jan '16
Percentage of Aus Beef Exports Coming to USA Aus Beef
Source: Urner Barry5
53
54
55
56
J F M A M J J A S O N D
CNY/
kg
China Wholesale Beef Price 2014 20152016Source: Urner Barry
6
5%
10%
15%
20%
25%
30%
2012 2013 2014 2015 2016
Percentage of Aus Beef Exports Going to China Aus BeefSource: Urner Barry
7
HIGH U.S. 90S PRICES PROVIDE COVER FOR IMPORTED LEANThe influx of imported beef might not have been possible without the strong market for U.S. domestic lean boneless beef. High prices provided cover for alternative items such as imported manufacturing beef. At times, it also created a floor for Choice and Select end cuts, which periodically came into grinding formulations (Chart 8).
High fresh 90s prices bump up against muscle cuts from the fed cattle sector. In 2015 there were 40 days in which knuckles were a more cost effective raw material than fresh 90s. This is more than double the days in 2013.
RECORD QUANTITIES OF BEEF IN COLD STORAGE
300
350
400
450
500
J F M A M J J A S O N D
Thou
sand
lbs.
Cold Storage Stocks- Frozen Bnls Beef 201420152016
Source: Urner Barry
The stockpiling on large overseas production and quota concerns ballooned beef cold storage stocks in 2015 and 2016. Freezers that held imported product were at capacity and struggled to keep pace with deliveries.
RETAIL DEMAND SPUTTERS BUT 2016 STARTS WITH AGGRESSIVE FAST FOOD FEATURESAs retail prices adjusted to higher raw material costs, movement slowed. There were less opportunities to purchase ground beef on feature in retail stores and prices were generally higher from where they stood in 2014. Retail prices have been somewhat slow to adjust as retailers look to get back some of the margin that was lost when prices pushed higher.
0.0
0.5
1.0
1.5
2.0
2.5
0
2,800
5,600
8,400
11,200
14,000
2012 2013 2014 2015 2016
$/lb. (Retail-Wholesale)
Buy Ops 80% Lean RetailGround Beef Buying Ops. Retail Features vs. Retail -Wholesale SpreadSource: Urner Barry
# of
Buy
ing
Ops
Linear (Buy Ops 80% Lean Retail)
As raw material prices declined in late 2015 and 2016, the fast food sector saw an abundance of featuring around dollar items and this bolstered movement in January and February which is the time of year that traditionally sees lackluster consumer demand. The demand helped facilitate a 15% increase in the price of Blend Cow 90s during the first quarter of 2016.UB
16
3540
0
10
20
30
40
2013 2014 2015
Days
Source: Urner Barry
8Number of Days Ch Pld Knuxwere Priced Lower to Fresh 90s in Grinding Formuations
©M
agon
e
“Even as prices for meat decline, the stronger dollar has been offsetting to lower meat prices and has
helped draw beef tothe United States”

56 • URNER BARRY’S REPORTER / VOL. 11, NO. 3 / SUMMER 2016
By Bill Smith | [email protected]
Domestic fresh 90s opened 2016 with prices at a discount compared to previous years. Weakness can be attributed to lighter demand. The average price for January 2016 was $203.70/cwt; roughly $100/cwt lower than January 2015. Cow and bull slaughter levels for the first quarter were slightly higher than the equivalent period for 2016.
Record high prices for fresh 90s were recorded early in 2015 and prices remained largely range-bound throughout the first half of 2015 before trending lower. 2016 started the year with a slight increase in fresh 90s as demand improved. Average prices during the first quarter of 2016 were down significantly when compared to the three-year-average price; each month was down about 15-16%. Imported beef was readily available and at significant discounts to domestic lean beef.
Fresh 50s started the first quarter of 2016 off with prices well below the prior year’s levels. January’s monthly average price of $66.20/cwt was down $64.90/cwt (roughly 49% lower) compared to January 2015, and 36%, lower than the three-year-average. February’s average price declined to $52.13/cwt; again significantly lower to both last February and the three-year-average. March, on the other hand, witnessed prices rebounding strongly as supplies were tighter than expected. March 2016 average price was $91.34/cwt; about $1/cwt higher than the equivalent time period for 2015.UB
DOMESTIC BONELESS BEEF MARKET
Lean and fat get taken to the mat
.35
.60
.85
1.10
1.35
1.60
Jan Feb Mar Apr May Jun Jul Aug Sep Oct Nov Dec$/
lb.
UB Beef Trimmings50% Fresh Chemical Lean FOB River
2013 20142015 2016
Source: Urner Barry
300
385
470
555
640
Jan Feb Mar Apr May Jun Jul Aug Sep Oct Nov Dec
Thou
sand
Hea
d
USDA Estimated Daily Livestock Slaughter Cow & Bull (Previous Day)(High)
2013 20142015 2016
Source: Urner Barry
1.80
2.30
2.80
3.30
Jan Feb Mar Apr May Jun Jul Aug Sep Oct Nov Dec
$/lb
.
UB Beef Trimmings90% Fresh Chemical Lean FOB River
2013 2014
2015 2016
Source: Urner Barry
2,100
2,300
2,500
2,700
2,900
Jan Feb Mar Apr May Jun Jul Aug Sep Oct Nov Dec
Thou
sand
Hea
d
USDA Estimated Daily Livestock Slaughter Cattle
2013 20142015 2016
Source: Urner Barry
©Ha
ndm
adeP
ictur
es
“Average prices during the first quarter of 2016 were down significantly when compared to the three-year-average price...”

VOL. 11, NO. 3 / SUMMER 2016 / URNER BARRY’S REPORTER • 57
By Bill Smith | [email protected]
The outlook for the by-product market for 2016 varies noticeably. Beef production so far this year is up about
3%, whereas pork production is down roughly 1%.
Major demand sectors for the by-product market are the oleo chemical, biodiesel, feed, pet food and baking. All these diverse areas make it harder to figure out demand patterns as they all impact the market in different ways.
Loose lard and edible tallow are the two items which are edible for human consumption and show up on the by-product report. Loose lard has been steady to slightly higher so far in 2016. Edible tallow opened 2016 at a discount compared to last year, but has trended higher through April. The monthly average price for edible tallow in April was 34% higher than the equivalent month in 2015.
Q1 2016 monthly average prices for renderer and packer tallow were discounted each month in comparison to the corresponding month in 2015. Inedible tallows are expected to level off as we approach the summer months. Production levels will play a key role in price direction.
The markets for choice white and yellow grease have trended higher since the beginning of the year. That being said, prices were well below 2015 levels until March. April 2016 choice white grease price was about 22% higher than April 2015. Seasonal trends will likely hold true with prices drifting lower the second half of the year.
The by-product market will likely continue to face a lot of the same key issues in 2016. Factors such as production schedules (availability), changes in demand, government regulations and more will all play key roles.UB
Bye, by-productsBY-PRODUCT MARKET
“ALL THESE DIVERSE AREAS MAKE IT HARDER TO FIGURE OUT DEMAND PATTERNS AS
THEY ALL IMPACT THE MARKET IN DIFFERENT WAYS.”
0.15
0.25
0.35
0.45
0.55
Jan Feb Mar Apr May Jun Jul Aug Sep Oct Nov Dec
$/lb
.
UB Fancy Bleachable Tallow Renderer, Chicago
2013 2014
2015 2016
Source: Urner Barry
0.20
0.25
0.30
0.35
0.40
0.45
0.50
0.55
Jan Feb Mar Apr May Jun Jul Aug Sep Oct Nov Dec$/
lb.
UB Edible Tallow, Chicago BasisS. Avg Monthly
2013 20142015 2016
Source: Urner Barry
0.15
0.25
0.35
0.45
0.55
Jan Feb Mar Apr May Jun Jul Aug Sep Oct Nov Dec
$/lb
UB Grease, Choice White, MW RiverS. Avg Monthly
2013 20142015 2016
Source: Urner Barry
0.15
0.25
0.35
0.45
Jan Feb Mar Apr May Jun Jul Aug Sep Oct Nov Dec
$/lb
.
UB Grease, Yellow, MW RiverS. Avg Monthly
2013 20142015 2016
Source: Urner Barry

58 • URNER BARRY’S REPORTER / VOL. 11, NO. 3 / SUMMER 2016
BrownProduce
Co.Farina,
Illinois 62838Josh Jahraus
Tel. (618) 245-3301Fax (618) 245-3552
BallasEgg Products
Corp.Zanesville,
Ohio 43701Craig Ballas
Tel. (740) 453-0386Fax (740) 453-0491
WabashValley
ProduceDubois,
Indiana 47527Scott Seger
Tel. (812) 678-3131Fax (812) 678-5931
“THE PASTEURIZED CRAB MEAT MARKET HAS EXPERIENCED A BOOM AND BUST
FROM 2014 UNTIL Q1 2016.”
CrabContinued from page 43
Feb-14, $11.51
Sep-14, $15.14
Dec-13, $8.81
Nov-14, $12.68
Mar-16, $7.270.0
0.5
1.0
1.5
2.0
2.5
3.0
3.5
4.0
6
8
10
12
14
16
'07 '08 '09 '10 '11 '12 '13 '14 '15 '16
Million lbs.
$/lb
.
US Imports - Crab, Pasteurized BLUEUB Past. BLUE IndexBLUE Imp$/lb.
Past.Crab Meat imports vs.UB Index and Replacement
6
Oct-13, $9.61
Nov-14, $10.59
0.0
0.5
1.0
1.5
2.0
2.5
3.0
3.54.55.56.57.58.59.5
10.511.512.513.5
'07 '08 '09 '10 '11 '12 '13 '14 '15 '16
Million lbs.
$/lb
.
CHINA + 1/2 VIETNAM IMPORTSUB Past. RED IndexRED Imp$/lb.
Past.Crab Meat imports vs.UB Index and Replacement
7
wholesale market rose approximately 33 percent from February to September 2014 led by tight supplies and high costs during the first six months of 2014 (Chart 6). What this means is that replacement costs for U.S. importers continued going up as product made it to the U.S.—it takes approximately 2-3 months for a P.O. to arrive in the U.S. and thus get recorded by the U.S. Department of Commerce. So with replacement costs reaching a record high in November 2014, and wholesale prices in the U.S. finding a plateau in September and October, prices since then adjusted lower both in the U.S. and abroad. Still, many importers continued buying near-record volumes throughout 2015 but at substantially lower prices overseas. This provided some incentive for importers to offload high-priced inventories even at a loss, simply because new replacement was also adjusting lower (Chart 6 and 7). What followed was basically all a correction.
Demand in the U.S., however, remained spooked by high prices causing prices in the U.S. market to continue dropping. But low prices have also caused many end-users to promote crab meat
once again, gradually but surely, as reported by many. In other words, the demand destruction caused by record-high prices in a matter of months had long-lasting effects in demand, which the industry is still recovering from.UB

VOL. 11, NO. 3 / SUMMER 2016 / URNER BARRY’S REPORTER • 59
AREA 1,038,700 sq km 9,833,517 sq kmCOASTLINE 3,208 km 19,924 kmPOPULATION 46,736,728 321,368,864LIFE EXPECTANCY 75.48 years 79.68 yearsGDP $274.2 billion $17.97 trillion GDP (per capita) $14,000 $56,300AGRICULTURE AS A %GDP 6.4% 1.6% AGRICULTURAL PRODUCTS Coffee, flowers, bananas,
rice, cattle, shrimpwheat, corn, grains, fruit,
beef, pork, vegetablesLABOR FORCE 24.34 million 156.4 millionUNEMPLOYMENT RATE 8.9% 5.20%CRUDE OIL PRODUCTION 989.9 k bbl/d 8.653 million bbl/day
Colombia / U.S.comparison
dominates the Colombian agricultural complex: Cattle. 74% of agriculturally developed land is dedicated to cattle, and they make up 45% of Colombia’s agricultural output. Colombia’s government has long pushed cattle health initiatives, especially those involving vaccinations. In 2009. Colombia was declared free of foot-and-mouth disease, and is eradicating brucellosis in hundreds of farms every year. These improved health standards will hopefully expand Colombian cattle exports in future years.
Seafood in Colombia is not as significant as cattle, although shallow water shrimp fisheries have a respectable annual take. Colombia’s remarkable biodiversity also allows for small-scale fishing for a notable variety of less common, valuable products. Colombian fishing occurs in both the Pacific Ocean and Caribbean Sea, taking advantage of Columbia’s unique double coastlines. Significant fishing occurs in inland rivers as well. Colombian aquaculture puts a major emphasis on shrimp, although tilapia, tambaqui and trout are also farmed commercially.
Looking forward, cattle is likely to remain the major agricultural product of Colombia, and, as more populations are certified safe and disease-free, their export opportunities will only grow.UB
Article contributed by Jake [email protected]
12,000 years ago, hunter-gatherer cultures traded with one another in the area that would one day become Bogotá. 1,000 years ago, the Muisca and Tairona Amerindians developed a pyramidal society and power structure. 500 years ago, settlements were founded by the Spanish, and the land was conquered in search of El Dorado. 150 years ago, the Republic of Colombia reached its current form, and it has been that way ever since. Colombia’s history in these past 150 years has seen an existence of insurgency and conflict, but the nation has maintained a strong tradition of democracy, deposing two military dictators within a year of their seizing power.
Cattle and coffee carry
ColombiaColombia has more than just democracy, however. It is also a country of life, and a lot of it. It is the second most biodiverse country in the world, behind only Brazil, which is 10 times the size. 10% of all species in the world are located within Colombia. The same climate that allows for this diversity also allows it to produce coffee. Lots and lots of it, as Colombia is fourth in global coffee production. Colombia also ranks in cut flower production, a respectable second behind the Netherlands.
Even with these globally ranked agricultural products, something else
©ale
xmillo
s
An international spotlight …

60 • URNER BARRY’S REPORTER / VOL. 11, NO. 3 / SUMMER 2016
So it is with all “experience goods.” Wine and beauty products are other examples.
That’s why it is so important to have a system in place that helps predict product performance, says Daryl Tatum, Colorado
State University meat scientist.
The wine industry has its ratings and flavor descriptions and the beef community its quality grades.
In a new research review, “Recent trends: beef quality, value and price,” Tatum combined the results of several
Article contributed by Miranda Reiman, Certified Angus Beef
You have to eat it. That’s really the only way to know if a steak is going to be good or not.
Increasing the oddsMoving up the grading scale …
• Food and agribusiness lender since 1917• Fixed and adjustable rate mortgage financing • Competitive interest rates • Flexible terms and structuring
© 2016 METLIFE, INC. PEANUTS © 2016 Peanuts Worldwide LLC
Whether you’re looking to expand your operation, refinance an existing mortgage or recapitalize your balance sheet, MetLife can tailor a loan to fit your needs.
Dan Seger 309-585-0637 [email protected]
www.metlife.com/ag
YOUR LENDER OF CHOICE FOR FOOD AND AGRIBUSINESS CAPITAL
Rates are attractive—contact your MetLife food & agribusiness representative today.
Food & Agribusiness Finance
Jon Dressler 559-470-6458 [email protected]
Felicia Fowlkes 202-826-4110
Brad Vissering 309-585-0180
studies to provide a comprehensive overview of the grading system’s ability to predict sensory performance and value of beef.
The results? Consumers who want more than a “run of the mill” eating experience should reach for premium Choice or Prime.
With Prime, there’s a 97% chance of having a good eating experience and that is 93% with premium Choice, but low Choice moves to 82%. Select is a “roll of the dice,” Tatum explains, with a one-in-three chance of having a negative experience.
Daryl Tatum

VOL. 11, NO. 3 / SUMMER 2016 / URNER BARRY’S REPORTER • 61
X _____________________________________Sign here for approval and fax to: 732-341-0891
Dated ____________________
Beef
Veal • Pork
Poultry • offal
HOME OFFICETom Lucaccioni
andrew wenk
aJ FoLLenweider
PhiLL hoPPenJan
847-358-9901
DENVER OFFICE rick ShuchTer
303-691-8110
ST. LOUIS OFFICE STeve Friedman
314-872-3117
BOSTON OFFICEroberT aPPeLL
508-878-3670
ason’s
oods
nc.
J
F
I
“After sorting for brands, what’s left in the Choice box isn’t too special,” Tatum says, noting that at least a third of the total Choice category is sold in branded beef and premium programs.
Moving up on the grading scale helps improve the odds dramatically. The odds of a good eating experience are 2.9 times greater when trading up from low Choice to premium Choice.
Economic signals reflect that reality.
“Sensory performance does align with the price difference in the trade,” he says.
From 2012 to 2014, the average carcass grid values showed a $13.64 per hundredweight (cwt.) premium for Prime, on down to a $10.09/cwt. discount for Select. Charting those amounts along with the meat sensory measurements shows a linear relationship.
To the grading system critics Tatum says, “When I look at these things, it seems to be working pretty well. I don’t think we’d have been able to trade beef at the prices we have been without some performance behind it.”
History demonstrated what happened when marbling wasn’t part of the equation as beef got leaner and the industry tried to compete with other proteins on price alone.
“Demand kept tanking,” Tatum says. “A lot of the quality signals and trends that we see today began back then.”
He referenced the opposite trends for commodity beef versus the Certified Angus Beef® (CAB®) brand, which got its start in 1978 and saw dramatic sales increases at a time when beef sales were declining overall.
Today’s science is convincing and fits well with the economics, Tatum says. The only way to be sure that an “experience good”
is going to give you a good experience is to make use of trusted marketing parameters so that it becomes more of a “search good,” something you seek out repeatedly because of more favorable experiences.
A certain brand, variety and vintage will increase your odds, but, “you never really know until you uncork the bottle,” he says.
Or take that first juicy bite.
To read the entire report, visit www.CABpartners.com/educators.UB
www.turkeyvalleyfarms.com507.337.3100
CALL US FOR YOUR CO-PACK TURKEY NEEDS
Raw CAB prime strip loin

62 • URNER BARRY’S REPORTER / VOL. 11, NO. 3 / SUMMER 2016
The rebound in the value of the dollar during the second half of 2014 pushed the index over 100.00 to the highest level since April 2003. The rapid rise during
Among the many factors that can affect international sales or imports are swings in currency exchange rates, which can alter the volume and prices of goods sold or received.
During the past 20 or so years, the U.S. dollar index swung from a high of 121.29 in July 2001 to a low of 71.05 in April 2008 and back over 100.00 in March 2015 (Chart 1). As the value of the U.S. dollar swings, the exchange rate between the dollar and the currencies of our trading partners is typically altered as well. When the value of the dollar is down, relative to our trading partners’ currencies, U.S. goods become less expensive for them to buy. Conversely, when the value of the dollar is high, international customers pay more for U.S. goods.
For example, the exchange rate between the U.S. dollar and Mexican peso on May 1st of this year was 17.1866 pesos per dollar. On the same date 15 years ago the rate was 9.2504 pesos per dollar. This means that to purchase a pound of a meat or poultry product worth $3 would require nearly 52 pesos now versus about 28 pesos in 2001 (Chart 2).
As currency exchange rates change, so can outlook for exports/imports
The dollar’s value and its great impact ...
707580859095
100105110115120
'95 '96 '97 '98 '99 '00 '01 '02 '03 '04 '05 '06 '07 '08 '09 '10 '11 '12 '13 '14 '15 '16
U.S. Dollar Index (yearly average)Source: Barchart
1
0
4
8
12
16
20
'95 '96 '97 '98 '99 '00 '01 '02 '03 '04 '05 '06 '07 '08 '09 '10 '11 '12 '13 '14 '15 '16
USD
/MXN
U.S. Dollar to Mexican Peso, $1USD = $MXNSource: Barchart 2
0.10
0.11
0.14 0.
18 0.20 0.23 0.
28 0.31
0.18 0.
12
0.01
-0.1
4
-0.1
4
-0.2
4
-0.0
6
-0.2
5
-0.3
1
-0.2
7
-0.2
4
-0.1
6
-0.0
5
0.00
-0.4
-0.3
-0.2
-0.1
0.0
0.1
0.2
0.3
0.4
'95 '96 '97 '98 '99 '00 '01 '02 '03 '04 '05 '06 '07 '08 '09 '10 '11 '12 '13 '14 '15 '16
Varia
nce
U.S. Dollar to Canadian Dollar, $1USD = $CADvariance from 22 -year avg used as baseline
3
the last half 2014 along with other factors contributed to slowed beef and pork exports in 2015. Poultry exports were hampered significantly in 2015 as well
“When exchange rates are unfavorable for international
customers … they often purchase less from the U.S. and seek out better bargains from other supplying countries…”
©ste
vegr
aham

VOL. 11, NO. 3 / SUMMER 2016 / URNER BARRY’S REPORTER • 63
due in large part to import bans on U.S. poultry imposed by some trading partners following outbreaks of Highly Pathogenic Avian Influenza.
When exchange rates are unfavorable for international customers that purchase U.S. meat and poultry products, they often purchase less from the U.S. and seek out better bargains from other supplying countries. They may also buy cheaper cuts or trade down to less expensive proteins to fulfill their food needs.
The swings in currency exchange rates typically last several months to a few years, so the impact can be fairly lengthy and can be either beneficial or costly to livestock and poultry producers, processors and international traders.
Japan, Mexico and Canada are three of the U.S.’ largest international customers for meat and poultry. The currency exchange rates with these three nations have varied considerably during the past two decades. The following charts illustrate annual variances in exchange rates from the average for each of these three nations (Charts 3, 4 & 5).
“The United States will continue to be challenged to compete with the EU (on pork sales to Asia) due to a strong dollar and relatively higher prices,” USDA economists said in its April livestock and poultry outlook report.
Regarding poultry exports, USDA’s outlook report said “an excess of exportable supplies caused by trade restrictions weakened U.S. prices in 2015. However, these lower prices were largely offset by a stronger dollar. A weakened Real also reduced competiveness of the United States versus Brazil.”
The dollar index has been easing gradually of late. Since hitting a 2016 high of 99.95 on Jan. 21, the index has eased and as of May 10 was at 94.267. A weaker dollar through the balance of 2016 could help boost exports and slow the flow of imports but a rebound in the index would have the opposite effect.UB
Article contributed by Curt [email protected]
-4.9
3
-3.5
3
-3.0
0
-2.4
5
-1.6
4
-1.5
5
-1.7
0
-1.5
2
-0.6
5
0.50
0.09
0.13
0.00
-0.4
2
2.85 1.
29
0.56
2.04
1.23
2.15 4.
34 6.24
-6
-4
-2
0
2
4
6
8
'95 '96 '97 '98 '99 '00 '01 '02 '03 '04 '05 '06 '07 '08 '09 '10 '11 '12 '13 '14 '15 '16
Varia
nce
U.S. Dollar to Mexican Peso, $1USD = $MXNvariance from 22 -year avg used as baseline
4-2
4.44 -2.9
3
18.9
0
24.9
7
11.3
2
-0.2
5
15.4
9
20.3
7 10.8
6
2.34
-3.3
7
5.70 11
.33
-4.0
0
-10.
22 -14.
00
-26.
93
-28.
08
-10.
48 -5.7
7
10.9
5
-1.7
9
-40
-30
-20
-10
0
10
20
30
'95 '96 '97 '98 '99 '00 '01 '02 '03 '04 '05 '06 '07 '08 '09 '10 '11 '12 '13 '14 '15 '16
Varia
nce
U.S. Dollar to Japanese Yen, $1USD = $JPYvariance from 22 -year avg used as baseline
5
phone: 479-967-6600 • fax: [email protected]
TRADERS INBEEF, PORK, POULTRY & TURKEY
RVT is looking for motivated traders/brokers to join our team and partner with us to expand in food
brokerage opportunities
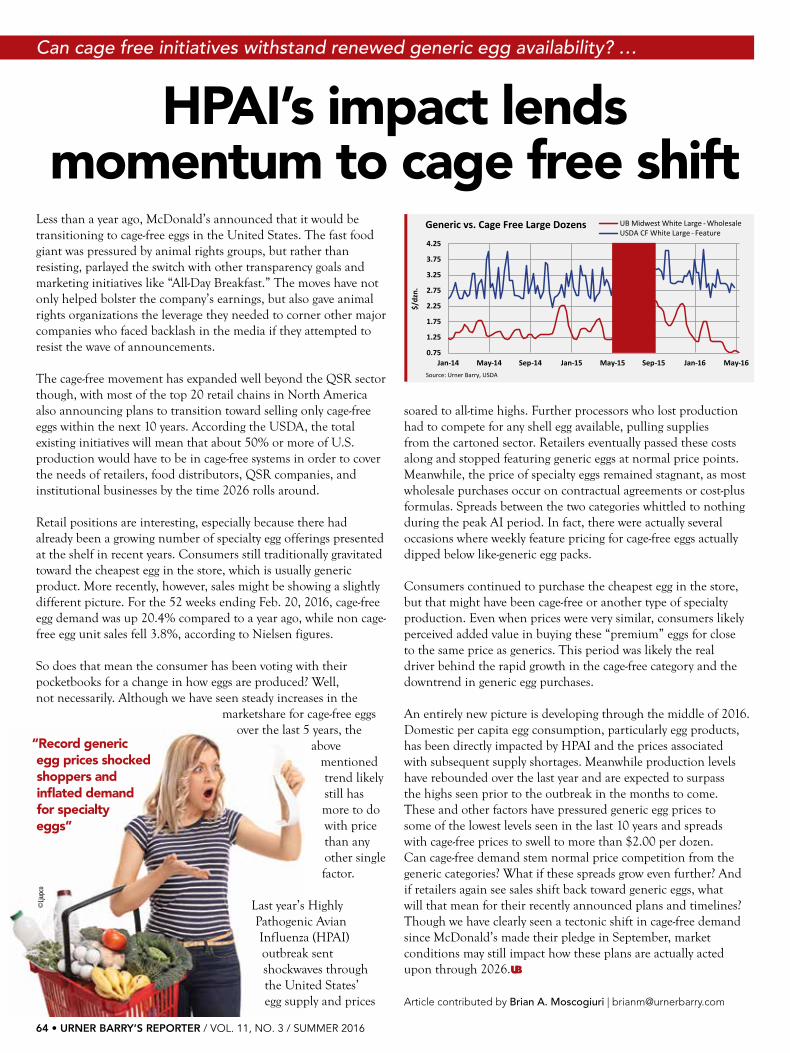
64 • URNER BARRY’S REPORTER / VOL. 11, NO. 3 / SUMMER 2016
soared to all-time highs. Further processors who lost production had to compete for any shell egg available, pulling supplies from the cartoned sector. Retailers eventually passed these costs along and stopped featuring generic eggs at normal price points. Meanwhile, the price of specialty eggs remained stagnant, as most wholesale purchases occur on contractual agreements or cost-plus formulas. Spreads between the two categories whittled to nothing during the peak AI period. In fact, there were actually several occasions where weekly feature pricing for cage-free eggs actually dipped below like-generic egg packs.
Consumers continued to purchase the cheapest egg in the store, but that might have been cage-free or another type of specialty production. Even when prices were very similar, consumers likely perceived added value in buying these “premium” eggs for close to the same price as generics. This period was likely the real driver behind the rapid growth in the cage-free category and the downtrend in generic egg purchases.
An entirely new picture is developing through the middle of 2016. Domestic per capita egg consumption, particularly egg products, has been directly impacted by HPAI and the prices associated with subsequent supply shortages. Meanwhile production levels have rebounded over the last year and are expected to surpass the highs seen prior to the outbreak in the months to come. These and other factors have pressured generic egg prices to some of the lowest levels seen in the last 10 years and spreads with cage-free prices to swell to more than $2.00 per dozen. Can cage-free demand stem normal price competition from the generic categories? What if these spreads grow even further? And if retailers again see sales shift back toward generic eggs, what will that mean for their recently announced plans and timelines? Though we have clearly seen a tectonic shift in cage-free demand since McDonald’s made their pledge in September, market conditions may still impact how these plans are actually acted upon through 2026.UB
Article contributed by Brian A. Moscogiuri | [email protected]
Less than a year ago, McDonald’s announced that it would be transitioning to cage-free eggs in the United States. The fast food giant was pressured by animal rights groups, but rather than resisting, parlayed the switch with other transparency goals and marketing initiatives like “All-Day Breakfast.” The moves have not only helped bolster the company’s earnings, but also gave animal rights organizations the leverage they needed to corner other major companies who faced backlash in the media if they attempted to resist the wave of announcements.
The cage-free movement has expanded well beyond the QSR sector though, with most of the top 20 retail chains in North America also announcing plans to transition toward selling only cage-free eggs within the next 10 years. According the USDA, the total existing initiatives will mean that about 50% or more of U.S. production would have to be in cage-free systems in order to cover the needs of retailers, food distributors, QSR companies, and institutional businesses by the time 2026 rolls around.
Retail positions are interesting, especially because there had already been a growing number of specialty egg offerings presented at the shelf in recent years. Consumers still traditionally gravitated toward the cheapest egg in the store, which is usually generic product. More recently, however, sales might be showing a slightly different picture. For the 52 weeks ending Feb. 20, 2016, cage-free egg demand was up 20.4% compared to a year ago, while non cage-free egg unit sales fell 3.8%, according to Nielsen figures.
So does that mean the consumer has been voting with their pocketbooks for a change in how eggs are produced? Well, not necessarily. Although we have seen steady increases in the
marketshare for cage-free eggs over the last 5 years, the
above mentioned trend likely still has more to do with price than any other single factor.
Last year’s Highly Pathogenic Avian Influenza (HPAI)outbreak sent shockwaves through the United States’ egg supply and prices
HPAI’s impact lends momentum to cage free shift
Can cage free initiatives withstand renewed generic egg availability? …
0.75
1.25
1.75
2.25
2.75
3.25
3.75
4.25
Jan-14 May-14 Sep-14 Jan-15 May-15 Sep-15 Jan-16 May-16
$/dz
n.
UB Midwest White Large - WholesaleUSDA CF White Large - Feature
Generic vs. Cage Free Large Dozens
Source: Urner Barry, USDA
©Lju
pco
“Record generic egg prices shocked shoppers and inflated demand for specialtyeggs”

VOL. 11, NO. 3 / SUMMER 2016 / URNER BARRY’S REPORTER • 65
Superfood. The word is thrown around in food advertising to describe anything from salmon to oatmeal, and often goes hand in hand with things like juicers and smoothies. Beyond a mask and cape, what exactly makes these foods so “super”?
While no scientific basis currently exists for the definition of the term superfood, there are a few common threads between most of the foods that carry the name. In general, superfoods have a lot of micronutrients, like vitamins, minerals, antioxidants, and phytochemicals. Eggs and salmon, both considered superfoods, are noted for their great protein levels. Superfoods also tend to have a low calorie count. This results in a high nutrient density; meaning a superfood might offer more nutrient bang for your calorie buck than another, more mild-mannered meal.
Generally, superfoods are very good for you. However, it’s still important to take a look at what’s actually in what you eat, before what you eat goes in you. Consuming too much of any food won’t provide special benefits, and not all so-called superfoods should be viewed in the same light. Since science has no definition for a superfood, some food trends that carry the name are not as healthy as they sound. Juice cleanses, for example, are often considered unhelpful, and often dangerous. While the juices themselves carry vitamins, the trend of “removing impurities” from your body with a cleanse diet is sometimes called dangerous and nutritionally unsound. It is food trends like juicing that make nutritionists and dietitians disinclined to adopt the idea of superfoods, instead preferring terms that accurately describe a food’s exact nutrient makeup and dietary role.
A balanced diet should certainly contain superfoods; they’re basically tasty vitamin or mineral supplements. However, they aren’t all a person should eat. People need a lot of different nutrients in
Behind the mask: what makes superfoods so super
various quantities, and the best way to get that is to follow a balanced diet. While traditional superfoods like kale or acai berries indubitably carry benefits, so too do foods that are a part of our everyday diets. Superfoods, like their ordinary food brethren, are best enjoyed in moderation.UB
Article contributed by Jake [email protected]
It’s a bird, it’s a plane …
©pixelliebe
“A superfood might offer
more nutrient bang for
your calorie buck...”
Distributors of the finest protein products: Beef, Pork, Poultry, Seafood, Veal & Lamb,
Processed Meats, Natural Products, Cheese & Dairy
Since 1989. From Our Door
to Yours.
San Diego: 619-477-0185Los Angeles (JSS): 323-584-3160Sacramento: 916-399-8982Seattle (WBX): 253-604-4755Portland (WBX): 503-284-3314Phoenix: 623-936-0020
Dallas: 623-936-0020Denver: 303-333-8225
Kansas City: 913-371-2333Sioux City: 605-232-6151
Orlando: 407-296-0818

66 • URNER BARRY’S REPORTER / VOL. 11, NO. 3 / SUMMER 2016
Executive ConferenceContinued from page 1
Urner Barry
P.O. Box 389
Toms River, NJ 08754-0389
732-240-5330
www.urnerbarry.com/executive
See you next year!
Caesars Palace, Las Vegas
April 30 – May 2, 2017
Caesars Palace, Las Vegas
May 1-3, 2016
Navigating Change.
Conquering Challenges.
Oskaloosa Food Products President and current American Egg Board Chairman, Blair Van Zetten (third from left), was honored as Urner Barry’s Egg Person of the Year. Helping to celebrate Blair’s many years of hard work and dedication were (L to R) Cindy and Jeff Henning, Henning Holdings; Lisa Beohm, Henning Companies; Craig Rowles, Iowa Cage Free; and Todd Carlson, Henning Holdings.
Urner Barry’s 2016 Poultry Person of the Year Award recipient, Gary Cooper, is flanked by his family and by members of the Cooper Farms team. (L to R) Terry Wehrkamp, Joe Wourms, Luke Cooper, Cole Cooper, Chuck Staugler, Dianne Cooper, Roger Wellman and Dan Lightle.
Nearly 500 attendees made it to this historic three-day conference for a program packed with a series of breakout sessions catered for protein professionals.
Keynote Speaker Stephen Moore from the Heritage Foundation opened the event. His talk addressed the current state of politics and policy decisions in the U.S and their direct impacts on operating big and small business domestically and abroad.
Day one also featured a review of international cold storage trends from Global Cold Chain Alliance’s Corey Rosenbusch; an update to the Avian Influenza epidemic from Hybrid Turkey’s Dr. Helen Wojcinski; and a review of the U.S. protein supply from Cattlefax CEO Randy Blach.
On day two “Supermarket Guru” Phil Lempert took the stage to tell the crowd about the latest retail innovations changing consumer buying trends.
Datassential’s Colleen McClellan closed out the morning sessions with an analysis of how Generations Y and now Z are rapidly influencing consumption patterns at the foodservice level.
Tuesday afternoon’s sessions featured a financial outlook on the entire food sector with Rabbobank’s Food and Agricultural analyst Will Sawyer. American Blue Ribbon’s Executive Neil Naroff followed up with a restaurateur’s perspective of how poultry and eggs are featured in his restaurants.
A poultry and egg export forum followed with USAPEEC’s Jim Sumner and Deb El Foods’ Elliot Gibber.
Per tradition, the Executive Conference concluded with the annual Egg and Poultry Roundtables hosted by Urner Barry’s own expert market reporters. Blach capped off sessions with a final beef and pork forecast provided by Obsono.
THE NETWORKINGIn addition to high quality industry and business content, Urner Barry’s Executive Conference and Marketing Seminar is also an ideal networking opportunity.
The conference features several premier events that allow attendees to meet with existing and potential customers.
Evening cocktail receptions, the annual golf outing, in addition to private breakfast and lunch hours, offer conference attendees unique opportunities to engage with industry contacts.
Attendees not interested in hitting the links or in need of a mid-session meal are able to relax poolside between sessions at a Caesars Palace cabana hosted by Urner Barry. In the evenings, guests also enjoy access to countless casinos, restaurants and shows up and down the Las Vegas strip.
THE AWARDSIn 1986 Urner Barry began recognizing two individuals, one from the egg industry and the other from the poultry sector for contributions made to their respective fields.
Those honors are now known as Urner Barry’s Egg and Poultry Person of the Year awards, which are held each year during the conference’s annual attendee dinner event.
This year Urner Barry honored Blair Van Zetten as the Egg Person of the Year and
Gary Cooper as the Poultry Person of the Year.
Blair Van Zetten is the President of Oskaloosa Food Products Corporation located in Oskaloosa, Iowa. Oskaloosa Foods is an industry leader in dried, liquid and frozen egg products that serves both domestic and international markets. Van Zetten’s start in the egg business was alongside his father who started the company in 1938. Returning to work alongside his dad at the
Text continued on page 71

VOL. 11, NO. 3 / SUMMER 2016 / URNER BARRY’S REPORTER • 67
Enjoying a beautiful evening during Sunday’s reception were (L to R) Jeff and Cathy Henning, Henning Holdings; Craig Rowles, Iowa Cage Free; Lisa Beohm, also of Henning; and Ken Alvarez, Hendrix-ISA.
An egg-cellent time was had by all! (L to R) Al Schimpf, S&R Egg Farms with Gary and Barbara West and Mike and Cathy West, J.S. West and Company.
More photos on next page...
Seen “fowling” around were (L to R) Butterfield Foods’ Lon Peterson and Mitch Forstie, along with Ted Hudson of Burnbrae Farms and Josh Fisher of B & B Poultry.
Nothing left to do but smile, smile, smile! Kelvin Kershaw, Land O’Frost, and Emily Sauders, Farbest Foods, enjoying opening night festivities.
No need to ask where the party is with this group in town! (L to R) Chris Woodling, GNP; Jeff Tapick, Martin Preferred Foods; Jay Hager, GNP; Cathy Woodling, Tom Ellis, John Bowles Foods; and Matt Boarman, Martin Preferred Foods.
This year’s event saw a perfect mix of conference “old timers” and newcomers. Here first-time attendee Jan Jandrain (third from left) of Butterball learning the ropes from veterans (L to R) Anthony Steed also of Butterball, Roger Wellman of Cooper Farms and Land O’ Frost’s Carl Abbott.
Enjoying cocktails and networking at Sunday’s Welcome Reception! (L to R) Peter Clarke and Glen Jennings, Egg Farmers of Canada; Sarah-Jane Hill, Bloomin’ Brands Inc.; Tim Lambert, also of Egg Farmers of Canada; and Steve Manton, Noble Egg Innovations.
Rabobank’s Agricultural Analyst Will Sawyer took time to educate Executive Conference attendees about the current state of lending to protein operators.

68 • URNER BARRY’S REPORTER / VOL. 11, NO. 3 / SUMMER 2016
TRADERS OF MEAT AND POULTRYBird-in-Hand Farms is one of the leading poultry enterprises in the United States. Since 1949, we’ve represented suppliers and
customers in the buying and selling of poultry and meats.
www.BIHFARMS.com
EST. 1949
LANCASTER, PACompanyHeadquarters
717.291.5855Fred BloomTed Bloom
412.443.6848Bob Willoughby
BRANDON, MS601.932.5997David ColeDonnie Pepper
TOPSAIL, NC910.328.1288Wayne ReynoldsGayla MacMillanWilliam Reynolds
MONETT, MO417.235.5700Randy WittTom DrewiankaMarla Sperry
507.530.0658Laura Eichmann
RAEFORD, NC910.875.5757Selena Jackson
GEORGETOWN, DE410.726.3472Lou Sensi
SALISBURY, MD410.219.5037Ronnie Graves TUCSON, AZ
520.404.4223Dave Manning
SOUTHERN PINES, NC910.695.0661David Wilson
CHAPIN, SC803.932.4361Alec Herring Yvonne McMurry
RUSSELLVILLE, AR479.968.3332Bill Lewis
NACOGDOCHES, TX936.564.0539Jackie Cates
EXPORTS: LATIN AMERICA / NICARAGUA770.657.4342 / 011.505.2.299.2560 Cell: 011.505.7.885.8888Luis Fuster • Rose Camacho • Grace Uy
Logistics: LAWRENCEVILLE, GA770.827.3477Yanita Velez
Executive Conference...continued from page 67
The Annual Golf Tournament received rave reviews after moving to Bali Hai. This year the team of (L to R) Scott Shultz, Tip Top Poultry; Ted Rueger, Eastern Quality Foods; Chris Brakebush, Brakebush Brothers; and Hans Schmidt of Koch Foods was the one to beat!
Sharp dressed men! Mike Little (L), Mountaire Farms; and Brad Horan, Lamex Foods.
What? Us Worry?!? USAPEEC’s Jim Sumner and Boyce Overstreet of C & O Food Services ready to hit the links!!
SAVEthe
DATE!
41st Annual Executive Conferenceand Marketing SeminarApril 30 – May 2, 2017 Caesars Palace, Las Vegas

VOL. 11, NO. 3 / SUMMER 2016 / URNER BARRY’S REPORTER • 69
Urner Barry would like to sincerely thank our generous sponsors for their continued support. Their involvement has enabled our event for the past 40 years. We recognize their contributions are imperative in providing the industry with this high-quality event that not only offers one of the best networking opportunities to the industry, it also presents exceptional educational and motivational content. Our deepest gratitude as we look forward to 2017!
2016 EXECUTIVE CONFERENCE & MARKETING SEMINAR SPONSORS
Sponsorship for more than 20 years
GOLD SPONSORSSponsorship for 10 years or more
SILVER SPONSORS SPONSORS
Navigating Change. Conquering Challenges.
R
®
Kap’s
FPI

70 • URNER BARRY’S REPORTER / VOL. 11, NO. 3 / SUMMER 2016
As oil, coal and natural gas have gone down in price, it has become less profitable to ship them, making producers more likely to purchase local supply if available. Coal and oil move by rail in the U.S. and were part of why the rail stocks were so loved by investors. However, as coal has been nearly legislated out of existence in the last few years and as oil has gone down to prices at one point in the range of $27/bbl, it’s become difficult for railways to move oil and coal profitably and, as such, volumes have declined. The problem with rail isn’t just in North America – freight rates from Europe to Asia fell to just $620USD/container (or other currency equivalent) and typically operators need about $1,000 to be profitable. So while many of the rails are making up
the difference on volume, that cannot go on forever.
U.S. rails are doing better than their counterparts in the old world, but there is still some pain in the sector. Any increases in the movement of merchandise and large goods is offset by the declining volume of coal and oil moving over U.S. rails, previously a staple of the industry. Last year multiple coal companies filed for bankruptcy, including Alpha Natural Resources, Patriot Coal and Walter Energy. And while extra space on the
trains is good news for other industries looking for a deal on space in a freight car, the railroads are certainly not happy about it.
On the whole, it seems like we are in the midst of a big economic shift here. Overall volumes are generally flat or declining based on sector and larger ships; post-PANAMAX ships will allow shippers to have smaller fleets, though shippers like Maersk that run many, many routes will struggle with the logistical challenges of this. While many shippers are going through bankruptcy or reorganization, this is not as unusual as it sounds. Overall, it is unlikely that globalization is going anywhere or that U.S. imports will continue to decline barring a severe and unforeseen recession. Furthermore, it seems like most modern and post-industrialization economies are able to pick up in services where they lose in raw materials and finished goods in most cases.UB
Article contributed by Adam Sharkey | [email protected]
There is a great deal of concern lately surrounding global trade volumes, particularly shipments in bulk by sea and rail. Ships are getting larger and railroads are adding capacity, presumably too late, as the days of increasing volumes seem to have passed us by. But, how did we get here and what exactly is happening with global trade?
For starters, there has by no means been a serious decline in the trend of other countries exporting to the United States. Total U.S. imports did decline by about half a percent from 2014 to 2015, but such a decrease is not unusual as this number fluctuates. U.S. exports declined by nearly eight percent, mostly due to dollar strength. In other words, global trade volumes had stayed roughly the same, with countries that have weakening currencies picking up where the U.S. fell short on the export front.
This year was where things started to slow down. As services make up a larger portion of the economy, manufactured goods just don’t draw as much demand as they used to. Families are often taking some of the money they used to buy toys or DVDs, which have declined in volume but certainly not disappeared, and putting it towards digital memberships. And while toys are certainly not yet a thing of the past (nor is it likely they’ll ever be), more and more gifts are electronic in nature (a $25 Candy Crush card vs. a $25 toy). This is creating a scenario where less physical goods need to be shipped across the Pacific but, in the post-PANAMAX era, we have more capacity than we ever have.
And, now that the Panama and Suez canals have gone through a fair amount of work to bring themselves up to snuff, it’s almost ironic to think that now that we can finally handle with some degree of comfort the level of global trade we had projected, we’re falling from it, and fast. Maersk, which last year spooked investors by reporting lower-than-projected earnings and reining in their guidance, this year has seen revenue growth slow in the areas that are still doing fine and has reported heavy losses in its oil division. Overall, energy has been a huge part of the issues in shipping.
What big ships and small profits mean for globalization
Freight fright ...
©pe
tersp
iro

VOL. 11, NO. 3 / SUMMER 2016 / URNER BARRY’S REPORTER • 71
Bird-In-Hand ........................................... 68Cal-Maine ................................................. 5Camanchaca Inc. ................................... 33Catelli Brothers, Inc. .............................. 13Chicken of the Sea Frozen Foods .......... 37ComeCarne ............................................ 19Country Charm Eggs, LLC ..................... 16D & R Foods ............................................ 6Deb El Food Products LLC .................... 16Devi Seafoods, Inc. ................................ 38Dolphin Shipping ................................... 18Estherville Foods ................................... 17Farbest Foods ........................................ 24Grupo Capistrano Alimentari ................. 51Harbor Seafood ..................................... 41Harvest Meat Company ......................... 65
Jason’s Food Inc. .................................... 61Keyport International ............................. 43L & S Foods ............................................ 22LaMonica Fine Foods ............................... 2Meat Commodities Inc. ........................... 7Metlife Financial ..................................... 60Mexican Beef ......................................... 48Midwest Poultry Services ....................... 10National Poultry & Food Distributors Association (NPFDA) .......................... 34North Carolina State Port Authority ...... 15North American Meat Institute (NAMI) . 45NuCal Foods .......................................... 18Poultry Specialties Inc. ............................. 6Prestage Foods ...................................... 25Protein Alliance ...................................... 26
River Valley Trading ............................... 63Savage Poultry ....................................... 27Sea Watch International, Ltd. ................ 39Shorepoint Insurance Services ............... 31South American Beef ............................ 72Thunderbird Food Machinery ................ 23Tippmann Group/ Interstate Warehousing ...................... 47Turkey Valley Farms ............................... 61Urner Barry ............................................ 50Vista Food Exchange, Inc. .................... 35Wabash Valley Produce .......................... 58Wayne Farms .......................................... 21Westside Foods Inc. .............................. 29Win Transport ........................................ 44
Advertiser Index ...
pounds per capita, reflecting higher production and less leaving the country. The current projections for 2016 and 2017, assuming production continues to expand by several percentage points faster than the U.S. population, are 214.5 and 217 pounds per capita, respectively. Essentially, each person in the United States would need to consume 15 more pounds of poultry and red meat over the course of the year in 2017 than they did in 2014. This is a tall order, and does not include any potential expansion in domestic egg or seafood supplies. The last time we saw per capita numbers this high was in 2008, a year in which beef, pork, chicken, and turkey (as well as shrimp and salmon) prices were all notably lower. This is likely not a coincidence.
As we sit close to the halfway mark in 2016, retail sales have had their up and down moments but frequently have left something to be desired, especially given the added availability of protein. It is easy for the beef industry to blame cheap pork features for poor sales and the pork industry to place the blame on cheap poultry prices on their lackluster retail performance. However, it would appear that generally, the availability of protein has surpassed the growth of protein demand, regardless of the category. This is a global issue, as most of our protein categories rely, at least partially, on consistent international trade. With expectations
Supply
Executive Conference
Continued from page 1
Continued from page 66
of further protein availability in the coming years and a much more gradual growth in population, nurturing and expanding on that international business will become all the more critical to stabilizing domestic wholesale prices.
Of course every market has its own intricacies that can affect price and availability, and the degree of these outside elements can have a substantial impact. However, much of the analysis included in this issue of Urner Barry’s Reporter will touch on some of the aforementioned factors with the impact of supply being a common thread.UB
Article contributed by Russell Barton | [email protected]
'16 P, 214.5
'17 P, 217.0
200
205
210
215
220
225
'93 '94 '95 '96 '97 '98 '99 '00 '01 '02 '03 '04 '05 '06 '07 '08 '09 '10 '11 '12 '13 '14 '15 '16 P
'17 P
lbs.
Per Capita Disappearance (Retail Weight)Red Meat & Poultry
Source: USDA
operation in 1975, he took control of the company in 1980 upon his dad’s passing. During his career he served on many industry-related boards including the American Egg Board and the Iowa Egg Council. As a founding member of the Egg Industry Center board, Van Zetten acted as its first Chair and remains an active and committed member of the group to this day.
Gary Cooper is the Chief Operating Officer of Cooper Farms. He joined the family operation in 1974, after attending Bowling Green State University and is intimately familiar with all aspects of the company. As Past Chairman and member of the Executive
Committee for the National Turkey Federation, Gary is no stranger to Washington D.C. and Capital Hill, where he worked tirelessly to advance the causes of the turkey industry. He serves on the Legislative Committee for the National Pork Producers Council, is a Past-President of the Ohio Poultry Association and Past-Chairman of the U.S. Poultry and Egg Association. Cooper is also a past board member of the American Feed Industry Association, the Midwest Poultry Consortium and the U.S. Farmers and Ranchers Alliance. More recently Gary has been the driving force behind the National Turkey Federation’s Turkey Demand Enhancement Team and the 20 by 2020 project.UB
Article contributed by Michael Ramsingh | [email protected]

72 • URNER BARRY’S REPORTER / VOL. 11, NO. 3 / SUMMER 2016
Urner Barry • P.O. Box 389, Toms River, NJ 08754-0389Volume 11, Number 3 • Summer 2016
Urner Barry’s Reporter (ISSN 1944771X) is published quarterly by Urner Barry Publications, 1001 Corporate Circle, Toms River, NJ 08755. Periodicals Postage Paid at Toms River, NJ 08755 and additional offices.
• •


![[Ariela Keysar, Barry A. Kosmin (editors)] Secular(Book ZZ org)](https://static.fdokumen.com/doc/165x107/631a8022d5372c006e0385d3/ariela-keysar-barry-a-kosmin-editors-secularbook-zz-org.jpg)