On the prediction of internal particle morphology in suspension polymerization of vinyl chloride....
14
Chemical Engineering Science 62 (2007) 3970 – 3983 www.elsevier.com/locate/ces On the prediction of internal particle morphology in suspension polymerization of vinyl chloride. Part I: The effect of primary particle size distribution Aleck H. Alexopoulos b , Costas Kiparissides a , b, ∗ a Department of Chemical Engineering, Aristotle University of Thessaloniki, Greece b Chemical Process Engineering Research Institute, CERTH P.O. Box 472, 540 06 Thessaloniki, Greece Received 11 January 2007; received in revised form 5 April 2007; accepted 9 April 2007 Available online 18 April 2007 Abstract The present study provides a comprehensive investigation on the determination of the primary particle size distribution in the suspension “powder” polymerization of vinyl chloride. The primary particle size distribution inside the polymerizing monomer droplets is determined by the solution of a population balance equation governing the nucleation, growth, and aggregation of the primary particles. The stability of the colloidal primary particles is expressed in terms of the electrostatic and steric stabilization forces. The primary particle stability model includes the effects of agitation, temperature, electrolyte as well as primary and secondary stabilizer concentrations. It also includes both diffusive and shear-induced particle destabilization mechanisms. The proposed stability model is shown to accurately describe existing experimental data on particle number, mean particle size and particle size distribution for both bulk and suspension vinyl chloride polymerizations. The primary particle population balance model can predict the critical monomer conversion at which massive particle aggregation occurs leading to the formation of a continuous network of primary polymer particles inside the polymerizing monomer droplets. A detailed investigation on the predicted critical monomer conversion is carried out including its dependence on the rate of agitation, temperature, electrolyte concentration, as well as the concentrations of the primary and secondary stabilizers. 2007 Elsevier Ltd. All rights reserved. Keywords: Particle size distribution; Population balance; “Powder” suspension polymerization; Morphology; Porosity 1. Introduction The major manufacturing route currently employed for the commercial production of poly(vinyl chloride), PVC, is the sus- pension polymerization process accounting for over 75% of the total PVC produced (Smallwood, 1985; Summers, 1997; Saeki and Emura, 2002). Due to its unique morphological character- istics, PVC can be combined with a number of additives result- ing in materials exhibiting a broad range of end-use properties (i.e., from flexible elastomers to rigid plastics). The suspension polymerization of vinyl chloride monomer (VCM) involves a complex multi-phase heterogeneous kinetic ∗ Corresponding author. Department of Chemical Engineering, Aristotle University of Thessaloniki, P.O. Box 472, Thessaloniki 540 06, Greece. Tel.: +30 2310 996211; fax: +30 23100 996198. E-mail address: [email protected] (C. Kiparissides). 0009-2509/$ - see front matter 2007 Elsevier Ltd. All rights reserved. doi:10.1016/j.ces.2007.04.009 mechanism in combination with a series of physical transitions throughout the course of polymerization (Smallwood, 1985; Saeki and Emura, 2002). Initially, the monomer is dispersed into the continuous aqueous phase as separate droplets in the size range of 50–250 m by the combined action of primary stabilizers and agitation (Fig. 1). The initiator(s) is(are) pre- dominantly soluble in the monomer droplets. Upon the thermal decomposition of the initiator molecules, polymer chains are formed in the dispersed VCM phase, via a free-radical poly- merization mechanism and immediately precipitate from the monomer phase due to their limited solubility in the VCM. As a result, the polymerizing system, almost from the onset of the polymerization, separates into two phases (i.e., the monomer- and the polymer-rich phases) that are assumed to be in thermo- dynamic equilibrium. The precipitated polymer chains initially form unstable nano-domains that rapidly coagulate, leading to the generation of the primary particle nuclei. During the
Transcript of On the prediction of internal particle morphology in suspension polymerization of vinyl chloride....
Chemical Engineering Science 62 (2007) 3970–3983www.elsevier.com/locate/ces
On the prediction of internal particle morphology in suspensionpolymerization of vinyl chloride. Part I:
The effect of primary particle size distribution
Aleck H. Alexopoulosb, Costas Kiparissidesa,b,∗aDepartment of Chemical Engineering, Aristotle University of Thessaloniki, Greece
bChemical Process Engineering Research Institute, CERTH P.O. Box 472, 540 06 Thessaloniki, Greece
Received 11 January 2007; received in revised form 5 April 2007; accepted 9 April 2007Available online 18 April 2007
Abstract
The present study provides a comprehensive investigation on the determination of the primary particle size distribution in the suspension“powder” polymerization of vinyl chloride. The primary particle size distribution inside the polymerizing monomer droplets is determined bythe solution of a population balance equation governing the nucleation, growth, and aggregation of the primary particles. The stability of thecolloidal primary particles is expressed in terms of the electrostatic and steric stabilization forces. The primary particle stability model includesthe effects of agitation, temperature, electrolyte as well as primary and secondary stabilizer concentrations. It also includes both diffusive andshear-induced particle destabilization mechanisms. The proposed stability model is shown to accurately describe existing experimental dataon particle number, mean particle size and particle size distribution for both bulk and suspension vinyl chloride polymerizations. The primaryparticle population balance model can predict the critical monomer conversion at which massive particle aggregation occurs leading to theformation of a continuous network of primary polymer particles inside the polymerizing monomer droplets. A detailed investigation on thepredicted critical monomer conversion is carried out including its dependence on the rate of agitation, temperature, electrolyte concentration,as well as the concentrations of the primary and secondary stabilizers.� 2007 Elsevier Ltd. All rights reserved.
Keywords: Particle size distribution; Population balance; “Powder” suspension polymerization; Morphology; Porosity
1. Introduction
The major manufacturing route currently employed for thecommercial production of poly(vinyl chloride), PVC, is the sus-pension polymerization process accounting for over 75% of thetotal PVC produced (Smallwood, 1985; Summers, 1997; Saekiand Emura, 2002). Due to its unique morphological character-istics, PVC can be combined with a number of additives result-ing in materials exhibiting a broad range of end-use properties(i.e., from flexible elastomers to rigid plastics).
The suspension polymerization of vinyl chloride monomer(VCM) involves a complex multi-phase heterogeneous kinetic
∗ Corresponding author. Department of Chemical Engineering, AristotleUniversity of Thessaloniki, P.O. Box 472, Thessaloniki 540 06, Greece.Tel.: +30 2310 996211; fax: +30 23100 996198.
E-mail address: [email protected] (C. Kiparissides).
0009-2509/$ - see front matter � 2007 Elsevier Ltd. All rights reserved.doi:10.1016/j.ces.2007.04.009
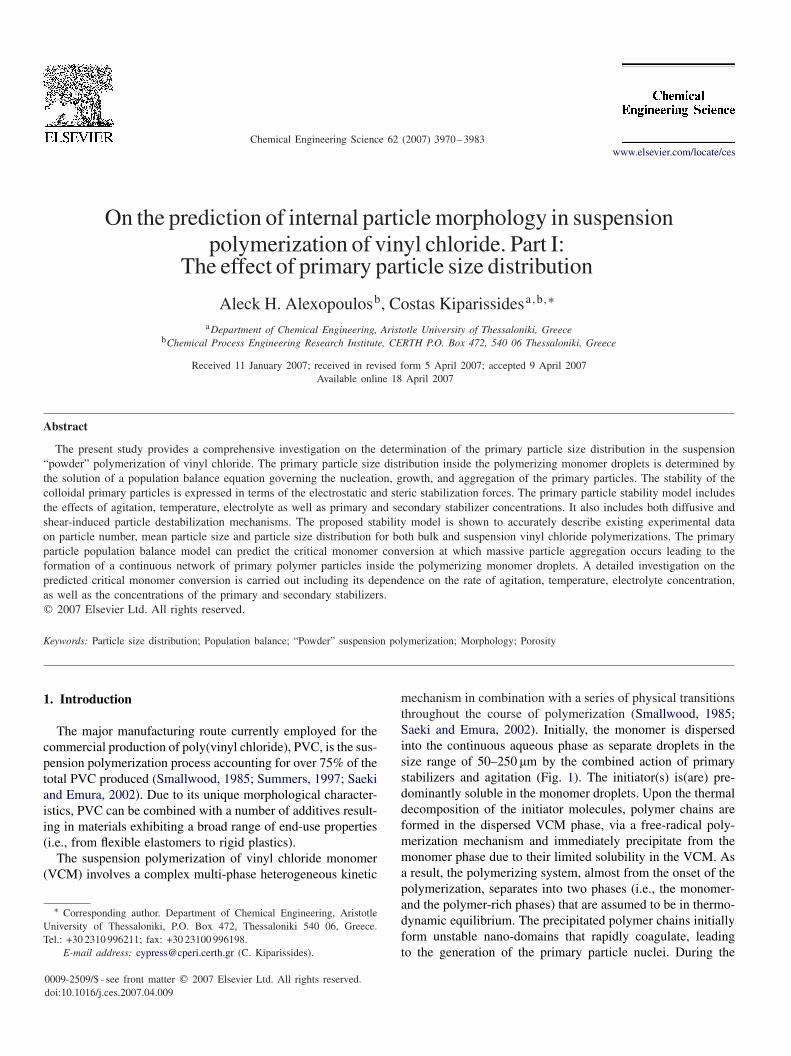
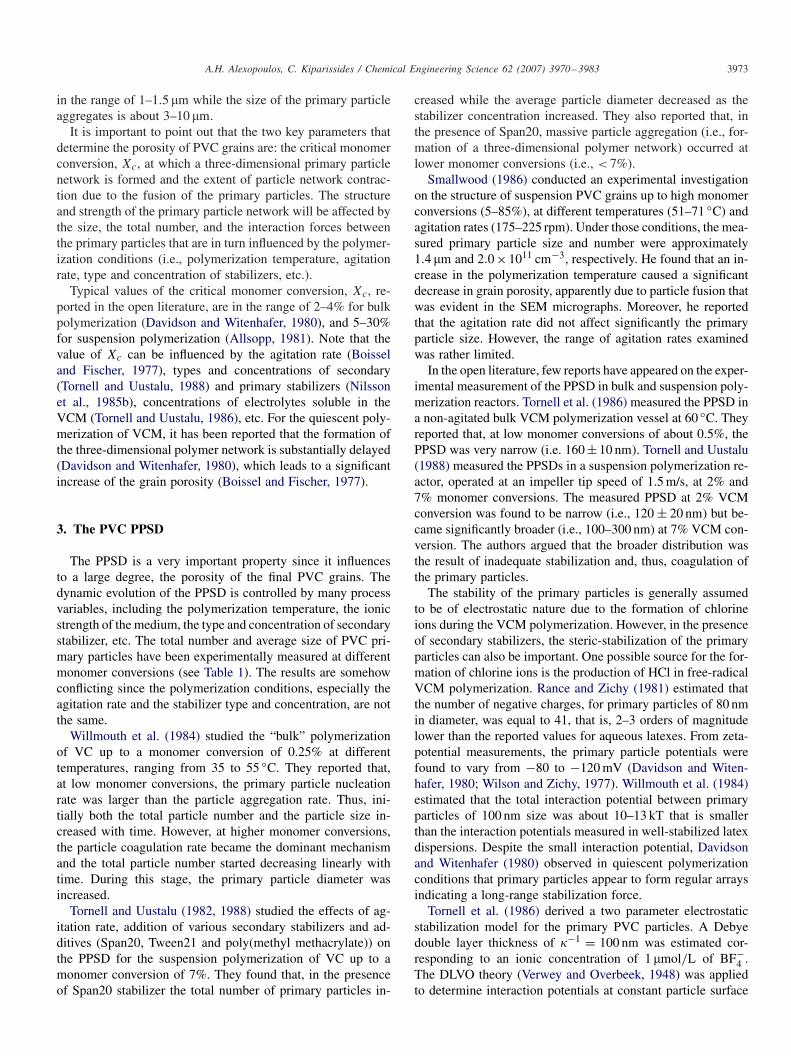
mechanism in combination with a series of physical transitionsthroughout the course of polymerization (Smallwood, 1985;Saeki and Emura, 2002). Initially, the monomer is dispersedinto the continuous aqueous phase as separate droplets in thesize range of 50–250 �m by the combined action of primarystabilizers and agitation (Fig. 1). The initiator(s) is(are) pre-dominantly soluble in the monomer droplets. Upon the thermaldecomposition of the initiator molecules, polymer chains areformed in the dispersed VCM phase, via a free-radical poly-merization mechanism and immediately precipitate from themonomer phase due to their limited solubility in the VCM. Asa result, the polymerizing system, almost from the onset of thepolymerization, separates into two phases (i.e., the monomer-and the polymer-rich phases) that are assumed to be in thermo-dynamic equilibrium. The precipitated polymer chains initiallyform unstable nano-domains that rapidly coagulate, leadingto the generation of the primary particle nuclei. During the
A.H. Alexopoulos, C. Kiparissides / Chemical Engineering Science 62 (2007) 3970–3983 3971
Monomer droplets
Macroscale Microscale
Basic particle
Primary particle
Primary stabilizer
Secondary stabilizer
Fig. 1. Macro- and micro-scale representation of reactor, monomer droplets,and primary particles—processes.
course of polymerization, the primary particles increase insize by both coagulation with the continuously nucleatedunstable nano-domains and polymerization of the absorbedmonomer, in the polymer-rich phase. Progressively, the VCMdroplets evolve into PVC grains. It has been shown experi-mentally that the internal morphology of PVC grains consistsof a three-dimensional network of primary particles and theiraggregates.
Compared to other polymer resins, the quality of PVC isprimarily characterized by the morphology of the polymergrains. In general, the morphology of PVC grains, producedby the suspension polymerization process, is determined bythe grain shape (e.g., spherical, irregular, etc.), and grain sizedistribution, the average grain porosity and pore size distribu-tion as well the accessibility of the grain’s internal pores. Itshould be noted that PVC morphology greatly affects its han-dling, processing and application characteristics. Specifically,grain porosity largely influences the removal of unreactedVCM and the plasticizer uptake by the PVC grains duringprocessing.
The initial monomer droplet size distribution, DSD, is an im-portant aspect of the PVC suspension polymerization processas it largely determines the final size distribution of the PVCgrains (Bao and Brooks, 2002). The DSD is a manifestation ofthe dynamic balance between droplet coalescence and break-age processes. These are primarily controlled by the dissipationof turbulent kinetic energy in the system, the type and concen-tration of stabilizers, affecting the interfacial tension forces atthe monomer–water interface, the viscosities and densities ofthe continuous and dispersed phases, etc. During the course ofpolymerization, the variation of the physical properties of thedispersion system (e.g., viscosity, interfacial tension, formationof the grain “skin”, etc.) can largely influence the droplet/grainsize distribution developments in the VCM suspension poly-merization process (Nilsson et al., 1983; Kotoulas andKiparissides, 2006; Maggioris et al., 2000).
In general, the PVC grains consist of a number of sub-grains (agglomerated droplets), depending on the quality ofagitation and the stability of the VCM droplets (Tregan andBonnemayre, 1970). Thus, under low agitation conditions and
moderate values of the monomer–water interfacial tension,unicellular grains can be produced consisting of finer (i.e.,about 50 �m) and denser (i.e., low porosity) polymer particles.On the other hand, multi-cellular grains, having an averagesize of 100–150 �m, can be produced under more intense ag-itation conditions and lower values of interfacial tension. Thegrain porosity can vary significantly between uni- and multi-cellular PVC grains. For multi-cellular grains, in addition tothe intracellular porosity of the unicellular grains, macroporesformed between the agglomerated droplets can give rise to theso-called intercellular porosity.
It has been reported that PVC grains are frequently sur-rounded by an outer pericellular membrane of approximately200–500 nm in thickness (Smallwood, 1986). Initially, a thinpolymer “skin” is formed at the VCM–water interface due tografting of PVC chains onto the absorbed primary stabilizermolecules. Subsequently, primary particles, formed within theVC dispersed monomer droplets, aggregate at the “skin” lead-ing to the formation of a pericellular membrane (Davidson andWitenhafer, 1980) The morphology (i.e., porosity) of the peri-cellular membrane depends on the type and concentration ofthe primary stabilizer and affects the droplet coalescence andbreakage processes as well as the extent of droplet/particle vol-ume contraction caused by the higher density of the polymer(Nilsson et al., 1985a). These effects, however, have not beensufficiently studied nor quantified in the literature. Note that theporosity of the pericellular membrane is directly related to theaccessibility of the internal grain pores and, thus, to the plasti-cizer uptake by the PVC grains. Moreover, when the pericellu-lar membrane pores are closed a pressure difference across themembrane develops during the course of polymerization. Thiscan cause the internal particle network to “collapse” resultingin the formation of “dimpled” particles with concomitant theloss of grain porosity (Allsopp, 1981).
In general, the morphological properties of the PVC grainsare determined by the following process variables: polymer-ization temperature, quality of agitation, type and concentra-tion of the surface active agents (i.e., primary and secondarystabilizers). The relationships between process variables (i.e.,agitation, temperature, stabilizers, etc.) and micro-scale graincharacteristics (i.e., primary particle size distribution (PPSD),porosity, etc.) and macro-scale grain size distribution are notwell-understood since many complex interrelated physical andchemical phenomena are involved (Xie et al., 1991). Becauseof this multi-scale complexity it is not surprising that, in theopen literature, there are no comprehensive quantitative modelsaccounting for the effect of the process variables on the grainporosity.
In the following section, the physical-kinetic mechanismof the suspension PVC polymerization process is described.Subsequently, a comprehensive population balance model isdeveloped to calculate the dynamic evolution of the PPSDin the polymerizing monomer droplets in terms of the pro-cess variables. The numerical solution of the resulting popula-tion balance equation, PBE, is then described. Finally, modelpredictions on the total number of primary particles, the av-erage primary particle diameter, the PPSD and the critical
3972 A.H. Alexopoulos, C. Kiparissides / Chemical Engineering Science 62 (2007) 3970–3983
monomer conversion, at which the primary particles form athree-dimensional polymer network inside the polymerizingmonomer droplets, are compared with available experimentalmeasurements.
2. The physical-kinetic mechanism of the suspension PVCprocess
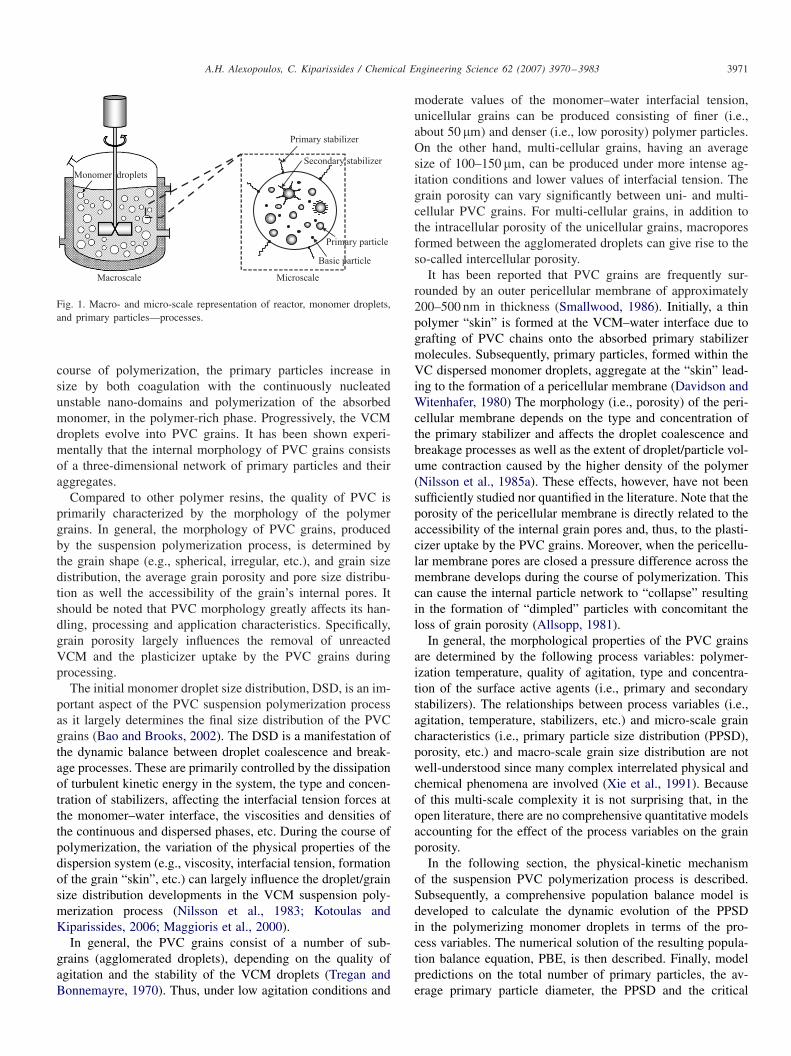
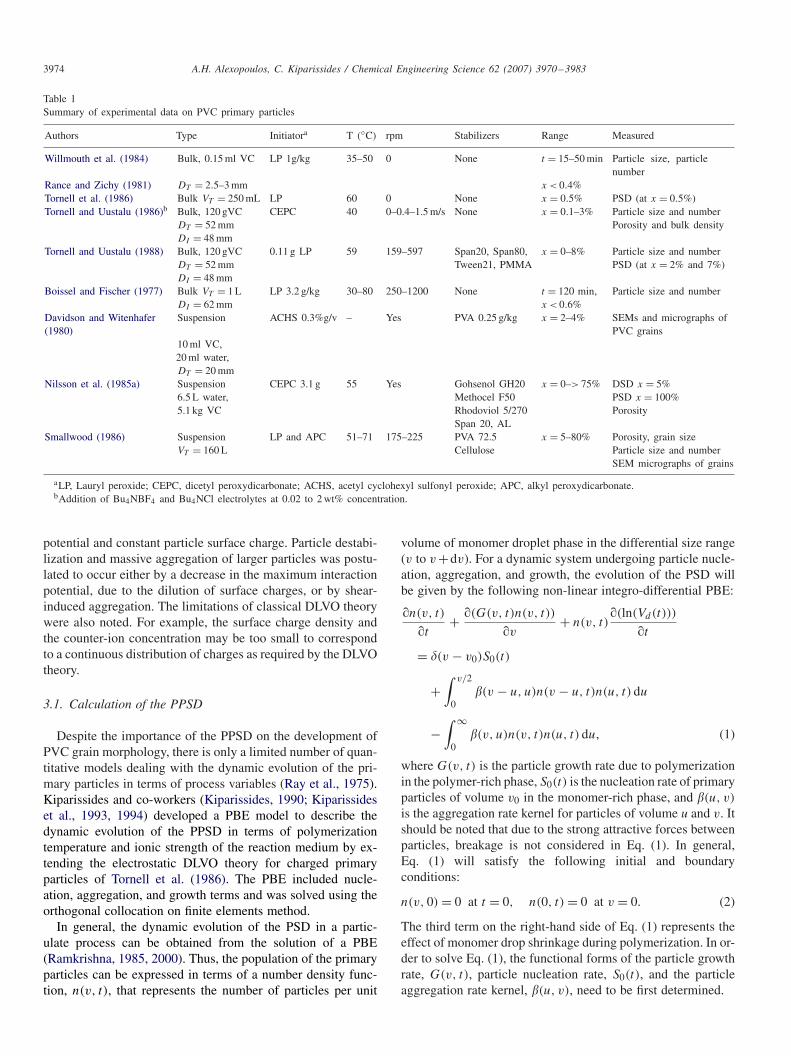
Previously published papers (Allsopp, 1981; Xie et al.,1991; Kiparissides et al., 1997; Yuan et al., 1991; Rance,1985; Geil, 1977; Ravey, 1977) on the morphology of PVCgrains have postulated the following five-stage kinetic-physicalmechanism, shown pictorially in Fig. 2, to describe the nucle-ation, stabilization, growth, and aggregation of PVC primaryparticles.
During the first polymerization stage (VCM conversionrange: 0 < X < 0.01%), primary radicals, formed via ther-mal decomposition of initiator molecules, rapidly react withmonomer to produce polymer chains that almost instanta-neously become insoluble in the monomer phase. In fact, thepolymer chains precipitate out of the continuous VCM phasewhen they reach a specific chain length (i.e., of about 10–30monomer units) (Cotman et al., 1967; Rance and Zichy, 1981).It has been postulated that approximately 10–50 polymer chainsare subsequently combined together to form nano-domainsalso called basic particles. The nano-domains are swollen withmonomer and have an initial diameter of about 10–20 nm.
In stage two (VCM conversion range: 0.01 < X < 1%), theformation of PVC domains, also called primary particle nuclei,takes place. Because of the limited stability of the domains,they rapidly undergo coagulation leading to the nucleation ofthe primary particle nuclei. The initial size of these primaryparticle nuclei has been found to be in the range of 80–100 nm.Typically, a primary particle nucleus may consist of about 1000nano-domains. Contrary to nano-domains, the primary particlenuclei carry sufficient negative electrostatic charges to formstable colloidal dispersions in the monomer phase. During thisstage, the primary particles grow in size mostly by coagulationwith smaller nano-domains rather than by polymerization ofthe absorbed monomer.
In stage three (VCM conversion range: 1 < X < 20%),growth and aggregation of the primary particles occur. Primaryparticle nuclei are continuously produced up to a monomerconversion of about 5–10%. During this stage, the primaryparticles grow in size by the capture of unstable nano-domainsand the polymerization of the absorbed monomer. The lattergrowth process is progressively becoming the dominant mech-anism as the volume of the polymer phase increases (Cotmanet al., 1967). The size and the number of the primary particlesdepend on the growth rate and the electrostatic-steric stabilityof the primary particles. The latter decreases as the monomerconversion increases. At monomer conversions of about7–20%, massive aggregation of the primary particles results inthe formation of a continuous three-dimensional primary par-ticle network within the VCM droplet. The three-dimensionalprimary particle network structure, its initial porosity, and its
Coiled Macroradicals
Nano-Domains
(x < 1 %) 10 - 20
Domains
80 - 200 nm
Primary Particles
0.2 - 1.5 µm
Primary Particle
Agglomerates
(x = 4 - 10 %)
1-10 µm
Growth and Fusion
of Agglomerates
x = 20 - 90 %
Aggregation
~10-50
Aggregation
~1000
Secondary
Aggregation
~10-15
Aggregation
and Growth
STAGE 1
STAGE 2
STAGE 3
STAGE 4
STAGE 5
Fig. 2. Evolution of primary PVC particles.
mechanical strength will depend on the size and the numberof primary particles, the electrostatic and steric forces betweenthe primary particles, the polymerization temperature and thepolymer viscoelastic properties.
In stage four (VCM conversion range: 20 < X < 70–75%),the growth and fusion of the primary particles continues. Thatis, the primary particles increase in size due to polymerizationand also undergo substantial fusion. Both processes result ina continuous decrease in particle porosity. At low monomerconversions (i.e., in the so-called “sticky” stage, X < 30%),the polymerizing droplets can undergo limited coalescenceleading to the formation of multi-cellular grains. At highermonomer conversions, the droplets/particles become less“sticky” and the coalescence rate decreases significantly. Onthe other hand, inside the polymerizing monomer droplets, theprimary particles continue to grow until the disappearance ofthe separate monomer phase (i.e., at about 70–75% monomerconversion).
Finally, in stage five (VCM conversion range: 70–75 < X <
90–95%), polymerization continues only in the monomer-swollen polymer phase, however, at a lower rate, until themonomer has been depleted. During this stage, the vapor pres-sure in the reactor continuously decreases due to the transferof VCM from the overhead gas phase to the monomer starvedpolymer phase. Note that the polymerization is usually termi-nated at a monomer conversion of about 95–98%. At the finalVC conversion, the size of the individual primary particles is
A.H. Alexopoulos, C. Kiparissides / Chemical Engineering Science 62 (2007) 3970–3983 3973
in the range of 1–1.5 �m while the size of the primary particleaggregates is about 3–10 �m.
It is important to point out that the two key parameters thatdetermine the porosity of PVC grains are: the critical monomerconversion, Xc, at which a three-dimensional primary particlenetwork is formed and the extent of particle network contrac-tion due to the fusion of the primary particles. The structureand strength of the primary particle network will be affected bythe size, the total number, and the interaction forces betweenthe primary particles that are in turn influenced by the polymer-ization conditions (i.e., polymerization temperature, agitationrate, type and concentration of stabilizers, etc.).
Typical values of the critical monomer conversion, Xc, re-ported in the open literature, are in the range of 2–4% for bulkpolymerization (Davidson and Witenhafer, 1980), and 5–30%for suspension polymerization (Allsopp, 1981). Note that thevalue of Xc can be influenced by the agitation rate (Boisseland Fischer, 1977), types and concentrations of secondary(Tornell and Uustalu, 1988) and primary stabilizers (Nilssonet al., 1985b), concentrations of electrolytes soluble in theVCM (Tornell and Uustalu, 1986), etc. For the quiescent poly-merization of VCM, it has been reported that the formation ofthe three-dimensional polymer network is substantially delayed(Davidson and Witenhafer, 1980), which leads to a significantincrease of the grain porosity (Boissel and Fischer, 1977).
3. The PVC PPSD
The PPSD is a very important property since it influencesto a large degree, the porosity of the final PVC grains. Thedynamic evolution of the PPSD is controlled by many processvariables, including the polymerization temperature, the ionicstrength of the medium, the type and concentration of secondarystabilizer, etc. The total number and average size of PVC pri-mary particles have been experimentally measured at differentmonomer conversions (see Table 1). The results are somehowconflicting since the polymerization conditions, especially theagitation rate and the stabilizer type and concentration, are notthe same.
Willmouth et al. (1984) studied the “bulk” polymerizationof VC up to a monomer conversion of 0.25% at differenttemperatures, ranging from 35 to 55 ◦C. They reported that,at low monomer conversions, the primary particle nucleationrate was larger than the particle aggregation rate. Thus, ini-tially both the total particle number and the particle size in-creased with time. However, at higher monomer conversions,the particle coagulation rate became the dominant mechanismand the total particle number started decreasing linearly withtime. During this stage, the primary particle diameter wasincreased.
Tornell and Uustalu (1982, 1988) studied the effects of ag-itation rate, addition of various secondary stabilizers and ad-ditives (Span20, Tween21 and poly(methyl methacrylate)) onthe PPSD for the suspension polymerization of VC up to amonomer conversion of 7%. They found that, in the presenceof Span20 stabilizer the total number of primary particles in-
creased while the average particle diameter decreased as thestabilizer concentration increased. They also reported that, inthe presence of Span20, massive particle aggregation (i.e., for-mation of a three-dimensional polymer network) occurred atlower monomer conversions (i.e., < 7%).
Smallwood (1986) conducted an experimental investigationon the structure of suspension PVC grains up to high monomerconversions (5–85%), at different temperatures (51–71 ◦C) andagitation rates (175–225 rpm). Under those conditions, the mea-sured primary particle size and number were approximately1.4 �m and 2.0 × 1011 cm−3, respectively. He found that an in-crease in the polymerization temperature caused a significantdecrease in grain porosity, apparently due to particle fusion thatwas evident in the SEM micrographs. Moreover, he reportedthat the agitation rate did not affect significantly the primaryparticle size. However, the range of agitation rates examinedwas rather limited.
In the open literature, few reports have appeared on the exper-imental measurement of the PPSD in bulk and suspension poly-merization reactors. Tornell et al. (1986) measured the PPSD ina non-agitated bulk VCM polymerization vessel at 60 ◦C. Theyreported that, at low monomer conversions of about 0.5%, thePPSD was very narrow (i.e. 160 ± 10 nm). Tornell and Uustalu(1988) measured the PPSDs in a suspension polymerization re-actor, operated at an impeller tip speed of 1.5 m/s, at 2% and7% monomer conversions. The measured PPSD at 2% VCMconversion was found to be narrow (i.e., 120 ± 20 nm) but be-came significantly broader (i.e., 100–300 nm) at 7% VCM con-version. The authors argued that the broader distribution wasthe result of inadequate stabilization and, thus, coagulation ofthe primary particles.
The stability of the primary particles is generally assumedto be of electrostatic nature due to the formation of chlorineions during the VCM polymerization. However, in the presenceof secondary stabilizers, the steric-stabilization of the primaryparticles can also be important. One possible source for the for-mation of chlorine ions is the production of HCl in free-radicalVCM polymerization. Rance and Zichy (1981) estimated thatthe number of negative charges, for primary particles of 80 nmin diameter, was equal to 41, that is, 2–3 orders of magnitudelower than the reported values for aqueous latexes. From zeta-potential measurements, the primary particle potentials werefound to vary from −80 to −120 mV (Davidson and Witen-hafer, 1980; Wilson and Zichy, 1977). Willmouth et al. (1984)estimated that the total interaction potential between primaryparticles of 100 nm size was about 10–13 kT that is smallerthan the interaction potentials measured in well-stabilized latexdispersions. Despite the small interaction potential, Davidsonand Witenhafer (1980) observed in quiescent polymerizationconditions that primary particles appear to form regular arraysindicating a long-range stabilization force.
Tornell et al. (1986) derived a two parameter electrostaticstabilization model for the primary PVC particles. A Debyedouble layer thickness of �−1 = 100 nm was estimated cor-responding to an ionic concentration of 1 �mol/L of BF−
4 .The DLVO theory (Verwey and Overbeek, 1948) was appliedto determine interaction potentials at constant particle surface
3974 A.H. Alexopoulos, C. Kiparissides / Chemical Engineering Science 62 (2007) 3970–3983
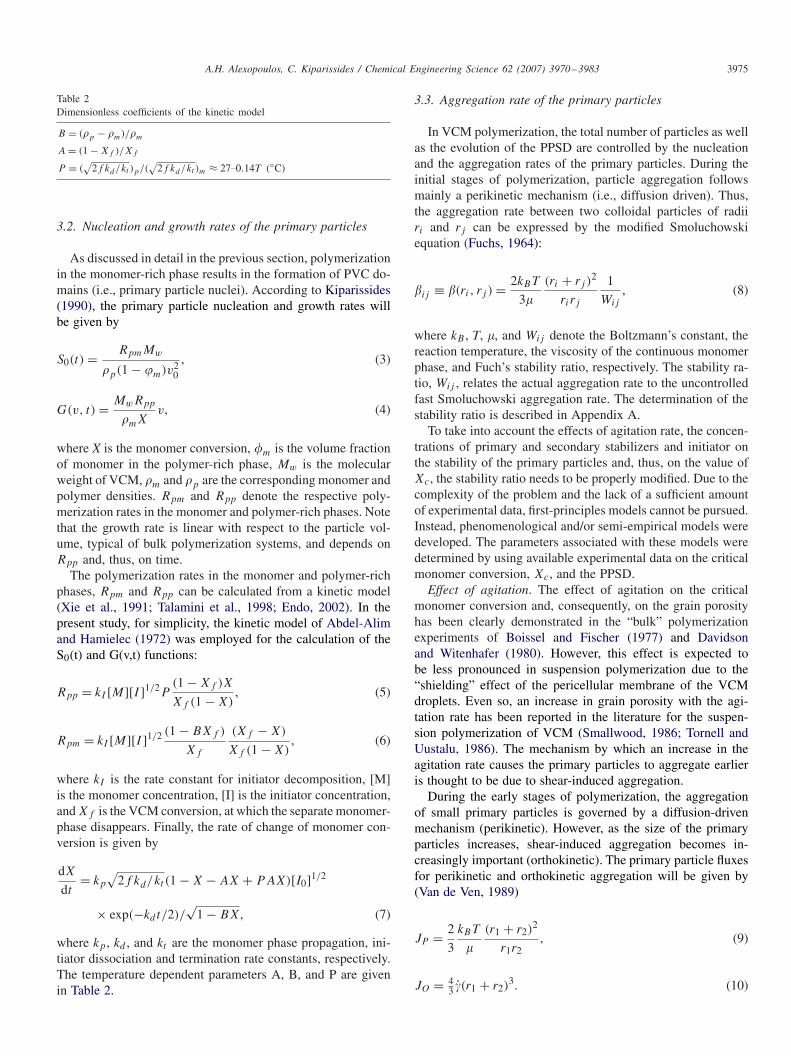
Table 1Summary of experimental data on PVC primary particles
Authors Type Initiatora T (◦C) rpm Stabilizers Range Measured
Willmouth et al. (1984) Bulk, 0.15 ml VC LP 1g/kg 35–50 0 None t = 15–50 min Particle size, particlenumber
Rance and Zichy (1981) DT = 2.5–3 mm x < 0.4%Tornell et al. (1986) Bulk VT = 250 mL LP 60 0 None x = 0.5% PSD (at x = 0.5%)Tornell and Uustalu (1986)b Bulk, 120 gVC CEPC 40 0–0.4–1.5 m/s None x = 0.1–3% Particle size and number
DT = 52 mm Porosity and bulk densityDI = 48 mm
Tornell and Uustalu (1988) Bulk, 120 gVC 0.11 g LP 59 159–597 Span20, Span80, x = 0–8% Particle size and numberDT = 52 mm Tween21, PMMA PSD (at x = 2% and 7%)DI = 48 mm
Boissel and Fischer (1977) Bulk VT = 1 L LP 3.2 g/kg 30–80 250–1200 None t = 120 min, Particle size and numberDI = 62 mm x < 0.6%
Davidson and Witenhafer Suspension ACHS 0.3%g/v – Yes PVA 0.25 g/kg x = 2–4% SEMs and micrographs of(1980) PVC grains
10 ml VC,20 ml water,DT = 20 mm
Nilsson et al. (1985a) Suspension CEPC 3.1 g 55 Yes Gohsenol GH20 x = 0–> 75% DSD x = 5%6.5 L water, Methocel F50 PSD x = 100%5.1 kg VC Rhodoviol 5/270 Porosity
Span 20, ALSmallwood (1986) Suspension LP and APC 51–71 175–225 PVA 72.5 x = 5–80% Porosity, grain size
VT = 160 L Cellulose Particle size and numberSEM micrographs of grains
aLP, Lauryl peroxide; CEPC, dicetyl peroxydicarbonate; ACHS, acetyl cyclohexyl sulfonyl peroxide; APC, alkyl peroxydicarbonate.bAddition of Bu4NBF4 and Bu4NCl electrolytes at 0.02 to 2 wt% concentration.
potential and constant particle surface charge. Particle destabi-lization and massive aggregation of larger particles was postu-lated to occur either by a decrease in the maximum interactionpotential, due to the dilution of surface charges, or by shear-induced aggregation. The limitations of classical DLVO theorywere also noted. For example, the surface charge density andthe counter-ion concentration may be too small to correspondto a continuous distribution of charges as required by the DLVOtheory.
3.1. Calculation of the PPSD
Despite the importance of the PPSD on the development ofPVC grain morphology, there is only a limited number of quan-titative models dealing with the dynamic evolution of the pri-mary particles in terms of process variables (Ray et al., 1975).Kiparissides and co-workers (Kiparissides, 1990; Kiparissideset al., 1993, 1994) developed a PBE model to describe thedynamic evolution of the PPSD in terms of polymerizationtemperature and ionic strength of the reaction medium by ex-tending the electrostatic DLVO theory for charged primaryparticles of Tornell et al. (1986). The PBE included nucle-ation, aggregation, and growth terms and was solved using theorthogonal collocation on finite elements method.
In general, the dynamic evolution of the PSD in a partic-ulate process can be obtained from the solution of a PBE(Ramkrishna, 1985, 2000). Thus, the population of the primaryparticles can be expressed in terms of a number density func-tion, n(v, t), that represents the number of particles per unit
volume of monomer droplet phase in the differential size range(v to v +dv). For a dynamic system undergoing particle nucle-ation, aggregation, and growth, the evolution of the PSD willbe given by the following non-linear integro-differential PBE:
�n(v, t)
�t+ �(G(v, t)n(v, t))
�v+ n(v, t)
�(ln(Vd(t)))
�t
= �(v − v0)S0(t)
+∫ v/2
0�(v − u, u)n(v − u, t)n(u, t) du
−∫ ∞
0�(v, u)n(v, t)n(u, t) du, (1)
where G(v, t) is the particle growth rate due to polymerizationin the polymer-rich phase, S0(t) is the nucleation rate of primaryparticles of volume v0 in the monomer-rich phase, and �(u, v)
is the aggregation rate kernel for particles of volume u and v. Itshould be noted that due to the strong attractive forces betweenparticles, breakage is not considered in Eq. (1). In general,Eq. (1) will satisfy the following initial and boundaryconditions:
n(v, 0) = 0 at t = 0, n(0, t) = 0 at v = 0. (2)
The third term on the right-hand side of Eq. (1) represents theeffect of monomer drop shrinkage during polymerization. In or-der to solve Eq. (1), the functional forms of the particle growthrate, G(v, t), particle nucleation rate, S0(t), and the particleaggregation rate kernel, �(u, v), need to be first determined.
A.H. Alexopoulos, C. Kiparissides / Chemical Engineering Science 62 (2007) 3970–3983 3975
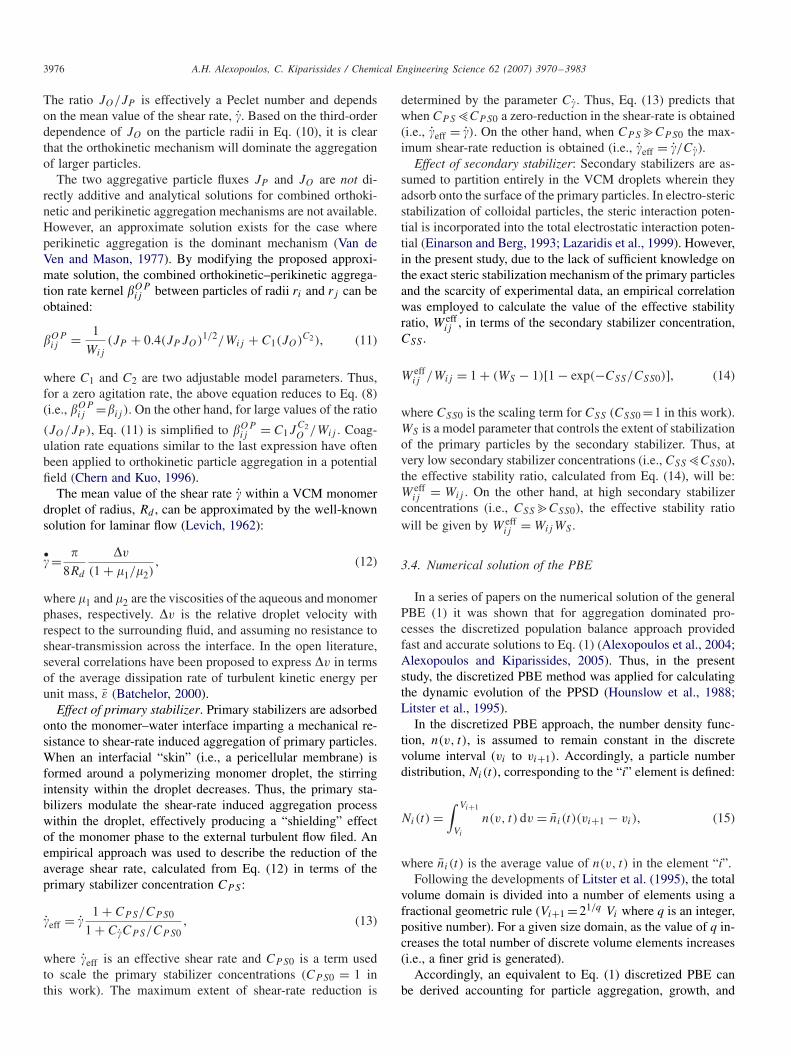
Table 2Dimensionless coefficients of the kinetic model
B = (�p − �m)/�m
A = (1 − Xf )/Xf
P = (√
2f kd/kt )p/(√
2f kd/kt )m ≈ 27.0.14T (◦C)
3.2. Nucleation and growth rates of the primary particles
As discussed in detail in the previous section, polymerizationin the monomer-rich phase results in the formation of PVC do-mains (i.e., primary particle nuclei). According to Kiparissides(1990), the primary particle nucleation and growth rates willbe given by
S0(t) = RpmMw
�p(1 − �m)v20
, (3)
G(v, t) = MwRpp
�mXv, (4)
where X is the monomer conversion, �m is the volume fractionof monomer in the polymer-rich phase, Mw is the molecularweight of VCM, �m and �p are the corresponding monomer andpolymer densities. Rpm and Rpp denote the respective poly-merization rates in the monomer and polymer-rich phases. Notethat the growth rate is linear with respect to the particle vol-ume, typical of bulk polymerization systems, and depends onRpp and, thus, on time.
The polymerization rates in the monomer and polymer-richphases, Rpm and Rpp can be calculated from a kinetic model(Xie et al., 1991; Talamini et al., 1998; Endo, 2002). In thepresent study, for simplicity, the kinetic model of Abdel-Alimand Hamielec (1972) was employed for the calculation of theS0(t) and G(v,t) functions:
Rpp = kI [M][I ]1/2P(1 − Xf )X
Xf (1 − X), (5)
Rpm = kI [M][I ]1/2 (1 − BXf )
Xf
(Xf − X)
Xf (1 − X), (6)
where kI is the rate constant for initiator decomposition, [M]is the monomer concentration, [I] is the initiator concentration,and Xf is the VCM conversion, at which the separate monomer-phase disappears. Finally, the rate of change of monomer con-version is given by
dX
dt= kp
√2f kd/kt (1 − X − AX + PAX)[I0]1/2
× exp(−kd t/2)/√
1 − BX, (7)
where kp, kd , and kt are the monomer phase propagation, ini-tiator dissociation and termination rate constants, respectively.The temperature dependent parameters A, B, and P are givenin Table 2.
3.3. Aggregation rate of the primary particles
In VCM polymerization, the total number of particles as wellas the evolution of the PPSD are controlled by the nucleationand the aggregation rates of the primary particles. During theinitial stages of polymerization, particle aggregation followsmainly a perikinetic mechanism (i.e., diffusion driven). Thus,the aggregation rate between two colloidal particles of radiiri and rj can be expressed by the modified Smoluchowskiequation (Fuchs, 1964):
�ij ≡ �(ri, rj ) = 2kBT
3�
(ri + rj )2
rirj
1
Wij
, (8)
where kB , T, �, and Wij denote the Boltzmann’s constant, thereaction temperature, the viscosity of the continuous monomerphase, and Fuch’s stability ratio, respectively. The stability ra-tio, Wij , relates the actual aggregation rate to the uncontrolledfast Smoluchowski aggregation rate. The determination of thestability ratio is described in Appendix A.
To take into account the effects of agitation rate, the concen-trations of primary and secondary stabilizers and initiator onthe stability of the primary particles and, thus, on the value ofXc, the stability ratio needs to be properly modified. Due to thecomplexity of the problem and the lack of a sufficient amountof experimental data, first-principles models cannot be pursued.Instead, phenomenological and/or semi-empirical models weredeveloped. The parameters associated with these models weredetermined by using available experimental data on the criticalmonomer conversion, Xc, and the PPSD.
Effect of agitation. The effect of agitation on the criticalmonomer conversion and, consequently, on the grain porosityhas been clearly demonstrated in the “bulk” polymerizationexperiments of Boissel and Fischer (1977) and Davidsonand Witenhafer (1980). However, this effect is expected tobe less pronounced in suspension polymerization due to the“shielding” effect of the pericellular membrane of the VCMdroplets. Even so, an increase in grain porosity with the agi-tation rate has been reported in the literature for the suspen-sion polymerization of VCM (Smallwood, 1986; Tornell andUustalu, 1986). The mechanism by which an increase in theagitation rate causes the primary particles to aggregate earlieris thought to be due to shear-induced aggregation.
During the early stages of polymerization, the aggregationof small primary particles is governed by a diffusion-drivenmechanism (perikinetic). However, as the size of the primaryparticles increases, shear-induced aggregation becomes in-creasingly important (orthokinetic). The primary particle fluxesfor perikinetic and orthokinetic aggregation will be given by(Van de Ven, 1989)
JP = 2
3
kBT
�
(r1 + r2)2
r1r2, (9)
JO = 43 (r1 + r2)
3. (10)
3976 A.H. Alexopoulos, C. Kiparissides / Chemical Engineering Science 62 (2007) 3970–3983
The ratio JO/JP is effectively a Peclet number and dependson the mean value of the shear rate, . Based on the third-orderdependence of JO on the particle radii in Eq. (10), it is clearthat the orthokinetic mechanism will dominate the aggregationof larger particles.
The two aggregative particle fluxes JP and JO are not di-rectly additive and analytical solutions for combined orthoki-netic and perikinetic aggregation mechanisms are not available.However, an approximate solution exists for the case whereperikinetic aggregation is the dominant mechanism (Van deVen and Mason, 1977). By modifying the proposed approxi-mate solution, the combined orthokinetic–perikinetic aggrega-tion rate kernel �OP
ij between particles of radii ri and rj can beobtained:
�OPij = 1
Wij
(JP + 0.4(JP JO)1/2/Wij + C1(JO)C2), (11)
where C1 and C2 are two adjustable model parameters. Thus,for a zero agitation rate, the above equation reduces to Eq. (8)(i.e., �OP
ij =�ij ). On the other hand, for large values of the ratio
(JO/JP ), Eq. (11) is simplified to �OPij = C1J
C2O /Wij . Coag-
ulation rate equations similar to the last expression have oftenbeen applied to orthokinetic particle aggregation in a potentialfield (Chern and Kuo, 1996).
The mean value of the shear rate within a VCM monomerdroplet of radius, Rd , can be approximated by the well-knownsolution for laminar flow (Levich, 1962):
• =
8Rd
�v
(1 + �1/�2), (12)
where �1 and �2 are the viscosities of the aqueous and monomerphases, respectively. �v is the relative droplet velocity withrespect to the surrounding fluid, and assuming no resistance toshear-transmission across the interface. In the open literature,several correlations have been proposed to express �v in termsof the average dissipation rate of turbulent kinetic energy perunit mass, ε (Batchelor, 2000).
Effect of primary stabilizer. Primary stabilizers are adsorbedonto the monomer–water interface imparting a mechanical re-sistance to shear-rate induced aggregation of primary particles.When an interfacial “skin” (i.e., a pericellular membrane) isformed around a polymerizing monomer droplet, the stirringintensity within the droplet decreases. Thus, the primary sta-bilizers modulate the shear-rate induced aggregation processwithin the droplet, effectively producing a “shielding” effectof the monomer phase to the external turbulent flow filed. Anempirical approach was used to describe the reduction of theaverage shear rate, calculated from Eq. (12) in terms of theprimary stabilizer concentration CPS :
eff = 1 + CPS/CPS0
1 + CCPS/CPS0, (13)
where eff is an effective shear rate and CPS0 is a term usedto scale the primary stabilizer concentrations (CPS0 = 1 inthis work). The maximum extent of shear-rate reduction is
determined by the parameter C. Thus, Eq. (13) predicts thatwhen CPS>CPS0 a zero-reduction in the shear-rate is obtained(i.e., eff = ). On the other hand, when CPS?CPS0 the max-imum shear-rate reduction is obtained (i.e., eff = /C).
Effect of secondary stabilizer: Secondary stabilizers are as-sumed to partition entirely in the VCM droplets wherein theyadsorb onto the surface of the primary particles. In electro-stericstabilization of colloidal particles, the steric interaction poten-tial is incorporated into the total electrostatic interaction poten-tial (Einarson and Berg, 1993; Lazaridis et al., 1999). However,in the present study, due to the lack of sufficient knowledge onthe exact steric stabilization mechanism of the primary particlesand the scarcity of experimental data, an empirical correlationwas employed to calculate the value of the effective stabilityratio, W eff
ij , in terms of the secondary stabilizer concentration,CSS .
W effij /Wij = 1 + (WS − 1)[1 − exp(−CSS/CSS0)], (14)
where CSS0 is the scaling term for CSS (CSS0 =1 in this work).WS is a model parameter that controls the extent of stabilizationof the primary particles by the secondary stabilizer. Thus, atvery low secondary stabilizer concentrations (i.e., CSS>CSS0),the effective stability ratio, calculated from Eq. (14), will be:W eff
ij = Wij . On the other hand, at high secondary stabilizerconcentrations (i.e., CSS?CSS0), the effective stability ratiowill be given by W eff
ij = WijWS .
3.4. Numerical solution of the PBE
In a series of papers on the numerical solution of the generalPBE (1) it was shown that for aggregation dominated pro-cesses the discretized population balance approach providedfast and accurate solutions to Eq. (1) (Alexopoulos et al., 2004;Alexopoulos and Kiparissides, 2005). Thus, in the presentstudy, the discretized PBE method was applied for calculatingthe dynamic evolution of the PPSD (Hounslow et al., 1988;Litster et al., 1995).
In the discretized PBE approach, the number density func-tion, n(v, t), is assumed to remain constant in the discretevolume interval (vi to vi+1). Accordingly, a particle numberdistribution, Ni(t), corresponding to the “i” element is defined:
Ni(t) =∫ Vi+1
Vi
n(v, t) dv = ni (t)(vi+1 − vi), (15)
where ni (t) is the average value of n(v, t) in the element “i”.Following the developments of Litster et al. (1995), the total
volume domain is divided into a number of elements using afractional geometric rule (Vi+1 =21/q Vi where q is an integer,positive number). For a given size domain, as the value of q in-creases the total number of discrete volume elements increases(i.e., a finer grid is generated).
Accordingly, an equivalent to Eq. (1) discretized PBE canbe derived accounting for particle aggregation, growth, and
A.H. Alexopoulos, C. Kiparissides / Chemical Engineering Science 62 (2007) 3970–3983 3977
nucleation mechanisms.
dNi
dt= 2Gv(vi)
3(1 + r)vi
{rNi−1
r2 − 1+ Ni − rNi+1
r2 − 1
}
+q∑
k=2
j2∑j=j1
�i−k,jNi−kNj
2(j−i+1)/q − 1 + 2−(k−1)/q
21/q − 1
+ 1
2�i−q,i−qN2
i−q +q∑
k=2
j2+1∑j=j1+1
�i−k+1,jNi−k+1Nj
× 21/q − 2(j−i)/q − 2−(k−1)/q
21/q − 1
−ne∑
j=i−S(q)+1
�i,jNiNj −i−S(q)∑
j=1i>S(q)
�i,jNiNj
2(j−i)/q
21/q − 1
+i−S(q)−1∑
j=1i>S(q)+1
2(j−i+1)/q
21/q − 1�i−1,jNi−1Nj
+ �(i − 1)S0(t), (16)
where i =1, 2, . . . , ne; j > 0; r =Di+1/Di; j1 = i −S(q −k +2) − k + 1; j2 = i − S(q − k + 1) − k; S(q) = q(q + 1)/2.“ne” is the total number of elements and �i,j = � (Vi, Vj )
is the equivalent discrete kernel for particle aggregation. Foraggregation dominated processes, the recommended values ofq range from 2 to 4 (Hounslow et al., 1988). To improve thenumerical performance of the DPBE, the particle nucleationterms can be distributed over adjacent elements (Alexopoulosand Kiparissides, 2005). From the numerical solution of theDPBE (Eq. (18)), the time evolution of the PPSD as well as thetotal number and volume of the particles can be determined.
4. Results and discussion
Detailed numerical simulations were carried out for a num-ber of different VCM “bulk” and “suspension” polymerizationcases. The key model variables were the polymerization tem-perature, T, the agitation rate, N , the initiator concentration,CI , the Debye length, �−1 (or the electrolyte concentrationCz,i), the primary stabilizer concentration, CPS , and the sec-ondary stabilizer concentration, CSS . In all simulations, the val-ues of the various model parameters were kept constant, that is,p=1.25, D0 =20 nm, C1 =0.01, C2 =1, C=10, and WS =10.The numerical values of ne and q were 40 and 2, respectively,except where otherwise noted.
The various mean particle diameters, Dpq , were calculatedby the following equation:
D=pq
[ne∑i=1
DpNi
/ne∑i=1
DqNi
]1/(p−q)
, (17)
where p and q < p are integers. Thus, for p = 1 and q = 0the mean particle diameter, D10, is obtained. Similarly,
the volumetric mean particles diameter D30 is defined for p=3and q = 0. From the calculated values of the particle numberdistribution, Ni(t), the fractional particle number distribution,fi(t), can be easily calculated:
fi(t) = Ni(t)
/ne∑i=1
Ni(t) . (18)
The numerical accuracy of the DPBE method depends onthe values of the dimensionless aggregation and growth times.For all the cases examined in this work, the dimensionlessaggregation time for the smaller particles was of the order of�a. ∼ 100–500. On the other hand, the dimensionless growthtime, at the critical monomer conversion, was of the order of�g ∼ 0.1–1. Based on the “applicability conditions” describedin Alexopoulos et al. (2004) and the dimensionless aggregationand growth times calculated above, it can be concluded that theaccuracy of the DPBE method was at least 5% in terms of themoments (i.e., zero and first) of the distribution.
The numerical value of the particle charge parameter p isvery important as it controls the particle stability and the onsetof massive particle aggregation (see Appendix A). Thus, byincreasing the value of the parameter p above one, the stabilityof the primary particles, especially of the larger ones, increases.On the other hand, when the numerical value of p decreases, theonset of massive particle aggregation appears at lower monomerconversions (i.e., Xc < 5%). Note that for values of p > 2 theprimary particles are sufficiently stable, i.e., massive particleaggregation does not occur.
Initially, the experimental measurements of Willmouth et al.(1984) on the number and mean diameter of basic particles,carried out in a non-agitated vessel in the absence of stabilizers(Table 1), were used to estimate the unknown model parameters(i.e., p and �−1). The charge parameter, p, and the Debye length,�−1, were estimated to be 1.25 and 150 nm, respectively. In allthe subsequent simulations the value of p was kept constant(p = 1.25) while the value of �−1 changed with temperatureand the electrolyte concentration according to Eq. (A.6).
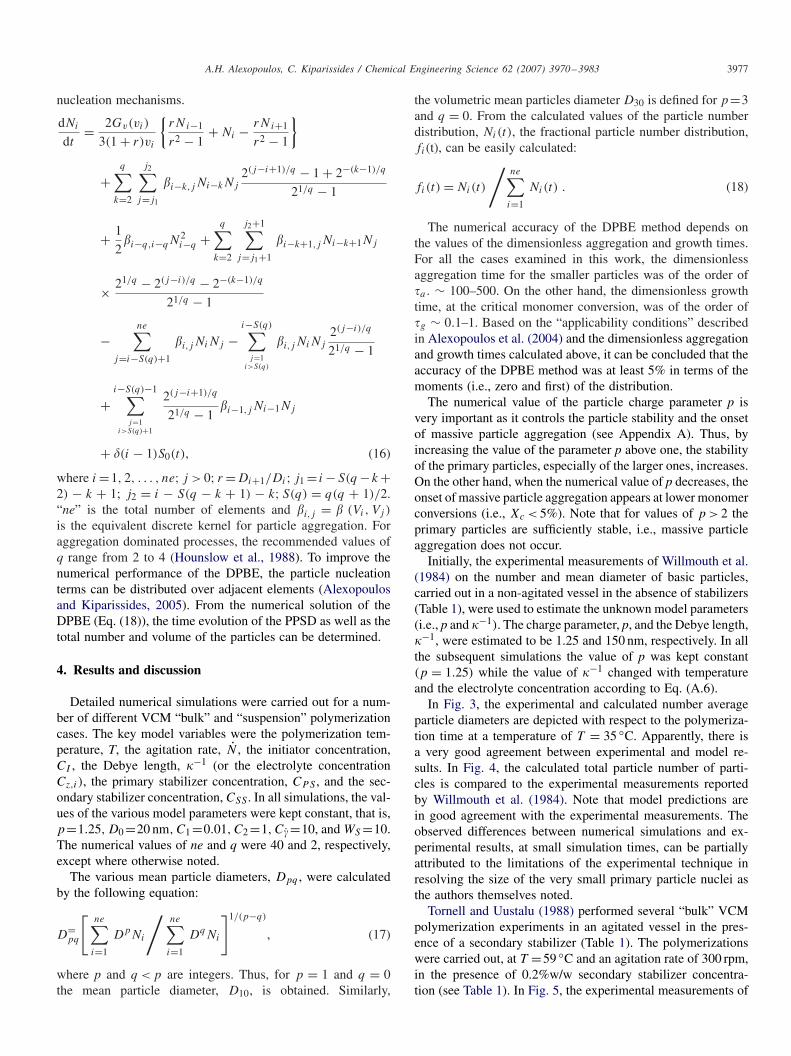
In Fig. 3, the experimental and calculated number averageparticle diameters are depicted with respect to the polymeriza-tion time at a temperature of T = 35 ◦C. Apparently, there isa very good agreement between experimental and model re-sults. In Fig. 4, the calculated total particle number of parti-cles is compared to the experimental measurements reportedby Willmouth et al. (1984). Note that model predictions arein good agreement with the experimental measurements. Theobserved differences between numerical simulations and ex-perimental results, at small simulation times, can be partiallyattributed to the limitations of the experimental technique inresolving the size of the very small primary particle nuclei asthe authors themselves noted.
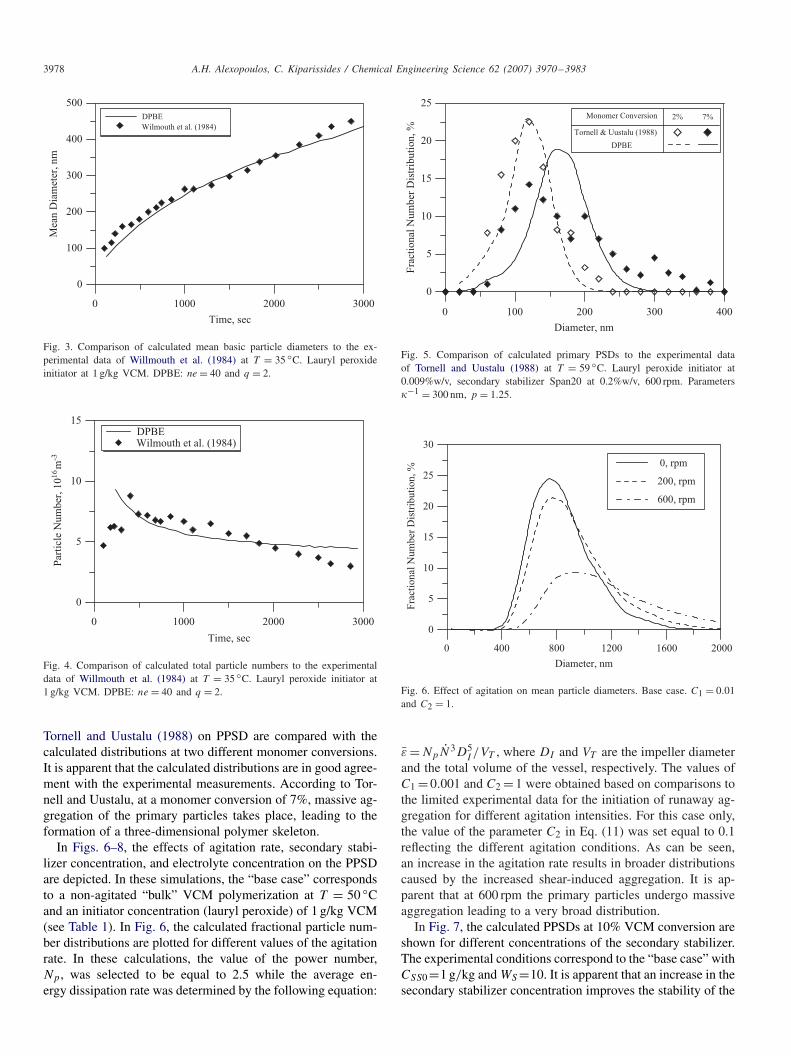
Tornell and Uustalu (1988) performed several “bulk” VCMpolymerization experiments in an agitated vessel in the pres-ence of a secondary stabilizer (Table 1). The polymerizationswere carried out, at T =59 ◦C and an agitation rate of 300 rpm,in the presence of 0.2%w/w secondary stabilizer concentra-tion (see Table 1). In Fig. 5, the experimental measurements of
3978 A.H. Alexopoulos, C. Kiparissides / Chemical Engineering Science 62 (2007) 3970–3983
0 1000 2000 3000
Time, sec
0
100
200
300
400
500
Mea
n D
iam
eter
, n
m
DPBE
Wilmouth et al. (1984)
Fig. 3. Comparison of calculated mean basic particle diameters to the ex-perimental data of Willmouth et al. (1984) at T = 35 ◦C. Lauryl peroxideinitiator at 1 g/kg VCM. DPBE: ne = 40 and q = 2.
0 1000 2000 3000
Time, sec
0
5
10
15
Par
ticl
e N
um
ber
, 1
016m
-3
DPBEWilmouth et al. (1984)
Fig. 4. Comparison of calculated total particle numbers to the experimentaldata of Willmouth et al. (1984) at T = 35 ◦C. Lauryl peroxide initiator at1 g/kg VCM. DPBE: ne = 40 and q = 2.
Tornell and Uustalu (1988) on PPSD are compared with thecalculated distributions at two different monomer conversions.It is apparent that the calculated distributions are in good agree-ment with the experimental measurements. According to Tor-nell and Uustalu, at a monomer conversion of 7%, massive ag-gregation of the primary particles takes place, leading to theformation of a three-dimensional polymer skeleton.
In Figs. 6–8, the effects of agitation rate, secondary stabi-lizer concentration, and electrolyte concentration on the PPSDare depicted. In these simulations, the “base case” correspondsto a non-agitated “bulk” VCM polymerization at T = 50 ◦Cand an initiator concentration (lauryl peroxide) of 1 g/kg VCM(see Table 1). In Fig. 6, the calculated fractional particle num-ber distributions are plotted for different values of the agitationrate. In these calculations, the value of the power number,Np, was selected to be equal to 2.5 while the average en-ergy dissipation rate was determined by the following equation:
0 100 200 300 400
Diameter, nm
0
5
10
15
20
25
Fra
ctio
nal
Num
ber
Dis
trib
uti
on, %
Monomer Conversion
Tornell & Uustalu (1988)
2% 7%
DPBE
Fig. 5. Comparison of calculated primary PSDs to the experimental dataof Tornell and Uustalu (1988) at T = 59 ◦C. Lauryl peroxide initiator at0.009%w/v, secondary stabilizer Span20 at 0.2%w/v, 600 rpm. Parameters�−1 = 300 nm, p = 1.25.
0 400 800 1200 1600 2000
Diameter, nm
0
5
10
15
20
25
30
Fra
ctio
nal
Nu
mb
er D
istr
ibu
tio
n, %
200, rpm
600, rpm
0, rpm
Fig. 6. Effect of agitation on mean particle diameters. Base case. C1 = 0.01and C2 = 1.
ε =NpN3D5I /VT , where DI and VT are the impeller diameter
and the total volume of the vessel, respectively. The values ofC1 = 0.001 and C2 = 1 were obtained based on comparisons tothe limited experimental data for the initiation of runaway ag-gregation for different agitation intensities. For this case only,the value of the parameter C2 in Eq. (11) was set equal to 0.1reflecting the different agitation conditions. As can be seen,an increase in the agitation rate results in broader distributionscaused by the increased shear-induced aggregation. It is ap-parent that at 600 rpm the primary particles undergo massiveaggregation leading to a very broad distribution.
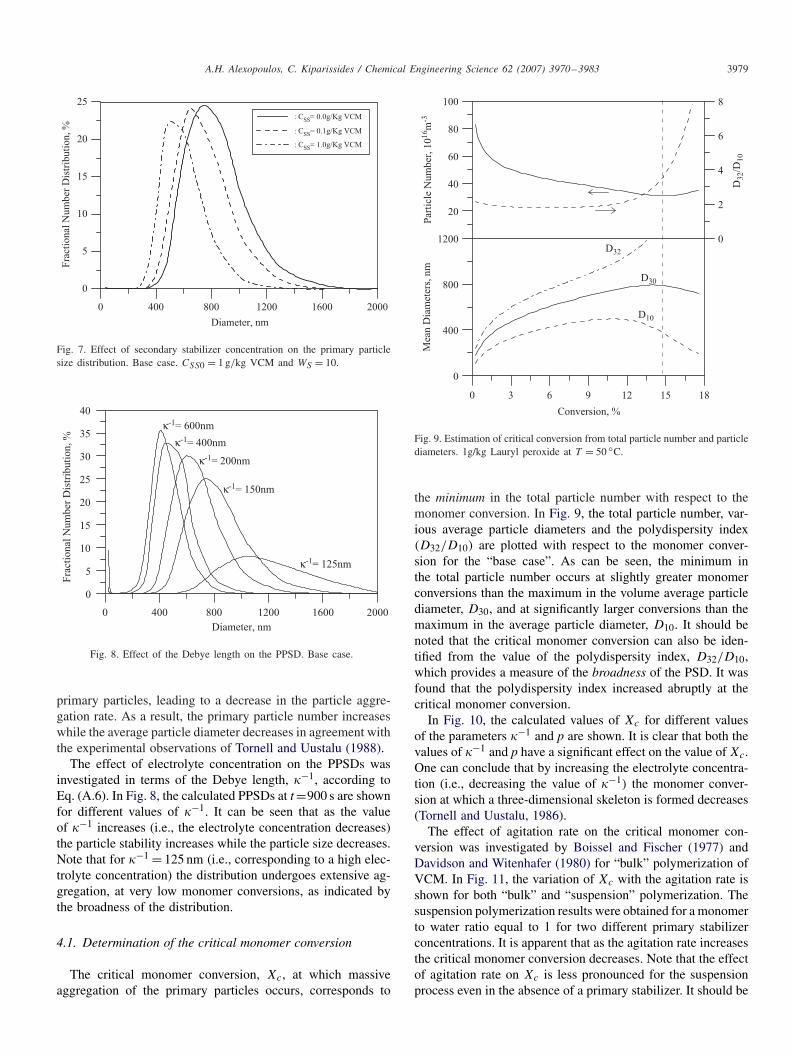
In Fig. 7, the calculated PPSDs at 10% VCM conversion areshown for different concentrations of the secondary stabilizer.The experimental conditions correspond to the “base case” withCSS0=1 g/kg and WS =10. It is apparent that an increase in thesecondary stabilizer concentration improves the stability of the
A.H. Alexopoulos, C. Kiparissides / Chemical Engineering Science 62 (2007) 3970–3983 3979
0 400 800 1200 1600 2000
Diameter, nm
0
5
10
15
20
25
Fra
ctio
nal
Nu
mb
er D
istr
ibu
tio
n, %
: CSS= 0.0g/Kg VCM
: CSS= 0.1g/Kg VCM
: CSS= 1.0g/Kg VCM
Fig. 7. Effect of secondary stabilizer concentration on the primary particlesize distribution. Base case. CSS0 = 1 g/kg VCM and WS = 10.
0 400 800 1200 1600 2000
Diameter, nm
0
5
10
15
20
25
30
35
40
Fra
ctio
nal
Num
ber
Dis
trib
uti
on, %
κ-1= 125nm
κ-1= 150nm
κ-1= 200nm
κ-1= 400nm
κ-1= 600nm
Fig. 8. Effect of the Debye length on the PPSD. Base case.
primary particles, leading to a decrease in the particle aggre-gation rate. As a result, the primary particle number increaseswhile the average particle diameter decreases in agreement withthe experimental observations of Tornell and Uustalu (1988).
The effect of electrolyte concentration on the PPSDs wasinvestigated in terms of the Debye length, �−1, according toEq. (A.6). In Fig. 8, the calculated PPSDs at t=900 s are shownfor different values of �−1. It can be seen that as the valueof �−1 increases (i.e., the electrolyte concentration decreases)the particle stability increases while the particle size decreases.Note that for �−1 = 125 nm (i.e., corresponding to a high elec-trolyte concentration) the distribution undergoes extensive ag-gregation, at very low monomer conversions, as indicated bythe broadness of the distribution.
4.1. Determination of the critical monomer conversion
The critical monomer conversion, Xc, at which massiveaggregation of the primary particles occurs, corresponds to
0 3 6 9 12 15 18
Conversion, %
0
400
800
1200
Mea
n D
iam
eter
s, n
m
20
40
60
80
100
Par
ticl
e N
um
ber
, 10
16m
-3
0
2
4
6
8
D32/D
10
D30
D10
D32
Fig. 9. Estimation of critical conversion from total particle number and particlediameters. 1g/kg Lauryl peroxide at T = 50 ◦C.
the minimum in the total particle number with respect to themonomer conversion. In Fig. 9, the total particle number, var-ious average particle diameters and the polydispersity index(D32/D10) are plotted with respect to the monomer conver-sion for the “base case”. As can be seen, the minimum inthe total particle number occurs at slightly greater monomerconversions than the maximum in the volume average particlediameter, D30, and at significantly larger conversions than themaximum in the average particle diameter, D10. It should benoted that the critical monomer conversion can also be iden-tified from the value of the polydispersity index, D32/D10,which provides a measure of the broadness of the PSD. It wasfound that the polydispersity index increased abruptly at thecritical monomer conversion.
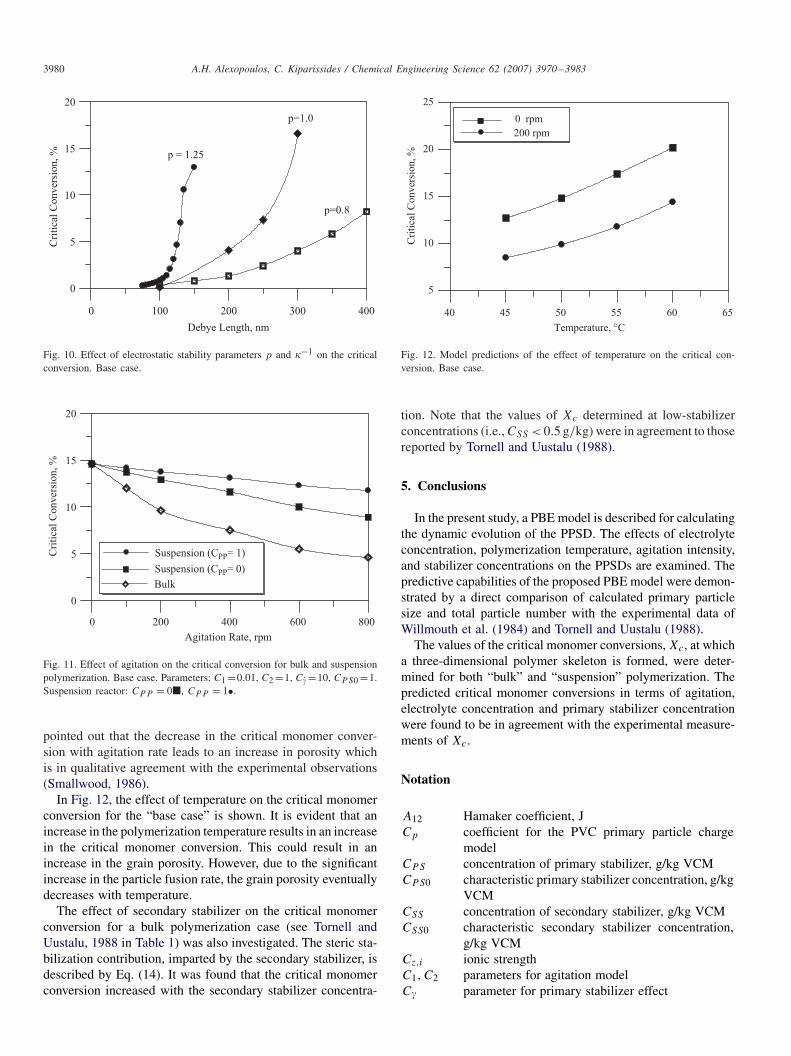
In Fig. 10, the calculated values of Xc for different valuesof the parameters �−1 and p are shown. It is clear that both thevalues of �−1 and p have a significant effect on the value of Xc.One can conclude that by increasing the electrolyte concentra-tion (i.e., decreasing the value of �−1) the monomer conver-sion at which a three-dimensional skeleton is formed decreases(Tornell and Uustalu, 1986).
The effect of agitation rate on the critical monomer con-version was investigated by Boissel and Fischer (1977) andDavidson and Witenhafer (1980) for “bulk” polymerization ofVCM. In Fig. 11, the variation of Xc with the agitation rate isshown for both “bulk” and “suspension” polymerization. Thesuspension polymerization results were obtained for a monomerto water ratio equal to 1 for two different primary stabilizerconcentrations. It is apparent that as the agitation rate increasesthe critical monomer conversion decreases. Note that the effectof agitation rate on Xc is less pronounced for the suspensionprocess even in the absence of a primary stabilizer. It should be
3980 A.H. Alexopoulos, C. Kiparissides / Chemical Engineering Science 62 (2007) 3970–3983
0 100 200 300 400
Debye Length, nm
0
5
10
15
20
Cri
tica
l C
onver
sion,
% p = 1.25
p=1.0
p=0.8
Fig. 10. Effect of electrostatic stability parameters p and �−1 on the criticalconversion. Base case.
0 200 400 600 800
Agitation Rate, rpm
0
5
10
15
20
Cri
tica
l C
on
ver
sio
n, %
Bulk
Suspension (CPP= 1)
Suspension (CPP= 0)
Fig. 11. Effect of agitation on the critical conversion for bulk and suspensionpolymerization. Base case. Parameters: C1 =0.01, C2 =1, C =10, CPS0 =1.Suspension reactor: CPP = 0�, CPP = 1•.
pointed out that the decrease in the critical monomer conver-sion with agitation rate leads to an increase in porosity whichis in qualitative agreement with the experimental observations(Smallwood, 1986).
In Fig. 12, the effect of temperature on the critical monomerconversion for the “base case” is shown. It is evident that anincrease in the polymerization temperature results in an increasein the critical monomer conversion. This could result in anincrease in the grain porosity. However, due to the significantincrease in the particle fusion rate, the grain porosity eventuallydecreases with temperature.
The effect of secondary stabilizer on the critical monomerconversion for a bulk polymerization case (see Tornell andUustalu, 1988 in Table 1) was also investigated. The steric sta-bilization contribution, imparted by the secondary stabilizer, isdescribed by Eq. (14). It was found that the critical monomerconversion increased with the secondary stabilizer concentra-
40 45 50 55 60 65
Temperature, °C
5
10
15
20
25
Cri
tica
l C
on
ver
sio
n,
%
0 rpm
200 rpm
Fig. 12. Model predictions of the effect of temperature on the critical con-version. Base case.
tion. Note that the values of Xc determined at low-stabilizerconcentrations (i.e., CSS < 0.5 g/kg) were in agreement to thosereported by Tornell and Uustalu (1988).
5. Conclusions
In the present study, a PBE model is described for calculatingthe dynamic evolution of the PPSD. The effects of electrolyteconcentration, polymerization temperature, agitation intensity,and stabilizer concentrations on the PPSDs are examined. Thepredictive capabilities of the proposed PBE model were demon-strated by a direct comparison of calculated primary particlesize and total particle number with the experimental data ofWillmouth et al. (1984) and Tornell and Uustalu (1988).
The values of the critical monomer conversions, Xc, at whicha three-dimensional polymer skeleton is formed, were deter-mined for both “bulk” and “suspension” polymerization. Thepredicted critical monomer conversions in terms of agitation,electrolyte concentration and primary stabilizer concentrationwere found to be in agreement with the experimental measure-ments of Xc.
Notation
A12 Hamaker coefficient, JCp coefficient for the PVC primary particle charge
modelCPS concentration of primary stabilizer, g/kg VCMCPS0 characteristic primary stabilizer concentration, g/kg
VCMCSS concentration of secondary stabilizer, g/kg VCMCSS0 characteristic secondary stabilizer concentration,
g/kg VCMCz,i ionic strengthC1, C2 parameters for agitation modelC parameter for primary stabilizer effect
A.H. Alexopoulos, C. Kiparissides / Chemical Engineering Science 62 (2007) 3970–3983 3981
Dpq mean diameter based on p and q moments, mDI impeller diameter, mDT mixing tank diameter, mD0 basic particle (or nano-domain) diameter, me basic electron charge, Cbfi number frequency of primary particlesh particle-to-particle surface distance, mHT mixing tank height, mG growth rate in volume-scale, m3/sJO orthokinetic aggregation kernel, m3/sJP perikinetic aggregation kernel, m3/skB Boltzmann constant, J/KMw molecular weight, g/moln number density function, m−6
ni average value of the number density function inelement i, m−6
ne number of elementsN agitation rate, s−1
Ntot total number of particles,m−3
NA Avogadro number, mol−1
Ni particle number density in element i, m−3
NP impeller power numberp coefficient for PVC primary particle charge modelq geometric discretization parameterQi electric charge of particle i, Cbri, rj radius of particle i, mrij mean radius of particles i and j, mRd radius of VCM droplet, mRpm polymerization rate in the monomer phase, mol/
s/m3
Rpp polymerization rate in the polymer phase, mol/s/m3
S0 nucleation rate, m−3/st time, sT Temperature, ◦C and Ku volume, m3
v volume, m3
v0 volume of PVC basic particles, m3
V A attractive interaction potential, JV R repulsive interaction potential, JV T total interaction potential, JVd dispersion volume (polymer in monomer), m3
VT tank volume, m3
V Ri repulsive interaction potential in region i, J
V Rij smoothed interaction potential between regions i
and j, JWij stability ratio between particles i and jW eff
ij Effective stability ratioWs parameter for secondarystabilizer effectX conversionXc critical conversion for particle network formationXf critical conversion for monomer depletionzi ion valence number
Greek letters
� aggregation rate kernel, m3/s
�ij value of aggregation rate kernel between particlesi and j , m3/s
i intermediate quantity in electrorepulsion model Shear rate, s−1
eff effective shear rate within droplet, s−1
�v velocity difference between VCM droplet and sur-rounding fluid, m/s
ε average energy dissipation rate, m2/s3
ε dielectric relaxation, Cb/m/Vε0 dielectric relaxation of vacuum, Cb/m/Vεr relative dielectric relaxation�i zeta potential, V�0 characteristic zeta potential, V� inverse Debye double-layer, m−1
� viscosity, N s/m2
kinematic viscosity, m2/s� density,kg/m3
�i surface charge density, V/m2
�m monomer volume fraction in the polymer phase�i surface potential or polymer particle of size i, V
Subscripts
d dropletm monomerp polymer1 droplet phase2 aqueous phase
Superscript
OP orthokinetic-perikinetic
Appendix A. Determination of the stability ratio, Wij
The stability ratio can be expressed in terms of the totalinteraction potential, V T (Fuchs, 1964):
Wij = (ri + rj )
∫ ∞
0
exp(V T /kBT )
h2dh, (A.1)
where h is the particle-to-particle surface distance.In general, the total interaction potential of electrostatically
stabilized particles can be described in terms of the attractive,V A (i.e., London dispersion forces) and repulsive, V R (i.e.,electrostatic), particle surface potentials:
V T = V A + V R . (A.2)
The van der Waals interaction potential between two unequalspherical particles of radii ri and rj is given by (Hunter, 1987):
V A = −A12
6
[2
(s2 − 4)+ 2
s2+ ln
(s2 − 4
s2
)], (A.3)
where s is the dimensionless particle-to-particle separation dis-tance, s = 2 + 2h/(ri + rj ) and A12 is the effective Hamakercoefficient which for the PVC/VCM is approximately equal to5 × 10−21 J.
3982 A.H. Alexopoulos, C. Kiparissides / Chemical Engineering Science 62 (2007) 3970–3983
The interaction potential curves for PVC primary particlesis characterized by the broad range of PVC primary particlesizes (e.g., from 10 nm to over 1 �m). Furthermore, it has beenshown that the interaction potential for the PVC/VCM systemis rather broad due to the low dielectric coefficient of VCMand the relatively small number of charges on the PVC basicparticles (Rance and Zichy, 1981). Thus, for a broad rangeof particle sizes and small values of the surface potential, theexpressions proposed by Ottewill (1982) can be employed forthe calculation of the electrostatic interaction potential, V R:
V R1 = εr2
ij �i�j
e−�h
h + 2rij, �rij < 2.5,
V R12 = V R
1 (3.5 − �rij ) + V R2 (�rij − 2.5), 2.5 < �rij < 3.5,
V R2 = ε
2rij �
20ij e
−�h, 3.5 < �rij < 9.5,
V R23 = V R
2 (10.5 − �rij ) + V R3 (�rij − 9.5), 9.5 < �rij < 10.5,
V R3 = ε
2rij �i�j ln(1 + e−�h), �rij > 10.5, (A.4)
where V Rij represents the intermediate smoothed-potential for
two particles with V Ri and V R
j potentials (Prindle, 1989). rijis the geometric mean diameter and �i is the zeta-potential ofparticle i. The expressions for �0, i , and the dielectric constantε are given by
ε = 4ε0εr , �0 = 4kBT /zie, i = tanh(�i/�0), (A.5)
where ε0, εr denote the permittivity of vacuum and the relativedielectric constant of VCM with respect to vacuum. The productterm ε0εr for VCM will be equal to 4.16 × 10⁻¹¹ Cb2/J/m.
A key quantity in the above expressions is the inverse Debyelength, �, given by
� =(
(4e2NA/εkBT )∑
i
z2i Cz,i
)1/2
(A.6)
where e is the elementary electron charge, zi and Cz,i denotethe valency and concentration of ion “i”, respectively. For a 1:1electrolyte at a typical concentration of 1 �mol/L and at 323 K,the value of � for S-PVC will be equal to 1.3 × 10⁷ m−1.
By ignoring the Stern-layer effects, the zeta-potential �i isequal to the particle surface potential �i . Values of the latter canbe calculated in terms of the surface charge density, �, usingthe Debye–Huckel approximation that is valid for low valuesof the surface potential (Hunter, 1987):
�i = 4ri�i/ε(1 + �ri). (A.7)
The surface charge density can in turn be expressed in terms ofthe total particle charge, Qi (�i =Qi/4r2). Thus, the particlesurface potential can be calculated by the following equation:
�i = Qi/εri(1 + �ri). (A.8)
According to Tornell and Uustalu (1988), the total particlecharge will depend on the particle size, according to
Qi = Cprpi , (A.9)
where Cp is a constant and the exponent p can take values inthe range of (0, 2). Based on available experimental data onthe total particle charge at different particle radii, Tornell et al.(1986) calculated the value of Cp (Kiparissides, 1990):
Cp = Cp0/rp
0 = 1.57 × 10⁻¹⁷(1.5 × 10⁻⁷)−p. (A.10)
According to the stabilization scheme outlined above (see Eqs.(A.1)–(A.10)), it can be shown that the surface potential dis-plays a maximum with respect to the particle size for values ofthe exponent p in the range of 1 < p < 2. This is an importantobservation since a maximum value in the interaction poten-tial, at some critical particle size, implies that particles largerthan the critical size eventually become unstable and undergorunaway aggregation.
References
Abdel-Alim, A.H., Hamielec, A.E., 1972. Bulk polymerization of vinylchloride. Journal of Applied Polymer Science 16, 783–799.
Alexopoulos, A.H., Roussos, A.I., Kiparissides, C., 2004. Part I: dynamicevolution of the particle size distribution in particulate processesundergoing combined particle growth and aggregation. ChemicalEngineering Science 59 (24), 5751–5769.
Alexopoulos, A.H., Kiparissides, C., 2005. Part II: dynamic evolution of theparticle size distribution in particulate processes undergoing simultaneousparticle nucleation, growth and aggregation. Chemical Engineering Science60 (15), 4157–4169.
Allsopp, M.W., 1981. The development of suspension PVC morphology. Pureand Applied Chemistry 53, 449–465.
Bao, Y.Z., Brooks, B.W., 2002. Influences of some polymerization conditionson particle properties of suspension poly(vinyl chloride) resin. Journal ofApplied Polymer Science 85 (7), 1544–1552.
Batchelor, G.K., 2000. An Introduction to Fluid Mechanics. CambridgeUniversity Press, Cambridge, MA.
Boissel, J., Fischer, N., 1977. Bulk polymerization of vinyl chloride:nucleation phase. Macromolecular Science—Chemistry A11 (7), 1249–1269.
Chern, C.S., Kuo, Y.N., 1996. Shear-induced coagulation kinetics of semibatchseeded emulsion polymerization. Chemical Engineering Science 51 (7),1079–1087.
Cotman, J.D., Gonzales, M.F., Claver, G.C., 1967. Studies on poly(vinylchloride). III. The role of the precipitated polymer in the kinetics ofpolymerization of vinyl chloride. Journal of Polymer Science Part A:Polymer Chemistry 5, 1137–1164.
Davidson, J.A., Witenhafer, D.E., 1980. Particle structure of suspensionpoly(vinyl chloride) and its origin in the polymerization process. Journalof Applied Polymer Science Polymer Physics Edition 18, 51–69.
Einarson, M.B., Berg, J.C., 1993. Electrosteric stabilization of colloidaldispersions. Journal of Colloid and Interface Science 155 (1), 165–172.
Endo, K., 2002. Synthesis and structure of poly(vinyl chloride). Progress inPolymer Science 27, 2021–2054.
Fuchs, N.A., 1964. The Mechanics of Aerosols. Pergamon Press, New York.Geil, P.H., 1977. Polymer morphology. Journal of Macromolecular
Science—Chemistry A11 (7), 1271–1280.Hounslow, M.J., Ryall, R.L., Marshall, V.R., 1988. Discretized population
balance for nucleation, growth, and aggregation. A.I.Ch.E. Journal 34 (11),1821–1832.
A.H. Alexopoulos, C. Kiparissides / Chemical Engineering Science 62 (2007) 3970–3983 3983
Hunter, R.J., 1987. Foundations of colloid science. Clarendon Press, Oxford.Kiparissides, C., 1990. Prediction of the primary particle size distribution
in vinyl chloride polymerization. In: Macromolecular ChemistryMacromolecular Symposium, vol. 35/36, pp. 171–192.
Kiparissides, C., Moustakis, I., Hamielec, A., 1993. Electrostatic and stericstabilization of PVC particles. Journal of Applied Polymer Science 49,445–459.
Kiparissides, C., Achilias, D.S., Chatzi, E.G., 1994. Dynamic simulation ofprimary particle-size distribution in vinyl chloride polymerization. Journalof Applied Polymer Science 54, 1423–1438.
Kiparissides, C., Daskalakis, G., Achilias, D.S., Sidiropoulou, E., 1997.Dynamic simulation of industrial poly(vinyl chloride) batch suspensionpolymerization reactors. Industrial and Engineering Chemistry Research36 (4), 1253–1267.
Kotoulas, C., Kiparissides, C., 2006. A generalized population balance modelfor the prediction of particle size distribution in suspension polymerizationreactors. Chemical Engineering Science 61, 332–346.
Lazaridis, N., Alexopoulos, A.H., Chatzi, E.G., Kiparissides, C., 1999.Steric stabilization in emulsion polymerization using oligomeric nonionicsurfactants. Chemical Engineering Science 54, 3251–3261.
Levich, V., 1962. Physicochemical Hydrodynamics. Prentice-Hall, EnglewoodCliffs, NJ.
Litster, J.D., Smit, D.J., Hounslow, M.J., 1995. Adjustable discretizedpopulation balance for growth and aggregation. A.I.Ch.E. Journal 41,591–603.
Maggioris, D., Goulas, A., Alexopoulos, A.H., Chatzi, E.G., Kiparissides, C.,2000. Prediction of particle size distribution in suspension polymerizationreactors: effect of turbulence nonhomogeneity. Chemical EngineeringScience 55, 4611–4627.
Nilsson, H., Silvegren, C., Uustalu, J., 1983. Drop and grain sizedistribution during suspension polymerization of vinyl(chloride). PolymerCommunications 24 (9), 268–269.
Nilsson, H., Norvitt, T., Silvegren, C., Tornell, B., 1985a. Suspensionstabilizers for PVC production II: drop size distribution. Journal of VinylTechnology 7 (3), 119–122.
Nilsson, H., Silvegren, C., Tornell, B.E., Lundqvist, J., Petterson, S., 1985b.Suspension stabilizers for PVC production III: control of resin porosity.Journal of Vinyl Technology 7 (3), 123–127.
Ottewill, R.H., 1982. The stability and instability of polymer latices. In:Piirma, I. (Ed.), Emulsion Polymerization. Academic Press, New York.
Prindle, J.C., 1989. Dynamics and stability of emulsion polymerizationreactors. Ph.D. Thesis, University of Wisconsin-Madison.
Rance, D.G., 1985. Colloidal aspects of poly(vinyl chloride) productionprocesses. In: Buscall, R., Corner, T., Stageman, J.F. (Eds.), PolymerColloids. Elsevier, Applied Science Publishers,
Rance, D.G., Zichy, E.L., 1981. The life-cycle of the two-phase system invinyl chloride polymerization. Pure Applied Chemistry 53, 377–384.
Ravey, M., 1977. Mechanism of scale formation in PVC reactors. Journal ofApplied Polymer Science 21, 839–840.
Ray, W.H., Jain, S.K., Salovey, R., 1975. On the modeling of bulk poly(vinylchloride) reactors. Journal of Applied Polymer Science 19, 1297–1315.
Ramkrishna, D., 1985. The status of population balances. Review in ChemicalEngineering 3 (1), 49–95.
Ramkrishna, D., 2000. Population Balances: Theory and Applications toParticulate Systems in Engineering. Academic Press, San Diego, California.
Saeki, Y., Emura, T., 2002. Technical progresses for PVC production. Progressin Polymer Science 27, 2055–2131.
Smallwood, P.V., 1985. Vinyl chloride polymers polymerization. In: Mark,H. (Ed.), Encyclopedia of Polymer Science and Engineering. Wiley, NewYork. 295pp.
Smallwood, P.V., 1986. The formation of grains of suspension poly(vinylchloride). Polymer 27, 1609–1618.
Summers, J.W., 1997. A review of vinyl technology. Journal of Vinyl &Additive Technology 3 (2), 130–139.
Talamini, G., Visentini, A., Kerr, J., 1998. Bulk and suspension polymerizationof vinyl chloride: the two-phase model. Polymer 39 (10), 1879–1891.
Tornell, B.E., Uustalu, J.M., 1982. The influence of additives on the primaryparticle nucleation and agglomeration in poly(vinyl-chloride). Journal ofVinyl Technology 4 (2), 53–56.
Tornell, B.E., Uustalu, J.M., 1986. Primary particle stability in bulkpolymerization of vinyl chloride at high ion strength. Polymer 27,250–252.
Tornell, B.E., Uustalu, J.M., 1988. Formation of primary particles in vinylchloride polymerization. Journal of Applied Polymer Science 35, 63–74.
Tornell, B.E., Uustalu, J.M., Jonsson, B., 1986. Colloidal stability ofPVC primary particles in vinyl chloride. Colloid Polymer Science 264,439–444.
Tregan, R., Bonnemayre, A., 1970. Revista Plasticos Modemos 23, 7.Van de Ven, T.G.M., 1989. Colloidal Hydrodynamics. Colloid Science.
Academic Press, New York.Van de Ven, T.G.M., Mason, S.G., 1977. The micro-rheology of colloidal
dispersions. Part VIII: effect of shear on perikinetic doublet formation.Colloid Polymer Science 255, 794–804.
Verwey, E.J.W., Overbeek, J.TH.G., 1948. Theory of the Stability ofLyophobic Colloids. Dover Publications, New York.
Willmouth, F.M., Rance, D.G., Henman, K.M., 1984. An investigation ofprecipitation polymerization in liquid vinyl chloride by photon correlationspectroscopy. Polymer 25, 1185–1192.
Wilson, J.C., Zichy, E.L., 1977. Observations of charge on nascent poly(vinylchloride) particles in monomer. Polymer 20 (2), 264–265.
Xie, T.Y., Hamielec, A.E., Wood, P.E., Woods, D.R., 1991. Suspension, bulk,and emulsion polymerization of vinyl chloride—mechanism, kinetics, andreactor modelling. Journal of Vinyl Technology 13 (1), 2–25.
Yuan, H.G., Kalfas, G., Ray, W.H., 1991. Suspension polymerization—areview. Macromolecular Chemistry and Physics 31 (C283), 215–299.