On-line Coupling of Pressurised Hot Water Extraction and ...
77
University of Helsinki Department of Chemistry Laboratory of Analytical Chemistry Finland On-line Coupling of Pressurised Hot Water Extraction and Microporous Membrane Liquid–Liquid Extraction with Chromatography in Analysis of Environmental Samples Kati Lüthje Academic Dissertation To be presented with the permission of the Faculty of Science of the University of Helsinki for public criticism in Auditorium A 129 of the Kumpula Chemistry Building 12 March 2004, at 12 o’clock noon. Helsinki 2004
-
Upload
khangminh22 -
Category
Documents
-
view
2 -
download
0
Transcript of On-line Coupling of Pressurised Hot Water Extraction and ...

University of Helsinki Department of Chemistry
Laboratory of Analytical Chemistry Finland
On-line Coupling of Pressurised Hot Water Extraction and Microporous Membrane Liquid–Liquid Extraction with Chromatography in Analysis of
Environmental Samples
Kati Lüthje
Academic Dissertation
To be presented with the permission of the Faculty of Science of the University of Helsinki for public criticism in Auditorium A 129 of the Kumpula Chemistry Building 12 March 2004, at 12
o’clock noon.
Helsinki 2004
2
Custos:
Prof. Marja-Liisa Riekkola Laboratory of Analytical Chemistry
Department of Chemistry University of Helsinki
Finland
Reviewers:
Prof. Anders Colmsjö Department of Analytical Chemistry
Stockholm University Sweden
and Prof. Raimo Hiltunen
Division of Pharmacognosy Department of Pharmacy
University of Helsinki Finland
Opponent: Prof. Udo A. Th. Brinkman
Department of Analytical Chemistry and Applied Spectroscopy Free University, Amsterdam
The Netherlands
ISBN 952-91-6757-1 (paperback) ISBN 952-10-1580-2 (pdf file)
http://ethesis.helsinki.fi
Yliopistopaino, Helsinki 2004

3
“Gott fólk hefur þykkar hendur” Vigdís Grímsdóttir, ‘Kaldaljós’

4
Contents Preface ......................................................................................................................... 6 Abstract........................................................................................................................ 7 Abbreviations .............................................................................................................. 8 Symbols ..................................................................................................................... 10 List of original publications..................................................................................... 11 1. Introduction ........................................................................................................... 12 2. Objectives of the study ........................................................................................ 14 3. Compounds studied ............................................................................................. 15
3.1. Brominated flame retardants................................................................. 15 3.2. Polycylic aromatic hydrocarbons ......................................................... 16 3.3. Pesticides ................................................................................................ 17
4. Pretreatment and analysis of solid and liquid samples ................................... 18 4.1. Pretreatment of solid samples .............................................................. 18 4.2. Pretreatment of liquid samples ............................................................. 19 4.3. Analytical techniques............................................................................. 20
5. Pressurised hot water extraction........................................................................ 20 5.1. Factors affecting the extraction ............................................................ 21
5.1.1. Temperature ..........................................................................................21 5.1.2. Pressure..................................................................................................22 5.1.3. Flow-rate ................................................................................................22
5.2. Selectivity ................................................................................................ 23 5.3. Equipment and trapping......................................................................... 23 5.4. Applications............................................................................................. 24
6. Membrane extraction............................................................................................ 24 6.1. Porous and non-porous membrane techniques.................................. 25 6.2. Microporous membrane liquid–liquid extraction ................................ 26
6.2.1. Factors affecting the extraction ...........................................................27 6.2.2. Applications ...........................................................................................28
7. Injection and solvent evaporation in gas chromatography ............................. 29 7.1. Large volume injection........................................................................... 29 7.2. On-column injection/transfer................................................................. 30 7.3. Solvent evaporation................................................................................ 31
7.3.1. Retention gap techniques .....................................................................31 7.3.1.1. Conventional retention gap technique .................................32 7.3.1.2. Partially concurrent solvent evaporation ............................32
7.3.2.Fully concurrent solvent evaporation ..................................................33 7.3.3. Comparison of evaporation techniques ..............................................33 7.3.4. Solvent vapour exit ...............................................................................33
7.4. On-line coupling of extraction techniques to gas chromatography . 34 8. Experimental ......................................................................................................... 35

5
8.1. Chemicals and materials........................................................................ 35 8.2. Equipment................................................................................................ 35
8.2.1. Analytical instrumentation ..................................................................40 8.2.2. On-line coupled extraction–analysis systems .....................................41
8.3. Methods ................................................................................................... 41 8.3.1. On-line methods ....................................................................................42 8.3.2. Off-line methods....................................................................................43
9. Results and discussion........................................................................................ 44 9.1. Optimisation of extraction methods ..................................................... 44
9.1.1. Pressurised hot water extraction .........................................................45 9.1.1.1. Sample size..............................................................................46 9.1.1.2. Flow-rate .................................................................................46 9.1.1.3. Extraction temperature .........................................................46 9.1.1.4. Extraction time.......................................................................46 9.1.1.5. Adsorption to capillaries .......................................................47 9.1.1.6. Vessel size................................................................................48
9.1.2. Microporous membrane liquid–liquid extraction..............................50 9.1.2.1. Choice of membrane ..............................................................50 9.1.2.2. Choice of acceptor solvent.....................................................50 9.1.2.3. Donor flow-rate ......................................................................51 9.1.2.4. Extraction time.......................................................................52 9.1.2.5. Acceptor flow-rate..................................................................52 9.1.2.6. Extraction temperature .........................................................55
9.2. Trapping and clean-up in pressurised hot water extraction.............. 58 9.2.1. Solid-phase trapping.............................................................................58 9.2.2. Collection into solvent and liquid–liquid extraction..........................59 9.2.3. Trapping with membrane techniques .................................................60
9.2.4. Comparison of trapping methods...............................................60 9.2.5. Clean-up with liquid chromatography................................................62
9.3. Gas chromatography.............................................................................. 63 9.3.1. Injection or transfer to gas chromatograph .......................................63 9.3.2. Temperature programming .................................................................63
9.4. Quantitative analysis .............................................................................. 64 9.4.1. Characteristics of methods...................................................................64 9.4.2. Determination of brominated flame retardants in sediments...........66 9.4.3. Determination of polycyclic aromatic hydrocarbons in soil and
sediment ..................................................................................................67 9.4.4. Analysis of hydrophobic pollutants in surface water ........................69
10. Conclusions ........................................................................................................ 71 11. References........................................................................................................... 73 Appendix: Papers I-VI

6
Preface This thesis is based on research carried out in the Laboratory of Analytical Chemistry of the Department of Chemistry, University of Helsinki, during the years 2000-2003. First of all, I would like to thank Professor Marja-Liisa Riekkola for giving me the opportunity to carry out this work in the Laboratory of Analytical Chemistry and for advice and support during the work. I am most grateful to my supervisor Docent Tuulia Hyötyläinen, who provided me with bunch of fresh ideas, encouragement and help in various matters. I am also indebted to Doc. Kari Hartonen, Lic. Phil. Matti Jussila and Prof. Jan Åke Jönsson for their research ideas, help with the device and their contribution as co-authors in the papers. I also want to thank my special assignment workers Marja Lehmusjärvi and Riitta Kontinen for their involvement. I wish to thank Sami Palonen for the help with software and data handling, Pekka Tarkiainen for technical support and Pentti Jyske for the help and encouragement with “LC–GC mystery” and other instruments. Special thanks go to my roommates Masahiko, Terhi and Maarit, and Juhani from next door, for help in the laboratory and several discussions on both research topics, and even more importantly, on quite a few other issues. I would also like to thank my co-workers Heli, Heidi, Jari, Jarno, Johan, Johanna, Maria, Minna, Pasi, Pertti, Sami V., Simo, Susanne and Yohannes together with all the new-comers for creating a comfortable working atmosphere and help when needed. Special thanks go to Merit, Liisa and Erja who took care that everything was functioning in the laboratory. I am grateful to Dr. Kathleen Ahonen who revised the language of papers I-V and the thesis. Prof. Anders Colmsjö and Prof. Raimo Hiltunen are thanked for the careful pre-examination of the thesis. Finally, I want to thank my parents Eeva and Pentti and sisters Outi and Päivi whom I can always count on and my precious husband Kai for always cheering me up and making me laugh. Many thanks also to my friends, and judo friends for providing me with the opportunity to train and fight and see the research world with different eyes. Financial support from Finnish Cultural Foundation, Academy of Finland, Acta Chemica Scandinavica, Kordelin Foundation and Waldemar von Frenckell Foundation is gratefully acknowledged.
7
Abstract On-line coupling of extraction and analytical techniques offers a number of important advantages: minimised manual pretreatment and analyte loss, low solvent consumption and, since the whole extract is injected for analysis, extremely low detection limits. Three on-line systems for the pretreatment and analysis of solid samples and one system for aqueous samples were developed in this study. Factors affecting the extractions and the design of equipment were investigated. A system combining pressurised hot water extraction, liquid chromatography and gas chromatography (PHWE–LC–GC) was developed for the analysis of brominated flame retardants (BFRs) in soil. Environmentally harmful BFRs were extracted from soil with pressurised hot water and the extract was collected into a solid-phase trap. The extract was eluted from the trap to a liquid chromatograph (LC), where it was cleaned, and different compound groups were fractionated. The fraction containing the target analytes was transferred to a gas chromatograph (GC) for analysis. Low detection limits were obtained with this method. In a second system, analytes were collected with a membrane extraction unit. With this pressurised hot water extraction – microporous membrane liquid-liquid extraction – gas chromatography (PHWE–MMLLE–GC) system, polycyclic aromatic hydrocarbons (PAHs) were determined in soil. In a further application of PHWE–MMLLE–GC, the flat sheet membrane unit used in the first combination was replaced by a laboratory-made hollow fibre module. This modified system was applied for the determination of PAHs in soil and sediment samples. Reliable quantifications were achieved with both PHWE–MMLLE–GC systems. The results were compared with those obtained by other methods and with reference values. Different trapping methods for use with PHWE (solvent trapping, solid-phase trapping, flat sheet membrane unit, hollow fibre membrane unit) were compared in terms of selectivity, extraction yield, repeatability and robustness. The best trapping method is dependent on the application. The simplest method for the determination of PAHs in soil and sediment was trapping with the flat-sheet membrane unit. As well as a trapping method for PHWE, microporous membrane liquid–liquid extraction was studied as a separate sample preparation method. Factors affecting MMLLE were investigated in detail, with special attention paid to the effect of temperature on diffusion, mixing of the donor and acceptor solvents, extraction yield, adsorption to the membrane material and membrane pore size. An on-line combination of MMLLE and gas chromatography was applied for the analysis of hydrophobic pollutants in surface water samples. The extraction, injection and GC conditions were optimised and eight water samples from Finnish lakes and rivers and the Gulf of Finland were analysed for selected pesticides and PAHs. None of the target analytes were found, but to demonstrate the applicability of the system two samples spiked with the studied compounds were analysed.

8
Abbreviations ASE accelerated solvent extraction ASTED automated sequential trace enrichment of dialysates BFR brominated flame retardant BP4A tetrabromobisphenol A BP6 hexabromobiphenyl BTEX benzene, toluene, ethyl benzene and xylene DNA deoxyribonucleic acid ELM emulsion liquid membrane EPA U.S. Environmental Protection Agency FCSE fully concurrent solvent evaporation FID flame ionisation detector FS flat sheet GC gas chromatography HBCD hexabromocyclodecane HF hollow fibre IARC International Agency for Research on Cancer i.d. inner diameter LC liquid chromatography LLE liquid–liquid extraction LPME liquid-phase microextraction LVI large volume injection MAE microwave assisted extraction MASE membrane assisted solvent extraction MBSE membrane based solvent extraction MBSS membrane based solvent stripping MESI membrane extraction with sorbent interface MIMS membrane inlet mass spectrometry MMLLE microporous membrane liquid–liquid extraction MS mass spectrometry MTBE methyl-tert-butylether NPLC normal-phase liquid chromatography o.d. outer diameter PAH polycyclic aromatic hydrocarbon PBB polybrominated biphenyl PBDE polybrominated diphenylether PCB polychlorinated biphenyl PCDD polychlorinated dibenzodioxine PCDF polychlorinated dibenzofurane PCSE partially concurrent solvent evaporation PEEK poly(etheretherketone)

9
PHT4 tetrabromo phthalic anhydride PHWE pressurised hot water extraction PLE pressurised liquid extraction PME polymeric membrane extraction PTFE poly(tetrafluoroethylene) PTV programmable temperature vapouriser RPLC reversed-phase liquid chromatography RSD relative standard deviation SAE sonication-assisted extraction SBSE stirbar sorptive extraction SFE supercritical fluid extraction SIM selected ion monitoring SLM supported liquid membrane S/N signal-to-noise ratio SP solid phase SPE solid-phase extraction SPME solid-phase microextraction SVE solvent vapour exit SWC superheated water chromatography TBBPA tetrabromobisphenol A T23P tris(2,3-dibromopropylphosphate) UF ultrafiltration UV ultraviolet (light) VF vacuum filtration v/v volume-to-volume ratio

10
Symbols a hydrodynamic radius (m) α polarisability (C2 m2 J-1) ci analyte concentration D diffusion coefficient (m2 s-1) E extraction efficiency (%) Ee enrichment factor ε relative permittivity (dielectric constant) K partition coefficient k Boltzmann constant (1.38*10-23 J K-1) logKOW octanol–water partition coefficient M molecular mass (g mol-1) NA Avogadro constant (6.022*1023 1 mol-1) η dynamic viscosity (Pa s) P pressure (bar, 1 bar = 105 Pa) PC critical pressure (bar) R gas constant (8.314 J K-1mol-1) δ solubility parameter (Hildebrand unit H, 1 H = 1 (cal cm-3)1/2, 1cal = 4.19 J) T temperature (°C, 0°C = 273.15 K) TC critical temperature (°C) µ electric dipole moment (C m, I debye unit D = 3.33564*10-30 C m) µI chemical potential

11
List of original publications The dissertation is based on the following six publications, hereafter referred to by their Roman numerals (I-VI).
I. Kati Kuosmanen, Tuulia Hyötyläinen, Kari Hartonen and Marja-Liisa Riekkola, reproduced with permission from J. Chromatogr. A 943 (2002) 113-122. “Pressurised Hot Water Extraction Coupled On-Line with Liquid Chromatography–Gas Chromatography for the Determination of Brominated Flame Retardants in Sediment Samples” Copyright 2002 Elsevier Science
II. Kati Kuosmanen, Tuulia Hyötyläinen, Kari Hartonen, Jan Åke Jönsson and Marja-Liisa Riekkola, reproduced with permission from Anal. Bioanal. Chem. 375 (2003) 389-399. “Analysis of PAH Compounds in Soil with On-line Coupled Pressurised Hot Water Extraction–Microporous Membrane Liquid-Liquid Extraction–Gas Chromatography” Copyright 2003 Springer-Verlag
III. Kati Kuosmanen, Tuulia Hyötyläinen, Kari Hartonen and Marja-Liisa Riekkola, reproduced with permission from Analyst 128 (2003) 434-439. “Analysis of Polycyclic Aromatic Hydrocarbons in Soil and Sediment with On-line Coupled Pressurised Hot Water Extraction, Hollow Fibre Microporous Membrane Liquid–Liquid Extraction and Gas Chromatography” Copyright 2003 The Royal Society of Chemistry
IV. Kati Lüthje (formerly Kuosmanen), Tuulia Hyötyläinen and Marja-Liisa Riekkola, reproduced with permission from J. Chromatogr. A 1025 (2004) 41-49. “Comparison of Different Trapping Methods for Pressurised Hot Water Extraction” Copyright 2004 Elsevier Science
V. Kati Kuosmanen, Marja Lehmusjärvi, Tuulia Hyötyläinen, Matti Jussila and Marja-Liisa Riekkola, reproduced with permission from J. Sep. Sci. 26 (2003) 893-902. “Factors Affecting Microporous Membrane Liquid–Liquid Extraction” Copyright 2003 Wiley
VI. Kati Lüthje (formerly Kuosmanen), Tuulia Hyötyläinen and Marja-Liisa Riekkola, accepted for publication in Anal. Bioanal. Chem. “On-line Coupling of Microporous Membrane Liquid–Liquid Extraction and Gas Chromatography in the Analysis of Organic Pollutants in Water”

12
1. Introduction Growing demands are being set on sample pretreatment and analytical techniques. Fast, automated and, most importantly, reliable methods are needed for the determination of trace amounts of target analytes in various matrices. The most widespread chromatographic techniques ─ liquid chromatography (LC) and gas chromatography (GC) ─ have been under intensive study and development during the past decades. Today these techniques are versatile with low detection limits, and they are suitable for routine analysis where high repeatability is required. After pretreatment of the sample, chromatographic methods are well suited for the analysis of complex food, biological, pharmaceutical and environmental samples. Growing concern about our environment and pollution has created a demand for environmentally friendly sample pretreatment methods. Traditional methods tend to be laborious, time-consuming and a frequent source of analytical errors. Typically, the traditional methods are multi-step procedures characterised by easy contamination, decreased reliability and risk of analyte loss. In addition, harmful organic solvents may be used in large quantity. During the last decade, environmentally friendly extraction methods requiring only small volumes of organic solvents have been developed. Use of the smallest possible volume of organic solvent not only makes the methods environmentally friendly but also cheaper. Examples of such methods are pressurised hot water extraction (PHWE) and supercritical fluid extraction (SFE) for solid samples and membrane extraction techniques such as supported liquid membrane (SLM), microporous membrane liquid-liquid extraction (MMLLE) and solid-phase microextraction (SPME) for liquid samples. The selectivity of most extraction methods is limited, and if the separation obtained with the available analytical technique is insufficient, the extract has to be cleaned and in some cases also fractionated before analysis. In addition to the target analytes, extracts usually contain other chemically similar compounds in large quantities, which could disturb the analysis. Different kinds of extracts can be cleaned and fractionated in a more or less similar manner. Solid-phase extraction and liquid chromatography are often applied, for example. The best features of sample preparation and analytical methods can be combined and manual pretreatment minimised by coupling an extraction technique on-line to a chromatographic technique. Extremely low detection limits can be obtained when the whole extract is injected to a gas chromatograph, and then even a small amount of sample is sufficient for analysis. Also, some special problems can be solved with on-line systems. The aim of this research was to develop sensitive on-line methods where extraction and chromatography are coupled together for the determination of organic pollutants in soil, sediment and water. These methods combine environmentally friendly extraction and gas chromatographic analysis either with direct on-line coupling or with coupling via a liquid chromatograph. Sediment samples, for example, are complex and contain large quantities of interfering inorganic compounds such as sulfur and hydrocarbons, which are present in much higher levels than the target analytes.

13
As a result the extract has to be cleaned, fractionated and concentrated, for example by liquid chromatography, before the injection to GC (I). Another possibility is to replace the LC unit used for the cleaning and carry out concentration in a microporous membrane liquid–liquid extraction unit (II, III). Various trapping systems for the analytes have been used in PHWE applications. In this study, trapping to solvent, solid-phase trapping and trapping with flat-sheet or hollow-fibre membrane units were studied and compared (IV). The MMLLE unit used for trapping after PHWE can also be used independently for the pretreatment of liquid samples. The applicability in sample preparation of a flat-sheet membrane unit, and factors affecting MMLL extraction, were carefully studied (V) before the determination of hydrophobic pollutants in Finnish surface water samples by MMLLE–GC (VI).

14
2. Objectives of the study The aim in this study was to develop on-line systems that combine sample pretreatment and analysis in the same closed system. In this way low detection limits are obtained and manual work is minimised. The sample preparation methods that were used were pressurised hot water extraction for solid samples and microporous membrane liquid-liquid extraction for both liquid samples and PHW extracts. The analytical methods were LC–GC and GC. In the on-line methods that were developed the whole extract was injected or transferred for analysis. In addition to the development of on-line systems, different trapping systems in PHWE were investigated and compared. Also, factors affecting MMLL extraction were studied in detail. Specifically the aims were the following:
• Application of pressurised hot water extraction in the extraction of traces of brominated flame retardants in contaminated sample matrices (I)
• Optimisation and application of an on-line PHWE–LC–GC method for the determination of brominated flame retardants in sediments (I)
• Use of MMLLE as a trapping method after PHW extraction, and coupling of these two extraction methods on-line (II, III)
• Application and optimisation of flat-sheet and hollow-fibre membrane units in the cleaning and concentration of PHW extracts in PHWE–MMLLE–GC (II, III)
• Development and application of PHWE–MMLLE–GC methods for the determination of PAHs in soil and sediment (II, III, IV)
• Construction of a compact hollow fibre MMLLE module (III, IV) • Comparison of different trapping methods in PHWE in terms of selectivity, efficiency,
repeatability and robustness (IV) • Investigation of the effect of different factors on the extraction behaviour in MMLLE (V) • Investigation of the effect of increased temperature on MMLL extraction (V) • Optimisation and application of on-line coupled MMLLE–GC in the analysis of
hydrophobic pollutants in water (VI) Chapters 3 and 4 below provide background information on the compounds and compound groups (brominated flame retardants, polycyclic aromatic hydrocarbons and pesticides) and the solid and liquid environmental samples that were studied. The principles and several applications of the sample preparation, and analytical techniques applied in the coupled systems are presented in Chapters 5-7. Chapters 8 and 9 summarise the experimental work reported in the attached publications: chapter 8 the experimental conditions and equipment and chapter 9 the results of the experiments. Conclusions are presented in Chapter 10.

15
3. Compounds studied In the research for this dissertation, environmental samples of soil, sediment and water were investigated for brominated flame retardants (BFRs), polycyclic aromatic hydrocarbons (PAHs) and pesticides. PAH compounds have been widely studied for many years, whereas the intensive study of BFRs has only recently begun [1]. Pesticides have been under intensive study [2,3] since the late 1960s. From their various sources these compounds are transported in air and water throughout the world. They enter the soil in rain droplets and adsorb to particles containing organic matter. Eventually they end up in seawater and in sea-bottom sediments. Because of the effective transport, these compounds are found everywhere in the world. 3.1. Brominated flame retardants BFRs are added to polymers, paints and textiles as a means of protecting electronic equipment such as televisions and computers, devices containing circuit boards, electronic components, cables and car parts. Many different types of flame retardants exist, among them inorganic and organic phosphate esters and chlorinated and brominated compounds [1]. Brominated flame retardants (BFRs) form about 30% of the total annual consumption of flame retardants [4-6]. Structurally they include aromatics, cyclic aliphatics, phenolic derivatives and aliphatics and phthalic anhydride derivatives. The most common BFRs are tetrabromobisphenol A (TBBPA), polybrominated diphenyl ethers (PBDEs) and hexabromocyclododecane (HBCD) and polybrominated biphenyls (PBB) [5-7]. The scale of production of BFRs has grown rapidly along with growth in the use of synthetic polymers and the introduction of stricter safety requirements. Levels of BFRs in the environment are increasing as a result [1]. PBBs and PBDEs in many ways resemble the better known polychlorinated biphenyls (PCB) and polychlorinated dibenzodioxins (PCDD) [8]. Like PCBs, PBBs and PBDEs are persistent and bioaccumulating environmentally harmful compounds. Whereas PCBs usually enter the environment directly from point sources at manufacture, however BFRs are released from products over their entire lifetimes. BFRs released to indoor air usually adsorb onto particles and enter the environment during ventilation. BFRs have been found throughout the world in air, sediment, fish tissue, sewage sludge, bird eggs, whale, dolphin and seal fat, mussels and human serum, milk and tissue [1]. Owing to bioaccumulation, concentrations in predators in the food chain are often significant. Heating of PBBs and PBDEs may lead to the formation of brominated dioxins and furans. Like PCBs, both PBBs and PBDEs comprise 209 congeners. Congener patterns of PBBs and PBDEs in environmental samples do not match those of technical products, indicating an environmental alteration, possibly a photochemical debromination. In general, the environmental characteristics of BFRs and their impact on health are not well known [1]. Most of these compounds are relatively non-toxic, but some have similar toxic effects to PCBs,
16
PCDDs and PCDFs [9]. Since the water solubilities and vapour pressures of PBBs, TBBPA, HBCD and PBDEs are very low [5], the compounds tend to quickly adsorb onto solid particles of sediment and soil when released to the environment. PBBs and PBDEs are also presumed to bioaccumulate easily because of their high lipophilicity and resistance to degradative processes [6]. According to present knowledge, lower PBDE congeners (from tetra to hexa) are likely to be carcinogenic, endocrinic disrupters or neurodevelopment toxicants [4,5,9]. The most common BFR, tetrabromobisphenol A (TBBPA), has been shown to be toxic at least to marine organisms [8]. The BFRs of interest in the present study were hexabromobiphenyl (BP6), heptabromobiphenyl, tribromotrichlorocyclohexane, tetrabromodichlorocyclohexane, pentabromochlorocyclohexane, pentabromotoluene, tetrabromobisphenol A (BP4A), tetrabromophthalic anhydride (PHT4), and tris(2,3-dibromopropyl)phosphate (T23P). The molar masses of these compounds are typically high (300–1000 g/mol), while their water solubilities (<30 µg/l) and vapour pressures are low. Some of the compounds do not dissolve in water at all. The octanol–water partition coefficients (logKow) are typically larger than 4 [10, 11]. 3.2. Polycyclic aromatic hydrocarbons Polycyclic aromatic hydrocarbons (PAHs) are formed during incomplete combustion of organic compounds containing hydrogen and oxygen. In complete combustion of organic compounds only carbon dioxide and water are formed. In reality, combustion processes are seldom complete. The major source of PAHs discharged to the atmosphere is motor vehicles [12]. Other sources are industry, combustion of waste products, open fires, cooking, heating with wood, forest fires and volcanic eruptions. PAH compounds bind to particles when exhaust gas or smoke cools. They condense from the gas phase and adsorb onto particle surfaces [13]. Organic pollutants adsorbed onto particles can be transported in the atmosphere far from their source. PAHs found in Alaska, northern Norway and the national parks of the United States have been transported by air from distant industrialised areas. The distance the compounds are transported is dependent on how long they remain in the air and on their degradation and transformation due to chemical and photochemical reactions. PAHs bound to particles are more stabile than those in gas phase [14]. Particles in air containing PAHs enter the water or soil with rain. In water bodies PAHs tend to bind to sediments. PAHs are not carcinogenic or mutagenic as such but their metabolites bind to deoxyribonucleic acid (DNA) in cells and have a mutagenic or carcinogenic impact [15]. The carcinogenicity and mutagenicity of a molecule are dependent on its structure, which determines its behaviour and possible inteference with biochemical reactions in cells. Mutagenicity refers to the ability to cause mutations, or changes in the genome. A mutation occurs when certain molecules bind to the DNA of a cell and disturb the duplication of the DNA during cell division. Cancerous growth occurs as a consequence of disturbed cell division and, accordingly, many mutagenic compounds are also carcinogenic. Benz[a]anthracene is typically included among carcinogenic PAH compounds.

17
In this research, 16 priority PAHs defined by the Environmental Protection Agency (EPA) were of interest. The molar masses of PAHs are typically in the range 130–300. The solubility of the smallest PAHs (e.g. naphthalene) in water is at µg/ml level, but for the larger PAHs the water solubility is poor. The vapour pressures of the compounds at ambient temperature are low. Values of the octanol–water partition coefficients, logKOW, are in the range 3–7 (lowest naphthalene, highest dibenz[a,h]anthracene) [11]. 3.3. Pesticides
A pesticide is any substance or mixture of substances intended for preventing, destroying or repelling pests. The term pesticide applies to insecticides, herbicides, fungicides and various other substances used to control pests [16-19]. A pesticide is also any substance or mixture of substances intended for use as a plant regulator, defoliant or desiccant. Pests are living organisms that occur where they are not wanted or that cause damage to crops, humans or other animals. Examples are insects, mice and other animals, weeds, fungi and microorganisms such as bacteria and viruses. The hydrophilicity or lipophilicity of a pesticide has an impact on how it penetrates cell membranes and other barriers in the target. If effects in both hydrophilic and lipophilic areas of the target are required the pesticide can be dissolved into suitable transporter or solvent.
Pesticides include many chemically diverse groups, such as organophophorus compounds, chlorinated hydrocarbons, carbamates, pyrethrins and pyrethrinoids, and phenoxyacids [18]. The physico-chemical properties of pesticides affect their distribution, transport in air or water, absorbance onto particles or organisms, and toxicity. Pesticides affect their target by different mechanisms [17,18]. Some chlorinated pesticides affect the nervous system and disturb signal transport. Organophosphorus compounds, on the other hand, disturb the function of acetylcholine esterase, a transmitter in the nervous system. Carbamates are designed to cause intoxication, where acetylcholine accumulates in the nervous system causing the target animal to become overactive. Convulsions ensue, then paralysis and eventually death. Some systemic fungicides that are transported with water interfere with the formation of DNA by preventing protein synthesis, and in that way also the normal growth of the target fungi. Phenoxyherbicides affect the formation of auxine hormone in weeds and stop their growth. Most pesticides represent some risk of harm to humans, animals or the environment since they are designed to kill or otherwise adversely affect living organisms [16,19]. Information on the direct impact of pesticides on human health is mainly obtained from accidents or intentional misuse. Very little is known about the amounts needed to cause foetal deformities, cancer and disorders of the genome. Different modes of action in humans are, for example, chronic toxicity caused by long use of small amounts of pesticides. Symptoms of chronic toxicity usually appear in liver and kidneys. Some previously used pesticides, for example amitrol and nitrofen, have been shown to cause cancer. Nowadays the use of these chemicals is banned. Some fungicides have proven to be
18
mutagenic. Mutagenicity and carcinogenicity are often strongly related. Also teratogenic effects of pesticides have been studied. The major concern has been dioxins, which are now banned for pesticide use. For the pesticides studied in this research (listed in EU drinking water regulation), the molar masses are in the range 200–430. All are soluble in water, the solubility ranging from 0.078 for tetradifon to 678 µg/ml for metoxuron. The vapour pressures of the compounds at ambient temperature are low. The octanol–water partition coefficients, logKOW, range from 1.9 for metoxuron to 4.6 for tetradifon. 4. Pretreatment and analysis of solid and liquid samples Organic compounds in solid and liquid environmental samples have to be extracted from the matrix before analysis. There are various alternatives for performing extractions, but methods where the consumption of organic solvent is minimised are preferred. 4.1. Pretreatment of solid samples In solid samples such as soil and sediment the analytes tend to be tightly bound to the matrix and long extraction times are required. The analyte must first be desorbed from its original binding site in the sample matrix and then eluted from the sample. Traditionally the pretreatment of solid soil and sediment samples has been carried out by solid–liquid extraction, Soxhlet extraction or refluxing. Even though the equipment needed for these techniques is simple, many problems are encountered. The extraction may be time-consuming (Soxhlet as much as 24 h), large volumes of organic solvents are consumed and usually part of the solvent must be evaporated to concentrate the sample. Also selectivity is relatively poor. The automation of these traditional techniques is often demanding. On the other hand, the extractions can be carried out in parallel to make them more time-efficient. Soxhlet extraction is highly reliable and is useful as a benchmark technique in studying the extraction efficiencies of other techniques. With the traditional extraction techniques, the extract usually has to be concentrated and cleaned before analysis. A sample extracted in a large volume of organic solvent is typically concentrated with nitrogen flow and filtered before injection to the analytical instrument. Where necessary, extracts can be cleaned by solid-phase extraction or column liquid chromatography. Many new and effective techniques have been developed for the pretreatment of solid samples. These include supercritical fluid extraction (SFE), pressurised liquid extraction (PLE, also called accelerated solvent extraction, ASE) and a type of PLE, pressurised hot water extraction (PHWE). Among the advantages of these methods are the lower consumption of organic solvents compared with the traditional methods, the simple tuning of the selectivity of the SFE and PHWE methods, and the possibility for automation.

19
Many relatively hydrophobic organic pollutants, such as BFRs and PAHs, become tightly bound to soil or sediment particles when released to the environment. Extraction of these compounds from the matrix requires effective methods. Both Soxhlet extraction [20,21] and newer methods such as SFE [20-26], PLE with toluene [20,26,27] and PHWE [20,28-31, II-IV] have been applied for PAHs in soil and sediment. Brominated flame retardants in sediments have typically been extracted by solid–liquid extraction [32-35] or Soxhlet extraction [36]. SFE and PHWE are also suitable for the extraction of BFRs from solid samples (I). Relative to the traditional extraction procedures, the sample preparation is faster and more environmentally friendly by SFE and PHWE [37,38]. 4.2. Pretreatment of liquid samples Handling of liquid samples is in several respects easier than that of solid samples. The analytes are already in liquid phase and they do not have to be desorbed from binding sites in the matrix. The most widely used sample preparation method for liquid (aqueous) samples is liquid–liquid extraction (LLE) [39], a method that has remained virtually unchanged during the past hundred years. LLE relies on the relative solubility, diffusion, partitioning, viscosity and surface tension of the analyte(s) and the solvent. This classical extraction technique has its advantages, such as efficiency, but it tends to be laborious and time-consuming and to require large amounts of solvent. Another method widely used in the pretreatment of liquid samples is solid-phase extraction (SPE). Membrane extraction techniques have developed rapidly in recent years in some cases now challenging liquid–liquid extraction (LLE) and solid-phase extraction (SPE) for the pretreatment of liquid samples [55]. Liquid–liquid extraction is still a widely used method in pharmaceutical and biological analysis [111]. Many of the standard methods of the Environmental Protection Agency (EPA) are based on it. LLE requires large amounts of often expensive and environmentally harmful organic solvents, however, and the solvents usually must be concentrated by evaporation before analysis. Automation of this extraction technique is rather difficult and problems such as emulsion formation and precipitation are often encountered. Solid-phase extraction competes with LLE for title of the most popular extraction method for liquid samples [112]. In SPE, the analytes are trapped by letting the liquid sample flow through the SPE sorbent. The trap is then flushed and the analytes are eluted from the trap with organic solvent, water or a buffer solution. Advantages of SPE over LLE are the smaller amounts of organic solvents employed, the minimal manual work and the availability of automated equipment. The selectivity of SPE is usually worse than that of LLE, on the other hand, and problems may occur because of the poor retention of polar compounds into the solid-phase sorbent. In addition to LLE and SPE, solid-phase microextraction (SPME) [40], stir-bar sorptive extraction (SBSE) [41-43], exhaustive solvent extraction [44], automated Soxhlet extraction and supercritical fluid extraction [45] and microwave-assisted extraction [46] have been used in the pretreatment of liquid sample matrices containing organic pollutants, such as pesticides. In the pretreatment of

20
liquid samples, membrane extraction techniques [47-56] such as supported liquid membrane with flat sheet [57,58] or hollow fibre units [59], microporous membrane liquid–liquid extraction [60,61] and liquid-phase microextraction [62-64] have been under intensive study. The advantages of these relatively new extraction methods over LLE and SPE are the lower solvent consumption and the possibility of on-line coupling to analytical instruments. In the membrane extraction techniques the sample is also cleaned during the extraction step. The membrane techniques are described in Chapter 6. 4.3. Analytical techniques Liquid and solid samples extracted into organic solvent are usually analysed by LC or GC [3]. LC is selected if the analytes are polar, thermally labile or have high molecular mass. Otherwise GC is preferred because of better resolution. Most of the extraction techniques can be connected on-line with analytical techniques. For example, SFE and PHWE have been coupled on-line to GC and LC-GC [28, 65-67] and membrane extraction techniques to both LC and GC [53,55,68]. Detection in GC can be achieved with Fourier transform infrared spectrometry (FT-IR), atomic emission detection (AED) or the more common electron capture detector (ECD), FID or MS [20,27]. The most widely used detection methods for LC are UV and different types of MS. 5. Pressurised hot water extraction Pressurised hot water extraction (PHWE) and membrane extraction are the extraction methods of interest in this work. PHWE, which is actually a form of pressurised liquid extraction (PLE), was first introduced in 1994 [69]. Earlier, hot water (50-100°C) had been used for the extraction of organic compounds from solid matrices. Although PHWE is now well-known, commercial equipment is not yet available. Other terms for PHWE include subcritical water extraction, superheated water extraction, extraction using hot compressed water, extraction with water at elevated temperatures and pressures, and high temperature water extraction [70-74]. PHWE is usually performed in dynamic mode with water flowing constantly through the sample. The extracted analytes are collected into organic solvent or a solid-phase trap. Also other trapping methods have recently been developed (Section 5.3.1.). It is important that the target compounds dissolve in the extraction solvent. In the solvation process, solvent molecules force their way between the solute molecules and form a layer around them. The interactions are established between the solute molecules are interupted and at the same time new interactions between the solute and solvent molecules. Factors affecting the solvation process are the solubility (δ), dipole moment (µ), polarity (α), formation of hydrogen bonds and the sizes of the solute and solvent molecules. In PHWE, where water is the solvent, the main intermolecular interactions affecting the solvation process are induction, dispersion, ionic interactions and the formation of dipole-dipole and hydrogen bonds [75].

21
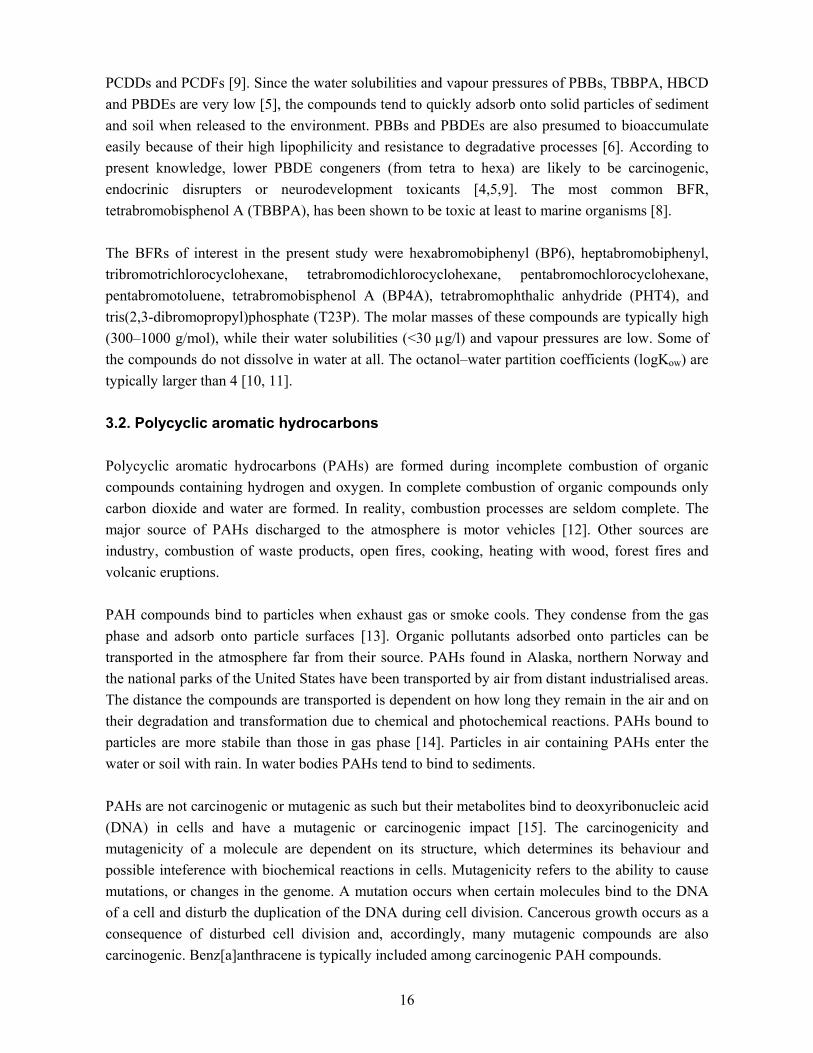
5.1. Factors affecting the extraction Factors affecting pressurised hot water extraction are temperature, pressure and flow-rate. The properties of the matrix and the analytes also affect the extraction. The selectivity of the extraction can be tuned by change in temperature and pressure and by the choice of an appropriate trapping method for the analytes. The analytes are first desorbed from their binding sites in the matrix and then eluted from the sample. The desorption is generally determined by rate processes such as diffusion (D), while the elution is modelled by the thermodynamic partitioning coefficient (KD). Extraction mechanisms and the effect of flow-rate have been investigated by extracting essential oil from savory and PAHs from soil with pressurised hot water [76]. With extraction curves for different solvent flow-rates it was demonstrated that the thermodynamic elution of the analytes from the matrix is the prevailing mechanism since extraction rates increased proportionally with the hot water flow-rate. For SFE, by contrast, the extraction showed only minimal dependence on flow-rate and the process is mainly controlled by the kinetics of the desorption from the matrix. 5.1.1. Temperature Of the factors affecting PHWE, temperature has the greatest effect. The extraction speed, efficiency and selectivity are affected simply by adjusting the temperature. High temperature changes the solvation properties of water significantly. At ambient pressure and temperature, water is suitable for the extraction of polar analytes, but near its supercritical point (TC=374°C, PC=221 bar) it is an excellent solvent for non-polar analytes [77]. As an example, the solubility of naphthalene as a function of temperature is presented in Fig. 1. The higher vapour pressures and the accelerated thermal desorption of the analytes are other factors increasing the extraction yield. The ionic, hydrogen bond and dipole–dipole interactions between the water molecules decrease with increasing temperature, though hydrogen bonding of some degree is still present in supercritical water [75]. The change in the polarity of water is evident in the value of relative permittivity (ε): at ambient temperature (20°C) the value is 80.1, but at temperatures above 300°C it falls below ten. In theory, then, very high extraction temperatures could be recommended for the extraction of non-polar analytes. In practice, several factors limit the maximum temperature. Too high a temperature can cause corrosion in the extraction system, decomposition of the target compounds and other possible reactions [78]. Also at high temperatures, more impurities are extracted. In addition, the equipment is more likely to leak at very high temperatures. For polar compounds relatively low extraction temperatures are recommended (100–150°C), whereas for moderately and low-polar analytes temperatures of 200–300°C are preferred [79,80]. Class-selective extraction can be obtained with temperature programming [79,81].
22
5.1.2. Pressure Pressure has less effect than temperature on the relative permittivity and solvating properties of water. The value of the relative permittivity increases only slightly with pressure. Usually the pressure is increased sufficiently to keep the water in a liquid state at the chosen extraction temperature. If extraction with steam is preferred, the pressure should be kept low. The extraction of non-polar compounds is more effective and more repeatable with steam than liquid water at the same temperature [82-85]. The better efficiency is achieved because of the lower relative permittivity of steam, and the better repeatability is probably due to the more uniform flow of the steam through the sample [75].
Figure 1. The solubility of naphthalene in water as a function of temperature [77]. 5.1.3. Flow-rate It has been demonstrated [69,81] that extraction efficiency for hydrophobic analytes increases with flow-rate up to some 1.1 ml/min. The effect of the flow-rate on the recovery depends on the compounds. For example, for low-molecular-mass PAHs (up to phenanthrene and anthracene, <178 g/mol) the same recovery can be obtained with the flow-rates 0.3, 0.7 and 1.0 ml/min, but for high-molecular-mass PAHs (>178 g/mol) the increase in the recovery with flow-rate is substantial [69]. With low-molecular-mass PAHs the extraction is not limited by the solubility of the compounds, whereas with high-molecular-mass PAHs higher solubility conditions may increase the extraction rates.
0
50
100
150
200
250
20 30 40 50 60 70 80T (°C)
S ( µ
g/m
l)

23
5.2. Selectivity The solvating properties of water and accordingly also the selectivity of pressurised hot water extraction are mainly controlled by temperature. For example, the solubility of alkanes in water increases rapidly with temperature, whereas the solubility of inorganic compounds decreases. Compounds of different polarity can therefore be selectively extracted through use of different extraction temperatures [81]. If the target compounds are thermally stabile, class-selective extraction can be carried out by increasing the temperature and letting the more thermolabile compounds in the sample degrade [71,86]. Selectivity can also be enhanced by using special solid-phase sorbents for the trapping of the analytes or through choice of suitable trapping solvent. Ethanol can be added as polar modifier to enhance the extraction [87]. Approaches in which sodium dodecyl sulfate (SDS) [88] or acidified water is added have also been demonstrated [89,90]. The use of acidified water as extractant may cause corrosion, however [91]. 5.3. Equipment and trapping No commercial PHWE equipment is available yet, and the equipment usually has to be self-built or modified from other equipment. The equipment is similar to that used in supercritical fluid extraction (SFE) and pressurised liquid extraction (PLE) but differs in that it has to tolerate temperatures sometimes over 300°C. Usually PHWE is carried out in dynamic mode with water constantly flowing. The equipment consists of a high-pressure pump for water, an extraction vessel made of stainless steel, an oven for heating the vessel, a cooling capillary, a pressure restrictor and a sample collection system. The PHW extract is usually collected in a solid-phase trap or in organic solvent followed by liquid–liquid extraction [69,83,84,92]. If the analytes are trapped in a solid-phase trap an extra pump is needed for the elution of the sorbent [82,86,92]. In addition, nitrogen is needed to dry the sorbent after extraction. Elution is carried out with a small volume of organic solvent after drying of the trap. An alternative trapping system, used in this research (II-IV), is microporous membrane liquid–liquid extraction where analytes are trapped into organic solvent after passing through a porous hydrophobic membrane. The mechanism is liquid–liquid extraction and the technique is discussed in more detail in Chapter 6. Solid-phase microextraction (SPME) [93,94] and stirbar sorptive extraction (SBSE) [95] are also suitable for trapping in PHWE. In addition, PHWE can be connected on-line to chromatographic techniques. On-line coupling to LC [96], LC–GC [28, I] and GC via membrane trapping (II, III) has succeeded well. PHWE has also been coupled to superheated water chromatography (SWC) via trapping to an SP trap packed with polystyrene–divinylbenzene [97].

24
5.4. Applications Most applications of pressurised hot water extraction involve the pretreatment of solid samples. The most important areas of application are the extraction of organic pollutants from soil and sediment and the extraction of aromatic compounds from herbs and other plants. PHWE has been applied, for example, to the extraction of PCBs [83,92], PAHs [30,82,84,88], pesticides [98] and fungicides and herbicides [99-101] from soil and sediment. Aromatic compounds have been extracted from rosemary [71, 102], marjoram [103], oregano [104], sage [105] and clove [86] and iridoid glycosides [106] and kava lactones have been extracted from kava root [107]. Among agricultural products, chlorinated pesticides and chlorobenzenes have been extracted from fruit and vegetables [41] and ethanol-modified pressurised hot water has been used in the extraction of atrazine from beef kidney [87] and avoparcin (antibiotic) from swine kidney [108]. Berberine, baicalein and glycyrrhizin have been extracted from medicinal plants [109] and cholesterol has been extracted from solid foods such as biscuits, chips, cereals, bread, sweets and egg [110]. Among inorganic compounds, cadmium and lead have been extracted from plant materials with acidified pressurised hot water and analysed by electrothermal atomic absorption spectrometry [90]. In all these applications the extraction temperature was in the range 175–300°C and the pressure ranged from 20 to 400 atm. The flow-rate of water was typically 1 ml/min and the extraction time typically 15–30 minutes. 6. Membrane extraction Various membrane extraction techniques are coming to rival LLE and SPE in the pretreatment of liquid samples [48-56]. These techniques have some clear advantages such as good selectivity and concentration and ease of automation. Membrane extraction techniques are either porous or non-porous techniques. It should be noted, however, that the membrane itself may be porous in the non-porous techniques. The division into porous and non-porous techniques is based on the application of the membrane, not on the actual porosity. Figure 2 shows the membrane processes classified according to the pore size of the membrane [47]. For example, microfiltration membranes are used in supported liquid membrane (SLM) and microporous membrane liquid–liquid extraction techniques, whereas ultrafiltration membranes are applied in dialysis. In all the membrane extraction techniques the membrane separates the donor and the acceptor solvents from each other and the molecules diffuse through the membrane from the donor solution to the acceptor solvent. The usual aim in membrane extraction is to transfer the largest possible amount of analyte from the donor side to the acceptor. To enhance the recovery, the acceptor solvent may flow so as to assist the transfer of the extracted analytes from the membrane to the acceptor solution. In some cases chemical reactions can be exploited in the trapping of the analytes in the acceptor solvent. A marked improvement in the extraction is easily achieved if the partition coefficient of the analyte between the donor and acceptor solvent is large.

25
Figure 2. Pore sizes in different membrane processes: 1) reversed osmosis, 2) ultrafiltration, 3) microfiltration, 4) traditional filtration [47]. 6.1. Porous and non-porous membrane techniques Characteristics of different membrane techniques are presented in Table 1. In porous membrane techniques [55], the donor and acceptor solvents are in physical interaction through the membrane pores. These systems are called one-phase systems, even though the compositions of the donor and acceptor solvents may be totally different. A good example of one-phase systems is an automated dialysis technique for sample preparation, ASTED (Automated Sequential Trace Enrichment of Dialysates) [113]. Another example is filtration. The emphasis of the present study was on the non-porous membrane techniques. In non-porous membrane techniques, polymeric materials or solvents within the pores of polymeric materials separate the donor and acceptor solvents from each other. Typically in non-porous membrane extraction techniques the membrane forms its own phase between the donor and acceptor solvents. Then a two- or a three-phase system is formed. A two-phase system is formed if the membrane pores are filled with the acceptor solvent. The most important application of the two-phase systems is microporous membrane liquid–liquid extraction (MMLLE) [48-56]. This technique, which was of interest in the present work will be discussed in detail in Section 6.2. In three-phase systems, two different solvent phases are located on either side of the membrane, which forms the third phase. Two different extractions can be carried out with this system, from the donor to the membrane (or solvent in the pores) and from the membrane (solvent) to the acceptor. In that way good selectivity can be achieved. Examples of three-phase systems are extractions based on supported liquid membrane (SLM) [114-118], emulsion liquid membrane (ELM) [119] and polymeric liquid membrane (PLM) [120], for example silicone rubber. Other examples are membrane extraction with sorbent interface (MESI) [121], membrane inlet mass spectrometry (MIMS) [122] and the use of gas-diffusion membranes in flow-injection analysis [123,124].
0.1 nm 1 nm 10 nm 100 nm 1 µm 10 µm 100 µm
12
34

26
Table 1. Comparison of the donor, acceptor and membrane phases used in different membrane techniques. The first five techniques are three-phase systems, MMLLE is a two-phase system and dialysis in a one-phase system. The applications are described for organic analytes [55,125]. Technique Membrane phase Donor phase Acceptor phase Application SLM Porous membrane
impregnated with organic solvent
Aqueous Aqueous (t) Charged analytes
PME Polymeric Aq./Org. Aq. (t) / Org. Charged or uncharged analytes, also gaseous samples
MESI Polymeric Aq./Org./Gas Gas / Sorbent Volatiles MIMS Polymeric Aq./Org./Gas Vacuum Volatiles Gas-diffusion Air in the membrane pores Aqueous Aqueous Gaseous analytes, e.g.
ammonia MMLLE Porous membrane
impregnated with organic solvent
Aqueous Organic solvent Relatively non-polar, uncharged analytes
Dialysis Porous membrane Aqueous Aqueous Separation of large molecules e.g. proteins
(t) = trapping reaction (analyte molecules are kept in the acceptor phase, e.g. by creation of a charged ion => back-extraction into the membrane prevented)
6.2. Microporous membrane liquid–liquid extraction The two-phase system where a porous membrane separates the donor and acceptor solvents is generally called microporous membrane liquid–liquid extraction (MMLLE), but also membrane assisted solvent extraction (MASE), membrane based solvent extraction (MBSE) and membrane based solvent stripping (MBSS) [55]. The technique was first introduced by Sahleström and Karlberg in 1986 [126], but wider interest had to wait until the late 1990s. In MMLLE the membrane pores are impregnated with the acceptor solvent and the analytes are usually extracted from aqueous donor phase through the membrane pores to organic acceptor phase. An opposite set-up can be applied as well. In the set-ups employing flat sheet membranes, channels are grooved in the membrane block for the donor and acceptor solvents on either side of the membrane. The blocks are either round or square. The volumes of the channels are typically 10–500 µl. It is also possible to use hollow fibre membranes in MMLLE. The extract volume then depends on the number, length and i.d. of the fibres. Common extraction devices for different applications are presented in Fig. 3. Many of the problems encountered in classical continuous liquid–liquid extraction, such as emulsion formation, the need for phase separators and segmentors and the need for large solvent volumes, are avoided by placing a membrane barrier between the solvents as in MMLLE. Additional advantages of MMLLE are savings in time, environmental friendliness and the possibility for automation and on-line coupling with analytical devices [52,68]. Since the extraction is usually made from aqueous to organic phase, coupling of MMLLE to GC or normal-phase LC is simple. In theory, it should also be possible to use hydrophilic membranes, in which the pores are filled with aqueous solvent. This set-up has not yet been studied [55].

27
Figure 3. Typical membrane extraction devices: a hollow-fibre unit and square and round blocks with flat sheet membranes. 6.2.1. Factors affecting the extraction The main factors affecting liquid–liquid extraction are the solvents, pH, partition coefficients of the analytes between the selected solvents and temperature. Additional factors are the pore size of the membrane, the donor and acceptor flow-rates, the pore size distribution and the form and geometry of the pores. Near the membrane surface, the donor and acceptor solvents are in direct interaction with each other and the mass transfer occurs at the surface of the membrane. In equilibrium, the extraction is based on liquid–liquid extraction and is dependent on the partition coefficients of the analytes between aqueous and organic phases. If the partition coefficients are large enough, a sufficient concentration into very small volume is obtained with a stagnant acceptor phase. When partition coefficients are smaller, a flowing acceptor may be used to transport the extracted analytes away and maintain the diffusion through the membrane [55]. Factors affecting the partition coefficient are temperature and the solvents. The partition coefficient K can be expressed as follows [127]:
∆−=
=
RTcc
K i
eqi
i0
expµ
β
α
(1),
Acceptor OUT
Aqueous sample
Polypropylenehollow fibres
IN
OUTAcceptor IN
Steel blockPeek block
PTFE block
MembraneGroove
Steel block
Donor IN Donor OUT
Acceptor OUT
PUMP 1
PUMP 2
Waste
GC
Donorchannel
Acceptorchannel Porous membrane
Membrane blocks
Sample IN Sample OUT
Acceptor IN Acceptor OUT
Acceptor OUT
Aqueous sample
Polypropylenehollow fibres
IN
OUTAcceptor IN
Steel blockPeek block
PTFE block
MembraneGroove
Steel block
Donor IN Donor OUT
Acceptor OUT
PUMP 1
PUMP 2
Waste
GC
Donorchannel
Acceptorchannel Porous membrane
Membrane blocks
Sample IN Sample OUT
Acceptor IN Acceptor OUT

28
where ci
α = analyte concentration in phase α, ciβ = analyte concentration in phase β, ∆µi
0 = µi0β-µi
0α (µi
0β and µi0α are the standard chemical potentials in phases β and α, respectively), µi = chemical
potential, R = gas constant and T = temperature [K]. In a non-equilibrium system (e.g. high flow-rate in MMLLE), not only the partition coefficient but other factors, such as diffusion and membrane pore size, affect the mass transfer and thereby the extraction yield. The diffusion coefficient, for its part, is affected by the analytes and their properties as well as by temperature and viscosity. Diffusion (D) can be expressed with the help of the Stokes–Einstein equation [128]:
aNRT
akTD
Aπηπη 66== (2),
where k = Boltzmann constant, η = viscosity, NA = Avogadro constant and a = hydrodynamic radius. The best theoretical extraction efficiency (E) in MMLLE is achieved when the donor flow-rate approaches zero [52]. In practice, however, it may be more relevant to maximise the enrichment factor Ee instead of the extraction efficiency. In this way, larger instrumental signals and more time-efficient analyses are obtained. With stagnant acceptor phase the maximum enrichment factor is as large as the partition coefficient K. With flowing acceptor phase the enrichment factor can be expressed as [61]
D
Ae
FF
K
E+
=1
1 (3),
where FA is the volume flow-rate of the acceptor phase and FD is the volume flow-rate of the donor phase. Increased flow-rate leads to decreased extraction efficiency, but this is compensated by the increased amount of analyte being delivered to the system. In optimisation of the flow-rate, also the amount of sample available should be considered. A large volume of the sample is consumed with high donor flow-rates, so that with limited sample amount available it may be wiser to use low flow-rates and maximise the extraction efficiency. 6.2.2. Applications MMLLE is best suited for the extraction of non-polar and uncharged compounds. If the compounds are charged, adjustment of pH can be used to advantage. MMLLE technique has been applied to the extraction of biological and environmental samples. Biological applications include the extraction

29
of organophosphate esters [60,129], BTEX [130] and local anaesthetics [60] from blood plasma, while notable environmental applications are the determination of organotin compounds [131] and cationic [132] and anionic [133] surfactants and the extraction of pesticides thiophanate-methyl [134,135] and vinclozolin [136] in water. Other pesticide applications include the determination of sulphonyl urea herbicides by MMLLE combined with capillary electrophoresis [137]. Various pesticides have also been determined in wine by MMLLE off-line with GC [138]. The membrane applied was PTFE or polypropylene. The acceptor solvents were hexane, isooctane, chlorobutane, cyclopentane, n-octanol, MTBE–hexane, cyclohexane, toluene and chloroform. The analysis was carried out by LC or GC. MMLLE has been coupled on-line to GC [61, Papers II, III and VI] as well as to LC [132,134,136]. In addition, coupling to multidimensional liquid chromatography has been carried out in the analysis of pyrolysis oils [139]. 7. Injection and solvent evaporation in gas chromatography Gas chromatography (GC) is perhaps the most common method for the analysis of organic compounds. The first GC injection techniques to be employed were vaporising techniques such as split and splitless injection. With these traditional techniques still much in use, only 1-2 µl of sample can be injected to the gas chromatograph. Today, with the development of on-column [140,141] and programmable temperature vaporiser [142-145] techniques, it is possible to inject large volumes or even whole extracts of pretreated samples to GC. These newer techniques also make it possible to combine liquid chromatography and gas chromatography on-line [146-148]. Large volume injection with an on-column injector was used in the present research. 7.1. Large volume injection There are three main objectives in applications of large volume injection (LVI) in gas chromatography. The first is to improve the sensitivity of the analytical technique by an increase in the amount of the analytes injected. The second is to simplify the sample pretreatment and the third is to achieve on-line coupling of GC with sample-preparation systems or other separation techniques [147]. Large volume injection makes it possible to introduce up to several hundred microlitres or even millilitres of sample to GC. Large sample volumes are introduced by on-column injection, loop-type injection and programmable temperature vaporisation (PTV) [147]. The same methods can also be applied in on-line transfer from liquid chromatograph (LC) to gas chromatograph (GC). In all LVI methods the sample is introduced, then the solvent is evaporated and after that a solvent–analyte separation occurs. Before separation, a large volume of solvent vapour has to be eliminated, for example via a solvent vapour exit (SVE) [147,148]. The focus in my research was on on-column injection/transfer, which is the preferred method if the samples are relatively clean [149]. Thus, here only on-column injection is discussed in detail. Information on loop-type and PTV methods can be found in Refs. 142, 147-149 and 150-155. The principles of on-column injection are the same as for on-column transfer from LC to GC (I) except that in extraction–analysis coupling the sample is

30
eluted to a loop in the injection valve, while in LC–GC a suitable fraction is transferred directly from LC to GC via an on-column injector. More information on the principles of LC–GC and other transfer/injection alternatives can be found in Refs. 156-163. 7.2. On-column injection/transfer On-column injection was introduced in the late seventies in response to the many problems encountered in vaporising injection. Two methods were published in 1977 [164] describing on-column injection of liquid samples into standard size capillaries. Slightly later an on-column injector was constructed, adapted for the use of syringes with thin-walled needles of an outer diameter fitting into the bore of standard capillary columns [165]. In 1981 the “flooding effect” or “band broadening in space” was described [166], when the effects of flowing sample liquid in a GC column were recognised. That created the basis for the study of solvent effects. Study began in 1981 on uncoated precolumns or retention gaps, for the reconcentration of solute bands broadened in space [167]. It was soon realised that retention gaps could also be used as guard columns and long retention gaps made it possible to introduce up to several hundred microlitres into capillary columns. The possibility of introducing large volumes of liquid sample to GC also made possible the coupling of HPLC and GC in 1984 [168]. The on-column injector is an interface for introducing a liquid sample directly to a gas chromatographic column. The injector is presented in Fig. 4. In LVI systems, a precolumn is usually connected to the injector. Solvent–analyte separation takes place in the precolumn, before the analytes are transferred to the analytical column. The on-column injection of hundreds of microlitres is generally carried out in conditions allowing partially concurrent solvent evaporation (PCSE) [162,169]. PCSE and other solvent evaporation techniques are discussed in more detail in the next section.
Figure 4. On-column injector for large volume injection/transfer. The injection can be made with a syringe or with the help of a pump [170].
Carrier gasGC
ColumnColumnSolvent film
faasiton esikolonni
jäte
Pump
siirtoventtiili
Retention gap
Waste
Injection valve
Carrier gasGC
ColumnColumnSolvent film
faasiton esikolonni
jäte
Pump
siirtoventtiili
Retention gap
Waste
Injection valve
faasiton esikolonni
jäte
Pump
siirtoventtiili
Retention gap
Waste
Injection valve
Retention gap
Waste
Injection valve

31
7.3. Solvent evaporation In large volume injection to GC most of the solvent must be evaporated before the separation of the analytes. The choice of the solvent evaporation technique has an important effect on the analysis. Critical parameters in the injection or transfer of solvent to GC are injection speed, solvent properties, oven temperature, carrier gas pressure, eluent flow-rate, injected sample volume and the applied injection technique. The evaporation techniques can be divided into five groups: conventional retention gap techniques [171], partially concurrent solvent evaporation (PCSE) [169,171], fully concurrent solvent evaporation (FCSE) [172], concurrent solvent evaporation with co-solvent trapping [172-174] and solvent evaporation with PTV [175]. The first two techniques are retention gap techniques and the next two fully concurrent solvent evaporation techniques. The retention gap techniques are usually applied with on-column injection or transfer, whereas the FCSE techniques are mainly used with loop-type interfacing to GC. The evaporation in PTV can be performed in several ways [142]. The retention gap techniques and FCSE techniques, which were used in this work, are discussed in the following. 7.3.1. Retention gap techniques Retention gap techniques [176] include the conventional retention gap technique and partially concurrent solvent evaporation. In both the sample is injected at a temperature below the solvent boiling point. Either an uncoated precolumn (retention gap) or a combination of an uncoated and a coated precolumn (retaining precolumn) is used. A carrier gas flow is required during the injection and solvent evaporation. The retention gap techniques are thus especially suitable for on-column injection/transfer. Retention gap techniques can also be combined with certain types of PTV injection. In on-column injection, solvent effects can be used to advantage: the liquid film concentrates the volatile analytes and it evaporates from the rear to the front. Less volatile analytes are refocused by phase-ratio focusing. A special feature of the retention gap techniques is the potential for solvent trapping of the analytes in which the solvent formed on the column walls retains and separates the analytes [177,178]. When a sample is introduced to a precolumn at oven temperature, below the boiling point of the solvent, it forms a solvent plug at the mouth of the column. (Fig. 5 A). The length of the plug depends on the volume injected and the internal diameter of the column. The solvent plug moves in the column, pushed by the carrier gas flow, and a thin solvent film is formed on the column walls. If the solvent is capable of wetting the column surface, it eventually forms a smooth film. The length of the solvent film depends on the injected volume, temperature and gas flow and on solvent properties such as surface tension, viscosity and density. The solvent begins to evaporate from the rear (Fig. 5 B). When the conditions have been carefully optimised the solvent cannot evaporate from the front because the carrier gas has already been saturated with the solvent molecules at the start of the evaporation. As compounds are evaporated they are retained in the solvent trap (Fig. 5 C) and are released only after the whole solvent film has evaporated (Fig. 5 D). At the end of the evaporation

32
the volatile analytes are concentrated into a narrow band whereas the less volatile compounds have been spread with the liquid film throughout the column (Fig. 5 E). Three comprehensive articles about solvent effects with large volume injection were published in 1998-1999 [179-181].
Figure 5. Formation of solvent trapping effect [170].
7.3.1.1. Conventional retention gap technique In the conventional retention gap technique the GC oven temperature is kept clearly below the solvent boiling point in prevailing pressure to allow the formation of a mechanically stabile solvent film on the walls of the uncoated precolumn. The evaporation of solvent begins from rear to front of the precolumn only after the whole sample fraction has been injected or transferred. In this technique, solvent trapping is thus used for the concentration of volatile compounds [178]. The advantages and disadvantages of the conventional retention gap technique are presented in Table 2. 7.3.1.2. Partially concurrent solvent evaporation With partially concurrent solvent evaporation (PCSE) [169,171], large sample volumes can be injected or shorter precolumns than in conventional retention gap technique can be applied. The sample is injected at a rate slightly above the solvent evaporation rate. In PCSE, most of the solvent is evaporated during the transfer to GC and only a small part forms the liquid film on the precolumn walls. Column temperature is kept slightly below the solvent boiling point at the carrier gas inlet pressure to ensure the sample liquid flow from the injector into the column, and prevent back-flow
haihtuva analyyttihuonosti haihtuva analyytti
kantajakaasu
A
B
C
D
E
carrier gas volatile analyte less volatile analyte

33
to the injector and gas lines [177]. The aim is to inject the sample at a temperature as near as possible to the solvent boiling point to keep the length of the solvent film short and to increase the evaporation rate. PCSE is more efficient than the conventional retention gap technique and is better suited for the on-line coupling of LC with GC. However, the optimisation of the transfer conditions is more demanding. Table 2 presents the advantages and disadvantages of PCSE. 7.3.2. Fully concurrent solvent evaporation In fully concurrent solvent evaporation (FCSE) the GC oven temperature is kept above the solvent boiling point at the prevailing pressure [172]. The solvent evaporates totally during the transfer to GC and, accordingly, short precolumns can be used. FCSE is suitable for the injection or transfer of large sample volumes. No solvent film is formed and volatile analytes evaporate with the solvent. The technique is not suitable for analytes with low boiling points and vapour pressures. FCSE is usually applied with the loop-type interface but it can also be used with on-column injection or transfer. The advantages and disadvantages of FSCE are noted in Table 2. 7.3.3. Comparison of evaporation techniques The characteristics of retention gap techniques and fully concurrent solvent evaporation methods are presented in Table 2. Evaporation with PTV is not included. As can be seen in the table, the conventional retention gap technique and partially concurrent solvent evaporation are best for volatile compounds, while fully concurrent solvent evaporation technique is the best option for less volatile analytes. Table 2. Comparison of the evaporation techniques applied in on-column large volume injection to GC (PTV not included). Evaporation Advantages Disadvantages Conventional retention gap technique
• Sharp peaks for the volatiles • Very long retention gaps (>10 m) • Less volatile compounds spread to
broad zones PCSE • Evaporation faster than in
conventional ret. gap. technique • Sharp peaks for the volatiles
• Long retention gaps (~10 m)
• Optimisation demanding FCSE • Simple optimisation
• Short precolumns (1–4 m) • No solvent trapping for the volatiles:
wide peaks • Suitable for analytes eluted above
some 60–100°C higher than the transfer temperature
7.3.4. Solvent vapour exit Most of the solvent vapour must be removed before analytical separation to protect the detector and to minimise the evaporation time of the solvent. Some solvents do not burn well, switch off the FID or form poisonous gases and their use should be totally avoided [182]. The carrier gas flow-rate and

34
thus also the solvent evaporation rate can be significantly enhanced by using a solvent vapour exit (SVE) mounted between the precolumn and the analytical column. With use of an SVE the evaporation rate can be increased as much as 20–50-fold [182]. If very long (>15 m) precolumns are used the increase in the evaporation rate is about two-fold [182]. The evaporation rate is also affected by the internal diameter of the precolumn: increase in the internal diameter leads to an increase in the gas flow-rate and thereby in the solvent evaporation rate. In retention gap techniques the solvent vapour exit has to be closed before the solvent has fully evaporated. This is important because otherwise the volatile analytes trapped in the solvent film may be lost with the solvent vapours. A retaining precolumn is often used in between the uncoated precolumn and the analytical column. According to earlier research, the role of the retaining precolumn was to prevent the loss of volatile compounds through the SVE. Later it was found that the most important role of the retaining precolumn is in pressure regulation to allow smooth evaporation [183]. The closing time of SVE is not as critical in FCSE as in PCSE since FCSE is not used in the analysis of volatile compounds. 7.4. On-line coupling of extraction techniques to gas chromatography Large volume injection techniques offer straightforward means for on-line coupling of extraction techniques to GC [147]. Basic understanding of solvent effects and large volume on-column injection is a prerequisite, however, for developing such systems. In addition to the on-column injector, also loop type interface [178] and PTV [142] injectors can be used in the coupling. In on-line coupling, when the whole extract is to be transferred to GC, the extract volume should be small, preferably less than 1–2 millilitres. The compatibility of the extraction solvent with GC also has to be considered: volatile and nonpolar solvents are preferred. The advantages achieved with the on-line combinations are minimised manual work and interference, leading to minimised contamination and analyte losses. Many of the on-line systems can also be automated. With the injection of the whole extract to GC increased sensitivity is achieved together with enhanced reliability. Extraction techniques already coupled on-line with GC include SPE, LLE, SFE, various membrane techniques, microwave-assisted extraction (MAE) and sonication-assisted extraction (SAE) [184]. LLE [185-187] and SPE [188-193] coupled on-line with GC have been applied in the analysis of organic pollutants or pharmaceuticals in liquid matrices. SPE was first coupled on-line with GC in 1987 via an on-column interface [193] in the analysis of chlorinated pesticides and PCBs in water samples. In the same year SFE was coupled with GC, also via an on-column interface [194-196]. The first SFE–LC–GC system was introduced by Cortes in 1991 for the analysis of grass for the insecticide chlorpyrifos [197]. Recently, an on-line combination of SFE–LC–GC–MS was applied in the determination of PAHs and organic acids in aerosols [66,198]. For atmospheric analysis, dynamic microwave assisted extraction has been coupled on-line with solid-phase extraction [199] and SPE–GC [200] and applied in the determination of organophosphate esters. Another method for the determination of these

35
organophosphate esters was dynamic sonication-assisted solvent extraction coupled on-line with GC via PTV injector [201,202]. 8. Experimental The chemicals and materials, equipment and procedures used in the experiments are described below. More complete information can be found in Papers I-VI. 8.1. Chemicals and materials Chemicals and materials used in the research are listed in Table 3. In addition to the chemicals, technical mixtures of individual BFRs, such as pentabromotoluene, tetrabromobisphenol A (BP4A), tetrabromophthalic anhydride (PHT4), tris(2,3-dibromopropyl)phosphate (T23P), a mixture of hexabromobiphenyl (BP6) and heptabromobiphenyl, mixture of tribromotrichlorocyclohexane, tetrabromodichlorocyclohexane and pentabromochlorocyclohexane, were employed. Also individual PAHs (naphthalene, acenaphthene, fluorene, phenanthrene and fluoranthene) and pesticides (lindan, vinclozoline, quinalphos, procymidone, endosulphan sulphate and tetradifon) were used. The dilution and use of these standard compounds are described in Papers I-VI. The solid-phase materials employed in the trapping of PHW extracts are presented in Section 9.2.1. In the on-line sample pretreatment and analysis of solid samples, both spiked sea-sand and real soil and sediment samples were applied (I-IV). In the optimisation steps, sea-sand was spiked with BFRs or PAHs in suitable organic solvent and the solvent was allowed to evaporate before extraction. The liquid and solid samples used in the study are listed in Table 4. 8.2. Equipment The equipment applied in the experiments is listed in Table 5 and the columns are presented in Table 6. Since the equipment for pressurised hot water extraction and microporous membrane liquid–liquid extraction was not commercially available, the PHWE device was laboratory-made from a GC oven, a three-way valve, a pressure regulator and a stainless steel capillary. Both commercial and in-house extraction vessels were employed. The construction of the in-house vessels is presented in Fig. 6. The membrane block for MMLLE was obtained from Lund University where it was constructed from poly(etheretherketone) (PEEK) and poly(tetrafluoroethylene) (PTFE). The structures of the flat sheet and hollow fibre membranes are presented in Fig. 7 A and B and the properties of the membranes are listed in Table 7. Soxhlet extraction units were applied (IV) to obtain reference results.

36
Table 3. Chemicals and materials used in the experiments (I-VI). Compound Manufacturer or supplier Comments Paper Acetone Lab Scan Analytical Sciences For cleaning the tubings of
PHWE (99.8%) I, II
BFR stock solution Self-made / AccuStandard Inc.
Prepared in toluene or isooctane; BFRs in Paper I
I
1,1’-Binaphthyl Acros Organics Internal standard (98%) III, V, VI 2,2’-Binaphthyl AccuStandard Inc. Internal standard (99.1%) I Cyclohexane Lab Scan Analytical Sciences Solvent (HPLC grade) III, IV, VI 4,4´-Dibromooctafluorobi-phenyl
Aldrich Internal standard (99%) I-V
Dichloromethane Lab Scan Analytical Sciences Solvent (HPLC grade) II Di-isopropyl ether J.T. Baker Chemicals B.V. Solvent (HPLC grade) VI Diphenylamine Merck Internal standard VI Diphenyleneoxide Aldrich Internal standard II, V Ethyl acetate Lab Scan Analytical Sciences Solvent (HPLC grade) I, II, IV Gasoline Gas station JET 95 okt I Hexane Lab Scan Analytical Sciences Solvent (HPLC grade) VI Isooctane Rathburn Chemicals Ltd. Solvent (HPLC grade) II Methanol Lab Scan Analytical Sciences Solvent (HPLC grade) II, V PAH standard mixture AccuStandard Inc. 17 PAHs (Z-014G-R) II-V n-Pentane Lab Scan Analytical Sciences HPLC grade, distilled in the
laboratory before use I, II
Pesticide standard mixture
AccuStandard Inc. 20 pesticides (AE-00030) VI
Phenol Merck Model compound V Polystyrene Laboratory of Polymer
Chemistry, University of Helsinki
Model compound, M=120 000
V
2-Propanol Fisher Scientific International Group
Solvent (HPLC grade) V, VI
Sea sand Riedel-de-Haën Acid washed and calcined sea sand, grain size 0.1-0.3 mm
I-IV
Toluene Lab Scan Analytical Sciences Solvent for standards (HPLC grade)
I-VI
Water Distilled and deionised, PHWE solvent and solvent for standards
I-VI

37
Table 4. Samples used in the study (I-VI). Sample Collection site Comments Paper Sediment 1529:1 Vistula River, site Kiezmark near
Gdansk 6 June 1992, depth 0-10 cm Supplied by Dr. B. van Bavel (MTM Research Centre, Örebro University, Sweden)
I
Sediment EC-1 Certified reference material Environment Canada, National Water Research Institute (Burlington, Ontario)
IV
Sediment JML Baltic Sea (59° 34.89' N / 23° 37.83' E) October 1998, depth 5-10 cm
Supplied by Dr. H. Kankaanpää (Finnish Institute of Marine Research, Helsinki, Finland)
I, IV
Sediment Setoc Sample 3 (98.4) from International Sediment Exchange for Tests of Organic Contaminants, the Netherlands
Supplied by Dr. Hanne Lund (SINTEF, Oslo, Norway)
II-IV
Soil Collected from decommissioned coal gasification plant, Husarviken, Stockholm
Supplied by Dr. B. van Bavel (MTM Research Centre, Örebro University, Sweden)
II-IV
Surface water Renkajärvi (lake), 20 June 2003, depth 1 m
pH 7.4 (24.7°C), clear VI
Surface water Syväjärvi (lake), 22 June 2003, 1 m pH 7.7 (23.6°C), clear VI
Surface water Kymijoki, Kuusankoski (river), 28 June 2003, depth 0.5-1 m
pH 7.7 (24.2°C), clear VI
Surface water Käyrälampi, Kouvola (small lake), 28 June 2003, depth 2-3 m
pH 7.6 (23.6°C), clear VI
Surface water Kymijoki, Koria (river), 28 June 2003, depth 0.3 m
pH 7.5 (23.6°C), clear VI
Surface water Inkoo, Baltic Sea, Gulf of Finland, 21 June 2003, depth 0.3 m
pH 7.8 (24.4°C), clear VI
Surface water Pikkukoski, Vantaanjoki (river), 1 July 2003, depth 0.5 m
pH 7.9 (24.5°C), yellowish, many particles
VI
Surface water Kuohijärvi, Lammi, (lake), 5 July 2003, depth 1 m
pH 7.8 (23.3°C), clear VI

38
Table 5. Equipment used in the research. Equipment Manufacturer and model Comments Paper Dynamic light scattering (DLS) equipment
Brookhaven Instruments, BI-200SM goniometer and BI-9000AT digital correlator
Lexel 85 Argon laser at 514.5 nm and 15–150 mW
V
Fluorescence detector Waters, 420-AC Detector in diffusion measurements: 455 nm for emission and 338 nm for excitation
V
Gas chromatography CE Instruments, Fisons 8000 Autosampler AS800 II, V GC–MS CE Instrumentation, HRGC 5300
/ Automass Solo, Thermoquest Confirmation of the identification of compounds
I, V
GC–MS Agilent Technologies, HP 6890N GC, 5973N quadrupole MS
Optimisation (V), confirmation of the identification of compounds
III, IV, VI
GC–MS Agilent Technologies, HP 5890 GC, 5989A quadrupole MS
Confirmation of the identification of compounds
II
GC oven for PHWE Varian Inc., Chrompack CP 9000 III, IV GC oven for PHWE Agilent Technologies, HP 5790A I, II High-pressure pump Jasco, PU-980 PHW and MMLL extractions and
diffusion measurements I-VI
Hollow-fibre membrane unit
Laboratory-made Empty LC column (7.5 cm × 4.6 mm i.d.) filled with 10–100 fibres
III, IV
Injector Vici AG, CheminertTM, Diffusion measurements, 20 µl internal volume
V
Liquid chromatograph Hewlett-Packard 1100 UV detection at 220 nm and 225 nm (IV), 254 nm and 270 nm (V)
IV, V
(LC–)GC CE Instruments, Fisons Instruments Dualchrom 3000 Series on-line HPLC-HRGC
Contains Phoenix 30CU pump I-III, VI
Membrane extraction block
Constructed at Lund University, Sweden
Made of PTFE and PEEK, channels of 0.1 or 0.2 ml
II, IV-VI
pH meter Radiometer, PHM220 MeterLab Applied for water samples VI PHW extraction vessel Keystone Scientific Inc. Stainless steel I PHW extraction vessel Laboratory-made Stainless steel, volume 2.8 ml, i.d.
10 mm II-IV
Pressure regulator Jasco Manually adjustable, needle valve type
I, II
Solid phase trapping column
Sorbent: Alltech Associates Inc. 5 cm × 2.1 mm i.d., Tenax TA (80-100 mesh) adsorbent
I, II, IV
Stainless steel capillary Alltech Associates Inc. Diffusion measurement coil, connections, i.d. 0.5-0.75 mm
I-VI
Three-way valve High Pressure Equipment Co., HIP 30-15 HF4-HT
Directing water, drying gas or solvent
I
Ultrafiltration equipment Millipore Filtration of polystyrene solution through Celgard 2400
V
UV detector Spectra-Physics, SP8450 Detection at 210, 220 or 262 nm V Vacuum filtration equipment
Millipore Filtration of polystyrene solution through Celgard 2400
V

39
Table 6. LC and GC columns used in the study. Column type Manufacturer Dimensions Paper
GC columns BGB Analytik (ret. gap.) / Agilent Technologies (analytical column)
3 m × 0.53 mm i.d. DPTMDS ret. gap. + 20 m ×0.25 mm i.d. HP-5, 0.25 µm phase thickness
I
GC columns BGB Analytik / Agilent Technologies
10 m × 0.53 mm i.d. DPTMDS ret. gap. + 20 m ×0.25 mm i.d. HP-5, 0.25 µm phase thickness
II, III, VI
GC columns BGB Analytik / Agilent Technologies
3 m × 0.53 mm i.d. DPTMDS ret. gap. + 30 m × 0.25 mm i.d. HP-5MS, 0.25 µm phase thickness
IV
GC columns BGB Analytik / Agilent Technologies
5 m × 0.53 mm i.d. DPTMDS ret. gap. + 20 m ×0.25 mm i.d. HP-5, 0.25 µm phase thickness
V
LC column Phenomenex, Luna cyano column 15 cm × 3.0 mm i.d., particle size 5 µm I
LC column Waters, Symmetry C18 15 cm × 4.6 mm i.d., particle size 3.5 µm V
SEC column Polymer Laboratories Ltd, PLgel Minimix
Cross-linked polystyrenedivinylbenzene, 250 mm × 4.6 mm i.d., particle size 5 µm
IV
Figure 6. In-house-made vessel for pressurised hot water extraction, shown with a copper sealing-ring, a stainless steel frit and a bolt for tightening the vessel.

40
Figure 7 A) Celgard 2400 polypropylene membrane and B) Celgard X50-215 hollow fibre membrane (three fibres), photographed with a microscope camera in the laboratory.
Table 7. Properties of the flat sheet (II, IV-VI) and hollow fibre (III, IV) membranes. Property Celgard 2400 flat
sheet Celgard X50-215 hollow fibre
TE-35 flat sheet (Schleicher&Schuell)
Material Polypropylene Polypropylene PTFE Porosity (%) 37 40 60-80 Pore dimensions (µm) 0.117 × 0.042 0.04 × 0.10 Pore size 0.2 Thickness/Wall thickness (µm)
25 40 (i.d. 220, o.d. 300) 60
Melt temperature 163°C -* -* *not reported by manufacturer
8.2.1. Analytical techniques The analytical techniques applied in the experiments were normal-phase liquid chromatography, reversed-phase liquid chromatography, size exclusion chromatography, gas chromatography, liquid chromatography – gas chromatography, gas chromatography – mass spectrometry, dynamic light scattering and chromatographic broadening technique for diffusion measurements [203]. Size exclusion chromatography was used for the comparison of PHW extracts trapped with various systems (IV) and liquid chromatography for the determination of mixing of the donor and acceptor solvents in MMLLE (V). Diffusion coefficients were studied by chromatographic broadening method as a function of temperature when factors affecting MMLLE were investigated (V). The techniques are described in more detail in Papers I-VI and the equipment is presented in Tables 5 and 6. The diffusion coefficient measurement device (V) consisted of an injector, 103 m of coiled stainless steel capillary and a UV or fluorescence detector.
A B

41
8.2.2. On-line coupled extraction–analysis systems The main analytical technique in this research was gas chromatography, which was coupled on-line with PHWE–SPE–LC (I), PHWE–MMLLE (II, III) or MMLLE (VI). GC was also used off-line in optimisations and investigation of fundamental aspects of MMLLE (V) and trapping in PHWE (IV). Figure 8 shows the set-up used in the PHWE–LC–GC system. This system is slightly more complicated and contains more valves than that used for on-line coupled PHWE–MMLLE–GC. This latter set-up, presented in Fig. 9, was used in the experiments reported in Paper II where the solid-phase trap containing Tenax TA (Paper I) was replaced by an MMLLE unit. The LC column used for cleaning and fractionating the extract before transfer to GC was removed since cleaning and concentration were now carried out by MMLLE. In one study (Paper III) the flat-sheet membrane unit was replaced by a hollow-fibre unit, and in another (Paper VI) only the MMLLE–GC part of the system was applied. The different parts of the on-line coupled systems were connected with stainless steel, PTFE or PEEK capillaries.
Figure 8. PHWE–LC–GC equipment. 1 Nitrogen, 2a and 2b High-pressure pumps, 3 Ethyl acetate/pentane (15:85, v/v), 4 Water, 5 Oven, 6 Heating coil, 7 Extraction vessel, 8 Cooling capillary, 9 Solid-phase trap, 10 Pressure regulator, 11 LC column, 12 Precolumn(s), 13 Analytical column, 14 Solvent vapour exit (SVE), 15 Flame ionisation detector (FID), V1 Three-way extraction valve, V2-V4 Multiport valves. 8.3. Methods Both on-line and off-line methods were applied in the experiments. In the on-line methods the whole extract was injected or transferred for analysis, whereas in the off-line methods only a part of the extract was analysed. Section 8.3.1. deals with extraction coupled on-line with GC analysis and section 8.3.2. with off-line procedures. Details of other methods used in the studies, such as SEC and LC, can be found in the original papers.
2a
V2 V3
V4
4
7
9
8 12 13
14 15V1
5
11
V1
2b
3
1
6
102a
V2 V3
V4
4
7
9
8 12 13
14 15V1
5
11
V1
2b
3
1
6
10

42
Figure 9. PHWE–MMLLE–GC equipment. 1 Water, 2a, 2b and 2c High-pressure pumps, 3 Oven, 4 Heating coil, 5 Extraction vessel, 6 Pressure regulator, 7 Membrane block containing flat-sheet membrane, 8 Organic solvent, 9 Sample loop, 10 Organic solvent, 11 Precolumn(s), 12 Analytical column, 13 Solvent vapour exit (SVE), 14 Flame ionisation detector (FID), V1 Injection/transfer valve to GC.
8.3.1. On-line methods Papers I-III and VI report on-line combinations of sample preparation and analytical methods. All include extraction, PHWE or MMLLE or both, and analysis by (liquid chromatography–) gas chromatography, as shown in Fig. 10. In the methods described in Papers I–III the first step is dynamic pressurised hot water extraction. Either solid-phase extraction (I) or microporous membrane liquid–liquid extraction (II, III) is carried out in the same step as PHWE (stagnant acceptor phase in MMLLE). In one case the first step in the method is MMLLE (VI). In the methods for solid samples, the samples are placed in the extraction vessel and internal standard is added before extraction. In the methods for liquid water samples, the water is put in a flask and pumped through the donor channel of a membrane extraction unit. After suitable extraction time, in both PHWE and MMLLE, the aqueous flow is stopped by switching off the pump. The extract is then eluted with use of another pump. In the methods including MMLLE (II, III, VI), the acceptor phase (extract) is eluted into a sample loop in the GC injection/transfer valve (V1 in Fig. 9). If the method does not include MMLLE the extract can also be cleaned with LC before GC analysis (I). The injection/transfer in all these on-line methods is done on-column with the help of an LC pump under conditions allowing either partially or fully concurrent solvent evaporation. The whole extract is injected or transferred for analysis. The injected volume is hundred(s) of microlitres in every case. It is advisable to inject a slightly larger volume than the extract volume to ensure the transfer of the whole extract, and after the injection to wash the sample loop with fresh solvent (II, VI). Extraction and analysis conditions in the different methods are discussed in more detail in Chapter 9. After injection or transfer of the extract to analysis, the tubings in the extraction system are flushed with organic solvent. In MMLLE the donor tubings and channel are flushed with water and the acceptor channel is cleaned with water and the acceptor solvent.
2a
5
3
2b
8
412 13
13 14
11 12
V1
101
2c
6
7
9
2a
5
3
2b
8
412 13
13 14
11 12
V1
101
2c
6
7
9

43
Figure 10. Analytical schemes for the on-line coupled systems.
8.3.2. Off-line methods Off-line methods (GC–MS and LVI–GC) were applied to study the trapping in PHWE and the factors affecting MMLLE (IV, V). In these methods only a part of the extract was injected on-column to GC. Detection was with MS or FID. An advantage of off-line analysis in the optimisation step is that, if necessary, several analyses can be made of the same extract, and the injection conditions do not have to be optimised for a particular extract volume or solvent.
SedimentSample
Paper I Paper II Paper III Paper IV
Extraction
Trapping
Clean-up, concentration
Analysis
PHWE
Solid-phase trap
NPLC
GC
Soil, sediment
PHWE
FS–MMLLE
GC
Soil, sediment
PHWE
HF–MMLLE
GC
Water
MMLLE
GC

44
9. Results and discussion The emphasis of this research was the development of on-line systems for sample pretreatment and analysis of environmental samples and study of the mechanisms and factors affecting MMLL extraction. The effect of different trapping systems in PHWE was also under investigation. The methods used in the research, together with the sample matrices and analytes, are presented in Table 8. Table 8. Methods, matrices and analytes applied in the research. Method Matrix Analytes Paper
PHWE–LC–GC Sediment BFRs I
PHWE–FS–MMLLE–GC Soil PAHs II
PHWE–HF–MMLLE–GC Soil PAHs III
PHWE–GC with different trapping methods Soil and sediment PAHs IV
MMLLE off-line GC Water PAHs, phenol V
MMLLE–GC Water Pesticides, PAHs VI
9.1. Optimisation of extraction methods The optimised conditions for extraction and analysis are presented in Table 9. In the optimisation of extraction methods, compromises have to be made when on-line systems are deployed. All conditions need to be chosen taking into account the previous or following part of the system. Optimisation refers therefore to a search for the best conditions for the system in question, not a search for absolute optimal conditions. In the on-line techniques (I, II, III, VI) the optimisation of the extraction parameters was carried out first and then the injection/transfer conditions to GC were optimised on the basis of the extraction optimisation. PHWE–FS–MMLLE–GC and PHWE–SPE–GC methods were compared in Paper II, but only the conditions for PHWE–FS–MMLLE–GC are given in Table 9. Information on the conditions for PHWE–SPE–GC can be found in Paper II. The results of the optimisations of the various methods are discussed below.

45
Table 9. Optimiosed extraction and analysis conditions in the methods applied in the research (I-VI). Method/ conditions
PHWE–LC–GC
PHWE–FS–MMLLE–GC
PHWE–HF-MMLLE–GC
PHWE off-line GC*
MMLLE off-line GC
MMLLE–GC
Sample size 100 mg 5 mg 5-10 mg 200 mg 25 ml 40 ml Flow-rate: PHWE1
/MMLLE2
1 ml/min1 0.5 ml/min1 1 ml/min1 1 ml/min1 0.5 ml/min2 1 ml/min2
PHWE oven temperature
325°C 300°C 300°C 300°C - -
Extraction time: PHWE1
/MMLLE2
40 min1 50 min1 30 min1 30 min1 50 min2 40 min2
PHWE pressure
118 bar 10 bar 8 bar 9 bar (SPE >30 bar)
- -
MMLLE acceptor solvent
- Toluene Cyclo-hexane
Ethyl acetate/cyc-lohexane 10:90 (v/v) or toluene
Toluene Toluene
Extract volume
3.5 ml before LC fractionation
0.125 ml 0.4 ml 0.5-0.75 ml (MMLLE) 3-6 ml (LLE and SPE)
0.125 ml 0.2 ml
Injection/ transfer technique to GC
On-column, FCSE
On-column, PCSE
On-column, PCSE
On-column to GC–MS
On-column On-column, PCSE
Injection/ transfer rate, time and volume
0.25 ml/min * 4 min 30 s = 1.125 ml
0.17 ml/min * 50 s = 0.142 ml
0.2 ml/min * 2 min = 0.4 ml
2 µl 8 µl 0.2 ml/min * 1 min 10 s = 0.233 ml
Injection/ transfer temperature
80°C 95°C 82°C 75°C 105°C 95°C
SVE closure time after injection
1 min 30 s 45 s 1 min 5 s - - 35 s
Paper I II III IV V VI *trapping methods LLE, SPE, HF–MMLLE and FS–MMLLE
9.1.1. Pressurised hot water extraction Pressurised hot water extraction was applied in studies I-IV. The extraction conditions were investigated with a view to the analytes, the matrix and the trapping technique. The parameters studied were sample amount, flow-rate, extraction time, temperature, trapping method, elution solvent and the elution volume of the extract.
46
9.1.1.1. Sample size The amount of sample required for analysis is dependent on the concentrations of the target analytes. Detection limits obtained with the developed system can be lowered by increasing the sample amount. Amounts can be significantly smaller in on-line techniques than in techniques where only a small portion of the extract is injected for analysis. The sample sizes in this research were in the range 5–200 mg. Small sample sizes (5–10 mg) were sufficient when microporous MMLLE was used as the trapping method and the analysis was made on-line (II, III). A marked concentration effect is achieved with MMLLE and, accordingly, low detection limits are obtained when the whole extract is injected for analysis. With off-line GC analysis (IV), 200-mg samples were employed and 100 mg samples were used when LC fractionation was carried out (I). 9.1.1.2. Flow-rate PHWE flow-rates of 0.5 ml/min and 1.0 ml/min were studied (I-IV). When PHWE was connected with MMLLE the flow-rate had to be adjusted taking into account the MMLLE conditions (II-IV). As was discussed in Chapter 5, the best recoveries for hydrophobic analytes with PHWE are usually obtained with flow-rates of about 1 ml/min, and MMLLE should be optimised on the basis of the optimal conditions in PHWE. Initially a flow-rate of 0.5 ml/min was used with PHWE–MMLLE (I) to ensure the stability of the membrane and avoid rapid pressure changes. Although this is not the optimal flow-rate in PHWE, more effective diffusion in MMLLE is obtained with lower flow-rate. Later, it was found 1 ml/min can be applied in both flat-sheet and hollow-fibre MMLLE and that flow-rate was adopted for PHWE–MMLLE (III, IV). Total recoveries were enhanced with the increase in the flow-rate since the extracted volume increased from 25 ml (II) to 30 ml (III). 9.1.1.3. Extraction temperature Temperatures of about 200°C are required for the extraction of low-molecular-mass PAHs [69], whereas 250–300°C is needed for the extraction of high-molecular-mass PAHs [20,69]. On the basis of this knowledge and earlier studies in our laboratory [82], the extractions of PAH compounds were carried out at 300°C (II-IV). The optimal extraction temperature for BFRs had been investigated earlier [37] and the extraction temperature of 325°C was applied (I). Higher temperatures are not advisable because of the possibility of corrosion and blockages in the system leading to unrepeatable extractions [37,204]. 9.1.1.4. Extraction time Typical extraction time in PHWE varies between 20 and 40 minutes. Optimising of the extraction time requires examination of the extraction profile of the analytes under the chosen conditions. The extraction time should be selected near the plateau in the extraction profile. If an extraction time from the steeply rising region of the curve is chosen the results are not quantitative and are unrepeatable (see Fig. 11). The optimal extraction time depends, of course, on the flow-rate of

47
water through the sample. In this research the optimal extraction times with the flow-rate of 1 ml/min were 30 min for PAHs (III, IV) and 40 min for BFRs (I). With lower flow-rate, 0.5 ml/min, the extraction time of 50 min was found best for PAHs (II). 9.1.1.5. Adsorption to capillaries One of the most severe problems in PHWE is the loss of the analytes through precipitation onto walls of the stainless steel capillary as they flow out of the extraction vessel with the water stream [80]. Precipitation may occur as the water cools down and the solubility of hydrophobic compounds decreases. The risk of adsorption is especially great for compounds like PAHs, whose solubility decreases rapidly upon cooling. The adsorption of PAHs was studied with a system where PHWE was connected with a solid-phase trap (II) and sea-sand spiked with standard solution was extracted. After extraction the trap was dried with nitrogen flow. The capillary leading from the extraction device to the trap was disconnected and the capillary was flushed with 2 ml ethyl acetate/pentane (15:85, v/v). The capillary was then reconnected to the trap and the trap was flushed in the same way as the capillary. Both 2-ml extracts were concentrated with nitrogen flow and analysed by GC. The adsorption was small, 0.12–6.6% (%capillary/trap) as can be seen in Table 10. After this study the stainless steel capillary was shortened and insulated with glass wool and aluminium foil to keep the temperature of the water above ambient. In that way the adsorption was minimised.
Table 10. Adsorption of PAH compounds in a stainless steel capillary in front of the solid-phase trap.*
Compound Adsorption (%capillary/trap)
Naphthalene 6.7 Acenaphthylene 3.0 Acenaphthene 4.5 Fluorene 2.5 Phenanthrene 5.3 Anthracene 3.4 Carbazole 0.12 Fluoranthene 1.2 Pyrene 4.0 Benzo[b]fluoranthene 2.6 Benzo[k]fluoranthene 3.8 Benz[a]anthracene 1.8 Chrysene 2.5 Average 3.2
*Unpublished results

48
9.1.1.6. Vessel size In addition to the commercial extraction vessel from Keystone Scientific Inc. (2.2 ml) and the laboratory-made 2.8 ml (10 mm i.d.) vessel, a smaller vessel of 1.0 ml was investigated. Since much smaller sample amounts are required in the on-line PHWE–MMLLE–GC than in off-line methods, it was reasonable to think that more effective and faster PHW extraction could be achieved with a 1.0 ml vessel. The extraction profile (sum profile) for PAHs obtained using the laboratory-made 1.0 ml vessel is presented in Fig. 11. As can be seen, the plateau was reached only after 35 min extraction, while with the 2.8 ml vessel 30 min was the optimal extraction time [82]. In regard to extraction time, the use of this small vessel did not, therefore, offer any improvement.
Figure 11. Extraction profile obtained with the small (1.0 ml) vessel with 20 mg sediment 1529:1 and flow-rate of 1.0 ml/min. *Unpublished results
The extraction profiles were also compared for the 1.0 ml and the 2.8 ml vessel with water flow-rate of 0.5 ml/min and with 40 mg sediment. As can be seen in Fig. 12, the profile obtained with the 2.8 ml vessel rises much more rapidly than that obtained with the 1.0 ml vessel. With the 2.8 ml vessel, most of the analytes were extracted soon after the start of the extraction, while with the 1.0 ml vessel the extraction took longer. Figure 12 also shows that the total area of the profile obtained with the 1.0 ml vessel is smaller than that obtained with the 2.8 ml vessel, indicating incomplete extraction. The extraction efficiencies obtained with the 1.0 ml and 2.8 ml vessels were compared by extracting sea-sand spiked with PAH standards for 50 min at 0.5 ml/min flow-rate. The PHW extracts were extracted into toluene and analysed by GC. The yields for the spiked samples were calculated by comparing with on-column standard injections. As Fig. 13 clearly shows, the 2.8 ml vessel gives the better extraction efficiency. One explanation for the unexpectedly poor behaviour of the small vessel is the wall thickness. The outer diameter of the 1.0 ml and 2.8 ml vessels is the same (20
0.0E+00
2.0E+06
4.0E+06
6.0E+06
8.0E+06
1.0E+07
1.2E+07
1.4E+07
1.6E+07
10 15 20 25 30 35 40 45Time (min)
Are
a
Naphthalene
Fluorene
Phenanthrene
Anthracene
Carbazole
Fluoranthene
Pyrene
Benz[a]anthracene+chrysene
Benzo[b]+[k]fluoranthene
Benzo[a]pyrene

49
mm), while the i.d. of the larger vessel is 10 mm and that of the smaller 5 mm. It takes longer for the smaller thick-walled vessel than for the larger thin-walled vessel to heat up to 300°C. Moreover, because of the different manufacturing method, the inner surface of the 1.0 ml vessel is slightly rougher than that of the 2.8 ml one, probably encouraging adsorption. Yet another reason for the unexpected results could be that the vessels were filled with sea-sand and, accordingly, the dead volume was also low in the 2.8 ml vessel.
Figure 12. Extraction of 40 mg 1529:1 sediment with small (1 ml) and large (2.8 ml) extraction vessels with a flow-rate of 0.5 ml/min. *Unpublished results
Figure 13. Comparison of the extraction yields for spiked samples with small and large extraction vessels. Peak identification: 1 naphthalene, 2 acenaphthylene, 3 acenaphthene, 4 fluorene, 5 phenanthrene, 6 anthracene, 7 carbazole, 8 fluoranthene, 9 pyrene, 10 benz[a]anthracene+chrysene, 11 benzo[b]&[k]fluoranthene, 12 benzo[a]pyrene, 13 indeno[1,2,3-c,d]pyrene+dibenz[a,h]anthracene, 14 benzo[g,h,i]perylene. *Unpublished results
0
0.5
1
1.5
2
2.5
0 10 20 30 40 50 60Time (min)
Rel
ativ
e ar
ea
Small vessel
Large vessel
0
20
40
60
80
100
120
140
Recovery (%)
1 2 3 4 5 6 7 8 9 10 11 12 13 14
large vessel
small vessel

50
9.1.2. Microporous membrane liquid–liquid extraction Microporous membrane liquid–liquid extraction can be applied both as a trapping method in PHWE (II, III, IV) and as an independent sample pretreatment method (V, VI). MMLLE is a relatively new technique, which has mainly been used in the pretreatment of liquid samples. For the first time in this research it was used as a trapping method in PHWE (II, III, IV). The factors to be optimised are the membrane, donor flow-rate, extraction time, extraction temperature, acceptor solvent, acceptor flow-rate, elution volume and sometimes also pH. Two configurations, flat sheet (II, IV-VI) and hollow fibre (III, IV) membrane units, were investigated. 9.1.2.1. Choice of membrane Two of the most common membrane materials in MMLLE are PTFE and polypropylene. The membrane has to be hydrophobic, porous and preferably thin. According to the literature, better results are obtained with thin membranes than relatively thick PTFE membranes [132]. Two flat sheet membranes of different type were selected for study: PTFE membrane model TE-35 and a polypropylene membrane Celgard 2400 (II). Toluene was the first choice as acceptor solvent since it is a good solvent for the PAH model compounds used in the study [205]. However, toluene is not a suitable acceptor solvent with PTFE membrane because it immediately passes through the membrane. Accordingly, PTFE membrane with isooctane as acceptor and polypropylene membrane with toluene were compared. Better extraction efficiency was achieved with the latter combination and Celgard 2400 polypropylene membrane was applied in all further studies employing flat sheet membrane units (IV, V, VI). In the construction of the hollow fibre membrane unit, Celgard X-50-215 membrane was selected according to the recommendation of Dr. J. Schneider of Celgard GmbH. This membrane was made of polypropylene, and the i.d. and the wall thickness of the fibres were suitable for analytical purposes. 9.1.2.2. Choice of acceptor solvent The selectivity of MMLLE depends in part on choice of the acceptor solvent. The criteria for the acceptor solvent are that it must dissolve the target analytes and it should not be miscible with water. The boiling point should be high enough to avoid its evaporation at ambient temperature, and the surface tension should be such that it does not pass through the whole membrane. In this research the acceptor solvent also had to be compatible with gas chromatographic analysis and large volume injection (II, III, VI). Further, it was desirable that the solvent is as environmentally friendly as possible. In the extraction of PAHs from soil (II), toluene was observed to give better results than isooctane. In the case of the hollow fibre module, aromatic solvents could not be used because of their effect on the epoxy glue used in the construction (III, IV). Cyclohexane (III) or cyclohexane–ethyl acetate (90:10, v/v) was used as acceptor in hollow fibre MMLLE. In the extraction of certified EC-1 sediment with flat sheet MMLLE, toluene and cyclohexane–ethyl acetate (90:10, v/v) gave

51
comparable recoveries (IV), but the repeatability was better with toluene. In the study of hydrophobic pollutants in surface waters, four acceptor solvents of different polarity were compared in MMLLE (VI). These were cyclohexane, toluene, cyclohexane–ethyl acetate (85:15, v/v) and an azeotropic mixture of hexane and di-isopropyle ether (47:53, v/v). In this case, too, best results were obtained with toluene, as can be seen in Fig. 14.
Figure 14. Comparison of four solvents as acceptors in MMLLE of hydrophobic pollutants in water. Peak identification: 1 naphthalene, 2 fluorene, 3 lindan, 4 vinclozolin, 5 quinalphos, 6 procymidone, 7 endosulphan sulphate 8 tetradifon. 9.1.2.3. Donor flow-rate As already discussed in Chapter 6, the donor flow-rate has an effect on the extraction yield and the enrichment factors. If the sample amount is not limited it is often advisable to carry out the extraction with a relatively high flow-rate, for example 1 ml/min. Even though the extraction yield decreases with increasing donor flow-rate, the enrichment factors are increased to yield a more effective transfer of the analytes from the donor phase to the acceptor. When MMLLE is used as a trapping method for PHWE the flow-rate should be optimised according to the PHWE conditions. The flow-rate 1 ml/min is a good choice in this case, too. In the studies with PHWE–MMLLE, flow-rates 0.5 ml/min (II) and 1.0 ml/min (III, IV) were applied. In study of the factors affecting MMLLE, the flow-rate was 0.5 ml/min (V). In the application of MMLLE–GC in the analysis of hydrophobic pollutants in water, flow-rates in the range 0.3–1.0 ml/min were investigated and 1.0 ml/min was observed to give the most effective extraction (VI), as can be seen in Fig. 15.
0.00
0.05
0.10
0.15
0.20
0.25
0.30
0.35
0.40
A/A(ISTD)
1 2 3 4 5 6 7 8
cyclohexane
toluene
hexane/isopropyl ether
15/85 EtAc/cyclohexane

52
Figure 15. Optimisation of the flow-rate in the extraction of hydrophobic pollutants from water. Results are presented as relative peak areas. Peak identification as in Fig. 14.
The effect of the donor flow-rate on the extraction yields can be investigated by plotting flow-rate versus extraction time (Fig. 16 a-c). Model plots for the analyte tetradifon in water are presented. As can be seen in all the figures, peak areas (i.e. instrument signals) obtained with the same extraction times increase with flow-rate. 9.1.2.4. Extraction time When MMLLE is used as a trapping device for PHWE the extraction time depends on the optimal extraction time for PHWE (II, III, IV). Extraction times of 30–50 min were applied in PHWE–MMLLE depending on the donor flow-rate (II, III, IV). As an independent extraction method the optimisation of the MMLL extraction time was based on the study of extraction profiles [138, VI]. Because it is dynamic in nature, MMLLE is not a quantitative extraction method but the aim is to extract, repeatably, sufficient amounts of analyte to obtain good signals in the chromatograms. Typical extraction times in MMLLE range from ten minutes to one hour [129-139]. The optimal extraction time also depends on the donor (sample) flow-rate. In the optimisation of the extraction time for hydrophobic pollutants in surface waters (VI), the optimal extraction time was found to be 40 min with the flow-rate of 1.0 ml/min. 9.1.2.5. Acceptor flow-rate The acceptor phase is usually kept stagnant during the extraction to allow efficient concentration to a small volume of organic solvent. If the partition coefficients of the analytes are small or if the diffusion of the analytes from the donor to the acceptor is to be enhanced, the use of flowing acceptor phase is the method of choice. When MMLLE is connected on-line to GC the extract is
1 2 3 4 5 6 7 80.3 ml/min
0.5 ml/min0.8 ml/min
1.0 ml/min0.00
0.20
0.40
0.60
0.80
1.00
1.20
A/A(ISTD)
Flow-rate
0.3 ml/min0.5 ml/min0.8 ml/min1.0 ml/min

53
usually eluted to a sample loop in the GC injection valve (II, III, VI). It is then more straightforward to use a stagnant acceptor to obtain a concentrated extract in a small volume and to be able to elute the whole extract at the same time. Stagnant acceptor phase was applied in most of the experiments (II, III, IV, VI), but the effect of a flowing acceptor was also investigated (V). The effect of the acceptor state on the extraction yields is dependent on the diffusion rates of the analytes. With high-molecular-mass PAHs the diffusion was enhanced with use of flowing acceptor and, accordingly, the extraction yields were increased (V) (extract volume increased from 0.125 ml to 0.150 ml). The flowing acceptor had a different effect on the extraction yield of the low-molecular-mass PAHs, however: extraction yields were comparable to or even worse than those achieved with stagnant acceptor. A probable reason for this was the larger volume of extract obtained with the flowing acceptor. The extract volume has an effect on the evaporation of the solvent after injection to GC and the larger extract volume may have negatively affected the analysis of the most volatile compounds. The effect of the flow direction was studied (V). While it is generally believed that a configuration with counter-currently flowing donor and acceptor phases yields the best results, the mixing of the donor and acceptor solvents was found to be vigorous with the counter-current configuration (Table 11) and significant volume of acceptor solvent was transferred to the donor side of the membrane. Extraction yields were decreased as a result. Weakest mixing was obtained with concurrently flowing acceptor. On the basis of this finding, the configuration with concurrently flowing donor and acceptor phases was employed in later work (V). Solvent mixing was even enhanced with increasing temperature. Table 11. Mixing of the donor and acceptor solvents with different flow configurations at 80°C, water phase on top in the unit: Amount of toluene in aqueous donor phase (µl/ml). Extraction time (min) Counter-current flow Stagnant acceptor Concurrent flow 5 9.17 17.62 0.76 10 3.72 1.13 0.36 15 3.85 0.66 0.24 20 3.98 0.44 0.22 25 3.79 0.45 0.29 30 3.74 0.41 0.30 35 3.73 0.43 0.29 40 3.39 0.40 0.25 45 3.81 0.41 0.27 50 4.13 0.41 0.25

54
Figure 16. Investigation of change in peak area with donor flow-rate and time: A) total peak area, B) peak area relative to peak area of ISTD, C) peak area relative to peak area of ISTD and extracted volume. Model plots are for the analyte tetradifon.
Tim
e (m
in)
0.4 0.6 0.8 1.010
60
40
20
30
50
1 x 10⁶
5 x 10⁶
9 x 10⁶
13 x 106
2.1 x 10⁷
Area
1.3 x 10⁷
2.5 x 1072.9 x 107
3.3 x 1073.7 x 107
4.1 x 10⁷
Flow rate (ml/min)
Tim
e (m
in)
0.4 0.6 0.8 1.010
60
40
20
30
50
Tim
e (m
in)
0.4 0.6 0.8 1.010
60
40
20
30
50
1 x 10⁶
5 x 10⁶
9 x 10⁶
13 x 106
2.1 x 10⁷
Area
1.3 x 10⁷
2.5 x 1072.9 x 107
3.3 x 1073.7 x 107
4.1 x 10⁷
Flow rate (ml/min)
B
0.15
0.27
0.37 0.46
0.59 0.7
0.81 0.91
1.03
Tim
e (m
in)
0.4 0.6 0.8 1.010
60
40
20
30
50
Area
Flow rate (ml/min)
B
0.15
0.27
0.37 0.46
0.59 0.7
0.81 0.91
1.03
Tim
e (m
in)
0.4 0.6 0.8 1.010
60
40
20
30
50
Area
Flow rate (ml/min)
C
Area
Tim
e (m
in)
Flow rate (ml/min)
0.4 0.6 0.8 1.010
60
40
20
30
50
0.01207
0.01271
0.01351
0.0142
0.01567
0.01495
0.01673
0.017 0.01783
C
Area
Tim
e (m
in)
Flow rate (ml/min)
0.4 0.6 0.8 1.010
60
40
20
30
50
0.01207
0.01271
0.01351
0.0142
0.01567
0.01495
0.01673
0.017 0.01783
A
C
B

55
9.1.2.6. Extraction temperature Temperature has an effect on MMLL extraction through its effects on the viscosities of the donor and acceptor solvents, the diffusion rates of the analytes from donor to acceptor phase, the solubility of the analytes in the donor phase, adsorption, membrane pore size and the mixing of the donor and acceptor solvents (V). The effect of temperature on the MMLL extraction was investigated with PAHs as model compounds (II, V), but only with flat sheet membranes since the glue in the hollow fibre module did not withstand elevated temperatures. Extraction temperatures of 20, 40, 60 and 80°C were compared for PHWE–MMLLE (II, IV). 80°C was found best for the high-molecular-mass PAHs. The increase in the extraction yields with temperature was dramatic. In addition to increased diffusion, this enhancement is due to the increase in solubility of the high-molecular-mass PAHs in water. Higher temperatures than 80°C were not investigated because bubbling of the acceptor phase has been observed even at temperatures about 20–30°C below the boiling point of the acceptor solvent [138]. Temperatures 20–80°C were studied in a more thorough study solely on MMLLE (PAHs in water as model compounds) (V). The effects of higher temperature on diffusion coefficients, phase mixing, adsorption and membrane pore size were of interest. Also the effect of temperature on the solubility of PAHs in water was estimated. The effect of temperature on the diffusion coefficients of model PAH compounds in donor phase water and acceptor phase toluene was measured by chromatographic broadening method. The increase in diffusion coefficients was significant, as can be seen in Fig. 17. As expected, the increase also led to an increase in extraction efficiencies (V).
Figure 17. Effect of temperature on the diffusion coefficients of selected PAHs in water or toluene. 1 naphthalene in water, 2 acenaphthene in water, 3 fluorene in water, 4 phenanthrene in toluene, 5 fluoranthene in toluene.
0.0E+00
5.0E-10
1.0E-09
1.5E-09
2.0E-09
2.5E-09
D (m2/s)
1 2 3 4 5
23405570
0.0E+00
5.0E-10
1.0E-09
1.5E-09
2.0E-09
2.5E-09
D (m2/s)
1 2 3 4 5
23405570

56
The membrane pore size (flat sheet membrane) (V) was observed to increase with temperature, leading to more effective extraction, but it also resulted in more vigorous mixing of the extraction solvents through the pores. The effective diameters of the particles that passed the membrane pores at 20–80°C are presented in Fig. 18.
0
5
10
15
20
25
30
20 40 60 80T (°C)
Part
icle
dia
met
er (n
m)
UFVF
Figure 18. Effective diameters of polystyrene particles that passed the membrane at different temperatures. UF = ultrafiltration, VF = vacuum filtration. The adsorption of hydrophobic analytes on the membrane material needs to be considered in MMLLE. Adsorption might also occur to membrane block materials PEEK and PTFE. Careful cleaning is required between repeated extractions to avoid memory effects. As can be seen in Fig. 19, adsorption to membrane material was significantly diminished with increasing extraction temperature, thus increasing the extraction yield (V). In this case no acceptor phase was present. Adsorption percentages were substantially lower in the presence of organic acceptor phase (V). By way of summary, Fig. 20 presents the factors affecting the extraction yield in MMLLE as a function of temperature, with naphthalene used as model compound. The extraction% is marked with a thick line. As can be seen in the figure, the major factors contributing to the increase in the extraction yield with temperature are increased solubility in water and diffusion (V). Viscosity, too, is dependent on temperature (Equation 2). When the diffusion coefficients of naphthalene, acenaphthene and fluorene in water were multiplied by the viscosity of water (at the measuring temperature) and divided by the absolute temperature, a constant value independent of temperature was obtained for each compound. This showed that the changes in viscosity and thermal energy (kT in Eq. 2) were the main causes of the increased diffusion coefficients. The effect of increased temperature on the extraction yields of all PAHs studied is presented in Fig. 21 (V).

57
Figure 19. Comparison of adsorption percentages in MMLLE at 22.5 and 80°C when no acceptor phase is present. Peak identification as in Fig. 13 except 7 fluoranthene, 8 pyrene, 9 benz[a]anthracene+chrysene, 10 benzo[b]&[k]fluoranthene, 11 benzo[a]pyrene, 12 indeno[1,2,3-c,d]pyrene+dibenz[a,h]anthracene, 13 benzo[g,h,i]perylene.
Figure 20. Effect of different factors on MMLLE extraction yield as a function of temperature. Y-axis: [extraction%]=%, [D]=m2/s, logKOW unitless, [S]=mg/l, [UF]+[VF]=nm.
0
2
4
6
8
10
12
Adsorption %
1 2 3 4 5 6 7 8 9 10 11 12 13
22.5°C
80°C
0.00
5.00
10.00
15.00
20.00
25.00
30.00
10 20 30 40 50 60 70 80 90T (°C)
extraction%D (*E+10)logKowS/10UFVF

58
Figure 21. Comparison of the recoveries in MMLLE at 20 and 80°C. For compounds 12-14 the extraction yields at 20°C were minimal and could not be determined. Peak identification as in Fig. 13. Even though the recovery in MMLLE is usually enhanced with increasing temperature, it needs to be remembered that high temperatures also increase the possibility of evaporation of volatile analytes. This is important especially when an “open” MMLLE system is applied. PHWE–MMLLE is considered as a “closed” system since the sample cannot evaporate when coming via tubings from PHWE to MMLLE. In the study of hydrophobic pollutants in surface water, the effect of increased temperature on the extraction yield of the volatiles was negative because of evaporation of the most volatile analytes. Extraction was therefore carried out at ambient temperature (VI). 9.2. Trapping and clean-up in pressurised hot water extraction Different methods can be applied in the trapping of analytes in PHWE. In this research solid-phase trapping (I, II, IV), trapping into a solvent followed by liquid–liquid extraction (IV) and microporous membrane liquid–liquid extraction with flat sheet (II, IV) or hollow fibre (III, IV) configurations were tested. After trapping, the extract can be further cleaned, concentrated and fractionated as required. One possibility for doing this is liquid chromatography. 9.2.1. Solid-phase trapping The analytes extracted by PHWE are effectively retained in a solid-phase material. Some separation of different compound groups occurs, varying with the material. Usually, however, the aim is not optimal separation but to retain all the analytes and be able to elute them easily. A widely used solid-phase material, Tenax TA, was employed in the trapping experiments (I, II, IV). Tenax GR was studied as an alternative material, but compounds disturbing the analysis were co-eluted (Table 12). Two different particle sizes of Tenax TA were investigated, mesh 60/80 and mesh 80/100. As can be seen in Table 12, the material with smaller particle size, mesh 80/100, offered better
0
10
20
30
40
50
60
E (%)
1 2 3 4 5 6 7 8 9 10 11 12 13 14
stagnant acceptor, water ontop, 20°C
stagnant acceptor, water ontop, 80°C

59
retention. The selection of the particle size of Tenax TA is not facile, however, since blockage of the trap sometimes occur with this small-particle packing material leading to unrepeatable extractions. On the other hand, breakthrough is a problem with the large-particle packing material. Study of the effect of trap length showed serious breakthrough to occur with a 2 cm × 2.1 mm i.d. trap, while best results were obtained with a 5 cm × 2.1 mm i.d. trap. Table 12. Optimisation of the material and length of the solid-phase trap. Packing material Column dimensions Analyte retention (for PAHs and BFRs) Tenax TA, mesh 80/100 2 cm × 2.1 mm i.d. Insufficient Tenax TA, mesh 80/100 5 cm × 2.1 mm i.d. Good (Best) Tenax TA, mesh 60/80 5 cm × 2.1 mm i.d. Average Tenax GR, mesh 80/100 5 cm × 2.1 mm i.d. Material contained interfering components
The extract was eluted from the SP trap with either pentane–ethyl acetate (85:15, v/v) (I, II) or cyclohexane–ethyl acetate (90:10, v/v) (IV). Ethyl acetate was added to the main solvent to enhance the elution from Tenax TA material. Different compositions of elution solvents were studied (5–50% ethyl acetate). With on-line transfer of a 1.125 ml fraction to GC (I), 15% of ethyl acetate was found to be an upper limit for the co-solvent. Larger volumes caused problems in the injection. The analytes were eluted from the trap either to further LC clean-up (I) or 3 ml was collected, concentrated and injected off-line to GC (II, IV). 9.2.2. Collection into solvent and liquid–liquid extraction Trapping to solvent followed by liquid–liquid extraction was applied in a comparison of different sized extraction vessels for PHWE. Ten successive fractions from each extraction were collected by LLE, which proved a useful method for the purpose. Trapping to solvent was also compared with other trapping systems (IV). Only simple equipment is required in LLE, but much manual work (shaking, collection of organic layer, drying with sodium sulphate and concentration with nitrogen). Two solvents were investigated in LLE: toluene and cyclohexane–ethyl acetate (90:10, v/v). Toluene is a good solvent for PAHs and cyclohexane–ethyl acetate allowed comparison of the results with those obtained with MMLLE and solid-phase trapping. Comparison of the recoveries of PAH compounds in sediment showed no significant difference between the results obtained with the two extraction solvents (IV). The results obtained with cyclohexane–ethyl acetate (90:10, v/v) were slightly more repeatable (IV). In general, recoveries are good with LLE, but the method is not the most selective (IV).

60
9.2.3. Trapping with membrane techniques The optimisation of microporous membrane liquid–liquid extraction is described in section 9.1.2. When used as a trapping method with PHWE, MMLLE has to be optimised on the basis of the PHWE conditions. In MMLLE trapping, the extract is eluted with just a small volume of organic solvent, and it is also cleaned through size-exclusion of the membrane pores. Other advantages and disadvantages of MMLLE as a PHWE trap are presented in Table 13. 9.2.4. Comparison of trapping methods At the beginning of the study SPE was used as trapping method for the analytes. However, some problems associated with blockage of the trap were encountered and alternative trapping methods were sought. Traditional LLE is not suitable for on-line combination without phase separators and segmentors. Membrane trapping methods were therefore developed. The properties of the membrane trapping systems were compared with the more traditional trapping methods (by off-line GC analysis). The advantages and disadvantages of SPE, LLE, FS–MMLLE and HF–MMLLE (I, II, III, IV) are presented in Table 13. The methods are compared in quantitative terms in section 9.4. The easiest operation and the shortest total extraction times were achieved with PHWE–MMLLE techniques. Also, the consumption of organic solvents was lower with the membrane trapping methods than with SPE and LLE. The recoveries obtained with PHWE–MMLLE methods were lower than those obtained with PHWE–SPE and PHWE–LLE. The selectivity was studied by comparing the relative molar masses of different extract types by SEC and by investigating the spectral matches (peak purity) and chromatogram profiles in GC–MS. PHWE–MMLLE systems give a significantly cleaner extract than the other systems. As presented in Fig. 22., the selectivities of PHWE–LLE and PHWE–SPE could probably be improved by better choice of solvent and solid-phase material. All methods except PHWE–LLE can be connected on-line to GC. In summary, the choice of trapping system depends totally on the application.

61
Table 13. Comparison of the properties of different trapping systems in PHWE. Property PHWE–SPE PHWE–LLE PHWE–FS–
MMLLE PHWE–HF–MMLLE
Operation Relatively easy, concentration with N2 required
A lot of manual work (LLE, drying, concentration with N2)
Easy Easy
Number of manual steps after PHWE
2 3 0 0
Consumption of organic solvents
3 ml >5 ml 0.5 ml (elution) 0.5-1.0 ml (elution)
Extraction time ~1 h ~1 h 35 min 35 min Robustness Poor Average Good Average Recovery Good Good Relatively poor Relatively poor Selectivity + ~ +++ +++ On-line connection to GC
++ (requires clean-up)
~ ++ ++
Typical problems Blocking of the trap
Laborious manual work
Possible adsorption with insufficient clean-up
Gluing of the HF–MMLLE unit
Figure 22. GC-MS chromatogram of EC-1 sediment: A) SPE trapping (trap Tenax TA), B) LLE trapping (ethyl acetate–cyclohexane 10:90, v/v), C) Flat sheet MMLLE trapping, D) Hollow fibre MMLLE trapping.
1·106
2·106
3·106
4·106
5·106
6·106
7·106
8·106
9·106
Time (min)
Abundance
6.0 8.0 10.0 12.0 14.0 16.0 18.0 20.0 22.0 24.0 26.0 28.0 30.0 32.00
A
BCD

62
9.2.5. Clean-up with liquid chromatography In addition to the target analytes, solid materials such as soils and sediments contain large amounts of matrix substances, often present in higher concentrations than the target compounds. It is advisable to separate the disturbing compounds from the target analytes before GC analysis to avoid overloading of the column when large sample volumes are transferred to GC. If the trapping system is not selective enough, further clean-up is necessary and this can be effectively performed on-line with LC (I). Sometimes it is possible to use a solid-phase trap simultaneously as a LC separation column [28]. For LC clean-up, a column was sought with the capability of fractionating different compound groups, such as brominated flame retardants, PAHs and alkanes (I). The aim was to elute the fraction containing BFRs as a narrow band (small fraction) on-line to GC (I). Not only the column but also the eluent has an effect on the separation. If the whole fraction is to be transferred on-line to GC, the composition of the eluent has to be optimised taking into account the GC transfer conditions. Table 14 shows the LC columns and eluent compositions that were studied. Initially, an amino column was selected for the LC separation, but after its deterioration it was replaced by a cyano column capable of fractionating alkanes, PAH compounds and BFRs. The fraction containing the target compounds, BFRs, was 1.125 ml (I). Table 14. LC columns and eluents investigated for the fractionation of BFRs in PHWE-LC-GC (I). Column Type Eluent Fractionation
capability Capcell CN S-5 10 cm × 2.1 mm i.d. 5 µm particle size
Cyano Pentane, pentane/ethyl acetate (85:15, v/v) and cyclohexane/ ethyl acetate (85:15, v/v)
Poor
Spherisorb CN S-5 10 cm × 2.1 mm i.d. 5 µm particle size
Cyano Same as above Poor
Beckmann Ultrasphere Si, 10 cm × 2.0 mm i.d., 5 µm particle size
Silica Same as above Poor
Hypersil MOS 20 cm × 4.6 mm i.d. 5 µm particle size
Mixed mode Pentane, pentane/ethyl acetate (85:15, v/v) and pentane/ethyl acetate (50:50, v/v)
Poor
Asahipak NH2P-50 25 cm × 2.1 mm i.d. 5 µm particle size
Amino Pentane/ethyl acetate (85:15, v/v) Good
Luna Phenomenex 15 cm × 3.0 mm i.d. 5 µm particle size
Cyano Pentane/ethyl acetate (85:15, v/v) Good

63
9.3. Gas chromatography The optimisation of gas chromatographic methods consisted of examination of the injection or transfer conditions to GC, study of the temperature programming and evaluation of the developed method in terms of linearity, repeatability, recovery and detection limits. 9.3.1. Injection or transfer to gas chromatograph In the on-line extraction–analysis methods, the volume injected to GC has to be optimised according to the extract volume (I-III, VI). If the injection is made off-line, only a certain portion of the extract can be injected and the injection conditions can be optimised independently, still taking into account the properties of the extraction solvent, however (IV, V). In the on-line techniques of this research the whole extract was injected for analysis (0.142–1.125 ml) (I-III, VI), whereas in the off-line techniques the injection volume was 2–8 µl (IV, V). With partially concurrent solvent evaporation it is important that the extract is injected at a temperature below the solvent boiling point at prevailing pressure and that the injection rate is faster than the evaporation rate to allow the formation of solvent film. With toluene as the solvent, an injection temperature of 95°C was applied (carrier gas pressure 110 or 150 kPa) (II, VI) and with cyclohexane the injection temperature was 82°C (carrier gas pressure 100 kPa) (III). In the analysis of BFRs in sediment the transfer temperature (80°C at 150 kPa carrier gas pressure) was above the boiling point of the main solvent pentane, but below the boiling point of the co-solvent ethyl acetate. The closing time of the SVE was investigated by the flame method [182] or, in the case of toluene, by measuring the time liquid toluene was visibly emerging from the SVE. The SVE was closed slightly before the end of the evaporation of the solvent to avoid loss of volatiles. In the various studies, SVE was kept open between 35 s and 1 min 30 s after the injection was complete (I, II, III, VI). 9.3.2. Temperature programming Similar temperature programming was used in the different studies with PAHs (II, III, IV, V). The injection/transfer temperature depended on the extraction solvent. In the optimisation of the temperature programming it was important to achieve good separation between peak pairs phenanthrene/anthracene, benzo[b]fluoranthene/benzo[k]fluoranthene, benz[a]anthracene/chrysene and indeno[1,2,3-c,d]pyrene/dibenz[a,h]anthracene. For BFRs (I) the temperature could be raised rapidly to 180°C since the analytes are not very volatile. The step from 180°C to 260°C was made slow enough to allow the separation between BP4A and T23P. For pesticides (VI) the temperature was rapidly raised to 150°C and then a rate of 5°C/min was applied. Critical peak pairs were atrazine/lindan, metoxuron/metobromuron and procymidone/quinalphos.

64
9.4. Quantitative analysis The on-line extraction–analysis systems were applied in the determination of various pollutants in soil, sediment and water. Comparison of various trapping systems in PHWE was carried out with off-line determinations. 9.4.1. Characteristics of methods The quantitative features of the on-line extraction–analysis methods are compared in Table 15. The average linearities obtained with the various methods were good. The %RSDs of the repeatability of the retention times were in the range 0.1–0.4% on average, whereas the %RSDs for the repeatability of the peak areas were about 10%. The limits of detection obtained with PHWE–MMLLE techniques are given for a 5 mg sample amount (II, III). Where needed, the detection limits could be further decreased by using larger samples. As can be seen in Table 15, best absolute recovery is obtained by PHWE method where the analytes are trapped in solid-phase material (I). On the other hand, with methods employing MMLLE, high enrichment factors, good selectivity and low limits of detection are obtained and the extractions are repeatable despite the rather low recoveries. Table 15. Characterisation of on-line extraction–analysis methods: average linearity, repeatability of retention times and peak areas and limits of detection for spiked samples. Property PHWE–LC–GC PHWE–FS–
MMLLE–GC PHWE–HF–MMLLE–GC
MMLLE–GC
Average linearity 0.984 0.987 0.968 0.970 Repeatability tr (%RSD) 0.14 0.14 0.3 0.42 Repeatability A (%RSD) 10.5 7.8 10.4 9.5 LOD 1.67 ng/g 0.084 ng 0.242 ng (soil) 5.8 ng/l Recovery (%) 80 14.9 40.8 18.6 Paper I II III VI
The extraction yields and enrichment factors for hydrophobic pollutants in water obtained with MMLLE (VI) and with PHWE–flat sheet–MMLLE and PHWE–hollow fibre–MMLLE (II, III) were investigated and compared. The enrichment factors for MMLLE–GC of hydrophobic pollutants in water were 59.5 on average while the average recovery was 18.6% (VI). The extraction yields (%) obtained with PHWE–hollow fibre MMLLE–GC were significantly better than those obtained with PHWE–flat sheet MMLLE–GC (Fig. 23). The main reason for this was the higher flow-rate applied in PHWE–hollow fibre–MMLLE (1.0 ml/min vs 0.5 ml/min). In section 9.4.2., the two PHWE–MMLLE techniques (off-line) are compared with the same donor flow-rate (1.0 ml/min). As can be seen in Fig. 24, the extraction was more efficient with the SPE system than with MMLLE trapping (II), but the performance of a system can also be evaluated with other criteria than extraction efficiency. High enrichment factors and more selective extraction were obtained with PHWE–MMLLE and, importantly, the extraction was also repeatable.

65
Figure 23. Comparison of the extraction efficiencies (%) obtained with flat sheet and hollow fibre PHWE–MMLLE systems. Extraction conditions: PHWE–FS–MMLLE 50 min × 0.5 ml/min, PHWE–HF–MMLLE 30 min × 1.0 ml/min, T=300°C and p~10 bar in both methods (II, III). Peak identification of PAHs as in Fig. 13.
Figure 24. Comparison of absolute peak areas obtained with PHWE–SPE–GC (off-line) and on-line PHWE–MMLLE–GC (II) systems. Extraction: 50 min × 0.5 ml/min at 300°C. Peak identification of PAHs as in Fig. 13.
In quantitative analyses of real samples the amounts of BFRs were determined in sediments 1529:1 and JML, and the amounts of PAHs in soil from Husarviken and sediment samples Setoc and EC-1. The extraction yields obtained with different trapping systems in PHWE were compared for the various samples. Several surface water samples were studied for selected pesticides and PAHs.
0.0E+00
5.0E+07
1.0E+08
1.5E+08
2.0E+08
2.5E+08
3.0E+08
3.5E+08
4.0E+08
Area
1 2 3 4 5 6 7 8 9 10 11 12 13 14
PHWE-SPE
PHWE-MMLLE
0
10
20
30
40
50
60
70
80
90
Recovery (%)
1 2 3 4 5 6 7 8 9 10 11 12 13 14
PHWE-FS-MMLLEPHWE-HF-MMLLE

66
9.4.2. Determination of brominated flame retardants in sediments The standard compounds used in the determination of brominated flame retardants in sediments were only available as technical mixtures and it is possible therefore that the mixtures contained compounds that did not elute from the GC column in the temperature program applied. This may have led to overestimation of BFR concentrations in sediments. On the other hand, some peaks may have contained two or more isomers that were not separated from one another. Compared with an earlier study on BFRs [37] where a PHW extract was analysed off-line by GC-MS, values were now higher, especially for the most volatile BFRs. A possible explanation for this is that, in the off-line method, the extract had to be concentrated by evaporation before analysis and loss of volatile analytes could have occurred. With use of a closed PHWE–LC–GC system under optimised conditions there is no loss of volatile analytes (I). The amounts of BFRs determined in sediments 1529:1 and JML are presented in Fig. 25.
0
20
40
60
80
100
120
140
m (ng/g)
1 2 3 4
1529:1 (ng/g)JML (ng/g)
Figure 25. Amounts of BFR compounds determined in sediments 1529:1 and JML. Peak identification 1 tetrabromodichlorocyclohexane, 2 pentabromochlorocyclohexane, 3 hexabromobiphenyl (BP6), 4 heptabromobiphenyl.

67
9.4.3. Determination of polycyclic aromatic hydrocarbons in soil and sediment PHWE–FS–MMLLE–GC and PHWE–HF–MMLLE–GC were compared with each other and with other methods for their performance in quantitative analysis (II, III) of PAHs in soil (Fig. 26). Considering the standard deviations, the results obtained with the different methods compare well for most compounds.
Figure 26. The amounts of PAHs determined by different methods in a soil sample from Husarviken. Peak identification: 1 naphthalene, 2 acenaphthylene, 3 acenaphthene, 4 fluorene, 5 phenanthrene+anthracene, 6 fluoranthene, 7 pyrene 8 benz[a]anthracene+chrysene, 9 benzo[b]+[k]fluoranthene, 10 benzo[a]pyrene, 11 indeno[1,2,3-c,d]pyrene+dibenz[a,h]anthracene, 12 benzo[g,h,i]perylene. More detailed information on off-line PHWE and Soxhlet conditions is available in Ref. 206 and Papers II and III. The amounts of PAHs in the Setoc sediment were determined by PHWE–HF–MMLLE–GC (III) and were compared with the reference values obtained in a Setoc intercalibration study [207]. As can be seen in Fig. 27, the results were at the level of the reference values, confirming the reliability of the developed on-line method. Four trapping methods in PHWE (SPE, LLE, HF–MMLLE and FS–MMLLE) were compared in the determination of PAHs in four soil or sediment samples (IV). The extraction flow-rate was 1.0 ml/min with all the trapping methods, including PHWE–FS–MMLLE. The average recoveries (%) compared with results obtained with Soxhlet extraction are presented in Fig. 28. As can be seen, recoveries were highest with PHWE–LLE and PHWE–SPE. Because of the dynamic nature of MMLLE, 100% extraction yield cannot be achieved with PHWE–MMLLE methods, but the lower extraction yield can be compensated by the use of a recovery standard in the extractions. Another possibility is on-line coupling to GC, with the injection of the whole extract and calibration with the whole on-line system.
0
50
100
150
200
250
300
350
400
1 2 3 4 5 6 7 8 9 10 11 12
m ( µ
g/g)
PHWE-HF-MMLLE-GC
PHWE-FS-MMLLE-GC
PHWE
Soxhlet

68
Figure 27. Comparison of results obtained for PAHs in sediment with the PHWE–HF–MMLLE–GC system and in intercalibration study Setoc. Peak identification as in Fig. 19.
Figure 28. Comparison of the average recoveries of PAHs from soil and sediment samples obtained with different trapping systems in PHWE. The reliability of the results obtained with different trapping methods in PHWE was compared by analysing certified EC-1 sediment for PAHs and comparing the results with reference values [208]. The results of the comparison are presented in Fig. 29. Taking into account the standard deviations the results were on the same level with all the methods and the reliability was demonstrated.
0.0
20.0
40.0
60.0
80.0
100.0
120.0
140.0
160.0
Recovery (%)
LLE FSMMLLE HFMMLLE SPE
JMLSetocEC1Husarviken
0
0.5
1
1.5
2
2.5
3
3.5
4
1 2 3 4 5 6 7 8 9 10 11 12 13
m ( µ
g/g)
PHWE-HF-MMLLE-GC
Setoc

69
Figure 29. Amounts of PAHs determined in EC-1 sediment with different trapping methods. Peak identification: 1 phenanthrene, 2 anthracene, 3 fluoranthene, 4 pyrene, 5 benz[a]anthracene+chrysene, 6 benzo[b]+[k]fluoranthene, 7 benzo[a]pyrene, 8 indeno[1,2,3-c,d]pyrene+dibenz[a,h]anthracene, 9 benzo[g,h,i]perylene. 9.4.4. Analysis of hydrophobic pollutants in surface water The MMLLE–GC method was applied to the analysis of hydrophobic pollutants in several surface water samples, but no target analytes were found despite the low detection limits obtainable with the MMLLE–GC method. The waters were evidently not polluted. To demonstrate the applicability of the method for water analysis, a sample from the river Vantaa was spiked with the studied compounds. A representative chromatogram can be seen in Fig. 30. The method is also suitable for the determination of pesticide concentrations in dirtier samples, such as the water leached from fields after spraying.
0
5
10
15
20
25
30
1 2 3 4 5 6 7 8 9
m ( µ
g/g)
LLE FSMMLLEHFMMLLESPEreference

70
Figure 30. MMLLE–GC chromatogram of a spiked river water sample. Peak identification: 1 naphthalene, 2 fluorene, 3 diphenylamine (ISTD), 4 simazine, 5 atrazine, 6 lindan, 7 terbutylazine, 8 metoxuron, 9 metobromuron, 10 vinclozolin, 11 isoproturon, 12 chlortoluron, 13 metazachlor, 14 quinalphos, 15 procymidone, 16 endosulphan I, 17 endosulphan II, 18 endosulphan sulphate, 19 tetradifon.
0.0E+00
2.0E+05
4.0E+05
6.0E+05
8.0E+05
1.0E+06
1.2E+06
0 5 10 15 20 25 30 35
Time (min)
1
2
3
4
5
6 7 8 9 10
1112
13
14,15
1617
18
19

71
10. Conclusions Important advantages of on-line coupling of sample pretreatment and analysis techniques are minimal sample loss and elimination of the impact of atmospheric oxygen and human errors on the analysis. The methods developed in this research are selective and suitable for the analysis of small amounts of target analytes in complex matrices. Low detection limits are obtained by injecting or transferring the whole PHW or MMLL extract to gas chromatography for analysis. As another advantage, the consumption of organic solvents is minimal compared to traditional sample pretreatment methods. In this research the methods were automated starting from the transfer of the extract to LC or GC. In PHWE the valves had to be turned manually and in MMLLE the pumps were handled manually Probably all the on-line methods applied in this study could eventually be fully automated and become suitable for routine analysis. Selective extraction and clean extracts concentrated into a small volume of organic solvent were achieved by replacing SPE with an MMLLE unit as a trapping system in pressurised hot water extraction. Liquid chromatographic clean-up was not needed and simple apparatus could be applied. Since the MMLLE unit does not create high back-pressure, the PHW extraction could be carried out with steam. This is not possible if solid-phase extraction is used in trapping because of the back-pressure created by the trap. A hollow fibre MMLLE unit was constructed to be used as a trap in PHWE and an on-line PHWE–HF–MMLLE–GC method was developed. The construction, especially gluing of the fibres to the extraction unit, proved challenging and therefore alternative construction methods should be sought for the future. The method worked well in the determination of PAHs in soil and sediment and should also be applied to other analytes and matrices. The extraction efficiency and extract volume can be adjusted through the choice of number and length of the hollow fibres. The MMLLE–GC method developed for the analysis of hydrophobic pollutants in surface waters proved to be repeatable and to perform well. The method should be suitable for other aqueous samples as well. FID was used as detector in the on-line systems. GC–MS was used off-line in verification of the identification of the analytes. A good way to further develop the on-line methods would be to use a mass spectrometer as the detector. Even lower detection limits could be achieved and the identification of analytes could be confirmed. With clean extracts the detection with FID is sufficient. The reliability of the on-line methods was evaluated by comparing the results with those obtained by other methods and with reference values. Reliable quantification was achieved. For the future, the on-line methods could be further developed and their application range broadened.

72
In addition to the development of on-line coupled sample pretreatment and analysis methods, comparisons were made between different trapping methods in PHWE. In the trapping with SPE, LLE, flat sheet MMLLE and hollow fibre MMLLE, considerably different results were obtained in terms of recovery, repeatability and selectivity. Also, the operation of the various trapping methods differed. Clearly, the trapping method should be chosen according to the application. If high recoveries are preferred, trapping into organic solvent followed by liquid–liquid extraction might be the method of choice. If selectivity is more important, membrane extraction units would be better. As the use of a flat sheet membrane device is more straightforward than that of a hollow fibre unit, FS–MMLLE is recommended for use with PHWE. The effect of temperature on microporous membrane liquid–liquid extraction was studied in detail. As expected the extraction yields were increased with temperature. The main factors contributing to this enhancement were changes in solubility, diffusion, partition coefficient, membrane pore size and adsorption. The boiling point of the acceptor solvent nevertheless sets an upper limit for the extraction temperature. Consideration also has to be given to the undesirable evaporation possible from a heated system. Many of the problems associated with traditional sample pretreatment methods can be avoided with the systems developed in this research. Today environmental aspects are very important, and the use of organic solvents can be significantly decreased with these novel on-line systems. The new methods require significantly less manual work than the traditional ones, and the analyst can concentrate on the data analysis while the sample processing and analysis proceed on-line. Because on-line systems consist of many different parts, their use may be challenging in the beginning. After thorough optimisation, however, they are well suited for environmental analysis and, with minor modifications, should also be suitable for routine analysis.

73
11. References
1. T. Hyötyläinen, K. Hartonen, Trends Anal. Chem. 21 (2002) 13. 2. A. Balinova, J. Chromatogr. A 754 (1996) 125. 3. R.B. Geerdink, W.M.A. Niessen, U.A.Th. Brinkman, J. Chromatogr. A 970 (2002) 65. 4. M.S. Reisch, Business 4 (1997) 19. 5. F.A. Simonsen, L.M. Moller, T. Madsen, M. Stavnsbjerg, Brominated Flame Retardants: Toxicity
and Ecotoxicity, Danish Environmental Protection Agency, Project No. 568, 2000. 6. Å. Bergman, Organohal. Comp. 47 (2000) 36. 7. J.B. Manchester-Neesvig, K. Valters, W.C. Sonzogni, Environ. Sci. Technol. 35 (2001) 1072. 8. C. Bernes, Persistent Organic Pollutants, A Swedish View of an International Problem, AB Fälths
Tryckeri, Värnamo, 1998, p. 33. 9. S. Burreu, D. Broman, U. Örn, Chemosphere 40 (2000) 977. 10. K. Hooper, A. McDonald, Environ. Health Persp. 108 (2000) 387. 11. Scifinder Scholar 2002, American Chemical Society. 12. C. Venkataraman, J.M. Lyons, S.K. Friedlander, Environ. Sci. Technol. 28 (1994) 555. 13. A.C. Lewis, D. Kupiszewska, K.D. Bartle, M.J. Pilling, Atmospheric Environment 29 (1995) 1531. 14. R. Atkinson, J. Arey, Environ. Health Persp. 102 Suppl. 4 (1994) 555. 15. A. Björseth (ed.) Handbook of Polycyclic Aromatic Hydrocarbons, Vol. 1, Dekker, New York, 1983. 16. www.epa.gov/pesticides, 1.10.2003. 17. J.W. Moore, E.A. Moore, Environmental Chemistry, Academic Press, New York, USA, 1976, p.
449. 18. H. Salem, E.J. Olajos, Toxicol. Indust. Health 4 (1988) 291. 19. I.A. Al-Saleh, J. Environ. Pat. Toxic. Oncol. 13 (1994) 151. 20. S.B. Hawthorne, C.B. Grabanski, E. Martin, D.J. Miller, J. Chromatogr. A 892 (2000) 421. 21. S.B. Hawthorne, D.J. Miller, Anal. Chem. 66 (1994) 4005. 22. M. Notar, H. Leskovsek, Fresenius J. Anal. Chem. 358 (1997) 623. 23. S. Bowadt, S.B. Hawthorne, J. Chromatogr. A 703 (1995) 549. 24. S. Bowadt, L. Mazeas, D.J. Miller, S.B. Hawthorne, J. Chromatogr. A 785 (1997) 205. 25. V. Janda, K.D. Bartle, A.A. Clifford, J. Chromatogr. 642 (1993) 283. 26. N. Saim, J.R. Dean, M.P. Abdullah, Z. Zakaria, J. Chromatogr. A 791 (1997) 361. 27. J. Pörschmann, J. Plugge, Fresenius J. Anal. Chem. 364 (1999) 643. 28. T. Hyötyläinen, T. Andersson, K. Hartonen, K. Kuosmanen, M.-L. Riekkola, Anal. Chem. 72 (2000)
3070. 29. K. Hartonen, G. Meissner, T. Kesälä, M.-L. Riekkola, J. Microcol. Sep. 12 (2000) 412. 30. S.B. Hawthorne, S. Trembley, C.L. Moniot, C.B. Grabanski, D.J. Miller, J. Chromatogr. A 886
(2000) 237. 31. Y. Yang, B. Li, Anal. Chem. 71 (1999) 1491. 32. K. Nylund, L. Asplund, B. Jansson, P. Jonsson, K. Litzén, U. Sellström, Chemosphere 24 (1992)
1721. 33. U. Sellström, A. Kierkegaard, C. de Wit, B. Jansson, Environ. Toxicol. Chem. 17 (1998) 1065. 34. U. Sellström, A. Kierkegaard, C. de Wit, B. Jansson, L. Asplund, L. Bergander, A. Bignert, T.
Odsjö, M. Olsson, Organohal. Comp. 28 (1996) 526. 35. U. Sellström, B. Jansson, Chemosphere 31 (1995) 3085. 36. C.R. Allchin, R.J. Law, S. Morris, Environ. Poll. 105 (1999) 197. 37. T. Hyötyläinen, K. Hartonen, S. Säynäjoki, M.-L. Riekkola, Chromatographia 53 (2001) 301. 38. K. Hartonen, S. Bowadt, S.B. Hawthorne, M.-L. Riekkola, J. Chromatogr. A 774 (1997) 229. 39. A.J. Handley, Extraction Methods in Organic Analysis, Sheffield Academic Press, Sheffield, 1999,
p. 3. 40. C. Blasco, G. Font, J. Mañes, Y. Pico, Anal. Chem. 75 (2003) 3606. 41. L. Wennrich, P. Popp, J. Breuste, Chromatographia Suppl. 53 (2001) S380. 42. C. Bicchi, C. Cordero, P. Rubiolo, P. Sandra, Eur. Food Res. Tech. 216 (2003) 449. 43. P. Sandra, B. Tienpont, F. David, J. Chromatogr. A 1000 (2003) 299. 44. B. Gevao, C. Mordaunt, K.T. Semple, T.G. Pierce, K.C. Jones, Environ. Sci. Technol. 35 (2001) 501. 45. U.I. Garimella, G.K. Stearman, M.J. Wells, J. Agric. Food Chem. 48 (2000) 5874. 46. K.K. Chee, M.K. Wong, M.K. Lee, Anal. Chim. Acta 330 (1996) 217.

74
47. R.W. Baker in chapter Membrane Separation in Encyclopedia of Separation Science (Ed.-in-Chief I.D. Wilson) Vol. 1, Academic Press, New York, 2000, p. 189-210.
48. J.Å. Jönsson, L. Mathiasson, Trends Anal. Chem. 11 (1992) 106. 49. J.Å. Jönsson, L. Mathiasson, Trends Anal. Chem. 18 (1999) 318. 50. J.Å. Jönsson, L. Mathiasson, Trends Anal. Chem. 18 (1999) 325. 51. J.Å. Jönsson, L. Mathiasson, Chromatographia Suppl. 52 (2000) S8. 52. J.Å. Jönsson, L. Mathiasson, J. Chromatogr. A 902 (2000) 205. 53. B.M. Cordero, J.L. Peréz Pavón, C.G. Pinto, E.F. Laespada, R.C. Martínez, E.R. Gonzalo, J.
Chromatogr. A 902 (2000) 195. 54. J.Å. Jönsson, L. Mathiasson, Advances in chromatography, 41, eds. P. Brown, E. Grushka. Marcel
Dekker, Inc., New York 2001, p.53-91. 55. J.Å. Jönsson, L. Mathiasson, J. Sep. Sci. 24 (2001) 495. 56. J.Å. Jönsson, L. Mathiasson, LCGC Europe 16 (2003) 683. 57. L. Chimuka, L. Mathiasson, J.Å. Jönsson, Anal. Chim. Acta 416 (2000) 77. 58. L. Jing-Fu, C. Jing-Bo, J. Gui-Bin, Anal. Chim. Acta 455 (2002) 93. 59. O.B. Jonsson, U. Nordlöf, U. L. Nilsson, Anal. Chem. 75 (2003) 3506. 60. O.B. Jonsson, E. Dyremark, U.L. Nilsson, J. Chromatogr. B 755 (2001) 157. 61. Y. Shen, J.Å. Jönsson, L. Mathiasson, Anal. Chem. 70 (1998) 946. 62. K.E. Rasmussen, S. Pedersen-Bjergaard, M. Krogh, H.G. Ugland, T. Gronhaug, J. Chromatogr. A
873 (2000) 3. 63. S. Andersen, T.G. Halvorsen, S. Pedersen-Bjergaard, K.E. Rasmussen, L. Tanum, H. Refsum, J.
Pharm. Biomed. Anal. 33 (2003) 263. 64. L. Hou, G. Shen, H.K. Lee, J. Chromatogr. A 985 (2003) 107. 65. H. J. Cortes, L.S. Green, R.M. Campbell, Anal. Chem. 63 (1991) 2719. 66. M. Shimmo, T. Hyötyläinen, K. Hartonen, M.-L. Riekkola, J. Microcolumn Sep. 13 (2001) 202. 67. S.B. Hawthorne, D.J. Miller, M.S. Krieger, J. Chromatogr. Sci. 27 (1989) 347. 68. N.C. van de Merbel, J. Chromatogr. A 856 (1999) 55. 69. S.B. Hawthorne, Y. Yang, D.J. Miller, Anal. Chem. 66 (1994) 2912. 70. T.M. Pawlowski, C.F. Poole, J. Agric. Food Chem. 46 (1998) 3124. 71. A. Basile, M.M. Jiménez-Carmona, A.A. Clifford, J. Agric. Food Chem. 46 (1998) 5205. 72. S. Inoue, M. Asaga, T. Ogi, Y. Yazaki, Holzforschung 52 (1998) 139. 73. H. Daimon, J, Pawliszyn, Anal. Commun. 33 (1996) 421. 74. S.B. Hawthorne, A. Kubátová in Chapter “Hot (subcritical) water extraction” in “Comprehensive
Analytical Chemistry, Sampling and Sample Preparation for Field and Laboratory” by J. Pawliszyn, Edited by D. Barceló, Elsevier, 2002, p. 587-607.
75. K. Hartonen, “Supercritical Fluid Extraction and Pressurized Hot Water Extraction – Novel Environmentally Friendly Analytical Techniques, Biological and Environmental Applications”, Doctoral thesis, University of Helsinki, Helsinki, 1999, p.26-32.
76. A. Kubátová, B. Jansen, J.-F. Vaudoisot, S.B. Hawthorne, J. Chromatogr A 975 (2002) 175. 77. D.J. Miller, S.B. Hawthorne, Anal. Chem. 70 (1998) 1618. 78. T. Andersson, K. Hartonen, T. Hyötyläinen, M.-L. Riekkola, Analyst 128 (2003) 150. 79. L. Ramos, E.M. Kristenson, U.A.Th. Brinkman, J. Chromatogr. A 975 (2002) 3. 80. R.M. Smith, J. Chromatogr. A 975 (2002) 31. 81. Y. Yang, S.B. Hawthorne, D.J. Miller, Environ. Sci. Technol. 31 (1997) 430. 82. K. Hartonen, G. Meissner, T. Kesälä, M.-L. Riekkola, J. Microcol. Sep. 12 (2000) 412. 83. Y. Yang, S. Bowadt, S.B. Hawthorne, D.J. Miller, Anal. Chem. 67 (1995) 4571. 84. B. van Bavel, K. Hartonen, C. Rappe, M.-L. Riekkola, Analyst 124 (1999) 1351. 85. T. Andersson, K. Hartonen, T. Hyötyläinen, M.-L. Riekkola, Anal. Chim. Acta 466 (2002) 93. 86. S. Rovio, K. Hartonen, Y. Holm, R. Hiltunen, M.-L. Riekkola, Flavour Fragr. J. 14 (1999) 399. 87. M.S.S. Curren, J.W. King, J. Agric. Food Chem. 49 (2001) 2175. 88. V. Fernández-Pérez, M.D. Luque de Castro, J. Chromatogr. A 902 (2000) 357. 89. M.M. Jiménez-Carmona, V. Fernández-Pérez, M.J. Gualda-Bueno, J.M. Cabanás-Espejo, M.D.
Luque de Castro, Anal. Chim. Acta 395 (1999) 113. 90. S. Morales-Muñoz, J.L. Luque-García, M.D. Luque de Castro, Spectrochim. Acta Part B 58 (2003)
159. 91. M.D. Luque de Castro, personal communication, Brugge, 2/2002.

75
92. K. Hartonen, K. Inkala, M. Kangas, M.-L. Riekkola, J. Chromatogr. A 785 (1997) 219. 93. S.B. Hawthorne, C.B. Grabanski, K.J. Hageman, D.J. Miller, J. Chromatogr. A 814 (1998) 151. 94. K.J. Hageman, L. Mazeas, C.B. Grabanski, D.J. Miller, S.B. Hawthorne, Anal. Chem. 68 (1996)
3892. 95. L. Wennrich, P. Popp, J. Breuste, Chromatographia Suppl. 53 (2001) S-380. 96. T.E. Yang, S.T. Ecker, R.E. Synovec, N.T. Hawley, J.P. Lomber, C.M. Wai, Talanta 45 (1998)
1189. 97. R. Tajuddin, R.M. Smith, Analyst 127 (2002) 883. 98. L.N. Konda, G. Füleky, G. Morovján, J. Agric. Food. Chem. 50 (2002) 2338. 99. M.S. Krieger, W.L. Cook, L.M. Kennard, J. Agric. Food Chem. 48 (2000) 2178. 100. M.S. Krieger, J.L. Wynn, R.N. Yoder, J. Chromatogr. A 897 (2000) 405. 101. C. Crescenzi, G. D’Ascenzo, A. Di Gorcia, M. Nazzari, S. Marchese, R. Samperi, Anal. Chem. 71
(1999) 2157. 102. E. Ibañez, A. Kubátová, F.J. Señoráns, S. Cavero, G. Reglero, S.B. Hawthorne, J. Agric. Food
Chem. 51 (2003) 375. 103. M.M. Jiménez-Carmona, J.L. Ubera, M.D. Luquede Castro, J. Chromatogr. A 855 (1999) 625. 104. R.S. Ayala, M.D. Luque de Castro, Food Chem. 75 (2001) 109. 105. M. Ollanketo, A. Peltoketo, K. Hartonen, R. Hiltunen, M.-L. Riekkola, Eur. Food. Res. Technol.
215 (2002) 158. 106. J. Suomi, H. Sirén, K. Hartonen, M.-L. Riekkola, J. Chromatogr. A 868 (2000) 73. 107. A. Kubátová, D.J. Miller, S.B. Hawthorne, J. Chromatogr. A 923 (2001) 187. 108. M.S.S. Curren, J.W. King, J. Chromatogr. A 954 (2002) 41. 109. E.S. Ong, S.M. Len, Anal. Chim. Acta 482 (2003) 81. 110. V. Fernández-Pérez, M.D. Luque de Castro, Anal. Bioanal. Chem. 375 (2003) 437. 111. Ref. 39, Section by A.J. Holden, p. 5-53. 112. Ref. 39, Section by A.J. Handley and R.D. McDowall, p. 54-74. 113. D.C. Turnell, J.D.H. Cooper, J. Chromatogr. 395 (1987) 613. 114. G.A. Audunsson, Anal. Chem. 58 (1986) 2714. 115. L. Chimuka, M.M. Nindi, M.E.M. ElNour, H. Frank, C. Velasco, J. High Resol. Chromatogr. 22
(1999) 417. 116. E. Thordarsson, J.Å. Jönsson, J. Emnéus, Anal. Chem. 72 (2000) 5280. 117. P. Dzygiel, P. Wieczorek, J. Sep. Sci. 24 (2001) 561. 118. O.C. Keller, J. Buffle, Anal. Chem. 72 (2000) 943. 119. S.P. Singh, A.P. Argekar, Sep. Sci. Technol. 38 (2003) 3747. 120. R.G. Melcher, Anal. Chim. Acta 214 (1988) 299. 121. Ref. 39, Section by Y. Luo and J. Pawliszyn, p. 75-99. 122. T. Kotiaho, J. Mass Spectrom. 31 (1996) 1. 123. G.A. Audunsson, Anal. Chem. 60 (1988) 1340. 124. L. Grönberg, P. Lövkvist, J.Å. Jönsson, Chromatographia 33 (1992) 77. 125. L. Chimuka, “Sample preparation of organic compounds in environmental analysis using liquid
membrane extraction”, Doctoral thesis, Lund University, Lund 2001. 126. Y. Sahleström, B. Karlberg, Anal. Chim. Acta 179 (1986) 315. 127. P.W. Atkins, Physical Chemistry, 5th Edition, Oxford University Press, Oxford 1995, p. 271-310. 128. Ref. 127, p.850. 129. O.B. Jonsson, U.L. Nilsson, J. Sep. Sci. 26 (2003) 886. 130. J. Norberg, E. Thordarsson, Analyst 125 (2000) 673. 131. K. Ndungu, L. Mathiasson, Anal. Chim. Acta 404 (2000) 319. 132. J. Norberg, E. Thordarsson, L. Mathiasson, J.Å. Jönsson, J. Chromatogr. A 869 (2000) 523. 133. L. Jing-fu, J. Gui-bin, Microchem. J. 68 (2001) 29. 134. M. Sandahl, L. Mathiasson, J.Å.Jönsson, J. Chromatogr. A 893 (2000) 123. 135. M. Sandahl, L. Mathiasson, J.Å.Jönsson, J. Chromatogr. A 975 (2002) 211. 136. M. Sandahl, E. Úlfsson, L. Mathiasson, Anal. Chim. Acta 424 (2000) 1. 137. Q. Zhou, J. Liu, Y. Cai, G. Liu, G. Jiang, Microchem. J. 74 (2003) 157. 138. T. Hyötyläinen, T. Tuutijärvi, K. Kuosmanen, M.-L. Riekkola, Anal. Bioanal. Chem. 372 (2002)
732.

76
139. T. Hyötyläinen, T. Andersson, M. Jussila, S.K. Wiedmer, M. Rautiainen and M.-L. Riekkola, J. Sep. Sci. 24 (2001) 544.
140. K. Grob, M. Biedermann, J. Chromatogr. A 750 (1996) 11. 141. K. Grob, “On-column Injection in Capillary Gas Chromatography”, Heidelberg, Hüthig,
Germany, 1987. 142. W. Engewald, J. Teske, J. Efer, J. Chromatogr. A 856 (1999) 259. 143. W. Vogt, K. Jacob, H.W. Obwexer, J. Chromatogr. 174 (1979) 437. 144. K. Grob, Z. Li, J. High Resolut. Chromatogr. Chromatogr. Commun. 11 (1988) 626. 145. H.G.J. Mol, H.-G. Janssen, A.A. Cramers, U.A.Th. Brinkman, J. High Resolut. Chromatogr. 18
(1995) 19. 146. K. Grob, “On-line Coupled LC-GC”, Heidelberg, Hüthig, 1991. 147. J. Teske, W. Engewald, Trends in Anal. Chem. 21 (2002) 584. 148. T. Hyötyläinen, M.-L. Riekkola, J. Chromatogr. A 1000 (2003) 357. 149. K. Grob, M. Biedermann, J. Chromatogr. A 750 (1996) 11. 150. K. Grob, J.-M. Stoll, J. High. Resol. Chromatogr. Chromatogr. Commun. 9 (1986) 518. 151. W. Vogt, K. Jacob, H.W. Obwexer, J. Chromatogr. 174 (1979) 437. 152. H.G.J. Mol, H.-G. Janssen, C.A. Cramers, U.A.Th. Brinkman, J. High Resol. Chromatogr. 18
(1995) 19. 153. K. Grob, Z. Li, J. High. Resol. Chromatogr. Chromatogr. Commun. 11 (1988) 626. 154. K. Grob, S. Brem., D. Fröchlich, J. High Resol. Chromatogr. 15 (1992) 659. 155. K. Grob, S. Brem, J. High Resol. Chromatogr. 15 (1992) 715. 156. L. Mondello, P. Dugo, G. Dugo, A.C. Lewis, K.D. Bartle, J. Chromatogr. A 842 (1999) 373. 157. K. Grob, J. Chromatogr. A 892 (2000) 407. 158. L. Mondello, G. Dugo, K.D. Bartle, LC-GC International Jan (1998) 26. 159. T. Hyötyläinen, M.-L. Riekkola, LC-GC Europe Sep (2000) 658. 160. T. Hyötyläinen, M.-L. Riekkola, Recent Res. Devel. Anal. Chem. 1 (2001) 21. 161. R.E. Majors, J. Chromatogr. Sci. 18 (1980) 571. 162. M. Biedermann, K. Grob, W. Meier, J. High Resol. Chromatogr. 295 (1989) 591. 163. K. Grob, M. Bronz, J. Microcol. Sep. 7 (1995) 421. 164. G. Schomburg, H. Behlau, R. Dielmann, F. Weeke, H. Husmann, J. Chromatogr. 142 (1977) 87. 165. K. Grob, K. Grob Jr., J. Chromatogr. 151 (1978) 311. 166. K. Grob, K. Grob Jr., J. Chromatogr. 213 (1981) 3. 167. K. Grob Jr., J. Chromatogr. 213 (1981) 3. 168. Ref. 141, p. 7. 169. F. Munari, A. Trisciani, G. Mapelli, S. Trestianu, K. Grob, J.M. Colin, J. High Resol. Chromatogr.
Chromatogr. Commun. 8 (1985) 601. 170. M.-L. Riekkola, T. Hyötyläinen, ”Column Chromatography and Capillary Electromigration
Techniques” (in Finnish), Yliopistopaino, Helsinki, 2000. 171. Ref. 146, p. 183-272. 172. Ref. 146, p. 316-381. 173. K. Grob, E. Müller, J. High Resol. Chromatogr. & Chromatogr. Commun. 11 (1988) 388. 174. K. Grob, E. Müller, J. High Resol. Chromatogr. & Chromatogr. Commun. 11 (1988) 560. 175. J. Staniewski, H.-G. Janssen, C.A. Cramers, J.A. Rijks, J. Microcol. Sep. 4 (1992) 331. 176. Ref. 141, p. 357. 177. Ref. 141, p. 245. 178. Ref. 146, p. 28-62. 179. E. Boselli, B. Grolimund, K. Grob, G. Lercker, R. Amadò, J. High Resol. Chromatogr. 21 (1998)
355. 180. E. Boselli, B. Grolimund, K. Grob, G. Lercker, R. Amadò, J. High Resol. Chromatogr. 21 (1998)
378. 181. E. Boselli, B. Grolimund, K. Grob, G. Lercker, R. Amadò, J. High Resol. Chromatogr. 22 (1999)
327. 182. Ref. 146, p.116-150. 183. E. Boselli, K. Grob, G. Lercker, J. High Resol. Chromatogr. 22 (1999) 149. 184. T. Hyötyläinen, M.-L. Riekkola, submitted to Anal. Bioanal. Chem. 185. J. Roeraade, J. Chromatogr. 330 (1985) 263.

77
186. E. Fogelqvist, M. Krysell, L.-G. Danielsson, Anal. Chem. 61 (1989) 101. 187. E.C. Goosens, R.G. Bunschoten, V. Engelen, D. de Jong, J.H.M. van den Berg, J. High Resolut.
Chromatogr. 13 (1990) 438. 188. P.J.M. Kwakman, J.J. Vreuls, U.A.Th. Brinkman, R.T. Ghijsen, Chromatographia 34 (1992) 41. 189. A.J.H. Louter, E. Bosma, J.C.A. Schipperen, J.J. Vreuls, U.A.Th. Brinkman, J. Chromatogr. B 689
(1997) 35. 190. T.H.M. Noij, M.-E. van der Kooij, J. High Resolut. Chromatogr. 18 (1995) 535. 191. E. Pocurull, C. Aguilar, F. Borrul, R.M. Marcé, J. Chromatogr. A 818 (1998) 85. 192. D. Jahr, Chromatographia 47 (1998) 49. 193. E. Noroozian, F.A. Maris, M.W.F. Nielen, R.W. Frei, G.J. de Jong, U.A.Th. Brinkman, J. High
Resolut. Chromatogr. Chromatogr. Commun. 10 (1987) 17. 194. S.B. Hawthorne, D.J. Miller, J. Chromatogr. 403 (1987) 63. 195. S.B. Hawthorne, D.J. Miller, M.S. Krieger, J. Chromatogr. Sci. 27 (1989) 347. 196. M. Lohleit, K. Bächmann, J. Chromatogr. 505 (1990) 227. 197. H.J. Cortes, L.S. Green, R.M. Campbell, Anal. Chem. 63 (1991) 2719. 198. M. Shimmo, H. Adler, T. Hyötyläinen, K. Hartonen, M. Kulmala, M.-L. Riekkola, Atmos.
Environ. 36 (2002) 2985. 199. M. Ericsson, A. Colmsjö, J. Chromatogr. A 964 (2002) 11. 200. M. Ericsson, A. Colmsjö, Anal. Chem. 75 (2003) 1713. 201. C. Sanchez, M. Ericsson, H. Carlsson, A. Colmsjö, J. Chromatogr. A 993 (2003) 103. 202. C. Sanchez, M. Ericsson, H. Carlsson, A. Colmsjö, E. Dyremark, J. Chromatogr. A 957 (2002)
227. 203. E. Gruschka, E.J. Kikta Jr., J. Phys. Chem. 78 (1974) 2297. 204. T. Andersson, T. Pihtsalmi, K. Hartonen, T. Hyötyläinen, M.-L. Riekkola, Anal. Bioanal. Chem.
376 (2003) 1081. 205. E. Manoli, C. Samara, Trends Anal. Chem. 18 (1999) 417. 206. J. Kronholm, J. Kalpala, K. Hartonen, M.-L. Riekkola, J. Supercr. Fluids 23 (2002) 12. 207. Quarterly report 98.4: International Sediment Exchange for Tests of Organic Contaminants,
Wageningen Evaluating Programmes for Analytical Laboratories, 1998. 208. Summary of Organic Contaminant Concentrations in NWRI’s Sediment Reference Materials,
National Water Research Institute, Environment Canada, 2000.