On electrode erosion in fluorescent lamps during instant start
100
On electrode erosion in fluorescent lamps during instant start Inauguraldissertation zur Erlangung des akademischen Grades doctor rerum naturalium (Dr. rer. nat.) an der Mathematisch-Naturwissenschaftlichen F akultat der Ernst-Moritz-Arndt-Universitat Greifswald vorgelegt von Stefan Hadrath geboren am 06. 05. 1978 in Anklam Greifswald, September 2006
-
Upload
khangminh22 -
Category
Documents
-
view
1 -
download
0
Transcript of On electrode erosion in fluorescent lamps during instant start

On electrode erosion in fluorescent lamps duringinstant start
Inauguraldissertation
zur
Erlangung des akademischen Grades
doctor rerum naturalium (Dr. rer. nat.)
an der
Mathematisch-Naturwissenschaftlichen F akultat
der
Ernst-Moritz-Arndt-Universitat Greifswald
vorgelegt von
Stefan Hadrath
geboren am 06. 05. 1978
in Anklam
Greifswald, September 2006

Dekan:
1. Gutachter:
2. Gutachter:
Prof. Dr. Klaus Fesser
Prof. Dr. Jurgen Ropcke
Prof. Dr. Peter Awakowicz
Tag der Promotion : 02. 03.2007

OS RAM osr<§
This work is supported by Osram GmbH.


Contents
1 Introduction 7
2 Fluorescent lamps 132.1 Ignition of a fluorescent lamp discharge.................................................... 13
2.1.1 Starting circuits of fluorescent lamps............................................. 142.1.2 Control gears for fluorescent lamps ............................................. 14
2.2 The electrode region ...................................................................................... 15
3 Experiment 193.1 Fluorescent lamps and the hollow cathode lamp...................................... 193.2 Laser-induced fluorescence............................................................................ 22
3.2.1 The rate equations ............................................................................ 233.2.2 The saturation parameter .................................................................. 243.2.3 The LIF setup...................................................................................... 263.2.4 Absolute calibration methods ....................................................... 293.2.5 Determination of total densities.................................................... 32
3.3 Emission spectroscopy................................................................................... 333.3.1 The OES setup ................................................................................... 35
3.4 Temperature measurements of the diffuse and spot modes..................... 36
4 Investigation on a hollow cathode lamp 394.1 Collisional effects............................................................................................. 394.2 Saturation parameter...................................................................................... 404.3 Influence on saturation due to an inhomogeneous laser profile.............. 424.4 Correction of the fluorescence intensity for a Gauss-shaped laser profile 434.5 Determination of tungsten densities in the hollow cathode lamp .... 464.6 Model of the tungsten density in the hollow cathode lamp..................... 48
5 Investigation of tungsten erosion processes in fluorescent lamps 515.1 Reason of tungsten erosion............................................................................ 515.2 The low-pressure dc argon discharge ........................................................... 525.3 Commercial fluorescent lamps..................................................................... 57
5.3.1 Investigation of early failure lamps................................................ 57
5

6 Contents
5.3.2 Fluorescence measurements on commercial fluorescent lamps 605.3.3 Determination of total densities................................................. 67
5.4 Temperature measurements and modeling of the diffuse and spotmodes in a low-pressure dc argon discharge .......................................... 685.4.1 Experimental results .................................................................... 695.4.2 Thermal model of the electrode ................................................. 70
6 Conclusion 73
A Appendix 77A.1 Spectral and temporal line profiles for correction of the rate equations 77 A.2 The fluorescence cross section................................................................. 78
Glossary 88
Danksagung 93
Eidesstattliche Erklarung 95
Curriculum vitae 97
List of publications and contributions 99

Chapter 1
Introduction
Johann Heinrich Goebel, a German watchmaker, invented the first light bulb in 1854. This idea was further developed by Thomas Edison and led to a breakthrough of incandescent lamps in 1879.
Nowadays, electric discharge lamps are used to generate artificial light. Presently, its relative part of the light work is more than 90 % [Rutscher and Deutsch 1983]. Because there are dozens of different types of discharge lamps, only a few light sources of major importance which together account for 99% of the light produced by electric discharge lamps should be named: high-pressure mercury lamps, low- and high- pressure sodium lamps, metal-halide arc lamps, and fluorescent lamps, latter observed in this work.
Fluorescent lamps Electric discharges in gases at low pressure have been known almost since the invention of methods to remove part of the air from inside a container. In 1705, Francis Hawksbee [Hawksbee 1705] produced the first hand-made glow discharge recorded in history by electrostatically charging the outside of a glass globe from which he had evacuated the air with one of VON Guericke’s vacuum pumps.
This and some other early "discharge lamps" were characterized by relatively low selectivity; electrical energy supplied to the discharge was dissipated in a variety of ways. Elastic collisions of electrons with gas atoms resulting in the generation of heat, the excitation of many different spectral lines, and inefficient electrodes for injecting electron current into the gas resulted in a lost of energy among many processes, with the result that no one of them commanded a significant fraction. Hence, such devices were comparatively inefficient as light sources.
In the 1920s, however, it was discovered that a discharge through a mixture of mercury vapor at a precise optimum pressure [Kuz’menko et al. 2000] and a rare gas at a somewhat higher pressure was phenomenally efficient in converting electrical energy into ultraviolet light. Fully 70 % of the electrical energy input to an uniform section of such a discharge column could be radiated in a single line of the mercury spectrum [Eckhardt 1967], the 253.7nm resonance line originating on the 63P2 state and terminating on the 61S0 ground-state of the mercury atom.
7

8 Chapter 1. Introduction
The development of practical commercial lamps based on this principle required two other inventions: a suitable fluorescent phosphor for application to the walls of the tube to convert the invisible ultraviolet radiation into visible light [Lankhorst and Niemann 2000], and efficient long-lived electrodes. Both of these were developed in the late 1930s, and the fluorescent lamp became commercially available in the 1940s.
In the following a review of significant lamp patents and milestones of the last 60 years of lighting research is listed [Osram 2005]. The electrodes were improved by introducing the primary coil by Sylvania in 1940 and the triple coil by General Electric (GE) in 1941. In 1950 GE designed lamp ballasts1 and special electrodes for rapid start of fluorescent lamps. By introducing of amalgam lamps in 1958 by OSRAM the dependence of the light output on the ambient temperature was reduced [Lankhorst and Niemann 2000; Lankhorst et al. 2000; Kuz’menko et al. 2000]. Improved possibilities to insert mercury in fluorescent lamps was presented in 1969 by Philips and in 1985 by Osram; latter in solid manner. Globally introduced in the early 1980s, compact fluorescent lamps became a cost-effective, efficient alternative to the incandescent lamp [Williams 1975; Proud 1983]. In 1981 Osram offered first electronic control gears to improve the efficiency of fluorescent lamps [Rozenboom 1983] (see section 2.1). The first electrodeless fluorescent lamp (QL) was introduced by Philips in 1991 [Wharmby 1989]. A new technology for reducing mercury consumption with Y2O3 protective films was presented in 1998 [Matsuo et al. 1998]. Another recent introduction is a range of T5 diameter lamps (T5 = 5/12 inch), using the three-band phosphors. They have very high lamp efficacies of around 100 lmW-1. These are for use in high-specification general lighting applications. The smaller diameter has many optical advantages for the designers of high-performance luminaries [Abeywickrama 1997].
Nowadays, fluorescent lamps generate more than 70% of all the artificial light in the world but consume only 50% of the energy needed for lighting. They need only about one fifth of the electricity that an ordinary light bulb needs. Depending on the type and the way in which they work, their average lifetime is between 5,000 and 45,000 hours, whereas a light bulb lasts only for 1,000 hours [Osram 2005]. The efficacies of the lamps can now achieve 100 lmW-1 or more compared to around 35 lm W-1 in 1940 [Abeywickrama 1997].
New electrodes to compatible economical and environmental claims All times, light bulbs have been continuously improved with innovative approaches to producing light based on new materials. The technical advancements of the past few years were mainly focused on two goals: developing more economical, energy-saving solutions and ensuring maximum environmental compatibility [Osram 2005].
For example, two years ago OSRAM unveiled a new xenon headlight that is com
1A ballast is a device used to start a gas discharge lamp, and, once the lamp is started, to limit the flow of electric current.

9
pletely mercury-free [Siemens 2005]. With this mercury-free xenon lamp, an environmentally friendly system for high-quality car headlights is provided. Zinc iodide is used instead of mercury. This alternative compound has the benefit of greater colour stability.
When lighting systems contain not only lamps but also electronic control gear and electronic systems, energy consumption can be cut by up to 30 % and lamp service lifetime increased by as much as 50 %. That is why not only lamps but also the associated electronic control gear are developed [Siemens 2005].
In 1990, about 10 billion lamps were produced, which have consumed about 3,000 billion kWh of electrical energy. An increase of the efficiency of 7 % would reduce the emission of carbon dioxide of 500 million tons, which is the double CO2 emission of all German powerplants [BMBF Publik 2000].
Among the reduction of the energy consumption, the increase of lamp lifetime can improve the environmental compatibility of fluorescent lamps.
The development of more robust electrodes or more durable electron-emitting materials could yield significant improvements in fluorescent lamps, since it would allow to operate at lower gas pressures, where efficacy is higher.
In general, a commercial electrode system consists of a tungsten coil coated with a work function reducing emitter mix of alkali oxides, such as BaO, SrO and CaO. The electrode can be destroyed by emitter loss during steady-state operation or due to coil fracture during instant start, because of intense sputtering of electrode material, including tungsten as well as emitter.
The lamp research on electrode processes of the last decades is given to introduce the state of the art of electrode investigations and to classify this work related to the background.
In North America nearly 95 % of all fluorescent lamps are instant started lamps, whereas in Europe more than 70 % are preheated ones. Especially in Europe, previous investigations of electrodes have been directed mainly toward preheated ignition [Thi- jssen and van der Heijden 2001] and steady-state operation, where mainly the loss of emitter material, especially of barium, is of interest.
Bhattacharya [Bhattacharya 1989a, b] and Michael [Michael 2001] have investigated the barium loss from a fluorescent lamp operated at 60 Hz by laser-induced fluorescence. Furthermore, Bhattacharya has determined the barium ion density in the vicinity of the electrode. During low frequency operation high peaks in barium density occurs at current-zero due to re-ignition of the lamp. The ionization of neutral barium and the collection of the produced ions by the cathode were discussed.
Additionally, Samir et al. [2005] have measured the temporal and spatial distribution of barium atoms in fluorescent lamps by laser-induced fluorescence under 60 Hz operation, too and could show that the maximum of barium is emitted mainly at the hot spot.
Moskowitz [1992] has investigated the influence of various lamp parameters, e. g.

10 Chapter 1. Introduction
different lamp ballasts on the lifetime of lamp electrodes.The effect of auxiliary coil heating on Ba loss from fluorescent lamp electrodes
under RF operation was investigated by Misono [2001] by means of optical emission spectroscopy. He could show that Ba emission is minimized for appropriate auxiliary coil heating and the lifetime of the electrode could be extended under the presented conditions. Additionally, Misono et al. [2001] have performed their observations for different operating frequencies.
First in the last few years electronic control gears (ECG) without preheating circuits are becoming more common for saving costs. But coil material namely tungsten is sputtered during the ignition especially without preheating of the coil. Since the last years, only a few investigations on tungsten erosion are known from literature.
Born et al. [2000] have investigated the tungsten erosion directly after the instant start of a pulsed low-pressure argon discharge. In front of the cathode they determined absolute densities by means of laser-induced fluorescence and compared the spatially and temporally resolved tungsten densities with diffusion model calculations. The pulse duration of about 8 ^s at a repetition rate of 9 Hz only made it possible to measure eroded tungsten in the first few milliseconds after ignition. If this are really ’instant starts’ is questionable. The glow-to-arc transition was not observed. Peak densities of nw,max = 2.5 ■ 109 cm-3 were measured.
Chittka et al. [1997] have specified the main trends and aims of electrode research considering the relevance to lamp applications. The special requirements during lamp start and stationary operation were discussed. Gupta and Zissis [2001] have thought over the effect of the electrode geometry on thermionic emission for the starting of fluorescent lamps.
Haverlag et al. [2002] have shown that coil breakage is caused by tungsten sputtering at one of the emitter-free ends mainly during the glow-to-arc transition. Investigations of Hilscher et al. [2004] on both linear and compact fluorescent lamps by fast emission spectroscopy and high-speed video observation support that behaviour.
The depletion of emitter from the oxide cathodes during the glow switch starting of the discharge in 50 Hz operated fluorescent lamps has been studied by van den Hoek et al. [2002]. During ignition two plasma modes exists: a glow discharge and a vapor-arc discharge. The vapor arc appears to be the dominant mechanism of emitter depletion.
An one-dimensional thermal model for an operating fluorescent lamp electrode was developed by Soules et al. [1989]. The calculated temperature distribution were in semi-quantitative agreement with their experimental measurements using an optical pyrometer. The model could be used as a design tool for new electrodes. Rather, these results emphasize the need to include the entire temperature profile along the electrode in any discussion of electrode lifetime.
The main goal of this work is to study the process of tungsten erosion during instant start. Therefore, the density of neutral atomic tungsten is determined by laser-

11
induced fluorescence (LIF) and optical emission spectroscopy measurements (OES). Investigations are performed on a low-pressure argon dc discharge and on commercial fluorescent lamps. To include the entire temperature profile along the electrode the diffuse and spot operation modes of the dc lamp are studied experimentally and theoretically. The measured dependencies of the cathode temperature along the coil on the discharge and heating parameters are compared with the calculated results.
In addition to fluorescent lamps, investigations were performed also on hollow cathode lamps (HCL). These are useful because they provide a variable source of sputtered tungsten atoms, and can serve as tuning tools for the used laser diagnostic.
The fraction of eroded tungsten ions is assumed to be negligible under our conditions. For a helium-argon-copper hollow cathode discharge at similar parameters but higher currents Bogaerts and Gijbels [2002] have computed that the ionization degree of eroded copper is about 1 %. The influence of tungsten clusters was not investigated.
The thesis is structured into six chapters. After this introduction, the basics of fluorescent lamps is discussed. In chapter three a detailed explanation of the used spectroscopic methods and the experimental arrangement are given. In the next chapter investigations on a tungsten hollow cathode lamp are shown. The determination of absolute tungsten densities in both dc lamp and commercial fluorescent lamps, and the study of the diffuse and spot operation modes in the dc lamp are presented in chapter five. The thesis ends with a conclusion in chapter six.

12 Chapter 1. Introduction
Chapter 2
Fluorescent lamps
All electric discharge lamps convert electrical energy into light by transforming electrical energy onto the kinetic energy of moving electrons, which in turn is converted into radiation as a result of collision processes [Waymouth 1971]. In the lamps, the primary process is collisional excitation of atoms in a gas to states from which they relax back to a lower energy state by means of the emission of electromagnetic radiation.
The basic process as it takes place in a discharge lamp is a three-step one: free electrons are accelerated by a potential difference which is applied to the device and maintained by an external source of power; the kinetic energy of the electrons is transformed into the internal energy of the atom; the internal energy of the atoms is dissipated as radiation as the atoms relax back to their lowest energy states. The free electrons are then accelerated again, and the whole process is repeated.
The unique advantage of the atomic radiation from a discharge is that by suitable choice of the atoms of which the gas is composed, the intensity of radiation in a desired frequency band can be made to approach that of the blackbody but be small or zero everywhere else.
There were many authors employed with gas discharges, or with glow discharges in particular, as e. g. Raizer [1997]; Loeb [1961]; Meyer and Nienhuis [1989]; Waymouth [1971]; Kapzow [1955]; Brown [1959]. Thus, only a short discussion follows, necessary to understand the investigated phenomena.
2.1 Ignition of a fluorescent lamp dischargeA fluorescent lamp driven with an ’instant start ECG’ starts in a glow mode. The glow discharge attaches at one of the emitter free ends of the coil because of two reasons: first of all the emitter is an isolator at low temperatures as in the glow mode and secondly the emitter is able to reduce the work function for secondary electron emission only at higher temperatures. In the glow mode, which lasts typically for tens of milliseconds, the discharge current is relatively low (few mA), but the lamp voltage
13
14 Chapter 2. Fluorescent lamps
may exceed 500 V because of the very high cathode fall. This causes high energy ion bombardment of the electrode which heats the electrode, and induces a transition from glow to arc mode. In the arc mode the electrode emits thermionically and the cathode fall drops to the 12 - 15 V range. Unfortunately, the high energy ion bombardment during the glow mode leads also to intense sputtering of electrode material, including tungsten as well as emitter. Thus, instant started fluorescent lamps often suffer from early failures due to coil fracture.
2.1.1 Starting circuits of fluorescent lampsAlthough electronic control gears (ECG) are common today, the starting circuit is explained by a ballast impedance in the following, first [Waymouth 1971]. One of the main differences is that an ECG drives the fluorescent lamp with a frequency of a few kilohertz instead of the line frequency of 50 Hz in conventional control gears described below. The use of a higher frequency increases the efficiency of fluorescent lamps and reduces the well-known jitter of old lamp installations.
Instant start
The simplest starting circuit, but historically not the first, is the instant start circuit. In this type of circuit, a sufficiently high potential is applied to a series combination of discharge lamp plus ballast impedance to ionize the gas and to reach full operating current without temporary pause in the glow mode. Needles to say, the instantaneous energy input to the cathode during the transient glow mode that persists while current is increasing is very high. The rate of change of cathode surface temperature is in excess of 100,000 K/s, which is almost of explosive violence. Whereas explosive temperature rise replace small parts of cathode coating, the bombardment by high-energy ions erodes the cathode surface atom by atom in a process called sputtering.
Preheat start
The remainder of the fluorescent lamp starting circuits all depend on some form of separate heating of the cathode in addition to that supplied by the discharge itself. The effect of the preheating is to heat the cathode to thermionic emitting temperature, strongly increasing the supply of initial electrons to be accelerated to produce the Townsend avalanche.
This was the first circuit used commercially for operating large numbers of fluorescent lamps.
2.1.2 Control gears for fluorescent lampsAs described above, discharge lamps have to be operated with control gear to limit the current. There is a choice of conventional, low-loss or electronic control gear. An

22 The electrode region 15
important factor as far as quality is concerned is their power loss which, together with the lamp wattage, is used to calculate the system wattage [Osram 2005].
Conventional control gear (CCG) This is a simple self-inductance comprising an iron core around which copper wire is wound. Because of its ohmic resistance there is considerable power losses and from self heating. The system wattage for a 26 W compact fluorescent lamp operated with conventional control gear is 32 W; in other words, the power loss is 6 W (23 %). By contrast, the system wattage with an ECG is 28 W, which corresponds to a power loss of only 7.5 %.
The European Ballast Directive (2000/55/EC) has classified all fluorescent ballasts in terms of their energy efficiency. The most inefficient types are legally banned from sale in Europe since May 2002. The aim of the Directive is to encourage the widespread use of electronic control gear which are the best in terms of energy efficiency.
Low-loss gear (LLG) Compared to conventional control gear, low-loss gear has a lower power loss but are larger and are more costly to manufacture because of their improved design and larger iron cores. The system wattage for a 26 W compact fluorescent lamp, for example, is around 30 W
Electronic control gear (ECG) In contrast to conventional control gear, ECGs operate at frequencies at or above 30 kHz which means they offer significant gains in efficiency. These gains are based essentially on two mechanisms: a reduction in electrode losses, and an increase in luminous efficacy, which is due almost entirely to more efficient conversion of electrical energy into the UV lines of the mercury atom at 185 nm and 254 nm.
The use of modern ECGs, above all for fluorescent lamps, has led to significant increases in lighting comfort, economy and reliability such as pleasant flicker-free light, up to 30 % savings in power input compared with CCG operation, and more than 50 % longer lamp lifetime compared with CCG thanks to preheat start.
Dimmable electronic control gears enables compact fluorescent lamps to be dimmed smoothly and without flicker from 100% to 3 % luminous flux and tubular fluorescent lamps from 100 % to 1 % luminous flux.
By means of ECGs both instant start and preheat start of fluorescent lamps is realizable. In this work instant start ECGs were used.
2.2 The electrode region
All investigations made in this work were performed at the cathode (or were connected to the cathode phase on alternating current). Thus, the following discussion, mainly taken from Lister et al. [2004], is focused on this electrode.

16 Chapter 2. Fluorescent lamps
The cathodes in a fluorescent lamp are multicoiled helices of tungsten, the interstices of which are impregnated with alkaline-earth oxides for enhanced electron emission. During normal operation, they are heated by the passage of current through the tungsten wire of the helices and by ion bombardment from the plasma. The presence of excess barium dissolved in the mixed oxide crystals and at the surface makes the oxides semiconducting at typical operating temperatures and reduces the work function of the cathodes [Herrmann and Wagener 1951], allowing them to supply current to the discharge at an operating temperature of 1200 -1400 K. The cathodes operate in the spot mode, the position of the spot varying during the lifetime of the lamp as the emissive material is locally evaporated and sputtered.
Figure 2.1(a) shows the basic arrangement of tungsten wire, which consists of a coil of very fine wire ("primary") wrapped loosely around a larger wire ("mandrel"). This basic structure is coiled once in a relatively closely wound secondary coil1. The finished coil, called for obvious reasons a "double coil", is shown mounted on a stem after coating in figure 2.1(b).
Figure 2.1: (a) Structure of the tungsten wires of a double coil. The cathode heating current, if any, and the discharge current to the external circuit are carried primarily by the mandrel wire, (b) Photograph of a double coil with cathode coating.
In the absence of a discharge, healed electrodes emit electrons in a process referred to as zero-field thermionic emission. For the alkaline-earth oxide cathodes this process depends on the pressure and type of buffer gas. The emission of an oxide cathode varies as the square root of the excess barium content at the surface of the BaO coating [Herrmann and Wagener 1951]. The excess barium content is in turn determined by the balance between a constant rate of production, through a classical reaction between BaO and the tungsten substrate, and a loss rate determined by evaporation and diffusion away from the cathode through the rare gas. The heavier the gas
lThe resulting coil can then coiled again into a fairly open structure. This was omitted in all investigated lamps discussed in this work.

2.2 The electrode region 17
or higher the pressure, the slower the diffusion and the higher the barium pressure at the cathode for better emission.
When the discharge is operating, the positive space-charge sheath results in a high value of the electric field at the cathode surface. This is not sufficient for any significant field emission, nor is secondary emission due to electrons released by ion bombardment important. However, thermionic emission is enhanced by the anomalous Schottky effect [Nottingham 1956] (also known as the "patch effect") in addition to the normal Schottky effect. The patch effect is due to the inhomogeneity of the work function in the presence of a surface electric field. The zero-field work function 0 may vary by % 2 eV from one crystal to another. If two neighboring crystals have work functions 01 and 02, the energy required for an electron in zero field to overcome the potential barrier is (01 + 02)/2. However, in the presence of an accelerating electric field at the cathode surface, the effective work function of the surface can approach the lesser of 01 and 02, leading to much more efficient emission than would be expected from the normal Schottky correction.
Visual observation of the cathode region shows the negative glow extending for about one tube radius on either side of the cathode and the Faraday dark space extending for a length slightly smaller than the tube diameter [Waymouth 1971]. No cathode dark space is visible, because the cathode sheath is extremely thin (% 0.1 mm) and electrons from the cathode (referred to as beam electrons) enter the negative glow with the full energy of the cathode fall.
Waymouth [1971] deduced from Langmuir-probe measurements that the ion current represents about 30 % of the total current at the cathode surface. In order to supply this current, the electron density must be significantly higher in the negative glow than in the positive column. There is a field reversal in the negative glow, which is established to balance the diffusion of ions and electrons in the region and to maintain constant current along the discharge [Druyvesteyn and Penning 1940]. The dependence of plasma density on discharge current is nonlinear, possibly due to variation in the ambipolar diffusion coefficient as a result of changes in the temperature of the cold trapped negative-glow electrons as the discharge current is varied [Wamsley et al. 1991].
The buffer gas has a different role in the cathode region than in the positive column. The cathode-fall voltage in fluorescent lamp discharges is somewhat dependent on operating conditions, including the amount of auxiliary heating, but its maximum value never exceeds the excitation potential of the buffer gas by any appreciable amount. Buffer-gas excitation in the negative glow of Hg-Ne discharges is easily observable from a simple visual observation of the red color of this region and is readily observed in many Hg-Ar discharges by using a spectrometer [Wamsley et al. 1993].
The anode sheath is typically % 0.25 mm, but for operation below 1 kHz the anode fall is subject to sawtooth oscillations [Waymouth 1971]. Fast electrons may cause significant ionization in the anode sheath, increasing the plasma density sufficiently for the anode to collect all the necessary current without the need for an anode fall. The anode fall collapses and the plasma diffuses away from the anode, causing the

18 Chapter 2. Fluorescent lamps
anode fall to become positive again, and the process repeats itself. For lamp operation above the ambipolar diffusion frequency (typically % 1 kHz), the negative glow formed during the cathode cycle does not have time to diffuse away during the anode cycle, and the pool of plasma remaining provides the required electron current without an anode fall. This phenomenon leads to an efficacy gain for lamps operated on an electronic ballast.

Chapter 3
Experiment
In this work the laser-induced fluorescence (LIF) technique is used to determine absolute particle densities. Moreover, relative densities of excited species are determined by means of emission spectroscopy. Additionally, the temperature of the coil during diffuse and spot mode of the discharge was measured.
In this chapter the investigated lamps and the essential basics of both optic methods and possible methods of calibration techniques are summarized. Afterwards, the setup for the temperature measurement is explained.
The presented experimental arrangements were developed during this work. First results achieved on commercial fluorescent lamps and at the low pressure dc argon discharge are published in the work of Hadrath et al. [2005] and Golubovskii et al. [2006], respectively.
3.1 Fluorescent lamps and the hollow cathode lampIn addition to fluorescent lamps, investigations have been performed also on hollow cathode lamps (HCL). These are useful because they provide a variable source of sputtered tungsten atoms, and can serve as tuning tools for precise calibration of the absolute laser frequency. Whereas, an extensive triggering on the ignition of the fluorescent lamp is necessary.
Before the tungsten erosion during instant start of fluorescent lamps was investigated, more fundamental investigations of the glow discharge were performed. With such a stationary discharge more meaningful basics on tungsten erosion in the glow mode could be researched and more accurate tungsten density profiles were measured. At this lamp also the investigation on spot formation were performed.
Thereafter, tungsten erosion processes during instant start of a fluorescent lamp were investigated on commercial fluorescent lamps.
The hollow cathode lamp The hollow cathode lamp used for preliminary investigations is shown in figure 3.1(a). To reach a high transparency of the laser radiation
19

20 Chapter 3. Experiment
in the UV region planar quartz windows are used. During initial investigations, the hollow cathode lamp is filled with argon or a argon krypton mixture at pressures of a few mbar, operates with currents up to 15 mA and voltages up to 300 V The length of the pure tungsten cathode is 19 mm with a diameter of 6 mm. The laser beam is passed through orifices (◦ 3 mm) in the hollow cathode. The LIF signal is imaged in the axial direction of the hollow cathode onto the monochromator. The optical setup for measurements in hollow cathode lamp and fluorescent lamp devices remains the same.
The dc lamp The development of a practicable fluorescent lamp for stationary investigations was a step-by-step process. The first dc lamp (DCL 1) is similar in design to a commercial T8-lamp of 60 cm length and 26 mm diameter (26 mm = 8/12 inch) but without phosphor coating. Planar quartz windows of 30 mm diameter are attached in a distance of the tungsten coil of nearly 10cm. The influence of the extenders is negligible, because a modification of the cold spot has no influence on the ignition but only on the discharge during steady-state operation. A mixture of argon and krypton, shared equally, is used as fill gas at pressure of 2.3 mbar and a small amount of mercury is added. In addition to stationary investigations of the glow phase the tungsten erosion during instant start was observed in this model lamp, too.
Due to the high ion bombardment in the stationary glow phase the coil is damaged after a few hours and a more practicable fluorescent lamp was necessary. Thus, for the second dc lamp (DCL 2) mercury is removed, first. The removal of mercury filling is valid because a lot of ions that bombard the cathode during the glow mode are indeed argon ions [Garner 2005]. Since the density of the buffer gas is 300 - 500 times higher than the density of mercury, the ionization of the buffer gas is dominant in the glow discharge [Haverlag et al. 2002]. The filling gas is changed to argon of a pressure of 3 mbar, because the commercial lamps - presented later in this section - uses this filling too.
In the glow mode the same coil is always the cathode and the other one is the anode. To raise the lifetime of the anode, which is not investigated, the (anode) coil is exchanged by a round, planar stainless steel plate (◦ 1 cm). The distance between cathode (coil) and anode is reduced of about 5 cm to be as short as possible to reduce the length of the positive column of the glow discharge. Thus, the measured lamp voltage is approximately the same as the cathode fall. To speed up the exchange time of a damaged coil a metal flange and a stop cock is implemented.
Unfortunately, the use of the metal flange has more disadvantages than advantages. Thus, for the third dc lamp (DCL 3) the metal flange was again removed. The resulting lamp is shown in figure 3.1(b). In all dc lamps the same coil, signed EW230 with emitter P 11, was applied, as shown in figure 3.2. The total length of the coil amounts to about 10 mm. The dc lamps were driven at different discharge currents up to 20 mA

3.1 Fluorescent lamps and the hollow cathode lamp 21
laserbeam
round, planar anodecathode
anodesfluorescencesignal to pump-
Figure 3.1: (a) Tungsten hollow cathode lamp and (b) dc lamp (DCL 3) in front and side view, respectively. The distance between cathode and anode in dc lamp amounts to about 5 cm. The laser beam and the direction of the fluorescence observation are signed in hollow cathode lamp.
Figure 3.2: Photograph of the observed coil, signed EW 230 P 11.
by an autoranging power supply (FUG MCA 750-15001).
The commercial fluorescent lamp The LIE measurements on commercial fluorescent lamps should be performed on T8-lamps of 60 cm length and 26 mm diameter, first. The lamps contain argon and krypton, shared equally, as filling gas at a pressure of about 2.3 mbar. Therefore, the dc lamp (DCL 1) contains this mixture too.
Unfortunately, due to the low UV transparency of the used glass tube the laser destroys these lamps and, therefore, it was not possible to investigate these ones. The only commercially available fluorescent lamps that satisfy the special needs of LIE due to the UV transparency of the glass tube are special T 12-lamps used for solariums (Sylvania Daylight Deluxe 40W) of 120 cm length and 38 mm diameter. The lamps with cleared ends* 2 were driven on an instant start electronic control gear of a frequency of 44 kHz. The lamps contain argon as filling gas at a pressure of 3 mbar and, hence, the filling gas of the dc lamps (DCL 2 and 3) was changed accordingly.
All lamps were fastened in such a way that the lamps were mobile and the observation volume could be moved so that a density profile could be measured. By means of two helium-neon-lasers the position of the lamps could optimally be adjusted.
The lamp voltage of both model and commercial fluorescent lamps was measured by a high voltage differential probe (L EC ROY ADP 300). The discharge current of
!0- 1500V, 0-1.5 A, max. 750 W2cleared ends: the phosphor coating of the glass bulb was removed in the vicinity of the coil

22 Chapter 3. Experiment
the dc lamp was simply measured by a multimeter and of the fluorescent lamp by a current probe (LEM PR 50).
3.2 Laser-induced fluorescenceIn the 1970s the development of good tunable lasers opened the way for laser-induced fluorescence experiments in lighting plasmas.
LIF experiments complement emission spectroscopy by providing access to the lower levels of transitions, especially metastable and ground levels of both atoms and ions, which do not radiate. LIF also provides better spatial and temporal resolution than emission spectroscopy. LIF can also be used to measure time-resolved data and determine rates as shown by Schnabel [1999]; Schnabel and Kock [2000a, b].
The LIF technique is particularly well-suited to determine absolute population densities of neutral and singly ionized atoms of liberated electrode material (as shown by measurements of Ba by Bhattacharya [1989a, b] and Michael [2001]) and, in certain cases, excitation temperatures [Hayes et al. 1989]. The excellent spatial resolution possible in LIF experiments on low-pressure discharges is illustrated by the work of van der Weijer and Cremers [1985b, c, a].
The use of semiconductor laser systems in LIF experiments eliminates some of the cost and complexity of organic dye lasers. A good example is the work by Yuasa et al. [1997].
LIF has also been used to measure Stark broadening and shifts in a low-pressure Na-Ne discharge [Cornelissen and Burgmans 1982]. This experiment involved Doppler-free two-photon excitation. Doppler-free excitation from counterpropagat- ing laser beams yielded very small linewidths and an ability to measure Stark shifts as small as 10 MHz. Stark shifts and broadenings due to Holtzmark fields in the plasma were measured and used to determine the local plasma density. Cornelissen and Burgmans [1982] measured electron densities as small as 1012 cm-3 with submillimeter spatial resolution.
The named examples illustrate the utility of LIF. In general, LIF and laser scattering diagnostics provide superb spatial and temporal resolution. Its experimental complexity is offset by the multitude of advantages it offers in comparison to emission spectroscopy, such as independence of plasma parameters. Since ne and Te typically have steep gradients near to the electrode, this is an especially useful feature.
Sufficient optical transmission of the investigated device both for the excitation wavelength and the fluorescence wavelength is necessary for a quantitative fluorescence measurement. Furthermore, no considerable part of the excited atoms should diffuse out of the observation volume in the timescale of their lifetime. The intensity of fluorescence radiation is directly proportional to the averaged particle density in the irradiated part of the observation volume for a spatial resolution that depends on the dimensions and a temporal resolution that depends on the duration of the laser

3.2 Laser-induced fluorescence 23
pulse. The results can be affected by saturation effects and collisions and must be accordantly considered. The determination of absolute particle densities demands a suitable calibration and the knowledge of the spectroscopic data of the involved transitions.
Only a short summary of the theoretical fundamentals of the LIF-spectroscopy is presented. A detailed description is given in textbook as e. g. Demtroder [2000] or in the work of Niemi [2003] or Hadrath et al. [2005], where the allocation dynamic of atoms as a result of optical excitation is described based on the radiation theory of Einstein and summarized in terms of a system of rate equations for the population densities of the involved states. Thereby, the restrictions due to saturation and collisions are discussed and the temporal and spatial dependencies as well as the polarization of fluorescence radiation are derived and the favorite calibration method is presented for the determination of absolute population densities.
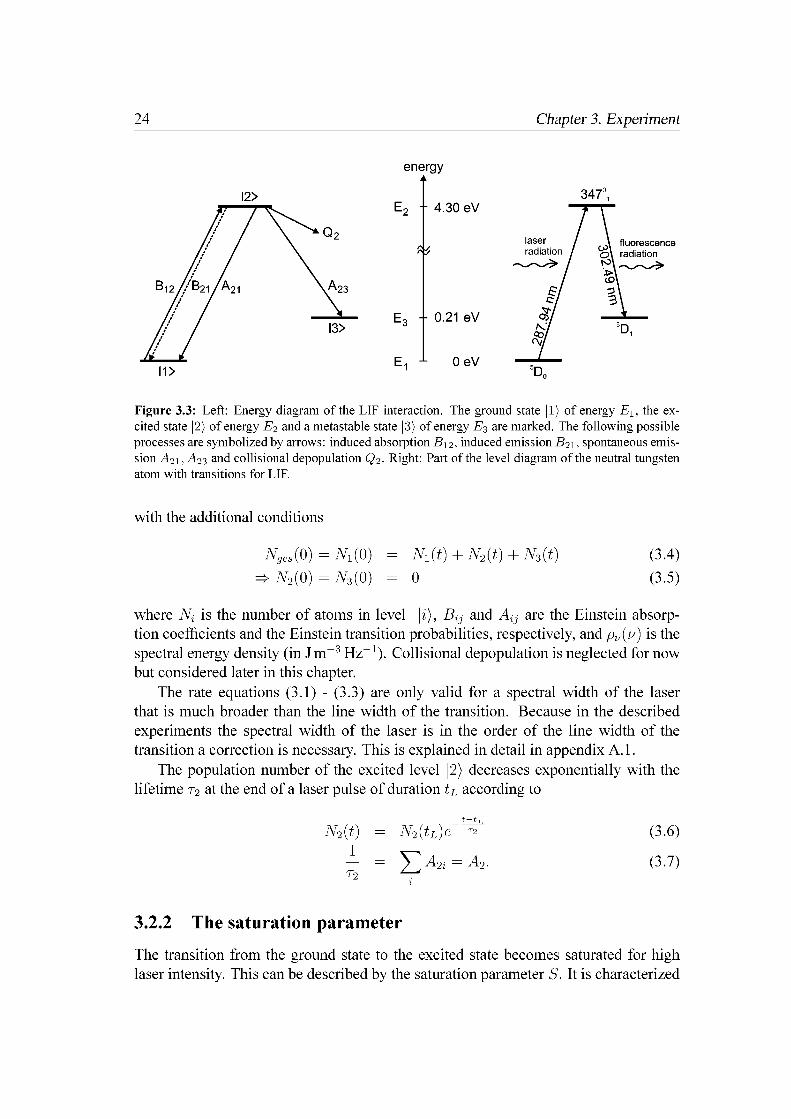
3.2.1 The rate equationsThe LIF mechanism can be described as a two-step process [Amorim et al. 2000]. First, a specific atomic or molecular species in its ground state |1) (energy E1) is excited by resonant absorption of laser photons (hvL) to a higher electronic level |2) of energy E2 with hv12 = E2 — E1. Then, the excited state relaxes by spontaneous emission of a fluorescence radiation to a lower state |3) of energy E3 with hvL1F = E2 — E3. The LIF radiation is emitted in the whole solid angle. Afterwards, it is analyzed and can give information on the density of the ground-state atoms and the energy distribution of the low energy levels.
In figure 3.3 a simplified three-level diagram of LIF in atoms (left) and the part of the level diagram containing the transitions to determine the ground-state density of tungsten atoms (right) are presented. The spectroscopic data of all observed LIF transitions are shown in table 3.1.
Laser radiation at \L = \12 = 287.94 nm excites tungsten atoms from the fivefold split ground state. The upper level 3470 subsequently decays spontaneously via different channels. The fluorescence radiation at A23 = 302.49 nm is detected for determination of the population density of the ground state 5D0.
For a spectral width of the laser AvL that is much broader than the line width of the transition Av12 the rate equations of a three-level diagram describe the excitation and relaxation processes completely [Niemi 2003; Schnabel 1999; Schnabel and Kock 2000a, b]
dN1(t)dt
dNg(t)dt
dNg(t)dt
— B12Pv(v12, t)N1(t) + (A21 + B21 Pv(v12, t))N2(t) (3.1)
+B12Pv(v12, t)N1(t) — (A23 + A21 + B21Pv(v12, t))N2(t) (3-2)
A23N2(t) (3.3)
24 Chapter 3. Experiment
energy
Ep -- 4.30 eV
laserradiation
,3 fluorescence Ox radiation
Eo "" 0.21 ©V
Figure 3.3: Left: Energy diagram of the LIF interaction. The ground state |1) of energy E\, the excited state |2) of energy E2 and a metastable state |3) of energy E3 are marked. The following possible processes are symbolized by arrows: induced absorption B12, induced emission B2i, spontaneous emission A2i , A23 and collisional depopulation Q2. Right: Part of the level diagram of the neutral tungsten atom with transitions for LIF.
with the additional conditions
Nges (0) = Ni (0) = Ni (t) + N (t) + N3 (t) (3.4)^ N2(0) = N3(0) = 0 (3.5)
where N is the number of atoms in level |i), Bij and Aij are the Einstein absorption coefficients and the Einstein transition probabilities, respectively, and pv (v) is the spectral energy density (in J m-3 Hz-1). Collisional depopulation is neglected for now but considered later in this chapter.
The rate equations (3.1) - (3.3) are only valid for a spectral width of the laser that is much broader than the line width of the transition. Because in the described experiments the spectral width of the laser is in the order of the line width of the transition a correction is necessary. This is explained in detail in appendix A.1.
The population number of the excited level |2) decreases exponentially with the lifetime t2 at the end of a laser pulse of duration tL according to
t-tL
N2 (t) = N2 (tL )e T2 (3.6)
T = y ] A2i = A2. (3.7)
3.2.2 The saturation parameter
The transition from the ground state to the excited state becomes saturated for high laser intensity. This can be described by the saturation parameter S. It is characterized

3.2 Laser-induced fluorescence 25
|1) |2)(^) |3) 91 92 93 A(12 [nm] A23 [nm]
5Do CO 5D1 1 3 3 287.94 302.49
5D1 357« 7 S3 3 5 7 293.50 304.975Ds 3963 7 S3 7 7 7 287.14 272.445D4 4024 7 S3 9 9 7 293.91 268.14
|1) |2)(^) |3) A(t) [108 s-1] A%3 [108 s-1] A^ [108 s-1] E(t} [eV]
5Do CO 5D1 0.25 0.16 0.44 0
5D1 3572 7 S3 0.15 0.17 0.39 0.215D3 3963 7 S3 0.06 1.05 1.23 0.605D4 4024 7 S3 0.05 0.74 0.86 0.77
Table 3.1: Spectroscopic data of some selected transitions of the tungsten atom. The first line indicates the transition presented in figure 3.3. The data are taken from: [Laun and Corliss 1968], (t) [NIST2004], ® line 1 and 2: [DenHartog et al. 1987], line 3 and 4: [Kling and Kock 1999]. The transition to the 5D2 level could not be observed due to the lack of intensity.
by the relation between the sum of pump- and relaxation rates
S =(B21 + B12) _ 91 + g2 u
pv — B21pv t2A2
9i + 92 °3
g1 8nhv32
91
Pv R21
and the branching ratio Rj
R21 A21T2A21A2
1,
(3.8)
(3.9)
(3.10)
(3.11)
where g1 and g2 are the statistical weights of the levels |1) and |2), respectively. Generally, an analytic solution of the rate equations can be found in dependence on the saturation parameter. There are three different cases: the unsaturated or linear LIF for S ^ 1, the low saturated LIF for S % 1 and the high saturated LIF for S » 1.
Linear LIF (S < 1)In case of linear LIF the intensity of fluorescence radiation linearly increases with the laser intensity. That is the case if the transition probability A21 of the excited state is much higher than the induced absorption rate B12pv. That means, that the neglect of induced emission and population losses from the ground state is permitted (B12PV — 0, N^t) % ^1(0)).
For a sufficient low and short excitation it is guaranteed that the population density of the excited state and, therefore, the fluorescence intensity linearly depends on

26 Chapter 3. Experiment
the laser intensity and the practically uninfluenced ground-state population.These are perfect requirements for a quantitative measurement by means of laser-induced fluorescence.
One difficulty is the influence of inelastic collisions. Quenching collisions lead to de-excitation of the atoms and a shortening of the lifetimes of the excited levels. Furthermore, the linear dependence must be ensured over the whole laser cross sectional area.
Low saturation under stationary conditions (S % 1)Krames [1999] has introduced a correction factor if the deviation from linearity is low enough. This correction factor contains the saturation parameter S (3.8) which can be determined experimentally by a saturation curve (as shown in section 4.2). That means that the LIF signal without saturation would be S +1 -times higher than with saturation.
High saturation under stationary conditions (S » 1)In this approximation one suppose that the laser pulse quickly generate equilibrium populationin the pumped system, according to the statistical weights. Daily [1977] and Lins [1985] simply called this saturation effect. The excited system is treated as lossless.
One of the fundamental sources of error is the spatially intensity distribution of the laser pulse. The so-called power broadening was treated by Daily [1978]; Rodrigo and Measures [1973]; Salmon and Laurendeau [1985]. An own approach is presented in section 4.3.
3.2.3 The LIF setupThe experimental arrangement including both spectroscopic methods is presented in figure 3.4. The LIF setup is separated in three parts: the laser system to generate resonant laser radiation, the lamp, and the region to detect the fluorescence signal. A CCD3 camera is used for the emission spectroscopy measurement which is described in detail in section 3.3.1.
The laser system
To excite all interesting tungsten transitions a powerful, tunable light source is required. Pulsed dye lasers [Demtroder 2000] fulfill these requirements in the visible spectrum and after frequency doubling in the interested UV region around 300 nm.
The excitation of the dye solution is performed by a Nd:YAG laser. The Nd:YAG laser Quanta Ray Pro-230 (from Spectra Physics) is a flash-lamp pumped solid-state laser with a repetition rate of 10 Hz. Its wavelength is 1064 nm. A KDP
3Charged Coupled Devices

3.2 Laser-induced fluorescence 27
fluorescence
mirror
interferencefilterlaser
radiation ■> lens
Nd:YAG
fluorescence radiation ,
0.5 m double monochromator
HeNe laser
oooo
Figure 3.4: Experimental arrangement for LIE (with PD - photo diode, PMT - photomultiplier, ECG - electronic control gear, SIIG - second harmonic generator, DSO - digital storage oscilloscope, and a HeNe laser to adjust the (dye) laser beam onto the coil) and OES measurements.

28 Chapter 3. Experiment
(kalium-dihydrogen-phosphate) crystal generates the second harmonic at 532 nm. The pulse energy of the frequency doubled laser radiation is about 500 mJ with a pulse duration of about 6 - 10 ns. This radiation is used to pump the dye laser.
The resonator of the dye laser PrecisionScan - D1800 (from Sirah) utilizes two gratings, each with 1800 grooves/mm in Littmann alignment [Sirah GmbH 1998]. The wavelength of the laser can be tuned in dependence on the used dye solution by rotation of the Littrow grating. The pulsed dye laser radiation is frequency doubled with a KDP crystal, too. The used dye solution Pyrromethene 597 [Partridge, Jr. et al. 1994] in ethanol has its maximum efficiency at 582 nm, respectively 291 nm after frequency doubling.
In figure 3.5 the temporal evolution of a laser pulse of 8.3 ns measured with a photo diode is presented. The pulse energy is about lOmJ. The polarization direction is parallel to the base plate, so the laser is called p-polarized.
8.3 ns
time [ns]
Figure 3.5: Temporal evolution of a frequency doubled laser pulse with a duration of 8.3 ns (FWHM).
Unfortunately, the energy of the laser pulse leads to a damage of the glass bulb. Therefore, the laser beam was broadened by a Galileo telescope, based on two lenses of fi = —50 mm and /2 = 200 mm in a distance of 150 mm. Afterwards, a pinhole with a diameter of 1 mm separates a small range of the laser profile to get a more homogeneous spatial laser profile. Thus, the energy of the laser pulse is reduced to about 10 //J.
Fluorescence detection
The laser beam waist (<t> 1 mm) is passed to the vicinity of the coil. Perpendicular to the laser beam the region of interest is imaged (1:1) by a lens system (/ = 150 mm) to the entrance slit of a 0.5 m double monochromator (Acton Research Spectra Pro-5OOi). It utilizes two gratings, each with 2400 grooves/mm, and very efficiently suppresses parasitic stray light. Its spectral resolution is 50 pm. The dimension of the observation volume is determined on the one hand by the diameter of the laser beam, but on the other hand much more by the aperture of the entrance slit of the monochromator.

3.2 Laser-induced fluorescence 29
The fluorescence radiation (red shifted with respect to the laser radiation) is measured with a photomultiplier tube (PMT, Hamamatsu R1477-06) behind its exit slit. By means of a special gatable socket (Hamamatsu C1392-56) the PMT is electrically switched so that its output is obtained only during the desired period. Thereby, saturation of the photo cathode by continuous parasitic stray light could be reduced. The laser intensity is measured with a photodiode (PD), which is connected to the same digital storage oscilloscope (LeCroy WavePro 7300, 3 GHz, 20 Gs/s) as the photomultiplier, which is triggered by the laser pulse.
The fluorescence and the reference (laser) signal were simultaneously recorded and the waveforms were stored by a personal computer. To investigate the dependency of the fluorescence signal on the laser intensity one or more neutral density filters could be placed into the laser beam.
3.2.4 Absolute calibration methodsThe voltage drop ULIF over the internal resistor R (50 Q) of a digital oscilloscope, depends on the number of fluorescence photons NF per laser pulse detected by a photomultiplier (PMT)
Slif = [ Ulif(t)dt = QGeRNF, (3.12)
where Q and G are the quantum efficiency and the gain of the PMT, respectively, and e is the elementary charge. The time-integration of the voltage response of the PMT on the load is the LIF signal Slif.
The number of detected fluorescence photons NF is related to the total number of emitted fluorescence photons Ntft due to one laser pulse by [Niemi 2003]
NF = T ^^ 9 (9) NF\ (3.13)4n A 2
where T is the transmission of the detection path, AQ/4n is the detection angle, and A23/A2 considers the relation between all possible transitions to lower energy levels |3), |4), 4 nK (9) is the polarization of the fluorescence radiation [Niemi 2003].Furthermore, the depopulation by quenching with rare gas atoms must be considered by the quenching factor
9A2
A2 + St kSt nSt'(3.14)
where kst is the quenching rate coefficient of all quenchers St e.g. the buffer gas Ar, Kr, —
Taking into account that N = nV and V = FL one obtains for the unsaturated LIF signal
SlifULIF(t)dt = QGeRT^^ q 4nK(9) u^iFLni(0)NL, (3.15)
4n A2

30 Chapter 3. Experiment
where L and F are the length and the cross sectional area of the detection volume V in direction of the laser beam, respectively, uLIF is the fluorescence cross section4, and Nl are the emitted laser photons per laser pulse. For the low saturated case equation (3.15) has to be multiplied with the factor 1/(1 + S) to consider the saturation parameter.
In case of high saturation spontaneous transitions to the ground state are again transferred in the excited state for sufficient long laser pulses and are again detectable as fluorescence photons. Thus, the relation between the transition probabilities is changed in analogous way to equation (3.13)
A23 A23A2 A2 — A21
(3.16)
The LIF signal can be described similar to equation 3.15 by
SLIF = f ULIF(t)dt = QGeRT^ . A'3. q 4nK(9) —m(0)V. (3.17) V 4n A2 — A21 gi + g2
One of the main difficulties in determination of absolute densities from LIF signals is the determination of the geometry and the spectral response of the optical imaging and detection of the fluorescence. A precise determination of the parameters transmission T, detection angle AQ/4n and observation volume V can be avoided by Rayleigh scattering performed with the same system (laser and detection) as in the LIF experiment.
Rayleigh scattering
The Rayleigh calibration method is based on the comparison of the LIF signal with the Rayleigh scattering signal measured at a reference gas of known density - usually a rare gas - which is observed under the same excitation and detection conditions [Amorim et al. 2000; Bogen 1983; Lochte-Holtgreven 1968; Bessenrodt- Weberpals et al. 1986; Bridge and Buckingham 1966; Hamamoto et al. 1981; Jauernik et al. 1987; Reckers et al. 1997; Rousseau et al. 2002; Salmon and Lauren- deau 1985]. This method can be used if the fluorescence and the excitation wavelength (wavelength of scattered light) are nearby. The Rayleigh signal can be described by
SRay = J URay (t)dt = QGeRTURayLnRay (3.18)
where uRay is the cross section and nRay denotes the density of the observed reference gas.
Xenon was used as reference gas for the Rayleigh calibration measurement due to its high dipole polarizability depending on the mass of the gas atoms. Thus, xenon is more suitable as e. g. argon.
4For more information on the determination of the fluorescence cross section see A.2.

3.2 Laser-induced fluorescence 31
The Rayleigh scattering cross section according to
, with Q/2 = + (5 + ^) cost9] (3.19)
is a Ray = 3,1- 10-29m2 for a laser wavelength of 288 nm, a dipole polarizability a0 = 4,044 A3 of xenon [Lide 2001] and an angle of d = 0° between the vec
tors of the electric held strength of the laser radiation and the Rayleigh scattering light [Chance and Spurr 1997]. The anisotropy k of rare gases is negligible in contrast to them of molecular gases.
Because the Rayleigh scattering cross section is significant smaller than the LIT cross section, the Rayleigh intensity was measured as a function of the rare gas density to determine the intensity of parasitic stray light by extrapolation to nRay = 0.
A simple vacuum chamber tilled with xenon up to atmospheric pressure was used, as shown in figure 3.6. The optical setup for the LIT and the Rayleigh measurements
150 mm
to pump
laserbeam
Rayleighsignal
Figure 3.6: Vacuum chamber for Rayleigh scattering measurements. The quartz windows in laser direction are slantwise attached to reduce reflections. The fill pressure of xenon could be varied by an extern pump.
remains the same. So, the transmission T, the detection angle AO, the observation volume V and the quantum efficiency Q (by using identical wavelengths) of the photomultiplier remain the same.
In figure 3.7(a) the intensity of the Rayleigh scattering light caused by a laser pulse with an intensity IL of 222mV is presented5. Figure 3.7(b) shows the measured Rayleigh signal in dependence on the tilling gas pressure of xenon. The normalized Rayleigh signal per pressure unit determined from the slope of the fitted line
= 2.6pVsbar-imV-\
5Remark: The intensity of the Rayleigh scattering light and the intensity of the laser pulse are both given in millivolts (mV) but are not quantitative comparable due to the fact that the Rayleigh intensity was measured by a photomultiplier and the laser intensity by a photo diode.

32 Chapter 3. Experiment
(a) (b)
Figure 3.7: (a) Temporal evolution of the Rayleigh signal caused by laser excitation of IL = 222 mV. (b) Measured Rayleigh signal divided by the laser intensity in dependence on the xenon fill pressure.
By combining equations (3.15) and (3.18) the ground-state population density ui = u1(0) before the laser pulse can be determined. In case of low saturation one obtains
f ULIF (t)dt ORgy nRgy A2 1 (S + 1)f URgy (t)dt olif qA23 4nK(6) ( (3.20)
whereas the linear case ensues as boundary value of above equation for S ^ 0. The case of high saturation can be analogously derived from (3.17) and (3.18) to
= f ULIF(t)dt ORaynRay A2 — A21 1 gl + g2 EL (32T1Ul f URgy (t)dt F q A23 4nK(6) g2 hv 12" "
In comparison to linear LIF the cross sectional area in the detection volume must be known. The main difficulty is to ensure S ^ 1 over the whole spatial laser profile, which means to have a nearly rectangular shape. Otherwise, there is no saturation at the edges of the laser profile that leads to the so-called power broadening [Lieder 1989]. An own approach to avoid this effect is presented in section 4.3.
3.2.5 Determination of total densitiesTo determine the total tungsten density the population densities of all energy levels must be summed. Under the assumption of a Boltzmann distribution one must measure only some population densities Uj and plot logarithmically the relative population densities njg1 /u1 gj versus the energy shift AEj = Ej — E1 in a Boltzmann plot. A straight line which fits quite well the measuring points indicates that the levels are Boltzmann distributed with an excitation temperature Ta. This temperature can be determined from the slope of the fitted line [Lieder 1989; Demtroder 2000] in according to
njg1 =u1 gj
AEj
(3.22)
3.3 Emission spectroscopy 33
where k is the Boltzmann constant. By using the partition function
^ E,Z(Tg) = ^] gi e-(3.23)
itotal densities can be determined by n = n1Z/g1.
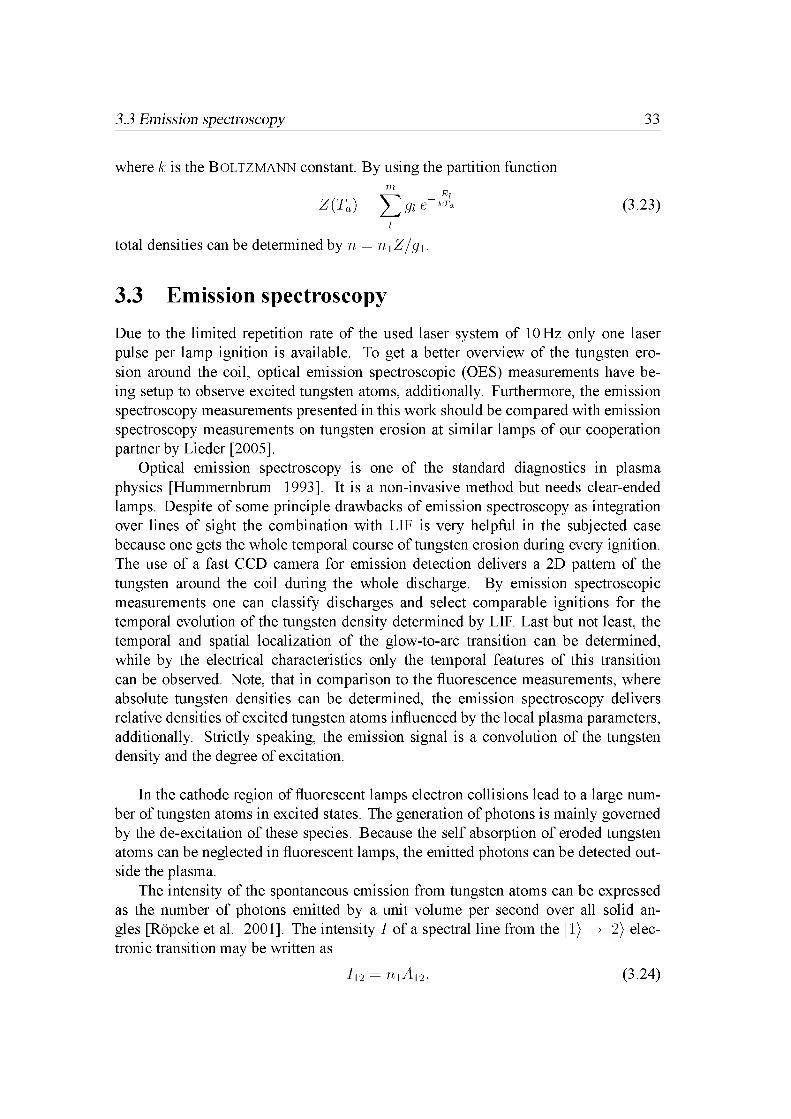
3.3 Emission spectroscopyDue to the limited repetition rate of the used laser system of 10 Hz only one laser pulse per lamp ignition is available. To get a better overview of the tungsten erosion around the coil, optical emission spectroscopic (OES) measurements have being setup to observe excited tungsten atoms, additionally. Furthermore, the emission spectroscopy measurements presented in this work should be compared with emission spectroscopy measurements on tungsten erosion at similar lamps of our cooperation partner by Lieder [2005].
Optical emission spectroscopy is one of the standard diagnostics in plasma physics [Hummernbrum 1993]. It is a non-invasive method but needs clear-ended lamps. Despite of some principle drawbacks of emission spectroscopy as integration over lines of sight the combination with LIF is very helpful in the subjected case because one gets the whole temporal course of tungsten erosion during every ignition. The use of a fast CCD camera for emission detection delivers a 2D pattern of the tungsten around the coil during the whole discharge. By emission spectroscopic measurements one can classify discharges and select comparable ignitions for the temporal evolution of the tungsten density determined by LIF. Last but not least, the temporal and spatial localization of the glow-to-arc transition can be determined, while by the electrical characteristics only the temporal features of this transition can be observed. Note, that in comparison to the fluorescence measurements, where absolute tungsten densities can be determined, the emission spectroscopy delivers relative densities of excited tungsten atoms influenced by the local plasma parameters, additionally. Strictly speaking, the emission signal is a convolution of the tungsten density and the degree of excitation.
In the cathode region of fluorescent lamps electron collisions lead to a large number of tungsten atoms in excited states. The generation of photons is mainly governed by the de-excitation of these species. Because the self absorption of eroded tungsten atoms can be neglected in fluorescent lamps, the emitted photons can be detected outside the plasma.
The intensity of the spontaneous emission from tungsten atoms can be expressed as the number of photons emitted by a unit volume per second over all solid angles [Ropcke et al. 2001]. The intensity I of a spectral line from the |1) ^ |2) electronic transition may be written as
I12 = n1 A12 ■> (3.24)

34 Chapter 3. Experiment
where the initial state is denoted by 1 and the final state by 2. n1 is the population density of the initial electronic level and Aj the corresponding transition probability for spontaneous emission.
A plasma diagnostic technique based on emission spectroscopy has the characteristic of an inverse problem. Usually, integral intensities of emission lines in the line of sight are measured within a certain solid angle with a selected spectral resolution. Only if the plasma is homogeneous over the solid angle being investigated, the local value of the intensity can be determined. Otherwise theoretical inversion methods have to be used such as the Abel inversion in the case of cylindrical symmetry, or tomography. The measured, spatially localized line emission intensities allow the calculation of population densities of the electronic levels of the species of interest provided the transition probabilities are known, and the spectrometer functions have been calibrated. The calculation of species densities in the ground state from measured line intensities often is also an inverse problem. It requires a theoretical model for the excitation and de-excitation processes, all necessary cross sections, transition probabilities, etc., as well as knowledge about the electron energy distribution function (EEDF) [Drawin and Emrad 1978]. These requirements are often non-trivial to achieve.
The main problems in interpretation of OES measurements in the cathode region of the investigated lamps are:
• The intensity of a spectral line is measured line-integrated. Because the plasma of a fluorescent lamp is extremely inhomogeneous in the vicinity of the coil, the plasma parameters ne and Te clearly vary in direction of the line of sight. This steep gradients near the electrode are shown in figure 3.8 by axial profiles of the electron density and electron temperature in a T8-lamp, calculated by Garner [2006].
• These plasma parameters were not measured in the lamps under study.
• The rate coefficient of excitation by electron collisions especially below an electron temperature of 1 eV is unknown.
• The tungsten atoms are inhomogeneously distributed near the electrode, too, because they are locally sputtered [Samir et al. 2005].
• Additionally, the electron density and temperature vary with the discharge current. This correlation is unknown, too.
Nevertheless, a few authors have performed OES measurements on fluorescent lamps anyway not on tungsten atoms during instant start. The effect of auxiliary coil heating on emitter (Ba) loss from fluorescent lamp electrodes under RF operation was investigated by Misono [2001] and for different operating frequencies by Misono et al. [2001].

3.3 Emission spectroscopy 35
plasma density
electron temperature
axial position, z (cm)
Figure 3.8: Electron density and electron temperature calculated by Gamer [2006].
3.3.1 The OES setupHowever, there are some possibilities to observe the spontaneous emission of excited tungsten atoms. The use of an array of several PMTs has the disadvantage of limited numbers of spatial channels. Therefore, emission spectroscopic recording of tungsten erosion was performed by a fast CCD camera (Photron Fastcam PCI R2, Model 1 OK) equipped with a narrow band interference filter with a central wavelength of 429.85 nm (FWHM: 2nm)6. The strongest tungsten line at 400.88 nm could not be observed because the used CCD camera is not sensitive in this region. Typically, the camera system was used at a frame rate of 1000 fps with a resolution of 480 x 512 pixel. A Nikkon objektive with a focal length of 85 mm and an aperture of 1.8 was used to collect as much as possible of the emitted light. At a distance of about 30 cm between lens and coil nearly the half of the coil could be imaged. The experimental arrangement was already presented by introducing the LIF setup in section 3.2.3.
In contrast to the LIF measurements which results in the determination of absolute densities of ground-state tungsten atoms (5Z90), the emissions spectroscopy results in the determination of relative densities of excited tungsten atoms (7P2°, 719°). The interesting part of the level diagram of tungsten is presented in figure 3.9.
A spectrum of the emitted light of a fluorescent lamp with Ar filling is shown in figure 3.10. This spectrum was captured with a fiber optic spectrometer (Ocean Optics HR4000, optical resolution: 0.25 nm) by Lieder and Gamer [2005] on same
6For a typical OES measurement a complete spectrum is measured but here, only one line is observed. In fact, this measurement should be called "2D-imaging" or "2D-emission-measurement".

36 Chapter 3. Experiment
energy
3.26 eV
0.37 eV
7P°2,7D°3:|1>
%%127S,
spontaneousemission
I2>
Figure 3.9: Part of the level diagram of the neutral tungsten atom with transitions for emission spectroscopic measurements.
T8-lamps. The use of the named filter is justified because during the ignition only tungsten is observable (green line), whereas argon lines occur only during steady-state operation (red line).
3000
wavelength [nm]
Figure 3.10: Emission spectrum of a fluorescent lamp with Ar filling during instant start. The green curve was measured during the ignition of the lamp and the red curve during steady-state operation.
3.4 Temperature measurements of the diffuse and spot modes
Investigations on the temperature of the coil in glow and arc mode were performed at the dc lamp (DCL3), shown in figure 3.1(b) with two different coils (cathode side), with and without emitter coating, to investigate the spot formation during the ignition.
Two tungsten coils, Targe’ and ’small’, each of them uncoated and coated with emitter, were investigated. The coils are double winded coils consisting of two tungsten wires: a thick wire (of length Lx and diameter DL) and a thin wire (of length L2 and diameter D2). The small coil is the coil at which all of the tungsten density measurements were performed. A photograph of the large coil is shown in figure 3.11 and

3.4 Temperature measurements of the diffuse and spot modes 37
the parameters of both coils are listed in table 3.2.
Figure 3.11: A photograph (left) and optical microscope image (right) of the large coil.
Large coil thick wire thin wire
Small coil thick wire thin wire
Li [cm] Di L2 [cm] D-2 Li [cm] Di L2 [cm] D-2
[mm] [mm] [mm] [mm]14.2 0.113 184.6 0.026 10.62 0.045 52.67 0.020
Table 3.2: Parameters of the coils under investigation
The temperature of the coil was measured with an infrared camera Indigo Phoenix (detector: InGaAs, spectral range: 0.9 - 1.7 pm, resolution: 320 x 256 pixel, exposure time: > 500 ns, frame rate: 120 Hz) [Kettlitz et al. 2005] by means of the same Nikkon objective as for the emission spectroscopy measurements presented in section 3.3. The distance between coil and objective amounts to about 22 cm.
For calibration of absolute temperatures a tungsten ribbon lamp was used. This lamp was placed into the setup instead of the dc lamp. Afterwards, the temperature was measured on the one hand by the infrared camera and on the other hand by a pyrometer Im- pac IS 10 (spectral range: 0.7 - 1.1 pm, diameter: 0.3 mm, range:900 - 3500 °C). The emission coefficient of tungsten (e = 0.41) was taken from deVos [1954] and Latyev et al. [1970]. The same value was used for the coated tungsten due to the lack of detailed data. In this way, the infrared camera was calibrated in the range between 700 and 1500 °C.
The temperature profile was measured by the following procedure. For different discharge currents the temperature profiles were measured while temporally increasing the heating current. The infrared camera supplied a corresponding movie of the coil temperature. A single frame of this movie is shown in figure 3.12.
Figure 3.12: Snapshot of the coil measured with the frared camera.
in-

38 Chapter 3. Experiment
The vertical curve represents the data points, which were selected for further evaluation. The start and end points of this curve refer to the holders of the coil. Between both horizontal lines the coil is coated with emitter. After having covered the whole range of heater currents the temperature of the coil along the selected curve and the currents and voltages of the discharge and heater were plotted versus time.

Chapter 4
Investigation on a hollow cathode lamp
Investigations on a hollow cathode lamp (HCL) were performed before the main investigations on fluorescent lamps. These are necessary to determine absolute tungsten densities in the fluorescent lamp, too.
The very important advantage of a hollow cathode lamp is that it is a variable source of sputtered tungsten atoms. In this work no extensive or detailed investigations on hollow cathode lamps should be done. Hollow cathode lamps were already investigated by many authors, e. g. Lieder [1989]; Kling and Kock [1999]; Kling et al. [2000]; Hannaford [1983].
Moreover, hollow cathode lamps can serve as tuning tools for precise calibration of the absolute laser frequency. Unfortunately, the dye laser underlies a small wavelength shift within his specifications due to temperature, mechanical and optical effects. For that, the hollow cathode lamp was placed into the laser beam instead of the fluorescent lamp before each measuring session. Subsequently, the dye laser was tuned around the excitation wavelength and the fluorescence intensity was measured. At the exact excitation wavelength the fluorescence signal is at its maximum. Afterwards, the dye laser was adjusted to this wavelength and the fluorescent lamp was positioned into the setup instead of the hollow cathode lamp. This procedure was regularly repeated to control the correct excitation wavelength.
Figure 4.1 shows the temporal evolution of the fluorescence signal1, measured in hollow cathode lamp but on a par with fluorescent lamp measurements. The lifetime of the excited state can be determined from the decay curve.
4.1 Collisional effectsIn addition to spontaneous and induced emission, quenching collisions lead to deexcitation of the atoms and a shortening of the lifetimes of the excited levels. The
'Remark: The intensity of the fluorescence radiation and the intensity of the laser pulse are both given in millivolts (mV) but are not quantitative comparable due to the fact that the LIF intensity was measured by a photomultiplier and the laser intensity by a photo diode.
39

40 Chapter 4. Investigation on a hollow cathode lamp
laser pulse LIF signal
time t [ns]
Figure 4.1: Temporal evolution of the fluorescence signal caused by laser excitation, at 287.94 nm, of ground state tungsten atoms in a hollow cathode lamp. The LIF signal and the measured lifetime are Slif = f Ulifdt = 459 pVs and t = 23 ns, respectively.
quenching by rare gases has often been supposed to be negligibly small but lifetime measurements on complex atoms have shown that such effects can be significant for certain longer-lived levels [Hannaford 1983]. Collisional depopulation can also be strong for highly excited levels. The strongest depopulation is produced by the heavy rare gases Ar, Kr and Xe for which the dipole polarizabilities are large.
The determination of the quenching rate coefficient kst of the quencher St has been performed in the hollow cathode lamp by variation of the rare gas pressure and measurement of the lifetime from the decay curve of the fluorescence radiation. This investigation is based on the relation [Lieder 1989]
_ = kSt nst + , (4.1)T To
where t and t0 are the measured and natural lifetimes, respectively, and Kst = kstnst denotes the quenching rate. The natural lifetime can be estimated by extrapolation of the observed lifetimes to zero rare gas pressure. The measured lifetimes for pure argon and a mixture of argon and krypton, shared equally, are presented in figure 4.2 by a STERN-VoLMER-plot [Demtroder 2000]. For a typical argon pressure of 2 mbar the quenching rate is KAr = 3.3 ■ 106 s-1 and the quenching factor (3.14) is q = 0.93. Thus, de-excitation by quenching collisions is relatively insignificant for the observed transitions of tungsten atoms and can be neglected under these conditions. Furthermore, an error in determination of the quenching rate of 100 % only leads to a maximum error in the quenching factor of 6 %.
4.2 Saturation parameterThe transition from the ground state to the excited state can be saturated for high laser intensities. This saturation is described by the saturation parameter S (3.8) which can be determined experimentally: the LIF signal Slif is measured in dependence on the

4.2 Saturation parameter 41
= 0.77
= 40
rare gas pressure [mbar]
(a) argon filling
t. = 31.6 ± 0.9 ns= (2.0 ±0.2) 10 ms
R2 = 0.969
rare gas pressure [mbar]
(b) argon-krypton filling, shared equally
Figure 4.2: Determination of quenching rate coefficients by a STERN-VOLMER-plot measured in the hollow cathode lamp at a discharge current of 10mA.
laser intensity IL by using different neutral density filters2 to reduce the laser intensity. The measured curve can be fitted by
SSlif ~ S + 1 , with S ~ II. (4.2)
A measured saturation curve is presented in figure 4.3. The saturation parameter only depends on the laser intensity by the relation S = 0.054 ■ IL. This leads to a saturation
= 0.953
laser intensity lL [mV]
Figure 4.3: Measured saturation curve with S = 0.054 • IL. For a laser intensity corresponding to a voltage drop of e. g. 120 mV the saturation parameter is about 6.
parameter in the order of S < 10.
In addition to the experimental determination of the saturation parameter, it can be
2These are special filters for laser radiation in the UV region.

42 Chapter 4. Investigation on a hollow cathode lamp
calculated by [Dullni 1984]
S =
with k =
For a spectral laser line width of AAL = 0.8 pm, a laser cross sectional area of F = 4.2 mm2, a laser pulse duration of tL = 8.3 ns and an energy of about El = 10 gJ the saturation parameter is S = 1076.
The big discrepancy in both methods can be explained by power broadening effects due to an inhomogeneous laser profile. This is illustrated in the next section.
g1 + g2 1 AL EL a __ ,ELgi 8nhc2 AAL tLFA2lT2 = kF'
gl + g2 1 A A21t2g1 8nhc2 A A tL
(4.3)
(4.4)
4.3 Influence on saturation due to an inhomogeneous laser profile
The LIF-theory supposes a spatially homogeneous laser profile. Unfortunately, typical laser profiles and so that of the used laser system is at best Gauss-shaped. That means that the transition to the upper state can not be saturated over the whole laser cross sectional area. More precisely, if the laser intensity is increased the transition is first saturated in the middle of the laser beam but in the edges more and more tungsten atoms are excited. This leads to a so-called power broadening.
A spatial filter behind the Galileo telescope was used to prevent the influence of interference pattern. The spatial filter consists of two lenses (f = 100 mm) and a small pinhole with a diameter of 20 gm centric between both lenses.
The shape of the laser profile was measured by the CCD-camera. In figure 4.4(a) a snapshot and in figure 4.4(b) the shape of the laser profile with (above) and without (below) the spatial filter is imaged. With the spatial filter the laser profile is nearly Gauss-shaped3. The laser cross sectional area can be determined to F = 4.2 mm2 by evaluation of the snapshot of the laser beam.
3Both shapes in fig. 4.4(b) were normalized to unity. Therefore, the profile measured with the spatial filter (above) looks broader than without (below).

4.4 Correction of the fluorescence intensity for a Gauss-shaped laser profile 43
vertical cut
-1.0 -0.5 0.0 0.5radial position [mm]
(a) (b)
Figure 4.4: (a) Snapshot of the laser profile, (b) Shape of the laser profile measured with (above) and without (below) the spatial filter. One can see that the shape of the laser profile measured without the spatial filter depends on the interference behind the pinhole of the Galileo telescope.
4.4 Correction of the fluorescence intensity for a Gauss-shaped laser profile
The laser energy El and, therefore, the saturation parameter4 is constant for a spatially rectangular laser profile with a diameter R
SR = § for r < R and (4.5)
SR = 0 otherwise. (4.6)
The total number of all laser photons through the laser cross sectional area F is Nl,r = EL/{hvL). Due to high saturation the LIT signal is independent of the laser energy and can be determined analogously to (3.17) by
Slif,r = c0cinwV,V = FL = ttR2L,
with the setup-specific constant c0 and the transition-specific constant c\
c0 = QGeZT —— and 4tt
^23 92Ci = —------- -------------- ,
A2 — A21 g 1 + 92
where Z is the internal resistor of the used digital oscilloscope (50 0).
4 To distinguish the saturation parameter and the LIT signal, until now symbolized by S, the saturation parameter is symbolized by § in this section.
(4.9)
(4.10)
(4.7)
(4.8)

44 Chapter 4. Investigation on a hollow cathode lamp
For the Gauss-shaped laser profile (figure 4.4(b), above) the saturation parameter can be written by
Sc = S-/(r), (4.11)
with /(r) = (4.12)
with the full width at half maximum (FWHM) o = W \J(In 4) = 0.5//,Three areas can be separated under the Gauss shape (figure 4.5): in the interval
[—Ei, Ei] the region of high saturation (HS, red), where E>Hs > 10, in the interval [—E, — E2] A [E2, E] the region without saturation (NS, cyan), where E>ms <0.1 and in the interval [—E2, —Ei] A [Ei, E2] the region of low saturation (LS, blue), where 0.1 < E>ls < 10. The values of the radii Ei and E2 depend on the laser energy and
Figure 4.5: Separation of the Gauss curve in three areas depending on the saturation parameter §.
can be determined by solving (4.11)
(4.13)E? = J^hi^81n4 hF
The number of the laser photons must be determined which cross these three areas. For the overall laser pulse the total number of the laser photons is 5
rR
2?r J r/(r) dr,
and the number of laser photons of each area are
(4.14)
Nl,hs =rRi/ r/(r]/ 0
) dr, (4.15)
=/ r/(r)
>Ridr, (4.16)
Nl,ls =(•Ri/ r/(r]JRi
) dr. (4.17)
5For the rectangular laser shape holds /(? ) = 1 and, thus, 2n J(f r 1 dr = irR2 = F.

4.4 Correction of the fluorescence intensity for a Gauss-shaped laser profile 45
With these requirements the LIF signal SLIf,g can be determined, which is the sum of the LIF signals per area. The LIF signal of the high saturation area is analogouslyto (4.7)
SLIF,HS — c0c1nW "Kgs,Vhs — Fhs L — nR21L.
(4.18)
(4.19)
Due to high saturation the LIF signal SlIf,hS is independent of the laser energy. The LIF signals of the low and unsaturated areas are
SLIF,LS — CoC2nw LNL,3(§LS +1), (4.20)
SlIF,NS — OoC2Uw LNl, 2, (4.21)
where c2 — aLIF A23/A2 is the transition-specific constant and aLIF the fluorescence cross section for the corresponding transition.
Because the saturation parameter in the low saturated region SlS is not constant, or - more precisely - a function of the radius, this region is split in ten sub-regions i of same length Ar, where Ar — (R2 — Ri)/10. Thus, on the one hand the saturation parameter SLS,i and on the other hand the number of laser photons NL;LS;i per subregion has to be evaluated:
NL,LS,i
SLS,i
Nl,R 2n rRl +iAr
F Ri+(i-1)Ar
S • exp2(Ri + (i
w
rf (r) dr,
— 2 )Ar)21
(4.22)
(4.23)
With these both requirements the exact LIF signal of the low saturation region can be determined
SLIF,LS SL!F,LS,, yi c0c2nWLNL,LS,i(SLS,i + 1).i
(4.24)
The quotient of the LIF signals of the rectangular laser pulse and of the Gaussshaped laser pulse leads to a correction factor C
1C
SL!F,G SLIF,HS + SL!F,NS + SLIF,LSSL!F,R SL!F,R
(4.25)
F + ^LI£Al—A21 (Nlns + ENL,LS,i(SLs,i + 1)), (4.26)F F A2 g2
that only depends on the laser energy and some known coefficients.That means, that the density of the excited species could be determined more ex
actly than in the past for a known (Gauss-)shaped laser profile by
nG — C • nR (4.27)

46 Chapter 4. Investigation on a hollow cathode lamp
where nR is the density determined for a rectangular laser profile and n(j is the corrected density for a Gauss-shaped profile.
In figure 4.6(a) the correction factor for a laser cross sectional area of F = 4.2 mm2 and a Gauss-shaped laser profile with FWHM = 1/2 R of the observed transition of ground-state tungsten atoms is presented. In figure 4.6(b) a measurement of the LIF signal in a hollow cathode lamp is presented in comparison to calculations of the LIF signal for a Gauss-shaped and a rectangular laser profile. The calculation was performed for a tungsten density of nw = 5.1 • 109 cm-3 and
5. 1.5-
(n 1.0 -
laser energy EL [jiJ]
2.o -
CO1 1.6-
O 1.4 -
laser energy EL [jaJ]
(a) (b)
Figure 4.6: (a) Correction factor C for a laser cross sectional area of F = 4.2 mm2 and a Gaussshaped laser profile with FWHM = 1/2R. (b) Measurement of the LIF signal in a HCL (•), with corresponding fit (dashed), and calculation for a rectangular (dash-dotted) respectively a Gauss-shape (straight) laser profile.
the following parameter: Q = 0.25, G = 2 • 106, T = 0.01, AQ/4tt = 6.6 • 10 4 sr, A2 = 0.44 • 10s s"\ A21 = 0.25 • 10s s"\ A23 = 0.16 • 10s s"\ 9l = 1, g2 = 3, andclif = 60.2 • 10 18 m2.
4.5 Determination of tungsten densities in the hollow cathode lamp
Tungsten densities can be determined in case of high saturation by development of (3.21)
n _ SlLF OjiayJlRay Ag. ~ Agl \ #1+02 -Ef ^
Ul SRay F q A23 47tK(6) g2 his12
The determination of the ground-state population density is exemplarily presented for the following fluorescence measurement of the transition 5D0 —> 347? —>5 Dx in the hollow cathode lamp for a discharge current of 10mA:
• laser pulse at Al = 287.94 nm: IL = 1305 mV, EL = 8.5 pi, tL = 8, 3 ns
• LIF signal: Slif = 2352 pVs

4.5 Determination of tungsten densities in the hollow cathode lamp 47
• Rayleigh signal for pxe = 1 bar: SRay = SRay/(pxeIl) ■ Il ■ Pxe = 3393 pVs
• laser cross sectional area: F = 4.2 mm2
• xenon density: nXe = pXe/(kT) = 2.45 ■ 1019 cm-3
• collision factor for an argon filling of 2 mbar: q = 0,93
• polarization of fluorescence: 4nK(0) = 3/4
• correction factor: C = 1.35
This results in a ground-state population density of nw(5D0) = 5.1 ■ 109 cm-3.
More interesting than the population density is the total tungsten density in the observed volume which depends on the individual excitation conditions. Therefore, the population densities of the transitions presented in table 3.1 were determined, first in hollow cathode lamp later in fluorescent lamp. This densities were plotted in a Boltzmann Plot in dependence on the energy shift AEj as shown in figure 4.7(a). By means of the excitation temperature determined from the slope of the fitted
= 0.96653 -
or-2 .
c -4 -
.2 0.4 0.6energy shift AE. [eV]
(a)
HCL discharge current lHCL [mA]
(b)
Figure 4.7: (a) BOLTZMANN-Plot to determine the excitation function from the slope of the fitted line and therewith the partition function Z. (b) Density of eroded tungsten atoms in dependence on the hollow cathode lamp discharge current.
line Ta = 1800 K one obtains the partition function to Z = 3. With this partition function the total density can be calculated by the relation nW = n1 Z/g1. This yields to a (total) tungsten density of nW = 15 ■ 109 cm-3.
By increasing the energy of the argon ions accelerated to the wall of the tungsten cathode sputtering of cathode material is increased. This leads to an increase of the tungsten density by increasing the discharge current as shown in figure 4.7(b). A fluctuation in discharge current of ±1 mA around the typical value of 10 mA is within the measurement error.

48 Chapter 4. Investigation on a hollow cathode lamp
4.6 Model of the tungsten density in the hollow cathode lamp
Preceding the following model of the tungsten density in the hollow cathode lamp, the argon plasma in the hollow cathode was theoretically studied by a hybrid model. This self-consistent model combines a kinetic treatment of the electron component with a fluid description of the discharge carriers and determines approximately the flux jw of sputtered tungsten atoms. The details of this model are described in our previous work [Hadrath et al. 2005]. This publication includes some of my experiments, but the presented model was developed by F. Sigeneger.
To determine the density of tungsten atoms in the hollow cathode the twodimensional diffusion equation -DWAnW(r, t) = FT(r)jW has been solved. The source term includes the profile FT(r) which describes the thermalization of sputtered atoms due to collisions with the gas atoms. This profile has been taken form a description of the thermalization of sputtered copper atoms by Monte Carlo calculations [Bo- gaerts et al. 1995]. To complete the model the boundary condition (dnW)/dr = 0 has been applied at the cathode surface and the tungsten density has been set equal to zero at both ends of the cathode cylinder. For the diffusion coefficient of the tungsten atoms in argon at an estimated temperature T = 300 K a value of DW = 88 cm2 s-1 has been determined from a hard core model [Born et al. 2000]. The density profile obtained for the tungsten atoms is shown in figure 4.8 for a discharge voltage of 180 V. Assuming axial homogeneity, the total current can be calculated to Ihcl = 5.7mA. Because of the small radius only a weak variation of the axial profile between the cathode surface and the centre occurs. The calculated density of the tungsten atoms in the centre is in relatively good agreement to the measured density of the tungsten atoms as shown in figure 4.7(b). However uncertainties remain, mainly with respect to the correct determination of the ion energy distribution and the thermalization profile.

4.6 Model of the tungsten density in the hollow cathode lamp 49
cathodecentre
z [ cm ]
Figure 4.8: Axial density profile of the tungsten atoms determined by the diffusion model.

50 Chapter 4. Investigation on a hollow cathode lamp

Chapter 5
Investigation of tungsten erosion processes in fluorescent lamps
In this chapter the investigations on tungsten erosion on both the dc lamp and the commercial fluorescent lamp are presented and the experimental results are discussed. Due to the high relevance for practice all investigations were performed on lamps that are as much as possible similar to commercial lamps. Therefore, it was not always possible to vary every parameter (such as filling gas and pressure, emitter coating, or mercury filling) from one lamp to another one as this may be possible under laboratory conditions like in a more flexible plasma vessel. Thus, the presented measurements are samples for different types of lamps and describe individual cases of lamp ignitions.
5.1 Reason of tungsten erosionTungsten can be eroded in two different ways - on the one hand by evaporation at higher temperatures and on the other hand by sputtering due to ion bombardment.
The spot temperatures, during steady state, typically are in the range of 12001400 K. During the cold ignition the temperature can rise up to 2000 K [Hockel 2006; Lieder 2005]. The vapor pressure of tungsten at 2000 K is about 10-6 Pa [Stull 1972] which represents a maximum particle density of about 107 cm-3 (without influence by the plasma electric field). The measured densities are in the order of 108 — 109 cm-3 as shown later in this chapter. Therefore, evaporation cannot be the reason of the tungsten erosion. To a greater degree the erosion is affected by sputtering processes1. Haverlag et al. [2002] presented a detailed electron microscope image of the area where the electrode has broken (figure 5.1). A typical "shadow" pattern was found. This indicates that the erosion process that is responsible for the electrode fracture is likely due to a sputtering process by bombardment of energetic particles. *
'For comparison, the maximum particle density of Barium atoms at similar spot temperatures is about 1017 cm-3 which explains the high Barium loss during steady-state operation [Bhattacharya 1989a]. Of course, the measured densities are lower due to the influence by the plasma electric field
51

52 Chapter 5. Investigation of tungsten erosion processes in fluorescent lamps
Figure 5.1: Detailed electron microscope image of the area where the electrode has broken. A typical "shadow" pattern (see arrows) is found. This indicates that bombardment by energetic particles is responsible for the fracture of the coil [Haverlag et al. 2002].
5.2 The low-pressure dc argon discharge
A dc lamp was used to investigate the process of tungsten erosion under stationary conditions in the critical glow phase. It is clear that the results obtained in the dc discharge can not entirely transferred to the ac discharge of fluorescent lamps. Simply because in the first few milliseconds of the ignition of an instant started lamp the glow phase is present, the discussion of the basic sputtering processes is usefull.
The following measurements were performed at the dc lamp DCL 1 and DCL 3, as described in section 3.1.
The current-voltage characteristic of the dc lamp and snapshots of the coil in glow and arc mode are shown in figure 5.2. The current-voltage characteristic represents the well-known characteristic of a glow discharge [Rutscher and Deutsch 1983].
In the usual range of glow-discharge conditions encountered in lamps, the cathode fall increases with increasing current. The increase of cathode fall with current is in general stronger than the decrease in potential drop across the positive column with increasing current. The lamp as a whole then has a positive current-voltage-characteristic in the glow phase. This helps the transition from glow to arc discharge by increasing the energy input to the cathode from the discharge. The positive ions reaching the cold cathode strike it with energy up to a maximum equal to ion charge times cathode fall, and most of this energy goes into heat, which increases cathode temperature. The higher the cathode fall and the ion current, the faster the cathode is heated to emitting temperature and the sooner the discharge is converted to a hot-cathode discharge.
At the transition from the glow to the arc mode at a discharge current of about 11- 12 mA, the cathode fall strongly reduces, which leads to an decrease of the total lamp voltage with increasing current.
The density of eroded tungsten atoms during the glow phase was measured by

5.2 The low-pressure dc argon discharge 53
Figure 5.2: Current-voltage-characteristic of the dc lamp (a) and snapshot of the tungsten coil in glow (b) and arc (c) mode. The coating appears dark because the lamp was already driven before taking this snapshot.
laser-induced fluorescence at a discharge current of 10 mA. The main problem is the very short lifetime of the cathode in the stationary glow mode of only a few hours. Therefore, it was not possible to reduce the measurement error by averaging about a lot of measurements.
Furthermore, the determination of total tungsten densities was not possible because the lifetime of each coil was too low to determine the population densities of different states of the tungsten atom. By comparison with the density distribution in hollow cathode lamp and commercial fluorescent lamps (see next section) one can expect total densities which are 2-5 times larger than the ground-state population densities.
Radial profiles of the population density of ground-state tungsten atoms in a distance of 1-3 mm to the coil measured in the dc lamp DCL 1 are presented in figure 5.3. The maximum tungsten density was measured directly in front of the emitter free parts.
Another example is presented in figure 5.4 showing a completely different behaviour. Here, the dc lamp DCL 3 was investigated. The erosion of tungsten is nearly independent of the radial position, although at the emitter free parts more tungsten should leave the cathode. Although the filling of both lamps are not really the same2, this disagreement has other reasons. To a greater degree the different history of operation conditions can give an explanation.
Lamp DCL 1 was only driven in glow mode. That means, during its whole lifetime the coil was always operated as a cold cathode and in addition to this the emitter
2As described in section 3.1 the DCL 1 contains mercury and a mixture of argon and krypton and the DCL 3 contains only pure argon without any additive of mercury.

54 Chapter 5. Investigation of tungsten erosion processes in fluorescent lamps
5 -------- J--------- 1------ LJ--------- ,--------- 1--------- 1--------- 1--------- 1--------- 1--------- I-J-------1--------- 1--------- L-6 -4 -2 0 2 4 6
radial position r in front of the coil [mm]
Figure 5.3: Profiles of the population density of eroded tungsten atoms in the ground-state at a discharge current of 10mA in radial direction in front of the coil in the dc lamp (DCL 1). The dotted lines represents the stems and the boundary of emitter coating, respectively.
remained unchanged because it did not reach its normal operating temperature. In the first minutes of cathode lifetime no (or only a few amount of) tungsten is deposited on the coated part of the coil.
In contrast to this, DCL 3 is a pretreated lamp3. The coil was preheated and, therefore, it was operated as a hot cathode. The coil has reached its normal operating temperature for thermionic emission and the emitter structure was not longer unchanged. During this burn-in-process, sputtered atoms from the bare tungsten ends are bounced back on the cathode surface by the rare-gas, and deposited helter-skelter instead of in an orderly way, and then sputtered again from the whole surface [Waymouth 1971]. At the present pressures the mean free paths4 of atoms evaporated from the cathode surface are very much shorter than the distance between cathode and bulb wall.
Furthermore, the emitter became porous and the discharge could attach the whole cathode during the glow phase. This assumption seems to be supported if one takes a look on the snapshots of the both coils during the glow mode measured by the CCD camera without any interference filter. In DCL 1 the bare tungsten ends of the coil appear brighter (figure 5.5(a)) which is an indicator that the discharge attaches primar-
3Investigations of the diffuse and spot modes (see chapter 5.4) were performed at this lamp before the LIF measurements.
4The mean free path length is of about a few tens of micrometers.

5.2 The low-pressure dc argon discharge 55
8.0
7.0
6.0
c5
Ii1
5.0
4.0
3.0
2.0
1.0
radial position r in front of the coil [mm]
Figure 5.4: Profiles of the population density of eroded tungsten atoms in the ground-state at a discharge current of 10 mA in radial direction in front of the coil in the dc lamp (DCL3). The dotted lines represents the stems and the boundary of emitter coating, respectively.
ily at this parts, whereas in DCL 3 the discharge covers the whole coil (figure 5.5(b)). Because of the disordered distribution of tungsten over the whole cathode surface including the bare tungsten ends as well as the emitter covered parts, and the structural change of the emitter itself, the tungsten was sputtered from the whole surface.
Ionization length of tungsten By means of laser-induced fluorescence, absolute densities of coil material in the vicinity of the coil can be determined. That means that one measures the source, but not the transport. However, the thing of interest is the subsequent flux of tungsten away from the electrode. Therefore, the ionization length is an important parameter to decide if such flux measurements are possible by means of emission spectroscopy.
The central requirement is, that the ionization length of tungsten has to be smaller than the lamp diameter. The ionization length, which depends on the mean velocity v of eroded tungsten atoms, the electron density ne, and the rate coefficient of ionization S can be described by [Steinbrink 1997]
v^ion = 7^- (5-1)
Due to the lack of data it is difficult to evaluate this characteristic length. As an upper boundary, the following estimation results in an ionization length of about 10 cm.

56 Chapter 5. Investigation of tungsten erosion processes in fluorescent lamps
(b)
Figure 5.5: Snapshot of the cathodes of both dc lamps DCL 1 and 3 observed by the CCD camera without any interference filter.
Here, the mean velocity of eroded tungsten atoms was determined from the mean kinetic energy of sputtered tungsten atoms by argon ion bombardment in a linear plasma generator [Steinbrink 1997] to v = 2 • 105 cm/s, which was estimated as the half of the sublimation energy of tungsten atoms. The rate coefficient of ionization was determined to S = 2 • 10-9 cm3/s by the same setup for an electron temperature of about 1 eV, which is typical here [Garner 2005]. The electron density of ne % 1013 cm-3 is based on interferometrical measurements of Garner [2005] in the glow phase of a 28W-T8 lamp operating on an electronic instant start ballast.
For a lower boundary, the ionization length can be determined experimentally. The tungsten density is measured in front of the emitter free part of the coil (at r = 3.75 mm) in axial direction of the lamp as shown in figure 5.6 for lamp DCL 3. From the decay of the curve the ionization length yields to about 3 mm under the limitation of a complete ionization of the sputtered tungsten atoms. However, among the ionization, diffusion of tungsten can lead to a loss of tungsten atoms.
Due to the fact that the estimation for the upper boundary is in the similar way uncertain as the estimation for the lower limit, more detailed investigations are necessary to decide if flux measurements by emission spectroscopy are possible.
The measurement of the particle drift is another possibility to get a better understanding of the transport processes. Velocities of tungsten atoms can be determined by measurement of the doppler profile by laser-induced fluorescence, too. But therefore, lasers are needed, which spectral width is much less than the line width of the transition (A\l C 0.7pm, see appendix A.l). A possible laser system could be a diode pumped Nd: YAG cw-laser in combination with a dye ring laser. Therewith, laser line widths down to 3 fim are possible.

5.3 Commercial fluorescent lamps 57
8.0
7.0
6.0
O« 5.0
tc0"Oco
4.0
3.0
2.0
1.0
0.0012345678
distance d to the coil [mm]
Figure 5.6: Profiles of the population density of eroded tungsten atoms in the ground-state at a discharge current of 10 mA in axial direction in front of the emitter free part of the coil (at 3.75 mm) in the dc lamp (DCL3).
5.3 Commercial fluorescent lamps
5.3.1 Investigation of early failure lampsAs shown in the previous section the homogeneity of the emitter coating seems to be one of the mainly influencing factors that affect the lifetime of the electrode. Detailed studies on commercial lamps by Lieder [2005] at OSRAM confirm this assumption. Therefore, his studies are presented in the following subsection to compare both investigations.
The lifetime of the electrode was investigated in dependence on the fill pressure [Lieder 2005]. Two different teams have detected the maximum number of switching cycles of a commercial 18W-T8-lamp (independent of each other) that contains the same tungsten coil as in the previously observed dc lamp. During one switching cycle the lamp is 30 s on and 30 s off. This is a standard procedure of lamp manufacturers to investigate the lifetime of lamps. It does not represent the normal use of fluorescent lamps but stronger demands they.
In figure 5.7 the maximum number of switching cycles are plotted versus the pressure of the rare gas mixture, argon and krypton, shared equally. A dependency on the fill pressure is not observable but two groups of lamps can be separated: early failure lamps and long runners. Microscopic investigations of the emitter coating have shown that the coils of long runners are inhomogeneously covered and those of the

58 Chapter 5. Investigation of tungsten erosion processes in fluorescent lamps
early failure lamps are homogeneously covered. The mean lifetimes are 7700 db 420 and 870 db 70 switching cycles, respectively. Early failures and large spreads in lamp lifetime could not be avoided by these empirical improvements (see figure 5.7). This can be explained by the stochastic nature of the coil coating by emitter material and resulting more or less homogeneity of covering.
_ A team A V team B
14000
12000
10000inhomogeneouslycoveredemitter
6000
homogenouslycoveredemitter
fill pressure [Torr]
Figure 5.7: Maximum number of switching cycles of a commercial 18W-T8-lamp measured by two different teams at Os ram [Lieder 2005].
In the glow mode the discharge attaches the coil only at bare tungsten because the emitter is an isolator at low temperatures. In case of a homogeneously covered electrode only the uncovered ends of the coil are bare tungsten parts where the glow discharge can attach. Due to the increasing coil temperature by ion bombardment the emitter becomes able to reduce the work function for secondary electron emission. The discharge contracts and switches into an arc discharge which attaches the coil directly at the transition region from the uncovered to the covered part of the coil. Haverlag et al. [2002] have shown that coil breakage mainly takes place at this emitter-free ends.
In case of an inhomogeneously covered electrode several bare tungsten areas are present distributed along the (covered) coil. The glow discharge can attach the coil at different positions. Because there is no preferred discharge attachment point the durability of the coil is increased.
Four lamps (marked with a, b, c, and d in figure 5.7) were randomly chosen for further tests: two with homogeneously and two with inhomogeneously covered coils

5.3 Commercial fluorescent lamps 59
where each of them is covered with a different amount of emitter material. In figure 5.8 snapshots of this lamps before and after the lifetime tests are presented. The lamp
(a) 8.1 mg, 9939 #, inhomogeneous (b) 4.6 mg, 7576 #, inhomogeneous
(c) 8.1 mg, 1903 #, homogeneous (d) 4.8 mg, 1404 #, homogeneous
Figure 5.8: Snapshots before (small subhgure) and after lifetime test [Lieder 2005]. The emitter weight, the maximum number of switching cycles and the structure of the emitter coating is given below each figure.
tubes of both early failure lamps (below) were extremely blackened, whereas the long runners (above) have a nearly clear glass tube. And this in spite of the more than five times larger maximum number of switching cycles. The black layer is less sputtered tungsten, but to a greater degree evaporated barium, the main part of the emitter mix, which is caused by a temperature rise of the coil [Hockel 2006; Gamer 1998].
The eroded tungsten is deposited on the cathode surface, which "poisons" the emitter coating and, therefore, increases the work function [Waymouth 1971]. Thus, the coil must be heated to higher temperatures to supply the required thermionic emission. But this temperature increase leads to an increased evaporation rate of barium, that is deposited on the wall. Waumans et al. [2004] have shown, that during steady-state operation the deposited tungsten will be transferred into tungsten oxide base material.
The additional observation of a single emission line at 400 nm of atomic tungsten by means of an automated fast emission monochromator (AFEM) was performed by Lieder [2005] to investigate the tungsten erosion during the whole lifetime of each lamp. The spectrometer setup5 consists of a 1 m monochromator and a linear array
5 The detailed setup of the automated fast emission monochromator (AFEM) is shown in [Hockel

60 Chapter 5. Investigation of tungsten erosion processes in fluorescent lamps
with 8 photomultipliers which are connected by a 32 channel array of quartz fibers. This setup has a spectral resolution of 50 pm, a spatial resolution of 0.55 mm and a temporal resolution of 200 p,s. In figure 5.9 the positions of the active channels along the coil is presented. With this 8 channels the tungsten erosion along one half of
Figure 5.9: Observation points of the AFEM along the coil [Lieder 2005]. The channel 12 is inactive. The coil length amounts to about 10 mm.
the coil could be observed. The emission signals - temporally integrated over the glow phase - of atomic tungsten for each of the named lamps versus the switching cycles and versus the 8 observation channels are plotted in figure 5.10. Both early failure lamps (below) erode very strong coil material especially at the bare tungsten ends of the coil near the post. All the more tungsten is eroded all the earlier the coil is broken. Both long runners (above) erode less tungsten and erode nearly the same amount independently of the position at the coil.
This result confirms the investigations performed at the dc lamp in the previous section. Unfortunately, a declaration of the lifetime of the coils of the dc lamps could not be given, because these lamps were only driven in glow mode, whereas the lamps discussed here were switched on and off.
5.3.2 Fluorescence measurements on commercial fluorescent lamps
At the moment when the measurements on commercial fluorescent lamps were performed the spatial filter, as described in section 4.3, was not yet implemented in the experimental setup. For that reason the actual tungsten densities can be around two times larger than the measured ones. This factor represents the measurement error due to the inhomogeneous laser profile. The LIF measurements were performed at the commercial T 12-lamps described in section 3.1.
2006]. The AFEM was build at Osram Munich with support from Os ram Augsburg.

5.3 Commercial fluorescent lamps 61
Figure 5.10: Emission signals of the AFEM - integrated over the glow phase - of atomic tungsten for two long runners with inhomogeneously covered coils (above) and two early failure lamps with homogeneously covered coils (below) [Lieder 2005].
emiss
ion
signa
l [ar
b.u.
j em
issio
n sig
nal [
arb.
u.j

62 Chapter 5. Investigation of tungsten erosion processes in fluorescent lamps
The physics of lamp ignition
To investigate the tungsten erosion processes during instant start of a fluorescent lamp it is necessary to synchronize the lamp ignition with the laser repetition rate. Due to the low laser repetition rate of 10 Hz there is only one laser pulse per ignition available to excite eroded tungsten atoms. That means that one has to reconstruct the temporal evolution of the sputtered tungsten density on the base of different lamp starts. Certainly, one has to take into account the stochastic nature of lamp starts in time and space. For this reason an average determination associates with this single measurements.
A single measurement of the current-voltage-characteristic is shown in figure 5.11. The fluorescent lamp is driven by an electronic control gear with a frequency of around
o -500 -
time [ms]
Figure 5.11: Example of a current-voltage-characteristic during instant start of the fluorescent lamp. The dashed lines mark A) power on, B) ignition, C) LIF-measurement and D) glow-to-arc transition of the observed electrode.
44 kHz. Few milliseconds after power on (A, t = 0), the lamp ignites which is marked by the jump of the lamp voltage at t = 3 ms (B). In this example, the LIF-measurement was performed 15 ms after the ignition of the lamp (C). At about 24 ms (D) the lamp voltage decreases which is an indication of the transition from the glow to arc mode of the observed electrode. Note that the two electrodes do not make the glow-to-arc transition at the same moment. The delays between ignition and LIF-measurement and between LIF-measurement and glow-to-arc transition are called the ’time after ignition’ AtZ and the ’time related to the glow-to-arc transition’ Atg, respectively. These delays differ from ignition to ignition.
Furthermore, the moment and sometimes the position of the glow-to-arc transition stochastically fluctuate. Therefore, the CCD observation of excited tungsten atoms has been used as an additional tool to select comparable ignitions [Hadrath et al. 2005].
Tungsten erosion during instant start
In figure 5.12 the investigated section of the coil is presented and the location is marked, where the discharge attaches. In contrast to the modeling results of Haver-

5.3 Commercial fluorescent lamps 63
lag et al. [2002] the discharge attaches not only at the bare tungsten ends of the coil but also at the emitter covered part, due to the inhomogeneous coating of the coil.
Figure 5.12: Tungsten coil with positions of the attachment point and for the LIT-measurements. The laser pulse with a diameter of 1 mm crosses the coil in a distance of 2 mm. The picture was taken during lamp off.
At five equidistant locations 2 mm in front of the coil with a distance (in radial direction r) of 0.5 mm nine LIF-measurements were performed each time during successive lamp starts 10,15,..., 45 ms after switching on the lamp [Hadrath et al. 2004, 2005]. The absolute population density of ground-state tungsten atoms has been determined from the intensity of the fluorescence signal. The reconstructed tungsten density profiles are presented in figure 5.13.
In the upper figure one can see the temporal evolution of the tungsten density in relation to the moment of the ignition of the lamp and in the lower one the same densities in relation to the moment of the glow-to-arc transition. Due to the large scatter of the time interval between the ignition and the glow-to-arc transition for different instant starts the upper figure better describes the tungsten densities directly after the ignition and the lower one better the behaviour during the glow-to-arc transition. Another possibility to represent the reconstructed temporal evolution of tungsten density is given in figure 5.14. Here, the densities are plotted versus the period between ignition and glow-to-arc transition, which is normalized to unity. Zero characterizes the ignition and one characterizes the glow-to-arc transition.
The eroded tungsten density increases immediately with the ignition, reaches a maximum where the discharge contracts at the end of the glow mode and decreases some milliseconds before the glow-to-arc transition takes place. Note that the transmission of the bulb was not considered. That attenuation which has to consider for the intensity of the laser and the fluorescence signal, each of about 45 %, will increase the measured tungsten densities in the commercial fluorescent lamp by about a factor of four. The maximum tungsten erosion is investigated within a region of a few hundred micrometers only located at the discharge attachment point.

tung
sten
popu
latio
n de
nsity
tu
ngst
en po
pula
tion d
ensit
yn/
DJU
Cfc
m-3]
n/
Djn
tfcm
3]
64 Chapter 5. Investigation of tungsten erosion processes in fluorescent lamps
r = +1.0 mm r = +0.5 mm r = 0.0 mm r = -0.5 mm r = -1.0 mm
time after ignition Atz [ms]
(a)
r = +1.0 mm r = +0.5 mm r = 0.0 mm r = -0.5 mm r = -1.0 mm
time related to the glow-to-arc-transition Atg [ms]
(b)
Figure 5.13: Two reconstructions of the same tungsten density measurements, according to the time after ignition (a) and the time related to the glow-to-arc transition (b) at different positions near the coil. Due to the neglect of the transmission of the bulb, the density is about four times higher.

5.3 Commercial fluorescent lamps 65
glow-to-Arctransition
- - r = +1.0 mmignitionr = +0.5 mmr = 0.0 mmr = -0.5 mm
-1.0 mm
« <T
period between ignition and glow-to-arc transition [rel.
Figure 5.14: Reconstruction of the tungsten population density according to the normalized period between ignition and glow-to-arc transition.
It was found by Haverlag et al. [2002] that the contraction of the discharge already sets in a few milliseconds before the lamp voltage starts to decrease. This means that a contracted glow discharge with a high cathode fall is present in these last few milliseconds before the glow-to-arc transition is observed in the electrical signal. The times when the contraction and the lamp voltage decay occur are usually 3 - 5 ms apart and occur at different times for the two electrodes.
Due to spatial and temporal variations of discharge signatures between subsequent ignitions, the reconstruction of the temporal evolution of tungsten erosion can strongly fluctuate. Therefore, the OES measurements by a fast CCD camera were performed that delivers a 2D pattern of the eroded tungsten. The results of these measurements are presented in figure 5.15. The temporal evolution of the lamp voltage (top), of the discharge current (middle) and of the emission signal (bottom) are shown which has been recorded with a rate of 1000 frames per second. With respect to the latter the ordinate corresponds to the spatial coordinate parallel to the axial direction of the coil (respective the radial direction r of the lamp) as illustrated by the snapshot at the left hand side. This snapshot shows the lower end of the coil where the discharge attachment point (at r % 0.4 mm) can be observed. The total length of the coil amounts to about 20 mm. The signal plotted in the lower figure has been obtained by integrating the emission signal over the radial direction of the coil (respective the axial direction z

66 Chapter 5. Investigation of tungsten erosion processes in fluorescent lamps
of the lamp) for each frame.
r
40 50 60time t [ms]
100
Figure 5.15: Discharge current and lamp voltage characteristics during instant start of the fluorescent lamp (above) with corresponding emission spectroscopic measurement by a CCD camera (below) and a snapshot of the coil (left).
In contrast to the LIF measurements (see figure 5.14) showing a nearly uniformly tungsten sputtering during the whole glow mode the maximum emission signal was only detected during the glow-to-arc transition. This is affected by the strong excitation of the sputtered tungsten atoms and does not indicate the maximum sputter rate during the glow-to-arc transition.
This interpretation is supported by OES and atom absorption spectroscopy (AAS) measurements also on atomic tungsten by Lieder and Garner [2005] at similar T8-lamps. They also detect the maximum emission signal during the glow-to-arc transition but the maximum absorption signal maximum ground-state tungsten density)

5.3 Commercial fluorescent lamps 67
in the glow phase.
For comparison the sputter yield of tungsten atoms calculated by Haverlag et al. [2002] is given in figure 5.16. By this picture Haverlag et. al explain that the effective sputter yield increases by a large factor while the discharge is contracting to the arc. They argue that the emission current density increases during the contraction and, therefore, the ion energy distribution shifts to larger ion energies [Davis and Vander- slice 1963] and the ion current density also increases there. The conclusion of their interpretation is that strongly enhanced sputtering takes place in the region of the contraction a few milliseconds before the glow-to-arc transition.
Thus, the different results of LIF, AAS and OES show the need for the application of different types of diagnostics. Otherwise the interpretation is at least difficult.
5.3.3 Determination of total densities
As described in section 4.5 for the hollow cathode lamp the total densities can be determined under the assumption of a BOLTZMANN distribution. It is clear that the assumption of a BOLTZMANN distribution is not valid in most cases. Due to the low temperatures the influence of the specific distribution on the calculated total densities is low. Therefore, it is reasonable to apply the most common distribution.
The transitions presented in table 3.1 were observed. In contrast to the hollow cathode lamp, the determination of the population density of the state 5D4 was not possible, because the fluorescence radiation was too weak. The measured population densities versus the ignition time are plotted in figure 5.17(a), whereas only relative densities are given. This is sufficient because only the density relations between the observed states are needed. The high range of variation is shown which is on the one hand a reason for the deviation between subsequent ignitions and on the other hand for the low repetition rate of only one measurement per ignition. Under the assumption that the glow phase occurs approximately in the first 20 ms after the ignition a "mean population density" in the glow phase was determined by an averaging of the very densities.
The resulting density relation is placed in a BOLTZMANN-Plot (figure 5.17(b)). The worst fitted lines are plotted (dashed lines) as boundaries resulting in excitation temperatures of 1000 and 2600 K. The partition functions are 1.5 and 5.2, respectively and, therefore, in the glow phase the total tungsten density is about 2-5 times higher than the population density of the ground state.

68 Chapter 5. Investigation of tungsten erosion processes in fluorescent lamps
Figure 5.16: Calculated sputter yield as a function of the position on the electrode. During the contraction the sputter yield increases by a large factor which explains the observed local damaging of the electrode coil [Haverlag et al. 2002].
Figure 5.17: (a) Population densities of the 5 D0, 5Di, and bDs states in the glow phase of the lamp ignition. The dashed line marks the end of the glow phase, (b) BOLTZMANN-Plot to determine the excitation function from the slope of the fitted line and therewith the partition function Z. The dashed lines mark the worst fitted lines with an excitation temperature of 1000 K and 2600 K.
5.4 Temperature measurements and modeling of the diffuse and spot modes in a low-pressure dc argon discharge
Experimental results and thermal modeling of the temperature distribution of the fluorescent lamp electrode by Soules et al. [1989] have emphasized the need to include the entire temperature profile along the electrode in any discussion of electrode lifetime.
Two coils of different size, each of them uncoated and coated with oxide mix, were used in measurements of the coil temperatures at varying heat power and discharge current. The modeling of Golubovskii, Porokhova and Sigeneger [Golubovskii et al. 2006] is based on the solution of the heat balance equation for the cathode temperature, equations for particle fluxes and heat balance equation for the gas temperature.

5.4 Temperature measurements and modeling of the diffuse and spot modes in alow-pressure dc argon discharge 69
5.4.1 Experimental resultsIn figure 5.18 examples of the discharges in diffuse and spot mode, respectively, are represented. The heat current and voltage as well as the discharge current and lamp
time [s] time [s]
Figure 5.18: Discharges in (a) glow and (b) arc mode. Horizontal lines in the chart of the temperature profile indicate the positions of the coil center and boundaries of the emitter covered parts.
voltage are given on upper figures and the temperature profiles are shown below. Horizontal lines in the chart of the temperature profile indicate the positions of the coil center and boundaries of the emitter covered parts.
The figure on the left corresponds to the discharge current of 6 mA. At this current the lamp with cold cathode is in the glow mode. At small heat currents the temperature of the coil is low and the secondary electrons can only be emitted by high energy ion bombardment. With increasing heat current the temperature of the coil increases and the thermionic emission becomes dominant. The lamp voltage drops from almost 200 V to less than 50 V.
The figure on the right corresponds to the discharge current of 14 mA. The lamp operates in the arc mode with a hot spot. The temperature of the hot spot, in the

70 Chapter 5. Investigation of tungsten erosion processes in fluorescent lamps
absence of external heating, is about 1100 °C. The hot spot occurs between the upper emitter free and the emitter covered part of the coil (indicated by the horizontal line). By further increasing of the overall coil temperature due to increasing heat current the hot spot disappears and the discharge attaches the whole coil. The main problem of this measurement technique is that the discharge can attach inside the coil or at the backside, which is not observed by the camera system. Therefore, under these special conditions the hot spot temperature can be higher than measured.
5.4.2 Thermal model of the electrode
To describe the coiled-coil electrodes a model of the wire has been considered which assumed that the coil is equivalent to a cylinder of length L = 14.2 cm and diameter D = 113 ^m, corresponding to the thick uncoiled wire. This is justified by the large resistance and weak heating of the thin wire. The temperature T of the cathode body can be obtained from the one-dimensional heat balance equation
dT d dT Cppdi- dXKdX W,gain Wloss, (5.2)
where the specific heat cp, the mass density p, and the thermal conductivity k are the properties of the cathode material, correspondingly [ITER 2006]. Wgain is the heat power per unit of cathode volume and W1oss is the power of heat losses per volume.
The specific heat power Wgain is connected with the Joule heating, due to the heat current through the electrode, and with the discharge heating, due to the ion bombardment in the presence of a discharge. Taking into consideration an inhomogeneous heat generation along the electrode, the heat power per volume has the following representation
U2 4Wgain (x) = ^(T)L2 + ji(x)Uc/ (x) D , (5.3)
where Uh is the heat voltage impressed across the electrode, A(T) is the specific resistance, ji(x) is the ion current density at the electrode surface and Uc/(x) is the cathode fall.
The specific power of heat losses W1oss is connected with the thermionic emission of electrons, radiation from the cathode surface and heat exchange of the electrode with the ambient gas
W1oss D 1 jem(T) 0(T) +2kT
e+ e(T )a[T4 T4] + h(T)(T - T,) (5.4)
The coefficient h(T) for heat exchange with the ambient gas was found equal to 30-50Wm-2K-1, the work function 0 = 4.54eV for tungsten and 4>(T) = 1.6 + 6 ■ 10-4T for oxide. Further coefficients are the emissivity of the cathode material e(T) and the Stefan-Boltzmann’s constant a. The cathode fall Uc/, the

5.4 Temperature measurements and modeling of the diffuse and spot modes in alow-pressure dc argon discharge 71
electron, ion and emission current densities je, ji and jem were written in the form
je
ji
jem
73 + jem
1+7 ’j — jem
1 + 7
(5 5)
(5.6)
(5.7)
The empirical relation ji = jea>w{Ucf — Ui) with the Waymouth’s constant aw [Way- mouth 1959] was used to relate the ion to the electron current density. The total current density j = je + >, was normalized on the discharge current i according to i = 7tDL J* j(x)dx. The complete modeling is described more detailed in [Gol- ubovskii et al. 2006] which includes among the solution of the heat balance equation for the cathode temperature also the solutions of the equations for particle fluxes and heat balance equation for the gas temperature. Here only a short summary based on [Ehlbeck et al. 2006] is given.
In figures 5.19 and 5.20 the comparisons of the measured and calculated temperature distributions along the uncoated and coated coils with and without discharge are represented under various heat and discharge conditions. A coating of coils with oxide at equal heat powers leads to reduction of coil temperatures and broadening of the profiles. This is caused mainly by increased heat losses due to electron emission. Near the ends of the coils specific maxima can be observed (fig. 5.19(b)). These maxima are conditioned by the presence of uncoated parts and smaller heat losses there.
(b) coated coil without discharge(a) uncoated coil without discharge
Figure 5.19: Measured and calculated temperature profiles of uncoated and coated coils without discharge at heat currents + = 1.48 A (1), 1.16 A (2), and 0.85 A (3).
Figure 5.20 illustrates the impact of the discharge on the temperature profile. The additional heating by the discharge current results in a local increase of temperature, generally in the central part of the coil. In figure 5.20(b), the formation of a spot with

72 Chapter 5. Investigation of tungsten erosion processes in fluorescent lamps
1.1
1.0
p
o.g
0.8
0.0 0.2 0.4 X/L 0.6 0.8 1.0
(a) uncoated coil with discliarge (b) coated coil with discharge
Figure 5.20: Measured and calculated temperature profiles of uncoated and coated coils with discharge. Heat currents for the uncoated coil (a): ih = 1.5 A (1), 1.18 A (2), 0.86 A (3),and0.46 A (4). Discliarge and heat currents for the coated coil (b): i = 10 and 40 mA, ih = 1.15 A (1), i = 40 mA, ih = 0.85 A (2), and i = 10 mA, ^ = 0.85 A (3).
decreasing heat power is shown. At heat power larger than that corresponding to curve 1, the presence of a discharge current up to 60 mA does not influence the cathode temperature. The cathode is heated up to such large temperatures that the emission current density exceeds that of the discharge. In this situation a double sheath is formed to trap an excessive electron emission current from the cathode. At intermediate heat power (ih = 1.15 A, curves 1 in figure 5.20(b)) a weak dependence of the temperature on the discharge current is measured. At small heat power (ih = 0.85 A, curves 2 and 3 in figure 5.20(b)) an increase of the current leads to a spot formation. A local disturbance of the temperature results in a higher electron emission from this region. Emitted electrons cause ionization in the cathode sheath. The generated ions return to the cathode, heat it and cause secondary emission. The ion and electron current densities correlate with the emission profile. Thus, if the temperature locally increases, the emission current increases, the ion current increases in the vicinity of higher emission and produces additional heating and further increase of the temperature.
Studies performed for a smaller coil (L = 10.6 cm, D = 45 pm) demonstrate similar dependencies.
The spot mode obtained in the present investigation in the framework of a simple one-dimensional analysis reflects, in general, the main features of spot formation which is similar in high pressure arcs [Dabringhausen 2004; Dabringhausen et al. 2005; Lichtenberg et al. 2005]. Good agreement between the measured and computed cathode temperatures is obtained that contributes to a better understanding of the role of discharge and emission currents in diffuse and spot operation modes of uncoated and coated electrodes. To obtain accurately the electron and ion profiles along the cathode a more detailed study on the basis of the two-dimensional sheath description, and heat and current transport through the oxide coating is required.

Chapter 6
Conclusion
The important lamp manufacturers are interested to enhance the lifetime of lamps, which is mainly limited by the electrode durability. Therefore, the investigation of tungsten erosion during instant start is necessary and was the main goal of this work.
The following results have been achieved:
(i) First investigations were performed using a hollow cathode lamp with a pure tungsten cathode as variable source of sputtered tungsten atoms. In the hollow cathode lamp the impact of collisional effects has been investigated, the saturation parameter has been determined and a Rayleigh calibration has been performed. Thus, the absolute tungsten density could be determined which nonlinearly increases with the discharge current and reaches 15 ■ 109 cm-3 at the chosen discharge parameters. Furthermore, the density profile of sputtered tungsten atoms in the hollow cathode has been determined by an approximative ion energy distribution and a diffusion model.
(ii) Fundamental studies of the tungsten erosion were performed in a low-pressure dc argon discharge in the glow phase. Two different erosion processes were observed: at a virginal electrode tungsten is mainly sputtered at the bare tungsten ends, whereas at an electrode, that was already operated as a hot cathode, tungsten is sputtered nearly uniformly along the coil. One millimeter in front of the coil the population density is about nW (5D0) = 5 ■ 109 cm-3, in case of the uniformly eroding coil.
(iii) For the first time the tungsten erosion during instant start of commercial fluorescent lamps was experimentally investigated in this work. The erosion process could be related to sputtering. A reconstruction of the temporal evolution of the absolute tungsten population density of the ground state during the glow mode was presented. The sputtered tungsten density increases immediately with the ignition, reaches a maximum where the discharge contracts at the end of the glow mode, and decreases some milliseconds before the glow-to-arc transition
73

74 Chapter 6. Conclusion
takes place. The maximum tungsten density was observed within a region of a few hundred micrometers only located at the discharge attachment point.
The main result achieved in this work is that during the whole glow mode tungsten is sputtered. Therefore, the lifetime of instant started fluorescent lamps can be enhanced by reducing the duration of the glow mode.
Additionally, the need for the application of different types of diagnostics for the observation of lamp ignition was shown due to different results of LIF, AAS and OES: The observation of excited tungsten atoms by OES shows the maximum emission signal at the glow-to-arc transition whereas by LIF and AAS measurements of tungsten atoms in the ground state the maximum density is found during the whole glow mode. This can be explained by the fact that the intensity of the spontaneous emitted light is related not only to the density but also to the degree of excitation.
(iv) The temperature profiles along coiled-coil electrodes of dc low-pressure lamps operating in diffuse and spot mode have been studied experimentally and theoretically. A one-dimensional model of the electrode heating by external and discharge currents has been developed by Golubovskii, Porokhova and Sige- neger [Golubovskii et al. 2006] and its results have been compared with the measured ones for a broad spectrum of conditions: large and small coils, uncoated and coated with emitter mix, various preheating parameters and discharge currents. All these cases were described within a unique common set of equations and coefficients. The satisfactory agreement of the calculated results with the measured ones evidences the universality of the model.
The description of the spot mode in the framework of the present onedimensional analysis reflects, in general, the main features of spot formation. By superimposing an initial temperature disturbance the development of the spot connected with increased local heating and thermionic emission could theoretically be reproduced.
(v) Last but not least, a new contribution on LIF diagnostic was presented. Up to now, the LIF diagnostic supposes a spatially homogeneous laser profile. However, the laser profile of typical laser systems are at best Gauss-shaped. For a spatially homogeneous laser profile the transition to the excited state can be saturated over the whole laser cross sectional area. But in case of an inhomogeneous laser profile, saturation cannot be reached in the edges of the cross sectional area. For the first time a correction factor for a Gauss-shaped profile was evaluated that considers the power broadening.
(vi) Results that were not achieved by my own investigations but by measurements of our industrial partner Osram, namely Dr. Gerd Lieder, that support the results of (ii) are as follows [Lieder 2005]:

75
In addition to the prehistory of lamp lifetime, the homogeneity of the emitter coating affects the durability of the electrode. In dependence on the coating homogeneity, there exists two clearly separated groups of fluorescent lamps. The observed instant started fluorescent lamps with homogeneously covered emitter reaches a lifetime of 870 ± 70 maximum switching cycles, whereas identically constructed fluorescent lamps with inhomogeneously covered emitter reaches a nearly ten times larger lifetime of 7700 ± 420 maximum switching cycles. Detailed investigations of the underlying erosion processes have shown, that the early failure lamps mainly sputter tungsten at the bare tungsten ends of the coil and the long runners sputter less tungsten from the whole coil.
After a preselection of lamps according to the quality of the emitter coating a recall ratio of early failure lamps better than 80 % could be reached.
Further work will be necessary to determine particle fluxes from the electrode to the plasma instead of particle densities. Probably, particle fluxes seem to be more significant for the description of the erosion process. Velocities of tungsten atoms can be determined from the doppler profile by laser-induced fluorescence measurements with lasers, whose spectral width is much less than the line width of the transition. Furthermore, a complex modeling of the electrode region is necessary.
The presented observations demonstrate that there remains a considerable lack of understanding of the physics of the near-cathode region. Excitation of buffer gas resonance levels, followed by transport of the resonance radiation and eventual Penning ionization of Hg by the excited Ar, together with spatial redistribution of Hg due to the intense localized ionization near the cathode hot spot, are processes that may have a large influence in this region, requiring further experimental and numerical investigation.

76 Chapter 6. Conclusion

Appendix A
A.1 Spectral and temporal line profiles for correction of the rate equations
The rate equations (3.1) - (3.3) are only valid for a spectral width of the laser that is much broader than the line width of the transition. The spectral laser line width of the used dye laser is AAL = 0,8 pm resp. AvL = 2, 9 GHz (FWHM) [Sirah GmbH 1998] and the doppler width, which corresponds to the spectral width of the atomic transition1, is Av12 = 2.5 GHz (FWHM) for tungsten atoms at T % 2000 K. Thus, the rate equations become
dNi(t)dt
dN2(t)dt
d^(t)dt
-Bi2Ni(t) / g(vL - Vi2)pv(v,t)dv
+ ^ A21 + B21N2(t) J 9(uL — v12 )Pv (V t)dv
+Bi2Ni(tW g(vL — Vi2)Pv(v,t)dv
— ( A23 + A21 + B2lN2(t) g(vL — V12 )pv (v, t)dv
A23N2(t),
where g(vL — v12) is the line shape function of the atomic transition normalized as f g(vL — v12)dv = 1. The line shape function is the convolution of the laser profile and the absorption (doppler) profile with the line width Av2 = AvL + Av22. To determine the line shape function experimentally the dye laser was tuned around the center wavelength of the transition and the fluorescence intensity was detected2. This procedure was regularly repeated. In figure A.1 a measured line shape function is presented. The measured line width of Av = 12 GHz is broader than the theoretical line width of
1the natural line width can be neglected2This measurement was performed in the hollow cathode lamp but is also conveyable on fluorescent
lamps.
77
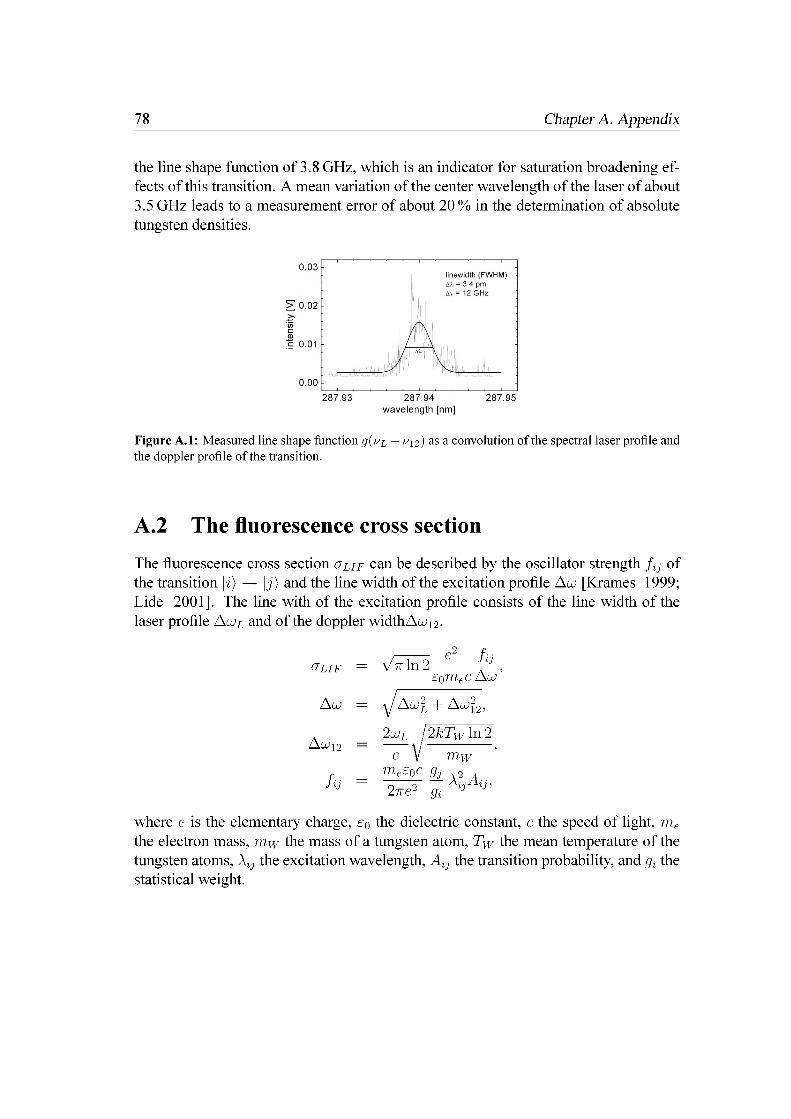
78 Chapter A. Appendix
the line shape function of 3.8 GHz, which is an indicator for saturation broadening effects of this transition. A mean variation of the center wavelength of the laser of about3.5 GHz leads to a measurement error of about 20 % in the determination of absolute tungsten densities.
0.03 -linewidth (FWHM) AX = 3.4 pm Av = 12 GHz
> 0.02 -
.5 0.01 -
0.00 -
287.93 287.94wavelength [nm]
287.95
Figure A.l: Measured line shape function g(uL — v 12) as a convolution of the spectral laser profile and the doppler profile of the transition.
A.2 The fluorescence cross sectionThe fluorescence cross section (jLif can be described by the oscillator strength of the transition | z ) —> | j) and the line width of the excitation profile Aw [Krames 1999; Tide 2001]. The line with of the excitation profile consists of the line width of the laser profile AwL and of the doppler width Awi2.
O'LlF
Aw
Awi2
fij
where e is the elementary charge, e0 the dielectric constant, c the speed of light, me the electron mass, mw the mass of a tungsten atom, Tw the mean temperature of the tungsten atoms, the excitation wavelength, AtJ the transition probability, and y, the statistical weight.
SoTTleC ACJ
= \J Aw£ + Aw^2,
2ujl 12kTw In 2c V
me£0C 9j \2 a "2^ ^ Xi^

Bibliography
Abeywickrama, M. G. (1997). Fluorescent lamps. In J. Coaton and A. Marsden (Eds.), Lamps and Lighting (4th ed.)., Chapter 10, pp. 194-215. London: Arnold.
Amorim, J., G. Baravian, and J. Jolly (2000). Laser-Induced Resonance Fluorescence as a Diagnostic Technique in Non-Thermal Equilibrium Plasmas. J. Phys. D: Appl. Phys. 33, R51-R65.
Bessenrodt-Weberpals, M., A. Brockhaus, P Jauernik, H. Kempkens, C. Nieswand, and J. Uhlenbusch (1986). Diagnostic of a Steady-State Low-Pressure Hollow Cathode Arc in Argon. IEEE Transaction On Plasma Science PS-14(4), 492-497.
Bhattacharya, A. K. (1989a, June). Measurement of barium ion density in the vicinity of fluorescent lamp electrodes. J. Appl. Phys. 65(12), 4603-4607.
Bhattacharya, A. K. (1989b, June). Measurement of barium loss from a fluorescent lamp electrode by laser-induced fluorescence. J. Appl. Phys. 65(12), 4595-4602.
BMBF Publik (2000, May). Plasmatechnik. Bundesministerium fur Bildung und Forschung, Bonn, Germany.
Bogaerts, A. and R. Gijbels (2002, Dec.). Hybrid modeling network for a helium- argon-copper hollow cathode discharge used for laser applications. J. Appl. Phys. 92(11), 6408-6422.
Bogaerts, A., M. van Straaten, and R. Gijbels (1995). Description of the Thermaliza- tion Process of the Sputtered Atoms in a Glow-Discharge using a 3-Dimensional Monte-Carlo Method. J. Appl. Phys. 77, 1868-1874.
Bogen, P. (1983, Aug.). Application of Fluorescence Spectroscopy to the Diagnostics of Plasma Close to the Walls. In W. Botticher, H. Wenk, and E. Schulz-Gulde (Eds.), Proc. XVI. International Conference on Phenomena in Ionized Gases, Dusseldorf, Germany, pp. 164-173.
Born, M., P Lilie, and J. Uhlenbusch (2000). Measurement of tungsten densities by means of laser-induced fluorescence during ignition of a pulsed low-pressure argon discharge. J. Phys. D: Appl. Phys. 33, 1576-1580.
79

80 Bibliography
Bridge, N. J. and A. D. Buckingham (1966). The polarization of laser light scattered by gases. Proc. Roy. Soc. A 295, 334-349.
Brown, S. C. (1959). Basic Data of Plasma Physics. Cambridge, USA: The M.I.T. Press.
Chance, K. V. and R. J. D. Spurr (1997). Ring effect studies: Rayleigh scattering, including molecular parameters for rotational Raman scattering, and the Fraunhofer spectrum. Applied Optics 36(21), 5224-5230.
Chittka, U., P. Postma, and W. Schlager (1997). Electrodes for gas discharge lamps. Applied Surface Science 111, 302-310.
Cornelissen, H. J. and A. L. J. Burgmans (1982). Electron density measurements in a low pressure discharge using doppler-free two-photon spectroscopy. Opt. Co- mun. 41, 187.
Dabringhausen, L. (2004). Charakterisierung von Elektroden fur Hochdruck- Plasmalampen durch Pyrometrie und Simulation (1st ed.). Berlin: TENEA Verlag. Zugl.: Ruhr-Universitat Bochum, Diss., 2004.
Dabringhausen, L., O. Langenscheidt, S. Lichtenberg, M. Redwitz, and J. Mentel (2005, Sep.). Different modes of arc attachment at HID cathodes: simulation and comparison with measurements. J. Phys. D: Appl. Phys. 38(17), 3128-3142.
Daily, J. W. (1977, March). Saturation effects in laser induced fluorescence spectroscopy. Applied Optics 16(3), 568-571.
Daily, J. W. (1978). Saturation of Fluorescence in Flames with a Gaussian Laser Beam. Applied Optics 17, 225-229.
Davis, W. D. and T. A. Vanderslice (1963). Ion Energies at the Cathode of a Glow Discharge. Phys. Rev. 131(1), 219-228.
Demtroder, W. (2000). Laserspektroskopie: Grundlagen und Techniken (4th ed.). Berlin, Heidelberg, New York: Springer Verlag.
Den Hartog, E. A., D. W. Duquette, and J. E. Lawler (1987, Jan.). Absolute transition probabilities in Ta I and W I. J. Opt. Soc. Am. B 4(1), 48-63.
deVos, J. C. (1954). A new determination of the emissivity of tungsten ribbon. Phys- ica 10, 690-714.
Drawin, H. W. and F. Emrad (1978). Ground-State Populations of Atomic Hydrogen and Hydrogen-Like Ions in Nonthermal Plasmas and Collisional-Radiative Recombination and Ionization Coefficients. Physica 94C, 134.

Bibliography 81
Druyvesteyn, M. J. and F. M. Penning (1940). The Mechanism of Electrical Discharges in Gases of Low Pressure. Rev. Mod. Phys. 12, 87.
Dullni, E. (1984, Juli). Fluoreszenzspektroskopische Bestimmung der Flufidichte von zerstaubtem Titan bei reinen und oxidierten Oberflachen. Diss., Ruhr-Universitat Bochum, Bochum, Germany.
Eckhardt, K. (1967). Entwicklungstendenzen bei Leuchtstofflampen. Lichttech-nik 19(12), 146A-151A.
Ehlbeck, J., Y B. Golubovskii, S. Hadrath, I. A. Porokhova, and F. Sigeneger (2006, July). Diffuse and spot operation modes of low-pressure dc-lamps with coiled electrodes. In XVIII. Proc. of the European Conference on Atomic and Molecular Physics of Ionised Gases (ESCAMPIG), Bari, Italy.
Garner, R. (1998, Aug.). A Temperature and Emissivity Diagnostic for Fluorescent Lamp Electrodes. In Proc. 8th International Symposium on the Science and Technology of Light Sources, Greifswald, Germany, pp. 374-375.
Garner, R. (2005). Central Research & Services Laboratory, OSRAM Sylvania, Beverly, USA. private communication.
Garner, R. (2006, June). Time dependent modeling of the electrode region of a fluorescent lamp discharge. In 33rdIEEE International Conference on Plasma Science, Traverse City, MI, USA, pp. Poster 2P45.
Golubovskii, Y B., S. Hadrath, H. Lange, I. A. Porokhova, F. Sigeneger, and J. Ehlbeck (2006). Investigations of the diffuse and spot modes in a low-pressure dc argon discharge with coiled-coil cathodes. J. Phys. D: Appl. Phys.. submitted.
Gupta, D. K. and G. Zissis (2001). Effect of Electrode Geometry on Thermionic Emission for the Starting of Fluorescent Lamps. In Proc. 9th International Symposia on the Science and Technology of Light Sources, Ithaca, NY, USA, pp. 217-218. P 070.
Hadrath, S., R. Brandenburg, J. Ehlbeck, and G. Lieder (2005, July). Spatially and Temporally Resolved Determination of Absolute Tungsten Densities in Fluorescent Lamps during Instant Start by Laser-induced Fluorescence. In Proc. XXVII. International Conference on Phenomena in Ionized Gases (ICPIG), Eindhoven, Nether- land.
Hadrath, S., J. Ehlbeck, G. Lieder, and F. Sigeneger (2004, July). Investigation of Tungsten Erosion in Fluorescent Lamps during Cold Start by Laser-induced Fluorescence. In G. Zissis (Ed.), Proc. 10th International Symposium on the Science and Technology of Light Sources, Toulouse, France, pp. 627-628. Institute of Physics.

82 Bibliography
Hadrath, S., J. Ehlbeck, G. Lieder, and F. Sigeneger (2005, Sep.). Determination of absolute population densities of eroded tungsten in hollow cathode lamps and fluorescent lamps by laser-induced fluorescence. J. Phys. D: Appl. Phys. 38(17), 3285-3295.
Hamamoto, M., M. Mitsuo, K. Muraoka, and M. Akazaki (1981, Sep.). Absolute Density Measurement of Metal Atoms by Laser Resonance Scattering with the Aid of Rayleigh Scattering. Japanese Journal of Applied Physics 20(9), 1709-1713.
Hannaford, P. (1983). Spectroscopy with sputtered atoms. Contemp. Phys. 24(3), 251-270.
Haverlag, M., A. Kraus, J. Sormani, J. Heuvelmans, A. Geven, L. Kaldenhoven, and G. Heijne (2002). High-frequency cold ignition of fluorescent lamps. J. Phys. D: Appl. Phys. 35, 1695-1701.
Hawksbee, F. (1705). Phil. Trans. 308, 309.
Hayes, E., B. Juttner, G. Lieder, W. Neumann, H. Pursch, and L. Weixelbaum (1989). Measurement of the Behavior of Neutral Atom Density in a Diffuse Vacuum Arc by Laser-Induced Fluorescence (LIF). IEEE Transaction On Plasma Science 17(5),666-671.
Herrmann, G. and H. Wagener (1951). The Oxide Coated Cathode, Volume 2. Chap- mann and Hall.
Hilscher, A., R. Garner, and G. Lieder (2004, July). Improvement of Fluorescent Lamp Cold Start. In G. Zissis (Ed.), Proc. 10th International Symposium on the Science and Technology of Light Sources, Toulouse, France, pp. 147-148. Institute of Physics.
Hockel, J. F. (2006, Jan.). Untersuchungen zum Kaltstartverhalten von Leuchtstofflampen. Diplomarbeit, Fachhochschule Munchen, Munich, Germany.
Hummernbrum, F. (1993, Oct.). Plasmadiagnostik an einem mikrowellenangeregten Prozefiplasma zur Erzeugung amorpher C:H-Schichten (1st ed.). Wissenschaftliche Schriftenreihe Physik; Bd. 3. Berlin, Germany: Verlag Koster. Zugl.: Universitat Dusseldorf, Diss., 1993.
ITER (2006). Material handbook. http://aries.ucsd.edu/LIB/PROPS/.
Jauernik, P, H. Kempkens, and J. Uhlenbusch (1987). Simultaneous Detection of Rayleigh and Thomson Scattering Signals from a Hollow Cathode Arc Plasma. Plasma Physics and Controlled Fusion 29(11), 1615-1630.
Kapzow, N. A. (1955). Elektrische Vorgange in Gasen und Vakuum (2nd ed.). Berlin, Germany: VEB Deutscher Verlag der Wissenschaften.

Bibliography 83
Kettlitz, M., M. Sieg, H. Schneidenbach, and H. Hess (2005). Lowering of the cathode fall voltage by laser exposure of the cathode in a high-pressure mercury discharge. J. Phys. D: Appl. Phys. 38(17), 3175-3181.
Kling, R., J. O. Ekberg, and M. Kock (2000, Nov.). WII branching ratios and oscillator strengths. Journal of Quantitative Spectroscopy & Radiative Transfer 67(3), 227238.
Kling, R. and M. Kock (1999, May). W I branching ratios and oscillator strengths. Journal of Quantitative Spectroscopy & Radiative Transfer 62(2), 129-140.
Krames, B. (1999). Raumliche Konzentrationsverteilungen vonN2-Triplett-Zustanden im elektrodennahen Plasma einer RF-Niederdruckentladung. Diss., Technische Universitat Chemnitz, Chemnitz, Germany.
Kuz’menko, M. E., O. V. Mitichkin, A. I. Bezlepkin, S. V. Kostyuchenko, N. N. Kudryavtsev, and V. Y Pecherkin (2000). Experimental investigation of a low- pressure amalgam lamp at an increased power of discharge. High Tempera-tue 38(3), 487-488.
Lankhorst, M. H. R., W. Keur, and H. A. M. van Hal (2000). Amalgams for fluorescent lamps, Part II: The systems Bi-Pb-Hg and Bi-Pb-Au-Hg. J. Alloys Comp. 309(1-2),188-196.
Lankhorst, M. H. R. and U. Niemann (2000). Amalgams for fluorescent lamps, Part I: Thermodynamic design rules and limitations. J. Alloys Comp. 308(1-2), 280-289.
Latyev, L. N., V Y Chekhovskoi, and E. N. Shestakov (1970). Monochromatic emis- sivity of tungsten in the temperature range 1200 - 2600 K and in the wavelength range 0.4 - 4 pm. High Temperatures - High Pressures 2, 175-181.
Laun, D. D. and C. H. Corliss (1968, Dec.). The First Spectrum of Tungsten (W I). Journal of Research of the National Bureau of Standards 72A (6), 609-755.
Lichtenberg, S., L. Dabringhausen, O. Langenscheidt, and J. Mentel (2005, Sep.). The plasma boundary layer of HID-cathodes: modelling and numerical results. J. Phys. D: Appl. Phys. 38(17), 3112-3127.
Lide, D. R. (2001). CRC-Handbook of Chemistry and Physics (82nd (2001 - 2002) ed.). Boca Raton, Florida 33431: CRC Press LLC. pages 10-164-10-169.
Lieder, G. (1989). Laserinduzierte Fluoreszenz zur Bestimmung der absoluten Dichte und der Anregungstemperatur von atomarem Eisendampf. Diss., Ernst-Moritz- Arndt-Universitat Greifswald, Greifswald, Germany.
Lieder, G. (2005). Research Light Sources, Osram GmbH, Munich, Germany. private communication.

84 Bibliography
Lieder, G. and R. Garner (2005). Research Light Sources, Osram GmbH, Munich, Germany; Central Research & Services Laboratory, OSRAM Sylvania, Beverly, USA. private communication.
Lins, G. (1985, Dec.). Measurement of the Neutral Copper Vapor Density Around Current Zero of a 500-A Vacuum Arc Using Laser-Induced Fluorescence. IEEE Transaction On Plasma Science PS-13(6), 577-581.
Lister, G. G., J. E. Lawler, W. P Lapatovich, and V. A. Godyak (2004, April). The Physics of discharge lamps. Rev. Mod. Phys. 76(2), 564-565.
Lochte-Holtgreven, W. (1968). Plasma Diagnostics. Amsterdam, Niederlande: North Holland Publishing Co.
Loeb, L. B. (1961). Basic processes of gaseous electronics (2nd ed.). Berkeley, Calif., USA: University of California Press.
Matsuo, K., T. Atagi, and Y. Ikai (1998, Aug.). Mercury consumption reduction in fluorescent lamps. In Proc. 8th International Symposium on the Science and Technology of Light Sources, Greifswald, Germany, pp. 144-145.
Meyer, C. and H. Nienhuis (1989). Discharge Lamps. Kluwer Academic Pub.
Michael, J. D. (2001). Measurement of Barium Evaporation Rates for F-Lamp Cathodes using Laser Induced Fluorescence. In Proc. 9th International Symposia on the Science and Technology of Light Sources, Ithaca, NY, USA, pp. 219-220. P 071.
Misono, K. (2001). Effect of Auxiliary Heating on Barium Loss from Fluorescent Lamp Electrode under HF Operation. In Proc. 9th International Symposia on the Science and Technology of Light Sources, Ithaca, NY, USA, pp. 223-224. P 073.
Misono, K., M. Kando, and J. Verdeyen (2001). Effect of Operating Frequency of Fluorescent Lamp on Barium Sputtering from Electrode. J. Light & Vis. Env. 25(2), 1-9.
Moskowitz, P E. (1992). Fluorescent lamp electrode diagnostics by laser-induced fluorescence. In Proc. VI. International Symposium on the Science & Technology of Light Sources, Budapest, Hungary.
Niemi, K. (2003). Nachweis leichter Atome in reaktiven Plasmen mittels Zweiphoto- nen laserinduzierter Fluoreszenzspektroskopie unter besonderer Berucksichtigung der Absolutkalibrierung (1st ed.). Gottingen, Germany: Cuvillier Verlag. Zugl.: Universitat Duisburg-Essen, Diss., 2003.
NIST (2004). National Institute of Standards and Technology, NIST Atomic Spectra Database. http://physics.nist.gov/cgi-bin/AtData/main_asd.
Bibliography 85
Nottingham, W. B. (1956). Thermionic emission. In S. Flugge (Ed.), Encyclopedia of Physics, Volume 21. Berlin, Germany: Springer Verlag.
Osram (2005). Osram GmbH, Munich, Germany. http://www.osram.com.
Partridge, Jr., W. P., N. M. Laurendeau, C. C. Johnson, and R. N. Steppel (1994). Performance of Pyrromethene 580 and 597 in a commercial Nd:YAG-pumped dye- laser system. Optics Letters 19(20), 1630-1632.
Proud, J. M. (1983, April). Compact Fluorescent Lamps. In Proc. 3rd International Symposium on the Science and Technology of Light Sources, Toulouse, France, pp. 45.
Raizer, Y P. (1997). Gas Discharge Physics. Springer. Reprint.
Reckers, W., Y Gu, E. W. Rothe, and H. Voges (1997). Rayleigh Scattering of Excimer Laser Light from Some Simple Molecules at 193 nm and 248 nm: The Effect of Polarization upon Imaging Diagnostics. Applied Spectroscopy 51(7), 1012-1016.
Rodrigo, A. B. and R. M. Measures (1973). An Experimental Study of the Diagnostic Potential of Laser Selective Excitation Spectroscopy for a Potassium Plasma. IEEE J. of Quantum Electron. QE-9, 972-978.
Ropcke, J., P B. Davies, M. Kaning, and B. P Lavrov (2001). Diagnostics of nonequilibrium molecular plasmas using emission and absorption spectroscopy. In R. Hippler, S. Pfau, M. Schmidt, and K. Schoenbach (Eds.), Low Temperature Plasma Physics (1st ed.)., Chapter 7, pp. 173-176. WILEY-VCH Verlag Berlin GmbH, Berlin, Germany.
Rousseau, A., E. Teboul, M. J. van de Sande, and J. J. A. M. van der Mullen (2002). Spatially resolved gas temperature measurements by Rayleigh scattering in a microwave discharge. Plasma Sources Sci. Technol. 11, 47-52.
Rozenboom, J. (1983, April). Electronic Ballast for Gas Discharge Lamps. In Proc. 3rd International Symposium on the Science and Technology of Light Sources, Toulouse, France, pp. 80.
Rutscher, A. and H. Deutsch (1983). Wissensspeicher Plamaphysik. Leipzig, Germany: VEB Fachbuchverlag.
Salmon, J. T. and N. M. Laurendeau (1985, Jan.). Calibration of laser-saturated fluorescence measurements using Rayleigh scattering. Applied Optics 24(1), 65-73.
Samir, A. H. A., G. Yamashita, Y Yamagata, K. Uchino, T. Ueda, and Y Manabe (2005, Sep.). Temporal and spatial distribution of Ba atoms in a fluorescent lamp measured by laser-induced fluorescence technique. In Proc. XII. International Symposium on Laser-Aided Plasma Diagnostics (LAPD-12), Snowbird, Utah, USA.

86 Bibliography
Schnabel, R. (1999). Zeitaufgeloste, nichtlineare laserinduzierte Fluoreszenz zurMes- sung von Lebensdauern, Ubergangswahrscheinlichkeiten und Besetzungsdichten (1st ed.). Berlin: Wissenschaft und Technik Verl. Zugl.: Universitat Hannover, Diss., 1999.
Schnabel, R. and M. Kock (2000a, May). f-value measurement of the Be I resonance line using a nonlinear time-resolved laser-induced-fluorescence technique. Phys.Rev. A 61(062506).
Schnabel, R. and M. Kock (2000b, Dec.). Time-resolved nonlinear laser-induced fluorescence technique for a combined lifetime and branching-fraction measurement.Phys. Rev. A 63(012519).
Siemens (2005). Annual report 2005. Annual report, Siemens AG, Wittelsbacherplatz 2, 80333 Munich, Germany.
Sirah GmbH (1998). PrecisionScan Service Manual. An der Feuerwache 10, 41564 Kaarst, Germany: Sirah Laser- und Plasmatechnik GmbH. http://www. sirah.com.
Soules, T. F., J. H. Ingold, A. K. Bhattacharya, and R. H. Springer (1989). Thermal Model of the Fluorescent Lamp Electrode. J. of the IES18, 81-92.
Steinbrink, J. (1997, April). Spektroskopische Untersuchungen von zerstaubtem Wolfram in einer linearen Plasmaanalge. Diplomarbeit, Humboldt-Universitat zu Berlin, Max-Planck-Institut fur Plasmaphysik, Berlin, Germany.
Stull, D. (1972). In D. Gray (Ed.), American Institute of Physics Handbook (3rd ed.). New York, USA: McGraw Hill.
Thijssen, T. L. G. and A. J. H. van der Heijden (2001). Investigations on Ba Depletion from Electrodes in Low-Pressure Hg/Noble Gas Discharge Lamps using 133Ba Tracer Techniques, Fast Photog. and SEM. In Proc. 9th International Symposia on the Science and Technology of Light Sources, Ithaca, NY, USA, pp. 215.
van den Hoek, W. J., T. L. G. Thijssen, A. J. H. van der Heijden, B. Buijsse, and M. Haverlag (2002). Emitter depletion studies on electrodes of 50 Hz mercury/noble gas discharge lamps during ignition. J. Phys. D: Appl. Phys. 35, 1716-1726.
van der Weijer, P and R. M. M. Cremers (1985a). Determination of the effective radiative lifetime of the 6 3P1 atomic mercury level in low-pressure mercury discharges. J. Appl. Phys. 57(3), 672-677.
van der Weijer, P. and R. M. M. Cremers (1985b). The pulsed optogalvanic effect in a low-pressure mercury discharge. Opt. Commun. 53(2), 109-112.

Bibliography 87
van der Weijer, P and R. M. M. Cremers (1985c). The pulsed optogalvanic effect in a low-pressure mercury discharge induced by optical pumping on the 408 nm line. Opt. Commun. 54(5), 273-276.
Wamsley, R. C., K. Mitsuhashi, and J. E. Lawler (1993). Ionization balance in the negative glow of a Hg-Ar hot-cathode discharge. Phys. Rev. E 47(5), 3540-3546.
Wamsley, R. C., T. R. O’Brian, K. Mitsuhashi, and J. E. Lawler (1991). Laser-induced fluorescence on Hg+ in Hg-Ar discharges. Appl. Phys. Lett. 59, 2947.
Waumans, L., Y Dietzenbacher, P Stobbelaar, and C. van der Marel (2004, July). Surface analysis of fluorescent lamp electrodes in high-frequency cold igniting applications. In G. Zissis (Ed.), Proc. 10th International Symposium on the Science and Technology of Light Sources, Toulouse, France, pp. 209-210. Institute of Physics.
Waymouth, J. F. (1959). Pulse Technique for Probe Measurements in Gas Discharges. J. Appl. Phys. 30(9), 1404-1412.
Waymouth, J. F. (1971). Electric discharge lamps. Cambridge, USA: TheM.I.T. Press.
Wharmby, D. O. (1989, Sep.). Review of Electrodeless Discharges for Lighting. In Proc. 5 th International Symposium on the Science and Technology of Light Sources, York, England, pp. 141-150.
Williams, C. E. (1975, April). A New, Compact Fluorescent Tube. In Proc. Symposium on Incoherent Light Sources (LS1), Loughborough, UK, pp. 36.
Yuasa, K., K. Yamashina, and T. Skurai (1997). Ar Lowest Excited State Densities in Ar and Ar-Hg Hot Cathode Discharge. Jpn. J. Appl. Phys., Part 1 36(4A), 23402345.

88

Glossary
A0Aij
Bij
cCoClC2CPCdDDweEEl
ff (r)fijFFT (r)gg(v)Gh
iihI
II
RICHARDSON‘s constant [Am-2K-2]Einstein coefficient of spontaneous emission, transition probability [s-l]i < j: Einstein absorption coefficient [m3 J-1 s-1]i > j: Einstein coefficient of induced emission [m3 J-1 s-1 ]speed of light [ms-1]setup-specific constant [V s]transition-specific constanttransition-specific constant [cm-2]specific heat [J g-1 K-1]correction factordistance to the coil in axial direction [mm] diameter [m]diffusion coefficient of tungsten atoms [cm2 s-1]elementary charge [A s]energy [eV], [J]energy of the laser pulse [J]focal length [mm]radial GAUSS-shape functionoscillator strengthcross sectional area [m2]radial thermalization profilestatistical weightline shape functiongain of the photomultiplierPlanck’s constant [J s]heat exchange coefficient [W m-2 K-1 ]discharge current [mA]heat current [mA]intensity [mV]current [mA]intensity of the laser pulse [mV] total current density [Am-2]
89

je, ji, jem jWkkstKSt4 nK (9) LmnU1nenRayUwnw (5Do) NNpNo*Nl
PqQrR
SS, SSLIFSRayttLAtgAtzT
TaTeU^c/UhUivV
electron, ion and emission current density [Am-2] flux of sputtered tungsten atoms [cm-1 s-1]Boltzmann’s constant [JK-1] quenching rate coefficient quenching ratepolarization of the fluorescence radiation length [m] mass [g]total particle density [cm-3]ground state density [cm-3]electron density [cm-3]density of the reference gas (xenon) [cm-3]total atomic tungsten density [cm-3]atomic ground state tungsten density [cm-3]number of atomsnumber of fluorescence photonstotal number of emitted fluorescence photons due to one laser pulse number of laser photons pressure [bar] quenching factorquantum efficiency of the photomultiplierradial direction [m]branching ratioresistance [fi]radius [m]rate coefficient of ionization [cm3 s-1] saturation parameter LIF signal [V s]Rayleigh signal [V s] time [s]duration of the laser pulse [ns]time related to the glow-to-arc transition [ms]time after ignition [ms]transmissiontemperature [K], [°C]excitation temperature [K]electron temperature [K]voltage [V]cathode fall [V]heat voltage [V]ionization potential [V]mean velocity of eroded tungsten atoms [cm s-1] volume [m3]
90

W"gain W'losszZ
aoawY££o
K
AA(T)AionAlAAA AlvVl
VLIFAvAVLPPv (v)a
&LIFaRayT<PUAuAQ/4n
heat power per unit of volume [W m-3] power of heat losses per volume [W m-3] axial direction [m] resistance [fi] partition function
dipole polarizability [A3]
Waymouth‘s constant [V-1] secondary emission coefficient emission coefficient dielectric constant [As V-1 m-1]angle between the vectors of the electric field strength of the laserradiation and the Rayleigh scattering lightanisotropythermal conductivity [W m-1 K-1] wavelength [nm] specific resistance [fi m] ionization length [cm] wavelength of laser radiation [nm] spectral line width [nm] spectral line width of the laser [nm] frequency [Hz]frequency of laser radiation [Hz]frequency of fluorescence radiation [Hz]spectral line width [Hz]spectral line width of the laser [Hz]mass density [gm-3]spectral energy density [J m-3 Hz-1]full width at half maximum (FWHM) [m]Stefan-Boltzmann’s constant [Wm-2 K-4]fluorescence cross section [cm-2]Rayleigh cross section [cm-2] lifetime [ns], Tij = 1/Aj work function [eV] angular frequency [Hz], u = 2nv spectral line width [Hz], Au = 2nAv detection angle
AAS atom absorption spectroscopyAFEM automated fast emission monochromatorCCD charged coupled devicesCCG conventional control gear
91

DCL dc lampDSO digital storage oscilloscopeECG electronic control gearEEDF electron energy distribution functionFWHM full width at half maximumHCL hollow cathode lampKDP kalium-dihydrogen-phosphateLIF laser-induced fluorescenceLLG low-loss gearOES optical emission spectroscopyPD photo diodePMT photomultiplierSHG second harmonic generator
92

Danksagung
Ich mochte mich bei alien bedanken, die mir diese Arbeit ermoglicht haben.
Bei Prof. Dr. Jurgen Ropcke und Prof. Dr. Klaus Gunther1 mochte ich mich fur die Betreuung und Begutachtung dieser Arbeit bedanken.
Fur die hervorragenden Rahmenbedingungen am Institut fur Niedertemperatur- Plasmaphysik e. V. (INP) und die kritischen und forderlichen Ratschlage mochte ich mich bei Prof. Dr. Klaus-Dieter Weltmann bedanken.
Dr. Jorg Ehlbeck und Dr. Gerd Lieder1 2 mochte ich fur die interessante Themen- stellung, die ausgezeichnete Betreuung und Unterstutzung sowie die umfangreichen Diskussionen danken.
Prof. Dr. Yuri B. Golubovskii3, Dr. Irina A. Porokhova3 und Dr. Florian Sigeneger danke ich fur die Erstellung der in dieser Arbeit verwendeten theoretischen Modelle.
Dr. Richard Garner4 danke ich fur die ausfuhrlichen Emails als Antwort auf meine dafur umso kurzer formulierten Fragen zu den Plasmaprozessen in Leuchtstofflampen.
Mein Dank gilt Dr. Mario Maass und Alfred Scholz fur die tatkraftige Unterstutzung im Labor.
Kristian Rackow danke ich fur die Hilfe bei der Erstellung einzelner Programme zur Datenauswertung.
Bedanken mochte ich mich auch bei Dr. Ronny Brandenburg und Rene Bussiahn fur die Tipps und Hilfe bei der Durchsicht der Arbeit.
Nicht zu vergessen sind alle Mitarbeiter am INP Greifswald fur das uberaus freund- liche Betriebsklima und alle am Gelingen der Arbeit beteiligten Mitarbeiter der Osram GmbH, insbesondere der Entwicklungsabteilung in Augsburg. Danke.
Ich danke allen Freunden und Verwandten, die mich wahrend meines Studiums be- gleitet haben.
Meiner Verlobten Stefanie mochte ich fur Ihre Liebe und Ihr Verstandnis danken. Danke, dass es Dich gibt!
Allen voran gilt mein tiefempfundener Dank meinen Eltern, die mir das Studium er- moglicht haben und immer zu mir standen, fur ihr Engagement und ihre Liebe.
Die Mutter ist der Genius des Kindes.
Georg Wilhelm Friedrich Hegel (1770-1831)
1 Osram Berlin2 Osram Munchen3 St. Petersburg State University, Russia4OSRAM Sylvania, USA


Eidesstattliche Erklarung
Hiermit erklare ich, dass diese Arbeit bisher von mir weder an der Mathematisch- Naturwissenschaftlichen Fakultat der Ernst-Moritz-Arndt-Universitat Greifswald noch einer anderen wissenschaftlichen Einrichtung zum Zwecke der Promotion eingereicht wurde.
Ferner erklare ich, dass ich diese Arbeit selbstandig verfasst und keine anderen als die darin angegebenen Hilfsmittel benutzt habe.


Curriculum vitae
Personal informationName Stefan Hadrath
Date of birth 06. 05. 1978
Place of birth Anklam
Education09/84 - 07/91 Primary school
at Polytechnische Oberschule Friedland
09/91 - 06/96 Secondary schoolat Gymnasium Friedland Qualification: A levels
10/97 - 01/03 Study of physicsat Ernst-Moritz-Arndt-University of Greifswald, Qualification: diploma in physicsTitle: Dynamische Untersuchungen des Quecksilberdampf- druckes in Amalgamlampen (Dynamic investigations of the mercury vapor pressure in amalgam lamps)
02/03 - 06/06 PhD studyat Ernst-Moritz-Arndt-University of Greifswald,Institute for Low Temperature Plasma Physics (INP), including a bilateral industrial project of 5 month
since 01/04 Member of the International Max Planck Research School (IMPRS) for Bounded Plasmas at Ernst-Moritz-Arndt-University of Greifswald
Work experiencesince 02/03 Scientific assistant
at Ernst-Moritz-Arndt-University of Greifswald, Institute for Low Temperature Plasma Physics (INP)


List of publications and contributions
[1] S. Hadrath, J. Ehlbeck, G. Lieder, and F. Sigeneger. Determination of absolute population densities of eroded tungsten in hollow cathode lamps and fluorescent lamps by laser-induced fluorescence. J. Phys. D: Appl. Phys.,38(17):3285-3295, Sep. 2005.
[2] Yu. B. Golubovskii, S. Hadrath, H. Lange, I. A. Porokhova, F. Sigeneger, and J. Ehlbeck. Investigations of the diffuse and spot modes in a low-pressure dc argon discharge with coiled-coil cathodes. J. Phys. D: Appl. Phys., 2006. submitted.
[3] S. Hadrath, M. Beck, R. C. Garner, G. Lieder, and J. Ehlbeck. Determination of absolute Ba densities during dimming operation of fluorescent lamps by laser-induced fluorescence measurements. J. Phys. D: Appl. Phys.,40(1):163-167, 2007.
[4] S. Hadrath, R. C. Garner, G. Lieder, and J. Ehlbeck. Cathode fall measurements in fluorescent lamps at high frequencies. J. Phys. D: Appl. Phys., 2007. in preparation.
[5] S. Hadrath, J. Ehlbeck, G. Lieder, and F. Sigeneger. Investigation of Tungsten Erosion in Fluorescent Lamps during Cold Start by Laser-induced Fluorescence. In G. Zissis, editor, Proc. 10th International Symposium on the Science and Technology of Light Sources, pages 627-628, Toulouse, France, July 2004. Institute of Physics.
[6] S. Hadrath, R. Brandenburg, J. Ehlbeck, and G. Lieder. Spatially and Temporally Resolved Determination of Absolute Tungsten Densities in Fluorescent Lamps during Instant Start by Laser-induced Fluorescence. In Proc.XXWL International Conference on Phenomena in Ionized Gases (ICPIG),Eindhoven, Netherland, July 2005.
[7] J. Ehlbeck, Yu. B. Golubovskii, S. Hadrath, I. A. Porokhova, and F. Sigeneger. Diffuse and spot operation modes of low-pressure dc-lamps with coiled

electrodes. In XVIII. Proc. of the European Conference on Atomic and Molecular Physics of Ionised Gases (ESCAMPIG), Bari, Italy, July 2006.
[8] S. Hadrath. Kaltstartuntersuchungen an Leuchtstofflampen mittels laserin- duzierter Fluoreszenz. Oral presentation, Osram, Augsburg, March 2004.
[9] S. Hadrath. Investigation of Tungsten Erosion in Fluorescent Lamps during Cold Start by Laser-induced Fluorescence. Oral presentation, Osram, Augsburg, July 2004.
[10] S. Hadrath. Projektbericht - Kaltstartuntersuchungen an FL mittels LIF. Oral presentation, Osram, Augsburg, April 2005.
[11] S. Hadrath. Untersuchungen zum Bariumverlust wahrend des Dimmbetrie- bes von T5 Leuchtstofflampen mittels LIF. Oral presentation, Osram, Augsburg, April 2006.
[12] S. Hadrath, J. Ehlbeck, and G. Lieder. Untersuchungen zum Kaltstartver- halten von Leuchtstofflampen mittels laserinduzierter Fluoreszenz. In Ver- handlungen der DPG, page 103, March 2005. Bd. 3/2005.
[13] S. Hadrath. Investigation of Tungsten Erosion in Fluorescent Lamps during Cold Start by Laser-induced Fluorescence. Oral presentation, International Max Planck Research School of Bounded Plasmas (IMPRS), Greifswald, July2004.
[14] S. Hadrath. Investigation of Tungsten Erosion in Fluorescent Lamps during Cold Start by LIF. Poster, Evaluation of the IMPRS, Greifswald, Nov. 2004.
[15] S. Hadrath. Determination of Absolute Population Densities of Eroded Tungsten in Fluorescent Lamps by LIF. Oral presentation, IMPRS, Greifs- wald, May 2005.
[16] S. Hadrath. Barium Loss during Dimming Operation of Fluorescent Lamps by LIF. Oral presentation, IMPRS, Greifswald, April 2006.