Old dog, new tricks? The fitness of mirror trade analysis to ...
35
Carlotta Schuster 1 Junior Davis 2 Division for Africa, Least Developed Countries and Special Programmes, UNCTAD 1 [email protected] 2 [email protected] Old dog, new tricks? The fitness of mirror trade analysis to detect illicit financial outflows from Africa Background Paper Economic Development in Africa Report 2020 Tackling Illicit Financial Flows for Sustainable Development in Africa September 2020 United Nations Conference on Trade and Development
-
Upload
khangminh22 -
Category
Documents
-
view
4 -
download
0
Transcript of Old dog, new tricks? The fitness of mirror trade analysis to ...
Carlotta
Schuster1
Junior
Davis2
Division for
Africa, Least
Developed
Countries and
Special
Programmes,
UNCTAD
1 [email protected] 2 [email protected]
Old dog, new tricks?
The fitness of mirror trade analysis to detect
illicit financial outflows from Africa
Background Paper
Economic Development in Africa Report 2020
Tackling Illicit Financial Flows for Sustainable
Development in Africa
September 2020
United Nations Conference on Trade and Development
1
Contents
List of tables ............................................................................................................................................ 1
List of figures ........................................................................................................................................... 1
1. Introduction ............................................................................................................................ 2
2. Trade-related illicit financial flows in the literature ............................................................... 4
3. Caveats of the mirror trade gap for inference on IFFs ............................................................ 6
3.1 The role of trade reporting systems ................................................................................... 7
3.2 Data quality ......................................................................................................................... 8
4. Structure of the empirical analysis of the commodity specific mirror trade gap ................... 8
4.1 Rationale and sample selection .......................................................................................... 8
4.2 The method ....................................................................................................................... 10
4.3 Cost, insurance, freight (CIF) ............................................................................................. 11
5.1 The special role of gold as a conduit for illicit financial flows ........................................... 19
5.3 Future and reserves .......................................................................................................... 24
6 Intra-African asymmetries in bilateral trade data ..................................................................... 26
7 Concluding remarks ................................................................................................................... 27
References ............................................................................................................................................ 29
Appendix I Data availabiity United Nations Comtrade, 2000-2018 (Nov. 2019) .................................. 32
Appendix II Commodities of interest and their derivative products (four-digit HS 1992) .................... 34
List of tables
Table 1 Classification of the outcome of the mirror trade gap .............................................................. 3
Table 2 Africa estimates of trade-related illicit financial flows (Billions of dollars)................................ 5
Table 3 Summary of cost, insurance, freight (CIF) by commodity ........................................................ 12
Table 4 Export value and trade gaps for extra-continental commodity trade, 2000 -2018 ................. 16
Box 1 Zambia: Exploring the copper trade gap ..................................................................................... 17
Box 2 South Africa: Exploring the gold trade gap ................................................................................. 22
List of figures
Figure 1 Commodity exports by group, 2000–2018 (Percentage of total African exports) ................. 10
Figure 2 Sum of trade gaps by commodity group (Millions of dollars) ................................................. 14
Figure 3 Uganda and the United Arab Emirates: Gold imports and exports ........................................ 20
Figure 4 Madagascar: Mirror trade gap and commodity prices (Millions of dollars) ........................... 21
Figure 5 Intra-African trade gap by commodity group ($US millions) .................................................. 26
2
1. Introduction
Since illicit financial flows (IFFs) are clandestine in nature and illegal activities are inherently
intertwined such as the use of fraudulent trade invoices to launder the proceeds of crime, it is
hard to measure them. One way of looking into trade invoice related IFFs is by comparing official
trade statistics reported by two trading partners for the same trade flow. This so-called mirror
trade data analysis, which is used in this paper, compares the export value reported by country A
to country B with the import value reported by country B for the same trade flow.
The UNCTAD-UNODC (2020) takes force defines IFFs as cross-border financial flows that are illicit
in origin, transfer or use. They are financial cross-border flows from criminal activities, like illegal
markets, corruption or smuggling; as well as tax and commercial practices, like tax evasion
through trade misinvoicing.
Ideally, activities generating IFFs should be distinguished and measured separately so that policy
makers can design tools to combat them. Measuring illicit activities is difficult and only little data
is available, so researchers measure the channels, such as trade or financial transactions which
are used to transfer funds abroad based on publicly available data. Funds flow abroad through
three main channels: The physical smuggling of goods or currency and, more importantly, via
financial or trade transactions. The first two channels leave no trace in trade records; therefore,
the presented estimates only cover a subset of global IFFs.
The relative attractiveness of the international trade system for IFFs is due to the possibility of
commingling of illicit funds with legitimate ones, limited verification procedures to exchange
customs data between countries and limited resources of customs agencies to detect illegal
transactions (Financial Action Task Force, 2006).
Mirror trade analysis relies on the principle of double accounting in international trade statistics,
which is unique in macroeconomic data and has interested researchers for a long time
(Morgenstern, 1963; Bhagwati, 1964, 1967). The exact method of calculating the mirror trade gap
has been refined over the years and in recent years has gained momentum due to broader
discussions on curbing illicit financial flows (IFFs) with the measurement of Sustainable
Development Goal (SDG) 16.4 (e.g. Global Financial Integrity, 2019; UNECA, 2017).
For the African continent extractive commodity exports are very important, as they constitute
more than half of total African exports during the period in question, 2000 to 2018 (figure 1). It
has been estimated that as much as 50 per cent of illicit outflows from Africa are generated via
trade mispricing and more than half of trade related IFFs stem from the extractive sector (UNECA,
2017). Therefore, the focus of this paper is on extra-African extractive commodity exports by
commodity and dedicates a sub-analysis to intra-African commodity trade (section 6).
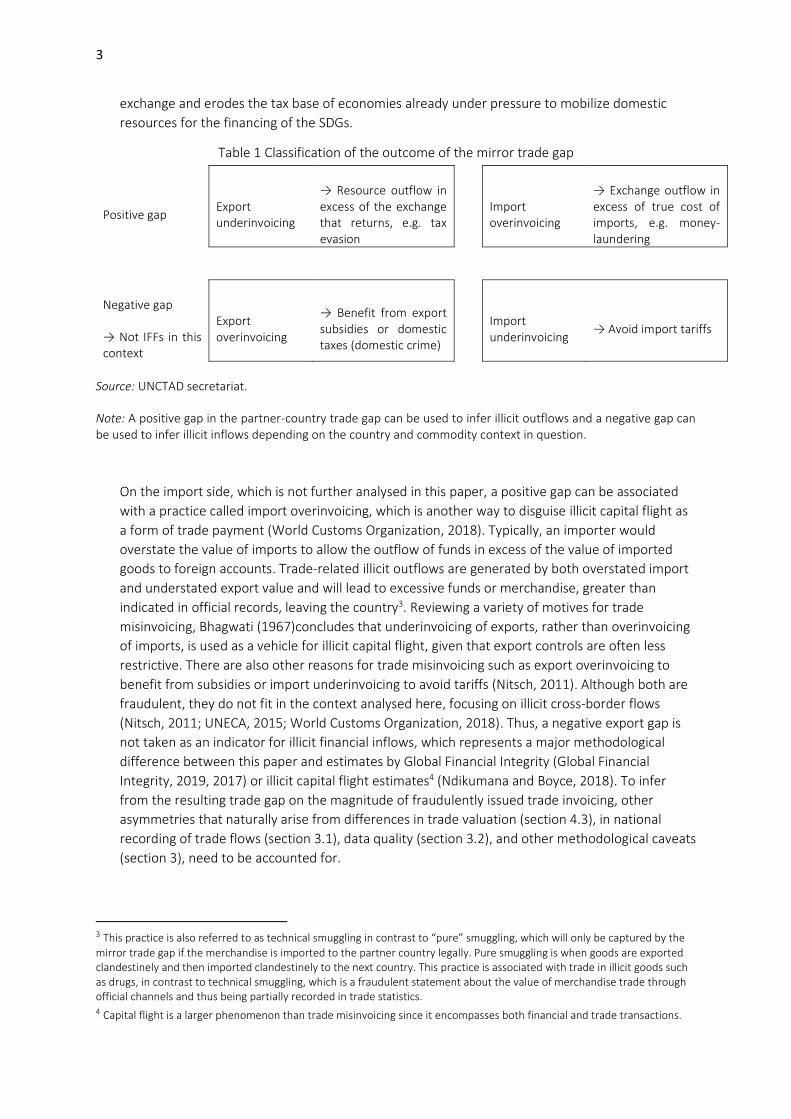
Table 1 provides an overview of four different trade gaps that can arise when comparing mirror
trade statistics and their underlying motivation for misinvoicing. This paper focuses on extra-
continental extractive commodity export, where export underinvoicing (that is, a positive trade
gap) has been identified as the most relevant conduit for IFFs. Export underinvoicing, which is a
practice where the value of exports is understated to conceal profits abroad (World Customs
Organization, 2018), has different motives from reducing the domestic tax burden to trade-based
money laundering of the proceeds of crime (Financial Action Task Force, 2006).
A positive export trade gap arises when the value of exports is lower than the value of imports
recorded by the partner country. Commodities leave the country, but the corresponding financial
flows partly stay in foreign accounts. This deprives developing countries of much needed foreign
3
exchange and erodes the tax base of economies already under pressure to mobilize domestic
resources for the financing of the SDGs.
Table 1 Classification of the outcome of the mirror trade gap
Positive gap Export underinvoicing
→ Resource outflow inexcess of the exchangethat returns, e.g. taxevasion
Import overinvoicing
→ Exchange outflow inexcess of true cost ofimports, e.g. money-laundering
Negative gap
→ Not IFFs in thiscontext
Export overinvoicing
→ Benefit from exportsubsidies or domestictaxes (domestic crime)
Import underinvoicing
→ Avoid import tariffs
Source: UNCTAD secretariat.
Note: A positive gap in the partner-country trade gap can be used to infer illicit outflows and a negative gap can be used to infer illicit inflows depending on the country and commodity context in question.
On the import side, which is not further analysed in this paper, a positive gap can be associated
with a practice called import overinvoicing, which is another way to disguise illicit capital flight as
a form of trade payment (World Customs Organization, 2018). Typically, an importer would
overstate the value of imports to allow the outflow of funds in excess of the value of imported
goods to foreign accounts. Trade-related illicit outflows are generated by both overstated import
and understated export value and will lead to excessive funds or merchandise, greater than
indicated in official records, leaving the country3. Reviewing a variety of motives for trade
misinvoicing, Bhagwati (1967)concludes that underinvoicing of exports, rather than overinvoicing
of imports, is used as a vehicle for illicit capital flight, given that export controls are often less
restrictive. There are also other reasons for trade misinvoicing such as export overinvoicing to
benefit from subsidies or import underinvoicing to avoid tariffs (Nitsch, 2011). Although both are
fraudulent, they do not fit in the context analysed here, focusing on illicit cross-border flows
(Nitsch, 2011; UNECA, 2015; World Customs Organization, 2018). Thus, a negative export gap is
not taken as an indicator for illicit financial inflows, which represents a major methodological
difference between this paper and estimates by Global Financial Integrity (Global Financial
Integrity, 2019, 2017) or illicit capital flight estimates4 (Ndikumana and Boyce, 2018). To infer
from the resulting trade gap on the magnitude of fraudulently issued trade invoicing, other
asymmetries that naturally arise from differences in trade valuation (section 4.3), in national
recording of trade flows (section 3.1), data quality (section 3.2), and other methodological caveats
(section 3), need to be accounted for.
3 This practice is also referred to as technical smuggling in contrast to “pure” smuggling, which will only be captured by the
mirror trade gap if the merchandise is imported to the partner country legally. Pure smuggling is when goods are exported clandestinely and then imported clandestinely to the next country. This practice is associated with trade in illicit goods such as drugs, in contrast to technical smuggling, which is a fraudulent statement about the value of merchandise trade through official channels and thus being partially recorded in trade statistics. 4 Capital flight is a larger phenomenon than trade misinvoicing since it encompasses both financial and trade transactions.
4
At the time of writing, there are insufficient studies exploring the statistical and logistical reasons
for bilateral trade asymmetries, especially in Africa (UNSD, 2019). This paper aims to address
some of the criticisms raised in the literature by better controlling for cost, insurance and freight
(CIF) and by providing an in-depth analysis of the recording of international trade statistics, while
highlighting the trade recording particularities for individual countries and commodities. The
paper provides an Africa-centred analysis by focusing on primary commodity exports and their
value chains that are of particular importance to the continent (in terms of total exports) and that
have been highlighted as being prone to illicit outflows (UNECA, 2015; UNCTAD, 2016a)
Further, both intra- and extracontinental African mirror trade gaps are calculated. For intra-
African trade the lack of information on how trade statistics are recorded is a major obstacle for
the mirror trade analysis since other reasons for asymmetries in bilateral trade flows need to be
exclude for a meaningful deduction from the trade gap on IFFs. The role of industry-specific
features, such as the high degree of concentration in commodity extraction and trading, bonded
warehouses for metals and petroleum exports via pipelines and how these features are reflected
in international trade statistics is also highlighted but needs further examination.
The rest of the paper is structed as followed: Section 2 reviews recent similar studies, section 3
examines caveats of the mirror trade gap for inference on IFFs. Section 4 describes the sample
selection and model estimated. Section 5 shows the results by commodity group and section 6
focuses on intra-African trade. Section 7 concludes.
2. Trade-related illicit financial flows in the literature
Estimates for illicit financial flows vary greatly depending on the methodology used and the scope
of IFFs covered5. The literature on trade-related IFFs has graduated from estimates based on total
exports and imports to more country- and product-specific analyses, as the limitations of
international merchandise trade statistics to accurately trace international trade have become
evident. Estimates based on total trade should only be considered as indicative number, since
calculating the mirror trade gap over the sum of all commodity groups conceals large commodity-
specific heterogeneities. Furthermore, due to significant differences in the data used (e.g. level of
product aggregation) and methodology which is linked to what is considered IFFs, estimates are
hard to compare across studies.
The literature review highlights the results of studies related to the research undertaken in this
paper but does not aim to be exhaustive. The report of the High-level Panel on Illicit Financial
Flows from Africa (UNECA, 2015) considers the whole continent and specific country–commodity
pairs. It concludes that the largest shares of illicit outflows from Africa in precious metals, iron
and steel, and ores are generated by the Southern African Customs Union; Zambia alone
accounted for 65 per cent of trade misinvoicing in copper. The difficulties in using international
trade statistics from Southern Africa are the subject of a more detailed discussion in section 3.1.
This highlights the importance of the extractive sector in generating IFFs and the role that the
international community could play in combating them. In the case of mining, multinational
enterprises (MNEs) increasingly centralize their trading operations, which raises the risk of trade
mispricing. Singapore and Switzerland are among the most attractive places for centralizing trade
operations due to tax incentives for multinational trading companies (UNECA, 2017). Switzerland
5 Country specific studies are summaries in UNCTAD (2020).
5
accounts for around a third of the global transit trade in key commodities such as oil, metals and
agricultural goods (Lannen et al., 2016).
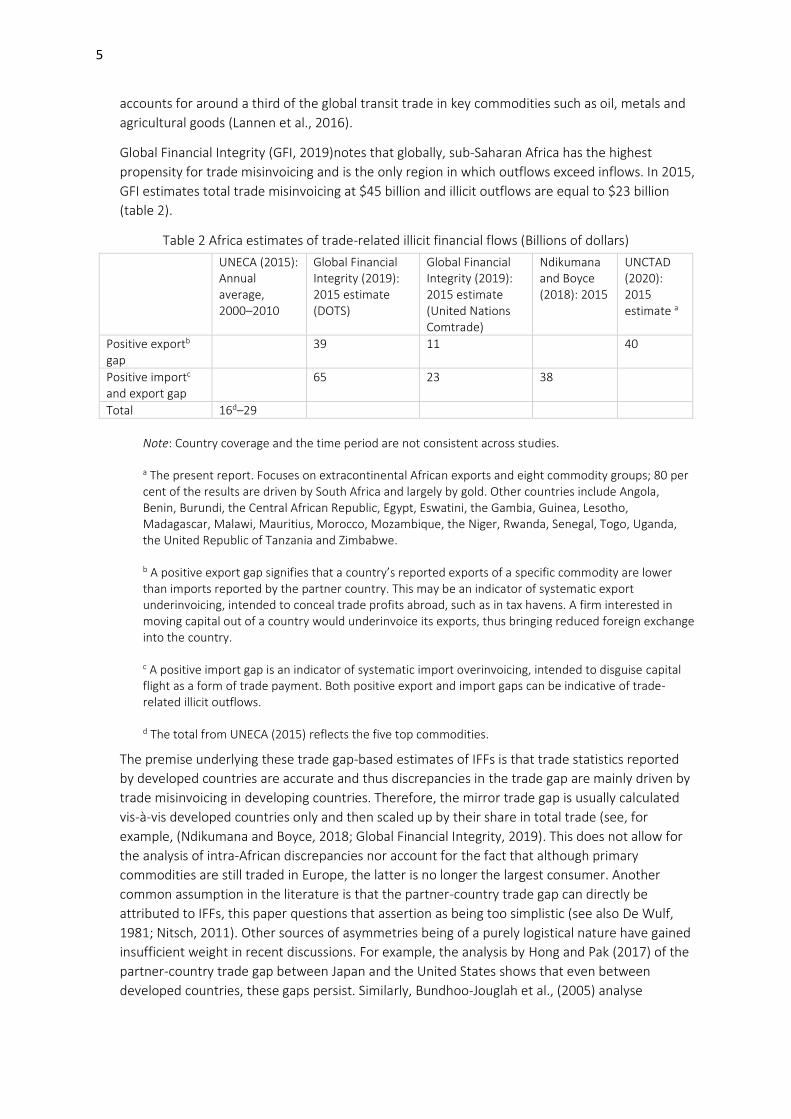
Global Financial Integrity (GFI, 2019)notes that globally, sub-Saharan Africa has the highest
propensity for trade misinvoicing and is the only region in which outflows exceed inflows. In 2015,
GFI estimates total trade misinvoicing at $45 billion and illicit outflows are equal to $23 billion
(table 2).
Table 2 Africa estimates of trade-related illicit financial flows (Billions of dollars)
UNECA (2015): Annual average, 2000–2010
Global Financial Integrity (2019): 2015 estimate (DOTS)
Global Financial Integrity (2019): 2015 estimate (United Nations Comtrade)
Ndikumana and Boyce (2018): 2015
UNCTAD (2020): 2015 estimate a
Positive exportb gap
39 11 40
Positive importc and export gap
65 23 38
Total 16d–29
Note: Country coverage and the time period are not consistent across studies.
a The present report. Focuses on extracontinental African exports and eight commodity groups; 80 per cent of the results are driven by South Africa and largely by gold. Other countries include Angola, Benin, Burundi, the Central African Republic, Egypt, Eswatini, the Gambia, Guinea, Lesotho, Madagascar, Malawi, Mauritius, Morocco, Mozambique, the Niger, Rwanda, Senegal, Togo, Uganda, the United Republic of Tanzania and Zimbabwe.
b A positive export gap signifies that a country’s reported exports of a specific commodity are lower than imports reported by the partner country. This may be an indicator of systematic export underinvoicing, intended to conceal trade profits abroad, such as in tax havens. A firm interested in moving capital out of a country would underinvoice its exports, thus bringing reduced foreign exchange into the country.
c A positive import gap is an indicator of systematic import overinvoicing, intended to disguise capital flight as a form of trade payment. Both positive export and import gaps can be indicative of trade-related illicit outflows.
d The total from UNECA (2015) reflects the five top commodities.
The premise underlying these trade gap-based estimates of IFFs is that trade statistics reported
by developed countries are accurate and thus discrepancies in the trade gap are mainly driven by
trade misinvoicing in developing countries. Therefore, the mirror trade gap is usually calculated
vis-à-vis developed countries only and then scaled up by their share in total trade (see, for
example, (Ndikumana and Boyce, 2018; Global Financial Integrity, 2019). This does not allow for
the analysis of intra-African discrepancies nor account for the fact that although primary
commodities are still traded in Europe, the latter is no longer the largest consumer. Another
common assumption in the literature is that the partner-country trade gap can directly be
attributed to IFFs, this paper questions that assertion as being too simplistic (see also De Wulf,
1981; Nitsch, 2011). Other sources of asymmetries being of a purely logistical nature have gained
insufficient weight in recent discussions. For example, the analysis by Hong and Pak (2017) of the
partner-country trade gap between Japan and the United States shows that even between
developed countries, these gaps persist. Similarly, Bundhoo-Jouglah et al., (2005) analyse
6
asymmetries in bilateral trade between Germany and the United Kingdom and ascribe the
differences to accounting standards.
The UNCTAD (2020) estimates of $40 billion in export underinvoicing using the net export gap and
is the sum of all positive individual country estimates in 2015 (covering 21 African countries and
the eight selected commodity groups). Despite significant differences in methodologies for trade-
related illicit outflows from the continent, some convergence on findings exist; IFFs are large,
have increased over time and trade in primary extractive commodities is a major contributor
(UNECA, 2015; Östensson, 2018).
UNECA (2017) recommends that international organizations should increase their efforts to
develop tools, databases and indicators to monitor and curb illicit financial outflows. Effort should
be devoted to upgrading existing publicly accessible databases to capture trade mispricing, as well
as developing new transfer pricing databases. In the spirit of these recommendations, this paper
revisited the fitness of the mirror trade methodology for detecting illicit financial flows along the
commodity value chains.
3. Caveats of the mirror trade gap for inference on IFFs
There are a multitude of challenges in matching bilateral trade data. Ideally, exports of country A
to country B should be equivalent to imports of country B from country A, minus cost, insurance
and freight (CIF) based on the principal of double accounting in trade statistics, but in reality, this
is seldom the case.
In order to infer from the results of the trade gap analysis on export underinvoicing the trade gap
needs to be persistent and positive and other valid reasons for asymmetries in recorded trade flows
need to be accounted for.
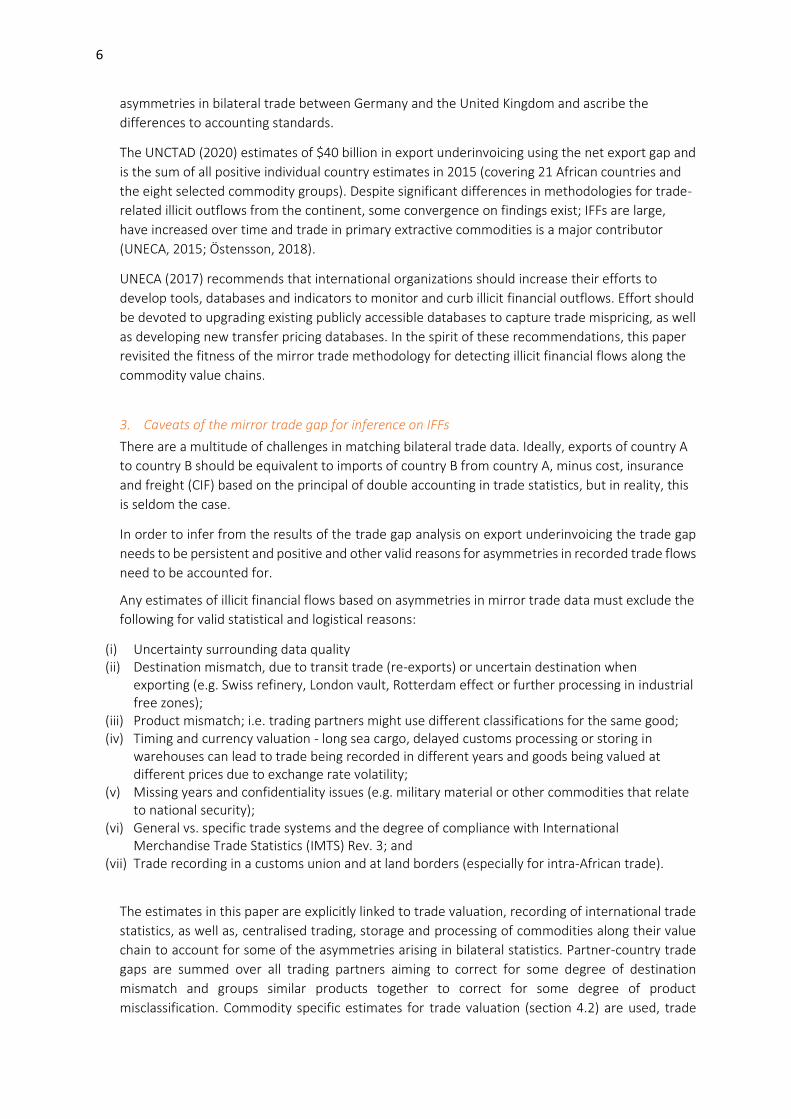
Any estimates of illicit financial flows based on asymmetries in mirror trade data must exclude the
following for valid statistical and logistical reasons:
(i) Uncertainty surrounding data quality (ii) Destination mismatch, due to transit trade (re-exports) or uncertain destination when
exporting (e.g. Swiss refinery, London vault, Rotterdam effect or further processing in industrial free zones);
(iii) Product mismatch; i.e. trading partners might use different classifications for the same good; (iv) Timing and currency valuation - long sea cargo, delayed customs processing or storing in
warehouses can lead to trade being recorded in different years and goods being valued at different prices due to exchange rate volatility;
(v) Missing years and confidentiality issues (e.g. military material or other commodities that relate to national security);
(vi) General vs. specific trade systems and the degree of compliance with International Merchandise Trade Statistics (IMTS) Rev. 3; and
(vii) Trade recording in a customs union and at land borders (especially for intra-African trade).
The estimates in this paper are explicitly linked to trade valuation, recording of international trade
statistics, as well as, centralised trading, storage and processing of commodities along their value
chain to account for some of the asymmetries arising in bilateral statistics. Partner-country trade
gaps are summed over all trading partners aiming to correct for some degree of destination
mismatch and groups similar products together to correct for some degree of product
misclassification. Commodity specific estimates for trade valuation (section 4.2) are used, trade
7
reporting systems and data quality concerns are highlighted and their potential impact on
asymmetries in reported bilateral trade flows is discussed below.
3.1 The role of trade reporting systems
How a country reports its trade statistics matters, and especially when matching bilaterally
recorded trade flows. The trade reporting system governs how individual transactions are
recorded at the national level and is the foundation of aggregates reported in United Nations
Comtrade. There are two different types of trade reporting systems, general and special. In the
case of the general trade system, the economic territory and the statistical system are consistent,
meaning that all merchandise entering and leaving the country will be recorded. The special trade
system allows for some exceptions, such as special economic zones, bonded customs warehouses
or industrial free zones. Countries that apply the special trade system account for a smaller
proportion of trade than countries that use the general trade system. When comparing the same
trade flow recorded by different countries, missing imports or exports can be linked to the special
trade reporting system and can create a large trade gap that is not linked to IFFs.
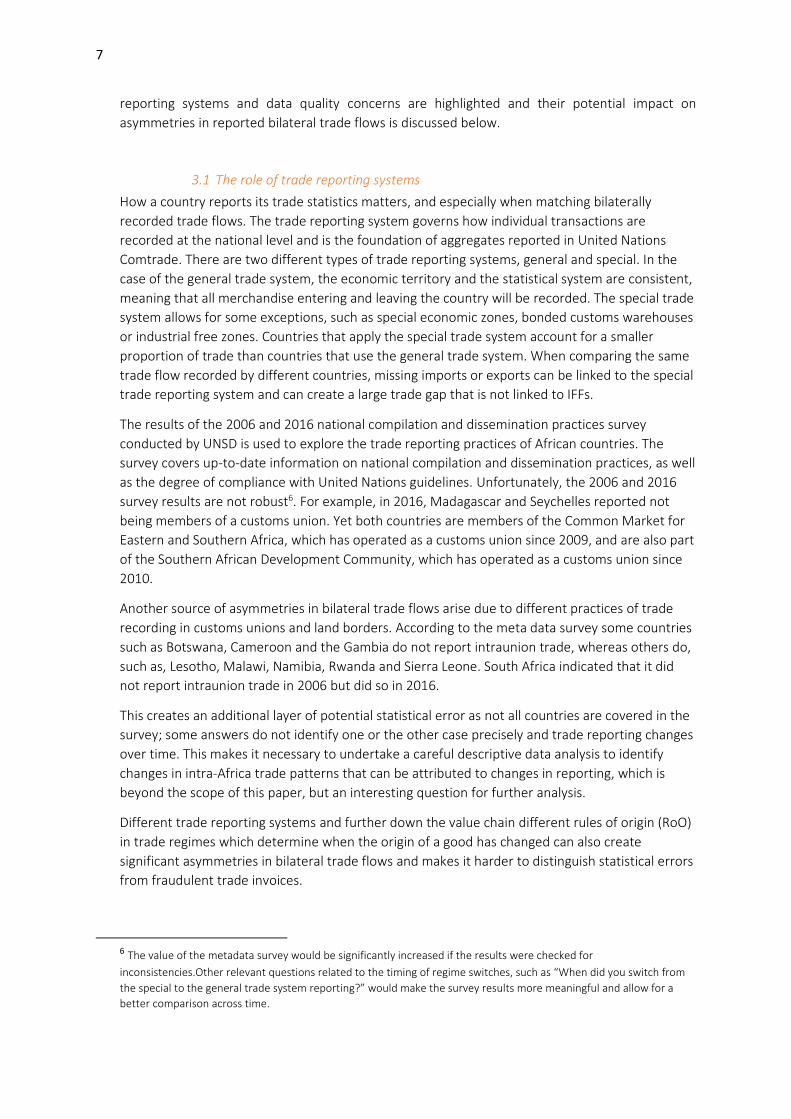
The results of the 2006 and 2016 national compilation and dissemination practices survey
conducted by UNSD is used to explore the trade reporting practices of African countries. The
survey covers up-to-date information on national compilation and dissemination practices, as well
as the degree of compliance with United Nations guidelines. Unfortunately, the 2006 and 2016
survey results are not robust6. For example, in 2016, Madagascar and Seychelles reported not
being members of a customs union. Yet both countries are members of the Common Market for
Eastern and Southern Africa, which has operated as a customs union since 2009, and are also part
of the Southern African Development Community, which has operated as a customs union since
2010.
Another source of asymmetries in bilateral trade flows arise due to different practices of trade
recording in customs unions and land borders. According to the meta data survey some countries
such as Botswana, Cameroon and the Gambia do not report intraunion trade, whereas others do,
such as, Lesotho, Malawi, Namibia, Rwanda and Sierra Leone. South Africa indicated that it did
not report intraunion trade in 2006 but did so in 2016.
This creates an additional layer of potential statistical error as not all countries are covered in the
survey; some answers do not identify one or the other case precisely and trade reporting changes
over time. This makes it necessary to undertake a careful descriptive data analysis to identify
changes in intra-Africa trade patterns that can be attributed to changes in reporting, which is
beyond the scope of this paper, but an interesting question for further analysis.
Different trade reporting systems and further down the value chain different rules of origin (RoO)
in trade regimes which determine when the origin of a good has changed can also create
significant asymmetries in bilateral trade flows and makes it harder to distinguish statistical errors
from fraudulent trade invoices.
6 The value of the metadata survey would be significantly increased if the results were checked for
inconsistencies.Other relevant questions related to the timing of regime switches, such as “When did you switch from
the special to the general trade system reporting?” would make the survey results more meaningful and allow for a
better comparison across time.
8
3.2 Data quality
The quality of trade data varies across countries. For example, 55 per cent of developed countries
use customs declarations as the main source of international trade statistics, and supplement
these with other administrative records associated with taxation and enterprise surveys. In
contrast, 98 per cent of developing countries rely purely on customs declarations (UNSD, 2019).
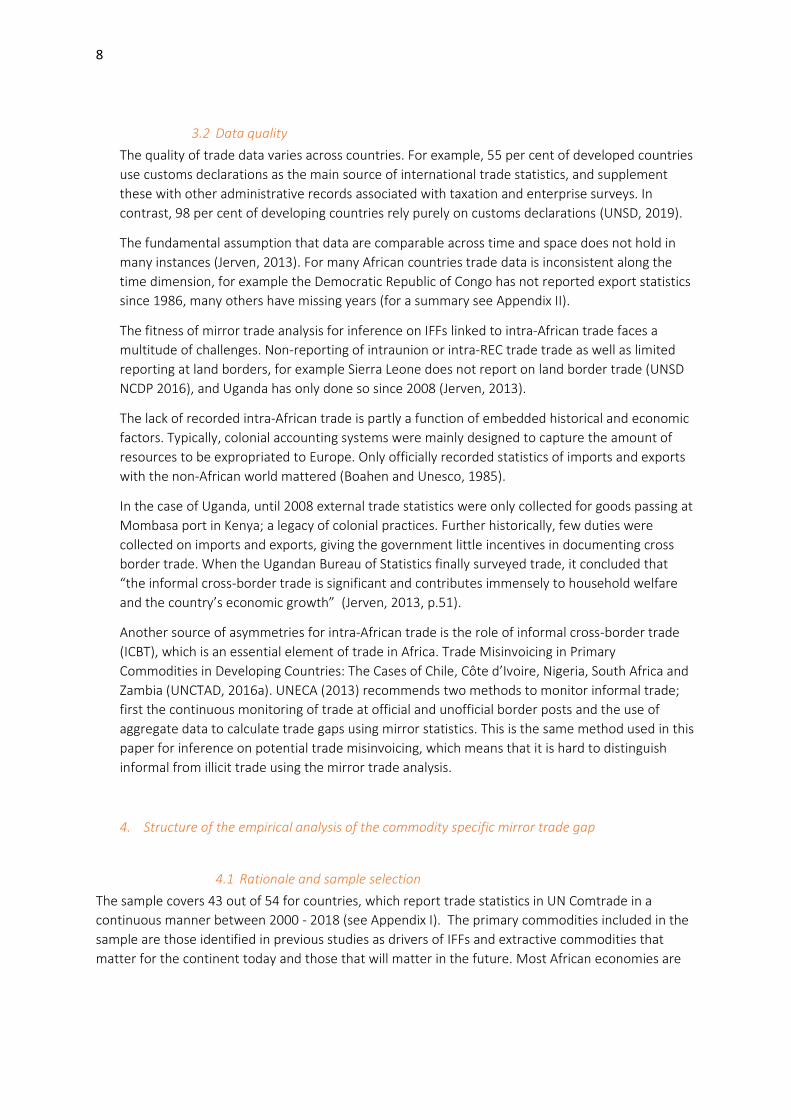
The fundamental assumption that data are comparable across time and space does not hold in
many instances (Jerven, 2013). For many African countries trade data is inconsistent along the
time dimension, for example the Democratic Republic of Congo has not reported export statistics
since 1986, many others have missing years (for a summary see Appendix II).
The fitness of mirror trade analysis for inference on IFFs linked to intra-African trade faces a
multitude of challenges. Non-reporting of intraunion or intra-REC trade trade as well as limited
reporting at land borders, for example Sierra Leone does not report on land border trade (UNSD
NCDP 2016), and Uganda has only done so since 2008 (Jerven, 2013).
The lack of recorded intra-African trade is partly a function of embedded historical and economic
factors. Typically, colonial accounting systems were mainly designed to capture the amount of
resources to be expropriated to Europe. Only officially recorded statistics of imports and exports
with the non-African world mattered (Boahen and Unesco, 1985).
In the case of Uganda, until 2008 external trade statistics were only collected for goods passing at
Mombasa port in Kenya; a legacy of colonial practices. Further historically, few duties were
collected on imports and exports, giving the government little incentives in documenting cross
border trade. When the Ugandan Bureau of Statistics finally surveyed trade, it concluded that
“the informal cross-border trade is significant and contributes immensely to household welfare
and the country’s economic growth” (Jerven, 2013, p.51).
Another source of asymmetries for intra-African trade is the role of informal cross-border trade
(ICBT), which is an essential element of trade in Africa. Trade Misinvoicing in Primary
Commodities in Developing Countries: The Cases of Chile, Côte d’Ivoire, Nigeria, South Africa and
Zambia (UNCTAD, 2016a). UNECA (2013) recommends two methods to monitor informal trade;
first the continuous monitoring of trade at official and unofficial border posts and the use of
aggregate data to calculate trade gaps using mirror statistics. This is the same method used in this
paper for inference on potential trade misinvoicing, which means that it is hard to distinguish
informal from illicit trade using the mirror trade analysis.
4. Structure of the empirical analysis of the commodity specific mirror trade gap
4.1 Rationale and sample selection
The sample covers 43 out of 54 for countries, which report trade statistics in UN Comtrade in a
continuous manner between 2000 - 2018 (see Appendix I). The primary commodities included in the
sample are those identified in previous studies as drivers of IFFs and extractive commodities that
matter for the continent today and those that will matter in the future. Most African economies are
9
heavily dependent on the export of primary commodities (45 out of 54 are commodity dependent).7
Eighteen countries are dependent on minerals, ores and metals exports, 17 on the export of
agricultural products and 10 on fuel exports. Further, the continent holds critical reserves of minerals
which will be in high demand in the future (section 5.3).
There is empirical evidence that the degree of trade misinvoicing varies over commodity groups and is
linked to commodity-specific characteristics (UNCTAD, 2016a). For example, high-value, low-weight
commodities such as diamonds, gold and other precious metals appear to be more prone to
smuggling and have been linked to IFFs, corruption and illicit arms trafficking (Berman et al., 2017).
The list of commodities covered as classified by HS code can be found in Appendix II. A feature of
trade in primary extractive commodities that makes them vulnerable to trade misinvoicing is market
concentration. As the large-scale extraction of natural resources is highly capital intensive, MNEs
market concentration is significant, enabling them to exert significant influence over government
regulation (UNCTAD, 2016b). Similarly, major agglomerates in extractive industries, which both mine
and trade commodities, can exert considerable influence over prices and key stages of the value
chain.
The distinction between intra- and extracontinental African trade for the calculation of the trade gap
matters since trade patterns in terms of size and products are different. In addition, key players and
motives for fraudulent customs invoicing differ. Furthermore, the quality of intra-African trade data is
generally lower as trade recording at sometimes porous land borders is more challenging than at
ports. Therefore, the trade gap patterns are expected to differ for intra- and extracontinental African
exports of extractive resources.
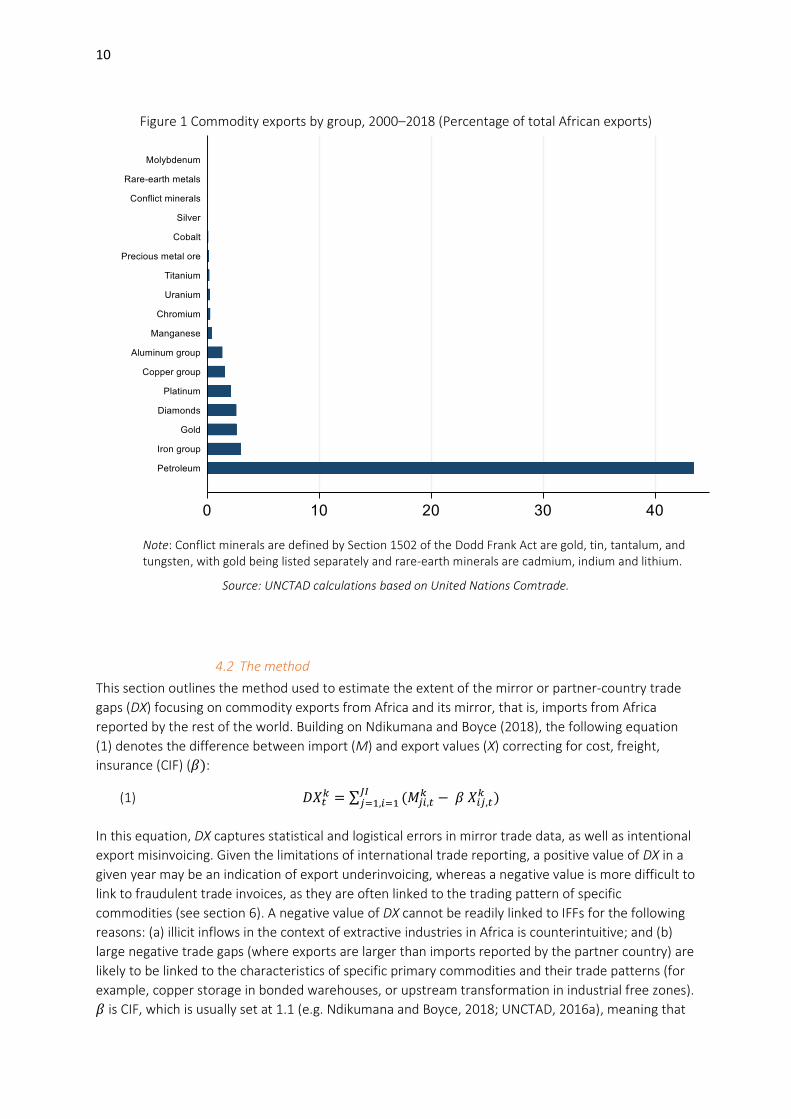
Figure 1 shows commodity exports by group as a share of total African exports. Primary extractive
commodities constituted more than 50 per cent of total exports during 2000–2018, with oil and gas
exports contributing around 45 per cent of total exports. Many of the identified commodities make
up a small percentage of total African exports but nevertheless show similar trade gaps as other
largely traded commodities.
7 A country is export commodity-dependent when more than 60 per cent of its total merchandise exports are composed of commodities. African countries that are not export commodity dependent include Cabo Verde, Egypt, Eswatini, Lesotho, Mauritius, Morocco, South Africa and Tunisia.
10
Figure 1 Commodity exports by group, 2000–2018 (Percentage of total African exports)
Note: Conflict minerals are defined by Section 1502 of the Dodd Frank Act are gold, tin, tantalum, and tungsten, with gold being listed separately and rare-earth minerals are cadmium, indium and lithium.
Source: UNCTAD calculations based on United Nations Comtrade.
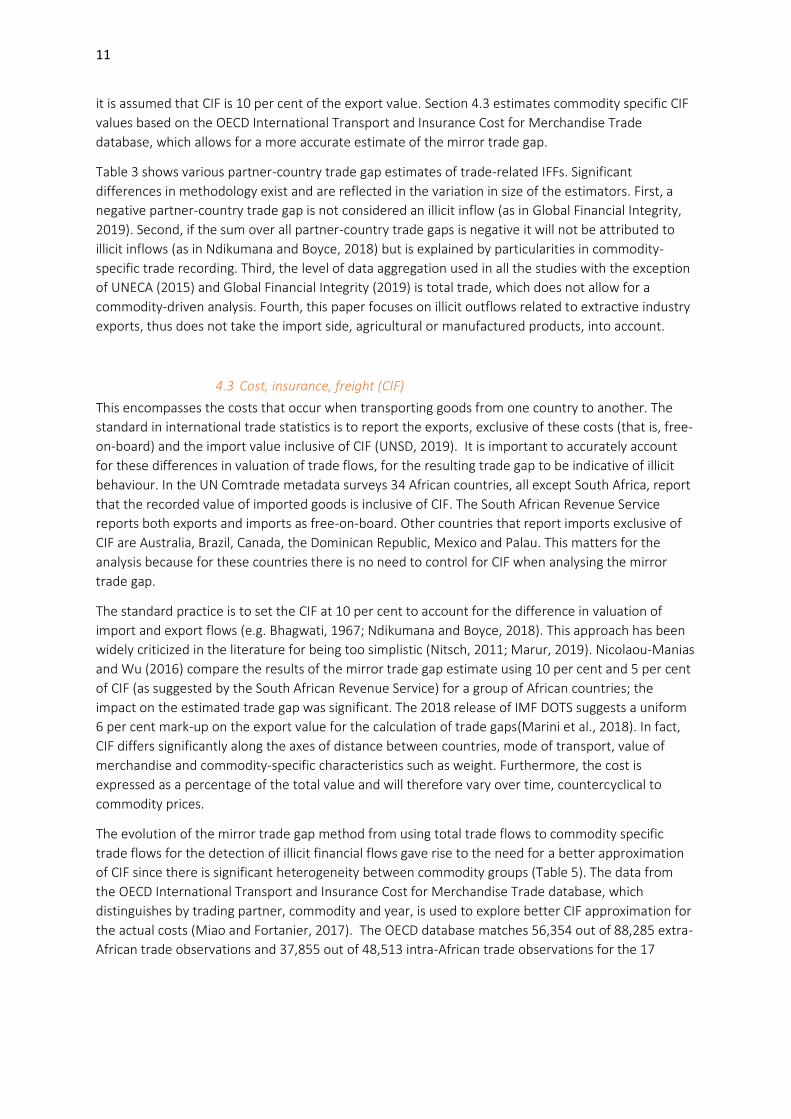
4.2 The method
This section outlines the method used to estimate the extent of the mirror or partner-country trade
gaps (DX) focusing on commodity exports from Africa and its mirror, that is, imports from Africa
reported by the rest of the world. Building on Ndikumana and Boyce (2018), the following equation
(1) denotes the difference between import (M) and export values (X) correcting for cost, freight,
insurance (CIF) (𝛽):
(1) 𝐷𝑋𝑡𝑘 = ∑ (𝑀𝑗𝑖,𝑡
𝑘 − 𝛽 𝑋𝑖𝑗,𝑡𝑘 )𝐽𝐼
𝑗=1,𝑖=1
In this equation, DX captures statistical and logistical errors in mirror trade data, as well as intentional
export misinvoicing. Given the limitations of international trade reporting, a positive value of DX in a
given year may be an indication of export underinvoicing, whereas a negative value is more difficult to
link to fraudulent trade invoices, as they are often linked to the trading pattern of specific
commodities (see section 6). A negative value of DX cannot be readily linked to IFFs for the following
reasons: (a) illicit inflows in the context of extractive industries in Africa is counterintuitive; and (b)
large negative trade gaps (where exports are larger than imports reported by the partner country) are
likely to be linked to the characteristics of specific primary commodities and their trade patterns (for
example, copper storage in bonded warehouses, or upstream transformation in industrial free zones).
𝛽 is CIF, which is usually set at 1.1 (e.g. Ndikumana and Boyce, 2018; UNCTAD, 2016a), meaning that
11
it is assumed that CIF is 10 per cent of the export value. Section 4.3 estimates commodity specific CIF
values based on the OECD International Transport and Insurance Cost for Merchandise Trade
database, which allows for a more accurate estimate of the mirror trade gap.
Table 3 shows various partner-country trade gap estimates of trade-related IFFs. Significant
differences in methodology exist and are reflected in the variation in size of the estimators. First, a
negative partner-country trade gap is not considered an illicit inflow (as in Global Financial Integrity,
2019). Second, if the sum over all partner-country trade gaps is negative it will not be attributed to
illicit inflows (as in Ndikumana and Boyce, 2018) but is explained by particularities in commodity-
specific trade recording. Third, the level of data aggregation used in all the studies with the exception
of UNECA (2015) and Global Financial Integrity (2019) is total trade, which does not allow for a
commodity-driven analysis. Fourth, this paper focuses on illicit outflows related to extractive industry
exports, thus does not take the import side, agricultural or manufactured products, into account.
4.3 Cost, insurance, freight (CIF)
This encompasses the costs that occur when transporting goods from one country to another. The
standard in international trade statistics is to report the exports, exclusive of these costs (that is, free-
on-board) and the import value inclusive of CIF (UNSD, 2019). It is important to accurately account
for these differences in valuation of trade flows, for the resulting trade gap to be indicative of illicit
behaviour. In the UN Comtrade metadata surveys 34 African countries, all except South Africa, report
that the recorded value of imported goods is inclusive of CIF. The South African Revenue Service
reports both exports and imports as free-on-board. Other countries that report imports exclusive of
CIF are Australia, Brazil, Canada, the Dominican Republic, Mexico and Palau. This matters for the
analysis because for these countries there is no need to control for CIF when analysing the mirror
trade gap.
The standard practice is to set the CIF at 10 per cent to account for the difference in valuation of
import and export flows (e.g. Bhagwati, 1967; Ndikumana and Boyce, 2018). This approach has been
widely criticized in the literature for being too simplistic (Nitsch, 2011; Marur, 2019). Nicolaou-Manias
and Wu (2016) compare the results of the mirror trade gap estimate using 10 per cent and 5 per cent
of CIF (as suggested by the South African Revenue Service) for a group of African countries; the
impact on the estimated trade gap was significant. The 2018 release of IMF DOTS suggests a uniform
6 per cent mark-up on the export value for the calculation of trade gaps(Marini et al., 2018). In fact,
CIF differs significantly along the axes of distance between countries, mode of transport, value of
merchandise and commodity-specific characteristics such as weight. Furthermore, the cost is
expressed as a percentage of the total value and will therefore vary over time, countercyclical to
commodity prices.
The evolution of the mirror trade gap method from using total trade flows to commodity specific
trade flows for the detection of illicit financial flows gave rise to the need for a better approximation
of CIF since there is significant heterogeneity between commodity groups (Table 5). The data from
the OECD International Transport and Insurance Cost for Merchandise Trade database, which
distinguishes by trading partner, commodity and year, is used to explore better CIF approximation for
the actual costs (Miao and Fortanier, 2017). The OECD database matches 56,354 out of 88,285 extra-
African trade observations and 37,855 out of 48,513 intra-African trade observations for the 17
12
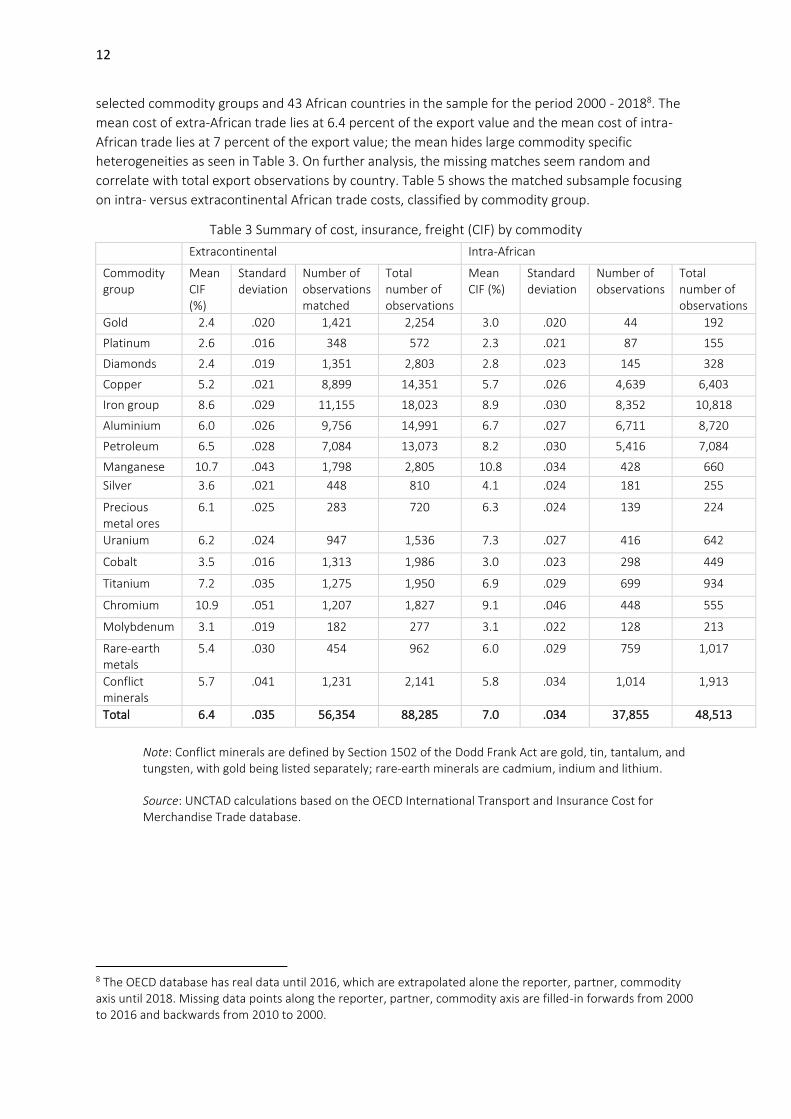
selected commodity groups and 43 African countries in the sample for the period 2000 - 20188. The
mean cost of extra-African trade lies at 6.4 percent of the export value and the mean cost of intra-
African trade lies at 7 percent of the export value; the mean hides large commodity specific
heterogeneities as seen in Table 3. On further analysis, the missing matches seem random and
correlate with total export observations by country. Table 5 shows the matched subsample focusing
on intra- versus extracontinental African trade costs, classified by commodity group.
Table 3 Summary of cost, insurance, freight (CIF) by commodity
Extracontinental Intra-African
Commodity group
Mean CIF (%)
Standard deviation
Number of observations matched
Total number of observations
Mean CIF (%)
Standard deviation
Number of observations
Total number of observations
Gold 2.4 .020 1,421 2,254 3.0 .020 44 192
Platinum 2.6 .016 348 572 2.3 .021 87 155
Diamonds 2.4 .019 1,351 2,803 2.8 .023 145 328
Copper 5.2 .021 8,899 14,351 5.7 .026 4,639 6,403
Iron group 8.6 .029 11,155 18,023 8.9 .030 8,352 10,818
Aluminium 6.0 .026 9,756 14,991 6.7 .027 6,711 8,720
Petroleum 6.5 .028 7,084 13,073 8.2 .030 5,416 7,084
Manganese 10.7 .043 1,798 2,805 10.8 .034 428 660
Silver 3.6 .021 448 810 4.1 .024 181 255
Precious metal ores
6.1 .025 283 720 6.3 .024 139 224
Uranium 6.2 .024 947 1,536 7.3 .027 416 642
Cobalt 3.5 .016 1,313 1,986 3.0 .023 298 449
Titanium 7.2 .035 1,275 1,950 6.9 .029 699 934
Chromium 10.9 .051 1,207 1,827 9.1 .046 448 555
Molybdenum 3.1 .019 182 277 3.1 .022 128 213
Rare-earth metals
5.4 .030 454 962 6.0 .029 759 1,017
Conflict minerals
5.7 .041 1,231 2,141 5.8 .034 1,014 1,913
Total 6.4 .035 56,354 88,285 7.0 .034 37,855 48,513
Note: Conflict minerals are defined by Section 1502 of the Dodd Frank Act are gold, tin, tantalum, and tungsten, with gold being listed separately; rare-earth minerals are cadmium, indium and lithium.
Source: UNCTAD calculations based on the OECD International Transport and Insurance Cost for Merchandise Trade database.
8 The OECD database has real data until 2016, which are extrapolated alone the reporter, partner, commodity axis until 2018. Missing data points along the reporter, partner, commodity axis are filled-in forwards from 2000 to 2016 and backwards from 2010 to 2000.
13
A variety of factors will impact CIF such as geography (distance, landlocked or island status) and
infrastructure (quality of transport facilities, as well as information and communication technologies)
(Limão and Venables, 2001). From the OECD database, the following trends for extra-continental
trade emerge:
a) For high value commodities (gold, platinum and diamonds), CIF is around 2.5 percent of export value (Table 3);
b) Copper, aluminium and petroleum are close to the 6 per cent of CIF recommended by IMF;
c) Manganese and iron are closer to the 10 per cent adjustment widely used in the literature;
d) Standard deviations are very large and landlocked countries do not seem to be the driving force.
The gradual shift from estimating the partner-country trade gap based on total trade vis-à-vis
commodity-based approach needs more precise estimates of CIF. Adding 10 per cent to the export
value to account for the difference in valuation might be a good proxy when using total exports but
hides significant heterogeneity across commodity groups.
For the following estimations commodity group means will be used to fill in the missing CIF value
estimates. For gold exports from South Africa the mean value is estimated at 2.9 percent of export
value. This estimate will be used for all gold exports from South Africa since gold trading partners are
not reported individually.
5. Results of the empirical analysis
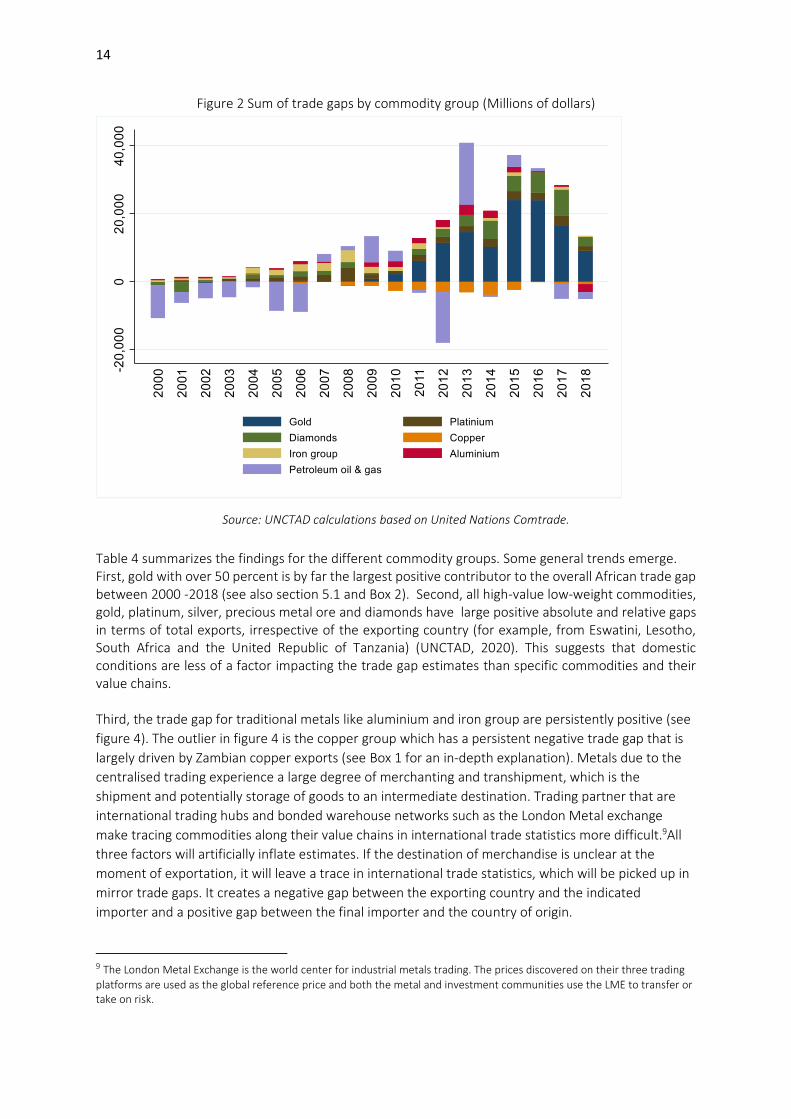
The estimated $40 billion trade gap in 2015 derived from extractive commodities, 77 per cent were concentrated in the gold supply chain, followed by diamonds (12 per cent) and platinum (six per cent) (UNCTAD, 2020). Based on these new findings this paper offers deeper insights in the trade gap for specific commodity exports. Figure 2 shows how the main trade gaps behave over time. Usually trade gaps are persistent, either
positive or negative over time with expectation of the petroleum oils and gas trade gap. The
decomposition of the petroleum oils and gas trade gap and which countries are driving the results
warrants further analysis. Other commodities like gold, diamonds, platinum and iron have a
consistent positive trade gap over the sample period, whereas copper has a persistent negative one.
Continuity over time matters since if not driven by a major event like the commodity super-cycle the
trade gap and amount of export minsinvoing can be expected to be consistent.
14
Figure 2 Sum of trade gaps by commodity group (Millions of dollars)
Source: UNCTAD calculations based on United Nations Comtrade.
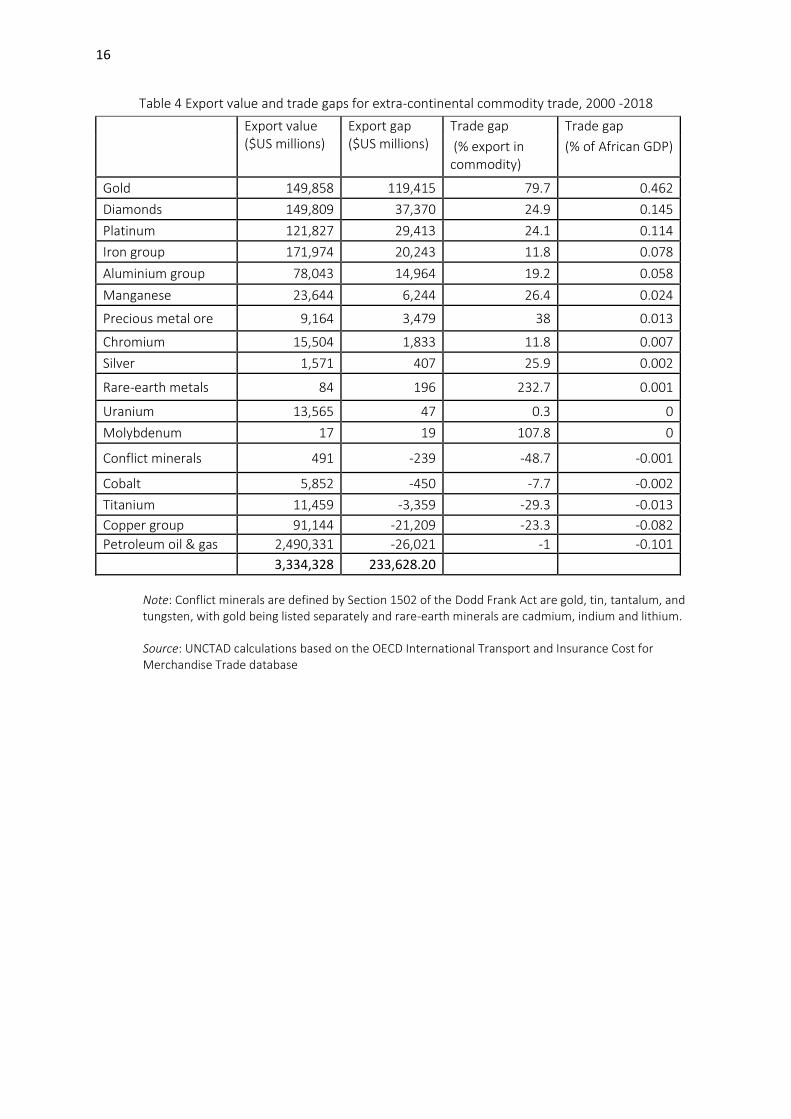
Table 4 summarizes the findings for the different commodity groups. Some general trends emerge. First, gold with over 50 percent is by far the largest positive contributor to the overall African trade gap between 2000 -2018 (see also section 5.1 and Box 2). Second, all high-value low-weight commodities, gold, platinum, silver, precious metal ore and diamonds have large positive absolute and relative gaps in terms of total exports, irrespective of the exporting country (for example, from Eswatini, Lesotho, South Africa and the United Republic of Tanzania) (UNCTAD, 2020). This suggests that domestic conditions are less of a factor impacting the trade gap estimates than specific commodities and their value chains. Third, the trade gap for traditional metals like aluminium and iron group are persistently positive (see
figure 4). The outlier in figure 4 is the copper group which has a persistent negative trade gap that is
largely driven by Zambian copper exports (see Box 1 for an in-depth explanation). Metals due to the
centralised trading experience a large degree of merchanting and transhipment, which is the
shipment and potentially storage of goods to an intermediate destination. Trading partner that are
international trading hubs and bonded warehouse networks such as the London Metal exchange
make tracing commodities along their value chains in international trade statistics more difficult.9All
three factors will artificially inflate estimates. If the destination of merchandise is unclear at the
moment of exportation, it will leave a trace in international trade statistics, which will be picked up in
mirror trade gaps. It creates a negative gap between the exporting country and the indicated
importer and a positive gap between the final importer and the country of origin.
9 The London Metal Exchange is the world center for industrial metals trading. The prices discovered on their three trading
platforms are used as the global reference price and both the metal and investment communities use the LME to transfer or take on risk.
15
Fourth, new metals like manganese, chromium, molybdenum and other rare-earth metals have the
largest relative trade gaps. The rare-earth metal group (indium, cadmium, lithium) has with more than
200 percent the largest relative trade gap. This means that imports by the rest of the world are three
times larger than exports reported by the continent. The next largest relative trade gap is
molybdenum with 100 percent and gold with 80 percent of lost exports relative to total exports in the
same commodity group.
Fifth, the uranium group has the lowest export gap with 0.3 percent, meaning that uranium exports
from the continent are well balanced with uranium imports reported by the rest of the world. Due to
its specific use as fuel for nuclear power plants the uranium trade unlike other metals is not organised
on a commodity exchange such as the London Metal Exchange but governed by contracts directly
negotiated between buyer and seller.
Sixth, the petroleum oil and gas exports tend to leave a negative trade gap, i.e. exports reported by
Africa are larger than imports reported by the rest of the world. In fact, all major petroleum exporting
countries (Algeria, Angola, Nigeria and Tunisia) to some extent have large negative export trade gaps,
except for Egypt, which has a large positive gap (UNCTAD, 2020). Many of the Northern African
countries, export petroleum via pipelines which according to IMTS 2010 recommendations should be
included in international merchandise trade statistics as they constitute international transactions in
goods, although they are not always recorded by custom authorities but by the exporting firm. In the
absence of customs records pipeline exports are often reported by the buyer and seller, which
creates another level of complexity. Additionally, petroleum exports face the same trade recording
challenges as other commodities with centralised trading and refining operations. Even though, the
negative export trade gap cannot be linked to illicit financial outflows, it cannot be concluded that the
continent does not experience them but rather that trade recording practices and mirror trade
analysis are not able to detect them.
Seventh, conflict minerals (tin, tantalum and tungsten) excluding gold have a large negative trade gap
of around 50 percent, meaning that half of the reported exports from African cannot be matched with
reported imports by the rest of the world. This might be linked to the tightened value chain
regulations of these commodities but warrants further analysis.10
10 Section 1502 of the Dodd Frank Act classifies gold, tin, tantalum, and tungsten as conflict minerals and regulates their use, therefor giving the incentive to underreport their use or mispresent their origin.
16
Table 4 Export value and trade gaps for extra-continental commodity trade, 2000 -2018
Export value ($US millions)
Export gap ($US millions)
Trade gap Trade gap
(% export in commodity)
(% of African GDP)
Gold 149,858 119,415 79.7 0.462
Diamonds 149,809 37,370 24.9 0.145
Platinum 121,827 29,413 24.1 0.114
Iron group 171,974 20,243 11.8 0.078
Aluminium group 78,043 14,964 19.2 0.058
Manganese 23,644 6,244 26.4 0.024
Precious metal ore 9,164 3,479 38 0.013
Chromium 15,504 1,833 11.8 0.007
Silver 1,571 407 25.9 0.002
Rare-earth metals 84 196 232.7 0.001
Uranium 13,565 47 0.3 0
Molybdenum 17 19 107.8 0
Conflict minerals 491 -239 -48.7 -0.001
Cobalt 5,852 -450 -7.7 -0.002
Titanium 11,459 -3,359 -29.3 -0.013
Copper group 91,144 -21,209 -23.3 -0.082
Petroleum oil & gas 2,490,331 -26,021 -1 -0.101
3,334,328 233,628.20
Note: Conflict minerals are defined by Section 1502 of the Dodd Frank Act are gold, tin, tantalum, and tungsten, with gold being listed separately and rare-earth minerals are cadmium, indium and lithium.
Source: UNCTAD calculations based on the OECD International Transport and Insurance Cost for Merchandise Trade database
17
Box 1 Zambia: Exploring the copper trade gap
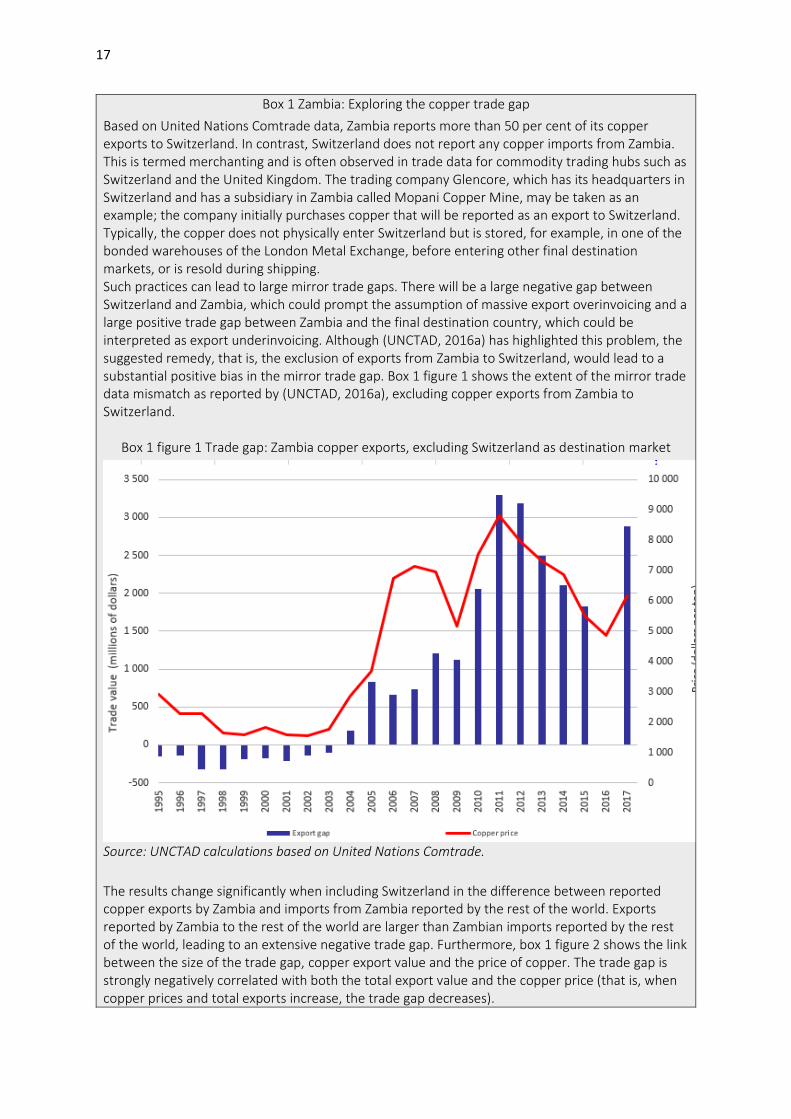
Based on United Nations Comtrade data, Zambia reports more than 50 per cent of its copper exports to Switzerland. In contrast, Switzerland does not report any copper imports from Zambia. This is termed merchanting and is often observed in trade data for commodity trading hubs such as Switzerland and the United Kingdom. The trading company Glencore, which has its headquarters in Switzerland and has a subsidiary in Zambia called Mopani Copper Mine, may be taken as an example; the company initially purchases copper that will be reported as an export to Switzerland. Typically, the copper does not physically enter Switzerland but is stored, for example, in one of the bonded warehouses of the London Metal Exchange, before entering other final destination markets, or is resold during shipping. Such practices can lead to large mirror trade gaps. There will be a large negative gap between Switzerland and Zambia, which could prompt the assumption of massive export overinvoicing and a large positive trade gap between Zambia and the final destination country, which could be interpreted as export underinvoicing. Although (UNCTAD, 2016a) has highlighted this problem, the suggested remedy, that is, the exclusion of exports from Zambia to Switzerland, would lead to a substantial positive bias in the mirror trade gap. Box 1 figure 1 shows the extent of the mirror trade data mismatch as reported by (UNCTAD, 2016a), excluding copper exports from Zambia to Switzerland.
Box 1 figure 1 Trade gap: Zambia copper exports, excluding Switzerland as destination market
Source: UNCTAD calculations based on United Nations Comtrade.
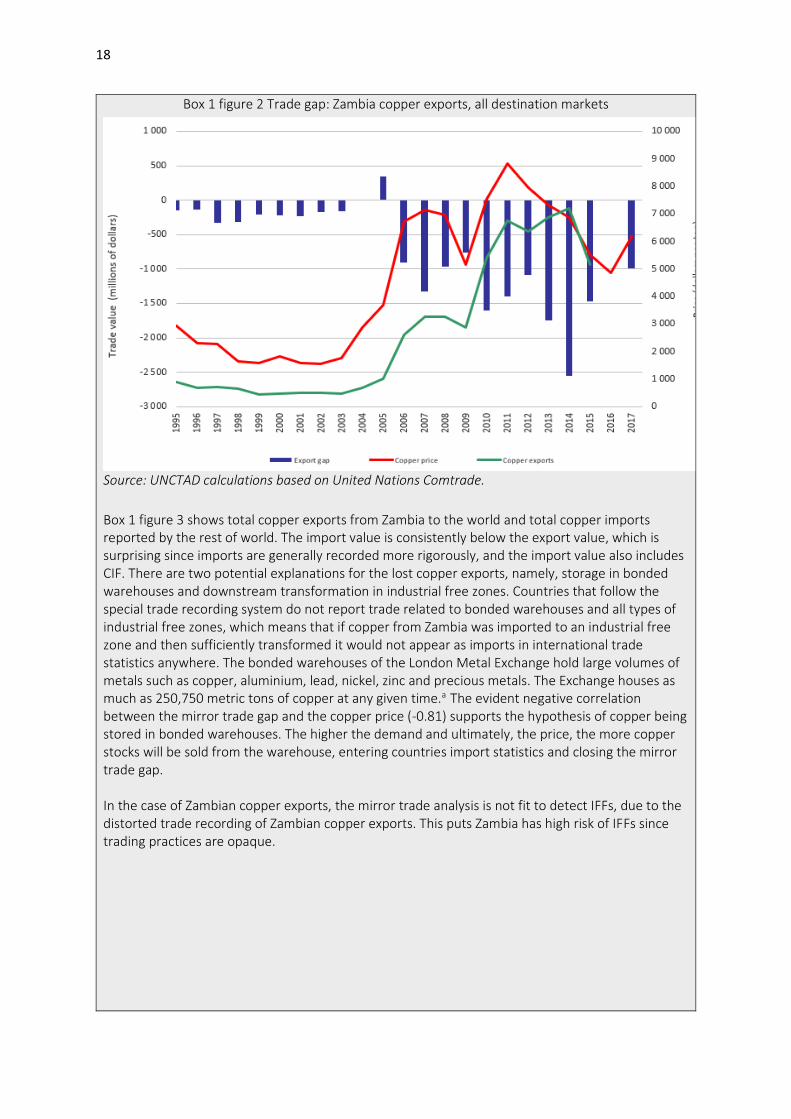
The results change significantly when including Switzerland in the difference between reported copper exports by Zambia and imports from Zambia reported by the rest of the world. Exports reported by Zambia to the rest of the world are larger than Zambian imports reported by the rest of the world, leading to an extensive negative trade gap. Furthermore, box 1 figure 2 shows the link between the size of the trade gap, copper export value and the price of copper. The trade gap is strongly negatively correlated with both the total export value and the copper price (that is, when copper prices and total exports increase, the trade gap decreases).
18
Box 1 figure 2 Trade gap: Zambia copper exports, all destination markets
Source: UNCTAD calculations based on United Nations Comtrade.
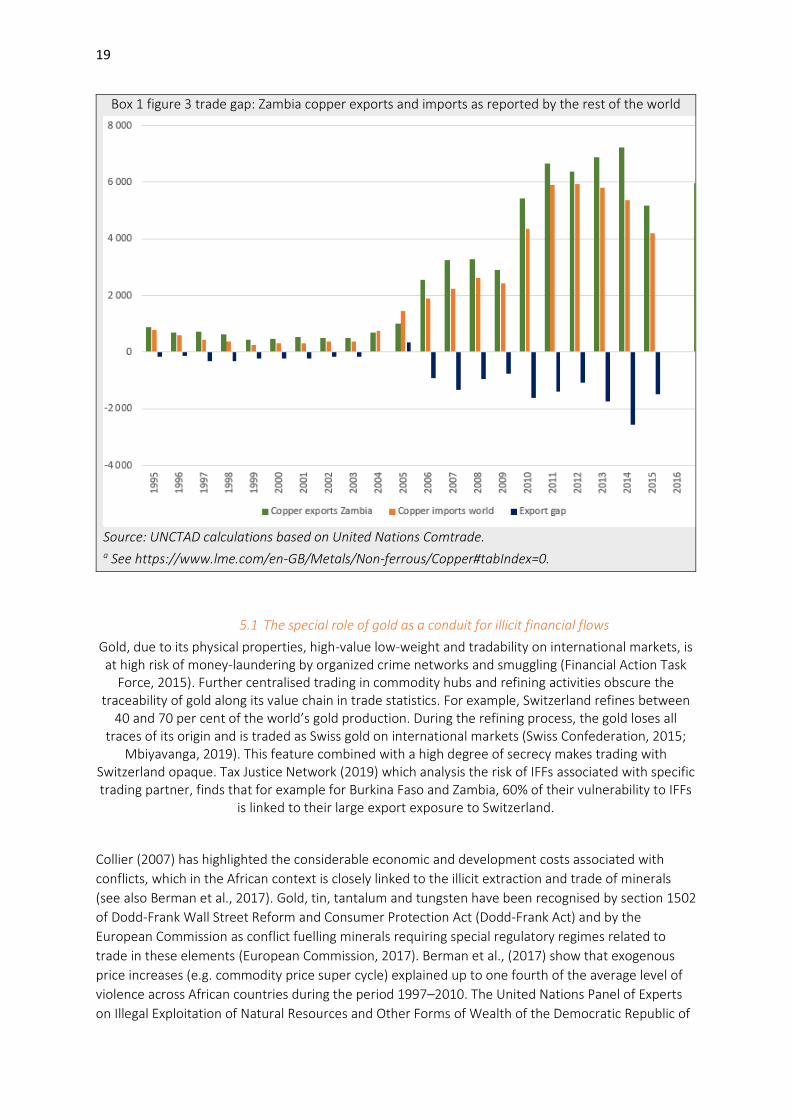
Box 1 figure 3 shows total copper exports from Zambia to the world and total copper imports reported by the rest of world. The import value is consistently below the export value, which is surprising since imports are generally recorded more rigorously, and the import value also includes CIF. There are two potential explanations for the lost copper exports, namely, storage in bonded warehouses and downstream transformation in industrial free zones. Countries that follow the special trade recording system do not report trade related to bonded warehouses and all types of industrial free zones, which means that if copper from Zambia was imported to an industrial free zone and then sufficiently transformed it would not appear as imports in international trade statistics anywhere. The bonded warehouses of the London Metal Exchange hold large volumes of metals such as copper, aluminium, lead, nickel, zinc and precious metals. The Exchange houses as much as 250,750 metric tons of copper at any given time.a The evident negative correlation between the mirror trade gap and the copper price (-0.81) supports the hypothesis of copper being stored in bonded warehouses. The higher the demand and ultimately, the price, the more copper stocks will be sold from the warehouse, entering countries import statistics and closing the mirror trade gap. In the case of Zambian copper exports, the mirror trade analysis is not fit to detect IFFs, due to the distorted trade recording of Zambian copper exports. This puts Zambia has high risk of IFFs since trading practices are opaque.
19
Box 1 figure 3 trade gap: Zambia copper exports and imports as reported by the rest of the world
Source: UNCTAD calculations based on United Nations Comtrade. a See https://www.lme.com/en-GB/Metals/Non-ferrous/Copper#tabIndex=0.
5.1 The special role of gold as a conduit for illicit financial flows
Gold, due to its physical properties, high-value low-weight and tradability on international markets, is at high risk of money-laundering by organized crime networks and smuggling (Financial Action Task
Force, 2015). Further centralised trading in commodity hubs and refining activities obscure the traceability of gold along its value chain in trade statistics. For example, Switzerland refines between
40 and 70 per cent of the world’s gold production. During the refining process, the gold loses all traces of its origin and is traded as Swiss gold on international markets (Swiss Confederation, 2015;
Mbiyavanga, 2019). This feature combined with a high degree of secrecy makes trading with Switzerland opaque. Tax Justice Network (2019) which analysis the risk of IFFs associated with specific trading partner, finds that for example for Burkina Faso and Zambia, 60% of their vulnerability to IFFs
is linked to their large export exposure to Switzerland.
Collier (2007) has highlighted the considerable economic and development costs associated with
conflicts, which in the African context is closely linked to the illicit extraction and trade of minerals
(see also Berman et al., 2017). Gold, tin, tantalum and tungsten have been recognised by section 1502
of Dodd-Frank Wall Street Reform and Consumer Protection Act (Dodd-Frank Act) and by the
European Commission as conflict fuelling minerals requiring special regulatory regimes related to
trade in these elements (European Commission, 2017). Berman et al., (2017) show that exogenous
price increases (e.g. commodity price super cycle) explained up to one fourth of the average level of
violence across African countries during the period 1997–2010. The United Nations Panel of Experts
on Illegal Exploitation of Natural Resources and Other Forms of Wealth of the Democratic Republic of
20
the Congo (UN Security Council, 2002) found that Kampala’s largest gold trading companies,
Machanga Ltd and Uganda Commercial Impex, were buying gold from Ituri-based non-State armed
groups. The United Nations Security Council established a Committee (UN Security Council, resolution
1533, 2004) that imposed sanctions on gold trade with that region under Security Council resolution
1596 (2005). This is because there is documented evidence that gold is often smuggled from the
Democratic Republic of the Congo to Uganda and then exported to the United Arab Emirates
(Reuters, 2019; UN Security Council, 2002), and much of this trade is not reflected in African export
statistics since the Democratic Republic of the Congo has not been reporting trade statistics since
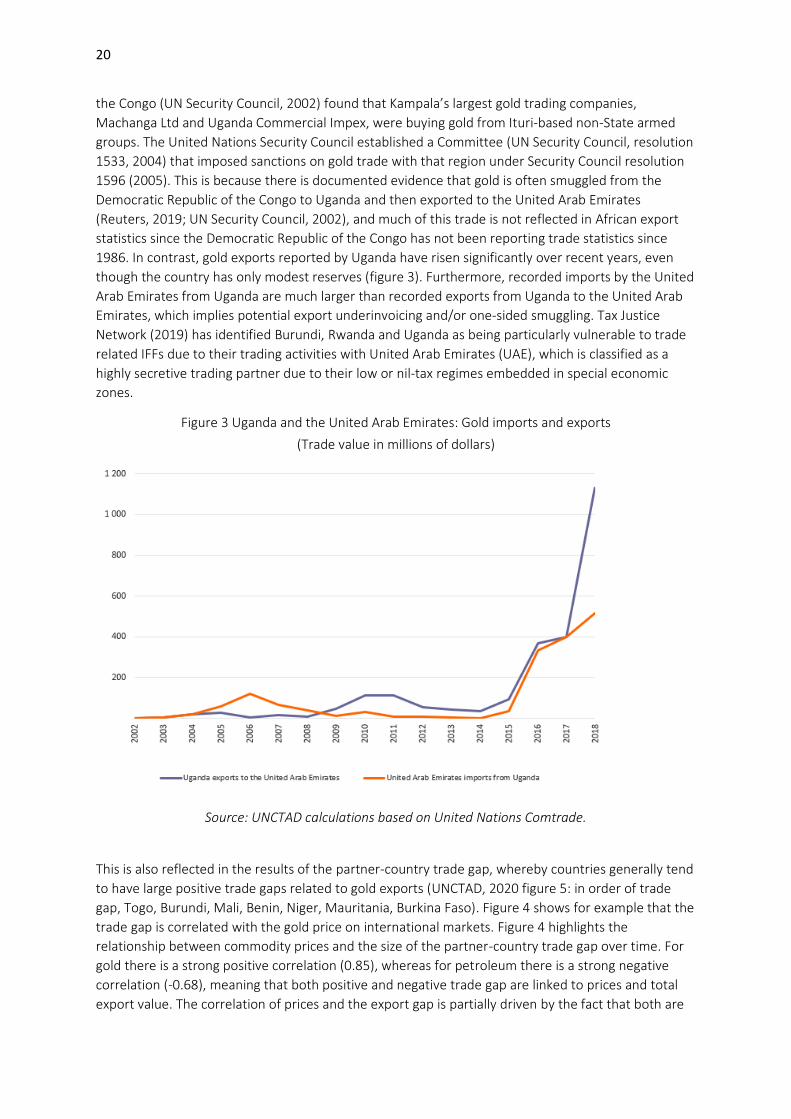
1986. In contrast, gold exports reported by Uganda have risen significantly over recent years, even
though the country has only modest reserves (figure 3). Furthermore, recorded imports by the United
Arab Emirates from Uganda are much larger than recorded exports from Uganda to the United Arab
Emirates, which implies potential export underinvoicing and/or one-sided smuggling. Tax Justice
Network (2019) has identified Burundi, Rwanda and Uganda as being particularly vulnerable to trade
related IFFs due to their trading activities with United Arab Emirates (UAE), which is classified as a
highly secretive trading partner due to their low or nil-tax regimes embedded in special economic
zones.
Figure 3 Uganda and the United Arab Emirates: Gold imports and exports
(Trade value in millions of dollars)
Source: UNCTAD calculations based on United Nations Comtrade.
This is also reflected in the results of the partner-country trade gap, whereby countries generally tend
to have large positive trade gaps related to gold exports (UNCTAD, 2020 figure 5: in order of trade
gap, Togo, Burundi, Mali, Benin, Niger, Mauritania, Burkina Faso). Figure 4 shows for example that the
trade gap is correlated with the gold price on international markets. Figure 4 highlights the
relationship between commodity prices and the size of the partner-country trade gap over time. For
gold there is a strong positive correlation (0.85), whereas for petroleum there is a strong negative
correlation (-0.68), meaning that both positive and negative trade gap are linked to prices and total
export value. The correlation of prices and the export gap is partially driven by the fact that both are
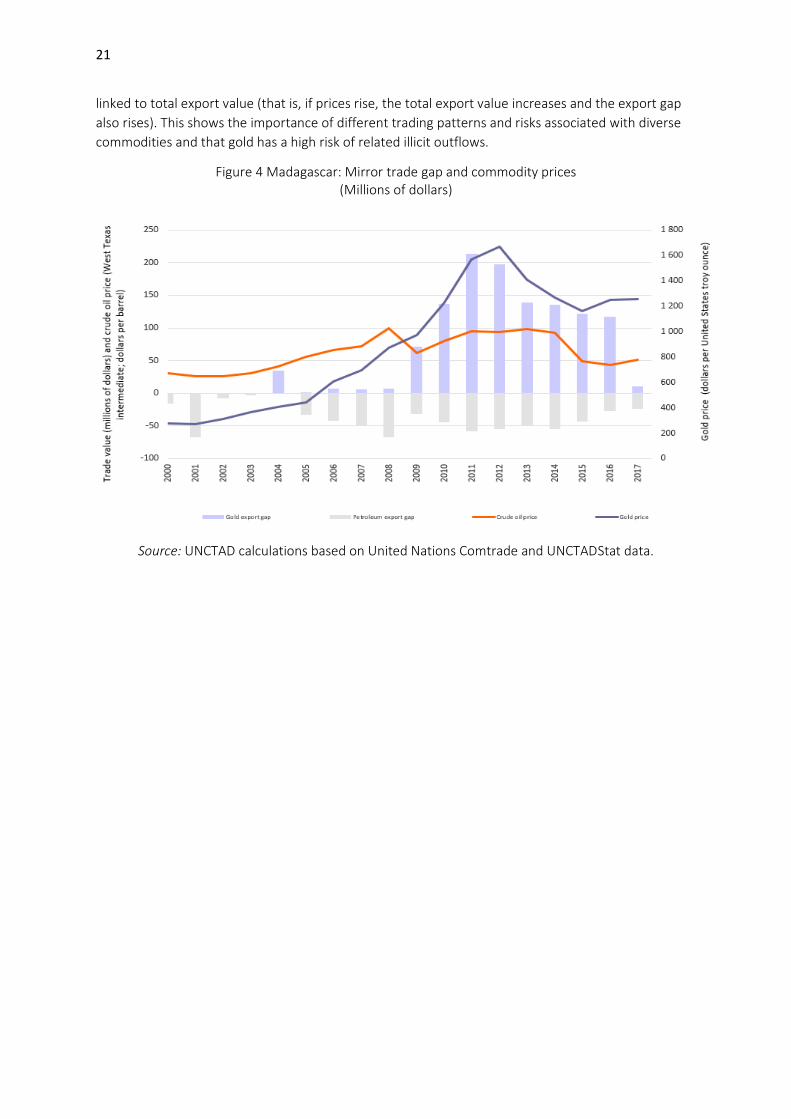
21
linked to total export value (that is, if prices rise, the total export value increases and the export gap
also rises). This shows the importance of different trading patterns and risks associated with diverse
commodities and that gold has a high risk of related illicit outflows.
Figure 4 Madagascar: Mirror trade gap and commodity prices (Millions of dollars)
Source: UNCTAD calculations based on United Nations Comtrade and UNCTADStat data.
22
Box 2 South Africa: Exploring the gold trade gap
Gold exports from South Africa constitute more than half of the overall African trade gap between 2000 - 2018. South Africa is Africa’s largest gold exporter with more than $50 billion worth of Gold exports between 2011 – 2018, which is more than 50 percent of total African gold exports. It is therefore not surprising that South Africa also has the largest absolute gold trade gap of $78 billion which constitutes around 67 percent of the total African gold export gap. The African gold export gap lies at 106 percent of African gold exports, which means that for the period 2011- 2018 gold imports reported by the rest of the world were twice as large as gold exports reported by the continent. This large trade gap is partially linked to differences in trade recording, different rules of origin (RoO) in trade regimes as well as refining activities, which makes it harder to trace the origin of gold. This paper revisits the results from (UNCTAD, 2016a) and takes account of the South African Revenue Authority, as well as, the (EUNOMIX Research, 2016) study in an effort to unify the different findings in a new light. South Africa has a special trade recording regime for Gold.
1) Before 2011 gold was not reported in UN Comtrade, but in the IMF Balance of Payment (BoP) Statistics (see Box 2 figure 1). Therefore, gold exports from and import to South Africa were excluded from the main analysis before 2011 but will be shown in the following figures.
2) Even after 2011 South Africa does not disclose its Gold trading partners, thus partner specific CIF values cannot be estimated and the mean CIF value for gold exports from South Africa of 2.9 percent of export value is used for all gold exports with undisclosed destination (“Areas, nes”).
3) In the UNSD National Compilation and Dissemination Survey, which covers national compilation and dissemination practices of trade data reported in UN Comtrade. The South African Revenue Service reports that it follows a hybrid special strict trade reporting system, which includes warehoused goods for local consumption, but goods imported and exported for processing are excluded from trade statistics (i.e. merchanting).
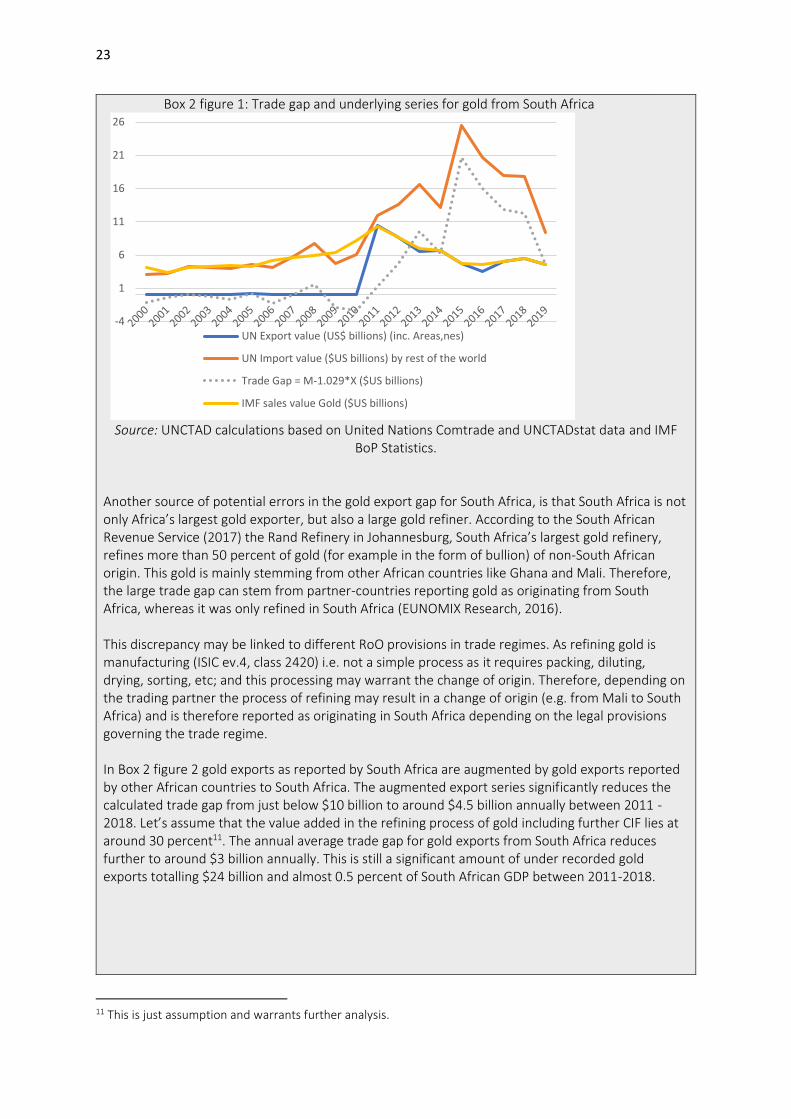
Box 2 figure 1 shows South African gold exports as reported in the IMF BoP Statistics and UN Comtrade, including non-specified destination markets (“Areas, new”). Before 2011 these series are very different but converge from 2011 onwards. Further, Box 2 figure 1 shows gold imports as reported by the rest of the world and the resulting trade gap using 2.9 percent of export value to account for trade valuation. Even when accounting for South Africa’s special trade recording regime a large positive trade gap persists, with an annual average of just below $10 billion between 2011- 2018.
23
Box 2 figure 1: Trade gap and underlying series for gold from South Africa
Source: UNCTAD calculations based on United Nations Comtrade and UNCTADstat data and IMF
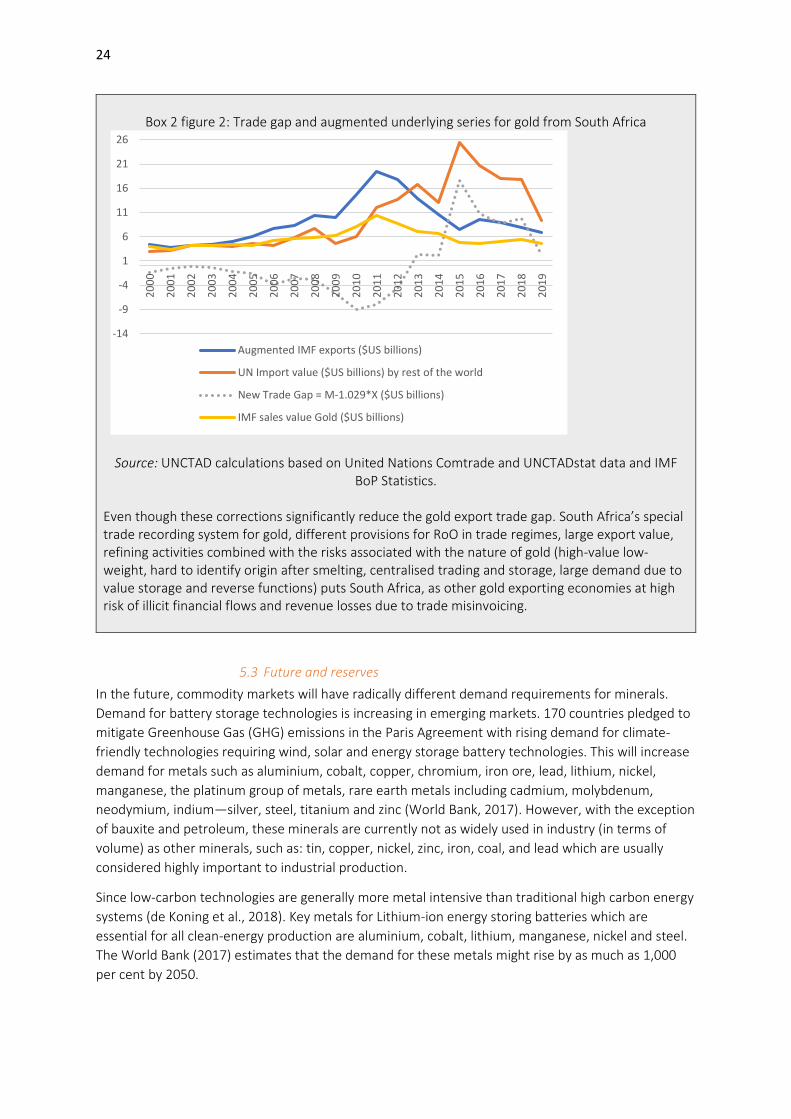
BoP Statistics. Another source of potential errors in the gold export gap for South Africa, is that South Africa is not only Africa’s largest gold exporter, but also a large gold refiner. According to the South African Revenue Service (2017) the Rand Refinery in Johannesburg, South Africa’s largest gold refinery, refines more than 50 percent of gold (for example in the form of bullion) of non-South African origin. This gold is mainly stemming from other African countries like Ghana and Mali. Therefore, the large trade gap can stem from partner-countries reporting gold as originating from South Africa, whereas it was only refined in South Africa (EUNOMIX Research, 2016). This discrepancy may be linked to different RoO provisions in trade regimes. As refining gold is manufacturing (ISIC ev.4, class 2420) i.e. not a simple process as it requires packing, diluting, drying, sorting, etc; and this processing may warrant the change of origin. Therefore, depending on the trading partner the process of refining may result in a change of origin (e.g. from Mali to South Africa) and is therefore reported as originating in South Africa depending on the legal provisions governing the trade regime. In Box 2 figure 2 gold exports as reported by South Africa are augmented by gold exports reported by other African countries to South Africa. The augmented export series significantly reduces the calculated trade gap from just below $10 billion to around $4.5 billion annually between 2011 -2018. Let’s assume that the value added in the refining process of gold including further CIF lies at around 30 percent11. The annual average trade gap for gold exports from South Africa reduces further to around $3 billion annually. This is still a significant amount of under recorded gold exports totalling $24 billion and almost 0.5 percent of South African GDP between 2011-2018.
11 This is just assumption and warrants further analysis.
-4
1
6
11
16
21
26
UN Export value (US$ billions) (inc. Areas,nes)
UN Import value ($US billions) by rest of the world
Trade Gap = M-1.029*X ($US billions)
IMF sales value Gold ($US billions)
24
Box 2 figure 2: Trade gap and augmented underlying series for gold from South Africa
Source: UNCTAD calculations based on United Nations Comtrade and UNCTADstat data and IMF
BoP Statistics.
Even though these corrections significantly reduce the gold export trade gap. South Africa’s special trade recording system for gold, different provisions for RoO in trade regimes, large export value, refining activities combined with the risks associated with the nature of gold (high-value low-weight, hard to identify origin after smelting, centralised trading and storage, large demand due to value storage and reverse functions) puts South Africa, as other gold exporting economies at high risk of illicit financial flows and revenue losses due to trade misinvoicing.
5.3 Future and reserves
In the future, commodity markets will have radically different demand requirements for minerals.
Demand for battery storage technologies is increasing in emerging markets. 170 countries pledged to
mitigate Greenhouse Gas (GHG) emissions in the Paris Agreement with rising demand for climate-
friendly technologies requiring wind, solar and energy storage battery technologies. This will increase
demand for metals such as aluminium, cobalt, copper, chromium, iron ore, lead, lithium, nickel,
manganese, the platinum group of metals, rare earth metals including cadmium, molybdenum,
neodymium, indium—silver, steel, titanium and zinc (World Bank, 2017). However, with the exception
of bauxite and petroleum, these minerals are currently not as widely used in industry (in terms of
volume) as other minerals, such as: tin, copper, nickel, zinc, iron, coal, and lead which are usually
considered highly important to industrial production.
Since low-carbon technologies are generally more metal intensive than traditional high carbon energy
systems (de Koning et al., 2018). Key metals for Lithium-ion energy storing batteries which are
essential for all clean-energy production are aluminium, cobalt, lithium, manganese, nickel and steel.
The World Bank (2017) estimates that the demand for these metals might rise by as much as 1,000
per cent by 2050.
-14
-9
-4
1
6
11
16
21
262
00
0
20
01
20
02
20
03
20
04
20
05
20
06
20
07
20
08
20
09
20
10
20
11
20
12
20
13
20
14
20
15
20
16
20
17
20
18
20
19
Augmented IMF exports ($US billions)
UN Import value ($US billions) by rest of the world
New Trade Gap = M-1.029*X ($US billions)
IMF sales value Gold ($US billions)
25
The US Geological Survey (USGS 2016), which provides publicly available and current information on
commodity production and global reserves, estimates:
• South Africa holds almost 100 per cent of the platinum metal group12 reserves and is already the largest producer of platinum and palladium. Zimbabwe is the third largest producer in the platinum metal group worldwide, however, potential reserves have not been estimated (USGS, 2016);
• South Africa also holds 40 per cent of the world’s chromium and 30 per cent of the global manganese reserves (USGS 2016, 49);
• The Republic of Congo is the world’s largest cobalt producer and is estimated to hold 50 per cent of global reserves, whilst Zambia accounts for around 4 per cent of world reserves (USGS 2016, 52).
• The Democratic Republic of Congo and Zambia each respectively account for around 3 per cent of the world’s estimated copper reserves;
• South Africa accounts for 5 per cent of world nickel reserves and 8 per cent of the world’s titanium reserves. Kenya holds 7 per cent of global titanium reserves, Madagascar 5 per cent, and Mozambique 2 per cent respectively; and
• Guinea accounts for 6.5 per cent of global bauxite production and 26 per cent of global reserves.
These are rough estimates of potential reserves available on the continent, as significant information
gaps impede robust data collection on mineral and metal resources in Africa (World Bank, 2017). For
example, the survey reports no profile for potential contributions from Africa for cadmium,
molybdenum, silver, rare earth metals, and zinc, and relatively small profiles for copper, iron ore, and
lithium. There is no record of production and reserves for rare earth metals for any developing
country besides South Africa, China, Brazil, India, and Malaysia. Another example is that the US
Geological Survey (2016) only lists Zimbabwe as having small lithium reserves, but it is estimated that
the Democratic Republic of Congo holds very large reserves (World Bank, 2017).
Africa’s potential is significant given its large ore reserves in platinum, manganese, bauxite and
chromium. Most continental reserves and production activities lie in the south, except for Guinea
(World Bank, 2017). This probably stems more from survey gaps than the actual absence of those
metals. The continent does have rare earth metals deposits and has been exporting them, but what is
lacking is a comprehensive survey and an estimate of how difficult it would be to translate resources
into reserves (World Bank, 2017). Given the current structure of the global rare earths supply chain
African countries not only need to exploit the mining of extractives but also diversify activities within
the chain to tap nascent manufacturing opportunities and build capacity in downstream processing.
Africa’s production of “hard” minerals requires a greater focus on export competitiveness through
smart trade strategies and the deepening of the financial system to support SMEs.
The scarcity of geological information available for the continent and the arising information
asymmetry between mining companies and governments makes the sector prone to illicit outflows
(see also UNECA, 2017). Indeed, often MNEs have an incentive to mask production data to evade or
avoid taxes, but they also have an incentive to exaggerate reserve estimates in order to attract
investment and raise funds on international capital markets. Further, high-value low-weight
commodities like gold or diamonds are especially prone to smuggling (UNCTAD, 2016a). The risk of
smuggling of rare-earth minerals is increasing with potentially rapidly rising demand.
12 The six platinum-group metals are ruthenium, rhodium, palladium, osmium, iridium, and platinum. They have similar physical and chemical properties and tend to occur together in the same mineral deposits. In Africa, the platinum group metals are mainly produced in Zimbabwe and South Africa.
26
6 Intra-African asymmetries in bilateral trade data
Generally, a positive net export gap can be an indicator of export underinvoicing, which is a channel
through which value leaves the country clandestinely. It is more difficult to link a negative trade gap
to IFFs as this could simply reflect the underreporting of imports by the partner country due to
change of origin or use in special economic zones.
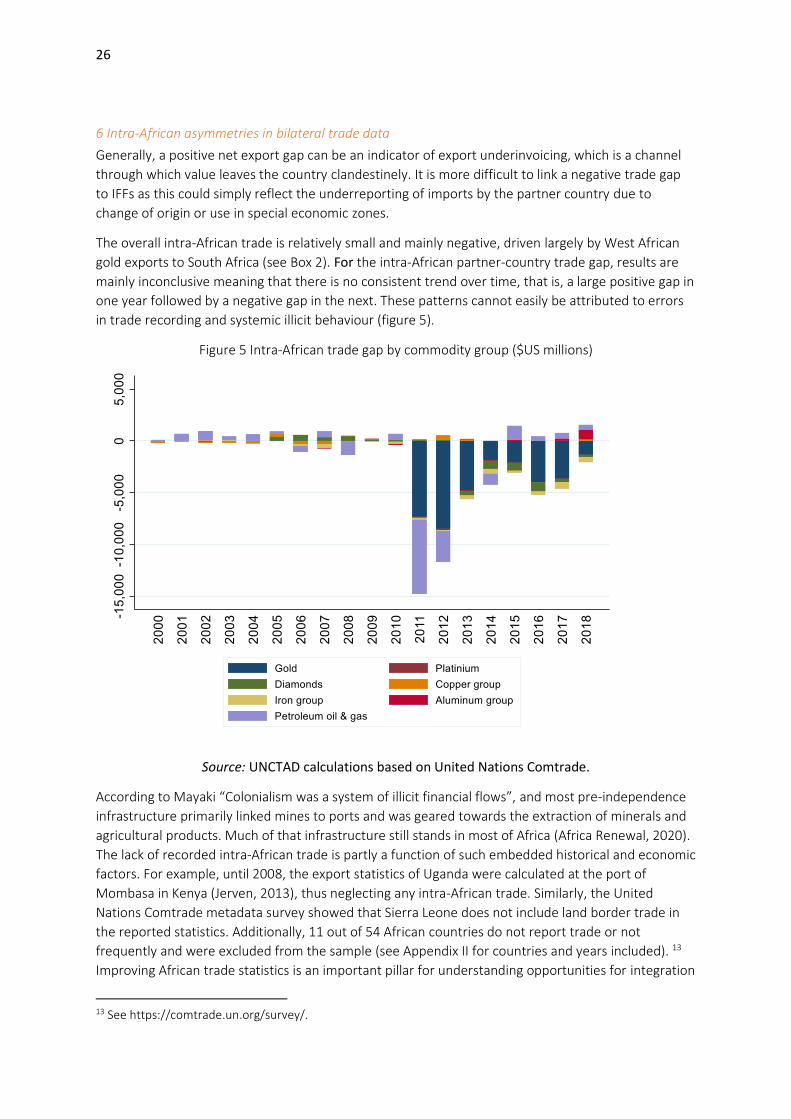
The overall intra-African trade is relatively small and mainly negative, driven largely by West African
gold exports to South Africa (see Box 2). For the intra-African partner-country trade gap, results are
mainly inconclusive meaning that there is no consistent trend over time, that is, a large positive gap in
one year followed by a negative gap in the next. These patterns cannot easily be attributed to errors
in trade recording and systemic illicit behaviour (figure 5).
Figure 5 Intra-African trade gap by commodity group ($US millions)
Source: UNCTAD calculations based on United Nations Comtrade.
According to Mayaki “Colonialism was a system of illicit financial flows”, and most pre-independence
infrastructure primarily linked mines to ports and was geared towards the extraction of minerals and
agricultural products. Much of that infrastructure still stands in most of Africa (Africa Renewal, 2020).
The lack of recorded intra-African trade is partly a function of such embedded historical and economic
factors. For example, until 2008, the export statistics of Uganda were calculated at the port of
Mombasa in Kenya (Jerven, 2013), thus neglecting any intra-African trade. Similarly, the United
Nations Comtrade metadata survey showed that Sierra Leone does not include land border trade in
the reported statistics. Additionally, 11 out of 54 African countries do not report trade or not
frequently and were excluded from the sample (see Appendix II for countries and years included). 13
Improving African trade statistics is an important pillar for understanding opportunities for integration
13 See https://comtrade.un.org/survey/.
27
under the AfCFTA and for creating transparency along commodity value chains to allow for more
domestic resources for the financing of the SDGs.
Another hurdle for the use of the mirror trade gap on intra-African statistics is informal trade.
Informal cross-border trade is sizeable and important for many African economies. For some borders
and specific products, informal trade might be as high as formal trade. For example, a recent survey
concluded that the number of products being exported from Benin to Nigeria was five times greater
than official records showed (Bensassi et al., 2016). Informal cross-border trade means that data at
land borders is not collected rigorously, which in turn may limit the usefulness of the partner-country
trade gap analysis for the inference of IFFs linked to intra-African trade. A systematic approach to
assessing informal cross-border trade and its formalization will be necessary to identify growth
potential and risks associated with intra-African trade. Informal cross-border trade should not be
equated with IFFs, but illicit cross-border trade may use the same routes as other informal cross-
border trade. However, the partner-country trade gap method can also be used to identify issues with
trade recording and customs inefficiencies. For example, if all trade partners report importing a
specific commodity at a higher value than a country’s own export statistics, this might be an
indication of significant informal (possibly illicit) cross-border activities or smuggling.
7 Concluding remarks
The magnitude of export misinvoicing in Africa is based on a range of estimates and varies from $30 billion to $52 billion per annum. The mirror trade gap cannot capture the origin of IFFs but reflects a channel through which funds leave a country. Even when trade misinvoicing can be clearly recognized, it does not facilitate the identification of the underlying crime (for a critique of the method, see (Forstarter, 2017). Fraudulent trade invoices may be motivated by the circumvention of capital controls, tax evasion, laundering proceeds of crime, bribery or the financing of terrorism. However, the method can identify industries with a high risk of trade related IFFs or at least alert government officials to areas in which trade is not being properly recorded as a good first line of defence, as it is based on publicly available data.
For some African countries, Illicit trade in extractive resources has an unquantifiable multiplier effect
because it undermines peace and security, which can confine an economy in a “conflict trap” stalling
development for decades (Collier, 2007). Estimates should therefore be taken as a lower bound of the
actual cost. Both the United States under Section 1502 of the Dodd-Frank Wall Street Reform and the
European Union under the Conflict Mineral Regulation (which will take effect in January 2021) have
identified, classified and regulated the trade in minerals which are most often linked to armed-
conflicts and human rights abuses. Being cognisant of these interlinkages, IFFs are grouped under SDG
16 on peace, justice and strong institutions.
The scarcity of available geological information in Africa and the resulting information asymmetry between mining companies that have the means to acquire private information about reserves and governments makes the extractive sector particularly prone to illicit outflows (UNECA, 2017). There are only rough estimates of potential reserves available on the continent, as significant information gaps impede robust data collection on mineral and metal resources in Africa (World Bank, 2017).
As noted for gold, high-value commodities are especially prone to trade related illicit outflows. With rapidly rising demand for metals for the use in battery-storage technologies, the risk of IFFS linked of the export of rare earth minerals is increasing and improving their governance should be a policy
28
priority for well-endowed countries. Comprehensive geological surveys will allow African countries to use their monopoly power in contract negotiation and could be levelized in international financial markets.
There is uncertainty about the quality of African trade statistics, especially for intra-African trade. The United Nations Comtrade metadata survey, which could shed light on what is covered in international trade statistics, lacks a comprehensive and consistent database. The frequency of reporting and quality of trade data is linked to institutional capacity and so is the probability of trade-related illicit financial outflows; thus, there is a downward bias in the estimates, since countries that have the highest probability of incurring trade misinvoicing also have the highest probability of low-quality trade reporting since both a correlated with institutional quality. For example, the estimate in this paper excludes 11 countries from the sample due to non-reporting or too many missing years (only countries with at least 10 observations between 2000 and 2018 are included).
Informal cross-border trade is estimated to be as large as officially recorded trade for some country borders and specific products in Africa (Morrissey et al., 2015).This renders the partner-country trade gap method less significant for the detection of systemic trade misinvoicing for intra-African trade as, it captures both illicit and informal trade. Nonetheless, the method adds value to the analysis of intra-African trade patterns because it helps identify gaps in trade recording and, together with production or resource endowments information, could be used to identify potential rules of origin violations.
These limitations bring to light the necessity of a triangulated approach to identify IFFs, including information on other criminal activities that generate cross-border financial flows and evasive intrafirm trading that can drain countries’ financial resources without the necessity of fraudulent invoices, to generate a comprehensive picture of the scale of IFFs. Even if trade misinvoicing can be clearly identified, customs fraud will only be captured by the mirror trade gap if smuggling or misinvoicing is only one sided. However, if trade partners at both ends of the transaction collude, the trade value reported in both countries will be equal. Other non-commercial pathways of IFFs are opaque and it is thus more difficult to quantify their magnitude based on official statistics.
One way of circumventing the issue linked to data quality is the use of the price-filter analysis on
individual customs transactions. The price-filter analysis transaction-level microdata and estimates the
price range of a specific commodity over time to distinguish between normal and abnormal pricing
(Carbonnier and Mehrotra, 2018; Ahene-Codjoe and Alu, 2019). The analysis either relies on the
distribution of prices over time and its outliers (interquartile range price filter) or the comparison of
transaction-level prices to free market prices (“arm’s length price filter”). For example, Ahene-Codjoe
and Alu (2019) find evidence of a significant and abnormal undervaluation of commodity exports from
Ghana. Using contemporaneous market reference prices and interquartile-range price filter methods,
the authors find that abnormally undervalued export of gold (gold bullion and unwrought gold) equalled
$3.8 billion or 11 per cent of the total export value ($35.6 billion) of gold between 2011 and 2017.
The Swiss research centre on “Curbing Illicit Financial Flows from Resource-rich Developing countries”,
as well as, Global Financial Integrity with their GFTrade tool have successfully developed methodologies
for the detection of IFFs via the price-filter method. UNCTAD has the Automated System for Customs
Data (ASYCUDA) programme which is a computerized customs management system, which is used by
most African countries. The ASYCUDA programme has developed Mineral Output Statistical Evaluation
System (MOSES), which is geared towards tracking the export of natural resources along their value
chain. MOSES successfully tracked and monitored 755,000 Metric tons of copper exported from Zambia
in 2018 (UNCTAD, 2019). This creates a unique opportunity for African countries in cooperation with
UNCTAD to use the methodology that has already been developed and the software that is already in
place to apply the price-filter analysis for the detect IFFs.
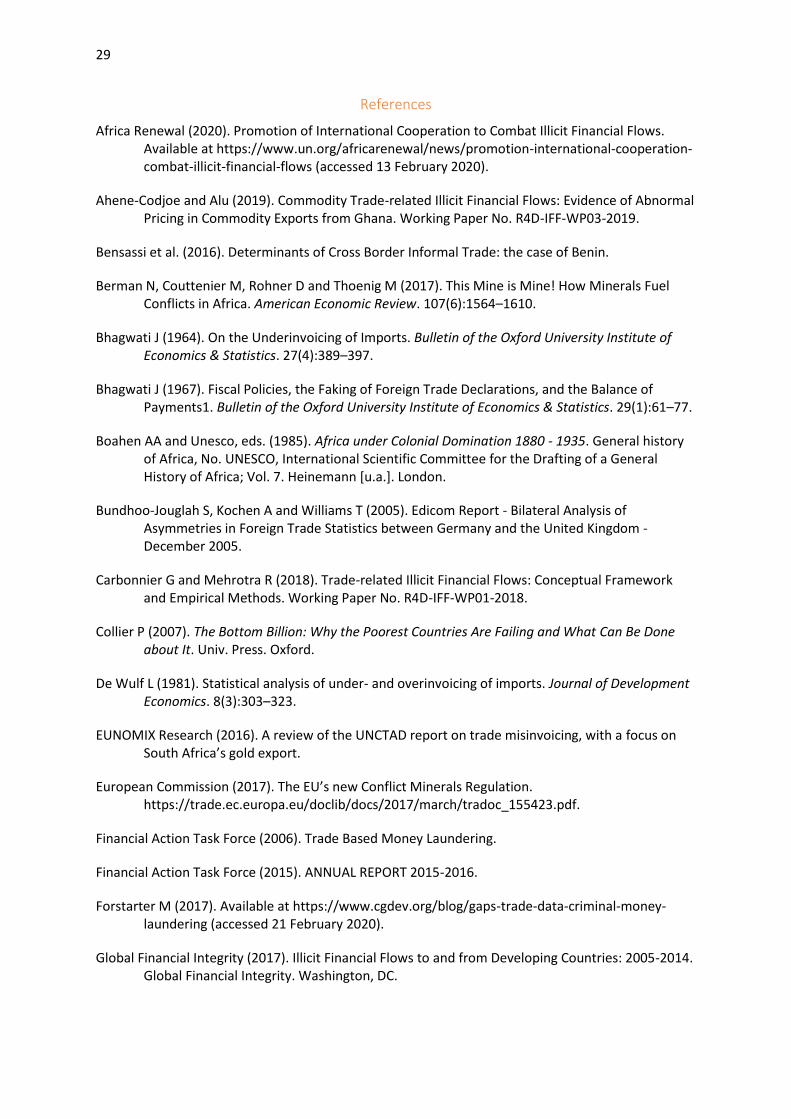
29
References
Africa Renewal (2020). Promotion of International Cooperation to Combat Illicit Financial Flows. Available at https://www.un.org/africarenewal/news/promotion-international-cooperation-combat-illicit-financial-flows (accessed 13 February 2020).
Ahene-Codjoe and Alu (2019). Commodity Trade-related Illicit Financial Flows: Evidence of Abnormal Pricing in Commodity Exports from Ghana. Working Paper No. R4D-IFF-WP03-2019.
Bensassi et al. (2016). Determinants of Cross Border Informal Trade: the case of Benin.
Berman N, Couttenier M, Rohner D and Thoenig M (2017). This Mine is Mine! How Minerals Fuel Conflicts in Africa. American Economic Review. 107(6):1564–1610.
Bhagwati J (1964). On the Underinvoicing of Imports. Bulletin of the Oxford University Institute of Economics & Statistics. 27(4):389–397.
Bhagwati J (1967). Fiscal Policies, the Faking of Foreign Trade Declarations, and the Balance of Payments1. Bulletin of the Oxford University Institute of Economics & Statistics. 29(1):61–77.
Boahen AA and Unesco, eds. (1985). Africa under Colonial Domination 1880 - 1935. General history of Africa, No. UNESCO, International Scientific Committee for the Drafting of a General History of Africa; Vol. 7. Heinemann [u.a.]. London.
Bundhoo-Jouglah S, Kochen A and Williams T (2005). Edicom Report - Bilateral Analysis of Asymmetries in Foreign Trade Statistics between Germany and the United Kingdom - December 2005.
Carbonnier G and Mehrotra R (2018). Trade-related Illicit Financial Flows: Conceptual Framework and Empirical Methods. Working Paper No. R4D-IFF-WP01-2018.
Collier P (2007). The Bottom Billion: Why the Poorest Countries Are Failing and What Can Be Done about It. Univ. Press. Oxford.
De Wulf L (1981). Statistical analysis of under- and overinvoicing of imports. Journal of Development Economics. 8(3):303–323.
EUNOMIX Research (2016). A review of the UNCTAD report on trade misinvoicing, with a focus on South Africa’s gold export.
European Commission (2017). The EU’s new Conflict Minerals Regulation. https://trade.ec.europa.eu/doclib/docs/2017/march/tradoc_155423.pdf.
Financial Action Task Force (2006). Trade Based Money Laundering.
Financial Action Task Force (2015). ANNUAL REPORT 2015-2016.
Forstarter M (2017). Available at https://www.cgdev.org/blog/gaps-trade-data-criminal-money-laundering (accessed 21 February 2020).
Global Financial Integrity (2017). Illicit Financial Flows to and from Developing Countries: 2005-2014. Global Financial Integrity. Washington, DC.
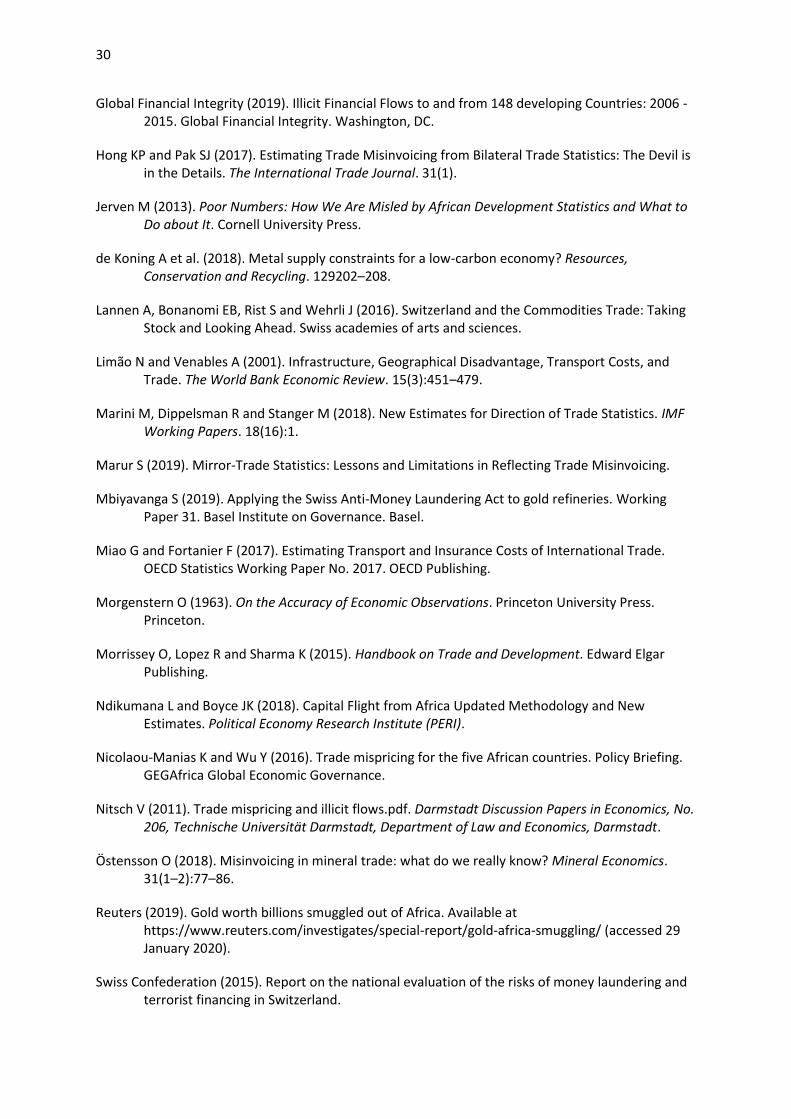
30
Global Financial Integrity (2019). Illicit Financial Flows to and from 148 developing Countries: 2006 -2015. Global Financial Integrity. Washington, DC.
Hong KP and Pak SJ (2017). Estimating Trade Misinvoicing from Bilateral Trade Statistics: The Devil is in the Details. The International Trade Journal. 31(1).
Jerven M (2013). Poor Numbers: How We Are Misled by African Development Statistics and What to Do about It. Cornell University Press.
de Koning A et al. (2018). Metal supply constraints for a low-carbon economy? Resources, Conservation and Recycling. 129202–208.
Lannen A, Bonanomi EB, Rist S and Wehrli J (2016). Switzerland and the Commodities Trade: Taking Stock and Looking Ahead. Swiss academies of arts and sciences.
Limão N and Venables A (2001). Infrastructure, Geographical Disadvantage, Transport Costs, and Trade. The World Bank Economic Review. 15(3):451–479.
Marini M, Dippelsman R and Stanger M (2018). New Estimates for Direction of Trade Statistics. IMF Working Papers. 18(16):1.
Marur S (2019). Mirror-Trade Statistics: Lessons and Limitations in Reflecting Trade Misinvoicing.
Mbiyavanga S (2019). Applying the Swiss Anti-Money Laundering Act to gold refineries. Working Paper 31. Basel Institute on Governance. Basel.
Miao G and Fortanier F (2017). Estimating Transport and Insurance Costs of International Trade. OECD Statistics Working Paper No. 2017. OECD Publishing.
Morgenstern O (1963). On the Accuracy of Economic Observations. Princeton University Press. Princeton.
Morrissey O, Lopez R and Sharma K (2015). Handbook on Trade and Development. Edward Elgar Publishing.
Ndikumana L and Boyce JK (2018). Capital Flight from Africa Updated Methodology and New Estimates. Political Economy Research Institute (PERI).
Nicolaou-Manias K and Wu Y (2016). Trade mispricing for the five African countries. Policy Briefing. GEGAfrica Global Economic Governance.
Nitsch V (2011). Trade mispricing and illicit flows.pdf. Darmstadt Discussion Papers in Economics, No. 206, Technische Universität Darmstadt, Department of Law and Economics, Darmstadt.
Östensson O (2018). Misinvoicing in mineral trade: what do we really know? Mineral Economics. 31(1–2):77–86.
Reuters (2019). Gold worth billions smuggled out of Africa. Available at https://www.reuters.com/investigates/special-report/gold-africa-smuggling/ (accessed 29 January 2020).
Swiss Confederation (2015). Report on the national evaluation of the risks of money laundering and terrorist financing in Switzerland.
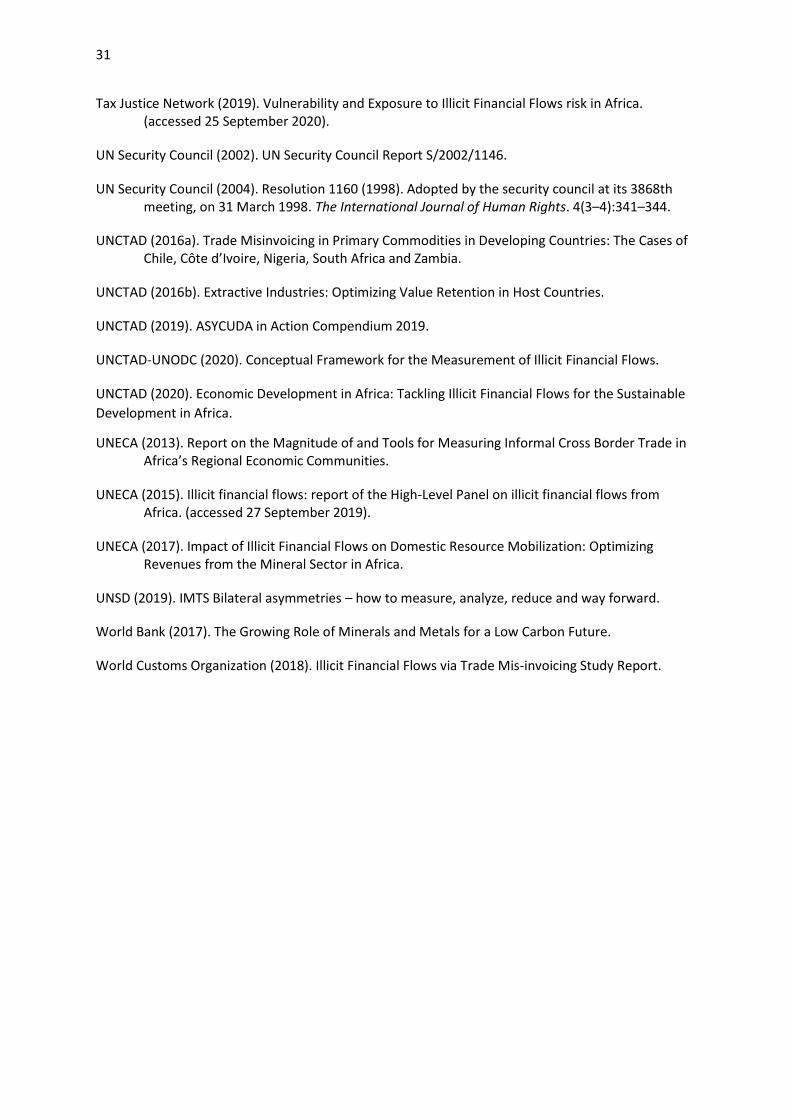
31
Tax Justice Network (2019). Vulnerability and Exposure to Illicit Financial Flows risk in Africa. (accessed 25 September 2020).
UN Security Council (2002). UN Security Council Report S/2002/1146.
UN Security Council (2004). Resolution 1160 (1998). Adopted by the security council at its 3868th meeting, on 31 March 1998. The International Journal of Human Rights. 4(3–4):341–344.
UNCTAD (2016a). Trade Misinvoicing in Primary Commodities in Developing Countries: The Cases of Chile, Côte d’Ivoire, Nigeria, South Africa and Zambia.
UNCTAD (2016b). Extractive Industries: Optimizing Value Retention in Host Countries.
UNCTAD (2019). ASYCUDA in Action Compendium 2019.
UNCTAD-UNODC (2020). Conceptual Framework for the Measurement of Illicit Financial Flows.
UNCTAD (2020). Economic Development in Africa: Tackling Illicit Financial Flows for the Sustainable
Development in Africa.
UNECA (2013). Report on the Magnitude of and Tools for Measuring Informal Cross Border Trade in Africa’s Regional Economic Communities.
UNECA (2015). Illicit financial flows: report of the High-Level Panel on illicit financial flows from Africa. (accessed 27 September 2019).
UNECA (2017). Impact of Illicit Financial Flows on Domestic Resource Mobilization: Optimizing Revenues from the Mineral Sector in Africa.
UNSD (2019). IMTS Bilateral asymmetries – how to measure, analyze, reduce and way forward.
World Bank (2017). The Growing Role of Minerals and Metals for a Low Carbon Future.
World Customs Organization (2018). Illicit Financial Flows via Trade Mis-invoicing Study Report.
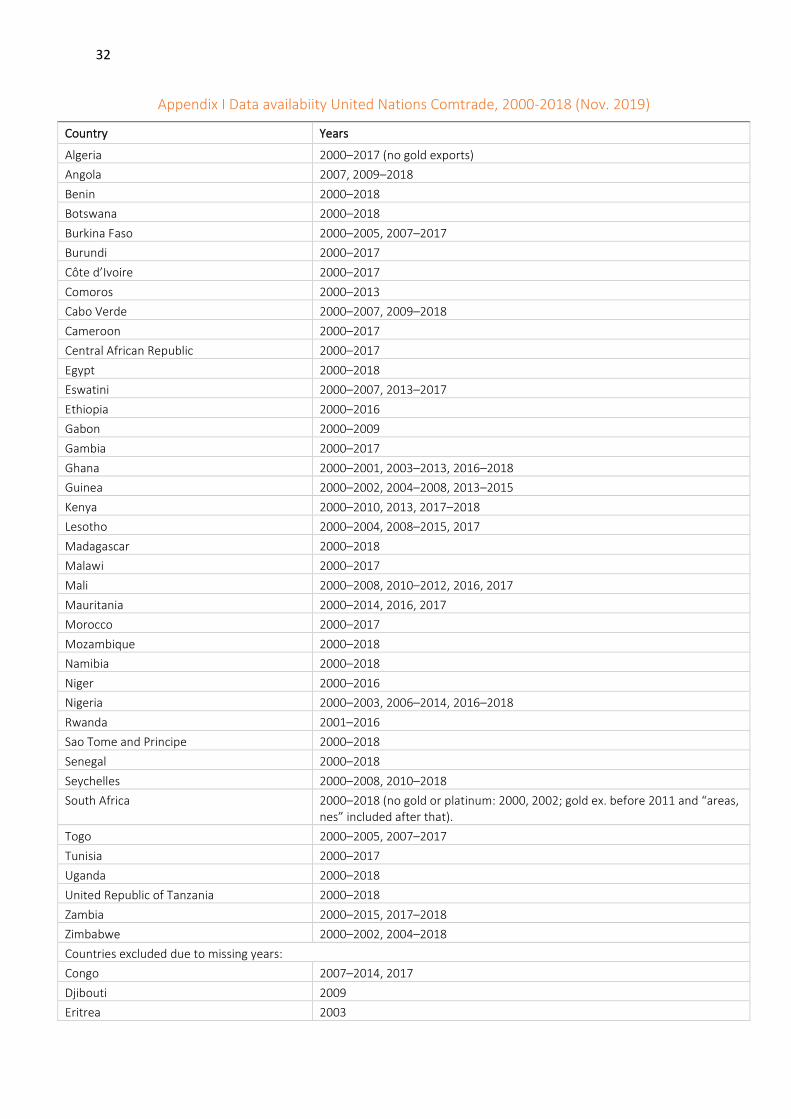
32
Appendix I Data availabiity United Nations Comtrade, 2000-2018 (Nov. 2019)
Country Years
Algeria 2000–2017 (no gold exports)
Angola 2007, 2009–2018
Benin 2000–2018
Botswana 2000–2018
Burkina Faso 2000–2005, 2007–2017
Burundi 2000–2017
Côte d’Ivoire 2000–2017
Comoros 2000–2013
Cabo Verde 2000–2007, 2009–2018
Cameroon 2000–2017
Central African Republic 2000–2017
Egypt 2000–2018
Eswatini 2000–2007, 2013–2017
Ethiopia 2000–2016
Gabon 2000–2009
Gambia 2000–2017
Ghana 2000–2001, 2003–2013, 2016–2018
Guinea 2000–2002, 2004–2008, 2013–2015
Kenya 2000–2010, 2013, 2017–2018
Lesotho 2000–2004, 2008–2015, 2017
Madagascar 2000–2018
Malawi 2000–2017
Mali 2000–2008, 2010–2012, 2016, 2017
Mauritania 2000–2014, 2016, 2017
Morocco 2000–2017
Mozambique 2000–2018
Namibia 2000–2018
Niger 2000–2016
Nigeria 2000–2003, 2006–2014, 2016–2018
Rwanda 2001–2016
Sao Tome and Principe 2000–2018
Senegal 2000–2018
Seychelles 2000–2008, 2010–2018
South Africa 2000–2018 (no gold or platinum: 2000, 2002; gold ex. before 2011 and “areas, nes” included after that).
Togo 2000–2005, 2007–2017
Tunisia 2000–2017
Uganda 2000–2018
United Republic of Tanzania 2000–2018
Zambia 2000–2015, 2017–2018
Zimbabwe 2000–2002, 2004–2018
Countries excluded due to missing years:
Congo 2007–2014, 2017
Djibouti 2009
Eritrea 2003
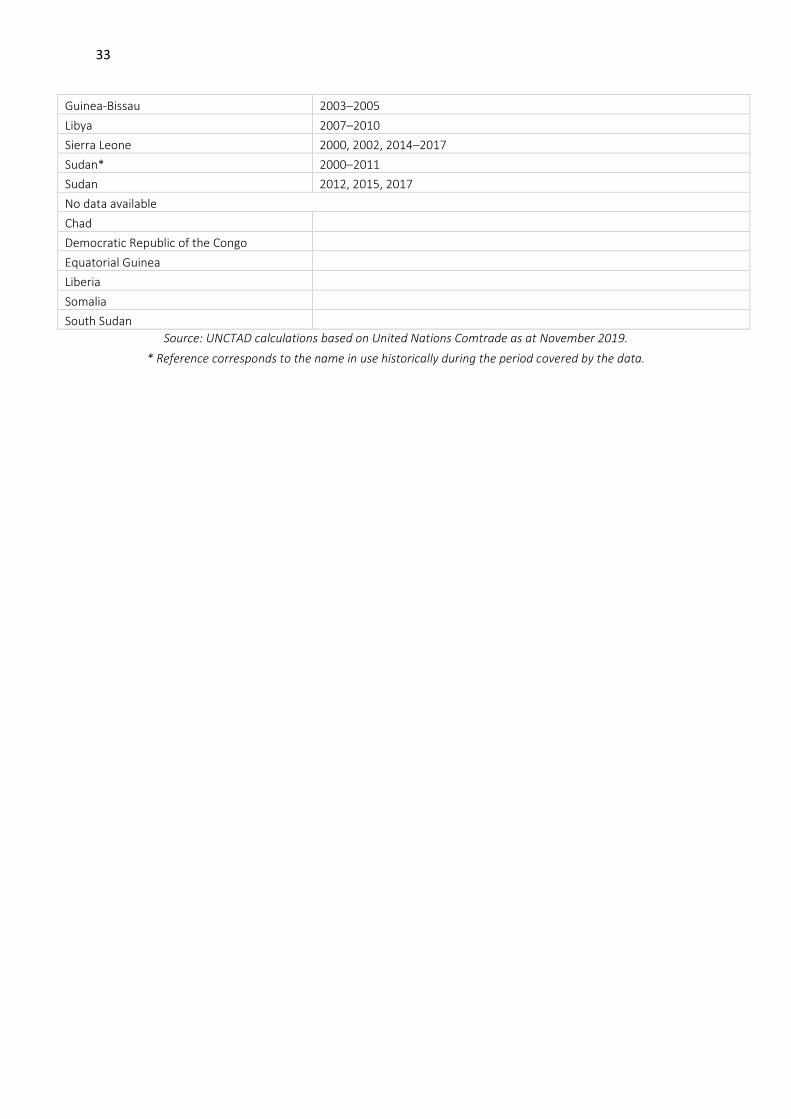
33
Guinea-Bissau 2003–2005
Libya 2007–2010
Sierra Leone 2000, 2002, 2014–2017
Sudan* 2000–2011
Sudan 2012, 2015, 2017
No data available
Chad
Democratic Republic of the Congo
Equatorial Guinea
Liberia
Somalia
South Sudan
Source: UNCTAD calculations based on United Nations Comtrade as at November 2019.
* Reference corresponds to the name in use historically during the period covered by the data.
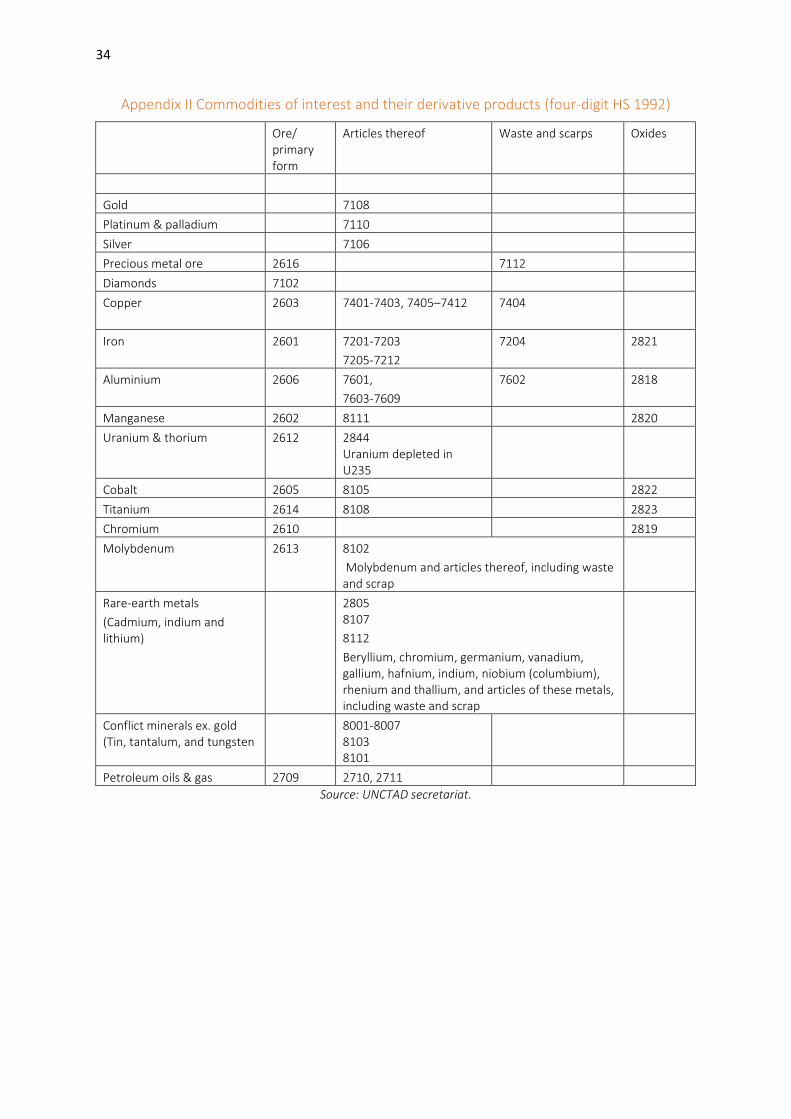
34
Appendix II Commodities of interest and their derivative products (four-digit HS 1992)
Ore/ primary form
Articles thereof Waste and scarps Oxides
Gold 7108
Platinum & palladium 7110
Silver 7106
Precious metal ore 2616 7112
Diamonds 7102
Copper 2603 7401-7403, 7405–7412 7404
Iron 2601 7201-7203
7205-7212
7204 2821
Aluminium 2606 7601,
7603-7609
7602 2818
Manganese 2602 8111 2820
Uranium & thorium 2612 2844 Uranium depleted in U235
Cobalt 2605 8105 2822
Titanium 2614 8108 2823
Chromium 2610 2819
Molybdenum 2613 8102
Molybdenum and articles thereof, including waste and scrap
Rare-earth metals
(Cadmium, indium and lithium)
2805 8107
8112
Beryllium, chromium, germanium, vanadium, gallium, hafnium, indium, niobium (columbium), rhenium and thallium, and articles of these metals, including waste and scrap
Conflict minerals ex. gold (Tin, tantalum, and tungsten
8001-8007 8103 8101
Petroleum oils & gas 2709 2710, 2711
Source: UNCTAD secretariat.