Office of the Director - Arkansas Department of Human Services
277
-
Upload
khangminh22 -
Category
Documents
-
view
1 -
download
0
Transcript of Office of the Director - Arkansas Department of Human Services


www.arkansas.gov/dhs
Serving more than one million Arkansans each year
Office of the Director
P.O. Box 1437, Slot S-201 · Little Rock, AR 72203-1437 501-682-8650 · Fax: 501-682-6836 · TDD: 501-682-8933
MEMORANDUM
TO: Governor Mike Beebe
FROM: John Selig, Director Department of Human Services
DATE: December 10, 2010
SUBJ: SFY 2010 DHS STATISTICAL REPORT
In compliance with Act 414, Section 24 of 1961, we are pleased to submit the annual Arkansas Department of Human Services Statistical Report. Additionally, we are proud to present this report on the DHS main web site at http://www.arkansas.gov/dhs/NewDHS/DHSAnnualStats.html . This report is a comprehensive statistical analysis of the Department's social programs and services that were provided to the citizens of Arkansas for state fiscal year 2010.
JS:pl


●
○
○
○
○
○
○
●
○
○
○
○
○
○
○
● Division of Child Care and Early Childhood Education (DCC&ECE)
○
○
○
○
○
○
●
○
○
○
○
○
○
○
○
●
○
○
○
○
○
○
○
○
○
○
○
○
Supplemantal Nutrition Assistance Program (SNAP)-------------------------------------------------------------------------------------------------
ARKANSAS DHS STATISTICAL REPORT
TABLE OF CONTENTS
Adult Protective Services Referrals by County---------------------------------------------------------------------------------
Adult Protective Services Referrals by County-State Map---------------------------------------------------------------------------------
Transitional Services-------------------------------------------------------------------------
Intensive Family Services--------------------------------------------------------------------------------
DBHS-24
Substance Abuse Treatment By Provider---------------------------------------------------------------------------DBHS-29
Division of County Operations (DCO)
SFY 2010
Services Provided-------------------------------------------------------------------------------------------
Adoption Services-------------------------------------------------------------------------------------------
Independent Living Program-----------------------------------------------------------------------------
Introduction----------------------------------------------------------------------------------------------------
The Administrative Aging Network--------------------------------------------------------------------
Services--------------------------------------------------------------------------------------------------------
Emergency Shelter Grants Program-----------------------------------------------------------------
DBHS-04
DBHS-15
DBHS-20
Adult Protective Services--------------------------------------------------------------------------------
Medicaid--------------------------------------------------------------------------------------------------------
Child Care Assistance Programs---------------------------------------------------------------
Program Support--------------------------------------------------------------------------------------
Special Nutrition Programs------------------------------------------------------------------------
Child Care Licensing and Accreditation---------------------------------------------------------------------------------
Mental Health Clients By Provider-----------------------------------------------------------------------------------
Substance Abuse Treatment Unduplicated Clients---------------------------------------------------------------------------
Introduction----------------------------------------------------------------------------------------------
Actual Expenditures For Child Care Services----------------------------------------------
Introduction----------------------------------------------------------------------------------------------------
DBHS Unduplicated Clients----------------------------------------------------------------------------
Arkansas State Hospital (ASH)------------------------------------------------------------------------
Mental Health Clients Unduplicated Children---------------------------------------------------------------------------
Introduction----------------------------------------------------------------------------------------------------
Child Maltreatment Assessment Services---------------------------------------------------------
Foster Care Services--------------------------------------------------------------------------------------
DBHS-11
DCCECE-01
DCCECE-02
DCCECE-03
Division of Aging and Adult Services (DAAS)
Division of Behavioral Health Services (DBHS)
DCFS-01
DCFS-03
DCO-35
DCO-36
DCO-37
DCO-38
DCO-39
DAAS-01
DAAS-01
DAAS-02
DAAS-05
DAAS-06
DAAS-07
DBHS-01
DCFS-13
DCFS-29
DCFS-31
DCO-01
DCO-03
DCO-04
DCO-16
DCO-21
DCO-39
Commodity Distribution-----------------------------------------------------------------------------------
The Community Services Block Grant Program-------------------------------------------------
Home Energy Assistance Program------------------------------------------------------------
Weatherization Assistance Program----------------------------------------------------------------
Shelter Plus Care Program------------------------------------------------------------------------------
DCCECE-05
Work Pays --------------------------------------------------------------------------------------------DCO-11
DCFS-35
DCFS-36
DCFS-37
Division of Children and Family Services (DCFS)
DCCECE-14
DCCECE-20
Introduction----------------------------------------------------------------------------------------------------
Division of County Operation Expenditures--------------------------------------------------------
Transitional Employment Assistance (TEA)------------------------------------------------------

●
○
○
○
○
○
○
○
○
○
●
○
○
○
○
●
○
○
○
○
○
○
○
○
○
○
○
○
●
○
○
○
○
●
○
○
○
○
○
○
○
○
○
○
●
(CONTINUED)
SFY 2010
Arkansas Volunteer Centers----------------------------------------------------------------------------
Children's Services ----------------------------------------------------------------------------------
DSB-05
DOV-01
Glossary-01
DYS-01
Quality Assurance ---------------------------------------------------------------------------------------
The Economic Impact of Arkansas Volunteers--------------------------------------------------
Arkansas’ Promise-----------------------------------------------------------------------------------------
DOV-01
DOV-01
Glossary-------------------------------------------------------------------------------------------------------
Introduction----------------------------------------------------------------------------------------------------
Goals and Services-----------------------------------------------------------------------------------------
The Summit--------------------------------------------------------------------------------------------
Arkansas Service Commission------------------------------------------------------------------------
Arkansas Mentors Program-----------------------------------------------------------------------------
Recognition Services Statistics------------------------------------------------------------------------
Juvenile Justice and Delinquency Prevention (Title II Grants)-------------------------------
Arkansas Community Service Award Winners-----------------------------------------------------------------------------
State and Federal Parks Volunteer Program-----------------------------------------------
Director's Office----------------------------------------------------------------------------------------------
Division of Youth Services (DYS)
DYS-03
DOV-05
Human Developmental Center (HDC)----------------------------------------------------------------
Funding (SFY 2000 - 2010)------------------------------------------------------------------------------
Outreach Activities------------------------------------------------------------------------------------
DYS-21
DYS-23
DDS-01
Long Term Care---------------------------------------------------------------------------------------------
Introduction----------------------------------------------------------------------------------------------------
Field Services------------------------------------------------------------------------------------------------
Business and Technology Services------------------------------------------------------------------
Division of Services for the Blind (DSB)
DSB-01
DSB-03
DSB-04
DMS-21
Act 648 of 1993----------------------------------------------------------------------------------------------
Introduction----------------------------------------------------------------------------------------------------
DMS Expenditures------------------------------------------------------------------------------------------
Medicaid Services------------------------------------------------------------------------------------------
Division of Medical Services (DMS)
DMS-01
DMS-02
DMS-03
Waiver Services ----------------------------------------------------------------------------------------
Community Program Statistics------------------------------------------------------------------------
DOV-01
DDS-02
Division of Developmental Disabilities Services (DDS)
Introduction----------------------------------------------------------------------------------------------------
DDS-16
Community-Based Youth Services Programs----------------------------------------------------
Interstate Compact on Juveniles-----------------------------------------------------------------------
DDS-18
DDS-04
DDS-07
DDS-09
DDS-13
DDS-14
ARKANSAS DHS STATISTICAL REPORT
Training & Technical Assistance Provided---------------------------------------------------------
TABLE OF CONTENTS
Introduction----------------------------------------------------------------------------------------------------
Providers and Contractors-----------------------------------------------------------------------
Commitments to Youth Services Centers----------------------------------------------------------
Recommitments to Youth Services Centers------------------------------------------------------
Juveniles Referred to Alternate Placement Facilities------------------------------------------
Juvenile Justice and Delinquency Prevention (Title V Grants)------------------------------
Programs-----------------------------------------------------------------------------------------------
DOV-05
Division of Volunteerism (DOV)
DOV-02
DOV-02
DOV-04
DOV-04
DOV-01
DYS-03
DYS-04
DYS-05
DYS-06
DYS-19
DYS-20
DOV-02


Recommends policy, develops regulations to implement the Older Americans Act (OAA) and administers the OAA budget,
grants for research, training, model projects, etc.
The Division’s mission is to promote the health, safety and independence of older Arkansans and adults with physical
disabilities by working toward two primary goals: (1) to provide administrative support services for aging Arkansans and adults
with physical disabilities; and (2) to enhance the quality of life for aging Arkansans and adults with physical disabilities. The
Division is responsible for planning coordinating, funding, and evaluating programs for older adults and adults with physical
disabilities that are authorized by both state and federal governments.
DEPARTMENT OF HUMAN SERVICES
ADMINISTRATION ON AGING
The federal organization that makes the Older Americans Act a reality is the Administration on Aging (AoA). AoA is directly
under the U.S. Department of Health and Human Services (HHS). The administrative network reaches through the 10 regional
offices of HHS to the 56 State Units on Aging (SUAs) and some 655 Area Agencies on Aging (AAAs).
PRESIDENCY
Source: DAAS Website and Division of Aging and Adult Services
(655 Agencies)
Develop and implement the area plans on aging, serve as advocates for older people, coordinate with other agencies and
organizations in the planning and service areas to develop comprehensive aging service systems, and administer the Older
Americans Act programs within their jurisdictions.
Provide technical assistance to states and monitor state aging programs.
REGIONAL OFFICES ON AGING
AREA AGENCIES ON AGING
STATE UNITS ON AGING
(56 Jurisdictions)
Coordinate state level activities on behalf of older people, develop and administer the state plans on aging, serve as
advocates, and provide technical assistance to Area Agencies on Aging.
(10 Regions)
ARKANSAS DHS STATISTICAL REPORT
DIVISION OF AGING AND ADULT SERVICES
INTRODUCTION
SFY 2010
HISTORY
The agency achieved divisional status through Act 228 of 1977, and the responsibility for adult protective services was
transferred by the General Assembly in 1979. As a result of Act 348 of 1985, the Division of Aging and Adult Services (DAAS)
was created within the reorganized Arkansas Department of Human Services. In 1997 the Division began providing services to
adults with physical disabilities.
A growing nationwide awareness of the problems of the elderly and the needs for services and assistance on their behalf led to
the passage of the Older Americans Act in 1965. This legislation, which created the Administration on Aging at the federal
level, also mandated the establishment of a state unit on aging in each state to administer programs under the Act.
Accordingly, the Arkansas Office on Aging was established in 1966 by proclamation of Governor Orville Faubus under the
auspices of the Governor’s Office.
Since 1965, the Older Americans Act has been amended several times, each time expanding the roles of state units on aging.
Arkansas legislation has also changed the name of the state unit on aging, the organizational location, and its authority and
funding responsibilities. In 1971, the State Unit was placed within the Department of Social and Rehabilitative Services. The
responsibility for Adult Services was assumed in 1972.
THE ADMINISTRATIVE AGING NETWORK
MISSION AND OBJECTIVES
DAAS-1

Total 44
Total 44 Oriental 0
American Indian 0
GENDER ETHNICITY
Female 33 White 21
Other 0
Unknown 18
Home Delivered Meals provides meals to clients who are age 60+ (or spouse or disabled dependent of person age 60+),
homebound, and unable to prepare nutritionally adequate meals, and living in an area where the meal can be delivered. Home
Delivered Meals served 1,927,441 meals to 13,967 clients in SFY 2010.
Client Representation is provided by a knowledgeable worker who assists individuals in receiving services and benefits for
which they are eligible. Assistance was provided to 8,430 unduplicated clients in SFY 2010.
Personal Care assists Medicaid clients in meeting daily living tasks to enable the client to remain in the community.
Traditionally, personal care is provided by an agency but is available to some as a monthly cash allowance through the
Independent Choices program. Service was provided to 1,350 clients in SFY 2010.
ElderChoices is a Medicaid home and community-based program that provides in-home services to individuals 65 and over.
These in-home services are designed to delay or prevent institutionalization by maintaining, strengthening, or restoring an
eligible client’s functioning in his or her own home, that of a caregiver, or foster home. Services may include adult day care,
adult day health care, adult family homes, chore, home delivered meals, homemaker, personal emergency response system,
adult companion and respite care.
Pace is a comprehensive health and social services delivery system that provides and coordinates primary, preventive, acute
and long-term care services to the frail elderly as a means for keeping them in their homes and communities for as long as
possible.
Male 11 Black 5
Unknown 0 Spanish American 0
Pace Clients by Gender and Ethnicity
Chore Services is for individuals without adequate help to perform services for them. This is a household service which may
include running errands, preparing food, simple household tasks, heavy cleaning or yard and walk maintenance which the
client is unable to perform alone and which do not require the services of a trained homemaker or other specialist. There were
389 clients served in SFY 2010.
Homemaker provides household management tasks such as menu planning, bill paying, and checking account management.
Individuals must be without significant social support systems able to perform services for them. Homemaker served 500
clients in SFY 2010.
ARKANSAS DHS STATISTICAL REPORT
DAAS SERVICES PROVIDED
SFY 2010
Senior Citizens Centers provide a wide range of services for aging adults, typically including recreational activities for adults,
socialization, educational programs, and other services. Arkansas has 223 such centers.
Legal Assistance clients must be age 60+ needing legal advice that does not involve criminal charges. Legal Assistance
provided 724 hours of service to 177 clients in SFY 2010.
Congregate Meals are available for individuals over 60 years of age. The meals are served in a group setting such as a senior
center or elderly housing facility and are usually associated with activities to promote social interaction and reduce social
isolation. This service provided 1,541,248 meals to 24,792 clients in SFY 2010.
DAAS-2

ARKANSAS DHS STATISTICAL REPORT
DAAS SERVICES PROVIDED
SFY 2010
Unknown 472
Other 36
Hispanic 17
Total 3,105
Asian
Black 649
Asian 2
Native American 6
3,105
Hispanic
20
12
Other
White 1,319
Male 1,250
Total 2,501
Total 2,501
Female
Alternatives for Adults with Physical Disabilities (AAPD) provides attendant care and environmental modification services
to individuals ages 21 through 64 who are determined physically disabled by either Social Security or the DHS Medical Review
Team and who meet the criteria for intermediate nursing home care. The individual’s income should be under 300% of the SSI
Federal Benefit Rate and meet the resource limits for Medicaid. Persons who qualify will also receive regular Medicaid benefits
such as doctor and hospital services. Clients choose their attendants and are responsible for training, hiring, firing, and
supervising activities.
Male 2,313
7,380
5
Native American 4
Black 1,554
1,251
Unknown 0
5
19
1,681
13
GENDER ETHNICITY
2,174
White
Black
Hispanic
Asian
Native American
Other
7,380 8
Female
Male
Unknown
Total
5,629
1,751
0
ElderChoices Clients by Gender and Ethnicity
3,480
Unknown
Total
IndependentChoices Clients by Gender and Ethnicity
GENDER ETHNICITY
Female 792 White 972
IndependentChoices began as a consumer-directed Medicaid waiver for Medicaid eligible persons age 18 and above who
have a medical need for personal care service. On April 1, 2008 the IndependentChoices Program was approved by CMS to
be an option in the Medicaid Personal Care Program with the approval of the State Plan Amendment. CMS also approved two
home and community based waiver services, Adult Companion Services and Homemaker, as eligible services offered through
the IndependentChoices Program. This consumer directed service offers a person a monthly cash allowance in place of
traditional personal care. Each participant works with his/her counselor to establish a budget based on his/her individual
assessed needs for personal assistance. Eligible persons are able to choose, supervise and pay their own personal care aide
and use some of the allowance to purchase goods and services related to personal care needs. The IndependentChoices
participant (or his/her designated decision-making partner) will be assisted by a counselor who will coordinate enrollment and
provide information as questions arise. The participant receives counseling and fiscal support at no additional cost to the
participant's budget.
Alternatives Clients by Gender and Ethnicity
GENDER ETHNICITY
Unknown 538
Total
DAAS-3

●
●
Source: Division of Aging and Adult Services
GENDER ETHNICITY
Female 566 White 312
ARKANSAS DHS STATISTICAL REPORT
DAAS SERVICES PROVIDED
SFY 2010
Male 110 Black
Total 676
Hispanic 1
Asian 1
Unknown 342
Total 676
Other 2
18
Program Statistics:
Transportation Service transports a client from one location to another so that the client has access to needed services, care,
or assistance, such as medical services, shopping, bill paying, etc. The service may include escort assistance. This service
provided 477,088 one way trips to 6,761 clients in SFY 2010.
Federal Senior Community Service Employment Programs serves persons with low incomes who are 55 years old or over
and have poor employment prospects. The program has two purposes: 1) to provide useful community services through part-
time, temporary employment where program participants are engaged in community services and 2) to foster individual
economic self-sufficiency where participants receive work experience and job skills that can lead to unsubsidized employment.
For Program year July 01, 2009 - June 30, 2010, 464 participants were served in the Federal Senior Community Service
Community Service Employment Program and 36 participants were placed in unsubsidized employment. For this same time
period, 162 participants were served in the State Older Worker Community Service Program.
Information and Assistance is available to all older persons, their families, and friends. The service includes concrete
information about services and benefits and where to obtain them. It may include assistance with referral to an agency
providing the service or benefit and follow-up to see if the service was satisfactory. There were 91,888 state referrals given to
72,375 clients during SFY 2010.
Ombudsman Program is a statewide program that advocates for the rights of long-term care residents. It is a program of
community advocates that addresses the complaints of nursing home and residential care facility residents. Its representatives
provide information on facilities, work for systematic change, and monitor the activities of the regulatory system.
3,982
Facility complaints
Facility visits
Resident and family council meetings attended
1,597
1,511
96
330
The Governor's Advisory Council on Aging (GACA) is a 24-member Advisory Council, and meets quarterly.
Aging Arkansas Newspaper
Participated monthly by submitting articles for statewide newspaper with circulation of nearly 40,000.
Special Events
Arkansas Aging Conference had a record 600 participants.
Community education sessions
Telephone inquiries
Adult Day Care services are community-based group programs designed to meet the needs of functionally and/or cognitively
impaired adults through an individual case plan. These structured programs provide a variety of health, social and support
services. Adult day centers operate programs during normal business hours with some programs offering evening and
weekend services. These programs served 54 clients in SFY 2010.
Assisted Living Facilities provide 24-hour supervision and supportive services including limited nursing services in a
congregate setting to persons aged 65 and above. Assisted Living services are also available to persons 21 years of age and
above that are blind or disabled. Assisted Living is a Medicaid and community based waiver program.
Assisted Living Clients by Gender and Ethnicity
DAAS-4

▪
▪
▪
▪
▪
Unknown 38 4
Source: Division of Aging and Adult Services
The Adult Protective Services Unit protects and assists adults, age 18 and older, who are:
Abused, neglected, or exploited, or any combination thereof, and
Endangered as a result of lack of capacity or impaired from mental or physical disease or defect as these terms are
defined by Arkansas Statute.
Referrals Founded
By Age
569 109Total Referrals Founded New Custody Clients Taken
By Gender
667Cases Pending/Open
Referrals Received and Founded
By Age, Gender, Race, Abuse Type and Place of Abuse
28
26
18 to 29 282 19
30 to 39 137
40 to 49 247
50 to 59 474 66
60 to 69 656 110
70 to 79 914 127
80 to 89 962 154
Referrals
3,216
90+ 305 35
Total 4,015 569
4
Founded
Total
Other
57
Physical Abuse
Verbal Abuse
Sexual Abuse
208
20
270
0
3
42
Exploitation
Tech Assist
386
1,865
1,135Caregiver Neglect
Self Neglect 471
Referrals
Place of Abuse
30
0
4,015
58
3,714
31
508
3
ARKANSAS DHS STATISTICAL REPORT
ADULT PROTECTIVE SERVICES
SFY 2010
Adult Protective Services (APS):
Acts as an advocate for adult Arkansans who are endangered and are impaired or lack capacity.
Searches for the least restrictive living alternative for individuals who are not capable of providing self care.
Strives to involve the adult requiring services, as well as the family, in the decision making process.
APS statistical information for SFY 2010:
Total Referrals Received Visits to Custody Clients4,015 1,715
Male
Female
4,015
257
312
569
1,645
2,370
Total
By Race
6
Oriental
Hispanic
27
37
Founded
White
Black 733
479
81
Referrals
19
5694,015
335
9
This page is not reflective of abuse that has occurred in Nursing Homes, Human Development Centers, or Development
Disabilities Licensed Providers. Adult Protective Services investigated those cases as incidents of abuse.
FoundedReferrals
569
Private Residence
DDS Provider
Other
Total
By Abuse Type
Founded
1
0
569Total
Native American
Unknown 13
9
4,015
DAAS-5

Arkansas 29 Lee 14
Ashley 44 Lincoln 6
Baxter 117 Little River 26
Benton 196 Logan 65
Boone 61 Lonoke 57
Bradley 29 Madison 16
Calhoun 6 Marion 39
Carroll 33 Miller 80
Chicot 17 Mississippi 73
Clark 39 Monroe 24
Clay 33 Montgomery 21
Cleburne 54 Nevada 20
Cleveland 10 Newton 32
Columbia 22 Ouachita 52
Conway 32 Perry 15
Craighead 96 Phillips 48
Crawford 66 Pike 23
Crittenden 52 Poinsett 50
Cross 29 Polk 45
Dallas 8 Pope 73
Desha 19 Prairie 5
Drew 27 Pulaski 434
Faulkner 91 Randolph 34
Franklin 23 Saline 111
Fulton 35 Scott 22
Garland 226 Searcy 18
Grant 14 Sebastian 188
Greene 86 Sevier 16
Hempstead 51 Sharp 28
Hot Spring 50 St. Francis 33
Howard 26 Stone 25
Independence 49 Union 62
Izard 24 Van Buren 19
Jackson 22 Washington 199
Jefferson 87 White 85
Johnson 54 Woodruff 10
Lafayette 11 Yell 36
Lawrence 43 Total 4,015
Source: Division of Aging and Adult Services
ARKANSAS DHS STATISTICAL REPORT
ADULT PROTECTIVE SERVICES
REFERRALS BY COUNTY
SFY 2010
County Referrals County Referrals
DAAS-6

196 33 61 39
ARKANSAS DHS STATISTICAL REPORT
ADULT PROTECTIVE SERVICES
REFERRALS BY COUNTY
STATE MAP
SFY 2010
34 33
24 28 86
117 35
43
199 16 32 18 96 73
25 49
66 54 19 50
23 73 54 22
29 52
65 85
32
36 15
188 91 10 33
5
22 57 14
434
4821 226 111 24
45
87 29
50 14
26 23
39
16 8 6
26 51 20 52
10 19
27
6 29
80
1144 17
22 62
Source: Division of Aging and Adult Services
ARKANSAS
ASHLEY
BAXTERBENTON BOONE
BRADLEYCALHOUN
CARROLL
CHICOT
CLARK
CLAY
CLEBURNE
CLEVELAND
COLUMBIA
CONWAY
CRAIGHEAD
CRAWFORD
CROSS
DALLAS
DESHA
DREW
FAULKNER
FULTON
GARLAND
GRANT
GREENE
HEMPSTEAD
HOT SPRING
HOWARD
IZARD
JACKSON
JEFFERSON
JOHNSON
LAWRENCE
LEE
LINCOLN
LOGAN
LONOKE
MADISON
MARION
MILLER
MISSISSIPPI
MONROEMONTGOMERY
NEVADA
NEWTON
OUACHITA
PERRY
PHILLIPS
PIKE
POINSETT
POLK
POPE
PRAIRIE
PULASKI
RANDOLPH
ST. FRANCIS
SALINE
SCOTT
SEARCY
SEVIER
SHARP
STONE
UNION
VAN BUREN
WASHINGTON
WHITE
WOODRUFF
YELL
INDEPENDENCE
SEBASTIAN
FRANKLIN
CRITTENDEN
LITTLE RIVER
LAFAYETTE
DAAS-7


Division Overview
Mental Health Services
ARKANSAS DHS STATISTICAL REPORT
DIVISION OF BEHAVIORAL HEALTH SERVICES
INTRODUCTION
SFY 2010
Additionally CMHCs provide a comprehensive array of clinical and rehabilitative mental health services
including: crisis intervention and stabilization; mental health, psychiatric, psychological and forensic
assessment; treatment planning; individual, family, and group therapy; medication management; case
management; day treatment/partial hospitalization programs; psychiatric rehabilitation day programs;
specialized services for children with serious emotional disturbance, including interagency service
coordination and wrap-around; prevention, consultation, and education; and other supportive services such as
housing, vocational, and foster care services. The state’s three certified Community Mental Health Clinics
(Birch, GAIN, and Small Group Therapy) provide specialized services for adults with severe and persistent
mental illness.
Each of the state’s 14 CMHCs provides services in one of 14 designated geographic catchment areas that
encompass the entire state. All CMHCs are nationally accredited by either Commission on Accreditation of
Rehabilitation Facilities (CARF) or the Joint Commission on the Accreditation of Healthcare Organizations
(JCAHO). CMHCs operate out of 144 sites located in 67 of the state’s 75 counties. Services are provided in
all counties of the state through off-site outreach. CMHCs provide screenings for all persons referred for
publicly supported inpatient care, including at the Arkansas State Hospital and in local psychiatric hospital
beds paid for through funds provided to the CMHCs.
The Division of Behavioral Health Services (DBHS), within the Department of Human Services, is responsible
for ensuring the provision of public mental health and substance abuse treatment/prevention services
throughout the state of Arkansas.
The Division of Behavioral Health Services discharges its responsibility for the provision of public mental
health services by operating the 236 bed Arkansas State Hospital and the 310 bed Arkansas Health Center (a
skilled long-term nursing home facility), by contracting with fourteen local, private non-profit Community
Mental Health Centers (CMHCs), and certifying three private non-profit specialty Community Mental Health
Clinics. Priority populations for DBHS mental health services are individuals found not guilty by reason of
mental disease or defect, individuals assessed as potentially violent, other forensic clients, adults with a
serious mental illness, and children and adolescents with a serious emotional disturbance. The Arkansas
State Hospital includes 90 adult acute care beds, 92 forensic beds, and 54 adolescent beds. Admission to
acute care beds is through a referral from the state’s CMHCs. Admission to forensic beds, for either
evaluation and/or treatment, is by a circuit court order. The Arkansas Health Center provides skilled nursing
home services for individuals with mental health problems that cannot be effectively managed in other nursing
homes. The Center also provides some other specialized nursing home care.
DBHS-1

Substance Abuse Services
●
●
●
●
●
●
●
●
Three residential adolescent treatment programs that provide residential alcohol and drug treatment;
Thirteen Regional Alcohol and Drug Detoxification Centers that provide detoxification services to persons
needing supervised withdrawal from some type of substance abuse;
Fifteen residential/outpatient treatment centers that provide alcohol and drug counseling service coupled
with room and board when necessary;
Prevention services are funded through 38 grants to and contracts with local programs, communities and
other organizations to provide an array of prevention services. In addition to these local grants and contracts,
ADAP funds 13 Prevention Resource Centers (PRC) in the state that are designed to respond to the needs of
a particular geographical area to support its prevention initiatives. PRCs also work with businesses to provide
prevention activities in the workplace to help businesses deal with substance abuse.
ADAP licenses 52 alcohol and drug treatment programs in the state and approves Opioid Treatment
Programs. The office is responsible for overseeing the provision that persons court ordered to treatment
meet the requirements of the Substance Abuse Commitment Law. Alcohol and drug treatment services are
provided through various funding sources. ADAP funds the following treatment services:
Seven Special Women’s Services programs which allows a parent to bring up to two children into
treatment with her. Other services include alcohol and drug counseling, parenting skills, room and board,
transportation, referral for medical services, job readiness and child care;
ARKANSAS DHS STATISTICAL REPORT
DIVISION OF BEHAVIORAL HEALTH SERVICES
SFY 2010
The Office of Alcohol and Drug Abuse Prevention (ADAP) within the Division of Behavioral Health Services is
the single state agency responsible for funding of alcohol and drug prevention and treatment services,
providing court ordered treatment, licensing of alcohol and drug treatment programs, the State Methadone
Authority, administering the Drug and Alcohol Safety Educational Programs and providing training to the field
of substance abuse.
INTRODUCTION
ADAP distributes federal funds from the Substance Abuse Prevention and Treatment Block Grant to provide
alcohol and drug prevention and treatment services in the state.
Nine outpatient programs that provide alcohol and drug counseling service;
Five secure treatment beds that provide secure treatment for court committed clients from outside of the
Central Arkansas Area;
One Opioid Treatment Program (methadone maintenance treatment) providing medication and outpatient
drug counseling to opiate abusing clients.
Court Ordered Referral and Treatment Program providing court ordered treatment for clients committed
to treatment under the Substance Abuse Commitment Law from Central Arkansas;
ADAP administers and funds 14 Drug and Alcohol Safety Educational Programs (DASEP). DASEP is
responsible for providing the court with a Pre-sentence Screening Report on all persons adjudicated for
Driving While Intoxicated/Driving Under the Influence of alcohol or other drugs. Educational services are also
provided by the DASEP for those offenders required to take an educational course to get their drivers license
reinstated.
DBHS-2

Number of Clients Served
Source: Division of Behavioral Health
ADAP funds the Arkansas Prevention Certification Board and the Arkansas Substance Abuse Counselor
Certification Board. Both boards oversee the quality of persons providing alcohol and drug counseling and
prevention services. ADAP also administers two major data collection efforts that include the Arkansas
Prevention Needs Assessment Student Survey conducted and published annually, and the Risk Factors for
Adolescent Drug and Alcohol Abuse in Arkansas, an archival data report compiled from various state data
sources.
SFY 2010
Substance Abuse Services (Continued)
ARKANSAS DHS STATISTICAL REPORT
DIVISION OF BEHAVIORAL HEALTH SERVICES
INTRODUCTION
Training services for the field of alcohol and drug services are funded by ADAP through contract and grants
with Mid-South Addiction Training Network, Mid-South Summer School, and the Prevention Institute. These
organizations provide training throughout the state for persons working in the field of substance abuse.
During SFY 2010, 74,277 persons received mental health services through DBHS mental health programs,
12,260 received substance abuse treatment services, and 303,153 received drug abuse prevention services.
Tables 7 through 10 show the unduplicated number of mental health clients served by each provider. The total
served in these tables (76,212) represents the duplication across providers in the system. Thus, there were
1,935 instances (76,212- 74,277) during the year of a person who had received mental services from one
provider, also receiving mental health services from another provider. Likewise, tables 21 through 24 show
the unduplicated number of substance abuse treatment clients served by each provider. The total served in
these tables (12,273) represents the duplication across providers in the system. Thus, there were 13
instances (12,273 - 12,260) during the year of a person who had received substance abuse treatment
services from one provider, also receiving substance abuse treatment services from another provider.
DBHS-3

MENTAL HEALTH CLIENTS(Arkansas State Hospital & Community Mental Health Centers)

Arkansas 181 463 20 18 682 Lincoln 185 213 16 31 445
Ashley 361 537 25 21 944 Little River 144 247 13 16 420
Baxter 53 459 22 20 554 Logan 219 269 8 10 506
Benton 1,412 2,299 97 93 3,901 Lonoke 353 652 22 10 1,037
Boone 44 524 23 14 605 Madison 233 222 7 10 472
Bradley 80 225 13 16 334 Marion 100 274 7 7 388
Calhoun 30 82 4 6 122 Miller 204 1,057 38 33 1,332
Carroll 227 430 34 28 719 Mississippi 461 856 42 35 1,394
Chicot 139 222 12 23 396 Monroe 106 171 17 20 314
Clark 78 246 16 20 360 Montgomery 104 82 7 7 200
Clay 192 346 12 16 566 Nevada 48 283 11 7 349
Cleburne 205 612 17 21 855 Newton 17 81 4 102
Cleveland 79 128 10 9 226 Ouachita 160 543 31 32 766
Columbia 235 531 39 49 854 Perry 83 167 5 9 264
Conway 235 495 24 25 779 Phillips 249 506 31 32 818
Craighead 1,213 1,511 68 66 2,858 Pike 133 129 6 2 270
Crawford 415 624 16 13 1,068 Poinsett 96 342 17 22 477
Crittenden 353 757 34 34 1,178 Polk 275 229 6 4 514
Cross 191 336 20 22 569 Pope 410 1,174 43 38 1,665
Dallas 33 80 5 13 131 Prairie 51 96 5 6 158
Desha 256 270 12 16 554 Pulaski 1,523 4,031 211 150 5,915
Drew 306 355 11 14 686 Randolph 178 424 23 33 658
Faulkner 1,038 2,123 97 148 3,406 Saline 484 1,426 64 70 2,044
Franklin 74 158 6 5 243 Scott 81 131 8 4 224
Fulton 53 117 6 4 180 Searcy 49 145 11 8 213
Garland 1,330 1,636 106 133 3,205 Sebastian 533 1,655 49 60 2,297
Grant 162 273 17 17 469 Sevier 153 387 20 38 598
Greene 308 913 27 47 1,295 Sharp 61 348 24 23 456
Hempstead 305 643 44 36 1,028 St. Francis 291 533 18 15 857
Hot Spring 433 510 34 22 999 Stone 127 354 24 14 519
Howard 240 356 19 36 651 Union 615 1,754 109 112 2,590
Independence 219 664 26 26 935 Van Buren 164 472 34 32 702
Izard 74 219 12 5 310 Washington 2,121 2,889 107 103 5,220
Jackson 114 317 10 9 450 White 365 1,154 37 35 1,591
Jefferson 932 1,862 109 124 3,027 Woodruff 94 225 9 4 332
Johnson 127 491 23 20 661 Yell 120 321 18 22 481
Lafayette 54 140 13 8 215 Out of State 63 334 19 24 440
Lawrence 177 323 16 29 545 Unknown 62 253 9 6 330
Lee 124 199 15 21 359
TOTALS 22,797 46,905 2,244 2,331 74,277
Source: SPQM DATA SYSTEM
DIVISION OF BEHAVIORAL HEALTH SERVICES
TABLE 1. UNDUPLICATED MENTAL HEALTH CLIENTS SERVED SYSTEM-WIDE
BY COUNTY AND AGE
0 - 17 18 - 59 60 - 64 65 + Total
ARKANSAS DHS STATISTICAL REPORT
SFY 2010
County 0 - 17 18 - 59 60 - 64 65 + CountyTotal
DBHS-4

Arkansas 1 190 0 0 0 16 475 682
Ashley 1 326 0 3 1 17 596 944
Baxter 0 0 0 1 3 295 255 554
Benton 20 88 5 29 0 9 3,750 3,901
Boone 2 1 1 2 5 153 441 605
Bradley 0 137 0 1 0 7 189 334
Calhoun 0 33 0 0 0 1 88 122
Carroll 0 7 0 0 0 0 712 719
Chicot 1 251 0 0 1 8 135 396
Clark 1 94 0 1 7 3 254 360
Clay 0 27 2 2 3 186 346 566
Cleburne 0 5 0 3 1 217 629 855
Cleveland 0 39 0 0 0 9 178 226
Columbia 1 396 0 3 0 2 452 854
Conway 2 120 0 3 9 22 623 779
Craighead 2 493 5 5 31 177 2,145 2,858
Crawford 5 20 1 8 8 52 974 1,068
Crittenden 2 610 1 1 2 151 411 1,178
Cross 0 79 0 0 1 255 234 569
Dallas 0 69 0 0 0 2 60 131
Desha 2 296 1 0 2 11 242 554
Drew 1 224 1 1 3 14 442 686
Faulkner 17 352 1 35 49 85 2,867 3,406
Franklin 1 1 0 1 2 26 212 243
Fulton 1 0 0 0 1 73 105 180
Garland 4 336 1 13 93 39 2,719 3,205
Grant 0 10 1 0 0 39 419 469
Greene 1 11 0 2 5 122 1,154 1,295
Hempstead 1 408 1 4 2 66 546 1,028
Hot Spring 1 170 0 8 28 50 742 999
Howard 0 148 1 1 1 59 441 651
Independence 1 19 1 2 5 348 559 935
Izard 0 1 1 1 0 112 195 310
Jackson 0 41 0 0 4 234 171 450
Jefferson 8 1,955 2 0 7 65 990 3,027
Johnson 0 21 2 8 47 20 563 661
Lafayette 0 102 0 0 0 8 105 215
Lawrence 0 1 0 0 2 51 491 545
Lee 0 252 1 1 0 30 75 359
SFY 2010
Hawaiian/PI Asian
ARKANSAS DHS STATISTICAL REPORT
DIVISION OF BEHAVIORAL HEALTH SERVICES
TABLE 2. UNDUPLICATED MENTAL HEALTH CLIENTS SERVED SYSTEM-WIDE
BY COUNTY AND RACE
Unknown
American
Indian/Ak. WhiteMultiracial TotalCounty Black
DBHS-5

Lincoln 0 93 0 1 4 4 343 445
Little River 0 100 1 0 2 27 290 420
Logan 0 10 1 2 2 25 466 506
Lonoke 2 26 0 1 1 682 325 1,037
Madison 0 7 0 1 0 0 464 472
Marion 1 3 0 2 1 131 250 388
Miller 2 309 2 1 4 36 978 1,332
Mississippi 0 444 3 1 9 239 698 1,394
Monroe 0 177 0 0 2 35 100 314
Montgomery 0 1 0 1 1 2 195 200
Nevada 1 125 0 1 4 17 201 349
Newton 1 0 0 0 0 21 80 102
Ouachita 3 382 0 0 0 5 376 766
Perry 0 4 0 2 1 6 251 264
Phillips 0 494 4 1 3 88 228 818
Pike 0 3 0 2 4 0 261 270
Poinsett 0 43 0 0 1 25 408 477
Polk 1 3 0 1 2 13 494 514
Pope 1 71 2 22 40 62 1,467 1,665
Prairie 0 30 0 1 0 59 68 158
Pulaski 15 2,174 10 7 48 1,883 1,778 5,915
Randolph 1 4 3 0 4 114 532 658
Saline 1 72 0 1 0 1,095 875 2,044
Scott 1 18 0 0 5 8 192 224
Searcy 0 0 0 2 3 54 154 213
Sebastian 25 157 2 7 17 83 2,006 2,297
Sevier 0 25 0 5 2 176 390 598
Sharp 1 2 0 2 2 145 304 456
St. Francis 0 403 0 1 3 185 265 857
Stone 0 0 0 2 5 75 437 519
Union 4 1,204 0 0 0 2 1,380 2,590
Van Buren 0 11 0 1 3 197 490 702
Washington 25 315 15 21 0 6 4,838 5,220
White 1 56 0 8 11 540 975 1,591
Woodruff 0 94 0 0 16 89 133 332
Yell 3 9 1 11 12 23 422 481
Out of State 1 37 3 6 1 67 325 440
Unknown 1 80 0 1 0 95 153 330
TOTALS 167 14,319 76 254 536 9,348 49,577 74,277
Source: SPQM DATA SYSTEM
TABLE 2. UNDUPLICATED MENTAL HEALTH CLIENTS SERVED SYSTEM-WIDE
UnknownMultiracial
ARKANSAS DHS STATISTICAL REPORT
DIVISION OF BEHAVIORAL HEALTH SERVICES
SFY 2010
BY COUNTY AND RACE
White
American
Indian/Ak. TotalCounty Asian Black Hawaiian/PI
DBHS-6

Arkansas 2 3 677 682 Lincoln 6 0 439 445
Ashley 12 6 926 944 Little River 6 70 344 420
Baxter 2 223 329 554 Logan 5 30 471 506
Benton 275 6 3,620 3,901 Lonoke 26 410 601 1,037
Boone 5 113 487 605 Madison 7 0 465 472
Bradley 4 2 328 334 Marion 4 113 271 388
Calhoun 2 0 120 122 Miller 22 140 1,170 1,332
Carroll 38 0 681 719 Mississippi 43 291 1,060 1,394
Chicot 7 6 383 396 Monroe 1 16 297 314
Clark 16 23 321 360 Montgomery 7 18 175 200
Clay 11 28 527 566 Nevada 2 68 279 349
Cleburne 12 191 652 855 Newton 1 20 81 102
Cleveland 1 2 223 226 Ouachita 4 2 760 766
Columbia 1 0 853 854 Perry 0 12 252 264
Conway 13 32 734 779 Phillips 5 29 784 818
Craighead 65 298 2,495 2,858 Pike 4 11 255 270
Crawford 34 179 855 1,068 Poinsett 6 79 392 477
Crittenden 14 166 998 1,178 Polk 11 5 498 514
Cross 17 110 442 569 Pope 56 15 1,594 1,665
Dallas 0 2 129 131 Prairie 0 49 109 158
Desha 6 1 547 554 Pulaski 95 1,532 4,288 5,915
Drew 9 5 672 686 Randolph 16 124 518 658
Faulkner 48 83 3,275 3,406 Saline 4 1,892 148 2,044
Franklin 2 19 222 243 Scott 6 1 217 224
Fulton 1 73 106 180 Searcy 0 64 149 213
Garland 99 371 2,735 3,205 Sebastian 108 12 2,177 2,297
Grant 3 33 433 469 Sevier 58 42 498 598
Greene 20 133 1,142 1,295 Sharp 8 139 309 456
Hempstead 30 120 878 1,028 St. Francis 9 62 786 857
Hot Spring 15 227 757 999 Stone 6 103 410 519
Howard 29 52 570 651 Union 18 2 2,570 2,590
Independence 13 313 609 935 Van Buren 5 229 468 702
Izard 2 138 170 310 Washington 461 4 4,755 5,220
Jackson 0 219 231 450 White 5 446 1,140 1,591
Jefferson 3 7 3,017 3,027 Woodruff 0 109 223 332
Johnson 14 14 633 661 Yell 23 5 453 481
Lafayette 0 35 180 215 Out of State 7 57 376 440
Lawrence 7 72 466 545 Unknown 6 159 165 330
Lee 3 22 334 359
TOTALS 1,886 9,687 62,704 74,277
Source: SPQM DATA SYSTEM
ARKANSAS DHS STATISTICAL REPORT
SFY 2010
County
Hispanic or
Latino
Origin
Not
Available
Not Hispanic
or Latino
Origin Total County
DIVISION OF BEHAVIORAL HEALTH SERVICES
TABLE 3. UNDUPLICATED MENTAL HEALTH CLIENTS SERVED SYSTEM-WIDE
BY COUNTY AND ETHNICITY
Hispanic or
Latino
Origin
Not
Available
Not Hispanic
or Latino
Origin Total
DBHS-7

Arkansas 295 387 0 682 Lincoln 197 248 0 445Ashley 442 502 0 944 Little River 191 229 0 420Baxter 270 277 7 554 Logan 237 269 0 506Benton 1,885 2,016 0 3,901 Lonoke 413 607 17 1,037Boone 240 364 1 605 Madison 227 245 0 472Bradley 138 196 0 334 Marion 158 229 1 388Calhoun 59 63 0 122 Miller 576 756 0 1,332Carroll 322 397 0 719 Mississippi 668 726 0 1,394Chicot 182 214 0 396 Monroe 158 156 0 314Clark 161 199 0 360 Montgomery 98 102 0 200Clay 314 252 0 566 Nevada 194 155 0 349Cleburne 355 497 3 855 Newton 45 56 1 102Cleveland 102 124 0 226 Ouachita 331 435 0 766Columbia 385 469 0 854 Perry 121 143 0 264Conway 384 395 0 779 Phillips 407 411 0 818Craighead 1,533 1,325 0 2,858 Pike 131 139 0 270Crawford 514 554 0 1,068 Poinsett 222 255 0 477Crittenden 538 640 0 1,178 Polk 253 261 0 514Cross 267 302 0 569 Pope 748 917 0 1,665Dallas 55 76 0 131 Prairie 75 82 1 158Desha 291 263 0 554 Pulaski 2,648 3,231 36 5,915Drew 318 368 0 686 Randolph 319 339 0 658Faulkner 1,538 1,867 1 3,406 Saline 951 1,093 0 2,044Franklin 116 127 0 243 Scott 127 97 0 224Fulton 79 101 0 180 Searcy 86 126 1 213Garland 1,557 1,648 0 3,205 Sebastian 1,088 1,209 0 2,297Grant 198 271 0 469 Sevier 256 342 0 598Greene 593 702 0 1,295 Sharp 218 238 0 456Hempstead 485 543 0 1,028 St. Francis 388 469 0 857Hot Spring 487 512 0 999 Stone 226 291 2 519Howard 320 331 0 651 Union 1,156 1,434 0 2,590Independence 420 511 4 935 Van Buren 308 393 1 702Izard 140 169 1 310 Washington 2,597 2,623 0 5,220Jackson 181 268 1 450 White 696 891 4 1,591Jefferson 1,459 1,568 0 3,027 Woodruff 157 174 1 332Johnson 306 355 0 661 Yell 222 259 0 481Lafayette 90 125 0 215 Out of State 217 221 2 440Lawrence 256 289 0 545 Unknown 181 145 4 330Lee 173 186 0 359
TOTALS 34,739 39,449 89 74,277
Source: SPQM DATA SYSTEM
Total Total County Female MaleMaleCounty
ARKANSAS DHS STATISTICAL REPORT
Female Unknown
DIVISION OF BEHAVIORAL HEALTH SERVICES
TABLE 4. UNDUPLICATED MENTAL HEALTH CLIENTS SERVED SYSTEM-WIDE
BY COUNTY AND GENDER
SFY 2010
Unknown
DBHS-8

Female 14 1,824 9 30 110 1,317 6,001 9,305
Male 24 2,988 24 41 163 1,801 8,442 13,483
Unknown 0 0 0 0 0 5 4 9
Total 38 4,812 33 71 273 3,123 14,447 22,797
Female 69 4,782 26 89 152 3,309 18,531 26,958
Male 48 3,856 13 81 91 2,495 13,286 19,870
Unknown 0 0 0 0 0 66 11 77
Total 117 8,638 39 170 243 5,870 31,828 46,905
Female 8 293 1 8 6 125 1,057 1,498
Male 0 161 0 2 3 71 507 744
Unknown 0 0 0 0 0 2 0 2
Total 8 454 1 10 9 198 1,564 2,244
Female 4 286 3 1 7 109 1,278 1,688
Male 0 129 0 2 4 47 460 642
Unknown 0 0 0 0 0 1 0 1
Total 4 415 3 3 11 157 1,738 2,331
Female 0 0 0 0 0 0 0 0
Male 0 0 0 0 0 0 0 0
Unknown 0 0 0 0 0 0 0 0
Total 0 0 0 0 0 0 0 0
Female 95 7,185 39 128 275 4,860 26,867 39,449
Male 72 7,134 37 126 261 4,414 22,695 34,739
Unknown 0 0 0 0 0 74 15 89
Total 167 14,319 76 254 536 9,348 49,577 74,277
ARKANSAS DHS STATISTICAL REPORT
Total
DIVISION OF BEHAVIORAL HEALTH SERVICES
TABLE 5. UNDUPLICATED MENTAL HEALTH CLIENTS SERVED SYSTEM-WIDE
BY AGE, GENDER AND RACE
SFY 2010
UnknownBlack Hawaiian/PI Multiracial White
American
Indian/Ak.AsianGender
0 - 17
Age
18 - 59
65 +
Source: SPQM DATA SYSTEM
60 - 64
Unknown
TOTALS
DBHS-9

Female 435 1,096 7,774 9,305
Male 651 1,418 11,414 13,483
Unknown 0 3 6 9
Total 1,086 2,517 19,194 22,797
Female 425 3,657 22,876 26,958
Male 350 2,865 16,655 19,870
Unknown 0 65 12 77
Total 775 6,587 39,543 46,905
Female 11 182 1,305 1,498
Male 5 112 627 744
Unknown 0 2 0 2
Total 16 296 1,932 2,244
Female 5 202 1,481 1,688
Male 4 84 554 642
Unknown 0 1 0 1
Total 9 287 2,035 2,331
Female 0 0 0 0
Male 0 0 0 0
Unknown 0 0 0 0
Total 0 0 0 0
Female 876 5,137 33,436 39,449
Male 1,010 4,479 29,250 34,739
Unknown 0 71 18 89
Total 1,886 9,687 62,704 74,277
0 - 17
Total Not available
Not Hispanic or Latino
Origin
Source: SPQM DATA SYSTEM
18 - 59
60 - 64
65 +
Unknown
TOTALS
SFY 2010
Hispanic or Latino
OriginGenderAge
ARKANSAS DHS STATISTICAL REPORT
DIVISION OF BEHAVIORAL HEALTH SERVICES
TABLE 6. UNDUPLICATED MENTAL HEALTH CLIENTS SERVED SYSTEM-WIDE
BY AGE, ETHNICITY, AND GENDER
DBHS-10

MENTAL HEALTH CLIENTS(Arkansas State Hospital & Community Mental Health Centers)

Arkansas State Hospital 113 785 23 13 934
Centers for Youth and Families 1,362 204 0 0 1,566
Community Counseling Services, Inc. 2,093 2,433 152 182 4,860
Counseling Associates, Inc. 2,012 4,721 207 268 7,208
Counseling Services of Eastern Arkansas 1,361 2,597 134 146 4,238
Delta Counseling Associates, Inc. 1,126 1,590 69 85 2,870
GAIN, Inc. 0 150 13 6 169
Health Resources of Arkansas, Inc. 1,696 5,971 251 221 8,139
Little Rock Community Mental Health Center 4 2,035 135 99 2,273
Mid-South Health Systems, Inc. 2,675 4,961 206 251 8,093
Ozark Guidance Center, Inc. 4,059 6,023 257 239 10,578
Professional Counseling Associates 837 2,568 92 56 3,553
Small Group Work Therapy 0 99 8 8 115
South Arkansas Regional Health Center 1,049 3,062 191 211 4,513
Southeast Arkansas Behavioral Healthcare System, Inc. 1,593 3,081 182 212 5,068
Southwest Arkansas Counseling & Mental Health Center, Inc. 1,151 3,204 168 181 4,704
The Birch Tree Communities, Inc. 1 438 26 8 473
The Counseling Clinic, Inc. 487 1,400 63 65 2,015
Western Arkansas Counseling & Guidance Center 1,594 3,068 90 91 4,843
TOTALS 23,213 48,390 2,267 2,342 76,212
Source: SPQM DATA SYSTEM
Service Providers 0 - 17 18 - 59 60 - 64 65 + Total
SFY 2010
ARKANSAS DHS STATISTICAL REPORT
DIVISION OF BEHAVIORAL HEALTH SERVICES
TABLE 7. TOTAL MENTAL HEALTH CLIENTS SERVED
BY PROVIDER AND AGE
DBHS-11

White
Arkansas State Hospital 2 419 2 8 0 11 492 934
Centers for Youth and Families 3 749 4 0 35 285 490 1,566
Community Counseling Services, Inc. 6 565 1 25 135 20 4,108 4,860
Counseling Associates, Inc. 21 528 7 83 162 191 6,216 7,208
Counseling Services of Eastern Arkansas 2 2,040 6 4 11 819 1,356 4,238
Delta Counseling Associates, Inc. 5 1,223 2 4 4 47 1,585 2,870
GAIN, Inc. 0 91 0 1 2 3 72 169
Health Resources of Arkansas, Inc. 7 208 3 23 62 2,837 4,999 8,139
Little Rock Community Mental Health Center 10 1,159 6 3 14 66 1,015 2,273
Mid-South Health Systems, Inc. 5 1,099 13 11 55 976 5,934 8,093
Ozark Guidance Center, Inc. 46 419 23 46 0 7 10,037 10,578
Professional Counseling Associates 4 269 0 6 0 2,513 761 3,553
Small Group Work Therapy 0 20 0 0 3 0 92 115
South Arkansas Regional Health Center 8 2,086 0 2 0 0 2,417 4,513
Southeast Arkansas Behavioral Healthcare
System, Inc. 10 2,348 4 2 13 105 2,586 5,068
Southwest Arkansas Counseling & Mental
Health Center, Inc. 5 1,218 5 13 13 401 3,049 4,704
The Birch Tree Communities, Inc. 2 147 0 1 1 11 311 473
The Counseling Clinic, Inc. 0 30 0 1 0 1,218 766 2,015
Western Arkansas Counseling & Guidance
Center 35 193 4 22 38 196 4,355 4,843
TOTALS 171 14,811 80 255 548 9,706 50,641 76,212
Source: SPQM DATA SYSTEM
Service Providers Asian Black Total
Hawaiian/
PI
American
Indian/Ak.
Multi-
racial Unknown
ARKANSAS DHS STATISTICAL REPORT
TABLE 8. TOTAL MENTAL HEALTH CLIENTS SERVED
BY PROVIDER AND RACE
SFY 2010
DIVISION OF BEHAVIORAL HEALTH SERVICES
DBHS-12

Arkansas State Hospital 26 19 889 934
Centers for Youth and Families 45 117 1,404 1,566
Community Counseling Services, Inc. 146 550 4,164 4,860
Counseling Associates, Inc. 152 125 6,931 7,208
Counseling Services of Eastern Arkansas 51 423 3,764 4,238
Delta Counseling Associates, Inc. 38 17 2,815 2,870
GAIN, Inc. 1 82 86 169
Health Resources of Arkansas, Inc. 60 2,621 5,458 8,139
Little Rock Community Mental Health Center 27 77 2,169 2,273
Mid-South Health Systems, Inc. 172 1,104 6,817 8,093
Ozark Guidance Center, Inc. 779 0 9,799 10,578
Professional Counseling Associates 60 1,948 1,545 3,553
Small Group Work Therapy 1 15 99 115
South Arkansas Regional Health Center 29 3 4,481 4,513
Southeast Arkansas Behavioral Healthcare System, Inc. 16 0 5,052 5,068
Southwest Arkansas Counseling & Mental Health Center, Inc. 142 543 4,019 4,704
The Birch Tree Communities, Inc. 5 142 326 473
The Counseling Clinic, Inc. 0 2,012 3 2,015
Western Arkansas Counseling & Guidance Center 165 245 4,433 4,843
TOTALS 1,915 10,043 64,254 76,212
Source: SPQM DATA SYSTEM
Service Providers
Hispanic or
Latino Origin
Not
Available
Not Hispanic
or Latino
Origin Total
SFY 2010
ARKANSAS DHS STATISTICAL REPORT
DIVISION OF BEHAVIORAL HEALTH SERVICES
TABLE 9. TOTAL MENTAL HEALTH CLIENTS SERVED
BY PROVIDER AND ETHNICITY
DBHS-13

Arkansas State Hospital 278 656 0 934
Centers for Youth and Families 653 913 0 1,566
Community Counseling Services, Inc. 2,556 2,304 0 4,860
Counseling Associates, Inc. 3,981 3,227 0 7,208
Counseling Services of Eastern Arkansas 2,250 1,988 0 4,238
Delta Counseling Associates, Inc. 1,529 1,341 0 2,870
GAIN, Inc. 56 113 0 169
Health Resources of Arkansas, Inc. 4,555 3,551 33 8,139
Little Rock Community Mental Health Center 1,276 997 0 2,273
Mid-South Health Systems, Inc. 4,009 4,084 0 8,093
Ozark Guidance Center, Inc. 5,454 5,124 0 10,578
Professional Counseling Associates 2,118 1,363 72 3,553
Small Group Work Therapy 54 61 0 115
South Arkansas Regional Health Center 2,517 1,996 0 4,513
Southeast Arkansas Behavioral Healthcare System, Inc. 2,708 2,360 0 5,068
Southwest Arkansas Counseling & Mental Health Center, Inc. 2,547 2,157 0 4,704
The Birch Tree Communities, Inc. 169 304 0 473
The Counseling Clinic, Inc. 1,089 926 0 2,015
Western Arkansas Counseling & Guidance Center 2,532 2,311 0 4,843
TOTALS 40,331 35,776 105 76,212
Source: SPQM DATA SYSTEM
ARKANSAS DHS STATISTICAL REPORT
DIVISION OF BEHAVIORAL HEALTH SERVICES
TABLE 10. TOTAL MENTAL HEALTH CLIENTS SERVED
BY PROVIDER AND GENDER
Male Unknown Total
SFY 2010
Service Providers Female
DBHS-14


Arkansas 0 1 0 0 1 Lincoln 0 1 0 0 1
Ashley 0 6 0 0 6 Little River 0 2 0 0 2
Baxter 0 8 0 0 8 Logan 1 8 1 0 10
Benton 3 35 0 1 39 Lonoke 1 11 0 0 12
Boone 0 10 1 0 11 Madison 1 0 0 0 1
Bradley 0 2 0 0 2 Marion 0 3 0 0 3
Calhoun 0 1 0 0 1 Miller 2 11 0 0 13
Carroll 0 5 0 0 5 Mississippi 2 13 0 0 15
Chicot 0 4 0 0 4 Monroe 0 1 0 0 1
Clark 0 5 1 0 6 Montgomery 0 0 0 0 0
Clay 0 9 0 0 9 Nevada 0 10 0 0 10
Cleburne 0 3 0 0 3 Newton 0 2 0 0 2
Cleveland 0 1 1 0 2 Ouachita 0 8 0 0 8
Columbia 0 4 0 0 4 Perry 1 2 0 0 3
Conway 2 16 0 0 18 Phillips 2 22 1 0 25
Craighead 4 24 1 0 29 Pike 2 0 0 0 2
Crawford 1 5 0 0 6 Poinsett 1 8 0 0 9
Crittenden 0 14 1 0 15 Polk 0 3 0 1 4
Cross 0 1 0 0 1 Pope 2 16 0 0 18
Dallas 0 0 0 1 1 Prairie 1 4 0 0 5
Desha 0 6 0 0 6 Pulaski 45 211 7 4 267
Drew 1 2 0 0 3 Randolph 0 3 0 0 3
Faulkner 2 24 0 0 26 Saline 1 11 0 1 13
Franklin 0 3 0 0 3 Scott 16 40 2 1 59
Fulton 0 2 1 0 3 Searcy 0 1 0 0 1
Garland 1 16 0 0 17 Sebastian 1 3 0 0 4
Grant 0 0 0 0 0 Sevier 3 14 1 1 19
Greene 0 6 0 0 6 Sharp 0 3 0 0 3
Hempstead 0 16 0 0 16 St. Francis 0 5 0 0 5
Hot Spring 0 13 2 0 15 Stone 0 2 0 0 2
Howard 0 2 0 1 3 Union 0 14 0 0 14
Independence 0 4 0 0 4 Van Buren 2 4 0 0 6
Izard 0 1 0 0 1 Washington 6 43 2 0 51
Jackson 0 8 0 1 9 White 1 9 1 0 11
Jefferson 6 17 0 0 23 Woodruff 0 0 0 0 0
Johnson 0 5 0 0 5 Yell 1 3 0 1 5
Lafayette 0 2 0 0 2 Out of State 0 7 0 0 7
Lawrence 1 3 0 0 4 Unknown 0 0 0 0 0
Lee 0 3 0 0 3
TOTALS 113 785 23 13 934
Source: SPQM DATA SYSTEM
ARKANSAS DHS STATISTICAL REPORT
DIVISION OF BEHAVIORAL HEALTH SERVICES
TABLE 11. ARKANSAS STATE HOSPITAL
UNDUPLICATED CLIENTS SERVED BY COUNTY AND AGE
SFY 2010
18 - 59 60 - 64 65 + TotalTotal County 0 - 17County 0 - 17 18 - 59 60 - 64 65 +
DBHS-15

Arkansas 0 1 0 0 0 0 0 1Ashley 0 4 0 0 0 0 2 6Baxter 0 0 0 0 0 0 8 8Benton 0 3 0 4 0 2 30 39Boone 0 0 0 0 0 0 11 11Bradley 0 2 0 0 0 0 0 2Calhoun 0 0 0 0 0 0 1 1Carroll 0 0 0 0 0 0 5 5Chicot 0 3 0 0 0 0 1 4Clark 0 2 0 0 0 0 4 6Clay 0 4 0 0 0 0 5 9Cleburne 0 0 0 0 0 0 3 3Cleveland 0 1 0 0 0 0 1 2Columbia 0 2 0 0 0 0 2 4Conway 0 6 0 0 0 0 12 18Craighead 0 12 0 0 0 1 16 29Crawford 0 0 0 0 0 0 6 6Crittenden 0 8 0 0 0 0 7 15Cross 0 1 0 0 0 0 0 1Dallas 0 1 0 0 0 0 0 1Desha 0 3 0 0 0 0 3 6Drew 0 0 0 0 0 0 3 3Faulkner 0 7 0 0 0 1 18 26Franklin 0 0 0 0 0 0 3 3Fulton 0 0 0 0 0 0 3 3Garland 0 6 1 0 0 0 10 17Grant 0 0 0 0 0 0 0 0Greene 0 0 0 0 0 0 6 6Hempstead 0 10 0 0 0 0 6 16Hot Spring 0 4 0 0 0 0 11 15Howard 0 1 0 0 0 0 2 3Independence 0 0 0 1 0 0 3 4Izard 0 0 0 0 0 0 1 1Jackson 0 2 0 0 0 0 7 9Jefferson 0 20 0 0 0 0 3 23Johnson 0 1 0 0 0 0 4 5Lafayette 0 1 0 0 0 0 1 2Lawrence 0 0 0 0 0 0 4 4Lee 0 2 0 0 0 0 1 3
ARKANSAS DHS STATISTICAL REPORT
DIVISION OF BEHAVIORAL HEALTH SERVICES
TABLE 12. ARKANSAS STATE HOSPITAL
UNDUPLICATED CLIENTS SERVED BY COUNTY AND RACE
SFY 2010
County Unknown White Total
American
Indian/Ak. MultiracialAsian Black Hawaiian/PI
DBHS-16

Lincoln 0 1 0 0 0 0 0 1Little River 0 0 0 0 0 0 2 2Logan 0 2 0 0 0 0 8 10Lonoke 0 1 0 0 0 0 11 12Madison 0 0 0 0 0 0 1 1Marion 0 0 0 0 0 0 3 3Miller 0 6 0 0 0 0 7 13Mississippi 0 10 0 0 0 0 5 15Monroe 0 0 0 0 0 0 1 1Montgomery 0 0 0 0 0 0 0 0Nevada 0 5 0 0 0 1 4 10Newton 0 0 0 0 0 0 2 2Ouachita 0 6 0 0 0 0 2 8Perry 0 0 0 0 0 0 3 3Phillips 0 20 0 0 0 0 5 25Pike 0 0 0 0 0 0 2 2Poinsett 0 2 0 0 0 0 7 9Polk 0 0 0 0 0 0 4 4Pope 0 4 0 0 0 0 14 18Prairie 0 3 0 0 0 0 2 5Pulaski 1 194 1 0 0 0 71 267Randolph 0 0 0 0 0 0 3 3Saline 0 12 0 0 0 0 1 13Scott 0 21 0 0 0 0 38 59Searcy 0 0 0 0 0 0 1 1Sebastian 0 0 0 0 0 0 4 4Sevier 0 3 0 0 0 1 15 19Sharp 0 1 0 0 0 1 1 3St. Francis 0 0 0 0 0 0 5 5Stone 0 0 0 0 0 0 2 2Union 0 8 0 0 0 0 6 14Van Buren 0 0 0 0 0 1 5 6Washington 0 10 0 3 0 2 36 51White 0 2 0 0 0 0 9 11Woodruff 0 0 0 0 0 0 0 0Yell 1 0 0 0 0 0 4 5Out of State 0 1 0 0 0 1 5 7
Unknown 0 0 0 0 0 0 0 0
TOTALS 2 419 2 8 0 11 492 934
Source: SPQM DATA SYSTEM
DIVISION OF BEHAVIORAL HEALTH SERVICES
American
Indian/Ak.
TABLE 12. ARKANSAS STATE HOSPITAL
ARKANSAS DHS STATISTICAL REPORT
UNDUPLICATED CLIENTS SERVED BY COUNTY AND RACE
SFY 2010
County Multiracial Unknown White TotalAsian Black Hawaiian/PI
DBHS-17

Arkansas 0 1 0 1 Lincoln 0 1 0 1
Ashley 3 3 0 6 Little River 1 1 0 2
Baxter 5 3 0 8 Logan 3 7 0 10
Benton 10 29 0 39 Lonoke 4 8 0 12
Boone 3 8 0 11 Madison 0 1 0 1
Bradley 0 2 0 2 Marion 2 1 0 3
Calhoun 0 1 0 1 Miller 2 11 0 13
Carroll 2 3 0 5 Mississippi 3 12 0 15
Chicot 2 2 0 4 Monroe 1 0 0 1
Clark 2 4 0 6 Montgomery 0 0 0 0
Clay 3 6 0 9 Nevada 1 9 0 10
Cleburne 0 3 0 3 Newton 1 1 0 2
Cleveland 0 2 0 2 Ouachita 3 5 0 8
Columbia 2 2 0 4 Perry 1 2 0 3
Conway 3 15 0 18 Phillips 9 16 0 25
Craighead 5 24 0 29 Pike 0 2 0 2
Crawford 4 2 0 6 Poinsett 3 6 0 9
Crittenden 2 13 0 15 Polk 0 4 0 4
Cross 0 1 0 1 Pope 5 13 0 18
Dallas 0 1 0 1 Prairie 1 4 0 5
Desha 2 4 0 6 Pulaski 85 182 0 267
Drew 1 2 0 3 Randolph 0 3 0 3
Faulkner 11 15 0 26 Saline 3 10 0 13
Franklin 0 3 0 3 Scott 12 47 0 59
Fulton 2 1 0 3 Searcy 0 1 0 1
Garland 7 10 0 17 Sebastian 0 4 0 4
Grant 0 0 0 0 Sevier 7 12 0 19
Greene 3 3 0 6 Sharp 0 3 0 3
Hempstead 7 9 0 16 St. Francis 2 3 0 5
Hot Spring 6 9 0 15 Stone 1 1 0 2
Howard 3 0 0 3 Union 5 9 0 14
Independence 1 3 0 4 Van Buren 1 5 0 6
Izard 0 1 0 1 Washington 10 41 0 51
Jackson 5 4 0 9 White 3 8 0 11
Jefferson 5 18 0 23 Woodruff 0 0 0 0
Johnson 3 2 0 5 Yell 1 4 0 5
Lafayette 1 1 0 2 Out of State 3 4 0 7
Lawrence 1 3 0 4 Unknown 0 0 0 0
Lee 1 2 0 3
TOTALS 278 656 0 934
Source: SPQM DATA SYSTEM
ARKANSAS DHS STATISTICAL REPORT
DIVISION OF BEHAVIORAL HEALTH SERVICES
TABLE 13. ARKANSAS STATE HOSPITAL
UNDUPLICATED CLIENTS SERVED BY COUNTY AND GENDER
Unknown Total Unknown Total
SFY 2010
County County Female MaleFemale Male
DBHS-18

Source: Arkansas State Hospital Data System
June-10
220
220
The average daily census for SFY 2010 was for all patients (acute adult, forensic adult, and adolescent ).
August-09
September-09
212
214
October-09 214
All ASH Patients
Monthly Average Daily Census
Month Census
July-09 211
ARKANSAS DHS STATISTICAL REPORT
DIVISION OF BEHAVIORAL HEALTH SERVICES
TABLE 14. ARKANSAS STATE HOSPITAL
AVERAGE DAILY CENSUS BY MONTH
SFY 2010
221March-10
April-10
May-10
November-09
December-09
212
217
221
214
January-10
February-10
219
DBHS-19
MENTAL HEALTH CLIENTS(Arkansas State Hospital & Community Mental Health Centers)

Arkansas 0 19 0 0 0 4 56 0 30 0 0 0 3 69 0 0 181
Ashley 0 61 0 2 0 5 86 0 80 0 0 0 9 118 0 0 361
Baxter 0 0 0 0 0 16 5 0 0 0 0 1 14 16 0 1 53
Benton 3 15 1 4 0 0 514 2 29 3 9 0 3 829 0 0 1,412
Boone 0 0 0 0 0 2 16 0 0 0 0 0 6 20 0 0 44
Bradley 0 10 0 0 0 0 22 0 18 0 1 0 2 27 0 0 80
Calhoun 0 1 0 0 0 0 7 0 6 0 0 0 1 15 0 0 30
Carroll 0 0 0 0 0 0 105 0 1 0 0 0 0 121 0 0 227
Chicot 0 31 0 0 1 2 18 0 52 0 0 0 5 30 0 0 139
Clark 0 8 0 0 3 0 27 1 7 0 1 2 0 29 0 0 78
Clay 0 0 0 1 1 28 31 0 3 0 0 1 57 70 0 0 192
Cleburne 0 1 0 0 0 32 61 0 3 0 0 1 28 78 1 0 205
Cleveland 0 5 0 0 0 2 26 0 7 0 0 0 3 36 0 0 79
Columbia 0 53 0 0 0 1 34 0 95 0 0 0 1 51 0 0 235
Conway 0 10 0 0 1 6 75 1 16 0 0 1 11 114 0 0 235
Craighead 0 91 1 1 10 25 285 0 192 4 0 14 56 534 0 0 1,213
Crawford 0 3 0 1 2 7 172 0 4 0 4 1 11 210 0 0 415
Crittenden 0 104 0 0 1 30 37 0 112 0 0 1 27 41 0 0 353
Cross 0 11 0 0 1 35 29 0 13 0 0 0 74 28 0 0 191
Dallas 0 3 0 0 0 2 5 0 14 0 0 0 0 9 0 0 33
Desha 0 50 0 0 0 4 47 1 83 1 0 1 4 65 0 0 256
Drew 0 46 0 0 0 3 87 0 61 0 0 2 6 101 0 0 306
Faulkner 1 40 0 1 7 12 359 2 71 0 0 12 21 512 0 0 1,038
Franklin 0 0 0 0 0 4 28 1 0 0 1 0 6 34 0 0 74
Fulton 0 0 0 0 0 16 15 0 0 0 0 0 9 13 0 0 53
Garland 1 59 0 6 28 4 439 1 90 0 3 49 7 643 0 0 1,330
Grant 0 1 0 0 0 11 70 0 0 0 0 0 12 68 0 0 162
Greene 0 2 0 0 0 21 117 0 1 0 0 0 19 148 0 0 308
Hempstead 0 58 0 0 0 12 62 1 86 0 1 0 19 66 0 0 305
Hot Spring 0 34 0 2 9 3 144 0 49 0 2 12 9 169 0 0 433
Howard 0 25 0 0 0 9 48 0 53 1 1 1 21 81 0 0 240
Independence 0 1 0 0 2 36 55 0 3 0 0 1 58 61 1 1 219
Izard 0 1 0 0 0 12 18 0 0 0 1 0 27 15 0 0 74
Jackson 0 3 0 0 0 31 16 0 5 0 0 3 38 18 0 0 114
Jefferson 1 226 0 0 0 15 77 2 428 1 0 3 18 161 0 0 932
Johnson 0 1 0 0 2 2 45 0 1 1 0 2 3 70 0 0 127
Lafayette 0 12 0 0 0 2 14 0 17 0 0 0 1 8 0 0 54
Lawrence 0 0 0 0 1 6 66 0 0 0 0 1 11 92 0 0 177
Lee 0 48 0 1 0 7 5 0 43 0 0 0 6 14 0 0 124
Wht.Unk. Unk. Wht.Unk.Bl.
Hai/
P.I.
Mult
R
*"Unduplicated Children Served" equals persons less than eighteen years old.
Total
Asian = As., Black = Bl., Hawaiian. Pacific Island = P.I., Indian/Alaskan = Ind./Ak., Multi-racial = MultR, Unknown = Unk., White = Wht.
Ind./
Ak. Wht.
ARKANSAS DHS STATISTICAL REPORT
SFY 2010
County As. Bl.
Hai/
P.I.
DIVISION OF BEHAVIORAL HEALTH SERVICES
BY COUNTY BY GENDER AND RACE
Female Male Unknown
TABLE 15. UNDUPLICATED MENTAL HEALTH CHILDREN SERVED*
As.
Ind./
Ak.
Mult
R
DBHS-20

Lincoln 0 14 0 0 3 2 63 0 20 0 0 1 1 81 0 0 185
Little River 0 16 0 0 0 9 31 0 22 1 0 2 6 57 0 0 144
Logan 0 1 0 0 0 4 94 0 2 0 0 0 2 116 0 0 219
Lonoke 0 1 0 0 0 136 23 1 5 0 0 1 159 27 0 0 353
Madison 0 2 0 1 0 0 93 0 4 0 0 0 0 133 0 0 233
Marion 0 0 0 0 0 22 33 0 0 0 0 0 19 26 0 0 100
Miller 0 20 0 0 1 5 50 0 41 0 0 0 4 83 0 0 204
Mississippi 0 66 0 0 1 45 78 0 108 2 0 6 62 93 0 0 461
Monroe 0 22 0 0 0 6 10 0 41 0 0 2 7 18 0 0 106
Montgomery 0 0 0 0 0 1 39 0 1 0 1 1 0 61 0 0 104
Nevada 0 7 0 0 0 5 11 0 5 0 0 0 0 20 0 0 48
Newton 0 0 0 0 0 1 6 0 0 0 0 0 2 8 0 0 17
Ouachita 0 43 0 0 0 2 24 0 46 0 0 0 3 42 0 0 160
Perry 0 0 0 1 0 0 35 0 1 0 0 0 2 44 0 0 83
Phillips 0 66 0 0 1 6 23 0 109 0 0 0 6 38 0 0 249
Pike 0 0 0 1 1 0 49 0 2 0 1 1 0 78 0 0 133
Poinsett 0 1 0 0 0 0 35 0 7 0 0 1 4 48 0 0 96
Polk 0 0 0 0 1 3 111 0 2 0 0 1 1 156 0 0 275
Pope 0 3 0 0 5 10 171 0 11 0 0 6 19 185 0 0 410
Prairie 0 3 0 0 0 11 5 0 9 0 0 0 15 8 0 0 51
Pulaski 2 221 0 0 10 273 120 0 412 3 0 15 325 140 2 0 1,523
Randolph 0 0 0 0 0 16 49 0 0 1 0 1 30 81 0 0 178
Saline 0 0 0 0 0 150 36 0 5 0 0 0 237 56 0 0 484
Scott 0 0 0 0 3 2 25 0 2 0 0 2 2 45 0 0 81
Searcy 0 0 0 1 0 12 12 0 0 0 0 1 4 18 1 0 49
Sebastian 3 18 0 0 5 11 182 2 28 0 2 5 16 261 0 0 533
Sevier 0 5 0 1 0 35 29 0 3 0 1 1 53 25 0 0 153
Sharp 0 0 0 0 0 9 20 0 0 0 1 1 8 22 0 0 61
St. Francis 0 57 0 0 1 26 40 0 93 0 0 0 40 34 0 0 291
Stone 0 0 0 0 2 5 50 0 0 0 0 0 11 58 0 1 127
Union 0 116 0 0 0 0 123 0 187 0 0 0 1 188 0 0 615
Van Buren 0 1 0 0 0 26 44 0 1 0 0 1 33 58 0 0 164
Washington 3 78 6 6 0 0 768 7 114 6 9 0 2 1,122 0 0 2,121
White 0 2 0 0 3 53 102 1 10 0 1 1 79 112 0 1 365
Woodruff 0 14 0 0 3 11 20 0 14 0 0 3 18 11 0 0 94
Yell 0 2 0 0 1 2 40 0 2 0 0 1 5 67 0 0 120
Out of State 0 3 1 0 0 3 22 0 4 0 1 0 4 25 0 0 63
Unknown 9 8 12 1 4 15 13 62
TOTALS 14 1,824 9 30 110 1,317 6,001 24 2,988 24 41 163 1,801 8,442 5 4 22,797
DIVISION OF BEHAVIORAL HEALTH SERVICES
ARKANSAS DHS STATISTICAL REPORT
Female Male Unknown
SFY 2010
BY GENDER AND RACE
TABLE 15. UNDUPLICATED MENTAL HEALTH CHILDREN SERVED*
Source: SPQM DATA SYSTEM
Wht. Unk. Wht.Bl.
Hai/
P.I.
Mult
R
*"Unduplicated Children Served" equals persons less than eighteen years old.
Wht.Bl. Unk.
Asian = As., Black = Bl., Hawaiian. Pacific Island = P.I., Indian/Alaskan = Ind./Ak., Multi-racial = MultR, Unknown = Unk., White = Wht.
County As.As. Unk.
Mult
R
Ind./
Ak.
Hai/
P.I.
Ind./
Ak. Total
DBHS-21

Female 0 11 0 0 0 0 1 12
Male 0 45 0 1 0 1 54 101
Total 0 56 0 1 0 1 55 113
Female 2 229 0 0 11 115 185 542
Male 0 410 4 0 18 149 239 820
Total 2 639 4 0 29 264 424 1,362
Female 1 104 0 8 41 3 721 878
Male 2 147 0 8 65 8 985 1,215
Total 3 251 0 16 106 11 1,706 2,093
Female 1 57 0 2 16 30 742 848
Male 3 101 1 0 19 51 989 1,164
Total 4 158 1 2 35 81 1,731 2,012
Female 0 318 0 1 4 114 147 584
Male 0 417 0 0 3 175 182 777
Total 0 735 0 1 7 289 329 1,361
Female 0 205 0 2 1 13 259 480
Male 1 294 1 0 1 19 330 646
Total 1 499 1 2 2 32 589 1,126
Female 0 0 0 0 0 0 0 0
Male 0 0 0 0 0 0 0 0
Total 0 0 0 0 0 0 0 0
Female 0 25 0 1 9 289 456 780
Male 1 31 0 3 13 357 504 909
Unknown 0 0 0 0 0 3 4 7
Total 1 56 0 4 22 649 964 1,696
Female 0 0 0 0 0 1 0 1
Male 0 1 0 0 0 0 2 3
Total 0 1 0 0 0 1 2 4
Female 0 159 1 2 13 142 681 998
Male 0 312 7 0 25 242 1,091 1,677
Total 0 471 8 2 38 384 1,772 2,675
Health Resources of Arkansas, Inc.
GAIN (Greater Assistance for those In
Need)
Mid-South Health Systems, Inc.
Little Rock Community Mental Health Center
Centers for Youth and Families, Inc.
Community Counseling Services, Inc.
Counseling Associates, Inc.
Counseling Services of Eastern Arkansas
Delta Counseling Associates
Arkansas State Hospital
Service Providers As. Bl. Ind./Ak.
ARKANSAS DHS STATISTICAL REPORT
SFY 2010
TotalHai/P.I. MultR.Gender Wht.
DIVISION OF BEHAVIORAL HEALTH SERVICES
TABLE 16. MENTAL HEALTH CHILDREN SERVED*
BY PROVIDER, RACE AND GENDER
Unk.
DBHS-22

Female 6 99 8 11 0 0 1,512 1,636
Male 9 154 9 17 0 3 2,231 2,423
Total 15 253 17 28 0 3 3,743 4,059
Female 0 8 0 0 0 357 15 380
Male 1 15 0 0 0 421 18 455
Unknown 0 0 0 0 0 2 0 2
Total 1 23 0 0 0 780 33 837
Female 0 214 0 0 0 0 192 406
Male 0 336 0 0 0 0 307 643
Total 0 550 0 0 0 0 499 1,049
Female 1 265 0 0 3 25 316 610
Male 2 496 1 1 5 32 446 983
Total 3 761 1 1 8 57 762 1,593
Female 0 141 0 1 1 74 246 463
Male 1 228 2 4 4 106 343 688
Total 1 369 2 5 5 180 589 1,151
Female 0 0 0 0 0 1 0 1
Male 0 0 0 0 0 0 0 0
Total 0 0 0 0 0 1 0 1
Female 0 0 0 0 0 158 22 180
Male 0 5 0 0 0 260 42 307
Total 0 5 0 0 0 418 64 487
Female 3 19 0 2 12 27 620 683
Male 4 36 0 7 11 31 822 911
Total 7 55 0 9 23 58 1,442 1,594
Female 14 1,854 9 30 111 1,349 6,115 9,482
Male 24 3,028 25 41 164 1,855 8,585 13,722
Unknown 0 0 0 0 0 5 4 9
Total 38 4,882 34 71 275 3,209 14,704 23,213
Source: SPQM DATA SYSTEM
The Birch Tree Communities, Inc.
The Counseling Clinic, Inc.
Western Arkansas Counseling & Guidance
TABLE 16. MENTAL HEALTH CHILDREN SERVED*
Southwest Arkansas Counseling & MHC,
Inc.
Unk.Hai/P.I. Ind./Ak.
Southeast Arkansas Behavioral Healthcare
System, Inc.
Service Providers MultR.
Ozark Guidance Center, Inc.
*Unduplicated within Provider, Duplicated across Providers
South Arkansas Regional Health Center
TOTALS
ARKANSAS DHS STATISTICAL REPORT
BY PROVIDER, RACE AND GENDER
SFY 2010
TotalWht.
Professional Counseling Associates
Gender As. Bl.
Asian = As., Black = Bl., Hawaiian. Pacific Island = P.I., Indian/Alaskan = Ind./Ak., Multi-racial = MultR, Unknown = Unk., White = Wht.
DIVISION OF BEHAVIORAL HEALTH SERVICES
DBHS-23

SUBSTANCE ABUSE TREATMENT(Alcohol and Drug Abuse Prevention - ADAP)

Arkansas 0 80 0 0 80 Lincoln 1 23 2 0 26
Ashley 2 51 0 0 53 Little River 0 37 0 0 37
Baxter 4 190 0 1 195 Logan 21 69 1 0 91
Benton 36 597 5 4 642 Lonoke 1 212 2 0 215
Boone 17 125 1 0 143 Madison 0 48 0 0 48
Bradley 1 50 1 0 52 Marion 2 51 0 0 53
Calhoun 0 13 0 0 13 Miller 5 191 3 0 199
Carroll 13 71 5 2 91 Mississippi 1 89 1 0 91
Chicot 2 26 0 0 28 Monroe 0 32 0 0 32
Clark 2 49 0 0 51 Montgomery 0 14 0 0 14
Clay 0 23 0 0 23 Nevada 1 45 1 0 47
Cleburne 16 122 0 1 139 Newton 0 7 0 0 7
Cleveland 0 22 0 0 22 Ouachita 1 58 1 1 61
Columbia 14 42 1 1 58 Perry 1 23 1 0 25
Conway 2 74 1 0 77 Phillips 3 102 1 1 107
Craighead 6 248 2 1 257 Pike 0 26 0 0 26
Crawford 26 210 2 1 239 Poinsett 0 93 1 0 94
Crittenden 2 153 1 0 156 Polk 4 34 0 0 38
Cross 3 36 0 0 39 Pope 2 249 2 1 254
Dallas 1 4 0 0 5 Prairie 1 22 0 2 25
Desha 1 23 0 0 24 Pulaski 71 1,957 22 7 2,057
Drew 5 61 1 0 67 Randolph 0 35 0 0 35
Faulkner 21 250 2 0 273 Saline 31 384 4 1 420
Franklin 4 36 0 0 40 Scott 5 13 0 1 19
Fulton 4 41 0 0 45 Searcy 2 20 1 0 23
Garland 23 393 5 7 428 Sebastian 61 510 6 3 580
Grant 5 52 0 0 57 Sevier 2 35 0 0 37
Greene 1 137 1 0 139 Sharp 4 78 1 1 84
Hempstead 8 99 1 1 109 St. Francis 5 88 2 0 95
Hot Spring 0 101 0 0 101 Stone 3 48 1 1 53
Howard 0 78 3 0 81 Union 5 209 2 0 216
Independence 20 201 3 0 224 Van Buren 2 40 1 0 43
Izard 7 50 2 0 59 Washington 121 1,374 14 4 1,513
Jackson 0 68 0 1 69 White 8 376 0 2 386
Jefferson 21 523 2 3 549 Woodruff 0 34 0 0 34
Johnson 2 73 0 0 75 Yell 2 45 1 0 48
Lafayette 1 20 1 0 22 Out of State 5 235 6 2 248
Lawrence 4 53 0 0 57 Unknown 4 31 2 0 37
Lee 1 56 1 2 60
TOTALS 650 11,438 120 52 12,260
Source: ADMIS dbo_tblRptClientTreatEnviron
County 0 - 17 18 - 59 60 - 64 65 + Total County 0 - 17 18 - 59 60 - 64 65 + Total
ARKANSAS DHS STATISTICAL REPORT
DIVISION OF BEHAVIORAL HEALTH SERVICES
TABLE 17. UNDUPLICATED CLIENTS SERVED SYSTEM-WIDE
BY COUNTY AND AGE
SFY 2010
OFFICE OF ALCOHOL AND DRUG ABUSE PREVENTION
SUBSTANCE ABUSE TREATMENT
DBHS-24

Arkansas 1 26 0 1 0 1 51 80
Ashley 0 16 0 0 0 3 34 53
Baxter 0 0 1 0 0 2 192 195
Benton 2 15 2 8 0 77 538 642
Boone 0 2 0 2 0 4 135 143
Bradley 0 18 0 0 0 5 29 52
Calhoun 0 1 0 1 0 0 11 13
Carroll 0 2 0 0 0 7 82 91
Chicot 0 16 0 0 0 0 12 28
Clark 0 14 0 0 0 2 35 51
Clay 0 0 0 0 0 0 23 23
Cleburne 0 1 0 1 0 0 137 139
Cleveland 0 4 0 0 0 1 17 22
Columbia 0 23 0 0 0 1 34 58
Conway 0 13 0 0 0 4 60 77
Craighead 0 45 0 0 0 3 209 257
Crawford 3 4 0 4 0 6 222 239
Crittenden 0 83 0 0 0 5 68 156
Cross 0 8 0 0 0 0 31 39
Dallas 0 1 0 0 0 0 4 5
Desha 0 13 0 0 0 1 10 24
Drew 0 26 0 0 0 0 41 67
Faulkner 2 37 0 3 0 8 223 273
Franklin 1 1 0 0 0 0 38 40
Fulton 0 0 0 1 0 0 44 45
Garland 0 25 0 5 0 6 392 428
Grant 0 1 0 0 0 0 56 57
Greene 0 3 0 0 0 2 134 139
Hempstead 0 51 0 1 0 7 50 109
Hot Spring 0 8 0 0 0 1 92 101
Howard 0 27 0 0 0 1 53 81
Independence 1 11 0 1 0 5 206 224
Izard 0 1 0 0 0 0 58 59
Jackson 0 16 0 0 0 1 52 69
Jefferson 0 299 0 0 0 0 250 549
Johnson 0 3 0 1 0 3 68 75
Lafayette 0 7 0 0 0 1 14 22
Lawrence 0 0 0 0 0 0 57 57
Lee 0 30 0 0 0 1 29 60
UnknownMultiracial White TotalCounty Asian Black Hawaiian/PI
American
Indian/Ak.
ARKANSAS DHS STATISTICAL REPORT
DIVISION OF BEHAVIORAL HEALTH SERVICES
TABLE 18. UNDUPLICATED CLIENTS SERVED SYSTEM-WIDE
BY COUNTY AND RACE
SFY 2010
OFFICE OF ALCOHOL AND DRUG ABUSE PREVENTION
SUBSTANCE ABUSE TREATMENT
DBHS-25

Lincoln 0 6 0 1 0 0 19 26
Little River 0 10 0 0 0 0 27 37
Logan 0 3 0 1 0 0 87 91
Lonoke 0 13 0 1 0 2 199 215
Madison 0 0 0 0 0 1 47 48
Marion 0 0 0 0 0 0 53 53
Miller 0 45 0 0 0 1 153 199
Mississippi 0 33 0 0 0 1 57 91
Monroe 0 8 0 0 0 0 24 32
Montgomery 0 0 0 0 0 0 14 14
Nevada 0 19 0 0 0 1 27 47
Newton 0 0 0 0 0 0 7 7
Ouachita 0 22 0 1 0 0 38 61
Perry 0 0 0 0 0 1 24 25
Phillips 0 51 0 0 0 1 55 107
Pike 0 0 0 0 0 1 25 26
Poinsett 0 7 0 0 0 0 87 94
Polk 0 0 0 0 0 0 38 38
Pope 1 18 0 3 0 8 224 254
Prairie 0 3 0 0 0 0 22 25
Pulaski 6 824 2 7 0 45 1,173 2,057
Randolph 1 0 0 0 0 0 34 35
Saline 2 35 0 2 0 13 368 420
Scott 0 0 0 0 0 0 19 19
Searcy 0 0 0 0 0 2 21 23
Sebastian 7 51 1 11 0 20 490 580
Sevier 0 3 0 1 0 3 30 37
Sharp 0 0 0 0 0 2 82 84
St. Francis 1 43 0 0 0 0 51 95
Stone 0 1 0 0 0 0 52 53
Union 0 60 0 1 0 2 153 216
Van Buren 0 0 0 0 0 0 43 43
Washington 16 80 7 15 0 155 1,240 1,513
White 0 26 0 2 0 4 354 386
Woodruff 0 8 0 1 0 0 25 34
Yell 0 2 0 0 0 2 44 48
Out of State 0 7 0 58 0 2 181 248
Unknown 0 6 0 1 0 4 26 37
TOTALS 44 2,235 13 135 0 429 9,404 12,260
Source: ADMIS dbo_tblRptClientTreatEnviron
TABLE 18. UNDUPLICATED CLIENTS SERVED SYSTEM-WIDE
BY COUNTY AND RACE
SFY 2010
County Asian Black Unknown White TotalHawaiian/PI
American
Indian/Ak. Multiracial
ARKANSAS DHS STATISTICAL REPORT
DIVISION OF BEHAVIORAL HEALTH SERVICES
OFFICE OF ALCOHOL AND DRUG ABUSE PREVENTION
SUBSTANCE ABUSE TREATMENT
DBHS-26

Arkansas 2 0 78 80 Lincoln 1 0 25 26
Ashley 2 0 51 53 Little River 0 0 37 37
Baxter 2 0 193 195 Logan 1 0 90 91
Benton 64 0 578 642 Lonoke 2 0 213 215
Boone 4 0 139 143 Madison 0 0 48 48
Bradley 5 0 47 52 Marion 0 0 53 53
Calhoun 0 0 13 13 Miller 1 0 198 199
Carroll 5 0 86 91 Mississippi 1 0 90 91
Chicot 0 0 28 28 Monroe 0 0 32 32
Clark 2 0 49 51 Montgomery 0 0 14 14
Clay 0 0 23 23 Nevada 2 0 45 47
Cleburne 0 0 139 139 Newton 0 0 7 7
Cleveland 1 0 21 22 Ouachita 1 0 60 61
Columbia 0 1 57 58 Perry 0 1 24 25
Conway 2 2 73 77 Phillips 1 0 106 107
Craighead 3 0 254 257 Pike 1 0 25 26
Crawford 7 1 231 239 Poinsett 0 0 94 94
Crittenden 4 0 152 156 Polk 1 0 37 38
Cross 0 0 39 39 Pope 7 0 247 254
Dallas 0 0 5 5 Prairie 0 0 25 25
Desha 1 0 23 24 Pulaski 45 0 2,012 2,057
Drew 1 0 66 67 Randolph 1 0 34 35
Faulkner 7 2 264 273 Saline 10 0 410 420
Franklin 1 0 39 40 Scott 0 0 19 19
Fulton 0 0 45 45 Searcy 2 0 21 23
Garland 9 0 419 428 Sebastian 23 0 557 580
Grant 0 0 57 57 Sevier 3 1 33 37
Greene 2 0 137 139 Sharp 2 0 82 84
Hempstead 7 0 102 109 St. Francis 0 0 95 95
Hot Spring 1 0 100 101 Stone 0 0 53 53
Howard 2 0 79 81 Union 4 0 212 216
Independence 5 0 219 224 Van Buren 0 0 43 43
Izard 0 0 59 59 Washington 127 0 1,386 1,513
Jackson 2 0 67 69 White 3 1 382 386
Jefferson 4 0 545 549 Woodruff 0 0 34 34
Johnson 3 0 72 75 Yell 0 1 47 48
Lafayette 1 0 21 22 Out of State 1 0 247 248
Lawrence 0 0 57 57 Unknown 1 1 35 37
Lee 1 0 59 60
TOTALS 391 11 11,858 12,260
Source: ADMIS dbo_tblRptClientTreatEnviron
County
Hispanic
or Latino
Origin
Not
Available
Not
Hispanic
or Latino
Origin Total County
Hispanic
or Latino
Origin
Not
Available
Not
Hispanic
or Latino
Origin Total
ARKANSAS DHS STATISTICAL REPORT
DIVISION OF BEHAVIORAL HEALTH SERVICES
TABLE 19. UNDUPLICATED CLIENTS SERVED SYSTEM-WIDE
BY COUNTY AND ETHNICITY
SFY 2010
OFFICE OF ALCOHOL AND DRUG ABUSE PREVENTION
SUBSTANCE ABUSE TREATMENT
DBHS-27

Arkansas 32 48 0 80 Lincoln 12 14 0 26
Ashley 13 40 0 53 Little River 12 25 0 37
Baxter 52 143 0 195 Logan 31 60 0 91
Benton 198 443 1 642 Lonoke 71 144 0 215
Boone 45 98 0 143 Madison 14 34 0 48
Bradley 13 39 0 52 Marion 17 36 0 53
Calhoun 2 11 0 13 Miller 83 116 0 199
Carroll 28 63 0 91 Mississippi 21 70 0 91
Chicot 7 21 0 28 Monroe 14 18 0 32
Clark 15 36 0 51 Montgomery 5 9 0 14
Clay 7 16 0 23 Nevada 14 33 0 47
Cleburne 47 92 0 139 Newton 0 7 0 7
Cleveland 7 15 0 22 Ouachita 16 45 0 61
Columbia 10 48 0 58 Perry 7 17 1 25
Conway 23 52 2 77 Phillips 43 64 0 107
Craighead 99 158 0 257 Pike 6 20 0 26
Crawford 79 159 1 239 Poinsett 33 61 0 94
Crittenden 40 116 0 156 Polk 17 21 0 38
Cross 16 23 0 39 Pope 93 161 0 254
Dallas 1 4 0 5 Prairie 4 21 0 25
Desha 4 20 0 24 Pulaski 587 1,470 0 2,057
Drew 24 43 0 67 Randolph 17 18 0 35
Faulkner 92 179 2 273 Saline 129 291 0 420
Franklin 13 27 0 40 Scott 9 10 0 19
Fulton 18 27 0 45 Searcy 10 13 0 23
Garland 166 262 0 428 Sebastian 197 383 0 580
Grant 18 39 0 57 Sevier 15 21 1 37
Greene 45 94 0 139 Sharp 33 51 0 84
Hempstead 26 83 0 109 St. Francis 34 61 0 95
Hot Spring 45 56 0 101 Stone 19 34 0 53
Howard 21 60 0 81 Union 73 143 0 216
Independence 97 127 0 224 Van Buren 13 30 0 43
Izard 20 39 0 59 Washington 434 1,079 0 1,513
Jackson 18 51 0 69 White 154 231 1 386
Jefferson 139 410 0 549 Woodruff 13 21 0 34
Johnson 31 44 0 75 Yell 15 32 1 48
Lafayette 8 14 0 22 Out of State 65 183 0 248
Lawrence 13 44 0 57 Unknown 10 26 1 37
Lee 10 50 0 60
TOTALS 3,882 8,367 11 12,260
Source: ADMIS dbo_tblRptClientTreatEnviron
SFY 2010
County Female Male Unknown Total
ARKANSAS DHS STATISTICAL REPORT
TABLE 20. UNDUPLICATED CLIENTS SERVED SYSTEM-WIDE
BY COUNTY AND GENDER
DIVISION OF BEHAVIORAL HEALTH SERVICES
OFFICE OF ALCOHOL AND DRUG ABUSE PREVENTION
SUBSTANCE ABUSE TREATMENT
Total County Female Male Unknown
DBHS-28
SUBSTANCE ABUSE TREATMENT(Alcohol and Drug Abuse Prevention - ADAP)

Service Providers 0 - 17 18 - 59 60 - 64 65 + Total
10th District Substance Abuse Program 0 184 2 2 188
Alternative Opportunities dba Day Spring Behavioral Health
Services 15 68 1 0 84
Arkansas River Valley Area Council (Freedom House) 0 272 5 0 277
AR Department of Corrections 2 1,273 11 2 1,288
AR Department of Community Corrections 5 391 8 2 406
Black Community Developers 0 241 3 1 245
Capstone Treatment Centers 5 3 0 0 8
CATAR Clinic 0 152 2 0 154
Counseling Associates 13 171 1 0 185
Counseling Clinic 31 162 2 1 196
Crowley's Ridge Development Council 1 341 3 0 345
Decision Point 9 575 12 7 603
Family Service Agency 1 358 4 6 369
Gateway House 0 346 1 0 347
Harbor House 0 451 7 5 463
Health Resources of Arkansas 49 1,104 8 10 1,171
Human Development & Research Services 2 377 4 0 383
Little Rock Community Mental Health Center (Mid-Ark) 0 470 4 0 474
Mid-South Health System 0 90 0 0 90
North Central Arkansas Development Council 8 143 2 1 154
Northwest Arkansas Psychological Group 0 46 1 1 48
Ozark Guidance Center 4 1,235 11 8 1,258
Ozark Mountain Alcohol Residential Treatment 0 257 0 1 258
Quapaw House 89 788 7 9 893
Recovery Center of Arkansas 2 619 4 1 626
Second Change Recovery Center 0 6 0 0 6
Serenity House 0 311 5 0 316
Serenity Counseling Advocates 0 22 0 0 22
Sharon Nelson Counseling 0 1 0 0 1
Soberity Living Center 0 2 0 0 2
South Arkansas Youth Services 14 0 0 0 14
Southeast Arkansas Behavioral Healthcare System 16 34 0 0 50
Southwest Arkansas Counseling & Mental Health Center 7 319 4 0 330
Springdale Treatment Center 0 131 1 0 132
Step Up Support Center 0 35 0 0 35
The Bridge 0 0 1 0 1
The United Methodist Children's Home 0 71 0 0 71
University of Arkansas Medical Center Substance Abuse 0 48 0 0 48
United Family Services 57 9 0 0 66
Union County Drug Court dba South Arkansas Substance Abuse 0 247 5 2 254
Washington County Drug Court Treatment 0 88 0 0 88
Western Arkansas Counseling & Guidance Center (Horizon) 166 2 0 0 168
Youth Bridge 154 2 0 0 156
TOTALS 650 11,445 119 59 12,273
Source: ADMIS dbo_tblRptClientTreatEnviron
BY PROVIDER AND AGE
SFY 2010
ARKANSAS DHS STATISTICAL REPORT
DIVISION OF BEHAVIORAL HEALTH SERVICES
OFFICE OF ALCOHOL AND DRUG ABUSE PREVENTION
SUBSTANCE ABUSE TREATMENT
TABLE 21. TOTAL CLIENTS SERVED
DBHS-29

Service Providers Asian Black
Hawaiian
/PI
American
Indian/Ak
Multi-
racial Unknown White Total
10th District Substance Abuse Program 0 55 0 1 0 7 125 188
Alternative Opportunities dba Day Spring
Behavioral Health Services 0 3 0 1 0 0 80 84
Arkansas River Valley Area Council (Freedom
House) 1 21 0 1 0 9 245 277
AR Department of Corrections 6 433 0 1 0 32 816 1,288
AR Department of Community Corrections 1 79 0 1 0 10 315 406
Black Community Developers 0 163 0 0 0 2 80 245
Capstone Treatment Centers 0 0 0 0 0 1 7 8
CATAR Clinic 0 2 1 2 0 1 148 154
Counseling Associates 0 13 0 5 0 2 165 185
Counseling Clinic 2 8 0 1 0 13 172 196
Crowley's Ridge Development Council 0 33 0 0 0 4 308 345
Decision Point 2 13 0 6 0 31 551 603
Family Service Agency 2 140 1 3 0 19 204 369
Gateway House 1 18 0 23 0 6 299 347
Harbor House 3 20 1 50 0 9 380 463
Health Resources of Arkansas 2 196 0 3 0 16 954 1,171
Human Development & Research Services 0 200 0 1 0 2 180 383
Little Rock Community Mental Health Center (Mid-
Ark) 0 128 0 2 0 6 338 474
Mid-South Health System 0 10 0 0 0 3 77 90
North Central Arkansas Development Council 1 4 0 1 0 3 145 154
Northwest Arkansas Psychological Group 0 1 0 0 0 2 45 48
Ozark Guidance Center 14 49 6 14 0 150 1,025 1,258
Ozark Mountain Alcohol Residential Treatment 1 5 1 1 0 2 248 258
Quapaw House 0 74 0 6 0 12 801 893
Recovery Center of Arkansas 3 171 0 1 0 26 425 626
Second Change Recovery Center 0 3 0 0 0 0 3 6
Serenity House 1 62 0 0 0 2 251 316
Serenity Counseling Advocates 0 0 0 0 0 1 21 22
Sharon Nelson Counseling 0 0 0 0 0 0 1 1
Soberity Living Center 0 1 0 0 0 0 1 2
South Arkansas Youth Services 0 6 0 0 0 1 7 14
Southeast Arkansas Behavioral Healthcare
System 0 26 0 0 0 6 18 50
Southwest Arkansas Counseling & Mental Health
Center 0 99 0 2 0 10 219 330
SFY 2010
ARKANSAS DHS STATISTICAL REPORT
DIVISION OF BEHAVIORAL HEALTH SERVICES
OFFICE OF ALCOHOL AND DRUG ABUSE PREVENTION
SUBSTANCE ABUSE TREATMENT
TABLE 22. TOTAL CLIENTS SERVED
BY PROVIDER AND RACE
DBHS-30

Service Providers (Continued) Asian Black
Hawaiian
/PI
American
Indian/Ak
Multi-
racial Unknown White Total
Springdale Treatment Center 1 3 2 1 0 2 123 132
Step Up Support Center 0 23 0 0 0 0 12 35
The Bridge 0 0 0 0 0 0 1 1
The United Methodist Children's Home 0 17 0 2 0 1 51 71
University of Arkansas Medical Center Substance
Abuse 0 2 0 0 0 0 46 48
United Family Services 0 50 0 0 0 7 9 66
Union County Drug Court dba South Arkansas
Substance Abuse 0 52 0 0 0 4 198 254
Washington County Drug Court Treatment 1 5 0 2 0 8 72 88
Western Arkansas Counseling & Guidance
Center (Horizon) 2 12 0 2 0 12 140 168
Youth Bridge 0 20 1 2 0 34 99 156
TOTALS 44 2,220 13 135 0 456 9,405 12,273
Source: ADMIS dbo_tblRptClientTreatEnviron
BY PROVIDER AND RACE
SFY 2010
ARKANSAS DHS STATISTICAL REPORT
DIVISION OF BEHAVIORAL HEALTH SERVICES
OFFICE OF ALCOHOL AND DRUG ABUSE PREVENTION
SUBSTANCE ABUSE TREATMENT
TABLE 22. TOTAL CLIENTS SERVED
DBHS-31

Service Providers
Hispanic or
Latino Origin
Not
Available
Not Hispanic or
Latino Origin Total
10th District Substance Abuse Program 9 0 179 188
Alternative Opportunities dba Day Spring Behavioral Health
Services 0 2 82 84
Arkansas River Valley Area Council (Freedom House) 8 1 268 277
AR Department of Corrections 35 4 1,249 1,288
AR Department of Community Corrections 12 1 393 406
Black Community Developers 3 4 238 245
Capstone Treatment Centers 1 0 7 8
CATAR Clinic 2 1 151 154
Counseling Associates 1 0 184 185
Counseling Clinic 9 4 183 196
Crowley's Ridge Development Council 4 1 340 345
Decision Point 33 1 569 603
Family Service Agency 20 3 346 369
Gateway House 6 1 340 347
Harbor House 9 0 454 463
Health Resources of Arkansas 15 4 1,152 1,171
Human Development & Research Services 4 0 379 383
Little Rock Community Mental Health Center (Mid-Ark) 6 2 466 474
Mid-South Health System 2 0 88 90
North Central Arkansas Development Council 3 0 151 154
Northwest Arkansas Psychological Group 3 0 45 48
Ozark Guidance Center 100 0 1,158 1,258
Ozark Mountain Alcohol Residential Treatment 2 1 255 258
Quapaw House 16 3 874 893
Recovery Center of Arkansas 9 5 612 626
Second Change Recovery Center 0 0 6 6
Serenity House 1 0 315 316
Serenity Counseling Advocates 2 1 19 22
Sharon Nelson Counseling 0 0 1 1
Soberity Living Center 0 0 2 2
South Arkansas Youth Services 1 0 13 14
Southeast Arkansas Behavioral Healthcare System 2 6 42 50
Southwest Arkansas Counseling & Mental Health Center 13 0 317 330
ARKANSAS DHS STATISTICAL REPORT
DIVISION OF BEHAVIORAL HEALTH SERVICES
OFFICE OF ALCOHOL AND DRUG ABUSE PREVENTION
SUBSTANCE ABUSE TREATMENT
SFY 2010
TABLE 23. TOTAL CLIENTS SERVED
BY PROVIDER AND ETHNICITY
DBHS-32

Service Providers (Continued)
Hispanic or
Latino Origin
Not
Available
Not Hispanic or
Latino Origin Total
Springdale Treatment Center 2 0 130 132
Step Up Support Center 0 0 35 35
The Bridge 0 0 1 1
The United Methodist Children's Home 1 0 70 71
University of Arkansas Medical Center Substance Abuse 0 0 48 48
United Family Services 6 2 58 66
Union County Drug Court dba South Arkansas Substance
Abuse 4 0 250 254
Washington County Drug Court Treatment 9 0 79 88
Western Arkansas Counseling & Guidance Center (Horizon) 11 3 154 168
Youth Bridge 34 3 119 156
TOTALS 398 53 11,822 12,273
Source: ADMIS dbo_tblRptClientTreatEnviron
ARKANSAS DHS STATISTICAL REPORT
DIVISION OF BEHAVIORAL HEALTH SERVICES
OFFICE OF ALCOHOL AND DRUG ABUSE PREVENTION
SUBSTANCE ABUSE TREATMENT
TABLE 23. TOTAL CLIENTS SERVED
BY PROVIDER AND ETHNICITY
SFY 2010
DBHS-33

Service Providers Male Female Unknown Total
10th District Substance Abuse Program 111 77 0 188
Alternative Opportunities dba Day Spring Behavioral Health Services 56 28 0 84
Arkansas River Valley Area Council (Freedom House) 189 88 0 277
AR Department of Corrections 1,081 207 0 1,288
AR Department of Community Corrections 406 0 0 406
Black Community Developers 167 78 0 245
Capstone Treatment Centers 8 0 0 8
CATAR Clinic 96 58 0 154
Counseling Associates 98 87 0 185
Counseling Clinic 137 59 0 196
Crowley's Ridge Development Council 208 137 0 345
Decision Point 388 215 0 603
Family Service Agency 303 66 0 369
Gateway House 52 294 1 347
Harbor House 450 13 0 463
Health Resources of Arkansas 738 431 2 1,171
Human Development & Research Services 268 115 0 383
Little Rock Community Mental Health Center (Mid-Ark) 321 153 0 474
Mid-South Health System 60 30 0 90
North Central Arkansas Development Council 76 78 0 154
Northwest Arkansas Psychological Group 35 13 0 48
Ozark Guidance Center 922 334 2 1,258
Ozark Mountain Alcohol Residential Treatment 166 92 0 258
Quapaw House 523 370 0 893
Recovery Center of Arkansas 377 248 1 626
Second Change Recovery Center 3 3 0 6
Serenity House 202 114 0 316
Serenity Counseling Advocates 11 10 1 22
Sharon Nelson Counseling 1 0 0 1
Soberity Living Center 1 1 0 2
South Arkansas Youth Services 14 0 0 14
Southeast Arkansas Behavioral Healthcare System 30 14 6 50
Southwest Arkansas Counseling & Mental Health Center 222 108 0 330
Springdale Treatment Center 84 48 0 132
Step Up Support Center 19 16 0 35
The Bridge 0 1 0 1
The United Methodist Children's Home 0 71 0 71
University of Arkansas Medical Center Substance Abuse 30 18 0 48
United Family Services 49 16 1 66
Union County Drug Court dba South Arkansas Substance Abuse 163 91 0 254
Washington County Drug Court Treatment 60 28 0 88
Western Arkansas Counseling & Guidance Center (Horizon) 120 45 3 168
Youth Bridge 130 26 0 156
TOTALS 8,375 3,881 17 12,273
Source: ADMIS dbo_tblRptClientTreatEnviron
ARKANSAS DHS STATISTICAL REPORT
DIVISION OF BEHAVIORAL HEALTH SERVICES
OFFICE OF ALCOHOL AND DRUG ABUSE PREVENTION
SUBSTANCE ABUSE TREATMENT
TABLE 24. TOTAL CLIENTS SERVED
BY PROVIDER AND GENDER
SFY 2010
DBHS-34


●
●
●
●
●
ARKANSAS DHS STATISTICAL REPORT
DIVISION OF CHILD CARE AND EARLY CHILDHOOD EDUCATION
INTRODUCTION
SFY 2010
Source: Child Care System
The Arkansas Better Chance (ABC) program served 24,880 preschool children in high quality early childhood
settings in 2009-2010. The state pre-k program, Arkansas Better Chance for School Success (ABCSS),
received a score of 9 out of 10 by the National Institute of Early Education Research Annual State of
Preschool Yearbook. Arkansas ranked 8th in the nation for access to services for 3 year olds, and 8th in
access for 4 year olds. The yearbook evaluation addressed three areas of programming: access, quality
standards, and resources. The total funding for ABC and ABCSS is $111 million annually.
The Division partnered with Maternal and Child Health in the Department of Health to apply for a new round
of grant funds to support the Early Childhood Comprehensive Systems Initiative. The grant was funded for
up to 3 years at $132,000 each year. This grant will provide continuing support to assist the state with
coordination and integration of statewide systems that support families and communities in the development
of all children in order that they are healthy and ready to learn.
As a result of the American Recovery and Reinvestment Act, the state of Arkansas was awarded $25.1
million dollars for childcare assistance. Six percent of this funding is dedicated to support state efforts to
continue to strengthen and improve quality of early care and education including an emphasis on infants,
toddlers and school age children in programs. With the ARRA funds, the Division of Child Care and Early
Childhood Education was able to eliminate a waiting list of more than 8,000 low-income families. The
Division is pleased to report that with ARRA funding, an additional 6,000 low-income children were served.
The USDA program expenditures grew from $42.8 million to $45 million to meet the increasing demand to
serve nutritious meals to children in Arkansas. The program expenditures increase was due to the growth in
the Child and Adult Care Food Program (CACFP). The Special Nutrition Programs are continuing to identify
and target counties with low or no participation to provide healthy, nutritious meals to eligible children.
Highlights and Accomplishments During the Past Year Include:
The licensed capacity for all centers and homes in Arkansas has been expanded from 117,507 in 2001 to
175,712 in 2010. This represents a growth of 33.1% over the past nine years. The number of Quality
Approved facilities in Arkansas has increased from 425 in 2004 to 684 in 2010, an increase of 37.8% during
this six-year period. Currently, approximately 24.7% of all licensed child care centers and child care family
homes are Quality Approved.
DCCECE-1
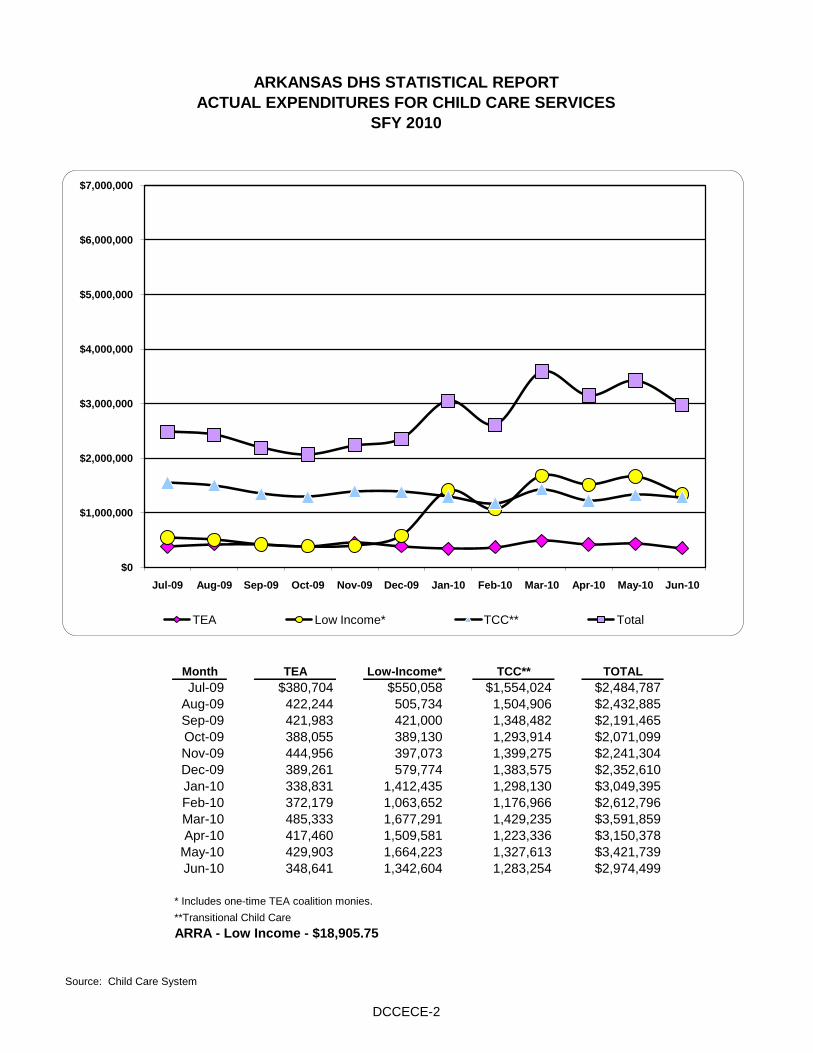
Source: Child Care System
$2,191,465
$2,071,099
$2,484,787
$2,432,885
$2,241,304
$2,352,610
$2,974,499
$3,049,395
$2,612,796
$3,591,859
$3,150,378
$3,421,739
348,641
417,460
429,903
485,333
1,412,435
1,293,914
1,176,9661,063,652
389,130
397,073
579,774
1,399,275
1,383,575
1,298,130
421,000
Feb-10
Sep-09
Oct-09
Nov-09
Dec-09
Jan-10
389,261
338,831
372,179
1,223,336
ARKANSAS DHS STATISTICAL REPORT
ACTUAL EXPENDITURES FOR CHILD CARE SERVICES
SFY 2010
Month TOTALLow-Income* TCC**TEA
422,244
421,983
388,055
444,956
1,348,482
505,734Aug-09
* Includes one-time TEA coalition monies.
**Transitional Child Care
Apr-10
Jun-10
1,327,6131,664,223
1,677,291
1,509,581
1,283,2541,342,604
1,429,235
ARRA - Low Income - $18,905.75
May-10
Mar-10
1,504,906
Jul-09 $550,058$380,704 $1,554,024
$0
$1,000,000
$2,000,000
$3,000,000
$4,000,000
$5,000,000
$6,000,000
$7,000,000
Jul-09 Aug-09 Sep-09 Oct-09 Nov-09 Dec-09 Jan-10 Feb-10 Mar-10 Apr-10 May-10 Jun-10
TEA Low Income* TCC** Total
DCCECE-2

ABC SUMMER CARE
SCHOOL
STIMULUS-SCHOOL
STIMULUS-TEEN EDUCATION
STIMULUS-TEEN EMPLOYMENT
STIMULUS-WORKING
STIMULUS-WORKING STUDENT
SUPPORTIVE SERVICES
TEEN EDUCATION
TEEN EMPLOYMENT
WORKING
WORKING STUDENT
JOB SEARCH
SCHOOL
WORK EXPERIENCE
TOTAL CHILDREN SERVED
ARKANSAS DHS STATISTICAL REPORT
$58,511,806TOTAL
ESS TOTAL 7,693
3,192
3,192FOSTER CARE TOTAL
Child Care Development Fund (CCDF)
3,917,831
$53,995,266
Source
FOSTER CARE
598,708PROTECTIVE SERVICES
FOSTER CARE
DISCRETIONARY FC NON IV-E
FOSTER CARE
$2,439,112
Children:
Extended Support Services (ESS) WORKING
All Data
7,693
$1,478,719
The Child Care Assistance Program began in 1989. The initial purpose of this program was to provide subsidized
childcare services to low-income families utilizing child care voucher services. The families must be working,
enrolled in an educational program, or attending training. Child care voucher services are also provided to families
and children needing Protective Services and Foster Care. In 1997 with the authorization of welfare reform, the
process was expanded to include families receiving Transitional Employment Assistance (TEA) and families
transitioning from TEA to Extended Support Services (ESS).
DIVISION OF CHILD CARE AND EARLY CHILDHOOD EDUCATION
CHILD CARE ASSISTANCE PROGRAMS
SFY 2010
A Child may be counted in each
cost center.
SFY 2010
LOW-INCOME TOTAL
41
4
7,473
1,335
45
39
2
3,895
809
LOW-INCOME
19,908
DISCRETIONARY FC NON IV-E
1,673
FOSTER CARE
1,519
2,704
1,798
1,763
PROTECTIVE SERVICES TOTAL
565
565
PROTECTIVE SERVICES
2,073
TEA TOTAL
1,410
1,765
5,248
36,606
TEA
DCCECE-3

WORKING
ABC SUMMER CARE
SCHOOL
STIMULUS-SCHOOL
STIMULUS-TEEN EDUCATION
STIMULUS-TEEN EMPLOYMENT
STIMULUS-WORKING
STIMULUS-WORKING STUDENT
SUPPORTIVE SERVICES
TEEN EDUCATION
TEEN EMPLOYMENT
WORKING
WORKING STUDENT
JOB SEARCH
SCHOOL
WORK EXPERIENCE
TOTAL FAMILIES SERVED
Source: Child Care System
ESS TOTAL
All Data4,077
4,077
FOSTER CARE
FOSTER CARE TOTAL
1,573
27
A Family may be counted in each
cost center.
DISCRETIONARY FC NON IV-E
738
FOSTER CARE
835
ARKANSAS DHS STATISTICAL REPORT
DIVISION OF CHILD CARE AND EARLY CHILDHOOD EDUCATION
CHILD CARE ASSISTANCE PROGRAMS
SFY 2010
LOW-INCOME
Families:
2,415
1,127
ESS
38
2
1,772
1,573
920
Number of providers who provided subsidized
services:1,504
OVERALL COUNT TABLE
Number of Cases
Served (excluding
FC) By DCC/ECE
435
12,609LOW-INCOME TOTAL
PROTECTIVE SERVICES TOTAL
PROTECTIVE SERVICES 330
330
1,166
40
4
4,663
16,752
Number of Children Served
By DCC/ECE
29,682
TEA
TEA TOTAL
1,245
967
1,081
3,293
21,882
Number of licensed child care centers or homes
and registered homes:2,824
Number of licensed or registered providers
approved to participate in the voucher system:1,996
17,831 27,297
Number of Cases
Served By DCC/ECE
Number of Children Served
(excluding FC) By DCC/ECE
CHILD CARE PROVIDERS:
DCCECE-4


2006-07 2007-08 2008-09 2009-10
1,708 1,837
ENHANCEMENT/IMPROVEMENT GRANTS
Grants are made available to providers for the purchase of equipment, materials, and supplies to enhance program
quality and assist with maintaining licensing standards. Providers must demonstrate age-appropriate immunizations for
all children in care to qualify for grants.
**CCDF grants were not available to fully or partially funded ABC programs.
Percentage of Approved Grants Which Are Used to
Correct Licensing Deficiencies (Outdoor, Indoor, e.g.)
ENHANCEMENT
GRANTS
222
61% 38% 75%
Percentage of Grants approved
Percentage of Denied Applications Which Are Due to
Incomplete Immunization Audits
84%
23%
47 45 47
25%
50 73 67
12% 20%
67% 66%
71
64%
64%
*Grants were placed on hold from March '07 - June '07.
117 143
Percentage of Grants Denied
Applications Denied
ARKANSAS DHS STATISTICAL REPORT
PROGRAM SUPPORT
SFY 2010
THE QUALITY PERSPECTIVE
The Program Development Unit within the Division is in a unique position of providing supportive services to child care
providers, families and division staff. The Unit provides development services to child care programs, staff and parents
through several methods. Developing and implementing new programs for young children include expanding current
programs and improving all early care and education child care programs. Professional development activities include
training and technical assistance services that encourage and ensure quality child care services for young children. The
professional and program development activities are inherent to supporting expansion of quality child care for Arkansas
children. Specific program activities include:
BASIC ORIENTATION COURSE FOR CHILD CARE STAFF/CHILD CARE ORIENTATION TRAINING (CCOT)
PROGRAM PROGRAM MEASUREMENTS
57 39
Number of Classes 110 120 105 120
CHILD CARE
ORIENTATION
TRAINING
297
Percentage of Persons Completing the 10
Modules 77% 75% 79% 83%
235
88% 80%
Number of Persons Enrolled 2,069 2,028
Number of Sites Providing Training 57 57
2008-09** 2009-10**
In 2009-2010, total grants awarded of $234,750 affected the care of 14,798 children in licensed child care settings.
PROGRAM 2006-07* 2007-08PROGRAM MEASUREMENTS
Applications Approved
42
77% 75%
402
242 115
TRAINING GRANTS *
Training grants are available to assist providers in accessing training for CPR and Red Cross Health and Safety training.
CPR training is required for licensure and this grant assists providers in paying for this required training. There were four
hundred forty-five (445) programs with six hundred eighteen (618) staff participants who accessed CPR/Red Cross
training through support from the DCC&ECE.
* Training grants for fiscal year '08 - '09 were limited to two (2) participants per licensed program and stopped March 31, 2010 to transition to
Better Beginnings.
DCCECE-5

*ABC and Head Start Programs were not eligible for CDA Scholarship Grants in FY2008-09
** Reflects current CDA's in Arkansas.
Approved CDA Institutions
Approved CDA Instructors
CDA
SCHOLARSHIP
PROGRAM
Number of Scholarships Awarded
Number of New CDA’s in State (Assessments)
ARKANSAS DHS STATISTICAL REPORT
PROGRAM SUPPORT
SFY 2010
Scholarships are made available to individuals working in child care programs to assist with the cost of training pursuant
to certification under the Child Development Associate Credential. This nationally recognized credential provides a
practicum for child care workers. The goal is to improve the learning environment for children in care.
In 2000, Arkansas implemented an approval procedure for institutions and instructors of CDA coursework. Institutions
submit verification of specific criteria to ensure that CDA courses offer high quality instruction for students. Currently,
there are 28 approved institutions and 87 approved instructors. The approved CDA institutions have adopted three CDA
common courses for consistency and to encourage articulation agreements throughout the higher education system.
PROGRAM MEASUREMENTS
CHILD DEVELOPMENT ASSOCIATE (CDA) SCHOLARSHIPS
The Arkansas Early Childhood Professional Development Registry tracks practitioners and trainers in an effort to
increase training and education levels and to ensure quality educational opportunities.
The Arkansas Early Childhood Professional Development System (AECPDS) was developed and guidelines were
promulgated in 2004. The purpose of the system is to create a coordinated system of professional development for early
care and education providers in Arkansas. The implementation of the system was made possible through five working
committees with the oversight of a steering committee. An evaluation of the system was completed September 2007 with
recommendations for improving the competency areas, the three registries, the career lattice and to include on-going
work with higher education. During 2008-2009, the system was rebranded and renamed TAPP (Traveling A rkansas
Professional Pathways). The Practioner Register now has 23,196 participants and the Trainer Registry has 1,221 verified
trainers. (Website: http://professionalregistry.astate.edu/)
PROFESSIONAL DEVELOPMENT
Arkansas currently has a total of 3,503 persons with the Child Development Associate Credential. This total includes all
persons in Arkansas that hold the CDA Credential and not just those in receipt of scholarship assistance. Previous years
have not reflected the entire count.
2006-07 2007-08
92 102
2009-102008-09
29 30
89 92 87 87
28
Total CDA’s in State
213
June 2010
102
5,211 7,408 8,860 3,503**
28
ADVANCED
Doctorate 5 9
Masters 123 141
199
376 559 1,452
595 379 180*
TOTAL TRAINERS 976 1,064 1,064
8,938
332 332
Technical 34 37
June 2009
INTERMEDIATE
Credential
Endorsement 267
37
BASICAwareness 3,867 8,083 8,083
Orientation 8,246
23,960TOTAL PRACTITIONERS 13,817 19,015
290 290
Training / Educational Categories Training / Educational Levels June 2008
494
Certificate 33 37 37
482 494
141
Baccalaureate 264
9
8,938
Associate
DCCECE-6

Foundation 3
Intermediate 1
Intermediate 2
Intermediate 3
Advanced 1
Advanced 2
Incomplete Appl
Total
AR Early Childhood Professional Development Registry (TAPP)
Best Care/Best Care Connected
Caregiver Certificate
Child Care Curriculum Endorsement
Directors Mentor Quality Initiative
Disaster Preparation
Early Childhood Health Initiative
Fit Kids
Governor's Work Life Initiative
Guiding Children Successfully
Healthy Hearts
Mental Health-Early Intervention
NAP SACC
PreK Early Learning Literacy in Arkansas (ELLA)
30
24
3,295
23,960
Entry
TAPP Map Level Number of Practitioners
Foundation 2
Foundation 1 3,940
7,419
2,400
1,545 1,179
Social/Emotional Learning
School-Age Child Care Credential
Pre-K ELLA is designed to provide guidance to early childhood educators with strategies and techniques in delivering
balanced literacy opportunities that provide a strong foundation for school and life success to young children in Arkansas.
DCC&ECE contracts with 14 other agencies, including the University of Arkansas at Fayetteville, that coordinates the 30
hour training.
Welcome the Children
PRE-K EARLY LEARNING LITERACY IN ARKANSAS (ELLA)
1,295 719
Classes 65 86 64
61%84%
Graduates 688
ARKANSAS DHS STATISTICAL REPORT
PROGRAM SUPPORT
SFY 2010
PROFESSIONAL DEVELOPMENT AND TRAINING ACTIVITIES
Development and Training Activities include:
Making 1st Experiences Count
2009-10
949
61
% Completion 58%
635
67%
Enrolled 1,195
Pre-K Ella Classes from March 1, 2006 - June 30, 2010
2006-07 2007-08 2008-09
PROFESSIONAL DEVELOPMENT (Continued)
6,124
688
15
25
DCCECE-7

Pre-K SEL Classes from July 1, 2007 - June 30, 2010
Framework Classes from July 1, 2007- June 30, 2010
2007-08
Graduates
91% 63%% Completion
66
2009-10
1,082
734
68%
1,081 311
2008-09
1,188 491
Program Measurements
Enrolled
Framework classes provide a foundation for early care providers in this framework, benchmarks, strategies, activities,
and development of curriculum related to the Framework and Kindergarten Readiness. This training also addresses the
observation and assessment of young children.
5726Classes
FRAMEWORK
2008-09
1,672
955
57%
80
54
TECHNICAL ASSISTANCE FOR PROGRAM DEVELOPMENT
Technical assistance is available by self-referral or referral from the licensing office to all child care programs in the state.
Childhood Services, affiliated with Arkansas State University, has established a group of early childhood professionals to
offer this assistance at no charge to providers.
427515 415 605
Loan guarantees are made to assist with the development of new facilities or expansion of existing facilities, particularly in
low-income, rural areas that demonstrate a need for additional quality child care. Guarantees are available to a
maximum of $25,000 and may be used for operating capital, as well as capital outlay.
ARKANSAS CHILD CARE FACILITIES LOAN GUARANTEE FUND
2009-10
1,343
705
53%
633
Arkansas Better Chance / Even Start Monitoring / TA
TYPE OF T/TA VISITS
Number of Person Enrolled
Training / Training Assistance (TA)
Number of Persons Completing
Completion Rate
Number of Classes
ARKANSAS CHILDREN’S PROGRAM ADMINISTRATOR ORIENTATION (NEW DIRECTOR’S ORIENTATION)
The Orientation is a licensure requirement and provides a comprehensive eighteen (18) hour training for all new directors
of child care centers. The topics in this series of trainings assist center directors in fulfilling his/her administrative duties.
Topics (which are divided into three (3) days of training) include: effective organizational management; effective
supervision; family and community relations; basics of legal and financial management; staffing for success; program
development; professional development; and effective communication. During the past year, eighteen classes were held
with 360 directors attending.
589
2006-07 2007-08 2008-09
515 523 665
2009-10
75%
1010 690 735 861
GRAND TOTAL
Technical Assistance Workshops 278
2,145 2,129 2,941 2,155
105 501 936
Quality Approval / Quality Initiative Monitoring / TA
ARKANSAS DHS STATISTICAL REPORT
PROGRAM SUPPORT
SFY 2010
PRE-SOCIAL EMOTIONAL LEARNING (PRE-K SEL)
Pre-K SEL provides teachers of three to five year olds knowledge and skills to build warm relationships with children,
parents and coworkers, to create positive and productive classroom climates, prevent challenging behavior, and to
manage disruptive behavior and teach children new skills so they can enter kindergarten ready to learn.
2007-08
72
Program Measurements
DCCECE-8

247 388
none
3 3
Total Guarantee Applications Denied/Rescinded $90,000 $0$205,000 $35,000
COMMUNITY DEVELOPMENT BLOCK GRANT PARTNERSHIP WITH ARKANSAS ECONOMIC DEVELOPMENT
COMMISSION
Current Total of Loans Guaranteed
Central Arkansas
Parents can access information on all licensed/registered child care homes and centers by accessing the DCC&ECE web
site at: http://www.arkansas.gov/childcare/ or through the 1-800-445-3316 line. All licensed and registered homes and
centers are included in the referral database. This web site also includes information on all services available throughout
the division, including information for parents on selecting child care programs. Local Child Care Resource and Referral
Agencies (CCR&R) continue to operate and support parental access and business involvement in early care issues both
locally and on a statewide basis.
Current Total Guarantees in Place (Fund Exposure)
$119,500$223,000 $119,500
$438,455
$90,000 $45,000 $45,000
$425,430 $442,413
Participating Financial Institutions
$433,920Guarantee Fund Investment
Total Defaults none
$198,000
$70,000
2 2
$-0-
nonenone
Capital Reduction (Accrued Interest Applied Before
Capital is Accessed)$-0- $-0- $-0-
DCC&ECE and Arkansas Economic Development Commission (AEDC) have a working partnership to assist in the
development of quality child care programs in Arkansas. DCC&ECE provides the pre-application review for AEDC to
determine the viability of potential child care projects. AEDC provides grant funding for construction or renovation of child
care facilities which will serve a majority of low to moderate-income children. These grants are available only to city or
county governments. Funding available to support these construction/renovation grants was decreased during the 07-08
SFY to $720,000 and with increased construction costs, the number of projects recommended has decreased.
2 3
2009-10
July 1, 2007PROGRAM July 1, 2008 July 1, 2009 July 1, 2010
ARKANSAS DHS STATISTICAL REPORT
PROGRAM SUPPORT
SFY 2010
300
CHILD CARE
RESOURCE
AND
REFERRAL
7,330North West
25 1095 2012
299 1,277 1,086
South East
1,459
Internet Usage for R & R 2,766,860 11,107**
1011
757,145 191,328
2006-07 2007-08
North Central 1,705 3,036 10,489
2009-102007-08
1,209
CHILD CARE RESOURCE CENTER
The Child Care Resource Center is a lending library and resource center for child care providers throughout the state. All
licensed and registered child care providers may apply for a user card and will receive a catalog of resources available.
The resource center is available for use by providers for training and staff development activities.
PROGRAM MEASUREMENTS 2006-07 2007-08 2008-09 2009-10
Visitors to Arkansas Child Care Resource Center (ACCRC) 515 547
2 2AEDC
3
4 3
4
Number of Projects Completed
Number of Projects Approved/Funded
2008-09PROGRAM MEASUREMENTSPROGRAM
251
* R&R established in 2006.**Report covers March 14, 2008 through June 30, 2008 ***South West CCR&R established in Fall of 2009
New Provider Kits Inquiries
693 1,029
3,513 3,968
12,859North East
337
CHILD CARE RESOURCE AND REFERRAL CENTER
PROGRAM
1,595
232
2008-09
833
PROGRAM MEASUREMENTS 2006-07
DCCECE-9

ARKANSAS
BETTER
CHANCE
TOTAL FUNDS AVAILABLE
2007-08 2008-09
SFY 2010
ARKANSAS BETTER CHANCE PROGRAMS
DCC&ECE, in cooperation with the Arkansas Department of Education and the Arkansas State Board of Education,
PROGRAM SUPPORT
ARKANSAS DHS STATISTICAL REPORT
Services may be home-based, such as the Home Instruction Program for Preschool Youngsters (HIPPY) or Parents as
Teachers (PAT), center-based programs, or licensed family home programs. In 2004, the Arkansas General Assembly
expanded this program by $40 million for the Arkansas Better Chance for School Success program. This component of
ABC targeted three and four-year old children from families with gross income of less than 200% of the Federal Poverty
Level. This program has essentially become the state funded Pre-K program in Arkansas, giving funding priority to
school districts in academic distress, districts with schools listed as being in school improvement status for two years and
districts with elementary schools where more than 75% of fourth-grade students score below proficient on math and
literacy benchmark exams. In 2007, the 86th General Assembly appropriated an additional $40 million which brings total
funding to $111 million. This fulfills the commitment made to state Pre-K.
2008-09
SCHOOL AGE & SUMMER PROGRAMS/BEST PRACTIES
The Arkansas Out of School Network (AOSN) continues to expand and increase collaboration and partnerships
agreements with programs and agencies involved in school age care and youth development activities. Grant funding
from the Mott Foundation continues and the network has received an Innovations Grant to support local community
development work using the Study Circle model in two Arkansas communities - Lake Village/Eudora and mid-town Little
Rock. An Arkansas team comprised of representatives from AOSN, DCCECE, ADE, State Board of Education and the
General Assembly (one Senator and two Representatives) formed the team to participate in Ready by 21, sponsored by
the National Council of State Legislators. Planning from this conference established the Youth Policy Summit held in
June of 2010. The Division actively supports the work of the AOSN and has implemented many recommendations of the
Governor's Task Force on best practices for school-age and summer programs including work conditions to establish
stand-alone school age licensing requirements for school-age/youth development programs. These recommendations
placed an increased focus on ensuring high quality programs for children and youth during out of school hours.
286
ABC Family
Day Homes
Number of Sites 20 19
Number of Children Served 5,351 5,689
68
INITIATIVES
286 286
5,510
Number of Classrooms 726 928
18,342
928
40
19 19
Number of Children Served 161
928
19,084
Number of Sites
Number of Children Served 13,219
40
5,612
18,557
40
HIPPY/PAT
ABC
ABC
CLASSROOMS
$71,166,500
2009-10
$111,000,000 $111,000,000 $111,000,000
$108,780,000 $109,002,000
$2,220,000 $1,998,000
1.80%
Granted to ABC Programs $67,203,507 $108,780,000
Administration Cost$1,399,330 $2,220,000
1.97% 2.00% 2.00%
DCCECE-10

Southern Good Faith Fund/Southern Bancorp, Pine Bluff
SCHOOL READINESS INDICATORS
American Recovery and Reinvestment Act Child Care Development Fund Quality Initiatives
The Division entered into contracts/grants with twelve organizations to support capacity building projects that will expand
and enhance quality and quantity of early care in Arkansas.
Arkansas State University Childhood Services Inc., State University
Child Care Connections, Little Rock
Northwest Arkansas Child Care Resources and Referral, Springdale
ARKANSAS DHS STATISTICAL REPORT
PROGRAM SUPPORTSFY 2010
The University of Arkansas at Little Rock (UALR) Children's Data Center/Institute for Economic Advancement continues
to gather and track school readiness indicators and provides data for policy planning. The ability to establish trend data
that informs our policy decisions occurs through use of the trending reports. Additional child health indicators are
incorporated each year and the "Getting Ready For School" report is released each Fall at the Early Care and Education
Economic Summit. The Division is working with UALR/Institute for Economic Advancement on an economic study of the
long-term impact of early care and education programs in Arkansas.
Jefferson Comprehensive Care Systems, Inc., Pine Bluff
University of Arkansas Cooperative Extension Service, Little Rock
UAMS/Partners for Inclusive Communities, North Little Rock
White River Planning and Development District/Children of NC Arkansas, Batesville
UAMS, Department of Psychiatry, Little Rock
Arkansas State Head Start Collaboration Project
Zero to Three National Center for Infants, Toddler and Families, Washington DC (project based in Pulaski County)
The Communities Group, Little Rock
Total contract funds: $4,740,189.93
Contracts/grants agreements are in place from July 1, 2009 through October 31,2010.
All projects are within the following seven categories and are designed to build infrastructure through the
training of trainers, development of capacity and support to expand quality and quantity of care for young
children.
Business of Child Care
Dollars and Sense/Business Development for Child Care
Family Child Care Business Training
Business Development/Planning Success
Early Care and Education Economic Summit
AR Family Child Care Association/support start-up
Quality Rating and Improvement System
Quality Care Education and Outreach Campaign
Quality Care development of tool kits and training
QRIS Evaluation of standards and processes
Child Care Coaches assigned to low-performing child care programs to assist in their work towards quality
Child Health and Well-Being
Foster Care/Infant Care best practices working with families and the current court system-joint projects with DCFS
Special Quest/Local Teams implement strategies for Inclusive Care for Children With Special Needs/joint project with
Head Start and DDS
Child Health Care Consultants/Infant Toddler Specialists assigned to each of the 6 Child Care Resource and Referral
agencies
Ages and Stages Developmental screening/pilot projects in the 6 CC&R areas/physician protocol being developed
DCCECE-11

Child Guidance and Behavior/Social Emotional Development
Al's Pals a social-emotional curriculum for preschool children training for teachers and use in 50 preschool classrooms
Al's Caring Pal's for Family Child Care/Social-emotional curriculum/training of trainers and delivery to family child care
TIPS/Brief Parenting Interventions-tip sheets-training for teachers and caregivers in high voucher use programs to assist
parents with child behavior issues
Parenting
Parenting Training with women in Substance Abuse Treatment
Best Practices/Parenting for Family Support Staff working with Voucher Providers/pilots for parenting training with
voucher families
Establish Child Care Resource and Referral in SW AR
Infant/Toddler Care
Infant Toddler Education Frameworks/Training of Trainers and expanded delivery of framework training
Infant and Toddler Specialists in six (6) local Child Care Resource and Referral Centers to develop new Infant/Toddler
programs
School Age/Youth Development Programming
High Scope Youth Program Quality Assessment/external and internal evaluators
Development of materials to support QRIS
On-line training for Development Assets Basics
After-School Academics
Standards development
Training and Technical Assistance to implement Governors Task Force on Best Practices for School Age and Summer
Programs
School Age Best Practice General Improvement Funds Projects
Legislation approved during the January 2009 General Assembly dedicated General Improvement Funds for school age
program grants serving school age children and implementing literacy, nutrition and physical activity curriculum. A
Request for Application was issued and two projects were funded: Save the Children in West Helena and In His Image
Youth Development Center in Little Rock. Both provided high quality care for school age children, participated in the
Youth Program Quality Assessment and met the Quality Standards as designed by the Governor's Task Force on Best
Practices for School Age and Summer Programs Funding for these pilot projects was for an eight month period.
Better Beginnings Implementation
The Better Beginnings Website was officially opened on June 1, 2010. Providers and parents can access information on-
line about Better Beginnings. Work continues to keep the site updated and with information that is interactive and
current.
The Better Beginnings Incentive Grants replacing all other enhancement, quality and Child Development Scholarship and
CPR grants became operational on July 1, 2010.
Child Care Resource and Referral Regional Agencies
The six regional Child Care Resource and Referral Agencies offer the following new projects/training opportunities to
early care programs in their catchment areas:
NAP-SACC--(Nutrition and Physical Activity-Self Assessment for Child Care) The NAP-SACC program offers a series of
4 training topics and concludes with a self-assessment and action plan for improving nutrition and physical activities for
children and adults in the programs. The program has been in existence in Arkansas for 4 years and has grown from 4
sites during year one to 66 sites.
ARKANSAS DHS STATISTICAL REPORT
PROGRAM SUPPORTSFY 2010
DCCECE-12

Child Care Resource and Referral Regional Agencies (Continued)
ARKANSAS DHS STATISTICAL REPORT
PROGRAM SUPPORTSFY 2010
Source: Program Support Unit
Family Child Care Business Training -----Training for family child care providers in business, management and fiscal
recordkeeping is provided to all newly licensed family child care providers on an individual basis and group sessions are
offered and open to all licensed family child care providers. The training is based on the Tom Copeland Business or
Family Child Care publications.
Ages and Stages Questionnaire (ASQ), a parent completed developmental screening is being piloted in over 50 child
care programs. The CCR&R staff have trained child care providers with high-voucher usage, in the use of the
developmental screening tools based on a child's age. The scoring is completed and information is shared on all children
screened with the local medical home for the child. A DHS fellow has worked on the evaluation component of this
project, a final report will be available in Fall of 2010. The ASQ project will continue with additional child care programs
being trained to expand this service.
DCCECE-13


Total Number of Paid Meals 611,979 597,400
Total Meals 2,116,510 2,207,284
Total Number of Free Meals 1,452,516 1,549,359
Total Number of Reduced Meals 52,015 60,525
Total Number of Paid Snacks 7,926 8,330
Total Snacks 168,497 180,390
Total Number of Free Snacks 160,157 170,895
Total Number of Reduced Snacks 1,007 1,165
Total Number of Paid Breakfasts 30,787 25,768
Total Breakfasts 615,581 701,810
Total Number of Free Breakfasts 632,595 668,080
Total Number of Reduced Breakfasts 7,062 7,962
Total Number of Paid Lunches 573,266 563,302
Total Lunches 1,276,976 1,325,084
Total Number of Free Lunches 659,764 710,384
Total Number of Reduced Lunches 43,946 51,398
Number of Facilities/Sites 117 124
Program Funds (Approximate) $3,066,184 $3,352,752
National School Lunch and Breakfast Programs
These programs provide reimbursement to an educational unit of high school grade or under, operating under
public or non-profit private ownership in a single building or complex of buildings. Organizations that are
licensed to provide residential child care.
SFY 2009 SFY 2010
Number of Contracts 87 91
Total Number of Paid Meals 5,907,564 5,985,680
Total Meals 28,884,547 30,346,730
Total Number of Free Meals 21,218,685 22,592,979
Total Number of Reduced Meals 1,758,298 1,768,071
SFY 2009 SFY 2010
Number of Contracts 504 522
Program Funds (Approximate) $36,591,761 $38,134,031
ARKANSAS DHS STATISTICAL REPORT
SPECIAL NUTRITION PROGRAMS
SFY 2010
The Special Nutrition Programs provide reimbursement for well-balanced, nutritious meals served to individuals
enrolled in participating programs. Total grants for these programs were $45,028,268. Funds for all programs
must be added together to capture the grand total.
Child and Adult Care Food Program
This program provides reimbursement to organizations providing licensed nonresidential day-care services.
Adult day-care centers may participate. Organizations may be reimbursed for two meals and one supplement
or one meal and two supplements per day.
DCCECE-14

* *
*Included in the National School Lunch Program (NSLP) program funds
Source: Special Nutrition Programs Unit
Program Funds (Approximate) $10,396 $5,388
Total Milk Served 56,171 36,434
Number of Contracts 7 5
Number of Facilities/Sites 7 5
Special Milk Program
This program provides reimbursement to any school or non-profit institution based on the number of half-pints
of milk served to participating children.
SFY 2009 SFY 2010
Total Number of Supplements 19,997 27,482
Total Meals 1,104,649 1,851,046
Total Number of Lunches 703,749 1,316,650
Total Number of Suppers 17,708 46,969
Program Funds (Approximate) $3,148,653 $3,541,485
Total Number of Breakfasts 363,195 459,945
Number of Contracts 113 130
Number of Facilities/Sites 311 339
ARKANSAS DHS STATISTICAL REPORT
SPECIAL NUTRITION PROGRAMS
SFY 2010
Summer Food Service Program
This program provides reimbursement to summer camps and migrant centers for up to three (3) meals per day.
Other sites may be reimbursed for two (2) meals per day.
SFY 2009 SFY 2010
DCCECE-15

* Program Funds for Special Milk Program were $5,387.93.
Source: Special Nutrition Program Unit
ARKANSAS DHS STATISTICAL REPORT
SPECIAL NUTRITION PROGRAMS
SFY 2010
$39.8
$3.4 $3.5
0
5
10
15
20
25
30
35
40
45
Child and Adult Care Food Program
National School Lunch and Breakfast Programs*
Summer Food Service
Program
Mil
lio
ns
Special Nutrition Programs 2010 Program Funds
$3.1
$3.4
2.1
2.2
2
3
4
SFY 2009 SFY 2010
Mil
lio
ns
National School Lunch and Breakfast Programs
Program Funds Total Meals
$3.1
$3.5
1.1
1.9
0
1
2
3
4
SFY 2009 SFY 2010
Summer Food Service Program
Program Funds Total Meals
$36.6
$39.8
28.930.3
0
5
10
15
20
25
30
35
40
45
SFY 2009 SFY 2010
Mil
lio
ns
Child and Adult Care Food Program
Program Funds Total Meals
DCCECE-16

Total $45,028,268
* Monies pulled by Service Date
Source: Special Nutrition Program Unit
Lafayette 149,724 Woodruff 78,291
Yell 437,461
Jefferson 2,362,894 Washington 1,956,879
Johnson 376,251 White 980,202
Izard 114,941 Union 707,297
Jackson 230,077 Van Buren 182,686
Howard 311,375 Sharp 535,514
Independence 592,679 Stone 144,702
Hempstead 462,062 Sebastian 317,589
Hot Spring 474,436 Sevier 290,175
Grant 47,307 Scott 103,564
Greene 613,902 Searcy 1,716,245
Fulton 113,917 Saint Francis 647,961
Garland 1,824,095 Saline 169,571
Faulkner 1,291,716 Pulaski 7,673,317
Franklin 254,183 Randolph 278,722
Desha 579,858 Pope 703,774
Drew 572,267 Prairie 28,580
Cross 305,557 Poinsett 356,501
Dallas 243,165 Polk 265,785
Crawford 862,204 Phillips 734,355
Crittenden 1,585,107 Pike 281,019
Conway 368,620 Ouachita 489,954
Craighead 1,698,221 Perry 162,439
Cleveland 139,018 Nevada 165,644
Columbia 455,198 Newton 113,371
Clay 154,914 Monroe 177,128
Cleburne 232,673 Montgomery 49,576
Chicot 596,227 Miller 498,214
Clark 409,929 Mississippi 1,335,505
Calhoun 48,888 Madison 116,577
Carroll 311,891 Marion 135,785
Boone 477,908 Logan 414,325
Bradley 286,476 Lonoke 614,045
Benton 1,587,459 Little River 169,938
Arkansas $325,177 Lawrence $223,891
Ashley 432,835 Lee 265,693
ARKANSAS DHS STATISTICAL REPORT
SPECIAL NUTRITION PROGRAMS
PAYMENTS BY COUNTY*
SFY 2010
County Payments County Payments
Baxter 471,562 Lincoln 141,280
DCCECE-17

2 26
Lee 5 223 0 1 20 7 71
Lawrence 4 224 1 2 130
7 71
Lafayette 2 145 0 2 82 0 0
Johnson 3 268 1 3 256
2 21
Jefferson 34 3,422 3 11 587 29 273
Jackson 5 411 1 2 139
4 46
Izard 3 138 1 3 74 2 26
Independence 13 1,289 3 4 153
2 24
Howard 7 374 1 2 41 10 141
Hot Spring 9 661 3 3 265
6 64
Hempstead 5 323 2 2 92 7 77
Greene 17 1,173 2 2 160
13 149
Grant 3 115 0 1 22 2 15
Garland 27 2,595 4 5 361
6 68
Fulton 2 231 0 3 67 3 30
Franklin 3 163 1 1 81
8 98
Faulkner 19 2,049 5 3 151 20 278
Drew 7 771 1 2 90
3 37
Desha 6 777 2 4 313 6 72
Dallas 2 235 1 1 139
14 176
Cross 10 515 2 1 100 8 97
Crittenden 20 2,044 3 6 322
24 260
Crawford 11 1,263 1 7 208 12 121
Craighead 35 3,018 2 6 295
3 42
Conway 7 447 0 1 159 11 142
Columbia 6 392 1 5 155
4 50
Cleveland 0 0 0 3 148 6 72
Cleburne 4 568 1 2 45
5 67
Clay 0 0 0 4 192 3 36
Clark 8 519 0 4 224
10 111
Chicot 7 432 1 3 123 11 110
Carroll 5 424 2 2 89
1 10
Calhoun 1 26 0 2 57 1 10
Bradley 4 372 1 2 76
32 371
Boone 15 1,096 1 3 135 10 138
Benton 45 6,377 0 7 355
Baxter 8 751 0 6 187 9 91
Ashley 10 595 0 2 90
Arkansas 3 199 0 2 179 11 148
6 66
ARKANSAS DHS STATISTICAL REPORT
SPECIAL NUTRITION PROGRAMS
CHILD AND ADULT CARE FOOD PROGRAM
SFY 2010
County
Day Care
Centers
Licensed
Capacity
Centers
Adult
Centers
Head Start
Sites
Licensed
Capacity
Head Starts
Day Care
Homes
Licensed
Capacity
Homes
DCCECE-18

Lincoln
Source: Special Nutrition Program Unit
677 7,642Total 862 77,166 82 279 14,084
4 64Yell 8 544 0 3 208
11 141
Woodruff 2 181 1 1 21 6 78
White 12 1,575 2 6 322
3 48
Washington 46 3,838 1 9 448 53 595
Van Buren 4 255 2 2 61
2 26
Union 7 563 1 8 583 5 50
Stone 1 42 3 1 30
12 168
St. Francis 9 680 1 1 50 13 157
Sharp 6 363 0 3 101
24 245
Sevier 6 323 1 1 42 4 46
Sebastian 29 2,508 0 9 400
6 61
Searcy 1 116 1 3 90 0 0
Scott 2 92 0 2 61
2 26
Saline 19 1,861 4 2 64 4 46
Randolph 5 340 1 2 168
0 0
Pulaski 211 20,079 6 23 1,499 69 604
Prairie 1 39 0 2 47
4 46
Pope 15 1,115 2 6 414 5 56
Polk 10 633 1 3 170
3 42
Poinsett 8 511 1 5 208 5 56
Pike 4 521 0 4 97
2 14
Phillips 10 1,015 1 5 182 12 131
Perry 3 149 0 2 40
2 19
Ouachita 2 201 0 5 262 21 229
Newton 3 65 1 6 92
2 26
Nevada 3 178 1 2 74 0 0
Montgomery 2 50 0 1 20
18 204
Monroe 2 96 0 2 42 7 64
Mississippi 18 1,819 2 16 1,079
8 105
Miller 4 220 0 4 140 12 149
Marion 1 32 0 3 78
13 142
Madison 3 124 0 1 70 8 87
Lonoke 18 1,827 1 3 216
Logan 6 260 1 4 188 12 150
Little River 3 162 0 2 58
3 164 0 2 97 1 16
4 46
ARKANSAS DHS STATISTICAL REPORT
SPECIAL NUTRITION PROGRAMS
CHILD AND ADULT CARE FOOD PROGRAM
SFY 2010
County
Day Care
Centers
Licensed
Capacity
Centers
Adult
Centers
Head Start
Sites
Licensed
Capacity
Head Starts
Day Care
Homes
Licensed
Capacity
Homes
DCCECE-19


ARKANSAS DHS STATISTICAL REPORT
LICENSING AND ACCREDITATION
SFY 2010
The Placement and Residential Unit is in the planning stages for a computer program that will be developed in
stages. The first stage will include the piece for monitoring DCFS foster homes. The second stage will bring in the
private agencies and the ability to track all licenses for the unit, as well as all monitoring being completed on the
tablet computer.
The Child Care Licensing and Accreditation Unit is responsible for licensing all child care situations where more
than five (5) children are cared for, maintaining the Voluntary Registry for persons providing care to five (5) or fewer
children who choose to be registered, administering the Quality Accreditation System, and licensing all child
placement and residential agencies. The Unit inspects most licensed centers and all licensed and registered
homes a minimum of three (3) times per year. Some licensed centers or homes that are a quality accreditation
level 2 or higher and have high levels of compliance may be placed on a reduced monitoring schedule. Technical
assistance and consultative services are provided to licensed and registered programs, applicants, and parents and
to programs that have applied for Quality Accreditation or are already Quality Accredited sites.
The Child Care Licensing Unit was placed with the Division of Child Care and Early Childhood Education following
passage of Act 1132 in 1997. Accreditation became part of the unit in 2005 when the Division began work on a
Quality Rating System (QRS) for licensed center and home child care providers. In July of 2009, Placement and
Residential Licensing was combined with Child Care Licensing. With this growth, the unit was renamed the
Licensing and Accreditation Unit, which consists of three parts: Child Care Licensing, Better Beginnings, and
Placement and Residential Licensing.
The Child Care Licensing Unit investigates complaints of non-compliance on licensed and registered child care
facilities. The Unit also assists the Crimes Against Children Division, of the Arkansas State Police and the Division
of Children and Family Services, in the investigation of child maltreatment complaints in these facilities. The Child
Care Licensing Unit is responsible for processing and tracking background checks on all child care
owners/operators and employees through the FBI, the State Police, and the Arkansas Child Maltreatment Central
Registry. Child Care Licensing staff members insure that appropriate corrective action is taken on any persons
found to have a record of child maltreatment and that persons who have a conviction of a prohibited offense are
removed from child care.
The Child Care Licensing Unit has converted to the collection of all field data by hand-held "tablet" computers to
further streamline the data collection process. The Licensing Unit has been working closely with Northrop Grumman
to redesign the central licensing computer system (CLEAN). The new system (CCLAS) will be an “occasionally
connected” system that will increase the efficiency of the staff, and increase communication with provider. It should
be in full operation by the end of September 2010.
The Better Beginnings Unit is responsible for maintaining the Quality Rating Improvement System (QRiS), which
initially consists of three tiers above the current level of the minimum licensing requirements. Providers qualifying
for the levels above minimum licensing will be entitled to grants based on their level of participation.
Implementation of QRiS began in July 2010. The Better Beginnings Unit continues to strive in efforts to improve the
quality of care for children in child care settings, and to increase the number of programs participating in Better
Beginnings.
The Placement and Residential Licensing Unit is responsible for licensing all child placement and residential
agencies. This includes state and private agencies that have one or more program that could include placement,
foster care, therapeutic foster care, residential facilities, psychiatric facilities, sex offender facilities, emergency
shelters, or adoption agency services. The Placement and Residential Licensing Unit investigates complaints of
non-compliance on licensed agencies. The Unit also assists the Crimes Against Children Division, of the Arkansas
State Police and the Division of Children and Family Services, in the investigation of child maltreatment complaints
in these facilities. The Licensing staff members also insure that appropriate corrective action is taken on any
persons found to have a record of child maltreatment and that persons who have a conviction of a prohibited
offense are removed from caring for children.
DCCECE-20

2 10Lee 11 531 7 74 605
0 0
Lawrence 18 1,048 2 26 1,074 0 0
Lafayette 7 321 1 16 337
4 18
Johnson 9 683 5 56 739 1 5
Jefferson 67 5,299 28 278 5,577
0 0
Jackson 10 1,118 1 16 1,134 1 6
Izard 7 248 2 26 274
0 0
Independence 27 2,461 4 46 2,507 1 5
Howard 14 690 10 141 831
1 5
Hot Spring 17 1,074 2 24 1,098 0 0
Hempstead 12 708 7 77 785
1 5
Greene 27 2,244 6 64 2,308 0 0
Grant 6 409 1 10 419
0 0
Garland 53 4,366 12 150 4,516 2 10
Fulton 7 434 3 30 464
1 5
Franklin 11 656 5 74 730 2 10
Faulkner 59 4,973 20 266 5,239
0 0
Drew 17 1,484 9 114 1,598 0 0
Desha 15 1,458 6 72 1,530
0 0
Dallas 9 633 2 32 665 1 5
Cross 16 886 7 90 976
0 0
Crittenden 47 3,983 17 200 4,183 0 0
Crawford 30 2,207 11 116 2,323
2 10
Craighead 84 6,697 25 270 6,967 0 0
Conway 16 981 8 110 1,091
0 0
Columbia 22 1,429 3 31 1,460 0 0
Cleveland 3 148 6 72 220
0 0
Cleburne 9 763 4 50 813 0 0
Clay 11 581 3 36 617
0 0
Clark 24 1,689 6 77 1,766 0 0
Chicot 17 1,255 11 109 1,364
0 0
Carroll 10 679 10 112 791 0 0
Calhoun 4 107 1 10 117
0 0
Bradley 12 1,049 2 20 1,069 0 0
Boone 26 1,738 10 136 1,874
1 5
Benton 132 14,126 32 388 14,514 3 15
Baxter 27 2,282 8 80 2,362
Arkansas 13 1,027 10 128 1,155 0 0
Ashley 24 1,496 6 66 1,562 0 0
ARKANSAS DHS STATISTICAL REPORT
CHILD CARE FACILITIES
SFY 2010
Licensed Facilities Registered Facilities
County
Child
Care
Centers 1
Capacity
Child Care
Family Homes Capacity
Total Capacity
Licensed
Voluntary
Homes 2
Total Capacity
Registered
DCCECE-21

Stone 5 234 4 52 286 00
1. Includes: Licensed Infant/Toddler and School Age Facilities
2. Includes: Registered Relative Family Homes
Source: Child Care Licensing
Total 2,083 166,536 661 7,129 173,665 64 320
0 0
Yell 12 960 4 64 1,024 0 0
Woodruff 5 304 6 78 382
6 35
White 34 3,491 11 141 3,632 1 5
Washington 134 11,058 53 60 11,118
0 0
Van Buren 11 665 3 48 713 0 0
Union 26 2,040 7 76 2,116
0 0
Sharp 11 573 13 190 763 0 0
Sevier 11 523 4 46 569
0 0
Sebastian 82 6,502 22 248 6,750 5 25
Searcy 7 331 0 0 331
0 0
Scott 5 462 3 36 498 0 0
Saline 42 3,983 6 64 4,047
0 0
Saint Francis 17 1,329 13 157 1,486 0 0
Randolph 13 732 2 26 758
0 0
Pulaski 418 39,976 65 604 40,580 17 81
Prairie 5 146 1 10 156
1 5
Pope 38 3,173 5 50 3,223 0 0
Polk 17 819 4 46 865
0 0
Poinsett 22 1,191 5 56 1,247 0 0
Pike 11 796 4 52 848
1 5
Phillips 29 1,574 10 122 1,696 1 5
Perry 6 240 1 10 250
0 0
Ouachita 16 809 24 255 1,064 0 0
Newton 9 181 2 19 200
0 0
Nevada 7 339 0 0 339 0 0
Montgomery 6 207 2 26 233
1 5
Monroe 7 263 7 69 332 1 5
Mississippi 46 2,828 18 209 3,037
0 0
Miller 26 1,354 11 144 1,498 1 5
Marion 6 265 8 104 369
4 20
Madison 5 218 5 68 286 2 10
Lonoke 37 3,483 8 94 3,577
Logan 13 778 12 150 928 0 0
Little River 8 444 4 46 490
Lincoln 6 304 1 16 320 0 0
0 0
SFY 2010
Licensed Facilities Registered Facilities
County
Child
Care
Centers 1
Capacity
Child Care
Family Homes Capacity
Total Capacity
Licensed
Voluntary
Homes 2
Total Capacity
Registered
ARKANSAS DHS STATISTICAL REPORT
CHILD CARE FACILITIES
DCCECE-22

Total Capacity*: 173,665
*Does not include Voluntary Registered Facilities
5 unchanged1,498
3371,562 1,364
31 decreased1,460 2,116
39 increased117 1,069
1,766
569 665 320
220 1,530
490 785 339 1,064 1,598
865
5,577 1,155
1,098 419
831 848
40,580
233 4,516 4,047 332 1,696
1,024 250
156
498 3,577 605
4,183
928 3,632
6,750 5,239 382 1,486
976
730 3,223 813 1,134
1,091
3,037
286 2,507
2,323 739 713 1,247
274 763 2,308
1,074
11,118 286 200 331 6,967
464
ARKANSAS DHS STATISTICAL REPORT
CAPACITY OF
CHILD CARE FACILITIES
BY COUNTY
SFY 2010
758 617
14,514 791 1,874 369 2,362
ARKANSAS
ASHLEY
BAXTERBENTON BOONE
BRADLEYCALHOUN
CARROLL
CHICOT
CLARK
CLAY
CLEBURNE
CLEVELAND
COLUMBIA
CONWAY
CRAIGHEAD
CRAWFORD
CROSS
DALLAS
DESHA
DREW
FAULKNER
FULTON
GARLAND
GRANT
GREENE
HEMPSTEAD
HOT SPRING
HOWARD
IZARD
JACKSON
JEFFERSON
JOHNSON
LAWRENCE
LEE
LINCOLN
LOGAN
LONOKE
MADISON
MARION
MILLER
MISSISSIPPI
MONROEMONTGOMERY
NEVADA
NEWTON
OUACHITA
PERRY
PHILLIPS
PIKE
POINSETT
POLK
POPE
PRAIRIE
PULASKI
RANDOLPH
ST. FRANCIS
SALINE
SCOTT
SEARCY
SEVIER
SHARP
STONE
UNION
VAN BUREN
WASHINGTON
WHITE
WOODRUFF
YELL
INDEPENDENCE
SEBASTIAN
FRANKLIN
CRITTENDEN
LITTLE RIVER
LAFAYETTE
DCCECE-23

State Fiscal Year Total Licenses Preschool
Child Care
Family Homes Infant/Toddler School Age
2008 4,243 1,796 759 1,027 661
2009 4,244 1,802 726 1,045 671
2010 4,231 1,801 661 1,070 699
ARKANSAS DHS STATISTICAL REPORT
CHILD CARE LICENSES
SFY 2008 - 2010
CHILD CARE LICENSES
Source: Child Care Licensing
4,243
1,796
759
1,027
661
4,244
1,802
726
1,045
671
4,231
1,801
661
1,070
699
0
500
1000
1500
2000
2500
3000
3500
4000
4500
5000
Total Licenses Preschool Child Care Family Homes
Infant/Toddler School Age
2008 2009 2010
DCCECE-24

State Fiscal
Year
Child Care
License Growth
Pattern
2000 3,996
2001 3,767
2002 3,669
2003 3,821
2004 3,930
2005 4,019
2006 4,207
2007 4,180
2008 4,243
2009 4,244
2010 4,231
Source: Child Care Licensing
CHILD CARE LICENSES
SFY 2010
CHILD CARE LICENSES GROWTH PATTERN
ARKANSAS DHS STATISTICAL REPORT
3,996
3,7673,669
3,8213,930
4,019
4,207 4,1804,243 4,244 4,231
0
1000
2000
3000
4000
5000
2000 2001 2002 2003 2004 2005 2006 2007 2008 2009 2010
State Fiscal Year
Child Care License Growth Pattern
DCCECE-25

Type Investigations SubstantiatedPercentage
Substantiated
Voluntary Registered/
Relative In Home
0 0 0.0%
Unlicensed 76 30 39.5%
Child Care Family
Home69 20 29.0%
Child Care Facilities
Preschool, I/T, SA644 188 29.2%
TOTAL 789 238 30.2% *
*This procedure is necessary since all child maltreatment complaints also involve potential licensing
violations. For example, allegations of child maltreatment involving physical abuse would also be
investigated as a possible violation of licensing requirements in the behavior guidance section.
Source: Child Care Licensing
ARKANSAS DHS STATISTICAL REPORT
LICENSING COMPLAINTS
SFY 2010
0
100
200
300
400
500
600
700
Voluntary Registered/ Relative In Home
Unlicensed Child Care Family Home
Child Care Facilities Preschool, I/T, SA
Investigations
Substantiated
DCCECE-26

SFY 2008 SFY 2009 SFY 2010
422 327 320
8,810 8,370 7,669
32,203 32,962 34,435
84,178 85,425 86,489
172,040 173,912 176,684
Source: Child Care Licensing
ARKANSAS DHS STATISTICAL REPORT
MAXIMUM CAPACITY
OF FACILITIES
SFY 2010
Facilities
Registered Family Homes
Child Care Family Homes
Infant/Toddler Centers
Preschools
Maximum Capacity
320
7,669
34,435
86,489
176,684
327
8,370
32,962
85,425
173,912
422
8,810
32,203
84,178
172,040
0 50,000 100,000 150,000 200,000
Registered Family Homes
Child Care Family Homes
Infant/Toddler Centers
Preschools
Maximum Capacity
SFY 2008 SFY 2009 SFY 2010
DCCECE-27
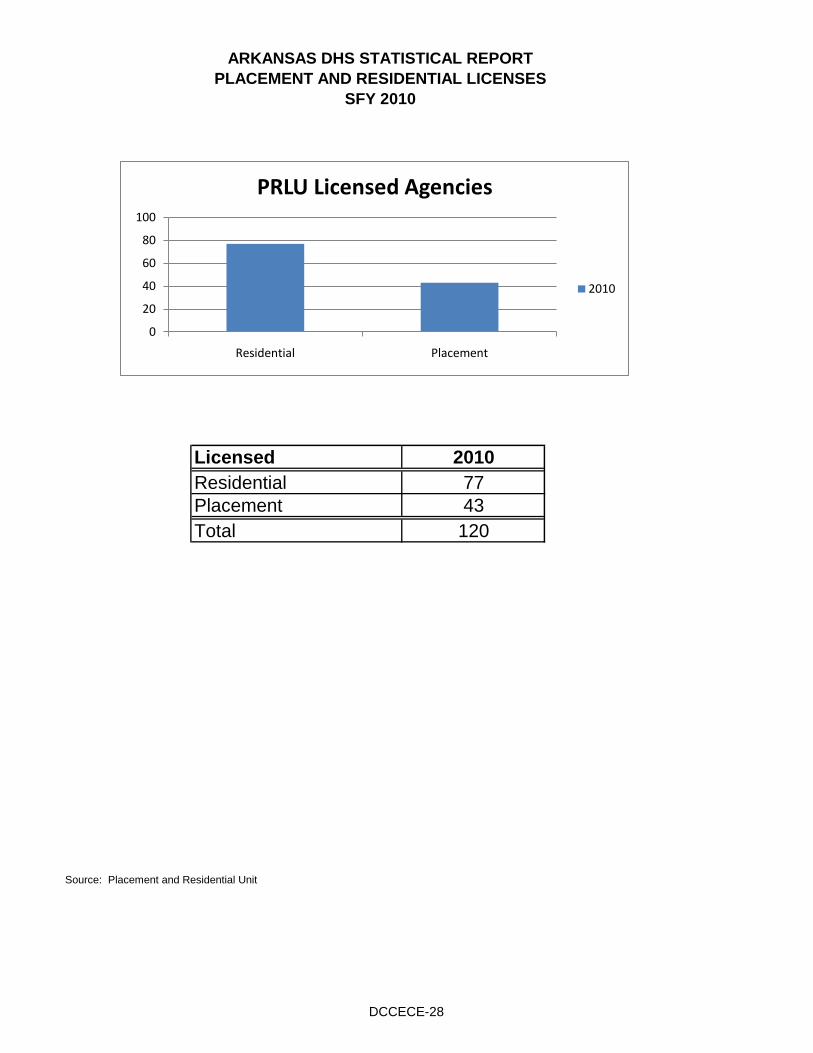
Licensed 2010
Residential 77
Placement 43
Total 120
ARKANSAS DHS STATISTICAL REPORT
PLACEMENT AND RESIDENTIAL LICENSES
SFY 2010
Source: Placement and Residential Unit
0
20
40
60
80
100
Residential Placement
PRLU Licensed Agencies
2010
DCCECE-28

Provider Types 2010
Regular Residential 52
Emergency 14
Psychiatric 14
Sex Offender 3
Totals 83
PLACEMENT AND RESIDENTIAL UNIT
RESIDENTIAL PROVIDER TYPES
SFY 2010
Source: Placement and Residential Unit
ARKANSAS DHS STATISTICAL REPORT
0
10
20
30
40
50
60
Regular Residential
Emergency Psychiatric Sex Offender
Residential Provider Types
2010
DCCECE-29

Provider Types 2010
Foster Care 16
Theraputic Foster Care 8
Placement Only 14
Adoption 20
Totals 58
PLACEMENT PROVIDER TYPES
SFY 2010
Source: Placement and Residential Unit
ARKANSAS DHS STATISTICAL REPORT
PLACEMENT AND RESIDENTIAL UNIT
0
5
10
15
20
25
Foster Care Theraputic Foster Care
Placement Only Adoption
Placement Provider Types
2010
DCCECE-30


The Division of Children and Family Services (DCFS)
Arkansas State Police (Crimes Against Children Division)
DCFS County Staff
Protective Services
In 1997, DHS and the Arkansas State Police entered into a contractual agreement that formed the Family
Protection Unit now known as the Crimes Against Children Division (CACD). The CACD is composed of two
sections: 1) the Child Abuse Hotline, and 2) civilian employees who assess child maltreatment reports. The
CACD maintains an around-the-clock statewide intake process (The Child Abuse Hotline) for accepting reports of
alleged child maltreatment. The CACD’s civilian employees are responsible for assessing Priority l allegations of
severe maltreatment, involving severe physical and sexual abuse. They also conduct investigations of
maltreatment in DCFS foster homes and pre-adoptive homes. CACD completed 6,700 (20%) investigations in
SFY 2010.
ARKANSAS DHS STATISTICAL REPORT
THE DIVISION OF CHILDREN AND FAMILY SERVICES
INTRODUCTION
SFY 2010
DCFS staff housed in DHS county offices assesses allegations of child maltreatment in which the perpetrator is
in the home and not the specific responsibility of CACD. DCFS staff in the county office has primary
responsibility for assessing an allegation of child maltreatment and seeks to ascertain the existence, cause,
nature and extent of child maltreatment, the existence of previous injuries, and the names and conditions of other
children in the home. DCFS remains primarily responsible for ensuring the health and safety of the children, even
if the primary responsibility for the investigation belongs to the CACD. DCFS has the responsibility for the
assessment of Priority II reports.
DCFS is committed to protecting children and preserving families. Every child deserves to grow up in a
permanent family. The primary and preferred way of achieving this goal is to provide families experiencing
turmoil with services to prevent the need to place children outside their home. When a child must be separated
from his/her family, DCFS will provide a safe environment and will make efforts to provide services to reunite the
family or to find the child a permanent home.
In State Fiscal Year (SFY) 2010, 32,915 reports of abuse and neglect were investigated. Of these reports of
abuse and neglect, 7,831 (24%) were determined to be true, 25,084 (76%) were unsubstantiated. Of the
reports accepted for investigation, 26,215 (80%) were assigned to DCFS.
When an investigation is determined to be true, DCFS opens a protective service case and works with the
child(ren) and family in the home or, if the abuse is severe, DCFS places the child in a safe and home-like
setting. In SFY 2010, DCFS served 26,407 children in 11,804 families in this capacity. The purpose of the
services is to provide the child with a continuous, safe and stable living environment, promote family autonomy,
strengthen family life where possible, and promote the reunification of the child with the parent, guardian or
custodian, when applicable.
The Child Maltreatment Assessment Protocol (PUB-357) is used for screening and prioritizing all allegations of
child maltreatment. This protocol is used when a DCFS Family Service Worker (FSW) or the CACD conducts a
Child Maltreatment Assessment. It identifies and defines the various types of child maltreatment a FSW/CACD
worker may encounter during an assessment. The protocol also identifies when and from whom an allegation of
child maltreatment may be taken. Finally, it identifies those conditions, which must be met before an allegation of
abuse or neglect can be founded (determined to be true).
In addition, DCFS investigates Priority I reports of abandonment, failure to protect, medical neglect of disabled
infants, failure to thrive, malnutrition, and substantial possibility of severe maltreatment.
DCFS-1

The Children's Reporting System used the following methodology to identify a foster child:
●
●
●
Children’s Reporting and Information System (CHRIS)
Open Removal at any time during the SFY 2010 period
Open Case at any time during the SFY 2010 period
Open Removal later than adoption legalized date (this captures a child, when he/she goes back into Foster
Care after the adoption has been dissolved).
When a child has been removed and needs a foster home placement, DCFS places the child in an approved
foster home. The approval process ensures that a potential foster parent attends training and meets health,
safety, and physical requirements and satisfies other standards outlined in the Standards for Approval of Foster
Family Homes. In SFY 2010, there were 458 new foster homes approved, resulting in a total of 1,150 foster
homes in Arkansas.
ARKANSAS DHS STATISTICAL REPORT
THE DIVISION OF CHILDREN AND FAMILY SERVICES
The Family Resource Centers (FRC) are community-based and family focused and offer services directed
toward prevention, intervention, and alleviation of community identified problems. Each facility provides
educational and support services to assist parents and is open to all families in its targeted community. The
centers are designed to work with the Division of Children and Family Services county offices to address the
needs of DCFS clients.
Preventive and Support Services
Central Registry
Foster Homes
Source: Division of Children and Family Services
INTRODUCTION
SFY 2010
CHRIS was implemented in December 1997 as DCFS’ worker-based information system and source of data for
state, federal and management reports. Data described in this report was pulled from the CHRIS system.
This unit serves as the repository of all child maltreatment reports. The Child Maltreatment Reporting Act
requires that a statewide central registry be established within the Department of Human Services (DHS) for the
collection of information relative to the child maltreatment reports. The registry contains identifying data, dates
and circumstances of any persons requesting or receiving information from the registry. There were 85,659
registry checks made in SFY 2010.
When there is no abuse or neglect present, but a family requests services, DCFS opens a Supportive Services
case. In SFY 2010, DCFS served 2,380 children in 1,086 families.
There are a limited number of situations when children cannot safely remain at home and must be separated
from their family. When a child must be separated from the family, DCFS will provide a healthy and safe
environment and will make appropriate and timely efforts to provide services to reunite the family. In SFY 2010,
DCFS placed 7,491 in substitute care settings: Kinship Care, Foster Care, Therapeutic Foster Care, Residential
Care, Shelters, etc.
Foster Care Services
Adoption Services
The school based Human Services Worker program was not funded in SFY 2010.
All children deserve a permanent home. One option is to terminate parental rights to free a child for adoptive
placement when it has been determined to be in the best interest of the child. In SFY 2010, there were 342
children placed in adoptive homes.
DCFS-2


Source: Division of Children and Family Services
SFY 2006 - 2010
CHILD MALTREATMENT ASSESSMENT SERVICES
The Division of Children and Family Services maintains, via an interagency agreement with the Arkansas State
Police, an around-the-clock statewide intake process for accepting reports of alleged child maltreatment. During
state fiscal year 2010, a total of 32,915 maltreatment reports were received, assessed and completed. Of these
abuse and neglect reports, 25,084 were unsubstantiated.
Child Maltreatment Reports Assessed/Completed
ARKANSAS DHS STATISTICAL REPORT
SFY 2010
25,178
26,81727,672
30,191
32,915
0
5,000
10,000
15,000
20,000
25,000
30,000
35,000
2006 2007 2008 2009 2010
State Fiscal Year
DCFS-3

Percent
True Determined Unsubstantiated Unable to Assessments
County Assessments to be True Assessments Exempt** Locate Completed
Arkansas 59 26.94% 157 1 2 0 219
Ashley 64 31.68% 127 6 5 0 202
Baxter 93 21.09% 339 5 4 0 441
Benton 520 24.25% 1,469 42 106 7 2,144
Boone 149 25.34% 423 6 9 1 588
Bradley 27 23.68% 82 0 3 2 114
Calhoun 10 18.18% 44 0 1 0 55
Carroll 79 28.83% 176 3 15 1 274
Chicot 30 26.55% 81 2 0 0 113
Clark 38 20.77% 138 2 3 2 183
Clay 42 18.10% 179 4 7 0 232
Cleburne 72 24.32% 214 1 5 4 296
Cleveland 19 20.88% 70 0 1 1 91
Columbia 53 31.93% 104 4 4 1 166
Conway 79 24.23% 231 7 7 2 326
Craighead 367 30.38% 789 29 21 2 1,208
Crawford 160 20.86% 547 12 20 28 767
Crittenden 182 28.17% 416 24 24 0 646
Cross 79 28.94% 157 14 23 0 273
Dallas 22 20.18% 86 0 1 0 109
Desha 25 19.69% 99 2 0 1 127
Drew 62 31.00% 133 5 0 0 200
Faulkner 209 22.87% 653 16 32 4 914
Franklin 55 28.65% 128 0 8 1 192
Fulton 46 28.57% 109 0 3 3 161
Garland 183 16.07% 819 60 73 4 1,139
Grant 54 24.55% 161 2 2 1 220
Greene 191 24.61% 535 19 23 8 776
Hempstead 51 26.42% 128 3 9 2 193
Hot Spring 88 18.53% 373 10 3 1 475
Howard 18 13.85% 108 0 3 1 130
Independence 116 25.00% 328 12 4 4 464
Izard 51 29.31% 119 0 0 4 174
Jackson 47 22.60% 153 6 2 0 208
Jefferson 190 25.27% 485 30 33 14 752
Johnson 104 28.11% 237 11 17 1 370
Lafayette 25 33.78% 46 2 0 1 74
Lawrence 79 28.32% 191 2 5 2 279
Lee 9 12.16% 62 3 0 0 74
* Includes assessments completed by DCFS, CACD and Law Enforcement.
** Includes Religious and Underage Juvenile Aggressor Exemptions
Unknown
ARKANSAS DHS STATISTICAL REPORT
CHILD MALTREATMENT ASSESSMENTS*
BY FINDINGS
SFY 2010
DCFS-4

Percent
True Determined Unsubstantiated Unable to Assessments
County Assessments to be True Assessments Exempt** Locate Completed
Lincoln 28 19.58% 113 2 0 0 143
Little River 36 24.66% 102 2 4 2 146
Logan 60 19.23% 223 2 21 6 312
Lonoke 202 23.60% 576 25 52 1 856
Madison 59 30.26% 128 2 4 2 195
Marion 30 16.30% 148 2 4 0 184
Miller 141 24.14% 331 15 87 10 584
Mississippi 194 27.87% 458 24 17 3 696
Monroe 20 23.81% 60 2 1 1 84
Montgomery 15 15.96% 69 4 3 3 94
Nevada 27 27.00% 60 2 5 6 100
Newton 20 25.64% 56 0 1 1 78
Ouachita 97 33.80% 182 3 4 1 287
Perry 23 18.40% 95 1 6 0 125
Phillips 33 14.29% 173 8 16 1 231
Pike 13 12.38% 86 2 4 0 105
Poinsett 120 20.76% 418 9 29 2 578
Polk 75 29.88% 163 5 7 1 251
Pope 124 17.92% 531 14 20 3 692
Prairie 22 27.50% 51 2 5 0 80
Pulaski 819 23.11% 2,496 107 120 2 3,544
Randolph 53 20.00% 181 6 7 18 265
Saline 206 18.78% 810 27 49 5 1,097
Scott 46 25.99% 115 3 11 2 177
Searcy 16 20.25% 61 1 1 0 79
Sebastian 404 25.14% 1,085 36 44 38 1,607
Sevier 45 25.14% 121 1 9 3 179
Sharp 73 29.44% 168 5 1 1 248
St. Francis 74 21.45% 253 11 4 3 345
Stone 27 21.77% 93 0 2 2 124
Union 149 38.11% 220 5 13 4 391
Van Buren 52 24.64% 151 6 2 0 211
Washington 510 22.89% 1,585 32 91 10 2,228
White 206 24.09% 620 8 16 5 855
Woodruff 20 21.98% 67 2 1 1 91
Yell 44 15.83% 214 8 3 9 278
State Office 1 16.67% 4 1 0 0 6
State Total 7,831 23.79% 22,963 730 1,142 249 32,915
Source: Division of Children and Family Services
Unknown
* Includes assessments completed by DCFS, CACD and Law Enforcement.
** Includes Religious and Underage Juvenile Aggressor Exemptions
ARKANSAS DHS STATISTICAL REPORT
CHILD MALTREATMENT ASSESSMENTS*
BY FINDINGS
SFY 2010
DCFS-5
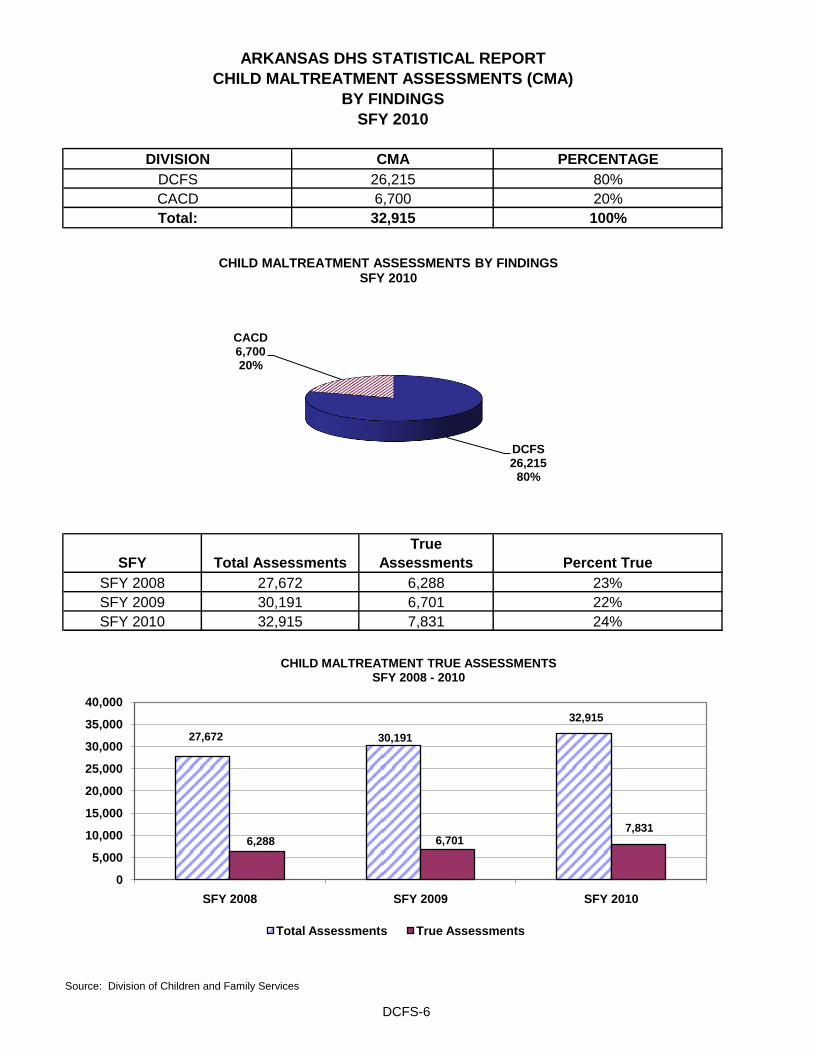
Source: Division of Children and Family Services
ARKANSAS DHS STATISTICAL REPORT
CHILD MALTREATMENT ASSESSMENTS (CMA)
BY FINDINGS
SFY 2010
26,215 80%
20%
100%
DCFS
CACD 6,700
24%
Total:
CMA
SFY 2010 32,915
True
Assessments
6,288
6,701
7,831
SFY 2008
SFY 2009
32,915
DIVISION
30,191
SFY
PERCENTAGE
Total Assessments
27,672
Percent True
23%
22%
DCFS26,215
80%
CACD6,70020%
CHILD MALTREATMENT ASSESSMENTS BY FINDINGS SFY 2010
27,672 30,191
32,915
6,288 6,7017,831
0
5,000
10,000
15,000
20,000
25,000
30,000
35,000
40,000
SFY 2008 SFY 2009 SFY 2010
CHILD MALTREATMENT TRUE ASSESSMENTS SFY 2008 - 2010
Total Assessments True Assessments
DCFS-6

ABUSE
1.
2.
3.
4.
1.
2.
3.
4.
1.
2.
3.
4. The child is in danger of hurting himself or others;
5.
6.
NOTE: The prior list of unreasonable actions is considered illustrative and not exclusive.
The agency has policy and procedures regarding restraints;
The person exercising the restraint is an employee of an agency licensed or exempted from
licensure under the Child Welfare Agency Licensing Act;
The person exercising the restraint has been trained in properly restraining children, de-escalation,
and conflict resolution techniques; and
Reasonable and moderate physical discipline inflicted by a parent or guardian shall not include any act that
is likely to cause and which does cause injury more serious than transient pain or minor temporary marks.
The age, size and condition of the child and the location of the injury and the frequency of recurrence of
injuries shall be considered when determining whether the physical discipline is reasonable or moderate.
No other alternative exists to control the child except for a restraint;
The restraint is for a reasonable period of time.
Injury to a juvenile’s intellectual, emotional or psychological development as evidenced by observable and
substantial impairment of the juvenile’s ability to function within the juvenile’s normal range of performance
and behavior.
No unreasonable action shall be construed to permit a finding of abuse without having established the
elements of abuse.
Abuse shall not include physical discipline of a child when it is reasonable and moderate and is inflicted by
a parent or guardian for purposes of restraining or correcting the child.
Abuse shall not include when a child suffers transient pain or minor temporary marks as the result of a
reasonable restraint if:
Any history that is at variance with the history given.
Any non-accidental physical injury.
Any of the following intentional or knowing acts, with physical injury and without justifiable cause:
Throwing, kicking, burning, biting or cutting a child.
Striking a child age seven or older on the face or head.
Any of the following intentional or knowing acts, with or without injury:
Striking a child age six or younger on the face or head.
Shaking a child age three or younger.
Interfering with a child’s breathing.
Pinching or striking a child in the genital area.
Striking a child with a closed fist.
Shaking a child.
Engaging in conduct creating a realistic and serious threat of death, permanent or temporary
disfigurement, or impairment of any bodily organ.
ARKANSAS DHS STATISTICAL REPORT
MALTREATMENT DEFINITIONS
SFY 2010
Any of the following acts or omissions by a parent, guardian, custodian, foster parent, person eighteen (18) years
of age or older living in the home with a child whether related or unrelated to the child, or any person who is
entrusted with the juvenile’s care by a parent, guardian, custodian, or foster parent, including, but not limited to,
an agent or employee of a public or private residential home, child care facility, public or private school, or any
person legally responsible for the juvenile’s welfare, but excluding the spouse of a minor:
Extreme or repeated cruelty to a juvenile.
DCFS-7

SEXUAL ABUSE
1.
2.
1.
1.
1.
2.
1.
NEGLECT
Failure or irremediable inability to provide for the essential and necessary physical, mental, or emotional,
needs of the juvenile;
Failure to provide for the juvenile’s care and maintenance, proper or necessary support, or medical,
surgical, or other necessary care;
Actual or attempted sexual intercourse, deviate sexual activity, or sexual contact by forcible
compulsion.
ARKANSAS DHS STATISTICAL REPORT
MALTREATMENT DEFINITIONS
SFY 2010
(continued)
Failure, although able, to assume responsibility for the care and custody of the juvenile or participate in a
plan to assume such responsibility;
Failure to appropriately supervise the juvenile that results in the juvenile’s being left alone at an
inappropriate age or in inappropriate circumstances that put the juvenile in danger; or
By a person ten (10) years of age or older to a person younger than eighteen (18) years of age:
Actual or attempted sexual intercourse, deviate sexual activity, or sexual contact by forcible
compulsion;
Indecent exposure, or forcing, the watching of pornography or live sexual activity;
Actual or attempted sexual intercourse, deviate sexual activity, or sexual contact or solicitation;
By a person eighteen (18) years of age or older to a person not his or her spouse who is younger than
sixteen (16) years of age:
Acts or omissions of a parent, guardian, custodian, foster parent, or any person who is entrusted with the
juvenile’s care by a parent, custodian, guardian, or foster parent, including, but not limited to, an agent or
employee of a public or private residential home, child care facility, public or private school, or any person legally
responsible under state law for the juvenile’s welfare, but excluding the spouse of a minor and the parents of a
married minor, which constitute:
Failure or refusal to prevent the abuse of the juvenile when the person knows or has reasonable cause to
know the juvenile is or has been abused;
Failure to take reasonable action to protect the juvenile from abandonment, abuse, sexual abuse, sexual
exploitation, neglect, or parental unfitness where the existence of such condition was known or should
have been known;
By a sibling or caretaker to a person younger than eighteen (18) years of age:
By a caretaker to a person younger than eighteen (18) years of age:
By a person younger than ten (10) years of age to a person younger than eighteen (18) years of age:
Actual or attempted sexual intercourse, deviate sexual activity, or sexual contact or solicitation;
Forcing or encouraging the watching of pornography;
Forcing, permitting, or encouraging the watching of live sexual activity;
Failure or refusal to provide the necessary food, clothing, or shelter, and education required by law, or
medical treatment necessary for the juvenile’s well-being, except when the failure or refusal is caused
primarily by the financial inability of the person legally responsible and no services for relief have been
offered or rejected.
DCFS-8
EXEMPTED FROM TRUE DUE TO RELIGIOUS EXEMPTION
PREPONDERANCE OF THE EVIDENCE
Source: Division of Children and Family Services
Evidence which is of greater weight or more convincing than the evidence which is offered in opposition to it; that
is, evidence which, as a whole, shows that the fact to be proved is more probable than not.
A protocol is used when a DCFS Family Service Worker (FSW) or the Arkansas State Police conducts a Child
Maltreatment Assessment. It identifies and defines the various types of child maltreatment a FSW/CACD may
encounter during an assessment. The protocol also identifies when and from whom an allegation of child
maltreatment may be taken. Finally it identifies those conditions, which must be met before an allegation of
abuse or neglect can be founded (determined to be true).
ARKANSAS DHS STATISTICAL REPORT
MALTREATMENT DEFINITIONS
SFY 2010
(continued)
Determination will be entered when the parent’s decision to withhold medical treatment is based solely upon a
religious belief, and the child is treated by spiritual means alone, through prayer, in accordance with a recognized
religious method of healing by an accredited practitioner. Such prohibition shall not limit the administrative or
judicial authority of the State to ensure that medical services are provided to the child when the child's health
requires it.
DCFS-9

8,052 83% 9,939 86%
4,028 41% 5,012 43%
3,377 35% 3,558 31%
Source: Division of Children and Family Services
* The total number represented will outnumber the total children involved in true maltreatment reports because a child can be involved in
more than one allegation.
Neglect
Physical Abuse
Sexual Abuse
Type of Abuse SFY 2009 SFY 2010
ARKANSAS DHS STATISTICAL REPORT
ASSESSMENT STATUS AND BREAKDOWN*
BY TYPE OF ABUSE
SFY 2010
8,052
9,939
4,028
5,012
3,3773,558
0
2,000
4,000
6,000
8,000
10,000
12,000
SFY 2009 SFY 2010
ASSESSMENT STATUS AND BREAKDOWN BY TYPE OF ABUSE SFY 2009 - SFY 2010
Neglect Physical Abuse Sexual Abuse
DCFS-10

Age Gender White Black Asian1
AIAN2
NAPI3
Hispanic
More
Than 1
Race Total
Female 335 95 1 1 1 26 41 500
Male 405 133 3 2 2 38 41 624
Female 999 238 4 2 4 80 110 1,437
Male 1,054 269 3 3 11 98 98 1,536
Female 1,300 344 2 2 7 101 92 1,848
Male 1,190 352 5 2 13 112 125 1,799
Female 1,055 271 4 2 1 89 80 1,502
Male 609 148 0 2 3 38 45 845
Female 585 179 2 2 1 54 32 855
Male 287 77 0 0 1 22 16 403
Female 3 1 0 0 0 1 0 5
Male 7 3 0 0 0 1 0 11
Total* 7,829 2,110 24 18 44 660 680 11,365
Source: Division of Children and Family Services
1Includes Indochinese, Cambodian, Hmong, Laotian, Vietnamese.
2 Includes American Indian and Alaskan Native.
3 Includes Native Hawaiian and Other Pacific Islander.
18+
*Demographic information was not entered into CHRIS for 167 children.
12 to 15
16 to 18
ARKANSAS DHS STATISTICAL REPORT
VICTIMS OF CHILD MALTREATMENT*
2 to 5
6 to 11
Characteristics of Children Involved in True Maltreatment Reports
SFY 2010
0 to 1
4,097
1,848
2,347
1,258
160
500
1,000
1,500
2,000
2,500
3,000
3,500
4,000
4,500
0 to 5 6 to 11 12 to 15 16 to 18 18+
Age Bracket
Child Maltreatment True ReportsSFY 2010
DCFS-11

Source: Division of Children and Family Services
ARKANSAS DHS STATISTICAL REPORT
ASSESSMENTS DETERMINED TO BE TRUE*
SFY 2010
* State Office = 1
53 42
520 79 149 30 93 46
51 73 191
79
194
27 116
160 104 52 120
510 59 20 16 367
55 124 72 47
79 182
60 206
404 209 20 74
79
33
44 23
22
46 202 9
819
15 183 206 20
45
75
190 59
88 54
25
18 13
38
97
22 28
19
State Total:* 7,831
2564 30
53
141
36 51 27
149
62
10 27
ARKANSAS
ASHLEY
BAXTERBENTON BOONE
BRADLEYCALHOUN
CARROLL
CHICOT
CLARK
CLAY
CLEBURNE
CLEVELAND
COLUMBIA
CONWAY
CRAIGHEAD
CRAWFORD
CROSS
DALLAS
DESHA
DREW
FAULKNER
FULTON
GARLAND
GRANT
GREENE
HEMPSTEAD
HOT SPRING
HOWARD
IZARD
JACKSON
JEFFERSON
JOHNSON
LAWRENCE
LEE
LINCOLN
LOGAN
LONOKE
MADISON
MARION
MILLER
MISSISSIPPI
MONROEMONTGOMERY
NEVADA
NEWTON
OUACHITA
PERRY
PHILLIPS
PIKE
POINSETT
POLK
POPE
PRAIRIE
PULASKI
RANDOLPH
ST. FRANCIS
SALINE
SCOTT
SEARCY
SEVIER
SHARP
STONE
UNION
VAN BUREN
WASHINGTON
WHITE
WOODRUFF
YELL
INDEPENDENCE
SEBASTIAN
FRANKLIN
CRITTENDEN
LITTLE RIVER
LAFAYETTE
DCFS-12


Unknown
Male
Female
1
2
3
Includes American Indian and Alaskan Native.
Includes Native Hawaiian and Other Pacific Islander.
Source: Division of Children and Family Services
41
Gender
Number of
Children Percent
Includes Indochinese, Cambodian, Hmong, Laotian, Vietnamese.
TOTAL
12 - 15 years
7,491 100.00%
3,807 50.82%
1,197
16 Years & Older 1,223 16.33% 714 9.53%
0.55%
Independent Living
15.98%
Age
1,880 25.10% Emancipation
00 - 05 years 3,166 42.26% Adoption
ARKANSAS DHS STATISTICAL REPORT
TOTAL FOSTER CARE CHILDREN SERVED
Number of
Children Percent
SFY 2010
When it has been determined that a child is at risk and cannot remain in the home of parents/caregivers, the
Division of Children and Family Services provides substitute care services for the child. Foster care provides
selective placement in a foster and therapeutic foster home or residential facility for a planned period of time for a
child who has been separated from his birth or legal parents.
06 - 11 years
1,154 15.41%
0 0.00%
Number of
Children Percent Permanency Goal*
Guardianship
TOTAL 7,491 100.00%
Maintain Children in Own Home0.33%25
No Case Plan 545 7.28%
TOTAL 7,491 100.00%
3,684 49.18%
1,053 14.06%
Relative Placement 255 3.40%
Return To Parent 3,729 49.78%
Percent
1,287 17.18%
928 12.39%
Ethnicity
Total
Ethnicity Percent Length of Stay
1,168 15.59%
White 4,562 60.90% Less than 30 Days
Black 1,729
ASIAN1 14 0.19% 3 - 6 Months
23.08% 30 - 90 Days
Number of
Children
AIAN2
12 0.16% 6 - 12 Months
574 7.66%
NAPI3
14 0.19% 12 - 24 Months
7,491 100.00%
TOTAL 7,491 100.00%
Unknown 25 0.33% TOTAL
Hispanic 492
Multiple 643 8.58% 36+ Months
6.57% 24 - 36 Months
1,313 17.53%
1,359 18.14%
862 11.51%
DCFS-13

Age Gender White Black Asian1
Aian2
Napi3
Hispanic
More
Than 1
Race Total
Female 351 143 1 0 1 35 46 577
Male 640 159 2 0 1 38 50 640
Female 585 190 0 1 2 59 102 939
Male 638 198 2 3 2 79 88 1,010
Female 558 212 2 0 1 60 55 888
Male 579 235 1 2 2 73 100 992
Female 382 122 2 0 1 33 66 606
Male 353 142 1 4 3 37 51 591
Female 258 134 0 2 0 28 28 450
Male 230 99 1 0 0 27 29 386
Female 122 54 2 0 0 13 18 209
Male 116 41 0 0 1 10 10 178
4,562 1,729 14 12 14 492 643 7,466
Source: Division of Children and Family Services
3 Includes Native Hawaiian and Other Pacific Islander.
1Includes Indochinese, Cambodian, Hmong, Laotian, Vietnamese.
Characteristics of Children in Foster Care During the Year
SFY 2010
0 to 1
18+
*Demographic information had not been entered into CHRIS for 25 children.
2 to 5
12 to 15
16 to 17
ARKANSAS DHS STATISTICAL REPORT
2 Includes American Indian and Alaskan Native.
CHILDREN IN FOSTER CARE
6 to 11
Total*
3,166
1,880
1,197
836
387
0
500
1,000
1,500
2,000
2,500
3,000
3,500
0 to 5 6 to 11 12 to 15 16 to 17 18+
Age Bracket
Children in Foster Care SFY 2010
DCFS-14

Native
American Hawaiian
Indian or And Other
Alaskan Pacific Unable to Total
County White Black Asian1
Native Islander Hispanic Multiple Determine Ethnicity
Arkansas 24 17 0 0 0 0 3 1 45
Ashley 13 14 0 0 0 2 3 0 32
Baxter 52 0 0 0 0 1 4 0 57
Benton 230 11 1 3 1 57 16 0 319
Boone 105 0 0 0 1 2 3 0 111
Bradley 9 12 0 0 0 13 1 0 35
Calhoun 11 1 0 0 0 0 0 0 12
Carroll 35 0 0 0 0 8 1 0 44
Chicot 1 21 0 0 0 0 6 0 28
Clark 27 11 0 0 0 4 4 0 46
Clay 20 0 0 0 0 0 0 0 20
Cleburne 95 0 0 1 0 5 0 0 101
Cleveland 14 8 0 0 0 2 0 0 24
Columbia 20 19 0 0 0 2 3 1 45
Conway 76 24 0 0 0 12 8 0 120
Craighead 168 65 0 0 0 12 24 2 271
Crawford 99 2 1 0 1 14 8 0 125
Crittenden 40 82 0 0 0 9 10 0 141
Cross 24 25 0 0 0 0 5 1 55
Dallas 2 6 0 0 0 1 2 0 11
Desha 5 15 0 0 0 5 5 0 30
Drew 19 33 0 0 0 4 4 0 60
Faulkner 105 14 0 0 0 5 12 0 136
Franklin 32 0 0 0 0 1 3 0 36
Fulton 56 1 0 0 0 4 2 0 63
Garland 232 34 0 0 0 13 30 1 310
Grant 14 1 0 0 0 0 1 0 16
Greene 121 0 0 0 0 3 5 0 129
Hempstead 7 17 0 0 0 7 4 1 36
Hot Spring 41 0 0 0 0 2 8 1 52
Howard 3 9 0 0 0 3 2 0 17
Independence 114 6 0 0 0 13 15 0 148
Izard 46 2 0 0 0 5 1 0 54
Jackson 20 24 0 0 0 2 1 0 47
Jefferson 56 233 0 0 0 3 16 0 308
Johnson 43 1 1 0 0 3 8 0 56
Lafayette 6 10 0 0 0 0 1 0 17
Lawrence 81 1 0 0 0 2 2 0 86
Lee 3 15 0 0 0 0 1 0 19
1 Includes Indochinese, Cambodian, Hmong, Laotian, and Vietnamese.
ARKANSAS DHS STATISTICAL REPORT
CHILDREN IN FOSTER CARE
BY ETHNICITY
SFY 2010
DCFS-15

Native
American Hawaiian
Indian or And Other
Alaskan Pacific Unable to Total
County White Black Asian1
Native Islander Hispanic Multiple Determine Ethnicity
Lincoln 17 8 1 0 0 0 4 0 30
Little River 25 3 0 0 0 2 9 0 39
Logan 45 1 0 0 0 2 0 0 48
Lonoke 148 11 0 0 0 8 13 2 182
Madison 38 0 0 0 0 0 4 0 42
Marion 48 0 0 0 0 1 3 0 52
Miller 127 44 0 0 0 10 17 1 199
Mississippi 62 50 0 0 1 2 16 0 131
Monroe 8 9 0 0 0 0 0 0 17
Montgomery 18 0 0 0 0 1 0 1 20
Nevada 11 9 0 0 0 1 0 0 21
Newton 26 0 0 0 0 1 0 0 27
Ouachita 36 34 0 0 0 2 11 0 83
Perry 30 0 0 0 0 1 0 0 31
Phillips 7 35 0 0 0 2 5 0 49
Pike 16 0 0 0 0 0 0 0 16
Poinsett 74 2 0 0 0 5 11 1 93
Polk 87 0 0 0 0 5 5 0 97
Pope 132 11 0 0 0 25 10 0 178
Prairie 14 7 0 0 0 0 0 0 21
Pulaski 297 589 1 0 0 40 101 2 1,030
Randolph 74 0 0 0 0 1 1 0 76
Saline 96 13 0 0 0 12 9 0 130
Scott 28 0 0 0 0 1 6 0 35
Searcy 17 0 0 0 0 0 0 0 17
Sebastian 461 56 6 4 0 97 119 2 745
Sevier 32 0 0 0 0 4 3 0 39
Sharp 70 3 1 3 0 0 7 0 84
St. Francis 27 40 0 0 0 7 5 0 79
Stone 14 0 0 0 0 0 1 0 15
Union 30 43 0 0 0 3 12 0 88
Van Buren 40 0 1 0 0 1 0 0 42
Washington 147 6 1 0 10 21 17 3 205
White 143 5 0 0 0 6 30 3 187
Woodruff 13 16 0 0 0 0 1 2 32
Yell 34 0 0 1 0 11 1 0 47
State Office 1 0 0 0 0 1 0 0 2
State Total* 4,562 1,729 14 12 14 492 643 25 7,491
Source: Division of Children and Family Services
1 Includes Indochinese, Cambodian, Hmong, Laotian, and Vietnamese.
ARKANSAS DHS STATISTICAL REPORT
CHILDREN IN FOSTER CARE
BY ETHNICITY
SFY 2010
DCFS-16

Total
County Male Female Children
Arkansas 23 22 45
Ashley 20 12 32
Baxter 33 24 57
Benton 171 148 319
Boone 57 54 111
Bradley 13 22 35
Calhoun 3 9 12
Carroll 20 24 44
Chicot 15 13 28
Clark 21 25 46
Clay 11 9 20
Cleburne 56 45 101
Cleveland 12 12 24
Columbia 20 25 45
Conway 65 55 120
Craighead 142 129 271
Crawford 60 65 125
Crittenden 69 72 141
Cross 24 31 55
Dallas 3 8 11
Desha 15 15 30
Drew 29 31 60
Faulkner 76 60 136
Franklin 19 17 36
Fulton 31 32 63
Garland 159 151 310
Grant 8 8 16
Greene 61 68 129
Hempstead 23 13 36
Hot Spring 26 26 52
Howard 6 11 17
Independence 76 72 148
Izard 30 24 54
Jackson 22 25 47
Jefferson 154 154 308
Johnson 34 22 56
Lafayette 5 12 17
Lawrence 34 52 86
Lee 9 10 19
ARKANSAS DHS STATISTICAL REPORT
CHILDREN IN FOSTER CARE
BY GENDER
SFY 2010
DCFS-17

Total
County Male Female Children
Lincoln 15 15 30
Little River 15 24 39
Logan 23 25 48
Lonoke 70 112 182
Madison 15 27 42
Marion 21 31 52
Miller 115 84 199
Mississippi 60 71 131
Monroe 5 12 17
Montgomery 12 8 20
Nevada 9 12 21
Newton 10 17 27
Ouachita 48 35 83
Perry 16 15 31
Phillips 27 22 49
Pike 9 7 16
Poinsett 46 47 93
Polk 54 43 97
Pope 90 88 178
Prairie 11 10 21
Pulaski 542 488 1,030
Randolph 42 34 76
Saline 60 70 130
Scott 20 15 35
Searcy 7 10 17
Sebastian 377 368 745
Sevier 19 20 39
Sharp 44 40 84
St. Francis 47 32 79
Stone 11 4 15
Union 55 33 88
Van Buren 19 23 42
Washington 103 102 205
White 89 98 187
Woodruff 18 14 32
Yell 27 20 47
State Office 1 1 2
State Total 3,807 3,685 7,491
Source: Division of Children and Family Services
ARKANSAS DHS STATISTICAL REPORT
CHILDREN IN FOSTER CARE
BY GENDER
SFY 2010
DCFS-18

0 to 1 2 to 5 6 to 11 12 to 15 16 to 17 Over 17 Total
Foster Family Home 466 651 509 206 144 53 2,029
Residential Facility 22 26 88 151 133 37 457
Therapeutic Foster Home 3 26 138 71 32 10 280
Trial Home Visit 43 79 65 50 26 1 264
Sub-Acute CRT 0 0 28 52 44 1 125
Foster Family Home -Kinship 65 112 72 34 10 7 300
Adoptive Home* 39 52 46 12 2 0 151
Emergency Shelter 6 20 52 44 43 1 166
Runaway 2 2 0 5 36 5 50
ILP** Sponsor 0 0 0 0 4 91 95
Youth Services 0 0 0 7 14 1 22
Hospital/Medical 3 1 10 5 7 0 26
Temporary Placement 6 12 17 13 8 2 58
Acute CRT 0 0 9 8 12 1 30
Incarceration 0 0 0 4 8 3 15
ASAP CRT 0 0 0 10 5 0 15
ASAP Residential Treatment 0 0 0 6 9 1 16
ASAP Therapeutic FC 0 0 0 5 6 1 12
DDS Placement 0 0 1 0 1 0 2
Unknown*** 3 0 0 0 2 0 5
Total 658 981 1,035 683 546 215 4,118
**Independence Living Program
Source: Division of Children and Family Services
ARKANSAS DHS STATISTICAL REPORT
CHILDREN IN FOSTER CARE AT THE END OF THE YEAR
BY PLACEMENT TYPE
SFY 2010
***Unknown due to data entry after report completion.
*Non-finalized adoptions.
Placement
Age
2,029
457
280 264125 300 151 166
50 95 22 26 58 30 15 15 16 12 2 50
500
1,000
1,500
2,000
2,500
Children in Foster Care By Placement Type SFY 2010
DCFS-19

Permanency Goal National**
Return Home 49%
Adoption 23%
Independence N/A
Remain at Home N/A
Relative Care 4%
Guardianship 4%
Emancipation 6%
Long Term Care 9%
Not Yet Established 6%
Total* 100%
Source: Division of Children and Family Services
** Adoption and Foster Care Analysis and Reporting System (AFCARS) preliminary data submitted for children in foster care between
10/1/2007 and 9/30/2008 as of October 2009.
3,729
1,154
714
1,053
255
41
N/A
N/A
545
*Sum of individual percentages may not equal 100% due to rounding.
3,424
1,252
751
1,146
232
7%
100%
0.5%
N/A
N/A
3%
ARKANSAS DHS STATISTICAL REPORT
CHILDREN IN FOSTER CARE
N/A
590
7,446
SFY 2009
46%
17%
10%
15%
3%
0.7%
7,491
8%
100%
SFY 2010
BY PERMANENCY GOAL
SFY 2010
N/A
14%
50
1
50%
15%
10%
0.01%
3,424
1,252
751
1,146
232 50 1 N/A
590
3,729
1,154
714
1,053
25541 0 N/A
545
0
500
1,000
1,500
2,000
2,500
3,000
3,500
4,000
Retu
rn H
om
e
Ad
op
tio
n
Ind
ep
en
de
nc
e
Rem
ain
at
Ho
me
Re
lati
ve
Ca
re
Gu
ard
ian
sh
ip
Em
an
cip
ati
on
Lo
ng
Te
rm C
are
No
t Y
et
Es
tab
lis
he
d
Children in Foster Care Permanency Goal SFY 2009 - SFY 2010
SFY 2009 SFY 2010
DCFS-20

Source: Division of Children and Family Services
*Children who have exited care or how long children have been in care at the end of the state fiscal year.
ARKANSAS DHS STATISTICAL REPORT
CHILDREN IN FOSTER CARE
BY LENGTH OF STAY UPON ENTERING CARE
SFY 2008 - SFY 2010
Percent of Children
60.04%
63.04% 62.69%
18.63%
16.55%18.14%
21.34% 20.41%19.17%
0.00%
10.00%
20.00%
30.00%
40.00%
50.00%
60.00%
70.00%
2008 2009 2010
Less than 12 months 12 to 24 months More than 24 months
DCFS-21

*Children who have exited care or how long children have been in care at the end of the state fiscal year.
Source: Division of Children and Family Services
ARKANSAS DHS STATISTICAL REPORT
CHILDREN IN FOSTER CARE
BY LENGTH OF STAY UPON ENTERING CARE
SFY 2008 - SFY 2010
Number of Children
4,187
4,694 4,696
1,299 1,2321,359
1,488 1,5201,436
0
500
1000
1500
2000
2500
3000
3500
4000
4500
5000
2008 2009 2010
Less than 12 months 12 to 24 months More than 24 months
DCFS-22
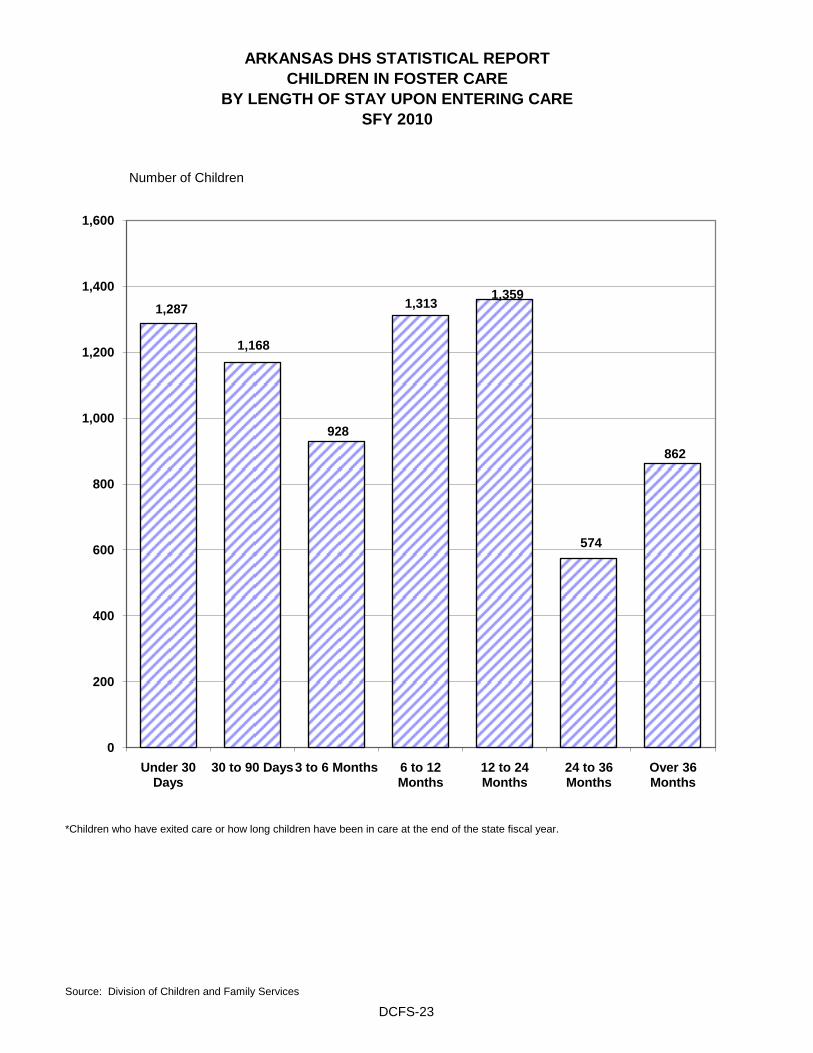
Source: Division of Children and Family Services
*Children who have exited care or how long children have been in care at the end of the state fiscal year.
BY LENGTH OF STAY UPON ENTERING CARE
SFY 2010
ARKANSAS DHS STATISTICAL REPORT
CHILDREN IN FOSTER CARE
Number of Children
1,287
1,168
928
1,3131,359
574
862
0
200
400
600
800
1,000
1,200
1,400
1,600
Under 30 Days
30 to 90 Days3 to 6 Months 6 to 12 Months
12 to 24 Months
24 to 36 Months
Over 36 Months
DCFS-23

Under 30 1 to 3 4 to 6 7 to 12 13 to 24 25 to 36 Over 36 Total
County Days Months Months Months Months Months Months Children
Arkansas 3 12 12 4 5 1 8 45
Ashley 9 4 10 1 2 4 2 32
Baxter 11 10 6 7 12 0 11 57
Benton 42 64 43 71 64 9 26 319
Boone 13 17 20 21 20 13 7 111
Bradley 10 4 1 1 6 1 12 35
Calhoun 8 1 0 2 0 0 1 12
Carroll 8 6 8 7 10 2 3 44
Chicot 0 6 3 4 8 3 4 28
Clark 5 12 0 3 23 1 2 46
Clay 4 3 0 2 8 1 2 20
Cleburne 12 23 14 14 20 2 16 101
Cleveland 10 7 1 0 2 4 0 24
Columbia 35 2 2 4 1 1 0 45
Conway 20 32 3 24 17 11 13 120
Craighead 34 33 33 49 68 25 29 271
Crawford 23 22 16 19 14 19 12 125
Crittenden 10 15 25 46 17 16 12 141
Cross 11 5 13 15 5 2 4 55
Dallas 6 2 0 0 2 1 0 11
Desha 4 10 2 2 6 2 4 30
Drew 6 5 6 12 9 3 19 60
Faulkner 33 25 9 25 24 9 11 136
Franklin 1 17 5 4 4 2 3 36
Fulton 3 8 16 9 12 7 8 63
Garland 75 61 34 45 46 12 37 310
Grant 8 1 2 2 1 1 1 16
Greene 11 25 29 17 32 6 9 129
Hempstead 13 8 6 1 2 1 5 36
Hot Spring 16 11 5 13 3 1 3 52
Howard 0 2 0 0 4 1 10 17
Independence 12 23 21 32 33 10 17 148
Izard 2 11 8 14 3 0 16 54
Jackson 5 6 8 9 11 5 3 47
Jefferson 92 66 18 52 26 23 31 308
Johnson 11 19 8 10 6 1 1 56
Lafayette 10 4 1 0 1 0 1 17
Lawrence 14 16 7 20 10 8 11 86
Lee 2 0 3 7 4 1 2 19
*Children who have exited care or how long children have been in care at the end of the state fiscal year.
ARKANSAS DHS STATISTICAL REPORT
CHILDREN IN FOSTER CARE
BY LENGTH OF STAY UPON ENTERING CARE*
SFY 2010
DCFS-24

Under 30 1 to 3 4 to 6 7 to 12 13 to 24 25 to 36 Over 36 Total
County Days Months Months Months Months Months Months Children
Lincoln 9 6 5 4 5 0 1 30
Little River 13 2 4 8 5 0 7 39
Logan 25 5 4 4 4 4 2 48
Lonoke 33 37 24 37 36 11 4 182
Madison 3 10 5 12 5 5 2 42
Marion 7 3 7 8 7 14 6 52
Miller 37 19 22 32 52 19 18 199
Mississippi 36 22 21 19 19 11 3 131
Monroe 5 1 2 4 4 1 0 17
Montgomery 2 4 6 4 0 1 3 20
Nevada 12 3 0 2 4 0 0 21
Newton 2 9 5 4 6 1 0 27
Ouachita 48 5 3 8 4 3 12 83
Perry 7 4 3 4 11 2 0 31
Phillips 0 2 7 10 12 12 6 49
Pike 1 0 2 8 4 0 1 16
Poinsett 23 13 24 22 6 3 2 93
Polk 13 10 16 16 9 17 16 97
Pope 35 34 14 30 46 11 8 178
Prairie 3 8 0 3 5 1 1 21
Pulaski 98 108 105 189 253 101 176 1,030
Randolph 12 17 19 9 10 4 5 76
Saline 19 18 16 33 29 6 9 130
Scott 6 5 7 11 5 1 0 35
Searcy 2 0 2 6 1 2 4 17
Sebastian 55 94 90 142 165 73 126 745
Sevier 3 7 12 3 8 1 5 39
Sharp 10 11 11 26 11 4 11 84
St. Francis 23 11 6 7 12 11 9 79
Stone 0 3 1 6 1 0 4 15
Union 38 12 13 8 5 7 5 88
Van Buren 11 6 5 2 1 1 16 42
Washington 57 32 21 21 35 17 22 205
White 42 31 33 31 26 13 11 187
Woodruff 0 6 11 5 4 2 4 32
Yell 4 11 4 7 8 6 7 47
State Office 1 1 0 0 0 0 0 2
State Total 1,287 1,168 928 1,313 1,359 574 862 7,491
*Children who have exited care or how long children have been in care at the end of the state fiscal year.
Source: Division of Children and Family Services
ARKANSAS DHS STATISTICAL REPORT
CHILDREN IN FOSTER CARE
BY LENGTH OF STAY UPON ENTERING CARE*
SFY 2010
DCFS-25

Age Gender White Black Asian1
AIAN2
NAPI3
Hispanic
More
Than 1
Race Total
Female 301 102 0 0 1 26 47 477
Male 343 109 2 0 2 32 42 530
Female 352 93 0 1 2 29 47 524
Male 352 92 0 1 1 51 36 533
Female 312 102 1 0 1 31 28 475
Male 328 125 1 1 2 39 57 553
Female 244 68 1 0 1 21 36 371
Male 193 67 0 3 1 16 18 298
Female 121 52 0 2 0 9 15 199
Male 98 31 0 0 0 17 7 153
Female 0 0 0 0 0 0 0 0
Male 0 0 0 0 0 0 0 0
Total* 2,644 841 5 8 11 271 333 4,113
3 Includes Native Hawaiian and Other Pacific Islander.
2 Includes American Indian and Alaskan Native.
Source: Division of Children and Family Services
1Includes Indochinese, Cambodian, Hmong, Laotian, Vietnamese.
*Demographic information had not been entered into CHRIS for 21 children.
2 to 5
6 to 11
12 to 15
18 +
ARKANSAS DHS STATISTICAL REPORT
CHILDREN IN FOSTER CARE
CHACTERISTICS OF CHILDREN WHO ENTERED FOSTER CARE DURING THE YEAR
SFY 2010
16 to 18
0 to 1
2,064
1,028
669
352
0
500
1,000
1,500
2,000
2,500
0 to 5 6 to 11 12 to 15 16 to 18
Age Bracket
Children who Entered Foster Care by AgeSFY 2010
DCFS-26

Reasons 0 to 1 2 to 5 6 to 11 12 to 15 16 to 18 18+ TotalAbandonment 63 56 94 127 95 1 436
Adoption 0 0 0 1 0 0 1
Caretaker Illness 133 138 184 176 95 0 726
Child’s Behavior 0 0 114 264 181 0 559
Child’s Disability 9 10 21 22 7 0 69
Inadequate Housing 206 226 268 162 44 0 906
Managed Mental Health 0 0 1 0 0 0 1
Neglect 856 999 1,035 651 211 1 3,753
Other 1 2 15 12 3 0 33
Parent Death 6 9 12 14 17 0 58
Parent Incarceration 306 414 449 247 73 0 1,489
Physical Abuse 244 288 367 287 111 1 1,298
Relinquishment 7 1 6 7 2 0 23
Sex Offender 0 0 18 25 16 0 59
Sexual Abuse 25 88 168 197 59 0 537
Substance Abuse-Child 0 0 15 58 34 0 107
Substance Abuse-Parent 793 806 704 369 119 0 2,791
Teen Parent in Care 71 3 0 0 1 0 75
Truancy 0 0 63 79 43 0 185
Total 2,720 3,040 3,534 2,698 1,111 3 13,106
More than one reason could be selected for each child in foster care.
Source: Division of Children and Family Services
SFY 2010
ARKANSAS DHS STATISTICAL REPORT
CHILDREN IN FOSTER CARE
REASONS CHILDREN PLACED IN FOSTER CARE BY AGE DURING THE YEAR
4361
726559
69
906
1
3,753
33 58
1,4891,298
23 59
537
107
2,791
75
185
0
500
1,000
1,500
2,000
2,500
3,000
3,500
4,000
Reasons Children Placed in Foster Care SFY 2010
DCFS-27

0 to 1 2 to 5 6 to 11 12 to 15 16 to 18 Over 18 Total
Adoption 89 253 156 56 20 0 574
Child Aged Out 0 0 0 0 174 51 225
Custody Transfer 2 3 4 2 3 1 15
Death of Child 5 0 0 2 0 1 8
Emancipation 0 0 0 0 6 3 9
Non-Relative Custody 16 20 21 24 27 0 108
Relative Custody 260 398 385 222 110 2 1,377
Reunification 248 421 385 272 171 0 1,497
Tribal Jurisdiction 0 0 1 0 1 0 2
*Total 620 1,095 952 578 512 58 3,815
**Information taken from DCFS Annual Report Card
ARKANSAS DHS STATISTICAL REPORT
CHILDREN IN FOSTER CARE
REASON CHILDREN EXITED CARE BY AGE
SFY 2010
Source: Division of Children and Family Services
Reasons
Age
There were 458 new foster homes recruited during SFY 2010. Additionally, there were 1,150 approved foster
homes at the end of June, 2010.
FOSTER FAMILY HOMES STATISTICAL DATA SFY 2010**
*Demographic information had not been entered into CHRIS for 16 children.
574
225
15 8 9108
1,3771,497
20
200
400
600
800
1,000
1,200
1,400
1,600
Ad
op
tio
n
Ch
ild
Ag
ed
O
ut
Cu
sto
dy
Tra
nsfe
r
Death
of
Ch
ild
Em
an
cip
ati
on
No
n-R
ela
tiv
e
Cu
sto
dy
Rela
tiv
e
Cu
sto
dy
Reu
nif
icati
on
Tri
bal
Ju
risd
icti
on
Reasons Children Exited Care SFY 2010
DCFS-28


Child Protective Child Protective Supportive Supportive
Foster Care Service Service Service Service Total
County Cases(1)
Cases(2) Children Cases Children Cases
Arkansas 45 85 172 8 17 138
Ashley 32 72 152 20 38 124
Baxter 57 111 221 12 30 180
Benton 319 563 1,286 9 19 891
Boone 111 196 365 25 56 332
Bradley 35 37 65 1 1 73
Calhoun 12 8 22 2 2 22
Carroll 44 62 146 1 1 107
Chicot 28 34 79 11 20 73
Clark 46 43 84 13 30 102
Clay 20 63 143 19 43 102
Cleburne 101 101 197 8 11 210
Cleveland 24 24 49 3 4 51
Columbia 45 90 210 17 33 152
Conway 120 162 359 9 14 291
Craighead 271 462 1,125 6 13 739
Crawford 125 230 547 36 89 391
Crittenden 141 268 797 18 44 427
Cross 55 130 291 5 10 190
Dallas 11 20 39 2 2 33
Desha 30 45 107 23 40 98
Drew 60 95 208 19 42 174
Faulkner 136 296 638 24 60 456
Franklin 36 76 154 5 11 117
Fulton 63 77 161 0 0 140
Garland 310 370 737 57 122 737
Grant 16 32 50 23 50 71
Greene 129 233 497 9 20 371
Hempstead 36 102 214 6 15 144
Hot Spring 52 113 240 17 42 182
Howard 17 30 62 5 10 52
Independence 148 216 474 3 4 367
Izard 54 84 177 8 16 146
Jackson 47 95 200 8 22 150
Jefferson 308 363 893 118 252 789
Johnson 56 121 267 0 0 177
Lafayette 17 40 80 3 6 60
Lawrence 86 123 242 0 0 209
Lee 19 21 38 6 13 46
(1) A Foster Care (FC) Case consists of one child in Foster Care.
(2) A Child Protective Service (CPS) Case consists of a family with at least one child in the home. A CPS case can
also be a FC case if at least one child is in the home and one is in FC.
ARKANSAS DHS STATISTICAL REPORT
SERVICES PROVIDED
SFY 2010
DCFS-29

Child Protective Child Protective Supportive Supportive
Foster Care Service Service Service Service Total
County Cases(1)
Cases(2) Children Cases Children Cases
Lincoln 30 30 52 17 30 77
Little River 39 58 112 9 12 106
Logan 48 81 172 2 2 131
Lonoke 182 273 589 10 14 465
Madison 42 73 173 5 10 120
Marion 52 71 155 4 5 127
Miller 199 233 451 15 40 447
Mississippi 131 242 629 7 17 380
Monroe 17 31 72 14 32 62
Montgomery 20 17 38 16 36 53
Nevada 21 48 119 4 9 73
Newton 27 22 45 3 6 52
Ouachita 83 163 336 7 16 253
Perry 31 41 85 4 8 76
Phillips 49 83 225 13 35 145
Pike 16 14 29 4 12 34
Poinsett 93 185 447 0 0 278
Polk 97 111 240 16 31 224
Pope 178 227 447 37 80 442
Prairie 21 29 65 1 2 51
Pulaski 1,030 1,431 3,369 182 417 2,643
Randolph 76 93 205 2 7 171
Saline 130 353 742 26 58 509
Scott 35 50 124 5 5 90
Searcy 17 31 55 1 3 49
Sebastian 745 872 1,994 29 84 1,646
Sevier 39 75 158 2 10 116
Sharp 84 121 223 7 15 212
St. Francis 79 139 362 37 74 255
Stone 15 39 89 0 0 54
Union 88 194 408 8 15 290
Van Buren 42 73 150 10 25 125
Washington 205 595 1,368 21 52 821
White 187 290 649 5 12 482
Woodruff 32 44 88 0 0 76
Yell 47 77 152 4 4 128
State Office 2 2 2 0 0 4
State Total* 7,491 11,804 26,407 1,086 2,380 20,381
(2) A Child Protective Service (CPS) Case consists of a family with at least one child in the home. A CPS case can
Source: Division of Children and Family Services
(1) A Foster Care (FC) Case consists of one child in Foster Care.
also be a FC case if at least one child is in the home and one is in FC.
*Demographic information had not been entered into CHRIS for 26 children.
SFY 2010
ARKANSAS DHS STATISTICAL REPORT
SERVICES PROVIDED
DCFS-30


Source: Division of Children and Family Services
ARKANSAS DHS STATISTICAL REPORT
ADOPTIONS
NUMBER OF CHILDREN PLACED
SFY 2000 - SFY 2010
* Adjusted from previous fiscal year to show those children placed in adoptive homes. A home does not become adoptive until the adoption
is finalized.
352
398
478
422414
273281
357
272
368
342
0
100
200
300
400
500
600
2000 2001 2002 2003 2004* 2005* 2006 2007 2008 2009 2010
State Fiscal Year
Series1
DCFS-31

Characteristics of Children Placed in Adoptive Homes
** Native Hawaiian And Other Pacific Islander
*** More than one race was indicated in CHRIS.
Special Needs
*A child may have more than one condition.
1 This number does not take into account children with severe medical and psychological needs because this data is not
available in CHRIS (AR Children's Reporting and Information System). As enhancements are made to the data system
to capture this information, the data will be provided in future reports.
Member of Sibling Group 120
Race/Ethnicity
Age
220
185
NAPI**
Special Needs Condition
36 10.53%
TOTAL 342
Male 189
187 54.68%
32.75%
55.26%
Gender
TOTAL 342 100.00%
0.00%
Number of Children*
There were 222 children with special needs who were placed in pre-adoptive homes during SFY 2010.1
Children
with special needs are defined as children who have severe medical or psychological needs that require ongoing
treatment. Other children may be considered special needs if they are a Caucasian child over the age of nine, an
African American child who is two years old or older, or a child who is a member of a sibling group of three or more
that is being placed together with his or her sibling.
Hispanic 17 4.97%
Multiple***
0
Female 153 44.74%
Ethnicity Number of Children Percentage
100.00%
0.00%
White 208 60.82%
Black 81 23.68%
Asian 0 0.00%
Aian
12.57%
6 to 11 years 112
0 to 5 years
ARKANSAS DHS STATISTICAL REPORT
ADOPTION SERVICES
SFY 2010
Services are provided to birth parents, children, and adoptive families to establish and maintain permanent homes
for children. This unit is also responsible for the adoption subsidy program, the Arkansas Mutual Consent
Voluntary Adoption Registry, and the Interstate Compact on Adoptions and Medical Assistance (ICAMA) program.
There were 342 children placed in adoptive homes during SFY 2010, down from 368 in SFY 2009. The following
tables show the breakdowns of these children by age, gender and race.
Number of Children Percentage
TOTAL 342
Age Number of Children Percentage
100.00%
12 to 18 years 43
0
DCFS-32

Subsidized Adoptions
Disruptions
Non-Foster Parent Adoptive Homes
Homes Awaiting Children at the Beginning of the Year
New Homes Approved During the Year
Total During the Year
Homes in Which Children Were Placed During the Year
Approved Adoptive Homes Closed at the End of the Year
Homes That Experienced a Disruption
Number of Homes Awaiting Children
Children Waiting for Adoption
** More than one race indicated in CHRIS.
There are currently 513 children waiting for adoption. The following table describes the demographics of these
children.
Source: Division of Children and Family Services
32 54 513TOTAL 264 162 1 0
0 190 0
1 1 3 270 016-18
Female 11 5
Male 14 8
0 3
5 550 0
0 7 14 850 012-15
Female 33 15
Male 44 20
0 2
4 850 0
0 4 15 1020 06-11
Female 45 31
Male 56 27
0 5
4 380 0
0 4 7 640 02-5
Female 18 14
Male 24 29
0 2
150 0
Aian Napi Total
0 1 2 230 0
-153
+20
237
273
+213
486
0
Demographics of Children Waiting for Adoption
Age Gender White Black Asian Hispanic Multiple**
0-1Female 7 5
Male 12 8
3 0
-116
ARKANSAS DHS STATISTICAL REPORT
ADOPTION SERVICES
SFY 2010
There were 514 new subsidized adoptions approved in SFY 2010, with 436 federally funded and 78 state funded.
A disruption of an adoptive placement occurs when a family who had accepted a child for adoption decides not to
proceed with finalization and the child is removed from the home. Twenty disruptions occurred in SFY 2010, with
the same number of disruptions in the previous fiscal year.
0
DCFS-33


Total Total Total
Twenty Plus 59 White 746 Male 549
Nineteen 108 Black 387 Female 666
Eighteen 228 Hispanic 44 1,215
Seventeen 304 Asian 10
Sixteen 253 Native American 12
Fifteen-Fourteen 263 Other Ethnicity 16
1,215 1,215
Total Total Total
Less than 6 months 91 Living in a Foster Home 484 Employed 371
6 months to 1 Year 180 Living in a Group Home 433 Obtained High School 158
Between 1 and 2 Years 243 Living Independently 178Diploma/GED
Between 2 and 3 Years 184 Institutionalized 82 Obtained Housing/ 293
Between 3 and 4 Years 165 Other Living Arrangements 96Other Community Service
Between 4 and 5 Years 98 Special Needs Children 60
Between 5 and 7 Years 145 Married 3
Between 7 and 10 Years 64 Parents 56 Age Total
Between 10 and 12 Years 32 Eighteen 33
Between 12 and 15 Years 9 Nineteen 23
More than 15 Years 4 Twenty 15
1,215 Twenty-one 11
Twenty-two 10
*There were 92 students funded through the Arkansas Education & Training Voucher (ETV) Program
Total Total
General Statistics
Length of Time in Foster
Care Youth Who Were Other Characteristics
Total
ETV Funded Students*
ARKANSAS DHS STATISTICAL REPORT
TRANSITIONAL SERVICES FOR YOUTH
FFY 2010
YOUTH SERVED
(October 1, 2009 to September 30, 2010)
Total
Demographics
Age Ethnicity Gender
DCFS-34

1.
Number of life-skills workshops presented during the year. 357
Total number of teens attending the workshops. (duplicated count) 3,510
Total number of foster parents attending the workshops. (duplicated count) 516
Total number of staff attending the workshops. (duplicated count) 413
2. Total number of teens given initial assessment during the year. 305
3. Number of reassessments during the year. 756
4. Number of ILP staffings attended during the year. 519
5. Number of ILP home/apartment/school, etc, startups during the year. 137
6. Number of OJT placements during the year. 39
7. Total number of teens that completed the ILP program plan during the year. 52
8. Total number of teens that withdrew before completing transitional/educational plan. 195
9. Number of video presentations that were made during the year. 84
10. Total number of people that attended video presentations: 777
Teens 620
Foster Parents 59
Staff 98
11. Youth receiving “After-Care" services during the year. 191
Source: Independent Living Title IV-E Program Report, FFY 2010
777
Life-skills topics covered in workshops – Credit Counseling, Housing, Post-Secondary
Finance, Finance and Money Management, Vocational Planning, Parenting, Health
and Hygiene, Personal Appearance, Nutrition, Team Building, Self-esteem, Legal
Issues, Job Search, Drugs, Sex/STD’s, Community Resources, Conflict Resolution,
Moving Planning, Anger Management, Cultural Diversity, Voting 101, Purchasing,
Handling and Cooking Food, Internet Safety, Gangs vs. School.
Total
ARKANSAS DHS STATISTICAL REPORT
INDEPENDENT LIVING PROGRAM (ILP)
YOUTH SERVED(CONTINUED)
FFY 2010
(October 1, 2009 to September 30, 2010)
DCFS-35

The following services were provided through contracts during SFY 2010:
Type of Contract Service
Therapeutic Foster Care
Emergency Shelter
Residential Treatment
Sexual Offenders Treatment Programs
Independent Living Programs
ARKANSAS DHS STATISTICAL REPORT
SPECIALIZED PLACEMENT SERVICES
SFY 2010
The Specialized Placement Unit provides technical and financial assistance to local county offices requiring help
in locating and/or funding out-of-home placements for children with emotional and/or behavioral problems. The
Division of Children and Family Services provides these placements through contracts with private providers or
Medicaid providers. Services purchased are as follows: therapeutic foster care, residential treatment,
comprehensive residential treatment, emergency shelter, case management and specialized foster care
placements for developmentally delayed children and sexual offender treatment programs.
Source: Division of Children and Family Services
Comprehensive Residential Treatment
(Inpatient Psychiatric Treatment/Hospital)
10
14
Specialized Foster Care Services for
Developmentally Delayed Children
Number of Programs
1
15
3
14
5
DCFS-36

Source: Division of Children and Family Services
ARKANSAS DHS STATISTICAL REPORT
INTENSIVE FAMILY SERVICES
SFY 2010
The Division of Children and Family Services seeks to ensure the health and safety of children and to preserve
families through the provision of Intensive Family Services (IFS). The goals are to prevent unnecessary out-of-
home placements of children and to promote reunification of families with children in placement. IFS is a
combination of counseling and support services aimed at ensuring the health and safety of all family members
while helping the family learn how to stay together successfully. Services are immediate, time-limited, and home-
based. The IFS practitioner concentrates on the most serious issues affecting the family and provides tailored
services to meet the unique needs of the family. IFS was provided through contractors and DCFS staff.
There were 204 families with 497 children who received these services in SFY 2010.
DCFS-37


●
●
●
●
Melissa Dean, Assistant Director, Administrative Support
Mission:
The mission of the Division of County Operations is to ensure the delivery of quality human services that strengthen
the health and well being of Arkansas' children, families and adults.
Executive Staff:
Joni Jones, Director
ARKANSAS DHS STATISTICAL REPORT
DIVISION OF COUNTY OPERATIONS (DCO)
INTRODUCTION
SFY 2010
Gwen Williams, Assistant Director, Field Operations
Linda Greer, Assistant Director, Program Planning and Development
Thomas Green, Assistant Director, Community Services
Fast Facts:
People Served Annually: 1,159,628
Facilities Regulated: None
Division Established: 1985
Budget: $199.5 Million ($137.8 Million Fed, $44.3 Million State, $13 Million Other
and $4.5 Million ARRA)
Staff: 1,993 Budgeted Positions (includes 60 Tobacco and 121 Stimulus positions)
Institutions Operated: 83 DHS County Offices
Programs:
Medicaid – The Division of County Operations enrolls eligible individuals in the Medicaid Program to assist
with payment of medical services, prescription drugs, long-term care and other related services.
Approximately 791,478 Arkansas children and adults were eligible for medical care through the Medicaid
program during State Fiscal Year 2010. Clients counted as receiving this service may have also received
additional services shown on this page.
Transitional Employment Assistance (TEA) – This program provides time-limited cash assistance each
month to low-income families with dependent children. Approximately 34,701 people were provided this
service during State Fiscal Year 2010. Clients counted as receiving this service may have also received
additional services shown on this page.
Work Pays - The Work Pays Program is an incentive program designed to encourage working TEA clients
to remain employed after closure of the TEA case while increasing their hours of work and/or hourly wage.
Families participating in Arkansas Work Pays will receive a monthly cash assistance payment in the amount
of $204 for up to 24 months, provided they meet the Work Pays eligibility requirements. This work incentive
program may be limited to 3,000 families being enrolled per month. In State Fiscal Year 2010, 7,340
individuals participated in this program. Clients counted as receiving this service may have also received
additional services shown on this page.
Supplemental Nutrition Assistance Program SNAP (Formerly known as the Food Stamp Program) – This
program provides a nutrition safety net for low-income children, families and adults. Over $672.8 million in
benefits were provided to 643,420 people during State Fiscal Year 2010. This figure includes $43.5 million
in food assistance provided as a result of the American Recovery and Reinvestment Act of 2009 (ARRA*).
Clients counted as receiving this service may have also received additional services shown on this page.
DCO-1

●
●
●
●
●
●
●
* American Recovery and Reinvestment Act of 2009 (ARRA)
Source: DCO Website
ARKANSAS DHS STATISTICAL REPORT
Home Energy Assistance Program – This program provides financial assistance to approximately 158,377
households each year to help them meet home energy costs. Case management activities designed to
encourage and enable households to reduce their energy costs and thereby, their need for financial
assistance, are also provided.
Weatherization Assistance Program – This program provides Weatherization services and case
management activities designed to encourage and enable households to reduce their energy costs, and
thereby their need for financial assistance. There were 2,888 homes were weatherized in SFY 2010 of
which 2,051 were funded through the ARRA* program.
Shelter Plus Care Program – This program provides grants to community shelters that provide housing and
supportive shelters for homeless persons with disabilities (primarily serious mental illness, chronic problems
with alcohol and/or drugs, acquired immune deficiency syndrome (AIDS), or related diseases). There were
395 people provided with rental assistance in SFY 2010 through this program.
Emergency Shelter Program – This program provides $1,202,070 in grant funds to 75 local community
homeless shelters.
DIVISION OF COUNTY OPERATIONS (DCO)
INTRODUCTION
SFY 2010
Programs: (continued)
Community Services Block Grant (CSBG) Program – This program provides more than $9.46 million in
annual as well as approximately $13.5 million in ARRA* funding to the 16 Community Action Agencies in
the state to support services and activities that assist low-income families to become self-sufficient.
Commodity Distribution/Emergency Food – This program provides more than 27.5 million pounds of USDA-
donated food to needy and unemployed people through school lunch programs, charitable and correctional
institutions, child feeding programs, disaster organizations, soup kitchens and food banks.
Refugee Resettlement – This program provides temporary cash and medical assistance to eligible refugees
and entrants to help them become self-sufficient.
DCO-2

Expenditures*
DCO Administration:
00 - Regular Salaries 59,917,413$
01 - Extra Help 220,835
02 - Maintenance & Operations 20,124,761
03 - Fringe Benefits 19,285,022
06 - Overtime 689
09 - Conference Fees & Travel 76,497
10 - Professional Fees & Services 6,321,573
11 - Capital Outlay 28,644
15 - Claims 12,993
*44 - Data Processing Services 4,450,239
Sub-Total 110,438,666$
Tobacco Settlement - Medicaid Expansion Program:
00 - Regular Salaries 552,973$
02 - Maintenance & Operations 5,924
03 - Fringe Benefits 382,835
*44 - Data Processing Services 4,348
Sub-Total 946,080$
DCO Programs:
Hunger Coalition 956,400$
Shelter Plus Care 1,562,522
AABD (State) -
Weatherization (Federal) 6,639,037
Emergency Food (Federal) 597,163
Low-Income Energy Assistance (Federal) 34,106,635
Refugee Resettlement (Federal) 5,589
Emergency Shelter (Homeless Assistance) (Federal) 1,151,143
TEA Employment Services 2,636,265
TEA/Work Pays Cash Assistance, Relocation, Diversions 16,314,616
SNAP Employment & Training 166,196
Community Services Block Grant (Federal) 9,191,062
Commodity Distribution - SAC Fund - Operating Exp 31,034
Commodity Distribution - SAC Fund - Capital Outlay -
Sub-Total 73,357,662$
ARRA and Reinvestment Funds:
Weatherization Grants and Administration 12,513,932$
CSBG Grants and Administration 7,492,329
Homelessness Grants and Administration 2,915,898
TEFAP Grants and Administration 496,610
SNAP (formerly the Food Stamp Program) 2,045,628
DCO IT Reinvestment Projects 4,431,160
DCO Reinvestment Projects - ACCESS Arkansas Ctr. 152,083
DCO Miscellaneous Reinvestment Projects 4,365,352
34,412,992$
GRAND TOTAL 219,155,400$
ARKANSAS DHS STATISTICAL REPORT
DIVISION OF COUNTY OPERATIONS
EXPENDITURES
SFY 2010
Source: AASIS Y_DEV_80000046 Budget Reconciliation Report
* The AASIS 46 Budget reconciliation Report includes a duplicate payment for the DIS bill under DCO Admin - 44 - DP
Services for $136,068 and for $327 in Tobacco Settlement - 44 - DP Services. These Payments were voided in July 2010.
This table does not reflect $4.77 billion in public assistance benefits authorized by DCO eligibility workers in SFY 2010 as these
payments are not reflected in the DCO budget. The adjusted administrative rate is 2.28%.
DCO-3


Arkansas 120 91 178 $109,871 Lincoln 97 74 160 98,792
Ashley 154 106 248 $132,259 Little River 70 47 112 68,848
Baxter 133 110 216 $114,853 Logan 163 140 287 149,021
Benton 173 83 311 $159,748 Lonoke 287 262 503 318,971
Boone 174 164 277 $153,805 Madison 28 19 46 26,608
Bradley 108 89 167 $105,537 Marion 66 56 117 70,754
Calhoun 25 15 43 $19,968 Miller 374 290 655 357,496
Carroll 27 16 55 $32,998 Mississippi 461 292 756 424,780
Chicot 147 106 216 $139,694 Monroe 70 39 111 69,186
Clark 84 53 142 $77,431 Montgomery 20 9 34 19,459
Clay 115 97 184 $110,138 Nevada 67 55 114 59,171
Cleburne 74 62 119 $66,217 Newton 34 22 50 30,700
Cleveland 49 36 70 $46,166 Ouachita 233 161 364 241,687
Columbia 187 127 301 $185,735 Perry 36 27 78 40,772
Conway 84 73 135 $74,998 Phillips 452 316 730 495,287
Craighead 551 447 959 $624,660 Pike 10 3 18 11,681
Crawford 181 152 322 $187,872 Poinsett 264 212 455 293,022
Crittenden 626 447 1,029 $594,337 Polk 76 62 129 59,649
Cross 121 85 199 $108,625 Pope 205 178 367 195,743
Dallas 69 53 109 $67,748 Prairie 25 18 39 21,268
Desha 128 102 207 $134,062 Pulaski-East 283 217 455 286,939
Drew 100 77 158 $94,849 Pulaski-JAX 460 371 759 505,460
Faulkner 302 226 508 $226,619 Pulaski-North 566 353 975 621,965
Franklin 59 54 107 $51,695 Pulaski-South 498 383 827 478,920
Fulton 78 68 127 $59,883 Pulaski-SW 785 531 1,278 794,224
Garland 327 236 533 $329,675 Randolph 142 113 216 116,501
Grant 30 21 47 $29,382 Saline 127 77 229 109,442
Greene 247 204 424 $199,198 Scott 57 39 114 46,109
Hempstead 181 137 301 $174,773 Searcy 21 15 46 26,629
Hot Spring 86 57 151 $82,555 Sebastian 179 96 316 186,131
Howard 55 40 97 $47,402 Sevier 89 67 148 78,659
Independence 156 104 272 $164,414 Sharp 120 94 207 110,820
Izard 40 32 55 $34,062 St Francis 443 356 734 484,056
Jackson 129 94 222 $127,600 Stone 32 22 52 25,992
Jefferson 827 620 1,301 $801,458 Union 197 98 321 183,925
Johnson 98 85 184 $91,704 Van Buren 42 34 75 36,676
Lafayette 68 50 116 $59,478 Washington 556 284 1,056 574,215
Lawrence 110 88 172 $88,387 White 299 254 474 256,523
Lee 163 120 232 161,943 Woodruff 93 74 159 95,439
Yell 26 10 44 29,470
Source:
Adults Column - Extract From ACES Data Base Grant Amount Column - Monthly TEA Payroll Reports
(1) Unduplicated count for TEA Category 20. (2) Does not reflect cancellations and/or adjustments.
Cases Column - Extract From ACES Data Base Children Column - Extract From ACES Data Base
Adults (1)
24,104 $14,172,789State Total 14,439 10,597
ARKANSAS DHS STATISTICAL REPORT
TEA CASES, PERSONS AND GRANT AMOUNT
SFY 2010
Children (1)
Grant
Amount (2)
County Cases (1)
Adults (1)
Children (1)
Grant
Amount (2)
County Cases (1)
DCO-4

SFY UNDUPLICATED CASES GRANT AMOUNT
2003 19,936 $22,568,309
2004 18,326 $20,070,793
2005 15,792 $18,152,040
2006 14,712 $15,222,869
2007 14,674 $14,743,241
2008 14,010 $14,082,236
2009 13,951 $13,626,632
2010 14,439 $14,172,789
ARKANSAS DHS STATISTICAL REPORT
TEA CASES AND GRANT AMOUNT
SFY 2003 - 2010
Sources: Cases Column - Extract From ACES Data Base; Grant Amount Column - Monthly TEA Payroll Reports
0 5,000,000 10,000,000 15,000,000 20,000,000 25,000,000
2003
2004
2005
2006
2007
2008
2009
2010
19,936
18,326
15,792
14,712
14,674
14,010
13,951
14,726
$22,568,309
$20,070,793
$18,152,040
$15,222,869
$14,743,241
$14,082,236
$13,626,632
$14,172,789
UNDUPLICATED CASES GRANT AMOUNT
DCO-5

Male Female Ukn Male Female Ukn Male Female Ukn Male Female Ukn
Arkansas 50 48 0 20 19 0 19 22 0 89 89 0 178
Ashley 58 49 0 36 49 0 27 29 0 121 127 0 248
Baxter 53 56 0 35 37 0 21 14 0 109 107 0 216
Benton 80 81 0 58 38 0 29 25 0 167 144 0 311
Boone 65 91 0 37 32 0 31 21 0 133 144 0 277
Bradley 49 48 0 24 17 0 12 17 0 85 82 0 167
Calhoun 6 14 0 6 9 0 3 5 0 15 28 0 43
Carroll 12 10 0 13 9 0 6 5 0 31 24 0 55
Chicot 60 69 0 20 23 0 22 22 0 102 114 0 216
Clark 34 40 0 20 22 0 7 19 0 61 81 0 142
Clay 35 44 0 39 30 0 23 13 0 97 87 0 184
Cleburne 32 28 0 22 18 0 6 13 0 60 59 0 119
Cleveland 14 23 0 9 10 0 4 10 0 27 43 0 70
Columbia 87 71 0 36 46 0 23 38 0 146 155 0 301
Conway 47 37 0 16 14 0 12 9 0 75 60 0 135
Craighead 282 243 0 132 126 0 74 102 0 488 471 0 959
Crawford 69 76 0 50 56 0 33 38 0 152 170 0 322
Crittenden 282 293 0 130 141 0 73 110 0 485 544 0 1029
Cross 58 59 0 26 31 0 12 13 0 96 103 0 199
Dallas 43 24 0 15 12 0 8 7 0 66 43 0 109
Desha 56 69 0 27 26 0 15 14 0 98 109 0 207
Drew 44 45 0 32 18 0 6 13 0 82 76 0 158
Faulkner 132 143 0 86 68 0 36 43 0 254 254 0 508
Franklin 27 24 0 20 21 0 5 10 0 52 55 0 107
Fulton 28 25 0 23 21 0 16 14 0 67 60 0 127
Garland 127 139 0 83 100 0 27 57 0 237 296 0 533
Grant 9 10 0 7 10 0 7 4 0 23 24 0 47
Greene 115 104 0 60 73 0 34 38 0 209 215 0 424
Hempstead 68 79 0 46 43 0 24 41 0 138 163 0 301
Hot Spring 44 26 0 30 18 0 15 18 0 89 62 0 151
Howard 26 25 0 20 12 0 6 8 0 52 45 0 97
Independence 62 55 0 42 53 0 32 28 0 136 136 0 272
Izard 8 21 0 10 7 0 7 2 0 25 30 0 55
Jackson 62 43 0 40 34 0 13 30 0 115 107 0 222
Jefferson 367 367 0 178 180 0 77 132 0 622 679 0 1,301
Johnson 40 45 0 34 33 0 21 11 0 95 89 0 184
Lafayette 39 28 0 13 16 0 8 12 0 60 56 0 116
Lawrence 43 46 0 30 20 0 17 16 0 90 82 0 172
Lee 65 83 0 22 26 0 13 23 0 100 132 0 232
ARKANSAS DHS STATISTICAL REPORT
County
BY AGE GROUP
CHILDREN RECEIVING TEA
SFY 2010
Grand
Total
5 & Under 6 - 12 13 - 17 Total
DCO-6

Male Female Ukn Male Female Ukn Male Female Ukn Male Female Ukn
Lincoln 34 52 0 24 24 0 9 17 0 67 93 0 160
Little River 41 30 0 13 12 0 8 8 0 62 50 0 112
Logan 81 63 0 40 56 0 25 22 0 146 141 0 287
Lonoke 110 105 0 104 94 0 35 55 0 249 254 0 503
Madison 15 9 0 7 4 0 4 7 0 26 20 0 46
Marion 29 21 0 19 26 0 10 12 0 58 59 0 117
Miller 180 173 0 85 95 0 51 71 0 316 339 0 655
Mississippi 214 189 0 94 121 0 45 93 0 353 403 0 756
Monroe 36 23 0 15 15 0 12 10 0 63 48 0 111
Montgomery 10 6 0 5 9 0 2 2 0 17 17 0 34
Nevada 38 28 0 17 13 0 7 11 0 62 52 0 114
Newton 16 7 0 5 10 0 1 11 0 22 28 0 50
Ouachita 105 113 0 44 41 0 22 39 0 171 193 0 364
Perry 13 20 0 15 13 0 6 11 0 34 44 0 78
Phillips 219 205 0 83 96 0 46 81 0 348 382 0 730
Pike 6 0 0 2 5 0 1 4 0 9 9 0 18
Poinsett 98 113 0 82 70 0 44 48 0 224 231 0 455
Polk 34 26 0 21 23 0 13 12 0 68 61 0 129
Pope 109 100 0 45 52 0 27 34 0 181 186 0 367
Prairie 12 8 0 2 8 0 4 5 0 18 21 0 39
Pulaski-East 122 127 0 55 71 0 40 40 0 217 238 0 455
Pulaski-JAX 211 228 0 91 120 0 46 63 0 348 411 0 759
Pulaski-North 251 243 0 131 174 0 65 111 0 447 528 0 975
Pulaski-South 243 240 0 112 97 0 64 71 0 419 408 0 827
Pulaski-SW 328 336 0 190 199 0 99 126 0 617 661 0 1,278
Randolph 60 46 0 32 32 0 23 23 0 115 101 0 216
Saline 64 46 0 37 41 0 16 25 0 117 112 0 229
Scott 17 33 0 27 16 0 10 11 0 54 60 0 114
Searcy 10 5 0 13 12 0 4 2 0 27 19 0 46
Sebastian 67 65 0 57 70 0 31 26 0 155 161 0 316
Sevier 43 34 0 17 32 0 12 10 0 72 76 0 148
Sharp 43 53 0 37 33 0 19 22 0 99 108 0 207
St Francis 224 197 0 81 107 0 58 67 0 363 371 0 734
Stone 9 12 0 7 11 0 8 5 0 24 28 0 52
Union 88 73 0 48 54 0 24 34 0 160 161 0 321
Van Buren 18 20 0 11 14 0 5 7 0 34 41 0 75
Washington 286 262 0 172 189 0 68 79 0 526 530 0 1,056
White 140 127 0 78 69 0 36 24 0 254 220 0 474
Woodruff 40 41 0 21 22 0 11 24 0 72 87 0 159
Yell 7 6 0 11 9 0 6 5 0 24 20 0 44
02,374 006,449 6,266 3,497
Source: Extract From ACES Data Base
Grand
Total
5 & Under 6 - 12
County
03,677 11,787 12,317 24,104
Total
ARKANSAS DHS STATISTICAL REPORT
State Total
13 - 17
CHILDREN RECEIVING TEA
BY AGE GROUP
SFY 2010
1,841
DCO-7

M F Ukn M F Ukn M F Ukn M F Ukn M F Ukn M F Ukn
Arkansas 0 7 0 2 52 0 4 18 0 1 4 0 0 3 0 7 84 0 91
Ashley 0 4 0 3 65 0 1 25 0 1 4 0 2 1 0 7 99 0 106
Baxter 0 4 0 6 52 0 8 23 0 1 5 0 5 6 0 20 90 0 110
Benton 0 6 0 3 48 0 2 14 0 2 3 0 0 5 0 7 76 0 83
Boone 1 8 0 19 86 0 7 24 0 1 11 0 4 3 0 32 132 0 164
Bradley 0 7 0 5 52 0 1 15 0 3 5 0 1 0 0 10 79 0 89
Calhoun 0 1 0 0 7 0 1 5 0 0 1 0 0 0 0 1 14 0 15
Carroll 1 1 0 1 3 0 1 5 0 1 1 0 1 1 0 5 11 0 16
Chicot 2 16 0 2 56 0 2 19 0 1 3 0 2 3 0 9 97 0 106
Clark 0 4 0 2 32 0 1 7 0 0 5 0 0 2 0 3 50 0 53
Clay 1 7 0 12 37 0 7 17 0 5 4 0 4 3 0 29 68 0 97
Cleburne 0 2 0 4 29 0 3 15 0 0 3 0 3 3 0 10 52 0 62
Cleveland 0 3 0 0 20 0 1 9 0 0 0 0 1 2 0 2 34 0 36
Columbia 0 10 0 0 80 0 1 20 0 0 8 0 3 5 0 4 123 0 127
Conway 0 4 0 6 41 0 5 13 0 0 0 0 1 3 0 12 61 0 73
Craighead 2 29 0 24 270 0 6 78 0 8 13 0 4 13 0 44 403 0 447
Crawford 0 6 0 5 68 0 11 38 0 5 8 0 3 8 0 24 128 0 152
Crittenden 1 41 0 10 288 0 9 71 0 2 13 0 3 9 0 25 422 0 447
Cross 0 8 0 3 56 0 1 12 0 0 4 0 0 1 0 4 81 0 85
Dallas 0 3 0 2 31 0 2 7 0 1 3 0 3 1 0 8 45 0 53
Desha 0 15 0 2 60 0 1 17 0 0 3 0 3 1 0 6 96 0 102
Drew 0 9 0 2 48 0 2 13 0 0 1 0 1 1 0 5 72 0 77
Faulkner 1 11 0 8 121 0 6 56 0 4 8 0 3 8 0 22 204 0 226
Franklin 0 3 0 3 30 0 1 10 0 3 3 0 1 0 0 8 46 0 54
Fulton 1 3 0 3 28 0 8 14 0 1 4 0 3 3 0 16 52 0 68
Garland 0 13 0 3 126 0 9 63 0 1 10 0 4 7 0 17 219 0 236
Grant 0 0 0 1 9 0 1 8 0 0 0 0 0 2 0 2 19 0 21
Greene 0 15 0 11 97 0 21 43 0 1 10 0 4 2 0 37 167 0 204
Hempstead 1 6 0 3 81 0 3 32 0 2 6 0 0 3 0 9 128 0 137
Hot Spring 0 7 0 4 22 0 1 16 0 1 4 0 1 1 0 7 50 0 57
Howard 0 2 0 1 25 0 2 8 0 0 1 0 0 1 0 3 37 0 40
Independence 0 3 0 5 55 0 4 25 0 2 3 0 4 3 0 15 89 0 104
Izard 0 2 0 3 15 0 1 6 0 1 3 0 0 1 0 5 27 0 32
Jackson 1 7 0 7 43 0 7 23 0 1 2 0 1 2 0 17 77 0 94
Jefferson 0 56 0 13 406 0 10 87 0 2 24 0 5 17 0 30 590 0 620
Johnson 1 3 0 3 42 0 6 20 0 2 1 0 4 3 0 16 69 0 85
Lafayette 0 2 0 1 32 0 1 10 0 0 2 0 0 2 0 2 48 0 50
Lawrence 0 5 0 5 46 0 4 20 0 2 2 0 2 2 0 13 75 0 88
Lee 0 20 0 6 67 0 3 15 0 1 3 0 1 4 0 11 109 0 120
M=Male, F=Female, and Ukn = Unknown
ARKANSAS DHS STATISTICAL REPORT
ADULTS RECEIVING TEA
BY AGE GROUP
SFY 2010
20 - 29 30 - 3919 & UnderCounty
40 - 44 45 & Over Total Grand
Total
DCO-8

M F Ukn M F Ukn M F Ukn M F Ukn M F Ukn M F Ukn
Lincoln 0 3 0 0 47 0 2 16 0 3 2 0 0 1 0 5 69 0 74
Little River 0 4 0 4 24 0 1 9 0 1 2 0 1 1 0 7 40 0 47
Logan 0 10 0 14 68 0 8 29 0 3 0 0 5 3 0 30 110 0 140
Lonoke 1 16 0 10 124 0 23 66 0 4 7 0 5 6 0 43 219 0 262
Madison 0 2 0 0 9 0 3 4 0 0 1 0 0 0 0 3 16 0 19
Marion 0 0 0 4 26 0 7 10 0 3 2 0 1 3 0 15 41 0 56
Miller 0 19 0 14 169 0 6 60 0 0 10 0 4 8 0 24 266 0 290
Mississippi 0 23 0 6 190 0 6 53 0 1 6 0 3 4 0 16 276 0 292
Monroe 0 0 0 0 28 0 0 9 0 1 0 0 0 1 0 1 38 0 39
Montgomery 0 0 0 0 7 0 0 2 0 0 0 0 0 0 0 0 9 0 9
Nevada 0 5 0 2 26 0 1 14 0 1 1 0 5 0 0 9 46 0 55
Newton 0 1 0 1 10 0 2 3 0 1 2 0 1 1 0 5 17 0 22
Ouachita 0 12 0 9 102 0 3 23 0 4 4 0 1 3 0 17 144 0 161
Perry 0 3 0 0 10 0 1 8 0 0 1 0 2 2 0 3 24 0 27
Phillips 0 33 0 8 219 0 5 37 0 2 3 0 4 5 0 19 297 0 316
Pike 0 0 0 0 1 0 0 1 0 0 0 0 1 0 0 1 2 0 3
Poinsett 1 17 0 14 102 0 9 50 0 5 8 0 4 2 0 33 179 0 212
Polk 0 3 0 4 30 0 5 13 0 1 3 0 0 3 0 10 52 0 62
Pope 1 11 0 5 95 0 9 42 0 6 2 0 2 5 0 23 155 0 178
Prairie 0 1 0 0 10 0 1 6 0 0 0 0 0 0 0 1 17 0 18
Pulaski-East 0 23 0 3 125 0 3 46 0 2 4 0 0 11 0 8 209 0 217
Pulaski-JAX 0 13 0 12 231 0 13 84 0 1 11 0 3 3 0 29 342 0 371
Pulaski-North 2 20 0 8 199 0 9 87 0 4 11 0 6 7 0 29 324 0 353
Pulaski-South 2 26 0 7 247 0 4 72 0 2 14 0 2 7 0 17 366 0 383
Pulaski-SW 0 41 0 12 327 0 14 101 0 1 19 0 5 11 0 32 499 0 531
Randolph 0 5 0 11 46 0 10 29 0 2 5 0 3 2 0 26 87 0 113
Saline 0 3 0 3 47 0 3 16 0 0 3 0 1 1 0 7 70 0 77
Scott 0 2 0 3 23 0 3 5 0 1 1 0 0 1 0 7 32 0 39
Searcy 0 0 0 1 7 0 0 4 0 0 2 0 1 0 0 2 13 0 15
Sebastian 1 6 0 4 48 0 3 31 0 1 1 0 0 1 0 9 87 0 96
Sevier 0 6 0 9 28 0 3 16 0 1 2 0 0 2 0 13 54 0 67
Sharp 1 2 0 7 43 0 7 21 0 3 4 0 2 4 0 20 74 0 94
St Francis 1 41 0 19 222 0 8 45 0 3 9 0 1 7 0 32 324 0 356
Stone 0 0 0 2 12 0 3 3 0 0 1 0 0 1 0 5 17 0 22
Union 0 8 0 1 70 0 0 15 0 0 3 0 0 1 0 1 97 0 98
Van Buren 0 2 0 4 18 0 2 5 0 1 0 0 1 1 0 8 26 0 34
Washington 1 15 0 13 160 0 10 63 0 3 11 0 1 7 0 28 256 0 284
White 1 21 0 16 133 0 12 42 0 4 12 0 7 6 0 40 214 0 254
Woodruff 0 3 0 4 40 0 7 12 0 2 2 0 4 0 0 17 57 0 74
Yell 0 0 0 0 7 0 0 3 0 0 0 0 0 0 0 0 10 0 10
Total19 & Under
County
ADULTS RECEIVING TEA
40 - 44 45 & Over
ARKANSAS DHS STATISTICAL REPORT
BY AGE GROUP
SFY 2010
10,5971,099 9,4980 0
Grand
Total
20 - 29 30 - 39
State Total 25 427 357 153 0
Source: Extract From ACES Data Base
M=Male, F=Female, and Ukn = Unknown
0123753 0 0371 2,076 2566,056
DCO-9

Descriptions Total Descriptions Total
Absent parent returned or not disabled 31 No longer resident of state 343
Change in Eligibles 18 No longer unemployed 4
Change in State/Local pension 3 Not Disabled-SSA Determination 1
Child reached age limit 22 Other, Needs Related 90
Child Support income 74 Other, non-need related 231
Citizenship Not Verified 1 Reached 60 months, no extension, not employed 11
Countable Resources 3 Refused other procedural requirement 4
Death 21 Reinstate, closed in error 3
Deemed Income, non-stepparent 1 Requested closure, no reason given 1,474
Disability not met 1 Social Security Benefits 97
Earnings Exceeds FPL 68 SSI Benefits 14
Eligible in another category 4 Standard Filing Unit 4
Employed at End of Extension period, No Stepparent Deemed Income 3
Additional Extension Given 2 TEA case closed due to progressive sanction 402
Employed, Reached 24-month Limit, No TEA close at client's request due to earnings 1,359
Extension Given 15 TEA close due to earnings 2,030
Extended, Found Employment TEA closed at client's request to preserve
lifetime benefits 9
Extended Period, Requested Closure 16 TEA did not participate in VoTech for 20 hours 1
Extended, found employment during closure TEA income exceeds $223 210
Extension of 60 mo. limit, requested case closure 4 TEA lifetime limit 261
Failed to cooperate, Child Support Enforcement 6 TEA non-compliance with employment plan 5
Failed to keep appointment 19 TEA non-compliance with PRA 1
Failed to meet initial eligibility 3 TEA non-cooperation with Child Support 3
Failed to meet participation requirements 14 TEA Progressive sanction 25-50% 11
Failed to provide information 632 TEA refused employment 2
Failed to verify income 98 Unable to locate 195
Institutionalized 9 Unable to locate, mail returned 236
No Extension Given or Continued – Not Employed 2 Unemployment Benefits, DWS Reported 168
No longer eligible child in home 624 Unemployment Benefits, non-DWS Reported 67
No longer in Foster Care 1 Veteran's Benefits 2
TOTAL 8,933
Source: Extract From ACES Data Base
ARKANSAS DHS STATISTICAL REPORT
TEA
REASONS FOR CLOSURES
SFY 2010
DCO-10

Arkansas Act 1705 established the Work Pays Program. Work Pays is an incentive program designed to
encourage working TEA clients to remain employed after closure of the TEA case while increasing their hours of
work and/or hourly wage. Families participating in Arkansas Work Pays will receive a monthly cash assistance
payment in the amount of $204 for up to 24 months, provided they meet the Work Pays eligibility requirements.
The twenty-four months will count toward the federal 60 month time limit but not the state's TEA 24 month limit.
This work incentive program may be limited to 3,000 families. This program was implemented in July 2006.

Arkansas 11 11 22 9,843 Lincoln 14 16 30 15,300
Ashley 15 15 23 17,952 Little River 5 6 9 8,466
Baxter 34 37 64 32,283 Logan 10 11 20 8,415
Benton 9 10 13 13,566 Lonoke 22 23 34 9,996
Boone 36 45 77 37,638 Madison 4 4 8 4,131
Bradley 17 20 29 14,127 Marion 9 12 19 9,690
Calhoun 3 3 3 3,774 Miller 69 74 146 75,276
Carroll 5 6 13 7,038 Mississippi 48 49 104 37,230
Chicot 26 27 43 21,675 Monroe 11 12 22 11,934
Clark 15 16 32 17,901 Montgomery 2 2 3 2,193
Clay 6 8 6 6,273 Nevada 15 17 37 12,240
Cleburne 7 8 16 7,038 Newton 4 4 9 5,508
Cleveland 8 9 12 10,404 Ouachita 35 36 68 42,483
Columbia 41 41 89 43,758 Perry 4 4 11 3,366
Conway 6 6 9 2,550 Phillips 96 101 179 125,919
Craighead 135 141 262 111,537 Pike 2 2 3 3,723
Crawford 15 18 32 16,677 Poinsett 14 17 27 11,679
Crittenden 117 121 236 128,112 Polk 17 18 29 26,622
Cross 17 17 28 15,300 Pope 16 17 26 14,892
Dallas 10 10 19 8,823 Prairie 2 2 3 3,468
Desha 18 18 36 16,167 Pulaski-East 52 53 83 50,745
Drew 23 23 43 24,837 Pulaski-Jax 77 78 153 80,682
Faulkner 45 48 92 51,408 Pulaski-North 161 167 302 175,440
Franklin 4 4 9 2,550 Pulaski-South 175 179 339 166,311
Fulton 8 8 15 10,506 Pulaski-SW 213 221 406 255,408
Garland 73 76 137 91,545 Randolph 3 4 4 2,550
Grant 1 1 2 1,530 Saline 28 29 62 34,068
Greene 30 32 58 23,715 Scott 8 9 19 8,568
Hempstead 38 41 69 46,767 Searcy 1 1 2 1,020
Hot Spring 11 12 25 12,240 Sebastian 21 24 42 23,919
Howard 12 14 24 10,302 Sevier 7 8 11 8,670
Independence 31 34 69 33,354 Sharp 19 21 31 26,316
Izard 2 3 3 3,060 St Francis 108 115 208 135,507
Jackson 15 17 33 7,905 Stone 1 1 2 204
Jefferson 178 184 330 176,409 Union 41 41 80 32,232
Johnson 3 3 7 5,814 Van Buren 3 4 4 4,641
Lafayette 11 11 21 6,783 Washington 27 29 52 36,873
Lawrence 0 0 0 0 White 19 20 28 18,156
Lee 55 61 95 62,934 Woodruff 11 13 23 9,333
Yell 1 1 2 918
Source:
ARKANSAS DHS STATISTICAL REPORT
WORK PAYS
CASES, PERSONS AND GRANT AMOUNT
SFY 2010
Children (1)
Grant
Amount (2)
County Cases (1)
Adults (1)
Children (1)
County Cases (1)
Adults (1)
Grant
Amount (2)
State Total 2,466 2,604 4,736 $2,618,187
Adults Column - Extract From ACES Data Base Grant Amount Column - Monthly TEA Payroll Reports
(1) Unduplicated count for Work Pays Category 84. (2) Does not reflect cancellations and/or adjustments.
Cases Column - Extract From ACES Data Base Children Column - Extract From ACES Data Base
DCO-11

Male Female Unknown Male Female Unknown
Arkansas 11 11 0 22 Lincoln 14 16 0 30
Ashley 14 9 0 23 Little River 4 5 0 9
Baxter 33 31 0 64 Logan 8 12 0 20
Benton 12 1 0 13 Lonoke 17 17 0 34
Boone 38 39 0 77 Madison 3 5 0 8
Bradley 15 14 0 29 Marion 12 7 0 19
Calhoun 2 1 0 3 Miller 73 73 0 146
Carroll 10 3 0 13 Mississippi 56 48 0 104
Chicot 25 18 0 43 Monroe 14 8 0 22
Clark 12 20 0 32 Montgomery 0 3 0 3
Clay 2 4 0 6 Nevada 16 21 0 37
Cleburne 7 9 0 16 Newton 8 1 0 9
Cleveland 6 6 0 12 Ouachita 38 30 0 68
Columbia 48 41 0 89 Perry 4 7 0 11
Conway 7 2 0 9 Phillips 85 94 0 179
Craighead 144 118 0 262 Pike 1 2 0 3
Crawford 15 17 0 32 Poinsett 12 15 0 27
Crittenden 122 114 0 236 Polk 15 14 0 29
Cross 14 14 0 28 Pope 14 12 0 26
Dallas 10 9 0 19 Prairie 1 2 0 3
Desha 17 19 0 36 Pulaski-East 49 34 0 83
Drew 18 25 0 43 Pulaski-JAX 78 75 0 153
Faulkner 47 45 0 92 Pulaski-North 152 150 0 302
Franklin 7 2 0 9 Pulaski-South 163 176 0 339
Fulton 10 5 0 15 Pulaski-SW 199 207 0 406
Garland 69 68 0 137 Randolph 2 2 0 4
Grant 1 1 0 2 Saline 33 29 0 62
Greene 28 30 0 58 Scott 13 6 0 19
Hempstead 35 34 0 69 Searcy 1 1 0 2
Hot Spring 14 11 0 25 Sebastian 14 28 0 42
Howard 14 10 0 24 Sevier 6 5 0 11
Independence 35 34 0 69 Sharp 14 17 0 31
Izard 2 1 0 3 St Francis 101 107 0 208
Jackson 15 18 0 33 Stone 0 2 0 2
Jefferson 167 163 0 330 Union 39 41 0 80
Johnson 4 3 0 7 Van Buren 3 1 0 4
Lafayette 9 12 0 21 Washington 22 30 0 52
Lawrence 0 0 0 0 White 12 16 0 28
Lee 46 49 0 95 Woodruff 10 13 0 23
Yell 0 2 0 2
Source: Extract From ACES Data Base
ARKANSAS DHS STATISTICAL REPORT
CHILDREN RECEIVING WORK PAYS
SFY 2010
County
Grand
Total
Grand
Total County
State Total 2,345 0 4,7362,391
DCO-12

M F Ukn M F Ukn M F Ukn M F Ukn M F Ukn M F Ukn
Arkansas 0 0 0 0 6 0 0 4 0 1 0 0 0 0 0 1 10 0 11
Ashley 0 0 0 0 9 0 0 5 0 0 1 0 0 0 0 0 15 0 15
Baxter 0 0 0 1 20 0 2 9 0 1 4 0 0 0 0 4 33 0 37
Benton 0 0 0 0 4 0 0 2 0 2 1 0 0 1 0 2 8 0 10
Boone 0 1 0 2 18 0 6 10 0 0 5 0 2 1 0 10 35 0 45
Bradley 0 0 0 2 12 0 1 3 0 0 1 0 1 0 0 4 16 0 20
Calhoun 0 0 0 0 0 0 0 3 0 0 0 0 0 0 0 0 3 0 3
Carroll 0 0 0 1 2 0 0 2 0 0 1 0 0 0 0 1 5 0 6
Chicot 0 1 0 1 14 0 0 8 0 1 1 0 0 1 0 2 25 0 27
Clark 0 0 0 0 11 0 0 2 0 1 2 0 0 0 0 1 15 0 16
Clay 0 0 0 2 5 0 0 1 0 0 0 0 0 0 0 2 6 0 8
Cleburne 0 0 0 1 5 0 0 2 0 0 0 0 0 0 0 1 7 0 8
Cleveland 0 0 0 0 5 0 1 2 0 0 0 0 0 1 0 1 8 0 9
Columbia 0 1 0 0 24 0 0 13 0 0 3 0 0 0 0 0 41 0 41
Conway 0 1 0 0 3 0 0 2 0 0 0 0 0 0 0 0 6 0 6
Craighead 0 3 0 3 93 0 6 28 0 0 5 0 1 2 0 10 131 0 141
Crawford 0 0 0 2 9 0 1 4 0 0 1 0 0 1 0 3 15 0 18
Crittenden 0 0 0 4 72 0 3 32 0 1 7 0 1 1 0 9 112 0 121
Cross 0 0 0 0 17 0 0 0 0 0 0 0 0 0 0 0 17 0 17
Dallas 0 0 0 0 5 0 0 5 0 0 0 0 0 0 0 0 10 0 10
Desha 0 0 0 0 14 0 0 2 0 0 0 0 1 1 0 1 17 0 18
Drew 0 0 0 0 15 0 0 6 0 0 1 0 0 1 0 0 23 0 23
Faulkner 0 0 0 1 33 0 3 10 0 0 0 0 0 1 0 4 44 0 48
Franklin 0 0 0 1 1 0 0 2 0 0 0 0 0 0 0 1 3 0 4
Fulton 0 0 0 0 2 0 0 6 0 0 0 0 0 0 0 0 8 0 8
Garland 0 0 0 3 40 0 0 23 0 1 4 0 0 5 0 4 72 0 76
Grant 0 0 0 0 0 0 0 1 0 0 0 0 0 0 0 0 1 0 1
Greene 1 2 0 1 14 0 1 10 0 1 1 0 0 1 0 4 28 0 32
Hempstead 0 1 0 0 17 0 2 16 0 1 3 0 0 1 0 3 38 0 41
Hot Spring 0 0 0 0 5 0 1 6 0 0 0 0 0 0 0 1 11 0 12
Howard 0 0 0 1 8 0 1 3 0 0 1 0 0 0 0 2 12 0 14
Independence 0 0 0 1 13 0 2 17 0 0 0 0 1 0 0 4 30 0 34
Izard 0 0 0 0 1 0 2 0 0 0 0 0 0 0 0 2 1 0 3
Jackson 0 0 0 0 7 0 1 7 0 0 1 0 1 0 0 2 15 0 17
Jefferson 0 1 0 2 128 0 8 35 0 0 5 0 0 5 0 10 174 0 184
Johnson 0 0 0 0 1 0 0 1 0 0 0 0 0 1 0 0 3 0 3
Lafayette 0 0 0 0 9 0 0 2 0 0 0 0 0 0 0 0 11 0 11
Lee 0 3 0 3 42 0 2 9 0 1 1 0 0 0 0 6 55 0 61
ARKANSAS DHS STATISTICAL REPORT
ADULTS RECEIVING WORK PAYS
BY AGE GROUP
SFY 2010
CountyGrand
Total
19 & Under
M=Male, F = Female, and Ukn = Unknown
20 - 29 30 - 39 40 - 44 45 & Over Total
DCO-13

M F Ukn M F Ukn M F Ukn M F Ukn M F Ukn M F Ukn
Lincoln 0 0 0 1 13 0 0 1 0 0 0 0 1 0 0 2 14 0 16
Little River 0 0 0 1 4 0 0 1 0 0 0 0 0 0 0 1 5 0 6
Logan 0 0 0 0 5 0 2 3 0 0 0 0 1 0 0 3 8 0 11
Lonoke 1 1 0 1 11 0 0 8 0 0 1 0 0 0 0 2 21 0 23
Madison 0 0 0 0 2 0 0 1 0 0 1 0 0 0 0 0 4 0 4
Marion 0 0 0 2 5 0 1 4 0 0 0 0 0 0 0 3 9 0 12
Miller 0 1 0 3 47 0 2 18 0 0 3 0 0 0 0 5 69 0 74
Mississippi 0 0 0 0 43 0 1 4 0 1 0 0 0 0 0 2 47 0 49
Monroe 0 0 0 0 8 0 0 2 0 1 0 0 0 1 0 1 11 0 12
Montgomery 0 0 0 0 2 0 0 0 0 0 0 0 0 0 0 0 2 0 2
Nevada 0 0 0 1 6 0 0 9 0 0 0 0 1 0 0 2 15 0 17
Newton 0 0 0 0 1 0 0 1 0 0 2 0 0 0 0 0 4 0 4
Ouachita 0 0 0 1 24 0 0 11 0 0 0 0 0 0 0 1 35 0 36
Perry 0 0 0 0 0 0 0 3 0 0 1 0 0 0 0 0 4 0 4
Phillips 0 1 0 4 68 0 2 21 0 0 2 0 0 3 0 6 95 0 101
Pike 0 0 0 0 2 0 0 0 0 0 0 0 0 0 0 0 2 0 2
Poinsett 0 1 0 2 7 0 0 1 0 0 3 0 1 2 0 3 14 0 17
Polk 0 0 0 0 10 0 1 5 0 0 2 0 0 0 0 1 17 0 18
Pope 0 1 0 0 9 0 1 6 0 0 0 0 0 0 0 1 16 0 17
Prairie 0 0 0 0 1 0 0 1 0 0 0 0 0 0 0 0 2 0 2
Pulaski-East 0 1 0 0 33 0 2 11 0 0 4 0 1 1 0 3 50 0 53
Pulaski-JAX 0 3 0 0 49 0 2 22 0 0 2 0 0 0 0 2 76 0 78
Pulaski-North 0 2 0 5 126 0 2 24 0 1 6 0 1 0 0 9 158 0 167
Pulaski-South 0 3 0 2 124 0 4 37 0 0 7 0 1 1 0 7 172 0 179
Pulaski-SW 0 0 0 1 143 0 9 54 0 2 6 0 0 6 0 12 209 0 221
Randolph 0 0 0 0 0 0 1 2 0 0 0 0 1 0 0 2 2 0 4
Saline 0 0 0 0 13 0 1 12 0 0 2 0 0 1 0 1 28 0 29
Scott 0 1 0 0 6 0 1 0 0 0 1 0 0 0 0 1 8 0 9
Searcy 0 0 0 0 0 0 0 0 0 0 1 0 0 0 0 0 1 0 1
Sebastian 0 0 0 2 14 0 0 4 0 0 2 0 1 1 0 3 21 0 24
Sevier 0 1 0 1 2 0 0 3 0 0 1 0 0 0 0 1 7 0 8
Sharp 0 0 0 3 11 0 0 4 0 1 1 0 0 1 0 4 17 0 21
St Francis 0 1 0 3 75 0 4 25 0 2 3 0 0 2 0 9 106 0 115
Stone 0 0 0 0 1 0 0 0 0 0 0 0 0 0 0 0 1 0 1
Union 0 0 0 0 29 0 0 11 0 0 1 0 0 0 0 0 41 0 41
Van Buren 0 0 0 0 2 0 1 1 0 0 0 0 0 0 0 1 3 0 4
Washington 0 0 0 2 14 0 0 12 0 0 1 0 0 0 0 2 27 0 29
White 0 0 0 1 13 0 0 4 0 0 0 0 0 2 0 1 19 0 20
Woodruff 0 0 0 1 7 0 1 1 0 0 2 0 1 0 0 3 10 0 13
Yell 0 0 0 0 1 0 0 0 0 0 0 0 0 0 0 0 1 0 1
2,604189
45 & Over Total
State Total 2 31 69 1,615 0 02,4150 0
County
Grand
Total
19 & Under 20 - 29 30 - 39 40 - 44
SFY 2010
ARKANSAS DHS STATISTICAL REPORT
ADULTS RECEIVING WORK PAYS
BY AGE GROUP
19 104 18 45620 0 0
Source: Extract From ACES Data Base
M=Male, F = Female, and Ukn = Unknown
81
DCO-14

Descriptions Total Descriptions Total
Earnings exceed Federal Poverty Level 99 No longer resident of state 38
Failed to meet initial eligibility 548 Other, non-need related 6
Failed to meet participation requirements 551 Requested closure, no reason given 368
Failed to provide information 33 Work Pays time limit met 264
No longer eligible child in home 10 Death 3
TOTAL 1,920
Source: Extract From ACES Data Base
ARKANSAS DHS STATISTICAL REPORT
WORK PAYS
REASONS FOR CLOSURES
SFY 2010
DCO-15


ACPU**** 4,851 5,364 $4,788,003 Lincoln 1,385 3,193 $3,772,547
ACPU*** 804 865 906,763 Little River 1,270 3,118 3,092,965
Arkansas 2,366 5,258 5,546,764 Logan 2,437 6,173 6,453,220
Ashley 2,924 6,790 7,165,300 Lonoke 4,154 11,103 11,001,990
Baxter 3,230 7,712 7,382,069 Madison 1,183 3,286 3,263,257
Benton 10,156 30,320 28,133,763 Marion 1,534 3,713 4,026,970
Boone 2,994 7,708 7,616,345 Miller 4,748 11,344 11,812,668
Bradley 1,703 3,711 3,726,340 Mississippi 5,764 15,205 16,039,896
Calhoun 446 975 908,341 Monroe 1,305 2,785 2,927,227
Carroll 1,897 4,971 4,512,095 Montgomery 846 2,030 1,968,137
Chicot 2,237 4,729 5,204,001 Nevada 943 2,285 2,542,668
Clark 2,189 4,820 4,725,391 Newton 826 2,000 2,028,599
Clay 1,225 3,448 3,172,279 Ouachita 3,278 7,387 8,353,387
Cleburne 1,898 4,733 4,287,531 Perry 846 2,121 2,363,579
Cleveland 844 2,026 2,095,849 Phillips 4,614 10,295 12,453,826
Columbia 3,481 7,427 8,240,138 Pike 824 2,297 2,358,024
Conway 2,434 5,754 5,615,213 Poinsett 2,889 7,516 8,393,442
Craighead 7,570 20,978 21,264,150 Polk 1,937 5,164 5,343,974
Crawford 4,916 13,852 13,674,662 Pope 4,531 11,449 10,935,837
Crittenden 7,412 18,868 21,634,212 Prairie 758 1,820 1,828,052
Cross 1,707 4,388 4,415,911 Pulaski-East 3,656 7,028 8,735,384
Dallas 1,043 2,226 2,299,823 Pulaski-JAX 4,841 12,208 13,671,571
Desha 2,082 4,733 5,235,972 Pulaski-North 8,789 19,898 22,863,641
Drew 2,340 5,084 5,662,338 Pulaski-South 9,551 18,747 21,068,774
Faulkner 6,976 17,102 17,032,388 Pulaski-SW 7,958 19,355 22,605,368
Franklin 1,712 4,340 4,469,012 Randolph 1,683 4,289 4,273,817
Fulton 1,128 2,952 2,789,112 Saline 5,318 13,691 14,760,178
Garland 9,054 21,272 21,974,593 Scott 1,185 3,209 3,244,253
Grant 1,169 3,004 2,941,216 Searcy 803 1,986 1,970,962
Greene 3,785 10,112 10,275,104 Sebastian 10,633 27,304 27,494,253
Hempstead 2,505 6,359 6,297,983 Sevier 1,611 4,577 4,315,454
Hot Spring 2,964 7,089 7,251,066 Sharp 1,486 3,854 4,072,004
Howard 1,372 3,508 3,344,205 St Francis 4,202 9,521 11,617,954
Independence 2,689 7,503 6,866,987 Stone 1,155 2,753 2,638,637
Izard 979 2,560 2,579,105 Union 5,031 11,393 12,708,225
Jackson 1,900 4,720 5,059,805 Van Buren 1,596 3,907 3,979,498
Jefferson 11,708 24,696 29,533,217 Washington 12,508 36,695 35,126,007
Johnson 2,276 5,947 5,757,591 White 5375 13914 14339814
Lafayette 1,103 2,432 2,619,321 Woodruff 1088 2234 2,649,280Lawrence 1554 4,125 4,232,614 Yell 1578 4455 4,271,214Lee 1851 3,657 4,244,348
*Based on household size, which could include household members not eligible for participation in the SNAP Program.
**Does not include adjustments due to cancellations.
***Area Central Processing Unit - This unit, located in Craighead County, processes SNAP applications for SSI recipients living in
14 surrounding counties (Area II).
****Area Central Processing Unit - This unit processes SNAP applications for SSI recipients living in Pulaski County (Area 6).
Source: Extract from ACES Data Base/Monthly County Office Operational Reports
ARKANSAS DHS STATISTICAL REPORT
SUPPLEMENTAL NUTRITION ASSISTANCE PROGRAM
PARTICIPATION
SFY 2010
County
Unduplicated
Cases
$672,847,473
Total Coupons
Issued**
Unduplicated
Cases
Unduplicated
Persons*
643,420
Total Coupons
Issued** County
State Total 263,593
Unduplicated
Persons*
DCO-16

Area 2 CPU 20 73 321 735 2,310 1,766 5,364
Area 6 CPU 5 8 42 120 378 289 865Arkansas 952 1,201 972 853 668 237 5,258
Ashley 1,193 1,541 1,292 1,160 848 310 6,790
Baxter 1,316 1,625 1,379 1,397 1,133 350 7,712
Benton 6,589 7,543 5,481 5,145 2,680 688 30,320
Boone 1,406 1,723 1,509 1,344 883 312 7,708
Bradley 713 734 715 618 477 211 3,711
Calhoun 189 184 172 154 152 55 975
Carroll 980 1,151 825 848 590 217 4,971
Chicot 849 979 880 709 658 341 4,729
Clark 872 1,048 1,047 743 584 201 4,820
Clay 607 840 605 651 354 121 3,448
Cleburne 853 1,007 872 846 590 207 4,733
Cleveland 371 480 338 344 260 104 2,026
Columbia 1,325 1,603 1,618 1,167 901 324 7,427
Conway 1,085 1,184 1,118 994 732 233 5,754
Craighead 4,688 5,140 4,272 3,365 1,673 345 20,978
Crawford 2,726 3,436 2,398 2,445 1,462 410 13,852
Crittenden 3,889 4,933 3,475 2,795 2,088 380 18,868
Cross 840 1,034 850 735 464 135 4,388
Dallas 407 453 422 359 333 101 2,226
Desha 919 1,063 870 685 615 242 4,733
Drew 931 1,059 1,143 804 597 215 5,084
Faulkner 3,400 3,863 3,734 2,806 1,657 435 17,102
Franklin 772 916 801 787 540 211 4,340
Fulton 504 649 553 490 402 149 2,952
Garland 3,912 4,496 4,056 3,764 2,870 674 21,272
Grant 570 689 554 524 348 102 3,004
Greene 1,982 2,288 1,946 1,875 1,019 291 10,112
Hempstead 1,247 1,509 1,134 1,004 746 235 6,359
Hot Spring 1,354 1,495 1,364 1,171 963 251 7,089
Howard 734 773 671 581 369 137 3,508
Independence 1,537 1,689 1,431 1,316 770 234 7,503
Izard 421 568 443 464 371 109 2,560
Jackson 886 1,044 931 795 549 175 4,720
Jefferson 4,754 5,540 5,158 3,786 2,922 843 24,696
Johnson 1,118 1,301 1,153 1,013 707 209 5,947
Lafayette 355 539 411 355 420 183 2,432
Lawrence 733 919 727 734 511 188 4,125
Lee 564 751 673 524 585 297 3,657
*
**
***
7 - 18 19 - 30
Area Central Processing Unit (ACPU) - This unit, located in Craighead County, processes SNAP applications for SSI recipients
living in 14 surrounding counties (Area II).
65
& Over
Area Central Processing Unit - This unit processes SNAP applications for SSI recipients in Pulaski County (Area VI).
Total
Recipients31 - 45 46 - 64
ARKANSAS DHS STATISTICAL REPORT
SUPPLEMENTAL NUTRITION ASSISTANCE PROGRAM
BREAKDOWN BY AGE *
SFY 2010
RECIPIENTS
The unduplicated count of recipients is based on the household size and may include household members who are not
receiving benefits.
County 0 - 6
DCO-17

Lincoln 509 747 589 525 390 191 3,193
Little River 575 724 561 515 371 157 3,118
Logan 1,074 1,417 1,138 1,043 810 284 6,173
Lonoke 2,018 2,833 1,994 1,922 1,120 363 11,103
Madison 537 827 531 616 416 146 3,286
Marion 534 809 604 699 640 186 3,713
Miller 2,267 2,559 2,140 1,886 1,335 368 11,344
Mississippi 3,136 3,885 2,846 2,358 1,498 397 15,205
Monroe 454 602 472 412 451 229 2,785
Montgomery 326 490 330 312 336 103 2,030
Nevada 435 531 352 372 310 138 2,285
Newton 266 428 313 355 323 168 2,000
Ouachita 1,467 1,574 1,349 1,136 1,056 320 7,387
Perry 364 441 417 391 284 72 2,121
Phillips 1,878 2,515 1,868 1,394 1,349 546 10,295
Pike 427 558 406 379 276 89 2,297
Poinsett 1,362 1,733 1,276 1,419 887 305 7,516
Polk 926 1,165 914 885 699 227 5,164
Pope 2,280 2,408 2,353 1,955 1,334 342 11,449
Prairie 297 408 317 316 239 100 1,820
Pulaski-East 1,267 1,425 1,495 1,178 1,002 213 7,028
Pulaski-JAX 2,724 2,901 2,352 1,991 1,200 232 12,208
Pulaski-North 3,962 4,814 3,661 3,227 2,423 373 19,898
Pulaski-South 3,276 4,178 3,791 3,246 2,572 313 18,747
Pulaski-SW 4,211 4,968 3,717 3,138 1,628 312 19,355
Randolph 719 930 805 794 506 216 4,289
Saline 2,610 3,283 2,454 2,574 1,461 325 13,691
Scott 562 740 606 555 406 143 3,209
Searcy 288 424 333 362 310 143 1,986
Sebastian 5,544 6,318 4,906 4,864 3,077 759 27,304
Sevier 996 1,072 802 822 404 146 4,577
Sharp 641 868 677 653 549 191 3,854
St Francis 1,816 2,227 1,786 1,427 1,244 400 9,521
Stone 445 572 438 507 426 196 2,753
Union 2,147 2,490 2,175 1,847 1,547 393 11,393
Van Buren 624 797 737 668 623 198 3,907
Washington 8,279 8,574 6,949 6,413 3,183 716 36,695
White 2,670 3,115 2,626 2,357 1,611 550 13,914
Woodruff 322 456 357 349 406 207 2,234
Yell 872 1,095 765 718 477 225 4,455
*
Sources: Extract from ACES Database
The unduplicated count of recipients is based on the household size and may include household members who are not
receiving benefits.
ARKANSAS DHS STATISTICAL REPORT
BREAKDOWN BY AGE *
SFY 2010
31 - 45
SUPPLEMENTAL NUTRITION ASISTANCE PROGRAM
Total
Recipients
107,585
19 - 307 - 18
RECIPIENTS
120,558 23,499 643,420
65
& Over
146,972
County 0 - 6
123,675
46 - 64
76,358State Total
DCO-18

Area 2 CPU 3,727 1,417 29 27 27 137 5,364
Area 6 CPU 293 536 10 0 15 11 865
Arkansas 2,710 2,450 60 13 7 18 5,258
Ashley 3,345 3,071 307 5 4 58 6,790
Baxter 7,439 28 98 49 21 77 7,712
Benton 20,743 366 7,780 432 566 433 30,320
Boone 7,358 22 88 118 21 101 7,708
Bradley 1,333 1,817 490 5 1 65 3,711
Calhoun 520 427 20 1 3 4 975
Carroll 4,053 15 784 56 9 54 4,971
Chicot 803 3,737 162 8 3 16 4,729
Clark 2,325 2,050 360 26 30 29 4,820
Clay 3,363 3 38 13 0 31 3,448
Cleburne 4,560 12 96 26 8 31 4,733
Cleveland 1,469 521 20 5 1 10 2,026
Columbia 2,212 5,026 99 20 2 68 7,427
Conway 4,431 1,009 228 16 26 44 5,754
Craighead 12,199 7,270 1,132 59 36 282 20,978
Crawford 12,225 290 792 258 81 206 13,852
Crittenden 3,660 14,766 233 51 14 144 18,868
Cross 2,551 1,766 42 11 2 16 4,388
Dallas 767 1,402 46 9 0 2 2,226
Desha 1,239 3,317 163 7 0 7 4,733
Drew 2,503 2,408 101 17 15 40 5,084
Faulkner 11,227 4,556 905 136 53 225 17,102
Franklin 4,136 19 55 53 48 29 4,340
Fulton 2,856 13 22 42 4 15 2,952
Garland 15,693 3,749 1,267 125 51 387 21,272
Grant 2,835 93 48 6 5 17 3,004
Greene 9,570 85 306 43 12 96 10,112
Hempstead 2,329 3,160 757 24 23 66 6,359
Hot Spring 5,617 1,110 281 20 5 56 7,089
Howard 1,677 1,187 563 25 27 29 3,508
Independence 6,478 307 540 65 47 66 7,503
Izard 2,475 8 21 28 2 26 2,560
Jackson 3,193 1,299 141 52 3 32 4,720
Jefferson 4,878 19,421 164 36 24 173 24,696
Johnson 5,049 123 634 27 55 59 5,947
Lafayette 799 1,584 20 5 1 23 2,432
Lawrence 4,052 24 19 20 0 10 4,125
Lee 740 2,847 35 7 9 19 3,657
*
**
***
****
*****
ARKANSAS DHS STATISTICAL REPORT
SUPPLEMENTAL NUTRITION ASSISTANCE PROGRAM
BREAKDOWN BY RACE
SFY 2010
RECIPIENTS
AIAN* ASIAN**
Total***
Recipients
Area Central Processing Unit - This unit processes SNAP applications for SSI recipients in Pulaski Co. (Area VI)
County White Black
Area Central Processing Unit (ACPU) - This unit, located in Craighead County, processes SNAP applications for SSI recipients living in
14 surrounding counties (Area II)
Includes Native American, Alaskan Native, and American Indian.
Includes Asian, Cambodian, Hmong, Laotian, Vietnamese, and Oriental.
Hispanic
The unduplicated count of recipients is based on the household size and may include household members who are not receiving
benefits.
Other or
Unknown
DCO-19

Lincoln 1,815 1,263 83 21 3 8 3,193
Little River 2,009 940 90 54 6 19 3,118
Logan 5,781 113 101 30 90 58 6,173
Lonoke 9,061 1,520 226 52 65 179 11,103
Madison 3,050 9 143 41 8 35 3,286
Marion 3,568 5 51 38 3 48 3,713
Miller 5,702 5,181 225 44 24 168 11,344
Mississippi 6,089 8,390 579 39 9 99 15,205
Monroe 882 1,839 32 9 4 19 2,785
Montgomery 1,823 11 155 26 8 7 2,030
Nevada 1,114 1,112 46 13 0 0 2,285
Newton 1,964 4 7 6 5 14 2,000
Ouachita 2,591 4,596 105 10 7 78 7,387
Perry 2,028 34 36 16 6 1 2,121
Phillips 1,667 8,495 74 17 2 40 10,295
Pike 1,891 84 250 20 14 38 2,297
Poinsett 6,337 921 172 15 10 61 7,516
Polk 4,765 20 218 132 10 19 5,164
Pope 9,748 730 760 33 24 154 11,449
Prairie 1,297 501 12 3 0 7 1,820
Pulaski-East 1,703 5,028 128 17 35 117 7,028
Pulaski-JAX 6,080 5,173 475 47 73 360 12,208
Pulaski-North 4,612 14,119 780 61 67 259 19,898
Pulaski-South 1,871 16,099 414 54 50 259 18,747
Pulaski-SW 3,567 13,832 1,539 35 102 280 19,355
Randolph 4,147 41 51 25 0 25 4,289
Saline 11,835 1,111 474 44 93 134 13,691
Scott 2,804 4 246 54 75 26 3,209
Searcy 1,921 0 28 17 0 20 1,986
Sebastian 17,113 3,927 4,435 450 675 704 27,304
Sevier 2,545 242 1,654 103 5 28 4,577
Sharp 3,726 32 37 25 1 33 3,854
St Francis 2,160 7,238 66 24 1 32 9,521
Stone 2,623 0 69 37 4 20 2,753
Union 3,814 7,040 388 41 21 89 11,393
Van Buren 3,726 23 95 31 7 25 3,907
Washington 20,862 2,057 9,817 411 2,884 664 36,695
White 12,039 1,163 432 61 37 182 13,914
Woodruff 1,177 1,042 4 0 0 11 2,234
Yell 3,297 90 917 37 57 57 4,455
*
**
***
Sources: Extract from ACES Database
ARKANSAS DHS STATISTICAL REPORT
Hispanic
RECIPIENTS
County White
BREAKDOWN BY RACE
SFY 2010
SUPPLEMENTAL NUTRITION ASISTANCE PROGRAM
Total***
RecipientsBlack ASIAN **
Other or
UnknownAIAN *
The unduplicated count of recipients is based on the household size and may include household members who are not receiving
benefits.
Includes Native American, Alaskan Native, and American Indian.
Includes Asian, Cambodian, Hmong, Laotian, Vietnamese, and Oriental.
643,4207,589207,340 44,370 4,139 5,746State Total 374,236
DCO-20


Arkansas 6,064 18,971 31.96% Lincoln 3,510 13,553 25.90%
Ashley 7,675 21,941 34.98% Little River 3,763 12,952 29.05%
Baxter 9,639 42,157 22.86% Logan 7,307 22,342 32.71%
Benton 41,356 225,504 18.34% Lonoke 14,766 66,677 22.15%
Boone 9,501 36,821 25.80% Madison 4,221 15,875 26.59%
Bradley 3,982 11,790 33.77% Marion 4,252 16,594 25.62%
Calhoun 1,354 5,196 26.06% Miller 13,152 43,522 30.22%
Carroll 6,813 27,938 24.39% Mississippi 18,202 46,605 39.06%
Chicot 5,203 11,823 44.01% Monroe 3,240 8,171 39.65%
Clark 6,263 23,835 26.28% Montgomery 2,638 9,009 29.28%
Clay 4,880 15,585 31.31% Nevada 3,072 9,164 33.52%
Cleburne 6,539 25,600 25.54% Newton 2,468 8,191 30.13%
Cleveland 2,261 8,436 26.80% Ouachita 8,481 25,432 33.35%
Columbia 8,093 23,854 33.93% Perry 2,608 10,312 25.29%
Conway 6,659 20,799 32.02% Phillips 11,017 20,921 52.66%
Craighead 27,522 95,457 28.83% Pike 3,139 10,627 29.54%
Crawford 16,964 60,102 28.23% Poinsett 9,188 24,682 37.23%
Crittenden 20,595 53,022 38.84% Polk 6,378 20,259 31.48%
Cross 5,959 18,544 32.13% Pope 16,217 60,214 26.93%
Dallas 2,810 7,991 35.16% Prairie 2,505 8,582 29.19%
Desha 5,250 13,358 39.30% Pulaski 103,043 381,904 26.98%
Drew 5,650 18,624 30.34% Randolph 5,694 17,952 31.72%
Faulkner 22,064 109,386 20.17% Saline 17,521 99,449 17.62%
Franklin 5,199 18,016 28.86% Scott 3,741 11,123 33.63%
Fulton 3,912 11,585 33.77% Searcy 2,681 7,944 33.75%
Garland 25,461 98,479 25.85% Sebastian 33,208 123,597 26.87%
Grant 3,912 17,760 22.03% Sevier 5,599 16,904 33.12%
Greene 12,506 40,996 30.51% Sharp 5,359 17,664 30.34%
Hempstead 8,030 23,027 34.87% St Francis 10,542 26,255 40.15%
Hot Spring 8,677 31,787 27.30% Stone 3,680 11,991 30.69%
Howard 4,606 14,291 32.23% Union 13,478 42,782 31.50%
Independence 10,636 34,634 30.71% Van Buren 4,496 16,418 27.38%
Izard 3,651 13,038 28.00% Washington 42,577 200,181 21.27%
Jackson 5,659 16,658 33.97% White 18,488 76,338 24.22%
Jefferson 25,729 78,705 32.69% Woodruff 2,673 7,359 36.32%
Johnson 8,057 24,994 32.24% Yell 6,824 22,496 30.33%
Lafayette 2,681 7,504 35.73%
Lawrence 5,863 16,882 34.73%
Lee 4,075 10,319 39.49%
*
Source: Extract from ACES Database for the Medicaid Eligibles and the Arkansas Institute for Economic Advancement, UALR, for 2007 population numbers
Medicaid Eligibles for Pulaski South, North, Southwest, East and Jacksonville were combined because there is no current population
estimate breakdown.
State Total 791,478 2,889,450 27.39%
ARKANSAS DHS STATISTICAL REPORT
MEDICAID ELIGIBLES
SFY 2010
County Population
Percent
Eligible
Percent
EligibleCounty
Medicaid
Eligibles
Medicaid
EligiblesPopulation
DCO-21

County
Arkansas 273 150 0 12 435 457 336 4 183 980
Ashley 280 207 10 20 517 436 627 11 220 1,294
Baxter 652 1 3 23 679 1,416 5 14 280 1,715
Benton 1,347 5 159 98 1,609 3,180 74 207 1,006 4,467
Boone 612 2 5 19 638 1,281 5 7 281 1,574
Bradley 170 118 5 4 297 260 307 8 119 694
Calhoun 44 24 0 3 71 87 100 1 38 226
Carroll 317 0 7 15 339 668 1 19 151 839
Chicot 137 295 1 21 454 176 726 1 177 1,080
Clark 258 130 1 10 399 542 315 5 196 1,058
Clay 363 0 0 18 381 732 22 5 176 935
Cleburne 452 1 1 19 473 816 2 4 173 995
Cleveland 124 26 1 4 155 160 111 1 53 325
Columbia 266 297 1 16 580 350 895 3 281 1,529
Conway 374 81 0 17 472 935 224 7 278 1,444Craighead 1,141 82 7 54 1,284 2,879 857 32 1,178 4,946
Crawford 749 18 19 44 830 2,180 67 29 542 2,818
Crittenden 290 601 5 59 955 673 2,567 13 764 4,017
Cross 282 144 0 15 441 472 370 2 211 1,055
Dallas 92 104 1 5 202 183 353 2 146 684
Desha 146 210 3 8 367 227 536 8 174 945
Drew 216 162 0 10 388 373 315 5 171 864
Faulkner 748 100 7 50 905 2,312 586 25 769 3,692
Franklin 405 2 4 10 421 654 2 6 146 808
Fulton 390 3 1 9 403 649 1 2 113 765
Garland 1,122 137 19 70 1,348 2,891 737 48 907 4,583
Grant 200 18 0 8 226 401 28 5 102 536
Greene 598 2 2 25 627 1,662 23 11 395 2,091
Hempstead 224 188 1 14 427 435 495 5 266 1,201
Hot Spring 380 75 0 12 467 933 236 7 237 1,413
Howard 212 74 8 17 311 315 197 7 121 640Independence 694 18 6 39 757 1,424 64 16 273 1,777
Izard 324 2 3 11 340 536 0 2 85 623
Jackson 327 77 0 11 415 674 225 1 173 1,073
Jefferson 464 949 6 70 1,489 906 3,060 12 1,027 5,005
Johnson 338 3 21 24 386 1,047 38 21 187 1,293
Lafayette 73 133 0 7 213 127 320 1 126 574
Lawrence 506 4 1 19 530 925 7 4 185 1,121
Lee 111 269 1 14 395 145 638 2 177 962
ARKANSAS DHS STATISTICAL REPORT
MEDICAID ELIGIBLES
BY CATEGORY AND RACE
SFY 2010
Total White
Aid to the Disabled
White Black
Aid to the Aged
Black HispanicOther or
UnknownHispanicOther or
Unknown Total
DCO-22

County
Lincoln 221 85 0 6 312 235 199 3 94 531
Little River 196 72 4 8 280 269 185 5 92 551
Logan 453 9 2 20 484 1,041 55 7 167 1,270
Lonoke 680 130 3 21 835 1,353 329 14 512 2,208
Madison 285 0 6 12 303 455 2 7 108 572
Marion 317 0 0 11 328 631 3 2 137 773
Miller 416 198 3 31 648 1,002 830 16 585 2,433
Mississippi 494 310 8 43 855 1,191 1,567 30 1,124 3,912
Monroe 143 152 1 12 308 172 384 2 115 673
Montgomery 214 0 1 8 223 289 1 3 49 342
Nevada 130 91 2 6 229 270 265 4 104 643
Newton 221 0 0 9 230 391 1 2 62 456
Ouachita 283 300 1 16 600 464 936 7 245 1,652
Perry 156 3 0 3 162 361 9 0 97 467
Phillips 149 491 1 25 666 354 1,530 11 473 2,368Pike 229 10 0 9 248 321 17 2 71 411
Poinsett 590 53 1 26 670 1,216 205 9 347 1,777
Polk 417 0 4 24 445 659 2 12 167 840
Pope 775 25 16 38 854 1,976 141 40 375 2,532
Prairie 176 49 1 6 232 258 139 1 90 488
Pulaski-East 282 294 8 56 640 699 1,056 9 409 2,173
Pulaski-JAX 316 86 4 50 456 1,144 566 27 572 2,309
Pulaski-North 815 540 8 91 1,454 1,173 2,482 27 1,208 4,890
Pulaski-South 225 530 12 64 831 1,304 2,642 38 1,459 5,443
Pulaski-SW 281 288 15 59 643 965 2,072 23 1,105 4,165
Randolph 452 6 0 18 476 734 7 1 129 871
Saline 780 48 6 24 858 1,416 192 17 188 1,813
Scott 233 1 1 11 246 488 4 10 105 607
Searcy 276 0 0 13 289 466 0 1 86 553
Sebastian 1,213 120 43 226 1,602 3,320 700 99 1,090 5,209
Sevier 238 25 11 7 281 377 39 24 105 545Sharp 438 2 1 18 459 787 7 6 156 956
St Francis 212 343 5 28 588 453 1,328 10 393 2,184
Stone 298 0 0 13 311 558 2 5 102 667
Union 416 437 3 21 877 748 1,435 11 387 2,581
Van Buren 342 0 0 8 350 579 3 7 122 711
Washington 1,386 19 88 95 1,588 3,677 263 174 1,016 5,130
White 996 32 7 68 1,103 2,219 165 15 487 2,886
Woodruff 182 104 0 10 296 246 218 0 61 525
Yell 485 10 9 18 522 765 20 26 195 1,006
1,270 26,476 132,764584 44,408 69,545 35,473State Total 32,112 9,575
HispanicOther or
Unknown Total Black HispanicWhiteOther or
UnknownWhite Black
Aid to the Aged Aid to the Disabled
Total
ARKANSAS DHS STATISTICAL REPORT
MEDICAID ELIGIBLES
BY CATEGORY AND RACE
SFY 2010
2,137
DCO-23

County
Arkansas 4 5 0 1 10 1,608 1,277 117 36 3,038
Ashley 3 3 0 0 6 1,977 1,459 353 49 3,838
Baxter 9 1 0 2 12 4,525 16 112 68 4,721
Benton 14 1 3 7 25 15,628 364 10,321 1,292 27,605
Boone 4 0 0 0 4 4,673 20 92 122 4,907
Bradley 0 3 0 2 5 759 732 484 65 2,040
Calhoun 2 0 0 0 2 429 221 25 5 680
Carroll 6 0 0 1 7 3,062 10 1,086 85 4,243
Chicot 3 4 0 1 8 443 1,637 179 42 2,301
Clark 7 3 0 1 11 1,491 993 313 80 2,877
Clay 3 0 0 0 3 2,403 13 54 32 2,502
Cleburne 4 1 0 2 7 3,252 18 114 51 3,435
Cleveland 3 1 0 1 5 837 267 48 17 1,169
Columbia 1 6 0 1 8 1,258 2,067 109 53 3,487
Conway 8 2 0 1 11 2,434 527 175 90 3,226Craighead 21 13 0 4 38 8,279 4,089 1,206 357 13,931
Crawford 10 2 0 1 13 7,585 209 1,021 725 9,540
Crittenden 3 20 1 2 26 2,247 7,356 173 158 9,934
Cross 3 4 0 1 8 1,790 992 48 52 2,882
Dallas 2 1 0 1 4 407 725 49 24 1,205
Desha 3 3 0 1 7 766 1,525 159 18 2,468
Drew 1 1 0 0 2 1,409 1,153 108 52 2,722
Faulkner 18 11 0 1 30 8,259 2,564 897 619 12,339
Franklin 2 0 0 0 2 2,481 38 60 113 2,692
Fulton 2 0 0 0 2 1,579 21 23 25 1,648
Garland 16 5 1 8 30 9,913 2,249 1,505 399 14,066
Grant 2 0 0 2 4 2,027 53 72 31 2,183
Greene 8 0 0 0 8 6,156 78 253 79 6,566
Hempstead 2 4 1 2 9 1,519 1,582 1,099 113 4,313
Hot Spring 8 1 0 0 9 3,748 704 248 75 4,775
Howard 1 1 1 0 3 1,156 633 604 44 2,437Independence 5 0 0 5 10 4,212 176 756 265 5,409
Izard 4 0 0 0 4 1,643 9 19 32 1,703
Jackson 3 1 0 0 4 1,825 634 104 49 2,612
Jefferson 7 22 0 7 36 2,622 8,840 163 225 11,850
Johnson 1 0 0 1 2 3,237 78 1,028 126 4,469
Lafayette 1 3 0 1 5 467 675 17 21 1,180
Lawrence 1 0 0 0 1 2,554 15 28 27 2,624
Lee 0 4 0 0 4 415 1,005 23 24 1,467
White Black HispanicOther or
Unknown Total White
Aid to the Blind ARKids
TotalBlackOther or
UnknownHispanic
ARKANSAS DHS STATISTICAL REPORT
MEDICAID ELIGIBLES
BY CATEGORY AND RACE
SFY 2010
DCO-24

County
Lincoln 2 3 0 0 5 995 569 100 28 1,692Little River 0 0 0 0 0 1,115 494 130 71 1,810
Logan 6 0 0 0 6 3,314 56 117 192 3,679
Lonoke 12 2 0 5 19 6,875 942 346 276 8,439
Madison 3 0 0 0 3 2,118 5 245 76 2,444
Marion 5 0 0 0 5 2,009 7 49 51 2,116
Miller 1 3 1 4 9 3,586 2,474 221 125 6,406
Mississippi 7 9 0 2 18 3,600 4,183 493 107 8,383
Monroe 1 3 0 0 4 568 805 27 24 1,424
Montgomery 2 0 0 0 2 1,282 7 141 24 1,454
Nevada 2 1 0 0 3 796 598 53 28 1,475
Newton 4 0 0 0 4 1,165 1 1 13 1,180
Ouachita 3 13 0 2 18 1,568 2,297 78 68 4,011
Perry 1 0 0 0 1 1,287 29 49 16 1,381
Phillips 2 11 0 4 17 916 3,665 47 50 4,678
Pike 2 0 0 0 2 1,445 47 275 25 1,792Poinsett 6 2 0 0 8 3,570 499 183 54 4,306
Polk 4 0 0 2 6 3,027 22 382 119 3,550
Pope 13 0 0 1 14 6,680 462 1,189 348 8,679
Prairie 3 1 0 0 4 861 253 26 17 1,157
Pulaski-East 10 10 0 2 22 1,415 3,031 350 259 5,055
Pulaski-JAX 6 5 0 2 13 4,983 4,066 693 449 10,191
Pulaski-North 14 23 0 2 39 2,801 7,085 1,127 366 11,379
Pulaski-South 23 24 0 12 59 878 8,232 927 296 10,333
Pulaski-SW 12 25 0 4 41 2,604 8,942 3,218 490 15,254
Randolph 3 0 0 0 3 2,697 37 64 37 2,835
Saline 10 0 0 2 12 9,017 810 746 277 10,850
Scott 5 0 0 2 7 1,580 13 274 137 2,004
Searcy 3 0 0 1 4 1,239 1 36 21 1,297
Sebastian 19 3 2 7 31 9,626 2,229 5,641 1,390 18,886
Sevier 0 0 1 0 1 1,381 132 2,103 103 3,719
Sharp 3 0 0 0 3 2,419 25 43 40 2,527St Francis 7 8 0 5 20 1,187 2,997 62 59 4,305
Stone 3 0 1 0 4 1,780 5 62 29 1,876
Union 3 6 0 3 12 2,525 3,729 410 123 6,787
Van Buren 5 0 0 0 5 2,204 30 79 44 2,357
Washington 20 0 4 6 30 13,100 1,264 11,426 2,665 28,455
White 17 1 0 5 23 8,306 797 695 306 10,104
Woodruff 1 2 0 0 3 710 410 12 11 1,143
Yell 4 0 0 1 5 2,273 81 1,522 138 4,014
State Total 442 281 16 131 870 240,577 106,355 56,887 14,692 418,511
Total BlackWhite TotalWhite Black HispanicOther or
Unknown HispanicOther or
Unknown
ARKidsAid to the Blind
SFY 2010
ARKANSAS DHS STATISTICAL REPORT
MEDICAID ELIGIBLES
BY CATEGORY AND RACE
DCO-25

County
Arkansas 373 297 6 5 681 198 83 1 4 286
Ashley 463 354 13 3 833 205 157 2 3 367
Baxter 1,035 3 11 6 1,055 585 7 19 15 626
Benton 2,992 50 723 142 3,907 1,327 32 140 73 1,572
Boone 827 1 15 16 859 643 2 1 10 656
Bradley 130 181 27 9 347 129 100 8 3 240
Calhoun 100 57 1 2 160 69 35 0 0 104
Carroll 493 1 50 14 558 376 2 11 5 394
Chicot 110 319 10 3 442 78 260 5 3 346
Clark 566 453 17 11 1,047 181 95 2 11 289
Clay 294 1 4 3 302 304 1 1 7 313
Cleburne 657 1 11 6 675 444 2 4 6 456
Cleveland 161 63 2 4 230 106 55 0 0 161
Columbia 405 686 10 13 1,114 141 282 0 5 428
Conway 452 105 8 9 574 251 73 2 5 331Craighead 1,760 1,023 60 47 2,890 1,147 251 18 43 1,459
Crawford 1,270 40 57 58 1,425 774 17 20 38 849
Crittenden 475 1,569 16 16 2,076 233 472 11 11 727
Cross 360 220 3 2 585 191 110 1 1 303
Dallas 99 228 0 2 329 75 68 0 0 143
Desha 181 340 12 4 537 101 145 2 5 253
Drew 368 312 12 9 701 188 147 5 5 345
Faulkner 1,549 703 43 56 2,351 675 173 18 27 893
Franklin 510 14 2 15 541 329 7 4 11 351
Fulton 371 1 4 3 379 277 2 2 4 285
Garland 1,633 361 76 37 2,107 955 205 23 58 1,241
Grant 400 11 9 4 424 172 6 0 3 181
Greene 1,057 4 25 7 1,093 742 9 3 26 780
Hempstead 463 503 53 16 1,035 187 235 9 5 436
Hot Spring 667 132 7 7 813 445 97 6 10 558
Howard 368 253 30 11 662 97 89 7 5 198Independence 926 35 19 28 1,008 564 27 10 23 624
Izard 366 0 2 7 375 277 0 2 5 284
Jackson 398 108 3 7 516 299 126 2 5 432
Jefferson 467 2,014 10 28 2,519 366 795 3 25 1,189
Johnson 744 25 89 18 876 392 14 13 11 430
Lafayette 124 187 1 4 316 85 84 0 4 173
Lawrence 526 2 3 3 534 419 5 1 5 430
Lee 108 263 3 3 377 73 181 4 3 261
ARKANSAS DHS STATISTICAL REPORT
MEDICAID ELIGIBLES
BY CATEGORY AND RACE
SFY 2010
Other or
Unknown Total
Family Planning Other
White Black Hispanic White Black HispanicOther or
Unknown Total
DCO-26
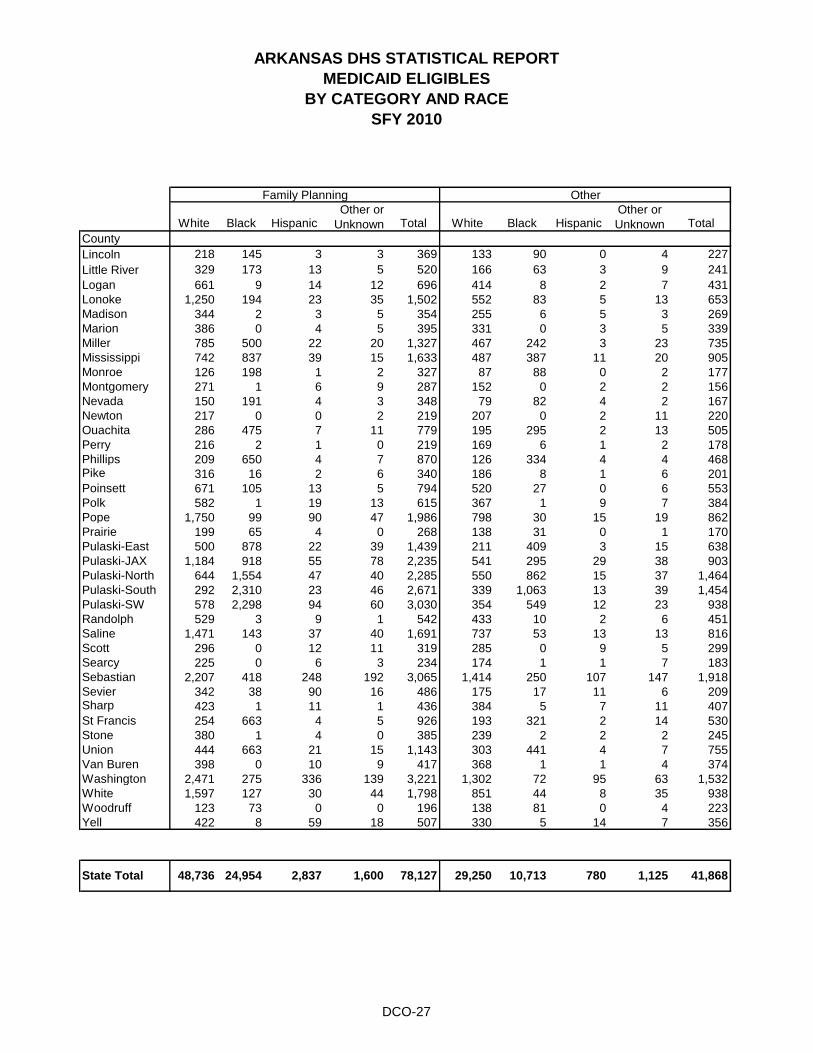
County
Lincoln 218 145 3 3 369 133 90 0 4 227
Little River 329 173 13 5 520 166 63 3 9 241
Logan 661 9 14 12 696 414 8 2 7 431
Lonoke 1,250 194 23 35 1,502 552 83 5 13 653
Madison 344 2 3 5 354 255 6 5 3 269
Marion 386 0 4 5 395 331 0 3 5 339
Miller 785 500 22 20 1,327 467 242 3 23 735
Mississippi 742 837 39 15 1,633 487 387 11 20 905
Monroe 126 198 1 2 327 87 88 0 2 177
Montgomery 271 1 6 9 287 152 0 2 2 156
Nevada 150 191 4 3 348 79 82 4 2 167
Newton 217 0 0 2 219 207 0 2 11 220
Ouachita 286 475 7 11 779 195 295 2 13 505
Perry 216 2 1 0 219 169 6 1 2 178
Phillips 209 650 4 7 870 126 334 4 4 468Pike 316 16 2 6 340 186 8 1 6 201
Poinsett 671 105 13 5 794 520 27 0 6 553
Polk 582 1 19 13 615 367 1 9 7 384
Pope 1,750 99 90 47 1,986 798 30 15 19 862
Prairie 199 65 4 0 268 138 31 0 1 170
Pulaski-East 500 878 22 39 1,439 211 409 3 15 638
Pulaski-JAX 1,184 918 55 78 2,235 541 295 29 38 903
Pulaski-North 644 1,554 47 40 2,285 550 862 15 37 1,464
Pulaski-South 292 2,310 23 46 2,671 339 1,063 13 39 1,454
Pulaski-SW 578 2,298 94 60 3,030 354 549 12 23 938
Randolph 529 3 9 1 542 433 10 2 6 451
Saline 1,471 143 37 40 1,691 737 53 13 13 816
Scott 296 0 12 11 319 285 0 9 5 299
Searcy 225 0 6 3 234 174 1 1 7 183
Sebastian 2,207 418 248 192 3,065 1,414 250 107 147 1,918
Sevier 342 38 90 16 486 175 17 11 6 209Sharp 423 1 11 1 436 384 5 7 11 407
St Francis 254 663 4 5 926 193 321 2 14 530
Stone 380 1 4 0 385 239 2 2 2 245
Union 444 663 21 15 1,143 303 441 4 7 755
Van Buren 398 0 10 9 417 368 1 1 4 374
Washington 2,471 275 336 139 3,221 1,302 72 95 63 1,532
White 1,597 127 30 44 1,798 851 44 8 35 938
Woodruff 123 73 0 0 196 138 81 0 4 223
Yell 422 8 59 18 507 330 5 14 7 356
1,125 41,86878,127State Total 48,736 24,954 2,837 1,600 29,250 10,713 780
Family Planning Other
White Black HispanicOther or
Unknown Total White Black HispanicOther or
Unknown Total
ARKANSAS DHS STATISTICAL REPORT
MEDICAID ELIGIBLES
BY CATEGORY AND RACE
SFY 2010
DCO-27

White Black Hispanic TotalCounty
Arkansas 242 141 1 4 388 108 133 4 1 246
Ashley 269 129 22 3 423 182 210 2 3 397
Baxter 535 2 2 2 541 283 1 3 3 290
Benton 1,349 8 371 96 1,824 283 9 37 18 347
Boone 335 2 2 6 345 490 6 2 16 514
Bradley 81 78 15 2 176 59 116 4 4 183
Calhoun 42 12 4 0 58 16 37 0 0 53
Carroll 272 0 52 23 347 77 0 3 6 86
Chicot 54 176 14 26 270 43 258 0 1 302
Clark 166 119 14 8 307 97 154 16 8 275
Clay 235 2 5 1 243 193 4 1 3 201
Cleburne 361 0 2 6 369 121 4 1 3 129
Cleveland 87 16 2 3 108 78 26 0 4 108
Columbia 172 259 9 6 446 109 381 3 8 501
Conway 335 51 20 7 413 144 40 2 2 188Craighead 1,113 459 102 42 1,716 591 595 31 24 1,241
Crawford 662 10 44 207 923 507 13 18 26 564
Crittenden 354 970 39 11 1,374 191 1,265 17 13 1,486
Cross 208 127 7 4 346 151 180 3 3 337
Dallas 46 75 3 3 127 39 74 1 2 116
Desha 83 212 12 3 310 51 308 2 2 363
Drew 157 133 7 10 307 132 176 6 7 321
Faulkner 663 202 23 371 1,259 368 204 7 15 594
Franklin 256 0 4 6 266 112 4 1 1 118
Fulton 195 2 0 1 198 225 3 3 1 232
Garland 1,093 184 113 35 1,425 450 174 23 14 661
Grant 229 7 8 3 247 103 3 3 2 111
Greene 748 1 21 9 779 533 10 8 10 561
Hempstead 165 146 18 24 353 68 172 11 5 256
Hot Spring 405 89 13 5 512 92 33 3 2 130
Howard 106 94 20 5 225 38 76 7 9 130Independence 369 11 23 130 533 435 36 39 8 518
Izard 163 3 5 3 174 144 0 3 1 148
Jackson 198 66 11 5 280 188 127 6 6 327
Jefferson 265 961 18 23 1,267 342 2,005 9 17 2,373
Johnson 359 6 55 5 425 162 4 6 4 176
Lafayette 44 64 3 1 112 32 72 3 1 108
Lawrence 301 1 1 1 304 314 3 1 1 319
Lee 58 87 2 1 148 42 416 0 3 461
ARKANSAS DHS STATISTICAL REPORT
MEDICAID ELIGIBLES
BY CATEGORY AND RACE
SFY 2010
Other or
Unknown
Pregnant Women TEA
White Black HispanicOther or
Unknown Total
DCO-28

County
Lincoln 113 62 5 2 182 109 79 0 4 192
Little River 147 52 7 3 209 70 75 2 5 152
Logan 341 7 8 16 372 338 7 7 17 369
Lonoke 607 64 15 73 759 275 57 6 12 350
Madison 195 0 10 1 206 69 0 1 0 70
Marion 168 0 0 3 171 121 2 1 1 125
Miller 450 254 13 11 728 290 549 20 7 866
Mississippi 512 549 43 24 1,128 389 940 26 11 1,366
Monroe 54 50 1 2 107 48 169 1 2 220
Montgomery 109 0 5 1 115 54 0 5 0 59
Nevada 94 50 6 5 155 14 30 1 2 47
Newton 77 0 0 0 77 82 0 0 0 82
Ouachita 195 309 11 14 529 85 292 4 6 387
Perry 115 1 9 1 126 66 5 0 3 74
Phillips 150 330 10 5 495 166 1,278 6 5 1,455Pike 104 7 7 2 120 22 2 0 1 25
Poinsett 429 40 14 6 489 482 90 10 7 589
Polk 319 0 10 2 331 195 2 6 4 207
Pope 809 56 86 25 976 275 18 15 6 314
Prairie 96 17 0 2 115 44 26 1 0 71
Pulaski-East 206 395 15 22 638 90 386 14 10 500
Pulaski-JAX 611 382 42 63 1,098 241 258 25 9 533
Pulaski-North 361 690 28 307 1,386 197 1,092 26 24 1,339
Pulaski-South 113 648 16 35 812 96 829 14 29 968
Pulaski-SW 231 876 64 84 1,255 327 1,592 105 39 2,063
Randolph 292 2 4 2 300 207 6 0 3 216
Saline 902 65 32 54 1,053 377 37 7 7 428
Scott 149 0 10 11 170 82 0 2 5 89
Searcy 79 0 0 0 79 39 0 2 1 42
Sebastian 1,085 271 292 185 1,833 439 145 40 33 657
Sevier 153 9 46 11 219 90 16 24 9 139
Sharp 269 1 2 4 276 279 9 3 4 295St Francis 177 417 5 7 606 202 1,151 21 9 1,383
Stone 138 0 4 3 145 44 2 1 0 47
Union 296 448 55 8 807 154 339 8 14 515
Van Buren 187 0 7 8 202 78 2 0 0 80
Washington 1,463 56 368 94 1,981 478 66 61 31 636
White 1,083 73 34 22 1,212 339 59 18 7 423
Woodruff 53 37 0 4 94 65 121 2 5 193
Yell 251 5 66 18 340 69 4 1 0 74
TEA
White Black HispanicOther or
Unknown Total
14,680 17,067 775 589 33,111
Other or
Unknown TotalBlack Hispanic
Pregnant Women
White
ARKANSAS DHS STATISTICAL REPORT
MEDICAID ELIGIBLES
BY CATEGORY AND RACE
SFY 2010
State Total 25,958 11,128 2,437 2,241 41,764
DCO-29

White Black Hispanic TotalCounty
Arkansas 0 0 0 0 0 3,263 2,422 133 246 6,064
Ashley 0 0 0 0 0 3,815 3,146 413 301 7,675
Baxter 0 0 0 0 0 9,040 36 164 399 9,639
Benton 0 0 0 0 0 26,120 543 11,961 2,732 41,356
Boone 0 0 0 0 0 8,865 38 124 474 9,501
Bradley 0 0 0 0 0 1,588 1,635 551 208 3,982
Calhoun 0 0 0 0 0 789 486 31 48 1,354
Carroll 0 0 0 0 0 5,271 14 1,228 300 6,813
Chicot 0 0 0 0 0 1,044 3,675 210 274 5,203
Clark 0 0 0 0 0 3,308 2,262 368 325 6,263
Clay 0 0 0 0 0 4,527 43 70 240 4,880
Cleburne 0 0 0 0 0 6,107 29 137 266 6,539
Cleveland 0 0 0 0 0 1,556 565 54 86 2,261
Columbia 0 0 0 0 0 2,702 4,873 135 383 8,093
Conway 0 0 0 0 0 4,933 1,103 214 409 6,659
Craighead 2 0 0 0 2 16,942 7,373 1,456 1,751 27,522Crawford 2 0 0 0 2 13,739 376 1,208 1,641 16,964
Crittenden 0 0 0 0 0 4,466 14,820 275 1,034 20,595
Cross 0 0 0 0 0 3,459 2,147 64 289 5,959
Dallas 0 0 0 0 0 943 1,628 56 183 2,810
Desha 0 0 0 0 0 1,558 3,279 198 215 5,250
Drew 0 0 0 0 0 2,844 2,399 143 264 5,650
Faulkner 1 0 0 0 1 14,593 4,543 1,020 1,908 22,064
Franklin 0 0 0 0 0 4,749 67 81 302 5,199
Fulton 0 0 0 0 0 3,688 33 35 156 3,912
Garland 0 0 0 0 0 18,073 4,052 1,808 1,528 25,461
Grant 0 0 0 0 0 3,534 126 97 155 3,912
Greene 0 0 0 0 0 11,505 127 323 551 12,506
Hempstead 0 0 0 0 0 3,063 3,325 1,197 445 8,030
Hot Spring 0 0 0 0 0 6,678 1,367 284 348 8,677
Howard 0 0 0 0 0 2,293 1,417 684 212 4,606
Independence 0 0 0 0 0 8,629 367 869 771 10,636Izard 0 0 0 0 0 3,457 14 36 144 3,651
Jackson 0 0 0 0 0 3,912 1,364 127 256 5,659
Jefferson 1 0 0 0 1 5,440 18,646 221 1,422 25,729
Johnson 0 0 0 0 0 6,280 168 1,233 376 8,057
Lafayette 0 0 0 0 0 953 1,538 25 165 2,681
Lawrence 0 0 0 0 0 5,546 37 39 241 5,863
Lee 0 0 0 0 0 952 2,863 35 225 4,075
MEDICAID ELIGIBLES
BY CATEGORY AND RACE
SFY 2010
U-18 Total
White Black HispanicOther or
Unknown TotalOther or
Unknown
ARKANSAS DHS STATISTICAL REPORT
DCO-30

White Black Hispanic TotalCounty
Lincoln 0 0 0 0 0 2,026 1,232 111 141 3,510
Little River 0 0 0 0 0 2,292 1,114 164 193 3,763
Logan 0 0 0 0 0 6,568 151 157 431 7,307
Lonoke 1 0 0 0 1 11,605 1,801 412 948 14,766
Madison 0 0 0 0 0 3,724 15 277 205 4,221
Marion 0 0 0 0 0 3,968 12 59 213 4,252
Miller 0 0 0 0 0 6,997 5,050 299 806 13,152
Mississippi 0 0 0 0 0 7,424 8,782 650 1,346 18,202
Monroe 0 0 0 0 0 1,199 1,849 33 159 3,240
Montgomery 0 0 0 0 0 2,373 9 163 93 2,638
Nevada 0 0 0 5 5 1,535 1,308 74 155 3,072
Newton 0 0 0 0 0 2,364 2 5 97 2,468
Ouachita 0 0 0 0 0 3,079 4,917 110 375 8,481
Perry 0 0 0 0 0 2,371 55 60 122 2,608
Phillips 0 0 0 0 0 2,072 8,289 83 573 11,017
Pike 0 0 0 0 0 2,625 107 287 120 3,139Poinsett 0 0 0 0 0 7,486 1,021 230 451 9,188
Polk 0 0 0 0 0 5,570 28 442 338 6,378
Pope 0 0 0 0 0 13,076 831 1,451 859 16,217
Prairie 0 0 0 0 0 1,775 581 33 116 2,505
Pulaski-East 0 0 0 0 0 3,413 6,459 421 812 11,105
Pulaski-Jax 0 0 0 0 0 9,026 6,576 875 1,261 17,738
Pulaski-North 0 0 0 0 0 6,555 14,328 1,278 2,075 24,236
Pulaski-South 0 0 0 0 0 3,270 16,278 1,043 1,980 22,571
Pulaski-SW 2 0 0 0 2 5,354 16,642 3,531 1,866 27,393
Randolph 0 0 1 1 2 5,347 71 80 196 5,694
Saline 0 0 0 0 0 14,710 1,348 858 605 17,521
Scott 0 0 0 0 0 3,118 18 318 287 3,741
Searcy 0 0 0 0 0 2,501 2 46 132 2,681
Sebastian 0 0 0 0 0 19,323 4,136 6,472 3,277 33,208
Sevier 0 0 0 0 0 2,756 276 2,310 257 5,599
Sharp 0 0 0 0 0 5,002 50 73 234 5,359St. Francis 0 0 0 0 0 2,685 7,228 109 520 10,542
Stone 0 0 0 0 0 3,440 12 79 149 3,680
Union 0 1 0 0 1 4,889 7,499 512 578 13,478
Van Buren 0 0 0 0 0 4,161 36 104 195 4,496
Washington 1 0 0 0 1 23,898 2,015 12,552 4,112 42,577
White 0 0 0 0 0 15,409 1,298 807 974 18,488
Woodruff 0 0 0 0 0 1,518 1,046 14 95 2,673
Yell 0 0 0 0 0 4,599 133 1,697 395 6,824
Source: Extract from ACES Database
State Total 11 1 0 5 17 461,327 215,551 65,589 49,014 791,478
TotalWhite Black HispanicOther or
Unknown
U-18 Total
Other or
Unknown
ARKANSAS DHS STATISTICAL REPORT
MEDICAID ELIGIBLES
BY CATEGORY AND RACE
SFY 2010
DCO-31

Source: Extract from ACES Data Base
2009 774,505
682,027
2007
794,3312008
736,537
760,167
766,151
2006
2010 791,478
2003 644,874
2004
2005
ARKANSAS DHS STATISTICAL REPORT
MEDICAID ELIGIBLES
SFY 2003 - 2010
Medicaid EligiblesState Fiscal Year
644,874
682,027736,537
760,167 766,151794,331 774,505 791,478
0
100,000
200,000
300,000
400,000
500,000
600,000
700,000
800,000
900,000
2003 2004 2005 2006 2007 2008 2009 2010
STATE FISCAL YEAR
MEDICAID ELIGIBLES
DCO-32

County
Arkansas 112 54 59 0 0 0 46 18 27 158 72 86
Ashley 189 70 119 0 0 0 29 9 19 218 79 138
Baxter 295 162 161 1 0 1 105 44 83 401 206 245
Benton 635 243 419 9 2 3 229 85 160 873 330 582
Boone 251 110 141 2 1 1 82 28 60 335 139 202
Bradley 92 40 44 0 0 0 50 18 38 142 58 82
Calhoun 24 14 12 0 0 0 4 0 4 28 14 16
Carroll 118 54 64 2 1 1 65 14 52 185 69 117
Chicot 129 54 79 0 0 0 59 23 47 188 77 126
Clark 160 73 87 1 1 0 33 16 18 194 90 105
Clay 118 33 75 0 0 0 41 6 35 159 39 110
Cleburne 206 58 146 1 1 0 60 24 38 267 83 184
Cleveland 47 24 22 0 0 0 15 5 12 62 29 34
Columbia 254 109 148 0 0 0 56 24 39 310 133 187
Conway 152 80 77 0 0 0 45 23 31 197 103 108
Craighead 375 187 210 5 3 3 159 74 100 539 264 313
Crawford 379 143 225 1 1 0 147 66 85 527 210 310
Crittenden 257 101 147 2 2 0 224 68 173 483 171 320
Cross 143 42 93 0 0 0 62 29 39 205 71 132
Dallas 69 39 34 0 1 0 63 41 25 132 81 59
Desha 111 50 60 1 0 1 51 16 40 163 66 101
Drew 141 53 92 0 0 0 43 9 37 184 62 129
Faulkner 322 173 150 0 0 0 118 63 58 440 236 208
Franklin 129 66 62 0 0 0 31 15 21 160 81 83
Fulton 157 80 81 0 0 0 52 25 30 209 105 111
Garland 511 211 280 4 2 2 160 47 108 675 260 390
Grant 135 47 72 0 0 0 32 16 22 167 63 94
Greene 148 88 64 0 0 0 53 22 33 201 110 97
Hempstead 145 58 75 1 1 0 50 25 27 196 84 102
Hot Spring 224 93 128 0 0 0 91 35 57 315 128 185
Howard 104 51 53 0 0 0 29 16 13 133 67 66
Independence 289 118 173 0 0 0 77 39 48 366 157 221
Izard 146 45 102 0 0 0 42 15 29 188 60 131
Jackson 122 67 63 0 0 0 38 18 30 160 85 93
Jefferson 634 258 366 0 0 0 265 87 200 899 345 566
Johnson 118 48 61 0 0 0 59 27 33 177 75 94
Lafayette 58 31 26 0 0 0 18 8 13 76 39 39
Lawrence 170 63 112 1 0 1 45 15 26 216 78 139
Lee 139 51 83 0 0 0 39 16 33 178 67 116
Ap-
provedDenied
De-
nied
Re-
ceived
Re-
ceived
Ap-
proved
ARKANSAS DHS STATISTICAL REPORT
APPLICATIONS FOR LONG-TERM CARESFY 2010
Aid to the Aged Aid to the Blind Aid to the Disabled Total
DeniedRe-
ceived
Ap-
provedDenied
Re-
ceived
Ap-
proved
DCO-33

County
Lincoln 87 43 37 0 0 0 41 21 21 128 64 58
Little River 81 43 38 0 0 0 18 9 10 99 52 48
Logan 233 76 154 1 0 1 77 28 51 311 104 206
Lonoke 335 159 198 2 0 2 144 63 93 481 222 293
Madison 91 36 51 0 0 0 19 7 14 110 43 65
Marion 134 46 93 0 0 0 53 14 44 187 60 137
Miller 238 115 134 0 0 0 116 69 57 354 184 191
Mississippi 221 112 118 0 0 1 87 46 52 308 158 171
Monroe 107 34 71 0 0 0 21 10 12 128 44 83
Montgomery 92 36 59 0 0 0 10 4 6 102 40 65
Nevada 58 26 31 0 0 0 38 26 13 96 52 44
Newton 66 34 31 0 0 0 13 8 6 79 42 37
Ouachita 285 98 182 0 0 0 66 21 42 351 119 224
Perry 70 35 31 0 0 0 20 6 12 90 41 43
Phillips 166 46 113 0 0 0 75 23 58 241 69 171
Pike 138 52 81 2 0 1 35 15 20 175 67 102
Poinsett 254 84 177 1 1 0 106 51 60 361 136 237
Polk 143 61 68 0 0 0 24 8 11 167 69 79
Pope 345 142 207 1 0 1 109 34 78 455 176 286
Prairie 87 38 40 0 0 0 22 13 12 109 51 52
Pulaski-East 186 74 123 3 0 3 65 26 50 254 100 176
Pulaski-Jax 81 35 44 0 0 0 43 15 33 124 50 77
Pulaski-North 794 380 412 1 1 1 318 138 206 1,113 519 619
Pulaski-South 187 76 120 0 0 0 103 39 88 290 115 208
Pulaski-SW 91 23 67 2 1 1 82 26 73 175 50 141
Randolph 211 75 126 0 0 0 31 7 23 242 82 149
Saline 345 163 169 2 0 0 154 82 85 501 245 254
Scott 84 32 54 0 0 0 25 7 21 109 39 75
Searcy 99 43 47 0 0 0 42 17 28 141 60 75
Sebastian 615 255 370 6 1 8 312 128 201 933 384 579
Sevier 140 57 77 0 0 0 39 15 24 179 72 101
Sharp 197 70 122 1 0 2 51 16 46 249 86 170
St Francis 193 81 104 1 0 1 51 15 40 245 96 145
Stone 95 43 51 0 0 0 26 13 16 121 56 67
Union 520 171 370 0 0 0 193 67 139 713 238 509
Van Buren 135 44 97 0 0 0 38 14 26 173 58 123
Washington 601 277 346 9 3 3 296 119 191 906 399 540
White 429 178 236 0 0 0 133 57 71 562 235 307
Woodruff 87 39 48 0 0 0 28 18 13 115 57 61
Yell 181 111 83 0 0 0 41 24 23 222 135 106
9,355
Re-
ceived
State Total 38 6,032 2,448 4,012 22,40563 23
Re-
ceived
Ap-
proved
De-
nied
Ap-
proved
Aid to the Aged Aid to the Blind Aid to the Disabled
Ap-
provedDenied
Note: Approved and denied may not equal received due to carry-over to next month.
Source: Report RS-4154
ARKANSAS DHHS STATISTICAL REPORT
APPLICATIONS FOR LONG-TERM CARESFY 2009
13,49516,310 6,884 9,445
DeniedRe-
ceived
Total
Re-
ceived
Ap-
provedDenied
DCO-34


Actual Average *
Number of Monthly
Recipient Number of Pounds Dollar
Agencies Participants of Food Value
Child Care 9 2,302 133,774 $104,902
National School Lunch 309 327,283 15,583,582 $11,813,723
Summer Food Services 38 11,222 22,616 $18,166
TEFAP (Needy Family) ** 15 29,346 5,840,948 $3,664,254
TEFAP - ARRA*** 21 0 831,416 $802,838
Food Banks**** 6 99,816 4,876,429 $3,426,217
Disaster 0 0 0 $0
Commodity Supplemental
Food Program3 2,817 234,798 $171,332
TOTAL 401 472,786 27,523,563 $20,001,432
*
**
***
****
USDA Food Groups By Weight Percent
By WeightBy Value
Percent
By Value
Meats/Alternatives 2,619,528 9.52% $3,745,779 18.73%
Poultry/Eggs 2,690,063 9.77% $3,425,191 17.12%
Fruits 6,206,686 22.55% $3,576,281 17.88%
Vegetables 7,355,502 26.72% $3,089,283 15.45%
Misc. 7,591,969 27.58% $5,474,766 27.37%
Processed 1,059,816 3.85% $690,132 3.45%
TOTAL 27,523,564 100.00% $20,001,432 100.00%
Source: Commodity Distribution Monthly Reports
ARKANSAS DHS STATISTICAL REPORT
COMMODITY DISTRIBUTION
PROGRAM SUMMARY
SFY 2010
BREAKDOWN BY U.S.D.A FOOD GROUPS
Food Bank totals for SFY 2010 include foods distributed to soup kitchens, food pantries and charitable institutions. USDA bonus commodities
include 2,288,936 of USDA foods purchased with $1,273,047 of entitlement funds and 2,587,493 lbs. valued at $2,153,169.
Funding provided by the American Recovery and Reinvestment Act of 2009 resulted in additional food distributions.
Programs
Averages were obtained by dividing the total participants that an agency served by the number of months that the agency participated in the
program.
Includes 2,528,647 lbs. of USDA foods purchased with $1,441,232 of entitlement funds and 3,312,300 lbs, valued at $2,223,021, as USDA bonus
commodities.
DCO-35

Employment
Education
Emergency Services
Housing
Income Maintenance
Welfare
Linkages
Nutrition
Health
Total**
* The number of persons served is duplicated within individual programs and across all programs.
**CSBG Grants funded by the American Recovery and Reinvestment Act (ARRA) of 2009.
Male Male
Female Female
Total Total
White Non-Hispanic White Non-Hispanic
Black Non-Hispanic Black Non-Hispanic
Hispanic Hispanic
Native American Native American
Asian Asian
Other Other
Total Total
Source: The Office of Community Services
5,815 2,751
ARKANSAS DHS STATISTICAL REPORT
THE COMMUNITY SERVICES BLOCK GRANT PROGRAM
FFY 2010 (October 1, 2009 - September 30, 2010)
Service Project
FFY 2010 ARRA-
CSBG Funds
Allocated **
Estimated
Number of
Persons
Assisted *
The purpose of the Community Services Block Grant (CSBG) Program is to provide a range of services and
activities having a measurable and potentially major impact on the causes of poverty through the 16 Community
Action Agencies (CAAs) serving located throughout Arkansas.
951,709
2,092,268
679,794
679,794
543,835
543,835
Unduplicated Demographics
73,039 13,002
25,270
$785,822
2,229
6,125
55,616
2,574
27,713
115,140
4,382
5,980
11,322
41,004
84,753
21,771
7,786
6,111
$5,302,390
1,903,422
1,495,546
893,980
1,471,065
958,176
524,810
449,134
1,552,928
Total of Direct FFY 2010 Service Projects by Category
FFY 2010 CSBG
Funds Allocated
Estimated Number of
Persons Assisted *
3,893
2,699
2,781
2,221
204,856 33,912
116,128 18,078
78,925 12,433
131,817 20,910
733,449
318,138$9,461,632
1,495,546
$13,595,871
FFY 2010 ARRA- CSBGFFY 2010 CSBG
2,731 379
204,856 33,912
770 192
487 79
DCO-36
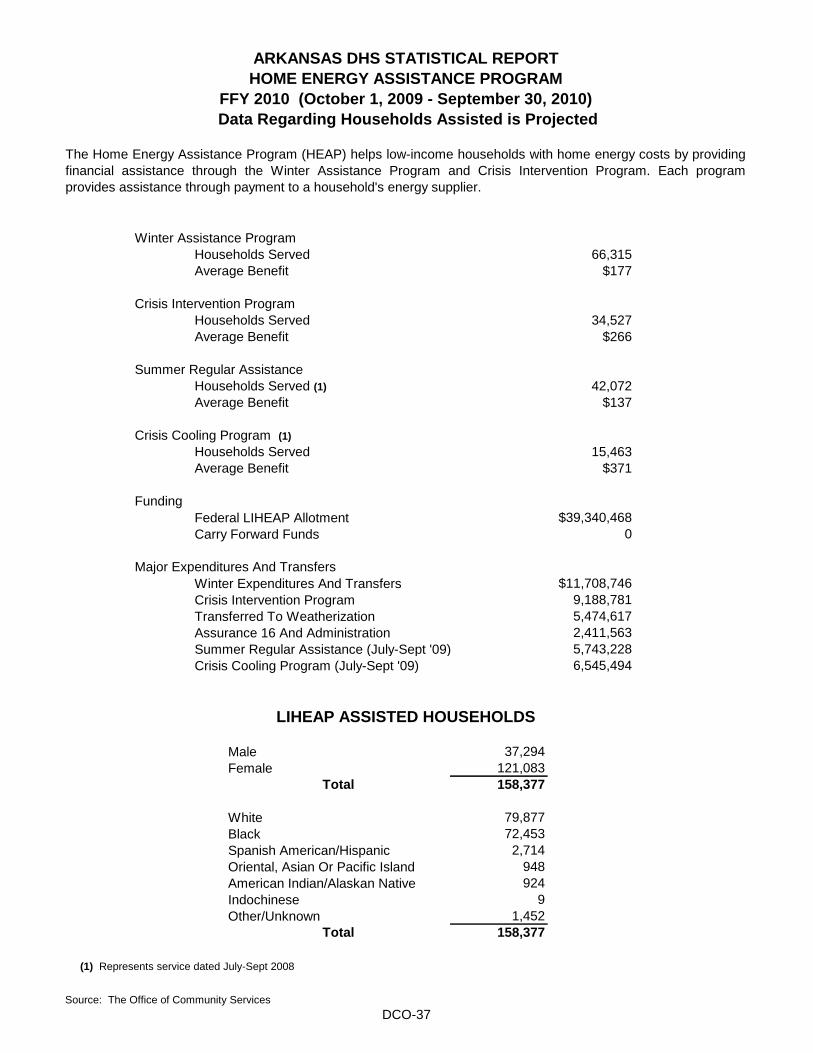
0
Summer Regular Assistance (July-Sept '09)
Crisis Cooling Program (July-Sept '09)
Oriental, Asian Or Pacific Island
(1) Represents service dated July-Sept 2008
ARKANSAS DHS STATISTICAL REPORT
HOME ENERGY ASSISTANCE PROGRAM
FFY 2010 (October 1, 2009 - September 30, 2010)
Summer Regular Assistance
Households Served (1) 42,072
Average Benefit $177
Crisis Intervention Program
Households Served 34,527
Average Benefit $266
Winter Assistance Program
Households Served 66,315
Data Regarding Households Assisted is Projected
The Home Energy Assistance Program (HEAP) helps low-income households with home energy costs by providing
financial assistance through the Winter Assistance Program and Crisis Intervention Program. Each program
provides assistance through payment to a household's energy supplier.
Households Served 15,463
Average Benefit $371
Funding
Federal LIHEAP Allotment $39,340,468
Average Benefit $137
Crisis Cooling Program (1)
Transferred To Weatherization 5,474,617
Assurance 16 And Administration 2,411,563
5,743,228
6,545,494
Carry Forward Funds
Major Expenditures And Transfers
Winter Expenditures And Transfers $11,708,746
Crisis Intervention Program 9,188,781
White 79,877
Black 72,453
Spanish American/Hispanic 2,714
LIHEAP ASSISTED HOUSEHOLDS
Male 37,294
Female 121,083
Total 158,377
Total 158,377
Source: The Office of Community Services
948
American Indian/Alaskan Native 924
Indochinese 9
Other/Unknown 1,452
DCO-37

DOE/LIHEAP*
Weatherized Units by Home Type Persons Assisted by Race/Ethnicity
Owner 566 White
Renter (Single) 71 Black
Renter (Multi) 0 Hispanic
Mobile Home (rent) 175 Native American
Mobile Home (own) 24 Asian
Other 1 Other
Total 837 Total
Weatherized Units by Priority GroupPersons Assisted by Priority Group
Elderly**-occupied 406 Elderly**
Disabled**-occupied 478 Disabled**
Native American-occupied75 Native Americans
Child - occupied 529 Children
Shelter 0
Total 1,488 Total
Weatherized Units by Home Type Persons Assisted by Race/Ethnicity
Owner White
Renter (Single) Black
Renter (Multi) Hispanic
Mobile Home (rent) Native American
Mobile Home (own) Asian
Total Other
Total
Weatherized Units by Priority Group Persons Assisted by Priority Group
Elderly**-occupied Elderly**
Disabled**-occupied Disabled**
Native American-occupied Native Americans
Child - occupied Children
Shelter
Total Total
65
2,051
70
4
1
7
1,815
406
11
WEATHERIZATION ASSISTANCE PROGRAM
FOR LOW-INCOME PERSONS
ARKANSAS DHS STATISTICAL REPORT
1,120
613
3,047
1,220
98
25
478
75
529
1,488 * LIHEAP contributes funds for all Regular DOE units so SFY totals are the same for both
programs.** Eligibility categories such as Elderly and Disabled represent a duplicate count of clients/units.
An estimated number of houses to be weatherized and people assisted for SFY 2010:
ARRA-Weatherization
1,439
212
0
335
4,173
** Eligibility categories such as Elderly and Disabled represent a duplicate count of clients/units.
15
4,416
1,252
1,541
25
1,355
25
744
0
3,051
1,009
1,273
DCO-38
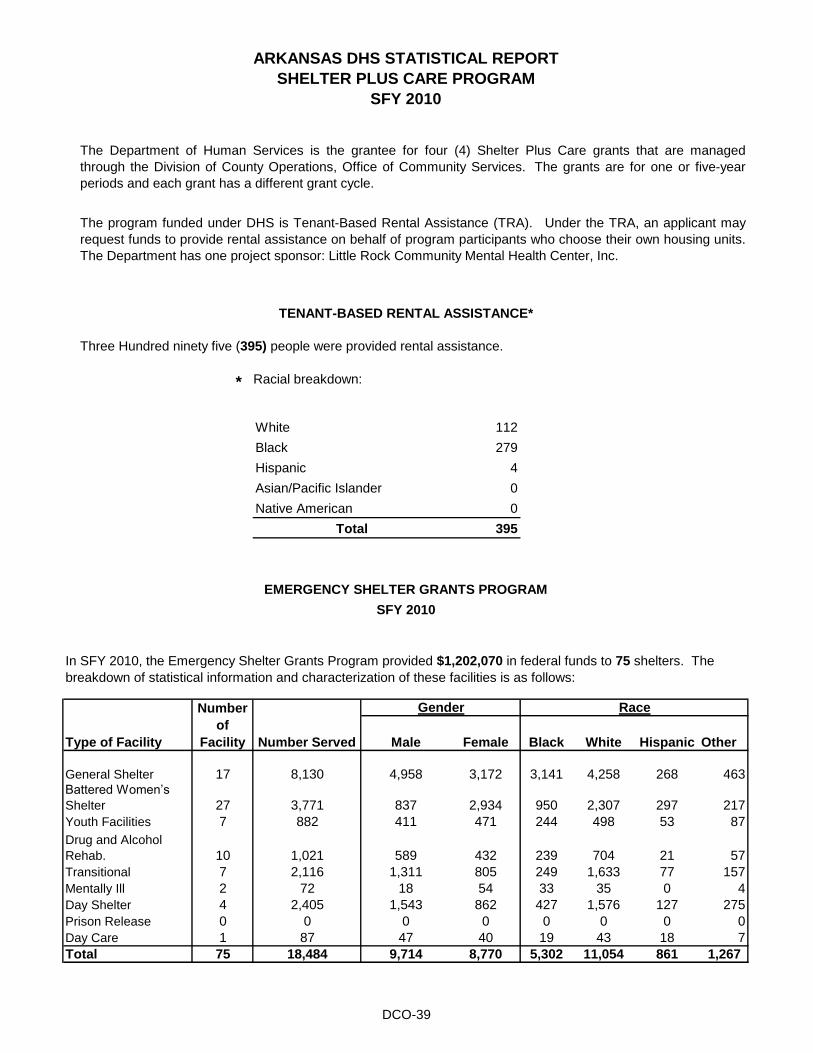
Three Hundred ninety five (395) people were provided rental assistance.
* Racial breakdown:
White
Black
Hispanic
Asian/Pacific Islander
Native American
Other
General Shelter 463
217
Youth Facilities 87
57
Transitional 157
Mentally Ill 4
Day Shelter 275
Prison Release 0
Day Care 7
1,267
ARKANSAS DHS STATISTICAL REPORT
SHELTER PLUS CARE PROGRAM
SFY 2010
The Department of Human Services is the grantee for four (4) Shelter Plus Care grants that are managed
through the Division of County Operations, Office of Community Services. The grants are for one or five-year
periods and each grant has a different grant cycle.
The program funded under DHS is Tenant-Based Rental Assistance (TRA). Under the TRA, an applicant may
request funds to provide rental assistance on behalf of program participants who choose their own housing units.
The Department has one project sponsor: Little Rock Community Mental Health Center, Inc.
TENANT-BASED RENTAL ASSISTANCE*
Number
of
Facility Number Served
Gender
112
279
4
0
0
Total 395
EMERGENCY SHELTER GRANTS PROGRAM
SFY 2010
In SFY 2010, the Emergency Shelter Grants Program provided $1,202,070 in federal funds to 75 shelters. The
breakdown of statistical information and characterization of these facilities is as follows:
27 3,771 837 2,934 950 2,307 297
17 8,130 4,958 3,172 3,141 4,258Battered Women’s
Shelter
Male Female Black White HispanicType of Facility
53
10 1,021 589 432 239 704 21
7 882 411 471 244 498
Drug and Alcohol
Rehab.
Race
268
77
2 72 18 54 33 35 0
7 2,116 1,311 805 249 1,633
127
0 0 0 0 0 0 0
4 2,405 1,543 862 427 1,576
18
Total 75 18,484 9,714 8,770 5,302 11,054 861
1 87 47 40 19 43
DCO-39

Client's Served Households Members Served
Male-Adult Male - Two Person
Female-Adult Male - Single
Male-Child 724 Male - Child
Female-Child 717 Female - Two Person
Unknown/Not Given/Transgender 64 Female - Single
Total Female - Child
Unknown/Not Given/Transgender
Race Total
White
Black 1,466 Ethnicity
Oriental, Asian Or Pacific Island 9 Hispanic/Latino
American Indian/Alaskan Native 17 Non-Hispanic/Non-Latino
Other/Unknown/Not Given 94 Unknown/Not Given 94
Total 3,074 Total
Service Type Total Served Total Cost Average Cost
Basic Needs
Homeless Motel Vouchers
Rent Payment Assistance
Rental Applications Fee
Rental Deposit Assistance
Housing Search Assistance
Moving Expense Assistance
Utility Bill Payment Assistance
Utility Deposit Assistance
Credit Counseling
Finance/Budget Counseling
Legal Services
Case Care Management
Drop In Centers
Outreach Programs
ARKANSAS DHS STATISTICAL REPORT
HOMELESS PREVENTION and RAPID REHOUSING PROGRAM
SFY 2010
The Homelessness prevention and Rapid Re-Housing Program (HPRP) provides homelessness prevention
assistance to households that would otherwise become homeless, and provides rapid re-housing assistance to
persons who are homeless.
723
826
218
3,073 714
68
Financial assistance includes a wide array of activities such as payment for back rent, security deposits, short and
medium term rental assistance, current and prior utility assistance and moving costs. The funds can also be used
to provide services that help families connect with housing, including landlord outreach, landlord-tenant mediation,
and housing based case management.
The grant is administered through 13 lead agencies selected by the Continuum of Care organizations throughout the
state. The Arkansas Department of Human Services is the Grantee for this program.
524 300
1,044 224
82 13,822.02$ 168.56$
3,073
1,487
125
2,854
3,073
8,731 1,652,845.53$ 189.31$
15 171.40$ 11.43$
7 650.00$ 92.86$
22 1,793.48$ 81.52$
3,359 221,249.76$ 62.89$
976 130,947.53$ 134.17$
514 52,085.87$ 101.33$
Source: The Office of Community Services
1 400.00$ 400.00$
18,700 2,149,980.47$ 114.44$
3,867 793.00$ 0.21$
1 -$ -$
174 25,950.00$ 149.14$
2 345.00$ 172.50$
840 48,926.88$ 58.25$
109 -$ -$
DCO-40


Source: DDS Website
ARKANSAS DHS STATISTICAL REPORT
DIVISION OF DEVELOPMENTAL DISABILITIES SERVICES
INTRODUCTION
SFY 2010
To accomplish its mission, DDS, the DDS Board, and its providers are committed to the principles and practices
of normalization; least restrictive alternatives; affirmation of individuals' constitutional rights; provision of quality
services; the interdisciplinary service delivery model; and the positive management of challenging behaviors.
Background, Services and Mission
DDS also provides an extensive range of services to individuals in community settings. These services are
provided through private, not-for-profit programs whose service areas include all 75 counties of the state. There
are 92 DDS Licensed Providers, 77 Medicaid Waiver Providers, and 78 Early Intervention Voucher
Providers. Additionally, DDS offers wrap-around services, individual/family supports and adaptive equipment.
In 1971, the Governor designated Mental Retardation/Developmental Disabilities Services to administer the
provisions of the Developmental Disabilities Services (DDS) and the Facilities Construction Act, or Public Law 91-
517, (as amended). This legislation expanded the responsibility of the agency to serve individuals with cerebral
palsy, epilepsy, and autism.
In 1981, Act 513 was passed and changed the name and official title of the agency and Board to the Division and
the Board of Developmental Disabilities Services. Under this Act, the Arkansas Children's Colonies became the
Human Development Centers (HDCs). There are six HDCs across the state; the first opened in 1959 at Conway,
and the last opened in 1978 in Warren. The HDCs are located in Conway, Alexander, Arkadelphia, Jonesboro,
Booneville, and Warren. These programs provide services to 1,063 individuals (as of 06/30/10) with
developmental disabilities who are in need of 24-hour residential, medical, and habilitative services.
In 1955, the Arkansas General Assembly created the Arkansas Children's Colony with the passage of Act 6.
This act has been revised and extended by numerous statutes, the latest being Act 1165 of 1975. Act 265 of
1969 created the Arkansas Department of Mental Retardation. It also expanded the authority of the Children's
Colony Board to include certain responsibilities for the individuals who, because of other disabilities, show
characteristics of mental retardation.
In 1971, Act 38 transferred the Arkansas Department of Mental Retardation and its functions, powers, and duties
to the Department of Social and Rehabilitative Services, which is now the Department of Human Services (DHS).
Act 348 of 1985 authorized the reorganization of the Department of Human Services, and under this change DDS
became one of 13 divisions/offices comprising an integrated services system. This Act designated control and
administration of the HDCs under the management and direction of the DDS Board with daily operation authority
extended to the DDS Director, in coordination with the Director of DHS.
DDS-1
ARKANSAS DHS STATISTICAL REPORT
GOALS AND SERVICES
SFY 2010
DDS, the DDS Board, and its providers are dedicated to the pursuit of the following goals:
Advocating for adequate funding, staffing, and services to address the needs of persons with developmental
disabilities;
Title V Children with Special Health Care Needs:
Below are brief descriptions of our service areas:
Children’s Services
This is the entry point for children ages birth to 21 and their families seeking services from DDS. Service
specialists are located in county offices across the state. They conduct intake interviews, perform eligibility
determinations, and make referrals for services based on individual needs. They also complete intake and
referral for children/families seeking Home and Community Based Waiver services.
The Children’s Services Section provides developmental disability services to children birth to five years of
age. By networking with local community providers, DDS ensures that services comply with Parts B and C
of the Individuals with Disabilities Education Act (IDEA).
Title V provides specialized medical care and rehabilitation for chronically ill and physically disabled children
whose families are partially or wholly unable to provide for such services and who meet the program’s
criteria. Title V staff determines financial and medical eligibility. A chronically ill/disabled child is defined as
a child under 18 years of age (under age 21 if funding allows) who has a disabling physical impairment
(either congenital or acquired) or who has other conditions known to produce such physical impairments.
Services are provided in a community setting by nurses, social workers, service specialists, and support
staff.
Title V provides medical and surgical treatment, therapies, appliances, medications, and care coordination.
All medical specialty services for children must be prior approved by Title V service teams.
Early Intervention/First Connections and Early Childhood Services:
Any person or organization may refer a child to Title V for diagnosis and recommendations for treatment.
Steps are then taken to secure an application for assistance through the DHS county office, designated
hospitals or DDS Children’s Services community based staff. A case record is then opened and a plan of
care for treatment is made and coordinated by the Title V staff.
Encouraging an interdisciplinary service system to be utilized in the delivery of appropriate individualized and
quality services;
Encouraging family, parent/guardian, individual, and public/community involvement in program development,
delivery, and evaluation;
Engaging in statewide planning that ensures optimal and innovative growth of the Arkansas service system to
meet the needs of persons with developmental disabilities and to assist such persons to achieve independence,
productivity, and integration into the community.
Protecting the constitutional rights of individuals with disabilities and their rights to personal dignity, respect and
freedom from harm;
Assuring that individuals with developmental disabilities who receive services from DDS are provided
uninterrupted essential services until such time a person no longer needs to depend on these services;
DDS-2

Source: Division of Developmental Disabilities Services
SFY 2010
Home and Community Based (Waiver) Services
Quality Assurance
This section is the regulatory body for the licensure and certification of all DDS Providers - licensure of Center-
based Services and certification of Waiver Providers, Early Intervention providers, and Targeted Case
Managers who serve individuals with developmental disabilities. The Quality Assurance section also conducts
monitoring activities for all three DDS services: Developmental Day Treatment Clinic Services (DDTCS), ACS
Waiver, and Early Intervention. The unit also conducts interviews with persons served by the ACS Waiver, using
the National Core Indicators (NCI) survey tool, to determine satisfaction with their services. The DDS Adult Intake
and Referral unit in QA is responsible for intake and referral for all adults seeking DDS services and assists
individuals and families with respite and other service needs. The QA Medicaid Income Eligibility Unit reviews
thousands of files for financial eligibility each year. Additional quality assurance activities include psychological
services, Foster Grandparent program, Ombudsman program, investigation of service concerns, incident
reporting, and technical assistance for provider organizations.
This section administers the Alternative Community Services (ACS) program under the 1915(c) Medicaid Waiver,
analyzes and develops policy, researches and develops remediations, and oversees a Waiver quality
management system as required by the Centers for Medicare and Medicaid Services. Administration of this
program includes approval of a Person-Centered Plan, oversight, case review, and prior service authorization.
People of any age may make application for services under this program. Service specialists who assist
individuals, families, and providers are located in various county offices across the state.
Residential Services
Six state-operated residential facilities, known as Human Development Centers, are located across the state.
Fiscal Management
This section administers contracts, personnel, finance, and various aspects of provider and staff development.
Compliance
This section addresses compliance with state and federal regulations for the division.
ARKANSAS DHS STATISTICAL REPORT
GOALS AND SERVICES
DDS-3


●
●
●
●
●
●
On-going service coordination was provided statewide to 2,983 children ages three (3) to enter Kindergarten
by the DDS Licensed DDTCS Providers.
Services to Infants and Toddlers (Ages: Birth to Three):
The Part C First Connections Program provided Early Intervention Services to 2,720 children.
Therapeutic Services were provided statewide to 2,983 children age three (3) to enter Kindergarten through
DDS licensed community programs.
Services to School Aged Children:
Five hundred and eighty three (583) hours of training was provided to professional/paraprofessional
staff and providers in DDS licensed community and voucher programs. Thirteen (13) hours of training
was also provided to Head Start/Early Head Start administration and staff, and to college graduate students
Special Education in the Human Development Centers was provided to 54 individuals by eight (8)
Special Education Teacher units authorized by the Department of Education.
Training:
Special Education Services were made available to 54 individuals aged 6 to 21 in the Human
Development Centers. These services are provided at the Conway site.
Services to Children (Ages: Three to Five):
ARKANSAS DHS STATISTICAL REPORT
CHILDREN'S SERVICES SECTION
SFY 2010
Northwest
Field Services (ages birth to 21):
Counties Covered
Benton, Boone, Carroll, Crawford, Franklin, Johnson, Logan, Madison, Montgomery,
Newton, Polk, Scott, Sebastian, Washington, and Yell
Regions
North Central
NortheastClay, Craighead, Crittenden, Cross, Greene, Jackson, Lawrence, Lee, Mississippi,
Monroe, Phillips, Poinsett, Prairie, Randolph, St. Francis, and Woodruff
Baxter, Cleburne, Conway, Faulkner, Fulton, Independence, Izard, Marion, Pope, Searcy,
Sharp, Stone, Van Buren, and White
Arkansas, Ashley, Bradley, Calhoun, Chicot, Cleveland, Desha, Drew, Lincoln, Jefferson,
and UnionSoutheast
Central Grant, Lonoke, Perry, Pulaski, and Saline
SouthwestClark, Columbia, Dallas, Garland, Hempstead, Hot Spring, Howard, Lafayette, Little
River, Miller, Nevada, Ouachita, Pike, and Sevier
DDS-4

●
Vision 19
●
American Indian or Alaska Native Birth to One Year
Asian or Pacific Islander One to Two Years
Black or African American Two to Three Years
Hispanic or Latino
White
Through the Title V CSHCN program 1,701 individuals received case management/service coordination
support.
The Special Needs Autism program was a one-time program available for individuals diagnosed with an
Autistic Spectrum Disorder during SFY 10. Funds were available for assistance in purchasing goods and
services required due to the diagnosis of Autism for which there was no other source of funding. 340
applications were approved for a total of $1,291,522.00.
138
1,114
247
1,599
Total 2,720 Total 2,720
The Title V CSHCN program served 965 individuals at an average cost of $2,203.00 This number includes
individuals for whom Title V CSHCN was the sole payer of services, those with private insurance coverage
and those with Medicaid for whom a service was prescribed which Medicaid does not cover.
One thousand eight hundred forty- five (1,845) individuals applied for assistance from the Title V CSHCN
program. Three hundred fifty-four (354) applications were funded through June 30, 2010 for the Title V
Family Support and Respite program at a cost of $320,090.00. The program ran from October 1, 2008
through September 30, 2010; however, effective January 1, 2010 the program is operating on a calendar
year basis.
The Title V Program provided the following services to individuals in Arkansas.
TITLE V CHILDREN WITH SPECIAL HEALTH CARE NEEDS (CSHCN) PROGRAM
26 982
Infants and Toddlers Receiving Early Intervention Services:
By AgeBy Race
2
HR (DayHab)
955 1,491
Speech/Language Therapy 732
Special Instruction 483
Transportation 490
Respite Care 2
Psychological 4
Social Work 2
Physical Therapy 483
Assistive Technology 1
1
Service Coordination 1,579
First Connections Early Intervention-Part C Services provided during the year:
Audiology 62
Occupational Therapy
Health Services
11
488
Medical Services (Diagnostic/Evaluation) 1
Nursing Services 62
Nutrition Services
Number of Children*Service
ARKANSAS DHS STATISTICAL REPORT
CHILDREN'S SERVICES SECTION
SFY 2010
Services to Infants and Toddlers (Ages: Birth to Three): (continued)
DDS-5
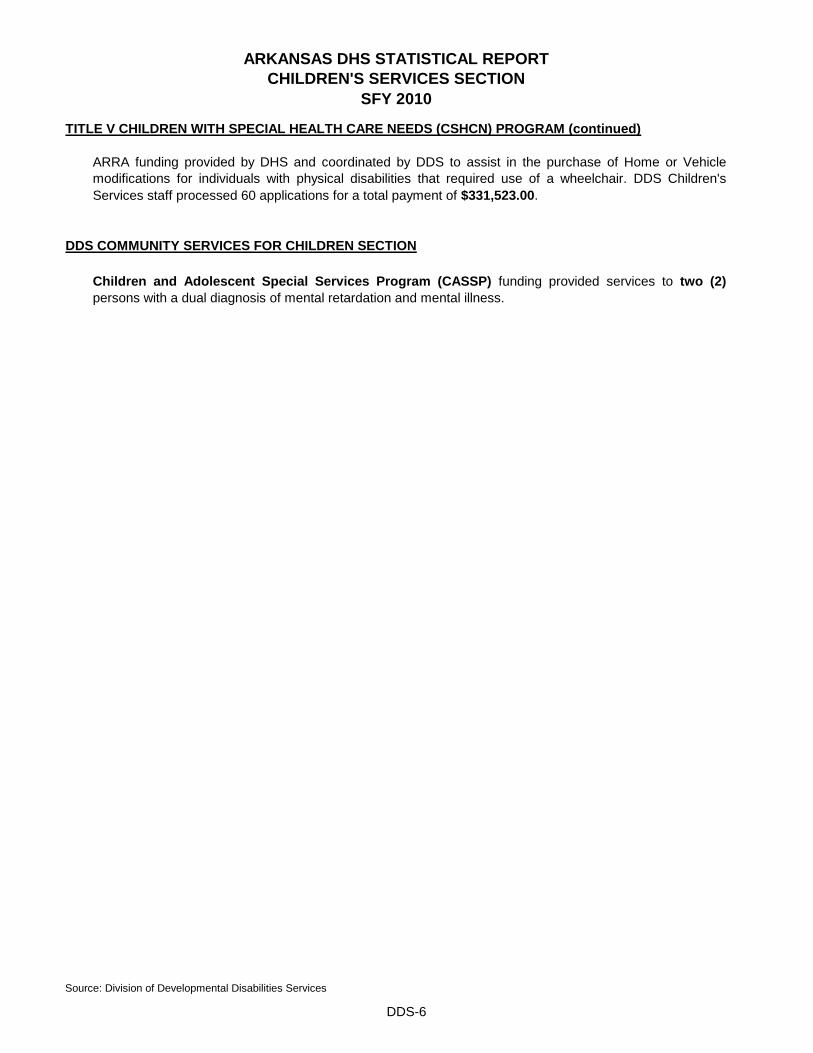
DDS COMMUNITY SERVICES FOR CHILDREN SECTION
Source: Division of Developmental Disabilities Services
ARRA funding provided by DHS and coordinated by DDS to assist in the purchase of Home or Vehicle
modifications for individuals with physical disabilities that required use of a wheelchair. DDS Children's
Services staff processed 60 applications for a total payment of $331,523.00.
SFY 2010
TITLE V CHILDREN WITH SPECIAL HEALTH CARE NEEDS (CSHCN) PROGRAM (continued)
Children and Adolescent Special Services Program (CASSP) funding provided services to two (2)
persons with a dual diagnosis of mental retardation and mental illness.
ARKANSAS DHS STATISTICAL REPORT
CHILDREN'S SERVICES SECTION
DDS-6

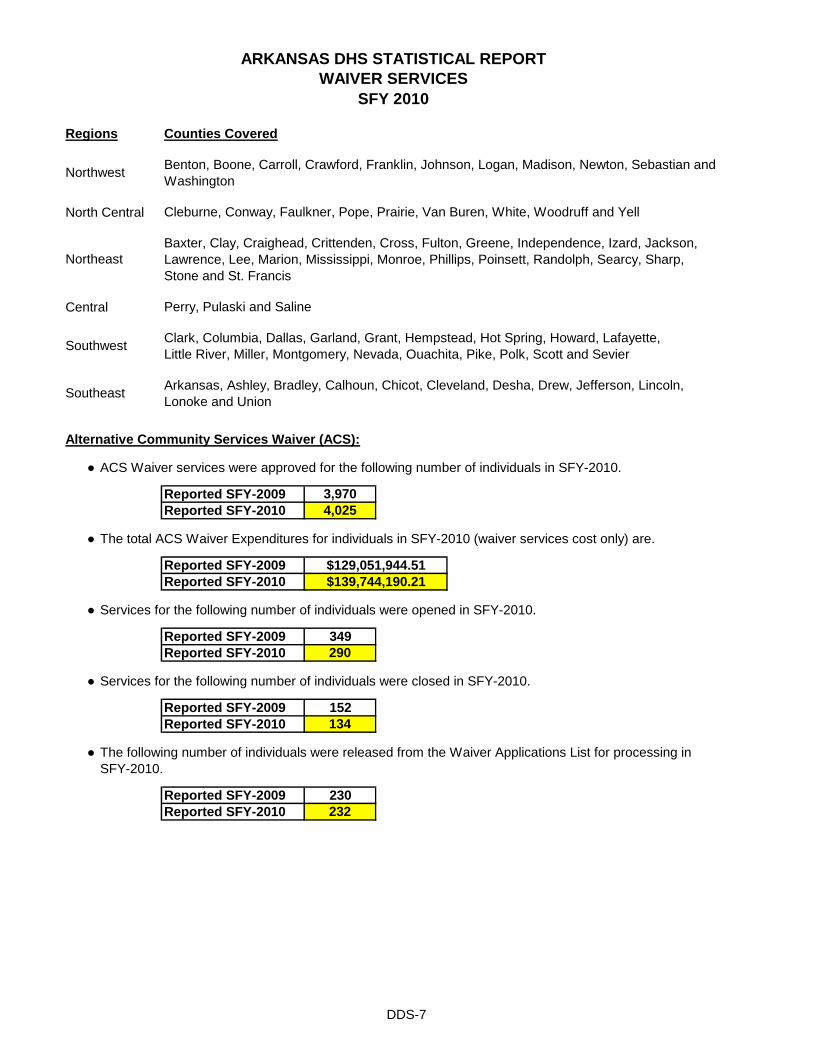
Counties Covered
●
Reported SFY-2009 3,970
Reported SFY-2010 4,025
●
Reported SFY-2009
Reported SFY-2010
●
Reported SFY-2009 349
Reported SFY-2010 290
●
Reported SFY-2009 152
Reported SFY-2010 134
●
Reported SFY-2009 230
Reported SFY-2010 232 100.87%
Services for the following number of individuals were opened in SFY-2010.
Services for the following number of individuals were closed in SFY-2010.
The following number of individuals were released from the Waiver Applications List for processing in
SFY-2010.
ARKANSAS DHS STATISTICAL REPORT
Southwest
WAIVER SERVICES
SFY 2010
Benton, Boone, Carroll, Crawford, Franklin, Johnson, Logan, Madison, Newton, Sebastian and
Washington
Cleburne, Conway, Faulkner, Pope, Prairie, Van Buren, White, Woodruff and YellNorth Central
Regions
Northwest
$139,744,190.21
ACS Waiver services were approved for the following number of individuals in SFY-2010.
Southeast
Northeast
Central
Baxter, Clay, Craighead, Crittenden, Cross, Fulton, Greene, Independence, Izard, Jackson,
Lawrence, Lee, Marion, Mississippi, Monroe, Phillips, Poinsett, Randolph, Searcy, Sharp,
Stone and St. Francis
Arkansas, Ashley, Bradley, Calhoun, Chicot, Cleveland, Desha, Drew, Jefferson, Lincoln,
Lonoke and Union
The total ACS Waiver Expenditures for individuals in SFY-2010 (waiver services cost only) are.
$129,051,944.51
Perry, Pulaski and Saline
Clark, Columbia, Dallas, Garland, Grant, Hempstead, Hot Spring, Howard, Lafayette,
Little River, Miller, Montgomery, Nevada, Ouachita, Pike, Polk, Scott and Sevier
Alternative Community Services Waiver (ACS):
DDS-7

Reported
SFY-2009
Reported
SFY-2010753 734
28 32
3,101 3,133
27 34
13 15
35 62
2 2
9 9
2 4
3,970 4,025
GENDERReported
SFY-2009
Reported
SFY-2010Female 1,673 1,697
Male 2,297 2,328
Total 3,970 4,025
Reported
SFY-2009
Reported
SFY-20102,285 2,445
736 728
24 26
366 356
106 100
3 0
23 26
2 2
153 143
22 56
29 30
221 113
3,970 4,025
Reported
SFY-2009
Reported
SFY-2010749 709
3,221 3,316
3,970 4,025
ID** CP*** Epilepsy Autism Other
Reported SFY-2009 3,104 693 290 319 460
3,156 721 322 370 537
*** Cerebral Palsy
Reported SFY-2010
The number of individuals by disability includes persons with multiple disabilities, thus the number would
exceed the SFY Unduplicated Totals.
** Intellectually Disabled
* The Alternative Community Services (ACS) Choice form (#102) that applicants for DDS service sign when they are seeking residential
services.
PRIORITY
102 Choice List*
Total
Nursing Home
Intermediate Care Facility for the Intellectually Disabled
Foster Care (DCFS Custody)
911 Act
DISABILITY
Arkansasa State Hospital
Child and Adolescent Service System Program
Integrated Supports
DDS Director
Total
AGE
Age: Birth to 17
Unknown
Human Development Center
Age: 18 and Up
Hispanic
Supportive Living Services
Total
ARKANSAS DHS STATISTICAL REPORT
WAIVER SERVICES
SFY 2010
Native American
Other
Philippino
Alternative Community Services Waiver (ACS): (Continued)
RACE
African American
Asian American
Caucasian
Polynesian
Unknown
DDS-8


Certification/Licensure Unit
Licensure Unit
Certification Unit
Central Office and field staff perform various activities to initially certify, recertify, and monitor services.
Home and Community Based Services Waiver Components
Consultation 36
Crisis Intervention 2
Adaptive Equipment 40
Supportive Living 61
Supported Employment 34
Case Management 61
Community Experiences 25
Non-medical Transportation 31
Supplemental Support 29
Environmental Modifications 31
Specialized Medical Supplies 29
Community Living 0
Respite 34
Emerency Response System 6
Community Transition 11
Certified 58 Independent Early Intervention Providers.
Forty-five (45) Early Intervention monitoring visits were conducted.
Twenty-eight (28) Technical Assistance visits were conducted.
Reviewed 20% of Early Intervention case files.
Investigation Unit
Investigated 149 service concerns.
Reviewed and performed follow-up as needed on 2,898 incident reports.
Completed reviews of 49 deaths of individuals served by community providers.
Reviewed 10% Of ACS Home and Community Based Waiver files.
Seven Certification staff (managers and licensing specialist) conducted monitoring visits for the Early Intervention
services provided in the DDS Licensed Community Programs.
Three hundred eighty-one (381) satisfaction surveys were conducted with Home and Community Based Waiver
services recipients.
DDS investigation unit reviews all incident reports submitted by community providers; Conducts follow-up as
needed; Completes an internal review of all deaths of waiver recipients; Recommends for external review by the
Community Provider Mortality Review Committee; And prepares packets for review and acts as facilitator. The
unit also reviews all service concerns submitted through phone interviews and on site visits, conducts training on
incident reporting and assists with technical issues with reporting system.
ARKANSAS DHS STATISTICAL REPORT
QUALITY ASSURANCE
SFY 2010
Four sections operate within the Quality Assurance Section - Certification/Licensure, Intake and Referral, Outreach,
and Psychology. Additional duties of the section are statistical reporting, administrator training, respite requests,
policy development, mortality review, and various quality improvement activities.
Five Service and Program Licensing Specialists conducted 77 annual license review visits, one to each licensed
program.
DDS-9

Adult Services Intake and Referral Unit/Medicaid Income Eligibility Unit
Of the 473 applications taken:
Of the 3,706 other cases processed:
3317 were re-approved without additional changes.
1,151 Waiver applications processed:
222 waiver applications were completed and sent to Waiver Application Unit;
596 waiver applications were pended primarily due to incomplete applications;
333 Waiver applications were placed in inactive status.
478 non-waiver referrals/applications were processed:
268 requests for DDS eligibility determination;73 approved25 denied
170 pending
2 Integrated Supports Contracts;
77 Emergency Respite Requests;
49 Special Needs funding requests;
24 approved
25 pending
82 HDC Referrals;
31 completed
51 pendeing
Outreach Unit
DDS Foster Grandparent Program
Foster Grandparent Services were provided by 92 income-eligible senior volunteers.
Foster Grandparent Demographics
Total
4470 - 79
80 - 84
85 plus
79
92
Female
Total
Three program eligibility specialists processed a total of 473 initial Medicaid Waiver applications and 3,706 other
cases (re-evaluations, closures and changes).
307 were approved;
38 were pending as of 06/30/2010.
138 were closed (due to death, moved from the state, re-evaluations not returned within timeframes, etc);
338 initial applications were determined eligible;
128 were denied (over timeframes, over resources, over income, failed to return needed information, etc.);
17 closures were reinstated;
234 were processed for changes (name, provider, address, etc);
Six intake specialists processed a total of 1,552 referrals for DDS waiver and non-waiver services:
26
Foster Grandparent Volunteers provided 131,070 hours of service to children and adults with disabilites in
Arkansas in SFY 2010.
Age
Gender
Male 13
8
92
60 - 69 14
ARKANSAS DHS STATISTICAL REPORT
QUALITY ASSURANCE
SFY 2010
DDS-10

Foster Grandparent volunteers provided services to 1,274 persons.
Category
Literacy
Mental Retardation
Physical Disabilities
Substance Abuse
Teen Pregnancy
Developmental Disabilities
School Readiness
Faith Based Programs
Mentoring
Total
DDS Ombudsman Program
Service ConcernsTotal Service Concern FY 2010 45
Program component
Waiver 32
Transition/DCFS 4
Other (education, mental health, DDS) 9
Home/On-site Reviews 14
Technical Assistance
Mortality Review 13
National Core Indicators Surveys 62
Information/Resource
Parent Support Group Presentation
Arch Ford Education Cooperative/Faulkner County Transition Team
Total 92
American Indian 2
Foster Grandparent Demographics (Continued)
Race
White, non-Hispanic 42
Hispanic
47
18
2
0
77
1
7
33
2
92
13
357
20
102
1,274
Grand Fosterparents
614 21
African Americam
84 14
1
Age
Birth - 5 614
6 - 12 360
21 plus 102
Total 1,274
ARKANSAS DHS STATISTICAL REPORT
QUALITY ASSURANCE
SFY 2010
1
0
13 - 20 198
A new program initiated in January 2009 within the Division of Developmental Disabilites, the DDS Ombudsman
program supports the Division's commitment to excellence in customer service. The mission of the DDS
Ombudsman is to assure that individuals receiving services through DDS have the right to live their lives with
dignity, in full consideration of their rights, and with the freedom to voice complaints or concerns without reprisal.
Foster Grandparent Volunteers seved children in each of the following need categories. The number of volunteers
dedicated to the identified category is reflected below:
Children
DDS-11

Psychological Services
One psychologist and two psychological examiners review and determine eligibility for DDS services.
DETERMINATIONS
Appeals 3
Eligibility 10
Human Development centers 92
Initial Determinations 1,630
Other 19
Pervasive level reviews 190
Redeterminations 1,133
Grand Total 3,077
Pending 1,221
Approved 1,774
Denied 82
ARKANSAS DHS STATISTICAL REPORT
QUALITY ASSURANCE
SFY 2010
DDS-12

Source: Division of Developmental Disabilities Services
15 minutes
Work Activity
N/A 501,257 $ 6,379,130.58
1,019
Community Services Programs
$ 242,152.04
15 minutesDevelopmental Therapy 690 50,308 $ 903,947.36
Evaluation
Year
Day
Day
Evaluation Services 31 30 $ 3,240.00
486Family/Individual Support
Adaptive Equipment 463 1,029
COMMUNITY PROGRAM STATISTICS
SFY 2010
Program
Number of
Individuals
Number of
Units Paid Amount
Unit
Description
Community Integration Companion
Adult Development
Day
76,790 $ 735,673.94
Consultation Services 157
Crisis Center/Intervention Services 0 0
0 0 $ -
Hour410
$ 212,619.83
Piece of
equipment
N/A
225,556
Hour
Hour
$ 1,261,068.32 Hour
751 $ 36,048.00
57 2,389
2,783 $ 338,457.91
4,503
0 0 $ -
33 4,031Integrated Support Group Rate
$ 444,968.67
$ -
15 minutes
Integrated Support Individual 19
30 minutes
Early Intervention 81 2,484
Occupational Therapy-Group
$ 166,924.80 Two Hours
Developmental Evaluation 690 1,370 $ 69,070.11
30 minutes
Occupational Therapy-Individual 248 12,134 $ 250,578.07
Occupational Therapy-Evaluation 206 434 $ 19,331.77
15 minutes
15 minutes
Physical Therapy-Individual 235 13,701 $ 273,225.15 15 minutes
Personal Care 0 0 $ -
25,546 $ 390,106.40
15 minutes
Physical Therapy-Evaluation 203 430 $ 18,502.76 15 minutes
Physical Therapy Assistant-Individual 39 2,189 $ 37,993.52
ARKANSAS DHS STATISTICAL REPORT
The following is a list of services provided by DDS licensed/certified providers during SFY 2010.
15 minutes
0 0 $ -
Hour
Speech-Evaluation
15 minutesTargeted Case Management 0
15 minutes
Speech Therapy-Individual 600 47,601 $ 896,727.34 15 minutes
Speech Therapy-Group
348 769 $ 34,116.99 30 minutes
Preschool 206
$ 8,361.50
221 $ 3,845.40
5,840 $ 1,635.20
0 $ -
Note: Figures are just for DDS Services purchased with Contract Dollars.
Total
Speech Therapy Assistant-Individual 5
Vocational Maintenance-Supported Employment
Mile
Transportation Non Profit -DDTCS 41 20,368 $ 30,535.50 Mile
Transportation-Individual 4
DDS-13

●
●
*
**
Total
Total
Non-Ambulatory
218Vision Impairment/Blind
Seizures
Challenging Behaviors
1,063
Total
*Secondary Conditions
Primary Diagnosis
100%
999
Percent is the total divided by 1,063.
Work Status
283
127
Percent**
Autism
ARKANSAS DHS STATISTICAL REPORT
HUMAN DEVELOPMENT STATISTICS
SFY 2010
The six (6) state-operated Human Development Centers provided a total of 393,645 client days, a decrease of
1,238 days, from SFY 2009.
76
7
Black Male
Total
Adaptive Level of Function
679
103
Hispanic
Total
63.88%
19.00%9.69%
Percent
As of June 30, 2010, services were being provided to 1,063 individuals, a decrease of 22 from SFY 2009.
Characteristics
Total
449
Race
808
Total Gender
1,063
Moderate
246
Other
7.15%
614
Profound
Total
1,063
1,063
Mild
202Severe
2
On HDC Grounds
137
367Fragile Health
Borderline 3 0.28%
Intellectual Disabilities/Mental Retardation
FemaleWhite
A client can have more than one disability.
Total
45%
2%In the Community 22
47%
21
19
Total
Autism
Cerebral Palsy
Epilepsy
Dual Diagnosis (Mental Illness/Retardation)
Cerebral Palsy
301
785
434
417
24
Hearing Impairment/Deaf
475
Total
497
DDS-14

**
**
Persons Transitioned to Home and Community Based (Waiver) Services 31
Total Days Provided Respite Services 3,025
Source: Division of Developmental Disabilities Services
Augmentative Communication 146 14%
Percent is the total divided by 1,063.
Hearing Aids 29 3%
Modified Diet 825 78%
Body Alignment Total
Wheelchairs (Supports) 218
Other (Braces, Ankle Foot Orthosis) 89
Total 307
Total Percent
HDC CONTINUUM OF SERVICES
SFY 2010
Characteristics (Continued)
ARKANSAS DHS STATISTICAL REPORT
DDS-15

●
●
●
●
●
●
●
●
●
●
●
Individuals Served Through Various Departments at HDCs
Miscellaneous Outreach Activities
Participated in Relay for Life, Race for the Cure, Special Olympics, Auism Awareness, Red Cross Blood Drive,
Chamber of Commerce events, and various County events.
Participated in Disaster Planning.
Hosted several state-wide conferences and trainings for HDC staff and community providers.
Participated in Employee Appreciation Day, hosted DDS Board Meeting, and participated in the KTHV Summer
Cereal Drive.
Provided Investigative Training, CPI Training, CPR/First Aide, and other trainings to outside agencies.
Provided internship for one psychology student.
Provided consultation for one Waiver provider.
Participated in Waiver training with Forrest City Intake Office, Jonesboro Services Center Waiver Office,
Licensure Office, Conway HDC and State Hospital with Transition Coordinator and the Little Rock Waiver
Application Office.
Conducted 65 consultations.
Tours
Seating Clinics
Respite
Dental
22
69
Conducted 46 parent/guardian conferences.
Made 609 contacts with individuals and the community.
Performed 51 psychological evaluations.
ARKANSAS DHS STATISTICAL REPORT
OUTREACH ACTIVITIES
Provided outreach services to 168 people.
SFY 2010
74
80
Conducted 0 therapy sessions.
Conducted 0 counseling sessions.
Made 129 home visits.
22Behavior Management Training
Transportation
147
Attended and/or presented 468 trainings, meetings, workshops, support groups, community, presentations,
etc.
Performed 32 initial intakes.
Hosted 13 support group meetings.
DDS-16

Source: Division of Developmental Disabilities Services
Miscellaneous Outreach Activities (Continued)
ARKANSAS DHS STATISTICAL REPORT
OUTREACH ACTIVITIES
Conducted annual Spook House and recreational activities at local VFW's, sporting events, plant and rummage
sales, fishing tournament and movie, Spring Fest, Fall Fest, Super Bowl Party, and participated in Christmas
Parades.
Participated in Foster Grandparent program.
SFY 2010
Opened a store which markets items made by people with developmental disabilities, from around the state.
Sold spring floral baskets to the community.
Participated in local Chamber of Commerce; Industrial Development Councils; Rotary Club; Kiwanis Club; United
Way, and various other civic organizations. Attended Community Provider Fairs.
Participated in health fairs, sporting events, including Special Olympics, holiday parties, family day, held
Volunteer Council Meetings, Resident Council Meetings, entered a float in the Christmas Parade, went on Easter
Egg Hunt, and participated in bowling tournaments.
Worked with Community Provider and began construction on a transitional home to be built on HDC site.
Served as training site for student nurses and psychology intern.
DDS-17

2010 2010
a.
b.
c.
d.
e.
f.
g.
h. &i.
j.
2008 k.
l.
2010 m.
a.
b.
c.
d.
e.
f.
g.
h.
i.
j.
k.
l.
m.
2009
(State Funding Only)
$140,352,332 2008
2005 2005
2006
2004 $38,266,313 $128,787,424
$ 24,248,027 transferred to Medical Services for DDS' Medicaid match.
$47,605,461
$14,680,491
2007
2001
$17,226,632 transferred to Medical Services for DDS’ Medicaid Match.
$14,168,338 transferred to Medical Services for DDS’ Medicaid Match.
$98,846,015
$99,648,430
2009
2009 $27,527,488 2009 $102,217,746
$14,367,073 transferred to Medical Services for DDS’ Medicaid Match.
$81,058,565
2007
$48,682,326
$27,276,451 2010 $113,665,398
$84,395,462
$85,427,771
2004
$20,253,290
$160,619,858
ARKANSAS DHS STATISTICAL REPORT
DDS FUNDING
SFY 1999-2010
TOTAL STATE GENERAL
State Fiscal Year State Fiscal Year
$36,118,068 $109,442,658
REVENUE EXPENDITURES
Total
2000
General Revenue
$37,376,693 1999
2000
$102,144,737
2004
$138,695,203
20002000
TOTAL EXPENDITURES FOR DDS
$35,065,765
1999
$37,126,049 2001
2002
2005
$18,705,564
$16,534,351 2001
2003
2005
2004
2002 2002
1999
$109,539,359
$13,905,279
$141,179,106
2003
2008
2006
2007
$136,652,486
$137,892,137
Source: Division of Developmental Disabilities Services
$26,508,188 2008 $101,601,688
2006$25,790,110
$18,658,518 transferred to Medical Services for DDS' Medicaid match.
State Fiscal Year General Revenue State Fiscal Year Total Revenue
$89,911,431
2006
2003
$89,095,372
$14,145,671 transferred to Medical Services for DDS’ Medicaid Match.
$9,283,025 transferred to Medical Services for DDS’ Medicaid Match.
$11,310,218 transferred to Medical Services for DDS’ Medicaid Match.
$5 million is due to a provider rate increase. The other increase is due to XIX expenditures and rate increase $2,890,343.
$24,075,024 transferred to Medical Services for DDS' Medicaid match.
1999
$95,898,097
$16,121,222
$ 25,985,944 transferred to Medical Services for DDS' Medicaid match.
EXPENDITURES FOR OPERATIONS
(State and Federal Funding)
CONTRACTS
(formerly GRANT-IN-AID)
FOR COMMUNITY PROGRAMS
$ 25,215,907 transferred to Medical Services for DDS' Medicaid match.
$ 25,985,944 transferred to Medical Services for DDS' Medicaid match.
$48,528,726
$15,695,344
$48,032,101
2003
$26,083,292 2007
(State and Federal Funding)
$38,578,012
$46,634,942
HUMAN DEVELOPMENT CENTERS
$98,899,333
$111,741,932
2002
2001
$109,904,692 $36,268,549
DDS-18


The Division of Medical Services houses two major programs under one administration:
Medicaid is a joint federal-state program that provides medical assistance for eligible individuals
based on financial need and/or health status. Medicaid furnishes medical assistance to those who
have insufficient incomes and resources to meet the costs of necessary medical services. It also
provides rehabilitative and other services to help families and individuals become or remain
independent and able to care for themselves.
ARKANSAS DHS STATISTICAL REPORT
DIVISION OF MEDICAL SERVICES
INTRODUCTION
SFY 2010
Medicaid
The Department of Human Services (DHS) is the single state agency authorized and responsible for
regulating and administering the program. DHS administers the Medicaid Program through the
Division of Medical Services (DMS). The Centers for Medicare and Medicaid Services (CMS)
administers the Medicaid Program for the U.S. Department of Health and Human Services. CMS
authorizes federal funding levels and approves each state’s State Plan, ensuring compliance with
federal regulations. Individuals are certified as eligible for Medicaid services by DHS Field Staff
located in DHS County Offices or by District Social Security Offices.
The Office of Long Term Care (OLTC) also surveys Adult Day Care, Adult Day Health Care, Post
Acute Head Injury Facility, Residential Care Facilities, and Assisted Living Facilities. In addition to
surveying facilities, OLTC administers the Nursing Home Administrator Licensure program, Criminal
Background program, Certified Nursing Assistant registry and training program, processes Medical
Needs Determinations for Nursing Home and Waivers and operates a Complaints Unit.
These programs are designed to serve Arkansans throughout the state. The following pages highlight the State
Fiscal Year 2010 performance of these programs through financial, utilization data, and narrative.
Source: DMS Website
A list of covered services can be found on page DMS-13 of this publication. Mandatory services are
required by the federal government. Optional services are those which the state has elected to
provide. Many of these optional services enable recipients to receive care in less costly home or
community-based settings. Optional services are approved in advance by CMS and are funded at
the same level as mandatory services.
Long-Term Care
Each year, more than 23,000 Arkansans who have chronic, long-term medical needs require
services in long-term care facilities. These individuals live in the approximately 227 nursing facilities
and 41 intermediate care facilities for the mentally retarded that are licensed to provide long-term
care services in Arkansas.
Improving the quality of life for residents and protecting their health and safety through enforcing
state and federal standards are primary goals of Arkansas Medicaid's Office of Long Term Care
(OLTC). Using qualified health care professionals, OLTC inspects all facilities to ensure residents
receive the care they need in a clean, safe environment and that they are treated with dignity and
respect.
DMS-1

DMS Administration Expenditures
00 - Regular Salaries $13,983,685.00
01 - Extra Help 104,938.00
02 - Maintenance & Operations 3,141,873.00
03 - Fringe Benefits 4,080,277.00
06 - Overtime 0.00
08 - Supplemental Salaries 0.00
09 - Conference Fees and Travel 172,995.00
10 - Professional Fees and Services 293,965.00
11 - Capital Outlay 87,269.00
44 - Purchase Data Processing 84,775.00
48 - Respite Care 0.00
Sub-Total $21,949,777.00
DMS Programs
Private Nursing Home $561,930,588.00
Prescription Drugs 318,101,235.00
Hospital/Medical 2,895,221,602.00
ARKids 93,327,496.00
Child and Family Institute 0.00
Infant Infirmary 21,454,487.00
Public Nursing Home 174,460,419.00
Medical Expansion 37,311,938.00
Nursing Home Quality of Life 184,888.00
Nursing Home Closure Costs 0.00
LTC Facility Receivership 0.00
Sub-Total $4,101,992,653.00
TOTAL $4,123,942,430.00
ARKANSAS DHS STATISTICAL REPORT
OFFICE OF ADMINISTRATIVE SERVICES
EXPENDITURES
SFY 2010
DMS-2
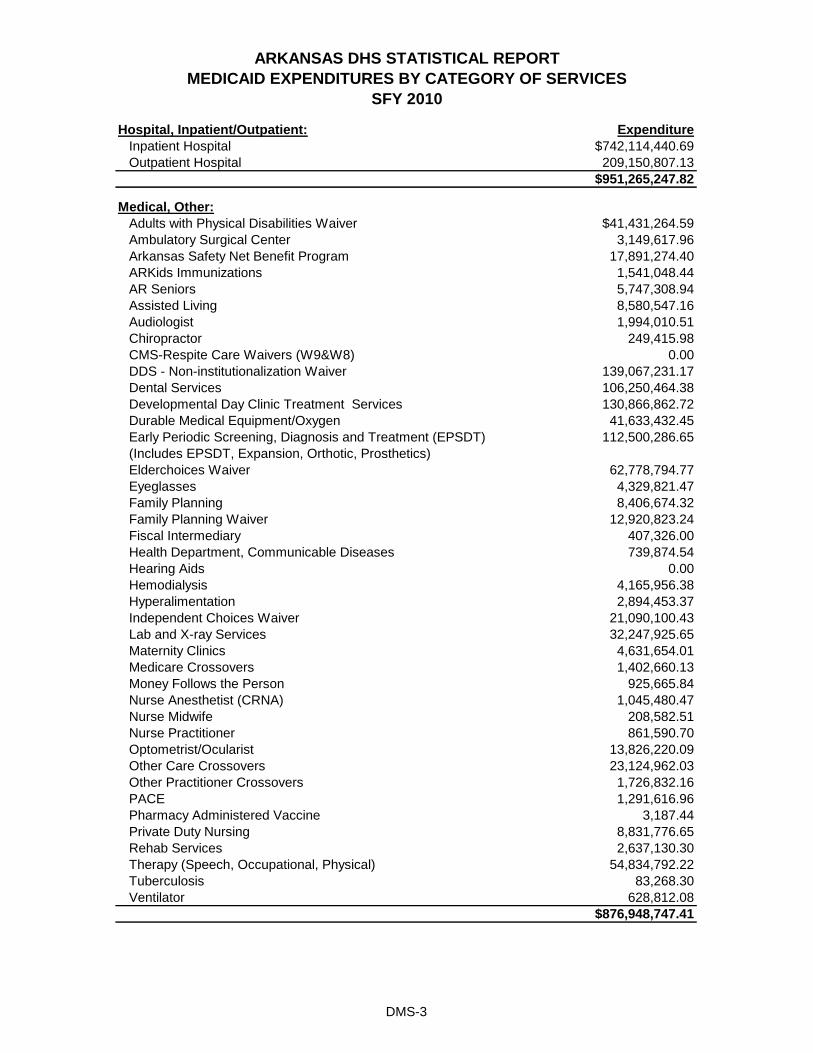
Hospital, Inpatient/Outpatient: Expenditure
Inpatient Hospital $742,114,440.69
Outpatient Hospital 209,150,807.13
$951,265,247.82
Medical, Other:
Adults with Physical Disabilities Waiver $41,431,264.59
Ambulatory Surgical Center 3,149,617.96
Arkansas Safety Net Benefit Program 17,891,274.40
ARKids Immunizations 1,541,048.44
AR Seniors 5,747,308.94
Assisted Living 8,580,547.16
Audiologist 1,994,010.51
Chiropractor 249,415.98
CMS-Respite Care Waivers (W9&W8) 0.00
DDS - Non-institutionalization Waiver 139,067,231.17
Dental Services 106,250,464.38
Developmental Day Clinic Treatment Services 130,866,862.72
Durable Medical Equipment/Oxygen 41,633,432.45
Early Periodic Screening, Diagnosis and Treatment (EPSDT) 112,500,286.65
(Includes EPSDT, Expansion, Orthotic, Prosthetics)
Elderchoices Waiver 62,778,794.77
Eyeglasses 4,329,821.47
Family Planning 8,406,674.32
Family Planning Waiver 12,920,823.24
Fiscal Intermediary 407,326.00
Health Department, Communicable Diseases 739,874.54
Hearing Aids 0.00
Hemodialysis 4,165,956.38
Hyperalimentation 2,894,453.37
Independent Choices Waiver 21,090,100.43
Lab and X-ray Services 32,247,925.65
Maternity Clinics 4,631,654.01
Medicare Crossovers 1,402,660.13
Money Follows the Person 925,665.84
Nurse Anesthetist (CRNA) 1,045,480.47
Nurse Midwife 208,582.51
Nurse Practitioner 861,590.70
Optometrist/Ocularist 13,826,220.09
Other Care Crossovers 23,124,962.03
Other Practitioner Crossovers 1,726,832.16
PACE 1,291,616.96
Pharmacy Administered Vaccine 3,187.44
Private Duty Nursing 8,831,776.65
Rehab Services 2,637,130.30
Therapy (Speech, Occupational, Physical) 54,834,792.22
Tuberculosis 83,268.30
Ventilator 628,812.08
$876,948,747.41
ARKANSAS DHS STATISTICAL REPORT
MEDICAID EXPENDITURES BY CATEGORY OF SERVICES
SFY 2010
DMS-3

Medicare Buy-In: Expenditure
Medicare Buy-In $148,568,607.70
$148,568,607.70
Mental Health:
Community Mental Health Centers (Rehabilitative Services for
Persons With Mental Illness)
$266,161,404.18
Inpatient Psychiatric $144,596,557.82
Psychologist $747,015.03
School-Based Mental Health $66,714.92
$411,571,691.95
Other:
Targeted Case Management (Children - Under 21-EPSDT) $7,529.30
Ages 21 to 59 7,312.92
Ages 60 and Older 1,072,992.60
Case Management/CMS 1,174,477.36
Case Management/DCFS 0.00
Case Management/DYS 762,923.02
Miscellaneous -4,936,159.60
Adjustments 5,542,906.64
ARKids School District Outreach 0.00
Program Administration 82,460,411.21
$86,092,393.45
Physician:
Physician Services $307,725,235.28
Managed Care Fee 14,464,375.32
$322,189,610.60
Special Care:
Community Health Centers (Federally Qualified Health Ctr) $13,342,650.94
Home Health Services 16,031,486.76
Hospice 5,517,371.57
Nursing Home Hospice 19,535,181.51
Personal Care Services 70,936,107.49
Rural Health Clinics 12,900,778.69
$138,263,576.96
Transportation:
Ambulance $20,971,458.05
Non-profit Transportation 661,237.00
Public Transportation -95.24
School District Transportation 0.00
Non-Emergency Transportation (NET) Waiver 35,264,977.81
Non-Public Transportation 11,931,778.39
$68,829,356.01
Total Hospital/Medical $3,003,729,231.90
SFY 2010
MEDICAID EXPENDITURES BY CATEGORY OF SERVICES
ARKANSAS DHS STATISTICAL REPORT
DMS-4

Prescription Drugs: Expenditure
Prescription Drugs $308,290,811.55
Prescription Drugs - State Contribution to Part D Drug Ben. 25,977,235.22
Family Planning Drugs 3,662,059.69
Assisted Living Drugs 39,628.00
Contracts 2,263,302.43
Total Prescription Drugs $340,233,036.89
Private Nursing Home:
Private Nursing Facilities $558,826,017.96
Contracts 3,104,569.41
$561,930,587.37
Private Pediatric ICF/MR
Intermediate Care Facility (ICF) Infant Infirmaries $21,454,486.37
$21,454,486.37
Public Nursing Home
Public Nursing Homes $174,460,418.76
$174,460,418.76
Total Long Term Care $757,845,492.50
Source: DMS Financial Activities
TOTAL MEDICAID PROGRAM $4,101,807,761.29
ARKANSAS DHS STATISTICAL REPORT
MEDICAID EXPENDITURES BY CATEGORY OF SERVICES
SFY 2010
DMS-5

Special Care includes Home Health, Private Duty Nursing, Personal Care, and Hospice Services.
Transportation includes emergency and non-emergency transportation.
Other includes administrative expenditures, Medicare co-pay and deductibles.
ICF/MR is an abbreviation for Intermediate Care Facility for Mentally Retarded.
Source: DMS Financial Activities
ARKANSAS DHS STATISTICAL REPORT
MEDICAID EXPENDITURES BY CATEGORY OF SERVICE
SFY 2009 - 2010
Mental Health11%
Buy-in4%
Medical, Other21%
Other2%
Transportation1%Hospital,
Inpatient/Outpatient20%
Private Nursing Home15%
Private Pediatric ICF/MR1%
Public Nursing Home4%
Total Prescription Drugs10%
Physician8%
Special Care3%
Medicaid Expenditures SFY 2009
Mental Health10%
Buy-in4%
Medical, Other21%
Other2%
Transportation2%Hospital,
Inpatient/Outpatient23%
Private Nursing Home14%
Private Pediatric ICF/MR1%
Public Nursing Home4%
Total Prescription Drugs8%
Physician8%
Special Care3%
Medicaid Expenditures SFY 2010
DMS-6
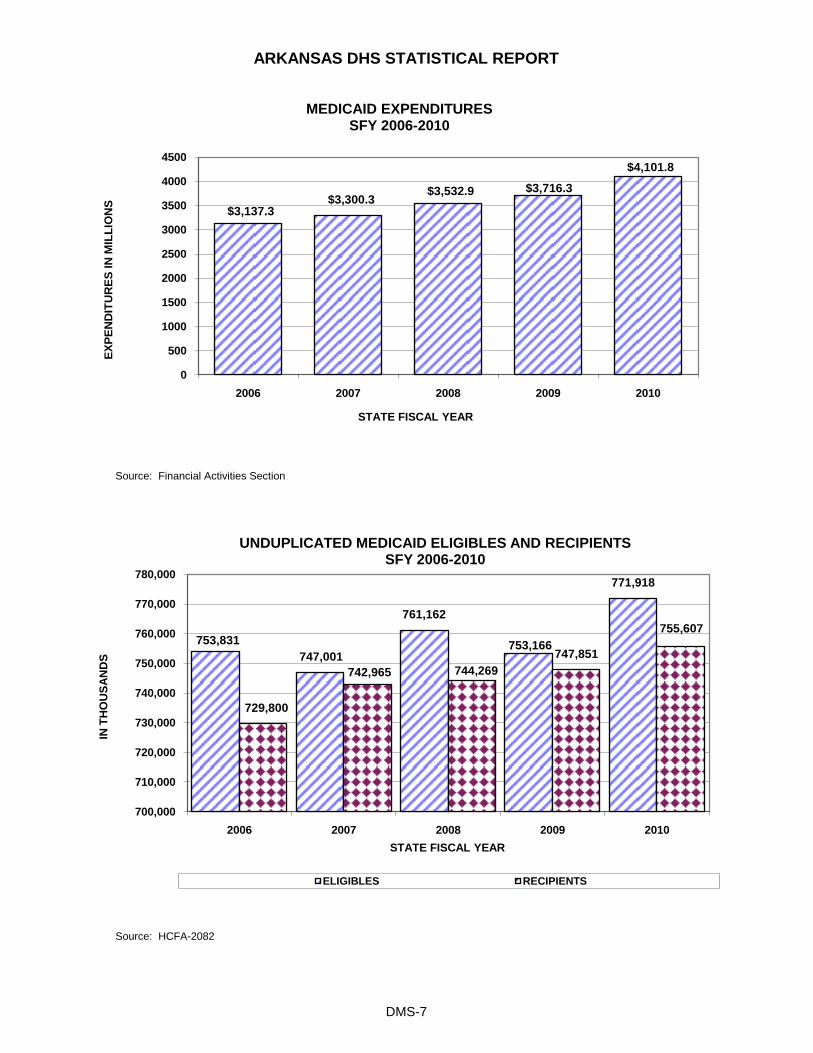
Source: Financial Activities Section
Source: HCFA-2082
ARKANSAS DHS STATISTICAL REPORT
$3,137.3$3,300.3
$3,532.9 $3,716.3
$4,101.8
0
500
1000
1500
2000
2500
3000
3500
4000
4500
2006 2007 2008 2009 2010
EX
PE
ND
ITU
RE
S I
N M
ILL
ION
S
STATE FISCAL YEAR
MEDICAID EXPENDITURESSFY 2006-2010
753,831
747,001
761,162
753,166
771,918
729,800
742,965 744,269
747,851
755,607
700,000
710,000
720,000
730,000
740,000
750,000
760,000
770,000
780,000
2006 2007 2008 2009 2010
IN T
HO
US
AN
DS
STATE FISCAL YEAR
UNDUPLICATED MEDICAID ELIGIBLES AND RECIPIENTS SFY 2006-2010
ELIGIBLES RECIPIENTS
DMS-7
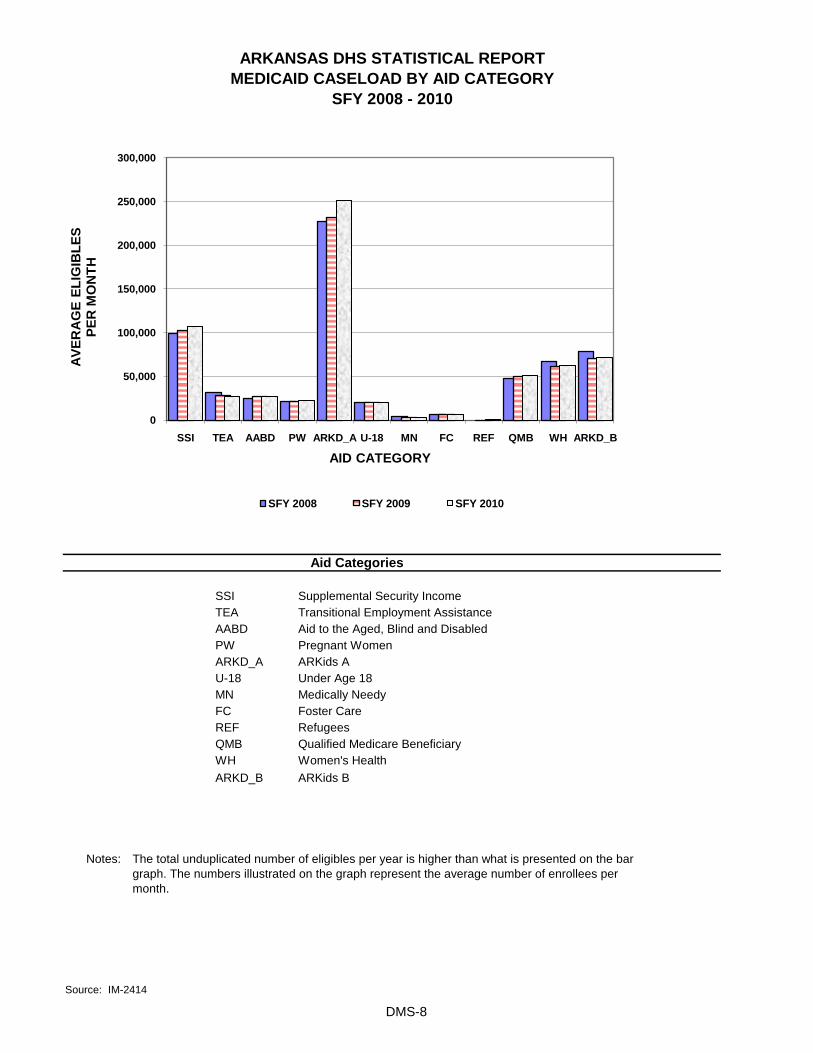
SSI Supplemental Security Income
TEA Transitional Employment Assistance
AABD Aid to the Aged, Blind and Disabled
PW Pregnant Women
ARKD_A ARKids A
U-18 Under Age 18
MN Medically Needy
FC Foster Care
REF Refugees
QMB Qualified Medicare Beneficiary
WH Women's Health
ARKD_B ARKids B
Notes:
Source: IM-2414
ARKANSAS DHS STATISTICAL REPORT
MEDICAID CASELOAD BY AID CATEGORY
SFY 2008 - 2010
The total unduplicated number of eligibles per year is higher than what is presented on the bar
graph. The numbers illustrated on the graph represent the average number of enrollees per
month.
Aid Categories
0
50,000
100,000
150,000
200,000
250,000
300,000
SSI TEA AABD PW ARKD_A U-18 MN FC REF QMB WH ARKD_B
AV
ER
AG
E E
LIG
IBL
ES
P
ER
MO
NT
H
AID CATEGORY
SFY 2008 SFY 2009 SFY 2010
DMS-8

All Ages Under 1 1-5 6-14 15-20 21-44 45-64 65-74 75-84 85+
755,607 24,558 147,580 211,652 115,101 131,148 65,325 23,299 19,746 17,198
97,400 21,861 9,755 2,905 8,349 26,742 14,139 4,977 4,547 4,125
6,261 0 32 2,620 3,087 321 179 11 7 4
1,776 1 17 116 213 700 666 60 3 0
20,051 0 0 0 6 336 2,748 3,052 5,535 8,374
549,577 22,027 117,076 140,756 74,681 101,462 51,454 16,775 14,096 11,250
241,541 46 49,465 120,332 42,917 15,852 9,976 1,773 811 369
154,980 74 8,796 60,272 28,412 15,959 21,346 7,992 6,893 5,236
326,007 12,550 74,951 74,901 43,868 54,493 38,352 11,442 8,970 6,480
374,944 21,712 105,053 132,965 50,112 36,287 19,697 4,207 2,926 1,985
6,386 499 478 144 212 1,048 2,299 551 617 538
230,753 6,435 33,660 38,984 36,465 52,754 36,031 10,627 8,779 7,018
454,676 16,279 112,049 143,720 69,070 66,937 32,239 5,473 4,489 4,420
96,574 1,432 11,602 8,714 4,228 13,271 22,826 13,021 11,733 9,747
500,967 17,022 132,991 186,512 87,541 48,280 25,873 2,145 369 234
35,047 1,349 7,573 3,564 5,120 9,585 7,019 529 187 121
13,900 1 9 135 139 1,365 3,109 2,761 3,423 2,958
13,629 40 616 1,765 3,038 43 205 2,127 3,009 2,786
423 0 10 321 83 5 4 0 0 0
27,213 324 13,278 10,707 1,533 290 558 245 179 99
1,345 11 7 9 3 113 605 128 161 308
9,781 136 1,390 1,607 1,185 2,815 1,415 355 454 424
Inpatient Hospital
ARKANSAS DHS STATISTICAL REPORT
RECIPIENTS OF MEDICAID SERVICES BY AGE
SFY 2010
Service Type
Unduplicated Total
Recipients
Other Care
Inpatient Psych Svcs, 21
and Under
Intensive Care Facility
Svcs, Mentally Retarded
Skilled Nursing Facility
Services
Physician Services
Dental Services
Other Practitioners
Services
Outpatient Hospital
Services
Clinic Services
Home Health Services
Lab & X-ray Services
Prescribed Drugs
Private Duty Nursing
Home & Community
Based Waiver
Source: HCFA-2082
Managed Care Fees
Transportation
Rehabilitation Services
Therapy Services
Nurse Midwife
Nurse Practitioner
Services
DMS-9

All Race
White, not
of
Hispanic
Origin
Black, not
of
Hispanic
Origin
American
Indian or
Alaskan
Native
Asian or
Pacific
Islander Hispanic Unknown
755,607 321,947 163,603 1,398 2,388 34,942 231,329
97,400 32,966 15,373 141 157 1,842 46,921
6,261 3,495 1,370 13 7 70 1,306
1,776 1,225 351 5 5 10 180
20,051 10,350 2,662 7 26 31 6,975
549,577 241,729 114,121 962 1,371 23,856 167,538
241,541 115,651 59,964 498 836 18,478 46,114
154,980 81,616 38,671 375 480 6,852 26,986
326,007 138,555 69,039 573 668 12,670 104,502
374,944 151,306 75,732 642 909 21,163 125,192
6,386 2,531 1,511 10 9 40 2,285
230,753 110,286 47,499 464 499 7,298 64,707
454,676 199,161 91,786 795 1,014 21,536 140,384
96,574 47,402 21,142 203 275 1,259 26,293
500,967 209,941 111,315 929 1,481 28,103 149,198
35,047 14,144 8,921 70 43 665 11,204
13,900 7,526 3,475 23 39 36 2,801
13,629 6,377 3,393 24 22 149 3,664
423 170 179 1 0 5 68
27,213 11,419 4,814 51 69 846 10,014
1,345 536 172 4 5 6 622
9,781 4,505 1,934 14 11 252 3,065
Inpatient Hospital
ARKANSAS DHS STATISTICAL REPORT
RECIPIENTS OF MEDICAID SERVICES BY RACE
SFY 2010
Unduplicated Total
Recipients
Service Type
Other Care
Inpatient Psych Svcs, 21
and Under
Intensive Care Facility
Svcs, Mentally Retarded
Skilled Nursing Facility
Services
Physician Services
Dental Services
Other Practitioners
Services
Outpatient Hospital
Services
Clinic Services
Home Health Services
Lab & X-ray Services
Prescribed Drugs
Managed Care Fees
Transportation
Rehabilitation Services
Home & Community Based
Waiver
Source: HCFA-2082
Therapy Services
Nurse Midwife
Nurse Practitioner Services
Private Duty Nursing
DMS-10

Private NH Public NH ICF/MR
Arkansas 16,622,391.31 2,243,229.71 6,161,051.84 5,433.39 72,584.56 $25,104,690.81
Ashley 28,364,249.89 3,089,019.15 2,472,704.52 51,644.27 0.00 $33,977,617.83
Baxter 27,049,166.42 3,784,255.95 10,284,652.23 85,527.85 0.00 $41,203,602.45
Benton 87,593,042.28 12,166,746.65 19,741,276.64 115,843.69 171,461.25 $119,788,370.51
Boone 27,385,258.83 2,982,542.80 7,985,394.19 78,802.14 50,577.38 $38,482,575.34
Bradley 13,524,834.33 1,587,903.41 2,729,013.60 7,449,822.19 20,133.61 $25,311,707.14
Calhoun 3,410,221.34 469,073.18 16,153.50 793.00 0.00 $3,896,241.02
Carroll 14,998,580.59 2,009,192.20 3,549,361.90 3,496.49 177,103.13 $20,737,734.31
Chicot 17,709,881.65 1,865,169.63 4,400,631.35 9,933.02 153,333.42 $24,138,949.07
Clark 18,271,199.93 2,163,833.80 6,204,355.52 11,809,173.52 14,146.51 $38,462,709.28
Clay 14,158,333.76 2,193,281.29 3,561,947.26 2,036.00 0.00 $19,915,598.31
Cleburne 18,277,020.91 2,447,926.78 5,436,701.85 -34,180.03 0.00 $26,127,469.51
Cleveland 7,199,945.88 919,130.07 2,252,063.81 3,933.16 0.00 $10,375,072.92
Columbia 22,661,182.16 2,973,258.38 9,333,556.14 22,891.02 0.00 $34,990,887.70
Conway 22,433,819.38 2,541,523.78 6,102,190.99 618,475.58 69,724.06 $31,765,733.79
Craighead 82,374,940.72 12,509,789.24 19,670,839.01 11,144,036.28 367,389.19 $126,066,994.44
Crawford 46,845,161.84 6,986,355.47 10,327,927.61 848,632.92 -84,036.76 $64,924,041.08
Crittenden 55,791,699.81 6,860,467.69 9,759,392.66 1,321,999.71 -9,472.08 $73,724,087.79
Cross 19,107,442.30 2,641,738.48 6,168,439.44 13,299.14 0.00 $27,930,919.36
Dallas 14,673,098.78 1,791,734.14 3,666,940.28 44,503.75 4,426,619.65 $24,602,896.60
Desha 18,027,829.68 2,061,727.73 2,718,325.16 14,308.75 62,401.70 $22,884,593.02
Drew 21,235,362.71 2,662,751.56 5,531,945.40 4,513.21 213,954.08 $29,648,526.96
Faulkner 64,468,258.76 11,083,011.07 12,691,610.37 60,273,638.34 123,405.61 $148,639,924.15
Franklin 10,844,477.58 1,846,345.91 6,684,814.54 8,718.58 62,844.24 $19,447,200.85
Fulton 12,368,046.94 1,596,125.12 4,898,408.93 26,127.55 14,393.18 $18,903,101.72
Garland 81,679,655.23 13,035,828.19 17,377,593.67 432,070.76 492,642.62 $113,017,790.47
Grant 10,542,680.29 1,599,424.56 2,355,045.29 -6,789.18 0.00 $14,490,360.96
Greene 39,163,199.28 6,176,129.99 8,348,933.28 -34,638.19 67,723.80 $53,721,348.16
Hempstead 20,436,760.60 2,686,304.39 5,867,330.35 584,932.92 2,254.58 $29,577,582.84
Hot Spring 29,602,830.81 4,109,846.72 5,749,666.28 171,437.68 -76,175.53 $39,557,605.96
Howard 10,216,659.41 1,425,694.50 5,822,294.53 167,424.49 154,432.84 $17,786,505.77
Independence 32,673,360.58 4,826,769.45 10,142,977.90 658,574.71 0.00 $48,301,682.64
Izard 11,069,185.86 1,610,518.49 5,049,965.88 13,881.24 -13,733.21 $17,729,818.26
Jackson 19,379,146.65 2,395,370.04 5,596,785.93 238,487.54 53,461.52 $27,663,251.68
Jefferson 70,294,315.44 8,806,720.67 16,175,749.41 1,434,249.09 -79,571.31 $96,631,463.30
Johnson 21,490,280.53 2,650,692.92 3,340,268.47 50,597.85 0.00 $27,531,839.77
Lafayette 8,414,063.08 948,009.37 2,019,140.82 -3,742.71 0.00 $11,377,470.56
Lawrence 17,643,447.08 2,801,110.81 9,071,336.98 18,498.44 82,846.16 $29,617,239.47
Lee 15,607,193.28 1,479,687.01 2,436,004.96 97,306.44 0.00 $19,620,191.69
ARKANSAS DHS STATISTICAL REPORT
MEDICAID PAYMENTS TO MEDICAL VENDORS
MEDICAID AND ARKids B PAYMENTS BY RECIPIENT COUNTY
SFY 2010
County Hospital/
Medical
Prescription
Drugs
Long Term Care
TOTAL
DMS-11

Private NH Public NH ICF/MR
Lincoln 9,794,287.02 1,518,836.52 5,016,327.03 95,126.75 0.00 $16,424,577.32
Little River 7,332,128.95 1,222,740.88 4,341,665.99 0.00 66,856.05 $12,963,391.87
Logan 18,226,512.12 3,104,315.44 5,406,067.27 14,897,779.97 21,580.82 $41,656,255.62
Lonoke 40,275,230.97 6,699,004.44 14,816,337.51 853,358.78 -79,923.74 $62,564,007.96
Madison $9,975,645.15 1,420,796.56 2,183,753.07 0 $0.00 $13,580,194.78
Marion 10,600,824.37 1,577,735.74 4,075,044.96 7,047.99 0.00 $16,260,653.06
Miller 32,585,368.48 4,767,519.54 10,233,826.88 808,547.98 -7,254.00 $48,388,008.88
Mississippi 49,913,534.06 7,531,116.45 8,258,954.29 205,173.19 73,406.58 $65,982,184.57
Monroe 12,102,291.52 1,383,139.75 1,882,535.52 0.00 0.00 $15,367,966.79
Montgomery 6,113,083.58 974,287.64 3,196,805.94 0.00 46,308.50 $10,330,485.66
Nevada 13,634,797.54 1,938,924.98 4,459,964.34 160,336.48 0.00 $20,194,023.34
Newton 6,510,685.80 678,453.67 2,076,244.61 4,075.79 0.00 $9,269,459.87
Ouachita 24,014,985.77 3,575,958.31 8,545,203.63 101,168.93 59,524.81 $36,296,841.45
Perry 6,692,428.22 1,057,573.71 2,483,538.14 32,504.20 156,241.32 $10,422,285.59
Phillips 40,362,121.34 4,998,668.53 4,598,763.54 654,236.84 0.00 $50,613,790.25
Pike 9,282,132.79 1,282,814.79 3,860,759.31 -34,920.33 1,463.38 $14,392,249.94
Poinsett 30,816,114.43 4,897,321.50 7,742,641.00 120,478.93 40,483.21 $43,617,039.07
Polk 15,001,537.67 2,174,129.65 2,783,316.48 89,035.24 87,190.44 $20,135,209.48
Pope 46,745,902.19 6,696,008.44 10,393,338.87 563,020.31 -24,841.12 $64,373,428.69
Prairie 6,855,670.35 1,000,049.59 3,845,868.66 0.00 0.00 $11,701,588.60
Pulaski 352,376,626.14 37,794,450.65 49,481,550.99 5,843,031.25 8,785,299.76 $454,280,958.79
Randolph 19,702,694.41 2,437,140.87 7,149,693.32 101,493.65 0.00 $29,391,022.25
Saline 61,800,267.47 8,747,977.27 11,843,008.12 46,049,418.75 108,882.21 $128,549,553.82
Scott 7,968,208.76 1,694,019.44 2,145,449.42 0.00 0.00 $11,807,677.62
Searcy 10,746,508.10 1,139,805.05 2,645,899.26 5,776.58 0.00 $14,537,988.99
Sebastian 88,843,304.01 12,587,883.36 20,259,584.20 1,501,042.96 4,984,592.24 $128,176,406.77
Sevier 10,851,808.76 1,788,131.26 4,093,915.83 4,644.12 69,674.77 $16,808,174.74
Sharp 19,663,907.53 2,232,420.86 4,013,127.51 120,271.15 -7.75 $26,029,719.30
St. Francis 37,912,560.15 4,678,587.57 3,768,996.46 2,608.53 94,587.25 $46,457,339.96
Stone 12,859,618.29 1,384,890.85 1,978,051.52 10,028.00 0.00 $16,232,588.66
Union 34,001,243.53 5,229,007.33 15,524,857.52 1,419,720.72 5,478.22 $56,180,307.32
Van Buren 14,500,695.18 2,038,825.15 3,807,346.64 34,484.48 97,504.06 $20,478,855.51
Washington 108,786,774.61 12,639,663.79 23,792,917.93 2,183,768.04 199,422.61 $147,602,546.98
White 51,991,284.30 8,715,261.30 13,681,584.38 853,898.96 36,209.80 $75,278,238.74
Woodruff 8,498,361.04 1,158,165.98 4,094,343.08 -18,135.51 0.00 $13,732,734.59
Yell 18,435,155.49 2,033,724.13 7,762,819.27 46,660.57 41,362.75 $28,319,722.21
State Total $2,329,382,525.99 $312,827,591.29 $557,946,894.98 $174,461,377.90 $21,454,486.37 $3,396,072,876.53
Note: Does not include Cost Settlements, TPL, Medicare Buy-in, Advanced Payments or Adminstrative Costs or Clawback.
Source: DSS Report
ARKANSAS DHS STATISTICAL REPORT
MEDICAID PAYMENTS TO MEDICAL VENDORS
MEDICAID AND ARKids B PAYMENTS BY RECIPIENT COUNTY
SFY 2010
County Hospital/
Medical
Prescription
Drugs
Long Term Care
TOTAL
DMS-12

Services Mandated by Federal Government:
Ambulance Maternity/physician program cost
Critical Access Hospitals INP MED Nonprofit Transportation
Critical Access Hospitals OUT MED Non-Public Transportation
EPSDT Immunizations Nurse Midwife
EPSDT Screening Nurse Practitioner
Family Planning All Aid Cat, 90/10 Match Ophthalmologist
Family Planning Clinics Ophthalmologist medical
Family Planning Drugs Oral Surgery Dentist (ADA Codes)
Family Planning FQHC Oral Surgery Physicians
Family Planning Not Aid Cat 69 90/10 Match Outpatient Hospital
Family Planning Nurse Practitioner Outpatient Hospital Family Planning
Family Planning Physician Outpatient Teaching Hospital
Family Planning RHC Pathologist
FQHC Core Services Pediatric Inpatient
FQHC Dental Pediatric Outpatient Hospital
FQHC Transportation Physician Services
Home Health Services Private SNF
ICF/INF/E.S. Prof Inpatient AR Teaching Hospital
Independent Lab Public ICF Mentally Retarded
Independent X-ray Public SNF
Inpatient Acute Care Radiologist
Inpatient AR Teaching Rural Health Clinics
Inpatient Hospital Rural Inpatient
Lab and X-ray Surgery
Maternity Clinic
Optional Services Chosen by Arkansas:
Ambulatory Surgical Centers Durable Medical Equipment/Oxygen
APD Agency Attendant Care, Co Employer ElderChoices Waiver
APD Attendant Care Extension 3 Prescriptions For AL
APD Counseling Case Management Eyeglasses
APD-Environmental Adaptations Family Planning Aid Cat 69, 75/25 OP
ARKIDS - Immunology Family Planning Aid Cat 69, 75/25 Prof
Assisted Living Agency Family Planning Waiver
Assisted Living Facility Family Planning Waiver Other Facilities
Assisted Living Pharm Consultant Family Planning Waiver Prescription Services
Chiropractor Family Planning Waiver RHC
Community Mental Health (RSPMI) Health Dept Communicable Disease
CRNA Hemodialysis
CSMT Age 21-59 with Developmental Disability Hospice
CSMT Age 60 and Older Hyperalimentation
DDS Alternative Com Service Waiver
ARKANSAS DHS STATISTICAL REPORT
SERVICES COVERED BY ARKANSAS MEDICAID
SFY 2010
DMS-13

Optional Services Chosen by Arkansas (continued):
Independent Choices C/FI OP FP, All Aid Cat
Independent Choices FMS Services Optometrist/ Ocularist
Independent Choices New Control Elderly Outpatient Rehab
Independent Choices New Treatment Elderly Outpatient Transplant Services
Independent Choices New Treatment Young Disabled PACE
Independent Choices Treatment Elderly Personal Care Services
Independent Choices Treatment Young Disabled Physician Transplant Services
Inpatient Rehab Prescription Services
Inpatient Transplant Private Duty Nursing Services
Managed Care Fees Tuberculosis
Mental Hospital Services - aged Vaccine administered in pharmacy
Net Managed Care Waiver Ventilator
Nursing Home Hospice
Optional Services Chosen by Arkansas For Individuals Over 21:
Audiologist EPSDT Prosthetic Device
Case Management CMS EPSDT Psychology Services
Case Management DCFS Hearing Aid
CMS/Respite Care/MR/DD (W9) Inpatient Psychiatric u-21
CMS/Respite Care/PD (W8) Private Duty Nursing EPSDT
Dental Services (See note.) Psychologist
Dental Services EPSDT RSPD Extended Rehab Services
Developmental Day Treatment Clinic Svc (See note.) RSPD/ Residential Rehab Center
Developmental Rehab Services School-Based Mental Health Services
DYS Rehab Services Sexual Offender Program
EPSDT CHMS Targeted Case Management
EPSDT DMS Expansion TCM/DYS
EPSDT Orthotic Appliances Therapy Individual/Regular Group
EPSDT Podiatry Therapy School District/ Esc Group
NOTES:
Long Term Care – Nursing Facility services for age 21 and older are mandatory; Nursing Facility services for
individuals under age 21 are optional.
ARKANSAS DHS STATISTICAL REPORT
SERVICES COVERED BY ARKANSAS MEDICAID
SFY 2010
Dental – Medical and surgical services of a dentist are mandatory; dental services for individuals age 21 and older
are optional.
DDTCS program is an optional program. DDTCS provided to pre-school age individuals would be considered
optional for individuals under age 21.
DMS-14

Approved Medicaid Waivers
Alternatives for Adults with Physical Disabilities Living Choices Assisted Living Waiver
Arkansas Health Net Non-Emergency Transportation
ARKids First B Tax Equity and Fiscal Responsibility Act (TEFRA)
DDS Alternative Community Services Waiver Women's Health (Family Planning)
ElderChoices Waiver
Major Benefit Limitations on Services:
Note - Any and all exceptions to benefit limits are based on medical necessity.
Additional Information for ARKids-B and TEFRA:
Source: Division of Medical Services
ARKids B beneficiary annual cost-sharing is capped at 5% of the family's gross annual income.
Premiums: Based on family income certain TEFRA beneficiaries must pay a premium.
Three pharmaceutical prescriptions are allowed per month; family planning and tobacco cessation prescriptions
are not counted against benefit limit; there are unlimited prescriptions for nursing facility beneficiaries and
EPSDT (Early Periodic Screening, Diagnosis, and Treatment) beneficiaries (Under age 21) and beneficiaries
with MEDICARE Part D will receive their drugs through that program rather than Medicaid. Extensions will be
considered for up to three additional prescriptions for a maximum of six (6) prescriptions per month for
beneficiaries. Beneficiaries receiving services through the Assisted Living waiver may receive up to nine (9)
medically necessary prescriptions per month.
Inpatient hospital days are limited to 24 per state fiscal year, except for EPSDT beneficiaries and some organ
transplant patients.
Co-Pay: Some beneficiaries must pay $0.50 to $3 of every prescription, and $2 on the dispensing fee for
prescription services for eyeglasses. Certain beneficiaries who have gross income at or above 100% of the
Federal Poverty Level, in the Working Disabled aid category, without regard to age, must pay a higher co-
payment for these services and also must pay co-payments for some additional services.
Co-Insurance: ARKids B beneficiaries must pay 20% of the charges for the first Medicaid covered day of
inpatient hospital services and must also pay co-insurance for some outpatient services.
Co-Pay: ARKids B beneficiaries must pay a co-payment for most services; for example $10.00 for most office
visits and $5.00 for most prescription drugs (and must use generic drugs and rebate manufacturer, if available).
Co-insurance: Some beneficiaries must pay 10% of the first Medicaid covered day of hospital stay. Certain
beneficiaries who have gross income at or above 100% of the Federal Poverty Level, in the Working Disabled
aid category, without regard to age, must pay a co-insurance of 25% of the first Medicaid covered day of
hospital stay and must also pay co-insurance for some additional services.
Twelve visits to hospital outpatient departments allowed per state fiscal year.
A total of twelve office visits allowed per state fiscal year for any combination of the following: certified nurse
midwife, physician, medical services provided by a dentist, medical services furnished by an optometrist, and
Rural Health Clinics.
One basic family planning visit and three (3) periodic family planning visits per state fiscal year. Family planning
visits are not counted toward other service limitations.
ARKANSAS DHS STATISTICAL REPORT
SERVICES COVERED BY ARKANSAS MEDICAID
SFY 2010
DMS-15

QA Activities include:
*
*
*
*
*
*
*
*
*
*
*
*
*
*
*
*
Monitors the use and security of Arkansas Medicaid data used or accessed by DHS business
associates and other outside entities.
Researches IT security issues, and coordinates IT security compliance and related issues with the
DHS HIPPA Security Officer, EDS Privacy Officer, and the DHS Office of Systems and Technology.
Manages DMS SharePoint sites and Portals.
Leading development of new waivers and demonstrations.
Communicating and coordinating with CMS regarding waiver and demonstration activities and
requirements, including the required renewal process.Providing technical assistance to operating agencies regarding waiver and demonstration
requirements and compliance.
Develops and administers the contract for the fiscal agent to operate the MMIS and monitors the
contractor's performance.
Maintains system documentation from the contractor.
Develops and produces reports from the Medicaid data warehouse.
Systems & Support performs the following:
Source: Division of Medical Services
ARKANSAS DHS STATISTICAL REPORT
SFY 2010
MEDICAID PROGRAM DEVELOPMENT UNIT (FORMERLY PROGRAM PLANNING AND DEVELOPMENT
Formerly two separate units, the Program Planning and Development (PPD) Section and the Waiver Quality
Assurance units have been combined. The new MPD Unit will develop and maintain the Medicaid State Plan and
the State's Child Health Insurance Program Plan, lead the development and research of new programs, oversee
contractor technical writing of provider policy manuals for each one of the different Medicaid programs,
coordinate the approval process through both State and Federal requirements, and coordinate efforts in
finalizing covered program services, benefit extension procedures and claims processing. The MPD Unit also
leads development of new waiver and demonstration programs and the resulting provider manuals. Because
DMS has administrative and financial authority for all Medicaid waivers and demonstrations, MPD is responsible
for monitoring operation of all Medicaid waivers and demonstration programs operated by other Divisions. MPD
assures compliance with CMS requirements for operating waivers and demonstrations and monitors for key
quality requirements.
SYSTEMS AND SUPPORT
Systems & Support administers the fiscal agent contract that operates the Medicaid Management Information
System (MMIS), which processes all Medicaid claims.
Develops all Request for Proposals (RFPs) and Advance Planning Documents (APDs) related to the
MMIS.
Performing case reviews, data analysis, and oversight activities to help identify problems and assure
remediation for compliance with CMS requirements.Developing QA strategies and interagency agreements for the operation and administration of
waivers and demonstrations.
Manages and monitors access to the Medicaid data warehouse.
SERVICES COVERED BY ARKANSAS MEDICAID
Develops, tracks, and documents customer service requests for modifications to the MMIS.
Approves production system modifications to MMIS.
Performs quality assurance reviews on all edits and audits affecting claims processed by the MMIS.
AND WAIVER QUALITY ASSURANCE)
DMS-16
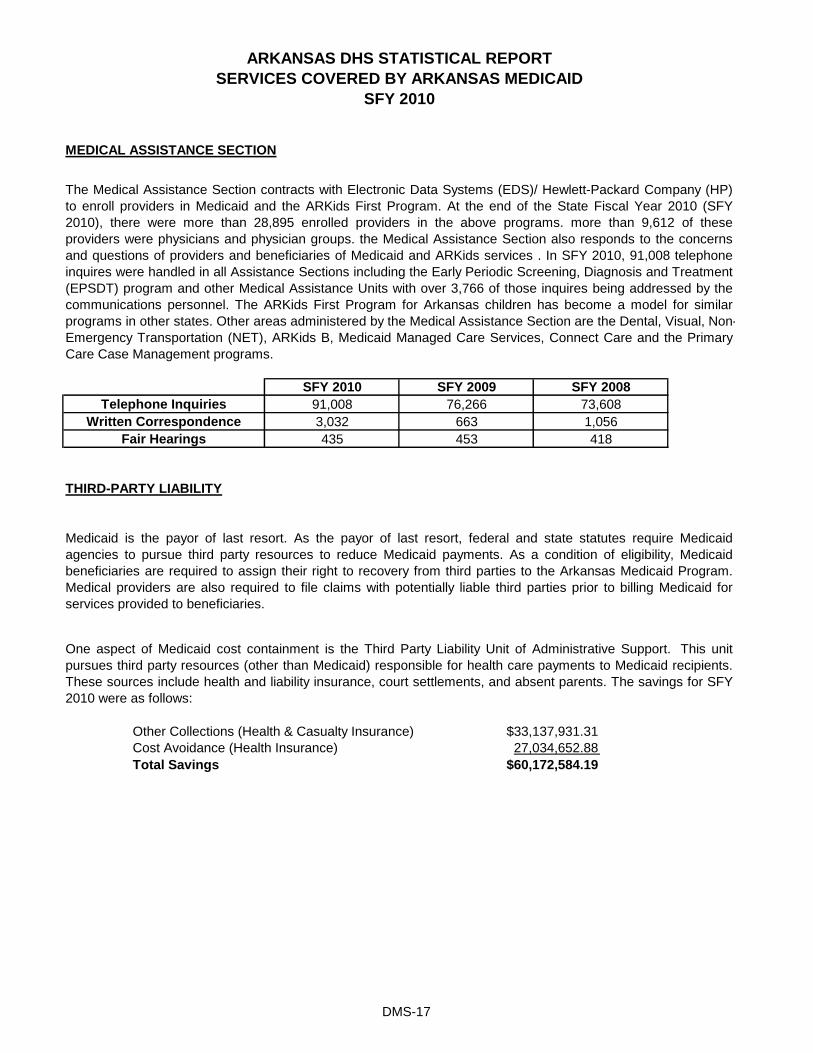
One aspect of Medicaid cost containment is the Third Party Liability Unit of Administrative Support. This unit
pursues third party resources (other than Medicaid) responsible for health care payments to Medicaid recipients.
These sources include health and liability insurance, court settlements, and absent parents. The savings for SFY
2010 were as follows:
Other Collections (Health & Casualty Insurance) $33,137,931.31
Cost Avoidance (Health Insurance) 27,034,652.88
Total Savings $60,172,584.19
ARKANSAS DHS STATISTICAL REPORT
SERVICES COVERED BY ARKANSAS MEDICAID
SFY 2010
THIRD-PARTY LIABILITY
Medicaid is the payor of last resort. As the payor of last resort, federal and state statutes require Medicaid
agencies to pursue third party resources to reduce Medicaid payments. As a condition of eligibility, Medicaid
beneficiaries are required to assign their right to recovery from third parties to the Arkansas Medicaid Program.
Medical providers are also required to file claims with potentially liable third parties prior to billing Medicaid for
services provided to beneficiaries.
The Medical Assistance Section contracts with Electronic Data Systems (EDS)/ Hewlett-Packard Company (HP)
to enroll providers in Medicaid and the ARKids First Program. At the end of the State Fiscal Year 2010 (SFY
2010), there were more than 28,895 enrolled providers in the above programs. more than 9,612 of these
providers were physicians and physician groups. the Medical Assistance Section also responds to the concerns
and questions of providers and beneficiaries of Medicaid and ARKids services . In SFY 2010, 91,008 telephone
inquires were handled in all Assistance Sections including the Early Periodic Screening, Diagnosis and Treatment
(EPSDT) program and other Medical Assistance Units with over 3,766 of those inquires being addressed by the
communications personnel. The ARKids First Program for Arkansas children has become a model for similar
programs in other states. Other areas administered by the Medical Assistance Section are the Dental, Visual, Non-
Emergency Transportation (NET), ARKids B, Medicaid Managed Care Services, Connect Care and the Primary
Care Case Management programs.
MEDICAL ASSISTANCE SECTION
SFY 2010 SFY 2009 SFY 2008
Fair Hearings 435 453 418
Telephone Inquiries 91,008 76,266 73,608
Written Correspondence 3,032 663 1,056
DMS-17

1.
2.
3.
4.
Source: Division of Medical Services
177
212
31
34
Fair Hearings Held
Patient Travel Dollars
Companion Travel Dollars
88
$10,068.30
$10,620.90
Fair Hearings Requests
Patient Travel Requests
Companion Travel Requested
ARKANSAS DHS ANNUAL STATISTICAL REPORT
SERVICES COVERED BY ARKANSAS MEDICAID
SFY 2010UTILIZATION REVIEW
The Utilization Review (UR) Section of the Arkansas Medicaid Program provides professional medical utilization
reviews for a wide variety of services in a timely, accurate, efficient and cost effective manner. Medicaid UR
participates in the development of clinically based standard of care coverage determinations and serves as a
resource to Arkansas Medicaid providers. UR has a responsibility for assuring quality medical care to Arkansas
Medicaid beneficiaries through detection and reporting of quality of care concerns to appropriate bodies in
addition to protecting the integrity of state and federal funds supporting the Medicaid Program.
Utilization Review provides professional reviews for:
Prior Authorization for Private Duty Nursing, Hearing Aids and Hearing Aid Repair, Extension of
Benefits for Home Health and Personal Care for Beneficiaries Over the Age of 21. Medical Supplies
and Incontinence Products.
Monitor Contractors Performing Prior Authorizations and Extension of Benefits for the following
programs: In-patient Psychiatric Services, In-patient and Out-patient Hospitalization, Emergency
Room Utilization, Personal Care for Beneficiaries Under the Age of 21, Child Health Management
Services, Therapy, RSPMI, Transplants, Durable Medical Equipment and Hyperalimentation Services.
Arrange Out-of-State Transportation for Beneficiaries for Medically Necessary Services/Treatment Not
Available In-State.
SUMMARY
Pre and Post-Payment Reviews of Medical Services.
36,140
63
11
4,288
Pre-Pay Claim Adjustments
Organ Transplant Dollar
Expended
323
$6,690,523.01
1,139
213
488
98 81
Prior Authorization Denials:
3972
6
803
159
Extension of Benefits Denials:
36
104
80
99
Prior Authorization Approvals:
6,163
Organ Transplant Paid to
Date
Personal Care Over 21
Independent Choice
Home Health
Incontinent Supplies
Medical Supplies Under 21
Pre-Pay Claim Reviews
Organ Transplant Requests
1,692
2,397
807
Extension of Benefits Approvals:
71
Explanation of Medical
Benefits (EOMB) Processed
PCP Changes Requested and
Processed
Durable Medical Equipment
Hyperalimentation
Private Duty Nursing
Hearing Aid Repairs
DMS-18

Source: Prescription Drug Program Unit
Medicaid reimbursement for prescription drugs is based on cost plus a dispensing fee. Drug costs are established
and based upon a pharmacy's estimated acquisition cost (EAC), the federally established generic upper limit (GUL)
or state established upper limit (SUL). Arkansas Medicaid has a dispensing fee $5.51 as established by the Division
of Medical Services and approved by the Centers for Medicare and Medicaid (CMS). The EAC and dispensing fee
are based upon surveys that determine an average cost for dispensing a prescription and the average ingredient
cost. In March of 2002, a differential fee of $2.00 was established and applied to generic prescriptions for which
there is not an upper limit.
The Prescription Drug Program, which is an optional Medicaid benefit, was implemented in Arkansas in 1973.
Under this program, eligible recipients may obtain prescription medication through any of the 838 enrolled
pharmacies in the state. During SFY 2010, a total of 449,381 Medicaid recipients used their prescription drug
benefits. A total of 4.9 million prescriptions were reimbursed by Arkansas Medicaid for cost of $312.0 million dollars
thus making the average cost per prescription approximately $63.67. An average cost for a brand name
prescription was $186 dollars, although representing 25% of the claims it accounted for 72% of our expenditures.
The average cost for a generic prescription was $24 dollars, representing 75% of our claims and accounted for 28%
of our expenditures.
The Prescription Drug Program restricts each recipient to a maximum of three prescriptions per month, with the
capability of getting up to six prescriptions by prior authorization, except for recipients under 21 and certified Long-
Term Care recipients who receive unlimited prescriptions per month. Persons eligible under the Assisted Living
Waiver are allowed up to nine prescriptions per month.
Beginning January 1, 2006, full benefit dual eligibles began to receive drug coverage through the Medicare
Prescription Drug Benefit (Part D) of the Medicare Modernization Act of 2003 rather than through Arkansas
Medicaid. Arkansas Medicaid is required to pay Centers for Medicare & Medicaid (CMS) the State Contribution for
Prescription Drug Benefit, sometimes referred to as the Medicare Part D Clawback. This payment for SFY 2010
was $25,977,235.
ARKANSAS DHS STATISTICAL REPORT
PRESCRIPTION DRUG PROGRAM
SFY 2010
DMS-19

Source: Prescription Drug Program Unit
ARKANSAS DHS STATISTICAL REPORT
PRESCRIPTION DRUG PROGRAM
SFY 2010
$45.65
$49.31 $50.42
$56.77$61.80
$63.87 $65.72
68.6171.24
63.67
$0.00
$10.00
$20.00
$30.00
$40.00
$50.00
$60.00
$70.00
$80.00
2001 2002 2003 2004 2005 2006 2007 2008 2009 2010
AV
ER
AG
E C
OS
T
STATE FISCAL YEAR
AVERAGE COST PER PRESCRIPTION DRUG SFY 2001-2010
DMS-20

Complaint Line 1-800-582-4887
ARKANSAS DHS STATISTICAL REPORT
OFFICE OF LONG TERM CARE
SFY 2010
Most people think of nursing facilities when they think of the Office of Long Term Care (OLTC). The OLTC
professional surveyors conduct annual Medicare and Medicaid and State Licensure surveys of Arkansas’ 227
Nursing Facilities and in the state’s forty-one (41) Intermediate Care Facilities for the Mentally Retarded (ICFs/MR)
including six (6) Human Development Centers. Annual and complaint surveys are also conducted in thirty-six (36)
Adult Day Care and Adult Day Health Care facilities and one (1) Post Acute Head Injury Facility throughout the state.
Semi-annual surveys are conducted in the seventy-seven (77) Residential Care Facilities, fifty-five (55) Assisted
Living Facilities and twenty-two (22) Alzheimer’s Special Care Units. In addition, annual Civil Rights surveys were
conducted in 111 hospitals, as well as 91 face-to-face medical need determination visits were made throughout the
state.
In addition to its role inspecting long-term care facilities, the OLTC provides training and educational opportunities to
various health care providers to help ensure that facilities provide the highest level of care possible to long term care
residents. OLTC staff provided approximately 256 hours of continuing education through ninety-five (95)
workshops/seminars to over 3,863 staff members in the nursing home and assisted living industry during SFY 2010.
In addition, there were 403 agendas submitted from outside sources for review to determine 1,990 contact hours for
nursing home administrators.
The Nursing Home Administrator Licensure Unit processed renewals for 650 licensed administrators, processed
eighty-three (83) license applications, and issued seventy-four (74) new licenses and 8 temporary licenses. In
addition, OLTC administered the state nursing home administrator examination to seventy-nine (79) individuals.
The Criminal Record Check Program applies to all categories of licensed long-term care facilities consisting of over
511 affected facilities. During SFY 2010, there were 35,137 "state" record checks processed through OLTC with 957
disqualifications (2.7%) and 18,232 "federal" record checks processed with 192 disqualifications (1.6%).
At the end of SFY 2010, the Registry for Certified Nursing Assistants (CNAs) contained 28,840 "active" and 60,685
"inactive" names listed. In addition to maintaining the Registry for CNAs, the OLTC also manages the certification
renewal process for CNAs, approves and monitors nursing assistant training programs, manages the statewide
competency testing services, and processes reciprocity transfers of CNAs coming into and leaving Arkansas.
The Medical Need Determination Unit processed approximately 1,238 Medicaid nursing facility applications per
month while maintaining approximately 12,692 active cases which includes processing 10,602 assessments,
processing over 1,833 changes of condition requests, 564 transfers, and 1,861 utilization review requests during the
year. Also processed were 3,328 applications/reviews for ICFs/MR. In addition, over 13,800
applications/reviews/waivers for other medical programs within DHS were made during SFY 2010.
The OLTC Complaint Unit staffs a registered nurse and a licensed social worker who record the initial intake of
complaints against long-term care facilities. Many times they are able to resolve the issues with immediate
satisfaction to the parties involved. When that is not possible, the OLTC performs an on-site complaint investigation.
The OLTC received 881 nursing home complaints during SFY 2010 regarding the care or conditions in long term
care facilities.
Office of Long Term Care (501) 682-8430
DMS-21

Native Spanish Asian Un- Un-
White Black Amer. Amer. Amer. Other known Total Male Female known Total
Arkansas 137 67 0 0 0 0 83 287 81 206 0 287
Ashley 58 33 0 2 0 0 39 132 31 101 0 132
Baxter 218 0 0 1 0 1 179 399 136 263 0 399
Benton 401 5 0 1 0 4 316 727 181 546 0 727
Boone 228 0 0 0 0 0 135 363 94 269 0 363
Bradley 122 47 0 3 1 0 32 205 92 113 0 205
Calhoun 0 0 0 0 0 0 0 0 0 0 0 0
Carroll 92 0 0 0 0 0 58 150 34 116 0 150
Chicot 41 81 0 0 0 1 35 158 63 95 0 158
Clark 186 106 0 0 0 5 91 388 165 223 0 388
Clay 105 0 0 0 0 0 42 147 41 106 0 147
Cleburne 132 1 0 0 0 0 73 206 60 146 0 206
Cleveland 31 9 0 0 0 0 24 64 23 41 0 64
Columbia 93 68 0 1 1 0 100 263 82 181 0 263
Conway 117 20 0 0 0 1 59 197 66 131 0 197
Craighead 501 71 1 3 0 5 252 833 273 560 0 833
Crawford 271 8 0 0 0 2 159 440 131 309 0 440
Crittenden 140 124 0 0 0 2 138 404 149 255 0 404
Cross 128 57 0 0 2 0 75 262 95 167 0 262
Dallas 103 69 0 3 0 2 76 253 156 97 0 253
Desha 76 95 0 0 0 0 48 219 78 141 0 219
Drew 77 39 0 0 0 0 27 143 52 91 0 143
Faulkner 661 113 1 1 1 1 225 1,003 431 572 0 1,003
Franklin 175 2 0 0 0 1 77 255 80 175 0 255
Fulton 42 0 0 0 0 1 28 71 23 48 0 71
Garland 378 54 0 0 0 3 288 723 223 500 0 723
Grant 44 2 0 0 0 0 25 71 22 49 0 71
Greene 225 1 0 1 0 1 90 318 76 242 0 318
Hempstead 93 64 0 0 0 2 64 223 81 142 0 223
Hot Spring 138 31 0 0 0 1 84 254 88 166 0 254
Howard 92 38 0 0 0 2 60 192 63 129 0 192
Independence 253 7 0 1 0 2 128 391 121 270 0 391
Izard 106 0 0 1 0 1 60 168 56 112 0 168
Jackson 95 28 0 0 0 0 55 178 62 116 0 178
Jefferson 148 250 0 1 0 2 169 570 192 378 0 570
Johnson 109 3 0 1 0 0 41 154 43 111 0 154
Lafayette 22 24 0 0 0 0 19 65 27 38 0 65
Lawrence 193 2 0 1 0 2 85 283 84 199 0 283
Lee 34 65 0 0 0 0 24 123 55 68 0 123
Lincoln 80 28 0 0 0 1 63 172 66 106 0 172
ARKANSAS DHS STATISTICAL REPORT
UNDUPLICATED LONG-TERM CARE CLIENTS *
BY GENDER AND RACE
SFY 2010
RACE GENDER
County
DMS-22

Native Spanish Asian Un- Un-
White Black Amer. Amer. Amer. Other known Total Male Female known Total
Little River 132 20 1 0 0 0 87 240 56 184 0 240
Logan 207 22 1 0 0 2 39 271 136 135 0 271
Lonoke 378 77 0 3 2 1 237 698 207 491 0 698
Madison 48 0 0 0 0 0 26 74 23 51 0 74
Marion 102 0 0 0 0 1 53 156 41 115 0 156
Miller 183 85 0 0 2 3 170 443 165 278 0 443
Mississippi 129 70 0 0 1 3 68 271 97 174 0 271
Monroe 0 0 0 0 0 0 0 0 0 0 0 0
Montgomery 55 0 0 0 0 0 51 106 22 84 0 106
Nevada 65 45 0 0 0 1 38 149 56 93 0 149
Newton 45 0 0 0 0 1 22 68 16 52 0 68
Ouachita 157 119 0 0 0 0 111 387 121 266 0 387
Perry 46 1 0 0 0 0 36 83 21 62 0 83
Phillips 64 106 0 0 0 1 64 235 95 140 0 235
Pike 77 4 0 0 0 0 37 118 28 90 0 118
Poinsett 177 41 0 0 0 0 102 320 129 191 0 320
Polk 91 1 0 1 0 0 44 137 38 99 0 137
Pope 241 3 0 0 0 0 114 358 84 274 0 358
Prairie 508 618 0 4 5 11 619 1,765 571 1194 0 1,765
Pulaski-East 35 18 0 0 1 1 44 99 31 68 0 99
Pulaski-Jax 20 4 0 0 1 0 0 25 7 18 0 25
Pulaski-North 132 42 1 1 0 0 104 280 77 203 0 280
Pulaski-South 50 46 0 0 1 0 64 161 45 116 0 161
Pulaski-SW 33 16 0 1 0 3 22 75 37 38 0 75
Randolph 183 0 0 1 0 0 60 244 66 178 0 244
Saline 546 141 2 5 2 2 231 929 456 473 0 929
Scott 45 0 0 0 0 0 28 73 23 50 0 73
Searcy 50 0 0 0 0 0 17 67 19 48 0 67
Sebastian 435 37 1 4 6 8 314 805 253 552 0 805
Sevier 60 2 1 0 0 1 60 124 31 93 0 124
Sharp 133 1 0 0 0 0 89 223 75 148 0 223
St. Francis 89 67 0 0 0 0 45 201 49 152 0 201
Stone 49 0 0 0 0 0 26 75 17 58 0 75
Union 212 131 0 1 0 1 128 473 143 330 0 473
Van Buren 108 1 0 0 0 0 50 159 37 122 0 159
Washington 451 7 2 2 1 4 344 811 245 566 0 811
White 319 17 1 0 1 2 202 542 179 363 0 542
Woodruff 63 24 0 0 0 0 26 113 41 72 0 113
Yell 181 2 1 1 0 1 89 275 73 202 0 275
State Total 12,044 3,380 13 45 28 90 7,487 23,087 0 7,686 15,401 0 23,087
County
* Unduplicated clients by facility. Duplication may result where the facility number changes to reflect change of ownership.
Source: HMRJ-460J
ARKANSAS DHS STATISTICAL REPORT
UNDUPLICATED LONG-TERM CARE CLIENTS *
BY GENDER AND RACE
SFY 2010
RACE GENDER
DMS-23

Public
Private
Source: HMVR-258J
Conway Human Development Center
Since 1990, the federal long-term care program has had two levels of facility care under Medicaid. These
levels of care are nursing facility services and intermediate care facility services for the mentally retarded
and developmentally disabled (ICF/MR). Arkansas classifies state-owned facilities as public and all others
as private. Arkansas Health Center is a public nursing facility. The ICF/MR population is divided into the six
(6) state-owned Human Development Centers, four (4) private pediatric facilities of which three (3) are for
profit, one (1) private nonprofit pediatric facility, and 31 fifteen-bed or less facilities serving adults.
ARKANSAS DHS STATISTICAL REPORT
LONG-TERM CARE MEDICAID PROGRAM
SERVICES AND STATISTICS
SFY 2010
NURSING FACILITIES ICF/MR
Arkansas Health Center Nursing Facility (formerly
Benton Services Center)
Alexander Human Development Center
Arkadelphia Human Development Center
Booneville Human Development Center
Private Nonprofit ICF/MR Pediatric:
Jonesboro Human Development Center
Warren Human Development Center
Private Nursing Homes (226) Private ICF/MR Pediatric facilities:
(For Profit and Nonprofit) Arkansas Pediatric
Brownwood
Millcreek
Total pages of copies 271,530
Staff man-hours required 2,880
Easter Seals
Private Nonprofit ICF/MR:
15 Bed or Less Facilities for Adults (31)
FOI requests processed 473
FREEDOM OF INFORMATION (FOI) REQUESTS
SFY 2010
DMS-24

NO. OF TOTAL TOTAL **
FACIL. BEDS RECIPIENTS
221 23,848 18,009
1 310 306
4 204 243
31 322 350
6 1,165 1,105
Total Medicaid 263 25,849 20,013
Non-Medicaid
NF Medicare 1 70
NF Private 3 244
Total Non-Medicaid 4 314
Total 267 26,163
Private NF 4,351,968 $558,826,018 $128 $31,030
Arkansas Health Care 93,789 36,627,967 391 119,699
Human Development Centers
ICF/MR386,871 115,270,365 298 104,317
Private ICF/MR - Over 15 beds 73,621 21,454,486 291 88,290Private ICF/MR - 15 beds or
less114,581 22,562,087 197 64,463
TOTAL 5,020,830 $754,740,923
AVERAGE WEIGHTED
RATE BY FACILITY TYPE
**Recipients reflect unduplicated count
of persons residing in specified
facilities during July 1, 2009-June 30,
2010
ARKANSAS DHS STATISTICAL REPORT
MEDICAID LONG-TERM CARE FACILITY PROGRAM STATISTICS
SFY 2010
DISTRIBUTION OF PATIENTS BY LEVEL OF CARE WITH PER DIEM RATES
149.79
411.14
293.58
198.95
316.57
Over 15 beds
Private Adult
15 beds & Under
HDC
FACILITY
TYPE
Nursing Facilities
Private Nursing Facilities
Public-AHC
ICF/MR Facilities
Private Pediatric
PATIENT
DAYS EXPENDITURES
AVERAGE
DAILY
PAYMENTS
AVG. ANNUAL
PAYMENTS PER
INDIVIDUAL
CASH EXPENDITURES FOR LTC FACILITIES
FACILITY CLASS
DMS-25

Source: DSS Report
ARKANSAS DHS STATISTICAL REPORT
LTC MEDICAID EXPENDITURES
SFY 2010
ARKANSAS DHS STATISTICAL REPORT
LTC MEDICAID RECIPIENTS
SFY 2010
ICF/MR$159,286,938
21%
Private NF$558,826,018
74%
AHC$36,627,967
5%
ICF/MR1,6988%
Private NF18,00990%
AHC3062%
DMS-26
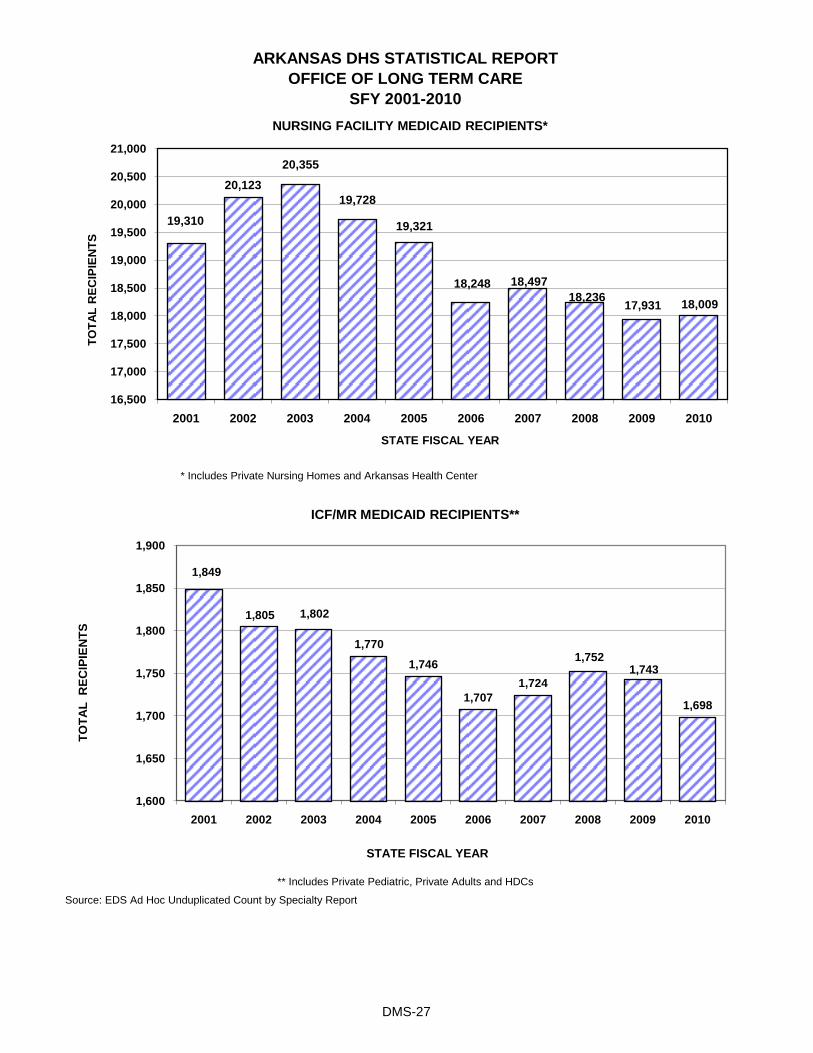
Source: EDS Ad Hoc Unduplicated Count by Specialty Report
* Includes Private Nursing Homes and Arkansas Health Center
** Includes Private Pediatric, Private Adults and HDCs
ARKANSAS DHS STATISTICAL REPORT
SFY 2001-2010
OFFICE OF LONG TERM CARE
1,849
1,805 1,802
1,770
1,746
1,707
1,724
1,7521,743
1,698
1,600
1,650
1,700
1,750
1,800
1,850
1,900
2001 2002 2003 2004 2005 2006 2007 2008 2009 2010
TO
TA
L
RE
CIP
IEN
TS
STATE FISCAL YEAR
ICF/MR MEDICAID RECIPIENTS**
19,310
20,123
20,355
19,728
19,321
18,248 18,497
18,23617,931 18,009
16,500
17,000
17,500
18,000
18,500
19,000
19,500
20,000
20,500
21,000
2001 2002 2003 2004 2005 2006 2007 2008 2009 2010
TO
TA
L R
EC
IPIE
NT
S
STATE FISCAL YEAR
NURSING FACILITY MEDICAID RECIPIENTS*
DMS-27

Source: AFGM Report R-2242
ARKANSAS DHS STATISTICAL REPORT
OFFICE OF LONG TERM CARE
SFY 2010
$302.4
$382.9$411.2
$444.7 $443.9
$487.3$501.2
$521.3$537.4 $558.8
$0
$100
$200
$300
$400
$500
$600
2001 2002 2003 2004 2005 2006 2007 2008 2009 2010
EX
PE
ND
ITU
RE
S
STATE FISCAL YEAR
PRIVATE NURSING FACILITY EXPENDITURESSFY 2001-2010
MILLIONS
5
$558.83
$36.63
$115.27
$21.45 $22.56
$0.00
$100.00
$200.00
$300.00
$400.00
$500.00
$600.00
Private NF Arkansas Health Care AHC NF
Human Development Centers HDCS
ICF/MR
Private ICF/MR Over 15 beds
Private ICF/MR 15 beds or less
LTC FACILITY EXPENDITURES IN MILLIONS
DMS-28

ARKANSAS DHS STATISTICAL REPORT
SFY 2001-2010
Source: AFGM Report R-2242
OFFICE OF LONG TERM CARE
$21.26 $22.79
$23.81$26.89
$24.36
$30.52 $31.68
$33.16 $34.31$36.63
$0
$5
$10
$15
$20
$25
$30
$35
$40
2001 2002 2003 2004 2005 2006 2007 2008 2009 2010
FA
CIL
ITY
E
XP
EN
DIT
UR
ES
STATE FISCAL YEAR
ARKANSAS HEALTH CENTER
MILLIONS
$85.51 $87.46 $86.79
$95.83$102.99 $100.46
$104.57 $110.26$104.84
$115.27
$0
$20
$40
$60
$80
$100
$120
$140
2001 2002 2003 2004 2005 2006 2007 2008 2009 2010
ICF
/MR
FA
CIL
ITY
E
XP
EN
DIT
UR
ES
STATE FISCAL YEAR
HUMAN DEVELOPMENT CENTERSMILLIONS
DMS-29

BAR CHART 1 BAR CHART 2
ARKANSAS DHS STATISTICAL REPORT
SFY 2001-2010
Source: AFGM Report R-2242
OFFICE OF LONG TERM CARE
$16.69 $17.15 $17.31 $18.07$16.96
$17.74$18.64
$19.18 $19.83
$21.45
$0
$5
$10
$15
$20
$25
2001 2002 2003 2004 2005 2006 2007 2008 2009 2010
EX
PE
ND
ITU
RE
S
Millions
STATE FISCAL YEAR
PRIVATE ICF/MR FACILITY EXPENDITURES (OVER 15 BEDS)
$15.43$15.84 $16.21 $17.11 $16.86
$17.66
$20.00
$18.40 $18.47
$22.56
$0
$5
$10
$15
$20
$25
2001 2002 2003 2004 2005 2006 2007 2008 2009 2010
EX
PE
ND
ITU
RE
S
Millions
STATE FISCAL YEAR
PRIVATE ICF/MR FACILITY EXPENDITURES(15 BEDS OR LESS "ADULTS")
DMS-30

Source: HMVR-258J, EDS Unduplicated Count Specialty Report and UALR Institute for Economic Advancement
Since approximately 74% of all Medicaid long-term facility care is provided in private nursing facilities, additional
information is provided for this service category. Expenditures in SFY 2010 increased 3.98% from SFY 2009 with an
increase of 14.67% over the past five (5) years.
ARKANSAS DHS STATISTICAL REPORT
ANALYSIS OF PRIVATE FACILITY EXPENDITURES
SFY 2010
UTILIZATION CONTROL AND NURSING FACILITY PAYMENT
CLASSIFICATIONS
The number of Medicaid recipients in nursing facilities has increased by 0.45% in the past five (5) years, while the
estimated over-age-85 population has increased by approximately 5.6% during the same period. With the continued
expansion of home and community based programs, those whose needs can be met in their own homes will
continue to choose that option.
The bulk of this increase is the result of the implementation of a cost based reimbursement methodology for nursing
facilities that began January 12, 2001. The cost base methodology increased emphasis in spending in the direct
care area. Increased quality of care was one of the major objectives of the new methodology.
54.0555.25 56.14 57.12 57.09
23.79 23.91 24.00 24.07 23.85
17.9318.17 17.90 17.93 18.01
0
10
20
30
40
50
60
2006 2007 2008 2009 2010
IN T
HO
US
AN
DS
GROWTH OF PRIVATE NURSING FACILITY BEDS AND MEDICAID RECIPIENTS (SFY 2006-2010)
85+ Population Private NF Beds Medicaid Recipients
DMS-31

276 2
Initial Medicaid Surveys Conducted 5
State Licensure Surveys Conducted 260
State Audits for Minimum Staffing 19
Facilities Cited with Substandard Quality of Care 88
Complaint Reports Received 881
Complaint Surveys Conducted 835 *
Complaint Surveys on Private Pay Facilities 11
Standard Surveys Performed 376
Standard Follow Up Surveys 225
Life Safety Code Surveys 306
Life Safety Code Follow Ups 130
Complaint Reports Received 131
Complaint Surveys Completed 109
Complaint Surveys of Unlicensed Facilities 8
Source: HMVR-258J and EDS Unduplicated Count Specialty Report
Some complaints cross fiscal year timelines of reporting and investigation.
RCF/ADC/ADHC/PAHI/ALF I/ALF II/HCR
NURSING HOMES
Standard Surveys Performed New facilities Licensed/Certified
ARKANSAS DHS STATISTICAL REPORT
SURVEY & CERTIFICATION
SFY 2010
OFFICE OF LONG TERM CARE
*Includes cases of multiple complaints investigated during a single survey.
DMS-32

Source: HMVR-258J
ARKANSAS DHS STATISTICAL REPORT
26,243
25,753
24,908
24,413 24,457
24,70724,628
24,73324,775
24,472
23,000
23,500
24,000
24,500
25,000
25,500
26,000
26,500
2001 2002 2003 2004 2005 2006 2007 2008 2009 2010
TO
TA
L N
UR
SIN
G
FA
CIL
ITY
BE
DS
STATE FISCAL YEAR
LICENSED NURSING FACILITY BEDS SFY 2001-2010
1,517 1,517 1,4721,361 1,361 1,361 1,361 1,369 1,369 1,369
300 300 315322 322 322 322 322 322 322
0
200
400
600
800
1,000
1,200
1,400
1,600
1,800
2,000
2001 2002 2003 2004 2005 2006 2007 2008 2009 2010
TO
TA
L I
CF
/MR
BE
DS
STATE FISCAL YEAR
LICENSED ICF/MR BEDS SFY 2001-2010
OVER 15-BED FACILITY 15 BED & UNDER FACILITY
DMS-33

* Does not include one (1) post acute head injury Residential Care Facility with sixty (60) beds.
Source: Residential Care Licensure Section
* Drastic decrease number of beds because some facilities closed and most converted to assisted
living.
ARKANSAS DHS STATISTICAL REPORT
4,800 4,681
4,457 4,267
3,805 3,728 3,717
3,2233,124
2,972
0
1,000
2,000
3,000
4,000
5,000
6,000
2001 2002 2003 2004 2005 2006 2007 2008 2009 2010
TO
TA
L R
ES
IDE
NT
IAL
CA
RE
BE
DS
STATE FISCAL YEAR
RESIDENTIAL CARE BEDS* SFY 2001-2010
124 121 118
108
98 94 93
8179 77
0
20
40
60
80
100
120
140
2001 2002 2003 2004 2005 2006 2007 2008 2009 2010
TO
TA
L R
ES
IDE
NT
IAL
C
AR
E F
AC
ILIT
IES
STATE FISCAL YEAR
RESIDENTIAL CARE FACILITIES* SFY 2001-2010
DMS-34

Source: Adult Day Care Licensure Section
ARKANSAS DHS STATISTICAL REPORT
29
36
27 2631 31
2522
2725
9
5
7 11
10 10
9
10
1011
0
5
10
15
20
25
30
35
40
45
2001 2002 2003 2004 2005 2006 2007 2008 2009 2010
FA
CIL
ITIE
S
STATE FISCAL YEAR
ADULT DAY CARE FACILITIES SFY 2001-2010
ADULT DAY HEALTH-CARE CENTER ADULT DAY-CARE CENTER
541625 643
578
715 715611
534 559 527
209122
164 253
223 223
188
183178
197
0
100
200
300
400
500
600
700
800
900
1,000
2001 2002 2003 2004 2005 2006 2007 2008 2009 2010
FA
CIL
ITY
SL
OT
S
STATE FISCAL YEAR
ADULT DAY CARE FACILITY SLOTS SFY 2001-2010
ADULT DAY HEALTH-CARE CENTER ADULT DAY-CARE CENTER
DMS-35


●
●
●
●
●
●
●
●
●
ARKANSAS DHS STATISTICAL REPORT
DIVISION OF VOLUNTEERISM
SFY 2010
The Arkansas Office of Volunteerism was created in 1974 by order of Governor Bumpers to implement and
administer a statewide immunization program. In 1977, the Office was established by Act 865 to assess and
recognize the needs of communities throughout Arkansas and train volunteer coordinators and volunteer
organizations in meeting those needs. The division also continues to assist in special projects to meet community
needs and to provide greater public awareness and recognition of volunteer efforts. In 1983, the Office of Volunteer
Services transferred from the Office of the Governor to the Department of Human Services (DHS). AR Code 25-16-
206 officially made the agency a Division of DHS. The mission of the Division of Volunteerism (DOV) is to
promote and support volunteering and national service in Arkansas. AR Code 25-10-128 (Act 1259 of 1997)
expanded the duties of the Division of Volunteerism (DOV) to include assistance to any agency or community
organization with welfare reform initiatives.
395
1,187
2,294
Youth Volunteer Hours 5,766
Youth Projects
Youth Participants Served
Adult Volunteer Hours
Faith Based & Community Organizations
Grant Station Research 41
1,145
8,859
In partnership with the Arkansas State Board of Education, this act provides an opportunity for students in grades
nine through twelve to perform volunteer service at sites that have applied to and have been sanctioned by the
Arkansas State Board of Education. Students may then earn an extra credit toward graduation upon completion of
seventy-five or more volunteer hours. There are 786 approved community sites across the state where student
volunteers are engaged in service. DOV is the main point of contact for technical assistance and training as well as
record keeping for Act 648 school programs.
Adults Engaged
The Economic Impact of Arkansas Volunteers:
Each year DOV publishes the study “THE ECONOMIC IMPACT OF ARKANSAS VOLUNTEERS”. The results of the
most recent study are as follows: Eight hundred thirty-one (831) volunteer organizations reported a total of
23,723,589 hours for an estimated total dollar value of $546,339,180. Had the State of Arkansas paid for the time
involved to provide the services donated by volunteers, an additional $12,608,738,774 in personal income would
have been required to generate that sum in general revenues.
Arkansas’ Promise:
Arkansas’ Promise supports efforts for youth to give back to their communities through the placement of ten full time
AmeriCorps Promise Fellows in communities throughout the state. This year, two additional full time Promise
Fellows were funded through the American Recovery and Reinvestment Act, for a total of twelve. Promise Fellows
activities for the state fiscal year 2010 are listed below.
Community Service Learning Act 648 of 1993:
1,305
Training & Technical Assistance Provided:
Other
Total Attendance
1,231
DOV-1

● ●
● ●
●
SFY 2010
The Arkansas Service Commission (ASC) in the DHS Division of Volunteerism has seventeen governor-appointed
members and a staff of six. Ex officio Commission members from participating state agencies bring the total to
twenty-five. The ASC helps communities, nonprofits, educational organizations and others in Arkansas obtain federal
funds from the Corporation for National and Community Service to administer AmeriCorps programs via competitive,
formula and education award programs to address locally identified issues. Priority areas for funding are education,
health/healthy futures, clean energy/environment, veterans issues and economic opportunity. The commission is
also responsible for monitoring these programs and ensuring complete and timely reports to the funding agency.
Volunteer Centers recruit, refer, and recognize volunteers in their local communities. Volunteer Centers in Arkansas
are in the following locations:
Heart of Arkansas United Way Volunteer Center (Pulaski)
The sub grantees are listed on the next page.
The Summit:
The thirty-fifth state conference on volunteerism, philanthropy and nonprofit leadership was held in Springdale April
29th and 30th, 2010. The partnership of the Division of Volunteerism and Arkansas Community Foundation hosted
over 200 participants. Seventeen workshops were offered during the two-day conference.
Arkansas Service Commission:
Arkansas Volunteer Centers:
United Way of Benton County
Handson Texarkana (Miller)Greater Jonesboro Volunteer Center (Craighead)
Eldorado Connections (Union)
The Arkansas Service Commission helped twelve sub applicants receive $ 2,172,899 in federal funding for
AmeriCorps program in SFY 2010, and an additional $ 775,967 for five American Recovery and Reinvestment Act
programs. Through these funds, 513 Arkansans tutored adults and children, translated and served as advocates for
non-English speaking families in schools, offered parenting education, helped uninsured and underinsured citizens
get cost-free prescription drugs, served as environmental stewards and educators, retrofitted homes of low to middle
income residents for energy efficiency and recruited thousands of traditional volunteers to assist in their efforts.
AmeriCorps members receive a small living allowance during their term of service and an education award for any
Title IV eligible school upon successful completion. The total value of education awards for the year was
approximately $ 1,538,815.
DIVISION OF VOLUNTEERISM
ARKANSAS DHS STATISTICAL REPORT
DOV-2

15RHT*
11QT*
47MT*
Total $2,948,866
58FT
6HT
174FT*
SFY 2010
DIVISION OF VOLUNTEERISM
Kiwanis Camp Pfeifer Alternative Classroom Experience (Pulaski County)
Arkansas' Promise Fellows (Statewide)
Program and Service Area:
MembersCompetitive
ARKANSAS DHS STATISTICAL REPORT
Arkansas Reads/Arkansas Literacy Councils (Statewide)
AmeriCorps Family Outreach-Rogers School District (Rogers, Springdale)
Formula
73HTSEARK Arkansas Smart Start (7 SE Counties)
Arkansas Children's Hospital HIPPY Corps (Statewide)
SEARK Future Teacher Initiative (Statewide) 100HT
United Way of Central Arkansas (Conway)
Total for all programs
10FT
*FT: Full Time (1700 hours), *HT: Half Time (900 hours), *RHT: Reduced Half Time (675 hours), *QT: Quarter Time (450 Hours),
*MT: Minimum Time (300 hours)
5 ARRA Programs
ARRA Competitive
Arkansas' Promise Fellows (LR, Fayetteville) 2FT
5FT
12 Programs Total $2,172,899 260HT
15RHT
11QT
47MT
Total $775,967
266HT*
Education Award Only
Lonoke Primary School (Lonoke)
No-cost Formula
Mid Delta Community Consortium (20 Counties) 40FT
Arkansas Reads/Arkansas Literacy Councils (Statewide) 7FT/6HT
Kiwanis Camp Pfeifer Alternative Classroom Experience (Pulaski County) 4FTWinthrop Rockefeller Institute (Petit Jean Mountain)
William J. Clinton Foundation HEAL AR (Statewide)
13FT/25HT
28FT/10HT
40HT
10FT
10FT
10FT
UALR Children International Next Move Corps (Little Rock) 1HT/15RHT/5QT/17MT
Winthrop Rockefeller Institute (Petit Jean Mountain) 11FT/11HT/6QT/30MT
116FT
24FT
ARRA Formula
DOV-3

●
●
●
●
●
●
●
●
●
●
Arkansas Mentors Program:
The goal of the Arkansas Mentors Program is to help families on public assistance (or in danger of being on public
assistance) become self-sufficient. The strength of the program is the involvement of community volunteers serving
as mentors. The Division of Volunteerism in collaboration with the Division of County Operations and community
leaders began the program in 1991. Over the last nineteen years it has been active in forty-nine counties and is
currently in four counties. Local programs are faith and community based as well as state-run with most being a
partnership of both. DOV provides start-up and on-going training and technical assistance to local programs. The
Division provides limited financial resources to the programs and maintains a monthly tracking system. The system
tracks the number of mentors in each program, the number of mentees, and the number of mentees who are
working.
See table below for SFY 2010 average by county.
14
1,786
Total Clients
302
County
Benton
15
12 24
29Garland
Grant
Total
Greene 249
14 24
Mentees Working
38
Theodoshia Cooper, Little Rock
115
Raul Blasini, Pocahontas
CenterPoint Energy of Arkansas, received the Large Corporate Humanitarian Award
Governor Mike Beebe presented the Distinguished Citizen Award to Freeman McKindra of Little Rock
Stella Lowe, Little Rock
Matt Eckess, Maumelle
The Arkansas Community of the Year Awards:
Reynolds Forestry Consulting and Real Estate PLLC of Magnolia received the Small Corporate Humanitarian
The Governor’s Office, KARK-TV Channel 4 and the Department of Human Services Division of Volunteerism
sponsor an annual awards event to thank Arkansans who have made exceptional contributions of time and services
to serving others. The 2010 Arkansas Community Service Award Winners are as follows:
Mentees
167
Mentors
37
The Division collaborates with the Governor’s Office and the Arkansas Municipal League to present the Volunteer
Community of the Year Awards to twelve communities for outstanding volunteer efforts. The 2009 recipients were
Bella Vista, Benton, Brookland, Clarkridge, Clarksville, Fayetteville, Fort Smith, Heber Springs, Lake City, Maumelle,
Norfolk and Van Buren.
Neta Stamps, Berryville
James Brown, Norphlet
0
The 2010 Arkansas Community Service Award Winners:
2,504
Lorrie Lindemen, Heber Springs
ARKANSAS DHS STATISTICAL REPORT
DIVISION OF VOLUNTEERISM
SFY 2010
50 50204
* This total represents clients served over the life of the local program.
DOV-4

DIVISION OF VOLUNTEERISM
SFY 2010
Certificates Provided
92
ARKANSAS DHS STATISTICAL REPORT
2,993
2,901Certificates
Governor's Letters
Recognition Mail Out:
Special recognition certificates and letters are mailed upon requests from volunteer organizations.
State and Federal Parks Volunteer Program:
DOV provided on-site technical assistance to Pinnacle Mountain, Lake Dardanelle, and Hobbs State Parks on their
volunteer programs.
7,029
Bookmarks Provided
Bookmarks (All)
Source: Division of Volunteerism
Total Certificates Awarded
DOV-5


1.
2.
ARKANSAS DHS STATISTICAL REPORT
DIVISION OF SERVICES FOR THE BLIND
INTRODUCTION
SFY 2010
During the 1940's and early 1950's, rudimentary services for blind people were provided by "home teachers" who
were employed by the Arkansas Department of Welfare. In 1955, services to blind people were transferred to the
Arkansas Rehabilitation Services, then in the Department of Education.
Arkansas Rehabilitation Services for the Blind was created in 1965 by Arkansas Act 180. This Act established a
Division of Rehabilitation Services for the Blind within the State Board for Vocational Education. All services for the
blind were transferred to said Division from the Arkansas Rehabilitation Services.
Act 38 of 1971 transferred the functions, powers, and duties of the Rehabilitation Services for the Blind to the
Department of Social and Rehabilitation Services (now the Department of Human Services) and placed them in the
Division of Rehabilitation Services.
AGENCY HISTORY
Arkansas Act 393 of 1975 amended Arkansas Act 38 of 1971 to require that the functions, powers and duties of the
Rehabilitation Services for the Blind be located within an Office for the Blind and Visually Impaired in the Division of
Rehabilitation Services. Act 393 gave the Office for the Blind and Visually Impaired statutory authority and legal
authority to promulgate rules, and established an Advisory Committee appointed by the Governor.
In 1983, a number of consumer, education, and service organizations identified a critical need for specialized
services to visually impaired and blind Arkansans. In response to this concern, the Governor and Legislature
established the Division of Services for the Blind (DSB) under Act 481. Although previously Arkansas had offered
separate services for blind and visually impaired persons, Act 481 provided that the agency should be governed by a
policy-making board, the majority of whom must be blind persons. Within the past decade, DSB has been
commended for innovative programming, consumer responsiveness, and consistently high performance in the
rehabilitation of severely disabled persons.
DSB functions both as a direct service provider and as a consumer agent in locating and purchasing quality services
(including medical and educational services; equipment or supplies related to self-sufficiency; job placement or
employment services; etc.). All direct services are made available to consumers in their own communities.
DSB serves consumers through three interdependent units: Field Services, Vending Facility Program, and the
DSB Directors Office. These three service units were designed by the DSB Board to offer two advantages to the
State of Arkansas:
Enhance the personal self-sufficiency of consumers eliminating costs associated with unnecessary
skilled care.
Maximize the potential contributions made by consumers as citizens and taxpayers.
DSB-1

1.
2.
3.
ARKANSAS DHS STATISTICAL REPORT
DIVISION OF SERVICES FOR THE BLIND
INTRODUCTION
SFY 2010
PHILOSOPHY AND GOALS
Source: DSB Website
Employment - To assist Arkansans who are blind or visually impaired to secure or maintain
employment and consistent with their skills, abilities, and interests.
Rehabilitation Teaching - To assist Arkansans who are blind or visually impaired to live as
independently as possible through the development of skills, accommodations, or adaptations that
are necessary to perform all activities of daily living.
Prevention of Blindness - To assist in preventing blindness by stabilizing vision, and, where
possible, restoring vision.
The Arkansas Division of Services for the Blind is dedicated to the independence of Arkansans who are blind or
visually impaired and is committed to the principle that these individuals have the right to make informed choices
regarding where they live, where they work, how they participate in the community, and how they interact with
others.
Within the constraints of state and federal laws and based on available funds, the Division of Services for the Blind
fulfils its mission through the following goals:
Our mission is to work in partnership with these Arkansans by assisting them in obtaining the information they need
to make informed choices and by providing them with access to services that increase their opportunities to live as
they choose.
DSB-2

ARKANSAS DHS STATISTICAL REPORT
DIVISION OF SERVICES FOR THE BLIND
SFY 2010
DSB FIELD SERVICES
AGE RANGE14-2122-39
GENDER
FemaleWhiteBlack
722730
RACE
During the 2010 state fiscal year, DSB provided specialized services to blind and visually impaired persons through
two major program units. Field Services offered vocational rehabilitation and independent living services to blind
and severely visually impaired persons in their homes and communities throughout Arkansas. Business and
Technology Services provided assessment of technological and job development needs, then prescribed
equipment and training plans to meet those needs in a rapidly changing job market and business environment. The
DSB Director’s Office supported the programs offered above through supplemental administrative services as well
as operating the Arkansas Information Reading Services for the Blind Network.
Vocational Rehabilitation- The objective of the Vocational Rehabilitation (VR) program is to ensure that qualified
blind and visually impaired persons work in appropriate careers and become as personally and economically
independent as possible. The program assesses consumer needs, plans appropriate services based upon informed
consumer choice, and develops and provides cost-effective services for individuals who are blind or severely visually
impaired. Consumers usually range in age from 14 to 64. The vocational rehabilitation services provided are
consistent with the strengths, resources, priorities, concerns, abilities, capabilities and informed choice of the
disabled individual.
To be eligible for DSB services, the individual must have a visual disability. The visual disability must be a
substantial impediment to employment. It must be determined that the individual with the visual disability can benefit
from vocational rehabilitation services in the achievement of a vocational outcome. Additionally, the individual
requires vocational rehabilitation services to prepare for, engage in, or retain gainful employment. After an individual
is determined eligible for vocational rehabilitation, services are provided. In SFY 2010, DSB served 1,452
vocational rehabilitation consumers, of which 100% were severely disabled. Of this number, 296 blind or
severely visually impaired individuals successfully achieved employment outcomes.
VOCATIONAL REHABILITATION (VR) DEMOGRAPHIC BREAKDOWN
Male 217972418
60-6970+
300390215
3071
1140-4950-59
Other Total 1,452
941
1,45223
1,452
Total
Asian
HispanicIndian
Total
DSB-3

ARKANSAS DHS STATISTICAL REPORT
DIVISION OF SERVICES FOR THE BLIND
GENDER RACE
DSB FIELD SERVICES (CONTINUED)
AGE RANGE
The Older Blind Program provides in-home instructions in the activities of daily living to Arkansans, age 55 and
older, who are blind, severely visually impaired or have a rapidly progressive visual impairment. The program assists
eligible individuals by teaching independent living skills necessary to remain independent in their homes and
communities. DSB, the DHS Division on Aging and Adult Services, and the Division of Health work together to
support the independence of older blind persons within the state. During SFY 2010, DSB served 732 older blind
persons. Of these individuals, 304 successfully completed their rehabilitation plans.
INDEPENDENT LIVING SERVICES FOR OLDER BLIND DEMOGRAPHIC BREAKDOWN
SFY 2010
601 55-60 72Male 203
0122 61-65
WhiteFemaleTotal 732 Hispanic
76
88
529 Black
Indian 4 71-75
During SFY 2010, there were 446 visits made to the Consumer Technology Lab with technology specialists
providing consultation and training to 335 individuals. Additionally, numerous public inquiries were made by
agencies, businesses, and individuals interested in learning more about adaptive equipment for blind and visually
impaired people. The Technology Lab has proven to be valuable in allowing blind individuals to have access to
computers for the purpose of gaining experience in using adaptive equipment.
Other 486+
149Total 732
DSB BUSINESS AND TECHNOLOGY SERVICES
Total
Asian 1
732
Staff Development- This unit is responsible for monitoring agency compliance with federal requirements regarding
the Comprehensive System of Personnel Development mandated under the Federal Rehabilitation Act. It assesses
all staff development needs under federal standards and acquires or provides appropriate training for professional
development and certification. In SFY 2010, 46 In-Service Training Activities were designed, conducted, and
coordinated in the area of field procedures, management/leadership, computer training, career development,
professional enhancement, and organizational development for all levels of positions within the Division. The
Division's philosophy is that DSB staff must possess specific knowledge concerning the problems of blindness.
Training opportunities are ongoing and coordinated with other state departments and federal agencies to provide the
highest quality training possible within available resources.
Consumer Technology- Like their sighted counterparts, blind college students, insurance agents, lawyers, social
workers, ministers, physicians, etc., have multiple needs for computers and other technology. Computer systems
with prescriptive sensory adaptations are developed by the Consumer Technology Program to enable blind and
visually impaired individuals to access the information needed for success in their chosen professions.
66-70 79
76-80 102
16681-85
DSB-4

Source: Division of Services for the Blind
Braille/Tape Production- This unit converts printed materials into Braille, large print, and cassette tape or computer
diskette according to the user's preference in order to comply with ADA requirements or the Federal Rehabilitation
Act. Services are provided after identifying preference of media choice from the agency's staff, consumers and
other professionals throughout the field of blindness: e.g. textbooks, operating manuals, meeting agendas/minutes,
training packets, test for employment, etc. This is a unique service specifically designed to meet the blind and
visually impaired individual's needs. The service is managed by a Library of Congress Certified Braille Transcriber.
From July 1, 2009 through June 30, 2010, the Braille/Tape Production unit received a total of 290 requests
for alternative format to print. Two hundred eighty three (283) requests asked for Braille, resulting in the
production of 9,536 Braille pages; as well as 6,900 large print pages, and 2 duplicated cassette tapes.
The DSB Director's Office provides administrative guidance and supplemental staff support to the previously
mentioned programs in the form of policy development, and financial services. Additionally, it oversees the operation
of the Arkansas Radio Reading Services for the Blind (AIRS).
Arkansas Information Reading Services for the Blind (AIRS)- Operating from the campus of the Arkansas
Educational Television Network, the Reading Service provides daily telephone or broadcast readings of state and
national newspapers, magazines and other printed material, which are not otherwise accessible to visually impaired
and physically handicapped individuals. Consumers receive the audio programs by tuning in to a particular
television channel in their area. While the number of consumers who access the service by personal
television is impossible to determine, in SFY 2010, the Arkansas Information Reading Services for the Blind
served an average of 400 consumers each month throughout Arkansas, utilizing the telephone reader
service that provides the reading of selected text upon demand from local, state and national sources.
Vending Facility Program- The Vending Facility Program (VFP) provides self-employment business opportunities
throughout the state for individuals who are interested in, and have the necessary skills for, private enterprise. The
vending locations are managed by totally blind or legally blind persons who have been trained and licensed by the
Division of Services for the Blind under the federal Randolph Sheppard Act. In addition to initial training, managers
are also provided technical assistance, financial management services and upward mobility training. The program
also assesses and recruits potential new locations. It equips locations, maintains and replaces equipment as
needed, and provides initial stock inventory. In fiscal year 2010, $51,185 was personally spent by the vendors
upgrading existing facilities. Licensed blind vendors operated 17 vending locations with sales of over $1.6
million dollars. There were also 16 mechanical vending locations on Arkansas highways generating income
of $140,287. Vending managers earned commissions on sales totaling $421,577, an average of $24,798
annually.
DIRECTOR'S OFFICE
Volunteer Coordination- In SFY 2010, DSB volunteers participated in various activities with a total of 471
hours. Service was donated in the areas of management, direct services, advocacy, indirect services,
special events, education and training, boards/commissions and advisory committee activities. A total of
388 volunteers donated time to DSB staff and consumers and various DSB and DHS projects.
DSB BUSINESS AND TECHNOLOGY SERVICES (Continued)
ARKANSAS DHS STATISTICAL REPORT
DIVISION OF SERVICES FOR THE BLIND
SFY 2010
DSB-5


1.
2.
3.
4.
5.
6.
7.
8.
Redirecting resources from incarceration and punishment to prevention and treatment will be more
effective, less costly, and lead to greater public safety for citizens of the state.
ARKANSAS DHS STATISTICAL REPORT
DIVISION OF YOUTH SERVICES
INTRODUCTION
SFY 2010
The mission of the Division of Youth Services is to provide effective prevention, intervention and treatment
programs to give opportunities for success to families and children in Arkansas and to ensure public safety.
Vision
Children and families in Arkansas are safe and have the resources they need in their communities to help them
succeed.
Values
This plan is based on a number of shared values and beliefs among stakeholders for juvenile justice reform:
State resources and programs to support children and families in Arkansas should be coordinated in a
system of care for maximum effectiveness This imperative must infuse every goal and strategy in this
plan.
Mission
An effective juvenile justice system will require creative partnerships among state agencies, public and
private schools, churches and faith-based organizations, local communities, the judicial system, and
foundations.
Source: Division of Youth Services
Youth and families should receive services in community centers close to their homes whenever
possible This will allow more community buy-in, family involvement, and ease of transition after
treatment.
Response to children in trouble should involve multi-system interventions with their families, and families
should be involved in needs assessment and planning.
Programs and services should be strength-based and empower youth and families to succeed.
Programs and services should be evidence-based or have data showing effective outcomes. To achieve
this accountability will require better baseline data and on-going data sharing as well as a commitment to
data-based decision making.
All children and youth in the state should have equal opportunities for fairness, help and success without
regard to gender, race or ethnicity, disability, geographic location, income level, or any other factor.
DYS-1

Source: Division of Youth Services
ARKANSAS DHS STATISTICAL REPORT
DIVISION OF YOUTH SERVICES
INTRODUCTION
SFY 2010
Historic Overview of DYS
Act 199 of 1905 established the first reform schools in Arkansas in Little Rock and Alexander, respectively.
Act 67 of 1917, the Arkansas Boys' Reform School was relocated to Pine Bluff.
Act 60 of 1937 established two additional "training" schools at Wrightsville and Fargo.
In 1985, Act 348 merged the Division of Youth Services with the Division of Children and Family Services until
Act 1296 of 1993 reestablished DYS as an independent division [within DHS]. The Division of Youth Services
(DYS) was authorized by Act 1296 to be "devoted entirely to handling the problems of youths involved in the
juvenile justice system." DYS became operational in October 1993 and is responsible for client-specific
programming and individual treatment programs, serious offender programs for violent youth offenders, providing
alternative community-based programming, and other services specified directly by Act 1296.
In 1968, the Department for Rehabilitative Services was assigned responsibility to administer "training" schools.
The Benton Services Center was opened and controlled the diagnosis and intake responsibilities regarding the
youth committed to state custody.
In 1971, Act 38 established the Department of Social and Rehabilitative Services (SRS), a forerunner to the
current Department of Human Services. The Office of Juvenile Services was placed under the direction of the
Director of SRS. In 1977, the Division of Youth Services was formally created as a division within the present
Department of Human Services (DHS).
DYS-2

Vera Lloyd - Little Rock
In SFY 2010, the Division of Youth Services contracted with Community Based Providers (CBP) for the following
services: Targeted Casework Management, Therapy, Diagnosis and Evaluation, Intensive Casework
Management, Interstate Compact, Emergency Shelter and Residential Treatment. In addition, the Community
Based Providers provided sanction services that included Community Service Supervision, Intensive Supervision
and Tracking, Compliance Monitoring, Drug Screening, Day Services Level I, Day Services Level II, and Crisis
Residential Treatment. Funding for community/based services was allocated to each judicial district, with one
contractor servicing each district. The providers in each district conducted a needs survey in order to provide the
services most beneficial to the youth in their individual areas. Aftercare services were provided in accordance
with ACT 1222, with quarterly reports submitted to the Legislative Committee on Children and Youth.
The Division also contracts for Specialized Services including: Therapeutic Group Home Services,
Comprehensive Residential Treatment Services in Psychiatric facilities, Sex Offender Treatment Services,
Socialization/Recreation Services, Therapeutic Foster Care, Diagnosis and Evaluation and Therapy. Six Serious
Offender Programs, four with 30 beds, one with 26, and one with 27 beds, have contracts with DYS.
The Residential Facilities programs had direct expenses in the amount of $22,710,486. The Community Based
programs had direct expenses in the amount of $16,638,799. The Residential Treatment programs had direct
expenses in the amount of $3,507,845. Total funding was $42,857,130.
Youth Village, Inc. - Memphis, TN
ARKANSAS DHHS STATISTICAL REPORT
DIVISION OF YOUTH SERVICES
SFY 2010
Community Based Programs and Services Providers
Comprehensive Juvenile Services - Fort Smith
Specialized Services Contractors
South Arkansas Youth Services, Inc. - Magnolia
Southwest Arkansas Counseling & Mental Health Center - Texarkana
United Family Services, Inc. - Pine Bluff
Youth Bridge, Inc. - Fayetteville
Professional Counseling Associates - Lonoke
Conway County Community Services, Inc. - Morrilton
Counseling Clinic - Benton
East Arkansas Youth Services, Inc. - Marion
Health Resources of Arkansas, Inc. - Batesville
Consolidated Youth Services - Jonesboro
Ouachita Children's Center - Hot Springs
Phoenix Youth and Family Services - Crossett
Arkansas State Hospital Unit, ASH - Little Rock
Consolidated Youth Services - Jonesboro
Youth Bridge Substance Abuse Treatment - Fayetteville
Youth Home - Little Rock
Piney Ridge - Fayetteville
Rivendell Behavior Health Services - Benton
South Arkansas Youth Services, Inc. - Magnolia
Source: Division of Youth Services
DYS-3

Dermott Juvenile Correctional Facility
The Arkansas Coalition for Juvenile Justice (ACJJ), which is appointed by the governor, participates in the
development and review of the State Plan prior to implementation and is afforded the opportunity to review and
submit recommendations to the DYS Director on all juvenile justice and delinquency grant applications. In
SFY2008, the primary goal of the ACJJ and DYS was disproportionate minority contact, as well as, the removal
of juveniles from adult jails and lockups assuring that those who needed detention were held in appropriate
facilities. To accomplish this, the ACJJ recommended and the Division of Youth Services approved Title II
Funds to fifteen agencies/organizations.
Of the fifteen subgrants, one subgrant offers Gender Specific Services (GS). Five subgrants offer
Disproportionate Minority Contact Services (DMC) with the goal of reducing over representation of minority youth
along the entire continuum of the juvenile justice system. One subgrant provides alternatives to the De-
institutionalization of Status Offenders (DSO). One subgrant is Mental Health (MH) aimed at addressing mental
health issues of juvenile. One subgrant is for Information Services. Two subgrants are for Delinquency
Prevention (DP). Four subgrants are for School Programs (SP).
07/01/09 - 06/30/10
Type of Service
Statewide
# Of Clients
Served
Columbia
TOPPS DMC
DMC
Jefferson
07/01/09 - 06/30/10Jefferson
N/A
07/01/09 - 06/30/10Jefferson
07/01/09 - 06/30/10
United Family 10
110East Arkansas Youth
Services
72
Crittenden
Jefferson DMC
ColumbiaMagnolia Public School
Scotty Scholl
CommunicationsInformation Services
SP
County
JJDP Title II Formula Grants
Substance Abuse Treatment Contractors
Mansfield Juvenile Treatment Center
Alexander Juvenile Correctional Facility (JUMP)
Serious Offender Programs
ARKANSAS DHHS STATISTICAL REPORT
DIVISION OF YOUTH SERVICES
SFY 2010
All contractors are responsible for providing substance abuse treatment pursuant to their contract.
Colt Juvenile Treatment Center
Harrisburg Juvenile Treatment Center
Lewisville Juvenile Treatment Center
Source: Division of Youth Services
Juvenile Justice and Delinquency Prevention (JJDP)
07/01/09 - 06/30/10
Counties
Served
Mansfield Juvenile Treatment Center for Girls
Dermott Juvenile Treatment Center
Statewide
Subgrant PeriodSubgrantee
Baxter County Juvenile
Services220SPBaxter
07/01/09 - 06/30/10
Crittenden, St.
Francis & Phillips
6
Baxter, Marion
DYS-4

Desha Desha Substance Abuse 13 Desha 07/01/09 - 06/30/10
07/01/09 - 06/30/10Faulkner County Faulkner Mentoring 85 Faulkner
Jefferson 07/01/09 - 06/30/10
Baxter County Baxter
Jefferson County Jefferson DP 46
17
Mentoring 100
07/01/09 - 06/30/10
Pulaski County Pulaski DP 55 Pulaski 07/01/09 - 06/30/10
City of Crossett
Baxter, Marion 07/01/09 - 06/30/10
JJDP Title V Formula Grants
County Type of Service
# Of Clients
Served
Counties
Served
07/01/09 - 06/30/10
Counties
Served
DIVISION OF YOUTH SERVICES
SFY 2010
ARKANSAS DHHS STATISTICAL REPORT
Pulaski County (6th
Judicial District)DP
103Holman Community
Development Corp.
Pulaski
Pulaski
Type of Service
# Of Clients
ServedCounty
City of Madison Pulaski SP 23
Phoenix Youth &
FamiliesAshley DMC 106
Pulaski 07/01/09 - 06/30/10
Garland 07/01/09 - 06/30/10
Simone’s Home. Pulaski
07/01/09 - 06/30/10
07/01/09 - 06/30/10
DP
DSO
Pulaski
Arkansas
30
JJDP Title II Formula Grants (Continued)
Subgrantee
Pulaski56Pulaski County Juvenile
Services
Arkansas
Source: Division of Youth Services
07/01/09 - 06/30/10
Garland County Juvenile
DetentionGarland MH 184
Crittenden DMC 84Crittenden and
Marion
GS 60
Drew School District
07/01/09 - 06/30/10
Desha SP 130 Desha
Earle School District
Subgrantee Subgrant Period
Ashley DP Ashley
Ashley, Drew,
Desha, Bradley &
Chicot
07/01/09 - 06/30/10
Subgrant Period
Pulaski 07/01/09 - 06/30/10
DYS-5

Total Number of Commitments:
2 1
11 2 0 1 1 0
6 3 0 2
0 1 3
0
14 0 1 1 11
722
11
0 6
77
2 0 2 2
0 11 1
3 0
3 0
3
36 9 8
6
18
1 2
8
214
60
Source: Division of Youth Services
9
531
18
0 24 4 5
*All commitments were counted even if a juvenile received one or more new commitment orders in the same case. Each was
counted as a new commitment.
16
5 1 4
1
ARKANSAS DHS STATISTICAL REPORT
DIVISION OF YOUTH SERVICES
COMMITMENTS TO YOUTH SERVICES CENTERS*
SFY 2010
5
1
62 2
8 10
4 2
17 23 7
1
ARKANSAS
ASHLEY
BAXTERBENTON BOONE
BRADLEYCALHOUN
CARROLL
CHICOT
CLARK
CLAY
CLEBURNE
CLEVELAND
COLUMBIA
CONWAY
CRAIGHEAD
CRAWFORD
CROSS
DALLAS
DESHA
DREW
FAULKNER
FULTON
GARLAND
GRANT
GREENE
HEMPSTEAD
HOT SPRING
HOWARD
IZARD
JACKSON
JEFFERSON
JOHNSON
LAWRENCE
LEE
LINCOLN
LOGAN
LONOKE
MADISON
MARION
MILLER
MISSISSIPPI
MONROEMONTGOMERY
NEVADA
NEWTON
OUACHITA
PERRY
PHILLIPS
PIKE
POINSETT
POLK
POPE
PRAIRIE
PULASKI
RANDOLPH
ST. FRANCIS
SALINE
SCOTT
SEARCY
SEVIER
SHARP
STONE
UNION
VAN BUREN
WASHINGTON
WHITEWOODRUFF
YELL
INDEPENDENCE
SEBASTIAN
FRANKLIN
CRITTENDEN
LITTLE RIVER
LAFAYETTE
DYS-6

Judicial Committing Judicial Committing
District County By County District Total District County By County District Total
1st Cross 2 11th East Arkansas 2 2
Lee 0
Monroe 7 11th West Jefferson 62
Phillips 6 Lincoln 4 66
St. Francis 8
Woodruff 1 24 12th Sebastian 36 36
2nd Clay 1 13th Calhoun 1
Craighead 11 Cleveland 1
Crittenden 7 Columbia 18
Greene 3 Dallas 1
Mississippi 11 Ouachita 5
Poinsett 2 35 Union 16 42
3rd Jackson 2 14th Baxter 1
Lawrence 0 Boone 0
Randolph 2 Marion 1
Sharp 1 5 Newton 1 3
4th Madison 0 15th Conway 2
Washington 14 14 Logan 0
Scott 1
5th Franklin 2 Yell 3 6
Johnson 3
Pope 0 5 16th Cleburne 2
Fulton 0
6th Perry 0 Independence 6
Pulaski 77 77 Izard 0
Stone 0 8
7th Grant 10
Hot Spring 8 18 17th Prairie 3
White 11 14
8th North Hempstead 24
Nevada 4 28 18th East Garland 17 17
8th South Lafayette 2 18th West Montgomery 0
Miller 8 10 Polk 1 1
9th East Clark 5 5 19th East Carroll 2 2
9th West Howard 4 19th West Benton 11 11
Little River 0
Pike 2 20th Faulkner 9
Sevier 5 11 Searcy 1
Van Buren 0 10
10th Ashley 14
Bradley 2 21st Crawford 6 6
Chicot 18
Desha 6 22nd Saline 23 23
Drew 9 49
23rd Lonoke 3 3
TOTAL * 531 531* Based on actual commitment orders regardless of case
Source: Division of Youth Services
Number of Commitments Number of Commitments
ARKANSAS DHS STATISTICAL REPORT
SFY 2010
COMMITMENTS TO YOUTH SERVICES CENTERS
BY JUDICIAL DISTRICT
DYS-7

White
Black
Asian
Bi-racial
Hispanic
Other
Source: Division of Youth Services
ARKANSAS DHS STATISTICAL REPORT
YOUTH SERVICES CENTERS COMMITMENTS
SFY 2007 - 2010
931
78
165 174150
150
622
935
81
135167 153
171
598
1331
82
129
186 174
17 4
636
931
55
128144 144
16 4
531
0
100
200
300
400
500
600
700
Under 13 13 14 15 16 17 18 19 Total
BY AGE
2007 2008 2009 2010
503 502545
450
11996 91 81
622598
636
531
0
100
200
300
400
500
600
700
2007 2008 2009 2010
BY GENDER
Male Female Total
288 303
3 0 22 2 4
622
269 291
0 028
0 10
598
242
333
1 047
1 12
636
201
292
0 030
0 8
531
0
100
200
300
400
500
600
700
White Black Asian Bi-racial Hispanic Native American Other Total
BY RACE
2007 2008 2009 2010
DYS-8

Felony
Offense 2000 2001 2002 2003 2004 2005 2006 2007 2008 2009 2010
Arson 1 2 8 3 0 2 3 4 6 1 4
Battery, First Degree 4 1 3 5 1 7 1 2 2 6 4
Burglary (d) 108 59 91 70 74 52 55 60 73 80 108
Kidnapping 0 0 1 0 0 0 0 0 0 2 1
Murder (a) (1) 2 0 0 0 0 0 0 0 2 2 0
Rape (2) 16 17 15 17 22 19 17 14 17 23 16
Robbery (b) 12 4 8 9 4 17 15 12 22 30 96
143 83 126 104 101 97 91 92 122 144 229
750 597 516 528 531 575 647 622 598 636 531
(a) Includes Capital, First Degree and Second Degree Murder.
(b) Includes Aggravated Robbery and Robbery.
(c) Includes Commitments for "Evaluation Only".
(d) Includes Burglary Commercial and Residential.
(1) Includes Attempted Capital Murder, Conspiracy to Commit Capital Murder,
Conspiracy to Commit Murder-Second Degree, and Criminal Attempt Murder-Second Degree.
(2) Includes Criminal Attempted Rape.
SFY Felonies Misdemeanors Total
2000 744 (1)
2001 568 (2)
2002 513 (3)
2003 523 (4)
2004 531
2005 573 (5)
2006 647
2007 622 (6)
2008 598 (4)
2009 636
2010 531 (7)
(1) Six (6) commitments were a result of violation or revocation of probation.(2) Twenty-nine (29) commitments were a result of violation or revocation of probation.(3) Three (3) commitments were a result of violation or revocation of probation.(4) Five (5) commitments were a result of violation or revocation of probation.(5) Two (2) commitments were a result of violation or revocation of probation.(6) Three (3) commitments were a result of aftercare probation.(7) Fourteen (14) commitments were a result of aftercare probation.
Source: Division of Youth Services
Total Commitments of
Selected Offenses
Total Commitments of All
Offenses (c)
State Fiscal Year
Commitments By Offense Class
293
359 260
276
307 261
327 186
306 217
468
409 227
331 186
ARKANSAS DHS STATISTICAL REPORT
ADJUDICATED DELINQUENTS COMMITTED
TO YOUTH SERVICES CENTERS
BY MOST SERIOUS FELONY OFFENSES
SFY 2000 to 2010
354
379 214
336 195
328 245
DYS-9

Offense Total
Category Sex Y A B C D U Total A B C U Total Offenses
Person Male 30 1 25 6 39 0 101 45 3 2 0 50 151
Female 0 0 5 0 12 0 17 16 2 3 0 21 38
Total 30 1 30 6 51 0 118 61 5 5 0 71 189
Property Male 0 1 82 63 16 0 162 7 2 2 0 11 173
Female 0 1 1 4 2 0 8 31 1 0 0 32 40
Total 0 2 83 67 18 0 170 38 3 2 0 43 213
Public Order Male 3 0 0 1 11 0 15 17 0 22 0 39 54
Female 0 0 0 1 1 0 2 5 0 7 1 13 15
Total 3 0 0 2 12 0 17 22 0 29 1 52 69
Drug Law Male 2 0 0 12 3 0 17 12 0 0 0 12 29
Violation Female 0 0 1 1 0 0 2 0 0 0 0 0 2
Total 2 0 1 13 3 0 19 12 0 0 0 12 31
Other Male 0 0 0 1 5 1 7 1 0 0 11 12 19
Female 0 0 0 0 0 0 0 1 1 0 8 10 10
Total 0 0 0 1 5 1 7 2 1 0 19 22 29
Totals Male 35 2 107 83 74 1 302 82 5 26 11 124 426
Female 0 1 7 6 15 0 29 53 4 10 9 76 105
Total 35 3 114 89 89 1 331 135 9 36 20 200 531
Source: Division of Youth Services
ARKANSAS DHS STATISTICAL REPORT
ADJUDICATED DELINQUENTS COMMITTED
TO YOUTH SERVICES CENTERS
The severity of the offense ranges from Felony classification Y being the most serious to Misdemeanor classification U being the least
serious.
Felony Misdemeanor
BY CATEGORY OF OFFENSE AND SEVERITY
SFY 2010
DYS-10

Offense Offense
Classification Grade Offense Title 2006 2007 2008 2009 2010
Felony A Attempted Aggravated Robbery 0 0 3 0 0
A Attempted Capital Murder 0 0 1 0 0
A Battery, Second Degree 0 0 0 0 0
A Criminal Attempt 1 3 4 1 1
A Sexual Abuse 0 0 0 0 0
A Sexual Assault, First Degree 1 0 1 1 0
B Abuse of Adults 0 1 0 0 0
B Battery, First Degree 1 2 2 6 4
B Carnal Abuse, First Degree 0 0 0 0 0
B Criminal Conspiracy 0 0 0 5 0
B Domestic Battery 1 1 1 0 0
B Hindering Apprehension 1 0 0 0 0
B Murder, Second Degree 0 0 0 1 0
B Robbery 15 12 8 16 13
B Sexual Abuse, Second Degree 0 0 0 0 0
B Sexual Assault, Second Degree 10 15 21 16 12
B Terroristic Act 1 0 5 3 1
C Domestic Battery, Second Degree 1 2 1 0 3
C Engage Child in Sex Explct - 1st Off 0 0 0 0 0
C False Imprisonment, First Degree 0 0 1 0 0
C Furnishing Prohibited Articles 1 0 0 0 1
C Incest 0 0 0 0 0
C Intimidating a Witness 0 0 0 1 0
C Negligent Homicide 0 1 0 0 0
C Sexual Abuse 0 0 0 0 0
C Sexual Abuse, First Degree 0 0 0 0 0
C Sexual Assault, Third Degree 1 2 1 4 1
C Stalking, Second Degree 0 0 0 0 1
C Trans/Dstrbtn Mat Depct Child, First Offense 0 0 0 1 0
D Aggravated Assault 12 13 7 12 6
D Aggravated Assault on Family of Household Member 1 2 2 5 3
D Battering, Domestic - 2nd Degree 0 0 2 1 1
D Battering, Domestic - 3rd Degree 0 2 2 2 0
D Battery, Second Degree 22 14 25 23 13
D Child Sex Offender Fail to Register 0 0 0 1 1
D Communicating False Alarm 3 2 2 0 0
D Death Threat - School Employee or Student 1 0 0 0 1
D Domestic Battery, Second Degree 0 0 0 0 0
D Domestic Battery, Third Degree 0 0 0 0 0
D Failure to Stop After Accident W/Injury or Death 1 0 1 0 1
D Sexual Assault - 4th Degree 0 0 3 0 5
D Sexual Solicitation of a Child 2 1 0 0 0
D Terroristic Threatening, First Degree 23 18 15 24 20
Y Aggravated Robbery 12 15 14 14 12
Y Capital Murder 0 0 0 0 1
Y Kidnapping 0 0 0 2 0
Y Murder, First Degree 0 0 1 1 16
Y Rape 17 14 17 23 1
128 120 140 163 118
Source: Division of Youth Services
ARKANSAS DHS STATISTICAL REPORT
Total Felony Offenses
PRIMARY OFFENSES OF ADJUDICATED DELINQUENTS
COMMITTED TO YOUTH SERVICES CENTERS
OFFENSE AGAINST PERSONSFY 2006 - 2010
SFY
DYS-11

Offense Offense
Classification Grade Offense Title 2006 2007 2008 2009 2010
Misdemeanor A Assault, First Degree 5 4 4 6 7
A Assault Family or Household Member, First Degree 1 1 1 2 1
A Battery, Second Degree 0 0 0 0 0
A Battery, Third Degree 33 34 33 45 27
A Battery, Fourth Degree 0 0 0 0 0
A Communicating False Alarm 0 0 0 0 0
A Domestic Battery 0 0 0 0 0
A Domestic Battery, Third Degree 20 13 10 5 12
A Endangering Welfare of a Minor, Second Degree 0 0 1 2 1
A False Imprisonment - 2nd Degree 0 0 0 0 1
A Negligent Homicide 0 1 0 0 0
A Sexual Abuse, Second Degree 0 1 0 0 0
A Sexual Assault, Fourth Degree 1 0 0 0 1
A Sexual Solicitation - Indency of a Child 0 0 0 1 0
A Terroristic Threatening 0 0 0 0 0
A Terroristic Threatening, Second Degree 12 13 19 14 11
B Assault Family of Household Member, Second Degree 0 3 0 1 1
B Assault, Second Degree 6 3 0 3 4
B Sexual Misconduct 0 0 0 0 0
B Terroristic Threatening, Second Degree 0 1 0 2 0
C Assault, Third Degree 4 4 5 0 4
C Assault Family or Household Member, Third Degree 1 7 0 1 1
C Domestic Assault, Third Degree 0 0 0 0 0
C Domestic Battery 0 0 0 0 0
U Insult or Abuse of a Teacher 1 1 0 1 0
U Unlawful Distribution of Prescription Drugs 0 0 0 0 0
U Using Abusive Language to School Bus Driver 0 0 0 0 0
84 86 73 83 71
212 206 213 246 189
Source: Division of Youth Services
SFY 2006 - 2010
Total Commitments for Offense Against Person
Total Misdemeanor Offenses
ARKANSAS DHS STATISTICAL REPORT
PRIMARY OFFENSES OF ADJUDICATED DELINQUENTS
COMMITTED TO YOUTH SERVICES CENTERS
OFFENSE AGAINST PERSON
SFY
DYS-12

Offense Offense
Classification Grade 2006 2007 2008 2009 2010
Felony A Arson 0 0 2 1 2
A Criminal Attempt 0 0 0 0 0
B Arson 2 0 1 0 1
B Burglary 7 6 8 7 3
B Criminal Attempt 0 1 2 2 0
B Forgery, First Degree 0 0 1 0 0
B Residential Burglary 36 37 49 62 62
B Robbery 0 0 0 0 0
B Theft of Services 0 0 0 0 0
B Theft of Property 24 22 19 26 15
B Theft by Receiving 5 7 3 2 2
C Arson 0 1 1 0 1
C Burglary 0 0 0 0 0
C Commercial Burglary 12 17 16 11 18
C Criminal Attempt 2 4 3 3 1
C Criminal Mischief 0 0 0 0 0
C Criminal Mischief, First Degree 13 15 12 16 13
C Defacing Objects of Public Interest>$250 0 0 0 0 0
C Forgery 0 0 0 0 0
C Forgery, Second Degree 5 6 3 3 0
C Fraudulent Use of a Credit Card 0 0 1 3 1
C Impairing the Operation of a Vital Public Facility 0 0 0 0 0
C Theft of Property 34 33 37 33 28
C Theft of Services 0 0 1 0 0
C Theft by Receiving 14 7 10 8 5
D Arson 0 1 1 0 0
D Breaking or Entering 19 27 24 22 16
D Burglary 0 0 0 0 0
D Commercial Burglary 0 0 0 0 0
D Conspiracy to Commit Commercial Burglary 0 0 0 0 0
D Criminal Attempt 2 2 1 0 0
D Criminal Attempt, Commercial Burglary 0 0 0 0 0
D Criminal Attempt, Burglary 0 0 0 0 0
D Criminal Mischief 1 1 3 2 1
D Reckless Burning 1 0 1 0 0
D Theft by Receiving 0 0 0 0 0
D Theft of Property 2 4 0 1 0
D Unlawful Destruction/Removal of Cemetry Grave Marker 0 0 0 0 1
Y Arson $100,000 or more 1 0 1 0 0
Y Aggravated Residential Burglary 0 0 0 1 0
180 191 200 203 170
Source: Division of Youth Services
Total Felony Offenses
ARKANSAS DHS STATISTICAL REPORT
PRIMARY OFFENSES OF ADJUDICATED DELINQUENTS
COMMITTED TO YOUTH SERVICES CENTERS
OFFENSE AGAINST PROPERTY
SFY 2006 - 2010
SFY
DYS-13

Offense Offense
Classification Grade Offense Title 2006 2007 2008 2009 2010
Misdemeanor A Amount of Theft 1 0 0 0 0
A Arson less than $500 0 2 0 0 0
A Consol Offenses - Shoplifting Presump - Amount of Theft 0 0 0 0 1
A Criminal Attempt 1 2 0 1 0
A Criminal Impersonation 0 0 0 0 0
A Criminal Mischief, First Degree 7 7 8 12 5
A Criminal Mischief, Second Degree 2 3 4 8 1
A Defacing Public Building 0 0 0 0 0
A Fraudulent Use of a Credit Card 0 0 0 0 0
A Shoplifting 2 3 1 2 0
A Theft by Receiving 9 8 1 6 3
A Theft of Motor Fuel 0 1 0 0 0
A Theft of Property 40 39 18 39 25
A Theft of Services 1 0 0 0 0
A Unauthorized Use of a Vehicle 12 4 9 6 3
B Criminal Mischief, Second Degree 5 1 2 3 2
B Criminal Mischief 0 0 0 0 0
B Criminal Trespass 10 7 2 3 1
C Criminal Mischief 0 0 0 0 0
C Criminal Trespass (Non-Occupied Structure or Vehicle) 0 0 0 0 0
C Criminal Trespass 3 1 1 1 2
C Theft by Receiving 0 0 0 0 0
U Shoplifting 0 2 0 0 0
93 80 46 81 43
273 271 246 284 213
Source: Division of Youth Services
SFY 2006 - 2010
Total Commitments for Offense Against Property
Total Misdemeanor Offenses
ARKANSAS DHS STATISTICAL REPORT
PRIMARY OFFENSES OF ADJUDICATED DELINQUENTS
COMMITTED TO YOUTH SERVICES CENTERS
OFFENSE AGAINST PROPERTY
SFY
DYS-14

Offense OffenseClassification Grade Offense Title 2006 2007 2008 2009 2010
Felony B Unlawful Discharge of Firearm Veh, Second Degree 0 0 1 0 0
C Escape, First Degree 2 2 0 0 0
C Failure to Appear 1 0 1 1 0
C Fleeing 1 1 1 0 2
C Hindering Apprehension 0 0 0 0 0
C Intimidating a Witness 0 0 0 0 0
D Absconding 7 3 2 12 5
D Escape, Second Degree 6 4 0 0 2
D Fleeing 2 1 1 2 2
D Handgun Minor in Possession, Second Offense 3 1 1 4 2
D Handgun Poss Campus Inst Higher Education 1 1 0 1 0
D Handgun Poss Pub School Property/Bus 1 0 0 3 1
D Inciting a Riot 0 5 0 0 0
D Indecent Exposure 0 0 0 0 0
D Threatening to Cause a Catastrophe 0 0 0 0 0
U Engage In Continuous Crime Gang, Second Degree 0 0 0 0 0
U Unlawful Burning 0 0 0 1 0
Y Simult Poss of Drugs and Firearms 0 1 2 0 3
Total Felony Offenses 24 19 9 24 17
Misdemeanor A Disorderly Conduct 0 0 0 0 0
A Escape 0 0 0 0 0
A Escape, Third Degree 3 2 3 0 1
A Failure to Appear 2 1 0 0 1
A Fleeing 3 2 3 1 1
A Handgun Minor in Possession, First Offense 5 6 2 4 6
A Harassing Communications 0 0 0 1 1
A Harassment 1 3 2 0 3
A Hindering Apprehension 0 0 0 0 0
A Indecent Exposure 1 3 2 0 1
A Minor in Possession of Handgun 0 0 0 0 0
A Obstructing Governmental Operations 4 4 3 1 2
A Public Intoxication 0 0 0 0 0
A Public Sexual Indecency 2 3 2 2 0
A Refusal to Submit to Arrest 0 0 0 0 0
A Resisting Arrest 5 3 7 3 6
B Fail to Report Suspected Abuse of Adults 0 0 0 0 0
B Fleeing 0 2 1 0 0
B Prostitution, First Offense 0 0 2 0 0
C Battery, Third Degree 0 0 0 0 0
C Disorderly Conduct 35 25 28 22 17
C Fleeing 3 2 3 0 3
C Obstructing Governmental Operations 5 2 3 4 3
C Obstructing Hwy or Other Public Place 5 2 1 0 0
C Public Intoxication 1 3 2 3 6
U Contempt of Court 1 1 1 0 0
U Littering 1st Offense 0 0 0 0 1
Total Misdemeanor Offenses 76 64 65 41 52
100 83 74 65 69
Source: Division of Youth Services
Total Commitments for Offense Against Public Order
ARKANSAS DHS STATISTICAL REPORT
PRIMARY OFFENSES OF ADJUDICATED DELINQUENTS
COMMITTED TO YOUTH SERVICES CENTERS
SFY 2006 - 2010
OFFENSE AGAINST PUBLIC ORDER
SFY
DYS-15

Offense Offense
Classification Grade Offense Title 2006 2007 2008 2009 2010
Felony A Conspiracy to Manufacture Controlled Substance 0 0 0 0 0
A Delivery of Controlled Substance 0 0 0 0 0
B Deliver Drug Paraphernalia to anyone < 18 0 0 0 0 0
B Intro Cont-Sub into Another's Body I-III 0 0 1 0 0
B Maintain Drug Premises Near Drug Free Zone 0 1 0 0 0
B Manf Etc Controlled Substance, Sch I, II, III 5 0 0 1 0
B Possession/Use of Drug Paraphernalia to Manufacture Meth 0 0 0 0 1
B Possession, Etc Counterfeit Subt with Intent SCH I, II 0 1 1 1 0
C Delivery of a Controlled Substance 0 0 0 0 0
C Delivery, Possession, Manufacture, Etc. Drug Paraphernalia 1 1 1 1 2
C Intro Cont-Sub into Another's Body IV-VI 0 0 0 1 0
C Manufacture, Delivery, Posession Marijuana < 10 pounds 0 1 0 1 0
C Manufacture, Etc. Controlled Substance, Sch IV, V 1 4 1 0 1
C Possession Ctrl/Cnft Sub w/o Prescription, Third Offense 4 5 8 1 1
C Possession of a Counterfeit Substance (Intent to Deliver) 2 0 0 0 0
C Possession of Controlled Substance 0 0 0 0 0
C Possession of Controlled Substance Sch I, II 3 6 6 2 5
C Possession of Drug Paraphernalia 0 0 0 0 0
C Possession of Marijuana <10 lbs 0 0 1 0 0
C Possession of Marijuana > = 10 < 100 lbs 1 0 1 0 0
C Possession, Etc Counterfeit Subt with Intent SCH I-V 0 4 1 0 4
D Poss of Ctrl/Counterfeit Subs w/o Presc, Second Offense 3 0 5 4 3
D Possession of Controlled Substance (Intent to Deliver) 1 0 0 0 0
D Poss, Etc Cntrft Sub W-Intent Unclass Sch 0 0 1 0 0
D Non-Controlled Substance Rep as Class Ctrl Substance 0 1 0 0 0
U Unlawful Sale Delv Depressants Stimulants 0 0 0 0 0
Y Manufactured Etc Controlled Substance >$400<28gms 1 0 0 1 0
Y Manuf Etc Controlled Substance Sch 1, 11 >28<200g 0 0 0 1 1
Y Manuf Etc Controlled Substance Sch 1, 11 0 1 0 3 1
Y Possession of Cocaine 0 0 0 0 0
Y Possession of Cocaine With Intent to Deliver 0 0 0 0 0
Y Possession of Controlled Substance (Intent to Deliver) 0 0 0 0 0
Y Manuf, Del, Possession Controlled Subs Sch 1, 11 <28 0 0 1 0 0
Y Simultaneous Possession of Drugs & Firearms 0 0 0 0 0
Total Felony Offenses 22 25 28 17 19
Misdemeanor A Delv, Poss, Manu, Etc. Drug Paraphernalia/Ctrfet Ctrl Sub 4 5 0 0 0
A Possession of a Controlled Substance on School Property 0 0 0 0 0
A Poss of a Ctrl/Counterfeit Subs w/o Presc, First Offense 27 18 19 9 9
A Possession of a Counterfeit Substance 0 0 0 0 0
A Possession of Drug Paraphernalia 0 0 0 0 0
A Possession of Marijuana 0 0 0 2 3
U Possession of Drug Paraphernalia 0 1 0 0 0
Total Misdemeanor Offenses 31 24 19 11 12
Total Commitments for Drug Law Violation 53 49 47 28 31
Source: Division of Youth Services
SFY
SFY 2006 - 2010
ARKANSAS DHS STATISTICAL REPORT
PRIMARY OFFENSES OF ADJUDICATED DELINQUENTS
COMMITTED TO YOUTH SERVICES CENTERS
DRUG LAW VIOLATIONS
DYS-16
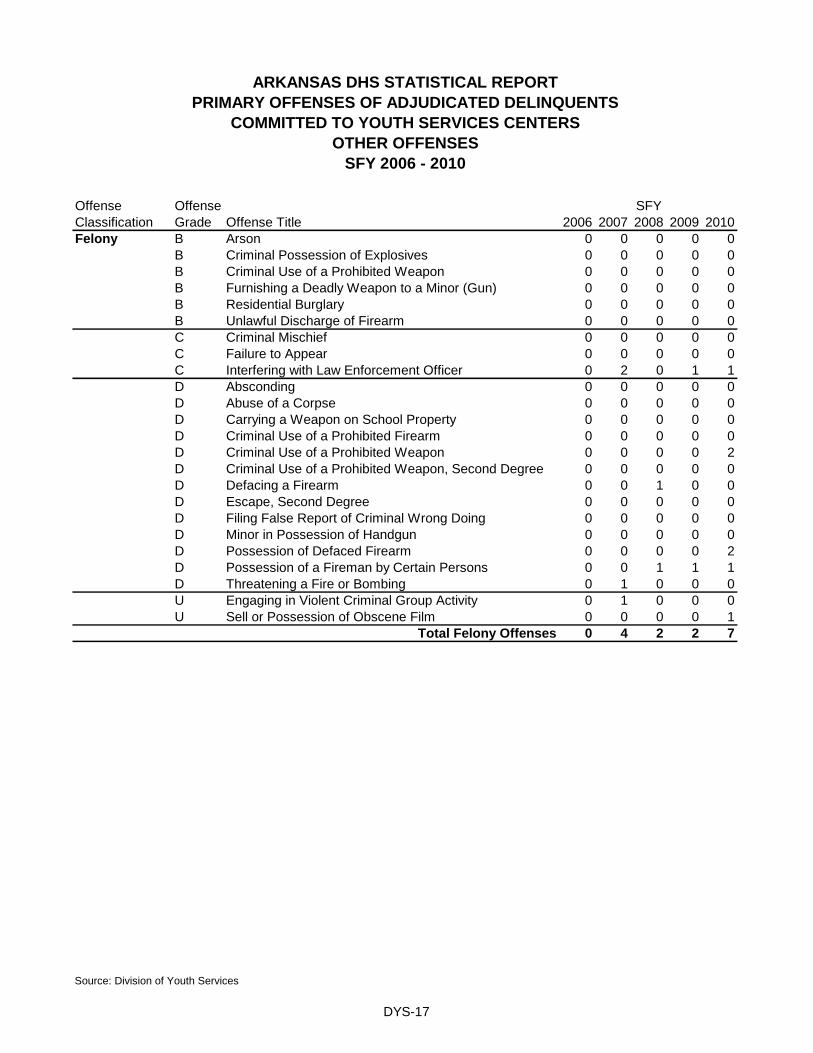
Offense Offense
Classification Grade Offense Title 2006 2007 2008 2009 2010
Felony B Arson 0 0 0 0 0
B Criminal Possession of Explosives 0 0 0 0 0
B Criminal Use of a Prohibited Weapon 0 0 0 0 0
B Furnishing a Deadly Weapon to a Minor (Gun) 0 0 0 0 0
B Residential Burglary 0 0 0 0 0
B Unlawful Discharge of Firearm 0 0 0 0 0
C Criminal Mischief 0 0 0 0 0
C Failure to Appear 0 0 0 0 0
C Interfering with Law Enforcement Officer 0 2 0 1 1
D Absconding 0 0 0 0 0
D Abuse of a Corpse 0 0 0 0 0
D Carrying a Weapon on School Property 0 0 0 0 0
D Criminal Use of a Prohibited Firearm 0 0 0 0 0
D Criminal Use of a Prohibited Weapon 0 0 0 0 2
D Criminal Use of a Prohibited Weapon, Second Degree 0 0 0 0 0
D Defacing a Firearm 0 0 1 0 0
D Escape, Second Degree 0 0 0 0 0
D Filing False Report of Criminal Wrong Doing 0 0 0 0 0
D Minor in Possession of Handgun 0 0 0 0 0
D Possession of Defaced Firearm 0 0 0 0 2
D Possession of a Fireman by Certain Persons 0 0 1 1 1
D Threatening a Fire or Bombing 0 1 0 0 0
U Engaging in Violent Criminal Group Activity 0 1 0 0 0
U Sell or Possession of Obscene Film 0 0 0 0 1
Total Felony Offenses 0 4 2 2 7
Source: Division of Youth Services
SFY
ARKANSAS DHS STATISTICAL REPORT
PRIMARY OFFENSES OF ADJUDICATED DELINQUENTS
COMMITTED TO YOUTH SERVICES CENTERS
OTHER OFFENSES
SFY 2006 - 2010
DYS-17

Offense Offense
Classification Grade Offense Title 2006 2007 2008 2009 2010
Misdemeanor A Attempt to Influence Public Servant 0 0 1 0 0
A Carrying Certain Prohibited Weapons 1 1 3 3 2
A Communicating a False Alarm 0 0 0 0 0
A Conspiracy to Commit Escape, Second Degree 0 0 0 0 0
A Criminal Impersonation 0 0 0 1 0
A Cruelty to Animals 0 0 0 0 0
A Escape, Third Degree 0 0 0 0 0
A Failure to Appear 0 0 0 0 0
A Filing False Rept of Crim Wrong Doing 0 0 0 1 0
A Harassing Communications 0 0 0 0 0
A Minor in Possession of a Handgun 0 0 0 0 0
A Obstructing Governmental Operations 0 0 0 0 0
A Possession of a Firearm by Certain Persons 0 0 0 0 0
A Possession of a Instrument of Crime 5 3 1 1 0
A Shoplifting 0 0 0 0 0
A Threatening a Fire or Bombing 0 0 0 0 0
B Criminal Solicitation 0 0 0 1 0
B Refusal to Submit to Arrest 1 0 1 2 1
C Criminal Trespass 0 0 0 0 0
C Disorderly Conduct 0 0 0 0 0
C Failure to Appear 0 0 0 0 0
C Possession of Paging Device at School 0 0 0 0 0
U Carrying a Knife 0 0 0 0 0
U Contempt of Court 0 0 0 0 0
U Criminal Contempt 5 4 3 1 4
U Purchase/Poss Intox Liquor by Minor 1 0 2 0 1
U Minor in Possession of Alcohol 0 0 0 0 0
U Revocation of Probation 0 0 1 0 0
U Smoking on School Property 0 0 0 1 0
U Aftercare Violation 0 3 4 0 14
Total Misdemeanor Offenses 13 11 16 11 22
Total Commitments for Other Offenses 13 15 18 13 29
Source: Division of Youth Services
ARKANSAS DHS STATISTICAL REPORT
SFY
PRIMARY OFFENSES OF ADJUDICATED DELINQUENTS
COMMITTED TO YOUTH SERVICES CENTERS
OTHER OFFENSES
SFY 2006 - 2010
DYS-18

Total Number of Prior Commitments
SFY Sex Commitments 0 1 2 3 4 5 6 7+ N/A
2006 Male 519 417 69 19 11 3 0 0 0 0
Female 128 100 18 4 4 2 0 0 0 0
Total 647 517 87 23 15 5 0 0 0 0
Recommitment Rate = 20%
Note: Based on all new commitment orders regardless of case.
2007 Male 503 393 82 21 6 1 0 0 0 0
Female 119 92 20 6 0 1 0 0 0 0
Total 622 485 102 27 6 2 0 0 0 0
Recommitment Rate = 22%
Note: Based on all new commitment orders regardless of case.
2008 Male 502 380 94 21 6 1 0 0 0 0
Female 96 63 25 6 2 0 0 0 0 0
Total 598 443 119 27 8 1 0 0 0 0
Recommitment Rate = 26%
Note: Based on all new commitment orders regardless of case.
2009 Male 545 423 94 24 3 1 0 0 0 0
Female 91 66 16 5 4 0 0 0 0 0
Total 636 489 110 29 7 1 0 0 0 0
Recommitment Rate = 23%
Note: Based on all new commitment orders regardless of case.
2010 Male 450 344 85 15 5 0 1 0 0 0
Female 81 55 17 5 2 2 0 0 0 0
Total 531 399 102 20 7 2 1 0 0 0
Recommitment Rate = 25%
Note: Based on all new commitment orders regardless of case.
Source: Division of Youth Services
ARKANSAS DHS STATISTICAL REPORT
NUMBER OF ADJUDICATED DELINQUENTS
RECOMMITTED TO YOUTH SERVICES CENTERS
SFY 2006 - 2010
DYS-19

Facility Male Female Total
Arkansas State Hospital 10 0 10
Consolidated Youth Services - CYS/ASAP 10 0 10
Piney Ridge 8 0 8
Rivendell Behavioral Health Services 67 28 95
South Arkansas Youth Services, Inc. 31 0 31
South Arkansas Youth Services, Inc. for Girls 0 31 31
Vera Lloyd 21 21 42
Youth Bridge, Inc. (YB/SAT) 51 0 51
Youth Home, Inc. 4 0 4
Youth Villages 5 3 8
Total 207 83 290
A. Juvenile Correctional Facilities 101 days
B. Juvenile Treatment Centers 178 days
C. Specialized Placements 144 days
D. Juvenile Detention Centers 41 days
Serious Offender Program Male Female Total
Alexander Juvenile Correctional Facility (JUMP) 299 34 333
Colt Juvenile Treatment Center 53 0 53
Dermott Juvenile Correctional Facility (18-21) 41 0 41
Dermott Juvenile Treatment Center 44 0 44
Harrisburg Juvenile Treatment Center 69 0 69
Lewisville Juvenile Treatment Center 69 0 69
Mansfield Juvenile Treatment Center 66 0 66
Mansfield Juvenile Treatment Center for Girls 0 50 50
Total 641 84 725
Source: Division of Youth Services
Number of Admissions
ARKANSAS DHS STATISTICAL REPORT
SFY 2010
to Serious Offender Programs
NUMBER OF JUVENILES REFERRED
TO SPECIALTY PROVIDER FACILITIES
Number of Placements
Average Length-of-Stay of Adjudicated Delinquents*
*Represents the length of time at the listed location and not the length of time since commitment to DYS.
Number of Adjudicated Delinquents Admitted
DYS-20

Provider Male Female Total
Comprehensive Juvenile Services 353 212 565
Consolidated Youth Services 379 235 614
Conway County Community Services 815 445 1,260
Counseling Clinic 1076 958 2,034
East Arkansas Youth Services, Inc. 106 35 141
Health Resources of Arkansas, Inc. 278 111 389
Ouachita Children's Center, Inc. 125 75 200
Phoenix Youth and Family Services 189 89 278
Professional Counseling Associates 100 62 162
South Arkansas Youth Services 145 76 221
Southwest AR Counseling and Mental Health Center 227 118 345
United Family Services, Inc. 1,106 614 1,720
Youth Bridge, Inc. 571 265 836
TOTAL 5,470 3,295 8,765
Source: Division of Youth Services
COMMUNITY-BASED PROGRAM INTAKES
BY PROVIDER BY GENDER
ARKANSAS DHS STATISTICAL REPORT
COMMUNITY-BASED YOUTH SERVICES PROGRAMS
SFY 2010
The Community-based program network consists of 13 privately-operated non-profit organizations for SFY 2010.
The division contracts with these programs to provide residential and non-residential services to youth up to the
age of 21 who are adjudicated delinquents, members of "families in need of service", or youth at risk (youth who
exhibit behavior that, if continued, would bring them into contact with the juvenile justice system).
DYS-21
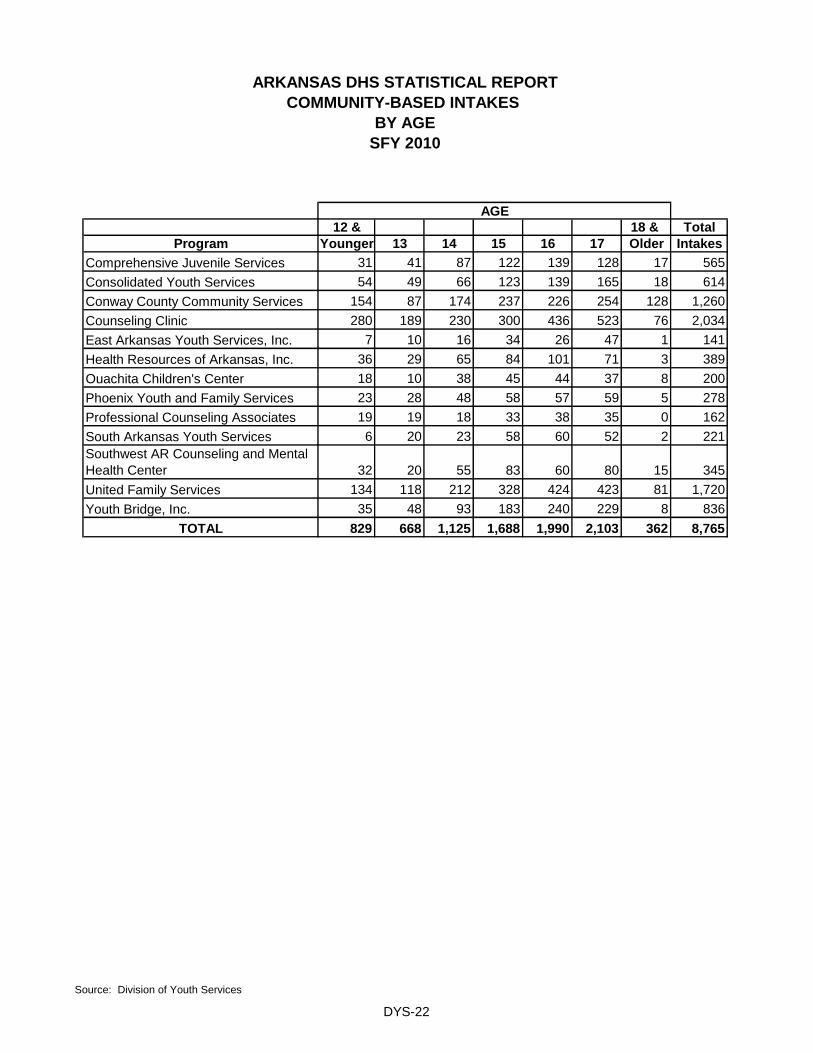
AGE
12 & 18 & Total
Program Younger 13 14 15 16 17 Older Intakes
Comprehensive Juvenile Services 31 41 87 122 139 128 17 565
Consolidated Youth Services 54 49 66 123 139 165 18 614
Conway County Community Services 154 87 174 237 226 254 128 1,260
Counseling Clinic 280 189 230 300 436 523 76 2,034
East Arkansas Youth Services, Inc. 7 10 16 34 26 47 1 141
Health Resources of Arkansas, Inc. 36 29 65 84 101 71 3 389
Ouachita Children's Center 18 10 38 45 44 37 8 200
Phoenix Youth and Family Services 23 28 48 58 57 59 5 278
Professional Counseling Associates 19 19 18 33 38 35 0 162
South Arkansas Youth Services 6 20 23 58 60 52 2 221
Southwest AR Counseling and Mental
Health Center 32 20 55 83 60 80 15 345
United Family Services 134 118 212 328 424 423 81 1,720
Youth Bridge, Inc. 35 48 93 183 240 229 8 836
TOTAL 829 668 1,125 1,688 1,990 2,103 362 8,765
Source: Division of Youth Services
ARKANSAS DHS STATISTICAL REPORT
COMMUNITY-BASED INTAKES
BY AGE
SFY 2010
DYS-22

109
84
25
132
97
35
67
0
19
Source: Division of Youth Services
Requests for Home Evaluation/Supervision Sent by Arkansas to Other States
Probation Referrals
Parole Referrals
ARKANSAS DHHS STATISTICAL REPORT
INTERSTATE COMPACT ON JUVENILES
SFY 2010
The Interstate Compact on Juveniles (ICJ) was designed primarily for cases involving out-of-state runaways,
escapees and absconders, and for the supervision of juveniles who have been adjudicated delinquent. It
provides legal procedures for the return of runaways and makes it possible to place a juvenile on probation or
parole in a state other than the one where the offense was committed with the assurance of supervision by the
appropriate agencies of the state in which he/she is placed.
Number of Absconders (Youth on Probation or Parole)
Requests for Home Evaluation/Supervision Received by Arkansas from Other States
Probation Referrals
Parole Referrals
Number of Runaways Returned (Non-Delinquent Youth)
Number of Escapees (Youth Committed to Facility)
DYS-23


ARKANSAS DHS STATISTICAL REPORT
GLOSSARY
SFY 2010
Compliance Monitoring/Electronic Monitoring (DYS) is a program which monitors a juvenile's presence in a
particular location in order to enable the juvenile to remain in the home or return to the home, thus preventing
institutionalization or re-institutionalization. Services are provided in accordance with an established plan of service
and include contact with the juvenile to determine compliance with the plan.
Adult Protective Services (DAAS) protects and assists adults, age 18 and older, who are abused, neglected, or
exploited, or any combination thereof, and who are endangered as a result of lack of capacity or impaired from
mental or physical disease or defect as these terms are defined by Arkansas Statute.
AMIGOS Program (DOV) helps English as a Learned Language students (ELL) deal with culture shock and new
learning environments. The mission of the AMIGOS program is to support and enhance the lives and academic
skills of students who speak English as a second language.
ARKids First (DCO & DMS) provides health insurance to children who otherwise might not get medical care. The
program offers two coverage options. ARKids A offers low-income children a comprehensive benefits package.
ARKids B provides limited coverage for slightly higher income families. ARKids B requires a small co-pay for most
services.
Commodity Distribution Program (DCO) processes and distributes raw commodities donated by the U.S.
Department of Agriculture to schools and other eligible recipient agencies in Arkansas.
Alternative Community Services (DDS) program under the Medicaid Waiver, analyzes and develops policy,
researches and develops innovative programs, assists with grant applications, and oversees quality improvement
activities.
Crisis Residential Services (DYS) includes intervention and stabilization of a juvenile in an existing facility that
provides a structured setting, close supervision, and necessary interventions to allow the juvenile to return home.
Services in a hardware secure facility are limited to fourteen (14) days per sanction. This service may include, but
is not limited to, education and room and board.
Day Services (DYS) provides educational and therapeutic services to juveniles who have been initially ordered
such services by the court or as a part of a legally authorized Diversion Agreement. The service is primarily to be
provided as a sanction for non-compliance with a court order or an established aftercare plan. This service may
also be used as an alternative to juvenile adjudication (Non-Sanction) to non-adjudicated youth who have been
referred by a local school district, a juvenile intake officer, or by family. This service is designed to enhance a
youth's behavior, academic performance, and interpersonal skills in a structured setting, either in a group or in a
one-to-one basis, based on an individual case plan. The program is provided for a period of less than twenty-four
(24) hours but more than two (2) hours and may include, but is not limited to, meals, transportation, therapy, anger
management, counseling, peer relationships, recreation, socialization, and education.
Diagnosis and Evaluation (DYS) is assessment of the nature and extent of a youth's physical, emotional,
educational and behavioral problems and recommendations for treatment strategies to remedy the identified
problems. The specific diagnostic services provided and level of sophistication of reports produced are based on
the individual needs of the referring agency. Allowable components are educational evaluation, social assessment,
psychological evaluation, psychiatric evaluation, and consultation with the referring agency. Evaluations may also
include a medical evaluation, if the assessment indicates a physical association with the emotional and/or
behavioral problem(s).
Developmental Day Treatment Clinic Services (DDS) services may be provided in the child’s home or in
integrated day care programs, local health department offices, or clinics.
Glossary-1

ARKANSAS DHS STATISTICAL REPORT
GLOSSARY
SFY 2010
Intensive Supervision and Tracking (DYS) is to provide intensive supervision and tracking services to juveniles
who have been initially ordered this service by the court or as a part of a legally authorized Diversion Agreement.
The service may also be used as a sanction for non-compliance with a court order or an established aftercare plan.
The primary goal of this program is to support the youth in their homes primarily through individualized, consistently
close supervision and monitoring. The service is available seven (7) days a week and may be performed at any
hour of the day or night, depending on the situation.
Drug Screenings (DYS) is the collection and analysis of urine samples to determine if a youth is using drugs. May
only be provided as a subordinate part of a sanction service for adjudicated delinquents or youth on aftercare
status. This service may also be provided as Non-Sanction Drug Screening as a subordinate part of another
service as a diversion from juvenile court or as court ordered for adjudicated Family In Need of Services (FINS).
The Sanction Services are limited to the length of time a sanction is imposed. The Non-Sanction Services are
limited to a period not to exceed six (6) months per each court order.
Food Stamp Program (DCO) provides food assistance to eligible households to cover a portion of a household’s
food budget. In addition to food assistance, the program provides food stamp recipients with nutrition education,
employment & training, and work experience in some cases.
Hyperalimentation (DMS) is the administration of nutrients by intravenous feeding especially to patients who
cannot ingest food through the alimentary tract (the tubular passage that begins from mouth and functions in
digestion and absorption of food and elimination of residual waste.)
IndependentChoices (DAAS) is a consumer-directed Medicaid waiver for Medicaid eligible persons age 18 and
above who have a medical need for personal care service. This consumer directed service gives clients a monthly
cash allowance in place of traditional personal care. Eligible persons are able to choose, supervise and pay their
own personal care aide and use some of the allowance to purchase goods and services related to personal care
needs.
Intensive Casework Management (DYS) are services specifically designed for youth committed to a youth
services facility operated by the Division of Youth Services. This should provide a community evaluation that
includes recommendations for release plans, services to families of committed youth, advocacy on behalf of the
youth, supervision, transportation, and follow-up. It may also include visiting youth at the Youth Services Center(s),
under certain circumstances.
Intensive Casework Management For Serious Offenders (DYS) are services specifically designed for youth
committed to the Division of Youth Services who have completed the residential phase of a serious offender
program and who have been transferred back to the community. Services include, but are not limited to,
recommendations for release plans, services to families of committed youth, advocacy on behalf of the youth,
supervision, transportation, and follow-up.
Emergency Shelter (DYS) are services, including room and board, for youth whose circumstances or behavioral
problems necessitate immediate removal from their homes or for youth released from a youth services facility who
need temporary placement in the community until long term residential arrangements can be made. The purposes
of Emergency Shelters are (1) to provide shelter for a period necessary to make more permanent arrangements or
(2) to provide a short-term alternative to secure detention. The extent and depth of the services provided to a youth
in the Emergency Shelter program will depend upon the individual needs of the youth and the referral source.
Emergency shelter is limited to a maximum of sixty (60) days in any six month period. An order from Juvenile Court
may supercede the stated time constraints.
Emergency Shelter Grants Program (DCO) assists local communities to improve the quality of life for the
homeless by: (1) Providing grants for minor renovations, rehabilitation or conversion of buildings for the homeless,
(2) Providing funds for payments of certain operating and maintenance expenses, (3) Providing funds for essential
social services expenses, and (4) Providing funds to be used for homeless prevention efforts.
Family Planning (DCO & DMS) provides limited coverage that includes family planning services only to women of
childbearing age and who also meet income, resources and other criteria.
Glossary-2

•
•
•
ARKANSAS DHS STATISTICAL REPORT
GLOSSARY
Community Service Work: A program that provides a site for community service work, supervision of the
juvenile on the work site by program staff or via monitoring of reports from the work site, and reports to
the court regarding compliance with the established case plan. The program may mediate between the
victim and the offender to determine the amount of restitution.
Restorative Justice (DYS) is the compensation to a crime victim by the offender. Restorative justice programs
may take minor offenders as well as serious offenders. This service may also be offered as Non-Sanction
Restorative Justice programs but would then be limited to non-adjudicated youth as a diversion from adjudication
by juvenile court. This program consists of three types of programs:
Cash: A program which assists the offender in obtaining employment and, in some cases, provides
supervision to the juvenile to monitor the payment of restitution to the victim or the juvenile's employment
to ensure compliance with the established plan of service.Restitution (Work for the Victim): A program that monitors a juvenile's work activities to compensate a
victim. The service may include arrangement of scheduled activities, monitoring of work performed, and
reports to the court or DYS regarding compliance with the established case plan. The program may
mediate between the victim and the offender to determine the amount of restitution.
Interstate Compact on Juveniles (DYS) provides for the supervision of out-of-state delinquent juveniles, provides
for the return of runaways, provides authorized agreements for the cooperative institutionalization of special types
of juveniles, and provides for the return of absconders and escapees. Allowable components include initial
evaluation, supervision, follow-up reports, and discharge.
SFY 2010
Medically Needy (DCO & DMS) is intended to provide medical services for categorically related individuals or
families whose income and/or resources exceed the limits for cash assistance but are insufficient to provide
medical care.
Low Income Home Energy Assistance Program (LIHEAP) (DCO) provides financial assistance to about 60,000
households each year to help them meet the costs of home energy i.e. gas, electricity, propane, etc. It also offers
weatherization services and case management activities which are designed to encourage and enable households
to reduce their energy costs and thereby, their need for financial assistance.
Medicaid (DCO & DMS) reimburses health care providers for covered medical services provided to eligible needy
individuals in certain categories. Eligibility is determined based on income, resources, Arkansas residency, and
other requirements.
Medicaid Eligible (DCO & DMS) is a person who has met certain requirements to obtain a Medicaid card.
Medicaid Recipient (DMS) is a person who uses their Medicaid card to receive Medicaid services.
Pregnant Women (DCO & DMS) with income up to 200% of Federal Poverty Level may be eligible for limited
coverage if they meet certain income, resource and other criteria, including prenatal, delivery, postpartum and
conditions, which may complicate the pregnancy. Coverage continues through the pregnancy and until the end of
the month that the 60th day postpartum falls.
Refugee Resettlement Program (DCO) assists newly arrived eligible refugees to assimilate into the American
way of life, offering financial and medical services to eligible refugees for up to five years.
Residential Treatment (DYS) is twenty-four hour treatment services available for up to one year for each
individual (recommended average: four to six months), for youth whose emotional and/or behavioral problems, as
diagnosed by a qualified professional, cannot be remedied in his or her own home. Room and board is limited to
six months in a one-year period. An order from Juvenile Court may supercede the stated time constraints.
Long-Term Care (DCO & DMS) - individuals who are residents of nursing homes may qualify for Medicaid if the
care in the facility is medically necessary and they meet income, resource and other criteria.
Preadmission Screening Resident Review (DDS) program for Medicaid recipients seeking admission to a
nursing home or presenting a mental status change while residing in a nursing home.
Glossary-3
Vocational Rehabilitation (DSB) objective is to ensure that qualified blind and visually impaired persons work in
appropriate careers and become as personally and economically independent as possible.
Weatherization Assistance Program (DCO) installs energy conservation materials on the homes of 1,300 low-
income families annually to lower utility bills. Materials generally installed include insulation of ceilings, duct
sealing, weather-stripping and caulking doors and windows, replacement of broken windows and health and safety
measures that are required prior to weatherization.
Work Pays (DCO) is an incentive program designed to encourage working TEA clients to remain employed after
closure of the TEA case while increasing their hours of work and/or hourly wage. Families participating in
Arkansas Work Pays will receive a monthly cash assistance payment in the amount of $204 for up to 24 months,
provided they meet the Work Pays eligibility requirements. The twenty-four months will count toward the federal 60
month time limit but not the state's TEA 24 month limit. This work incentive program may be limited to 3,000
families. This program was implemented in July 2006.
The Emergency Food Assistance Program (TEFAP) (DCO) makes surplus and purchased agricultural
commodities available to low income households. The commodities are intended to supplement other foods and
not serve as a household's sole or main food source.
Therapy (DYS) is a therapeutic relationship between the client and a qualified therapist for the purpose of
accomplishing changes that are identified as goals in the case plan through the use of various counseling
techniques. Services to specific individuals may include individual, group or family therapy, or consultation with the
referral source as needed.
Transitional Employment Assistance (TEA) (DCO & DMS) program is a time-limited assistance program to help
needy families with children become more responsible for their own support and less dependent on public
assistance. In addition to monthly cash assistance, employment-related services are provided to parents, including
job-readiness activities, transportation assistance, childcare assistance, and other supportive services so that the
parent can engage in work or education and training activities.
U-18 (DCO & DMS) is a Medical Assistance Only category intended to provide services to needy individuals under
18 years of age who meet the TEA income and resource requirements.
Special Nutrition Programs (DCCECE) provides reimbursement for well-balanced, nutritious meals served to
individuals enrolled in the Child and Adult Care Food Program, National School Lunch Program, Special Milk
Program , and the Summer Food Service Program.
Substance Abuse Services (DBHS) The Office of Alcohol and Drug Abuse Prevention (ADAP) within the Division
of Behavioral Health Services is the single state agency responsible for funding of alcohol and drug prevention and
treatment services, providing court ordered treatment, licensing of alcohol and drug treatment programs, the State
Methadone Authority, administering the Drug and Alcohol Safety Educational Programs and providing training to
the field of substance abuse.
Targeted Case Management (DYS) are services that assist an individual or family in accessing needed medical,
social, educational, and other services appropriate to the needs of the individual/family. Targeted case
management services include client intake, assessment, periodic reassessment, case plan development and
review, service referral, coordination and advocacy, monitoring of client service utilization, record keeping and
documentation of service contacts and client progress, and transportation.
SFY 2010
GLOSSARY
ARKANSAS DHS STATISTICAL REPORT
Glossary-4