
Offenses around Stadiums: A Natural Experiment on Crime Attraction and Generation
25
http://jrc.sagepub.com/ and Delinquency Journal of Research in Crime http://jrc.sagepub.com/content/early/2013/01/11/0022427812471349 The online version of this article can be found at: DOI: 10.1177/0022427812471349 2013 published online 21 January Journal of Research in Crime and Delinquency Justin Kurland, Shane D. Johnson and Nick Tilley Attraction and Generation Offenses around Stadiums: A Natural Experiment on Crime Published by: http://www.sagepublications.com On behalf of: John Jay College of Criminal Justice, City University of New York be found at: can Journal of Research in Crime and Delinquency Additional services and information for http://jrc.sagepub.com/cgi/alerts Email Alerts: http://jrc.sagepub.com/subscriptions Subscriptions: http://www.sagepub.com/journalsReprints.nav Reprints: http://www.sagepub.com/journalsPermissions.nav Permissions: What is This? - Jan 21, 2013 OnlineFirst Version of Record >> at UCL Library Services on January 21, 2013 jrc.sagepub.com Downloaded from
Transcript of Offenses around Stadiums: A Natural Experiment on Crime Attraction and Generation

http://jrc.sagepub.com/and Delinquency
Journal of Research in Crime
http://jrc.sagepub.com/content/early/2013/01/11/0022427812471349The online version of this article can be found at:
DOI: 10.1177/0022427812471349
2013 published online 21 JanuaryJournal of Research in Crime and Delinquency
Justin Kurland, Shane D. Johnson and Nick TilleyAttraction and Generation
Offenses around Stadiums: A Natural Experiment on Crime
Published by:
http://www.sagepublications.com
On behalf of:
John Jay College of Criminal Justice, City University of New York
be found at: canJournal of Research in Crime and DelinquencyAdditional services and information for
http://jrc.sagepub.com/cgi/alertsEmail Alerts:
http://jrc.sagepub.com/subscriptionsSubscriptions:
http://www.sagepub.com/journalsReprints.navReprints:
http://www.sagepub.com/journalsPermissions.navPermissions:
What is This?
- Jan 21, 2013OnlineFirst Version of Record >>
at UCL Library Services on January 21, 2013jrc.sagepub.comDownloaded from

Offenses aroundStadiums: A NaturalExperiment on CrimeAttraction andGeneration
Justin Kurland1, Shane D. Johnson1, and Nick Tilley1
AbstractObjectives. Inspired by ecological theories of crime, the aim of this studywas to make use of a natural experiment to see if a U.K. soccer stadium gen-erates or attracts crime in the area that surrounds it. Method. Data for theftand violent crime around Wembley stadium are analyzed to see if the rate(per-unit time and ambient population) of crime differ for days on which thestadium is used and those it is not. In addition, differences in the spatial andtemporal distribution of crime are examined for these two types of days.Results. Analyses indicate that on days when the stadium is used, the rateof crime per-unit time is elevated, but that the rate per ambient populationat risk is not. The spatial and temporal pattern of crime also clearly differsfor the two types of days. For example, the level of crime is elevated in thesurrounding area when the stadium is used relative to when it is not. Con-clusions. The case study suggests that the facility studied contributes to lev-els of crime in the area that surrounds it. The research provides further
1 UCL Department of Security and Crime Science, London, United Kingdom
Corresponding Author:
Justin Kurland, UCL Department of Security and Crime Science, 35 Tavistock Square, London
WC1H 9EZ, United Kingdom
Email: [email protected]
Journal of Research in Crime andDelinquency
00(0) 1-24ª The Author(s) 2013
Reprints and permission:sagepub.com/journalsPermissions.nav
DOI: 10.1177/0022427812471349http://jrcd.sagepub.com
at UCL Library Services on January 21, 2013jrc.sagepub.comDownloaded from

support for ecological theories of crime and their utility in informingcriminological understanding and policy-related questions.
Keywordsmeasurement, crime, policy crime, criminological theory, routine activitytheory, criminological theory, quantitative research, research methods
Introduction
Soccer has been associated with crime and disorder since the Middle Ages
(Elias and Dunning 1971). There have been diverse attempts at explanation
and prevention, which go back just as far. There has, though, been little
empirical research to determine whether explanations are adequate or
whether preventive measures have been effective (De Vreese 2000; Losel
and Bliesener 2003). The problems persist (Frosdick and Marsh 2005) and
anecdotal evidence (Home Office 2004-2009) suggests that crime and dis-
order associated with the games extend outside the stadiums. In this article,
we adopt an ecological approach to explanation and present empirical
analyses regarding patterns of crime for the largest stadium in Wembley,
United Kingdom.
Ecological approaches to crime focus on patterns in space and time.
They locate their genesis in attributes of the social and physical environ-
ment in which offending takes place rather than the psychology of offenders
(Brantingham and Brantingham 1984; Clarke and Cornish 1985). More-
over, the immediate environment is itself seen to be nested in a wider set-
ting, giving rise to the immediate situation. Two related theories suggest the
main constituents of the social and physical environment for soccer-related
crime and disorder. According to the first, ‘‘routine activity theory,’’ crimes
occur when a ‘‘likely offender’’ encounters a ‘‘suitable target’’ in the
absence of a ‘‘capable guardian,’’ an ‘‘intimate handler,’’ or ‘‘place man-
ager’’ who might otherwise restrain the offender (Eck 1994; Felson 1986;
Felson and Cohen 1980). Crime patterns across space and time are deemed
a function of the supply, distribution, and movement of these five types
of actor.
The second, ‘‘crime pattern theory,’’ explains offense patterns in terms
of the awareness and activity dynamics of those committing crimes (Bran-
tingham and Brantingham 1993a). Offenders, like everyone else, are famil-
iar with some places but not others. They tend to commit crime in places
they know to provide potential targets but where they are unlikely to be
2 Journal of Research in Crime and Delinquency 00(0)
at UCL Library Services on January 21, 2013jrc.sagepub.comDownloaded from

recognized by others who might intervene or report them to the police. This
means, for most perpetrators, places near to home, work, or other routine
activity nodes. Likely targets in these places are those perceived to yield
utility (Cornish and Clarke 1986) in the form of goods successfully stolen
or some other nonmaterial satisfaction.
‘‘Hot spots’’ (and times) of crime, such as those associated with soccer
matches—and other events that large numbers of people attend in one
place—may be explained in these terms. Crime pattern theory emphasizes the
importance of places or facilities (see also Eck et al. 2007) that act as ‘‘attrac-
tors’’ or ‘‘generators’’ of crime (Brantingham and Brantingham 1995). Both
forms of hotspot are rich in suitable targets. The conceptual distinction is
between those that draw intending offenders to them because of known suit-
able targets (crime attractors) and those that are frequented by a population
which includes offenders, who take advantage of serendipitous opportunities
encountered (crime generators; e.g., Brantingham and Brantingham 1993b).
Locations such as railway stations and high schools are considered crime gen-
erators (e.g., Roncek and Lobosco 1983), while both check-cashing and
liquor stores function as crime attractors (e.g., Gorman, Speer, and Gruen-
wald, 2001; Rengert, Ratcliffe, and Chakravorty 2005). However, while these
have been accepted as such, empirical research that supports their classifica-
tion in this way is not unequivocal. One reason for this is that it is difficult to
estimate the influence of particular facilities on crime patterns, as the facili-
ties of interest are always present in the environment, which precludes the use
of experimental methods to examine their impacts. Moreover, the reason that
there may be more crime in the environment surrounding a particular facility
may have more to do with the characteristics of that environment than the
facility itself. This issue of causality is particularly acute given that facilities
are not randomly located. Rather, retailers or other business owners tend to
open facilities at strategic locations that are likely (for example) to maximize
the potential for trade (Hillier and Hanson 1984). The problem is that the con-
ditions (such as high footfall) that make a location attractive to businesses (or
other facilities) may also be those that are conducive to crime. This type of
confound is difficult to rule out without using (quasi) experimental methods,
and these have hitherto rarely been used in this kind of research (but for anal-
yses of the introduction of new transport facilities, see Billings et al., 2011;
Ligget et al., 2003).
It is conjectured here that soccer matches (and other stadiums events)
comprise a distinct place-and time- specific crime attractor/generator.
Unlike other types of entertainment facilities, the activity that takes place
within soccer stadiums, and hence the effect they have on the ecology of the
Kurland et al. 3
at UCL Library Services on January 21, 2013jrc.sagepub.comDownloaded from

surrounding area, is episodic occurring on only a fraction of days at specific
times. We suggest that this creates conditions that approximate a natural
experiment, which facilitates the estimation of levels of crime and disorder
on days when the stadium is closed to act as a counterfactual against which
to compare patterns on days when it is used.
The remainder of the article will use Wembley Soccer Stadium (United
Kingdom) as a case study to explore the usefulness of the ecological the-
ories discussed in explaining patterns of crime and disorder associated with
soccer matches and other events. Wembley hosts not only soccer matches
but a range of other event types, including concerts and other sporting
events. These are attended by different populations, which result in different
conditions, and hence different expectations for potential crime problems.
Accordingly, two major categories of crime event were analyzed: violent
and theft and handling offenses (‘handling’ in England and Wales refers
to the receipt of stolen goods). The distinction between violent crime and
theft and handling offenses was made because each has its own motivations
and precipitators. For example, a precipitator of theft may be opportunity
due to lack of supervision (Engstad 1975; Mustaine and Tewksbury
1998) while precipitators of violence in this context may include provoca-
tion from opposing fans’ chants (e.g., Rotten et al. 1978; Russell 2004).
Our approach is important for two reasons: (1) It is the only empirical
study we know of that has examined patterns of crime around a soccer
stadium; and (2) although crime pattern theory was formulated decades ago,
empirical research concerning the attractor/generator hypothesis is limited
or has been subject to methodological difficulties (see above). Moreover, in
previous research, in the absence of suitable denominators, scholars have
tended to examine the change in the frequency of crime around facilities but
not in the associated rates, and when rates have been considered these are
typically calculated using the residential household population provided
in national censuses (see Andresen and Jenion 2010).
In the current study, we use measures of the ambient population in
combination with attendance figures from soccer matches and other events
to estimate meaningful denominators thereby allowing us to examine both
changes in the frequency and rate of crime on days when the stadium is used
and those when it is not. This allows a more nuanced examination of pat-
terns than is possible with simple counts of crimes. To elaborate, in terms
of hotspot typologies, Clarke and Eck (2003) define an area or facility as
a crime generator if it has a high count of crime but a low rate per population
at risk. In contrast, crime attractors are defined as those areas or facilities
that experience a high volume and rate of crime (per population at risk).
4 Journal of Research in Crime and Delinquency 00(0)
at UCL Library Services on January 21, 2013jrc.sagepub.comDownloaded from
In the current study, our interest is for a facility that has only episodic use.
Thus, we define such a facility as a crime generator if, relative to the
days on which it is not used, (on days which it is) it has an elevated
count of crime but the rate of crime per ambient population at risk
remains unchanged (or is lower). In contrast, we define such facilities
as crime attractors if, relative to days on which they are not used, on
the days that they are, both the count and rate of crime are elevated.
Following from this rationale, the first two hypotheses articulated below
refer to the dominant mechanism liable to lead to elevated crime levels,
while the third represents the possibility that both mechanisms operate
simultaneously:
1. The mostly crime attractor hypothesis. Events at stadiums attract large
numbers of likely offenders who wish to take advantage of the oppor-
tunities furnished, either in terms of the suitable targets for property
crime (large numbers of preoccupied people, unfamiliar with their
surroundings and with attractive goods about their persons) or in terms
of suitable targets for violent crime (notably fans of opposing teams).
According to this hypothesis, we would expect an increase in crime
to be associated with soccer matches and events and this to exceed the
(proportional) increase in the ambient population.
2. The mostly crime generator hypothesis. Events attract large numbers of
people some of whom are likely offenders for violent or property crime,
some of whom are suitable targets for violent or property crime and
some of whom are capable guardians of the otherwise suitable targets
for crime. When the likely offender meets the suitable target in the
absence of a capable guardian, offenses are likely to take place.
According to this hypothesis, an increase in crime will be associated
with soccer matches and events but that increase will be less than or
proportional to the increase in the ambient population.
3. The simultaneous crime generator/crime attractor hypothesis. Many
events and places that act as crime generators may also act as crime
attractors: What furnishes ample opportunities for the offender who
happens to be at a location may also attract offenders aware of the
available opportunities. Thus, soccer matches and events may simulta-
neously act as both crime attractors and generators. This would be
demonstrated (for example) by an increase that exceeds the propor-
tional change in ambient population for one crime type along with
increases that are less than or equal to the increase in ambient popula-
tion for others.
Kurland et al. 5
at UCL Library Services on January 21, 2013jrc.sagepub.comDownloaded from
As discussed, the analyses reported here are for the new Wembley
Stadium. Located in North London (United Kingdom), the stadium opened
in 2007 and seats 90,000 spectators. It is owned by the Football Association
(the governing body for English soccer) and hosts major national and
international games as well as a range of other types of event. In the sections
that follow, we discuss the data used, our analytic strategy and results, and
conclude by discussing the implications of the results for criminological
understanding and public policy.
Data and Method
We use three distinct data sets, as follows:
Timing of matches and other events—The Wembley Stadium website was
used to compile a set of dates, times, and attendance figures (http://
www.wembleystadium.com) for each soccer match and non-soccer event
that took place at the stadium between March 2007 and November 2009.
Over the period for which data were analyzed, there were 42 days when soc-
cer games were played, and 36 when events other than soccer matches were
held at the stadium. For the events there were a total of 21 concerts, seven
rugby matches, three American football games, three charity events, one
automobile race, and one track and field event. The website also provided
specific information about how spectators could commute to the stadium
via public transport which provided us with a detailed study area (see
Figure 1).
Crime data—The Metropolitan Police Service (MPS) provided three years
(2007 to 2009) of crime data geocoded to a spatial resolution of 1 m. The
MPS data related to incidents in the three municipal areas within which
the stadium and four subway stations serving it are located (see Figure
1). The total area amounts to 6.76 km2, with the boundary being up to
3.15 km from the stadium. The geocoded crime data for all three municipal
areas are used to examine whether differences exist in the overall counts of
offenses, the spatial and temporal distribution of offenses and as the
numerator for the calculation of day-specific crime rates to help classify the
stadium in terms of the hotspot typologies discussed above. The data ana-
lyzed were for days when soccer games were played, days when other
events were held at the stadium, and days when neither occurred.
The data analyzed are for violent crime and theft and handling
offences—two of the nine (burglary, criminal damage, drug offences, fraud
6 Journal of Research in Crime and Delinquency 00(0)
at UCL Library Services on January 21, 2013jrc.sagepub.comDownloaded from

and forgery, other notifiable offences, robbery, sexual offences, theft and
handling, and violence against the person) categories of offenses that police
forces in England and Wales are required to record by the Home Office. The
violent offenses analyzed exclude sexual offenses, robbery and homicide,
and hence quite specifically relate to violence against the person. The
offence theft involves the taking of property from a person without the
threat of, or actual violence. The offense of handling criminalizes any dis-
honest dealing with property acquired through theft and is roughly equiva-
lent to the possession of stolen property in the United States or the
possession of property obtained by crime in Canada.
Estimates of the ambient population—U.K. census data provide an esti-
mate of the number of people who live in an area, but this may be quite
different to the on-street population. We therefore calculated the typical
ambient population for the entire study area using LandScanTM data. Gen-
erated by the Oak Ridge National Laboratory using Geographic Informa-
tion from a range of sources including remote sensing data, these provide
an estimate of the ambient population of an area (averaged over 24 hours)
Figure 1. Map of the three wards (municipal areas) that make up the study area andthe location of the rail stations that service Wembley National Stadium.
Kurland et al. 7
at UCL Library Services on January 21, 2013jrc.sagepub.comDownloaded from

at a spatial resolution of approximately 1 km2. Using a Geographical Infor-
mation System, we identified each of the 1 km2 grid cells located wholly
or partly within the boundary of the three municipal areas (Figure 2).
Employing this method, an estimated ambient population of 40,048 was used
as the denominator for calculating crime rates on comparison days.
For match and event days, we also obtained figures of the numbers of
tickets sold. For match days, the average number of tickets sold was
69,090 (SD ¼ 23,059), while for event days it was 71,871 (SD ¼17,776). LandScan data do not include counts for intermittent popula-
tions such as users of a stadium and therefore for match and event days,
we sum the number of tickets sold for that event and the LandScan
counts to provide a general estimate of the population at risk for each
day. The rate of crime was then estimated by simply dividing the
offense count for that day by the revised estimate of the ambient pop-
ulation for match and event days.
Analytic Strategy
To estimate the effect that soccer matches or events might have on spatio-
temporal patterns of crime, a set of comparable days on which neither
matches nor other events occurred were identified. To do this, for each
match or event day, we identified the same day of the week seven days
before or after that event. If no match or event had occurred on either date,
and if neither day had already been selected as a comparison day for
another match or event, the earlier date was selected as the comparator
to leave sufficient comparison days for matches and events that occurred
at a later date. However, if both dates were unavailable due to a match or
event taking place on them, or because they had been previously selected
as a comparator, then the search for a comparator day was extended to a
fourteen day interval. If still no suitable comparator was identified, the
search was expanded to twenty-one days and then to twenty-eight days.
Using this approach, comparator days were identified for all soccer
matches and events. This approximates a natural experiment. It was not
possible, of course, to randomly assign match and non-match, event and
non-event days. Instead, natural variation in the dates of their occurrence
was used, making best-available comparisons for each pair. The downside
of this, of course, is that some unknown systematic bias may have been
introduced. The upside is that there can have been no adaptation by key
agents to the understanding that an experiment was being conducted.
8 Journal of Research in Crime and Delinquency 00(0)
at UCL Library Services on January 21, 2013jrc.sagepub.comDownloaded from

Because there may have been some unknown bias, further predictions for
the distinct expected signatures of event and soccer matches were also
examined. These related to the times within the day when crime events
were recorded and where they took place.
To examine differences in the spatial distribution of crime for match
and non-match days, we computed the distance of each crime from the sta-
dium so that we could see if the spatial pattern varied for match and event
days, and their comparators. In conducting the analysis, we were inter-
ested in differences in the actual distributions rather than the central ten-
dency of them. For this reason, a comparison of the mean distance that
Figure 2. Map of estimates of the ambient population. (i) Comprises an example ofa 1 km2 cell completely encapsulated by the boundary. For such cells, the totalestimated population in that cell was added to the area-level count of the ambientpopulation. (ii) Comprises an example of a cell that is only partially within the areaboundary. For such cells, we allocate A/C (where, A is the area of the cell that iswithin the boundary and C is the constant 1 km2) of the estimated population forthat cell to the area-level estimate. Note that this assumes that the population isuniformly distributed across each cell. This may be an unreasonable assumption, butin the absence of an alternative this was the approach used.
Kurland et al. 9
at UCL Library Services on January 21, 2013jrc.sagepub.comDownloaded from

events occurred from the stadium for the four types of day would not be
particularly informative. A number of statistical tests could be used to
examine differences in the distributions. As the data are for offense
counts, a w2 test could be used, with the categories of the contingency table
representing different spatial intervals (e.g., 0–200 m, 201–400 m, etc.)
from the stadium. However, a disadvantage of it is that we would have had
to categorize offenses as occurring within particular predefined—and
essentially arbitrary—spatial bandwidths of the stadium. Changing the
exact bandwidths used could affect the sensitivity of the test and may even
lead to very different conclusions.
For this reason, we used the Kolmogorov–Smirnov (Lilliefors 1967)
or KS test, which is not subject to the problem discussed above. The
approach to analysis is to first construct an empirical cumulative distri-
bution function (ECDF) for a particular variable (X) for each sample (i)
of interest. In our case, X is a vector that contains the distances that the
crimes considered occurred from the stadium. For each possible value
of X, the relative frequency (or fraction, f(x)) with which a value equal
to or less than x is observed is computed. The values of f(x) for any
sample will thus range from some minimum value to 1. To examine the
distributions, the f(x) values are plotted against the rank-ordered values
of X for sample i. As illustrated in the left panel of Figure 3, two
ECDFs are compared by computing the maximum absolute difference
(Dmax) between the f(x) values for every possible value of X. Large
absolute differences suggest that the two samples may be drawn from
different populations. The null hypothesis is tested by comparing the
observed Dmax with a distribution of expected values generated by
assuming that the two samples are drawn from the same population. The
latter can be found in statistical tables or derived more directly using a
permutation test. We use the latter, because this minimizes the distribu-
tional assumptions required (Massey 1951).
The principle for generating the expected distribution for Dmax is as
follows. All of the distances at which offenses occurred from the sta-
dium are stored in a single vector. Two samples are then drawn from
this vector using a uniform, a random number generator (without
replacement). The size of the samples is the same as for the observed
sample sizes. These represent the distributions for the match and non-
match days, generated assuming the null hypothesis that the distribution
of crimes does not differ for the two different types of day. An ECDF is
then generated for each of the two randomly selected samples and the
Dmax value calculated. A Monte Carlo (MC) simulation is used to
10 Journal of Research in Crime and Delinquency 00(0)
at UCL Library Services on January 21, 2013jrc.sagepub.comDownloaded from

generate 999 pairs of samples from all those possible and a sampling
distribution for the expected values of Dmax generated. The statistical
significance of the observed value of Dmax can be estimated using the
formula described by North, Curtis, and Sham (2002):
p ¼ r þ 1
nþ 1;
where, r is the number of Dmax values for the permuted data that are at
least as large as the observed Dmax value, and n is the number of permuta-
tions used (in this case 999). To illustrate the approach, the left panel of Fig-
ure 3 shows two ECDFs and the associated value of Dmax. The right panel of
Figure 3 shows the distribution of the expected values of Dmax generated
using 999 iterations of the MC simulation and assuming that the null
hypothesis is correct. In this case, the observed value of Dmax of .36 was
so extreme that a value at least this large was never generated by the MC
simulation. For such a case, the probability of observing a value at least this
large—assuming the null hypothesis—would be .001.
Results
Counts and Rates of Offenses
Table 1 shows the overall count of crimes for each of the four types of day,
the mean count for each type of day, and the mean rate of crime per
Figure 3. An example of how the Dmax test statistic is calculated (left panel), the dis-tribution for the expected distribution (right panel) computed using the permutationapproach described in the text, and the observed value (dotted vertical line).
Kurland et al. 11
at UCL Library Services on January 21, 2013jrc.sagepub.comDownloaded from

ambient population. On average, more theft and handling offenses were
recorded for event than match days. For violent offenses, the pattern was
reversed. Nonparametric permutation tests confirmed that, on average
(see Appendix), more crimes of both types occurred on match days (both
p’s < .001) than on relevant comparison days. For event days, relative to
the comparison days, significantly more theft and handling offenses
occurred (p < .002), but the number of violent offenses did not differ sig-
nificantly (p ¼ .066).
For match days, non-parametric permutation tests suggest that the rate of
theft and handling offenses (Table 1) was significantly lower than on the
relevant comparison days (p < .001), whereas for violent offenses, the rates
did not differ significantly (p > .14). For event days, the rates were signif-
icantly lower on event days than the relevant comparison days for both
types of crime (ps < .001).
The Temporal Distribution of Offenses
Soccer matches and other events tend to occur at particular times of the
day, and so (if the null hypothesis is incorrect) compared to days on which
the stadium is unused, the likelihood of crime occurrence should differ
systematically over the course of the day for match and event days. To
examine this, for each of the four types of day we aggregated the data and
Table 1. Mean Counts and Rates of Recorded Offenses per 10,000 Persons onDays When Soccer Matches, Events or Neither Occurred
Total(counts)
bM(counts)
cSD(counts)
bM(rate)
cSD(rate) N
Theft and Handling:Match 225** 5.38 3.09 4.98 2.35 42Match comparison 143 3.43 1.84 8.56** 4.61 42Event 308* 8.56 7.24 7.59 5.95 36Event comparison 152 4.38 2.00 10.95** 5.00 36Violent offenses:Match 241** 5.90 3.46 5.32 2.71 42Match comparison 99 2.50 1.90 6.24 4.75 42Event 127 3.53 2.20 3.14 1.92 36Event comparison 106 2.94 1.87 7.35** 4.66 36
Note: Mean ( bM) and standard deviation (cSD) of offense counts per day.* p �.01, ** p �.001.
12 Journal of Research in Crime and Delinquency 00(0)
at UCL Library Services on January 21, 2013jrc.sagepub.comDownloaded from
calculated the number of offenses that occurred within each hour h (or ear-
lier) for each type of offense and generated an ECDF for each. Hypothesis
testing was then conducted in the same way as described for spatial
patterns.
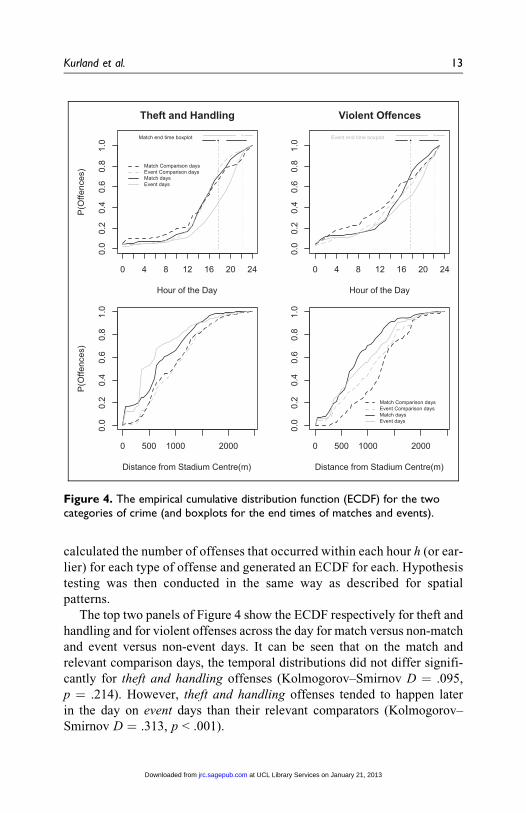
The top two panels of Figure 4 show the ECDF respectively for theft and
handling and for violent offenses across the day for match versus non-match
and event versus non-event days. It can be seen that on the match and
relevant comparison days, the temporal distributions did not differ signifi-
cantly for theft and handling offenses (Kolmogorov–Smirnov D ¼ .095,
p ¼ .214). However, theft and handling offenses tended to happen later
in the day on event days than their relevant comparators (Kolmogorov–
Smirnov D ¼ .313, p < .001).
0 500 1000 2000
0.0
0.2
0.4
0.6
0.8
1.0
Distance from Stadium Centre(m)
P(O
ffenc
es)
0 4 8 12 16 20 24
0.0
0.2
0.4
0.6
0.8
1.0
Theft and Handling
Hour of the Day
P(O
ffenc
es)
Match end time boxplot
Event daysMatch daysEvent Comparison daysMatch Comparison days
0 500 1000 2000
0.0
0.2
0.4
0.6
0.8
1.0
Distance from Stadium Centre(m)
Event daysMatch daysEvent Comparison daysMatch Comparison days
0 4 8 12 16 20 24
0.0
0.2
0.4
0.6
0.8
1.0
Violent Offences
Hour of the Day
Event end time boxplot
Figure 4. The empirical cumulative distribution function (ECDF) for the twocategories of crime (and boxplots for the end times of matches and events).
Kurland et al. 13
at UCL Library Services on January 21, 2013jrc.sagepub.comDownloaded from
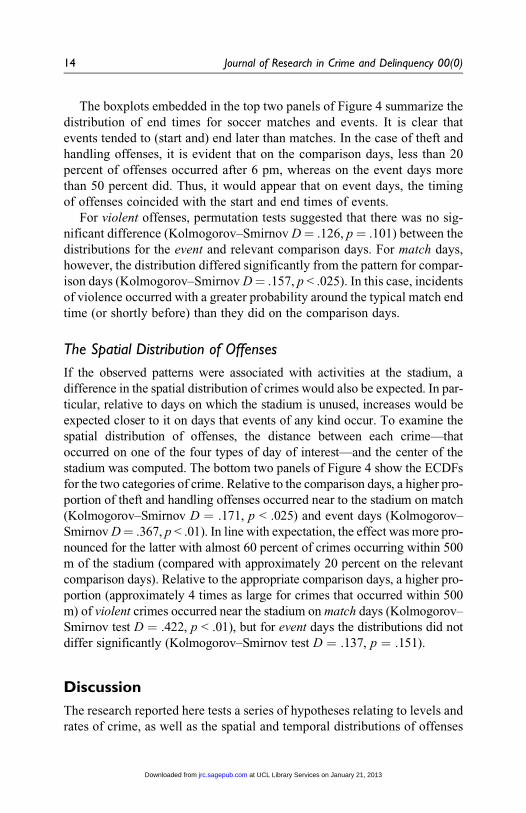
The boxplots embedded in the top two panels of Figure 4 summarize the
distribution of end times for soccer matches and events. It is clear that
events tended to (start and) end later than matches. In the case of theft and
handling offenses, it is evident that on the comparison days, less than 20
percent of offenses occurred after 6 pm, whereas on the event days more
than 50 percent did. Thus, it would appear that on event days, the timing
of offenses coincided with the start and end times of events.
For violent offenses, permutation tests suggested that there was no sig-
nificant difference (Kolmogorov–Smirnov D¼ .126, p¼ .101) between the
distributions for the event and relevant comparison days. For match days,
however, the distribution differed significantly from the pattern for compar-
ison days (Kolmogorov–Smirnov D¼ .157, p < .025). In this case, incidents
of violence occurred with a greater probability around the typical match end
time (or shortly before) than they did on the comparison days.
The Spatial Distribution of Offenses
If the observed patterns were associated with activities at the stadium, a
difference in the spatial distribution of crimes would also be expected. In par-
ticular, relative to days on which the stadium is unused, increases would be
expected closer to it on days that events of any kind occur. To examine the
spatial distribution of offenses, the distance between each crime—that
occurred on one of the four types of day of interest—and the center of the
stadium was computed. The bottom two panels of Figure 4 show the ECDFs
for the two categories of crime. Relative to the comparison days, a higher pro-
portion of theft and handling offenses occurred near to the stadium on match
(Kolmogorov–Smirnov D ¼ .171, p < .025) and event days (Kolmogorov–
Smirnov D¼ .367, p < .01). In line with expectation, the effect was more pro-
nounced for the latter with almost 60 percent of crimes occurring within 500
m of the stadium (compared with approximately 20 percent on the relevant
comparison days). Relative to the appropriate comparison days, a higher pro-
portion (approximately 4 times as large for crimes that occurred within 500
m) of violent crimes occurred near the stadium on match days (Kolmogorov–
Smirnov test D ¼ .422, p < .01), but for event days the distributions did not
differ significantly (Kolmogorov–Smirnov test D ¼ .137, p ¼ .151).
Discussion
The research reported here tests a series of hypotheses relating to levels and
rates of crime, as well as the spatial and temporal distributions of offenses
14 Journal of Research in Crime and Delinquency 00(0)
at UCL Library Services on January 21, 2013jrc.sagepub.comDownloaded from

around Wembley Stadium. The hypotheses were drawn from ecological
criminology, making use in particular of the crime attractor and crime gen-
erator typology. The novelty of the work relates to: (1) the attempt to bring
empirical evidence to understanding the nature of a problem that goes back
to the Middle Ages; (2) the measurement of levels of crime attraction and
generation, which are often referred to in the literature but seldom quanti-
fied; (3) the use of LandScan data to help estimate street level ambient
populations as a more realistic basis for measuring rates of street-level
offenses; (4) the exploitation of conditions approximating a natural experi-
ment in theory testing; and (5) the conduct of criminological research that
has direct use value.
In general, the results suggest that levels of crime are elevated on those
days that the stadium is used. Moreover, differences in the spatial and tem-
poral distribution of crime on days when the stadium is used and those when
it is not are consistent with the idea that the observed increases in the overall
level of crime are associated with the use of the stadium. However, while
the probability of crime per unit time appears to be elevated, the rate of
crime per population at risk does not. In fact, if anything, the rate of crime
per population at risk tended to be lower on days when the stadium was used
than when it was not. Consequently, we suggest that the increases in crime
observed around the stadium are most likely due to the facility episodically
generating rather than attracting crime. That is, stadiums, whether they are
used for soccer matches or any other type of event, are places to which large
numbers of people gravitate for reasons unrelated to criminal motivation, a
proportion of whom are liable to take advantage of criminal opportunities
they happen to come across. Moreover, just as some of those who visit com-
prise likely offenders, others will furnish suitable targets, or act as intimate
handlers or capable guardians. That we find an elevated number of crime
events but a lower rate in relation to the potential victim population would
suggest that the increased supply of intimate handlers and capable guar-
dians, together with place management within the stadium, does more to
contain the potential offenses produced by the influx of visitors to the area
than the increased supply of likely offenders and suitable targets does to
attract them. ‘‘Place management’’ in Wembley Stadium is provided pri-
marily by stewards (private-contract security staff) who work within the sta-
dium to handle turnstiles, assign seating, separate opposing sets of fans, and
provide stage or field security. It is also provided by other staff members
such as food and drink vendors who may intervene directly or call for
security when violence is about to, or has already occurred (Madensen and
Eck 2008).
Kurland et al. 15
at UCL Library Services on January 21, 2013jrc.sagepub.comDownloaded from
Considering the role of informal guardianship, it is possible that we
observe a lower rate of crime when the stadium is used because with
increased population density comes increased natural surveillance (Jacobs
1961; see also, Johnson and Bowers 2010) and mutual guardianship. In the
current study, it was not possible to tease apart the relative contributions of
place managers and informal guardianship on crime, but future research
may seek to do so using observational or other methods. For instance, to
examine the role of informal guardianship, such research might seek to
determine whether there is a negative association between ambient
population density and crime rates at such facilities.
It is important to note that in the analyses of crime rates presented here,
we use data that are aggregated over the course of the day. The reason for
this is that the estimates of the ambient population used—particularly that
proportion based on the LandScan data—relate to a typical 24-hour period
rather than for specific hours of the day. However, it is evident from the
analysis of the timing of offenses that the risk per unit time varies over the
course of the day, being highest around the time that events take place at
the stadium. Thus, in absence of the analysis of how crime rates vary over
the course of the day it may be unwise to rule out the crime attractor
hypothesis on the basis of the available data.
Similarly, we aggregate the data spatially, conducting our analyses for
the three administrative areas that surround Wembley stadium. In the event
that the stadium influences the risk of crime at those locations that are near-
est to it, by including in our analysis data for crimes that occurred farther
away, our estimates of the impact of the stadium on crime may be diluted.
This too would have implications for the crime generator/attractor
hypothesis.
We do not explore variation in crime rates at a more micro level here for
two reasons. The first is a practical issue and concerns our estimate of the
ambient population. That is, the LandScan data are not currently available
at a spatial scale finer than 1 km� 1 km and so the analysis of crime rates at
a lower level of resolution would be problematic. The second is a theoretical
(more important) issue. Unlike smaller facilities such as a bar whose influ-
ence on crime might be expected to be rather localized (see Groff 2011;
Ratcliffe 2011, 2012), Wembley stadium is a large facility that attracts a
substantial number of people, all of whom—given the locations of transport
nodes—to reach the venue, have to move through the wider area that sur-
rounds the stadium. Consequently, we consider it reasonable to assume that
any influence the stadium has on crime should extend to the wider environ-
ment within which it is located, and hence that patterns should be examined
16 Journal of Research in Crime and Delinquency 00(0)
at UCL Library Services on January 21, 2013jrc.sagepub.comDownloaded from

at this scale. Notwithstanding this, further research that examines patterns at
a more micro level, and seeks to explore whether the risk of crime is partic-
ularly affected in some environs more than others would be a fruitful
avenue for future research.
In any event, what the analyses demonstrate is that the probability of
offenses taking place per unit of time around the stadium is higher on match
or event days. The analyses of the spatial distribution of offenses also sug-
gest that the increase extends for some distance beyond the perimeter of the
stadium. For example, Figure 4 suggests that in the case of violent offenses,
relative to non-match days, on days when matches are played, there are
proportionally more offenses up to about 1.5 km from the stadium (i.e.,
on match but not comparator days, a very small fraction of incidents of vio-
lence occur between 1.5 and 3 km of the stadium). Given the change in the
ecology of the wider area within which the stadium is located, and the
location of the transit stations with respect to the stadium (see Figure 1), this
is perhaps not surprising and supports our decision to examine the variation
in crime rates across the wider area.
With respect to the spatial analyses, it is important to comment upon the
likely accuracy of the geocoordinates associated with the offenses. For
crimes where an offense takes place at a very specific location, such as a
burglary, geocoding tends to be highly accurate as the victim will be able
to report the exact location of the crime, and databases of building locations
are typically very good (Ratcliffe 2001). For crimes that occur at on street
locations, geocoding may be less accurate. This is often simply because the
victim is unable to provide an exact location. Given the types of crimes con-
sidered, geocoding accuracy may be a potential issue here. However, geo-
coding accuracy is largely a function of the geography concerned. That is, it
is a function of the extent to which it is possible for victims to identify and
differentiate between different locations, and for police recording systems
to be able to index crimes to these. For comparative studies for which
different areas are considered, geocoding accuracy may affect the reliability
of inferences made, as the factors that influence geocoding accuracy may
vary across different areas. However, in the current study, we suggest that
this issue is minimized as the geography is the same for the comparisons
made; the only thing that differs systematically is whether the stadium is
used or not.
The findings of this study are important from a policy perspective as in
the United Kingdom, at least, the police assess the probability of disorder
for each professional soccer game and deploy resources accordingly. The
soccer clubs are required by law to make a financial contribution to the costs
Kurland et al. 17
at UCL Library Services on January 21, 2013jrc.sagepub.comDownloaded from
of such policing, but typically only for resources deployed within a range of
100 m of the stadium boundary and for a period of 3 hours before and after
the game. Levels of payment have been contested in newspapers (League
reject call over police costs 2008), on television (Cockin 2008) and in the
court of law (High Court of Justice, Greater Manchester Police v Wigan
Athletic 2007); yet, little evidence has hitherto been available regarding the
level and distribution of crime and disorder associated with soccer matches
to inform such negotiations. The approach taken here provides one way of
estimating the distance over which events that take place at stadiums might
impact upon crime levels, and when they might do so. And, consequently,
the methods described provide an approach to assembling an evidence base
that could be used to determine the financial contribution that professional
soccer clubs should make to the costs of policing games of soccer. The pres-
ent results suggest that the criminogenic effect of the stadium extends con-
siderably beyond a buffer zone of 100 m. A limitation of the study, of
course, is that it makes use of data for only one stadium. Consequently,
future research might examine crime patterns for a sample of stadiums, and
may explore the extent to which these vary given the characteristics of the
wider environment within which stadiums are located. Such research might
also compare patterns for stadiums that are soccer-centric with those that
are event-centric.
In conclusion, in this study we have examined the extent to which an
example of one type of major facility influences patterns of crime in the
area that surrounds it. We suggest that there is no doubt that it does affect
levels of crime, even though this is an unintended consequence of the
facility. Given that the timing of the elevation in crime risk (per unit time)
is associated with a large change in the ambient population of the area, our
findings provide further support for ecological theories of crime and their
utility in exploring and explaining patterns of crime.
Appendix
Details of the Non-parametric Permutation Test Used to CompareOffense Counts/Rates on Match and Non-match Days
Offenses were selected from the point-level MPS data if: (1) They occurred
within the study area; and (2) took place on dates identified as a match,
event day or comparator day. Additionally, offenses were classified by
specific offense type, but for the purposes of the study we group them into
violent and theft and handling offenses.
18 Journal of Research in Crime and Delinquency 00(0)
at UCL Library Services on January 21, 2013jrc.sagepub.comDownloaded from
Simple non-parametric permutation tests were used to determine if there
were systematically more offenses on match and event days than on the rel-
evant comparator days, and if it was the case that the rate of crime per ambi-
ent populations also differed. The null hypothesis is that the counts (and
rates) of crime for each type of day are drawn from the same distribution,
and hence that any observed differences can be explained in terms of
sampling error. To examine this, for each pairwise comparison (e.g., match
days vs. nonmatch days for violent crime), we first calculate the sum of the
differences in the counts of offenses for each match day and the relevant
comparison day, as per equation (1)
Dj ¼Xn
i¼1
Matchij � Comparisonij;
where, i refers to the match considered and j refers to the crime type
(for event days we substitute the event day count for the match day
count), Matchij refers to the count of crime on match day i for crime
type j, Comparisonij refers to the count of crime on comparison day i
for crime type j.
Next, we compute the expected distribution of Dj, assuming the null
hypothesis is true. One permutation can be identified using a uniform
random number generator (uRNG) and the following approach. For each
match and comparison day:
Matchije ¼Matchij if uRNG < 0:5Comparisonij Otherwise
;
�
where Matchije refers to the expected count of crime on match day i for
crime type j for permutation e.
Where the value of the match count is swapped with that for the compar-
ison day, the count for the comparison day is likewise switched for that of
the match day. Completing this exercise for each match comparison (event
comparison) day pairing provides one permutation of the data that may be
used to compute one value of the expected distribution of Dj. Repeating this
exercise many times (say 999) represents a Monte Carlo (MC) simulation
which enables estimation of the Dj statistic generated under the assumptions
of the null hypothesis. The statistical significance of the observed Dj statis-
tic can then be estimated by computing the proportion of times it exceeds
the values computed using the MC simulation (North et al. 2002). The test
Kurland et al. 19
at UCL Library Services on January 21, 2013jrc.sagepub.comDownloaded from

is essentially a test of a difference in mean values (we just omit the
unnecessary step of dividing the D statistic by the sample size).
Declaration of Conflicting Interests
The author(s) declared no potential conflicts of interest with respect to the research,
authorship, and/or publication of this article.
Funding
The author(s) disclosed receipt of the following financial support for the research,
authorship, and/or publication of this article: This study was funded by the Govern-
ment Office for London (‘‘Analyses of late weekend kick-offs at premier football
matches and its possible link to increased levels of alcohol-related ASB and disorder’’,
GOL/04-09/10).
References
Anderson, Craig A. and Dona C. Anderson. 1984. ‘‘Ambient Temperature and Vio-
lent Crime: Test of Linear and Curvilinear Hypotheses.’’ Journal of Personality
and Social Psychology 46:91-97.
Billings, Stephen B., Suzanne Leland and David Swindell. 2011. ‘‘The effects of
the announcement and opening of light rail transit stations on neighborhood
crime.’’ Journal of Urban Affairs 33(5), 549-565.
Brantingham, Paul J. and Patricia L. Brantingham. 1984. Patterns in Crime. New York:
Macmillan.
Brantingham, Patricia L. and Paul J. Brantingham. 1993a. ‘‘Environment, Routine,
and Situation: Toward a Pattern Theory of Crime.’’ Pp. 259-294 in Routine
Activity and Rational Choice, edited by Ronald V. G. Clarke and Marcus Felson.
New Brunswick, NJ: Transaction.
Brantingham, Patricia L. and Paul J. Brantingham. 1993b. ‘‘Nodes, Paths and Edges:
Considerations on the Complexity of Crime and the Physical Environment.’’
Environmental Psychology 13:3-28.
Brantingham, Patricia L. and Paul J. Brantingham. 1995. ‘‘Criminality of Place:
Crime Generators and Crime Attractors.’’ European Journal on Criminal. Policy
and Research 3:5-26.
Clarke, Ronald V.G. and Derick B. Cornish. 1985. ‘‘Modeling offenders’ decisions:
a framework for research and policy.’’ Pp. 147-85 in Crime and Justice: An
Annual Review of Research, Vol. 6., edited by M. Tonry and N. Morris. Chicago:
University of Chicago Press.
Clarke, Ron V. G. and John E. Eck. 2003. Become a Problem Solving Crime Ana-
lyst in 55 Small Steps. London, UK: Jill Dando Institute, University College
20 Journal of Research in Crime and Delinquency 00(0)
at UCL Library Services on January 21, 2013jrc.sagepub.comDownloaded from

London. (http:// www.jdi.ucl.ac.uk/publications/manual/crime_manual_conte
nt.php).
Cockin, Jim (Reporting). (2008, March 3). Footing the Bill [Television Broadcast].
London, UK: SkySPORTS.
Cornish, Derek B. and Ronald V.G. Clarke, eds. 1986. The Reasoning Criminal.
New York, NY: Springer-Verlag.
De Vreese, Stephan. 2000. ‘‘Hooliganism Under the Statistical Magnifying Glass: A
Belgian Case Study.’’ European Journal on Criminal Policy and Research 8:
201-23.
Eck, John E. 1994. ‘‘Drug Markets and Drug Places: A Case-Control Study of the
Spatial Structure of Illicit Drug Dealing.’’ Unpublished PhD dissertation,
University of Maryland, College Park, MD.
Eck, John E., Ronald V.G. Clarke and Rob T. Guerette, R. 2007. ‘‘Risky facilities:
crime concentration in homogeneous sets of establishments and facilities.’’ Pp.
225-264 in Imagination for Crime Prevention. Crime Prevention Studies, Vol.
21., edited by Graham Farrell, Kate J. Bowers, Shane D. Bowers, Michael
Townsley. Monsey, NY: Criminal Justice Press.
Elias, Nobert and Eric Dunning. 1971. The Sociology of Sport: A Selection of
Readings. London, UK: Frank Cass.
Engstad, Peter A. 1975. ‘‘Environmental opportunities and the ecology of crime.’’
Pp. 206-222 in Crime in Canadian Society, edited by R. A. Silverman and
J. J. Teevan. Toronto, Canada: Butterworths.
Felson, Marcus. 1986. ‘‘Routine Activities, Social Controls, Rational Decisions, and
Criminal Outcomes.’’ in The Reasoning Criminal, edited by Derick B. Cornish
and Ronald V.G. Clarke. New York, NY: Springer-Verlag.
Felson, Marcus and Lawrence E. Cohen. 1980. ‘‘Human Ecology and Crime: A
Routine Activity Approach.’’ Human Ecology 8:389-406.
Frosdick, Steven and Peter Marsh. 2005. Football Hooliganism. London, UK: Willan.
Google Earth 6.0. 2008. ‘‘Wembley.’’ 51.553696� Latitude and -0.281653� Longi-
tude. June 26, 2010. Available through: http://www.google.com/earth/index.
html [Accessed November 29, 2012].
Gorman, Dennis M., Paul W. Speer, and Paul J. Gruenwald. 2001. ‘‘Spatial
Dynamics of Alcohol Availability.’’ Journal of Studies on Alcohol 62:
628-36.
Greater Manchester Police v Wigan Athletic Afc Ltd, Court of Appeal - Chancery
Division, December 21, 2007, [2007] EWHC 3095 (Ch).
Groff, Elizabeth R. 2011. ‘‘Exploring ‘Near’: Characterizing the Spatial Extent of
Drinking Place Influence on Crime.’’ Australian and New Zealand Journal of
Criminology 44:156-79.
Kurland et al. 21
at UCL Library Services on January 21, 2013jrc.sagepub.comDownloaded from

Hillier, Bill and Julienne Hanson. 1984. The Social Logic of Space. Cambridge:
Cambridge University Press.
Home Office. 2004. ‘‘Home Office Statistics on Football-Related Arrests and Ban-
ning Orders: Season 2003/2004.’’ Retrieved October 2, 2010 (http://www.
homeoffice.gov.uk/documents/football -arrests-03042835.pdf?view¼Binary).
Home Office. 2005. ‘‘Home Office Statistics on Football-Related Arrests and Ban-
ning Orders: Season 2004/2005.’’ Retrieved October 2, 2010 (http://www.home
office.gov.uk/documents/football _Arrest_BO_2004-52835.pdf?view¼Binary).
Home Office. 2006. ‘‘Home Office Statistics on Football-Related Arrests and
Banning Orders: Season 2005/2006.’’ Retrieved October 2, 2010 (http://www.
homeoffice.gov.uk/documents/football -arrests-05062835.pdf?view¼Binary).
Home Office. 2007 ‘‘Home Office Statistics on Football-Related Arrests and Ban-
ning Orders: Season 2006/2007.’’ Retrieved October 2, 2010 (http://www.home
office.gov.uk/documents/football -arreststatistics-20072835.pdf?view¼Binary).
Home Office. 2008 ‘‘Home Office Statistics on Football-Related Arrests and
Banning Orders: Season 2007/2008.’’ Retrieved October 2, 2010 (http://www.
homeoffice.gov.uk/documents/football -arrests-07082835.pdf?view¼Binary).
Home Office. 2009. ‘‘Home Office Statistics on Football-Related Arrests and
Banning Orders: Season 2008/2009.’’ Retrieved October 2, 2010 (http://
www.homeoffice.gov.uk/documents/football -arrests-08092835.pdf?view¼Bi
nary).
Jacobs, Jane. 1961. The Death and Life of Great American Cities. New York, NY:
Random House.
Johnson, Shane D. and Kate Bowers. 2010. ‘‘Permeability and Crime Risk: Are
Cul-De-Sacs Safer?’’ Journal of Quantitative Criminology 26:89-111.
League reject call over police costs. (2008, August 12). The Guardian. Retrieved
March 19, 2012 (http://www.independent.co.uk/sport/football/premier-league/
league-reject-call-over-police-costs-892066.html).
Liggett, Robin, Anastasia Loukaitou-Sideris and Hiroyuki Iseki. 2003. ‘‘Journey to
crime: Assessing the effects of a light rail line on crime in the neighborhoods.’’
Journal of Public Transportation 6(3), 85-115.
Lilliefors, Hubert W. 1967. ‘‘On the Kolmogorov-Smirnov Test for Normality with
Mean and Variance Unknown.’’ Journal of American Statistical Association 62:
399-402.
Losel, Friedrich and Thomas Bliesener. 2003. Pp. 245-64. in Youth Violence:
New Patters and Local Responses – Experiences in East and West, edited
by F. Dunkel Monchengladbach. Germany: Forum Verlag Godesberg
GmbH.
22 Journal of Research in Crime and Delinquency 00(0)
at UCL Library Services on January 21, 2013jrc.sagepub.comDownloaded from
Madensen, Tamara and John E. Eck. 2008. ‘‘Crowd Control at Stadiums and Other
Entertainment Venues.’’ Office Community Oriented Policing Services, U.S.
Department of Justice.
Massey, Frank J. 1951. ‘‘The Kolmogorov-Smirnov Test for Goodness of Fit.’’
Journal of American Statistical Association 46:68-78.
Mustaine, Elizabeth E. and Richard Tewksbury. 1998. ‘‘Predicting Risks of Larceny
Theft Victimization: A Routine Activity Analysis Using Refined Lifestyle
Measures.’’ Criminology 36:829-58.
North, Bernard, David Curtis, and Pak Sham. 2002. ‘‘A Note on the Calculation of
Empirical P values from Monte Carlo Procedures.’’ American Journal of Human
Genetics 71:439.
Ratcliffe, Jerry H. 2001. ‘‘On the Accuracy of TIGER Type Geocoded Address Data
in Relation to Cadastral and Census Areal Units.’’ International Journal of
Geographical Information Science 15:473-85.
Ratcliffe, Jerry H. 2011. ‘‘How Near is Near? Quantifying the Spatial Influence of
Crime Attractors and Generators.’’ Pp. 103-117 in Patterns, Prevention, and
Geometry of Crime, edited by Martin A. Andresen and J. Bryan Kinney. London,
UK: Routledge.
Ratcliffe, Jerry H. 2012. ‘‘The Spatial Extent of Criminogenic Places: A Change-
Point Regression of Violence around Bars.’’ Geographical Analysis 44(4):
302-320.
Rengert, George, Jerry H. Ratcliffe, and Sanjoy Chakravorty. 2005. Policing Illegal
Drug Markets: Mapping the Socio-Economic Environments of Drug Dealing.
New York: Criminal Justice Press.
Roncek, Dennis W. and Antoinette Lobosco. 1983. ‘‘The Effects of High Schools on
Crime in Their Neighborhoods.’’ Social Science Quarterly 64:598-613.
Rotten, James, Donald Olszewski, Mark Charleton, and Edgardo Soler. 1978.
‘‘Loud Speech, Conglomerate Noise and Behavioural after Effects.’’ Journal
of Applied Psychology 63:360-65.
Russell, Gordon W. 2004. ‘‘Sport Riots: A Social-Psychological Review.’’ Aggression
and Violent Behavior 9:353-78.
Bios
Justin Kurland is a PhD candidate at the UCL Jill Dando Institute of Security and
Crime Science at University College London, England. His research interests
include situational crime prevention, environmental criminology, computer simula-
tion and the development of spatial and temporal analytical techniques for crime
reduction.
Kurland et al. 23
at UCL Library Services on January 21, 2013jrc.sagepub.comDownloaded from

Shane D. Johnson is a Professor at the UCL Department of Security and Crime Sci-
ence, University College London, England. He has a PhD and an MA in psychology
and a BSc in computer science. He has particular interests in the spatial and temporal
distribution of crime, complexity science, and evaluation methods.
Nick Tilley is a member of the Jill Dando Institute of Crime Science at UCL and
Emeritus Professor of Sociology at Nottingham Trent University. His main research
interests lie in evidence-based policing, situational crime prevention, the interna-
tional crime drop and program evaluation methodology.
24 Journal of Research in Crime and Delinquency 00(0)
at UCL Library Services on January 21, 2013jrc.sagepub.comDownloaded from