
OFF-SHORING: HOW BIG IS IT?
274
A Report of the Panel of the NATIONAL ACADEMY OF PUBLIC ADMINISTRATION For the U.S. Congress and the Bureau of Economic Analysis October 2006 OFF-SHORING: HOW BIG IS IT? Panel Janet L. Norwood, Panel Chair* Carol Carson Manuel Deese* Norman J. Johnson* Franklin S. Reeder* John E. Rolph * Academy Fellow
-
Upload
khangminh22 -
Category
Documents
-
view
0 -
download
0
Transcript of OFF-SHORING: HOW BIG IS IT?

A Report of the Panel of the
NATIONAL ACADEMY OF
PUBLIC ADMINISTRATION
For the U.S. Congress and the Bureau of Economic Analysis
October 2006
OFF-SHORING: HOW BIG IS IT?
Panel
Janet L. Norwood, Panel Chair* Carol Carson
Manuel Deese*
Norman J. Johnson* Franklin S. Reeder*
John E. Rolph * Academy Fellow

ii
Officers of the Academy
Valerie A. Lemmie, Chair of the Board
G. Edward DeSeve, Vice Chair Howard M. Messner, President
Franklin S. Reeder, Secretary Howard M. Messner, Treasurer
Project Staff
J. William Gadsby,∗ Vice President, Academy Studies
Terry F. Buss, PhD, Program Area Director Kenneth F. Ryder Jr., Project Director Harry G. Meyers, PhD, Senior Advisor
Gwyneth H. Caverly, Senior Research Analyst Bryce Stephens, Senior Research Analyst
Noel A. Popwell, Senior Research Associate Nathan D. Winstead, Research Associate
Martha S. Ditmeyer, Senior Administrative Specialist _____________________________________________________________________________ The views expressed in this report are those of the Panel. They do not necessarily reflect the views of the Academy as an institution. National Academy of Public Administration 1100 New York Avenue, N.W. Suite 1090 East Washington, D.C. 20005 www.napawash.org First published October 2006 Printed in the United States of America ISBN 1-57744-123-0 Academy Project Number: 2051-000
∗ Academy Fellow

iii
FOREWORD Off-Shoring: How Big Is It? is the second of three Academy Panel reports providing a comprehensive review of services off-shoring. This report presents the results of the Panel’s research using publicly available industry-level data and confidential, firm-level (micro) data to address two critical questions:
1. What do currently available data indicate about the extent of U.S. services off-
shoring? 2. What additional data are needed to provide a more complete assessment of
U.S. services off-shoring? Contrary to many popular perceptions, the Panel found that services off-shoring remains quite small among the multi-national corporations and industries studied from 1998 to 2004. The Panel also found that U.S. businesses were much more likely to outsource services to other domestic firms during the same period, heightening the need to distinguish carefully between these two distinct and different economic concepts. Data gaps and deficiencies impede a complete assessment of the extent and impact of services off-shoring. The Panel commends the Bureau of Economic Analysis and the Bureau of Labor Statistics for their efforts to improve the quality, timeliness and completeness of the data with the resources available to them. Yet additional data improvements are needed and agencies should be provided the resources needed to achieve them. The Panel believes that it is prudent to improve existing data systems now—while the phenomenon remains relatively small—to better understand services off-shoring activities and their economic impacts in the future. I would like to thank the Panel and staff for their detailed assessment of a complex yet critically important issue. Let me also extend my appreciation to both Bureaus for their support, cooperation and responsiveness. Finally, I want to thank the Congress, especially Chairman Frank Wolf, for providing the initial direction and support for this review.
Howard M. Messner President National Academy of Public Administration

iv

v
TABLE OF CONTENTS FOREWORD................................................................................................................................ iii ACRONYMS................................................................................................................................ xi SECTION I—STUDY RESULTS ............................................................................................... 1 Highlights ................................................................................................................................. 3 Panel Message .......................................................................................................................... 9 Listing of Panel Findings and Recommendations .............................................................. 31 SECTION II—RESEARCH AND ANALYSIS ....................................................................... 35 Chapter 1: Introduction ...................................................................................................... 37
Objectives of the Academy Off-Shoring Study...................................................................... 37 Key Elements of the First Report............................................................................................ 38 Off-Shoring, MNCs, and National Statistical and Accounting Systems ................................ 40 Road Map to the Second Report ............................................................................................. 41
Chapter 2: Methodologies for Identifying Services Off-Shoring and Outsourcing....... 43
Basic research plan and objectives ......................................................................................... 43 Development of off-shoring indicators................................................................................... 45
Two Different Types of Off-Shoring................................................................................ 46
Analytical Approaches for Estimating Services Off-Shoring................................................. 48 Industry-Level Analyses ................................................................................................... 49
Micro-Level Analyses............................................................................................................. 52 Estimating Employment and Economic Impacts.............................................................. 55
Chapter 3: Industry-Level Analysis ................................................................................... 57
Introduction............................................................................................................................. 57 Data Sources and Development .............................................................................................. 58 Estimating Off-Shoring Intensity Indices ............................................................................... 58 BEA Industry I-O Use Tables................................................................................................. 58 Outsourcing and Off-Shoring Calculations ............................................................................ 59 Industry Level Findings .......................................................................................................... 63

vi
Assessment of the Data........................................................................................................... 66 Differences Between Comparable and Non-Comparable Services Imports..................... 66 Intermediate Goods and Services Import Data ................................................................. 67
Recommendations................................................................................................................... 67
Chapter 4: Using Occupation Data to Identify Services Off-Shoring............................. 69
Introduction............................................................................................................................. 69 Using OES Data to Examine Potential Services Outsourcing and Off-Shoring..................... 70
Methodology..................................................................................................................... 71 Data Strengths and Limitations......................................................................................... 72
Analytical Results ................................................................................................................... 73 Identifying Core Occupations Using Highly Aggregated Data ........................................ 73 Analysis Using Disaggregated (6-Digit) Occupational Data............................................ 78 Assessment of the Data..................................................................................................... 94
Chapter 5: Occupational Changes Within Sectors Off-Shoring Services ...................... 95
Introduction............................................................................................................................. 95
Methodology........................................................................................................................... 95 The Components of Employment Change........................................................................ 96 Occupational Employment Changes in Four Industry Sectors ............................................... 96
Linked Data Sets and Off-Shoring Quartiles .................................................................. 103 Changes in Total Employment, November, 2002 to May, 2005, by Industry Sector and 2-Digit Occupation.............................................................................................. 106 Changes in Total Employment, November, 2002 to May, 2005, by Industry Sector and 3-Digit Occupation.............................................................................................. 110
Conclusions and Data Recommendations............................................................................. 116 Chapter 6: Identifying Services Off-Shoring Using Micro-level Data.......................... 119
Introduction........................................................................................................................... 119 Research Approach and Data Sources .................................................................................. 120
The Role of MNCs.......................................................................................................... 121 Data Sources ................................................................................................................... 122
Estimating Services Off-Shoring Due to Business Restructuring ........................................ 124 Development of Key Measures....................................................................................... 125 Data Limitations.............................................................................................................. 126

vii
Analytic Approach .......................................................................................................... 127
Key Findings......................................................................................................................... 128 Levels of Outsourcing and Off-Shoring ......................................................................... 128 Variance Among Industries ............................................................................................ 131 Trends in Services Off-Shoring ...................................................................................... 133 Differences Between Services Off-Shoring MNCs and Non-Services Off-Shoring MNCs .................................................................................................... 136 Analyses of Services Off-Shoring from Global Expansion............................................ 139 Data Sources and Their Limitations ............................................................................... 140 Key Findings and Conclusions from Foreign Affiliate Data Analysis ........................... 142 Total Sales of Foreign Affiliates- Disaggregated by Destination and Customer Type .. 151 Sales Growth for MNC Parents Relative to Their Foreign Affiliates............................. 160
Chapter 7: Data Challenges and Recommended Improvements .................................. 163
Types of Data Issues ............................................................................................................. 164 Gaps in BEA Data........................................................................................................... 164 Gaps in BLS Data ........................................................................................................... 168 BEA Data Quality Issues ................................................................................................ 171 BLS Data Quality Issues................................................................................................. 176 Joint Agency Data Quality Issues ................................................................................... 177
Recommendations and Conclusions ..................................................................................... 178 Key Data Improvements for BEA................................................................................... 179 Key Data Improvements for the U.S. Statistical System................................................ 181 Key Data Improvements for BLS ................................................................................... 182 Additional Data Recommendations for BEA ................................................................. 183 Additional Data Recommendations for BLS .................................................................. 186
Conclusion ............................................................................................................................ 187 SECTION III—APPENDICES ............................................................................................... 191
Appendix A: Panel and Staff Listing .................................................................................. 193 Appendix B: Individuals Interviewed or Consulted............................................................ 197 Appendix C: Selected Bibliography.................................................................................... 205 Appendix D: Technical Appendix for Industry-Level Analysis ......................................... 231 Appendix E: Technical Appendix on BEA Micro-Data Analysis ...................................... 237

viii
CHARTS AND TABLES Charts Chart 4-1. Architecture and Engineering Employment in Non-Engineering Industries ............. 77 Chart 4-2. Architectural and Engineering Employment in the Architectural and Engineering Services Industry ........................................................................................................ 78 Chart 6-1. Average Outsourcing Total Off-Shoring and Services Off-Shoring for MNCs in Selected Industries (1999 to 2003) ........................................................... 129 Chart 6-2. MNCs Importing Services (1999 to 2003) .............................................................. 130 Chart 6-3. Average total and Services Off-Shoring Rates for MNC Parents in Pharmaceuticals and Medicine Manufacturing [3254] (1999 to 2003) ................... 133 Chart 6-4. Average Total and Services Off-Shoring Rates for MNC Parents in Architectural and Engineering and Related Services [5413] (1999 to-2003) .......... 134 Chart 6-5. Average Total and Services Off-Shoring Rates for MNC Parents in Computer Systems Design and Related Services [5415] (1999 to 2003) ................ 134 Chart 6-6. Average Total and Services Off-Shoring Rates for MNC Parents in Business Support Services [5614] (1999 to 2003) ................................................... 135 Chart 6-7. Differences Between Services Off-Shoring and Non- Services Off-Shoring MNCs in Selected Financial Variables .................................................................... 137 Chart 6-8. Architectural, Engineering and Related Services [5413] (2003) ............................. 138 Chart 6-9. Computer Systems Design and Related Services [5415] (2003) ............................. 138 Chart 6-10. NAICS Classifications for Foreign Affiliates with MNC Parents in Pharmaceuticals and Medicine Manufacturing [3254] (2003) ................................ 142 Chart 6-11. NAICS Classifications for Foreign Affiliates with MNC Parents in .................... 143 Architectural, Engineering and Related Services [5413] (2003) 145 Chart 6-12. NAICS Classifications for Foreign Affiliates with MNC Parents in Computer Systems Design and Related Services [5415] (2003) ............................. 143 Chart 6-13.NAICS Classifications for Foreign Affiliates with MNC Parents in Business Support Services [5614] (2003) ................................................................ 144 Chart 6-14. Growth in the Number of MNC Parents and Their Foreign Affiliates (1999 to 2003) .......................................................................................................... 146 Chart 6-15. Percentage Change of MNC Parent and Foreign Affiliate Sales (1999 to 2003) .. 147 Chart 6-16. Percentage Change of Average Sales per Employee for MNC Parents and Their Foreign Affiliates (1999 to 2003) ................................................................... 147 Chart 6-17. Percentage Change of Value added for MNC Parents and Their Foreign
Affiliates (1999 to 2003) ........................................................................................ 147 Chart 6-18. Percentage Change of MNC Parent and Foreign Affiliate Employment (1999 to 2003) .......................................................................................................... 148 Chart 6-19. Percentage Change of Employee Compensation for MNC Parents and Their Foreign Affiliates (1999 to 2003) ............................................................................ 148 Chart 6-20. Percentage Change of Average Employee compensation for MNC Parents and Their Foreign Affiliates (1999 to 2003) ............................................................ 149 Chart 6-21. Percentage Change of Net Income for MNC Parents and Their Foreign Affiliates (1999 to 2003) .......................................................................................... 149
ix
Chart 6-22. Market Destinations of Pharmaceutical and Medicine Manufacturing [3254] Foreign Affiliate Sales (1999 to 2003) .................................................................... 151 Chart 6-23. Market Destinations of Architectural, Engineering and Related Services [5413] Foreign Affiliate Sales (1999 to 2003) .................................................................... 152 Chart 6-24. Market Destinations of Computer Systems Design and Related Services [5415] Foreign Affiliate Sales (1999 to 2003) .................................................................... 152 Chart 6-25. Market Destinations of Business Support Services [5614] Foreign Affiliate Sales (1999 to 2003) .......................................................................................................... 153 Chart 6-26. Foreign Affiliate Sales of Services to Total Sales (1999 to 2003) ........................ 154 Chart 6-27. The Market Destinations of Pharmaceutical and Medicine Manufacturing [3254] .... Foreign Affiliate Sales of Services (1999 to 2003) ................................................. 155 Chart 6-28. The Market Destinations of Architectural, Engineering and Related Services [5413] Foreign Affiliate Sales of Services (1999 to 2003) ...................................... 155 Chart 6-29. The Market Destinations of Computer Systems Design and Related Services [5415] Foreign Affiliate Sales of Services (1999 to 2003) ...................................... 156 Chart 6-30. The Market Destinations of Business Support Services [5614] Foreign Affiliate Sales of Services (1999 to 2003) ............................................................................. 156 Chart 6-31. Pharmaceutical and Medicine Manufacturing [3254] MNC Parent Services Exports (2001 to 2003) .............................................................................. 158 Chart 6-32. Architectural, Engineering, and Related Services [5413] MNC Parent Services Exports (2001 to 2003) ............................................................................................ 158 Chart 6-33. Computer Systems Design and Related Services [5415] MNC Parent Services Exports (2001 to 2003) ............................................................................................ 159 Chart 6-34. Business Support Services [5614] MNC Parent Services Exports 2001 to 2003) ........................................................................................................... 159 Tables Table 3-1. The Use of Commodities by Industries, Annual I-O Accounts, 1998 and 2004 ....... 60 Table 3-2. Outsourcing and Off-Shoring Intensities ................................................................... 61 Table 3-3. Industry Services Outsourcing and Off-Shoring Intensities and Rates of Growth ... 64 Table 4-1. Core Occupations in Examined Industries, November, 2002 and May, 2005 Surveys .................................................................................................... 74 Table 4-2. Examined Industry Core Employment in Other Industries ....................................... 76 Table 4-3. Core Occupations in Examined Industries ................................................................ 79 Table 4-4. Examined Core Employment in Other Industries, Detailed Occupations ................. 81 Table 4-5. Examined Industry Core Occupations, Employment in Examined Industries and Other Industries .......................................................................................................... 90 Table 5-1. Changes in Occupational Structure and Employment Growth in the Computer Systems Design and Related Services Sector .............................................................................. 98 Table 5-2. Changes in Occupational Structure and Employment Growth in the Miscellaneous Professional, Scientific and Technical Services Sector ........................................... 100 Table 5-3. Changes in Occupational Structure and Employment Growth in the Administrative and Support Services Sector .................................................................................... 101 Table 5-4. Changes in Occupational Structure and Employment Growth in the Chemical Products Sector ........................................................................................................ 102

x
Table 5-5. Input-Output Industry Sector Quartiles Ranked by Off-Shoring Growth Rates ..... 104 Table 5-6. Change in Employment by Occupation for Highest and Lowest Off-Shoring Quartiles .............................................................................................. 108 Table 5-7. Change in Employment Due to Occupational Structure and Sector Growth by Occupation for Highest and Lowest Off-Shoring Quartiles ............................... 112 Table 6-1. Employment for Select 4 Digit Service Industries .................................................. 132 Table 6-2: Differences in Average Services Off-Shoring and Outsourcing for Group I MNC Parents ............................................................................................................ 136 Table 6-3. Outsourcing and Services Off-Shoring Estimated Proportional Changes ............... 138 Table 7-1. Recent Mass Lay-Off Events Including Movement of Work Overseas .................. 171 Table 7-2. Differences in Valuation of Canadian Imports of Computer and Data Processing Services .................................................................................................................... 173

xi
ACRONYMS
Academy National Academy of Public Administration AFL-CIO American Federation of Labor-Congress of Industrial Organizations ASTAR Automated Survey Transmission and Retrieval BEA Bureau of Economic Analysis BED Business Employment Dynamics BLS Bureau of Labor Statistics BPT Business, Professional, and Technical Services CIPSEA Confidential Information Protection & Statistical Efficiency Act COS Company Organization Survey CPS Current Population Survey EIN Employer Identification Number FDD Final Domestic Demand FDI Foreign Direct Investment GAO Government Accountability Office GDP Gross Domestic Product I-O Input-Output IPP International Price Program IRS Internal Revenue Service IT Information Technology ITAA Information Technology Association of America LEHD Longitudinal Employer Household Dynamics Data MGI McKinsey Global Institute MLS Mass Layoff Statistics MIT Massachusetts Institute of Technology MNC Multinational Corporation MOFA Majority Owned Foreign Affiliates MOU Memorandum of Understanding NAICS North American Industry Classification System NAPCS North American Produce Code System NAS National Academy of Sciences NASSCOM National Association of Software and Services Companies (India) OECD Organization for Economic Co-operation and Development OES Occupational Employment Statistics QCEW Quarterly Census of Employment and Wages SIC Standard Industrial Classification SOC Standard Occupation Code TA Technology Administration (Department of Commerce) UI Unemployment Insurance WTO World Trade Organization

xii

1
SECTION I
STUDY RESULTS

2

3
HIGHLIGHTS OF ACADEMY REPORT
SERVICES OFF-SHORING: HOW BIG IS IT? This is the second of three Academy Panel reports providing a comprehensive review of services off-shoring. It is in response to direction from the House Appropriations Subcommittee on Science, State, Commerce and Justice with funding provided by the U.S. Department of Commerce’s Bureau of Economic Analysis (BEA). This report focuses primarily on two questions:
1. What do currently available data indicate about the extent of U.S. services off-
shoring?
2. What additional data are needed to provide a more complete assessment of U.S. services off-shoring?
Concerns about the impact of international trade on the U.S. economy are not new. What distinguishes off-shoring concerns today is the focus on the services sector, particularly white collar, high-technology jobs previously considered less vulnerable to international trade and potential migration overseas. As the Panel found in its first report—Off-Shoring: An Elusive Phenomenon—the extent of services off-shoring and its economic effects are complex and poorly understood. The diversity of views among previous studies reflects not only differences in data used, time periods covered, and industries analyzed, but also the lack of a commonly accepted definition and the interchangeable use of multiple terms. To simplify the discussion and facilitate understanding, the Panel has recommended and is using the following terms and definitions: outsourcing—firms contracting out service and manufacturing activities to unaffiliated firms located either domestically or in foreign countries off-shoring—U.S. firms shifting service and manufacturing activities abroad to unaffiliated firms or their own affiliates
off-shore outsourcing—a subset of both outsourcing and off-shoring in that it refers only to those service and manufacturing activities of U.S. companies performed in unaffiliated firms located abroad
The Panel has identified two distinct types of services off-shoring with fundamentally different economic effects and different data needed to identify them.
1. Services off-shoring due to business restructuring. Results from a decision to restructure all or part of a business’ internal production processes and to obtain those restructured intermediate services from a foreign supplier. This involves some direct

4
U.S. job losses. The proportion of imported services used by a firm or industry in its business operations is a key indicator of this type of off-shoring.
2. Services off-shoring due to global expansion. Arises from a decision to expand
business operations or production activities globally. This may have no immediate employment effect, although some future employment may be foregone if overseas expansion substitutes for future exports. An indicator of this type of off-shoring is faster growth in sales or total activity among foreign affiliates relative to the sales growth or total activity for the multinational corporation (MNC) parent.
PRINCIPAL FINDINGS The Panel has made the following four principal findings based on its review of available industry-level data (1998 to 2004) and micro-level (firm) data (1999 to 2003) for the pharmaceutical and medicine manufacturing; architecture, engineering and related services; computer systems design and related services; and business support services industries:
1. Services off-shoring due to business restructuring is not as extensive for the MNC parents in the industries examined as some popular perceptions and concerns would suggest. One reason is that fewer than 20 percent of all MNC parents imported services from 1999 to 2003. The results for comparable industry groups from 1998 to 2004 confirmed this finding.
2. Outsourcing of services to domestic firms is substantially greater than off-
shoring of services due to business restructuring. For the four industries examined, services outsourcing ranged from three to more than 38 times larger than services off-shoring over the 1998 to 2004 period.
3. There was little consistent growth in services off-shoring from business
restructuring among specific industries and MNCs examined from 1998 to 2004. Growth rates varied substantially by industry. For those groups reviewed, annual growth ranged from 35.4 percent (for mining, except oil and gas) to -9.5 percent (for utilities), with a median rate of 4.6 percent. Manufacturing industries tended to have the higher services off-shoring growth rates, while some key services industries (broadcasting and telecommunications, administrative and support services, and information and data processing) experienced a decline in services off-shoring.
4. Services off-shoring due to global expansion was more widespread than that
due to business restructuring among the MNC parents concentrated in the four industries examined. The majority of these MNC parents had faster total sales growth for their foreign affiliates than for the parent. For those concentrated in three services industries (architectural, engineering and related services; computer systems design and related services; and business support services), more than 80 percent had faster affiliate sales growth.

5
The Panel acknowledges that existing data gaps and quality issues may understate the extent of services off-shoring. Yet the potential underestimate does not appear sufficient to explain the limited amount of services off-shoring due to business restructuring found at the industry and firm levels. KEY DATA RECOMMENDATIONS Two types of data issues were encountered when developing estimates of the extent of services off-shoring: basic data gaps and data quality concerns. The former reflected the absence of key data elements, while the later involved discrepancies in reported data and their timeliness. These data issues impede a complete assessment of the extent and impact of services off-shoring. To address these data issues, the Panel’s key recommendations focus on three critical areas:
1. Improving the consistency, completeness and coverage of BEA’s data on services imports.
2. Providing longitudinal occupational data through a revised or restructured Bureau of Labor Statistics (BLS) survey.
3. Developing consistent business identifiers to link information from several statistical agencies with different business organizational levels.
These three recommendations are similar to several recommendations made in the September 2006 final report of the Services Off-shoring Working Group at the Massachusetts Institute of Technology’s Industrial Performance Center. Improve BEA’s data on services imports More detailed and consistent data on the types of services imported are needed to better understand the extent and impact of services off-shoring. The Panel supports the BEA initiative to collect more consistent and detailed data on services imports from MNC foreign affiliates, comparable to that now collected for unaffiliated services imports (those from independent third parties). The Panel also recommends that BEA periodically review the data to ensure they are comprehensive and compatible with details on services contained in other economic data. The Panel also believes that BEA’s agreement with Census to add a question to the annual Company Organization Survey (COS) to identify firms that are importing services should improve its survey coverage of services importers, especially among large multi-establishment firms. The Panel also recommends that BEA consider other efforts to improve its mailing list, including working with other federal agencies surveying particular service activities.

6
Develop a national longitudinal component to BLS’s Occupational Employment Statistic (OES) surveys. Changes in the occupational structures of firms that are off-shoring services can provide essential information about the number and types of workers likely to be displaced. BLS’ OES program provides detailed occupational and wage data for individual establishments by industry and geographical areas within the United States. Yet BLS noted that the current sample was not designed to support comparisons of changes in occupations and wages across time periods. Developing additional OES samples to support such comparisons will require additional resources. The Panel believes this investment is needed if the distributional employment effects from services off-shoring (and from domestic outsourcing of services) are to be better understood. Develop consistent business identifiers among federal statistical agencies. Analyses of micro-level data available at different federal statistical agencies are needed to assess the employment and other economic effects of U.S. business decisions to off-shore services activities. Efforts to link micro-level data across the agencies have been impeded by the different systems that the three major agencies—BEA, BLS and Census—use for identifying business firms or establishments within their respective jurisdictions. The lack of accessible, comprehensive, and consistent business register has contributed to numerous data gaps and quality issues that affect the ability to estimate the extent and impacts of services off-shoring. The Panel recognizes that each agency needs data from business entities at different organizational levels to meet specific requirements at varying time intervals. However, a consistent set of identifiers for components within complex U.S. business entities would help each agency understand how each component fits within a consolidated national or international business entity. The Panel recommends that BEA, BLS and Census work together to develop and maintain a consistent set of identifiers for each level of organization within every consolidated business entity in the United States. This would include shared location data for various entities and consistent methodology for assigning industrial classifications. This change would retain the most advantageous features of each agency’s current business identification system. Most important, consistency would facilitate data sharing that could enhance the usefulness of separately collected data in understanding major cross-cutting issues, especially services off-shoring. Specifically, it would improve the ability to match BEA MNC data with BLS establishment data and business establishments in the economic census, thus improving the understanding of services off-shoring and other cross-cutting issues.
CONCLUDING REMARKS Levels of services off-shoring for the periods examined may be small, but there can be significant adverse effects on the sectors, geographic regions and individuals directly impacted. In addition, there exists the potential for future growth in this phenomenon, given the extent of

7
services outsourcing and continuing technological changes. The Panel commends BEA and BLS for their initiatives to improve the quality, timeliness, and completeness of their data with the resources available to them. However, additional data improvements and resources to achieve them are needed to understand more fully the extent and economic impacts of services off-shoring. The Panel believes it is prudent to improve existing data systems now to increase the ability to detect and monitor future services off-shoring activities and their economic impacts.

8

9
PANEL MESSAGE The services sector—particularly its white collar, high-technology jobs—has traditionally been considered less susceptible to international competition and overseas migration of services activities. More recently, these service sector jobs have been perceived as increasingly vulnerable to businesses shifting some services activities to foreign (off-shore) locations. This led the House Appropriations Subcommittee on Science, State, Commerce and Justice to provide authority and funding for the U.S. Department of Commerce’s Bureau of Economic Analysis (BEA) to have the National Academy of Public Administration (Academy) undertake a comprehensive study of the off-shoring phenomenon. The Subcommittee, Academy and BEA agreed that this study needed to address five key questions:
1. How should “off-shoring” be defined?
2. What do currently available data indicate about the extent of U.S. off-shoring?
3. What additional data are needed to provide a more complete assessment of U.S. off-shoring?
4. What factors account for current U.S. off-shoring?
5. What are the major impacts of off-shoring on U.S. workers and the economy and
implications for the educational system? This report—Off-shoring: How Big Is It?—is the second of three Academy Panel reports and focuses on the second and third questions. The first report—Off-Shoring: An Elusive Phenomenon—was released in January 2006 and addressed questions one and four. In it, the Panel recommended a broad definition of off-shoring to avoid ambiguities created by narrower definitions used in most previous studies and to prevent the definition from becoming outmoded as conditions change over time. The report also discussed factors that account for off-shoring service activities, including cost differences and quality improvements like more timely services (e.g. 24/7 response). The third report will address policy issues raised by question five, such as the role of temporary foreign workers under the H-1B and L-1 visa programs, and the impact on the U.S. education system’s ability to meet the economy’s needs for scientists, engineers and other high-skilled professional workers In Services Offshoring: How Big Is It?, the Panel’s principal findings regarding questions two and three are summarized below.
What do currently available data indicate about the extent of U.S. off-shoring? Currently available data show that services off-shoring from 1999 to 2003 was small for the industries and firms examined. This finding is contrary to some popular perceptions. Growth

10
in services off-shoring for these industries and firms during this period was also limited and varied substantially by industry. Existing data gaps and quality issues may understate the extent of services off-shoring. Yet the potential underestimate does not appear sufficient to explain the limited amount of services off-shoring found at the industry and firm levels. Services off-shoring may appear small in the aggregate at the moment, but there can be significant adverse effects on the sectors, geographic regions and individuals directly impacted. A more complete understanding of these economic impacts and the future size and scope of services off-shoring will require more detailed and better data. What additional data are needed to provide a more complete assessment of U.S. off-shoring? The analysis of industry- and micro-level data to estimate the extent of services off-shoring encountered a number of data gaps and data quality issues. The key data issues involved:
• Improving the consistency, completeness and coverage of BEA’s data on services imports.
• Providing longitudinal occupational data through a revised or restructured BLS
survey.
• Developing consistent business identifiers to link information from several statistical agencies with different business organizational levels.
These key data issues and others—summarized in Chapter 7—impede a complete assessment of the extent and impact of services off-shoring. The Panel supports current BEA initiatives to collect more consistent, detailed data on services imports and to improve its coverage of services importers. The Panel recommends additional improvements to address other data gaps and quality issues. These improvements and the resources to achieve them are needed now to better understand the extent of services off-shoring and its economic impacts before the phenomenon becomes more widespread.
Many of these findings and recommended data improvements have been reinforced by a recent report issued by the services off-shoring working group of the Industrial Performance Center at the Massachusetts Institute of Technology. That working group recommended that the federal statistical agencies collect more detail on international trade in services, publish time series data on employment by occupation and provide access to more micro-level data resources.1
This Panel Message presents the major findings and recommendations contained in this report. It also describes the methodologies used to estimate the extent of services off-shoring and outsourcing. Individual chapters contain the underlying analysis supporting these findings and recommendations.
1 Industrial Performance Center at MIT, Services Off-shoring Working Group Final Report, September 2006.

11
METHODOLOGY In its first report, the Panel found little consensus among prior studies regarding the extent and economic effects of services off-shoring. Disparity stemmed from many factors, including the lack of a commonly accepted definition; different time periods and industries covered; the variety of data and methodologies used, some with uncertain reliability; the wide range of potential economic impacts and entities affected; and the inherent difficulty in measuring off-shoring and estimating its impacts. Most of these studies used publicly available industry-level data to examine services off-shoring and its economic impacts, principally employment effects; few used micro-level or firm data. Furthermore, none attempted to link data at the micro-level from the major statistical agencies that collect trade and employment data. This may have reflected difficulties in obtaining access to confidential data, as well as the lack of explicit agency agreements or memoranda of understanding to share such data consistent with provisions of the 2002 Confidential Information Protection and Statistical Efficiency Act (CIPSEA). The Panel concluded that additional analysis of micro-level data was needed since off-shoring decisions reflect strategic business choices made by individual U.S. firms. This analysis also would avoid aggregation problems likely to occur with industry-level data since not all firms within an industry are likely to engage in services off-shoring. Given resource and time constraints, this research focused on a limited number of industries that were significant in size, potentially susceptible to services off-shoring, diverse, well integrated into the overall economy, and likely to continue expanding. The Panel selected the following industries2:
• pharmaceutical and medicine manufacturing [3254],
• architectural, engineering and related services [5413],
• computer systems design and related services [5415], and
• business support services [5614]. Three of the four are services industries, reflecting their increasing role in the U.S. economy and responding to growing concerns about services off-shoring. The micro-level research, together with additional industry-level research, had several objectives. The key ones were to:
2 The U.S., Canadian and Mexican statistical agencies use a common North American Industrial Classification System (NAICS) to identify industries at varying levels of detail. The most aggregate or highest level—the 2-digit level—distinguishes among 19 goods and services producing sectors, such as durable manufacturing and business and professional services. The most detailed level—the 6-digit level—contains more than 1,170 distinct industry categories. The industries the Panel selected are at the intermediate, 4-digit level to assure that the activities are sufficiently similar within reasonably sized sectors. The 4-digit NAICS codes are provided in parentheses.

12
• Develop estimates of the extent and impact of services off-shoring.
• Assess the adequacy of currently available micro- and industry-level data to produce such estimates.
Reflecting the decision to use both industry- and micro-level data, the Panel used different methodologies to achieve these key objectives. This approach acknowledged the complexity of off-shoring, its varied economic effects and the inherent difficulty in measuring them. Distinguishing outsourcing from off-shoring In its first report, the Panel found that the varied terms and definitions used in previous studies had unnecessarily complicated understanding of off-shoring. To simplify the discussion and enhance understanding, the Panel recommended using three basic terms and definitions:
outsourcing—firms contracting out service and manufacturing activities to unaffiliated firms located either domestically or in foreign countries off-shoring—U.S. firms shifting service and manufacturing activities abroad to unaffiliated firms or their own affiliates off-shore outsourcing—a subset of both outsourcing and off-shoring in that it refers only to those service and manufacturing activities of U.S. companies performed in unaffiliated firms located abroad3
Outsourcing reflects a strategic business decision to restructure current operations and rely on an independent third-party supplier to provide some services or goods components that had previously been produced within the firm. When outsourcing occurs between domestic firms, the production of that intermediate product or service and associated jobs shift from the restructuring firm to the new supplier. Although total U.S. employment may not change, employees of the restructuring firm holding those shifted jobs will lose their current ones. At the same time, the new supplier of the outsourced activity will seek new workers as it expands its business operations. Businesses make outsourcing decisions for numerous reasons; the key ones are to increase efficiency, reduce costs or both. Off-shoring decisions, often made for the same reasons as outsourcing, are conceptually distinct and can have different economic impacts.4 Two types of off-shoring The Panel’s definition of off-shoring is sufficiently broad to encompass two distinct types of off-shoring:
3 National Academy of Public Administration, Off-Shoring: An Elusive Phenomenon. January 2006, p 38. 4 See Off-Shoring: An Elusive Phenomenon, Chapter 2, ps. 8-10 for a more complete discussion of the differences between outsourcing and off-shoring and the reasons for each.

13
1. Off-shoring due to business restructuring. Results from a business’ decision to restructure all or part of its internal production processes and to obtain those restructured intermediate inputs from a foreign supplier.
2. Off-shoring due to global expansion. Arises from a business’ decision to expand its
operations or production activities globally. The review of previous studies found an almost exclusive focus on the first type. Yet both types are conceptually distinct, have substantially different economic effects and require different indicators and data to identify their scope and impact. Services off-shoring due to business restructuring involves a change in the mix of services used in the firm’s operations between internally provided and foreign supplied services. A critical issue for this type of services off-shoring is the direct employment effects from substituting imported services for internally provided services. Services off-shoring due to global expansion involves a reallocation of a firm’s total services output between its domestic and foreign operations. This type of off-shoring occurs only among firms that are multinational corporations (MNCs) and the direct employment effects are less certain than those from business restructuring off-shoring. Global expansion off-shoring may involve no decline in the current operations of the U.S. MNC parent when the firm chooses to meet growing overseas demands through overseas expansion, rather than increased U.S. exports. If foreign affiliate production substitutes for exports, this type may only forego future growth in exports and associated domestic employment. Alternatively, an expansion in foreign affiliate sales may provide access to new markets that would not otherwise be served by exports. This could complement MNC parent operations supporting an increase in parent (and U.S.) employment. Indicators of Outsourcing and Off-shoring Outsourcing and off-shoring due to business restructuring involve changes in the mix of inputs used by the firm in its business operations. Thus, indicators for these activities should include outsourced or off-shored inputs relative to a firm’s total inputs. Most previous studies used the ratio of purchased services inputs relative to total services inputs or total inputs as indicators. This report used that same indicator for services outsourcing—purchased services inputs relative to total inputs—except where data limitations required a less precise indicator.5 For services off-shoring, the preferred indicator would have been the percent of purchased services inputs imported. However, data limitations required the use of less precise indicators. For industry-level analyses, the services off-shoring indicator was the ratio of total services imports relative to total intermediate inputs; for the micro-level analyses, the indicator was essentially the same—total services imports relative to total purchased inputs. Global expansion off-shoring involves a redistribution of a MNC’s output between the domestic parent and its foreign affiliates. Because an indicator must compare affiliate production relative to parent output, the indicator used here was the comparison of growth rates of the MNC parent’s 5 See discussion in Chapter 6 explaining the use of a less precise indicator for services outsourcing—total outsourcing = total purchased inputs relative to total sales.

14
total sales and sales of services relative to their foreign affiliates. A faster rate of growth in affiliate activities implies an increase in the affiliates’ share of total MNC activities. This would reflect a redistribution of MNC output consistent with global expansion off-shoring. Data Sources The industry-level analyses in Chapters 3-5 examine off-shoring due to business restructuring. They use publicly available data from BEA input-output (I-O) use tables and the Bureau of Labor Statistics’ (BLS) Occupational Employment Statistics (OES) surveys to estimate services outsourcing and off-shoring by industry sectors and changes in employment, including changes in occupational mixes, within those sectors. Although this methodology is consistent with that used in several previous studies, current research examines different time periods (e.g. post-1997 to use NAICS rather than Standard Industrial Classification categories); employs different techniques (e.g. use of OES data to assess services outsourcing or off-shoring); or combines different data sets (e.g. link BLS occupational employment data from the OES program with BEA I-O and trade data) to identify distributional employment effects. The micro-level analysis presented in Chapter 6 uses BEA survey data on the financial operations of MNC parents and their foreign affiliates, as well as other international transactions between unaffiliated parties, to identify the extent of services off-shoring for MNCs due to business restructuring and global expansion. Data limitations required the use of less precise indicators of services off-shoring than the Panel would have preferred. As discussed below and in Chapter 7, the net effect of these data limitations was a likely understated extent of services off-shoring from business restructuring for both the industry- and micro-level analyses. FINDINGS Extent of Services Off-Shoring and Outsourcing Chart 1 shows the average outsourcing, total off-shoring and services off-shoring due to business restructuring from 1999 to 2003 for MNC parents in each of the four industries examined in Chapter 6. Each indicator is expressed as a percent of inputs used.6 This chart compares the period average of services off-shoring to both total off-shoring and total outsourcing since data limitations precluded estimates of services outsourcing. Charts 2 and 3 show estimated services off-shoring and services outsourcing as a percent of total inputs for the industry sectors from Chapter 3 that are comparable to the four MNC industries examined. For each MNC industry group or comparable aggregate industry sector, services off-shoring represented only a small fraction of services outsourcing.
6 More precisely, the services off-shoring indicator is services imports relative to total purchased inputs; the total off=shoring indicator is goods and services imports relative to total purchased inputs, and the outsourcing indicator is total purchased inputs relative to total sales which is a proxy for total inputs. See Chapter 6, development of key indicators pp. 6-7.

15
Chart 1: Average Outsourcing and Services Off-Shoring for MNCs in Selected Industries
0%
10%
20%
30%
40%
50%
60%
Perc
ent o
f Inp
uts
Pharmaceutical & MedicineManufacturing
Architectural & EngineeringServices
Computer System DesignServices
Business Support Services
Source: Bureau of Economic Analysis
Average Outsourcing Average Total Off-Shoring Average Services Offshoring
Chart 2: Services Outsourcing and Off-Shoring for Chemical Industry (325) and Miscellaneous Professional Services Industry (5412OP): 1998 – 2004
0%
5%
10%
15%
20%
25%
30%
35%
40%
19981999
20002001
20022003
2004
Perc
ent o
f Inp
uts
54120P Services Outsourcing
325 Services Outsourcing
325 Services Off-shoring
54120P Services Off-shoring
Source: Bureau of Economic AnalysisYear

16
Chart 3: Services Outsourcing and Off-Shoring for Computer Systems Design [5415] and Administration and Support Services (561): 1998 – 2004
0%
5%
10%
15%
20%
25%
30%
19981999
20002001
20022003
2004
Source: BEA and Academy staff calculations
Perc
ent o
f Inp
uts 561 Services Outsourcing
5415 Services Off-shoring
5415 Services Outsourcing
561 Services Off-shoring
Year
The industry-level analysis in Chapter 3 also showed a substantial range in the industry services off-shoring and outsourcing indicators from 1998 to 2004 for the 65 industry sectors examined.7 Services outsourcing was substantially greater than services off-shoring for all industry sectors, ranging from 1.5 to more than 10 times larger. In addition, services off-shoring tended to be greater for manufacturing industries while services outsourcing appeared greater for services industries. Services industries accounted for nine of the 10 industries with the greatest services outsourcing, but only three were among the ten with the greatest services off-shoring. The Panel recognizes that data limitations encountered during this analysis could affect some results, especially if the impact was primarily in one direction. Unfortunately, several limitations—the likelihood that U.S. import data understated services imports and the inability to use purchased services inputs in the services off-shoring indicator for MNC parents—suggest that services off-shoring indicators for the micro- and industry-level analyses are underestimated. The extent could not be ascertained, but the Panel believes it was not likely to account for an appreciable extent of the differences between services off-shoring and outsourcing shown in the charts using industry- and micro-level data.
7 This more comprehensive industry-level analysis confirmed that the results obtained for the four industries selected for detailed examination were consistent with those occurring across the full spectrum of 65 industry groups in the I-O tables.

17
For services off-shoring due to business restructuring, the Panel finds that the level of services off-shoring among MNC parents in the industries reviewed has been small during the 1999 to 2003 period. At the aggregate-level, services off-shoring levels have also remained small for comparable industry groups and most other industry sectors during the 1998 to 2004 period. The Panel finds that services outsourcing to domestic firms has been substantially larger than services off-shoring for the industry groups examined during the 1998 to 2004 period. The Panel finds that outsourcing and total off-shoring have been substantially larger than services off-shoring for the MNC parents examined during the 1999 to 2003 period.
One reason for the limited extent of services off-shoring among the MNC parents reviewed is that only a small number of them imported services during the 1999 to 2003 period. Among the entire universe of roughly 3,600 MNCs, about 16 percent did so. For the four industries examined, the percentage of MNC parents importing services in any year varied from 14 to 30 percent except for two groups. For those with sales concentrated in the pharmaceutical and medicine manufacturing industry, the percentage of services importers varied from 34 to 45 percent. For MNCs with limited (non-concentrated) sales in business support services, the percentage ranged from 29 to 50 percent. These findings are consistent with some previous studies, but they are contrary to some popular perceptions. Outsourcing and Services Off-Shoring Varies Among Industries Although the overall extent of services off-shoring may be less than some expect, its growth and impact on individual groups and sectors must be examined to ascertain any appreciable distributional effects. Both the micro- and industry-level data reveal substantial variation in the levels of services off-shoring and outsourcing across specific industries. The analysis in Chapter 6 and the data in Chart 1 indicate the differences in the level of services off-shoring, total outsourcing and total off-shoring for MNC parents in the four industries examined. For those in business support services, the rate of services off-shoring was one-half to one-quarter as large as that for those in the other three industries from 1999 to 2003. Chart 1 shows that total off-shoring of goods and services was about 6 times larger for parents concentrated in pharmaceutical and medicine manufacturing than in the three services industries. The industry-level analysis in Chapter 3 showed similar variations among the four comparable industry sectors (see Charts 2 and 3). For example, services off-shoring for the chemical industry from 1998 to 2004 was two to three times greater than the miscellaneous professional scientific and technical services sector and more than four to six times greater than the administrative and support services sector.

18
The Panel finds that the extent of outsourcing and services off-shoring varies substantially among the MNC parents and industries examined over the 1999 to 2003 and 1998 to 2004 periods.
This substantial variance may help to explain some of the differences found in previous studies that examined different industries. Growth In Services Off-Shoring And Outsourcing Both the industry- and micro-level analyses examined growth in services off-shoring and outsourcing over their respective time periods, an area of particular concern even if current services off-shoring levels were relatively small.8 At the industry level, growth rates for services off-shoring were calculated over the 1998 to 2004 period and industries ranked based on those growth rates. Manufacturing industries had most of the higher growth rates in services off-shoring, while the services industries generally had very low levels and growth. Ten of the 65 industries had annual growth rates of 10 percent or more; seven of them were manufacturing. Eight of the 65 industries had declining growth rates, with annual changes ranging from 0.7 percent to 9.5 percent. Several key services industries experienced a decline in services off-shoring over this period, including computer systems design and related services and miscellaneous professional, scientific and technical services. The median services off-shoring annual growth was 4.6 percent for the 65 industry sectors over this period. There was little correlation between the growth in services off-shoring and services outsourcing at the industry level during the period. Industries with the fastest growth in services off-shoring generally were not the ones with the fastest growth in services outsourcing. Only two of the 10 industries with the fastest growth in services off-shoring were in the top ten for services outsourcing growth.9
8 Data limitations prevented estimating services outsourcing for MNCs. Only total outsourcing estimates could be developed as explained in Chapter 6. 9 The industry-level analyses in Chapter 3 ranked industries by their growth in services off-shoring and services outsourcing. The correlation between these two rankings was only 0.09, a very small and insignificant positive correlation.

19
Chart 4: Average Total and Services Off-shoring Rates for MNC Parents in Pharmaceutical and Medicine Manufacturing (1999 to 2003)
0%
2%
4%
6%
8%
10%
12%
14%
16%
18%
20%
1999 2000 2001 2002 2003
Source: Bureau of Economic Analysis
Perc
ent o
f Inp
uts
Average Total Offshoring Average Services Offshoring
Chart 5: Average Total and Services Off-Shoring Rates for MNC Parents in Architectural and Engineering Services
0%
2%
4%
6%
8%
10%
12%
14%
16%
18%
20%
1999 2000 2001 2002 2003
Source: Bureau of Economic Analysis
Perc
ent o
f Inp
uts
Average Total Offshoring Average Services Offshoring

20
Chart 6: Average Total and Services Off-Shoring Rates for MNC Parents in Computer Systems Design (1999 to 2003)
0%
2%
4%
6%
8%
10%
12%
14%
16%
18%
20%
1999 2000 2001 2002 2003
Source: Bureau of Economic Analysis
Perc
ent o
f Inp
uts
Average Total Offshoring Average Services Offshoring
Chart 7: Average Total and Services Off-shoring Rates for MNC Parents in Business Support Services (1999 to 2003)
0%
2%
4%
6%
8%
10%
12%
14%
16%
18%
20%
1999 2000 2001 2002 2003
Source: Bureau of Economic Analysis
Perc
ent o
f Inp
uts
Average Total Offshoring Average Services Offshoring

21
For MNC parents in the four industries examined, Charts 4-7 show total off-shoring and services off-shoring as a percent of purchased inputs from 1999 to 2003. These charts suggest slight growth in average services off-shoring in one or two of the industries (e.g. engineering and business support services), but no consistent, substantial growth in services off-shoring among all four industries. For this micro-level analysis, the shorter time period and limited sample sizes for some of the MNC sub-groups raised concerns about the susceptibility of group averages to distortion from small sample effects. Chapter 6 describes the alternative statistical technique10 used to ascertain and estimate significant trends in MNC parents’ outsourcing or services off-shoring. The micro-level results indicated that in only one of the eight MNC industry groups examined11—pharmaceutical and medicine manufacturing—did the parents experience significant growth in services off-shoring.
The Panel finds little evidence of consistent growth in services off-shoring from business restructuring among MNC parents in the industries examined from 1999 to 2003. The same is true at the aggregate level for comparable industry groups from 1998 to 2004.
This finding is consistent with the mixed results found when comparing growth rates for services off-shoring among the 65 industry sectors from 1998 to 2004 using industry-level data. As the data in charts 2 and 3 indicate, there does not appear to be any obvious growth trend in services off-shoring for those industry sectors comparable to the four MNC industries examined. This lack of consistent growth in services off-shoring from business restructuring during these limited periods does not preclude future growth emerging over a longer time period. In fact, the substantially higher levels of services outsourcing indicate the potential for future growth in this area. Differences Between Firms Off-Shoring Services and Those Not Off-Shoring Services Chapter 6 compared MNC parents’ off-shoring services from 1999 to 2003 with others in the same industry using descriptive characteristics and financial measures to ascertain substantial differences. The comparisons included the number and size of MNCs (by employment levels) and a range of financial variables, including total sales, value-added, employment, employee compensation, average employment compensation, total sales per employee, total imports, net income and capital expenditure (property, plant and equipment spending). As a result:
10 As noted in the chapter, semi-log regressions were estimated for pooled cross-section and time series data for each MNC parent sub-group to determine whether any statistically significant trends existed for the services off-shoring or outsourcing indicators. The results showed both positive (growth) and negative (decline) values for the services off-shoring coefficient for the eight MNC groups tested. The coefficients ranged from -0.14 to 0.22, with a median of 0.034, but only one of them was statistically significant. 11 Although only four industries were examined, we were able to develop two sub-groups of MNC parents within each industry based on the industry distribution of their sales. MNC parents with the preponderance of their sales in one of these industries were considered concentrated in the industry; MNC parents with some sales in one of these industries, but the preponderance in another industry, were considered non concentrated in these industries.

22
The Panel finds that MNC parents off-shoring services appear to be larger, account for disproportionate amounts of total sales and net income and have higher sales per employee than MNC parents not off-shoring services in the same industries and sub-groups.
Global Expansion Off-Shoring The analyses in Chapter 6 examined differences in growth rates for total sales and services sales between MNC parents and their foreign affiliates in the four industries reviewed. This was done to determine whether services off-shoring due to global expansion could be detected. The evidence is mixed based on industry averages over this period. Foreign affiliate sales increased faster than parent sales in three of the industries, but sales for parents concentrated in architectural, engineering and related services grew faster than foreign affiliate sales over the 1999 to 2003 period. Analysis of the distribution of affiliate sales by industry, customer and market destination indicated that:
• U.S. foreign affiliates often were concentrated in a variety of different industries than their parents. Computer system design and related services was the only group with the majority of affiliates classified in the same industry as the parents. A greater diversification of activities appears to be one result of overseas expansion.
• For all four MNC parent industries, the majority of U.S. foreign affiliate sales were to
unaffiliated customers in their local foreign market. Very few affiliate sales were imports to the United States, either to the parent or third parties.
Chart 8: MNC Parents with Faster Foreign Affiliate Sales Growth
1999 to 2003
0%
10%
20%
30%
40%
50%
60%
70%
80%
90%
100%
Perc
ent o
f Par
ents
Pharmaceticals & MedicineManufacturing
Architectural, Engineering &Related Services
Computer Systems Design &Related Services
Business Support Services
Source: Bureau of Economic Analysis.

23
Chart 8 shows the percentage of MNC parents concentrated in these four industries whose foreign affiliate sales grew faster than their own from 1999 to 2003. In all four industries the majority of MNC parents had faster affiliate than parent sales. For the three services industries, over 80 percent of the parents had faster affiliate sales growth. The analysis in Chapter 6 also indicated that the vast majority of these parents (from 76 to over 88 percent) had increased parent sales during this period. This contrasts with the limited percent of MNC parents importing services over this same period and thus off-shoring services due to business restructuring. Services off-shoring due to global expansion appears much more common among the MNC parents in the four industries examined during the period.
The Panel finds that services off-shoring due to global expansion was more prevalent among MNC parents in the four industries studied than services off-shoring due to business restructuring during the 1999 to 2003 period.
DATA ISSUES AND RECOMMENDATIONS Two types of data issues were encountered when developing estimates of the extent of services off-shoring: basic data gaps and data quality concerns. The former reflected the absence of key data elements, while the later involved discrepancies in reported data and their timeliness. Chapter 7 examines these data issues and their effect on the ability to estimate the extent and impact of services off-shoring. Data gaps and quality concerns reflect the inherent complexity of the off-shoring phenomenon and challenges that federal statistical agencies face in developing and collecting services data. The Panel commends BEA and BLS for their initiatives to improve the quality, timeliness and completeness of their data with the resources available to them. The Panel also greatly appreciates the full cooperation, support and responsiveness both agencies provided during this review. Contemplating approaches to address these data issues, the Panel weighed several considerations:
• Not all data issues were equally important to improving the understanding of the extent and impact of services off-shoring.
• Addressing some data issues could also help to resolve other data problems.
• Any proposed change would require resources to implement and could impose additional
costs and reporting burdens on survey respondents.
• Some recommendations appeared easier or less costly to implement than others.
• It is likely that some recommendations could be implemented more quickly than others.
• Addressing some data gaps and quality issues would have significant implications for a broader set of economic, financial or statistical policy issues.

24
• Several possible recommendations are being considered or actively pursued by the
agencies themselves. The Panel’s recommended improvements and changes to the current data collection system attempt to balance these considerations. The Panel’s key recommendations focus on three critical areas:
1. Improving the consistency, completeness and coverage of BEA data on services imports,
2. Providing longitudinal occupational data through a revised or restructured BLS survey.
3. Developing consistent business identifiers to link information from several statistical agencies with different business organizational levels.
These key recommendations are similar to several recommendations contained in the September 2006 report of the services off-shoring working group of the Massachusetts Institute of Technology’s Industrial Performance Center. Additional Panel recommendations concerning data needs are organized by the principal responsible statistical agency. Key Data Improvements for BEA
• Collect consistent levels of detail for affiliated as unaffiliated services imports. BEA uses various surveys to collect services import data. Currently, the BEA annual survey for unaffiliated services imports (BE-22 or the benchmark survey BE-20) collects more detailed data on the types of services imported than are collected for affiliated services imports in its quarterly surveys of MNCs and their transactions with foreign affiliates (BE-577). Because of these differences, the micro-level analysis of services off-shoring could use only total services imports to develop estimates of services off-shoring among MNCs. This did not prevent developing some initial total services off-shoring estimates, but it did preclude detailed analysis of the types of services being off-shored by the MNC parent. Moreover, inconsistent categories of services imports—particularly the greater detail available for unaffiliated imports—may help to explain the different treatment of affiliated and unaffiliated imports in BEA I-O tables. More detailed and consistent data on types of affiliated and unaffiliated services imports could provide greater insight on the economic impacts of services off-shoring. Specifically, they would improve estimates of specific occupational impacts by providing a more direct linkage with specific, detailed services industries and occupations used to produce them. BEA has a proposal under consideration to establish comprehensive and uniform coverage between its collection of affiliated and unaffiliated services. This will entail simplification and consolidation of minor categories of unaffiliated services imports, and then consistent collection of remaining detailed services categories for both types of imports.

25
The Panel recommends that BEA should implement its proposal to collect consistent levels of detail for affiliated and unaffiliated services imports and periodically review the collection to ensure that it is comprehensive and compatible with details on services contained in other economic data.
This change will improve understanding of the types of services being off-shored and the implications for particular occupations. Using the same survey forms to collect detailed affiliated and unaffiliated services imports also should eliminate BEA’s use of different company identifiers for MNCs’ importing both types and facilitate merging these data electronically. The Panel recognizes that BEA will have to extend the level of detail on services imports as more detailed data on services are developed for the U.S. economy. An example is the current effort led by the U.S. Census Bureau to develop a hierarchical product code system for domestic services through the North American Product Code System (NAPCS).
• Improve sampling coverage of U.S services importers. The Panel agrees with BEA that improving current mailing lists will require more than access to a consistent set of business identifiers with common current addresses, as recommended below. BEA’s agreement with Census to add a question to the annual Company Organization Survey (COS) to identify firms that are importing services is a useful step. This should result in improved BEA survey coverage of services importers among large multi-establishment firms, though BEA could consider other efforts to improve its mailing list.
The Panel recommends that BEA should assess the effectiveness and impact of the additional COS question and continue to seek ways to improve its survey of services importers.
This would include working with other federal agencies surveying particular service activities to determine whether information on imports of those specific services would useful to that agency. An alternative source of specific service imports would help BEA assess the adequacy of its survey coverage in this area. Key Data Improvements for the U.S. Statistical System
• Develop consistent business identifiers. CIPSEA was designed to establish consistent protection for confidential information collected by federal statistical agencies and provide increased opportunities to share data for statistical purposes among those agencies through written agreements. Efforts to link micro-level data across agencies may be impeded by the different systems used by the three major statistical agencies—BEA, BLS and Census—for identifying business firms or establishments within their respective jurisdictions. The lack of an accessible, comprehensive and consistent business register has contributed to numerous data gap and quality issues affecting the ability to estimate the extent and impacts of services off-shoring.

26
The Panel recognizes that each agency needs data from business entities at different organizational levels to meet specific information requirements at varying time intervals. However, a consistent set of identifiers for components within complex U.S. business entities would help each agency understand how the business components fit within a consolidated national or international business entity. In addition, it would retain the most advantageous features of each agency’s current business identification system. Most important, consistency would facilitate data sharing that could enhance the usefulness of separately collected data in understanding major cross-cutting issues, especially services off-shoring.
The Panel recommends that BEA, BLS and Census should work together to develop and maintain a consistent set of identifiers for each level of organization within every consolidated business entity in the United States. This would include shared location data for various entities and consistent methodology for assigning industrial classifications to them.
Developing a consistent set of business identifiers with common current addresses is the first step in helping BEA improve its mailing lists for services imports surveys. This change would eliminate the use of different firm identifiers for MNCs importing both affiliated and unaffiliated services, which also would be accomplished through BEA’s proposal to adopt a common survey. The key advantage, however, is the impact on future data sharing and linking micro-level data across agencies. This change would improve the ability to match BEA MNC data with BLS establishment data and business establishments in the economic census, thus improving understanding of the extent and impact of services off-shoring and other cross-cutting issues. Key Data Improvements for BLS
• Redesign OES sample for multi-establishment firms and longitudinal analysis. The analyses of changes in occupational employment shares and their relation to services outsourcing and off-shoring, discussed in Chapters 4 and 5, demonstrate the importance of understanding these distributional effects for firms or industries that off-shored services. The analyses affirmed the value of examining individual firm behavior using micro-level data to estimate services off-shoring’s extent and impact. They also indicated that changes in occupational structures reflect the effect of numerous economic factors, services off-shoring being one of them. The current sampling design for the OES program produces reliable estimates of occupational employment by industry and geographic area within the United States to meet not only BLS requirements but also specific state needs as funding comes from state trust funds under the Wagner-Peyser Act. Yet the design limits analysis of occupational shifts and wage changes over time for specific firms, particularly MNCs with multiple establishments. Specifically, it is difficult to know whether any establishments matched for MNCs in the OES data are representative of all the MNC’s establishments. Moreover, BLS has warned researchers and other users on its website that it “does not use or encourage the use of OES data for time series analysis.”12 12 BLS website, see http//www.bls.gov/oes/oes_ques.htm#Ques27.

27
The Panel recommends that BLS should develop additional sampling panels for its OES program to provide representation for multi-establishment firms at a national level and to support longitudinal analysis for single and multi-establishment firms.
This change would require additional resources, even if some of the additional sampling panels could be accommodated within the overall sample without sacrificing the quality and reliability of geographic and industry-level estimates. Developing the capability of longitudinal analysis at a national level can demonstrate the value of monitoring occupational shifts for particular firms over time for potential future application to specific geographical areas. Additional Data Recommendations for BEA
• Develop Estimates of MNC value added for services. The value of BEA MNC data for estimating the extent and impact of services off-shoring is diminished by the inability to distinguish purchased services inputs from all purchased inputs. The former is needed to develop indicators for the extent of MNC services outsourcing and off-shoring. The Panel recognizes that the feasibility of modifying BEA surveys to collect these data depends primarily upon the ability of business accounting systems to supply that level of detail. Previous efforts to collect similar data have shown that business accounting systems are not able to supply such detail, making it necessary to consider other estimation efforts. One alternative is the use of detailed economic census data to develop benchmark estimates of the distribution of a MNC’s value added between goods and services activities. Another is the application of more detailed benchmark I-O industry analyses to MNCs in the same industry. Although these data are not current, BEA could use historical data to project estimates if reliable, stable trends were found.
The Panel recommends that BEA should explore other available data, such as the economic census or benchmark I-O industry estimates, and estimation techniques to help allocate MNC value added between services and other activities.
• Develop consistent accounting for affiliated and unaffiliated services imports
in BEA I-O tables. Currently, affiliated services imports are shown separately from unaffiliated services imports and are accounted for differently in BEA I-O tables as “non-comparable” imports. The differences in the detailed services collected for unaffiliated imports precluded providing more consistent treatment. With similar details for both types of services imports, BEA staff would be able to separate affiliated services imports from the “non-comparable” import category in the BEA I-O tables and develop accounting linkages between them and unaffiliated services imports of the same type.

28
The Panel recommends that BEA staff should work to remove affiliated imports from the “non-comparable” imports component within its I-O tables and link them more closely with the same type of unaffiliated services.
This will require coordination between BEA industry and international staffs to ensure that accounting for affiliated and unaffiliated services imports in these I-O tables can be linked without losing information and insight currently available from each type of import.
• Accelerate availability of MNC operating data BEA has taken steps to improve the timeliness of its MNC financial and operating data and unaffiliated services import data, such as exploring ways to encourage its respondents to submit data electronically using BEA’s Internet filing system. However, many larger MNCs are unwilling or unable to use the system. As discussed in Chapter 6, this is particularly unfortunate because only a limited percentage of MNCs import services, and these tended to be disproportionately large, at least for the sectors reviewed in detail for this report. Since BEA can identify MNCs that import services from its current data, BEA could focus attention on those MNCs. If this group continues to represent a relatively small percentage of all MNCs, BEA could consider reallocating resources or assigning higher priority to processing their data.
The Panel recommends that BEA should reallocate priorities and resources, if necessary, to accelerate the processing of MNC data for those MNCs importing services.
BEA could test this approach on a sample of large MNC services importers to determine the additional resources needed to accelerate the availability of services import data.
• Collect data on imports for intermediate use. Closing this data gap has the potential to improve directly the indicators used to assess the extent of services off-shoring. It also appears to be the one producing the fewest effects on other broad economic issues. The cost and effectiveness of obtaining these estimates are somewhat uncertain. Moreover, BEA staff have indicated that most of the services currently imported appear to be for intermediate use. As more detailed types of services activities are developed and imported, however, the distinction between intermediate use and final demand may become increasingly important. The Panel acknowledges the conceptual difficulties posed by this type of collection effort, given the multiple and complex transactions that occur within a large and dynamic U.S. economy. This is particularly acute for the services sector relative to the manufacturing sector. As BEA has acknowledged, its MNC surveys ask respondents to distinguish intermediate use from final demand use for goods imports. Yet BEA officials stated that they have not been successful in overcoming the conceptual and measurement hurdles presented by service type imports.

29
The Panel recommends that BEA should consider limited sampling of MNC service importers to test their ability to distinguish particular types of services imports for their own use rather than for sale to others.
BEA industry account staff have developed an algorithm for allocating affiliated services imports to intermediate use by commodity type within the I-O tables. Once common service type categories for affiliated and unaffiliated services have been adopted and BEA staff have been able to link their accounting treatment in the I-O tables, BEA can assess the accuracy of that algorithm and determine its applicability to allocating unaffiliated services imports between intermediate and other uses among the 65 industry sectors in the I-O tables. Additional Data Recommendations for BLS
• Apply additional sampling criteria for the MLS program BLS’ Mass Lay-off Statistics (MLS) program identifies major lay-off events at individual establishments and surveys those establishments to obtain more detailed information on the nature of the event. It does so by using administrative data available on unemployment insurance claimants from the comprehensive set of establishments within the Quarterly Census of Employment and Wages. MLS staff then interview employers experiencing these major events about the nature of the lay-offs. MLS is the only direct survey that asks U.S. employers whether a major lay-off at an establishment involved movement of work activity overseas. It focuses on major lay-off events that are highly disruptive to surrounding communities and involve often substantial adjustment issues for displaced employees. As a result, its targeting criteria are not aimed at detecting services off-shoring activities that are either less immediate or more dispersed throughout the firm. Starting in 2007, BLS will obtain monthly data from states on all lay-offs, regardless of size. This more detailed universe of events provides an opportunity to use additional selection criteria for surveying firms with specific lay-offs. The Panel believes this could provide an opportunity to address future services off-shoring issues by using different criteria for some of the follow-up surveys. These criteria could include BEA MNCs that have increased services off-shoring or OES establishments that have experienced major occupational changes consistent with services outsourcing or off-shoring. To better address future services off-shoring issues:
The Panel recommends that BLS should develop additional survey criteria to target firms or establishments likely to be off-shoring or outsourcing services in a supplement to its MLS program in 2007 and future years.
This recommendation would require additional resources, but it will utilize an already planned expansion of a program that effectively combines administrative data with targeted sampling information.

30
• Publish 3-digit level data on standard occupation codes.
BLS has provided the aggregated 2- and detailed 6-digit standard occupation code (SOC) data for the OES program on its website, but it has not yet done so for the intermediate 3-digit level. Unfortunately, attempts to aggregate the 6-digit data resulted in an undercount of the actual 3-digit data, as described in Chapter 4. BLS can avoid this issue by making estimates of 3-digit SOC data sets available to the public.
The Panel recommends that BLS should provide OES data at a 3-digit level on its website, in addition to the 2- and 6-digit SOC levels already provided.
While BLS staff have noted that publication of OES data at the 3-digit level may require some additional suppression of currently available 6-digit level details to avoid confidentiality issues, it is not clear how extensive this would be. This should be examined and some alternatives assessed in implementing this recommendation. CONCLUSION Current levels of services off-shoring may be small. But, the potential for future growth in this phenomenon can be substantial, given the extent of services outsourcing and continuing technological changes. The Panel believes it is prudent to improve existing data systems now to increase the ability to detect and monitor future services off-shoring activities and their economic impacts. More detailed and better data are needed to assess both the future size and scope of services off-shoring and any adverse effects on the sectors, geographic regions, and individuals directly impacted.
31
LISTING OF PANEL FINDINGS AND RECOMMENDATIONS FINDINGS Services Off-shoring from Business Restructuring
• The level of services off-shoring due to business restructuring among MNC parents in the industries reviewed has been small during the 1999 to 2003 period. At the aggregate level, services off-shoring levels have also remained small for comparable industry groups and most other industry sectors during the during the 1998 to 2004 period.
• Services outsourcing to domestic firms has been substantially larger than services off-
shoring for the industry groups examined during the 1998 to 2004 period.
• Outsourcing and total off-shoring have been substantially larger than services off-shoring for the MNC parents examined during the 1999 to 2003 period.
• The extent of outsourcing and services off-shoring varies substantially among the MNC
parents and industries examined over the respective 1999 to 2003 and 1998 to 2004 periods.
• There is little evidence of consistent growth in services off-shoring from business
restructuring among MNC parents in the industries examined from 1999 to 2003. The same is true at the aggregate level for comparable industry groups from 1998 to 2004.
• MNC parents off-shoring services appear to be larger, account for disproportionate
amounts of total sales and net income, and have higher sales per employee than MNC parents not off-shoring services in the same industries and sub-groups.
Services Off-shoring from Global Expansion
• Services off-shoring due to global expansion was more prevalent among MNC parents in the four industries studied than services off-shoring due to business restructuring during the 1999 to 2003 period.

32
DATA RECOMMENDATIONS Key Data Recommendations for BEA
• BEA should implement its proposal to collect consistent levels of detail for affiliated and unaffiliated services imports and periodically review the collection to ensure that it is comprehensive and compatible with details on services contained in other economic data.
• BEA should assess the effectiveness and impact of the additional COS question and
continue to seek ways to improve its survey of services importers. Key Data Recommendation for Statistical System
• BEA, BLS and Census should work together to develop and maintain a consistent set of identifiers for each level of organization within every consolidated business entity in the United States. This would include shared location data for various entities and consistent methodology for assigning industrial classifications to them.
Key Data Recommendations for BLS
• BLS should develop additional sampling panels for its OES program to provide representation for multi-establishment firms at a national level and to support longitudinal analysis for single and multi-establishment firms.
Additional Data Recommendations for BEA
• BEA should explore other available data, such as the economic census or benchmark I-O industry estimates, and estimation techniques to help allocate MNC sales and value added between services and other activities.
• BEA staff should work to remove affiliated imports from the “non-comparable” imports
component within its I-O tables and link them more closely with the same type of unaffiliated services.
• The Panel recommends that BEA should reallocate priorities and, if necessary resources,
to accelerate the processing of MNC data for those MNCs importing services.
• BEA should consider limited sampling of MNC service importers to test their ability to distinguish particular types of services imports for their own use rather than for sale to others.

33
Additional Data Recommendations for BLS
• To better address future services off-shoring issues, BLS should develop additional survey criteria to target firms or establishments likely to be off-shoring or outsourcing services in a supplement to its MLS program in 2007 and future years.
• BLS should provide OES data at a 3-digit level on its website, in addition to the 2- and 6-
digit SOC levels already provided.

34

35
SECTION II
RESEARCH AND ANALYSIS

36

37
CHAPTER 1
INTRODUCTION
This is the second of a three part series of Academy Panel reports under a grant from the Bureau of Economic Analysis (BEA) in the Department of Commerce to conduct a comprehensive study of off-shoring. Public Law 108-447 gave BEA the authority and funding for the grant. BEA issued the grant to the Academy in February 2005 and the Panel held its first Panel meeting in March 2005 to review background materials, obtain agency perspectives on off-shoring issues from the three key federal statistical agencies—BEA, the Bureau of Labor Statistics (BLS) and the Census Bureau—and establish an overall work plan. OBJECTIVES OF THE ACADEMY OFF-SHORING STUDY The issue of businesses shifting some of their activities to foreign (off-shore) locations and the effects of these shifts on the U.S. economy and individual workers is not new. However, “current concerns over off-shoring emphasize the loss of service-sector, white-collar, and high-technology jobs, rather than heavy manufacturing jobs previously the focal point of public debate about international trade’s benefits and costs.”13 Several studies of this recent off-shoring phenomenon cite the role of technology, improved international telecommunications, the growth and expanded use of the internet, improved and standardized software applicable to a range of business activities and the increased digitization of business services as key factors expanding the scope of off-shoring activities into a broader group of industries and occupations. Traditional concerns about the impact of trade on manufacturing industries and blue-collar jobs have evolved to new concerns about the impact of off-shoring on high-tech services industries that have previously been considered less susceptible to off-shoring. The slow employment recovery from the 2001 recession and the adverse distributional employment effects on certain high-tech occupations (e.g., computer programmers) reinforces these new concerns. With that background in mind, the Academy and BEA agreed that this off-shoring study needed to address the following key issues:
1. How should off-shoring be defined?
2. What do currently available data indicate about the extent of U.S. off-shoring?
3. What additional data are needed to provide a more complete assessment of U.S. off-shoring?
4. What factors account for current U.S. off-shoring? And
13 National Academy of Public Administration, Off-shoring: An Elusive Phenomenon. January 2006, p. 7.

38
5. What are the major impacts of off-shoring on U.S. workers and the economy and implications for the educational system?
The Panel addressed the first and fourth issues in the first report—Off-shoring: An elusive Phenomenon—released in January 2006. This second report focuses primarily on the second and third issues, while the final report will address the broader policy concerns raised in the last issue. KEY ELEMENTS OF THE FIRST REPORT In its first report, the Academy Panel developed a conceptual framework to help understand the inherently complex issues involved in measuring and assessing the impacts of off-shoring, especially off-shoring of services. Any attempt to measure the extent and impact of services off-shoring had to combine different U.S. labor market and international trade perspectives. The significance of services off-shoring activities and their economic effects had to be assessed relative to other economic changes affecting the U.S. labor market and international trade. As the first report noted, “off-shoring is one of the structural sources of job shifts in a dynamic labor market that creates and destroys between 7 and 8 million jobs a quarter.”14 In summarizing the results of numerous previous studies addressing different aspects of services off-shoring, the Panel found little consensus among them about the extent and impact of services off-shoring. The disparity and intensity of viewpoints stem from many factors, including:
• the lack of a commonly accepted definition;
• differences in how the phenomenon has been reviewed;
• varied reliability of data and their use;
• the wide range of potential economic impacts and entities affected; and
• the inherent difficulty in measuring off-shoring and estimating its impacts. The Panel also found that the multiple terms used to describe off-shoring unnecessarily complicated any understanding of the phenomenon. To simplify the discussion and enhance understanding, the Panel recommended using three basic terms: “outsourcing,” “off-shoring” and “off-shore outsourcing” and defined them as follows:
“Outsourcing—firms contracting out service and manufacturing activities to unaffiliated firms located either domestically or in foreign countries; Off-shoring—U.S. firms shifting service and manufacturing activities abroad to unaffiliated firms or their own affiliates;
14 Ibid., p. 29.

39
Off-shore outsourcing—a subset of both outsourcing and off-shoring in that it refers only to those service and manufacturing activities of U.S. companies performed in unaffiliated firms located abroad.”15
The Panel recognized that its definition of off-shoring was broader than many others that limited off-shoring to particular activities (e.g. IT enabled services), or to shifts in activities only to certain foreign areas (e.g. low wage developing countries). However, the broad definition was consistent with the Panel’s four selection criteria and was also very similar to the definition of movement of work used by BLS in its Mass Lay-off Survey (MLS) program. The Panel expected this broad definition would avoid ambiguities from artificial distinctions or changes over time created by the narrower definitions used by others. Most of these previous off-shoring studies used a variety of publicly-available industry-level data to examine the extent of services off-shoring and evaluate its economic impacts, principally the employment effects; few used confidential micro-level (firm) data. Further, none attempted to link data at the micro-level from the major statistical agencies that collect trade and employment data. This may have reflected difficulties in obtaining access to these confidential data or the lack of agreements or memoranda of understanding (MOU) to share such data as provided in the Confidential Information Protection and Statistical Efficiency Act of 2002 (CIPSEA). The Panel concluded that linking micro-level employment and trade data was critical to assessing the adequacy of available data for estimating the extent and effects of off-shoring, since individual firms make these strategic services off-shoring decisions. Given resource and time constraints, the micro- level research had to focus on a limited number of industries that were significant in size, potentially vulnerable to off-shoring, sufficiently diverse, well integrated into the overall economy, and likely to continue expanding. The Panel selected the following four-digit NAICS industries:
• pharmaceutical and medicine manufacturing [3254]
• architectural, engineering, and related services [5413]
• computer systems design and related services [5415], and
• business support services [5614]. Three of the four industries selected were services industries. This was consistent with the increased role of services industries in the U.S. economy and responsive to current off-shoring concerns that focused almost exclusively on services off-shoring. The micro-level research, together with additional industry-level research, had several objectives but the key ones were to develop estimates of the extent and economic impact of services off-shoring and assess the adequacy of currently available micro- and industry-level data to produce such estimates. The results of this additional research are presented in this second report.
15 Ibid., p. 38.

40
OFF-SHORING, MNCs, AND NATIONAL STATISTICAL AND ACCOUNTING SYSTEMS In the first report, the Panel developed a conceptual framework to assess off-shoring as an economic phenomenon whose complex issues and impacts had to be considered relative to the impacts of other economic forces affecting U.S. labor markets and international trade. Chapter 7 of this report describes a number of data limitations and issues encountered while undertaking this additional research and presents some recommendations for improvements. These data limitations and proposed improvements must also be considered within the context of the U.S. decentralized federal statistical system that is unique among most other developed nations, and the role of national economic, financial and accounting data in an increasingly global world. The decentralized federal statistical system imposes some unique challenges in attempting to work with confidential micro-level data from more than one agency. Special access is required, consistent with CIPSEA to assure that consistent, uniform procedures for protecting confidential data are followed.16 While CIPSEA authorizes data sharing among federal agencies, this can occur only under written agreement. In this instance, BEA and BLS had to develop and execute an MOU, and BEA had to issue public notices required under CIPSEA, to permit linking BEA micro-level multinational corporation (MNC) data with BLS micro-level establishment data from the Quarterly Census of Employment and Wages (QCEW) and Occupational Employment Statistics (OES) programs. Even with the full support of both agencies, the process for completing this BEA and BLS MOU on data sharing was a lengthy one. In addition to the separate departmental legal and policy reviews, the first of the two required Federal Register notices had a 60 day comment period that had to expire before the second notice could be published. The data to be linked also had to be reviewed for confidentiality issues before any data transfer could occur. While the Panel expects that future research involving linking BEA and BLS data will be facilitated by the MOU, efforts to link micro-level data among other agencies will require specific agency MOUs to proceed. The continued expansion of MNCs and the increasing importance of international trade and other international transactions among independent nations raises some unique challenges for accountants and statisticians trying to maintain national economic and financial data. Efforts to establish and maintain international standards for specific data elements in national accounts and international transactions have become both more important and more difficult to achieve. The increased presence of MNCs and their expanding role account for some of this. Reconciling international accounts has also become more important and more difficult, as BEA’s experience with India and Canada (described in Chapter 7) has demonstrated. The Panel is particularly sensitive to these challenges and tried to take them into account in making its own recommendations for improving data to address services off-shoring. Unfortunately, the data
16 The Foreign Direct Investment and International Financial Data Improvements Act of 1990 also authorized BEA and BLS to link BLS establishment data on occupational employment with BEA MNC data, particularly data on U.S affiliates of foreign corporations, to examine the occupational structures of those companies relative to other domestic firms in the same industry.

41
issues posed by increased globalization and expansion of MNC operations are even more complex and challenging than those encountered for services off-shoring. ROAD MAP TO THE SECOND REPORT Chapter 2 describes two distinct types of services off-shoring—off-shoring due to business restructuring, and that due to global expansion. There are differences in potential economic effects from each. Each presents unique measurement challenges. The chapter describes the off-shoring and outsourcing indicators developed to measure the extent of services off-shoring and outsourcing at both a micro- and industry-level. The chapter also examines the effect of data limitations on the services off-shoring and outsourcing indicators ultimately used and the potential impact on the resulting estimates of the extent of and changes in services off-shoring. Chapters 3, 4, and 5 present the results of industry- level analyses. Chapter 3 describes the use of BEA input-output (I-O) tables to identify services outsourcing among 65 aggregate industry sectors. The use of BEA trade data in conjunction with the I-O tables enables estimates of services off-shoring among these same industries. However, data limitations require the use of critical assumptions to allocate services imports between intermediate and other uses. Industries are ranked according to the growth in their services outsourcing and off-shoring intensity over the 1998–2004 period. Chapter 4 uses occupational data from BLS’ OES program to determine whether changes in certain core service producing occupations provide an indication of services outsourcing and off-shoring. Core services producing occupations account for a substantial amount of employment in the four industries examined and exclude general occupations common to most industries (e.g., management). Core occupations were developed at both aggregate and detailed Standard Occupation Codes (SOCs). The rates of growth in the employment share of these core occupations in the specialized industry supplying the services were compared to rates among all the other industries to determine whether any significant differences occurred. Chapter 5 links BEA I-O data with BLS OES data to determine whether better estimates of off-shoring can be produced and to identify any changes in the occupational mixes between industries that have the highest and lowest growth in services off-shoring (from BEA data) over this period. Data limitations restrict estimates of any occupational changes for the 65 NAICS I-O industry sectors to the 2002 to 2005 time period. The analysis distinguishes between occupation employment changes due to occupational structural changes and those due to sectoral growth. Occupations are ranked by their rate of employment change over the period, from the lowest (actual employment losses) to the highest growth. These rankings for the quartile of industries with the highest growth in services off-shoring are then compared to the quartile with the lowest services off-shoring growth Chapter 6 describes the analysis of BEA micro-data on MNCs for the four selected industry groups. BEA data allowed an identification of MNCs with sales concentrated in the target industries and those with only some sales in those industries (their sales activities were concentrated in a range of other industries). Although the percent of MNCs importing services

42
varied among each industry, service importing MNCs were in the minority in every instance. Data limitations restricted the period of analysis to 1999 to 2003. This chapter also examined the growth in sales for MNC parents and their foreign affiliates to determine whether affiliate growth exceeded parent growth. Those instances were consistent with potential services off-shoring due to global expansion. Chapter 7 reviews the data gaps and quality problems encountered while undertaking the micro- and industry-level research. Data gaps are distinguished from data quality issues. The chapter concludes with a number of Panel recommendations to improve the ability of current data to estimate the extent and impacts of services off-shoring.

43
CHAPTER 2
METHODOLOGIES FOR IDENTIFYING SERVICES OFF-SHORING AND OUTSOURCING
In their first off-shoring report—Off-Shoring: An Elusive Phenomenon—the Academy Panel recommended adopting a broad definition of off-shoring—“firms shifting service and manufacturing activities abroad to unaffiliated firms or their own affiliates.” The Panel observed that current concerns about the economic impacts of off-shoring focused more on white-collar, high-technology activities within the services sector than on manufacturing industries that have traditionally been considered more vulnerable to the economic effects of international trade. The Panel also found little consensus among previous studies about the extent and impacts of services off-shoring. Consequently, the Panel determined that additional research was needed for a comprehensive review of services off-shoring. This chapter describes the multiple analytical approaches used to estimate the extent and impacts of services off-shoring among U.S. business since 1998 and to assess the adequacy of currently available data to develop such estimates. This includes analysis of both micro- (firm) and industry-level data using indicators of services off-shoring and outsourcing as consistent as data would allow. The chapter also presents the rationale for the analytical approaches used and how the available data affected them. Although many of the analytical approaches are similar to those found in previous studies, they have been applied to different data (e.g., micro-level rather than industry-level data), time periods (e.g., post 1997 to use NAICS rather than SIC categories) or data sets (e.g., linking BLS occupational employment data from the OES program with BEA industry accounts input-output (I-O) and trade data). BASIC RESEARCH PLAN AND OBJECTIVES Most previous studies of U.S. off-shoring used only publicly-available, industry-level data from BEA and BLS.17 Because off-shoring decisions reflect strategic business choices made by individual U.S. firms, the Panel believed that its additional research needed to use micro-level data collected by both agencies to estimate the extent of services off-shoring and its economic effects. Because these data are confidential, it was necessary for the project staff carrying out the research to obtain sworn status with each agency to access and analyze these micro-level data. Additional data sharing arrangements described below also had to be put in place by the two agencies to allow linking these confidential micro-level data from different data sets between agencies. Given the uncertainties about matching various micro-level data sets, the limited time available to complete this portion of the study, and other resource restraints, the Panel decided to
17 National Academy of Public Administration, Off-Shoring: an Elusive Phenomenon, January 2006, See Chapter 4. The few studies of U.S. services off-shoring using micro-level data relied on proprietary data collected by the private research group doing the study.

44
concentrate this additional micro-level research on the following 4-digit NAICS industries, primarily in the services sector:
• pharmaceuticals and medicine manufacturing18 [3254],
• architectural, engineering and related services [5413],
• computer systems design and related services [5415], and
• business support services [5614]. This concentration primarily on service industries responds to concerns about the effects of services off-shoring, particularly high-technology services, rather than more traditional manufacturing activities. These target industries are also expanding, potentially susceptible to off-shoring, diverse, and have significant interactions with other economic sectors. The Panel’s research plan involved work with BEA and BLS micro-level and industry-level data to achieve two basic objectives:
• Develop estimates of off-shoring, particularly services off-shoring, activity and derived economic effects, including employment effects, for each of the four selected industries, and
• Determine the adequacy of currently available data in developing estimates of off-shoring
and associated economic effects. Although the Panel recognized the need for micro-level analysis to evaluate the effects of specific firm decisions, there were a number of reasons for including industry-level analyses in the second report:
• A comprehensive assessment of the adequacy of currently available data for identifying services off-shoring must include industry-level data;
• Industry-level analyses can provide a broader, economy-wide scope to an assessment of
the extent and effects of off-shoring that an intensive analysis of micro-level data for several key industries cannot;
• Some alternative indicators for measuring the extent and effects of off-shoring (e.g., core
supply producing occupations) can be identified and tested at an industry level before applying them to micro-level analyses;
18 A large amount of drug manufacturing occurs in Puerto Rico. BEA considers Puerto Rico to be a part of the United States for collecting and publishing its trade and MNC financial and operating data.
45
• Industry-level analyses can identify other industries using the services and commodities produced by these four selected industries and examine whether those users are outsourcing or off-shoring these services; and
• Results from industry-level analyses can be compared with micro-level results and
similar estimates from previous studies to reinforce particular findings. The basic research plan involved analyzing BEA micro-level financial and operating data of MNCs and trade in unaffiliated services data, as well as the industry accounts I-O data, primarily in the services sector, to determine whether estimates of services off-shoring activity could be developed for MNCs within the selected industries, or for the comparable industry sectors contained in the I-O use tables. Analysis of BLS micro-level establishment data would also identify any differences in employment, occupational structure, and wage changes between firms19 believed to be off-shoring services and other firms within the same industries. To identify off-shoring firms, the Panel planned to use several alternative sources—BLS MLS data, results from analyses of BEA MNC data, or other independent sources. Trends in employment flows, occupational structures and wage changes for the firms believed to be off-shoring were compared with trends for similar sized firms in the same industries to determine any significant differences. The analysis relied primarily on BEA micro- and industry-level data to identify the extent of services off-shoring for specific firms (MNCs) and industry sectors. BLS employment data from the QCEW and OES programs were linked at the industry- and micro- level to examine the employment effects for those firms or industries off-shoring services. The BLS data allowed analysis not only of aggregate employment effects, but key distributional effects—particularly whether services off-shoring had any different impacts on employment levels for specific occupations. As work progressed, occupational data appeared capable of identifying internal restructuring within firms that might indicate services outsourcing and possibly off-shoring. The analysis presented in chapters 4 and 5 explores these possibilities. Data limitations involving sampling design for the MLS and confidentiality issues with attempting to link external micro-level information from private sources20 to government micro-level data required relying primarily on BEA MNC data to identify firms off-shoring services. DEVELOPMENT OF OFF-SHORING INDICATORS Previous studies have noted the varied reasons for off-shoring, the primacy of cost-savings considerations and the range of financial and economic effects on the off-shoring firm, its 19 Since business restructuring decisions leading to off-shoring or outsourcing are believed to be made at the firm, not the establishment level, the BLS establishment data need to be aggregated to the firm level within the business organization. For example, Wal-Mart makes strategic business decisions at the firm or corporate level that affect each local store or establishment. The individual establishments, stores, need to be aggregated to develop a measure of the total firm, Wal-Mart. 20 Academy staff had obtained data from a private group that contained names of individual firms that had been cited in press reports or other public documents as relocating certain of their services operations to foreign locales. The existence of company names and the need to use them to link these data to government micro-level data raised confidentiality issues that appeared insurmountable.

46
workers, suppliers and customers, as well as the broader effects on the U.S. economy and workforce. The Panel believed that its definition of off-shoring was sufficiently broad to encompass all these varied reasons for firms’ off-shoring services. Two Different Types of Off-Shoring Firms decide to off-shore certain services for two distinctly different reasons. One results from a strategic decision to restructure or re-engineer current business or productions processes; the other arises from strategic decisions to expand overseas operations through foreign affiliates to meet growing global demands. If the firm is off-shoring because it has restructured internal production processes to obtain services from off-shore suppliers, that business restructuring decision should produce a change in the mix of inputs used to produce its output. There should be an increase in services imports by the firm that has restructured its activities and off-shored services to either an unaffiliated supplier or a foreign affiliate that had previously been supplied either internally or from an unaffiliated domestic supplier (outsourced services supplier). When the foreign supplier is an unaffiliated entity, off-shoring is a subset of outsourcing—“off-shore outsourcing”—as defined above.21 Alternatively, a firm may off-shore some of its services because it decided to reallocate its total services output between its domestic and overseas operations. This is a separate decision from outsourcing or off-shoring due to business restructuring, and is undertaken for entirely different reasons. Because only MNCs have separate domestic (U.S. parent) and overseas (foreign affiliate) operations, only MNCs can off-shore in this way. This global expansion off-shoring involves redistributing a MNC’s global output from its U.S. parent to its foreign affiliates, whereas off-shoring due to business restructuring involves redistributing the inputs used by the U.S. firm (or the MNC parent). Both MNCs and other domestic firms can experience off-shoring from business restructuring, and this activity should reflect increased use of imported services inputs.
Indicators of Business Restructuring Off-Shoring In theory, identifying and estimating the extent of off-shoring for firms that restructure their internal production processes would be relatively straightforward if sufficient data were available. An indicator for business restructuring off-shoring would reflect the amount of imported goods and services used by the firm to produce its products during the year relative to the total inputs used (labor, capital, and purchased intermediate products). The higher that ratio, the greater the off-shoring activity. Increases in the ratio over time indicate growth in the firm’s off-shoring activity.
21 MNCs can engage in business restructuring services off-shoring by obtaining the restructured service activity from a foreign affiliate rather than an independent foreign supplier. In this case, the services off-shoring is not a subset of outsourcing, since the off-shored service is obtained from an “in house” affiliate. For the rest of this paper, the term services off-shoring will apply to off-shoring from both affiliated and unaffiliated foreign suppliers. Chapters 2 and 3 of the first Panel report, Off-shoring: an Elusive Phenomenon, describe more completely the differences between outsourcing and off-shoring.

47
Since current concerns about off-shoring focus on service activities, and even more narrowly on high-technology services, rather than on the broader array of all goods and services, this off-shoring indicator needs to be refined to focus more directly on services. Again, in theory, the same off-shoring indicator can be constructed for particular services. For any service, the numerator of the specific services off-shoring ratio would include only the imports of specific services used as intermediate inputs. The denominator would still include the labor, capital and purchased inputs for the firm’s production processes using those specific services. The size of this off-shoring ratio is important because it helps determine the economic effects of off-shoring on the firm, its workers and the rest of the economy. In particular, it helps determine the direct employment impact from off-shoring. However, current off-shoring concerns also focus on whether off-shoring is increasing over time. Thus, the change in this off-shoring ratio is equally important, since it will indicate whether services off-shoring is increasing and, if so, how fast. Business restructuring off-shoring, like outsourcing, frequently affects activities not involving a business’s core competencies. As the first Panel report noted, “off-shoring decisions are made for many of the same reasons as outsourcing decisions.”22 However, these decisions can produce different benefits and risks. For this report, estimates of the level and growth of services outsourcing were developed and compared to services off-shoring estimates. Since services off-shoring from business restructuring is often a subset of services outsourcing, the difference between the two may identify the potential for future services off-shoring growth if current expected benefits and risks become more favorable. Services outsourcing was estimated as the amount of purchased services inputs relative to total inputs used in a firm’s production process.
Indicators of Global Expansion Off-Shoring This form of off-shoring arising from global expansion of a firm’s service production activities to areas outside the U.S. differs in several respects from off-shoring due to a restructuring of the firm’s internal production processes. First, this form is unique to MNCs, because only they have foreign affiliates to engage in global expansion outside the U.S. Second, this usually involves a redistribution of one or more components of the firm’s services outputs, while off-shoring due to business restructuring involves one or more services inputs used by the firm. Third, effects of global expansion off-shoring, especially the employment effects, are even more complex than those from off-shoring due to business restructuring. While the direct employment effects from off-shoring due to business restructuring are likely to involve some loss of jobs as imported services substitute for domestically supplied services, the direct employment effects from global expansion off-shoring are more uncertain. In many instances, primarily those where off-shoring provides the MNC access to previously untapped foreign markets, the direct employment and other economic effects may be strictly positive.23 In
22Op.cit., Off-Shoring; an Elusive Phenomenon. p. 9. 23 Several recent studies of BEA MNC employment data—Matthew J. Slaughter (Globalization and Employment by US Multinational Corporations: A Framework and Facts, March 2004) and Ann E Harrison and Margaret S. McMillan (Outsourcing Jobs? Multinationals and US Employment, NBER working paper 12372, July 2006)—have also found some complementarities between MNC parent and affiliate employment in certain conditions.
48
other cases, where the global expansion off-shoring foregoes growth in (or perhaps replaces) U.S. exports to foreign markets, the direct employment and other economic effects may be more mixed. Because of this greater complexity, identifying and estimating global expansion off-shoring by MNCs was much more difficult and required different data than business restructuring off-shoring.24 Estimating global expansion off-shoring examined whether MNCs within the four selected industry groups have redistributed some services production from the U.S parent to their foreign affiliates. A principal indicator for services off-shoring due to global expansion is the comparison of total service production growth rates for MNC parents relative to their foreign affiliates. A critical condition for global expansion off-shoring is that total service production25 is growing faster for a MNC’s foreign affiliates than for the U.S. parent. This condition limits global expansion off-shoring to those MNCs with foreign affiliates that account for an increased share of total MNC services production. There are a number of reasons, however, why services production for affiliates may be growing faster than for the MNC parent. Foreign demands for a MNC’s services may be growing faster than domestic (U.S.) demands. In this case, faster growth in foreign affiliates’ service production activities may simply be responding to changes in foreign market demand or other market conditions and not reflect an explicit MNC decision to reallocate services production to its overseas affiliates. Faster growth among affiliates may also reflect decisions to diversify, particularly if affiliate services activities differ from those of the parent. Global expansion off-shoring also implies that the MNC parent had been or would be able to meet the growth in foreign demand with its services exports. Identification of global expansion services off-shoring requires much more detailed data on the types of services produced and the markets served by foreign affiliate production and parent exports. More detailed data on the types of services produced and sold by foreign affiliates relative to parents could help distinguish between some of these reasons for expansion in foreign affiliate services activities, one of them being global expansion off-shoring. ANALYTICAL APPROACHES FOR ESTIMATING SERVICES OFF-SHORING Because services off-shoring involves a reallocation of some components of a firm’s services inputs (business restructuring off-shoring) or outputs (global expansion off-shoring) from its U.S. facilities (or those of its domestic unaffiliated service supplier) to some foreign facilities, analysis of industry- or micro-level data focused initially on production and trade data. MNCs with a declining share of total services output for the parent relative to its foreign affiliates provide an initial identification of possible services off-shoring due to global expansion. Similarly, firms increasing their use of imported services for intermediate inputs in their production processes provide a direct measure of the extent of services off-shoring from business restructuring. However, an examination of changes in specific occupations firms use to produce
24 This greater complexity and need for different types of data may explain why most previous studies of services off-shoring reviewed and summarized in Chapter 4 of the first Panel report addressed only restructuring off-shoring. 25 As explained in chapter 6, this study used total sales as a proxy for total services production.

49
services may provide an alternative means to identify the extent of this type of services off-shoring (or at least services outsourcing). Concerns about services off-shoring involve not only the current extent of off-shoring, but also any trends or changes in off-shoring over time. To address these concerns requires consistent, longitudinal data. Micro-level research on four specific, primarily services industries, at a 4-digit NAICS level, limited time series data to the availability of consistent NAICS data. Since the NAICS began in 1997, a 1997-2004 time period would allow an examination of changes U.S. firms’ activities during the late 90’s expansion building up to the 2001 recession and the subsequent recovery. Because not all BEA and BLS data are available for each of these years, the industry-level analyses covered the 1998 to 2004 period, but the micro-level data were available only from 1999 to 2003. While the analyses initially focused on four industries, the industry-level analysis was extended to other manufacturing and services industries that may be using outputs from these industries (intermediate services) in their production processes to identify whether they have outsourced, and perhaps off-shored any of these services. Similarly, the micro-level research included an examination of firms concentrated in these industries, as well as firms that have some, but not a preponderance, of their activity in one of these industries. Both industry- and micro-level analyses developed similar indicators of services off-shoring and outsourcing to the extent data permitted. Industry-Level Analyses Industry-level analyses used BEA I-O and trade data to develop services off-shoring and outsourcing indicators. These were then applied to all 65 industry sectors in the annual BEA I-O tables to identify industry sectors with the highest levels and growth rates for services off-shoring and outsourcing over the 1998- 2004 period. Analysis of BLS OES data for aggregate (2- and 3-digit) and detailed (6-digit) SOC categories of occupations first focused on developing core occupations needed to produce the services and commodities for the four industries selected for review. Changes in the employment of these core occupations between each selected industry and all other industries were examined to determine whether they could identify services outsourcing and off-shoring. Finally, BEA I-O data were compared with BLS OES data at the industry level to determine whether those industries with the highest growth in services off-shoring and outsourcing had different changes in their mix of occupations relative to industries with the lowest growth in these measures over the period.
Input-Output (I-O) Off-Shoring and Outsourcing Indicators BEA produces annual estimates of the inputs used by manufacturing and services industries to produce their output. While these annual estimates are not as detailed as the estimates developed for baseline years (based on economic census data collected at five-year intervals by the Census Bureau26), they are more current27 and provide information about outsourcing and off-shoring
26 For further information on economic census data collected by the Census Bureau go to www.census.gov. 27 Although the latest economic census data were collected for 2002, these data are still not available. Thus, the latest detailed I/O data currently available are from the 1997 economic census.

50
activities, albeit at a more aggregate level. Since these I-O data contain information on use of purchased services as inputs by various industries, we compared the change in purchased services and the purchased services share of gross output by industry over the period. Industries increasing use of “external” purchased services are outsourcing those services and may be susceptible to off-shoring. Consequently, the services outsourcing indicator used at the industry level was the ratio of purchased services relative to total sales (a proxy for total production or output). These I-O data also provided information on imports and exports of commodities by industry group. Sufficiently detailed export and import data in these I-O tables could provide insights about services outsourcing and off-shoring among individual industries. Unfortunately, there were major data limitations impeding the use of I-O data. The lack of data on services imports for intermediate use rather than final demand was the first data gap encountered. In addition, the current BEA I-O tables provided data only for 65 industry sectors. While 38 of these were service industries, the industries were not consistently disaggregated to the 4-digit NAICS level. Perhaps the most critical data limitation was the need to assume that the share of unaffiliated services imports in the total available domestic supply for each commodity is the same for all industries using that commodity to distribute these services imports among all of the I-O industries. This intermediate services import estimate was divided by total purchased inputs for each industry to develop a services off-shoring intensity indicator. Despite these limitations, I-O data provided information on the extent of outsourcing of services among manufacturing and services industries. To the extent that services off-shoring due to business restructuring is a subset of services outsourcing,28 estimates of services outsourcing can provide an upper boundary for potential services off-shoring. More detailed information on the share of services imports used as intermediate products would provide estimates of the amount of outsourced services that were also off-shored.
Occupational Distribution Indicators of Services Outsourcing and Off-Shoring This industry-level analysis used BLS OES data on detailed occupations by industry to develop an alternative measure for identifying services outsourcing and off-shoring. The key to this alternative occupational-based approach was an assumption that industries (and firms within those industries) specializing in the production of particular services use labor inputs in processes unique to the industry or that differ significantly from labor inputs needed for other non- service production. If different services (or for that matter manufactured goods) require different labor inputs (occupational mixes) to produce those services, then it should be possible to identify a group of core occupations that “define” the industry and distinguish it from other industries. This analysis required an industry approach because, as I-O analysis indicated, industries used a range of services and components in production processes, and some services and components were used in other industries and were produced in yet other industries.
28 Off-shore outsourcing is the only type of off-shoring due to restructuring for non-MNCs. However, MNC parents can off-shore services due to restructuring by importing those services from their foreign affiliates as well as unaffiliated foreign suppliers.

51
This analysis examined the principal occupations used in each selected industry. The degree of occupation concentration within each industry (usually whether a limited number of occupations account for a major part of total employment in the industry) defined this group as “core” services producing occupations. The analysis also identified other industries that employed these “core” occupations even though they were ancillary to those industries’ principal production activities. For example, computer programmers and systems analysts are “core” occupations within the computer design services industry, but other industries also include these occupations since they require computer support services in their own production processes. Likewise, mechanical and electrical engineers are core occupations within the architectural and engineering services industry, but other industries also employ them in their internal production processes. Differences in growth of core occupations relative to total employment were compared across industries. If non-specialist industries were reducing relative employment of selected service industry core occupations, while selected service industries were increasing their employment shares for these core occupations, or at least not decreasing it to the same degree as all other industries, this result was consistent with an increase in outsourcing of services produced by these primary occupations. Chapter 4 presents this analysis in detail. Industry-level analysis of changes in the employment share of core service producing occupations between the selected industries and the rest of the economy demonstrates the need to supplement OES data to go beyond measuring outsourcing and try to identify off-shoring. A decline in core occupation employment outside specialist services industries that exceeds the growth in these occupations within those industries may be consistent with possible off-shoring, but may also reflect the greater efficiency and productivity of these core occupations in the specialist service industries.
Linking BEA I-O and BLS OES data Because BEA I-O tables identify industries off-shoring services, combining results with OES occupational analyses provided a more complete measure of the extent of services off-shoring and its impact on the occupational structures of those industries off-shoring services. Data limitations again impeded this analysis. There were a number of aggregation issues that needed to be overcome, as described in Chapter 5. Perhaps the most critical limitation was that not all firms within an industry are homogeneous. They do not all face the same market conditions for their production and inputs, nor do they respond the same to changes in those conditions. If only a few firms within an industry are off-shoring services, the effect of off-shoring actions at the aggregate industry-level will depend upon the extent of their off-shoring and their size relative to all other firms in the industry. The same is true for the effect of services off-shoring on occupational employment. In short, possible occupational changes for off-shoring firms within the industry will be masked by the occupational changes for non-off-shoring firms in that industry. The masking of these individual firm off-shoring distributional effects is more likely at higher levels of aggregation for each industry. However, these analyses provided an opportunity to develop alternative measures for identifying services outsourcing and off-shoring and test their feasibility. The concept of core service producing occupations can be applied at the micro-level to assess whether firms that are

52
off-shoring particular services are also experiencing a decline in the relative employment of those core services producing occupations. MICRO-LEVEL ANALYSES Although the Census Bureau collects substantial, detailed data on business firm operations through its economic census, these data are collected only every five years, the latest are the 2002 Census. In addition, Census publishes more limited information from annual surveys in its County Business Patterns, Statistics of U.S. Businesses, Annual Survey of Manufactures, Service Annual Survey, and surveys on Construction, Retail Trade, Governments, and other sectors of the economy. An alternative source of timelier, but less detailed information is financial and operating data for MNCs from BEA annual and quarterly surveys. These surveys provide detail not found in the Census data on the relationships between MNCs and their foreign affiliates. Academy staff were authorized access to confidential, micro-level data from two datasets collected by the BEA: “financial and operating” data of MNCs, and “international transactions” data. Although U.S. parent MNCs account for less than 20 percent of total U.S. employment, MNCs are likely to be critical to assessing the extent of services off-shoring activity and its economic impacts, particularly its employment effects. A number of prior studies suggested that MNCs have had a leading role in initiating and expanding the off-shoring of services. Indeed, only MNCs can engage in global expansion services off-shoring. MNCs are also likely to play a substantial role in services off-shoring due to business restructuring. As BEA has noted, MNCs accounted for an estimated 37 percent of U.S. goods imports for 2003.29 MNCs also account for an even larger share of services imports that are considered most vulnerable to off-shoring—other private services, especially business, professional and technical (BPT) services. In 2004, of the estimated $40.7 billion of imported BPT services, almost 70 percent—$28.2 billion—were affiliated imports representing transactions between a MNC and its foreign affiliates.30
Identifying MNC Services Outsourcing Because services off-shoring from business restructuring is often a subset of services outsourcing,31 examining the extent of services outsourcing among MNCs in our select industries was a critical first step in analyzing the extent of services off-shoring. While not all outsourced services will or can be off-shored, outsourced services are potentially more susceptible to future off-shoring than services still produced internally. Thus, current outsourced service activities can provide an indicator of potential future growth in services off-shoring.
29 R. Mataloni, “U.S. Multinational Companies: Operations in 2003”, SCB July 2005 p. 13. 30 E. Nephew, J. Koncz, M. Borga and M. Mann, “U.S. International Services: Cross-Border Trade in 2004 and Sales through Affiliates in 2003. SCB October 2005, Table 1 p. 46. 31 MNCs can also off-shore services from restructuring by importing services inputs from their foreign affiliates.

53
Data limitations with BEA MNC surveys required use of an indirect proxy to assess the extent of and changes in MNC parent services outsourcing. Our services outsourcing indicator was the ratio of a MNC parent’s total purchased inputs to its total output, where total output was measured as total sales in a given year.32 Total sales were obtained directly from the MNC parent surveys, but the total purchased inputs variable was estimated as the difference between each MNC parents annually reported total sales and its value added—both variables were available or derived from the MNC survey data. Unfortunately, BEA MNC parent surveys do not collect separate information for the value added of goods and services. Consequently, the estimated purchased inputs variable cannot distinguish goods from services33 and only total outsourcing indicators could be developed. These were estimated for two groups of MNC parents:
• those with sales concentrated in the four industries examined (group I parents), and
• those with some sales in these industries, but with the preponderance of their sales in other industries (group II parents).
These two groups were developed both to expand the sample of MNC parents reviewed and to determine whether MNCs with services sales as only an ancillary activity were more likely to outsource (or off-shore) those ancillary services.
Business Restructuring Off-Shoring by MNCs Business restructuring off-shoring requires some use of imported purchased inputs. The preferred indicator of services off-shoring was that portion of a MNC parent’s purchased services inputs imported either from a. foreign affiliate (affiliated imports) or an independent third party (unaffiliated imports). Again, data limitations required use of indirect proxy indicators of services off-shoring: the first, “off-shoring intensity,” was the ratio of total imports to total purchased inputs; the second, “services off-shoring intensity,” was the ratio of total service imports to total purchased inputs. These off-shoring intensity indicators were then used to identify those MNC parents with above average off-shoring intensity, and those with positive off-shoring intensity growth over the period 1999 to 2003. Because of the substantial number of MNC parents that did not import either goods or services during this period, these off-shoring intensity indicators were used to divide the MNC parents within each industry group into sub-groups—the target group of services off-shoring MNC parents and other MNC parents.
32 As discussed in Chapter 6, total sales are an incomplete measure of total production which also includes changes in inventories. However, BEA staff have indicated that inventories for services are likely to be relatively minor. For certain types of services, e.g. trade and financial intermediation, output cannot be approximated by sales. However, for the types of services believed to be vulnerable to off-shoring—principally business, professional and technical private services—sales may be a reasonable proxy for total production. 33 Chapter 6 describes these data limitations and the development of this services outsourcing intensity measure in greater detail.
54
The services off-shoring MNC parents were compared with other MNC parents in the same industries and across different industries to identify any:
1. substantial differences in the extent of services off-shoring among those MNC parents in the industry sub-groups;
2. significant trends in the growth of the services off-shoring intensity over the period;
and
3. other differences in characteristics or economic performance between services off-shoring MNC parents and other MNC parents in the same industry sub-groups, using BEA MNC financial and operating data.
Global Expansion Off-Shoring by MNCs
This analysis examined transactions between and the relative economic performance of MNC parents and their foreign affiliates within the selected four industries over the period 1999 to 2003 to identify whether those MNCs reallocated services production activity from the U.S parent to their foreign affiliate(s). Total sales served as the proxy for services production activity. To determine whether total activity was reallocated from the parent to the foreign affiliates, we focused on those MNCs whose affiliates accounted for a larger share of total MNC sales over the 1999 to 2003 period. An increase in the affiliates’ share of total MNC sales occurs if their sales increased faster than parent sales over the period. To detect possible services off-shoring among MNCs due global expansion and to attempt to distinguish that from other explanations for faster affiliate growth, the micro-level analysis in chapter 6:
• Identified those MNCs that experienced faster growth in foreign affiliates’ total sales relative to the domestic parent during the 1999 to 2003 period and tried to determine the types of services involved (if possible).
• Examined and compared sales of MNC parents and foreign affiliates by industry.
• Examined the markets served—by destination and customer type—by foreign affiliate
total sales and services sales, and compared them to markets served by parent services exports.
The distribution of foreign affiliate sales among its local or host-country market, other foreign markets and the U.S. market can help determine whether the faster overseas growth reflects global off-shoring or other reasons. This analysis was combined with an examination of the distribution of parent services export to foreign markets. If most of the affiliate sales growth is occurring in the foreign home market and that market had not been served by parent services exports, that growth is less likely to impede growth in the parent’s services exports. The impact of affiliate expansion in foreign markets not served by parent exports may be more positive than

55
negative for parent sales to domestic or other foreign customers. In addition, foreign affiliates may be a primary source of demand for parent exports. ESTIMATING EMPLOYMENT AND ECONOMIC IMPACTS Analyses of BEA financial and operating data of MNCs identified MNC parents that had off-shored services due to either internal restructuring or global expansion. BEA surveys provided information on total sales, value added, employment, employee compensation, capital expenditures, net income, total exports and imports for each MNC. Data for services off-shoring MNC parents and non-off-shoring MNC parents were compared to assess the relative economic performance of each group within the same industry.34 Simple regression analysis was used to determine whether there were any statistically significant differences or trends for key financial measures between the services off-shoring parents and other MNCs over this period. To assess employment effects, the industry-level analysis in Chapter 5 examined occupational structural changes in those industries with the fastest growth in services off-shoring relative to those with the slowest growth (or actual declines in services off-shoring). For the micro-level analyses still underway, the research plan is to link BEA MNC micro-data with BLS micro-data from the QCEW and OES data bases. This linkage should allow an examination of potential differences in job creation and destruction for services off-shoring MNC parents relative to non- services off-shoring parents and comparably sized firms35 in the same industry. Changes in the occupational structures of services off-shoring MNC parents will also be compared to occupational changes for non-services off-shoring MNC parents and other similar sized firms in the same industry. These analyses of linked BEA and BLS micro-data should provide the most direct measures of net employment effects and distributional effects among particular occupations for servicing off-shoring firms. These results will be presented in the third Panel report.
34 Even though the non-concentrated, Group II MNCs are from different NAICS industries, we still compared the performance of services off-shorers to others for those four groups as well. 35 Since BEA data indicated that most MNCs tended to be large sized firms, with more than 1000 employees, only large sized domestic firms would be compared with MNCs using the BLS data.

56

57
CHAPTER 3
INDUSTRY-LEVEL ANALYSIS INTRODUCTION This chapter presents estimates of services outsourcing and off-shoring using publicly available data from BEA’s industry and international accounts.36 Chapter 4 and Chapter 5 present analyses of OES data to determine whether changes in the employment of services producing occupations can be observed in individual industries. Chapter 4 looks at the OES data alone to see whether they can be used to identify industries that may be outsourcing or off-shoring service activities. Chapter 5 takes a more direct approach for examining the employment and occupational impacts of services off-shoring by linking the measures of off-shoring developed in this chapter with OES national data. It uses these data to examine the components of the changes in employment for occupations in industry sectors experiencing high and low rates of services off-shoring growth. Industry-level analysis in this chapter uses BEA annual industry accounts data to identify industry sectors37 that have increased or reduced use of purchased services inputs relative to total output (services outsourcing). It also uses published import data to estimate services off-shoring, measured as purchased services imports as a percent of total purchased inputs. This chapter addresses the extent to which industry-level data provide adequate information for estimating the extent of services off-shoring among industries and its impact on employment within specific occupations. It assesses the effect of existing data limitations on the reliability and consistency of services off-shoring estimates, including the critical assumptions needed to work within these limitations. For example, it examines the extent to which non-comparable imports affect measurements of off-shoring, and the assumptions needed to convert total comparable import data to imports of intermediate goods and services. The chapter includes Panel recommendations for improving the usefulness of industry level data in estimating services off-shoring.
36 All of the principal statistical agencies have excellent web sites that make their detailed public data readily available. See www.bea.gov (Bureau of Economic Analysis) www.bls.gov (Bureau of Labor Statistics) www.census.gov (Bureau of the Census) 37 The term “sector” as used in this chapter and Chapter 5 refers to industries classified according to the 65 industry codes in BEA’s annual industry I-O accounts. BEA classification groups industries in varying combinations of 2-digit to 4-digit NAICS codes. The list of sectors and their NAICS industries is provided in Appendix D.

58
DATA SOURCES AND DEVELOPMENT BEA I-O data present aggregate industry activity for 65 BEA annual industry input-output account sectors, including 27 specific service sectors.38 These data provide detailed information on the flows of inputs and outputs among sectors and subsequent changes in the purchases of intermediate goods and services (outsourcing) among sectors. BEA I-O data that include services imports can be utilized to develop estimates of purchased intermediate imports, which are then used to measure services off-shoring over the period 1998 to 2004. Estimating Off-Shoring Intensity Indices In 1996, Feenstra and Hanson proposed a common sense measure of off-shoring due to business restructuring as “the share of imported intermediate inputs in the total purchase of non-energy materials.”39 Their measure has been used in a number of recent studies of services off-shoring, including several by Amiti and Wei (2005, 2006). These studies have generally relied on the SIC system, which has a much longer time frame, but far less detail on services industries than the newer NAICS-based data. BEA inter-industry data contain consistent annual estimates back to 1998 using NAICS. NAICS-based data were used because they (1) place a much heavier emphasis on service sector industries than the SIC, and (2) are the basis on which current and future data are classified by BEA, BLS, and Census. It is important that the classification system emphasize service sectors, because service activities account for the overwhelming majority of economic activities and are at the core of current off-shoring concerns. Another advantage of BEA inter-industry data is the availability of a consistent measure of total comparable40 imports associated with each good or service produced. While there are no direct measurements of imported intermediate goods and services used by an industry, a consistent allocation assumption can be applied to the total comparable import data to estimate industry intermediate comparable imports. Because all non-comparable imports are for services only, adding non-comparable imports for each industry to estimates of intermediate comparable imports of services yields industry totals for intermediate services imports. BEA Industry I-O Use Tables Measures of outsourcing and off-shoring can be calculated from BEA annual industry accounts I-O use tables using a methodology similar to that of Feenstra and Hanson. The I-O use tables also provide data on how commodities and services are used in the economy, both by sectors
38 There does not appear to be an official BEA list of service sectors. Yuskavage, Strassner, and Medeiros (2006) identify 36 of BEA annual industry I-O accounts sectors as service sectors. The NAPA analysis omits Utilities, Wholesale Trade, Retail Trade, and Transportation and Warehousing from their service sector classification. 39 Feenstra, Robert C. and Gordon H. Hanson (1996). “Globalization, Outsourcing and Wage Inequality.” American Economic Review. 40 Comparable imports generally are imports of goods and services for which domestic analogs exist. Non-comparable imports generally consist of services for which there is no domestic counterpart. Unfortunately, it also includes virtually all services imports of multinational companies regardless of the potential existence of domestic analogs.

59
producing goods and services and by households, businesses, and governments for international trade and final demand. Columns in the I-O use table contain data for each sector. Elements of the columns include types and amounts of purchased goods and services used in production, value added, gross operating surplus and indirect business taxes less subsidies. Summing the columns produces the value of total output for each sector. Rows of the table show how much of each good or service is provided to each of the sectors and how much to the principal components of final demand. The row sums are total commodity or service output. Table 3-1 illustrates the structure of the I-O use tables with highly aggregated data for 1998 and 2004. All industries have been combined into three sectors—total manufacturing, total services, and other than manufacturing and services (e.g., agriculture, natural resources, wholesale and retail sales and government). Total intermediate uses are the sum of purchased inputs by each of the sectors (summing along the rows of the table). Final domestic demand (FDD) is the familiar C+I+G from the national income accounts. Summing FDD with exports and imports (shown separately) and the change in private inventories yields an estimate of GDP by commodity or service. Table 3-1 provides information on the interaction of the sectors. For example, it shows that in 2004, the services sector purchased $794 billion of manufacturing output and $3.3 trillion of services output for use as inputs to produce some $12.2 trillion in service sector output. The manufacturing sector used $1.4 trillion of manufacturing intermediate product and $570 billion of service sector-provided services in producing some $4.3 trillion in manufacturing sector output. The table also provides information on how much of each commodity or service is used for intermediate purposes relative to other uses, such as final demand or export. In 2004, almost 64 percent of manufacturing output was used for intermediate purposes. For services, only about 38 percent was allocated to intermediate uses. Outsourcing and Off-Shoring Calculations Data in Table 3-1 provide information needed to estimate industry sector outsourcing and off-shoring intensities. Table 3-2 shows aggregated estimates of total services outsourcing and off-shoring intensities for all sectors of the economy. These estimates reflect the extent to which all industries taken together have outsourced or off-shored their services inputs.

60
Table 3-1 The Use of Commodities by Industries, Annual I-O Accounts, 1998 and 2004
Billions of Dollars
Commodities/Services Total Manufacturing Total Services
Other than Manufacturing and Services
Total Intermediate
Uses
Exports of goods and services
Imports of goods and services
Change in Inventories C+I+G Total Final
Uses (GDP)
Total Commodity
Output1998
Total Manufacturing* 1,370 586 398 2,353 530 -826 32 1,689 1,425 3,778Total Services** 473 2,163 597 3,233 130 -22 1 5,111 5,219 8,452Other than Manufacturing and Services*** 648 422 423 1,494 227 -70 38 1,986 2,181 3,675Noncomparable Imports**** 19 37 22 78 -129 51 -78 0
Total intermediate inputs 2,510 3,209 1,440 7,158Compensation of employees 795 3,047 1,182 5,024Indirect Taxes and Surplus 497 2,258 941 3,723 0 0 0 0 0 0
Total Value Added 1,292 5,305 2,123 8,747 'Total Industry Output 3,802 8,514 3,563 887 -1,047 71 8,836 15,905
2004Total Manufacturing* 1,411 794 537 2,743 566 -1,240 80 2,147 1,553 4,296Total Services** 570 3,253 806 4,629 192 -49 2 7,293 7,438 12,067Other than Manufacturing and Services*** 887 596 623 2,106 294 -194 -26 2,803 2,877 4,983Noncomparable Imports**** 32 65 37 134 -194 60 -134 0
Total intermediate inputs 2,900 4,709 2,003 9,612Compensation of employees 879 4,261 1,554 6,693Indirect Taxes and Surpus 523 3,193 1,378 5,041
Total Value Added 1,402 7,454 2,932 11,734 'Total Industry Output 4,302 12,163 4,935 1,052 -1,676 55 12,303 21,346
Industries/Sectors
Note: Detail may not add to total due to rounding. * Total Manufacturing includes industry codes 311FT-339 ** Total Services includes industry codes 511-GSLG *** Other than Manufacturing and Services includes industry codes 111CA-23, 42-493, and S002-S004 Source: Bureau of Economic Analysis and Academy staff calculations.

61
Table 3-2 Outsourcing and Off-Shoring Intensities
Billions of Dollars, Annual Rates of Growth in Percent
Industry Output, Purchased Inputs Domestic Supply and Purchased Services 1998 2004 Annual %
Change Total Industry Output 15,878 21,400 5.8 Total Purchased Inputs 7,158 9,612 0.0 Domestic Supply - Total Services 8,344 11,922 7.1 Total Purchased Services 3,233 4,629 7.2Services Imports
Services Comparable Imports -22 -49 20.0 Services Comparable Imports as a Share of Services Do 0.0027 0.0041 9.0 Intermediate Comparable Services Imports 9 19 20.1 Non Comparable Imports 78 134 11.9
Total Intermediate Imports 87 153 12.7
Services Outsourcing and Off-shoring IntensitiesServices Outsourcing Intensity: Services Used by All Sectors as a Share of Total Industry Output 0.2036 0.2163 1.0
Services Off-shoring Intensity: Estimated Services Imports**** as a Share of Total Purchased Inputs 0.0121 0.0159 5.2
* Comparable services imports are estimated as (1) total imports of services as a percent of domestic supply of services, times (2) total intermediate uses of purchased services by all sectors.
Total imports of services are estimated comparable imports of services plus total intermediate uses of non-comparable imports.
Source: Bureau of Economic Analysis and Academy staff calculations on Table 3-1.
Data in Table 3-2 derive from Table 3-1, and have been rearranged for ease of presentation. For example, total industry output, $15,878 billion in 1998, is the sum of the separate industry output column totals for manufacturing ($3,802 billion), services ($8,514 billion) and other than manufacturing and services ($3,563 billion). Purchased inputs is both the sum of Total intermediate inputs and total intermediate uses ($7,158 billion in 1998). Outsourcing refers to the share of purchased intermediate goods and services relative to total industry output. Increases in this ratio reflect a reduced reliance on internal labor and capital to produce sector output. Reductions in this share indicate increased use of internal labor and capital within the sector’ production processes. Services outsourcing is the services component of this measure and reflects the extent to which firms within industries are relying on purchases of intermediate services as opposed to producing them with their own resources. From Table 3-2, intermediate purchases of services by all sectors rose from 20.4 percent of total industry output in 1998 to 21.6 percent by 2004,41 an annual rate of growth of 1.0 percent.
41 From Table 3-2, economy wide services outsourcing in 2004 equals total purchased services ($4,629 billion) divided by total industry output ($21,400).

62
Services off-shoring due to internal business restructuring is measured using imported intermediate services as a percent of total purchased inputs. To estimate imported purchases of intermediate goods and services, we assume that the ratio of total comparable imports to domestic supply42 for each commodity or service is constant for all industries and commodities and services. This critical assumption is needed because we lack direct measures of services (or goods) imports by industry for intermediate use that are separate from final demand. It implies that if imports of services in 1998 ($22 billion) was 0.3 percent of domestic supply, then every firm in every industry that purchased $1 million in services in 1998 imported $3,000 of those purchased services. During the 1998 to 2004 period comparable imports of services more than doubled, from $22 billion to $49 billion (see Table 3-1). Non-comparable imports—a substantial portion of which included services imports of multinational companies from their affiliates—grew from $78 billion to $134 billion. Our measure of services off-shoring intensity is substantially the same as that of Feenstra and Hanson—purchases of imported services as a percent of total non-energy intermediate purchases. Purchases of imported services (intermediate services imports) must include both comparable and non-comparable services imports, because non-comparable imports are substantially larger than comparable services imports. For this analysis, the services off-shoring indicator consists of the sum of comparable and non-comparable imports of services as a percentage of total intermediate input for all industries output. Comparable intermediate services imports are calculated as the product of the comparable services import share and total purchases of intermediate services. The comparable services import share is the ratio of comparable imported services to domestic supply of services. In Table 3-2, domestic supply is total commodity output less exports plus imports less change in inventories. Comparable intermediate services increased from $9 billion in 1998 to $19 billion in 2004, an annual rate of growth of 20 percent. Total intermediate services imports equals these estimated comparable intermediate imports plus total non-comparable imports.43 It grew from $87 billion in 1998 to $153 billion in 2004, and annual rate of growth of 12.7 percent. The outsourcing intensity indicator in Table 3-2, purchased intermediates as a percent of total industry output grew from 20.4 percent in 1998 to 21.6 percent in 2004, an annual rate of growth of 1 percent. Off-shoring, while much smaller in magnitude, grew at a faster rate. The off-shoring intensity indicator, imported purchased intermediates as a percent of total purchased
42 Domestic Supply is the total amount of a good or service available domestically, either in production as an intermediate input, or in final use. Domestic supply is Total Commodity Output (Use Table row total), less exports (not available domestically) plus imports (available domestically) less the change in private inventories, (increased domestic availability when stocks are drawn down). See Smith, George M. and Sherlene K.S. Lum. (December, 2005). “Annual Industry Accounts; Revised Estimates for 2002-2004”. Survey of Current Business, pp. 25-26. 43 Yuskavage, Robert E., Eric H. Strassner, and Gabriel W. Medeiros. (2006) “Outsourcing and Imported Services in BEA’s Industry Accounts,” indicated that all non-comparable imports are services.

63
intermediates, increased from 1.2 percent in 1998 to 1.6 percent in 2004, an annual rate of growth of 5.2 percent. INDUSTRY LEVEL FINDINGS This methodology in Table 3-2 was used to calculate the more detailed estimates of services outsourcing and off-shoring intensities from each industry sector presented in Table 3-3. As in Table 3-2, detailed estimates involve calculating (1) domestic supply, (2) comparable import share, (3) percentage of intermediate services purchased (outsourcing), and (4) percentage of intermediate services imported (off-shoring). Table 3-3 shows estimates of services outsourcing and off-shoring for 1998 and 2004 for each sector and the average annual growth in those measures over the period. Sectors are sorted largest to smallest by the growth rates for services off-shoring. They are ranked by the magnitude of their services off-shoring and also their outsourcing growth rates. These data indicate that services outsourcing is substantially greater than services off-shoring for nearly every industry sector. For some sectors that have been the focus of the current concerns about off-shoring of high tech services, the difference between these two measures is quite large. For example, estimated services off-shoring in the miscellaneous professional, scientific and technical services sector in 2004 was 1.34 percent—virtually unchanged from its 1998 rate. However, services outsourcing for this high technology services sector in 2004 was 34.5 percent and had increased at almost 5 percent per year from 1998. Second, these data indicate that there is little correlation between the growth in services off-shoring and services outsourcing at these aggregate industry levels. Only two of the industry sectors among the ten with the greatest growth in services off-shoring intensity during this period were also among the top ten in growth for services outsourcing. The correlation (Pearson’s r) between these two growth rates was 0.09. The correlation (Pearson’s r) between off-shoring and outsourcing rankings for each industry was a similarly small 0.11. A third observation is that most of the industry sectors with the highest growth in services off-shoring intensity during this period are manufacturing industries—not services industries. Most of the services industries, including the three reviewed intensively using micro-level data in this report, were in the lowest quartile of industries with off-shoring services growth.

64
Table 3-3 Industry Services Outsourcing and Off-Shoring Intensities and Rates of Growth
By Annual Rate of Growth of Services Off-Shoring, 1998 to 2004
Outsourcing Off-Shoring
Off-Shoring
(Percent)
Annual Growth
Rate
Outsourcing (Percent)
Annual Growth
Rate
Rank Rank Industry Group* 1998 2004 Percent 1998 2004 Percent 59 1 Mining, except oil and gas 1.09 3.39 35.34 8.24 6.57 -3.37 13 2 Apparel and leather and allied products 0.18 0.45 25.73 9.47 10.99 2.68 19 3 Other transportation equipment 0.19 0.43 21.01 8.22 9.40 2.39 22 4 Rental and leasing services and lessors of intangible assets 2.83 6.06 19.04 29.29 33.21 2.23 9 5 Insurance carriers and related activities 2.67 5.30 16.35 41.32 48.61 2.94
40 6 Electrical equipment, appliances, and components 0.94 1.81 15.21 7.54 7.39 -0.32 20 7 Printing and related support activities 0.24 0.45 13.83 8.93 10.20 2.38 7 8 Machinery 0.70 1.25 12.87 8.57 10.74 4.22
46 9 Real estate 0.30 0.50 11.55 18.36 17.16 -1.09 23 10 Food and beverage and tobacco products 0.26 0.45 11.40 9.93 11.21 2.14 31 11 Chemical products 2.62 4.06 9.13 11.21 12.07 1.28 58 12 Motion picture and sound recording industries 0.90 1.39 8.97 50.71 42.24 -2.78 57 13 Primary metals 0.21 0.32 8.82 5.97 5.09 -2.44 17 14 Paper products 0.14 0.22 8.69 6.98 8.01 2.47 27 15 Fabricated metal products 0.49 0.75 8.64 8.87 9.75 1.65 60 16 Farms 0.07 0.11 8.58 12.24 9.15 -4.21 54 17 Funds, trusts, and other financial vehicles 1.52 2.28 8.36 74.05 65.86 -1.84 14 18 Accommodation 0.62 0.93 8.17 19.66 22.81 2.67 3 19 Computer and electronic products 2.05 3.04 8.04 15.09 20.35 5.81 6 20 Textile mills and textile product mills 0.17 0.25 7.91 6.15 7.76 4.35
28 21 Wholesale trade 3.55 5.19 7.71 14.32 15.60 1.50 47 22 Educational services 0.33 0.47 6.78 30.31 28.30 -1.11 21 23 Motor vehicles, bodies and trailers, and parts 0.79 1.08 6.16 8.85 10.04 2.25 11 24 Plastics and rubber products 0.46 0.62 5.85 7.80 9.09 2.77 51 25 Transit and ground passenger transportation 0.14 0.19 5.71 16.44 15.18 -1.28 49 26 Securities, commodity contracts, and investments 6.19 8.20 5.39 34.86 32.24 -1.25 39 27 Amusements, gambling, and recreation industries 0.31 0.41 5.17 24.75 24.31 -0.30 8 28 State and local government enterprises 0.14 0.18 5.04 18.52 22.53 3.60
12 29 Food services and drinking places 0.11 0.15 5.02 16.37 19.09 2.76 61 30 Federal Reserve banks, credit intermediation, and related
activities 1.29 1.68 4.98 31.54 23.32 -4.35
38 31 Miscellaneous manufacturing 0.50 0.64 4.86 10.29 10.38 0.14 43 32 Truck transportation 0.85 1.09 4.66 15.90 15.00 -0.94

65
Outsourcing Off-Shoring
Off-Shoring
(Percent)
Annual Growth
Rate
Outsourcing (Percent)
Annual Growth
Rate
Rank Rank Industry Group* 1998 2004 Percent 1998 2004 Percent 2 33 Federal general government 6.00 7.66 4.60 18.00 25.48 6.92
32 34 Other services, except government 0.18 0.22 4.04 18.98 20.22 1.09 33 35 Publishing industries (includes software) 1.27 1.57 3.96 31.20 33.20 1.07 10 36 Furniture and related products 0.13 0.16 3.81 9.16 10.70 2.80 55 37 Waste management and remediation services 0.23 0.28 3.81 36.33 32.29 -1.85 56 38 Rail transportation 0.92 1.12 3.59 18.31 15.85 -2.24 45 39 Nonmetallic mineral products 0.63 0.76 3.40 8.27 7.76 -1.04 26 40 Retail trade 0.32 0.38 3.20 17.17 19.16 1.93 41 41 Wood products 0.09 0.10 3.02 5.62 5.43 -0.55 52 42 Forestry, fishing, and related activities 0.11 0.12 2.79 5.21 4.77 -1.39 37 43 Warehousing and storage 0.66 0.75 2.33 20.03 20.69 0.56 35 44 Hospitals and nursing and residential care facilities 0.13 0.14 2.22 25.01 26.42 0.94 25 45 Water transportation 16.45 18.61 2.19 25.03 27.98 1.96 53 46 Management of companies and enterprises 0.39 0.44 2.17 32.47 29.50 -1.53 34 47 Ambulatory health care services 0.14 0.16 1.86 19.61 20.75 0.97 36 48 Social assistance 0.16 0.17 1.61 20.78 21.53 0.60 30 49 State and local general government 0.14 0.15 1.30 17.01 18.31 1.28 44 50 Construction 0.21 0.22 1.02 13.07 12.33 -0.95 48 51 Air transportation 17.31 18.21 0.87 23.37 21.76 -1.15 42 52 Performing arts, spectator sports, museums, and related
activities 0.39 0.40 0.65 35.96 34.38 -0.73
16 53 Legal services 0.23 0.24 0.62 21.76 25.04 2.51 50 54 Computer systems design and related services 2.87 2.92 0.28 21.75 20.10 -1.27 62 55 Pipeline transportation 0.36 0.36 0.12 39.26 28.21 -4.69 29 56 Federal government enterprises 7.74 7.78 0.07 7.17 7.81 1.48 4 57 Miscellaneous professional, scientific and technical
services 1.34 1.34 0.04 26.47 34.28 4.92
63 58 Other transportation and support activities 1.35 1.30 -0.70 18.75 12.51 -5.55 18 59 Administrative and support services 0.66 0.57 -2.27 19.12 21.91 2.43 24 60 Support activities for mining 2.00 1.38 -5.19 13.81 15.55 2.10 64 61 Oil and gas extraction 1.40 0.94 -5.48 23.10 14.63 -6.11 5 62 Information and data processing services 2.45 1.57 -5.97 28.91 37.28 4.83 1 63 Petroleum and coal products 0.31 0.17 -7.40 11.07 16.26 7.80
15 64 Broadcasting and telecommunications 4.65 2.50 -7.69 37.90 43.82 2.60 65 65 Utilities 0.14 0.06 -9.52 7.83 3.00 -10.29
Source: BEA Industry Annual Input-Output Use Tables and Academy Calculations

66
Finally, growth in services off-shoring over the period varied across the industry sectors. Eight sectors experienced a decline in estimated services off-shoring intensity, including the broadcasting and telecommunications services, information and data processing services, and the administrative and support services sectors. Several of these services sectors with declining rates of services off-shoring over this period represent high technology services that are the focus of much of the current concerns about services off-shoring. While ten sectors experienced growth rates for services off-shoring that exceeded ten percent per year, most of these services off-shoring levels remained relatively small. In conclusion,
The Panel finds that services outsourcing to domestic firms has been substantially larger than services off-shoring for the industry groups examined during the 1998 to 2004 period. The Panel finds that services off-shoring levels have remained small for comparable industry groups and most other industry sectors during the 1998 to 2004 period. The Panel also finds little evidence of consistent growth in services off-shoring among the industry sectors, with substantial variation among individual sectors during this period.
ASSESSMENT OF THE DATA Using the methodology of this chapter to calculate off-shoring rates revealed two major problems with the data. Differences Between Comparable and Non-Comparable Services Imports Non-comparable imports are considerably greater in aggregate than imputed comparable imports of services by industry and vary widely from industry to industry. In 2004 the overall ratio of non-comparable imports to imputed comparable imports of services was 4.8. Individual industries varied with a range of 0 to 159 and a median value of 11.5. While non-comparable imports nominally are those for which there are no domestic equivalents, they also include all MNC affiliated services imports whether or not domestic analogs exist. Failure to include these affiliated services imports in the estimates of intermediate imports would substantially understate any estimates of the extent of services off-shoring. A problem is that non-comparable imports are sector specific but not commodity or service specific. Currently, BEA uses different surveys to collect data on affiliated non-comparable and comparable services imports and the unaffiliated survey collects more detail on the types of services imported. Consequently, there is no way of identifying the types of affiliated services are being imported at the same level of detail as comparable, unaffiliated services imports. It is not known whether these affiliated services are engineering, accounting, legal, sales,

67
administrative support or other technical services. It would be very useful to be able to break out non-comparable imports into categories similar to those for comparable imports.
However, combining these two types of services imports into the non-comparable imports groupings in the I-O use tables would lose valuable information on the current industry allocation of these comparable services imports (presumably for intermediate use). BEA staff have developed an algorithm to allocate these non-comparable imports to specific industries for intermediate use by those industries. This information is exactly what is needed to develop effective indicators of services off-shoring due to internal business restructuring. Retaining that information for affiliated services imports, even if they are reported at the same level of detail as unaffiliated services imports, would provide a way to test the validity of the key assumption made to allocate unaffiliated services imports between intermediate uses and final demand. Intermediate Goods and Services Import Data Direct measures of comparable imports for purchases of intermediate goods and services are not available. This data gap necessitates the assumption that all industries import intermediate services at the same rate, equal to the comparable import share of domestic supply. This methodology was used by BEA in determining its Import Matrix for the 1997 benchmark tables and has been widely used by analysts. However, the assumption has no theoretical or behavioral basis, and in all probability it is inaccurate, since different sectors likely use imports in different proportions to their overall purchases of services. More importantly, within any industry sector individual firms likely use different production processes and mixes of inputs.44 Unfortunately, we have no way of knowing how inaccurate this assumption may be. RECOMMENDATIONS The Panel believes that BEA should make every effort to identify and show imported services currently categorized as non-comparable, when domestic analogs exist. In particular, there should be as much detail on comparable imports by multinational companies from their affiliates as there is from non-multinationals. BEA has indicated it plans to use a common survey in the future to collect similar details on the types of services imports for both affiliated and unaffiliated imports. Consequently, the Panel recommends that:
BEA should implement its proposal to collect consistent levels of detail for affiliated and unaffiliated services imports and periodically review this to assure its comprehensiveness and compatibility with details on services contained in other economic data.
44 The recent report of the National Research Council of the National Academies, analyzing the U.S. Content of Imports and the Foreign Content of Exports, 2006 raised similar concerns about the validity of this critical “import similarity” assumption.

68
BEA staff should work to remove affiliated imports from the ‘non-comparable” imports component within BEA I-O tables and link them more closely with the same type of unaffiliated services.
Further, BEA should determine the extent to which industry sectors import services uniformly, and whether they do so in proportion to the ratio of total imports of comparable services to domestic supply. If there are serious discrepancies in this assumption, BEA should make every effort to provide separate information on comparable imports of intermediate products and services by industry. To begin this effort, the Panel recommends that
BEA should consider limited sampling of MNC service importers to test their ability to distinguish the use of particular types of services imports for their own use rather than for sale to others.

69
CHAPTER 4
USING OCCUPATION DATA TO IDENTIFY SERVICES OFF-SHORING INTRODUCTION Chapter 3 presented sector estimates of the extent of services outsourcing and off-shoring using BEA inter-industry data. That chapter noted the usefulness of estimates of imported purchased intermediate services relative to total purchased inputs for identifying off-shoring of services. It also discussed obstacles to estimating imported intermediate services, including (1) the problem of distinguishing intermediate imports from imports for final demand and (2) the different treatment of non-comparable services imports (which also include all affiliated services imports of multinational companies) relative to comparable services imports in the I-O use tables. However, even if these problems were corrected and detailed estimates of imported purchases of intermediate services by type of service existed, the inter-industry data would still fail to identify the extent of off-shoring from business restructuring.45 The problem is that the BEA I-O industry data are based on transactions between establishments. If services are purchased or sold they are measured, but if they are produced within an establishment but not sold separately, they are not counted. Consequently, BEA I-O data cannot track services that are produced internally by establishments but not purchased or sold separately. The I-O accounts include such internally produced services as part of the value added of labor within each industry sector. However, when analysts measure vulnerability of occupations to off-shoring or their tradability46 of occupations they usually include jobs and occupations internal to establishments. There are many examples of services produced within establishments that potentially could be purchased or sold, including accounting and payroll, maintenance, advertising, legal, communications, and training. Business restructuring that affects the supply chain may influence these internally supplied services as well as those that are purchased. For example, purchased help desk services may augment or substitute for services currently supplied within establishments. Outsourcing or off-shoring of services may show up in the unemployment insurance and BLS MLS data, but they can also occur without layoffs, plant closures or announcements if they are phased-in over time and accomplished through attrition and reassignment. Even so, they should produce changes in the occupational structure in the establishments of firms outsourcing or off-shoring particular services. BLS OES data may help identify occupational employment shifts within establishments and industries.
45 Off-shoring due to restructuring refers to changes in the value chain of production and the substitution of imported intermediate goods and services for those produced within the firm or establishment. This is separate from the problem of measuring off-shoring from global expansion, where foreign direct investment substitutes for export-targeted domestic growth of establishments and firms. This distinction is discussed in Chapter 2 and estimated using micro-level data in Chapter 6. 46 See Bardan and Kroll (2004), Jensen and Kletzer (2006), or Van Welsum (2005) for example.

70
It is not possible to identify changes in the composition of employment within establishments or industries using BEA I-O industry data. I-O analyses that incorporate labor requirements typically assume a fixed occupational structure and focus on the total number jobs associated with shifts in final demand. Because services outsourcing and off-shoring are expected to change demand for specific workers in various industries, it is necessary to use data that are occupation-based, rather than product or services-based. This chapter and the next present analyses of OES data to determine whether changes in the employment of services producing occupations can be observed in individual industries and whether inferences can be drawn with respect to outsourcing or off-shoring. This chapter explores the extent to which analysis of OES data alone can identify the extent of services off-shoring and its economic effects. The analysis identifies particular service producing occupations core to production of specific services sectors that may be ancillary to the production of goods and services in establishments in other industries. It focuses on changes in employment share for these “core,” service-producing occupations in (1) services sectors and (2) all other industries. Declining employment shares for these core occupations in other industries is consistent with potential outsourcing of those services. Increased employment or increased shares of the same occupations within service sectors may suggest domestic outsourcing, while the lack of a corresponding increase in those industries could be the result of a number of factors, including services off-shoring. Chapter 5 takes a more direct approach for examining employment and occupations effects of services off-shoring. It uses BEA annual I-O industry data to directly measure off-shoring of services in specific industry sectors, as presented in Chapter 3. It then links these data to the OES data to examine differences in employment changes by occupation for sectors experiencing high and low rates of services off-shoring growth. It looks at two components of employment changes: (1) changing occupational structure within sectors, and (2) sectoral growth or decline. USING OES DATA TO EXAMINE POTENTIAL SERVICES OUTSOURCING AND OFF-SHORING This chapter describes the development and application of occupation-based measurements from BLS OES data in examining potential services outsourcing and off-shoring activities. Analysis focuses on the four industries, at a 4-digit NAICS level, selected for intensive examination using industry-level data:
• pharmaceutical and medicine manufacturing [3254],
• architectural, engineering and related services [5413],
• computer systems design and related services [5415], and
• business support services [5614].

71
Methodology Off-shoring due to business process restructuring is similar to outsourcing, and reflects competitive pressures that encourage firms to focus on their highest return activities. This suggests that successful competitive firms identify what they do best, concentrate on that, and eliminate, or seek other ways to obtain functions not critical to their core, profit-center activities. As firms restructure their internal processes to concentrate on core activities, other functions that still need to be performed may be transformed through re-engineering, consolidation or outsourcing. If these changes were substantial or protracted over a number of years, OES data should reflect changes in the employment share of occupations within a sector, with some occupations gaining share and some losing. Those occupations that are not core to an industry’s function and vulnerable to outsourcing and off-shoring would be expected to experience declining employment shares. Our methodology in this chapter is straightforward. The objective is to determine whether the changing shares of occupations within 4-digit NAICS industries can identify core service producing occupations that may be declining as a percent of total employment in other industries, and the extent to which those estimated employment changes reflect potential services outsourcing or off-shoring. Specifically, this analysis will:
1. Identify one or more primary or core occupations unique to the production activity for each of the four industries. A core occupation is one that consists of a substantial proportion of the labor force in that industry and which can be seen to define the industry. For example, major occupation class 17-0000, architecture and engineering occupations, accounted for over 51 percent of total employment in the architectural, engineering and related services [5413] industry, in the May, 2005 survey. Occupations that are not essential (do not define what an industry does) are considered ancillary.
The definitions are not static. Ancillary activities may become more profitable than core activities, resulting in a transformation of the firm, e.g., a computer or software manufacturer transforming itself into an IT and business services entity. Such a transformation involves substantial changes in the mix of occupations employed.
2. Measure the degree to which industries other than the four industries examined are
reducing these occupations as a percentage of their work forces. This declining share may be due to outsourcing (e.g., help desks), to increasing productivity of the particular ancillary activity relative to the rest of the labor force (e.g., computer-assisted drafting services), or to changes in demand.
3. Estimate the extent to which the four industries examined are increasing their
employment of core occupation workers when it is being reduced in other industries. If an industry produces primarily for final demand, it is unlikely that other industries will employ substantial numbers of its core workers, or that their attempts to outsource will have any impact

72
on its activity. This analysis principally applies to industries producing intermediate services, (although for balance we do look at one manufacturing industry-- pharmaceutical and medicine manufacturing [3254]) that produces largely for final demand. Data Strengths and Limitations The BLS OES program provides information on employment and compensation by occupation and industry. At the national level, OES provides information on 801 detailed 6-digit SOC occupations for each of 295 NAICS 4-digit industries.47 It also provides higher levels of occupational aggregation, including 22 major 2-digit classifications. Beginning with the November, 2002 survey, OES tracked occupations by NAICS-classified industries, and semi-annual surveys are available through May 2005, as of this report. Each OES national survey contains estimates of the total employed in each occupation in each industry and average hourly wage rates and annual salaries and their dispersion (percentile estimates). In addition, for each industry the survey summarizes occupations into 22 major groupings and total employment. The data are useful for examining internal restructuring within establishments, because the detailed occupational data correspond to activities that take place in the production of goods and services. For example, if an establishment produces and sells only architectural services, it nevertheless may use accountants, clerks, maintenance personnel, marketing staff, and human resource specialists. Assuming different activities require different occupational mixes, the occupational changes measured in OES can reflect changes in these activities. It may be possible to infer increases or reductions for types of work within individual industries, based on changes in their occupational mixes. However, there are a number of data limitations affecting this analysis. First, availability of BLS occupation by industry data on a NAICS basis only goes back to November, 2002 at the national 4-digit level. Since then, semi-annual surveys have been published in May and November. As a result, we have used only six surveys covering the period 2002 to 2005. Where NAICS and SIC classifications are closely linked, it may be possible to bridge to earlier surveys that were based on SIC codes, but this was beyond the scope of this study. Second, BLS OES employment statistics measure domestic employment only, so we cannot directly measure jobs that move off-shore. We can only see domestic gains and losses and changes in occupational shares domestically. This limits our ability to draw conclusions about whether services off-shoring is taking place:
• If core service producing occupations are declining in non-service producing industries but increasing in service producing industries by equal amounts, it would appear that little or no off-shoring of these service activities is taking place;
47 For a summary of the OES survey, see “Off-Shoring: An Elusive Phenomenon”, a Report of the Panel of the National Academy of Public Administration, January, 2006, Appendix D. Also, see Bureau of Labor Statistics web site, http://www.bls.gov/bls/occupation.htm
73
• If core occupation employment in the selected services industries exceeds reductions
elsewhere, it would appear that demand for, including net exports of, those services is increasing; and
• If core employment increases in the selected services industries is less than reductions
elsewhere, off-shoring may be taking place. Alternately, there may be significant technological or institutional shifts or changes in economic conditions that may account for these differences in employment growth.
Third, even when there are clear shifts in the mix of occupations within industries, the OES data alone cannot identify the reasons for such changes—i.e., whether due to cyclical factors, seasonal factors, competitive factors (such as possible gains from outsourcing), or other structural factors (such as technological change that increases the demand for some occupations relative to others). Finally, the OES data were never intended to be used as time series by BLS.48 Since the analysis in this chapter and Chapter 5 cover the relatively short period during which NAICS industry classification were in use by BLS, most of the caveats will not significantly affect the results. The Panel’s concern regarding a need for time series occupational employment by industry data is discussed in Chapter 7. ANALYTICAL RESULTS Publicly available OES data on occupation by industry have been combined in a Microsoft ACCESS data base (see Appendix D). We analyzed these data at the highly aggregated occupation 2-digit SOC level, and at the more detailed 6-digit SOC level. Identifying Core Occupations Using Highly Aggregated Data To identify core occupations within each industry examined at the 2-digit SOC level, we sought occupations accounting for a substantial portion of the work force and that recognizably define the industry. Our criterion was that gains or reductions in the relative employment share of these occupations likely reflect changes in the fundamental nature of the industry. In particular, a decreasing employment share for a core services occupation in other industries suggests that those industries are focusing on their earning activities and de-emphasizing or outsourcing others. Table 4-1 shows the concentration of employment in major occupational groups for each of the four industries examined over the November, 2002 to May, 2005 period. The percentages represent pooled totals for each industry over the entire period. Core occupational groups for each sector are shaded. Core occupations account for the largest share of employment in each sector. Two of the industry groups shown in Table 4-1 have more than one major core
48 See http://www.bls.gov/oes/oes_ques.htm#Ques27

74
occupation, even at this high level of aggregation. For those industries, multiple core occupations are combined.
Table 4-1 Core Occupations in Examined Industries November, 2002 and May, 2005 Surveys
Occupation
Code Occupation Title Share of Industry Employment
Cumulative Share
325400 Pharmaceutical and Medicine Manufacturing 51-0000 Production Occupations 27.8 % 27.8 % 19-0000 Life, Physical, and Social Science Occupations 18.4 46.3 43-0000 Office and Administrative Support Occupations 12.0 58.2 11-0000 Management Occupations 11.0 69.2 13-0000 Business and Financial Operations Occupations 6.9 76.1
541300 Architectural, Engineering and Related Services 17-0000 Architecture and Engineering Occupations 49.8 49.8 43-0000 Office and Administrative Support Occupations 13.6 63.4 11-0000 Management Occupations 9.4 72.8 19-0000 Life, Physical, and Social Science Occupations 5.4 78.2 15-0000 Computer and mathematical occupations 4.0 82.2
541500 Computer Systems Design and Related Services 15-0000 Computer and mathematical occupations 44.7 44.7 43-0000 Office and Administrative Support Occupations 13.8 58.6 11-0000 Management Occupations 10.7 69.2 15-0000 Computer and Mathematical Science Occupations 8.8 78.0 13-0000 Business and Financial Operations Occupations 6.8 84.8 561400 Business Support Services 43-0000 Office and Administrative Support Occupations 53.8 53.8 41-0000 Sales and Related Occupations 26.6 80.4 11-0000 Management Occupations 4.5 85.0 15-0000 Computer and mathematical occupations 2.9 87.9 13-0000 Business and Financial Operations Occupations 2.8 90.6
Source: BLS OES dad and Academy calculations Pharmaceutical and medicine manufacturing [3254] is oriented to final demand. Because of this, we do not expect significant interaction between primary occupations, production [51-0000] and life, physical and social science [SOC 19-0000] in that and other industries. The remaining industries are more focused on supplying services to other businesses and we would expect stronger interrelationships. Architectural, engineering, and related services [5413] has a single core occupational group, architecture and engineering occupations [SOC 17-0000], that accounted for nearly half its work force over the 2002 to 2005 period. Similarly computer systems design and related services [5415] also has a single core occupation group, computer and mathematical science occupations [SOC 15-0000], that accounted for nearly 45 percent of its work force.

75
Finally, business support services [5614] has two major occupation groupings in its core occupation set—office and administrative support occupations [SOC 43-000] and sales and related occupations [SOC 41-0000]. The first grouping is found in the other industries examined as well, often heavily represented in the work force; but in those cases, it more likely ancillary rather than core.
Services Core Employment in Other Industries To compare historical patterns of employment for these core occupations in all other industries49, we examined the change in share of total employment in those industries. For example, we looked at employment in architecture and engineering occupations [SOC 17-0000], in industries other than the architectural, engineering, and related service [5413] and measured it as a percentage of total employment in those other industries. Looking at employment shares rather than the raw numbers allows us to avoid reaching conclusions based on factors that affect the demand for workers in all occupations. The shares differed widely for different core occupations making comparisons difficult. To make comparisons more feasible we standardized shares, expressing each as an index number relative to its value in the November 2002 survey. A decline in the index, indicating slower growth in these relative to other occupations, suggests that outsourcing may have occurred over the period 2002 to 2005.
Analysis of Changes in Occupational Shares
Results at the 2-digit SOC are presented in Table 4-2. There appears to be little evidence of outsourcing for the core occupations in business support services [5614] and for computer systems design and related services [5415]. The index for the first hovered around the 1.000 base, and the index for the latter increased by 4 percent—perhaps reflecting a strong demand for IT services. The 6 percent decline in pharmaceuticals and medicine manufacturing [3254] core occupations in other industries may be something of an anomaly. A major component of the primary labor force in pharmaceutical and medicine manufacturing [3254] is production occupations [SOC 51-0000], and the data may well be identifying potential outsourcing or off-shoring of manufacturing jobs unrelated to the pharmaceutical and medicine manufacturing [3254] industry. This leaves the architectural, engineering, and related services [5413] industry, where there does appear to have been a decline in the share of architectural and engineering occupations in other industries. In fact Table 4-2 indicates that actual employment levels declined as well, by 73,520 positions during the November 2002 to May 2005 survey period, even while overall employment in the non-architecture and engineering service industries increased by 2.7 million. Chart 1 looks at architecture and engineering occupations [SOC 17-0000], in all sectors except architectural and engineering services [5413]. Over the period covered by NAICS data at a 4-digit level, employment of architects and engineers as a percent of total non-17-0000 employment was declining. 49 To calculate totals for all other industries, totals were constructed for all industries in the database with the four examined industries omitted.

76
Table 4-2
Examined Industry Core Employment in Other Industries
Year Month Core Employment Total Employment Share of Total Index
Pharmaceutical and Medicine Manufacturing Core Employment In Other than Pharmaceutical and Medicine Manufacturing Industries
2002 Dec 11,593,240 126,770,480 9.145 1.000 2003 May 11,299,030 126,149,250 8.957 0.979 2003 Nov 11,082,580 126,434,320 8.765 0.958 2004 May 11,044,720 127,418,350 8.668 0.948 2004 Nov 11,136,530 128,391,460 8.674 0.948 2005 May 11,264,130 129,470,750 8.700 0.951
Architectural, Engineering and Related Services Core Employment In Other than Architectural, Engineering and Related Services Industries
2002 Dec 1,769,870 126,770,480 1.396 1.000 2003 May 1,745,180 126,149,250 1.383 0.991 2003 Nov 1,707,110 126,434,320 1.350 0.967 2004 May 1,724,570 127,418,350 1.353 0.969 2004 Nov 1,721,810 128,391,460 1.341 0.961 2005 May 1,696,350 129,470,750 1.310 0.938
Computer Systems Design and Related Services Core Employment In Other than Computer Systems Design and Related Services Industries
2002 Dec 2,171,440 125,950,200 1.72 1.00 2003 May 2,219,540 125,325,830 1.77 1.03 2003 Nov 2,221,890 125,619,840 1.77 1.03 2004 May 2,301,110 126,576,370 1.82 1.05 2004 Nov 2,315,480 127,529,740 1.82 1.05 2005 May 2,297,230 128,576,650 1.79 1.04
Business Support Services Core Employment In Other than Business Support Services Industries
2002 Dec 35,488,380 126,313,080 28.096 1.000 2003 May 35,586,080 125,691,400 28.312 1.008 2003 Nov 35,526,470 125,983,780 28.199 1.004 2004 May 35,532,540 126,952,700 27.989 0.996 2004 Nov 35,698,920 127,926,320 27.906 0.993 2005 May 36,036,870 128,994,080 27.937 0.994
Source: BLS Occupational Employment Statistics and Academy calculations

77
Chart 4-1
Architecture and Engineering Employment in Non-Engineering Industries
1640
1660
1680
1700
1720
1740
1760
1780
Nov2002
May2003
Nov2003
May2004
Nov2004
May2005
Empl
oym
ent (
000)
1.26
1.28
1.3
1.32
1.34
1.36
1.38
1.4
1.42
Shar
e (%
)
Employment Share
Source: BLS Occupational Employment Statistics and Academy calculations If we take into account overall growth of the labor force over the period, the numbers are even more substantial. Applying the share of architects and engineers in the 2002 survey (1.40 percent) to total industry employment estimated by the May 2005 survey (129,470,750 employed) produces an estimate of an additional 111,219 architecture and engineering positions “lost” as a result of the changing share of total employment. During the same period, as shown in Chart 4-2, the number of architecture and engineering jobs in the architectural and engineering services sector increased by 59,620 positions. Domestic outsourcing appears to have accounted for about 81 percent of the reduction of architecture and engineering jobs from firms outside the architectural and engineering services industries.50 Without additional information, it is not possible to determine whether the remaining structural decline in engineering jobs was due to services off-shoring, greater productivity of engineering services in the specialized industry or if technological and market changes reduced demand.
50 Domestic outsourcing presumably occurs as engineering employment shifts from other industries to the specialized Architectural, Engineering and Other Technical Services industry.

78
Chart 4-2 Architectural and Engineering Employment in the Architectural and Engineering Services Industry
560570580590600610620630640650660670
Nov May Nov May Nov May
2002 2003 2003 2004 2004 2005
Em
ploy
men
t (00
0)
46.54747.54848.54949.55050.55151.5
Sha
re (%
)
Employment Share
Source: BLS Occupational Employment Statistics and Academy calculations There are a number of caveats to this comparison. First, as discussed earlier, the analysis only covers a three year period. This makes it difficult to separate out short-term, random and cyclical impacts from longer-term structural changes. Second, this aggregate occupational analysis may mask changes in specific occupations within the group. For example, computer and mathematical occupational employment may not change if a decline in computer programmer jobs is offset by an increase in computer software engineer jobs. Third, without additional information, it is not possible to identify reasons for the observed change. A decline in the employment of engineers outside the engineering services industry that exceeds the growth in engineer employment within that industry need not imply off-shoring if engineer occupations are more productive in the specialized industry or if technological changes are reducing demands for engineers in all industries.
Analysis Using Disaggregated (6-Digit) Occupational Data Finer tuning can help address the aggregation problem that may obscure offsetting movements in employment among different occupations. Table 4-3 identifies primary occupations reported in the four selected industries using more detailed occupational data.

79
Table 4-3 Core Occupations* in Examined Industries
Occupation Code Occupation Title Share Cumulative
Share Pharmaceutical and Medicine Manufacturing, NAICS Code 325400 51-9111 Packaging and Filling Machine Operators and Tenders 7.29 7.29 19-2031 Chemists 4.83 12.12 19-1042 Medical Scientists, Except Epidemiologists 3.37 15.49 51-9011 Chemical Equipment Operators and Tenders 3.06 18.56 51-9061 Inspectors, Testers, Sorters, Samplers, and Weighers 2.76 21.32 51-9023 Mixing and Blending Machine Setters, Operators, and Tenders 2.75 24.06 51-1011 First-Line Supervisors/Managers of Production and Operating Workers 2.69 26.75 19-4021 Biological Technicians 2.58 29.33 51-9012 Separating, Filtering, Clarifying, Precipitating, and Still Machine Setters, Operators, and Tenders 1.80 31.14 19-4031 Chemical Technicians 1.79 32.93
Architectural, Engineering and Related Services, NAICS Code 541300 17-2051 Civil Engineers 8.53 8.53 17-1011 Architects, Except Landscape and Naval 6.27 14.80 17-3011 Architectural and Civil Drafters 6.05 20.85 17-1022 Surveyors 3.25 24.10 17-3031 Surveying and Mapping Technicians 3.24 27.33 17-2141 Mechanical Engineers 3.22 30.55 17-3022 Civil Engineering Technicians 3.19 33.74 17-2071 Electrical Engineers 2.38 36.12 17-3013 Mechanical Drafters 1.53 37.65 17-3023 Electrical and Electronic Engineering Technicians 1.20 38.85
Computer Systems Design and Related Services, NAICS Code 541500 15-1031 Computer Software Engineers, Applications 11.65 11.65 15-1021 Computer Programmers 9.88 21.53 15-1051 Computer Systems Analysts 7.94 29.47 15-1041 Computer Support Specialists 7.29 36.76 15-1032 Computer Software Engineers, Systems Software 7.11 43.86 15-1071 Network and Computer Systems Administrators 3.32 47.18 15-1081 Network Systems and Data Communications Analysts 2.40 49.58 15-1061 Database Administrators 1.24 50.82 15-1099 Computer specialists, all other 0.66 51.48 15-1011 Computer and Information Scientists, Research 0.59 52.08
Business Support Services, NAICS Code 561400 41-9041 Telemarketers 20.10 20.10 43-4051 Customer Service Representatives 14.85 34.95 43-3011 Bill and Account Collectors 11.77 46.72 43-1011 First-Line Supervisors/Managers of Office and Administrative Support Workers 3.43 50.15 43-2011 Switchboard Operators, Including Answering Service 3.15 53.31 43-9061 Office Clerks, General 2.82 56.13 43-9071 Office Machine Operators, Except Computer 2.64 58.76 43-9051 Mail Clerks and Mail Machine Operators, Except Postal Service 2.02 60.78 43-3031 Bookkeeping, Accounting, and Auditing Clerks 1.31 62.09 41-1012 First-Line Supervisors/Managers of Non-Retail Sales Workers 1.22 63.31
* These are the six digit detailed occupations for the core occupations in Table 4-1. The ten largest sub occupations for each are shown. Shares are based on employment over the six survey periods from November 2002 through May 2005. Source: BLS OES data and Academy calculations.

80
The table presents the top ten detailed occupations (based on the total number of employees in the November 2002 to May 2005 OES surveys) for each of the core occupation groups identified in Table 4-1. The top ten 6-digit occupations accounted for a substantial proportion of the work force in each of these four industries, from over 43 percent for the pharmaceutical and medicine manufacturing [3254] industry, to nearly 79 percent for business support services [5614]. As with the 2-digit occupational analysis, we focus on changes in the employment share of the detailed core occupations in other industries. Table 4-4 presents for those industries employment by detailed core occupation, the percent of total employment, and index numbers reflecting changes in the employment shares for each. It is structured the same as Table 4-2 but with the detailed occupations shown in Table 4-3. For the pharmaceutical and medicine manufacturing [3254] the decline in core occupations as a percent of total industry employment is not uniform. The share of medical scientists, except epidemiologists, increased by over 35 percent; mixing and blending machine setters, operators, and tenders by 25 percent; and biological technicians by almost 48 percent. Chemists, chemical equipment operators and tenders, and chemical technicians took the brunt of the decrease in core occupation employment share. For architectural and engineering services [5413] core occupations, mechanical drafters as a percent of total non-engineering industry employment increased by almost 15 percent over the period; that of architectural and civil drafters decreased by nearly 30 percent; and employment of electrical and electronic engineering technicians declined by almost 17 percent. The share of employment in most of the other occupations there changed about 5-7 percent in either direction, while that of surveying and mapping technicians and mechanical engineering employment remained relatively flat. Computer systems design and related services [5415] core occupations in other industries experienced some volatility relative to total employment, but most occupations experienced an increasing share. The share of computer software engineers, applications, rose by 23 percent, computer software engineers, systems software by 34 percent, and network systems and data communications analysts by almost 47 percent. The share of computer programmers declined by 19 percent and database administrators by 7 percent. Most core occupations of business support services [5614] in other industries experienced declining shares of total employment. Telemarketers declined by 12 percent, and switchboard operators, including answering service; mail clerks and mail machine operators except postal service; and desktop publishers each declined by 19 percent. Customer service representatives experience the largest gain in share of nearly 10 percent but most other occupations were flat.

81
Table 4-4 Examined Core Employment
in Other Industries Detailed Occupations
Pharmaceutical and Medicine Manufacturing
All Non Case Study IndustriesYear Month Core Employment Total Employment Share of Total Index
Packaging and Filling Machine Operators and Tenders2002 Dec 365,410 126,770,480 0.29 1.0002003 May 373,090 126,149,250 0.30 1.0262003 Nov 369,170 126,434,320 0.29 1.0132004 May 383,220 127,418,350 0.30 1.0432004 Nov 384,220 128,391,460 0.30 1.0382005 May 361,630 129,470,750 0.28 0.969
Chemists2002 Dec 65,110 126,770,480 0.05 1.0002003 May 65,320 126,149,250 0.05 1.0082003 Nov 64,180 126,434,320 0.05 0.9882004 May 63,270 127,418,350 0.05 0.9672004 Nov 62,510 128,391,460 0.05 0.9482005 May 61,690 129,470,750 0.05 0.928
Medical Scientists, Except Epidemiologists2002 Dec 44,050 126,770,480 0.03 1.0002003 May 49,670 126,149,250 0.04 1.1332003 Nov 55,930 126,434,320 0.04 1.2732004 May 55,730 127,418,350 0.04 1.2592004 Nov 63,800 128,391,460 0.05 1.4302005 May 61,390 129,470,750 0.05 1.365
Chemical Equipment Operators and Tenders2002 Dec 43,220 126,770,480 0.03 1.0002003 May 44,400 126,149,250 0.04 1.0322003 Nov 37,160 126,434,320 0.03 0.8622004 May 36,540 127,418,350 0.03 0.8412004 Nov 34,650 128,391,460 0.03 0.7922005 May 35,860 129,470,750 0.03 0.812
Inspectors, Testers, Sorters, Samplers, and Weighers2002 Dec 478,890 126,770,480 0.38 1.0002003 May 473,390 126,149,250 0.38 0.9932003 Nov 477,670 126,434,320 0.38 1.0002004 May 483,250 127,418,350 0.38 1.0042004 Nov 491,500 128,391,460 0.38 1.0132005 May 492,050 129,470,750 0.38 1.006

82
Table 4-4 (continued)
Pharmaceutical and Medicine Manufacturing
All Non Case Study IndustriesYear Month Core Employment Total Employment Share of Total Index
Mixing and Blending Machine Setters, Operators, and Tenders2002 Dec 89,970 126,770,480 0.07 1.0002003 May 91,480 126,149,250 0.07 1.0222003 Nov 97,180 126,434,320 0.08 1.0832004 May 104,610 127,418,350 0.08 1.1572004 Nov 108,800 128,391,460 0.08 1.1942005 May 114,990 129,470,750 0.09 1.251
First-Line Supervisors/Managers of Production and Operating Workers2002 Dec 687,180 126,770,480 0.54 1.0002003 May 682,310 126,149,250 0.54 0.9982003 Nov 671,450 126,434,320 0.53 0.9802004 May 675,690 127,418,350 0.53 0.9782004 Nov 675,490 128,391,460 0.53 0.9712005 May 660,800 129,470,750 0.51 0.942
Biological Technicians2002 Dec 37,930 126,770,480 0.03 1.0002003 May 41,430 126,149,250 0.03 1.0982003 Nov 44,310 126,434,320 0.04 1.1712004 May 49,610 127,418,350 0.04 1.3012004 Nov 51,410 128,391,460 0.04 1.3382005 May 57,190 129,470,750 0.04 1.476
Separating, Filtering, Clarifying, Precipitating, and Still Machine Setters, Operators, and Tenders2002 Dec 27,990 126,770,480 0.02 1.0002003 May 30,320 126,149,250 0.02 1.0892003 Nov 23,510 126,434,320 0.02 0.8422004 May 24,400 127,418,350 0.02 0.8672004 Nov 31,640 128,391,460 0.02 1.1162005 May 33,940 129,470,750 0.03 1.187
Chemical Technicians2002 Dec 56,030 126,770,480 0.04 1.0002003 May 54,960 126,149,250 0.04 0.9862003 Nov 53,980 126,434,320 0.04 0.9662004 May 53,930 127,418,350 0.04 0.9582004 Nov 53,300 128,391,460 0.04 0.9392005 May 51,270 129,470,750 0.04 0.896

83
Table 4-4 (continued)
Architectural and Engineering ServicesAll Non Case Study Industries
Year Month Core Employment Total Employment Share of Total IndexCivil Engineers
2002 Dec 103,170 125,822,780 0.08 1.0002003 May 103,770 125,211,730 0.08 1.0112003 Nov 105,650 125,500,230 0.08 1.0272004 May 108,560 126,468,330 0.09 1.0472004 Nov 111,120 127,414,360 0.09 1.0642005 May 110,720 128,467,560 0.09 1.051
Architects, Except Landscape and Naval2002 Dec 12,540 125,822,780 0.01 1.0002003 May 12,390 125,211,730 0.01 0.9932003 Nov 13,170 125,500,230 0.01 1.0532004 May 13,830 126,468,330 0.01 1.0972004 Nov 13,820 127,414,360 0.01 1.0882005 May 13,330 128,467,560 0.01 1.041
Architectural and Civil Drafters2002 Dec 27,650 125,822,780 0.02 1.0002003 May 23,430 125,211,730 0.02 0.8522003 Nov 22,870 125,500,230 0.02 0.8292004 May 21,540 126,468,330 0.02 0.7752004 Nov 20,200 127,414,360 0.02 0.7212005 May 18,930 128,467,560 0.01 0.671
Surveyors2002 Dec 11,640 125,822,780 0.01 1.0002003 May 10,590 125,211,730 0.01 0.9142003 Nov 10,780 125,500,230 0.01 0.9282004 May 11,200 126,468,330 0.01 0.9572004 Nov 11,550 127,414,360 0.01 0.9802005 May 11,580 128,467,560 0.01 0.974
Surveying and Mapping Technicians2002 Dec 17,000 125,822,780 0.01 1.0002003 May 17,000 125,211,730 0.01 1.0052003 Nov 15,980 125,500,230 0.01 0.9422004 May 18,180 126,468,330 0.01 1.0642004 Nov 16,750 127,414,360 0.01 0.9732005 May 17,510 128,467,560 0.01 1.009
Mechanical Engineers2002 Dec 161,710 125,822,780 0.13 1.0002003 May 160,140 125,211,730 0.13 0.9952003 Nov 167,960 125,500,230 0.13 1.0412004 May 170,520 126,468,330 0.13 1.0492004 Nov 166,620 127,414,360 0.13 1.0172005 May 166,230 128,467,560 0.13 1.007

84
Table 4-4 (continued)
Architectural and Engineering ServicesAll Non Case Study Industries
Year Month Core Employment Total Employment Share of Total IndexCivil Engineering Technicians
2002 Dec 48,360 125,822,780 0.04 1.0002003 May 49,470 125,211,730 0.04 1.0282003 Nov 46,660 125,500,230 0.04 0.9672004 May 46,630 126,468,330 0.04 0.9592004 Nov 46,860 127,414,360 0.04 0.9572005 May 46,570 128,467,560 0.04 0.943
Electrical Engineers2002 Dec 112,870 125,822,780 0.09 1.0002003 May 108,600 125,211,730 0.09 0.9672003 Nov 111,450 125,500,230 0.09 0.9902004 May 109,710 126,468,330 0.09 0.9672004 Nov 113,520 127,414,360 0.09 0.9932005 May 110,830 128,467,560 0.09 0.962
Mechanical Drafters2002 Dec 45,910 125,822,780 0.04 1.0002003 May 49,710 125,211,730 0.04 1.0882003 Nov 52,500 125,500,230 0.04 1.1462004 May 54,900 126,468,330 0.04 1.1902004 Nov 54,740 127,414,360 0.04 1.1772005 May 53,860 128,467,560 0.04 1.149
Electrical and Electronic Engineering Technicians2002 Dec 172,510 125,822,780 0.14 1.0002003 May 156,530 125,211,730 0.13 0.9122003 Nov 164,260 125,500,230 0.13 0.9552004 May 158,270 126,468,330 0.13 0.9132004 Nov 155,940 127,414,360 0.12 0.8932005 May 146,490 128,467,560 0.11 0.832
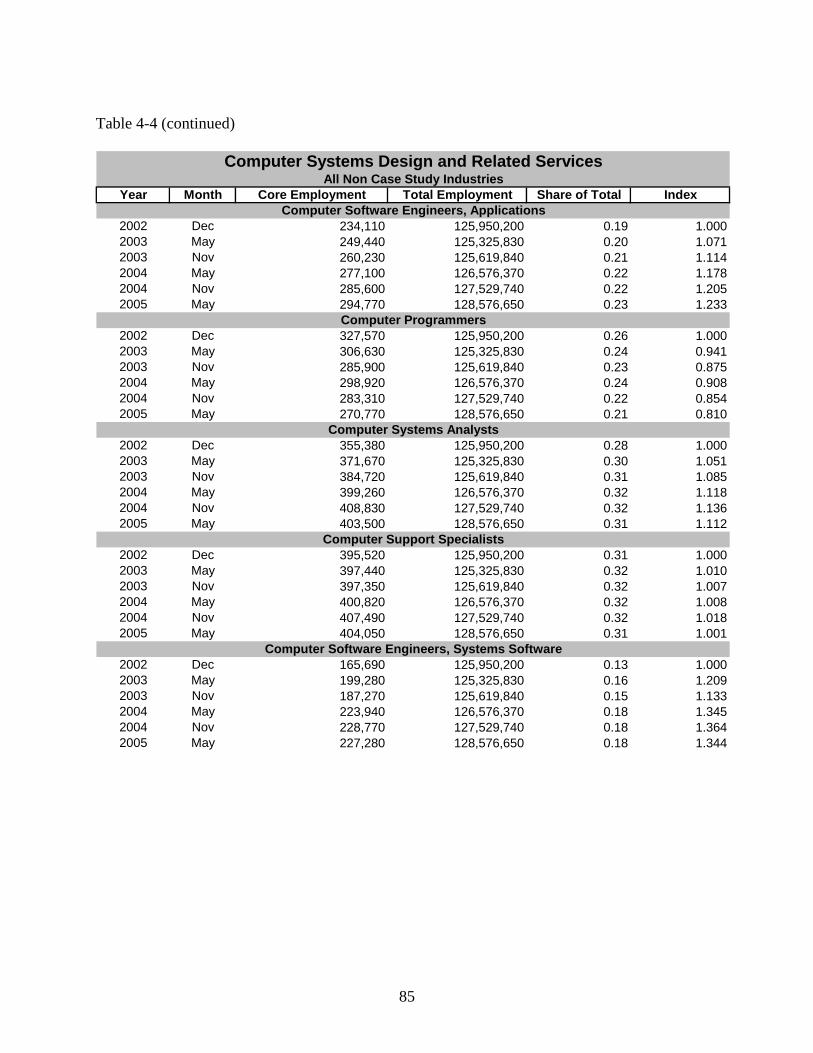
85
Table 4-4 (continued)
Computer Systems Design and Related ServicesAll Non Case Study Industries
Year Month Core Employment Total Employment Share of Total IndexComputer Software Engineers, Applications
2002 Dec 234,110 125,950,200 0.19 1.0002003 May 249,440 125,325,830 0.20 1.0712003 Nov 260,230 125,619,840 0.21 1.1142004 May 277,100 126,576,370 0.22 1.1782004 Nov 285,600 127,529,740 0.22 1.2052005 May 294,770 128,576,650 0.23 1.233
Computer Programmers2002 Dec 327,570 125,950,200 0.26 1.0002003 May 306,630 125,325,830 0.24 0.9412003 Nov 285,900 125,619,840 0.23 0.8752004 May 298,920 126,576,370 0.24 0.9082004 Nov 283,310 127,529,740 0.22 0.8542005 May 270,770 128,576,650 0.21 0.810
Computer Systems Analysts2002 Dec 355,380 125,950,200 0.28 1.0002003 May 371,670 125,325,830 0.30 1.0512003 Nov 384,720 125,619,840 0.31 1.0852004 May 399,260 126,576,370 0.32 1.1182004 Nov 408,830 127,529,740 0.32 1.1362005 May 403,500 128,576,650 0.31 1.112
Computer Support Specialists2002 Dec 395,520 125,950,200 0.31 1.0002003 May 397,440 125,325,830 0.32 1.0102003 Nov 397,350 125,619,840 0.32 1.0072004 May 400,820 126,576,370 0.32 1.0082004 Nov 407,490 127,529,740 0.32 1.0182005 May 404,050 128,576,650 0.31 1.001
Computer Software Engineers, Systems Software2002 Dec 165,690 125,950,200 0.13 1.0002003 May 199,280 125,325,830 0.16 1.2092003 Nov 187,270 125,619,840 0.15 1.1332004 May 223,940 126,576,370 0.18 1.3452004 Nov 228,770 127,529,740 0.18 1.3642005 May 227,280 128,576,650 0.18 1.344

86
Table 4-4 (continued)
Computer Systems Design and Related ServicesAll Non Case Study Industries
Year Month Core Employment Total Employment Share of Total IndexNetwork and Computer Systems Administrators
2002 Dec 192,710 125,950,200 0.15 1.0002003 May 198,490 125,325,830 0.16 1.0352003 Nov 206,760 125,619,840 0.16 1.0762004 May 216,630 126,576,370 0.17 1.1192004 Nov 221,970 127,529,740 0.17 1.1382005 May 226,230 128,576,650 0.18 1.150
Network Systems and Data Communications Analysts2002 Dec 101,930 125,950,200 0.08 1.0002003 May 111,210 125,325,830 0.09 1.0962003 Nov 118,910 125,619,840 0.09 1.1702004 May 136,020 126,576,370 0.11 1.3282004 Nov 142,070 127,529,740 0.11 1.3772005 May 150,500 128,576,650 0.12 1.446
Database Administrators2002 Dec 84,000 125,950,200 0.07 1.0002003 May 79,610 125,325,830 0.06 0.9522003 Nov 81,170 125,619,840 0.06 0.9692004 May 81,020 126,576,370 0.06 0.9602004 Nov 81,660 127,529,740 0.06 0.9602005 May 79,690 128,576,650 0.06 0.929
Computer specialists, all other2002 Dec N/A 125,950,200 NA2003 May N/A 125,325,830 NA2003 Nov N/A 125,619,840 NA2004 May 100,920 126,576,370 0.08 1.0002004 Nov 98,860 127,529,740 0.08 0.9722005 May 87,080 128,576,650 0.07 0.849
Computer and Information Scientists, Research2002 Dec 16,460 125,950,200 0.01 1.0002003 May 14,380 125,325,830 0.01 0.8782003 Nov 15,370 125,619,840 0.01 0.9362004 May 14,730 126,576,370 0.01 0.8902004 Nov 15,850 127,529,740 0.01 0.9512005 May 16,590 128,576,650 0.01 0.987

87
Table 4-4 (continued)
Business Support ServicesAll Non Case Study Industries
Year Month Core Employment Total Employment Share of Total IndexTelemarketers
2002 Dec 255,820 126,313,080 0.20 1.0002003 May 215,230 125,691,400 0.17 0.8452003 Nov 221,440 125,983,780 0.18 0.8682004 May 252,110 126,952,700 0.20 0.9812004 Nov 247,170 127,926,320 0.19 0.9542005 May 231,200 128,994,080 0.18 0.885
Customer Service Representatives2002 Dec 1,740,590 126,313,080 1.38 1.0002003 May 1,764,060 125,691,400 1.40 1.0182003 Nov 1,788,100 125,983,780 1.42 1.0302004 May 1,893,900 126,952,700 1.49 1.0832004 Nov 1,923,000 127,926,320 1.50 1.0912005 May 1,946,810 128,994,080 1.51 1.095
Bill and Account Collectors2002 Dec 322,330 126,313,080 0.26 1.0002003 May 327,380 125,691,400 0.26 1.0212003 Nov 327,690 125,983,780 0.26 1.0192004 May 342,620 126,952,700 0.27 1.0582004 Nov 341,500 127,926,320 0.27 1.0462005 May 329,970 128,994,080 0.26 1.002
First-Line Supervisors/Managers of Office and Administrative Support Workers2002 Dec 1,353,490 126,313,080 1.07 1.0002003 May 1,376,420 125,691,400 1.10 1.0222003 Nov 1,374,590 125,983,780 1.09 1.0182004 May 1,375,020 126,952,700 1.08 1.0112004 Nov 1,311,270 127,926,320 1.03 0.9572005 May 1,263,610 128,994,080 0.98 0.914
Switchboard Operators, Including Answering Service2002 Dec 199,200 126,313,080 0.16 1.0002003 May 185,230 125,691,400 0.15 0.9342003 Nov 179,780 125,983,780 0.14 0.9052004 May 177,170 126,952,700 0.14 0.8852004 Nov 174,320 127,926,320 0.14 0.8642005 May 165,470 128,994,080 0.13 0.813
Office Clerks, General2002 Dec 2,830,000 126,313,080 2.24 1.0002003 May 2,892,830 125,691,400 2.30 1.0272003 Nov 2,930,810 125,983,780 2.33 1.0382004 May 2,927,720 126,952,700 2.31 1.0292004 Nov 2,922,430 127,926,320 2.28 1.0202005 May 2,971,640 128,994,080 2.30 1.028

88
Table 4-4 (continued)
Business Support ServicesAll Non Case Study Industries
Year Month Core Employment Total Employment Share of Total IndexOffice Machine Operators, Except Computer
2002 Dec 67,050 126,313,080 0.05 1.0002003 May 62,780 125,691,400 0.05 0.9412003 Nov 58,840 125,983,780 0.05 0.8802004 May 72,890 126,952,700 0.06 1.0822004 Nov 63,760 127,926,320 0.05 0.9392005 May 62,360 128,994,080 0.05 0.911
Mail Clerks and Mail Machine Operators, Except Postal Service2002 Dec 147,120 126,313,080 0.12 1.0002003 May 130,040 125,691,400 0.10 0.8882003 Nov 132,190 125,983,780 0.10 0.9012004 May 125,990 126,952,700 0.10 0.8522004 Nov 123,210 127,926,320 0.10 0.8272005 May 122,280 128,994,080 0.09 0.814
Desktop Publishers2002 Dec 31,690 126,313,080 0.03 1.0002003 May 30,500 125,691,400 0.02 0.9672003 Nov 30,470 125,983,780 0.02 0.9642004 May 30,260 126,952,700 0.02 0.9502004 Nov 27,230 127,926,320 0.02 0.8482005 May 26,220 128,994,080 0.02 0.810
First-Line Supervisors/Managers of Non-Retail Sales Workers2002 Dec 300,190 126,313,080 0.24 1.0002003 May 310,430 125,691,400 0.25 1.0392003 Nov 301,160 125,983,780 0.24 1.0062004 May 295,020 126,952,700 0.23 0.9782004 Nov 289,620 127,926,320 0.23 0.9532005 May 279,380 128,994,080 0.22 0.911
Source: BLS Occupational Employment Statistics data and Academy calculations The disaggregated occupational analysis reveals the more extensive changes in occupational employment shares that are taking place in both the specialized services industries—at least the four selected industries—and all other industries. But as can be seen in the table, these changes in employment shares vary substantially for different detailed core occupations. However, even if a consistent pattern had emerged indicating faster growth in employment shares for these core occupations within the specialized industries, it would not be possible to attribute the reason for these differences in occupational employment shares without more data. Table 4-5 presents information on the employment by detailed core occupation in these four industries and other industries. It provides useful information on employment changes and the extent to which declines in other industries are offset by growth in employment in the four industries. This was discussed earlier for the architecture and engineering jobs at a more aggregated level. While it is informative to look at the actual numbers instead of shares, we can’t put them into the context of outsourcing, because it is not clear whether the occupational shares of total employment are increasing or decreasing. In addition, the detailed estimates

89
underestimate actual employment, because of the need of statistical agencies to protect the confidentiality of respondents. Over the survey period there was overall growth of some 38,850 jobs that are core to the pharmaceutical and medicine manufacturing [3254] industry. Of this, 35,030 were in other industries. Declines in other industries of chemists, first line supervisors of production workers and operating workers, and chemical technicians were accompanied by reductions in the pharmaceutical and medicine manufacturing [3254] industry. Only for chemical equipment operators and tenders was there an increase in pharmaceutical and medicine manufacturing [3254] counter to declines elsewhere. For the detailed architectural and engineering service [5413] core occupations, employment growth in the selected industry offset declines elsewhere for architectural and civil drafters, surveyors, and civil engineering technicians. The robust growth for other core occupations that were also growing outside the specialized industry suggests some degree of engineering services outsourcing within these non-architecture and engineering services industries. Table 4-4 confirms the declining share of architectural and civil drafters, suggesting that this occupation may have been domestically outsourced. There is no such offset for the decline in electrical and electronic engineering technicians, which fell by 17 percent among the other industry workforce, suggesting that these jobs have disappeared due to technological change or been off-shored. Overall growth in these occupations within the architectural and engineering Services industry accounts for all of the net growth of some 46,550 core engineering occupation jobs. Computer systems design and related services [5415] core occupations had the largest growth among the four selected industries, but much of this growth occurred in industries other than the specialized services industry. A decline of computer systems analysts within the specialized industry [5415] was more than offset by growth in other industries. Only computer programmers showed a consistent decline during the period. Business support services [5614] core occupations experienced the second largest increase, in both the four industries examined and in all other industries. Declines in first line supervisors of office and administrative support workers; switchboard operators, including answering service; mail clerks and mail machine operators, except postal service; office machine operators, except computer; and telemarketers in other industries were not offset, even though there was general growth in these occupations in the Business support services [5614] industry. Most of the growth in these core occupations in both the specialized industry and all other industries was in customer service representatives and office clerks, general.

90
Table 4-5 Examined Industry Core Occupations
Employment in Examined Industries and Other Industries
EmploymentCase Study Industry Other Industries Net Gain/Loss
51-9111Packaging and Filling Machine Operators and Tenders Nov-02 20,370 365,410Packaging and Filling Machine Operators and Tenders May-05 21,990 361,630Change Nov-02 to May-05 1,620 -3,780 -2160
19-2031 Chemists Nov-02 14,280 65,110Chemists May-05 12,920 61,690Change Nov-02 to May-05 -1,360 -3,420 -4780
19-1042 Medical Scientists, Except Epidemiologists Nov-02 8,770 44,050
Medical Scientists, Except Epidemiologists May-05 10,350 61,390Change Nov-02 to May-05 1,580 17,340 18920
51-9011 Chemical Equipment Operators and Tenders Nov-02 9,150 43,220
Chemical Equipment Operators and Tenders May-05 10,820 35,860Change Nov-02 to May-05 1,670 -7,360 -5690
51-9061Inspectors, Testers, Sorters, Samplers, and Weighers Nov-02 8,560 478,890Inspectors, Testers, Sorters, Samplers, and Weighers May-05 8,620 492,050Change Nov-02 to May-05 60 13,160 13220
51-9023Mixing and Blending Machine Setters, Operators, and Tenders Nov-02 7,780 89,970Mixing and Blending Machine Setters, Operators, and Tenders May-05 9,040 114,990Change Nov-02 to May-05 1,260 25,020 26280
51-1011First-Line Supervisors/Managers of Production and Operating Workers Nov-02 9,020 687,180First-Line Supervisors/Managers of Production and Operating Workers May-05 7,420 660,800Change Nov-02 to May-05 -1,600 -26,380 -27980
19-4021 Biological Technicians Nov-02 6,400 37,930Biological Technicians May-05 8,640 57,190Change Nov-02 to May-05 2,240 19,260 21500
51-9012
Separating, Filtering, Clarifying, Precipitating, and Still Machine Setters, Operators, and Tenders Nov-02 4,670 27,990Separating, Filtering, Clarifying, Precipitating, and Still Machine Setters, Operators, and Tenders May-05 4,770 33,940Change Nov-02 to May-05 100 5,950 6050
19-4031 Chemical Technicians Nov-02 6,660 56,030Chemical Technicians May-05 4,910 51,270Change Nov-02 to May-05 -1,750 -4,760 -6510Total Change, Nov-02 to May-05 3,820 35,030 38,850
Pharmaceutical and Medicine Manufacturing, NAICS Code 325400SOC Code Occupation Title Survey

91
Table 4-5 (continued)
Architectural and Engineering Services, NAICS Code 54130Employment
Case Study Industry Other Industries Net Gain/Loss17-2051 Civil Engineers Nov-02 100,640 103,17017-2051 Civil engineers May-05 115,810 110,720
Change Nov-02 to May-05 15,170 7,550 22,7200
17-1011 Architects, Except Landscape and Naval Nov-02 73,310 12,54017-1011 Architects, except landscape and naval May-05 82,150 13,330
Change Nov-02 to May-05 8,840 790 9,6300
17-3011 Architectural and Civil Drafters Nov-02 72,030 27,65017-3011 Architectural and civil drafters May-05 80,460 18,930
Change Nov-02 to May-05 8,430 -8,720 -2900
17-1022 Surveyors Nov-02 41,180 11,64017-1022 Surveyors May-05 41,860 11,580
Change Nov-02 to May-05 680 -60 6200
17-3031 Surveying and Mapping Technicians Nov-02 36,730 17,00017-3031 Surveying and mapping technicians May-05 45,060 17,510
Change Nov-02 to May-05 8,330 510 8,8400
17-2141 Mechanical Engineers Nov-02 34,010 161,71017-2141 Mechanical engineers May-05 47,060 166,230
Change Nov-02 to May-05 13,050 4,520 17,5700
17-3022 Civil Engineering Technicians Nov-02 36,130 48,36017-3022 Civil engineering technicians May-05 41,830 46,570
Change Nov-02 to May-05 5,700 -1,790 3,9100
17-2071 Electrical Engineers Nov-02 29,250 112,87017-2071 Electrical engineers May-05 30,570 110,830
Change Nov-02 to May-05 1,320 -2,040 -7200
17-3013 Mechanical Drafters Nov-02 17,730 45,91017-3013 Mechanical drafters May-05 19,610 53,860
Change Nov-02 to May-05 1,880 7,950 9,8300
17-3023Electrical and Electronic Engineering Technicians Nov-02 14,900 172,510
17-3023Electrical and electronic engineering technicians May-05 15,360 146,490Change Nov-02 to May-05 460 -26,020 -25,560Total Change, Nov-02 to May-05 63,860 -17,310 46,550
SOC Code Occupation Title Survey

92
Table 4-5 (continued)
Computer Systems Design and Related Services, NAICS Code 541500Employment
Case Study Industry Other Industries Net Gain/Loss
15-1031 Computer Software Engineers, Applications Nov-02 116,430 234,110
15-1031 Computer software engineers, applications May-05 149,290 294,770Change Nov-02 to May-05 32,860 60,660 93,520
15-1021 Computer Programmers Nov-02 119,700 327,57015-1021 Computer programmers May-05 114,580 270,770
Change Nov-02 to May-05 -5,120 -56,800 -61,920
15-1051 Computer Systems Analysts Nov-02 96,240 355,38015-1051 Computer systems analysts May-05 85,020 403,500
Change Nov-02 to May-05 -11,220 48,120 36,900
15-1041 Computer Support Specialists Nov-02 82,520 395,52015-1041 Computer support specialists May-05 85,760 404,050
Change Nov-02 to May-05 3,240 8,530 11,770
15-1032Computer Software Engineers, Systems Software Nov-02 67,790 165,690
15-1032Computer software engineers, systems software May-05 86,710 227,280Change Nov-02 to May-05 18,920 61,590 80,510
15-1071Network and Computer Systems Administrators Nov-02 38,050 192,710
15-1071Network and computer systems administrators May-05 40,280 226,230Change Nov-02 to May-05 2,230 33,520 35,750
15-1081Network Systems and Data Communications Analysts Nov-02 22,810 101,930
15-1081Network systems and data communications analysts May-05 31,550 150,500Change Nov-02 to May-05 8,740 48,570 57,310
15-1061 Database Administrators Nov-02 14,570 84,00015-1061 Database administrators May-05 14,680 79,690
Change Nov-02 to May-05 110 -4,310 -4,200
15-1099 Computer specialists, all other Nov-02 NA N/A15-1099 Computer specialists, all other May-05 15,780 87,080
Change Nov-02 to May-05 NA N/A N/A
15-1011Computer and Information Scientists, Research Nov-02 5,960 16,460
15-1011Computer and information scientists, research May-05 7,090 16,590Change Nov-02 to May-05 1,130 130 1,260Total Change, Nov-02 to May-05 50,890 200,010 250,900
SOC Code Occupation Title Survey

93
Table 4-5 (continued)
Business Support Services, NAICS Code 561400
EmploymentCase Study Industry Other Industries Net Gain/Loss
41-9041 Telemarketers Nov-02 155,430 255,82041-9041 Telemarketers May-05 155,660 231,200
Change Nov-02 to May-05 230 -24,620 -24,390
43-4051 Customer Service Representatives Nov-02 105,570 1,740,59043-4051 Customer service representatives May-05 117,040 1,946,810
Change Nov-02 to May-05 11,470 206,220 217,690
43-3011 Bill and Account Collectors Nov-02 78,400 322,33043-3011 Bill and account collectors May-05 97,010 329,970
Change Nov-02 to May-05 18,610 7,640 26,250
43-1011First-line supervisors/managers of office and administrative support workers Nov-02 25,550 1,353,490
43-1011First-line supervisors/managers of office and administrative support workers May-05 26,910 1,263,610Change Nov-02 to May-05 1,360 -89,880 -88,520
43-2011Switchboard Operators, Including Answering Service Nov-02 23,870 199,200
43-2011Switchboard operators, including answering service May-05 24,500 165,470Change Nov-02 to May-05 630 -33,730 -33,100
43-9061 Office Clerks, General Nov-02 20,110 2,830,00043-9061 Office clerks, general May-05 23,930 2,971,640
Change Nov-02 to May-05 3,820 141,640 145,460
43-9071 Office Machine Operators, Except Computer Nov-02 19,640 67,050
43-9071 Office machine operators, except computer May-05 20,650 62,360Change Nov-02 to May-05 1,010 -4,690 -3,680
43-9051Mail Clerks and Mail Machine Operators, Except Postal Service Nov-02 10,250 147,120
43-9051Mail clerks and mail machine operators, except postal service May-05 18,480 122,280Change Nov-02 to May-05 8,230 -24,840 -16,610
43-9031 Desktop Publishers Nov-02 370 31,69043-9031 Desktop publishers May-05 600 26,220
Change Nov-02 to May-05 230 -5,470 -5,240
41-1012First-Line Supervisors/Managers of Non-Retail Sales Workers Nov-02 8,410 300,190
41-1012First-line supervisors/managers of non-retail sales workers May-05 9,450 279,380Change Nov-02 to May-05 1,040 -20,810 -19,770Total Change, Nov-02 to May-05 46,630 151,460 198,090
SOC Code Occupation Title Survey
Source: BLS OES national data, Academy calculations

94
ASSESSMENT OF THE DATA The OES data are essential for identifying changes in the occupational structure of industries and for measuring associated employment effects, providing a fine level of industry and occupational detail. They can identify changes in occupations that may not appear in BEA data that primarily measure purchases and sales of output by firms and establishments or even in other BLS surveys that depend on unemployment insurance information. There are some limitations to this data set, however. The most serious is the lack of 3-digit occupational detail. While the analyst can aggregate the OES data manually, doing so will result in undercounting employment, due to BLS holding back detailed occupational data to prevent disclosure. This can be serious; aggregating from 6-digit to 2-digit occupational data would have significantly changed the data in Table 4-2 and Charts 4-1 and 4-2, and would have led to missing the declining industry shares for core pharmaceuticals and medicine manufacturing and architectural and engineering services occupations. It was seen in Tables 4-4 and 4-5 that the detailed occupations within the core set did not move uniformly, and that some level of detail finer than the major occupation level (2-digit) is needed. The next chapter also makes a compelling case for the usefulness of 3-digit occupational detail compiled by BLS. However, even if the level of detail were ideal the OES would still be limited in what it can tell us about services outsourcing and off-shoring. The data may suggest the presence of outsourcing by providing information on the shares of employment in various industries, but since the surveys only cover domestic employment, there is little they can tell us about off-shoring. Analysis of OES data can identify potentially significant changes in the occupational employment shares of occupations perceived to be vulnerable to outsourcing and off-shoring, but it is not enough. More information is needed to identify industries that are increasing purchases of the intermediate goods or services produced by workers in these occupations to determine whether services outsourcing is occurring and how it is affecting their occupational mix. To examine the extent and effects of services off-shoring, additional data on those industries importing services for intermediate use are needed. These additional data needs require integrating these BLS OES data with BEA industry data—in particular, the I-O use tables, described in Chapter 3. In the next chapter, we present the results of this linked analysis.

95
CHAPTER 5
OCCUPATIONAL CHANGES WITHIN SECTORS OFF-SHORING SERVICES
INTRODUCTION As the analysis in the Chapter 4 demonstrated, the strength of OES data is that they identify detailed changes in the composition of the work force over time for specific industries or sectors. The weakness for our purposes is that they cannot determine the reasons for those occupational changes, including shifting due to outsourcing or off-shoring. For example, if there is a decline in employment in an occupation as a percent of total industry employment, it may be due to outsourcing or off-shoring, but it may also be due to industry consolidation, changes in technology or productivity, changes in compensation in competing occupations requiring similar skills or other reasons. One way to relate changes in the occupational structures of industries to off-shoring is to combine the BLS OES with the BEA industry data. This allows an examination of changes in the occupational structures of those industries importing intermediate services or increasing use of purchased intermediate services and to determine whether occupational shares of services producing occupations have been declining. Results of that effort are discussed in this chapter. METHODOLOGY This next section presents a methodology for using OES data to analyze changes in employment for occupations within I-O sectors, by breaking total change in employment into two components, (1) employment changes due to changes in the occupational structure, and (2) changes due to overall sector growth or decline. The methodology is illustrated with the four examined industries. The section following that combines the methodology with measures of off-shoring by the 65 I-O sectors as developed and discussed in Chapter 3. To simplify the analysis, these 65 sectors are grouped into quartiles by their average annual rates of growth of off-shoring over the 1998 to 2004 period. The first quartile (highest rates) and fourth quartile (lowest rates) are compared to determine whether there have been any significant differences in occupational structural changes between the two groups. The analyses of changes in occupational structures in this chapter focus on two levels of detail—2-digit (22 categories) and 3-digit occupational groups (92 categories). OES data at the NAICS 4-digit industry level are publicly available only since 2002. The period of analysis extends therefore only from the November 2002 survey period through that of May 2005.

96
The Components of Employment Change All of the sectors experienced changes in employment by occupation over the 2002 to 2005 survey period. These changes in employment can be categorized into two components: (1) changes due to a shift in the occupational structure of the industries,51 and (2) changes due to all other factors, which together result in sector growth or decline (referred to as sector growth in this chapter). The occupational structure of an industry or I-O sector includes all of its occupational shares. An occupational share is the percentage of total employment in the sector accounted for by a particular occupation. If the structure is unchanged over time, then individual occupational shares are also unchanged, even though total employment increases or decreases. If the structure does change, say between 2002 and 2005, we can estimate the effect of that change on employment for a particular occupation by multiplying its 2002 employment share by 2005 sector employment and comparing that result to the actual 2005 employment for that occupation. Suppose that our 2005 estimate of the number of engineers in a particular industry is 1,000 if its occupational structure (the employment share of engineers in that industry) were unchanged, but there were only 900 engineers actually employed in that industry in 2005. This loss of 100 engineering jobs would be due to the change in the occupational structure. If actual employment of engineers in 2005 were 1,200 in that industry, the changing occupational structure (the increased employment share for engineers) would have produced a net gain of 200 jobs. Employment changes for each occupation resulting from overall industry growth are simply the difference between the actual changes observed in the OES data and the employment increases or decreases resulting from shifts in the occupational structure for each sector. For example, if the estimated net change in engineer employment due to occupational structure was an increase of 200 jobs, but the actual net change in engineering jobs in a particular sector was actually 250, we would infer that sector growth accounted for the remaining 50 jobs. The sums of the two components of employment change by occupation are consistent with these definitions. Since the occupational shares within each sector sum to one, the sum of increases and decreases resulting from occupational share changes will be zero.52 The residual employment contains all of the growth, and the sum of this component of employment change for all occupations is exactly equal to the change in aggregate employment. OCCUPATIONAL EMPLOYMENT CHANGES IN FOUR INDUSTRY SECTORS Tables 5-1 through 5-4 present findings for four industry sectors that each contain one of the four industries examined. Of the four industries examined, only one—computer systems design and related services [5415]—is separately broken out in the BEA I-O industry classification system,
51 The occupational structure of a sector is the percentage of sector employment accounted for by each of the occupations. 52 Changes in occupational structure will result in allocating 2005 employment in a different pattern, but since total employment does not change, the differences between actual and forecast employment will sum to zero.

97
called the computer systems design and related services sector. The others are part of larger sector groupings: pharmaceutical and medicine manufacturing [3254] in the chemical products sector; architectural, engineering and related services [5413] in the miscellaneous professional, scientific and technical services sector; and business support services [5614] in the administrative and support services sector. In this analysis we use the broader, BEA I-O sector classification, as we will later associate it with the services off-shoring indicators calculated in Chapter 3. Table 5-1 shows the components of the change in employment for the major occupation groupings in the computer systems design and related services sector. The occupations are ranked from the lowest to highest net change in employment. Between the November 2002 and the May 2005 OES surveys, employment grew by 72,480 jobs. About 70 percent of the change, or 50,470 jobs, was in the sector’s core occupation grouping—computer and mathematical science occupations.53 For this core service producing occupational group, occupational structural changes (i.e., growth in that occupation’s share of total employment), reflecting perhaps increasing specialization within the industry, accounted for 9,435 jobs or 19 percent of the increase, while sectoral growth accounted for the other 81 percent. The next largest occupational categories, office and administrative support occupations, and management occupations, had relatively little growth or a small decline in net employment over this period. Both occupational groups had substantial employment declines due to occupational structure changes that nearly, or more than offset changes due to sectoral growth. There was also a sharp increase in net employment for business and financial occupations, primarily the result of increasing occupational share.
53 See discussion in chapter 4 that defines core service producing occupations in these four selected industries.

98
Table 5-1 Changes in Occupational Structure and Employment Growth in the Computer Systems Design and Related Services Sector
Employment Employment Changes Due To
2002 2005 Change Occupation Structural Change Sector Growth
Installation, Maintenance, and Repair Occupations 18,750 16,310 -2,440 -3,791 1,351Production Occupations 4,210 3,090 -1,120 -1,423 303Management Occupations 112,400 111,320 -1,080 -9,182 8,102Building and Grounds Cleaning and Maintenance Occupations 1,180 540 -640 -725 85Transportation and Material Moving Occupations 2,040 1,810 -230 -377 147Legal Occupations 660 480 -180 -228 48Protective Service Occupations 1,150 1,120 -30 -113 83Healthcare Practitioner and Technical Occupations 370 570 200 173 27Construction and Extraction Occupations 260 580 320 301 19Education, Training, and Library Occupations 360 1,360 1,000 974 26Office and Administrative Support Occupations 153,290 154,740 1,450 -9,599 11,049Sales and Related Occupations 43,100 44,770 1,670 -1,437 3,107Arts, Design, Entertainment, Sports, and Media Occupations 16,720 19,110 2,390 1,185 1,205Life, Physical, and Social Science Occupations 4,320 7,120 2,800 2,489 311Architecture and Engineering Occupations 25,160 28,940 3,780 1,966 1,814Business and Financial Operations Occupations 52,280 66,400 14,120 10,352 3,768Computer and Mathematical Science Occupations 569,300 619,770 50,470 9,435 41,035
Total 1,005,550 1,078,030 72,480 0.00 72,480
Correlation between Employment Change and Occupation Structural Change 0.6448
Occupation
Source: BLS Occupational Employment Statistics, BEA Inter-industry Analysis Classifications, and Academy calculations

99
Table 5-2 shows the components of changes in employment for occupations in the miscellaneous professional, scientific and technical services sector. Overall employment increased by 305,080 over the period. Architecture and engineering occupations—the core service producing occupation for the architectural, engineering and related services [5413] industry—accounted for the largest share of this net employment increase, about 25 percent (or 98,220 jobs). The net employment increase for this core occupation was almost evenly split between rising specialization (occupational structure changes) and overall sector growth. Several other specialized service producing occupations—business and financial operations, life, physical, and social science, and computer and mathematical science— also had net employment increases that were reinforced by structural occupational changes. On the other hand, office and administrative support employment grew, but occupational structural changes reduced that net growth and total employment for management occupations fell due to a significant decline in its occupational employment share. Table 5-3, presents the components of employment changes for the administrative and support services sector. Overall there was an increase of 450,150 jobs, of which 156, 020, or 35 percent were in building and grounds cleaning and maintenance occupations. Growth here reflected both an increasing occupational share and overall sector growth. The decline in office and administrative support functions was due to the large decline in occupational share that more than offset sectoral growth. Production occupations grew, as did healthcare practitioner and technical occupations, due to increased occupational share and overall sector growth. Management occupations declined, as structural occupational changes more than offset sector growth. Table 5-4 shows employment changes and its components for the chemical products sector, which includes the pharmaceutical and medicine manufacturing [3254] industry. Overall employment declined by 840 jobs over the survey period. Production jobs increased by 23,440 due to changes in the occupational share. Employment in management occupations declined sharply, again primarily due to changing occupational share, as did office and administrative support occupations. Employment in the life, physical and social science occupations increased modestly due to favorable occupational structural changes. In general, for the four selected industries, the core service producing occupations appear to have gained employment due to occupational structural changes that are consistent with the possibility of increased services outsourcing among other (non-service producing) industry sectors. Management occupations in all sectors declined due to occupational structural changes that suggest a streamlining or flattening of business organizational structures.54 Sectoral increases moderated or overcame changes in occupational structure in a few instances, so that employment effects from declining occupational employment shares were masked by overall growth in employment.
54 BLS has suggested that in recent years manager occupations have been more carefully measured and edited. As a result, some portion of the observed flattening in the management structure may be the result of BLS’ estimation procedures.

100
Table 5-2 Changes in Occupational Structure and Employment Growth in the Miscellaneous Professional, Scientific and Technical Services Sector
Employment Employment Changes Due To
2002 2005 Change Occupation Structural Change Sector Growth
Management Occupations 387,290 333,750 -53,540 -84,376 30,836Production Occupations 83,730 79,330 -4,400 -11,067 6,667Transportation and Material Moving Occupations 47,680 43,760 -3,920 -7,716 3,796Installation, Maintenance, and Repair Occupations 35,450 32,600 -2,850 -5,673 2,823Building and Grounds Cleaning and Maintenance Occupations 38,130 36,760 -1,370 -4,406 3,036Personal Care and Service Occupations 24,080 23,010 -1,070 -2,987 1,917Education, Training, and Library Occupations 5,960 5,120 -840 -1,315 475Food Preparation and Serving Related Occupations 1,190 1,160 -30 -125 95Protective Service Occupations 5,730 5,750 20 -436 456Legal Occupations 6,780 6,820 40 -500 540Farming, Fishing, and Forestry Occupations 2,360 2,410 50 -138 188Community and Social Services Occupations 2,730 3,440 710 493 217Construction and Extraction Occupations 43,910 48,010 4,100 604 3,496Healthcare Support Occupations 59,360 66,300 6,940 2,214 4,726Healthcare Practitioner and Technical Occupations 115,030 124,470 9,440 281 9,159Sales and Related Occupations 161,400 171,170 9,770 -3,081 12,851Arts, Design, Entertainment, Sports, and Media Occupations 211,540 239,750 28,210 11,367 16,843Computer and Mathematical Science Occupations 220,620 262,840 42,220 24,654 17,566Life, Physical, and Social Science Occupations 201,810 249,810 48,000 31,932 16,068Office and Administrative Support Occupations 1,037,110 1,087,180 50,070 -32,505 82,575Business and Financial Operations Occupations 509,220 584,530 75,310 34,766 40,544Architecture and Engineering Occupations 630,560 728,780 98,220 48,014 50,206
Total 3,831,670 4,136,750 305,080 0.00 305,080
Correlation between Employment Change and Occupation Structural Change 0.7673
Occupation
Source: BLS Occupational Employment Statistics, BEA Inter-industry Analysis Classifications, and Academy calculations

101
Table 5-3 Changes in Occupational Structure and Employment Growth
in the Administrative and Support Services Sector
Employment Employment Changes Due To
2002 2005 Change Occupation Structural Change Sector Growth
Office and Administrative Support Occupations 1,667,590 1,633,170 -34,420 -148,350 113,930Sales and Related Occupations 433,290 418,210 -15,080 -44,683 29,603Management Occupations 212,570 203,200 -9,370 -23,893 14,523Architecture and Engineering Occupations 40,940 38,390 -2,550 -5,347 2,797Arts, Design, Entertainment, Sports, and Media Occupations 25,940 26,130 190 -1,582 1,772Community and Social Services Occupations 3,060 4,540 1,480 1,271 209Healthcare Support Occupations 96,020 97,880 1,860 -4,700 6,560Life, Physical, and Social Science Occupations 7,870 10,300 2,430 1,892 538Education, Training, and Library Occupations 9,840 14,800 4,960 4,288 672Legal Occupations 10,720 16,740 6,020 5,288 732Farming, Fishing, and Forestry Occupations 8,710 17,200 8,490 7,895 595Protective Service Occupations 613,620 623,130 9,510 -32,413 41,923Personal Care and Service Occupations 36,770 49,730 12,960 10,448 2,512Computer and Mathematical Science Occupations 103,400 117,670 14,270 7,206 7,064Installation, Maintenance, and Repair Occupations 121,440 141,530 20,090 11,793 8,297Construction and Extraction Occupations 150,150 177,610 27,460 17,202 10,258Food Preparation and Serving Related Occupations 70,410 109,730 39,320 34,510 4,810Transportation and Material Moving Occupations 839,000 878,340 39,340 -17,981 57,321Business and Financial Operations Occupations 129,360 176,380 47,020 38,182 8,838Healthcare Practitioner and Technical Occupations 130,510 181,310 50,800 41,884 8,916Production Occupations 448,510 517,860 69,350 38,708 30,642Building and Grounds Cleaning and Maintenance Occupations 1,429,090 1,585,110 156,020 58,384 97,636
Total 6,588,810 7,038,960 450,150 0.00 450,150
Correlation between Employment Change and Occupation Structural Change 0.6914
Occupation
Source: BLS Occupational Employment Statistics, BEA Inter-industry Analysis Classifications, and Academy calculations

102
Table 5-4 Changes in Occupational Structure and Employment Growth
in the Chemical Products Sector
Employment Employment Changes Due To
2002 2005 Change Occupation Structural Change Sector Growth
Management Occupations 69,840 55,780 -14,060 -13,987 -73Office and Administrative Support Occupations 103,470 95,030 -8,440 -8,331 -109Architecture and Engineering Occupations 34,640 31,920 -2,720 -2,684 -36Installation, Maintenance, and Repair Occupations 59,710 57,730 -1,980 -1,917 -63Business and Financial Operations Occupations 25,620 24,390 -1,230 -1,203 -27Construction and Extraction Occupations 6,500 6,180 -320 -313 -7Protective Service Occupations 1,670 1,430 -240 -238 -2Computer and Mathematical Science Occupations 15,660 15,590 -70 -54 -16Legal Occupations 1,310 1,260 -50 -49 -1Arts, Design, Entertainment, Sports, and Media Occupations 1,200 1,270 70 71 -1Healthcare Practitioner and Technical Occupations 2,020 2,100 80 82 -2Building and Grounds Cleaning and Maintenance Occupations 5,430 5,520 90 96 -6Education, Training, and Library Occupations 100 230 130 130 0Healthcare Support Occupations 520 710 190 191 -1Sales and Related Occupations 26,750 27,320 570 598 -28Transportation and Material Moving Occupations 61,980 63,050 1,070 1,135 -65Life, Physical, and Social Science Occupations 80,430 83,060 2,630 2,715 -85Production Occupations 302,200 325,640 23,440 23,758 -318
Total 799,050 798,210 -840 0.00 -840
Correlation between Employment Change and Occupation Structural Change 1.0000
Occupation
Source: BLS Occupational Employment Statistics, BEA Inter-industry Analysis Classifications and Academy calculations.
103
Linked Data Sets and Off-Shoring Quartiles In the remainder of the chapter, we summarize the components of employment gains or losses by occupation for all 65 I-O sectors, following the methodology of Tables 5-1 through 5-4. The summaries are at the 2- and 3-digit occupation levels for each I-O industry sector.55 The sectors have been ordered by off-shoring intensity growth rates over the period 1998 to 2004, from highest to lowest, and grouped into quartiles of employment based on employment levels in the May, 2005 OES national survey data.56 To identify possible effects from services off-shoring, occupational employment growth and its components in the highest off-shoring quartile are compared with those in the lowest. Table 5-5 lists the industry sectors by quartile, and shows their annual rates of growth of services off-shoring over the period 1998 to 2004 and total employment from the May, 2005 OES survey. Quartile I covers the group of industries with the highest rates of services off-shoring, and quartile IV, the group with the lowest. While each quartile has a mix of manufacturing and service industry sectors, it appears that quartile I, with the highest rates of services off-shoring increases (median annual growth of 9 percent), also includes the greatest concentration of manufacturing industries (64 percent). Quartile IV, with the lowest growth in services off-shoring (median annual growth of –0.7 percent), contains a substantial number of service sector industries (47 percent). In particular, two high technology white collar services sectors that have been the focus of much of the off-shoring concern—sector 541OP, miscellaneous professional, scientific, and technical services, and the computer systems design services [5415] industry—are both in the fourth quartile. One possible explanation is that these service producing occupations are more likely outsourced and off-shored in other industries, where they are not the core occupations and primary profit centers.
55 The BLS OES does not contain data summarized by 3-digit SOC code. We constructed our own by (1) obtaining the 3-digit occupation codes and titles from the BLS web site ( http://www.bls.gov/soc/soc_majo.htm ), manually creating a 3-digit to 6-digit occupation code bridge table in Microsoft Excel, importing that table into the Microsoft Access database, and merging the 3-digit occupation code into each record. The 3-digit bridge table is part of the database available with other data files for this report on the NAPA web site. 56 The tables in the chapter were summarized from cross tabulations, with occupations as rows and industry sectors as columns, and which show (1) changes in total employment over the survey period; (2) employment change due to occupational structural changes; and (3) employment change due to sectoral growth. The complete crosstabs for 2-digit, 3-digit and 6-digit occupations are on the NAPA web site or by request.

104
Table 5-5 Input-Output Industry Sector Quartiles Ranked by Off-Shoring Growth Rates
(Quartiles based on OES May, 2005 Employment)
Off-Shoring Intensity Employment I-O Industry
Code Industry 1998 2004 Annual Growth
Rates Sector Cumulative Quartile
212 Mining, except oil and gas 1.0863 3.3898 35.341 210,610 210,610 I 315AL Apparel and leather and allied products 0.1788 0.4549 25.729 309,650 520,260 I 3364OT Other transportation equipment 0.1923 0.4348 21.010 666,160 1,186,420 I 532RL Rental and leasing services and lessors of intangible
assets 2.8272 6.0563 19.035 670,760 1,857,180 I 524 Insurance carriers and related activities 2.6744 5.2979 16.349 2,129,930 3,987,110 I 335 Electrical equipment, appliances, and components 0.9442 1.8060 15.213 439,240 4,426,350 I 323 Printing and related support activities 0.2436 0.4458 13.829 652,360 5,078,710 I 333 Machinery 0.7044 1.2482 12.867 1,150,930 6,229,640 I 531 Real estate 0.2958 0.5008 11.554 1,437,840 7,667,480 I 311FT Food and beverage and tobacco products 0.2647 0.4457 11.401 1,669,970 9,337,450 I 325 Chemical products 2.6236 4.0614 9.134 875,640 10,213,090 I 512 Motion picture and sound recording industries 0.9047 1.3917 8.970 386,890 10,599,980 I 331 Primary metals 0.2113 0.3230 8.816 467,510 11,067,490 I 322 Paper products 0.1445 0.2198 8.687 487,560 11,555,050 I 332 Fabricated metal products 0.4915 0.7464 8.642 1,511,940 13,066,990 I 111CA Farms 0.0738 0.1118 8.580 304,260 13,371,250 I 525 Funds, trusts, and other financial vehicles 1.5167 2.2778 8.364 88,510 13,459,760 I 721 Accommodation 0.6210 0.9256 8.172 1,789,430 15,249,190 I 334 Computer and electronic products 2.0505 3.0394 8.037 1,312,840 16,562,030 I 313TT Textile mills and textile product mills 0.1724 0.2543 7.914 397,280 16,959,310 I 42 Wholesale trade 3.5495 5.1908 7.706 5,736,020 22,695,330 I 61 Educational services 0.3310 0.4657 6.781 12,137,430 34,832,760 32,576,983 3361MV Motor vehicles, bodies and trailers, and parts 0.7904 1.0824 6.159 1,118,660 35,951,420 II 326 Plastics and rubber products 0.4614 0.6234 5.855 804,410 36,755,830 II 485 Transit and ground passenger transportation 0.1417 0.1903 5.715 406,390 37,162,220 II 523 Securities, commodity contracts, and investments 6.1929 8.1953 5.389 781,290 37,943,510 II 713 Amusements, gambling, and recreation industries 0.3143 0.4118 5.167 1,339,410 39,282,920 II 722 Food services and drinking places 0.1118 0.1454 5.021 9,053,140 48,336,060 II 521CI Federal Reserve banks, credit intermediation, and
related activities 1.2932 1.6798 4.983 2,863,610 51,199,670
II 339 Miscellaneous manufacturing 0.4968 0.6415 4.857 652,900 51,852,570 II 484 Truck transportation 0.8545 1.0935 4.661 1,387,340 53,239,910 II

105
Off-Shoring Intensity Employment I-O Industry
Code Industry 1998 2004 Annual Growth
Rates Sector Cumulative Quartile
GFG Federal general government 6.0018 7.6567 4.596 1,799,620 55,039,530 II 81 Other services, except government 0.1771 0.2201 4.039 3,811,120 58,850,650 II 511 Publishing industries (includes software) 1.2718 1.5739 3.960 906,090 59,756,740 II 337 Furniture and related products 0.1304 0.1602 3.806 567,950 60,324,690 II 562 Waste management and remediation services 0.2256 0.2771 3.806 335,420 60,660,110 II 482 Rail transportation 0.9250 1.1244 3.593 212,880 60,872,990 II 327 Nonmetallic mineral products 0.6291 0.7573 3.397 507,360 61,380,350 II 44RT Retail trade 0.3182 0.3793 3.202 15,369,460 76,749,810 65,153,965 321 Wood products 0.0856 0.1011 3.024 557,680 77,307,490 III 113FF Forestry, fishing, and related activities 0.1068 0.1247 2.789 65,050 77,372,540 III 493 Warehousing and storage 0.6616 0.7542 2.333 582,250 77,954,790 III 622HO Hospitals and nursing and residential care facilities 0.1263 0.1432 2.225 8,086,620 86,041,410 III 483 Water transportation 16.4544 18.6138 2.187 57,920 86,099,330 III 55 Management of companies and enterprises 0.3864 0.4366 2.167 1,739,370 87,838,700 III 621 Ambulatory health care services 0.1446 0.1607 1.865 5,064,620 92,903,320 III 624 Social assistance 0.1596 0.1750 1.608 2,082,680 94,986,000 III GSLG State and local general government 0.1397 0.1506 1.304 7,640,280 102,626,280 97,730,948 23 Construction 0.2108 0.2237 1.022 7,215,250 109,841,530 IV 481 Air transportation 17.3096 18.2131 0.870 507,660 110,349,190 IV 711AS Performing arts, spectator sports, museums, and
related activities 0.3861 0.4012 0.650 504,320 110,853,510 IV
5411 Legal services 0.2311 0.2397 0.623 1,164,070 112,017,580 IV 5415 Computer systems design and related services 2.8691 2.9173 0.280 1,181,910 113,199,490 IV 486 Pipeline transportation 0.3571 0.3597 0.122 37,750 113,237,240 IV 5412OP Miscellaneous professional, scientific and technical
services 1.3392 1.3423 0.039 4,582,060 117,819,300 IV 487OS Other transportation and support activities 1.3547 1.2979 -0.699 1,938,980 119,758,280 IV 561 Administrative and support services 0.6624 0.5723 -2.266 7,766,820 127,525,100 IV 213 Support activities for mining 2.0007 1.3775 -5.191 206,990 127,732,090 IV 211 Oil and gas extraction 1.3971 0.9377 -5.480 122,360 127,854,450 IV 514 Information and data processing services 2.4533 1.5747 -5.969 431,000 128,285,450 IV 324 Petroleum and coal products 0.3087 0.1716 -7.402 112,500 128,397,950 IV 513 Broadcasting and telecommunications 4.6488 2.5035 -7.691 1,357,540 129,755,490 IV 22 Utilities 0.1430 0.0613 -9.524 552,440 130,307,930 130,307,930
Source: BEA Input-Output Analysis accounts, BLS Occupational Employment Statistics, and Academy calculations.

106
Changes in Total Employment, November, 2002 to May, 2005, by Industry Sector and 2-Digit Occupation Table 5-6 compares the change in total employment and its occupational structure and sector growth components for 2-digit occupations between the November, 2002 and May, 2005 OES national surveys. The table is sorted by change in employment by occupation in the first quartile industry sectors, from greatest employment loss to greatest gain. The table also shows the change in employment by occupation and its components in fourth quartile industry sectors and their rankings based on overall change in employment. These data provide a direct comparison of employment gains and losses in industries experiencing the highest growth in services off-shoring with those industries experiencing the lowest growth. Table 5-6 suggests that at a high level of aggregation, services off-shoring does not appear to have had a significant impact on the overall change in employment over the 2002 to 2005 period. There is a high correlation between occupational structure changes, suggesting that off-shoring of services has had even less impact on changes in employment due to changing employment shares. The occupation group with the greatest loss of employment among both the most and the least rapidly off-shoring industries was management occupations. It was the only occupation to show a decline in employment in the industries in the fourth quartile. A substantial increase due to sector growth was not enough to overcome the decline associated with occupational structure. It appears that businesses were simplifying or flattening out their organizational structures during this time period. The occupation class with the second greatest loss of occupational share among rapidly off-shoring industries was production occupations. These occupations had the sixth largest gain in employment among the least rapidly off-shoring industries. Among sectors with the highest rates of growth of services off-shoring, the drop in the number employed was driven by sectoral decline. Architecture and engineering occupations showed increased employment in sectors with the highest and lowest rates of growth of services off-shoring. First quartile employment gains were driven by changes in occupational structure, while fourth quartile gains were associated with sectoral growth. Computer and mathematical science occupations, and business and financial operations occupations also showed increases in sectors with the highest and lowest rates of growth of services off-shoring. First quartile gains were driven by changes in occupational share, but fourth quartile gains were split among changing share and increased overall sector growth. The occupation group with the greatest increase in employment among the most rapidly off-shoring industries was education, training, and library occupations. Almost all of the change was

107
driven by sectoral growth. For the least rapidly growing off-shoring industries it had the third weakest record of growth in employment among those sectors showing increases.57 Sales and related occupations had the second greatest increase in employment among industries with the greatest increases in services off-shoring. However among industries with the lowest growth in off-shoring, employment growth was significantly weaker, second from the bottom of sectors with growing employment. In this quartile employment increases due to sectoral growth more than offset declines due to structural change. Job gains appeared to be the result of factors other than off-shoring. Five of the ten top-ranked occupational groups in industry sectors with the greatest growth in off-shoring were also in the top ten occupational groups in industries with the least growth in off-shoring. The correlation between the overall change in employment by occupation in the highest and lowest off-shoring quartiles was 0.2175. Between change in employment due to shifts in the occupational structure it was 0.7208, and due to sectoral growth it was 0.1378. This suggests that overall there is little relationship between occupation employment changes at the two digit level in high and low services off-shoring industries. If occupations in the high off-shoring industry sectors were affected differently from occupation in the low off-shoring industries, the correlation should have been negative. Finally, looking at just the changes related to sectoral growth, architecture and engineering occupations showed a negative change in employment related to sectoral growth component among sectors with the greatest rates of increase in the off-shoring of services and a relatively large increase in employment in sectors with the slowest rates of growth in services off-shoring. Similarly, the growth-related changes in employment in legal occupations was twenty-one times higher among sectors in the fourth quartile compared to sectors in the first, and five times higher for computer and mathematical science occupations. This may be one of the few positive indicators of an impact from services off-shoring from this analysis, but it does not show up in the total changes.
57 This may be due to the heavy concentration of jobs in the quartile with the highest services off-shoring growth in just three sectors, Educational Services (90.0 percent in 2005), Social Assistance (5.9 percent), and State and Local General Government (1.9 percent). None of these was in the fourth quartile of sectors.

108
Table 5-6 Change in Employment by Occupation for Highest and Lowest Off-Shoring Quartiles
Quartile I* Quartile 4** Change Resulting from Change Resulting from 2 Digit SOC Occupation
Rank Change in Employment
Occupational Structure
Sectoral Growth Rank
Change in Employmen
t Occupational Structure
Sectoral Growth
11- Management Occupations 1 -218,530 -269,831 51,301 1 -191,560 -271,477 79,917 51- Production Occupations 2 -51,860 26,599 -78,459 17 66,670 21,157 45,513 35- Food Preparation and Serving Related
Occupations 3 -45,700 -78,285 32,585 9 33,920 27,681 6,239
37- Building and Grounds Cleaning and Maintenance Occupations
4 -16,310 -64,560 48,250 20 153,060 48,703 104,357
47- Construction and Extraction Occupations
5 -16,200 -28,777 12,577 22 336,320 28,683 307,637
31- Healthcare Support Occupations 6 -2,260 -4,075 1,815 5 8,800 -2,486 11,286 45- Farming, Fishing, and Forestry
Occupations 7 -800 -2,615 1,815 6 9,980 9,124 856
33- Protective Service Occupations 8 2,400 -4,046 6,446 7 10,190 -33,266 43,456 23- Legal Occupations 9 4,300 3,232 1,068 11 44,510 21,625 22,885 21- Community and Social Services
Occupations 10 7,910 -2,687 10,597 2 2,230 1,801 429
29- Healthcare Practitioner and Technical Occupations
11 15,660 5,374 10,286 13 60,410 42,266 18,144
39- Personal Care and Service Occupations
12 16,060 6,176 9,884 8 23,070 26,862 -3,792
17- Architecture and Engineering Occupations
13 19,000 23,098 -4,098 18 106,870 48,408 58,462
53- Transportation and Material Moving Occupations
14 47,010 -6,153 53,163 12 50,220 -32,738 82,958
15- Computer and Mathematical Science Occupations
15 53,100 41,946 11,154 19 123,030 65,218 57,812
19- Life, Physical, and Social Science Occupations
16 56,120 52,810 3,310 15 60,940 42,720 18,220
49- Installation, Maintenance, and Repair Occupations
17 81,240 45,406 35,834 16 64,210 36,306 27,904
27- Arts, Design, Entertainment, Sports, and Media Occupations
18 89,820 85,160 4,660 10 41,010 21,327 19,683

109
Quartile I* Quartile 4** Change Resulting from Change Resulting from 2 Digit SOC Occupation
Rank Change in Employment
Occupational Structure
Sectoral Growth Rank
Change in Employmen
t Occupational Structure
Sectoral Growth
43- Office and Administrative Support Occupations
19 91,980 -61,447 153,427 14 60,460 -182,355 242,815
13- Business and Financial Operations Occupations
20 132,430 108,510 23,920 21 181,070 119,811 61,259
41- Sales and Related Occupations 21 195,480 109,247 86,233 3 3,920 -46,822 50,742 25- Education, Training, and Library
Occupations 22 302,650 14,917 287,733 4 8,380 7,452 928
Total Change in Employment 763,500 0 763,500 1,257,710 0 1,257,710 Correlation: Change in Employment 0.2175 Occupational Structure 0.7208 Sectoral Growth 0.1378
Source: Bureau of Labor Statistics, Occupational Employment Statistics, 2002, May 2005 Bureau of Economic Analysis, Annual Industry Input-Output Use Tables, 1998 to 2004 Academy calculations

110
Changes in Total Employment, November, 2002 to May, 2005, by Industry Sector and 3-Digit Occupation It may be that the high level of aggregation of occupations is disguising the impact from services off-shoring on changes in particular occupations, especially if these changes affect relatively small segments of the work force. Table 5-7 presents information similar to that in Table 5-6, but using a more detailed occupational breakout (92 occupations rather than 22). The results are substantially the same.
Top executives had the greatest loss of employment in sectors with both the fastest and the slowest rates of growth of services off-shoring (-129,820 jobs and -93,130 jobs respectively). Increases due to sectoral growth were insufficient to offset reductions due to occupational shifts, suggesting a general flattening in organizational structures. Several occupations showed sharp differences between high and low off-shoring quartiles.
• Construction trades workers lost 18,740 jobs in sectors with high rates of off-shoring, but gained 278,270 jobs in sectors with the lowest rates of services off-shoring.58 In the first quartile, the loss was largely due to changing occupational structure, but in the fourth quartile the gain was primarily driven by sector growth.
• Assemblers and fabricators lost 36,000 jobs in sectors with the greatest growth in services
off-shoring but gained 102,590 jobs in sectors with the slowest growth. Most of the change in both quartiles was associated with changes in occupational shares.
• Primary, secondary, and special education school teachers gained 144,030 jobs among
industries with high services off-shoring intensity, but only 5,750 jobs among industries with low services off-shoring rates. First quartile employment gains were driven by sector growth, despite a loss due to changing occupational share.
These differences may be the result of high concentration of the occupations in one or more industry groups that fell into particular quartiles, rather than off-shoring as such. Off-shoring would have a stronger explanatory power if the jobs were evenly distributed in first and fourth quartile industries and different pattern of growth were observed. Neither services nor production occupations appear to be at the top or the bottom of the rankings. This may reflect the broad mix of occupations in both service and manufacturing industries. Even with the additional disaggregation of jobs there does not appear to be substantial differences in employment change that could be plausibly attributed to off-shoring.
• Four of the ten occupations with the greatest employment losses industries in the first quartile were also among the ten occupations with the greatest employment losses in industries in the fourth quartile.
58 Construction workers are heavily concentrated in the Construction sector (82 percent), which is in the fourth quartile.

111
• The correlation between changes in employment in 3-digit occupations in industries with
the greatest growth and those with the least growth in services off-shoring of 0.2054.
• The correlation for employment changes due to changes in occupational structure (0.4110) and sectoral growth (0.1263) similarly suggest that services off-shoring was not a principal driver of employment changes during the 2002 to 2005 period.
Those service occupations that have been perceived to have been adversely affected by services off-shoring in recent years—engineers, computer specialists, business operations specialists, and financial specialists—were among the occupations with the greatest employment gains in those industry sectors with the highest rates of growth of services off-shoring. These high technology, white collar service sector occupations also experienced high employment growth in those industry sectors in the fourth quartile. For these occupations, employment gains were driven by changing occupational share—the occupations gained in importance. There do not appear to be large differences in employment gains in sectors with the most rapid and least rapid rates of growth of services off-shoring.
However, some engineering and architectural occupations experienced employment losses in the first quartile but gains in fourth quartile industries due to structural shifts. For drafters, engineering and mapping technicians, losses of 22,080 jobs in the first quartile were offset by 22,720 jobs gained in fourth quartile industries. For architects, surveyors and cartographers, a negligible 80 jobs lost in the first quartile were far offset by a gain of 15.040 jobs in low off-shoring sectors.
Looking at just the employment changes associated with growth, we find that:
• Jobs lost in sectors with the highest rates of growth in services off-shoring were predominantly production related, including 2,236 engineering and 1,979 drafters, engineering and mapping technician jobs. Job losses for 4th quartile sectors were in air transportation and transportation, tourism and lodging.
• Top executives and other management occupations showed increased employment
associated with growth, although not enough to outweigh the negative structural impact on their employment.
• Computer specialists, financial specialists, business operations specialists, and office and
administrative support workers all showed increased employment associated with industry growth in both first and fourth quartiles.
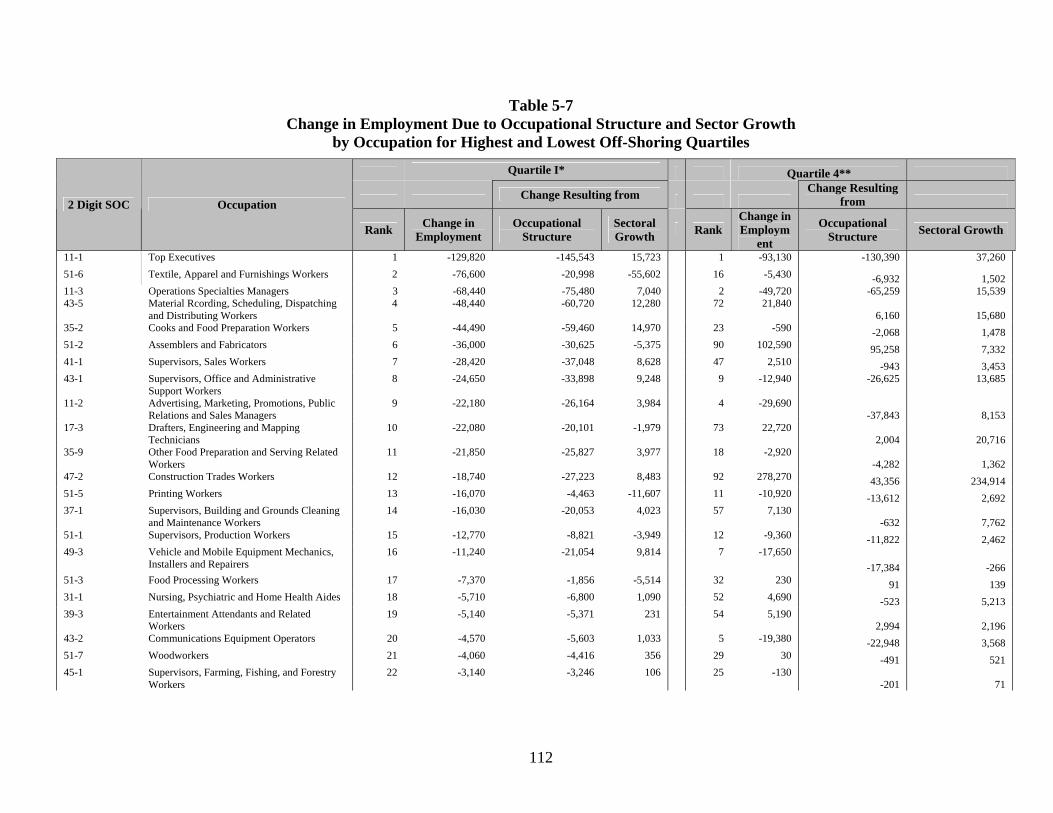
112
Table 5-7 Change in Employment Due to Occupational Structure and Sector Growth
by Occupation for Highest and Lowest Off-Shoring Quartiles
Quartile I* Quartile 4**
Change Resulting from Change Resulting
from 2 Digit SOC Occupation
Rank Change in Employment
Occupational Structure
Sectoral Growth Rank
Change in Employm
ent
Occupational Structure Sectoral Growth
11-1 Top Executives 1 -129,820 -145,543 15,723 1 -93,130 -130,390 37,260 51-6 Textile, Apparel and Furnishings Workers 2 -76,600 -20,998 -55,602 16 -5,430 -6,932 1,502 11-3 Operations Specialties Managers 3 -68,440 -75,480 7,040 2 -49,720 -65,259 15,539 43-5 Material Rcording, Scheduling, Dispatching
and Distributing Workers 4 -48,440 -60,720 12,280 72 21,840
6,160 15,680 35-2 Cooks and Food Preparation Workers 5 -44,490 -59,460 14,970 23 -590 -2,068 1,478 51-2 Assemblers and Fabricators 6 -36,000 -30,625 -5,375 90 102,590 95,258 7,332 41-1 Supervisors, Sales Workers 7 -28,420 -37,048 8,628 47 2,510 -943 3,453 43-1 Supervisors, Office and Administrative
Support Workers 8 -24,650 -33,898 9,248 9 -12,940 -26,625 13,685
11-2 Advertising, Marketing, Promotions, Public Relations and Sales Managers
9 -22,180 -26,164 3,984 4 -29,690 -37,843 8,153
17-3 Drafters, Engineering and Mapping Technicians
10 -22,080 -20,101 -1,979 73 22,720 2,004 20,716
35-9 Other Food Preparation and Serving Related Workers
11 -21,850 -25,827 3,977 18 -2,920 -4,282 1,362
47-2 Construction Trades Workers 12 -18,740 -27,223 8,483 92 278,270 43,356 234,914 51-5 Printing Workers 13 -16,070 -4,463 -11,607 11 -10,920 -13,612 2,692 37-1 Supervisors, Building and Grounds Cleaning
and Maintenance Workers 14 -16,030 -20,053 4,023 57 7,130
-632 7,762 51-1 Supervisors, Production Workers 15 -12,770 -8,821 -3,949 12 -9,360 -11,822 2,462 49-3 Vehicle and Mobile Equipment Mechanics,
Installers and Repairers 16 -11,240 -21,054 9,814 7 -17,650
-17,384 -266 51-3 Food Processing Workers 17 -7,370 -1,856 -5,514 32 230 91 139 31-1 Nursing, Psychiatric and Home Health Aides 18 -5,710 -6,800 1,090 52 4,690 -523 5,213 39-3 Entertainment Attendants and Related
Workers 19 -5,140 -5,371 231 54 5,190
2,994 2,196 43-2 Communications Equipment Operators 20 -4,570 -5,603 1,033 5 -19,380 -22,948 3,568 51-7 Woodworkers 21 -4,060 -4,416 356 29 30 -491 521 45-1 Supervisors, Farming, Fishing, and Forestry
Workers 22 -3,140 -3,246 106 25 -130
-201 71

113
Quartile I* Quartile 4**
Change Resulting from Change Resulting
from 2 Digit SOC Occupation
Rank Change in Employment
Occupational Structure
Sectoral Growth Rank
Change in Employm
ent
Occupational Structure Sectoral Growth
35-1 Supervisors, Food Preparation and Serving Workers
23 -2,720 -5,811 3,091 19 -1,980 -2,473 493
39-5 Personal Appearance Workers 24 -1,270 -1,496 226 26 -80 -210 130 47-1 Supervisors, Construction and Extraction
Workers 25 -1,240 -2,629 1,389 82 51,730 24,840 26,890
37-3 Grounds Maintenance Workers 26 -1,170 -6,484 5,314 88 88,620 56,472 32,148 19-2 Physical Scientists 27 -1,000 -1,097 97 66 12,600 6,428 6,172 47-4 Other Construction and Related Workers 28 -540 -659 119 58 8,140 3,337 4,803 33-9 Other Protective Service Workers 29 -280 -6,168 5,888 59 8,870 -33,075 41,945 33-2 Fire Fighting and Prevention Workers 30 -200 -231 31 38 1,090 706 384 39-6 Transportation, Tourism and Lodging
Attendants 31 -190 -1,564 1,374 51 4,050 13,111 -9,061
53-5 Water Transportation Workers 32 -120 -164 44 50 3,560 3,082 478 17-1 Architects, Surveyors and Cartographers 33 -80 -197 117 69 15,450 4,359 11,091 25-4 Librarians, Curators and Museum
Technicians 34 -20 -6,380 6,360 31 210 491 -281
39-4 Funeral Service Workers 35 0 0 0 28 0 0 0
33-1 First-Line Supervisors/Managers, Protective Service Workers
36 180 110 70 22 -730 -896 166
53-4 Rail Tranportation Workers 37 190 176 14 40 1,270 1,256 14 47-3 Helpers, Construction Trades 38 240 210 30 8 -16,860 -39,733 22,873 45-4 Forest, Conservation and Logging Workers 39 260 270 -10 24 -270 -314 44 21-2 Religious Workers 40 360 260 100 30 40 38 2 39-1 Supervisors, Personal Care and Service
Workers 41 370 -222 592 43 1,720 1,653 67
29-9 Other Healthcare Practitioners and Technical Occupations
42 870 703 167 27 -50 -65 15
37-2 Building Cleaning and Pest Control Workers 43 890 -38,022 38,912 83 57,310 -7,137 64,447 23-1 Lawyers, Judges and Related Workers 44 1,150 505 645 70 16,650 2,122 14,528 31-2 Occupational and Physical Therapists
Assistants and Aides 45 1,320 1,268 52 39 1,140 1,114 26
39-2 Animal Care and Service Workers 46 1,530 1,478 52 46 2,260 71 2,189 11-9 Other Management Occupations 47 1,910 -22,643 24,553 6 -19,020 -37,985 18,965 45-2 Agricultural Workers 48 2,080 361 1,719 64 10,380 9,639 741 31-9 Other Healthcare Support Occupations 49 2,130 1,457 673 49 2,970 -3,077 6,047

114
Quartile I* Quartile 4**
Change Resulting from Change Resulting
from 2 Digit SOC Occupation
Rank Change in Employment
Occupational Structure
Sectoral Growth Rank
Change in Employm
ent
Occupational Structure Sectoral Growth
15-2 Mathematical Science Occupations 50 2,430 1,981 449 21 -790 -2,606 1,816 33-3 Law Enforcement Workers 51 2,700 2,243 457 37 960 -1 961 51-8 Plant and System Operators 52 3,050 2,910 140 60 9,210 7,904 1,306 53-7 Material Moving Workers 53 3,140 -10,311 13,451 81 40,700 -24,728 65,428 23-2 Legal Support Workers 54 3,150 2,727 423 76 27,860 19,503 8,357 53-2 Air Transportation Workers 55 3,170 3,043 127 36 950 7,109 -6,159 43-6 Secretaries and Administrative Assistants 56 3,690 -36,829 40,519 15 -6,160 -68,941 62,781 29-2 Heath Technologists and Technicians 57 3,740 1,758 1,982 77 29,910 21,432 8,478 47-5 Extraction Workers 58 4,080 1,525 2,555 68 15,040 -3,117 18,157 49-2 Electrical and Electronic Equipment
Mechanics, Installers and Repairers 59 6,040 2,750 3,290 71 17,520 14,186 3,334
27-4 Media and Communication Equipment Workers
60 6,160 6,257 -97 20 -1,420 -4,513 3,093
51-4 Metal Workers and Plastic Workers 61 6,980 -15,382 22,362 13 -7,270 -15,804 8,534 21-1 Counselors, Social Workers and Other
Community and Social Service Specialists 62 7,550 -2,947 10,497 45 2,190 1,763 427
41-2 Retail Sales Workers 63 8,960 -10,187 19,147 14 -6,230 -12,745 6,515 53-3 Motor Vehicle Operators 64 9,370 -26,796 36,166 33 330 -20,949 21,279 29-1 Health Diagnosing and Treating Practitioners 65 11,050 2,912 8,138 78 30,550 20,899 9,651 53-6 Other Transportation Workers 66 11,800 10,957 843 44 1,970 1,829 141 49-1 Supervisors of Installation, Maintenance and
Repair Workers 67 11,920 8,894 3,026 56 6,850 4,833 2,017
25-3 Other Teachers and Instructors 68 12,420 6,388 6,032 34 340 85 255
19-4 Life, Physical and Social Science Technicians 69 13,900 13,602 298 65 11,500 6,746 4,754 19-1 Life Scientists 70 14,880 14,289 591 62 9,740 7,187 2,553 27-3 Media and Communication Workers 71 15,070 13,691 1,379 74 24,250 19,124 5,126 27-1 Art and Design Workers 72 17,680 17,664 16 67 13,040 2,372 10,668 41-9 Other Sales and Related Workers 73 19,130 7,538 11,592 61 9,520 -11,011 20,531 43-3 Financial Clerks 74 19,230 -580 19,810 86 80,430 35,614 44,816 53-1 Supervisors, Transportation and Material
Moving Workers 75 19,460 16,942 2,518 42 1,440 -336 1,776
39-9 Other Personal Care and Service Workers 76 20,760 13,350 7,410 63 9,930 9,241 689 35-3 Food and Beverage Serving Workers 77 23,360 12,813 10,547 80 39,410 36,505 2,905 43-9 Other Office and Administrative Support
Workers 78 23,560 -16,692 40,252 3 -35,540 -99,770 64,230
19-3 Social Scientists and Related Workers 79 28,340 26,016 2,324 75 27,100 22,359 4,741

115
Quartile I* Quartile 4**
Change Resulting from Change Resulting
from 2 Digit SOC Occupation
Rank Change in Employment
Occupational Structure
Sectoral Growth Rank
Change in Employm
ent
Occupational Structure Sectoral Growth
41-3 Sales Representatives, Services 80 33,540 26,039 7,501 17 -4,700 -14,633 9,933 17-2 Engineers 81 41,160 43,396 -2,236 85 68,700 42,045 26,655 15-1 Computer Specialists 82 50,670 39,965 10,705 91 123,820 67,824 55,996 25-9 Other Education, Training and Library
Occupations 83 50,690 -2,407 53,097 41 1,320 904 416
27-2 Entertainers and Performers, Sports and Related Workers
84 50,910 47,548 3,362 53 5,140 4,343 797
13-2 Financial Specialists 85 65,210 54,503 10,707 87 83,880 52,767 31,113 13-1 Business Operations Specialists 86 67,220 54,007 13,213 89 97,190 67,044 30,146 49-9 Other Installers, Maintenance and Repair
Occupations 87 74,520 54,816 19,704 84 57,490 34,671 22,819
51-9 Other Production Occupations 88 90,980 110,250 -19,270 10 -12,410 -33,433 21,023 25-1 Postsecondary Teachers 89 95,530 50,221 45,309 35 760 743 17 43-4 Information and Record Clerks 90 123,160 92,874 30,286 79 32,210 -5,845 38,055 25-2 Primary, Secondary and Special Education
School Teachers 91 144,030 -32,906 176,936 55 5,750 5,229 521
41-4 Sales Representatives, Wholesale and Manufacturing
92 162,270 122,905 39,365 48 2,820 -7,489 10,309
Total Change in Employment 763,500 0 763,500 1,257,710 0 1,257,710
Correlation: Change in Employment 0.2054 Occupational Structure 0.4110 Sectoral Growth 0.1263 * Sectors with Greatest Growth in Services Off-shoring, 1998 to 2004 ** Sectors with Slowest Growth in Services Off-shoring, 1998 to 2004
Source: Bureau of Labor Statistics, Occupational Employment Statistics, 2002, May 2005 Bureau of Economic Analysis, Annual Industry Input-Output Use Tables, 1998 to 2004 Academy calculations

116
CONCLUSIONS AND DATA RECOMMENDATIONS The analysis in this chapter could not identify clear differences changing occupational structures due to off-shoring. Undoubtedly part of the problem is the comparatively brief three year survey period, much of which was dominated by economic forces related to recovery from a recession. Many factors could account for employment changes over this period, including structural/technological changes in the economy, mergers and acquisitions of firms, qualitative changes in the response of firms to economic recession and recovery, and a flattening of the occupational structure due to better control and coordination. While services off-shoring may be one such factor, its importance relative to these and other influences did not emerge from this analysis. For the 65 I-O industry sectors, these analyses did not reveal any significant impact on changes in occupational shares based on differences in the rates of growth in services off-shoring intensities over this period. We have pushed the published data hard, and it appears that the BEA industry-based off-shoring data is too aggregated and the BLS data cover too short a period to identify the extent of off-shoring within industries. The results suggest a need to look more closely at the performance of individual firms, rather than highly aggregated industry totals. At the micro-level, it may be possible to identify firms within the same industry that import services (or do not import them) and their associated occupational employment patterns. These results reinforce the Panel’s view that detailed analyses of micro-level data are needed to produce more definitive findings on the employment effects of services outsourcing or off-shoring due to business restructuring. Interest and concerns about services off-shoring will most likely continue and may grow, particularly if aggregate labor market conditions deteriorate in the future. Improvements in publicly available industry level data could enhance understanding of future changes in services off-shoring and its broad economic effects. The above analysis has demonstrated that a comprehensive assessment of the effects of services off-shoring requires linking BLS employment and occupational data with BEA trade data. However, this industry analysis also showed that aggregation at the industry level may hide critical underlying differences in occupational structures, net employment levels, and other economic changes for individual firms within those industries. While the statistical agencies should continue to make publicly available the finest detail consistent with confidentiality of respondents and quality of the data, an assessment of the employment and other economic effects of firm decisions to off-shore services will ultimately require analysis of confidential, micro-level data. As chapter 7 describes in greater detail, the statistical agencies collect data on business enterprises at different organizational levels, for different purposes and at different time intervals. But, a critical first step in facilitating linking of specific micro-level data sets between individual agencies is to ensure that there are consistent identifiers of business entities at various organizational levels. Therefore,
• The Panel recommends that BEA, BLS and Census should work together to develop and maintain a consistent set of identifiers for each level of organization within every consolidated business entity in the United States.

117
This would include shared location data for various entities and consistent methodology for assigning industrial classifications to them.
In addition, the industry-level analysis in this chapter required the aggregation of publicly available 6-digit SOC data to 3-digit levels. There undoubtedly were quality issues due to missing data to prevent disclosure. BLS should be able to provide higher quality data from its complete surveys. Thus,
The Panel recommends that BLS should provide OES data at a 3-digit level on its website, and addition to the 2- and 6- digit SOC levels already provided.

118

119
CHAPTER 6
IDENTIFYING SERVICES OFF-SHORING USING MICRO-LEVEL DATA INTRODUCTION This chapter presents analyses of BEA micro-level (firm) cross-border trade in services and foreign direct investment data to determine whether they can identify the extent and impacts of services off-shoring. Analyses include off-shoring from both business restructuring and global expansion. Results from business restructuring off-shoring are contrasted with estimates of outsourcing. Although BEA surveys for unaffiliated services imports include both MNCs and other firms, most analyses in this chapter focus on MNCs only. Analyses also concentrate primarily on the four industries selected for intensive examination—pharmaceutical and medicine manufacturing [3254], architectural, engineering and related services [5413], computer systems design and related services [5415], and business support services [5614].
The first two sections of this chapter present research approaches and datasets used, describe the role of MNCs in the global economy, and briefly detail the methodology for developing indicators of services off-shoring and outsourcing given available data. The final two sections outline data limitations and assumptions of the micro-level analysis and present estimates of services off-shoring and outsourcing. Appendix E provides a more detailed explanation of the data adjustments and statistical procedures followed to estimate services off-shoring using available data, and includes more detailed data supporting the summary tables and charts presented in the text. Despite data limitations and other necessary caveats, results of the micro-level data analyses for potential services off-shoring due to business restructuring suggest the following: first, there is little evidence of widespread services off-shoring by U.S. MNCs for the industries examined, but outsourcing of services appears much more prevalent. Second, there does not appear to be significant growth in services off-shoring during the period 1999–2003, but this result must be taken cautiously given the limited time period covered. Third, there is variation in the level of outsourcing and off-shoring for MNCs, but this cannot be generalized to the universe of MNCs due to the small sample sizes in these industries. Fourth, most MNC off-shoring from parent business restructuring appears to involve goods rather than services. Finally, those MNCs off-shoring services appear to perform better than other MNCs in the same industry based on their total sales, net income, total sales per employee and other financial measures. The comparison of the growth in affiliate sales, employment, and net income relative to their parents over this period indicates that affiliate performance exceeded parents. However, for three of the four industries studied, the preponderance of foreign affiliate sales tended to be in different industries than the parent’s principal industry. Moreover, most foreign affiliate sales occurred in the foreign markets where they are located. These results support the view that growth in foreign affiliate sales–an indicator of potential services off-shoring due to global expansion—may also reflect more complex objectives, such as greater diversification and access to previously restricted foreign markets.

120
RESEARCH APPROACH AND DATA SOURCES Our review of off-shoring studies found little consensus about either the extent and impact of services off-shoring or the methodologies and data used to develop those estimates. For example, not only did estimates of U.S. job losses from services off-shoring vary widely, they also relied on a variety of methodologies, including analyses of announced layoffs, interviews and surveys of company officials, and other proprietary methods.59 None of these studies employed micro-level data from either BEA or BLS. The few that used micro-level data were private research group studies using proprietary data from their own surveys and non-transparent methodologies that were not easy to evaluate or replicate. Most previous studies relied on industry-level data. Chapters 3 and 4 presented industry-level analysis of BEA I-O data and BLS OES data to determine whether reasonable and reliable estimates of services outsourcing and off-shoring could be derived. This chapter employs a similar analysis for services off-shoring and outsourcing using BEA micro-level data for MNCs.60 In its first report, the Panel concluded that a comprehensive review of off-shoring needed additional research using micro-level data for two reasons. First, since services off-shoring decisions reflect strategic business choices made at the firm level, micro-level data could best distinguish between firms that had decided to off-shore services and those that had not. Second, micro-level data could avoid aggregation issues that arise using industry-level data, since not all firms within the industry choose to off-shore services. This additional micro-level research would have to focus on a few key industries, given resource and time constraints. This chapter focuses on two objectives:
1. develop estimates of the extent of off-shoring in four selected industries and to the extent feasible, estimate off-shoring’s key economic effects, and
2. determine the adequacy of currently available micro-level data in estimating the scope
and scale of off-shoring activity and its key economic effects. The four industries selected for examination were chosen because of their size and overall economic impact; their potential vulnerability to off-shoring; their diversity in both industry type and occupational mix; and their level of integration into the economy, producing potential spillover effects on other sectors. Chapter 4 provided detailed information on the occupational distribution of these four industries. The Role of MNCs
59 See Off-shoring: An Elusive Phenomenon; A Report by a Panel of the National Academy of Public Administration, January 2006. 60 Disclosure rules under the International Investment and Trade Services Act precludes the presentation of certain micro-level data which may impinge confidentiality.

121
A “U.S. MNC parent company” comprises the U.S. (domestic) operations of a MNC and is engaged in foreign direct investment with at least one affiliate located outside the U.S. A “U.S. foreign affiliate” is a firm located outside the U.S. in which a U.S. MNC parent has a direct investment interest. BEA defines a “majority owned foreign affiliate” (MOFA) as a foreign affiliate with a combined ownership of all U.S. MNC parents exceeding 50 percent.61 U.S. MNCs contribute substantially to overall U.S. economic activity. In 2003, the operations of U.S. MNC parents accounted for one-half of U.S. profits and one-fourth of U.S. gross domestic product. In that year, U.S. MNC operations accounted for roughly one-fifth of U.S. employment.62 MNCs also play a significant role in U.S. international trade. They accounted for an estimated 57 percent of U.S. goods exports and 37 percent of U.S. goods imports for 2003.63 MNCs also account for an even larger share of services imports that are considered most vulnerable to off-shoring—other private services, especially business, professional and technical (BPT) services. In 2004, almost 70 percent of the estimated $40.7 billion of imported BPT services,—$28.2 billion—were affiliated imports. These affiliated services imports reflect transactions between a MNC and its foreign affiliates.64 MNCs have continued to account for a substantial amount of U.S economic activity even though the number of parent MNCs has declined 7.4 percent from 3872 in 1999 to 358765 in 2003. Table 6-1 shows MNC employment in key industry sectors, including the four industries selected for this micro-level examination. While MNC employment appears to be more heavily concentrated in manufacturing rather than services industries, MNC employment still accounts for between 7.5 and 14.5 percent of total U.S. employment in the three examined services industries. The detailed industry comparisons contained in Table 6-1 can also reflect differences in the business organizational levels used by BLS and BEA to report their separate employment numbers. BEA employment MNC data are at a firm-level, while the BLS data are at an establishment level. MNCs are often large, complex firms with multiple establishments. BEA’s industry classification for MNCs reflects the preponderance of the firm’s sales in a particular industry. BLS uses the same approach for classifying establishments by industry. But a multi-establishment firm, e.g. a MNC classified as a pharmaceutical and medicine manufacturing firm, may have some establishments that sell pharmaceutical products (and are classified as pharmaceutical and medicine manufacturing establishments), but others that produce R&D services (and are therefore classified as R&D services establishments). These organizational
61 Ray Mataloni, “A Guide to BEA Statistics on U.S. Multinational Companies,” (Washington: Bureau of Economic Analysis- from March 1995 Survey of Current Business), p. 2. 62 J. Steven Landefeld and Raymond Mataloni, “Offshore Outsourcing and Multinational Companies,” (Washington: Bureau of Economic Analysis- power point presentation presented at the Brookings Institution, 2004), p. 19. 63 R. Mataloni, “U.S. Multinational Companies: Operations in 2003”, SCB July 2005 p. 13. 64 E. Nephew, J. Koncz, M. Borga and M. Mann, “U.S. International Services: Cross0-border Trade in 2004 and Sales through Affiliates in 2003. SCB October 2005, Table 1 p. 46. 65 This number includes those MNC parents exempt from reporting all but a few items on the benchmark survey because of the small size of their foreign operations. The data published by BEA exclude these parent companies from their number counts. In 2003, the BEA tabulation of MNC parents is 2,384 rather than 3,587. There are differences between MNC parent and foreign affiliate number counts in tables throughout this chapter and BEA tabulations found in BEA reports for the same reason.

122
differences for industry classifications make detailed industry comparisons between the BEA and BLS employment data difficult.66
Table 6-1
Employment for Select 4 Digit Service Industries (Employment in 000's)
U.S. Economy (1) MNC Parents (2)
Totals Totals Percent US TotalIndustry NAICS code 2002 2003 2004 2002 2003 2002 2003
Total 130341 129999 131480 22117.6 21701.1 17.0% 16.7%
Manufacturing 15259 14510 14329 8357.9 8152.9 54.8% 56.2% Pharmaceuticals 3254 294.9 291.5 287.6 378.2 384.1 128.2% 131.8%
Services 107784 108182 109596 12979.1 12890.3 12.0% 11.9%
Professional,Technical & Scientific 541 6643 6621.1 6673.2 962.8 946.4 14.5% 14.3% Architectural, Engineering, Related 5413 1242.4 1225.6 1237.7 92.9 92.4 7.5% 7.5% Computer Systems Design 5415 1119.2 1106 1129.6 372.6 356.7 33.3% 32.3%
Administrative Support Services 561 7450.8 7375.1 7533 986.4 977.1 13.2% 13.2% Business Support Services 5614 753.3 742.3 753.6 126.9 128.6 16.8% 17.3%
(1) BLS OES data (2) BEA MNC data Data Sources Data for this analysis came from two datasets collected and maintained by BEA: “financial and operating” data of MNCs, and “international transactions” data. The majority of the economic indicators used came from the MNC financial and operating data that included data for both MNC parents and their majority owned foreign affiliates. The principal exception was MNC parent unaffiliated services imports; these data were extracted from the international transactions dataset. The analysis focused primarily on MNCs; other domestic U.S. firms that may be importing services from unaffiliated foreign persons were not examined.
BEA Financial and Operating Data for MNCs BEA designs and conducts mandatory surveys to collect financial and operating data on MNCs. These data are collected annually with a benchmark survey conducted every five years. The micro-data are made available a year and seven months following the close of the year covered by the data.67 Financial and operating data cover U.S. MNC parent companies, their foreign
66 These differences also imposed significant challenges in matching micro-level data between the two agencies, as will be reported more fully in the third report. 67 The BEA faces some practical constraints that make accelerating the release of their data difficult: (1) their survey reports are not due until 5 months following the reference year; (2) there are a significant number of delinquent reports; and (3) many reporting companies file forms that contain missing and/or questionable data, which often requires time consuming follow-up with companies.

123
affiliates, and affiliates of foreign MNCs residing in the U.S.68 Financial and operating data include:
• balance sheets and income statements • sales by type (e.g. goods and services) • destination of sales by foreign affiliates • value added • employment • employee compensation • external financing • capital expenditure • research and development • reconciliations of changes in property, plant and equipment • income taxes, and • affiliated and unaffiliated trade (with the exception of unaffiliated trade in services).
International Transactions in Private Services Data
BEA international transactions in private services data cover U.S. residents’ transactions with unaffiliated foreign residents. U.S. residents include both MNCs and non-MNCs. A U.S. international transaction is one made between a U.S. resident and a non-resident, or “foreigner,” that is, a cross-border transaction between a U.S. company located in the U.S. and a foreign entity. In accordance with international standards, BEA considers U.S. foreign affiliates to be residents of the countries where they are located. Sales abroad by U.S. foreign affiliates are regarded as transactions between foreigners and not considered to be U.S. international transactions.69 Thus, transactions of U.S. MNC parents are covered by the international transactions in private services data, but transactions between their affiliates are not. Reporting for international transactions in private services surveys is mandatory and the confidentiality of the data for reporting companies is protected under the International Investment and Trade in Services Survey Act.70 The BEA collects most of its international transaction data through the Annual and Benchmark Survey of Selected Services Transactions with Unaffiliated Foreign Persons, which primarily cover business, professional and technical services.71 BEA also conducts 8 specialized surveys for this dataset:
• Quarterly Survey of Transactions Between U.S. and Unaffiliated Foreign Persons in Selected Services and in Intangible Assets;
• Quarterly Survey of Foreign Airline Operators’ Revenues and Expenses in the United
States; 68 Data on U.S. affiliates of foreign MNC parents are not included in the analysis in this report, but will be covered in the third report. 69 “U.S. International Transactions in Private Services: A Guide to the Surveys Conducted by the Bureau of Economic Analysis,” (Washington: Bureau of Economic Analysis, 1998), p. 9. 70 “U.S. International Transactions in Private Services,” p. 1. 71 “U.S. International Transactions in Private Services,” p. 11.

124
• Foreign Ocean Carriers’ Expenses in the United States;
• Ocean Freight Revenues and Foreign Expenses of United States Carriers;
• U.S. Airline Operators’ Foreign Revenues and Expenses;
• Quarterly Survey of Insurance Transactions by U.S. Insurance Companies with Foreign Persons;
• Benchmark Survey of Financial Services Transactions Between U.S. Financial Services
Providers and Unaffiliated Foreign Persons; and
• Quarterly Survey of Financial Services Transactions Between U.S. Financial Services Providers and Unaffiliated Foreign Persons.
ESTIMATING SERVICES OFF-SHORING DUE TO BUSINESS RESTRUCTURING This analysis used BEA MNC and unaffiliated trade in services data to identify firms that have outsourced or off-shored some of their service functions due to business restructuring during the 1999 to 2003 time period. MNCs were divided into two sub-groups: the first group—group I—represents those MNCs with the preponderance of their sales in one of the selected industries—pharmaceutical and medicine manufacturing [3254], architectural, engineering and related services [5413], computer systems design and related services [5415], and business support services [5614]; and the second group—group II—is a diverse set of MNCs classified in a range of other industries but with some sales in one of these four industries. Thus, a company may be classified as part of NAICS industry 3361 because its primary line of business is motor vehicle manufacturing, but if it also sells business support services because it operates a call center or debt collection center, it would be included as a non-concentrated MNC (group II) for business support services [5614]. Since these ancillary activities—the call center or debt collection center—could be vulnerable to outsourcing or even off-shoring, a structural change to off-shore this ancillary activity should ultimately generate a services import to the parent, even though the parent company may have all of their vehicle production plants within the United States. This analysis distinguishes the varying levels of services outsourcing and off-shoring activity between these group I and group II MNC parents. Table 6-A1 in Appendix E shows the number of MNC parents in groups I and II for the four industries examined. Although sample sizes for most of the sub-groups of industries are small, they are large enough to avoid most confidentiality issues that restrict disclosure of specific data.

125
Development of Key Measures
Total Purchased Inputs Total purchased inputs are a key variable for analyzing potential outsourcing and off-shoring activity for MNC parents. BEA does not directly obtain this information through its MNC surveys but instead derives it from other survey data. BEA and Academy staff use a similar methodology to derive total purchased inputs—taking the difference between each MNC parent’s annually reported total sales and value added.
Outsourcing Intensity Indicator To assess the extent of outsourcing and any changes in outsourcing activity over this period, an indirect indicator of outsourcing was developed. This “outsourcing intensity” indicator is the ratio of total purchased inputs to total sales. When a MNC parent increases its use of purchased inputs relative to its total sales (our proxy for total output), this “outsourcing intensity” ratio will increase to reflect that increase in outsourcing. MNC parents with higher outsourcing intensity ratios utilize purchased inputs more extensively in their production processes than those with lower outsourcing intensity ratios. A MNC parent with an increasing outsourcing indicator can mean either that the MNC parent has substituted greater amounts of purchased inputs for its own employees or capital in its production processes; or that the MNC parent may have changed its product mix toward a good or service that relies more heavily on purchased inputs. Because this study focuses on off-shoring of services rather than manufactured goods, we would have preferred to distinguish between services and goods outsourcing. However, BEA financial and operating data for MNCs currently do not allow separate estimates of purchased services inputs. This data gap not only precluded estimates of services outsourcing among MNCs but also affected the indicator for services off-shoring.72
Off-Shoring and Services Off-shoring Intensity Indicators Two indirect indicators of off-shoring were derived: “off-shoring intensity,” calculated as the ratio of total imports to total purchased inputs; and “services off-shoring intensity,” calculated as the ratio of total service imports to total purchased inputs.73 A significant number of MNC parents in groups I and II for each of the four industries did not have any goods and/or services imports; for these MNC parents, the off-shoring and/or services off-shoring intensity indicator was zero.
72 The feasibility of modifying BEA surveys to collect these data depends to a large extent on the ability of business accounting systems to supply that level of detail. See Chapter 7 for more discussion of the practical difficulties of collecting these data. 73 Academy staff would have preferred to use a more precise indicator—the ratio of intermediate services imports to purchased services inputs, but BEA data do not distinguish among end uses of imports and did not allow a separate estimate of purchased services inputs.

126
The “total imports” component in the “off-shoring intensity” indicator included total affiliated and unaffiliated goods imports, and affiliated service imports for groups I and II for all years. Unaffiliated services imports were included for group I MNC parents for years 2001 to 2003. SIC codes rather than NAICS codes were used for unaffiliated services importers prior to 2001. The “total services imports” component of the “services off-shoring intensity” indicator was constructed in the same way as the “total imports” component. Data Limitations There are six substantive data limitations that affect this micro-level analysis (see Chapter 7 for an in-depth description of these limitations).
MNC Services Imports Do Not Distinguish Imports for Intermediate Use Services imports used to estimate the services off-shoring intensity indicator included all imports and not simply those used by the MNC parent in its internal production processes. While this failure to distinguish between intermediate and final demand use may not be as significant for services as it is for goods, this data limitation overstated the services off-shoring intensity indicator. While many imported services, for example architectural, engineering and related services [5413] or most computer design and related services [5415], are likely to be included within the MNC parent’s own production processes, some may also meet customer needs directly. Although the direction of this limitation is known—the off-shoring intensity indicator is overstated—its extent and significance is not.
MNC Value Added Not Separated For Goods and Services BEA surveys do not collect data on a MNC parent’s purchased inputs directly. Instead, purchased inputs are estimated as the difference between a MNC parent’s total sales and value added. Current BEA surveys do distinguish sales of services from total sales, but they do not collect separate information to distinguish between goods and services for the individual components of value added. Consequently, purchased services inputs could not be distinguished from all purchased inputs and a separate services outsourcing indicator could not be developed. This data limitation also means that the services off-shoring intensity indicator is approximated as the ratio of imported services relative to total purchased inputs rather than total purchased services inputs. Because total purchased inputs (goods and services) most likely exceed purchased services inputs alone, the resulting services off-shoring indicator will be distorted downward.74
74 The distortion is downward since the denominator of the intensity ratio is overstated when total purchased inputs exceed purchased services inputs. However, many economists have used a services off-shoring indicator that is the ratio of imported intermediate services divided by total inputs (or total output). This ratio is the product of the services off-shoring intensity indicator (imported services/total purchased inputs) and the outsourcing intensity indicator (total purchased inputs/total sales) where total sales is the proxy for total output=total input.

127
MNC Annual Surveys Exclude Inventory Estimates
BEA collects data on MNC parent inventories in their benchmark surveys every five years, but data are not collected on annual surveys. Lack of data on the annual change in inventories for MNC parents affects the accuracy of the derived estimates of purchased inputs used by BEA. Because a MNC parent’s total output in any year includes not only its total sales but also any change in its inventory, sales may not be a good proxy for total output when large inventory changes occur. In a few cases, this approximation for purchased inputs resulted in negative values when value added exceeded sales in a particular year (e.g. when inventories increased significantly). Total purchased inputs identify outsourcing, total off-shoring and services off-shoring intensity among MNC parents. Negative values for total purchased inputs distort these indicators by producing nonsensical negative values. This data gap distorts the estimates of purchased inputs used to develop our outsourcing and off-shoring indicators. The direction of the distortion for an individual MNC parent in any particular year is unclear, since inventory changes can be either positive (inventories are increasing) or negative (inventories are decreasing).
Limited Time Series for MNC Micro-Data Analysis Micro-level analyses using MNC parent data examined a limited 1999 to 2003 time period. Data prior to 1999 use the SIC system for categorizing industries. Developing a detailed crosswalk between the NAICS and SIC was outside the scope of this study. Complete micro-level MNC parent data for 2004 were unavailable as of September 2006. The effect of this truncated time period of analysis is to limit the ability to discern any significant trends in outsourcing, total off-shoring and services off-shoring.
MNC Data Include Estimated Rather Than Reported Data for Some Variables in Some Years
BEA financial and operating data come from various surveys which MNCs are required to complete on a quarterly or annual basis. In some instances, firms may leave some survey items unanswered. In those cases, BEA staff usually impute a value for that particular item based on prior actuals and other criteria. The data base assigns different document type codes to distinguish estimates from actual reported data. No attempt was made to determine what proportion of the values for the MNCs analyzed were reported versus estimated since BEA staff indicated that MNC parent data were usually complete; imputed values were more likely to occur in the data for foreign affiliates. Analytic Approach Outsourcing, total off-shoring and services off-shoring intensity indicators were estimated for each MNC with concentrated (group I) or non-concentrated (group II) sales in one of the four selected industries between 1999 and 2003. Group averages for each of these measures, displayed in Table 6-A1 of Appendix E, were compared statistically using difference of means

128
tests to identify the statistical significance of any observed differences (Table 6-2). In addition to examining differences in the levels of outsourcing and off-shoring, analyses also focused on changes in these levels over time (Table 6-3). The key issue was whether there were any significant growth trends in any of these indicators. Analysis of these indicators also identified two distinct groups of MNC parents—those that were off-shoring services and those that were not for both concentrated (group I) and non-concentrated (group II) firms in all four industries. These two groups were analyzed to determine whether the off-shoring MNC parents differed significantly from non-off-shoring MNC parents in the same industry group by descriptive characteristics or financial performance measures (Table 6-A4 of Appendix E). KEY FINDINGS Levels of Outsourcing and Off-shoring
The comparison of outsourcing, off-shoring and services off-shoring indicators for the MNC parents in the four industries reviewed showed that services off-shoring was quite small relative to outsourcing for all groups during the 1999 to 2003 period. Chart 6-1 illustrates the differences between average levels of outsourcing, off-shoring, and services off-shoring during this period for these MNC parents.75 The highest average level of outsourcing (pharmaceutical and medicine manufacturing [3254], 57 percent) was almost 16 times larger than the highest average level of services off-shoring (architectural, engineering and related services [5614], 4 percent). Table 6-A1 of Appendix E compares the outsourcing, total off-shoring and services off-shoring indicators for MNC parents in each of the four industries (groups I and II) for the 1999 to 2003 period. It shows that in 2003, services off-shoring ranged from an average of .005 for MNC parents in business support services [5614] (group II), to a high of .052 for those in architectural, engineering and related services [5413] (group I). The median was .014. By contrast, outsourcing was much higher and ranged from an average of .427 for MNC parents in the business support services [5614] industry (group I) to a high of .657 for those in pharmaceutical and medicine manufacturing [3254] (group II). The difference between the services off-shoring intensity indicator and the outsourcing intensity indicator at the high end is over twelve-fold. This general pattern remained the same throughout the 1999 to 2003 period.
75 This is an industry average for each measures over four years (1999 – 2003).

129
Chart 6-1 Average Outsourcing Total Off-Shoring and Services Off-Shoring for MNCs in
Selected Industries (1999 to 2003)
0%
10%
20%
30%
40%
50%
60%
Perc
ent o
f Inp
uts
Pharmaceutical & MedicineManufacturing
Architectural & EngineeringServices
Computer System DesignServices
Business Support Services
Source: Bureau of Economic Analysis
Average Outsourcing Average Total Off-Shoring Average Services Offshoring
One explanation for the relatively small levels of services off-shoring is that only a limited number of MNC parents imported services during the period. Chart 6-2 below shows that with the exception of MNC parents76 in pharmaceutical and medicine manufacturing [3254] and business support services [5614] in 2002 and 2003, the proportion of MNC parents importing services was less than 25 percent in each group. Data also indicate that for the universe of MNCs in the BEA database, the percent importing services over this period stayed fairly constant at approximately 16 percent.77
76 The very small sample size for the business support services [5614] means that even an increase in one MNC importing services in a given year can increase the percent of MNC service importers by 10 percent. 77 This number includes those MNC parents exempt from reporting all but a few items on the benchmark survey because of the small size of their foreign operations. The data published by BEA exclude these parent companies from their official number counts.

130
Chart 6-2
MNCs Importing Services (1999 to 2003)
0
5
10
15
20
25
30
35
40
45
50
1999 2000 2001 2002 2003
Source: Bureau of Economic Analysis
Perc
ent o
f MN
Cs
All MNCs Pharmaceutical and Medicine ManufacturungArchitectural & Engineering Services Computer Systems Design ServicesBusiness Support Services
Despite the limitations in the outsourcing, off-shoring and services off-shoring indicators used, the potential biases created, and other caveats:
The Panel finds that the level of services off-shoring due to business restructuring among MNC parents in the industries reviewed has been small during the 1999 to 2003 period. The Panel finds that outsourcing and total off-shoring have been substantially larger than services off-shoring for the MNC parents examined during the 1999 to 2003 period.
The small levels of services off-shoring due to business restructuring is also consistent with the results from the industry-level analyses presented in Chapter 3. The Panel recognized that the inability to develop a separate services outsourcing indicator due to data gaps and other data issues may have understated the services off-shoring indicator and resulting estimates. But the potential underestimate of services off-shoring imposed by these data limitations did not appear sufficient to account for the size of the differences that were

131
found consistently among all four industries, including the two MNC sub-groups. The corroboration of these micro-level results by the industry-level analyses only strengthened that belief. Variance Among Industries Table 6A-1 in Appendix E provides detailed data indicating the extent of differences in both the outsourcing and services off-shoring indicators for MNC parents in groups I and II from 1999 to 2003. In 2003, the services off-shoring indicator average for group I MNC parents in architectural, engineering and related services was .052. This was four times as large as that for the MNC parents in business support services (.012), twice as large as that for computer systems design (.022), and significantly larger than pharmaceutical and medicine manufacturing (.037). For group II MNC parents, the services off-shoring indicator average in 2003 for those in architectural, engineering and related services (.014) and in pharmaceutical and medicine manufacturing (.015) was almost the same. But those services off-shoring indicators were much larger than for those in either business support service or computer systems design and related services (.005 and .010, respectively). A similar pattern exists for each of the other years during the period. MNC parents in pharmaceutical and medicine manufacturing [3254] (3 out of 5 years) and architectural, engineering and related services [5413] (2 out of 5 years) consistently had the higher levels of services off-shoring. MNC parents in business support services [5614] have the lowest levels of services off-shoring among the four industries examined. Table 6-2 below shows the differences in the five-year average servicing off-shoring and outsourcing indicators for MNC parents in each of the four industries (group I) from 1999 to 2003. Reading across each row in the table, the data indicate that services off-shoring among MNC parents in business support services [5614] was consistently and significantly78 smaller than that for parents in each of the other three industries. For MNC parents in architectural, engineering and related services [5413], services off-shoring tended to be higher than for parents in the other three industries, but the difference with parents in pharmaceutical and medicine manufacturing [3254] was not significant. The data in Table 6-2 also show significantly higher outsourcing for MNC parents in pharmaceutical and medicine manufacturing [3254] relative to MNC parents in the other industries and significantly lower outsourcing for MNC parents in business support services [5614] relative to parents in the other industries.
78Difference-of-means tests were used to determine whether the differences in these averages for each group were statistically significant.

132
Table 6-2: Differences in Average Services Off-Shoring and Outsourcing for Group I MNC Parents
Differences in Average Services Off-shoring
Industry 3254 5413 5415 5614
3254 - -.010 .007 .017 ** 5413 .010 - .017 ** .027 ** 5415 -.007 -.017 ** - .009 ** 5614 -.017 ** -.027 ** -.009 -
Differences in Average Outsourcing
Industry 3254 5413 5415 5614
3254 - -.028 ** .062 ** .115 ** 5413 -.028 ** - .034 .086 ** 5415 -.062 ** -.034 ** - .052 ** 5614 -.115 ** -.086 ** -.052 ** -
** Statistically significant at the 5 percent significance level.
While these data indicate that services off-shoring did vary among MNC parents in the four industries reviewed, these results can be affected by the small sample sizes analyzed in some cases. Even an un-weighted group average can be impacted by one or two individual firms accounting for a disproportionate share of imported services within a small group of MNCs. With that caveat in mind,
The Panel finds that the extent of outsourcing and services off-shoring varies substantially among the MNC parents in the four industries examined over the 1999 to 2003 time period.
Again, this finding is consistent with results from the industry-level analysis contained in Chapter 3, where outsourcing and off-shoring measures varied considerably. These substantial differences in the extent of services off-shoring among industries suggest that it is difficult to develop national conclusions about the extent of services off-shoring from a limited set of industries. This variation among industries may also help explain the range of results found in the previous off-shoring studies reviewed in the first report. Trends in Services Off-Shoring Charts 6-3 to 6-6 show the average annual rates of total off-shoring and services off-shoring for MNC parents in the four industries examined from 1999 to 2003. These charts do not indicate

133
any consistent growth in services off-shoring for MNC parents in these industries. While the average growth in services off-shoring appeared to increase gradually over the five-year period for MNC parents in architectural, engineering and related services [5413] and business support services [5614], these apparent increases started from very small levels.79 In computer systems design and related services [5415], growth remained relatively flat, while services off-shoring in pharmaceutical and medicine manufacturing [3254] fluctuated, peaking at 4 percent in 2001. During this period, average services off-shoring rates remained below 5 percent of purchased inputs, and in most instances well below 5 percent, for MNC parents in the four industries. The only exception was for MNC parents in architectural, engineering and related services [5413] in 2003, when their average services off-shoring rate was 5.2 percent of total purchased inputs.
Chart 6-3 Average total and Services Off-Shoring Rates for MNC Parents in
Pharmaceuticals and Medicine Manufacturing [3254] (1999 to 2003)
0%
2%
4%
6%
8%
10%
12%
14%
16%
18%
20%
1999 2000 2001 2002 2003
Source: Bureau of Economic Analysis
Perc
ent o
f Inp
uts
Average Total Offshoring Average Services Offshoring
79 From Table 6A-1 in Appendix E, the average services off-shoring rates in 1999 were about 2.3 percent of purchased inputs for parents in architectural, engineering and related services [5413] and less than one-quarter of one percent for parents in business support services [5614].

134
Chart 6-4 Average Total and Services Off-Shoring Rates for MNC Parents in
Architectural and Engineering and Related Services [5413] (1999 to-2003)
0%
2%
4%
6%
8%
10%
12%
14%
16%
18%
20%
1999 2000 2001 2002 2003
Source: Bureau of Economic Analysis
Perc
ent o
f Inp
uts
Average Total Offshoring Average Services Offshoring
Chart 6-5 Average Total and Services Off-Shoring Rates for MNC Parents in
Computer Systems Design and Related Services [5415] (1999 to 2003)
0%
2%
4%
6%
8%
10%
12%
14%
16%
18%
20%
1999 2000 2001 2002 2003
Source: Bureau of Economic Analysis
Perc
ent o
f Inp
uts
Average Total Offshoring Average Services Offshoring

135
Chart 6-6 Average Total and Services Off-Shoring Rates for MNC Parents in
Business Support Services [5614] (1999 to 2003)
0%
2%
4%
6%
8%
10%
12%
14%
16%
18%
20%
1999 2000 2001 2002 2003
Source: Bureau of Economic Analysis
Perc
ent o
f Inp
uts
Average Total Offshoring Average Services Offshoring
The truncated 1999 to 2003 time period and the limited sample sizes for the sub- groups of MNC parents for the four industries make it difficult to discern growth trends. More importantly, the limited time period and sample sizes raise concerns about the susceptibility of these group averages to small sample effects. To determine whether any statistically significant trends exist, semi-log regressions were run for pooled cross-section and time series data for MNC parents in groups I and II for each industry that were either “services off-shorers” or “non- services off-shorers.” The data for average outsourcing among MNC parents were also run and those results are shown in Table 6-3. For four of the eight MNC parent groups tested, the coefficients for services off-shoring were negative, but none were statistically significant. Only the MNC parents in the pharmaceutical and medicine manufacturing [3254] industry showed any statistically significant average annual growth (about 22 percent) in their level of service off- shoring from 1999 to 2003.80
80 The semi-log regressions were done using ‘year’ as the independent variable and the semi-logs of the intensity indicators, outsourcing and services off-shoring, as the dependent variables. The regression coefficients for the independent variable represents the annual percentage change for the particular indicator.

136
Table 6-3
Outsourcing and Services Off-Shoring Estimated Proportional Changes Services Off-Shoring Outsourcing
MNC Group Group I Group II Group I Group II Pharmaceutical and Medicine Manufacturing [3254]
• Services Off-Shoring MNCs 0.222 ** -0.033 0.163 0.139 • Other MNCs - - -0.136 0.043
Architectural, Engineering and Related Services [5413] • Services Off-Shoring MNCs 0.101 0.190 -0.265 0.141 • Other MNCs - - -0.027 0.004
Computer Systems Design and Related Services [5415] • Services Off-Shoring MNCs -0.036 -0.140 -0.063 0.019 • Other MNCs - - -0.017 -0.047
Business Support Services [5614] • Services Off-Shoring MNCs 0.205 -0.037 0.080 0.164 • Other MNCs - - 0.031 0.100
** Statistically significant at the 5 percent significance level. This same result was obtained for outsourcing: the signs on the coefficients were both positive and negative; the sizes of the coefficients varied; and none of the coefficients were statistically significant.81 Consequently,
The Panel finds little evidence of consistent growth in services off-shoring from business restructuring among MNC parents in the industries examined over the 1999 to 2003 period.
This finding is also consistent with the industry-level results reported in Chapter 3. Differences Between Services Off-Shoring MNCs and Non-Services Off-Shoring MNCs Charts 6-7 to 6-982 show that MNC parents that off-shored services from 1999 to 2003 tended to be larger, and accounted for more sales, value added, employment and net income than other parents in the three industries that could be presented. Each bar in Charts 6-7 through 6-9 shows the percent of each variable accounted for by MNC parents in a specific industry that off-shored services in 2003, with the remainder accounted for by the other MNC parents in that same industry. The data reveal a number of differences between MNC parents off-shoring services and those that do not in the same industry. First, services off-shoring MNC parents were a minority of the MNCs in each industry for the five-year period. Second, MNC parents off-shoring services were a majority of the large MNC parents83 concentrated in the pharmaceutical and medicine 81 A more detailed table with regression results for other variables such as employment and sales can be found in the Appendix E, Table 6A-3. 82 Confidentiality issues precluded presenting results for MNC parents concentrated in business support services [5614]. 83 Size is based on total employment, with large MNCs having more than 1000 employees.

137
manufacturing [3254] industry and a disproportionate share of those concentrated in architectural, engineering and other related services [5413] and computer systems design and related services [5415]. Services off-shoring parents also accounted for a disproportionate share84 of the key financial indicators shown in Charts 6-7 through 6-9—total sales, value added, total employment and net income. One exception was net income for services off-shoring MNC parents concentrated in architectural, engineering and related services [5413]. Table 6A-4 in Appendix E contains detailed data on the shares of various descriptive and financial measures accounted for by services off-shoring MNC parents relative to the rest of the MNC parents in their sub-group and industry. These measures include number of MNC parents; size characteristics (as measured by employment); and a number of financial or economic variables including: total sales, value-added (a measure of gross output less intermediate inputs), employment, employee compensation, average employee compensation, total sales per employee, total imports, net income, and capital expenditure (property, plant and equipment spending).
Chart 6-7 Differences Between Services Off-Shoring and Non- Services Off-Shoring MNCs in
Selected Financial Variables
0%
10%
20%
30%
40%
50%
60%
70%
80%
90%
100%
number MNCs large MNCs total sales value added employment net income
Perc
ent
all MNCsservice off-shorers
84 Disproportionate share is relative to the proportion of MNCs in the industry that services off-shoring parents account for.

138
Chart 6-8 Architectural, Engineering and Related Services [5413] (2003)
-20%
0%
20%
40%
60%
80%
100%
number MNCs large MNCs total sales value added employment net income
Perc
ent
all MNCsservice off-shorers
Chart 6-9
Computer Systems Design and Related Services [5415] (2003)
0%
10%
20%
30%
40%
50%
60%
70%
80%
90%
100%
number MNCs large MNCs total sales value added employment net income
Perc
ent
all MNCsservice off-shorers

139
Table 6A-4 in Appendix E shows that the services off-shoring MNC parents also had consistently higher sales per employee and average compensation rates than non-services off-shoring MNC parents from 1999 to 2003. While sales per employee for off-shoring MNCs concentrated in pharmaceutical and medicine manufacturing [3254] averaged between one and three percent higher than the overall group average over this period, this difference was even greater in the services industries examined. The greatest differences in sales per employee occurred among MNC parents concentrated in architectural, engineering and related services [5413] where sales per employee for services off-shoring MNC parents ranged between 39 and 77 percent above the total group average.85 These observed differences in the shares of various financial indicators accounted for by those MNC parents off-shoring services were found statistically significant for all industries and sub-groups except parents concentrated in the business support services [5614] industry (group I).86 While these results suggest that services off-shoring MNC parents may be doing better than MNC parents not off-shoring services, no attempt was made to establish a causal link between services off-shoring and performance in these financial variables. More sophisticated analytical techniques are needed to determine whether such a relationship exists.
The Panel finds that those MNC parents off-shoring services from 1999 to 2003 appear to be larger, account for disproportionate amounts of total sales and net income, and have higher sales per employee than non-services off-shoring MNC parents in the same sub-groups and industries.
Analyses of Services Off-Shoring from Global Expansion This section describes efforts to identify the extent of services off-shoring due to global expansion rather than business restructuring. As discussed in Chapter 2, this form of services off-shoring is limited to MNCs but is more complex and difficult to identify. BEA financial and operating data for MNCs also include information on foreign affiliates of U.S. MNC parents. Differences between MNC parent and foreign affiliate growth rates in total sales and sales of services were analyzed to determine whether MNC parents in the four examined industries were shifting and expanding production activities, particularly service production, to their foreign affiliates. Differences in growth rates for other key economic indicators were also examined to assess the economic performance of parents relative to their foreign affiliates between 1999 and
85 The data in Table 6A-4 in Appendix E show the percent of a sub-group total accounted for by services off-shoring MNC parents. If sales per employee for these services off-shoring MNC parents exceed the overall sub-group average, their percentage share will be greater than 100 percent. The amount in excess of 100 percent indicates how much larger the services off-shoring MNC parents’ sales per employee average is relative to the average for all MNC parents in that sub-group. 86 Table 6A-5 in Appendix E contains the results of these difference-of-means statistical tests. It should be noted however that because of the small samples of MNC parents, the differences may be due to the wide dispersion of the data across MNCs. Thus, these results may not be representative of the performance of all services off-shoring MNC parents.
140
2003.87 Analyses of the distribution of foreign affiliate sales by industry indicated whether the preponderance of affiliate sales were in the same industries as the parents. Similarly, analyses of the market destination of foreign affiliate sales indicated which markets and customers were being served by affiliate production. MNC parent export data were also examined to determine whether affiliate production activity affected parent export growth. Data Sources and Their Limitations
Comparative Growth Rates for MNC Parents and their Foreign Affiliates This comparative analysis of parent and foreign affiliate financial indicators focused on seven financial indicators from BEA financial and operating data—total sales, value added, employment, employee compensation, average employee compensation, sales per employee, and net income. Academy staff estimated growth rates for each indicator over the 1999 to 2003 period for both MNC parents with sales concentrated in one of the four industries examined (group I) and their foreign affiliates. To minimize potential confidentiality issues, the results of these growth rate comparisons are presented at aggregate group I levels for each industry. Although the period of analysis was shorter than desired, consistent growth rates were developed over the five-year period for both MNC parents and their foreign affiliates. These aggregate financial data however provide little information on some critical distributional differences that might exist between MNC parents and their foreign affiliates. For example, although these data identify aggregate changes in employment for MNC parents and foreign affiliates over this period, they do not identify differences in employment levels for specific occupations and therefore cannot determine which types of occupations had the greatest employment growth. Nor do they distinguish between the percentage of employment in high- or low-skill occupations in foreign affiliates relative to parents in their specific services or manufacturing industries. The employee compensation data can provide information on differences in average compensation between MNC parents and their foreign affiliates, but they do not indicate whether these reflect lower wages for the same occupations or different occupational mixes. Comparison of these MNC parent and foreign affiliate financial indicator growth rates can identify the extent of differences but cannot determine the reason for them. Thus, differences in the growth of parent and foreign affiliate net income cannot identify whether these differences reflect accounting policies (e.g. transfer pricing issues) or real economic difference, nor can the reasons for any real economic difference be identified without additional data. Differences in growth rates between the MNC parent and its foreign affiliate(s) in the variables that are generated by nominal dollar values such as sales and employee compensation can also be due to inflation and exchange rate differences between the U.S. and the host countries.
87 The entry and exit of foreign affiliates from year to year in the four industries examined may affect the results in the analysis of services off-shoring from global expansion. Some of the results may be due to changes in the composition of the foreign affiliate panel rather than changes in foreign affiliate behavior.

141
Distribution of Affiliate Sales BEA surveys collect financial and operating data on foreign affiliates at disaggregated levels that distinguish between type of industry, market destination—sales to local market of foreign affiliates, to U.S. market, or to other foreign markets—and customers served—sales to U.S. parent, other foreign affiliates of U.S. parent, or unaffiliated customers. These total sales data are further disaggregated into sales of services for the same set of sales destinations and customers. Academy staff analyzed these data for foreign affiliates with parents in the four industries to measure the amount of sales going to local and foreign markets versus the amount of sales to the United States. These data can measure the extent to which foreign affiliates are serving local and other foreign markets rather than meeting U.S domestic needs. They can also measure the proportion of foreign affiliate sales remaining within the MNC entity either as sales to their parents or to other foreign affiliates of the parent. Foreign affiliate sales to U.S. MNC parents and sales to other U.S persons represent U.S. affiliated and unaffiliated imports, respectively. Although we can measure the growth of foreign affiliate sales to local and foreign markets, these data alone cannot tell us the extent to which foreign affiliate sales are substituting for MNC parent exports. Linking parent export data by market destination with these foreign affiliate sales data may provide some indication of the degree of substitution for current exports, but cannot measure forgone export growth opportunities and the potential impact on U.S. employment. In addition, these data alone cannot distinguish among various reasons for growth in foreign affiliate sales to local or foreign markets. For example, they cannot determine whether growth is due to:
• MNC parents shifting services or manufacturing activities from the U.S. to their foreign affiliates—global expansion off-shoring;
• MNC parents choosing to serve new, previously untapped, local (host country) or foreign
markets via their foreign affiliates; or
• a response to an increase in local or foreign market demand for those areas currently served by foreign affiliate production.
Additional data and analyses are needed to distinguish among these potential reasons for differential growth in foreign affiliate relative to parent sales.
Distribution of MNC Parent Exports MNC parent export data provide information on the distribution of MNC parent exports between affiliated and unaffiliated recipients. Changes in the composition of total parent exports from 2001 to 2003—between exports to their foreign affiliates and exports to foreign unaffiliated persons—were examined for MNC parents in the four industries to identify the effect of foreign affiliate growth on MNC parent exports. These data however cannot measure U.S. job creation resulting from increased MNC parent affiliate exports. Nor can they measure the extent of

142
forgone exports to unaffiliated foreign persons due to foreign affiliate sales to local and other foreign markets. Key Findings and Conclusions from Foreign Affiliate Data Analysis
Industry Classifications of Foreign Affiliates BEA generally classifies MNC parents and their foreign affiliates according to the industry with the preponderance of the entity’s sales. The analysis of MNC parents in this report distinguished between parents whose sales were concentrated (group I) in one of the four industries selected for review and those parents with only some sales in these industries (group II). The comparative analysis for parents and their foreign affiliates included only group I parents to identify differences in industry categories for foreign affiliates relative to parents. If foreign affiliates have a different industry classification than their parents, then the preponderance of their sales are in another industry. This result would suggest that one goal of strategic business decisions to expand globally and off-shore services is to diversify into other product lines. Charts 6-10 to 6-13 show the primary industry classifications for foreign affiliates relative to their group I parents based on affiliates sales in 2003.88
Chart 6-10 NAICS Classifications for Foreign Affiliates with MNC Parents in Pharmaceuticals and
Medicine Manufacturing [3254] (2003)
Pharmaceutical and Medicine Manufacturing (3254)
33%
Drugs and Druggists' Sundries Wholesalers (4222)
31%
Other Miscellaneous Manufacturing (3399)
9%
Holding Compaines, Except Bank Holding Companies
(5512)7%
Miscellaneous 20%
88 The classification numbers are a combination of 1997 and 2002 NAICS codes with the exception of 5329 and 5512 which are classifications described in BEA’s “Guide to Industry and Foreign Trade Classifications for International Surveys.”

143
Chart 6-11 NAICS Classifications for Foreign Affiliates with MNC Parents in
Architectural, Engineering and Related Services [5413] (2003)
Architectural, Engineering, and Related Services (5413)
47%
Other Professional, Scientific, and Technical Services
(5419)14%
Miscellaneous12%
Building, Developing, and General Contracting (2330)
15%
Heavy Construction (2340)12%
Chart 6-12
NAICS Classifications for Foreign Affiliates with MNC Parents in Computer Systems Design and Related Services [5415] (2003)
Professional and Commercial Equipment and Supplies
Wholesalers (4214)20%
Miscellaneous15%
Computer Systems Design and Related Services (5415)
65%

144
Chart 6-13 NAICS Classifications for Foreign Affiliates with MNC Parents in
Business Support Services [5614] (2003)
Business Support Services (5614)27%
Professional and Commercial Equipment and Supplies
Wholesalers (4214)43%
Other Rental and Leasing Services (5329)
7%
Telecommunications (5133)6%
Miscellaneous17%
Source for Charts 6-10 to 6-13: Bureau of Economic Analysis. Key Findings:
• Chart 6-10 for foreign affiliates of group I MNC parents concentrated in the pharmaceutical and medicine manufacturing industry [3254] shows that only 33 percent of these affiliates had the majority of their sales in the parent industry in 2003. The remaining were classified in drugs and druggists’ sundries wholesalers (31 percent), other miscellaneous manufacturing (9 percent), holding companies, except bank holding companies (7 percent) and 20 percent were into the miscellaneous category.
• Chart 6-11 for foreign affiliates of group I MNC parents concentrated in architectural,
engineering and related services [5413] shows that only 47 percent of these affiliates were concentrated in their parent’s industry in 2003. The majority were distributed among , building, developing, and general contracting (15 percent), heavy construction (12 percent), other professional, scientific, and technical services (14 percent), and 12 percent fell into the miscellaneous category.
• Chart 6-12 for foreign affiliates of group I MNC parents concentrated in computer system
design and related services [5415] shows that the vast majority of these affiliates—65 percent—were concentrated in the parent industry in 2003. Of the remainder, 20 percent

145
were in professional and commercial equipment and supplies wholesalers, and 15 percent were in the miscellaneous category.
• Chart 6-13 for foreign affiliates of group I MNC parents concentrated in business support
services [5614] shows that only 27 percent of these affiliates were in business support services [5614]. The majority are classified in professional and commercial equipment and supplies wholesalers (47 percent), other rental and leasing services (7 percent), telecommunications (6 percent), and miscellaneous (17 percent).
Conclusion: Although each group of foreign affiliates in 2003 had a portion of foreign affiliates in the same industry as their parents, each group also had a large portion of foreign affiliates with the preponderance of sales in a variety of other industries. The only group with the majority of affiliates in the same industry as the parents was computer system design and related services [5415].
Growth of Foreign Affiliates vs. Growth of MNC Parents Chart 6-14 shows the number of MNC parents and their foreign affiliates concentrated in the four selected industries from 1999 to 2003. Charts 6-15 to 6-21 compare the growth rates of MNC parents to their foreign affiliates for seven economic indicators. While the number of MNC parents declined over this period in each industry (except in business support services [5614]) the number of foreign affiliates for these MNC parents increased (except in computer systems design and related services [5415]). Charts 6-15 to 6-21 however indicate a more erratic pattern in MNC parent and foreign affiliate growth rates for the seven economic indicators.

146
Chart 6-14 Growth in the Number of MNC Parents and Their Foreign Affiliates (1999 to 2003)
Number of MNC Parents
3254 5413 5415 5614 1999 46 48 104 11 2000 44 45 100 10 2001 43 44 98 10 2002 43 43 98 10 2003 42 44 91 11
Percent Change from 1999 to 2003* -8.7 % -8.3 % -12.5 % 0.0 % t
Number of Their Foreign Affiliates 3254 5413 5415 5614
1999 1285 387 954 55 2000 1328 380 953 160 2001 1352 378 932 159 2002 1333 415 951 160 2003 1362 426 841 166
Percent Change from 1999 to 2003* 6.0 % 10.1 % -11.8 % 201.8 %
* Percent Change from 1999 to 2003 is calculated as: (total variable value for 2003-total variable value for 1999)/total variable value for 1999.
Chart 6-15 Percentage Change of MNC Parent and Foreign Affiliate Sales (1999 to 2003)
-20%
-10%
0%
10%
20%
30%
40%
50%
60%
70%
3254 5413 5415 5614
MNC ParentsForeign Affiliates

147
Chart 6-16 Percentage Change of Average Sales per Employee for MNC Parents and
Their Foreign Affiliates (1999 to 2003)
-40%
-30%
-20%
-10%
0%
10%
20%
30%
40%
50%
3254 5413 5415 5614
MNC ParentsForeign Affiliates
Chart 6-17
Percentage Change of Value added for MNC Parents and Their Foreign Affiliates (1999 to 2003)
-10%
0%
10%
20%
30%
40%
50%
3254 5413 5415 5614
MNC ParentsForeign Affiliates

148
Chart 6-18 Percentage Change of MNC Parent and Foreign Affiliate Employment
(1999 to 2003)
-20%
-10%
0%
10%
20%
30%
40%
3254 5413 5415 5614
MNC ParentsForeign Affiliates
Chart 6-19
Percentage Change of Employee Compensation for MNC Parents and Their Foreign Affiliates (1999 to 2003)
-15%
-10%
-5%
0%
5%
10%
15%
20%
25%
30%
35%
3254 5413 5415 5614
MNC ParentsForeign Affiliates

149
Chart 6-20 Percentage Change of Average Employee compensation for MNC Parents and Their
Foreign Affiliates (1999 to 2003)
-20%
-15%
-10%
-5%
0%
5%
10%
15%
20%
25%
3254 5413 5415 5614
MNC ParentsForeign Affiliates
Chart 6-21 Percentage Change of Net Income for MNC Parents and Their Foreign Affiliates
(1999 to 2003)
-200%
-100%
0%
100%
200%
300%
400%
500%
600%
700%
800%
900%
3254 5413 5415 5614
MNC ParentsForeign Affiliates
Source for Charts 6-15 to 6-21: Bureau of Economic Analysis.

150
Key Findings: • Foreign affiliate sales (Chart 6-15) increased from 1999 to 2003 except in architectural,
engineering and related services [5413] where sales declined almost 13 percent over the period.89 In contrast, MNC parent sales increased only for those concentrated in pharmaceutical and medicine manufacturing [3254] and architectural, engineering and related services [5413]. Sales for MNC parents concentrated in computer system design and related services [5415], and business support services [5614] declined 6.8 percent and 12.2 percent, respectively. The growth in parent sales over this period exceeded that for their foreign affiliates only for architectural, engineering, and other services [5413]. For the other three industries, sales growth for foreign affiliates exceeded the growth for their parents.
• Average sales per employee (Chart 6-16) increased for foreign affiliates with parents
concentrated in the four industries with the exception of those in architectural, engineering and related services [5413], and increased for MNC parents with the exception of those concentrated in business support services [5614]. Comparative growth rates between parents and foreign affiliates were the same as for total sales. For pharmaceutical and medicine manufacturing [3254] and architectural, engineering and related services [5413] industries, parent growth exceeded foreign affiliate growth; for the other two industries, foreign affiliate growth exceeded parent growth.
• Value added (Chart 6-17) for foreign affiliates grew faster than their parents in the four
industries examined over this period. Value added decreased for MNC parents in computer system design and related services [5415] and business support services [5614].
• Employment (Chart 6-18) increased for foreign affiliates, except for business support
services [5614] between 1999 and 2003. For MNC parents, however, employment increased only for pharmaceutical and medicine manufacturing [3254]. Parent employment growth exceeded foreign affiliate growth in this industry as well.
• Employee compensation (Chart 6-19) increased for MNC parents and foreign affiliates
during the period except in business support services [5614]. MNC parents average employee compensation (Chart 6-20) increased in the four industries, but declined for foreign affiliates in architectural, engineering and related services [5413] and computer system design and related services [5415]. Over the period average employee compensation increased faster for MNC parents than for their foreign affiliates, although the difference was negligible for business support services [5614].
• Net income (Chart 6-21) increased from 1999 to 2003 for foreign affiliates with parents in
the four industries and for MNC parents in pharmaceutical and medicine manufacturing [3254] and architectural, engineering and related services [5413]. For MNC parents in computer system design and related services [5415], and business support services [5614] net
89 The number of foreign affiliates for these architectural, engineering and other related services [5413] industry parents also declined 12 percent over the period.
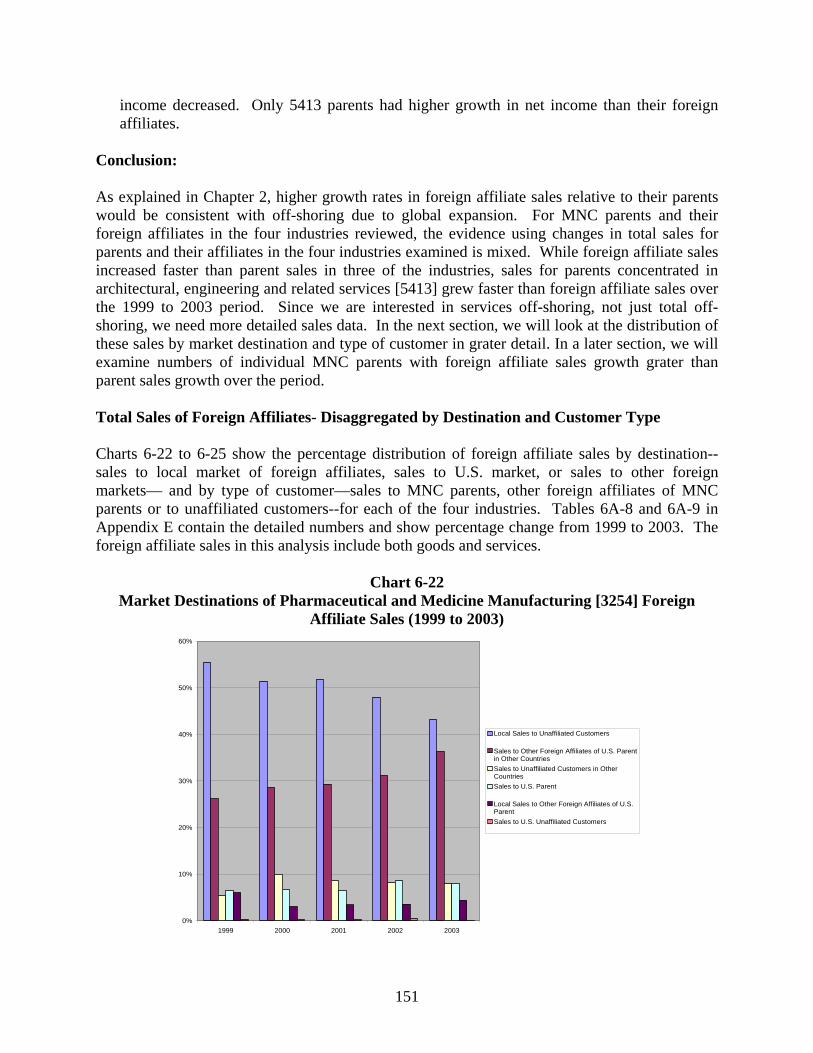
151
income decreased. Only 5413 parents had higher growth in net income than their foreign affiliates.
Conclusion: As explained in Chapter 2, higher growth rates in foreign affiliate sales relative to their parents would be consistent with off-shoring due to global expansion. For MNC parents and their foreign affiliates in the four industries reviewed, the evidence using changes in total sales for parents and their affiliates in the four industries examined is mixed. While foreign affiliate sales increased faster than parent sales in three of the industries, sales for parents concentrated in architectural, engineering and related services [5413] grew faster than foreign affiliate sales over the 1999 to 2003 period. Since we are interested in services off-shoring, not just total off-shoring, we need more detailed sales data. In the next section, we will look at the distribution of these sales by market destination and type of customer in grater detail. In a later section, we will examine numbers of individual MNC parents with foreign affiliate sales growth grater than parent sales growth over the period. Total Sales of Foreign Affiliates- Disaggregated by Destination and Customer Type Charts 6-22 to 6-25 show the percentage distribution of foreign affiliate sales by destination--sales to local market of foreign affiliates, sales to U.S. market, or sales to other foreign markets— and by type of customer—sales to MNC parents, other foreign affiliates of MNC parents or to unaffiliated customers--for each of the four industries. Tables 6A-8 and 6A-9 in Appendix E contain the detailed numbers and show percentage change from 1999 to 2003. The foreign affiliate sales in this analysis include both goods and services.
Chart 6-22 Market Destinations of Pharmaceutical and Medicine Manufacturing [3254] Foreign
Affiliate Sales (1999 to 2003)
0%
10%
20%
30%
40%
50%
60%
1999 2000 2001 2002 2003
Local Sales to Unaffiliated Customers
Sales to Other Foreign Affiliates of U.S. Parentin Other Countries Sales to Unaffiliated Customers in OtherCountries Sales to U.S. Parent
Local Sales to Other Foreign Affiliates of U.S.Parent Sales to U.S. Unaffiliated Customers

152
Chart 6-23
Market Destinations of Architectural, Engineering and Related Services [5413] Foreign Affiliate Sales (1999 to 2003)
0%
10%
20%
30%
40%
50%
60%
70%
80%
90%
1999 2000 2001 2002 2003
Local Sales to Unaffiliated Customers
Sales to Unaffiliated Customers in OtherCountries Sales to Other Foreign Affiliates of U.S. Parentin Other Countries Sales to U.S. Unaffiliated Customers
Local Sales to Other Foreign Affiliates of U.S.Parent Sales to U.S. Parent
Chart 6-24
Market Destinations of Computer Systems Design and Related Services [5415] Foreign Affiliate Sales (1999 to 2003)
0%
20%
40%
60%
80%
100%
120%
1999 2000 2001 2002 2003
Local Sales to Unaffiliated Customers
Sales to Unaffiliated Customers in OtherCountries Sales to Other Foreign Affiliates of U.S. Parentin Other Countries Sales to U.S. Parent
Local Sales to Other Foreign Affiliates of U.S.Parent Sales to U.S. Unaffiliated Customers

153
Chart 6-25 Market Destinations of Business Support Services [5614] Foreign Affiliate Sales
(1999 to 2003)
0%
20%
40%
60%
80%
100%
120%
1999 2000 2001 2002 2003
Local Sales of Services to UnaffiliatedcustomersSales of Services to Other Foreign Affiliates ofU.S. Parent in Other Countries Sales of Services to U.S. Parent
Sales of Services to Unaffiliated Customers inOther Countries Local Sales of Services to Other ForeignAffiliates of U.S. ParentSales of Services to U.S. UnaffiliatedCustomers
Source for Charts 6-22 to 6-25: Bureau of Economic Analysis. Key Findings:
• Total foreign affiliates sales increased from 1999 to 2003 except for architectural, engineering and related services [5413] (See Table 6A-9 in Appendix E).
• For all four industries, the majority of foreign affiliate sales were local sales to
unaffiliated customers. This was generally consistent throughout the period except for one or two years for foreign affiliates of MNC parents in pharmaceutical and medicine manufacturing [3254] (Chart 6-22) and business support services [5614] (Chart 6-25).
• During this five-year period, the second most popular destination for foreign affiliate
sales was to other MNC affiliates in other countries, except for architectural, engineering and related services [5413] (Chart 6-23). For pharmaceutical and medicine manufacturing [3254] (Chart 6-22) and computer system design and related services [5415] (Chart 6-24), the share of these sales increased from 1999 to 2003.
• For foreign affiliates with parents in architectural, engineering and related services [5413]
(Chart 6-23) sales to unaffiliated customers in other countries was the second most popular sales destination for the five-year period.
• Most other sales destinations accounted for small percentages of total sales from these
foreign affiliates during the five-year period. In particular, foreign affiliate sales to U.S.
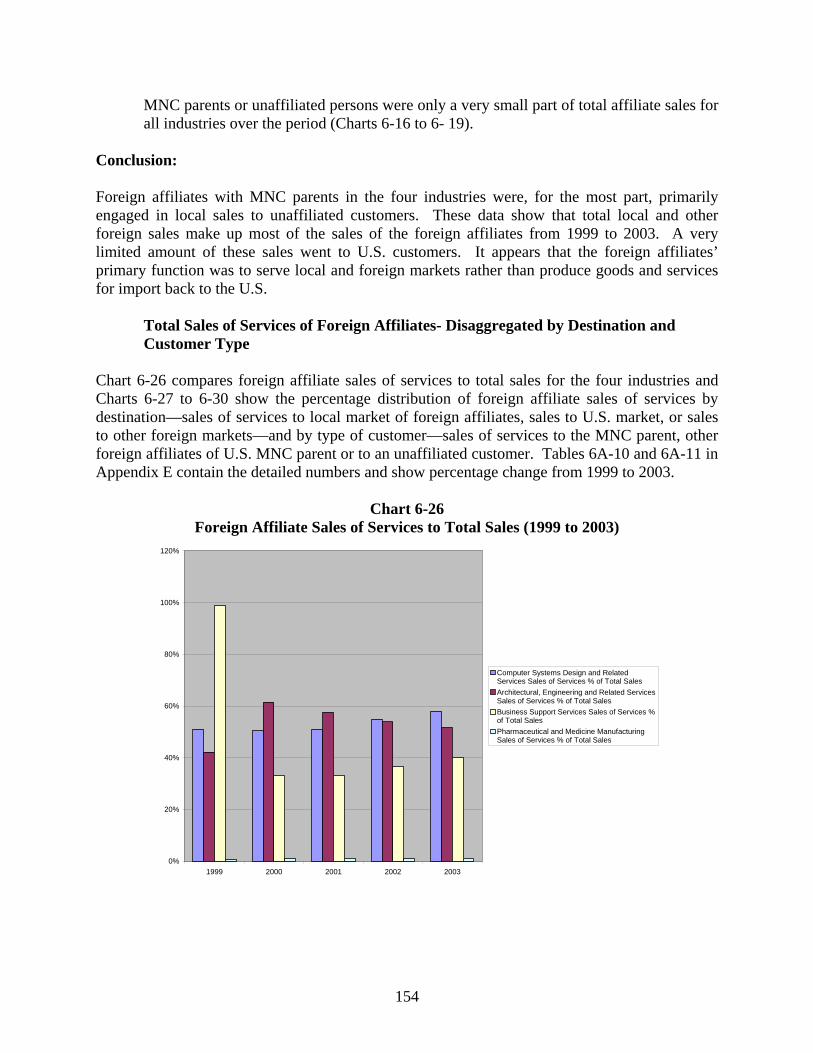
154
MNC parents or unaffiliated persons were only a very small part of total affiliate sales for all industries over the period (Charts 6-16 to 6- 19).
Conclusion: Foreign affiliates with MNC parents in the four industries were, for the most part, primarily engaged in local sales to unaffiliated customers. These data show that total local and other foreign sales make up most of the sales of the foreign affiliates from 1999 to 2003. A very limited amount of these sales went to U.S. customers. It appears that the foreign affiliates’ primary function was to serve local and foreign markets rather than produce goods and services for import back to the U.S.
Total Sales of Services of Foreign Affiliates- Disaggregated by Destination and Customer Type
Chart 6-26 compares foreign affiliate sales of services to total sales for the four industries and Charts 6-27 to 6-30 show the percentage distribution of foreign affiliate sales of services by destination—sales of services to local market of foreign affiliates, sales to U.S. market, or sales to other foreign markets—and by type of customer—sales of services to the MNC parent, other foreign affiliates of U.S. MNC parent or to an unaffiliated customer. Tables 6A-10 and 6A-11 in Appendix E contain the detailed numbers and show percentage change from 1999 to 2003.
Chart 6-26 Foreign Affiliate Sales of Services to Total Sales (1999 to 2003)
0%
20%
40%
60%
80%
100%
120%
1999 2000 2001 2002 2003
Computer Systems Design and RelatedServices Sales of Services % of Total SalesArchitectural, Engineering and Related ServicesSales of Services % of Total SalesBusiness Support Services Sales of Services %of Total SalesPharmaceutical and Medicine ManufacturingSales of Services % of Total Sales

155
Chart 6-27 The Market Destinations of Pharmaceutical and Medicine Manufacturing [3254] Foreign
Affiliate Sales of Services (1999 to 2003)
0%
10%
20%
30%
40%
50%
60%
70%
80%
1999 2000 2001 2002 2003
Local Sales of Services to UnaffiliatedcustomersSales of Services to Other Foreign Affiliates ofU.S. Parent in Other Countries Local Sales of Services to Other ForeignAffiliates of U.S. ParentSales of Services to U.S. Parent
Sales of Services to Unaffiliated Customers inOther Countries Sales of Services to U.S. UnaffiliatedCustomers
Chart 6-28 The Market Destinations of Architectural, Engineering and Related Services [5413]
Foreign Affiliate Sales of Services (1999 to 2003)
0%
10%
20%
30%
40%
50%
60%
70%
1999 2000 2001 2002 2003
Local Sales of Services to UnaffiliatedcustomersSales of Services to Unaffiliated Customers inOther Countries Sales of Services to Other Foreign Affiliates ofU.S. Parent in Other Countries Local Sales of Services to Other ForeignAffiliates of U.S. ParentSales of Services to U.S. Parent
Sales of Services to U.S. UnaffiliatedCustomers

156
Chart 6-29 The Market Destinations of Computer Systems Design and Related Services [5415] Foreign
Affiliate Sales of Services (1999 to 2003)
0%
10%
20%
30%
40%
50%
60%
70%
80%
90%
1999 2000 2001 2002 2003
Local Sales of Services to UnaffiliatedcustomersSales of Services to Other Foreign Affiliates ofU.S. Parent in Other Countries Sales of Services to U.S. Parent
Sales of Services to Unaffiliated Customers inOther Countries Local Sales of Services to Other ForeignAffiliates of U.S. ParentSales of Services to U.S. UnaffiliatedCustomers
Chart 6-30
The Market Destinations of Business Support Services [5614] Foreign Affiliate Sales of Services (1999 to 2003)90
0%
20%
40%
60%
80%
100%
120%
1999 2000 2001 2002 2003
Local Sales of Services to UnaffiliatedcustomersSales of Services to Other Foreign Affiliates ofU.S. Parent in Other Countries Sales of Services to U.S. Parent
Sales of Services to Unaffiliated Customers inOther Countries Local Sales of Services to Other ForeignAffiliates of U.S. ParentSales of Services to U.S. UnaffiliatedCustomers
Source for Charts 6-20 to 6-24: Bureau of Economic Analysis.
90 Chart 6-25 appears to be identical to Chart 6-30, however they are not the same chart. The distribution of market destinations for business support services [5614] sales and sales of services are very similar. Refer to Tables 6A-8 and 6A-10 in Appendix E for the detailed percentages.

157
Key Findings:
• Chart 6-26 shows that, in general, sales of services were the majority of foreign affiliate sales for those with parents in architectural, engineering and related services [5413] and computer systems design and related services [5415] from 1999 to 2003. Sales made by foreign affiliates with parents in business support services [5614] and pharmaceutical and medicine manufacturing [3254] were predominantly goods sales.
• Foreign affiliate services sales as a percent of their total sales increased from 1999 to
2003 for those foreign affiliates with parents concentrated in all four industries91 (see Chart 6-26 and Table 6A-11 in Appendix E). Foreign affiliates with parents in architectural, engineering and related services [5413], and computer system design and related services [5415] had more sales in services than goods (except for those with parents in architectural, engineering and related services [5413] in 1999). In contrast, from 2000 to 2003, foreign affiliates with parents in business support services [5614] sold a larger percentage of goods than services, except for 1999. Foreign affiliates with parents in pharmaceutical and medicine manufacturing [3254] (Chart 6-26) had very low percentages of services sales during the five-year period.
• From 1999 to 2003, the majority of foreign affiliate services sales were local sales to
unaffiliated customers for all four industries. Sales to other foreign markets, whether to other MNC affiliates or unaffiliated customers, tended to be the second most prominent destination for foreign affiliates services sales (Charts 6-27 to 6-30).
• The other destinations for services sales accounted for only small percentages of total
services sales for the foreign affiliates during the five-year period.92 As with total sales, foreign affiliate services sales to its MNC parent or unaffiliated U.S. customers accounted for a very small part of total foreign affiliate services sales.
Conclusion: As with total sales, foreign affiliate services sales primarily went to unaffiliated customers in the local markets during this five-year period. Foreign affiliate services sales as a percent of total foreign affiliate sales also increased over the period. These data show that most foreign affiliate sales of services were meeting foreign demands, primarily in their local markets. Few foreign affiliated service sales appear to have been imported to meet U.S needs.
MNC Parent Affiliated and Unaffiliated Services Exports Charts 6-31 to 6-34 show the percentage distribution of MNC parent exports to their foreign affiliates and to unaffiliated foreign persons. Tables 6A-12 and 6A-13 in Appendix E contain the detailed percentages and show the percentage change from 2001 to 2003. 91 This holds for foreign affiliates with business support services [5614] parents after the anomalous results for 1999. 92 The only exception is the 32 percent of local services sales to other MNC foreign affiliates made by affiliates with parents in business support services [5614] in the year 2000.

158
Chart 6-31 Pharmaceutical and Medicine Manufacturing [3254] MNC Parent Services Exports
(2001 to 2003)
0%
20%
40%
60%
80%
100%
120%
2001 2002 2003
MNC Parent Affiliated Services Exports% ofMNC Parent Services ExportsMNC Parent Unaffiliated Services Exports% ofMNC Parent Services Exports
Chart 6-32 Architectural, Engineering, and Related Services [5413] MNC Parent Services Exports
(2001 to 2003)
0%
10%
20%
30%
40%
50%
60%
70%
80%
2001 2002 2003
MNC Parent Affiliated Services Exports% ofMNC Parent Services ExportsMNC Parent Unaffiliated Services Exports% ofMNC Parent Services Exports

159
Chart 6-33 Computer Systems Design and Related Services [5415] MNC Parent Services Exports
(2001 to 2003)
0%
10%
20%
30%
40%
50%
60%
70%
80%
90%
2001 2002 2003
MNC Parent Affiliated Services Exports% ofMNC Parent Services ExportsMNC Parent Unaffiliated Services Exports% ofMNC Parent Services Exports
Chart 6-34
Business Support Services [5614] MNC Parent Services Exports (2001 to 2003)
0%
20%
40%
60%
80%
100%
120%
2001 2002 2003
MNC Parent Affiliated Services Exports% ofMNC Parent Services ExportsMNC Parent Unaffiliated Services Exports% ofMNC Parent Services Exports
Source for Charts 6-31 to 6-34: Bureau of Economic Analysis.

160
Key Findings:
• Total MNC parent exports increased from 2001 to 2003 except for business support services [5614]. Total MNC parent services exports increased for pharmaceutical and medicine manufacturing [3254] and computer systems design and related services [5415] but decreased for architectural, engineering and related services [5413] and business support services [5614] (see Table 6A-13 in Appendix E).
• For all four industries, the majority of MNC parent services exports went to their foreign
affiliates (Charts 6-31 to 6-34) from 2001 to 2003. MNC parent affiliated exports however decreased from 2001 to 2003 except in computer systems design and related services [5415] which increased 32.1 percent between the two years (see Table 6A-13 in Appendix E).
• MNC parent unaffiliated services exports increased from 2001 to 2003 for all four
industries, and the composition of MNC parent unaffiliated services exports to total MNC parent services exports also increased for all four industries between the two years (see Table 6A-13 in Appendix E).
Conclusion: Over the 2001 to 2003 time period, MNC parents primarily exported to their foreign affiliates rather than to unaffiliated foreign persons. MNC parent affiliated exports however, decreased from 2001 to 2003, except in computer systems design and related services [5415]. For all four industries, MNC parent unaffiliated services exports increased over this period. Sales Growth for MNC Parents Relative to Their Foreign Affiliates Although Chart 6-15 compared the growth in total sales for parents relative to their affiliates for all MNC parents in the four industries examined, that comparison did not account for changes in the number of MNC parents over the period. Moreover, given the small sample size for several of the industries examined, changes in total industry sales are susceptible to small sample effects. Specifically, large changes in sales for a few large MNC parents during the period could substantially affect total group sales. To address these concerns, we examined the number of MNC parents concentrated in the four industries with foreign affiliate sales that grew faster than their own between 1999 and 2003. Chart 6-29 shows the percent of MNC parents in each of the four industries that had faster growth in their foreign affiliates’ sales than parent sales between 1999 and 2003 The chart also shows the percent of those MNC parents with faster foreign affiliate sales growth that had positive growth in total parent sales over the period. While these data do control for changes in the number of parents over the period, it does not control for changes in the number of foreign affiliates. However, global services off-shoring can occur if affiliate sales are greater than parent sales from either faster growth among current affiliates or an increase in the number of affiliates, or both. Consequently, there appeared to be less need to control for changes in numbers of affiliates than changes in the number of parents.

161
Chart 6-29 Sales Growth for MNC Parents Relative to Their Foreign Affiliates (1999 to 2003)
Industry
Total MNC
Parents in Both
1999 and 2003
Number of MNC
Parents with Total
Sales Growth
Less Than Their
Foreign Affiliates
Percent of MNC
Parents with Total Sales
Growth Less Than Their
Foreign Affiliates
Number of MNC Parents with Positive
Total Sales Growth
Number of MNC Parents with Positive
Total Sales Growth, and
Total Sales Growth Less
Than Their Foreign
Affiliates
Percent of MNC Parents with
Positive Total Sales Growth,
and Total Sales Growth Less
Than Their Foreign Affiliates
3254 43 22 51.2% 39 18 81.8%5413 39 33 84.6% 33 25 75.8%5415 73 61 83.6% 62 54 88.5%5614 9 8 88.9% 8 7 87.5%
Key findings:
• In all four industries the majority of MNC parents experienced faster growth in foreign affiliate sales than parent sales between 1999 and 2003.
• For those MNC parents in the three services industries—architectural, engineering and
related services [5413], business support services [5614] and computer systems design and related services [5415]—the vast majority had faster affiliate sales growth, ranging between 84 and 89 percent.
• The percent of MNC parents in pharmaceutical and medicine manufacturing [3254] with
faster foreign affiliate sales growth between 1999 and 2003 was 51.2 percent.
• For those MNC parents in the four industries examined with faster affiliate sales growth than their parents between 1999 and 2003, a substantial majority also had growth in parent sales over the period. The percentages were significantly high for all four groups, with pharmaceutical and medicine manufacturing [3254] at 81.8 percent, architectural, engineering and related services [5413] at 75.8 percent, business support services [5614] at 87.5 percent, and computer systems design and related services [5415] at 88.5 percent.
Conclusion: As Chart 6-29 indicates, the majority of MNCs in each of these industries had faster growth in total sales for their foreign affiliates than their parent between 1999 and 2003. For the three services industries, over 80 % of the parents had faster affiliate sales growth. This contrasts with the limited percent of MNC parents importing services over the same period and thus off-shoring services due to business restructuring. This helps to confirm that the incidence of global expansion off-shoring among the MNC parents in the four industries examined appears to be

162
more widespread than off-shoring due to business restructuring during the 1999 to 2003 period. In addition, this greater incidence of global expansion off-shoring during the period was accompanied by growth in parent sales for the vast majority of parents. From 76 % to over 88 % of those parents with faster affiliate sales had increased parent sales during the period.
The Panel finds that services off-shoring due to global expansion was more prevalent among MNC parents in the four industries studied than services off-shoring due to business restructuring during the 1999 and 2003.

163
CHAPTER 7
DATA CHALLENGES AND RECOMMENDED IMPROVEMENTS A number of previous studies93 had indicated that attempts to estimate the extent of services off-shoring were hindered by gaps and other limitations in currently available data. These studies recognized that the prohibitive costs of collecting detailed data on services off-shoring and its key economic effects directly from individual firms required use of alternative indirect measures to estimate the extent and impacts of services off-shoring. Access and confidentiality issues also restricted most of the U.S. studies to an analysis of publicly available industry-level data. Previous chapters of this report also identified limitations in available micro-level as well as industry-level data that impeded efforts to estimate the extent of services off-shoring and its impacts over the 1998 to 2004 period. In this chapter, those data limitations will be examined in greater detail. Specifically, we will identify the specific data limitations, describe how they affect either the estimate of the extent of off-shoring or its economic effects, evaluate the significance of each impediment, and examine possible alternatives for improving current data. The chapter will conclude with a number of Panel recommendations to improve currently available data. These recommendations will reflect the significance of the limitation, the feasibility of the proposed improvement, and the implications of the proposed change for other elements of both the federal and international statistical systems. The Panel is particularly sensitive to the need to balance the demands for improved statistics to respond to a dynamic and changing global economy with essential consistency and compatibility among the various federal statistical agencies within the decentralized US system and between the US and other international systems. This sensitivity does not imply an aversion to changes to improve current data; it does suggest, however, the need for well documented and carefully planned changes that can improve not only our understanding of services off-shoring but also other economic forces driving the dynamic changes we continue to encounter. The Panel also recognizes that any proposed change will require resources to implement and can impose additional costs and reporting burdens on respondents to various federal data collection efforts. These costs and burdens must be weighed relative to the benefits obtained from a more complete assessment of the extent of services off-shoring and its economic effects that improved data could provide.
93 Prime examples include U.S. Government Accountability Office, International Trade: Current Government Data Provide Limited Insight into Off-shoring of Services, GAO-04-932, Washington DC September 2004, and Lieberman, Joseph I., Data Dearth in Off-shore Outsourcing: Policymaking Requires Facts. December 2004.

164
TYPES OF DATA ISSUES There were two types of data issues encountered in developing estimates of the extent of services off-shoring– basic data gaps and data quality concerns. The data gaps reflected the absence of key data elements in currently available data. An obvious example is the lack of separate measures of services imports used for intermediate purposes relative to final demand. While in some cases, assumptions were made to attempt to overcome this data gap, the validity of those assumptions was sometimes uncertain, at best. Data quality issues involved not only questions about discrepancies in reported data, but also the timeliness and availability of data. The alternatives for addressing these two different types of data issues also vary. Gaps in BEA Data
Affiliated and Unaffiliated Services Imports Differences The BEA collects services import data through a number of different surveys. The Annual Survey of Selected Services Transactions with Unaffiliated Foreign Persons (BE-22 or the benchmark year BE-20) provides detailed data on unaffiliated services imports by the types of services listed in attachment A. The quarterly surveys of MNC parents and their direct transactions with foreign affiliates (BE-577) provide data on affiliated services imports.94 However, unlike the detailed data from the unaffiliated surveys, the BE-577 survey seeks information on only the following types of services transactions between the MNC parent and its foreign affiliate:
• Insurance services • Financial services • Transportation • Computer and information services • Management and consulting services • Research, development and testing services • Other services
Because of these differences in types of services data, the micro-level analysis of services off-shoring could use only total services imports to develop estimates of services off-shoring among MNCs. While this did not prevent developing some initial total services off-shoring estimates, it did preclude any detailed analysis of the types of services being off-shored by the MNC parent. Moreover, these inconsistent categories of services imports—particularly the greater detail available for unaffiliated imports—may help explain the different treatment of affiliated and unaffiliated imports in BEA I-O tables. The review of “non comparable imports” in the data quality section will examine the implications of this in greater detail. More detailed and consistent data on the types of services imports from both affiliated and unaffiliated sources could provide greater insight on the economic impacts of services off-
94 BEA’S quarterly survey of transactions of U.S. affiliates with their foreign parents (BE-605) also collects data on affiliated services imports.

165
shoring. In particular, it might improve estimates of specific occupational impacts from services off-shoring by affording a more direct linkage with specific, detailed services industries and the occupations associated with the provision of those types of services. BEA has continued to explore efforts to improve its information on services transactions between MNC parents and their foreign affiliates. In a 2000 paper, Obie Whichard noted that BEA has tested collecting different types of services transactions in several benchmark surveys. However, he concluded that “BEA’s experience in collecting these data had indicated that respondents cannot break down all such transactions by type of service. Some transactions between parents and affiliates simply represent allocated charges to affiliates for a variety of overhead-type expenses incurred by the parent, and information on the specific types of services involved may not be maintained in company accounting systems.”95 BEA also has a proposal under consideration to establish comprehensive and uniform coverage between its collection of affiliated and unaffiliated services by using the same survey to collect both types of services imports. This will involve some simplification and consolidation of minor categories of unaffiliated services imports and then consistent collection of the remaining detailed services categories for both types of imports. BEA has initiated discussions with its major survey respondents to obtain comments on the proposal, including a suggestion that an “all other” category be established allowing respondents to self-identify types of imports beyond those already enumerated in the survey. As the recent report of the Services Off-shoring Working Group at MIT’s Industrial Performance Center has noted, “modern services industries are extremely dynamic and innovative. They create value, job growth, and influence the competitive position of the United States economy on the global stage….The statistical system of the United States has not adequately adapted to the increased importance of services by developing systems that collect and disseminate highly detailed economic statistics, as they do in the goods sector.”96 In 2004, services industries accounted for over 79 percent of GDP and over 82 percent of U.S. employment. This sector has been, and will continue to be, a dominant component of the U.S. economy. Developing more detailed data for services activities and implementing those changes throughout the U.S. statistical system will necessarily take substantial time and care. The current detailed data available for the goods sector evolved over decades. The U.S. Census Bureau, in conjunction with other federal statistical agencies, has begun that work, concentrating extensively on services products in the new North American Product Code System (NAPCS). As NAPCS, or some of its components, are fully implemented, BEA will also have to increase the type of detail it collects on its unified services imports survey.
MNC Value Added for Services In its survey of MNC financial operations, the BEA collects information on a number of MNC financial variables, including total sales and other economic components that sum to value
95 Obie Whichard, United States Statistics on Trade in Services. Paper presented to APEC Seminar on Statistical Reporting on Service Trade, Aug 2000. p. 11. 96Industrial Performance Center at MIT, Services Off-shoring Working Group Final Report, September 2006, p 14.

166
added. While the survey reports the largest eight categories of sales, the components of value added are not separately reported for goods and services. The micro-level MNC analysis for this report followed BEA staff practice of estimating MNC purchased inputs as the difference between total sales and value added.97 Estimated purchased inputs are critical components of the indicators to identify services outsourcing and off-shoring intensity among MNC parents, as described in Chapter 6. The proposed services outsourcing indicator was the ratio of purchased services inputs relative to total sales; the proposed services off-shoring indicator was the ratio of imported intermediate services relative to purchased services inputs. This data gap precluded any estimate of services outsourcing at a micro level, since an estimates of purchased services inputs could not be made. It also required a modification in the services off-shoring indicator, using the ratio of services imports relative to total purchased inputs rather than only purchased services inputs. This modification was likely to underestimate the extent of services off-shoring for any MNC—possibly by a large amount—since total purchased goods inputs can be quite large and total purchased inputs (goods and services) most likely exceed purchased services inputs alone.98 The impact of this modification on any trends in the services off-shoring intensity among MNCs was uncertain, since it would depend upon the growth in purchased services inputs relative to total purchased inputs over the period. The most direct approach for overcoming this gap would be to modify the current BEA survey to obtain data on the services content of the various components of value added. However, BEA staff have indicated that previous efforts to collect such detailed data were thwarted because most firms’ accounting systems did not provide information on value added by types of services produced. Another alternative might be to estimate the allocation of value added between services and goods using industry productivity averages developed from I-O data. Developing better data for estimating the extent of services outsourcing can provide some additional insight into the potential for future growth in services off-shoring due to business restructuring. While there are different costs and risks associated with off-shoring relative to outsourcing,99 an outsourced service is more vulnerable to off-shoring than those services that are still provided internally. Better measures of services outsourcing for MNCs can also improve understanding of MNC operating efficiency relative to domestic firms, given some recent work examining the links between productivity and outsourcing.100
97 Although this study followed the standard BEA convention in deriving MNC purchased inputs, the procedure produced occasional estimates of negative purchased inputs (see Chapter 6). This anomalous result occurred because of another data gap discussed below—the lack of data on inventories for MNC in the annual surveys. BEA collects MNC inventory data only every five years in the benchmark surveys. 98 This expected underestimate of the services off-shoring indicator will be mitigated by the inability to separate intermediate services imports from those for final demand as described later in the data gap section of this chapter. 99 See the discussion on outsourcing versus off-shoring in the first Panel report, Off-shoring: An Elusive Phenomenon, National Academy of Public Administration, January 2006, pp. 8-10. 100 See Dey, Housemen and Polivka, Contracting Out to Employment Services: Analysis Using the OES, CES, and CPS, a paper presented to the BLS LMI Conference May 2006, and Houseman, Outsourcing, Off-shoring, and Productivity Measurement in Manufacturing. Unpublished working paper, June 2006.

167
Services Imports for Intermediate Use U.S. data on services imports do not distinguish between uses of those imports.101 Importers do not indicate whether they will use those imports internally within their own business operations or sell them to some other individual or enterprise. One reason for this is that the distinction between intermediate use and final demand is complex and difficult to monitor within a diverse economy. In the previous example, if the initial importer had sold the imported service to another firm that subsequently used it internally, this subsequent intermediate use would not have been reflected in the initial importer response.102 The lack of data on services imported for intermediate use has a direct effect on the ability to estimate the extent of services off-shoring due to business restructuring. As noted in previous chapters, the preferred conceptual measure of this type of services off-shoring is the ratio of imported intermediate services relative to either total inputs, or total services inputs. To overcome this data gap required different assumptions about the available services imports data, depending upon the type of data being analyzed. For the industry-level analyses, the working assumption was that imported services were used the same as domestically produced services of the same type among the industries in the I-O table. However, as a recent National Academy of Sciences (NAS) study notes, the validity of this import similarity assumption depends upon the level of aggregation for the service categories in the I-O table and the effect of the terms of trade between the U.S. and the countries supplying the imported service.103 For the industry-level analyses, the impact of this data gap is confounded by the treatment of all affiliated services imports as “non comparable imports” in BEA I-O tables. This issue is examined separately in the data quality section. For the micro-level data, the working assumption was that all services imports were used internally by the importer. This assumption overstates the extent of services off-shoring to the extent any of the services imports were for final demand. The impact of this data gap on the trend in services off-shoring is unclear, since it will depend upon whether the services imported for final demand have been increasing or decreasing over the period relative to total services imports. One alternative for addressing this data gap is to modify the current BEA surveys to include a question on the use of particular imported services. Although the current BEA surveys do ask for this type of information from MNCs regarding imports of goods, it has not been extended to services because of substantial conceptual and measurement issues. A second alternative might be to link the current services imports data with other surveys indicating the use of selected
101 BEA surveys do ask respondents to distinguish goods imported for internal use from those imported for resale to others. BEA staff indicate that services imports raise conceptual as well as collection issues that have not yet been successfully surmounted BEA staff also maintain that most business, professional and technical (BPT) services imports—the types of services that have been the focus of much off-shoring concerns—are either used by the importing business or combined with other services and products before being sold to final customers.. 102 At an industry level, input-output tables can account for the multiple transactions through the use of specific industry multipliers. 103 National Research Council of the National Academies, Analyzing the U.S. Content of Imports and the Foreign Content of Exports. 2006, p 33.

168
services by other businesses. Data from the economic census, for example, might provide information to benchmark such uses by individual companies or by NAICS industry every five years. A third alternative is to collect data on the types of services imports at a level of detail that is compatible with the industry aggregates included in the BEA I-O table. This would allow application of the industry-level intermediate to final use ratio to each individual firm’s services imports to allocate them between intermediate and finals uses. This approximation still assumes a degree of homogeneity among firms within an industry that may not be accurate. In addition, it assumes that import similarity is more likely at lower levels of aggregation. However, the NAS study indicates why a more disaggregated categorization of services within an I-O table may enhance, but not assure, the validity of the import similarity assumption.104
MNC Inventory Estimates Although the BEA does collect data on MNC inventories in their benchmark surveys every five years, these data are not collected in the annual surveys. The lack of data on the annual change in inventories for MNCs affects the accuracy of the derived estimates of purchased inputs used by BEA staff and in this study. As noted above, purchased inputs were estimated as the difference between total sales and value added. This calculation was based on the identity that for each MNC parent, the value of total output in each year must equal the value of total inputs. Total inputs equal the MNC parent’s value added—the value of labor and capital inputs (including net profits) provided by the parent—plus any intermediate inputs supplied by another entity (purchased inputs). If total sales adequately accounted for total output, estimating purchased inputs as the difference between total sales and value added would be reasonable. However, a MNC parent’s total output in any year includes not only its total sales but also any change in its inventory. This data gap will distort the estimates of purchased inputs used to develop our outsourcing and off-shoring intensity measures. The direction of the inaccuracy for an individual MNC parent in any particular year is unclear, since inventory changes can be either positive (inventories are increasing) or negative (inventories are decreasing). The significance of the inaccuracy depends upon the size of the change in inventories relative to sales. BEA staff believe that inventories for services are most likely insignificant, since services usually cannot be stored, unlike goods and manufactured items. Gaps in BLS Data
Price and Quantity Data for Services Imports BLS develops and maintains price data for a range of domestic consumer, producer and international goods and services. The International Price Program (IPP) within BLS, established in 1971, collects prices on about 10,000 individual export items and 12,000 import items to develop export and import price indices. The vast majority of these individual export and import items are goods. The relatively few service transactions included involve primarily transportation and travel services. There are currently no export or import prices for business, professional, and technical (BPT) services. However, these BPT services imports are the focus of most of the current concerns about services off-shoring. 104 ibid. p. 35.
169
This data gap does not directly affect our indicators of the extent of services off-shoring or even services outsourcing among firms and MNCs because they rely on the value of services imports and the value of purchased services inputs.105 Similarly, trends in these indicators will not be directly affected by this data gap. However, forecasts or projections of future trends will depend on changes in relative prices. Moreover, prices are a critical element for assessing the economic effects of services off-shoring and this may explain why numerous trade economists, most notably Catherine Mann,106 have urged that a greater emphasis be placed on overcoming this gap. The recent NAS study perhaps put the argument most succinctly: “To determine the effects of international trade on wages and working conditions, it is not enough to know the value of imports and exports. One also needs to know the prices and quantities. Prices and costs are the economic signals that drive business and consumer decisions to buy or produce in one or another location.”107 Developing market based prices for distinct, internationally traded, services is an exceedingly challenging task. Developing prices for domestically traded services poses some daunting measurement issues because many services involve intangible transactions unlike most specific goods transactions. Qualitative differences in similar types of services supplied can be difficult to differentiate from the price of the service. For internationally traded services, these measurement difficulties are compounded by the lack of consistent categories of traded services. As described above, even BEA data on services imports provide substantially greater detail on the types of unaffiliated relative to affiliated services imports. Again, the NAS study reached an appropriately succinct conclusion: “To analyze the relative competitiveness of domestic and foreign producers of services, U.S. international price data need to be comparable to domestic price data for similar classifications of services transactions. It is difficult to achieve these objectives.”108 To have comparable international and domestic services prices, one must first have comparable categories of services for developing price measures. The current differences in the types of services reported for unaffiliated relative to affiliated imports indicate that this consistent set of services imports comparable to domestically traded services does not yet exist.
BLS Mass Lay-Off Survey (MLS) Limitations for Services Off-Shoring The MLS program at BLS is the only federal statistical survey that directly asks employers whether a major lay-off event at one of their establishments involved movement of work activity overseas and further, whether that work movement occurred within the firm’s legal structure or involved use of an independent outside party. Although the program began in 1995, the movement of work question was only added to the survey in 2004. The program’s current design focuses on major mass lay-off events that are likely to impose significant adjustment problems on the workers and communities affected. It uses administrative information available from the comprehensive set of establishments within the QCEW to identify mass lay-off events 105 Many economists might prefer a more precise measure—the quantity of services imported—to separate price changes, including changes in exchange rates, from changes in the amounts of imported services actually substituting for domestic inputs. 106 See for example, Prices for International Services Transactions: Issues and a Framework for Development, September 2004, a paper prepared for the BLS. 107 NAS, op. cit., p. 13. 108 Ibid., p. 14.

170
for individual establishments that last more than 30 days, have at least 50 initial unemployment insurance claims and involve establishments with 50 or more employees. BLS then contacts these selected establishments to obtain the additional information sought by the MLS program. The survey not only identifies the immediate employment effects from these major events but tracks some of the adjustment problems displaced employees encounter. This original program design has worked effectively to identify and help assess the employment and other impacts from large, concentrated lay-off events. But its current targeting criteria were not intended to identify structural reorganizations within a firm that may be spread among several establishments, phased-in over an extended period of time and include personnel options and severance packages to minimize lay-offs such as early retirement inducements, reassignments to different positions, relocations to other establishments within the firm, or retraining programs. As the first Panel report noted, the estimates of job losses from services off-shoring obtained from the MLS data in 2004 were substantially smaller than other estimates.109 But this clearly reflected the current program design focusing on major lay-off events. Given that design, it is not surprising that MLS survey results appear highly sensitive to general US labor market conditions. As the labor market improved in 2005, the number of MLS events and the number of employees affected by them declined, including those events associated with movement of work and movement of work overseas. The data in Table 7-1 show that the number of employees affected by MLS events involving movement of work overseas fell to 12,030 in 2005—a decline of more than 25 percent. Most other studies of services off-shoring suggest that this phenomenon, whether due to business restructuring or global expansion decisions, is determined by more fundamental and structural economic, financial and competitive market conditions than by temporary, cyclical U.S. labor market changes.110 While none of the other studies of off-shoring reviewed in the first report contained information as current as the MLS 2005 data, none indicate a decline in off-shoring or its employment effects. While limited to 2003 or 2004 data, the empirical results presented in chapters three through six do not indicate a decline in the extent of services off-shoring.
109 Op. cit., the Academy, See Table 4-3, p. 58. 110 Ibid., see discussion in Chapters 2 and 4.

171
Table 7-1 Recent Mass Lay-Off Events Including Movement of Work Overseas
(Numbers in Units)
Num
ber
Sepa
rate
d
Empl
oyee
s
Num
ber
Sepa
rate
d Em
ploy
ees
Perc
ent
Tota
l
Empl
oyee
s
Num
ber
Sepa
rate
d
Empl
oyee
s
Perc
ent
Tota
l
Empl
oyee
s
2004 5010 993909 366 73217 7.4% 103 16197 1.6%2005 4881 884661 277 53628 6.1% 91 12030 1.4%
Change -129 -109248 -89 -19589 -12 -4167 (in Percent) -2.6% -11.0% -24.3% -26.8% -11.7% -25.7%
Total MLS Events Movement of Work Events Work Movement Overseas Events
Source: BOS data This data gap did not affect the development of services off-shoring measures or the estimates of the extent of services off-shoring using those measures in this study. BLS staff indicate that in 2007 the program will develop from unemployment insurance initial claims filings monthly data on all lay-offs regardless of size. This more detailed universe of lay-off events will provide an opportunity to survey smaller lay-off events selectively using other criteria. Linking these data with OES data indicating firms that are undergoing significant occupational structural changes, or with shared BEA MNC data identifying firms that are increasing their services imports, could provide targeting criteria more focused on services off-shoring activities. If the current MLS survey provided greater coverage of establishments that appear to be off-shoring services through either business restructuring or global expansion, these MLS results could be compared with those developed for the particular industries included in the micro-level analyses of this report.111 BEA Data Quality Issues
Comprehensiveness and Accuracy of Survey Data Well publicized differences in the value of certain IT related services imports from India to the U.S. reported by BEA and The National Association of Software and Service Companies (NASSCOM)112 have raised concerns about the comprehensiveness and accuracy of BEA’s
111 The BEA MNCs that were identified as off-shoring services through business restructuring and experienced net job flow losses or specific occupational losses when matched with other BLS data could be compared to MLS establishments to determine the consistency of any matches if there were sufficient time and resources to accomplish these tasks. One difficulty is that these BEA MNC data were only available through 2003, before the new survey language on movement of work was implemented in the MLS. 112 The National Association of Software and Service Companies (NASSCOM) is India’s primary information technology association and collects trade data on IT, software and other related services from its members and other sources. These data are shared with the Reserve Bank of India (RBI); RBI in turn uses these NASSCOM data in its official reports on Indian exports and imports.

172
estimates of services imports. The differences are striking—for 2003, NASSCOM estimated Indian IT related services imports to the US were $8.7 billion, while BEA reported unaffiliated BPT services imports from India were only $420 million—a difference of almost $8.3 billion. 113 A recent GAO report, U.S and India Data on Off-shoring Show Significant Differences, reviewed the procedures and information used to develop these different estimates and found five principal reasons for this discrepancy. These were:
1. Earnings of temporary Indian workers residing in US—India’s estimates included all workers; BEA’s estimates included only those in the US for less than a year and not on the payroll of a firm in the US.
2. Definition of services—India defined them more broadly to include software embedded
in computers.
3. Definition of U.S. imports—India included sales to all U.S firms located outside the U.S. but consistent with international standards BEA does not.
4. Unaffiliated versus affiliated services—BEA’s estimates included only unaffiliated
services, since estimates of affiliated IT-related services imports are not available by country of origin; India’s estimates included both affiliated and unaffiliated services.
5. Other differences, including identifying specific firms participating in trade flows
between India and the U.S.114 The GAO report noted that Indian data did not conform to international standards for the first three reasons. GAO did not indicate how much each of these key factors contributed to the discrepancy, but cited Indian experts who suggested that as much as 65 percent ($5.4 billion) of the discrepancy was due to the first two reasons. BEA data also indicate that total affiliated imports of BPT services in 2003—$26.1 billion—were more than twice the amount of unaffiliated BPT services imports ($11.4 billion). If this same relationship applies to Indian BPT imports, BEA’s estimates of total BPT imports would have been almost 230 percent larger. This would have accounted for another 12 percent of the discrepancy, but that still leaves over 20 percent of the discrepancy to be accounted for by the other factors. This discrepancy in estimated services imports is apparently not unique to this Indian case. BEA staff noted that BEA has relied on Statistics Canada data on exports of unaffiliated computer and information services to the US rather than the results from their surveys to report unaffiliated computer and information services imports from Canada. Since 1970 Canada and the US have reconciled their current accounts and these results are reported in a Survey of Current Business article (most recently the November 2005 issue). This annual reconciliation process identified a substantial discrepancy between Canadian estimated exports and BEA estimated imports for these unaffiliated computer and information services. As the annual reconciliation article notes, “as part of the reconciliation process, Canada and the United States have evaluated the accuracy of each other’s estimates, and as a result, each country now includes in its published estimates 113 The corresponding difference for 2002 was over $6.2 billion. 114 GAO, U.S and India Data on Off-shoring Show Significant Differences, GAO-06-116, October 2005 p .3.
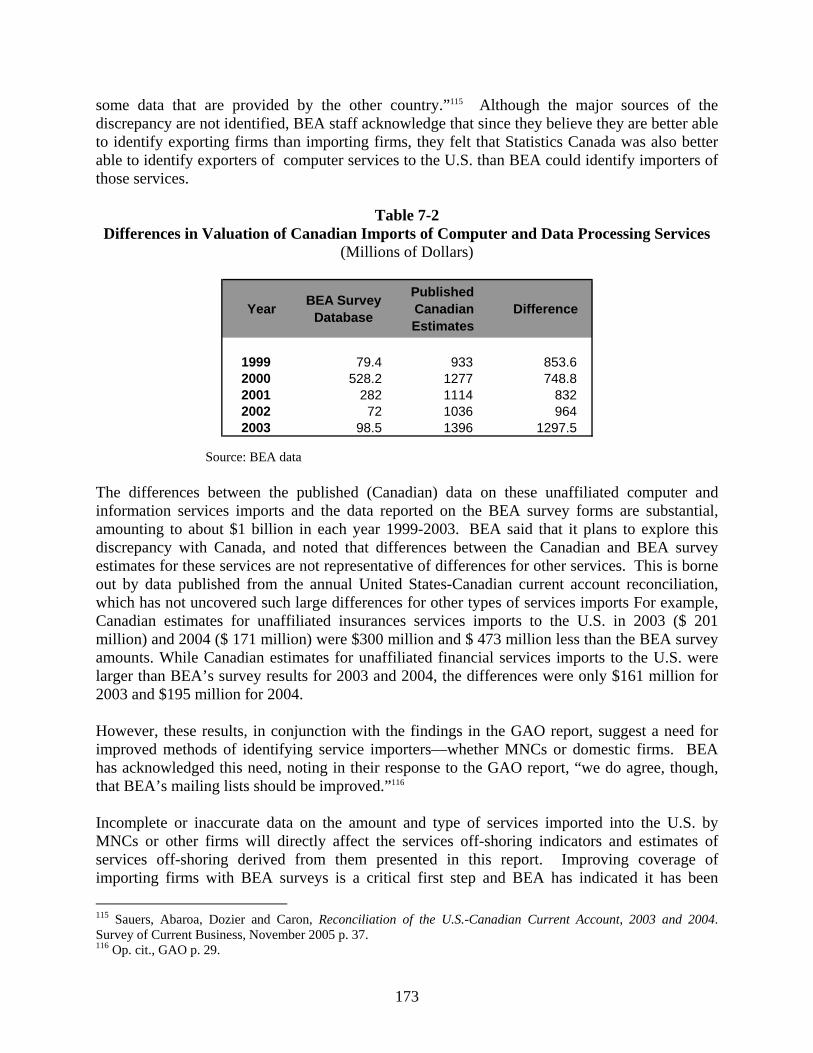
173
some data that are provided by the other country.”115 Although the major sources of the discrepancy are not identified, BEA staff acknowledge that since they believe they are better able to identify exporting firms than importing firms, they felt that Statistics Canada was also better able to identify exporters of computer services to the U.S. than BEA could identify importers of those services.
Table 7-2 Differences in Valuation of Canadian Imports of Computer and Data Processing Services
(Millions of Dollars)
Year BEA Survey Database
Published Canadian Estimates
Difference
1999 79.4 933 853.62000 528.2 1277 748.82001 282 1114 8322002 72 1036 9642003 98.5 1396 1297.5
Source: BEA data The differences between the published (Canadian) data on these unaffiliated computer and information services imports and the data reported on the BEA survey forms are substantial, amounting to about $1 billion in each year 1999-2003. BEA said that it plans to explore this discrepancy with Canada, and noted that differences between the Canadian and BEA survey estimates for these services are not representative of differences for other services. This is borne out by data published from the annual United States-Canadian current account reconciliation, which has not uncovered such large differences for other types of services imports For example, Canadian estimates for unaffiliated insurances services imports to the U.S. in 2003 ($ 201 million) and 2004 ($ 171 million) were $300 million and $ 473 million less than the BEA survey amounts. While Canadian estimates for unaffiliated financial services imports to the U.S. were larger than BEA’s survey results for 2003 and 2004, the differences were only $161 million for 2003 and $195 million for 2004. However, these results, in conjunction with the findings in the GAO report, suggest a need for improved methods of identifying service importers—whether MNCs or domestic firms. BEA has acknowledged this need, noting in their response to the GAO report, “we do agree, though, that BEA’s mailing lists should be improved.”116 Incomplete or inaccurate data on the amount and type of services imported into the U.S. by MNCs or other firms will directly affect the services off-shoring indicators and estimates of services off-shoring derived from them presented in this report. Improving coverage of importing firms with BEA surveys is a critical first step and BEA has indicated it has been 115 Sauers, Abaroa, Dozier and Caron, Reconciliation of the U.S.-Canadian Current Account, 2003 and 2004. Survey of Current Business, November 2005 p. 37. 116 Op. cit., GAO p. 29.

174
negotiating with the Census Bureau and the Internal Revenue Service (IRS) to obtain access to Census’ database of U.S. businesses.117 On July 6, 2006, the IRS issued a temporary rule118 providing BEA access to certain tax information that should help identify various components within a consolidated business entity, industry classification of those components, and their addresses. This rule should help resolve some of the issues restricting BEA’s access to these Census data and may provide useful information directly to BEA to help improve its survey mailing lists. In addition, BEA has obtained agreement from Census to include a question on whether a firm is importing services on the annual Company Organization Survey (COS). This survey obtains information from larger, multi-establishment firms using the Census business register to identify these firms. About 40,000 large firms are currently surveyed. Under the BEA/Census agreement, BEA would fund a sample expansion of another 15,000 firms. This additional information from Census’ COS should improve BEA’s survey coverage for these larger firms importing services.
Timeliness of MNC Financial and Operating Data Although the industry-level analyses covered the period from 1998 to 2004, the micro-level analyses using MNC data examined a more limited 1999-2003 period. The conversion to the NAICS for identifying principal manufacturing and service sector concentrations for MNC operations limits any consistent, historical analysis of these micro-level MNC data to 1999 forward.119 Although BEA has been working to improve the timeliness of its international trade data, and currently provides some summary data on affiliated and unaffiliated exports and imports, as well as key MNC operating data, within 16 months of the end of the year,120 complete micro-level MNC data for 2004 were still unavailable as of September 2006. These lags reflect the current BEA process for conducting these surveys, the continued reliance on paper processing by many MNCs, and the need to correct and verify data from primarily paper submissions. In addition, these 2004 data are benchmark year data and contain greater detail than other years. Because this greater detail requires more review and preparation of the data, benchmark year data are typically released later than other, less detailed, annual year data. BEA distributes its survey forms in the spring following the end of each year; responses are not due until May 31 for most surveys. A reliable and reasonably complete response is normally not available until the following spring. BEA has emphasized electronic collection processes and, starting in 1998, began work on its Automated Survey Transmission and Retrieval (ASTAR) system. ASTAR was implemented for individual surveys beginning in 2001 with the survey on MNC transactions with their affiliates (BE-577 Direct Transactions of U.S. Reporters with Foreign Affiliates). ASTAR now covers almost all the surveys conducted by the International
117 Ibid. p. 29. 118 See 26 CFR Part 301, Federal Register volume 71 Number 129 p. 38262. 119 Developing a detailed crosswalk between the NAICS and its predecessor system—the Standard Industrial Classifications (SIC)—was outside the scope of this study. 120 This year, BEA provided advanced summary estimates of key items for the 2004 data on MNC financial operations, including affiliated trade, in an April 20, 2006 press release.

175
Investment Division within BEA and several smaller surveys for the Balance of Payments Division.121 BEA fully recognizes the potential advantages from electronic collections in timeliness, accuracy, costs, and lower respondent burdens. While there have been improvements in the responses to BEA surveys and some increased use of the ASTAR system, a substantial portion of the major surveys filed with BEA continue to be paper documents. While these timeliness issues did not affect the development of the services outsourcing and off-shoring measures used in this report, they did preclude extending these measures to the most recent period. The truncated time period available for analyzing these micro-level data may have affected attempts to discern any significant trends in services off-shoring and outsourcing.
“Non-Comparable” Imports in BEA I-O Tables As discussed in Chapter 3, BEA staff account for unaffiliated and affiliated services imports differently in the I-O tables. Unaffiliated services imports are distributed by major commodity type and appear as an element in the estimate of total commodity output or production. Affiliated services imports are included with other “non-comparable” imports as a separate commodity in the I-O tables. The principal reason for creating a separate “non-comparable” imports category is the recognition that some types of imports have no domestic counterpart.122 However, many of the affiliated services imports included in the “non-comparable” category, “such as business, professional, and technical (BPT) services and royalties and license fees, have components that may be comparable to domestically produced services and that could be included in the domestic supply of those services.”123 This different treatment of similar types of affiliated and unaffiliated services imports—e.g. BPT services—in the I-O table will not only understate total production of BPT services shown in the table, but can cause analysts to underestimate the imports of particular services to be distributed between intermediate and other uses. A number of previous studies, including the recent NAS study, have used BEA I-O tables to estimate the share of imported services used as intermediate inputs, by applying the import similarity assumption to the imports by commodity type. It is not clear that these estimates were augmented by including the affiliated services import component within the “non-comparable” commodity line. One difficulty in doing this, of course, is that the BEA provides much greater detail on the types of unaffiliated services than affiliated services imports. Failure to account for these affiliated “non comparable” services imports could yield a substantial underestimate of imported intermediate services for certain types of services. As noted earlier in this chapter, affiliated imports for BPT services in 2004 were more than twice as
121 Walker, Patrica, Survey Data Collection Over the Internet at the U.S. BEA, paper presented at the Statistical Data Editing work session of the UN Economic Commission for Europe, October 2003, pp. 2-3. 122 Examples include overseas port operations by US air and water carriers and US government purchases for overseas operations. See Yuskavage, Strassner and Medeiros, Outsourcing and Imported Services in BEA’s Industry Accounts. Paper for the NBER’s Conference on Research in Income and Wealth, April 2006. 123 Ibid., p 20.

176
large as unaffiliated BPT services imports. Since BPT services have been considered by some to be potentially vulnerable to off-shoring activity, this failure could understate intermediate BPT services imports and consequently underestimate the extent of off-shoring of these services. The estimates of services off-shoring at an industry level, presented in Chapter 3, did account for these affiliated services embedded in “non-comparable” imports. That chapter describes the methodology and assumptions used to distribute these affiliated services. The Yuskavage et al paper also accounted for these affiliated services imports by relying on unpublished data developed by other BEA staff. But these data are not available to outside analysts. Consequently, as Yuskavage et al note, “BEA will investigate options for reducing the size of imports classified as “non-comparable,” while retaining the distributional advantages of the current procedures.”124 BLS Data Quality Issues
Multi-Establishment Firms in OES Sample The OES program surveys over a three year collection cycle the roughly 1.2 million establishments within the QCEW universe to produce estimates on employment and wages for over 800 occupations. The survey is conducted semi-annually and includes approximately 200,000 establishments—roughly 1/6th of the QCEW universe. The sample is designed to produce reliable estimates by geographical area (national, state and metropolitan area) and by industry at the 3- and 4-digit NAICS levels.125 This design is intended to collect data on any specific establishment only once every three years to minimize respondent burden. One parameter that is not explicitly discussed in this sampling design is the firm, particularly those larger firms with multiple establishments. Within the QCEW database, it is theoretically possible to construct firm-level information by aggregating all establishments with an EIN common to the firm. This works for the QCEW database because those administrative records constitute the entire universe of firms and establishments with paid employees in the U.S. The same process can be followed in the OES sample, but since not all establishments for multi-establishment firms will be captured in a particular sample, it is not clear how representative those captured establishments are of the entire firm. Services off-shoring decisions typically are made at a firm, not an establishment, level. Therefore, the effect of those decisions on employment and occupational structure need to be assessed for all establishments within the firm. While the economic effects of services off-shoring, particularly the employment impacts, will occur at the establishment level within the firm, not all establishments within the firm may experience the same impact from the firm’s decision. From the firm’s perspective, the success of its off-shoring decision depends upon the net economic, financial, and employment effects for the firm, not specific effects within individual establishments.
124 Ibid., p. 21. 125 The current sample also provides estimates for selected industries at the 5-digit NAICS level.

177
While this issue about the representation of multi-establishment firms within the OES sample does not affect the measures used to identify the extent of services off-shoring, it can affect the assessment of several key employment effects of off-shoring—occupational structure and wage changes within the off-shoring firm. Since MNC parents are generally large, multi-establishment firms and MNC parents that have off-shored services were larger than other parents within the same industry,126 this issues is especially critical to the assessment of changes in the occupational structures of those MNC parents that appear to have off-shored services over the period. Changes in the sample design for the OES could allow BLS to develop representative panels for multi-establishment firms within the current OES sample size at a national level, given the likely dispersion of individual establishments for these multi-establishment firms. The sampling design could explore whether these representative samples could be developed at the 4-digit NAICS level.
Longitudinal Occupation Analysis and OES Data BLS has issued very clear caveats about using the current OES data for longitudinal analysis of occupational changes at a national and/or aggregate industry level.127 The current OES sample was certainly not designed to support longitudinal analysis of occupational changes for specific establishments or firms. BLS staff have attempted to overcome this by creating data sets for matched establishments over a three to five year period and have made them available for this project.128 The industry-level analyses of these occupational data in chapters 4 and 5 have demonstrated the potential value the OES data can add to assessing both the extent and distributional employment effects of services off-shoring. However, these industry-level analyses still encounter aggregation issues, since not all firms within an industry are likely to engage in services off-shoring. Indeed, the micro-level analysis of MNCs in Chapter 6 indicated that only a limited proportion of MNC parents off-shored services due to business restructuring even among those in the same industry and that these proportions also varied by industry. While the lack of longitudinal OES data at the firm and establishment level did not impede the ability to develop initial estimates of the extent of services off-shoring among MNC parents, their availability might have provided an opportunity to extend that analysis to non-MNC firms. In addition, it would greatly improve an understanding of the distributional employment effects from services off-shoring due to business restructuring. Joint Agency Data Quality Issues
Different NAICS Classifications for Specific Firms Although both BEA and BLS use NAICS codes to determine the industry sectors for the firms or establishments providing them economic data, they assign these codes to different entities. BEA classifies their MNC parents and other importing firms according to the industry group
126 See discussion in Chapter 6. 127 See http://www.bls.gov/oes/oes_ques.htm#Ques27 128 These OES data sets will be described and analyzed in the final report.

178
accounting for the preponderance of firm sales, using the detailed sales data from their surveys. BLS asks establishments reporting employment data to classify themselves based on the industry group accounting for the largest share of their sales.129 To link BEA MNC data with the BLS establishment data, the BLS data must be aggregated into firms, where necessary. Academy staff assigned NAICS categories to these derived BLS firms based on the industry group accounting for the largest share of total firm employment. While there should be some correlation between these two classification methodologies, there is no reason to expect 100 percent correspondence. Different NAICS categories for the same firm can impose problems in linking firm-level data between the two agencies. Consistent industry classifications would provide another means for verifying the validity of initial matches.130 While the two different methodologies can provide some interesting insights on the complex internal structures of multi-establishment firms, it is still important to be confident that the matched firm is in fact the same entity. One approach to overcoming this is to have BEA and BLS reach agreement on a common NAICS identifier for the firms jointly reporting to each. Alternatively, establishing a consistent set of identifiers for components within complex U.S. business entities would help each agency understand how the business components providing them statistical data fit within a consolidated national or international business entity. RECOMMENDATIONS AND CONCLUSIONS The previous assessment of the significance of the various data gaps and data quality issues encountered and their impact on the ability to identify the extent of services off-shoring and its major economic effects suggested several critical observations.
• Not all data issues were equally important to improving the understanding of the extent and impact of services off-shoring.
• Addressing some data issues could help to resolve other data problems, as well.
• Any proposed change would require resources to implement and could impose additional
costs and reporting burdens on survey respondents.
• Some proposed changes appeared easier or less costly to implement than others.
• It is likely that some changes could be implemented more quickly than others.
• Addressing some data gaps and quality issues would have significant implications for a broader set of economic, financial or statistical policy issues.
129 BLS has no way to verify this self-determination since it collects only employment data from these establishments. 130 These matching issues will be described in detail in the final report.

179
• Several alternatives for improvement are being considered or actively pursued by the agencies themselves.
The Panel’s recommended improvements and changes to the current data collection system and specific elements within it attempt to achieve a balance among these observations. The Panel has distinguished three key recommendations among its recommended data improvements. These recommendations address the following critical needs:
• improving the consistency, completeness and coverage of BEA’s data on services imports;
• providing longitudinal occupational data through a revised or restructured BLS
survey; and
• developing consistent business identifiers to link information from several statistical agencies with different business organizational levels.
These key recommendations are similar to several of the recommendations contained in the September 2006 report of the Services Off-shoring Working Group at MIT’s Industrial Performance Center. The additional Panel recommended data improvements are organized by the principal responsible statistical agency. Key Data Improvements for BEA
Collect Consistent Levels of Detail for Affiliated and Unaffiliated Services Imports The Panel findings on the extent of services off-shoring in chapters three through six suggest that the phenomenon is small, has the potential to grow, and varies significantly among individual industries. These findings support the need to develop more detailed and consistent data on the types of services involved now, while the phenomenon is relatively small. Given the current dominance of affiliated imports for BPT and other services that appear particularly vulnerable to off-shoring, it is difficult to understand why there is less detail available for these imports than for unaffiliated imports. Collecting similar detail on affiliated and unaffiliated services imports will help address a number of data gap or data quality issues. Therefore,
The Panel recommends that BEA should implement its proposal to collect consistent levels of detail for affiliated and unaffiliated services imports and periodically review the collection to ensure that it is comprehensive and compatible with details on services contained in other economic data.
The current differences in the level of detail between affiliated and unaffiliated service imports include both type of service and country of origin—the current BEA proposal will address both differences. BEA acknowledges that their published data on services by type and country of origin may have to suppress more individual data to preserve respondent confidentiality. This change will improve our understanding of the types of services being off-shored, and the implications for particular occupations. It will facilitate efforts to remove these affiliated

180
services imports from the “non-comparable” import category in the BEA I-O tables and account for them the same as unaffiliated services imports of the same type. By assuring compatibly with other economic data on services, this change to collect uniform detailed services imports maintains opportunities for linking these data with other data on services (e.g. domestic supplies of services) to address future questions that cannot be fully answered using only the BEA trade data. Finally, this change provides the essential foundation for future efforts to develop price information for specific types of imported services that are compatible, or consistent with, similar domestically traded services. The Panel also recognizes that BEA will have to extend the level of detail on services imports as more detailed data on services are developed for the U.S. economy. An example of this is the current effort led by the U.S. Census Bureau to develop a hierarchical product code system for domestic services through the North American Product Code System (NAPCS). Implementing this recommendation will increase the reporting burden for U.S. MNC parents or U.S. affiliates of foreign MNC parents now responding to BE-577 and BE-605, respectively. This burden should be no greater than the current burden for MNC parents and other firms importing unaffiliated services imports. Moreover, the BEA proposal to eliminate some of the minor detailed categories for unaffiliated services imports should reduce the collection burden for those unaffiliated survey respondents.
Improve Sampling Coverage of U.S Services Importers The Panel agrees with BEA that improving current mailing lists will require more than access to a consistent set of business identifiers with common current addresses, as the Panel has recommended below. BEA needs additional help in identifying businesses importing services. BEA’s agreement with Census to add a question to the annual Company Organization Survey (COS) to identify firms that are importing services is another useful step. While this should result in improved BEA survey coverage of services importers among large multi-establishment firms, BEA could consider other efforts to improve its mailing list.
The Panel recommends that BEA should assess the effectiveness and impact of the additional COS question and continue to seek ways to improve its survey of services importers.
This COS check-off question should help BEA identify new or additional larger firms on the common business register that were not currently on its survey mailing lists. But BEA may also want to consider working with other federal agencies surveying particular service activities to determine whether information on imports of those specific services would useful to that agency. An alternative source of specific service imports would help BEA assess the adequacy of its survey coverage in this area. In addition, BEA should continue to work with its major trading partners to identify major differences in particular types of services imports where improved survey efforts may be needed. Additional resources will be needed to add check-off questions to other surveys, complete major trading partner reconciliations of services imports, and extend surveys to additional businesses found from new survey efforts.

181
Key Data Improvements for the U.S. Statistical System
Develop Consistent Business Identifiers The enactment of the Confidential Information Protection and Statistical Efficiency Act (CIPSEA) in 2002 was intended to establish consistent protection for confidential information collected by individual statistical agencies within the currently decentralized federal statistical system and provide increased opportunities to share data for statistical purposes among the agencies under specific written agreements. While this might have raised expectations about linking micro-level data across agencies to use currently available data more effectively in addressing cross-cutting issues, those expectations have yet to be fully realized. One reason for that is the difficulty in linking micro-level business data when the three major statistical agencies, BEA, BLS and Census, maintain different systems for identifying business firms or establishments within their own jurisdictions. This lack of a common, consistent central business register has contributed to a number of data gaps and data quality issues affecting the ability to estimate the extent and major economic impacts of services off-shoring. The business register maintained by the Census bureau contains basic organizational information, industry classification and operating data for each establishment, firm or company, and major intra-company organizational unit. Unfortunately, these operating data also contain information derived from tax records, and this creates additional issues concerning access to tax data that were not fully addressed or resolved in CIPSEA and may require additional legislation to resolve. Currently an MOU between Census and BLS provides BLS access to the Census business register on a confidential basis for research purposes only. This limited access does not allow BLS to use information from the business register to improve its sampling designs for any of its surveys or for any administrative purposes. BLS has been supplying Census with quarterly updates on employment and other information at the establishment level since BLS establishment data are the most current among the major federal statistical agencies. BEA has not yet been able to execute a similar MOU with Census, although BEA staff indicated that a July 6, 2006 temporary federal register notice issued by IRS providing BEA restricted access to certain tax data should facilitate the issuance of an MOU. The Panel recognizes that each of these three agencies need and collect data from business entities at different organizational levels to meet their specific information needs at varying time intervals. As this report has noted, BLS collects various types of employment data at the establishment level at monthly as well as quarterly intervals. BEA’s trade and foreign investment needs require quarterly collections from MNCs that may be firms with single or multiple EINs or conglomerate holding companies with multiple firms and multiple EINs. This report has also indicated several instances where sharing data between agencies can enhance an agency’s understanding of its own data and can address issues that cross-cut individual agencies, most especially. the extent and impact of services off-shoring. A consistent set of identifiers for components within complex U.S. business entities would help each agency understand how the business components it surveys fit within a consolidated

182
national or international business entity. This would also retain the most advantageous features of each agency’s current business identification system. Most importantly, consistency would facilitate data sharing that could enhance the usefulness of separately collected data in understanding major cross-cutting issues, especially services off-shoring. Therefore,
The Panel recommends that BEA, BLS, and Census should work together to develop and maintain a consistent set of identifiers for each level of organization within every consolidated business entity in the United States. This would include shared location data for various entities and consistent methodology for assigning industrial classifications to them.
Developing a consistent set of business identifiers with common current addresses is the first step in helping BEA improve its mailing lists for services imports surveys. This change would eliminate the use of different firm identifiers for MNCs importing both affiliated and unaffiliated services, which also would be accomplished through BEA’s proposal to adopt a common survey. The key advantage, however, is the impact on future data sharing and linking micro-level data across agencies. For example, this change would improve the ability to match BEA’s MNC data with BLS establishment data and business establishments in the economic census, thus improving understanding of the extent and impact of services off-shoring and other cross-cutting issues. Key Data Improvements for BLS
Redesign OES Sample for Multi-Establishment Firms and Longitudinal Analysis The analyses of changes in occupational employment shares and their relation to services outsourcing and off-shoring presented in chapters four and five demonstrate the importance of understanding these distributional effects for firms or industries that have off-shored services. These analyses also indicated that changes in occupational structures reflect the impact of a number of economic factors. Services off-shoring is one of those, but appears to be a relatively minor one for the industries reviewed, at least at the moment. These analyses also indicated the value of examining individual firm behavior using micro-level data. The current sampling design for the OES program produces reliable estimates of occupational employment by industry and geographic area within the U.S. to meet not only BLS requirements but also specific state needs as funding comes from state trust funds under the Wagner-Peyser Act. Yet the design limits analysis of occupational shifts and wage changes over time for specific firms, particularly MNCs with multiple establishments. Specifically, it is difficult to know whether the few establishments matched for MNCs in the OES data were representative of all the MNC’s establishments,
The Panel recommends that BLS should develop additional sampling panels for its OES program to provide representation for multi-establishment firms at a national level and to support longitudinal analysis for single and multi-establishment firms

183
This change would require additional resources, even if some of the additional sampling panels could be accommodated within the overall sample without sacrificing the quality and reliability of geographic and industry-level estimates. Developing the capability of longitudinal analysis at a national level can demonstrate the value of monitoring occupational shifts for particular firms over time for potential future application to specific geographical areas. For example, this change would not only enhance future research on the impact of services off-shoring on employment, wages and occupational changes but could also provide greater understanding of the role of large complex firms, e.g. MNCs, in the economy and particular local labor markets including their impact on the demand for specific occupations and wages in those markets. Longitudinal analysis of occupational changes among firms, particularly large, complex firms, may also improve understanding of outsourcing among U.S. businesses. Some recent research has suggested that a better understanding of outsourcing activities may improve our assessment of estimated productivity changes in the U.S. economy.131 Additional Data Recommendations for BEA
Develop Estimates of MNC Value Added for Services The value of BEA MNC data for estimating the extent of services off-shoring and its major impacts is currently diminished by the inability to distinguish purchased services inputs from all purchased inputs. Purchased services inputs are needed to develop indicators for the extent of a MNC’s services outsourcing and off-shoring. While the extent of services outsourcing is important due to its own economic and employment effects on the individual firm, it also has potentially significant implications for services off-shoring. Since services off-shoring due to business restructuring can be a subset of services outsourcing, current levels of services outsourcing reflect potential future growth opportunities for services off-shoring. The extent to which that potential is realized will depend upon future changes in the net returns from outsourcing relative to off-shoring. The Panel recognizes that the feasibility of modifying BEA surveys to collect such data depends directly upon the ability of business accounting systems to supply that level of detail. Previous BEA efforts to collect similar data have demonstrated that business accounting systems are not able to supply such detail, other estimation approaches will be needed. One alternative might be to link BEA MNC parent data to economic census data. This would allow identification of manufacturing establishments within the MNC parent and these could be used to develop estimates of value added for that parent’s goods-producing activities. In theory, subtracting these goods-producing value added estimates from total parent value added would yield the value added generated by the parent’s service producing establishments. Another alternative might be to use the more detailed benchmark I-O industry analyses to estimate the services component of total MNC purchased inputs and value added. This would
131 Op.cit., Dey, Houseman and Polivka, Contracting Out to Employment Services: Analysis Using the OES, CES and CPS, and Houseman, Outsourcing, Off-shoring, and Productivity Measurement in Manufacturing.

184
involve applying the industry distribution of services purchased inputs relative to all purchased inputs to all MNCs within the same industry. Therefore,
The Panel recommends that BEA should explore other available data, such as the economic census or benchmark I-O industry estimates, and estimation techniques to help it allocate MNC value added between services and other activities.
This change would require assessing whether benchmark data from the economic census or industry level data from BEA I-O tables could be used to estimate the proportion of a MNC parent’s value added used to produce services outputs. If these techniques can provide a reasonable estimate of the services component of a MNC parent’s value added, then total purchased services inputs can still be estimated as the difference between services sales and services value added.
Develop Consistent Accounting for Affiliated and Unaffiliated Services Imports in BEA I-O Tables
Currently, affiliated services imports are shown separately from unaffiliated services imports and are accounted for differently in BEA I-O tables as “non-comparable” imports. The differences in the detailed services collected for unaffiliated imports precluded providing more consistent treatment. With similar details for both types of services imports, BEA staff would be able to separate affiliated services imports from the “non-comparable” import category in the BEA I-O tables and develop accounting linkages between them and unaffiliated services imports of the same type.
The Panel recommends that BEA staff should work to remove affiliated imports from the ‘non-comparable” imports component within its I-O tables and link them more closely with the same type of unaffiliated services.
This will require coordination between BEA industry and international staffs to ensure that affiliated and unaffiliated services imports in these I-O tables can be linked without losing information and insight currently available from each type of import. It may also be true that some affiliated service imports may have no domestic counterpart and are therefore truly “non-comparable.” The additional detail to be obtained should help resolve this potential problem. This change will also ensure that total commodity outputs in the I-O tables include both unaffiliated and affiliated imports and that imported services for specific commodities displayed in these tables are also complete. This should prevent future potential underestimates of the intermediate use of specific services, since total services imports, and not simply unaffiliated services imports, will be allocated between intermediate and other uses.
Accelerate Availability of MNC Financial and Operating Data BEA staff have made numerous efforts to improve the timeliness of the services import data. BEA continues to explore ways to encourage its respondents to submit their data electronically

185
using the ASTAR system, but many of their larger MNCs remain unwilling or unable to use that system. This is particularly unfortunate because, as Chapter 6 has indicated, only a limited percentage of MNCs import services and these tended to be disproportionately large, at least for the sectors reviewed in detail for this report. Since BEA can identify from its current data those MNCs that import services, BEA could use this ability to focus on these particular MNCs. If this group continues to represent a relatively small percentage of all MNCs, BEA could consider focusing additional resources or assigning higher priority to processing these MNC data.
The Panel recommends that BEA should reallocate priorities and, if necessary resources, to accelerate the processing of MNC data for those MNCs importing services.
Since this would involve some additional resources, BEA may want to test this for a sample of large MNC services importers to determine the resources need to accelerate the availability of services import data. Accelerating the availability of preliminary estimates based on this sample of larger MNCs by a quarter would have permitted analysis of (at least preliminary) 2004 data for this report.
Collect Data on Imports for Intermediate Use While this data gap has the potential to improve most directly the measures used to assess the extent of services off-shoring, it also appears to be the one with the fewest effects on other broad economic issues. For example, improving the quality of BEA’s survey mailing lists for services imports will not only improve our estimates of the extent of off-shoring, but will improve other trade estimates, such as quarterly balance of payments estimates. The costs and effectiveness of obtaining these intermediate use estimates is also somewhat uncertain. The Panel acknowledges the conceptual difficulties facing this type of collection effort, given the multiple and complex transactions that occur within the large, dynamic U.S. economy. This is particularly acute for the services sector relative to the manufacturing sector. As BEA has acknowledged, their MNC surveys currently ask respondents to distinguish intermediate use from final demand use for goods imports. But BEA officials stated that they have not been successful in overcoming the conceptual and measurement hurdles present by service type imports.
The Panel recommends that BEA should consider limited sampling of MNC service importers to test their ability to distinguish the use of particular types of services imports for their own use rather than for sale to others.
BEA industry account staff have developed an algorithm for allocating affiliated services imports to intermediate use by commodity type within their I-O tables. Once common service type categories for both affiliated and unaffiliated services have been adopted and BEA staff have been able to link their accounting treatment of these two types of services imports in the I-O

186
tables, BEA should assess the accuracy of that algorithm and determine its applicability to allocating unaffiliated services imports between intermediate and other uses. BEA staff have also maintained that most BPT services imports appear to be used by the importing firm either internally, or combined with other services and products before sale to final consumers. While that may be true given the limited types of services currently identified for U.S economic activity, as more detailed services categories are developed over time, this distinction between services imported for intermediate use and for final demand may become increasingly important. It may be easier to test the ability to distinguish between these different usages while the detailed types of services and the use for final demand are relatively small. Additional Data Recommendations for BLS
Apply Additional Sampling Criteria for the MLS Program BLS’ MLS program identifies major lay-off events at individual establishments and surveys those establishments to obtain more detailed information on the nature of the event. It does so by using administrative data available from the comprehensive set of establishments within the QCEW. MLS is the only direct survey that asks U.S. employers whether a major lay-off at an establishment involved movement of work activity overseas. It focuses on major lay-off events that are highly disruptive to surrounding communities and involve often substantial adjustment issues for displaced employees. As a result, its targeting criteria are not aimed at detecting services off-shoring activities that are either less immediate or more dispersed throughout the firm. Starting in 2007, BLS will obtain monthly data from states on all lay-offs, regardless of size. This more detailed universe of events provides an opportunity to use additional selection criteria for surveying firms with specific lay-offs. The Panel believes this opportunity could be used to address future services off-shoring issues by using different criteria for some of the follow-up surveys. These criteria could include BEA surveyed MNCs that have increased services off-shoring or BLS surveyed establishments that have experienced major occupational changes consistent with services outsourcing or off-shoring.
To better address future services off-shoring issues, the Panel recommends that BLS should develop additional survey criteria to target firms or establishments likely to be off-shoring or outsourcing services in a supplement to its MLS program in 2007 and future years.
This recommendation would require additional resources, but it will utilize an already planned expansion of a program that effectively combines administrative data with targeted sampling information.
Publish 3-digit Level Data on Standard Occupation Codes
The industry-level analyses in Chapters 4 and 5 also showed the value of examining these occupational changes at disaggregated levels—more specifically at the 3-digit and 6-digit SOC

187
levels. While the BLS has provided the aggregate 2-digit and the detailed 6-digit SOC data for the OES program on its website, it has not yet done so for the intermediate 3-digit level. Unfortunately, attempts to aggregate the detailed 6-digit data to develop 3-digit data for this report encountered confidentiality and other data issues described in those chapters. Specifically, the 3-digit data developed for this report by aggregating the 6-digit data undercounted actual 3-digit data because certain 6-digit data elements in the publicly available data had been suppressed for confidentiality reasons. Consequently, the analyses of occupational changes at the 3-digit level in this report used a truncated data set. BLS staff can avoid these data issues by creating 3-digit SOC data sets for their OES data and making them available to the public.
The Panel recommends that BLS should provide OES data at a 3-digit level on its website, in addition to the 2- and 6-digit SOC levels already provided.
While the creation of publicly available 3-digit data provide detailed estimates that may require additional data suppression of current 6-digit data elements, the extent of this effect on the quality and scope of currently available data is not clear. BLS should determine the extent of any addition data suppression that would result from this recommendation and assess the significance of any reduction in current data quality relative to the additional information provided by releasing data at this intermediate, 3-digit level. CONCLUSION Current levels of services off-shoring may be small, but there exists the potential for future growth in this phenomenon, given the extent of services outsourcing and continuing technological changes. The Panel believes it is prudent to improve existing data systems now to increase the ability to detect and monitor future services off-shoring activities and their economic impacts

188

Attachment A
189
The Annual Survey of Selected Service Transactions with Unaffiliated Foreign Persons [BE-22]
The BE-22 survey collects data on the following types of services imports:
• advertising services; • auxiliary insurance services; • miscellaneous disbursements or outlays to fund news-gathering costs of broadcasters,
news-gathering costs of print media, production costs of motion picture MNCs, production costs of broadcast program material other than news, to maintain government tourism and business promotions offices, and maintain sales promotion and representative offices;
• education and training services; • computer and data processing services; • database and other information services; • telecommunications services; • research, development, and testing services; • management, consulting, and public relations services; • legal services; • industrial engineering services; • industrial-type maintenance; • installation, alterations and training services; • construction services; • engineering, architectural and surveying services; • merchanting services; • operating leasing; • mining services; • other private services (language translations services, security services, collection
services, salvage services, satellite photography and remote sensing/satellite imaging services, space transport, and transcription services);
• other trade-related services; • performing arts, sports, and other live performances, presentations, and events • purchase of rights to natural resources, and lease bonus payments; • use or lease of rights to natural resources, excluding lease bonus payments; waste
treatment and depollution services; and • purchases of financial services transactions not reported on the BE-82 survey.

190

191
SECTION III
APPENDICES

192

APPENDIX A
193
PANEL AND STAFF LISTING PANEL Janet L. Norwood, Panel Chair*∗—Counselor and Senior Fellow, Conference Board. Former Senior Fellow, The Urban Institute; Commissioner, Bureau of Labor Statistics, U.S. Department of Labor; Research Associate, William L. Clayton Center, Fletcher School of Law and Diplomacy, Tufts University. Carol Carson—Former Director of the Statistics Department of the International Monetary Fund. Former Director of the Bureau of Economic Analysis of the Department of Commerce; various positions with the Department of Commerce including Deputy Director of BEA, Chief Economist, and Editor-in-Chief of the Survey of Current Business; fellow of the National Association of Business Economics; member of the executive committee of the Conference on Research in Income and Wealth. Manuel Deese*—Managing Partner, Deese, Hastings, & Miller. Former Executive Vice President, Blue Cross and Blue Shield of Virginia; City Manager, Assistant City Manager for Operations, and Assistant City Manager for Administration, City of Richmond, Virginia; Assistant to the City Manager, City of Alexandria, Virginia. Norman J. Johnson*—Professor/Director, School of Business and Industry, Florida A&M University. Former President and Elected Member, Atlanta School Board; Special Assistant to the Provost, Georgia Institute of Technology; Associate Vice President for Academic Human Resource Development, and Professor of Organizational Effectiveness, Carnegie Mellon University; Associate Dean, Professor of Social Policy, and Chair, M.S. Program, School of Urban and Public Affairs, Carnegie Mellon. Franklin S. Reeder*—President, The Reeder Group. Former Director, Office of Administration, The White House. Former positions with the U.S. Office of Management and Budget: Deputy Associate Director for Veterans Affairs and Personnel; Assistant Director for General Management and Deputy Assistant Director; Chief, Information Policy Branch and Deputy Chief; Policy Analyst; and Chief, Systems Development Branch. Former Deputy Director, House Information Systems, and Committee Staff, Committee on House Administration, U.S. House of Representatives. Former positions with the U.S. Department of the Treasury and the U.S. Department of Defense focusing on information technology and systems. John E. Rolph—Professor, University of Southern California, Los Angeles; Founding Head, RAND Statistics Group; faculty positions at the University of London, Columbia University, the RAND Graduate School of Policy Studies, and the RAND/UCLA Health Policy Center; Fellow of the American Statistical Association, the Institute of Mathematical Statistics, the American
∗ Academy Fellow

APPENDIX A
194
Association for the Advancement of Science, and the International Statistical Institute; Chair of the National Research Council’s Committee on National Statistics. STAFF J. William Gadsby,∗ Vice President for Academy Studies—Former Director, Management Studies Program, National Academy of Public Administration. Former positions with the U.S. General Accounting Office: Senior Executive Service; Director, Government Business Operations Issues; Director, Federal Management Issues; Director, Intergovernmental and Management Issues. Former Assistant Director, Financial Management Branch, U.S. Office of Management and Budget. Terry F. Buss, Ph.D., Program Area Director—Former Dean, School of Policy and Management, Florida International University; Policy Director, Community Development and Planning, U.S. Department of Housing and Urban Development; Senior Policy Analyst, Congressional Research Service; Senior Strategy Advisor, World Bank; Senior Policy Advisor, Council of Governors’ Policy Advisors; consultant for U.S. Information Service and U.S. Agency for International Development in 10 countries; director of policy research centers at Ohio State, Youngstown State, and University of Akron; director of public management departments at University of Akron and Suffolk University. Two-time Fulbright Scholar—Hungary. Kenneth F. Ryder Jr., Project Director—Served as project director for three other Academy studies on the U.S Park Police, Presidio Trust Corporation, and Patent and Trademark Office. Consultant to the Academy on several other studies and to other federal agencies and entities on a range of economic, financial, banking, housing, budgeting, and financial management issues. Former Senior Executive Service; Executive Director, Research and Analysis, Office of Thrift Supervision; Positions with the U.S. Office of Management and Budget, including Deputy Associate Director, Housing, Treasury and Finance Division, and Deputy Associate Director, Special Studies Division, Economics and Government; Economist, the RAND Corporation Harry G. Meyers, Ph.D., Senior Advisor—Economic and Financial Consultant to the Academy. Former Senior Executive Service; Team Leader, Analytical Consulting Team, U.S. Census Bureau; Chief for Treasury Branch and Commerce and Justice Branch, Office of Management and Budget; Chief and Senior Economist , Special Studies Division, Economics and Government Area OMB. Work at Census and OMB involved statistical analyses of various federal programs and evaluations of major databases. Also served as Senior Analyst for the 1981 President’s Housing Commission and as financial economist in the Office of Government Financing in Treasury Department. Gwyneth H. Caverly, Senior Research Analyst—Former Researcher, Global Workforce in Transition, Indefinite Quantity Contract, United States Agency for International Development; Researcher, Center for Economic Policy Analysis—United Nations initiative; and Peace Corps volunteer and administrator. ∗ Academy Fellow

APPENDIX A
195
Bryce Stephens, Senior Research Analyst—Doctorate degree candidate in economics at the University of Maryland; Spent the past five years working directly with federal administrative and survey microdata as an Economist with the U.S. Census Bureau’s Longitudinal Employer-Household Dynamics Program (LEHD). While at LEHD, he worked primarily on the development of the Quarterly Workforce Indicators. Noel A. Popwell, Senior Research Associate—Former Program /Budget Analyst, Federal Reserve Board; former Budget/Management Analyst, City of Alexandria, Virginia; Master of Public Administration, American University; Bachelor of Arts in Economics, Hunter College, New York. Nathan D. Winstead, Senior Research Associate—Development Officer and Research Associate. Project staff on past Academy studies: Centers for Disease Control and Prevention and Office of Personnel Management PART Review. Bachelors of Science, Management in Public Affairs, Indiana University. Martha S. Ditmeyer, Senior Administrative Specialist—Former staff member of the Massachusetts Institute of Technology and of the Communications Satellite Corporation, Washington, D.C. and Geneva, Switzerland.

196

APPENDIX B
197
INDIVIDUALS INTERVIEWED OR CONSULTED FEDERAL AGENCIES Department of Commerce Kathleen Cooper, Undersecretary for Economic Affairs Office of Technology Policy Ben Wu, Assistant Secretary for Technology Policy Daniel Caprio, Deputy Assistant Secretary for Technology Policy Connie Chang, Acting Director Mark Boroush, Policy Analyst Laureen Daly, Policy Analyst Douglas Devereaux, Policy Analyst John Sargent, Senior Policy Analyst Bureau of the Census Hermann Habermann, Deputy Director and Chief Operating Officer Thomas Mesenbourg, Assistant Director for Economic Programs Ronald H. Lee, Senior Financial Advisor, Office of the Associate Director Daniel Weinberg, Chief Economist, Center for Economic Studies Bureau of Economic Analysis Steve Landefeld, Director Rosemary Marcuss, Deputy Director Ralph Kozlow, Associate Director for International Economics Obie Whichard, Chief, International Investment Division Ned Howenstine, Chief, Research Branch, International Investment Division Patricia Aboroa, Special Assistant to the Associate Director for International Economics Jiemin Guo, Senior Economist, Industrial Accounts Maria Borga, Research Branch, International Investment Division Ray Mataloni, Research Branch, International Investment Division William Zeile, Research Branch, International Investment Division Mark Planting, Chief, Annual Input-Output Branch, Industrial Accounts Robert Yuskavage, Industrial Accounts Gabriel Medeiros, Annual Input-Output Branch, Annual Input-Output Branch Economics and Statistics Administration Patricia Buckley, Senior Policy Advisor Keith Hall, Chief Economist International Trade Administration David Long, Director, Office of Service Industries Sara Hagigh, International Trade Specialist, Office of Service Industries

APPENDIX B
198
Department of Labor Bureau of Labor Statistics Kathleen Utgoff, Commissioner Phil Rones, Deputy Commissioner Sharon P. Brown, Chief, Local Area Unemployment Statistics Richard Clayton, Chief, Division of Administrative Statistics and Labor Turnover James Franklin, Supervisory Economist, Office of Employment Projections Pat Getz, Assistant Commissioner, Office of Industry Employment Statistics Cheryl Kerr, Economist, Office of the Commissioner Mike Pilot, Chief, Division of Occupational Outlook Norman Saunders, Senior Economist, Office of Employment Projections James Spletzer, Senior Research Economist, Office of Employment and Unemployment Statistics George D. Stamas, Division Chief, Occupational Employment Statistics Employment and Training Administration Gardner Carrick, Communications Director Terry Clark, Assistant to the Trade Adjustment Assistance Division Director Wayne Gordon, Team Leader, Office of Policy Development and Research Jacqui Shoholm, Director, Division of Policy and Legislation Kimberly Vitelli, Manpower Analyst Department of the Treasury Office of Thrift Supervision Scott Albinson, Managing Director for Supervision Donna Deale, Assistant Managing Director, Examination and Supervision Policy Robert Engelbreth, Director, Information Technology Risk INDEPENDENT AGENCIES Congressional Research Service Mary Jane Bolle, Analyst, Foreign Affairs, Defense and Trade Division General Accountability Office Virginia Hughes, Assistant Director, International Affairs and Trade Bradley Hunt, Analyst Judith Knepper, Project Manager, International Affairs and Trade Loren Yeager, Director, International Affairs and Trade International Trade Commission Richard Brown, Chief, Services and Investment Division Michael Ferrentino, Economist Eric Forden, International Trade Analyst

APPENDIX B
199
National Academy of Sciences Connie Citro, Director of the Committee on National Statistics Jane Ross, Director, Center for Social and Economic Studies Michael Moloney, Program Officer, National Research Council National Science Foundation Jacqueline Meszaros, Director, Division of Social and Economic Sciences Office of Management and Budget Katherine Wallman, Chief Statistician Paul Bugg, Desk Officer Office of the U.S Trade Representative David Walters, Assistant U.S. Trade Representative for Economic Affairs US China Commission Thomas Palley, Chief Economist UNITED STATES SENATE Office of Senator Joseph Lieberman Paul Brand, Legislative Fellow BUSINESS GROUPS Business Roundtable Chuck Levy, Consultant Chamber of Commerce Brian Josten, Executive Vice President, Government Affairs Martin Regalia, Vice President for Economic and Tax Policy National Association of Manufacturers David Huether, Chief Economist Patricia Long, Vice President of Advocacy and Policy Research INTERNATIONAL ORGANIZATIONS International Monetary Fund Neil Patterson, Assistant Director, Balance of Payments and External Debt Division Mary Amiti, Research Department John Motala, Senior Economist

APPENDIX B
200
Organization for Economic Co-operation and Development Nobuo Tanaka, Director, Science, Technology and Industry Desiree van Welsum Graham Vickery Dirk Pilat Statistics Canada Yvan Gervais, Coordinator, Research and Analysis, Business and Trade Statistics Field Pier-Paul Proulx, Senior Research Advisor, Policy Research Initiative Arthur Ridgeway, Director, Balance of Payments Division Jean-Pierre Simard, Services Division Ted Wannell, Labour and Household Surveys Analysis Division Gary Sawchuk, Policy Research Initiative Rene Morissette, Business and Labour Market Analysis Division Sebastien LaRochelle-Cote, Business and Labour Market Analysis Division Industry Canada Prakash Sharma International Trade Canada Shenjie Chen David Dodds OFF-SHORING VENDORS Agilent Technologies Anita Manwani, Former Vice President GTL Limited Michael T. Clark, CEO and President International Association of Outsourcing Professionals Mike Corbett, Executive Director neo-IT Atul Vashista, Chief Executive Officer PRIVATE RESEARCH GROUPS EvalueServe Alok Aggarwal, CEO

APPENDIX B
201
Forrester Research John McCartney, Vice President Global Insight Nariman Behravesh, Chief Economist McKinsey Inc Diane Farrell, Director of Research Martha Laboissiere National Bureau of Asian Research Joyce Noonan, Assistant Director for Globalization Programs National Opinion Research Center Julia Lane, Senior Vice President and Director, Economics, Labor and Population Studies THINK TANKS American Enterprise Institute Kevin Hassett, Director of Economic Policy Studies Economic Policy Institute Josh Bivens, Economist Lee Price, Research Director Robert Scott, Economist Institute for International Economics Martin Baily, Senior Fellow Bradford Jensen, Deputy Director Catherine Mann, Senior Fellow Jacob Kirkegaard, Research Associate Woodrow Wilson Center Kent Hughes, Director, Project on America and the Global Economy Lynn Sha, Program Associate TRADE ASSOCIATIONS Association for Computing Machinery Cameron Wilson, Director

APPENDIX B
202
American Electronics Association Josh James, Manager of Research Matthew Kazmierczak, Director of Research Information Technology Association of America Jeffrey Lande, Senior Vice President Institute of Electrical and Electronics Engineers Russell Harrison, Legislative Representative, Grassroots Activities Vin O’Neill, Legislative Representative, IEEE UNIONS American Federation of Labor-Congress of Industrial Organizations Paul Almeida, President Ronald Blackwell, Chief Economist Michael Gildea, Executive Director Thea Lee, Assistant Director for International Economics WashTech/CWA Marcus Courtney, President UNIVERSITIES Carnegie Mellon University Ashish Arora, Associate Professor Georgetown University Robert Bednarzik, Visiting Professor, Public Policy Institute Lindsay Lowell, Professor Johns Hopkins University Burt Barnow, Associate Director for Research, Institute for Public Policy Studies Indiana University William Aspray, Professor of Informatics Massachusetts Institute of Technology Tim Sturgeon, Senior Research Affiliate, Industrial Performance Center Rochester Institute of Technology Policy Ron Hira, Assistant Professor

APPENDIX B
203
Stanford University Rafiq Dossani, Senior Research Scholar, Asia-Pacific Research Center Eric Roberts, Professor University of California, Berkeley Cynthia Kroll, Researcher University of California, Davis Martin Kenney, Professor University of Dartmouth Matthew Slaughter, Associate Professor University of Maryland John Haltiwanger, Professor Jeff Werling, President, InForum WE Upjohn Institute Susan Houseman, Senior Economist

204

APPENDIX C
205
SELECTED BIBLIOGRAPHY
Abowd, John M., John Haltiwanger, and Julia Lane. “Integrated Longitudinal Employee-
Employer Data for the United States.” American Economic Review 94 (2) (May 2004): 224-229.
Abowd, John M., Paul Lengermann, and Kevin L. McKinney. “The Measurement of Human
Capital in the U.S. Economy.” March 2003. AFL-CIO. “The Bush Record on Shipping Jobs Overseas.” Washington, D.C.: AFL-CIO, 2004. _____. “Corporate Myths about Shipping Jobs Overseas.” 2005. Available at
http://www.aflcio.org/yourjobeconomy/jobs/outsourcing_myths.cfm. _____. “Corporations Doubled the Number of Jobs Sent Overseas in Three Years.” Washington
D.C.: AFL-CIO, 2004. <http://www.aflcio.org/yourjobeconomy/jobs/ns10202004.cfm>. _____. “Crisis in Manufacturing.” Washington, D.C.: AFL-CIO, 2004. _____. “Declining Job Quality: Here to Stay?” Washington, D.C.: AFL-CIO, 2004. _____. “Outsourcing America.” Washington, D.C.:AFL-CIO, 2004. _____. “Shipping Jobs Overseas: How Real Is the Problem?” Washington, D.C.: AFL-CIO,
2005. Aggrawal, Swati, Terry Levine, and Brian Jennings. “Outsourcing: Perspectives and its
Economic Impact.” Presentation. 2005. Agrawal, Vivek and Diana Farrell. “Who Wins in Offshoring.” The McKinsey Quarterly, 2003
Special Edition: Global Directions (2003). Agrawal, Vivek, Diana Farrell, and Jaana K. Remes. “Offshoring and Beyond.” The McKinsey
Quarterly, 2003 Special Edition: Global Directions (2003). Ahearn, Raymond J. “U.S.-European Union Trade Relations: Issues and Policy Challenges.”
IB10087. Washington, D.C.: Congressional Research Service, March 2003. Allegretto, Sylvia, Jared Bernstein, and Isaac Shapiro. “The Lukewarm 2004 Labor Market:
Despite Some Signs of Improvement, Wages Fell, Job Growth Lagged, and Unemployment Spells Remained Long.” Washington, D.C.: Economic Policy Institute, February 2005.
American Enterprise Institute for Public Policy Research. “Polls on NAFTA: A 10-Year
Review.” AEI, December 2003.

APPENDIX C
206
_____. “Summary: Domestic Effects of Foreign Direct Investment.” AEI Conference on
Domestic Effects of Foreign Direct Investment, 2 December 2004. 28 April 2005 <http://www.aei.org/events/filter.,eventID.957/summary.asp>.
Ahn, Sanghoon, Dongheon Lee, Siwook Lee, and Cheonsik Woo. “The Economic Impacts of
Outbound FDI and Trade: The Case of Korea.” Presented at the OECD Conference. Paris, France, November 2005.
Amiti, Mary and Shang-Jin Wei. “Fear of Service Outsourcing: Is it Justified?” WP/04/186.
Washington, D.C.: International Monetary Fund, October 2004. Presented at the OECD Conference. Paris, France, November 2005.
_____. “Service Offshoring, Productivity, and Employment: Evidence from the United States” WP/05/238. Washington, D.C.: International Monetary Fund, December 2005. Presented at the Conference on International Service Flows. Bethesda, MD, April 2006. Andersson, Fredrik, Harry J. Holzer and Julia I. Lane, “Moving Up or Moving On: Who
Advances in the Low-Wage Labor Market.” New York: Russell Sage Foundation, 2005 Antrás, Pol and Elhanan Helpman. “Global Sourcing.” Journal of Political Economy 112 (3)
(June 2004): 552-580. Antrás, Pol, Luis Garicano, and Esteban Rossi-Hansberg. “Offshoring in a Knowledge
Economy.” Cambridge, MA: National Bureau of Economic Research, January 2005. Arora, Ashish. “From Underdogs to Tigers: The Emerging Offshore Software Industries and the
US Economy.” Presentation at Brookings Trade Forum Offshoring White-Collar Work – The Issues and the Implications, 12-13 May 2005.
A.T. Kearney. A.T. Kearney’s 2004 Offshore Location Attractiveness Index: Making Offshore
Decisions. Chicago: A.T. Kearney, Inc., 2004. Atkinson, Robert. “Meeting the Offshoring Challenge.” Washington, D.C.: Progressive Policy
Institute, July 2004. ____. “Understanding the Offshoring Challenge.” Washington, D.C.: Progressive Policy
Institute, May 2004. Aubert, Patrick and Patrick Sillard. “Offshoring and Job Losses in French Industry.” Series of
working papers of the Directorate for Economic Studies and Analysis: April 2005. Presented at the OECD Conference. Paris, France, November 2005.

APPENDIX C
207
Baily, Martin N. and Diana Farrell. “Exploding the Myths about Offshoring.” McKinsey Global
Institute, April 2004. Baily, Martin Neil and Robert Z. Lawrence. “Don’t Blame Trade for U.S. Job Losses.” The
McKinsey Quarterly 1 (2005). _____. “What Happened to the Great US Job Machine? The Role of Trade and Electronic
Offshoring.” Brookings Papers on Economics Activity 2 (2004). Balaker, Ted, and Adrian T. Moore. “Offshoring and Public Fear: Assessing the Real Threat to
Jobs.” Reason Foundation, May 2005. Balasubramanian, Ramnath and Asutosh Padhi. “The Next Wave in US Offshoring.” The
McKinsey Quarterly 1 (2005). Bardhan, Ashok Deo and Dwight Jaffee. “On Intra-Firm Trade and Multinationals: Foreign
Outsourcing and Offshoring in Manufacturing.” University of California, April 2004. Bardhan, Ashok Deo and Cynthia A. Kroll. “The New Wave of Outsourcing.” Research Report,
Fisher Center for Real Estate and Urban Economics—University of California (2003). Barfield, Claude. High-Tech Protectionism: The Irrationality of Antidumping Laws.
Washington, D.C.: AEI Press, 2003. Barnow, Burt S. and Christopher T. King. “The Workforce Investment Act in Eight States.”
Washington, D.C.: U.S. Department of Labor, February 2005. Barry, Frank and Desiree van Welsum. “Services FDI and Offshoring into Ireland.” Paper
prepared for the OECD Directorate for Science, Technology and Industry Panel Session on Offshoring, 9-10 June 2005.
Bartelsman, Eric, Stefano Scarpetta, and Fabiano Schivardi. “Comparative Analysis of Firm
Demographics and Survival: Micro-Level Evidence for the OECD Countries.” Paris: Organisation for Economic Co-operation and Development, 2003.
Batt, Rosemary, Virginia Doellgast, and Hyunji Kwon. “A Comparison of Service Management
and Employment Systems Among In-house, Outsourced, and Offshore Call Centers.” Paper prepared for the Brookings Trade Forum Offshoring White-Collar Work –The Issues and Implications, Washington, D.C., 12-13 May 2005.
Bayoumi, Tamin, and Marcus Haacker. “It’s Not What You Make, It’s How You Use It:
Measuring the Welfare Benefits of the IT Revolution Across Countries.” Discussion Paper 3555. London: Centre for Economic Policy Research, September 2002.

APPENDIX C
208
Becker, Sascha O., Karolina Ekholm, Robert J¨ackle, and Marc-Andreas Muendler. “Location Choice and Employment Decisions: A Comparison of German and Swedish Multinationals.” August 2005. Presented at the OECD Conference. Paris, France, November 2005. Benedetto, Gary, et al. “Using Worker Flows to Measure Firm Dynamics.” Washington, D.C.:
U.S. Census Bureau, May 2004. Bergmann, Markus, Ramesh Mangaleswaran, and Glenn A. Mercer. “Global Sourcing in the
Auto Industry.” The McKinsey Quarterly, 2004 Special Edition: China Today (2004). Bergsten, C. Fred, and the Institute for International Economics. “The United States and the
World Economy: Foreign Economic Policy for the Next Decade.” Washington, D.C.: Institute for International Economics, January 2005.
Berman, Jay M. “Industry Output and Employment Projections to 2012.” Monthly Labor
Review (February 2004): 58-79. Bernard, Andrew B., J. Bradford Jensen, and Peter K Schott. “Falling Trade Costs,
Heterogeneous Firms, and Industry Dynamics.” March 2004. _____. “Importers, Exporters and Multinationals: A Portrait of Firms in the U.S. that Trade
Goods.” April 2005. Bhagwati, Jagdish, Arvind Panagariya, and T.N. Srinivasan. “The Muddles over Outsourcing.”
The Journal of Economic Perspectives 18(4) (Fall 2004): 93-114. _____. “Why Your Job Isn’t Moving to Bangalore.” Washington, D.C.: American Enterprise
Institute for Public Policy Research, March 2004. Bivens, Josh. “Shifting Blame for Manufacturing Job Loss: Effect of Rising Trade Deficit
Shouldn’t be Ignored.” Washington D.C.: Economic Policy Institute, undated. Borga, Maria. “Trends in Employment at U.S. Multinational Companies: Evidence from Firm-
Level Data.” Paper presented at the Brookings Trade Forum Offshoring White-Collar Work –The Issues and Implications, Washington, D.C., 12-13 May 2005.
_____. “Addressing Selected Issues in U.S. Bureau of Economic Analysis Estimates of U.S. International Services: Improved Measures of Insurance, Wholesale and Retail Trade, and Financial Services.” Washington, D.C.: U.S. Bureau of Economic Analysis. Presented at the Conference on International Service Flows. Bethesda, MD, April 2006. Borga, Maria and Michael Mann. “Cross-Border Trade in 2002 and Sales Through Affiliates in
2001.” Survey of Current Business (October 2003): 58-118.

APPENDIX C
209
____. “Cross-Border Trade in 2003 and Sales Through Affiliates in 2002.” Survey of Current Business (October 2004): 25-76.
Borga, Maria and William J. Zeile. “International Fragmentation of Production and the Intrafirm
Trade of U.S. Multinational Companies.” WP2004-02. Washington, D.C.: U.S. Bureau of Economic Analysis, January 2004.
Bottino, Susan J. “Perspective on Offshoring and New Jersey.” Trenton, N.J.: New Jersey
Policy Perspective, August 2004. Boulhol, Herve and Lionel Fontagné. “Deindustrialisation and the fear of relocations in the industry.” 13 July 2005. Presented at the OECD Conference. Paris, France, November 2005. Brainard, Lael and Robert E. Litan. “‘Offshoring’ Service Jobs: Bane or Boon—and What to
Do?” The Brookings Institution Policy Brief #132 (April 2004). Brainard, Lael, Robert E. Litan, and Nicholas Warren. “A Fairer Deal for America’s Workers in
a New Era of Offshoring.” Paper presented at the Brookings Trade Forum Offshoring White-Collar Work –The Issues and Implications, Washington, D.C., 12-13 May 2005.
Brandt, Nicola. “Business Dynamics in Europe.” Paris: Organisation for Economic Co-
operation and Development, 2004. _____. “Business Dynamics, Regulation and Performance.” Paris: Organisation for Economic
Co-operation and Development, 2004. Bronfenbrenner, Kate. “Uneasy Terrain: The Impact of Capital Mobility on Workers, Wages,
and Union Organizing.” Submitted to the U.S. Trade Deficit Review Commission, September 2000.
Bronfenbrenner, Kate and Stephanie Luce. “The Changing Nature of Corporate Global
Restructuring: The Impact of Production Shifts on Jobs in the US, China, and Around the Globe.” Washington, D.C.: U.S.-China Economic and Security Review Commission, October 2004.
Brown, Clair, John Haltiwanger, and Julia Lane. “Economic Turbulence: Is a Volatile Economy
Good for America?. Chicago, University of Chicago Press, 2006 Brown, Clair and Greg Linden. “Offshoring in the Semiconductor Industry: A Historical
Perspective.” Prepared for the 2005 Brookings Trade Forum Offshoring of White-Collar Work—the Issues and Implications, Washington, D.C., 12-13 May 2005.
Brown, Sharon P. “Mass Layoff Statistics and Domestic and Overseas Relocation.” Presented
at the Brookings Institution Data Workshop on Offshoring, Washington, D.C., June 2004.

APPENDIX C
210
_____. “Mass Layoff Statistics Data in the United States and Domestic and Overseas Relocation.” Presented at the EU-US Seminar on Offshoring of Services in ICT and Related Services, Brussels, Belgium, 13-14 December 2004.
Brown, Sharon P. and James Spletzer. “Labor Market Dynamics Associated with the Movement of Work Overseas.” Washington, D.C.: U.S. Bureau of Labor Statistics, 2 November, 2005. Presented at the OECD Conference. Paris, France, November 2005. Buchholz, Todd G. “Bringing the Jobs Home: How the Left Created the Outsourcing Crisis—
and How We Can Fix It.” New York: Penguin Group, 2004. Bulkeley, William M. “IBM Documents Give Rare Look at Sensitive Plans on ‘Offshoring.’”
Wall Street Journal (January 19, 2004). Business Roundtable. “Economic Growth and Job Creation: What Do Americans Think?”
Washington, D.C.: Undated. _____. “How to Secure U.S. Economic Growth and Jobs in the Worldwide Economy.”
Washington, D.C.: Undated. _____. “How to Secure U.S. Economic Growth and Jobs in the Worldwide Economy: U.S.
Facts.” Washington, D.C.: Undated. _____. “Securing Growth and Jobs: Improving U.S. Prosperity in a Worldwide Economy.”
Washington, D.C.: March 2004. Cato Institute. Cato Handbook for Congress: Policy Recommendations for the 108th Congress.
Washington, D.C.: Cato Institute, undated. Clark, Kelly A. and Rosemary Hyson. “New Tools for Labor Market Analysis: JOLTS.”
Monthly Labor Review (December 2001). Clausing, Kimberly. “The Role of U.S. Tax Policy in Offshoring.” Presented at the Brookings
Trade Forum Offshoring of White-Collar Work—the Issues and Implications, Washington, D.C., 12-13 May 2005.
“Companies that Outsource Offshore According to Lou Dobbs.” Computer Systems Policy Project. “Choose to Compete: How innovation, investment and
productivity can grow U.S. jobs and ensure American competitiveness in the 21st century.” Washington, D.C.: January 2004.
_____. “Ten Common Myths about Worldwide Sourcing.” Washington, D.C.: undated. Corrado, Carol, Paul Lengermann and Larry Slifman. “The Contribution of MNCs to U.S. Productivity Growth, 1977-2000.” Federal Reserve Board, Washington, D.C. October

APPENDIX C
211
2003 (Revised July 18, 2005). Presented at the Conference on International Service Flows. Bethesda, MD, April 2006. Cowen, Tyler. “Creative Destruction: How Globalization is Changing the World’s Cultures.”
Princeton and Oxford: Princeton Press, 2004. Craig, David and Paul Willmott. “Outsourcing Grows Up.” The McKinsey Quarterly (February 2005). Criscuolo, Chiara and Mark Leaver. “Offshore Outsourcing and Productivity.” Presented at the OECD Conference. Paris, France, November 2005. Davis, Steven J., John C. Haltiwanger, and Scott Schuh. “Job Creation and Destruction.” Cambridge, MA, and London, England: MIT Press, 1997. Deloitte Consulting. “Calling a Change in the Outsourcing Market: The Realities for the
World’s Largest Organizations.” Deloitte Development LLC, April 2005. Deloitte Research. “Business in China, the Next Stage: The Fifth Modernization.” Deloitte
Touche Tohmatsu, 2005. _____. “The Cusp of a Revolution: How Offshoring will Transform the Financial Services
Industry.” Deloitte Consulting, 2003. _____. “Inside Outsourcing: The what, who, and how of outsourcing IT-intensive processes.”
Deloitte Consulting, 2003. _____. “The Macro-Economic Case for Outsourcing.” Deloitte Consulting, 2003. _____. “Making the Off-Shore Call: The Road Map for Communications Operators.” Deloitte
Touche Tohmatsu, 2004. _____. “The Titans Take Hold: How offshoring has changed the competitive dynamic for global
financial services institutions.” Deloitte Development LLC, 2004. Desai, Mihir A., C. Fritz Foley, and James R. Hines, Jr. “Chains of Ownership, Regional Tax
Competition, and Foreign Direct Investment.” Working paper 9224. Cambridge, MA: National Bureau of Economic Research, 2002.
_____. “Foreign Direct Investment and Domestic Economic Activity.” Presentation, AEI
Conference on Domestic Effects of Foreign Direct Investment, 2 December 2004. _____. “International Joint Ventures and the Boundaries of the Firm.” Working paper 9115.
Cambridge, MA: National Bureau of Economic Research, 2002.

APPENDIX C
212
“Distortions and Deceptions in Strategic Decisions.” The McKinsey Quarterly. 1st Edition. New York: McKinsey and Company, 2006.
Dobbs, Lou. “Exporting America: Why Corporate Greed is Shipping American Jobs Overseas.”
New York and Boston: Warner Business Books, 2004. Doig, Stephen J., et al. “Has Outsourcing Gone Too Far?” The McKinsey Quarterly 4 (2004). Dossani, Rafiq. “Globalization and the Outsourcing of Services: The Impact of Indian
Offshoring.” In Offshoring White-Collar Work—The Issues and Implications, The Brookings Trade Forum, 2005, edited by Lael Brainard and Susan M. Collins. Washington, D.C.: The Brookings Institution, forthcoming.
Dossani, Rafiq and Martin Kenney. “Went for Cost, Stayed for Quality? Moving the Back
Office to India.” December 2003. Dryburgh, Heather, and Jason Hamel. “Immigrants in Demand: Staying or Leaving?” Statistics
Canada, Canadian Social Trends (Autumn 2004): 12-17. Dudley, Bill, et al. “Offshoring: Where Have all the Jobs Gone?” Goldman Sachs, US Economics
Analyst 3/38 (19 September 2003). Economic Policy Institute. EPI Issue Guide: Offshoring. Undated. Eurostat Progress Report to the Voorburg Group, September 23, 2003. Presented at 18th Meeting
of the Voorburg Group, Tokyo, Japan, October 2003. Faberman, R. Jason. “Gross Job Flows Over the Past Two Business Cycles: Not all ‘Recoveries’
are Created Equal.” Working paper 372. Washington, D.C.: U.S. Bureau of Labor Statistics, June 2004.
Farrell, Diana, Sacha Ghai, and Tim Shavers. “A Silver Lining in the US Trade Deficit.” The
McKinsey Quarterly (March 2005). Farrell, Diana and Adil S. Zainulbhai. “A Richer Future for India.” The McKinsey Quarterly,
2004 Special Edition: What Global Executives Think (2004). Feenstra, Robert C. and Gordon H. Hanson. “Global Production Sharing and Rising Inequality:
A Survey of Trade and Wages.” Working paper 8372. Cambridge, MA: National Bureau of Economic Research, June 2001.
_____. “The Impact of Outsourcing and High-Technology Capital on Wages: Estimates for the
United States, 1979-1990.” The Quarterly Journal of Economics 114 (3) (August 1999): 907-940.

APPENDIX C
213
Florida, Richard. “The Rise of the Creative Class…and how it’s transforming work, leisure, community, & everyday life.” New York: Basic Books, 2002.
Feliciano, Zadia and Robert E. Lipsey. “Foreign Entry into U.S. Manufacturing by Takeovers
and the Creation of New Firms.” Working paper 9122. Cambridge, MA: National Bureau of Economic Research, September 2002.
Freeman, Richard B. “Does Globalization of the Scientific/Engineering Workforce Threaten US
Economic Leadership?” Prepared for Innovation Policy and the Economy Conference, Washington, D.C., 19 April 2005.
_____. “Doubling the Global Work Force: The Challenge of Integrating China, India, and the
Former Soviet Bloc into the World Economy.” Washington, D.C.: Institute for International Economics, November 2004.
Fung, K.C., Lawrence J. Lau, and Joseph S. Lee. “General Characteristics of U.S. Direct
Investment.” In U.S. Direct Investment in China. Washington, D.C.: American Enterprise Institute, 2004.
GAO Report. “International Trade: U.S. and India Data on Offshoring Show Significant Differences.” GAO-06-116. Presented at the OECD Conference. Paris, France, November 2005. Gareiss, Robin. “Analyzing the Outsourcers.” Information Week (November 18, 2002). Garner, C. Alan. “Offshoring in the Service Sector: Economic Impact and Policy Issues.”
Federal Reserve Bank of Kansas City, Economic Review (Third Quarter 2004): 5-37. Glassman, James K. and Kevin A. Hassett. “Understanding the Role of the United States in the
Global Economy.” Washington, D.C.: AEI, August 2003. Global Insight. “Executive Summary: The Comprehensive Impact of Offshore IT Software and
Services Outsourcing on the U.S. Economy and the IT Industry.” Lexington, MA: Global Insight (USA), Inc.: 2004.
_____. “The Estimated Impact of Offshore IT Software and Services Outsourcing on each
State Economy, 2003 and 2008.” Lexington, MA: Global Insight (USA), Inc., March 2004.
Global Insight and Information Technology Association of America. “The Comprehensive
Economic Impact of Offshore IT Software and Services Outsourcing in the United States.” Presentation at the National Press Club, Washington, D.C., 30 March 2004.
“Globalisation: Coping with the Challenge.” Editorial, OECD Employment Outlook. OECD,
2005.

APPENDIX C
214
Goodman, William C. “Employment in Services Industries Affected by Recessions and
Expansions.” Monthly Labor Review (October 2001): 3-11. Goolsby, Kathleen, Todd Furniss, and F. Keaton Whitlow. “An Assessment of the Outsourcing
Market in the Banking Sector of Japan’s Financial Institutions Industry.” Dallas: Everest Group, 2002.
Gorg, Holger, Aoife Hanley, and Eric Strobl. “Productivity effects of international outsourcing: Evidence from plant level data*.” University of Nottingham, Ecole Polytechnique Paris: October 2005. Presented at the OECD Conference. Paris, France, November 2005. Griswold, Daniel T. “Why We Have Nothing to Fear from Foreign Outsourcing.” Center for
Trade Policy Studies, Cato Institute, Free Trade Bulletin 10 (March 2004). Groshen, Erica L. and Simon Potter. “Has Structural Change Contributed to a Jobless
Recovery?” Federal Reserve Bank of New York, Current Issues in Economics and Finance 9 (8) (August 2003).
Grossman, Gene. “Offshoring and Outsourcing: Lessons from the Theory of the Firm.”
Presentation, undated. Grossman, Gene M. and Elhanan Helpman. “Outsourcing in a Global Economy.” September
2001. Hagel, John, III. “Offshoring Goes on the Offensive.” The McKinsey Quarterly 2 (2004). Hanson, Gordon H., Raymond J. Mataloni, Jr., and Matthew J. Slaughter. “Expansion Abroad
and the Domestic Operations of U.S. Multinational Firms.” Working paper. Washington, D.C.: National Bureau of Economic Research, September 2003.
Hanson, Gordon H. and Chong Xiang. “International Trade in Motion Picture Services.” University of California, San Diego, National Bureau of Economic Research, and Purdue University. Presented at the Conference on International Service Flows. Bethesda, MD, April 2006. Harrington, Paul E. “Understanding & Responding to Imbalances in Engineering & IT Labor
Markets.” Presentation to Business Roundtable, Northeastern University, 15 September 2004.
Hatzichronoglou, Thomas. “The Impact of Offshoring on Employment: Measurement Issues and Implications.” Presented at the OECD Conference. Paris, France, November 2005. Hassett, Kevin A. “Discussion of Desai, Foley and Hines.” AEI Conference on Domestic
Effects of Foreign Direct Investment, 2 December 2004.

APPENDIX C
215
Hecker, Daniel E. “Occupational Employment Projections to 2012.” Monthly Labor Review (February 2004).
Helpman, Elhanan, Marc J. Melitz, and Stephen R. Yeaple. “Export versus FDI.” Discussion
paper #1998. Cambridge, MA: Harvard Institute of Economic Research, 2003.
Hijzen, Alexander, Holger Görg and Robert C. Hine. “International Outsourcing and the Skill Structure of Labour, Demand in the United Kingdom.” University of Nottinham, 2004. Presented at the OECD Conference. Paris, France, November 2005. Hira, Ronil. “Global Outsourcing of Engineering Jobs: Recent Trends and Possible
Implications.” Testimony to the Committee on Small Business, U.S. House of Representatives, 18 June 2003.
_____. “Homeland Security and the Technology Sector.” Testimony to the Senate Commerce,
Science, and Transportation Subcommittee on Science, Technology and Space, 24 April 2002.
_____. “The Offshoring of High-Skilled Jobs.” Testimony to the Committee on Small Business,
U.S. House of Representatives, 20 October 2003. _____. “The Other Side of the Outsourcing Debate.” Transcript, Washingtonpost.com Live
Discussion. 2 May 2005 <http://www.washingtonpost.com/wp-dyn/articles/A36379-2004Mar30.html>.
_____. Letter to Congressman Frank Wolf, April 21, 2004. Hong, Eun-Pyo. “OECD Activity on the Short-Term Indicators for Services.” Presented at 18th
Voorburg Group Meeting, Tokyo, October 2003. Horrigan, Michael W. “Employment Projections to 2012: Concepts and Context.” Monthly
Labor Review (February 2004). Houghton, John W. and Graham Vickery. “Digital Delivery of Business Services.” Paris:
Organisation for Economic Co-operation and Development, 2004. Hubbard, Glenn. “Does the Tax System Create Excessive Incentives to Move Activity Abroad?”
Remarks at International Tax Policy Forum, AEI Conference on Domestic Effects of Foreign Direct Investment, 2 December 2004.
Hughes, Kent H. “Introduction: Meeting the New Economic Challenge: Forging an American
Dream for the Twenty-First Century.” Building the Next American Century. Baltimore, MD: The Johns Hopkins University Press, February 2005.
Information Technology Association of America. “ITAA Global Sourcing Principles.”
Arlington, VA: ITAA, August 2003.

APPENDIX C
216
____. “Race to the Horizon: Competition, Innovation and Enlightened Public Policy Must Drive
the U.S. IT Industry in the Next Four Years.” Arlington, VA: ITAA, January 2005. The Institute of Electrical and Electronics Engineers. “Summary report: IEEE-USA Salary &
Fringe Benefit Survey, 2004 Edition.” The Institute of Electrical and Electronics Engineers, Inc., 2004.
______. “2004 IEEE-USA Unemployment survey Results (11/29/2004).” The Institute of
Electrical and Electronics Engineers, Inc., 2004. ______. “Position: Offshore Outsourcing—As approved by the IEEE-USA Board of Directors,
March 2004.” The Institute of Electrical and Electronics Engineers, Inc., 2004. Interindustry Economic Research Forum (Inforum). “The Trade and Economic Impacts of U.S.
Currency Valuation: A Global Modeling Analysis.” Submitted to the Department of Commerce International Trade Administration. January 2005.
Irwin, Douglas A. “’Outsourcing’ is Good for America.” Washington, D.C.: American
Enterprise Institute for Public Policy Research, February 2004. _____. “U.S. Direct Investment Abroad: A Historical Perspective.” Presented at AEI
Conference on Domestic Effects of Foreign Direct Investment, 2 December 2004. Jaffee, Dwight. “Globalization, Offshoring, and Economic Convergence: A Synthesis.”
Presented at the Understanding Global Outsourcing Conference, Stern School of Business, 10 December 2004.
Jain, Kuldeep P., Nigel A. S. Manson, and Shirish Sankhe. “The Right Passage to India.” The
McKinsey Quarterly (February 2005). Jensen, J. Bradford and Lori G. Kletzer. “Tradable Services: Understanding the Scope and
Impact of Services Offshoring.” Presentation, undated. ______. “Tradable Services: Understanding the Scope and Impact of Services Offshoring.”
Paper prepared for Brookings Trade Forum 2005 Offshoring White-Collar Work – The Issues and the Implications, 12-13 May 2005.
“Jobs Lost to Outsourcing Underestimated, Study Concludes.” The Business Journal (20
October 2004). Kalakota, Ravi and Marcia Robinson. “Five Reasons Why Offshore Outsourcing Projects Fail.”
Sterling Hoffman Executive Search Newsletter (undated). 2 May 2005 <http://www.sterlinghoffman.com/cgi-bin/index.pl?p=newsletter/articles/article112.html>.

APPENDIX C
217
Kapur, Devesh, and John McHale. “Give Us Your Best and Brightest: The Global Hunt for Talent and its Impact on the Developing World.” Baltimore: Brookings Institution Press, 2005.
Karamouzis, Frances, et al. “Gartner’s Global Offshore Sourcing Predictions.” COM-22-9634.
Stamford, CT: Gartner Inc., 2004. Kazmierczak, Matthew F. and Josh James. “Losing the Competitive Advantage? The Challenge
for Science and Technology in the United States.” Washington, D.C.: American Electronics Association, February 2005.
Khatchadourian, Kelley, and Alice Wiesner. “International Price Program’s (IPP’s) Services Price Indexes.” Washington, D.C.: U.S. Bureau of Labor Statistics. Presented at the Conference on International Service Flows. Bethesda, MD, April 2006. Kirkegaard, Jacob Funk. “Outsourcing and Offshoring: Pushing the European Model Over the
Hill, Rather Than Off the Cliff!” WP 05-1. Washington, D.C.: Institute for International Economics, March 2005.
_____. “Outsourcing—Stains on the White Collar?” Washington, D.C.: Institute for
International Economics, 2003. Kleinert, Jörn. “Globalization: Empirical Overview and Theoretical Explanations.” In The Role
of Multinational Enterprises in Globalization. New York: Springer, 2004. Kletzer, Lori G. Job Loss from Imports: Measuring the Costs. Washington, D.C.: Institute for
International Economics, 2001. _____. “Measuring the Costs of Trade-Related Job Loss.” Testimony prepared for the
Committee on Finance, U.S. Senate, 20 July 2001. Koch, Christopher. “Backlash.” CIO Magazine (September 1, 2003). Kozlow, Ralph H. “An Overview of U.S. Bureau of Economic Analysis Statistics on
Multinational Companies.” Prepared for the OECD Workshop on International Investment Statistics, Paris, France, 22-24 March 2004.
Kozlow, Ralph H. and Maria Borga. “‘Offshoring’ and the U.S. Balance of Payments.” U.S.
Bureau of Economic Analysis WP2004-05 (16 July 2004). Presented at the Brookings Institution, 22 June 2004.
Krantz, Rachel. “Employment in business services: a year of unprecedented decline.” Monthly
Labor Review (April 2002): 17-24. Kroll, Cynthia A. “At-Risk Occupations.” September 2004.

APPENDIX C
218
_____. “State and Metropolitan Area Impacts of the Offshore Outsourcing of Business Services and I.T.” Fisher Center for Real Estate and Urban Economics, Working Paper 05-293. Berkley: University of California, 2003. NOT FOR QUOTATION WITHOUT PERMISSION.
Landefeld, J. Steven and Ralph Kozlow. “Globalization and Multinational Companies: What are
the Questions, and How Well are we Doing in Answering them?” Presented at the Conference of European Statisticians, Globalization Seminar, Geneva, 10-12 June 2003.
Landefeld, Steven J. and Raymond Mataloni. “Offshore Outsourcing and Multinational
Companies.” U.S. Bureau of Economic Analysis WP2004-06 (16 July 2004). Presented at the Brookings Institution, 22 June 2004.
Leamer, Edward E. “Effort, Wages, and the International Division of Labor.” Working Paper
5803. Cambridge, MA: National Bureau of Economic Research, October 1996. _____. “Trade, Wages and Revolving Door Ideas.” Working Paper 4716. Cambridge, MA:
National Bureau of Economic Research, April 1994. Leamer, Edward E. and James Levinsohn. “International Trade Theory: The Evidence.”
Working Paper 4940. Cambridge, MA: National Bureau of Economic Research, November 1994.
Leamer, Edward E. and Michael Storper. “The Economic Geography of the Internet Age.”
Working Paper 8450. Cambridge, MA: National Bureau of Economic Research, August 2001.
Levine, Linda. “Offshoring (a.k.a. Offshore Outsourcing) and Job Insecurity Among U.S.
Workers.” CRS Report to Congress (RL32292). Washington, D.C.: Congressional Research Services, 18 June 2004.
Levy, Frank and Ari Goelman. “Offshoring and Radiology.” Presented at Brookings Trade
Forum 2005 Offshoring White-Collar Work – The Issues and the Implications, 12-13 May 2005.
Lieberman, Joseph I. Letter to Donald Evans and Elaine Chao. 13 December 2004. _____. Dear Colleague letter. 15 December 2005. _____. “Data Dearth in Offshore Outsourcing: Policymaking Requires Facts.” December 2004. _____. “Offshore Outsourcing and America’s Competitive Edge: Losing Out in the High
Technology R&D and Services Sectors.” 11 May 2004. Lindsey, Brink. “Job Losses and Trade: A Reality Check.” Trade Briefing Paper No. 19.
Washington, D.C.: Cato Institute, March 2004.

APPENDIX C
219
Lipsey, Robert E. “Foreign Production by US Firms and Parent Firm Employment.” In
Multinational Firms and Impacts on Employment, Trade and Technology. London: Routledge, 2002.
_____. “Measuring International Trade in Services.” Presented at the Conference on International Service Flows. Bethesda, MD, April 2006. Lipsey, Robert E. and Jean-Louis Mucchielli. “Introduction.” In Multinational Firms and
Impacts on Employment, Trade and Technology. London: Routledge, 2002. Lloyd, Emily and Charlotte Mueller. “Payroll employment grows in 2004.” Monthly Labor
Review (March 2005): 18-31. Lopez-Bassols, Vladimir. “ICT Skills and Employment.” Paris: Organisation for Economic Co-
operation and Development, 2002. Makin, John H. “America Demands; China Supplies.” American Enterprise Institute Online (19
March 2004). 28 April 2005 <http://www.aei.org/publications/pubID.20142,filter.all/pub_detail.asp>.
Mankiw, N. Gregory, Kristin J. Forbes, and Harvey S. Rosen. “The Economic Report of the
President.” Testimony before the Joint Economic Committee, U.S. Congress, 10 February 2004.
Mann, Catherine L. “Global Sourcing: The Information Technology Example.” Presented 7
February 2005 at the Cosmos Club, Washington, D.C. _____. “Global Sourcing & High Tech Jobs: Productivity Gains & Policy Challenges.”
Presented 11 March 2004. _____. “Globalization of IT Services and White Collar Jobs: The Next Wave of Productivity
Growth.” International Economics Policy Briefs PB03-11. Washington, D.C.: Institute for International Economics, December 2003.
_____. “Globalization of Services: Why, How Much, and What to do About it: Some Issues for
the North and for the South.” February 2004. _____. “Offshore Outsourcing and the Globalization of US Services: Why Now, How
Important, and What Policy Implications.” In The United States and the World Economy: Foreign Economic Policy for the Next Decade. Washington, D.C.: Institute for International Economics, 2005.
_____. “Prices for International Services Transactions.” Washington, D.C.: U.S. Bureau of
Labor Statistics, September 2004.

APPENDIX C
220
_____. “This is Bangalore Calling: Hang Up or Speed Dial?” Cleveland: Federal Reserve Bank of Cleveland, January 2005.
Mariotti, Sergio and Lucia Piscitello. “Foreign Direct Investment and Employment: Home
country experience in Italy.” In Multinational Firms and Impacts on Employment, Trade and Technology. London: Routledge, 2002.
Markusen, James R. “Modeling the Offshoring of White-Collar Services: From Comparative
Advantage to the New Theories of Trade and FDI.” Prepared for the Brookings Forum, Offshoring White-Collar Work: The Issues and Implications, 12-13 May 2005.
Mataloni, Raymond J., Jr. “U.S. Multinational Companies: Operations in 2002.” Survey of
Current Business (July 2004): 10-29. Mattoo, Aaditya and Sacha Wunsch. “Preempting Protectionism in Services: The GATS and
Outsourcing.” January 2004. McCarthy, John C. “Near-Term Growth of Offshoring Accelerating.” Cambridge, MA:
Forrester Research, Inc., 2004. McKinsey Global Institute. The Emerging Global Labor Market. San Francisco: McKinsey and
Company, 2005. _____. “Offshoring: Is it a Win-Win Game?” San Francisco, CA: McKinsey and Company,
August 2003. “The McKinsey Global Survey of Business Executives, July 2004.” The McKinsey Quarterly
Special Edition: What global executives think (2004). McNeil, Lawrence R. “International Trade and Economic Growth: A Methodology for
Estimating Cross-Border R&D Spillovers.” Washington, D.C.: U.S. Bureau of Economic Analysis. Presented at the Conference on International Service Flows. Bethesda, MD, April 2006.
“Measuring Globalisation: OECD Economic Globalisation Indicators.” Washington, D.C.:
OECD, 2005. Mehlman, Bruce P. “Offshore Outsourcing and the Future of American Competitiveness.”
Washington, D.C.: U.S. Department of Commerce, October 2003. Meltzer, Allan H. “A Jobless Recovery?” Washington, D.C.: American Enterprise Institute for
Public Policy Research, November 2003. Miller, Ronald E., and Peter D. Blair. Input-Output Analysis: Foundations and Extensions.
Englewood Cliffs, New Jersey: Prentice Hall Inc., 1985.

APPENDIX C
221
Morisi, Teresa L. “Recent changes in the national Current Employment Statistics survey.” Monthly Labor Review (June 2003).
Moris, Francisco. “U.S. INTERNATIONAL TRADE IN R&D-RELATED SERVICES AND A TRANSACTIONS-BASED PROFILE OF BUSINESS R&D.” Arlington, VA.: U.S. National Science Foundation. Presented at the Conference on International Service Flows. Bethesda, MD, April 2006. Morissette, René and Anick Johnson. “Are Good Jobs Disappearing in Canada?” Analytical
Studies Branch research paper series, no. 239. Ottawa: Statistics Canada, January 2005. Moyer, Brian C., Mark A. Planting, Paul V. Kern, and Abigail M. Kish. “Improved Annual
Industry Accounts for 1998-2003: Integrated Annual Input-Output Accounts and Gross-Domestic-Product-by-Industry Accounts.” Survey of Current Business (June 2004): 21-57.
Mutti, John, and Harry Grubert. “New Developments in the Effect of Taxes on Royalties and the Migration of Intangible Assets Abroad.” Presented at the Conference on International Service Flows. Bethesda, MD, April 2006. National Academy of Public Administration. Concept Paper for Offshoring Study. December
2004. _______. Final Offshoring Proposal. January 2005. National Bureau of Economic Research. “Business Cycle Expansions and Contractions.” 2 May
2005 <http://www.nber.org/cycles.html>. National Bureau of Statistics of China. “Progress Report from National Bureau of Statistics of
China.” Presented at Voorburg 18th Meeting, 18 October 2003. National Research Council, Committee on Analyzing the U.S. Content of Imports and the
Foreign Content of Exports. “Analyzing the U.S. Content of Imports and the Foreign Content of Exports.” Washington, D.C.: National Academies Press, October 2005.
National Research Council, Committee on National Statistics. “Principles and Practices for a
Federal Statistical Agency.” Third Edition. Washington, D.C.: National Academies Press, 2004-2005.
National Science Foundation. “Next Generation Cybertools.” NSF Funding Opportunity
Document, May 2005. ____. Summary of SBE/CISE Workshop on “Cyberinfrastructure for the Social and Behavioral
Sciences.” 15-16 March 2005.

APPENDIX C
222
neoIT. “Research Summary: Global ITO and BPO Trends in 2005.” Offshore Insights Market Report Series 2 (12) (December 2004).
_____. “Research Summary: Offshore and Nearshore ITO Salary Report 2004.” Offshore
Insights Market Report Series 3 (5) (May 2005). _____. “Research Summary: Mapping Offshore Markets Update 2004.” Offshore Insights
White Paper 2 (6) (June 2004). Norwood, Janet L. “The Changing World of Employment: Factory Jobs, Productivity, and
Worker Quality.” Washington, D.C.: Committee on National Statistics, October 2004. “A Note on Patterns of Production and Employment by U.S. Multinational Companies.” Survey
of Current Business (March 2004). Novak, Christopher A. and Matthew F. Kazmierczak. “Offshore Outsourcing in an Increasingly
Competitive and Rapidly Changing World: A High-Tech Perspective.” Washington, D.C.: American Electronics Association, March 2004.
Nyce, Steven A., and Sylvester J. Schieber. “The Economic Implications of Aging Societies:
The Costs of Living Happily Ever After.” New York: Cambridge University Press, 2005.
Okolie, Cordelia. “Why size class methodology matters in analyses of net and gross job flows.”
Monthly Labor Review (July 2004). O’Neill, Vin. “IEEE-USA Perspectives on the Adequacy of Available Data on Off-Shore
Outsourcing.” Presented at National Academy of Public Administration, Washington, D.C., May 2005.
Organisation for Economic Co-operation and Development. “Chapter 2: Globalisation of the
ICT Sector: Section on International Sourcing.” In Information Technology Outlook 2004. Paris: OECD, forthcoming.
______. “OECD Workshop on Services.” Conference Materials. Paris, 15-16 November 2004. _______. “Trade-adjustment Costs in OECD Labour Markets: Three Annexes.” Annexes to
Chapter 1 of the OECD Employment Outlook 2005. Paris: OECD, 2005. Organisation for Economic Co-operation and Development, Economics Department. “The
Benefits of Liberalising Product Markets and Reducing Barriers to International Trade and Investment: The Case of the United States and the European Union.” Working Paper no. 432. Paris: OECD, May 2005.

APPENDIX C
223
Organisation for Economic Co-operation and Development, Trade Union Advisory Committee. “Trade, Offshoring of Jobs and Structural Adjustment: The Need for a Policy Response.” TUAC discussion paper. Paris: OECD, 2004.
Orlov, Laurie M. and John C. McCarthy. “IT Is Not Going Away — But The Worker Profile
Changes: More Business-Centric White-Collar Roles Replacing Blue-Collar Technical Jobs.” Cambridge, MA: Forrester Research, Inc., 2005.
Pain, Nigel and Desirée van Welsum. “International Production Relocation and Exports of
Services.” Paris: OECD, 2004. Palan, Ronen. “The Offshore World: Sovereign Markets, Virtual Places, and Nomad
Millionares.” Ithica and London: Cornell University Press, 2003. “Panel session on ICT-enabled services offshoring: country and business perspectives.”
Summary, meeting of the OECD Working Party on the Information Economy, June 2005. Parker, Andrew. “Two-Speed Europe: Why 1 Million Jobs Will Move Offshore.” Cambridge,
MA: Forrester Research, Inc., 2004. Pilat, Dirk. “The Globalisation of Production and Value Chains: Issues for Discussion.” Presented at the OECD Conference. Paris, France, November 2005. Pinkston, Joshua C. and James R. Spletzer. “Annual Measures of Job Creation and Job
Destruction Created from Quarterly ES-202 Microdata.” Washington, D.C.: U.S. Bureau of Labor Statistics, undated.
Pivetz, Timothy R., Michael Searson, and James R. Spletzer. “Measuring job and establishment
flows with BLS longitudinal microdata.” Monthly Labor Review (April 2001):13-20. PricewaterhouseCoopers. “Management Barometer Survey on Outsourcing of Financial
Functions: US Findings.” PricewaterhouseCoopers, 2004. “Progress Report – Bureau of the Census/Bureau of Labor Statistics.” Presented at Voorburg
Group, 18th Meeting, Tokyo, Japan, October 2003. Quinn, James Brian and Frederick G. Hilmer. “Strategic Outsourcing.” The McKinsey
Quarterly 1 (1995). Rabaud, Isabelle. “Sixth OECD-Eurostat Meeting of Experts in Trade-in-Services Statistics (TIS).” OECD, Paris La Défense, 14th September, 2005. Presented at the OECD Conference. Paris, France, November 2005. Randolph, William. Comments on Slaughter presentation “Expansion Abroad and the Domestic
Operations of U.S. Multinational Firms.” AEI Conference on Domestic Effects of Foreign Direct Investment, 2 December 2004.

APPENDIX C
224
République Française, Département des Activités tertiaires [French Republic, Department of the
Tertiary Sector]. 2003 Progress Report for France. Presented at 18th Voorburg Group Meeting on Service Statistics. Paris: 9 September 2003.
Robbins, Carol A. “Measuring Payments for the Supply and Use of Intellectual Property.” Presented at the Conference on International Service Flows. Bethesda, MD, April 2006. Robinson, Marcia. Interview with Journal of Business Strategy. November 2004. Robinson, Marcia, and Ravi Kalakota. “Offshore Outsourcing: Business Models, ROI and Best
Practices.” Alpharetta, GA: Mivar Press, 2004. Rosenthal, Beth Ellyn. “Deloitte Study Discovers 75 Percent of Global Financial Institutions
Plan to Outsource Offshore.” June 2003. Samuelson, Paul A. “Where Ricardo and Mill Rebut and Confirm Arguments of Mainstream
Economists Supporting Globalization.” The Journal of Economic Perspectives 18 (3) (Summer 2004): 135-146.
Saunders, Norman C. “Coding Occupations for Risk of Offshore Outsourcing.” Washington,
D.C.: Bureau of Labor Statistics, undated. Sayeed, Asad and Radhika Balakrishnan. “Why do Firms Disintegrate? Towards an
Understanding of the Firm-level Decision to Subcontract and its Implications for Labor.” In Labor and the Globalization of Production: Causes and Consequences of Industrial Upgrading. New York: Palgrave Macmillan, 2005.
Schultze, Charles L. “Offshoring, Import Competition, and the Jobless Recovery.” The
Brookings Institution Policy Brief #136 (August 2004). Sicsic, Pierre. “Are there more and more missing imports of services in the French Balance of Payments?” Balance of Payments, Banque de France. Presented at the Conference on International Service Flows. Bethesda, MD, April 2006. Scott, Robert E. “The High-Price of ‘Free’ Trade: NAFTA’s failure has cost the United States
jobs across the nation.” Economic Policy Institute briefing paper. Washington, D.C.: EPI, November 2003.
_____. “U.S.-China Trade, 1989-2003: Impact on Jobs and Industries, National and State-by-State.” Economic Policy Institute Working Paper #270. Washington, D.C.: EPI, January 2005.
“Services Offshoring: What do the Data Tell Us?” Workshop hosted by the Brookings
Institution, 22 June 2004. Shared Services News 6 (10) (February 2005).

APPENDIX C
225
Slaughter, Matthew J. “Does the Tax System Create Excessive Incentives To Move Economic
Activity Abroad?” ITPF/AEI Seminar on Domestic Effects of Foreign Direct Investment, Washington, D.C., 2 December 2004.
_____. “Expansion Abroad and the Domestic Operations of U.S. Multinational Firms.”
ITPF/AEI Seminar on Domestic Effects of Foreign Direct Investment, Washington, D.C., 2 December 2004.
_____. “Globalization and Employment by U.S. Multinationals: A Framework and Facts.”
March 2004. Solomon, Jay. “Offshoring of Jobs to Widen in 2005: Study Says Growth Helped By Less
Political Opposition, More Pressure to Cut Costs.” The Wall Street Journal Online (2004).
Spletzer, James R., et al. “Business employment dynamics: new data on gross job gains and
losses.” Monthly Labor Review (April 2004): 29-42. Srinivasan, T.N. “Information Technology Enabled Services and India’s Growth Prospects.”
Presented at the Brookings Forum, Offshoring White-Collar Work: The Issues and Implications, May 12-13, 2005.
Statistics Canada. Occupation: 2001 Census Technical Report. Cat. No. 92-388-XIE. Statistics Sweden. “Progress Report of Sweden.” Presented at 18th Meeting of the Voorburg
Group, Tokyo, Japan, October 2003. Swaim, Paul. “Trade-adjustment Costs in OECD Labour Markets: A Mountain or a Molehill?” ISBN 92-64-01045-9, OECD Employment Outlook. Presented at the OECD Conference. Paris, France, November 2005. Tanaka, Nobuo. “Main Messages from the OECD Services Project and its Background.”
Presented 20 April 2005. Title V—Confidential Information Protection and Statistical Efficiency. Pub. L. 107–347, 17
Dec. 2002, 116 Stat 2962. Trefler, Daniel. “Offshoring: Threats and Opportunities.” Prepared for the Brookings Forum,
Offshoring White-Collar Work: The Issues and Implications, 12-13 May 2005. Triplett, Jack, and Barry P. Bosworth. “Productivity in the U.S. Services Sector: New Sources
of Economic Growth.” Washington, D.C.: The Brookings Institution Press, 2004.

APPENDIX C
226
Triplett, Jack E. and Barry P. Bosworth. “Productivity Measurement Issues in Service Industries: ‘Baumol’s Disease’ Has Been Cured.” FRB NY Economic Policy Review (September 2003): 23-33.
United Nations, et al. “Manual on Statistics of International Trade in Services.” Geneva: United
Nations, 2002. U.S. Bureau of Economic Analysis. U.S. Bureau of Economic Analysis Strategic Plan for FY
2005-FY 2009. U.S. Bureau of Labor Statistics. “Cooperating State Agencies: Occupational Employment and
Statistics (OES) Program.” U.S. Bureau of Labor Statistics and U.S. Census Bureau. “Current Population Survey: Design
and Methodology.” Technical Paper 63RV. Washington, D.C.: March 2002. U.S. Census Bureau, Bureau of Economic Analysis and National Science Foundation, Division
of Science Resources Statistics. “Research and Data Development Link Project Final Report.” Washington, D.C.: June 2005.
U.S. Chamber of Commerce. “Jobs, Trade, Sourcing, and the Future of the American
Workforce.” Washington, D.C.: U.S. Chamber of Commerce, April 2004. U.S. China Economic and Security Review Commission. “2004 Report to Congress.” 108th
Congress, 2nd Session. Washington, D.C.: June 2004. U.S. Department of Commerce. “Manufacturing in America: A Comprehensive Strategy to
Address the Challenges to US Manufacturers.” Washington, D.C.: U.S. Department of Commerce, January 2004.
U.S. Department of Labor. “Business Employment Dynamics: Second Quarter 2004.” Bureau
of Labor Statistics News (15 February 2005) USDL 05-207. _______. “Employment Situation: May 2005.” Bureau of Labor Statistics News (3 June 2005) USDL 05-965. _______. “Extended Mass Layoffs Associated With Domestic and Overseas Relocations, First
Quarter 2004.” Bureau of Labor Statistics News (10 June 2004) USDL 04-1038. _______. “Extended Mass Layoffs in 2003.” Report 982. Washington, D.C.: December 2004. _______. “Extended Mass Layoffs in the Fourth Quarter of 2004 and Annual Averages for
2004.” Bureau of Labor Statistics News (16 February 2005) USDL 05-264. _______. “Job Openings and Labor Turnover: February 2005.” Bureau of Labor Statistics News
(12 April 2005) USDL 05-622.

APPENDIX C
227
_______. “Mass Layoffs in February 2005.” Bureau of Labor Statistics News (24 March 2005)
USDL 05-486. _______. “Occupational Employment and Wages, November 2003.” Bureau of Labor Statistics
News (12 November 2004) USDL 04-2320. _______. “Occupational Employment and Wages, May 2003.” Bulletin 2567. Washington,
D.C.: Bureau of Labor Statistics, September 2004. _______. “Worker Displacement, 2001-03.” Bureau of Labor Statistics News (30 July 2004)
USDL 04-1381. U.S. Government Accountability Office. “International Trade: Current Government Data
Provide Limited Insight into Offshoring of Services.” Report to Congressional Requesters GAO-04-932. Washington, D.C.: GAO, September 2004.
U.S. International Trade Commission. “Examination of U.S. Inbound and Outbound Direct
Investment.” Publication 3383. Washington, D.C.: U.S. International Trade Commission, January 2001.
_______. “Industry Trade and Technology Review.” Publication 3253. Washington, D.C.: U.S.
International Trade Commission, October 1999. _______. “Industry Trade and Technology Review.” Publication 3661. Washington, D.C.: U.S.
International Trade Commission, November 2003. _______. “Recent Trends in U.S. Services Trade: 2004 Annual Report.” Publication 3703.
Washington, D.C.: International Trade Commission, June 2004. “Value and Performance.” The McKinsey Quarterly. Special Edition. New York: McKinsey
and Company, 2005. Van Welsum, Desirée. “In Search of ‘Off Shoring’: Evidence from U.S. Imports of Services.”
London: Birkbeck University of London, 2004. ______. “International services sourcing: Opportunities and challenges.” Presented at European
e-Skills Conference 2004, Thessalonica, Greece, 20-21 September 2004. Van Welsum, Desirée and Xavier Reif. “Potential Offshoring: Evidence from Selected OECD
Countries.” Presented at the Brookings Forum, Offshoring White-Collar Work: The Issues and Implications, 12-13 May 2005.
______. “We can work it out – The globalisation of ICT-enabled services*.” Presented at the Conference on International Service Flows. Bethesda, MD, April 2006.

APPENDIX C
228
Van Welsum, Desirée and Graham Vickery. “Potential Offshoring of ICT-Intensive Using Occupations.” Paris: Organisation for Economic Co-operation and Development, 2005. Presented at the OECD Conference. Paris, France, November 2005. Vargo, Franklin J. “NAFTA: A Ten Year Perspective and Implications for the Future.”
Testimony before the Subcommittee on International Economic Policy, Export, and Trade Promotion, 20 April 2004.
Vashistha, Atul, and Avinash Vashistha. “The Offshore Nation: The Rise of Services
Globalization.” New Delhi: Tata McGraw-Hill Publishing Company, 2005. Venkatraman, N. Venkat. “Offshoring Without Guilt.” MIT Sloan Management Review 45 (3)
(Spring 2004): 14-16. Ventoro. “Offshore 2005 Research: Preliminary Findings and Conclusions.” Hillsboro, OR:
Ventoro, October 2004. “Voorburg 2003: Progress Report from the UK.” Presented at 18th Meeting of the Voorburg
Group, Tokyo, Japan, October 2003. Wessel, David. “In Spite of Offshoring, U.S. Students Can Still Engineer a Career.” The Wall
Street Journal Online (16 June 2005). Whichard, Obie G. “Measuring Globalization: The Experience of the United States of America.”
Prepared for the 22nd CEIES Seminar, Statistics and Economic Globalisation, Copenhagen, Denmark, 2-3 June 2003.
_____. “Multiple Indicators for Multiple Uses: United States Statistics on Foreign Direct
Investment.” Presented at OECD World Forum on Key Indicators, Palermo, 10-13 November 2004.
Wölfl, Anita. “The Service Economy in OECD Countries.” Science, Technology and Industry
Working Paper 2005/3. Paris: Organisation for Economic Co-operation and Development, 2005.
World Trade Organization. “Financial Services: Background Note by the Secretariat.” S/C/W/72
(98-4837). Geneva: World Trade Organization, December 1998. _____. “GATS—Fact and Fiction.” Geneva: World Trade Organization, 2001. ______. “Presence of Natural Persons (Mode 4): Background Note by the Secretariat.”
S/C/W/75 (98-4927). Geneva: World Trade Organization, December 1998. Yuskavage, Robert E., Erich H. Strassner and Gabriel W. Medeiros. “Outsourcing and Imported Services in BEA’s Industry Accounts.” Washington, D.C.; Bureau of Economic

APPENDIX C
229
Analysis. Paper prepared for the National Bureau of Economic Research Conference on Research in Income and Wealth. Presented at the Conference on International Service Flows. Bethesda, MD, April 2006. Zagada Institute. Caribbean Call Center Report 2002. Zagada Markets, Inc., 2002. Zeile, William J. “Operations of U.S. Affiliates of Foreign Companies: Preliminary Results
from the 2002 Benchmark Survey.” Survey of Current Business (August 2004): 192-217.

230

APPENDIX D
231
TECHNICAL APPENDIX FOR INDUSTRY-LEVEL ANALYSES
CREATING A LINKED DATABASE WITH OES OCCUPATION DATA AND BEA ANNUAL I-O USE TABLES AND INDUSTRY CODES
The Bureau of Labor Statistics provides publicly available Occupational Employment Statistics (OES) data at a national 4 digit North American Industrial Classification System (NAICS) industry level. The data contain detailed employment and earnings data at the Standard Occupational Classification (SOC) 6 digit level for each industry. BLS also provides 2 digit SOC major occupation data for each industry and industry totals. The data are released about a year after each semi-annual survey is conducted. The consistency of the data makes it quite feasible to combine the separate spreadsheets into a single database. This provides a great deal more flexibility regarding the types of analysis that can be performed. For example, the estimates in Chapter 5 require (1) calculating for each occupation for each industry employment as a percent of industry total employment, (2) applying the shares calculated for the 2002 survey to industry totals in 2005, and (3) subtracting the calculated employment from actual employment levels for each occupation for each industry in the 2005 survey. While it might be possible to do this using the original Excel spreadsheets, the work is greatly facilitated by having all of the data together in a common structure. Similarly, the estimates of employment for core occupations of selected industries in other industries in Chapter 4 is a calculation done easily within a database, but one that might require a great deal more effort working within the spreadsheet format. The other, huge, advantage to working with a database is the ability to incorporate data from the BEA use tables and aggregate the OES data to BEA sector levels in order to perform the analyses of Chapter 5. While it has been possible to do so in Excel, it would have required substantially more effort. Creating the database required a good deal of preparation, despite the ready availability of the national OES data and BEA use tables. To do so we followed the steps below:
1. Download all BLS OES 4 digit spreadsheets, currently including one for November, 2002, May and November for 2003 and 2004, and May, 2005.132
2. In Excel, add two columns at the beginning, “Year” and “Month,” to identify the
surveys to which the data belong.
3. In Microsoft ACCESS, import all of the files, each into its own table. Numeric values in some of the surveys are treated as alphameric. Convert all fields to numeric so that they can be combined using the “Make Table” and “Append” queries.
132 See the BLS web site http://www.bls.gov/oes/home.htm

APPENDIX D
232
4. Make a table from the 2002 data and append the 2003, 2004 and 2005 tables in order, using “Make Table” and “Append” queries.
5. Add an auto numbered primary key ID field to the table “Combined OES Data”.
6. There are 21,696 records with ** in the employment field, indicating that the data is not
available and 249 additional records with missing wage data. Delete these records, using a make table query to create “Combined OES No Missing Data” (252,295 records).
7. Import BEA Annual Industry Accounts Input-Output Use Table data to an Excel
spreadsheet.133 The BEA data contain Use tables for the years 1998-2004 on separate spreadsheets within a single Excel workbook.
8. BEA's Excel Use Table workbook also contains a spreadsheet, “NAICS Codes,” that
contains the specific 2, 3, and 4 digit NAICS industries that are included in each I-O industry sector. Using Microsoft ACCESS, list the 4 digit NAICS codes in the OES data (set the property of the query to “Unique Values” to eliminate duplicates.) Export it to Excel, and create a table that bridges BEA I-O industry codes and titles to the 4-digit NAICS industry codes in the OES. Each line contains a single NAICS code and the matching BEA I-O code and title. Import this table to the database. A summarized version of this file, which groups the NAICS codes for appearance, is attached.
9. Use a select query to join the Combined OES Data and the BEA bridge table. Create a
new OES Data table, “OES with BEA Industry Codes,” that contains BEA industry codes and titles for each record.
10. The data contain useful records that need to be deleted from the main database but
retained as separate tables.
A. Each industry begins with a record with an occupation code “00-0000”. This record contains total employment and average annual compensation. There are 1766 records in the database. Put these into a separate Industry Totals table.
B. Within each industry are records coded XX-0000 where XX is an occupation
class, and 0000 signifies that it is a major occupation grouping. There are 27,643 records of major occupation by industry and survey in the database. Collect major occupation records into a separate table.
11. The data need 3-digit SOC identifiers, but the BLS OES does not contain data
summarized by 3-digit SOC code. Obtain the 3-digit SOC codes and titles from the BLS web site ( http://www.bls.gov/soc/soc_majo.htm ), and manually create a 3-digit to 6-digit occupation code bridge table in Microsoft Excel. Import that table into the Microsoft Access database, and merge the 3-digit occupation code into each record.
133 See the BEA site http://www.bea.gov/bea/dn2/i-o_annual.htm

APPENDIX D
233
12. In the database, create a list of occupation and industry pairs that existed both in 2002 and 2005. Select only these records for all surveys into a new table. This enforces consistency in the calculation of the components of employment change in Chapter 5. This reduces the database from 222,947 records to 168,583 records. Most of the reductions are in low employment occupations or industries, and the reduced data set accounts for 96.9 % of total employment in November2002 and 93.5% in May, 2005.
13. Delete all “-0000” records from this table to prevent double-counting.
14. Calculate total employment for each BEA I-O industry group. Calculate total
employment within each occupation within each BEA I-O industry group. Calculate the occupation share of total employment within each BEA I-O category.
All of the OES data as modified by Academy staff to incorporate BEA industry classifications can be found on the Academy’s web site http://www.napawash.org/pc_management_studies/offshoring/index.html

APPENDIX D
234
Table BEA Industry Account and Equivalent OES 4-digit NAICS Codes
Annual Industry Accounts Classification Codes
BEA Code BEA Industry Group NAICS Equivalent Codes
111CA Farms 115100, 115200 113FF Forestry, fishing, and related activities 113300 211 Oil and gas extraction 211100 212 Mining, except oil and gas 212100, 212200, 212300 213 Support activities for mining 213100 22 Utilities 221100, 221200, 221300 23 Construction 236100, 236200, 237100, 237200, 237300, 237900,
238100, 238200, 238300, 238900 311FT Food and beverage and tobacco products 311100, 311200, 311300, 311400, 311500, 311600,
311700, 311800, 311900, 312100, 312200 313TT Textile mills and textile product mills 313100, 313200, 313300, 314100, 314900 315AL Apparel and leather and allied products 315100, 315200, 315900, 316100, 316200, 316900 321 Wood products 321100, 321200, 321900 322 Paper products 322100, 322200 323 Printing and related support activities 323100 324 Petroleum and coal products 324100 325 Chemical products 325100, 325200, 325300, 325400, 325500, 325600, 325900 326 Plastics and rubber products 326100, 326200 327 Nonmetallic mineral products 327100, 327200, 327300, 327400, 327900 331 Primary metals 331100, 331200, 331300, 331400, 331500, 332 Fabricated metal products 332100, 332200, 332300, 332400, 332500, 332600,
332700, 332800, 332900 333 Machinery 333100, 333200, 333300, 333400, 333500, 333600, 333900 334 Computer and electronic products 334100, 334200, 334300, 334400, 334500, 334600 335 Electrical equipment, appliances, and
components 335100, 335200, 335300, 335900 3361MV Motor vehicles, bodies and trailers, and parts 336100, 336200, 336300 3364OT Other transportation equipment 336400, 336500, 336600, 336900 337 Furniture and related products 337100, 337200, 337900 339 Miscellaneous manufacturing 339100, 339900 42 Wholesale trade
423100, 423200, 423300, 423400, 423500, 423600, 423700, 423800, 423900, 424100, 424200, 424300,
424400, 424500, 424600, 424700, 424800, 424900, 425100 44RT Retail trade 441100, 441200, 441300, 442100, 442200, 443100,
444100, 444200, 445100, 445200, 445300, 446100, 447100, 448100, 448200, 448300, 451100, 451200, 452100, 452900, 453100, 453200, 453300, 453900,
454100, 454200, 454300
481 Air transportation 481100, 481200 482 Rail transportation 482100 483 Water transportation 483100, 483200 484 Truck transportation 484100, 484200 485 Transit and ground passenger transportation 485100, 485200, 485300, 485400, 485500, 485900

APPENDIX D
235
BEA Code BEA Industry Group NAICS Equivalent Codes
486 Pipeline transportation 486100, 486200, 486900 487OS
Other transportation and support activities 487100, 487200, 487900, 488100, 488200, 488300,
488400, 488500, 48890, 491100, 492100, 492200
493 Warehousing and storage 493100 511 Publishing industries (includes software) 511100. 511200 512 Motion picture and sound recording industries 512100, 512200 513
Broadcasting and telecommunications 515100, 515200, 516100, 517100, 517200, 517300,
517400, 517500, 517900
514 Information and data processing services 518100, 518200, 519100 521CI Federal Reserve banks, credit intermediation,
and related activities 521100, 522100, 52220, 522300
523 Securities, commodity contracts, and investments
523100, 523200, 523900
524 Insurance carriers and related activities 524100, 524200 525 Funds, trusts, and other financial vehicles 525100, 525900 531 Real estate 531100, 531200, 531300 532RL Rental and leasing services and lessors of
intangible assets 532100, 532200, 532300, 532400, 533100
5411 Legal services 541100 5412OP Miscellaneous professional, scientific and
technical services 541200, 541300, 541400, 541600, 541700, 541800, 541900
5415 Computer systems design and related services
541500
55 Management of companies and enterprises 551100 561
Administrative and support services 561100, 561200, 561300, 561400, 561500, 561600,
561700, 561900
562 Waste management and remediation services 562100, 562200, 562900 61 Educational services 611100, 611200, 611300, 611400, 611500, 611600, 611700 621 Ambulatory health care services 621100, 621200, 621300, 621400, 621500, 621600, 621900 622HO Hospitals and nursing and residential care
facilities 622100, 622200, 622300, 623100, 623200, 623300, 623900
624 Social assistance 624100, 624200, 624300, 624400 711AS Performing arts, spectator sports, museums,
and related activities 711100, 711200, 711300, 711400, 711500, 712100,
713 Amusements, gambling, and recreation industries
713100, 713200, 713900
721 Accommodation 721100, 721200, 721300 722 Food services and drinking places 722100, 722200, 722300, 722400 81
Other services, except government 811100, 811200, 811300, 811400, 812100, 812200,
812300, 812900, 813100, 813200, 813300, 813400, 813900
GFE Federal government enterprises None GFG Federal general government 999100 GSLE State and local government enterprises None GSLG State and local general government 999200, 999300
Source: Bureau of Economic Analysis

236

APPENDIX E
237
TECHNICAL APPENDIX ON BEA MICRO-DATA ANALYSIS METHODOLOGY AND DATA The data used in this analysis come from two datasets collected by the Bureau of Economic Analysis (BEA): “financial and operating” data of multinational corporations (MNCs), and “international transactions.” The majority of the economic indicators we used come from BEA financial and operating data, with the exception of MNC parent unaffiliated services imports and exports which were extracted from the international transactions dataset. This analysis focused primarily on U.S. MNC parents and their majority-owned foreign affiliates (MOFAs) in four industries at the four-digit North American Industry Classification System (NAICS) level, primarily in the services sector: pharmaceutical and medicine manufacturing [3254], architectural, engineering and related services [5413], computer system design and related services [5415], and business support services [5614]. The time series used is the longest possible given the availability of BEA data using NAICS codes to define MNC industry assignments. Generally, the data examined cover the 1999 to 2003 period; however, in some instances, shorter periods were used – for example unaffiliated services imports and exports data were available only from 2001 to 2003 because BEA used Standard Industrial Classification (SIC) codes, rather than NAICS codes, in 1999 and 2000. BEA defines a U.S. MNC, a U.S. MNC parent, and a U.S. foreign affiliate as: U.S. multinational company: “the U.S. parent and its foreign affiliates;” U.S. MNC parent: “a person, resident in the United States that owns or controls 10 percent or more of the voting securities, or the equivalent, of a foreign business enterprise. “Person” is broadly defined to include any individual, branch, partnership, associated group, association, estate, trust, corporation, or other organization (whether or not organized under the laws of any state), or any government entity. If incorporated, the U.S. parent is the fully consolidated U.S. enterprise consisting of (1) the U.S. corporation whose voting securities are not owned more than 50 percent by another U.S. corporation and (2) proceeding down each ownership chain form that U.S. corporation, any U.S. corporation whose voting securities are more than 50 percent owned by the U.S. corporation above it. A U.S. parent comprises the domestic operations of U.S. MNC, covering operations in the 50 states, the District of Columbia, the Commonwealth of Puerto Rico, and all other U.S. areas;” and U.S. foreign affiliate: “a foreign business enterprise in which there is U.S. direct investment, that is, in which a U.S. person owns or controls (directly or indirectly) 10 percent of more of the voting securities or the equivalent. Foreign affiliates comprise the foreign the foreign operations of a U.S. MNC over which the parent is presumed to have a degree of managerial influence.”134 BEA collects data for all U.S. foreign affiliates but collects more data for majority owned foreign affiliates (MOFAs). Our analysis focused on MOFAs to use a more comprehensive set of 134 Raymond J. Mataloni Jr., “U.S. Multinational Companies Operations in 2003,” (Washington: Bureau of Economic Analysis, July 2005), p. 12.

APPENDIX E
238
economic indicators. BEA defines a MOFA as a foreign affiliate with a combined ownership of all U.S. parents exceeding 50 percent.135 MNC PARENTS Identifying Number of U.S. MNC parents in 3254, 5413, 5415, 5614 for Groups I and II The number of U.S. MNC parents in the four industries was identified by extracting two sub-groups of MNC parents for each industry from BEA financial and operating data, for a total of eight sub-groups.
• Group I consists of those MNC parents classified by BEA as being in one of the four selected industries—according to the preponderance of their sales.
• Group II is made up of those MNC parents classified by BEA in another industry, but
having some sales in one of these four industries.
For example, the pharmaceutical and medicine manufacturing industry [3254] group I includes those MNC parents with the preponderance of their sales in the 3254 NAICS industry, while group II includes those MNC parents that have some, but not the preponderance, of their sales in the 3254 NAICS industry. Total employment for the MNC parents in each of the eight sub-groups were extracted for the years 1999 to 2003 from BEA financial and operating data. The MNC parents were divided into three categories: small, mid-size, and large firms (see Table E-1). The ranges for these three categories are 0-500 employees for a small firm, 500-1,000 employees for a mid-size firm, and 1000 or more employees for a large firm. For most sub-groups, the majority of MNC parents were large firms. The two exceptions were MNC parents concentrated (group I) in architectural, engineering and related services [5413], and in computer system design and related services [5415]. For these two sub-groups the majority of parents were small firms, although the percent of large firms for 5415 parents increased from 38 percent to 42 percent over the period.
135 Mataloni., “U.S. Multinational Companies Operations in 2003,” (Washington: Bureau of Economic Analysis, July 2005), p. 12.

APPENDIX E
239
Table E-1 MNC Distribution by Size of Firm and Year—Group I and Group II*
Group I Industry Group 1999 2000 2001 2002 2003 3254 Total 49 47 46 47 46 Small 19 16 16 16 15 Mid-size 3 6 6 6 7 Large 27 25 24 25 24 5413 Total 51 49 48 47 47 Small 28 28 27 26 26 Mid-size 5 5 5 4 5 Large 18 16 16 17 16 5415 Total 118 114 112 113 103 Small 63 60 57 57 50 Mid-size 10 8 11 12 10 Large 45 46 44 44 43 5614 Total 10 10 10 10 11 Small 1 1 1 1 1 Mid-size 0 0 0 0 0 Large 9 9 9 9 10 Group II Industry group 1999 2000 2001 2002 2003 3254 Total 33 35 36 34 33 Small 5 5 5 5 5 Mid-size 2 2 3 4 4 Large 26 28 28 25 24 5413 Total 64 55 54 55 56 Small 15 15 14 17 15 Mid-size 9 11 10 8 7 Large 40 29 30 30 34 5415 Total 105 106 100 94 90 Small 29 31 32 31 30 Mid-size 11 14 12 12 11 Large 65 61 56 51 49 5614 Total 20 18 17 13 16 Small 1 0 0 0 0 Mid-size 0 0 1 0 0 Large 19 18 16 13 16
* Note: MNC count reflects the original sample including outliers.

APPENDIX E
240
Extracting and Calculating Total Purchased Inputs, Outsourcing Intensity, Off-shoring Intensity, and Services Off-shoring Intensity Total Purchased Inputs The total purchased inputs variable is not directly obtained by BEA through its MNC surveys but is derived from other survey data. BEA and Academy staff used the same approximation to estimate total purchased inputs, i.e. the difference between each MNC parent’s annually reported total sales and the estimated value added. Total sales are reported directly, but value added is estimated by summing the individual components (employee compensation, profit-type return, net interest, indirect business taxes, and capital consumption allowances) that are reported in BEA surveys. The total sales and value added estimates developed from BEA financial and operating data for MNC parents in groups I and II for each of the four industries include both goods and services. The BEA surveys of the operations of MNC parents do distinguish sales of services from total sales, but they do not collect separate information to distinguish between goods and services for the individual components of value added. This limitation precluded any separate analysis of potential outsourcing of services relative to goods among these MNC parents. It also required using a more aggregate indicator for examining services off-shoring as described below. Another data gap is the absence of inventory data in the annual surveys. Inventory data are collected only for the benchmark years—1999 being the latest available. In theory, purchased inputs should equal the difference between a MNC parent’s total output and its value added. Total output includes both total sales and changes in inventory. The derived total purchased inputs measure (total sales less value added) does not include a MNC parent’s change in inventory because annual inventory data are not available. The significance of this limitation is somewhat unclear and BEA staff indicate that the inventory issue for services is likely to be small relative to goods. However, Academy staff encountered a few cases where individual MNC parents have a negative value for purchased inputs because their derived value for value added exceeded their sales for that year. Since purchased inputs is used in the numerator in calculating outsourcing intensity, and in the denominator in calculating off-shoring and services off-shoring intensity, this anomaly also creates a negative value for MNC parents’ calculated outsourcing, off-shoring and services off-shoring intensity indicators. Our methodology for dealing with such outliers is explained in detail in the “Average Outsourcing, Off-shoring and Services Off-shoring Intensity” section. Outsourcing Intensity To assess the extent of outsourcing and any changes in outsourcing activity over the 1999 to 2003 period, Academy staff developed an indirect indicator of outsourcing—the ratio of total purchased inputs to total sales. An increase in this ratio—our “outsourcing intensity” indicator—should occur when a MNC parent increases its use of purchased inputs relative to its total sales (our proxy for total output) and thus outsources more of its internal production processes. MNC

APPENDIX E
241
parents with higher outsourcing intensity ratios utilize purchased inputs more extensively in their production processes than those with lower outsourcing intensity ratios. A MNC with an increasing outsourcing intensity indicator has presumably substituted purchased inputs for its own employees or capital in its production processes over this period. Since this study focused primarily on the outsourcing and off-shoring of services rather than manufactured goods, we wanted to distinguish between services and goods outsourcing to assess the extent of services outsourcing relative to goods outsourcing. But data limitations precluded this, because BEA’s financial and operating data of MNCs currently do not allow separate estimates of purchased services inputs. Off-shoring Intensity and Services Off-shoring Intensity Academy staff derived two indirect indicators of off-shoring: “off-shoring intensity,” calculated as the ratio of total imports to total purchased inputs; and “services off-shoring intensity,” calculated as the ratio of total service imports to total purchased inputs. A significant number of MNC parents in groups I and II for each of the four industries do not have any goods and/or services imports. Thus, the off-shoring and/or services off-shoring intensity is zero for these MNC parents. The values for the total affiliated and unaffiliated goods imports and total affiliated services imports variables were extracted from the financial and operating dataset, and the values for the total unaffiliated service imports variables were extracted from the international transactions dataset. The unaffiliated services imports data list each value of the service categories imported by each company. Academy staff aggregated these data to create a total unaffiliated services imports variable for each company. These services categories come from the survey of Selected Service Transactions with Unaffiliated Foreign Persons and include:
• education and training services; • computer and data processing services; • database and other information services; • telecommunications services; • research, development, and testing services; • management, consulting, and public relations services; • legal services; • industrial engineering services; • industrial-type maintenance; • installation, alterations and training services; • construction services; • engineering, architectural and surveying services; • merchanting services; • operating leasing; • mining services; • other private services (language translations services, security services, collection
services, salvage services, satellite photography and remote sensing/satellite imaging services, space transport, and transcription services);

APPENDIX E
242
• other trade-related services; • performing arts, sports, and other live performances, presentations, and events • purchase of rights to natural resources, and lease bonus payments; • use or lease of rights to natural resources, excluding lease bonus payments; waste
treatment and de-pollution services; and • purchases of financial services transactions not reported on the financial services
transactions with unaffiliated foreign persons survey. The importers in the international transactions data are U.S. companies, both MNC parents and non-MNCs. Academy staff linked the MNC parent importers of unaffiliated services imports to the MNC parent companies extracted from financial and operating survey data, and did not utilize unaffiliated services import data for non-MNCs. The “total imports” component in the “off-shoring intensity” indicator included total affiliated and unaffiliated goods imports, and affiliated service imports for parents in groups I and II for all years. Unaffiliated services imports were included for group I MNC parents for years 2001 to 2003. SIC codes rather than NAICS codes were used for unaffiliated services importers prior to 2001. The “total services imports” component of the “services off-shoring intensity” indicator was constructed in the same way as the “total imports” component. Another important caveat is that neither the goods nor services import data distinguish between imports for intermediate use and those for final demand. Average Outsourcing, Off-shoring and Services Off-shoring Intensity Working with confidential micro-data presents some unusual challenges, not the least of which is determining how to present meaningful results without violating confidentiality requirements. Initially, we did not know whether MNC parents were equally likely to be outsourcing and off-shoring services. Consequently, we decided to calculate group averages for each of the four industries for groups I and II, and identify the number of MNC parents in each group that were above or below that average. In calculating the average outsourcing and services off-shoring intensities for each group, we adjusted the simple arithmetic means for some sub-groups to account for occasional outliers. Outliers for these intensity indicators had either negative values or values above 1. MNC parents with outsourcing or services off-shoring intensity outliers in all years they were represented in one of the eight industry sub-groups were omitted (e.g. a MNC parent with an outsourcing intensity outlier for three out of the three years the firm was in one of the eight industry sub-groups was omitted for all three years). MNC parents with outsourcing or services off-shoring intensity outliers for four out of the five, three out of five, three out of four, two out of four, two out of three, one out of three or one out of two years they were represented in the industry sub-groups were also omitted. In cases where there were outliers for one out of five, two out of five or one out of four years a MNC parent was represented in one of the industry sub-groups, we interpolated the outlier value. There were a total of 119 MNC observations omitted from the analysis due to outlier issues covering all five years for the 8 industry sub-groups. This amounted to only 5.7 percent of the
APPENDIX E
243
total number of MNC observations (2088)136 for the eight sub-groups examined. In none of the sub-groups did the number of omitted MNCs account for more than 10 percent of the group. The vast majority of outliers involved the outsourcing intensity indicator; there were no outliers for the services off-shoring intensity indicator. In addition to identifying those MNC parents above and below the average each year, we also identified the number of MNC parents consistently above the average intensity for five out of five years, and four out of five years. An above average outsourcing intensity, off-shoring intensity or services off-shoring intensity implies that the MNC parents in this category are the top outsourcers, off-shorers or services off-shorers in their industry grouping respectively. Those MNC parents with above average outsourcing, off-shoring or services off-shoring intensity for five out of the five years or four out of the five years are consistently the top outsourcers, off-shorers or services off-shorers in their industry grouping, respectively. These more detailed analyses of the MNC parents in each of our eight sub-groups created a number of confidentiality issues given the small numbers of parents being identified in some of these sub-sub-groups. Since a number of these averages had to be suppressed given the limited number of parents in the sub-groupings developed, this analysis was not included in this report. Comparison of Services Off-shoring MNCs to Total MNCs To overcome these confidentiality issues due to small sample problems, Academy staff distinguished between “services off-shorers,” those MNC parents with service imports, and all other MNC parents (“non-services off-shorers”) in the four industries and two sub-groups (concentrated and non- concentrated) previously described. However, even in this case, some confidentiality issues were encountered. For example, in Table 6A-4, the data for business support services [5614] had to be omitted due to confidentiality issues concerning the limited number of parents in the industry group. The analysis identified nine economic indicators to compare MNC parents engaged in services off-shoring to those MNC parents that were not. These nine variables were total sales, value added, employment, employee compensation, average employee compensation, sales per employee, total imports, net income and capital expenditure. All variables were taken directly from BEA financial and operating data, except for value added, average employee compensation, sales per employee and total imports. We derived average employee compensation as: employee compensation/employment; and sales per employee as: total sales/employment. The total imports variable includes total affiliated and unaffiliated goods imports, and affiliated service imports for groups I and II for all years. Unaffiliated services imports are included only for group I MNC parents for years 2001 to 2003. Those MNC parents considered to be outliers that were omitted from the average outsourcing and service-offshoring intensity analysis were omitted from this analysis as well. The MNC parents with service imports were extracted from the total group of MNC parents for each of the eight industry sub-groups for 1999 to 2003. The ratio of parent MNCs with service
136 A MNC observation is the number of times the MNC appears during the time period. Thus, a MNC that appeared in all five years between 1999 and 2003 had five observations. There were 2888 total MNC observations for all eight sub-groups examined over this period.

APPENDIX E
244
imports to total MNCs in each of the eight industry sub-groups was used to compare the values of each of the nine variables for services off-shorers relative to other MNC parents in each group. We also identified the number of services off-shorers and large services off-shorers (those MNC parents with service imports with 1,000 or more employees) and compared them to the number of total MNCs and total large MNCs respectively. Percentage changes between the years 1999 and 2003 were estimated for the nine variables and the number of services off-shorers and large services off-shorers. Linear Regressions and Means Tests To estimate annual growth rates for these small samples of MNC parents over a limited time period, Academy staff ran linear regressions using SPSS on the natural logs of total sales, employment, average employee compensation, sales per employee, net income and outsourcing intensity for “services off-shorers” and “non-services off-shorers.” Separate regressions were run for each of the eight MNC parent sub-groups over the five year period. Linear regressions were also run for the natural logs of services off-shoring intensity for MNC parents with service imports using the 1999 to 2003 five-year time series. Only one or two of the coefficients for these pooled cross-section/time series regressions were statistically significant (see Table 6A-5). Academy staff estimated the means for the outsourcing and services off-shoring indicators for each MNC parent group among the four industries under review. The differences in these means were then compared on a pair-wise basis. To determine the statistical significance of these pair-wise mean differences in outsourcing and services off-shoring indicators intensities, Academy staff used the independent t-tests from these differences of means tests. We used a similar analytical technique to compare difference in selected financial benchmarks in the four industries and two sub-groups for the 1999 to 2003 period. U.S. FOREIGN AFFILIATES Industry Classifications of U.S. Foreign Affiliates BEA classifies MNC parents and U.S. foreign affiliates according to the industry of the entity’s preponderance of sales for that year. U.S. foreign affiliates may have a different industry classification from their parents if the preponderance of their sales are in different industries. For the year 2003, Academy staff analyzed the industry classifications of the U.S. foreign affiliates with parents whose sales were concentrated in one of the four industries examined (group I) to determine whether those affiliates were classified in different industries. Pie charts show the primary industry distribution in percentage terms of the U.S. foreign affiliates for 2003. Growth of U.S. Foreign Affiliates vs. Growth of MNC Parents Utilizing BEA financial and operating data for U.S. foreign affiliates and MNC parents, Academy staff compared the growth of seven economic variables for U.S. foreign affiliates and MNC parents with concentrated sales (group I) in one of the four industries reviewed. The seven economic variables used in this analysis are total sales, value added, employment, employee

APPENDIX E
245
compensation, average employee compensation (employee compensation/employment), sales per employee (total sales/employment), and net income. In addition to the seven variables, changes in the number of U.S. foreign affiliates and MNC parents were also analyzed. Percentage changes between the years 1999 and 2003 were estimated for the seven variables and the number of U.S. foreign affiliates and MNC parents. For business support services [5614], however, the percentage change was calculated between 2000 and 2003 rather than for 1999 and 2003. The number of foreign affiliates for business support services [5614] increased from 55 in 1999 to 160 in 2000. Changes in the primary industry of even a single large U.S. MNC parent can cause pronounced changes in the number of foreign affiliates classified by the industry of their parent because a given parent might have dozens of foreign affiliates. Because MNC parents tend to be large diversified business enterprises, changes in the industrial mix of their activities can cause their primary industry to change and this appeared to be the case with 5614 between 1999 and 2000. Total Sales and Total Sales of Services of U.S. Foreign Affiliates To assess the destination of U.S. foreign affiliate sales—sales to foreign affiliates’ local market, sales to U.S. market, or sales to other foreign markets—Academy staff examined total foreign affiliate sales to six different sales destinations. The six destinations of sales, disaggregated into affiliated (MNC parent or other foreign affiliates of U.S. MNC parent) and unaffiliated customers, were: total local sales to other foreign affiliates of U.S. parent, total local sales to unaffiliated customers, total sales to U.S. parent, total sales to U.S. unaffiliated customers, total sales to other foreign affiliates of U.S. parent in other countries, and total sales to unaffiliated customers in other countries. The sales in this analysis included both goods and services. We calculated the values of total sales for each of the six sales destinations, and then estimated the percentage of total sales for each of the six sales destinations over the five-year time period for the four industry groups (group I). We also calculated the percentage change between the years 1999 and 2003 for total sales and each of the six total sales destinations. Again, for business support services [5614], we used the percentage change between 2000 and 2003 rather than for 1999 and 2003. Academy staff used the same methodology to analyze the destination of foreign affiliates’ sales of services. Total services sales were compared to total sales for foreign affiliates, and their distribution among the six sales destinations were estimated and compared to the distribution of total sales among these six destinations. MNC Parent Affiliated and Unaffiliated Exports To assess the composition and growth of MNC parent exports, Academy staff analyzed MNC parent total exports, total services exports, total affiliated and unaffiliated services exports. Total MNC parent exports were the sum of affiliated and unaffiliated goods and services exports. MNC parent services exports were the total of affiliated and unaffiliated services exports. The data for this analysis came from BEA financial and operating data, except for unaffiliated services exports which were extracted from the international transactions dataset. The time

APPENDIX E
246
series used was from 2001 to 2003 because SIC codes, rather than NAICS codes, were used in 1999 and 2000 for unaffiliated services exports data (except for MNC parent total affiliated exports that were available on a NAICS basis from 1999 to 2003). To analyze the composition of MNC parent exports, we compared the ratios of total MNC parent services exports to total MNC parent exports, MNC parent affiliated services exports to total MNC parent services exports, and MNC parent unaffiliated services exports to total MNC parent services exports. Due to suppression issues, BEA was unable to allow us to show the percentages of total MNC parent services exports to total MNC parent exports for architectural, engineering and related services [5413], computer system design and related services [5415], and business support services [5614]. To analyze the growth of MNC parent exports, we calculated the percentage change between the years 2001 and 2003 for total MNC parent exports, total MNC parent services exports, MNC parent unaffiliated services exports and the ratios of MNC parent affiliated services exports to total MNC parent services exports and MNC parent unaffiliated services exports to total MNC parent services exports. Due to suppression issues, BEA was unable to allow us to show the percentage changes for the ratio of MNC parent services exports to total MNC parent exports for the four examined industry groups. For MNC parent affiliated services exports, the percentage change was calculated between the years 1999 and 2003 because NAICS codes were used from 1999 to 2003. The percentage change for business support services [5614] was calculated between the years 2000 and 2003. Sales Growth for MNC Parents Relative to Their Foreign Affiliates Academy staff compared the growth in total sales of each MNC parent to the combined total sales of their foreign affiliates for the four group I industry groups used in the MNC parent analyses— those MNC parents with preponderance of sales in pharmaceutical and medicine manufacturing [3254], architectural, engineering and related services [5413], business support services [5614] and computer systems design and related services [5415]. The average percentage change in total sales between the years 1999 and 2003 for MNC parents and their foreign affiliates was used to determine whether MNC parents’ or their combined foreign affiliates’ total sales were growing faster. We collapsed the foreign affiliate total sales data into one combined total for the foreign affiliates of each of the group I MNC parents in each of the four industries examined for 1999 and 2003. Next we hand matched each MNC parent with the combined total of their foreign affiliates for 1999 and 2003. Academy staff then calculated the average percentage change in total sales for the MNC parents between 1999 and 2003, did the same for their foreign affiliates, and then compared these two growth rates. We also tabulated combined total MNC parents in both 1999 and 2003; MNC parents with total sales growth less than their foreign affiliates; MNC parents with positive sales growth; and MNC parents with positive sales growth and sales growth less than their foreign affiliates.

APPENDIX E
247
The number of total MNC parents in this analysis is smaller than other MNC parent numbers throughout Chapter 6 because: (1) we included only those MNC parents in each group I industry group that existed for both 1999 and 2003, thus MNC parents that either entered or exited in one of the two years were not included in the tabulation; and (2) there were some MNC parents in 1999 that did not have foreign affiliates included in the data since these affiliates were exempt from reporting on the 1999 benchmark survey. LISTING OF BACK-UP TABLES FOR CHAPTER 6 Table 6A-1 contains data from 1999 to 2003 showing the average value of the outsourcing, off-shoring and services off-shoring intensity indicators for the MNC parents in each industry and sub-group (groups I and II) as well as the number of parents in each year.

APPENDIX E
248
Table 6A-1 Comparison of Outsourcing, Total Off-shoring and Services Off-shoring
Intensity Indicators by Industry (1999 to 2003)
Ave
rage
O
utso
urci
ng A
vera
ge
Off
shor
ing
Ave
rage
Se
rvic
es
Off
shor
ing
MN
C C
ount
Ave
rage
O
utso
urci
ng A
vera
ge
Off
shor
ing
Ave
rage
Se
rvic
es
Off
shor
ing
MN
C C
ount
Ave
rage
O
utso
urci
ng A
vera
ge
Off
shor
ing
Ave
rage
Se
rvic
es
Off
shor
ing
MN
C C
ount
3254 0.585 0.190 0.027 46 0.562 0.162 0.028 44 0.562 0.176 0.041 435413 0.532 0.025 0.023 48 0.507 0.031 0.028 45 0.520 0.032 0.032 445415 0.490 0.024 0.017 104 0.478 0.031 0.024 100 0.466 0.033 0.021 985614 0.432 0.016 0.002 10 0.356 0.018 0.001 10 0.390 0.027 0.004 10
3254 0.628 0.194 0.015 33 0.593 0.101 0.011 35 0.664 0.116 0.012 365413 0.603 0.163 0.020 62 0.644 0.111 0.005 51 0.622 0.085 0.100 505415 0.618 0.070 0.023 98 0.605 0.080 0.009 99 0.601 0.118 0.007 935614 0.526 0.095 0.005 20 0.575 0.065 0.008 18 0.634 0.050 0.004 17
Gro
up I
Gro
up II
1999 2000 2001
Indu
stry
Ave
rage
O
utso
urci
ng
Ave
rage
O
ffsh
orin
g
Ave
rage
Se
rvic
es
Off
shor
ing
MN
C C
ount
Ave
rage
O
utso
urci
ng
Ave
rage
O
ffsh
orin
g
Ave
rage
Se
rvic
es
Off
shor
ing
MN
C C
ount
3254 0.548 0.184 0.026 43 0.573 0.189 0.037 425413 0.504 0.043 0.041 43 0.506 0.052 0.052 435415 0.480 0.022 0.014 98 0.453 0.025 0.022 915614 0.349 0.049 0.008 10 0.427 0.042 0.012 11
3254 0.639 0.109 0.012 34 0.657 0.116 0.015 335413 0.647 0.076 0.014 51 0.645 0.115 0.014 535415 0.603 0.052 0.007 89 0.588 0.060 0.010 855614 0.556 0.067 0.005 13 0.616 0.062 0.005 16
Gro
up I
Gro
up II
2002 2003
Indu
stry

APPENDIX E
249
Table 6A-2 shows the number and percentage of MNCs with imports (including goods and/or services) compared to the number and percentage of MNCs with services imports only for groups I and II in the four industries examined.
Table 6A-2 MNC Summary
1999 2000 2001 2002 2003All MNCs
Total MNCs 3872 3771 3717 3684 3587Total w/Imports 1856 1781 1776 1778 1749
% Total 47.934 47.229 47.780 48.263 48.759Total w/ Service Imports 653 578 583 583 571
% Total 16.865 15.327 15.685 15.825 15.9193254
Group ITotal MNCs 46 44 43 43 42Total w/Imports 32 31 32 32 31
% Total 69.57 70.45 74.42 74.42 73.81Total w/ Service Imports 19 15 19 19 19
% Total 41.30 34.09 44.19 44.19 45.245413
Group ITotal MNCs 48 45 44 43 43Total w/Imports 9 8 9 9 7
% Total 18.75 17.78 20.45 20.93 16.28Total w/ Service Imports 7 7 8 7 7
% Total 14.58 15.56 18.18 16.28 16.285415
Group ITotal MNCs 104 100 98 98 91Total w/Imports 17 21 23 25 23
% Total 16.35 21.00 23.47 25.51 25.27Total w/ Service Imports 17 19 19 24 21
% Total 16.35 19.00 19.39 24.49 23.085614
Group ITotal MNCs 11 10 10 10 11Total w/Imports 2 2 3 4 3
% Total 18.18 20.00 30.00 40.00 27.27Total w/ Service Imports 2 2 2 3 3
% Total 18.18 20.00 20.00 30.00 27.27
MNCs with Goods and Services ImportsGroup I
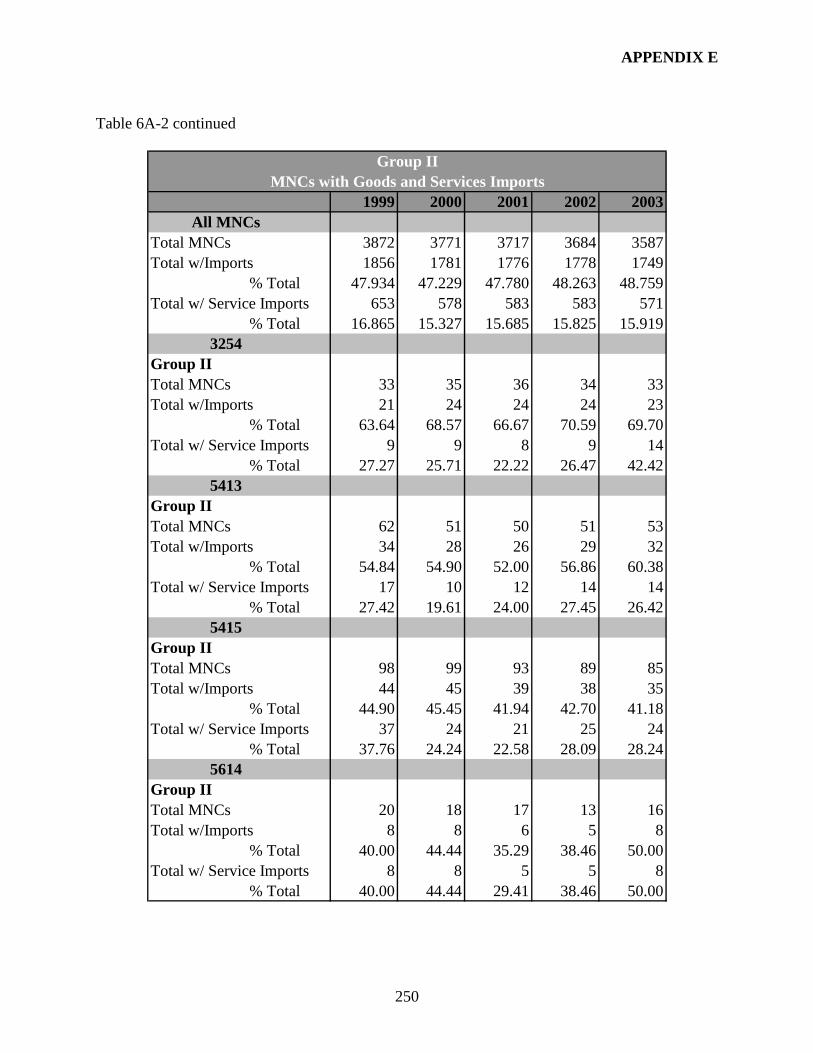
APPENDIX E
250
Table 6A-2 continued
1999 2000 2001 2002 2003All MNCs
Total MNCs 3872 3771 3717 3684 3587Total w/Imports 1856 1781 1776 1778 1749
% Total 47.934 47.229 47.780 48.263 48.759Total w/ Service Imports 653 578 583 583 571
% Total 16.865 15.327 15.685 15.825 15.9193254
Group IITotal MNCs 33 35 36 34 33Total w/Imports 21 24 24 24 23
% Total 63.64 68.57 66.67 70.59 69.70Total w/ Service Imports 9 9 8 9 14
% Total 27.27 25.71 22.22 26.47 42.425413
Group IITotal MNCs 62 51 50 51 53Total w/Imports 34 28 26 29 32
% Total 54.84 54.90 52.00 56.86 60.38Total w/ Service Imports 17 10 12 14 14
% Total 27.42 19.61 24.00 27.45 26.425415
Group IITotal MNCs 98 99 93 89 85Total w/Imports 44 45 39 38 35
% Total 44.90 45.45 41.94 42.70 41.18Total w/ Service Imports 37 24 21 25 24
% Total 37.76 24.24 22.58 28.09 28.245614
Group IITotal MNCs 20 18 17 13 16Total w/Imports 8 8 6 5 8
% Total 40.00 44.44 35.29 38.46 50.00Total w/ Service Imports 8 8 5 5 8
% Total 40.00 44.44 29.41 38.46 50.00
MNCs with Goods and Services ImportsGroup II

APPENDIX E
251
Table 6A-3 shows the regression coefficients for semi-log regressions for pooled time series data for two different sub-groups of MNC parents in each industry comparing services off-shoring MNC parents with non-services off-shoring MNC parents. The coefficients may be interpreted as average annual changes in the variable for the MNC parents in each industry and sub-group.

APPENDIX E
252
Table 6A-3
Average Annual Changes in Intensity Measures and Key Financial Performance Indicators 1999 to 2003
lnou
ts
lnof
fsvc
lnem
p
lnsa
lese
mp
lnav
ecm
p
lnne
tinc
lnsa
les
3254: Group I - Services Off-Shorers 0.163 0.222 ** -0.042 0.188 0.074 -0.064 0.023254: Group I - Non-Services Off-Shorers -0.136 - -0.02 0.037 0.058 -0.197 ** -0.002
5413: Group I - Services Off-Shorers -0.265 0.101 0.014 0.089 0.451 ** 0.016 0.0495413: Group I - Non-Services Off-Shorers -0.027 - 0.004 -0.115 -0.112 0.005 -0.005
5415: Group I - Services Off-Shorers -0.063 -0.036 0.063 0.049 -0.054 -0.13 0.0815415: Group I - Non-Services Off-Shorers -0.017 - -0.013 0.014 0.021 -0.13 ** -0.009
5614: Group I - Services Off-Shorers 0.08 0.205 -0.078 0.45 0.348 0.4 0.1565614: Group I - Non-Services Off-Shorers 0.031 - -0.007 -0.136 -0.273 -0.212 -0.036
Group I
** Statistically significant at the 5% significance level. Note: Measures are regression coefficients reflecting growth rates for 1999 to 2003 generated by SPSS' least squares regression. The regression method gives consideration to all data points in the series, thus it is least likely to be biased by a randomly high or low beginning or ending year. Variables are defined as follows: ln = logarithm; outs = outsourcing intensity measure; off = total offshoring intensity; offsvc = services offshoring; intensity; emp = employment; salesemp = sales per employee; avecmp = average compensation; svcimp = service imports; netinc = net income; sales = total sales
lnou
ts
lnof
fsvc
lnem
p
lnsa
lese
mp
lnav
ecm
p
lnne
tinc
lnsa
les
3254: Group II - Services Off-Shorers 0.139 -0.033 0.04 0.125 0.026 -0.034 0.0763254: Group II - Non-Services Off-Shorers 0.043 - -0.036 0.051 0.11 -0.097 -0.006
5413: Group II - Services Off-Shorers 0.141 0.19 0.15 0.068 0.154 0.127 0.1755413: Group II - Non-Services Off-Shorers 0.004 - 0.013 0.005 0.038 -0.085 0.013
5415: Group II - Services Off-Shorers 0.019 -0.14 0.037 -0.008 0.034 -0.134 0.0325415: Group II - Non-Services Off-Shorers -0.047 - 0.012 -0.026 0.046 -0.028 0.004
5614: Group II - Services Off-Shorers 0.164 -0.037 -0.136 0.09 -0.052 -0.166 -0.0815614: Group II - Non-Services Off-Shorers 0.1 - 0.122 0.066 0.184 -0.043 0.148
Group II
Note: Measures are regression coefficients reflecting growth rates for 1999 to 2003 generated by SPSS' least squares regression. The regression method gives consideration to all data points in the series, thus it is least likely to be biased by a randomly high or low beginning or ending year. Variables are defined as follows: ln = logarithm; outs = outsourcing intensity measure; off = total offshoring intensity; offsvc = services offshoring intensity; emp = employment; salesemp = sales per employee; avecmp = average compensation; svcimp = service imports; netinc = net income; sales = total sales

APPENDIX E
253
Table 6A-4 contains detailed data on the percentage shares of various descriptive and financial measures accounted for by services off-shoring MNCs relative to the rest of the MNCs in their sub-group and industry.
Table 6A-4: Services Off-Shoring MNC Share of Total
NUMBER MNCs
LARGE MNCs
TOTAL SALES
VALUE ADDED EMPLOYMENT EMPLOYMENT
COMPENSATION
Tota
l MN
CS
Serv
ice
Off
-Sh
orer
s
% o
f Tot
al
Tota
l MN
CS
Serv
ice
Off
-Sh
orer
s
% o
f Tot
al
% o
f Tot
al
% o
f Tot
al
% o
f Tot
al
% o
f Tot
al
3254Group I
1999 46 19 41.3% 26 18 69.2% 84.0% 86.5% 83.6% 85.7%2000 44 15 34.1% 24 14 58.3% 66.9% 66.8% 65.6% 70.2%2001 43 17 39.5% 23 16 69.6% 85.3% 87.2% 83.2% 86.1%2002 43 19 44.2% 24 18 75.0% 87.0% 89.6% 84.3% 85.8%2003 42 19 45.2% 23 17 73.9% 87.4% 87.6% 84.9% 85.7%
Percent Change -8.7% 0.0% 9.5% -11.5% -5.6% 6.8% 4.1% 1.3% 1.6% 0.0%Group II
1999 33 9 27.3% 26 9 34.6% 73.9% 76.1% 65.3% 71.4%2000 35 9 25.7% 28 9 32.1% 71.4% 72.2% 59.8% 63.8%2001 36 8 22.2% 28 8 28.6% 74.3% 75.1% 68.7% 69.8%2002 34 9 26.5% 25 8 32.0% 74.5% 74.2% 68.5% 70.1%2003 33 14 42.4% 24 7 29.2% 72.5% 74.3% 66.3% 68.4%
Percent Change 0.0% 55.6% 55.6% -7.7% -22.2% -15.7% -1.9% -2.4% 1.5% -4.1%5413
Group I 1999 48 7 14.6% 18 6 33.3% 52.0% 32.2% 37.3% 35.2%2000 45 6 13.3% 16 5 31.3% 50.7% 38.0% 32.2% 35.5%2001 44 7 15.9% 16 6 37.5% 56.9% 41.4% 37.4% 39.6%2002 43 7 16.3% 17 7 41.2% 57.0% 30.9% 34.0% 37.1%2003 44 7 15.9% 16 7 43.8% 57.2% 33.1% 32.3% 36.7%
Percent Change -8.3% 0.0% 9.1% -11.1% 16.7% 31.3% 10.1% 3.1% -13.3% 4.3%Group II
1999 60 16 26.7% 39 14 35.9% 41.5% 44.9% 48.3% 47.1%2000 52 10 19.2% 29 9 31.0% 56.7% 49.7% 46.8% 41.5%2001 51 12 23.5% 29 10 34.5% 58.0% 5.9% 38.2% 45.3%2002 52 13 25.0% 30 11 36.7% 57.8% 54.2% 45.6% 53.0%2003 54 13 24.1% 34 12 35.3% 61.0% 59.8% 46.6% 55.8%
Percent Change -10.0% -18.8% -9.7% -12.8% -14.3% -1.7% 46.8% 33.2% -3.6% 18.5%5415
Group I 1999 104 17 16.3% 42 10 23.8% 64.5% 57.5% 49.8% 68.0%2000 100 19 19.0% 41 14 34.1% 76.0% 70.5% 64.8% 65.6%2001 98 19 19.4% 41 15 36.6% 69.4% 67.2% 56.5% 62.3%2002 98 24 24.5% 42 17 40.5% 70.1% 64.1% 59.0% 64.1%2003 91 21 23.1% 41 16 39.0% 68.6% 65.0% 58.6% 67.0%
Percent Change -12.5% 23.5% 41.2% -2.4% 60.0% 63.9% 6.5% 13.1% 17.6% -1.4%Group II
1999 98 37 37.8% 63 34 54.0% 77.6% 75.6% 71.0% 74.0%2000 99 24 24.2% 61 21 34.4% 46.9% 55.2% 51.1% 49.9%2001 93 22 23.7% 56 18 32.1% 55.9% 54.2% 54.9% 59.0%2002 89 25 28.1% 51 21 41.2% 54.4% 57.2% 57.1% 59.2%2003 85 24 28.2% 49 21 42.9% 56.7% 55.5% 55.4% 58.8%
Percent Change -13.3% -35.1% -25.2% -22.2% -38.2% -20.6% -26.8% -26.6% -22.0% -20.4%5614
Group I 1999 11 2 18.2% 10 2 20.0% D D D D2000 10 2 20.0% 9 2 22.2% D D D D2001 10 2 20.0% 9 2 22.2% D D D D2002 10 3 30.0% 9 3 33.3% D D D D2003 11 3 27.3% 10 3 30.0% D D D D
Percent Change 0.0% 50.0% 50.0% 0.0% 50.0% 50.0% D D D DGroup II
1999 20 8 40.0% 19 7 36.8% 49.1% 55.8% 48.2% 50.0%2000 18 8 44.4% 19 8 42.1% 57.8% 56.6% 47.6% 53.5%2001 17 5 29.4% 16 5 31.3% 56.7% 53.5% 69.5% 42.4%2002 13 5 38.5% 13 5 38.5% 71.0% 58.8% 49.1% 49.5%2003 16 8 50.0% 16 7 43.8% 70.3% 60.1% 52.3% 53.2%
Percent Change -20.0% 0.0% 25.0% -15.8% 0.0% 18.8% 43.3% 7.7% 8.6% 6.4%

APPENDIX E
254
AVERAGE EMPLOYMENT
COMPENSATIONTOTAL SALES/ EMPLOYMENT
TOTAL IMPORTS NET INCOME CAPITAL
EXPENDITURE
Serv
ice
Off
-Sh
orer
s (%
)
% o
f Tot
al
% o
f Tot
al
% o
f Tot
al
% o
f Tot
al
% o
f Tot
al
3254Group I
1999 41.3% 102.6% 100.5% 74.0% 95.4% 83.2%2000 34.1% 107.0% 102.0% 67.8% 64.7% 41.3%2001 39.5% 103.4% 102.4% 79.0% 97.6% 87.7%2002 44.2% 101.8% 103.2% 87.5% 99.6% 87.5%2003 45.2% 101.0% 102.9% 87.4% 101.2% 83.0%
Percent Change 9.5% -1.6% 2.5% 18.2% 6.1% -0.2%Group II
1999 27.3% 109.3% 113.1% 63.9% 93.6% 74.5%2000 25.7% 106.6% 119.4% 55.8% 95.4% 73.3%2001 22.2% 101.6% 108.1% 60.0% 92.3% 79.9%2002 26.5% 102.4% 108.8% 70.4% 77.4% 72.7%2003 42.4% 103.2% 109.4% 68.4% 94.5% 69.7%
Percent Change 55.6% -5.5% -3.3% 7.0% 0.9% -6.5%5413
Group I 1999 14.6% 94.4% 139.4% 96.7% -25.6% 17.6%2000 13.3% 110.2% 157.3% 100.0% 123.7% 24.5%2001 15.9% 105.7% 151.9% 93.6% 67.3% 37.5%2002 16.3% 109.2% 167.8% 93.4% 236.1% 24.3%2003 15.9% 113.6% 177.0% 100.0% -6.8% 28.3%
Percent Change 9.1% 20.3% 27.0% 3.4% -73.5% 60.6%Group II
1999 26.7% 97.4% 85.9% 30.9% 33.1% 29.3%2000 19.2% 88.6% 121.1% 70.3% 37.7% 40.3%2001 23.5% 118.7% 152.1% 59.0% 74.1% 59.8%2002 25.0% 116.1% 126.7% 60.2% 104.6% 51.9%2003 24.1% 119.7% 130.9% 77.4% 108.8% 48.4%
Percent Change -9.7% 22.9% 52.3% 150.3% 229.0% 65.1%5415
Group I 1999 16.3% 136.6% 129.4% 100.0% 80.2% 72.7%2000 19.0% 101.4% 117.4% 97.1% 90.0% 80.0%2001 19.4% 110.3% 122.7% 26.0% 100.0% 1.5%2002 24.5% 108.6% 118.8% 99.9% 79.9% 75.6%2003 23.1% 114.5% 117.2% 99.8% 87.5% 76.8%
Percent Change 41.2% -16.2% -9.5% -0.2% 9.1% 5.6%Group II
1999 37.8% 104.2% 109.3% 90.2% 100.6% 80.8%2000 24.2% 97.6% 91.9% 54.8% 85.0% 50.6%2001 23.7% 107.5% 101.9% 58.0% 73.5% 57.4%2002 28.1% 103.6% 95.2% 62.4% 28.2% 51.3%2003 28.2% 106.3% 102.5% 68.0% 34.1% 49.0%
Percent Change -25.2% 2.0% -6.2% -24.6% -66.1% -39.4%5614
Group I 1999 18.2% D D D D D2000 20.0% D D D D D2001 20.0% D D D D D2002 30.0% D D D D D2003 27.3% D D D D D
Percent Change 50.0% D D D D D
Note: Values for 5614, group 1 have not been included due to disclosure issues.

APPENDIX E
255
Table 6A-5 contains the results of difference-of-means statistical tests comparing MNCs in the four industries on selected financial indicators.
Table 6A-5 Services Off-Shorers and Non-Services Off-Shorers Average
Differences in Selected Financial Performance Indicators
sale
s
sale
s/em
ploy
ee
outs
ourc
ing
inte
nsity
net i
ncom
e
aver
age
com
pens
atio
n
empl
oym
ent
empl
oym
ent
com
pens
atio
n
3254: Group I - Services Off-Shorers 7,556,161 431 0.57 1,511,351 97 16,559 1,619,3903254: Group I - Non-Services Off-Shorers 1,120,416 272 -0.26 77,587 64 2,831 237,575
Average Difference 6,435,745 ** 159 0.83 1,433,764 ** 33 ** 13,728 ** 1,381,815 **
5413: Group I - Services Off-Shorers 1,795,320 265 0.66 13,041 66 4,957 335,3395413: Group I - Non-Services Off-Shorers 275,445 170 0.48 3,776 63 1,731 107,017
Average Difference 1,519,875 ** 95 ** 0.18 9,265 ** 3 ** 3,226 ** 228,322 **
5415: Group I - Services Off-Shorers 2,743,466 325 0.47 357,526 629 9,900 850,0105415: Group I - Non-Services Off-Shorers 309,038 175 0.48 12,602 242 1,883 115,997Average Difference 2,434,428 ** 150 ** -0.01 344,924 ** 387 ** 8,017 ** 734,013 **
5614: Group I - Services Off-Shorers 1,993,636 97 0.38 27,107 45 14,025 812,4355614: Group I - Non-Services Off-Shorers 1,299,619 76 0.30 44,178 30 12,792 525,149
Average Difference 694,017 21 0.08 -17,071 15 1,233 287,286
Group I
sale
s
sale
s/em
ploy
ee
outs
ourc
ing
inte
nsity
net i
ncom
e
aver
age
com
pens
atio
n
empl
oym
ent
empl
oym
ent
com
pens
atio
n
3254: Group II - Services Off-Shorers 146,851,188 477 0.67 1,414,784 68 29,550 2,095,4043254: Group II - Non-Services Off-Shorers 1,734,588 373 0.64 37,922 63 4,960 308,115
Average Difference 145,116,600 ** 104 0.03 1,376,862 ** 5 ** 24,590 ** 1,787,289 **
5413: Group II - Services Off-Shorers 11,709,982 616 0.67 335,376 63 25,456 1,631,9435413: Group II - Non-Services Off-Shorers 2,779,534 341 0.65 50,220 64 9,225 507,861
Average Difference 8,930,448 ** 275 ** 0.02 ** 285,156 ** -1 16,231 ** 1,124,082 **
5415: Group II - Services Off-Shorers 8,218,474 337 0.57 343,315 69 29,179 2,126,6835415: Group II - Non-Services Off-Shorers 2,340,466 272 0.61 29,719 67 8,383 557,679
Average Difference 5,878,008 ** 65 ** -0.04 313,596 ** 2 20,796 ** 1,569,004 **
5614: Group II - Services Off-Shorers 8,475,384 340 0.63 1,208,754 53 21,833 1,247,0885614: Group II - Non-Services Off-Shorers 3,463,999 287 0.55 226,780 57 15,824 848,221
Average Difference 5,011,385.00 ** 53.00 0.08 981,974.00 ** -4.00 6,009.00 398,867.00 **
Group II
** Difference is statistically significant at the 5% significance level. Note: Numbers, except for employment, are in thousands and are rounded up to the nearest whole number.

APPENDIX E
256
Table 6A-6 shows the percentage changes in seven economic indicators for foreign affiliates with MNC parents in each industry between the years 1999 and 2003 or 2000 and 2003.
Table 6A-6 Growth of U.S. Foreign Affiliates—Percentage Change From 1999 to 2003 or 2000 to 2003
Sale
s
Valu
e A
dded
Empl
oym
ent
Empl
oym
ent
Com
pens
atio
n
Ave
rage
Em
ploy
men
t C
ompe
nsat
ion
Sale
s Pe
r Em
ploy
ee
Net
Inco
me
Total Total Total Total Total Total Total3254
Percent Change from 1999 to 2003*1 57.4% 40.5% 10.3% 24.4% 12.7% 42.7% 203.5%5413
Percent Change from 1999 to 2003*1 -12.7% 15.6% 28.5% 9.1% -15.1% -32.0% 55.2%5415
Percent Change from 1999 to 2003*1 9.0% 10.3% 5.5% 4.5% -0.9% 3.3% 74.8%5614
Percent Change from 2000 to 2003*2 10.7% 12.5% -3.3% -2.6% 0.7% 14.5% 821.6%
*1/ Percent Change between years 1999 and 2003 is calculated as: (total variable value for 2003-total variable value for 1999)/total variable value for 1999. *2/ Percent Change between years 2000 and 2003 is calculated as: (total variable value for 2003-total variable value for 2000)/total variable value for 2000. Note: The number of foreign affiliates for business support services [5614] increased from 55 in 1999 to 160 in 2000. Changes in the primary industry of even a single large U.S. MNC parent can cause pronounced changes in the number of foreign affiliates classified by the industry of their parent because a given parent might have dozens of foreign affiliates. U.S. MNC parent are classified by their primary industry of sales. Because MNC parents tend to be large, diversified business enterprises, changes in the industrial mix of their activities can cause their primary industry to change. For this reason, we calculated the percentage change between 2000 and 2003 for 5614, rather than 1999 and 2003.
Table 6A-7 shows the percentage changes for the same seven economic indicators used in Table 6A-6 for MNC parents in each industry between 1999 and 2003 in order to compare the MNC parents’ growth to their foreign affiliates’ growth for each indicator.
Table 6A-7 Growth of MNC Parents- Percentage Change from 1999 to 2003
Sale
s
Valu
e A
dded
Empl
oym
ent
Empl
oym
ent
Com
pens
atio
n
Ave
rage
Em
ploy
men
t C
ompe
nsat
ion
Sale
s Pe
r Em
ploy
ee
Net
Inco
me
Total Total Total Total Total Total Total3254
Percent Change from 1999 to 2003*1 43.2% 22.3% 10.9% 32.1% 19.1% 29.1% 13.8%5413
Percent Change from 1999 to 2003*1 1.3% 5.0% -17.7% 0.1% 21.6% 23.0% 224.7%5415
Percent Change from 1999 to 2003*1 -6.8% -3.7% -8.4% 8.9% 18.8% 1.8% -11.7%5614
Percent Change from 1999 to 2003*1 -12.2% -7.0% -9.3% -8.6% 0.7% -3.2% -79.3% *1/ Percent Change between years 1999 and 2003 is calculated as: (total variable value for 2003-total variable value for 1999)/total variable value for 1999.

APPENDIX E
257
Table 6A-8 contains foreign affiliate sales data—both goods and services—by destination--local sales, sales to other foreign customers, and sales to U.S. customer—and customer type—affiliated and unaffiliated customers, for 1999 to 2003.
Table 6A-8 Total Affiliated Sales by Destination and Customer Type (1999 to 2003)
Total Local Sales to Other Foreign Affiliates of U.S. Parent % of Total Sales
Total Local Sales to Unaffiliated Customers % of Total Sales
Total Sales to U.S. Parent % of Total Sales
Total Sales to U.S. Unaffiliated Customers % of Total Sales
Total Sales to Other Foreign Affiliates of U.S. Parent in Other Countries % of Total Sales
Total Sales to Unaffiliated Customers in Other Countries % of Total Sales
32541999 6.0% 55.5% 6.6% 0.3% 26.1% 5.4%2000 3.0% 51.4% 6.8% 0.2% 28.6% 10.0%2001 3.4% 51.8% 6.6% 0.3% 29.3% 8.7%2002 3.5% 48.0% 8.6% 0.5% 31.2% 8.2%2003 4.4% 43.2% 8.1% 0.1% 36.3% 7.9%
54131999 0.5% 82.0% 0.3% 0.5% 1.4% 15.2%2000 0.8% 71.4% 0.7% 1.5% 1.9% 23.7%2001 0.6% 76.5% 1.0% 1.4% 1.4% 19.1%2002 0.6% 76.9% 0.8% 1.2% 1.5% 18.9%2003 3.4% 76.7% 0.3% 0.3% 2.6% 16.6%
56141999 0.2% 97.1% 0.0% 1.4% 0.2% 1.1%2000 10.6% 71.0% 4.2% 0.0% 1.8% 12.4%2001 0.0% 48.6% 4.9% 0.0% 27.7% 18.8%2002 0.3% 46.8% 2.1% 0.0% 17.9% 32.9%2003 0.1% 53.3% 1.2% 1.5% 12.5% 31.3%
54151999 0.4% 71.6% 11.4% 0.7% 13.9% 2.0%2000 0.6% 73.4% 10.4% 0.4% 10.3% 5.0%2001 0.2% 70.7% 10.3% 0.2% 15.7% 2.9%2002 0.5% 73.3% 9.4% 0.3% 14.6% 2.0%2003 0.8% 76.5% 8.4% 0.3% 12.6% 1.5%

APPENDIX E
258
Table 6A-9 shows the percentage change from 1999 to 2003 or 2000 to 2003 for total affiliated sales by destination and customer type.
Table 6A-9
Total Affiliated Sales by Destination and Customer Type—Percentage Change from 1999 to 2003 or 2000 to 2003
Total Sales
Total Local Sales to Other Foreign Affiliates of U.S. Parent
Total Local Sales to Other Foreign Affiliates of U.S. Parent % of Total Sales
Total Local Sales to Unaffiliated Customers
Total Local Sales to Unaffiliated Customers % of Total Sales
Total Sales to U.S. Parent
Total Sales to U.S. Parent % of Total Sales
Total Sales to U.S. Unaffiliated Customers
Total Sales to U.S. Unaffiliated Customers % of Total Sales
Total Sales to Other Foreign Affiliates of U.S. Parent in Other Countries
Total Sales to Other Foreign Affiliates of U.S. Parent in Other Countries % of Total Sales
Total Sales to Unaffiliated Customers in Other Countries
3254% Change from 1999 to 2003*1 57.4% 15.0% -27.0% 22.5% -22.2% 93.6% 23.0% -46.9% -66.3% 118.4% 38.8% 130.7%
5413% Change from 1999 to 2003*1 -12.7% 449.1% 529.0% -18.4% -6.5% -9.6% 3.6% -53.1% -46.3% 67.5% 91.8% -4.5%
5614% Change from 1999 to 2003*1 1138.7% 9.6%% Change from 2000 to 2003*2 10.7% -98.7% -98.8% -16.8% -24.8% -68.1% -71.2% 655.3% 582.4% 179.6%
5415% Change from 1999 to 2003*1 9.0% 138.7% 119.0% 16.4% 6.8% -19.5% -26.1% -57.4% -60.9% -1.6% -9.7% -20.1%
*1/ Percent Change between years 1999 and 2003 is calculated as: (total variable value for 2003-total variable value for 1999)/total variable value for 1999. *2/ Percent Change between years 2000 and 2003 is calculated as: (total variable value for 2003-total variable value for 2000)/total variable value for 2000. Note: The number of foreign affiliates for business support services [5614] increased from 55 in 1999 to 160 in 2000. Changes in the primary industry of even a single large U.S. MNC parent can cause pronounced changes in the number of foreign affiliates classified by the industry of their parent because a given parent might have dozens of foreign affiliates. U.S. MNC parent are classified by their primary industry of sales. Because MNC parents tend to be large, diversified business enterprises, changes in the industrial mix of their activities can cause their primary industry to change. For this reason, we calculated the percentage change between 2000 and 2003 for 5614, rather than 1999 and 2003. The average percentage change between 1999 and 2003 was used for “Sales to U.S. Unaffiliated Customers” for 5614 because there were only sales made by MNCs in this industry to U.S. unaffiliated customers in the years 1999 and 2003.

APPENDIX E
259
Table 6A-10 contains affiliate sales of services data by destination--local sales, sales to other foreign customers, and sales to U.S. customer—and customer type—affiliated and unaffiliated customers, for 1999 to 2003.
Table 6A-10 Total Affiliated Sales of Services by Destination and Customer Type
Total Sales of Services
% of Total Sales
Local Sales of
Services to Other
Foreign Affiliates of U.S. Parent % of Total
Sales of Services
Local Sales of Services to Unaffiliated
customers% of Total Sales
of Services
Sales of Services
to U.S. Parent %
of Total Sales of Services
Sales of Services to
U.S. Unaffiliated Customers % of Total
Sales of Services
Sales of Services to Other Foreign
Affiliates of U.S.
Parent in Other
Countries % of
Total Sales of Services
Sales of Services to Unaffiliated Customers
in Other Countries %
of Total Sales of Services
32541999 0.6% 6.0% 75.2% 9.0% 0.02% 9.8% 0.0%2000 1.0% 19.0% 68.5% 2.0% 1.1% 7.3% 2.2%2001 1.2% 8.8% 70.8% 5.2% 0.01% 15.1% 0.0%2002 1.0% 19.4% 56.0% 4.9% 0.04% 19.6% 0.1%2003 1.2% 3.3% 53.7% 10.7% 0.01% 31.7% 0.5%
54131999 42.2% 1.3% 60.7% 0.4% 1.1% 3.1% 33.4%2000 61.5% 1.3% 57.3% 0.6% 1.1% 2.9% 36.8%2001 57.5% 0.9% 64.6% 0.9% 0.2% 2.4% 31.0%2002 53.8% 1.0% 60.3% 1.0% 0.1% 2.7% 34.8%2003 51.6% 3.0% 60.0% 0.5% 0.0% 5.0% 31.4%
56141999 98.9% 0.2% 97.1% 0.0% 1.4% 0.2% 1.1%2000 33.3% 32.0% 67.3% 0.0% 0.0% 0.3% 0.4%2001 33.3% 0.0% 49.5% 1.4% 0.0% 48.8% 0.3%2002 36.7% 0.0% 51.7% 1.3% 0.0% 46.7% 0.4%2003 40.2% 0.0% 69.8% 0.6% 3.7% 25.5% 0.4%
54151999 51.0% 0.5% 80.5% 7.0% 0.5% 8.8% 2.8%2000 50.4% 0.8% 85.0% 2.3% 0.7% 4.9% 6.4%2001 50.9% 0.2% 81.2% 4.9% 0.4% 10.5% 2.8%2002 55.0% 0.2% 81.3% 4.9% 0.4% 11.2% 2.0%2003 58.0% 0.7% 80.1% 6.6% 0.4% 11.0% 1.1%

APPENDIX E
260
Table 6A-11 shows the percentage change from 1999 to 2003 or 2000 to 2003 for affiliated sales of services by destination and customer type.
Table 6A-11 Affiliated Sales of Services by Destination and Customer Type—Percentage Change From 1999 to 2003 or 2000 to 2003
Total Sales
Sales of Services
Sales of Services % of Total Sales
Local Sales of Services to Other Foreign Affiliates of U.S. Parent
Local Sales of Services to Other Foreign Affiliates of U.S. Parent % of Sales of Services
Local Sales of Services to Unaffiliated customers
Local Sales of Services to Unaffiliated customers % of Sales of Services
Sales of Services to U.S. Parent
Sales of Services to U.S. Parent % of Sales of Services
Sales of Services to U.S. Unaffiliated Customers
Sales of Services to U.S. Unaffiliated Customers % of Sales of Services
Sales of Services to Other Foreign Affiliates of U.S. Parent in Other Countries
3254% Change from 1999 to 2003*1 57.4% 192.9% 86.1% 62.0% -44.7% 109.3% -28.6% 248.4% 19.0% 43.5% -51.0% 847.8%% Change from 2000 to 2003*2
5413% Change from 1999 to 2003*1 -12.7% 6.9% 22.4% 151.4% 135.3% 5.7% -1.1% 27.0% 18.9% -96.7% -96.9% 72.1%
5614% Change from 1999 to 2003*1 1138.7% 170.0%% Change from 2000 to 2003*2 10.7% 33.6% 20.7% -100.0% -100.0% 38.6% 3.7% 3096.5% 2291.9% 11296.5%
5415% Change from 1999 to 2003*1 9.0% 23.8% 13.6% 99.8% 61.4% 23.2% -0.5% 18.1% -4.6% 9.4% -11.6% 55.0% *1/ Percent Change between years 1999 and 2003 is calculated as: (total variable value for 2003-total variable value for 1999)/total variable value for 1999. *2/ Percent Change between years 2000 and 2003 is calculated as: (total variable value for 2003-total variable value for 2000)/total variable value for 2000.
Note: In the case of 3254, the percent change from 2000 to 2003 is taken when there are zero values for 1999. In the case of 5614, the number of foreign affiliates for business support services [5614] increased from 55 in 1999 to 160 in 2000. Changes in the primary industry of even a single large U.S. MNC parent can cause pronounced changes in the number of foreign affiliates classified by the industry of their parent because a given parent might have dozens of foreign affiliates. U.S. MNC parent are classified by their primary industry of sales. Because MNC parents tend to be large, diversified business enterprises, changes in the industrial mix of their activities can cause their primary industry to change. For this reason, we calculated the percentage change between 2000 and 2003 for 5614, rather than 1999 and 2003. However, the average percentage change between 1999 and 2003 was used for "Sales of Services to U.S. Unaffiliated Customers" and "Sales of Services to U.S. Unaffiliated Customers % of Sales of Services" for 5614 because there were only sales of services made by MNCs in this industry to U.S. unaffiliated customers in the years 1999 and 2003.

APPENDIX E
261
Table 6A-12 shows the composition of MNC parent exports using the ratios of MNC parent affiliated services exports to total MNC parent services exports, and MNC parent unaffiliated services exports to total MNC parent services exports.
Table 6A-12 MNC Parent Affiliated and Unaffiliated Services Exports (2001-2003)*1
Total MNC Services Exports % of Total MNC Parent Exports
MNC Parent Affiliated Services Exports % of
Total MNC Parent Services Exports
MNC Parent Unaffiliated Services
Exports % of Total MNC Parent Services
Exports3254
2001 19.8% 99.0% 1.0%2002 22.2% 97.8% 2.2%2003 16.3% 98.7% 1.3%
54132001 D*2 76.1% 23.9%2002 D 74.4% 25.6%2003 D 62.8% 37.2%
56142001 D 99.7% 0.3%2002 D 97.4% 2.6%2003 D 98.0% 2.0%
54152001 D 85.6% 14.4%2002 D 84.5% 15.5%2003 D 85.4% 14.6%
*1/ BEA unaffiliated services export data are classified using NAICS codes starting in 2001, consequently total exports and total services exports could only be calculated for our four industries from 2001 to 2003. *2/ Due to suppressions issues, BEA was unable to allow us to show data in these cases.

APPENDIX E
262
Table 6A-13 shows the percentage change from 2001 to 2003 for total MNC parent exports, MNC parent services exports, MNC parent unaffiliated services exports, and the ratios of MNC parent affiliated services exports to total MNC parent services exports and MNC parent unaffiliated services exports to total MNC parent services exports. The percentage change from 1999 to 2003 or 2000 to 2003 was used for MNC parent affiliated services exports.
Table 6A-13 MNC Parent Affiliated and Unaffiliated Services Exports—Percentage Change
from 2001 to 2003 or 2000 to 2003
Total MNC
Parent Exports
Total MNC
Parent Services Exports
MNC Services Exports
% of Total MNC
Parent Exports
MNC Parent
Affiliated Services Exports
MNC Parent
Affiliated Services
Exports% of Total
MNC Parent
Services Exports
MNC Parent
Unaffiliated Services Exports
MNC Parent Unaffiliated
Services Exports%
of Total MNC Parent
Services Exports
3254% Change from 2001 to 2003*1 26.1% 3.8% D*4 -0.3% 39.1% 34.0%% Change from 1999 to 2003*2 -6.3%
5413% Change from 2001 to 2003*1 41.4% -4.1% D -17.4% 49.0% 55.4%% Change from 1999 to 2003*2 -54.0%
5614% Change from 2001 to 2003*1 -16.3% -2.2% D -1.7% 594.7% 610.7%% Change from 2000 to 2003*3 -0.8%
5415% Change from 2001 to 2003*1 10.9% 35.1% D -0.3% 37.3% 1.6%% Change from 1999 to 2003*2 32.1%
*1/ Percent Change from 2001 to 2003 is calculated as: (total variable value for 2003-total variable value for 2001)/total variable value for 2001. Note: BEA unaffiliated services export data are classified using SIC codes through 2000 and then are classified using NAICS codes starting in 2001, consequently total exports and total services exports could only be calculated for our four industry from 2001-2003. *2/ Percent Change from 1999 to 2003 is calculated as: (total variable value for 2003-total variable value for 1999)/total variable value for 1999. *3/ Percent Change from 2000 to 2003 is calculated as: (total variable value for 2003-total variable value for 2000)/total variable value for 2000. Note: The number of foreign affiliates for business support services [5614] increased from 55 in 1999 to 160 in 2000. Changes in the primary industry of even a single large U.S. MNC parent can cause pronounced changes in the number of foreign affiliates classified by the industry of their parent because a given parent might have dozens of foreign affiliates. U.S. MNC parent are classified by their primary industry of sales. Because MNC parents tend to be large, diversified business enterprises, changes in the industrial mix of their activities can cause their primary industry to change. For this reason, we calculated the percentage change between 2000 and 2003 for 5614, rather than 1999 and 2003. *4/ Due to suppressions issues, BEA was unable to allow us to show data in these cases.