Occupation and cancer – follow-up of 15 million people in five Nordic countries
140
Acta Oncologica - Pukkala et al, Index Occupation and cancer. Follow-up of million people in five Nordic Countries EERO PUKKALA 1 , JAN IVAR MARTINSEN 2 , ELSEBETH LYNGE 3 , HOLMFRIDUR KOLBRUN GUNNARSDOTTIR 4 , PÄR SPARÉN 5 , LAUFEY TRYGGVADOTTIR 6 , ELISABETE WEIDERPASS 2,5,7 , KRISTINA KJÆRHEIM 2 Result tables by site ICD- Site ICD- Site 140 Lip cancer Testicular seminoma 141 Cancer of the tongue Testicular non-seminoma 142 Cancer of the salivary glands 179.0 Cancer of the penis 143-144 Cancer of the oral cavity 180 Kidney cancer 145-148 Cancer of the pharynx 180.1 Cancer of the kidney and renal pelvis 145 Cancer of the oropharynx 181 Cancer of the bladder, ureter, and urethra 146 Cancer of the nasopharynx 190 Malignant melanoma of the skin 150 Oesophageal cancer 190.6 Skin melanoma, upper limbs Adenocarcinoma of the oesophagus 191 Non-melanoma skin cancer 151 Stomach cancer 191.6 Non-melanoma skin cancer, upper limbs 151.1 Cardia cancer 192 Eye cancer 152 Cancer of the small intestine Malignant melanoma of the eye 153 Colon cancer 193 Brain cancer 154 Rectal cancer Glioma 155.0 Liver cancer Meningeoma Hemangiosarcoma of the liver 194 Thyroid cancer 155.1 Cancer of the gallbladder Follicular thyroid cancer 157 Pancreatic cancer Papillary thyroid cancer 160 Nasal cancer 195.0 Cancer of the glandula suprarenalis Adenocarcinoma of the nose 195.1 Cancer of the glandula parathyreioeda 161 Laryngeal cancer 195.2 Cancer of the thymus 162,163 Lung cancer 195.3 Cancer of the hypophysis Adenocarcinoma of the lung 195.4 Cancer of the corpus pineale Small cell cancer of the lung 196 Bone cancer Squamous cell cancer of the lung Chondrosarcoma Other and unspecified lung cancer 197 Soft tissue cancer 158, 162.2 Mesothelioma in the pleura/peritoneum Fibrosarcoma 170 Breast cancer Liposarcoma Ductal breast cancer 199 Other/unknown site Lobular breast cancer 200,202 Non-Hodgkin lymphoma 171 Cancer of the cervix uteri 201 Hodgkin lymphoma 172 Cancer of the corpus uteri 203 Multiple myeloma 173 Choriocarcinoma 204 Leukaemia 175.0 Ovarian cancer Chronic lymphatic leukaemia 175.1 Cancer of the fallopian tube Acute myeloid leukaemia 176.0 Cancer of the vulva Mycosis fungoides 176.1 Vaginal cancer Borderline tumour of the ovary 177 Prostate cancer 140-204 All malignant neoplasms 178 Testicular cancer Contact: Prof. Eero Pukkala, email:eero.pukkala@cancer.fi 1 Finnish Cancer Registry, 2 Cancer Registry of Norway, 3 University of Copenhagen, 4 Research Center for Occupational Health & Working Life, Reykjavik, Iceland 5 Karolinska Institute, Stockholm, Sweden. 6 Icelandic Cancer Registry, 7 Samfundet Folkhalsan, Helsinki Finland
-
Upload
independent -
Category
Documents
-
view
0 -
download
0
Transcript of Occupation and cancer – follow-up of 15 million people in five Nordic countries

Acta Oncologica - Pukkala et al, 2008 Index
Occupation and cancer. Follow-up of 15 million people in five Nordic CountriesEERO PUKKALA1, JAN IVAR MARTINSEN2, ELSEBETH LYNGE3, HOLMFRIDUR KOLBRUN GUNNARSDOTTIR4, PÄR SPARÉN5,LAUFEY TRYGGVADOTTIR6, ELISABETE WEIDERPASS2,5,7, KRISTINA KJÆRHEIM2
Result tables by siteICD-7 Site ICD-7 Site
140 Lip cancer 2 Testicular seminoma 69141 Cancer of the tongue 4 Testicular non-seminoma 70142 Cancer of the salivary glands 6 179.0 Cancer of the penis 71143-144 Cancer of the oral cavity 8 180 Kidney cancer 72145-148 Cancer of the pharynx 10 180.1 Cancer of the kidney and renal pelvis 74145 Cancer of the oropharynx 12 181 Cancer of the bladder, ureter, and urethra 76146 Cancer of the nasopharynx 14 190 Malignant melanoma of the skin 78150 Oesophageal cancer 16 190.6 Skin melanoma, upper limbs 80
Adenocarcinoma of the oesophagus 18 191 Non-melanoma skin cancer 82151 Stomach cancer 20 191.6 Non-melanoma skin cancer, upper limbs 84151.1 Cardia cancer 22 192 Eye cancer 86152 Cancer of the small intestine 24 Malignant melanoma of the eye 88153 Colon cancer 26 193 Brain cancer 90154 Rectal cancer 28 Glioma 92155.0 Liver cancer 30 Meningeoma 94
Hemangiosarcoma of the liver 32 194 Thyroid cancer 96155.1 Cancer of the gallbladder 34 Follicular thyroid cancer 98157 Pancreatic cancer 36 Papillary thyroid cancer 100160 Nasal cancer 38 195.0 Cancer of the glandula suprarenalis 102
Adenocarcinoma of the nose 40 195.1 Cancer of the glandula parathyreioeda 104161 Laryngeal cancer 42 195.2 Cancer of the thymus 106162,163 Lung cancer 44 195.3 Cancer of the hypophysis 108
Adenocarcinoma of the lung 46 195.4 Cancer of the corpus pineale 110Small cell cancer of the lung 48 196 Bone cancer 112Squamous cell cancer of the lung 50 Chondrosarcoma 114Other and unspecified lung cancer 52 197 Soft tissue cancer 116
158, 162.2 Mesothelioma in the pleura/peritoneum 54 Fibrosarcoma 118170 Breast cancer 56 Liposarcoma 120
Ductal breast cancer 58 199 Other/unknown site 122Lobular breast cancer 59 200,202 Non-Hodgkin lymphoma 124
171 Cancer of the cervix uteri 60 201 Hodgkin lymphoma 126172 Cancer of the corpus uteri 61 203 Multiple myeloma 128173 Choriocarcinoma 62 204 Leukaemia 130175.0 Ovarian cancer 63 Chronic lymphatic leukaemia 132175.1 Cancer of the fallopian tube 64 Acute myeloid leukaemia 134176.0 Cancer of the vulva 65 Mycosis fungoides 136176.1 Vaginal cancer 66 Borderline tumour of the ovary 138177 Prostate cancer 67 140-204 All malignant neoplasms 139178 Testicular cancer 68
Contact: Prof. Eero Pukkala, email:[email protected]
1Finnish Cancer Registry, 2Cancer Registry of Norway, 3University of Copenhagen, 4Research Center for Occupational Health & Working Life, Reykjavik, Iceland 5KarolinskaInstitute, Stockholm, Sweden. 6Icelandic Cancer Registry, 7Samfundet Folkhalsan, Helsinki Finland

Acta Oncologica - Pukkala et al, 2008 Lip cancer
Observed number of lip cancer among men in the Nordic countries and standardised incidence ratios 1961-2005, by country andoccupational category
Denmark Finland Iceland Norway Sweden Total
No Occupational category Obs SIR Obs SIR Obs SIR Obs SIR Obs SIR Obs SIR 95% CI
1 Technical workers, etc 74 0.44 78 0.49 1 1.16 43 0.47 290 0.66 486 0.56 0.52—0.622 Laboratory assistants 1 0.30 3 0.81 [0.17] 0.00 3 0.62 2 1.51 9 0.68 0.31—1.283 Physicians 1 0.07 [8.94] 0.00 [0.38] 0.00 5 0.37 10 0.52 16 0.28 0.16—0.464 Dentists 1 0.24 [2.00] 0.00 [0.08] 0.00 6 0.98 6 0.59 13 0.58 0.31—0.995 Nurses 1 5.29 [0.29] 0.00 [0.00] 0.00 1 2.61 [0.52] 0.00 2 1.44 0.17—5.216 Assistant nurses 4 1.01 1 4.68 [0.04] 0.00 1 0.40 4 0.59 10 0.75 0.36—1.377 "Other health workers" 2 0.16 6 0.62 [0.10] 0.00 1 0.19 15 0.86 24 0.54 0.34—0.808 Teachers 33 0.44 26 0.38 1 0.74 31 0.44 45 0.42 136 0.42 0.36—0.509 Religious workers etc 14 0.43 9 0.26 [0.94] 0.00 15 0.39 44 0.53 82 0.43 0.34—0.5410 Artistic workers 3 0.31 3 0.22 [0.26] 0.00 4 0.35 10 0.37 20 0.32 0.20—0.5011 Journalists 2 0.44 1 0.15 1 6.78 3 0.62 5 0.39 12 0.41 0.21—0.7212 Administrators 74 0.38 39 0.36 1 0.37 71 0.50 94 0.49 279 0.44 0.39—0.4913 Clerical workers 33 0.40 46 0.60 2 0.66 45 0.43 113 0.57 239 0.52 0.45—0.5914 Sales agents 27 0.62 51 0.48 2 1.32 65 0.51 157 0.55 302 0.54 0.48—0.6015 Shop workers 90 0.46 25 0.62 1 0.97 31 0.69 51 0.58 198 0.54 0.47—0.6216 Farmers 621 1.56 952 1.53 10 2.18 578 1.45 978 1.68 3139 1.57 1.51—1.6217 Gardeners 69 1.25 120 1.53 [0.15] 0.00 133 1.44 355 1.76 677 1.58 1.47—1.7118 Fishermen 57 3.33 14 1.79 1 0.51 232 1.92 80 3.65 384 2.27 2.05—2.5119 Forestry workers 18 2.22 124 1.35 [0.02] 0.00 114 1.58 189 1.29 445 1.40 1.27—1.5320 Miners and quarry workers 3 1.27 21 1.44 [0.03] 0.00 29 1.56 45 1.28 98 1.39 1.13—1.6921 Seamen 28 1.58 23 1.25 [0.62] 0.00 92 1.06 42 1.42 185 1.21 1.05—1.4022 Transport workers 34 0.82 44 0.76 [1.44] 0.00 35 0.74 91 0.95 204 0.84 0.73—0.9623 Drivers 199 1.54 156 0.91 2 1.06 127 1.00 262 1.14 746 1.13 1.05—1.2224 Postal workers 22 0.86 9 0.34 [0.27] 0.00 19 0.73 32 0.61 82 0.63 0.50—0.7825 Textile workers 12 0.50 15 0.78 [0.50] 0.00 22 0.75 48 0.74 97 0.70 0.57—0.8626 Shoe and leather workers 2 0.34 3 0.35 [0.11] 0.00 10 0.76 17 0.62 32 0.58 0.39—0.8227 Smelting workers 44 0.87 29 1.02 1 1.54 40 1.03 81 0.81 195 0.89 0.78—1.0328 Mechanics 113 0.81 94 0.57 [1.67] 0.00 118 0.68 376 0.90 701 0.78 0.73—0.8429 Plumbers 9 0.73 20 0.73 [0.30] 0.00 13 0.67 38 0.79 80 0.74 0.59—0.9230 Welders – – 12 0.53 [0.10] 0.00 26 1.27 47 0.93 85 0.91 0.72—1.1231 Electrical workers 19 0.59 50 0.75 1 1.05 70 0.93 132 0.97 272 0.87 0.77—0.9832 Wood workers 100 1.01 216 1.06 2 1.83 248 1.15 321 1.02 887 1.06 0.99—1.1333 Painters 18 0.57 30 0.73 [0.41] 0.00 24 0.65 45 0.51 117 0.59 0.49—0.7134 "Other construction workers" 255 2.05 162 1.21 3 1.49 58 1.39 248 1.46 726 1.54 1.43—1.6535 Bricklayers 42 1.18 18 0.84 – – 26 1.19 31 0.75 117 0.98 0.81—1.1736 Printers 5 0.23 7 0.44 [0.31] 0.00 6 0.29 18 0.41 36 0.35 0.25—0.4937 Chemical process workers 24 1.14 29 1.00 1 4.70 62 1.22 86 1.12 202 1.14 0.99—1.3138 Food workers 64 0.95 20 0.94 3 1.60 46 0.82 57 0.77 190 0.86 0.75—0.9939 Beverage workers 10 1.28 [1.51] 0.00 [0.03] 0.00 [0.39] 0.00 6 1.33 16 1.12 0.64—1.8240 Tobacco workers 2 1.45 1 4.23 [0.00] 0.00 1 1.08 [0.31] 0.00 4 1.40 0.38—3.5941 Glass makers etc 52 1.30 28 0.92 [0.32] 0.00 21 0.82 106 1.32 207 1.17 1.02—1.3442 Packers 42 1.18 81 1.20 [1.08] 0.00 71 0.83 161 1.05 355 1.03 0.93—1.1543 Engine operators 55 1.54 88 1.08 [1.22] 0.00 42 0.99 131 1.14 316 1.15 1.03—1.2844 Public safety workers 20 0.58 30 0.61 2 2.13 25 0.72 46 0.72 123 0.67 0.56—0.8045 Cooks and stewards 2 0.82 [2.53] 0.00 [0.39] 0.00 15 1.05 9 0.82 26 0.85 0.56—1.2546 Domestic assistants [0.03] 0.00 [0.22] 0.00 [0.00] 0.00 [0.10] 0.00 [0.68] 0.00 [1.02] 0.00 0.00—3.6147 Waiters [4.95] 0.00 1 0.43 [0.03] 0.00 3 0.46 3 0.53 7 0.36 0.14—0.7448 Building caretakers 33 0.92 34 0.75 1 2.02 15 0.82 71 1.21 154 0.97 0.83—1.1449 Chimney sweeps 1 1.14 6 1.78 – – [1.84] 0.00 4 1.07 11 1.12 0.56—2.0050 Hairdressers 3 0.29 [0.92] 0.00 [0.05] 0.00 3 0.56 7 0.47 13 0.41 0.22—0.7051 Launderers 2 0.39 1 1.11 [0.05] 0.00 3 0.93 4 0.38 10 0.50 0.24—0.9352 Military personnel 4 0.24 8 0.61 – – 19 0.76 35 0.95 66 0.72 0.55—0.9153 "Other workers" 132 1.25 53 0.98 3 0.76 238 1.42 251 1.34 677 1.31 1.21—1.4154 Economically inactive 169 1.68 444 1.28 6 2.24 87 0.95 261 0.94 967 1.18 1.11—1.26
1-54 All categories 2645 1.00 3231 1.00 45 1.00 2996 1.00 5560 1.00 14477 1.00 # REF. #
Obs = observed number of cases; SIR = standardised incidence ratio; 95% CI = 95% confidence interval
2 Index Prev Next

Acta Oncologica - Pukkala et al, 2008 Lip cancer
Observed number of lip cancer among women in the Nordic countries and standardised incidence ratios 1961-2005, by country andoccupational category
Denmark Finland Iceland Norway Sweden Total
No Occupational category Obs SIR Obs SIR Obs SIR Obs SIR Obs SIR Obs SIR 95% CI
1 Technical workers, etc [1.17] 0.00 4 1.33 [0.02] 0.00 1 1.63 6 1.08 11 1.06 0.53—1.902 Laboratory assistants [0.82] 0.00 1 0.54 [0.03] 0.00 [0.77] 0.00 1 0.64 2 0.40 0.05—1.443 Physicians [0.41] 0.00 1 1.49 [0.00] 0.00 [0.31] 0.00 1 0.79 2 0.75 0.09—2.724 Dentists [0.35] 0.00 [1.17] 0.00 [0.00] 0.00 [0.26] 0.00 1 1.00 1 0.36 0.01—2.005 Nurses 6 0.83 12 1.28 [0.13] 0.00 5 0.83 21 1.24 44 1.11 0.81—1.496 Assistant nurses 12 2.44 11 0.96 [0.18] 0.00 7 1.17 34 1.17 64 1.24 0.95—1.587 "Other health workers" 2 0.48 7 0.82 [0.04] 0.00 8 1.35 18 1.82 35 1.23 0.86—1.718 Teachers 15 1.68 14 0.70 [0.22] 0.00 7 0.62 36 0.95 72 0.92 0.72—1.169 Religious workers etc 1 0.83 5 0.77 [0.03] 0.00 3 1.05 8 0.64 17 0.74 0.43—1.1810 Artistic workers 1 1.53 [1.41] 0.00 [0.03] 0.00 [0.86] 0.00 2 0.83 3 0.56 0.12—1.6411 Journalists [0.13] 0.00 1 1.01 [0.01] 0.00 [0.23] 0.00 2 1.79 3 1.22 0.25—3.5512 Administrators 2 0.53 5 1.58 1 38.52 1 0.35 6 1.08 15 0.97 0.54—1.6013 Clerical workers 34 0.97 46 0.76 [0.68] 0.00 24 0.68 108 1.17 212 0.94 0.83—1.0814 Sales agents 2 5.96 9 0.81 [0.08] 0.00 6 1.14 12 0.89 29 0.96 0.64—1.3815 Shop workers 20 0.81 31 0.80 [0.48] 0.00 36 1.19 59 1.02 146 0.96 0.81—1.1316 Farmers 7 0.39 40 1.25 [0.40] 0.00 21 0.96 [5.37] 0.00 68 0.88 0.68—1.1217 Gardeners 2 0.88 102 1.18 [0.01] 0.00 16 1.24 16 1.07 136 1.17 0.99—1.3818 Fishermen [0.09] 0.00 [0.17] 0.00 [0.01] 0.00 1 6.40 [0.05] 0.00 1 2.09 0.05—11.6519 Forestry workers [0.02] 0.00 [0.31] 0.00 [0.00] 0.00 [0.23] 0.00 [0.33] 0.00 [0.90] 0.00 0.00—4.1220 Miners and quarry workers [0.00] 0.00 [0.15] 0.00 [0.00] 0.00 [0.01] 0.00 [0.08] 0.00 [0.24] 0.00 0.00—15.4221 Seamen – – [0.02] 0.00 – – [0.04] 0.00 [0.01] 0.00 [0.07] 0.00 0.00—55.3022 Transport workers [0.02] 0.00 1 0.45 [0.02] 0.00 [0.16] 0.00 3 3.33 4 1.20 0.33—3.0623 Drivers 1 1.67 [0.77] 0.00 [0.01] 0.00 [0.61] 0.00 3 1.36 4 0.95 0.26—2.4424 Postal workers 2 1.55 6 0.49 [0.16] 0.00 12 1.74 16 0.99 36 0.98 0.68—1.3525 Textile workers 5 0.62 29 1.00 [0.34] 0.00 7 0.61 38 1.11 79 0.95 0.76—1.1926 Shoe and leather workers [0.58] 0.00 3 0.85 [0.02] 0.00 [0.80] 0.00 [2.58] 0.00 3 0.40 0.08—1.1727 Smelting workers [0.14] 0.00 [0.85] 0.00 [0.00] 0.00 [0.09] 0.00 [0.68] 0.00 [1.75] 0.00 0.00—2.1028 Mechanics 1 0.74 3 0.90 [0.00] 0.00 [0.96] 0.00 4 0.58 8 0.64 0.28—1.2629 Plumbers [0.02] 0.00 [0.01] 0.00 – – [0.01] 0.00 [0.01] 0.00 [0.04] 0.00 0.00—93.1630 Welders – – [0.21] 0.00 [0.00] 0.00 [0.07] 0.00 [0.26] 0.00 [0.54] 0.00 0.00—6.8631 Electrical workers 1 0.53 2 1.20 [0.00] 0.00 2 1.96 2 0.52 7 0.83 0.34—1.7232 Wood workers [0.64] 0.00 8 1.05 [0.00] 0.00 [0.35] 0.00 2 1.75 10 1.03 0.49—1.8933 Painters [0.02] 0.00 2 2.41 [0.00] 0.00 [0.08] 0.00 [0.31] 0.00 2 1.61 0.20—5.8234 "Other construction workers" [0.02] 0.00 6 1.79 [0.00] 0.00 [0.03] 0.00 [0.04] 0.00 6 1.74 0.64—3.7935 Bricklayers [0.00] 0.00 [0.10] 0.00 – – [0.00] 0.00 [0.00] 0.00 [0.11] 0.00 0.00—34.4136 Printers 1 1.38 3 0.88 [0.03] 0.00 2 2.12 4 1.39 10 1.25 0.60—2.3137 Chemical process workers [1.16] 0.00 4 2.15 [0.01] 0.00 2 2.38 1 0.43 7 1.13 0.45—2.3338 Food workers 4 0.70 9 0.89 1 1.58 10 1.80 8 1.14 32 1.10 0.75—1.5639 Beverage workers [0.51] 0.00 [0.59] 0.00 [0.00] 0.00 [0.05] 0.00 1 2.27 1 0.63 0.02—3.4940 Tobacco workers 2 2.81 [0.34] 0.00 – – [0.19] 0.00 [0.27] 0.00 2 1.33 0.16—4.8041 Glass makers etc [1.35] 0.00 8 1.20 [0.02] 0.00 3 1.67 10 1.63 21 1.31 0.81—2.0142 Packers 1 2.52 16 1.34 [0.07] 0.00 5 1.15 6 0.65 28 1.07 0.71—1.5543 Engine operators [0.01] 0.00 5 2.76 [0.00] 0.00 [0.06] 0.00 1 1.76 6 2.45 0.90—5.3344 Public safety workers [0.04] 0.00 1 2.45 [0.01] 0.00 [0.58] 0.00 1 1.33 2 1.11 0.13—4.0245 Cooks and stewards [0.02] 0.00 13 0.96 [0.26] 0.00 7 1.09 8 0.58 28 0.82 0.55—1.1946 Domestic assistants 18 1.96 16 1.24 [0.08] 0.00 20 1.22 37 1.04 91 1.23 0.99—1.5147 Waiters 2 1.37 2 0.19 [0.02] 0.00 7 1.05 15 1.05 26 0.79 0.52—1.1648 Building caretakers 30 1.14 59 1.22 [0.51] 0.00 21 0.73 45 1.23 155 1.10 0.94—1.2949 Chimney sweeps [0.00] 0.00 [0.02] 0.00 – – [0.00] 0.00 [0.00] 0.00 [0.03] 0.00 0.00—125.5550 Hairdressers 1 0.62 2 0.52 [0.02] 0.00 [1.70] 0.00 6 1.01 9 0.69 0.31—1.3051 Launderers 2 0.67 3 0.72 [0.08] 0.00 3 1.20 5 0.67 13 0.75 0.40—1.2952 Military personnel [0.01] 0.00 [0.02] 0.00 – – [0.01] 0.00 [0.02] 0.00 [0.06] 0.00 0.00—59.7353 "Other workers" 11 1.48 13 0.93 [0.47] 0.00 13 0.88 20 1.23 57 1.08 0.81—1.3954 Economically inactive 208 1.01 365 1.01 5 2.71 204 1.04 718 0.96 1500 0.99 0.94—1.04
1-54 All categories 394 1.00 868 1.00 7 1.00 454 1.00 1285 1.00 3008 1.00 # REF. #
Obs = observed number of cases; SIR = standardised incidence ratio; 95% CI = 95% confidence interval
3 Index Prev Next

Acta Oncologica - Pukkala et al, 2008 Cancer of the tongue
Observed number of cancer of the tongue among men in the Nordic countries and standardised incidence ratios 1961-2005, by countryand occupational category
Denmark Finland Iceland Norway Sweden Total
No Occupational category Obs SIR Obs SIR Obs SIR Obs SIR Obs SIR Obs SIR 95% CI
1 Technical workers, etc 46 0.74 59 0.85 [0.56] 0.00 40 0.76 191 0.87 336 0.83 0.75—0.922 Laboratory assistants 2 1.65 4 2.21 [0.11] 0.00 1 0.42 2 1.30 9 1.28 0.58—2.423 Physicians 3 0.63 4 1.00 [0.20] 0.00 8 1.26 12 1.13 27 1.04 0.68—1.514 Dentists 1 0.65 3 3.72 [0.05] 0.00 3 1.07 9 1.84 16 1.59 0.91—2.575 Nurses [0.08] 0.00 [0.32] 0.00 [0.00] 0.00 [0.44] 0.00 [1.00] 0.00 [1.85] 0.00 0.00—2.006 Assistant nurses 1 0.65 [0.32] 0.00 [0.03] 0.00 [1.01] 0.00 5 1.24 6 0.87 0.32—1.887 "Other health workers" 1 0.24 2 0.55 [0.06] 0.00 4 1.61 8 0.93 15 0.79 0.44—1.318 Teachers 17 0.61 18 0.66 1 1.30 14 0.37 46 0.77 96 0.63 0.51—0.769 Religious workers etc 11 1.10 17 1.02 [0.51] 0.00 15 0.82 44 0.91 87 0.93 0.74—1.1510 Artistic workers 9 2.79 9 1.69 1 7.11 9 1.74 28 2.07 56 2.05 1.55—2.6611 Journalists 1 0.62 7 2.73 [0.08] 0.00 3 1.26 13 2.04 24 1.84 1.18—2.7512 Administrators 71 1.12 40 1.01 2 1.66 72 1.17 93 1.20 278 1.14 1.02—1.2913 Clerical workers 23 0.78 20 0.81 2 1.42 61 1.33 89 1.04 195 1.04 0.90—1.2014 Sales agents 16 1.01 40 1.08 1 1.42 58 1.12 165 1.30 280 1.21 1.07—1.3515 Shop workers 66 1.06 27 1.57 [0.51] 0.00 21 0.96 59 1.45 173 1.21 1.05—1.4116 Farmers 36 0.33 107 0.77 3 1.52 58 0.46 79 0.44 283 0.51 0.45—0.5717 Gardeners 11 0.71 15 0.64 [0.07] 0.00 20 0.62 36 0.51 82 0.58 0.46—0.7118 Fishermen 4 0.65 1 0.52 2 1.44 27 0.65 6 0.80 40 0.68 0.49—0.9319 Forestry workers [2.21] 0.00 26 0.94 [0.01] 0.00 16 0.69 20 0.38 62 0.59 0.45—0.7620 Miners and quarry workers [0.70] 0.00 4 0.87 [0.02] 0.00 7 0.97 12 0.88 23 0.88 0.56—1.3221 Seamen 17 2.33 5 0.79 [0.35] 0.00 72 1.86 14 1.14 108 1.66 1.38—2.0122 Transport workers 9 0.65 15 0.88 [0.65] 0.00 20 1.06 37 0.92 81 0.89 0.71—1.1123 Drivers 50 1.04 74 1.21 1 0.99 77 1.37 115 1.07 317 1.16 1.04—1.2924 Postal workers 7 0.69 11 1.21 [0.12] 0.00 12 1.15 25 1.08 55 1.04 0.78—1.3525 Textile workers 9 1.21 7 1.30 [0.21] 0.00 7 0.68 27 1.18 50 1.08 0.80—1.4326 Shoe and leather workers 2 1.16 1 0.43 [0.04] 0.00 7 1.66 11 1.28 21 1.24 0.77—1.9027 Smelting workers 19 0.98 5 0.58 [0.30] 0.00 13 0.87 41 1.08 78 0.96 0.76—1.2028 Mechanics 59 1.16 56 0.90 [1.00] 0.00 80 1.02 173 0.90 368 0.96 0.86—1.0629 Plumbers 5 1.06 11 1.04 [0.16] 0.00 9 0.96 21 0.95 46 0.98 0.72—1.3130 Welders – – 16 1.42 [0.06] 0.00 11 1.00 31 1.16 58 1.18 0.90—1.5331 Electrical workers 14 1.07 17 0.61 1 1.61 36 1.03 76 1.10 144 0.99 0.84—1.1632 Wood workers 25 0.75 40 0.71 1 1.86 64 0.78 78 0.66 208 0.72 0.63—0.8233 Painters 12 1.06 20 1.57 1 4.76 14 1.01 46 1.31 93 1.27 1.03—1.5634 "Other construction workers" 43 1.13 39 1.06 1 0.86 19 1.08 72 1.12 174 1.10 0.95—1.2835 Bricklayers 17 1.40 8 1.36 – – 15 1.85 15 0.99 55 1.33 1.00—1.7336 Printers 9 1.07 6 0.89 [0.18] 0.00 16 1.72 27 1.32 58 1.28 0.98—1.6637 Chemical process workers 7 1.06 13 1.28 [0.10] 0.00 18 1.00 32 1.12 70 1.10 0.86—1.3938 Food workers 24 1.05 5 0.69 1 1.17 24 1.14 34 1.17 88 1.08 0.87—1.3339 Beverage workers 11 4.03 [0.45] 0.00 [0.01] 0.00 [0.36] 0.00 7 4.34 18 3.49 2.07—5.5140 Tobacco workers 2 5.35 [0.08] 0.00 [0.00] 0.00 [0.31] 0.00 1 7.14 3 3.31 0.68—9.6741 Glass makers etc 10 0.77 12 1.11 [0.16] 0.00 9 0.82 33 1.01 64 0.95 0.73—1.2142 Packers 15 1.38 27 1.30 [0.49] 0.00 49 1.56 82 1.44 173 1.44 1.24—1.6743 Engine operators 13 1.03 33 1.06 1 1.45 21 1.01 42 0.81 110 0.94 0.78—1.1344 Public safety workers 5 0.46 13 0.76 [0.47] 0.00 16 1.16 29 0.92 63 0.86 0.66—1.0945 Cooks and stewards 6 6.02 3 2.27 1 4.22 13 1.90 17 2.74 40 2.56 1.83—3.4946 Domestic assistants [0.01] 0.00 [0.06] 0.00 [0.00] 0.00 [0.07] 0.00 2 2.67 2 2.26 0.27—8.1647 Waiters 11 5.62 4 2.97 [0.03] 0.00 13 4.64 13 4.16 41 4.43 3.18—6.0148 Building caretakers 13 1.17 12 0.90 [0.19] 0.00 9 1.22 23 0.98 57 1.03 0.78—1.3349 Chimney sweeps 1 2.94 [0.99] 0.00 – – 2 2.73 3 1.71 6 1.57 0.58—3.4250 Hairdressers 7 2.24 [0.30] 0.00 [0.03] 0.00 5 2.46 12 2.16 24 2.17 1.39—3.2351 Launderers [1.54] 0.00 1 3.28 [0.02] 0.00 [1.19] 0.00 3 0.76 4 0.57 0.16—1.4652 Military personnel 7 0.99 5 0.77 – – 12 0.96 20 1.11 44 1.00 0.72—1.3453 "Other workers" 76 2.06 28 1.75 1 0.55 46 0.80 66 0.96 217 1.20 1.05—1.3754 Economically inactive 49 1.84 111 1.46 2 1.39 55 1.69 184 1.59 401 1.59 1.44—1.75
1-54 All categories 873 1.00 1001 1.00 23 1.00 1201 1.00 2329 1.00 5427 1.00 # REF. #
Obs = observed number of cases; SIR = standardised incidence ratio; 95% CI = 95% confidence interval
4 Index Prev Next

Acta Oncologica - Pukkala et al, 2008 Cancer of the tongue
Observed number of cancer of the tongue among women in the Nordic countries and standardised incidence ratios 1961-2005, bycountry and occupational category
Denmark Finland Iceland Norway Sweden Total
No Occupational category Obs SIR Obs SIR Obs SIR Obs SIR Obs SIR Obs SIR 95% CI
1 Technical workers, etc 5 3.01 3 0.59 [0.05] 0.00 [0.97] 0.00 3 0.42 11 0.73 0.37—1.312 Laboratory assistants 1 0.81 2 0.72 [0.06] 0.00 1 0.86 1 0.41 5 0.65 0.21—1.523 Physicians [0.55] 0.00 1 0.78 [0.01] 0.00 [0.48] 0.00 2 1.14 3 0.74 0.15—2.154 Dentists [0.49] 0.00 3 2.41 [0.01] 0.00 2 4.91 1 0.79 6 1.76 0.65—3.835 Nurses 9 0.93 9 0.64 [0.35] 0.00 8 0.86 12 0.56 38 0.69 0.49—0.956 Assistant nurses 4 0.56 17 1.24 [0.49] 0.00 7 0.77 30 0.77 58 0.84 0.64—1.087 "Other health workers" 6 1.08 10 0.90 [0.09] 0.00 6 0.66 12 0.91 34 0.87 0.60—1.228 Teachers 13 1.04 33 1.32 1 1.70 18 1.02 58 1.15 123 1.16 0.97—1.389 Religious workers etc 1 0.60 11 0.82 [0.09] 0.00 1 0.23 18 1.04 31 0.84 0.57—1.1910 Artistic workers 4 4.77 3 1.41 [0.07] 0.00 2 1.54 4 1.26 13 1.73 0.92—2.9611 Journalists [0.19] 0.00 1 0.75 [0.02] 0.00 2 5.73 1 0.67 4 1.18 0.32—3.0312 Administrators 4 0.80 3 0.66 [0.06] 0.00 6 1.38 4 0.54 17 0.80 0.46—1.2713 Clerical workers 67 1.34 98 1.19 1 0.52 58 1.08 149 1.27 373 1.22 1.10—1.3514 Sales agents 1 2.25 4 0.34 [0.20] 0.00 9 1.17 17 1.02 31 0.84 0.57—1.2015 Shop workers 34 1.02 48 1.14 2 1.61 42 0.96 78 1.16 204 1.09 0.95—1.2516 Farmers 10 0.42 24 0.94 2 2.19 36 1.19 5 0.71 77 0.88 0.70—1.1017 Gardeners 3 0.99 63 0.87 [0.03] 0.00 14 0.79 15 0.85 95 0.86 0.69—1.0518 Fishermen [0.12] 0.00 1 5.95 [0.03] 0.00 [0.23] 0.00 [0.06] 0.00 1 1.64 0.04—9.1519 Forestry workers [0.03] 0.00 [0.32] 0.00 [0.01] 0.00 1 3.12 [0.40] 0.00 1 0.93 0.02—5.1620 Miners and quarry workers [0.00] 0.00 [0.13] 0.00 [0.00] 0.00 [0.02] 0.00 [0.10] 0.00 [0.25] 0.00 0.00—14.6621 Seamen – – [0.04] 0.00 [0.00] 0.00 [0.05] 0.00 [0.01] 0.00 [0.11] 0.00 0.00—33.4622 Transport workers [0.03] 0.00 [2.00] 0.00 [0.03] 0.00 [0.25] 0.00 [1.11] 0.00 [3.43] 0.00 0.00—1.0823 Drivers 3 3.56 2 1.97 [0.02] 0.00 [0.92] 0.00 2 0.67 7 1.21 0.49—2.4924 Postal workers 2 1.14 12 0.96 [0.44] 0.00 6 0.57 22 1.13 42 0.94 0.68—1.2725 Textile workers 10 0.90 26 0.93 [0.80] 0.00 14 0.86 46 1.20 96 1.01 0.82—1.2426 Shoe and leather workers 1 1.21 2 0.58 [0.04] 0.00 2 1.74 [2.88] 0.00 5 0.60 0.19—1.4027 Smelting workers [0.20] 0.00 2 2.48 [0.00] 0.00 [0.14] 0.00 [0.87] 0.00 2 0.99 0.12—3.5728 Mechanics 1 0.50 [3.74] 0.00 [0.01] 0.00 2 1.42 10 1.16 13 0.82 0.44—1.4129 Plumbers [0.02] 0.00 [0.01] 0.00 – – [0.01] 0.00 [0.02] 0.00 [0.05] 0.00 0.00—68.2230 Welders – – [0.31] 0.00 [0.00] 0.00 [0.11] 0.00 1 2.78 1 1.29 0.03—7.1731 Electrical workers 2 0.71 4 1.57 [0.01] 0.00 1 0.67 1 0.21 8 0.68 0.30—1.3532 Wood workers 1 1.07 10 1.43 [0.01] 0.00 [0.52] 0.00 1 0.67 12 1.21 0.62—2.1133 Painters [0.04] 0.00 1 1.20 [0.00] 0.00 [0.11] 0.00 [0.39] 0.00 1 0.73 0.02—4.0534 "Other construction workers" 1 36.64 3 1.10 [0.00] 0.00 [0.05] 0.00 [0.06] 0.00 4 1.40 0.38—3.5835 Bricklayers [0.01] 0.00 [0.10] 0.00 – – [0.00] 0.00 [0.00] 0.00 [0.11] 0.00 0.00—34.9336 Printers 2 1.91 7 1.93 [0.06] 0.00 [1.41] 0.00 7 1.97 16 1.65 0.94—2.6837 Chemical process workers [1.64] 0.00 [1.82] 0.00 [0.03] 0.00 1 0.82 7 2.53 8 1.07 0.46—2.1138 Food workers 11 1.36 7 0.74 3 1.92 7 0.89 10 1.22 38 1.08 0.77—1.4839 Beverage workers 2 2.66 [0.52] 0.00 [0.00] 0.00 [0.07] 0.00 [0.52] 0.00 2 1.07 0.13—3.8740 Tobacco workers [1.04] 0.00 [0.30] 0.00 – – [0.28] 0.00 [0.32] 0.00 [1.93] 0.00 0.00—1.9141 Glass makers etc [1.99] 0.00 7 1.05 [0.04] 0.00 2 0.76 13 1.77 22 1.18 0.74—1.7842 Packers 2 3.54 13 1.11 1 6.62 7 1.12 12 1.09 35 1.18 0.82—1.6443 Engine operators [0.02] 0.00 1 0.52 [0.00] 0.00 [0.10] 0.00 [0.79] 0.00 1 0.35 0.01—1.9644 Public safety workers [0.06] 0.00 [0.48] 0.00 [0.03] 0.00 [0.80] 0.00 [1.09] 0.00 [2.47] 0.00 0.00—1.5045 Cooks and stewards [0.02] 0.00 12 0.89 [0.58] 0.00 11 1.21 16 0.98 39 0.99 0.70—1.3546 Domestic assistants 9 0.72 16 1.07 [0.17] 0.00 26 1.09 31 0.66 82 0.84 0.66—1.0447 Waiters 5 2.33 15 1.31 [0.07] 0.00 13 1.35 22 1.36 55 1.39 1.05—1.8148 Building caretakers 36 1.00 47 1.03 1 0.82 44 1.06 49 1.08 177 1.04 0.90—1.2149 Chimney sweeps [0.00] 0.00 [0.02] 0.00 – – [0.01] 0.00 [0.00] 0.00 [0.03] 0.00 0.00—115.4150 Hairdressers 4 1.79 4 0.90 [0.06] 0.00 4 1.60 10 1.39 22 1.34 0.84—2.0351 Launderers 1 0.25 1 0.28 [0.21] 0.00 1 0.28 7 0.83 10 0.50 0.24—0.9352 Military personnel [0.02] 0.00 1 19.70 – – [0.01] 0.00 [0.04] 0.00 1 8.19 0.21—45.6153 "Other workers" 13 1.26 21 1.46 2 1.65 18 0.84 17 0.84 71 1.05 0.82—1.3354 Economically inactive 262 0.97 291 0.97 4 1.00 296 1.02 845 0.97 1698 0.98 0.94—1.03
1-54 All categories 530 1.00 839 1.00 17 1.00 668 1.00 1539 1.00 3593 1.00 # REF. #
Obs = observed number of cases; SIR = standardised incidence ratio; 95% CI = 95% confidence interval
5 Index Prev Next

Acta Oncologica - Pukkala et al, 2008 Cancer of the salivary glands
Observed number of cancer of the salivary glands among men in the Nordic countries and standardised incidence ratios 1961-2005, bycountry and occupational category
Denmark Finland Iceland Norway Sweden Total
No Occupational category Obs SIR Obs SIR Obs SIR Obs SIR Obs SIR Obs SIR 95% CI
1 Technical workers, etc 25 0.71 47 1.26 1 2.63 16 0.74 147 1.01 236 0.98 0.86—1.112 Laboratory assistants [0.70] 0.00 1 1.06 [0.07] 0.00 1 0.98 1 1.23 3 0.85 0.17—2.473 Physicians 1 0.34 1 0.46 [0.15] 0.00 8 2.91 8 1.16 18 1.21 0.72—1.914 Dentists 4 4.61 [0.45] 0.00 [0.04] 0.00 1 0.81 2 0.61 7 1.19 0.48—2.455 Nurses [0.04] 0.00 [0.15] 0.00 [0.00] 0.00 [0.15] 0.00 1 1.92 1 1.16 0.03—6.486 Assistant nurses 2 2.37 1 7.02 [0.02] 0.00 [0.46] 0.00 2 0.79 5 1.25 0.41—2.927 "Other health workers" 6 2.42 1 0.49 [0.05] 0.00 2 1.87 5 0.87 14 1.23 0.67—2.068 Teachers 19 1.21 21 1.39 [0.55] 0.00 18 1.15 43 1.12 101 1.18 0.97—1.449 Religious workers etc 5 0.77 12 1.40 [0.38] 0.00 6 0.76 34 1.11 57 1.06 0.80—1.3710 Artistic workers [1.99] 0.00 1 0.34 [0.10] 0.00 3 1.31 13 1.44 17 1.04 0.61—1.6711 Journalists 1 1.06 [1.42] 0.00 [0.06] 0.00 [1.02] 0.00 6 1.41 7 0.91 0.36—1.8712 Administrators 38 0.97 30 1.35 [1.04] 0.00 33 1.21 55 1.00 156 1.08 0.92—1.2613 Clerical workers 32 1.84 15 1.03 1 0.85 17 0.82 65 1.08 130 1.14 0.96—1.3614 Sales agents 3 0.33 17 0.80 1 1.72 26 1.10 107 1.22 154 1.08 0.92—1.2715 Shop workers 52 1.32 14 1.49 1 2.52 15 1.58 23 0.82 105 1.21 1.00—1.4716 Farmers 64 0.84 101 1.08 1 0.58 65 1.02 124 0.87 355 0.94 0.85—1.0417 Gardeners 4 0.37 12 0.84 [0.06] 0.00 14 0.88 56 1.04 86 0.91 0.73—1.1218 Fishermen 5 1.39 2 1.59 1 1.06 17 0.83 9 1.58 34 1.06 0.74—1.4919 Forestry workers 1 0.64 9 0.54 [0.01] 0.00 11 0.94 27 0.69 48 0.69 0.51—0.9220 Miners and quarry workers [0.47] 0.00 4 1.48 [0.01] 0.00 7 2.08 5 0.51 16 0.97 0.56—1.5821 Seamen 2 0.51 6 1.65 1 3.84 17 0.99 4 0.45 30 0.89 0.60—1.2722 Transport workers 5 0.60 13 1.26 [0.55] 0.00 9 1.02 45 1.56 72 1.26 0.99—1.5923 Drivers 27 0.98 30 0.86 2 2.59 22 0.88 73 1.00 154 0.96 0.82—1.1224 Postal workers 7 1.28 8 1.52 [0.10] 0.00 10 2.10 17 1.06 42 1.33 0.96—1.7925 Textile workers 5 1.04 3 0.89 [0.18] 0.00 9 1.78 20 1.16 37 1.21 0.85—1.6726 Shoe and leather workers 2 1.68 [1.47] 0.00 [0.04] 0.00 [2.12] 0.00 6 0.89 8 0.69 0.30—1.3627 Smelting workers 9 0.82 4 0.77 [0.25] 0.00 3 0.43 20 0.72 36 0.71 0.49—0.9828 Mechanics 23 0.78 36 1.03 1 1.37 25 0.72 129 0.98 214 0.92 0.81—1.0629 Plumbers 2 0.76 4 0.68 [0.12] 0.00 3 0.74 11 0.72 20 0.72 0.44—1.1130 Welders – – 3 0.51 [0.04] 0.00 8 1.73 9 0.51 20 0.71 0.44—1.1031 Electrical workers 8 1.13 11 0.73 1 2.28 18 1.16 59 1.28 97 1.15 0.94—1.4132 Wood workers 18 0.89 30 0.86 1 2.32 39 1.01 65 0.75 153 0.85 0.72—0.9933 Painters 4 0.61 10 1.31 [0.17] 0.00 2 0.31 23 0.91 39 0.85 0.60—1.1634 "Other construction workers" 25 0.99 20 0.88 2 2.30 4 0.51 44 0.94 95 0.92 0.74—1.1235 Bricklayers 12 1.64 1 0.27 – – 6 1.56 9 0.81 28 1.08 0.72—1.5636 Printers 4 0.84 3 0.81 [0.13] 0.00 9 2.20 14 1.01 30 1.13 0.76—1.6137 Chemical process workers 4 0.94 6 1.03 [0.08] 0.00 7 0.81 19 0.91 36 0.91 0.64—1.2638 Food workers 14 1.01 2 0.47 [0.70] 0.00 9 0.91 28 1.33 53 1.06 0.80—1.3939 Beverage workers 1 0.60 1 3.77 [0.01] 0.00 [0.12] 0.00 2 1.68 4 1.22 0.33—3.1440 Tobacco workers [0.27] 0.00 [0.05] 0.00 [0.00] 0.00 [0.15] 0.00 [0.10] 0.00 [0.57] 0.00 0.00—6.4941 Glass makers etc 3 0.37 5 0.81 [0.12] 0.00 2 0.41 31 1.34 41 0.97 0.69—1.3142 Packers 10 1.38 8 0.64 [0.41] 0.00 14 0.94 36 0.86 68 0.89 0.69—1.1243 Engine operators 10 1.34 13 0.75 [0.51] 0.00 11 1.24 34 0.95 68 0.97 0.76—1.2344 Public safety workers 11 1.66 4 0.41 1 2.72 6 0.94 23 1.09 45 1.02 0.74—1.3645 Cooks and stewards 1 1.82 [0.69] 0.00 [0.17] 0.00 3 1.02 5 1.26 9 1.08 0.50—2.0646 Domestic assistants [0.01] 0.00 [0.04] 0.00 [0.00] 0.00 [0.03] 0.00 [0.41] 0.00 [0.48] 0.00 0.00—7.6747 Waiters 2 1.77 1 1.49 [0.02] 0.00 2 1.61 4 1.95 9 1.76 0.80—3.3448 Building caretakers 11 1.51 5 0.62 [0.17] 0.00 4 1.21 19 1.15 39 1.10 0.79—1.5149 Chimney sweeps [0.19] 0.00 [0.59] 0.00 – – [0.33] 0.00 1 0.83 1 0.43 0.01—2.4050 Hairdressers 4 1.95 [0.18] 0.00 [0.02] 0.00 [0.96] 0.00 3 0.73 7 0.96 0.39—1.9851 Launderers [1.02] 0.00 [0.18] 0.00 [0.02] 0.00 [0.56] 0.00 2 0.69 2 0.43 0.05—1.5452 Military personnel 3 0.81 4 1.16 – – 6 1.07 11 0.90 24 0.96 0.62—1.4353 "Other workers" 26 1.16 16 1.66 1 0.66 32 1.15 52 1.03 127 1.14 0.95—1.3554 Economically inactive 27 1.20 61 1.18 2 1.95 13 0.84 91 1.13 194 1.13 0.98—1.30
1-54 All categories 542 1.00 597 1.00 18 1.00 553 1.00 1642 1.00 3352 1.00 # REF. #
Obs = observed number of cases; SIR = standardised incidence ratio; 95% CI = 95% confidence interval
6 Index Prev Next

Acta Oncologica - Pukkala et al, 2008 Cancer of the salivary glands
Observed number of cancer of the salivary glands among women in the Nordic countries and standardised incidence ratios 1961-2005,by country and occupational category
Denmark Finland Iceland Norway Sweden Total
No Occupational category Obs SIR Obs SIR Obs SIR Obs SIR Obs SIR Obs SIR 95% CI
1 Technical workers, etc [1.35] 0.00 3 0.82 [0.05] 0.00 1 1.50 9 1.25 13 1.01 0.54—1.722 Laboratory assistants [0.97] 0.00 3 1.53 [0.07] 0.00 2 2.46 1 0.44 6 0.98 0.36—2.143 Physicians [0.46] 0.00 1 1.10 [0.01] 0.00 [0.34] 0.00 2 1.17 3 0.88 0.18—2.564 Dentists [0.40] 0.00 [0.88] 0.00 [0.00] 0.00 1 3.51 2 1.60 3 1.06 0.22—3.115 Nurses 8 1.00 7 0.70 1 3.53 8 1.24 22 1.03 46 1.00 0.73—1.336 Assistant nurses 6 1.05 3 0.31 [0.36] 0.00 8 1.28 32 0.83 49 0.81 0.60—1.077 "Other health workers" 2 0.43 4 0.50 [0.08] 0.00 5 0.79 9 0.69 20 0.63 0.38—0.978 Teachers 7 0.69 15 0.84 [0.52] 0.00 10 0.82 52 1.07 84 0.94 0.75—1.179 Religious workers etc [1.37] 0.00 12 1.26 [0.08] 0.00 5 1.69 11 0.66 28 0.91 0.61—1.3210 Artistic workers [0.71] 0.00 1 0.66 [0.06] 0.00 1 1.11 2 0.64 4 0.63 0.17—1.6211 Journalists [0.15] 0.00 1 1.05 [0.02] 0.00 [0.24] 0.00 1 0.68 2 0.71 0.09—2.5512 Administrators 4 0.95 2 0.62 [0.04] 0.00 2 0.68 8 1.12 16 0.91 0.52—1.4813 Clerical workers 45 1.10 58 0.99 2 1.34 42 1.11 145 1.23 292 1.14 1.02—1.2814 Sales agents [0.38] 0.00 9 1.08 [0.14] 0.00 6 1.14 15 0.90 30 0.98 0.66—1.3915 Shop workers 30 1.07 24 0.81 [0.88] 0.00 28 0.91 68 0.97 150 0.94 0.80—1.1016 Farmers 17 0.86 15 0.83 1 1.78 24 1.20 6 0.89 63 0.97 0.74—1.2417 Gardeners 5 1.96 53 1.03 [0.02] 0.00 15 1.26 22 1.21 95 1.13 0.92—1.3918 Fishermen [0.10] 0.00 1 8.40 [0.03] 0.00 [0.16] 0.00 [0.06] 0.00 1 2.14 0.05—11.9319 Forestry workers [0.03] 0.00 [0.22] 0.00 [0.00] 0.00 [0.22] 0.00 1 2.47 1 1.13 0.03—6.3220 Miners and quarry workers [0.00] 0.00 [0.09] 0.00 – – [0.01] 0.00 [0.10] 0.00 [0.21] 0.00 0.00—17.9721 Seamen – – [0.03] 0.00 [0.00] 0.00 [0.04] 0.00 [0.01] 0.00 [0.08] 0.00 0.00—45.0622 Transport workers [0.03] 0.00 [1.43] 0.00 [0.02] 0.00 [0.17] 0.00 1 0.85 1 0.35 0.01—1.9723 Drivers [0.69] 0.00 1 1.39 [0.01] 0.00 [0.63] 0.00 1 0.34 2 0.40 0.05—1.4524 Postal workers [1.46] 0.00 10 1.13 1 3.55 5 0.68 23 1.15 39 1.03 0.73—1.4125 Textile workers 12 1.30 15 0.75 [0.41] 0.00 9 0.78 31 0.77 67 0.82 0.64—1.0526 Shoe and leather workers [0.68] 0.00 2 0.82 [0.02] 0.00 1 1.21 3 0.97 6 0.85 0.31—1.8527 Smelting workers [0.16] 0.00 2 3.50 [0.00] 0.00 [0.10] 0.00 1 1.14 3 1.75 0.36—5.1228 Mechanics 4 2.47 3 1.13 [0.01] 0.00 1 0.99 5 0.56 13 0.92 0.49—1.5729 Plumbers [0.02] 0.00 [0.01] 0.00 – – [0.01] 0.00 [0.01] 0.00 [0.05] 0.00 0.00—79.9530 Welders – – [0.22] 0.00 [0.00] 0.00 [0.08] 0.00 1 2.83 1 1.54 0.04—8.6031 Electrical workers 1 0.44 [1.82] 0.00 [0.00] 0.00 [1.10] 0.00 1 0.20 2 0.20 0.02—0.7132 Wood workers [0.76] 0.00 5 1.01 [0.01] 0.00 1 2.75 1 0.67 7 0.92 0.37—1.9033 Painters [0.03] 0.00 [0.60] 0.00 [0.00] 0.00 [0.08] 0.00 1 2.52 1 0.91 0.02—5.0534 "Other construction workers" [0.02] 0.00 4 2.04 [0.00] 0.00 [0.03] 0.00 [0.05] 0.00 4 1.93 0.53—4.9435 Bricklayers [0.00] 0.00 [0.07] 0.00 – – [0.00] 0.00 [0.00] 0.00 [0.08] 0.00 0.00—47.7036 Printers [0.85] 0.00 3 1.16 [0.04] 0.00 [1.00] 0.00 4 1.09 7 0.86 0.35—1.7737 Chemical process workers 1 0.74 1 0.78 [0.01] 0.00 1 1.13 1 0.35 4 0.62 0.17—1.5938 Food workers 5 0.75 4 0.60 1 1.02 3 0.54 5 0.59 18 0.63 0.38—1.0039 Beverage workers 2 3.25 [0.37] 0.00 [0.00] 0.00 [0.05] 0.00 2 3.75 4 2.56 0.70—6.5540 Tobacco workers [0.85] 0.00 [0.21] 0.00 – – 1 4.98 [0.33] 0.00 1 0.63 0.02—3.5141 Glass makers etc [1.60] 0.00 4 0.84 [0.03] 0.00 2 1.06 7 0.91 13 0.82 0.43—1.4042 Packers 1 2.15 6 0.72 [0.08] 0.00 5 1.13 9 0.79 21 0.85 0.52—1.3043 Engine operators [0.01] 0.00 1 0.73 [0.00] 0.00 [0.07] 0.00 [0.77] 0.00 1 0.45 0.01—2.5044 Public safety workers [0.05] 0.00 [0.34] 0.00 [0.02] 0.00 [0.53] 0.00 1 0.95 1 0.50 0.01—2.8145 Cooks and stewards [0.02] 0.00 11 1.14 1 3.25 6 0.96 18 1.08 36 1.10 0.77—1.5246 Domestic assistants 18 1.73 6 0.57 [0.08] 0.00 17 1.04 45 0.98 86 1.03 0.82—1.2747 Waiters 1 0.57 9 1.10 [0.04] 0.00 8 1.17 20 1.17 38 1.12 0.79—1.5448 Building caretakers 33 1.10 29 0.90 2 2.97 34 1.19 50 1.10 148 1.08 0.92—1.2749 Chimney sweeps [0.00] 0.00 [0.02] 0.00 – – [0.00] 0.00 [0.00] 0.00 [0.02] 0.00 0.00—153.1850 Hairdressers [1.80] 0.00 4 1.26 [0.05] 0.00 2 1.12 9 1.21 15 1.05 0.59—1.7451 Launderers 6 1.76 [2.51] 0.00 [0.09] 0.00 5 2.01 6 0.68 17 0.98 0.57—1.5752 Military personnel [0.02] 0.00 [0.03] 0.00 – – [0.01] 0.00 [0.03] 0.00 [0.10] 0.00 0.00—38.5253 "Other workers" 5 0.59 12 1.17 1 1.38 13 0.87 18 0.88 49 0.89 0.66—1.1854 Economically inactive 229 1.01 252 1.19 1 0.41 193 0.95 899 1.00 1574 1.02 0.97—1.07
1-54 All categories 442 1.00 596 1.00 11 1.00 465 1.00 1571 1.00 3085 1.00 # REF. #
Obs = observed number of cases; SIR = standardised incidence ratio; 95% CI = 95% confidence interval
7 Index Prev Next

Acta Oncologica - Pukkala et al, 2008 Cancer of the oral cavity
Observed number of cancer of the oral cavity among men in the Nordic countries and standardised incidence ratios 1961-2005, bycountry and occupational category
Denmark Finland Iceland Norway Sweden Total
No Occupational category Obs SIR Obs SIR Obs SIR Obs SIR Obs SIR Obs SIR 95% CI
1 Technical workers, etc 105 0.87 55 0.79 2 2.43 40 0.57 262 0.85 464 0.82 0.74—0.892 Laboratory assistants 6 2.55 1 0.54 [0.15] 0.00 3 0.93 1 0.55 11 1.17 0.58—2.093 Physicians 9 0.95 5 1.22 [0.31] 0.00 4 0.46 14 0.97 32 0.87 0.59—1.224 Dentists 4 1.35 2 2.45 [0.10] 0.00 1 0.26 8 1.16 15 1.02 0.57—1.685 Nurses [0.15] 0.00 [0.32] 0.00 [0.00] 0.00 1 2.09 1 1.04 2 1.05 0.13—3.786 Assistant nurses 3 1.02 [0.32] 0.00 [0.03] 0.00 3 2.10 2 0.39 8 0.81 0.35—1.607 "Other health workers" 4 0.49 3 0.82 [0.08] 0.00 4 1.20 9 0.76 20 0.74 0.45—1.148 Teachers 31 0.58 24 0.87 2 1.74 29 0.58 64 0.78 150 0.70 0.60—0.829 Religious workers etc 18 0.89 12 0.72 [0.70] 0.00 25 1.01 54 0.86 109 0.87 0.72—1.0510 Artistic workers 9 1.40 14 2.59 [0.19] 0.00 7 0.98 30 1.59 60 1.58 1.20—2.0311 Journalists 5 1.60 5 1.93 [0.11] 0.00 3 0.94 15 1.70 28 1.57 1.04—2.2712 Administrators 132 1.04 31 0.77 1 0.57 81 0.95 131 1.15 376 1.02 0.92—1.1313 Clerical workers 52 0.90 27 1.08 5 2.72 52 0.81 139 1.12 275 1.01 0.89—1.1314 Sales agents 42 1.36 33 0.88 1 1.01 89 1.21 235 1.29 400 1.23 1.12—1.3615 Shop workers 141 1.13 20 1.14 [0.67] 0.00 22 0.73 67 1.14 250 1.08 0.95—1.2216 Farmers 92 0.40 89 0.64 1 0.38 134 0.70 153 0.53 469 0.55 0.50—0.6017 Gardeners 20 0.62 16 0.67 [0.08] 0.00 35 0.72 75 0.68 146 0.68 0.58—0.8018 Fishermen 17 1.42 [1.92] 0.00 1 0.51 57 0.92 9 0.78 84 0.94 0.75—1.1619 Forestry workers 1 0.22 22 0.78 [0.02] 0.00 22 0.63 59 0.74 104 0.70 0.58—0.8520 Miners and quarry workers [1.44] 0.00 7 1.50 1 28.93 9 0.86 11 0.54 28 0.76 0.50—1.1021 Seamen 38 2.75 11 1.72 1 2.00 98 1.81 43 2.37 191 2.05 1.78—2.3622 Transport workers 30 1.10 14 0.82 [0.90] 0.00 25 0.91 57 0.96 126 0.95 0.80—1.1323 Drivers 89 0.96 47 0.76 1 0.70 89 1.14 137 0.90 363 0.94 0.85—1.0424 Postal workers 19 0.99 12 1.31 1 7.01 11 0.74 39 1.18 82 1.08 0.86—1.3425 Textile workers 15 1.00 5 0.91 1 4.19 14 0.92 33 0.94 68 0.95 0.74—1.2126 Shoe and leather workers 4 1.12 2 0.85 [0.05] 0.00 7 1.10 18 1.32 31 1.19 0.81—1.7027 Smelting workers 42 1.12 4 0.46 1 2.51 19 0.88 46 0.81 112 0.90 0.74—1.0828 Mechanics 90 0.91 80 1.27 [1.41] 0.00 105 0.96 269 0.98 544 0.99 0.91—1.0829 Plumbers 17 1.87 11 1.02 [0.21] 0.00 19 1.48 26 0.82 73 1.13 0.88—1.4230 Welders – – 18 1.56 [0.09] 0.00 8 0.54 33 0.89 59 0.93 0.71—1.2031 Electrical workers 30 1.21 29 1.03 1 1.15 52 1.07 94 0.97 206 1.04 0.90—1.1932 Wood workers 47 0.71 45 0.79 2 2.76 100 0.84 125 0.71 319 0.76 0.68—0.8533 Painters 35 1.58 22 1.69 1 3.21 34 1.69 68 1.31 160 1.49 1.28—1.7434 "Other construction workers" 93 1.20 47 1.26 1 0.64 35 1.42 113 1.18 289 1.22 1.09—1.3735 Bricklayers 36 1.50 9 1.52 – – 14 1.18 28 1.22 87 1.34 1.07—1.6536 Printers 20 1.23 6 0.87 [0.28] 0.00 17 1.33 41 1.41 84 1.29 1.03—1.5937 Chemical process workers 14 1.05 9 0.87 [0.13] 0.00 27 1.02 35 0.82 85 0.91 0.73—1.1338 Food workers 39 0.86 11 1.49 2 2.12 35 1.15 48 1.10 135 1.06 0.89—1.2539 Beverage workers 11 2.05 1 2.25 [0.01] 0.00 1 2.30 3 1.23 16 1.84 1.05—2.9840 Tobacco workers 1 1.26 [0.09] 0.00 [0.00] 0.00 1 2.19 [0.20] 0.00 2 1.30 0.16—4.7041 Glass makers etc 23 0.89 11 1.01 [0.19] 0.00 25 1.62 46 0.96 105 1.05 0.86—1.2742 Packers 31 1.40 27 1.29 [0.57] 0.00 61 1.34 74 0.87 193 1.11 0.96—1.2743 Engine operators 18 0.73 28 0.88 [0.96] 0.00 31 1.10 73 0.98 150 0.94 0.80—1.1044 Public safety workers 26 1.17 13 0.75 [0.63] 0.00 22 1.12 43 0.98 104 1.00 0.83—1.2245 Cooks and stewards 7 3.67 3 2.30 1 2.97 30 3.22 23 2.81 64 3.04 2.34—3.8846 Domestic assistants [0.02] 0.00 [0.05] 0.00 [0.00] 0.00 [0.08] 0.00 [0.76] 0.00 [0.92] 0.00 0.00—4.0247 Waiters 30 7.98 4 3.01 [0.04] 0.00 9 2.31 24 5.65 67 5.05 3.91—6.4148 Building caretakers 30 1.33 16 1.19 [0.22] 0.00 14 1.35 33 0.99 93 1.16 0.94—1.4249 Chimney sweeps 2 3.07 1 1.00 – – 1 0.96 6 2.40 10 1.93 0.92—3.5450 Hairdressers 4 0.62 1 3.29 [0.05] 0.00 6 2.06 16 1.90 27 1.49 0.98—2.1651 Launderers 2 0.64 1 3.26 [0.02] 0.00 2 1.15 4 0.66 9 0.80 0.37—1.5252 Military personnel 12 0.90 5 0.76 – – 17 0.97 34 1.33 68 1.08 0.84—1.3753 "Other workers" 112 1.55 22 1.36 2 0.81 91 1.08 112 1.08 339 1.22 1.09—1.3554 Economically inactive 82 1.42 130 1.72 2 1.20 71 1.55 312 1.90 597 1.73 1.60—1.87
1-54 All categories 1740 1.00 1011 1.00 31 1.00 1712 1.00 3395 1.00 7889 1.00 # REF. #
Obs = observed number of cases; SIR = standardised incidence ratio; 95% CI = 95% confidence interval
8 Index Prev Next

Acta Oncologica - Pukkala et al, 2008 Cancer of the oral cavity
Observed number of cancer of the oral cavity among women in the Nordic countries and standardised incidence ratios 1961-2005, bycountry and occupational category
Denmark Finland Iceland Norway Sweden Total
No Occupational category Obs SIR Obs SIR Obs SIR Obs SIR Obs SIR Obs SIR 95% CI
1 Technical workers, etc 5 1.32 5 1.04 [0.08] 0.00 [1.43] 0.00 8 0.81 18 0.90 0.53—1.432 Laboratory assistants 2 0.72 3 1.14 [0.12] 0.00 2 1.10 2 0.74 9 0.90 0.41—1.713 Physicians [1.26] 0.00 1 0.86 [0.03] 0.00 1 1.34 3 1.33 5 0.92 0.30—2.144 Dentists [1.12] 0.00 2 1.57 [0.01] 0.00 1 1.54 2 1.12 5 1.04 0.34—2.425 Nurses 20 0.90 19 1.44 [0.67] 0.00 11 0.76 22 0.73 72 0.89 0.70—1.136 Assistant nurses 16 1.00 13 0.97 [1.00] 0.00 15 1.05 46 0.88 90 0.93 0.75—1.147 "Other health workers" 8 0.63 9 0.84 [0.18] 0.00 12 0.83 15 0.86 44 0.79 0.58—1.068 Teachers 26 0.92 28 1.15 1 0.89 17 0.62 58 0.85 130 0.87 0.73—1.039 Religious workers etc 4 1.05 11 0.90 [0.18] 0.00 5 0.74 20 0.90 40 0.89 0.63—1.2110 Artistic workers 2 1.02 1 0.50 [0.15] 0.00 3 1.45 11 2.56 17 1.62 0.95—2.6011 Journalists 1 2.40 4 3.15 [0.03] 0.00 4 7.35 3 1.50 12 2.82 1.46—4.9212 Administrators 11 0.95 4 0.92 [0.14] 0.00 9 1.31 7 0.71 31 0.95 0.64—1.3413 Clerical workers 133 1.17 78 0.99 3 0.82 80 0.92 186 1.12 480 1.07 0.98—1.1714 Sales agents 2 1.95 16 1.35 [0.45] 0.00 20 1.58 27 1.12 65 1.30 1.00—1.6615 Shop workers 64 0.83 34 0.82 3 1.16 61 0.83 101 0.98 263 0.88 0.78—1.0016 Farmers 27 0.50 24 0.86 1 0.47 43 0.84 13 1.34 108 0.74 0.62—0.9017 Gardeners 4 0.57 57 0.76 [0.07] 0.00 29 0.95 32 1.18 122 0.87 0.73—1.0418 Fishermen [0.28] 0.00 1 6.01 [0.06] 0.00 [0.38] 0.00 1 11.21 2 2.07 0.25—7.4819 Forestry workers [0.07] 0.00 1 3.01 [0.01] 0.00 [0.56] 0.00 [0.58] 0.00 1 0.64 0.02—3.5920 Miners and quarry workers [0.00] 0.00 [0.14] 0.00 [0.00] 0.00 [0.03] 0.00 [0.14] 0.00 [0.31] 0.00 0.00—11.8821 Seamen – – [0.04] 0.00 [0.00] 0.00 [0.09] 0.00 [0.02] 0.00 [0.15] 0.00 0.00—25.3422 Transport workers 1 12.98 2 1.00 [0.08] 0.00 [0.39] 0.00 2 1.23 5 1.20 0.39—2.8123 Drivers 1 0.52 1 1.03 [0.03] 0.00 4 2.72 7 1.76 13 1.55 0.83—2.6524 Postal workers 5 1.24 12 0.96 2 2.20 13 0.76 24 0.82 56 0.88 0.66—1.1425 Textile workers 26 1.02 35 1.22 4 2.07 23 0.83 62 1.02 150 1.04 0.88—1.2226 Shoe and leather workers 1 0.53 [3.48] 0.00 [0.10] 0.00 [1.96] 0.00 3 0.65 4 0.33 0.09—0.8527 Smelting workers 1 2.19 [0.81] 0.00 [0.00] 0.00 1 4.60 2 1.63 4 1.48 0.40—3.7828 Mechanics 5 1.10 8 2.17 [0.01] 0.00 2 0.85 20 1.62 35 1.53 1.06—2.1229 Plumbers [0.05] 0.00 [0.01] 0.00 – – [0.02] 0.00 [0.02] 0.00 [0.09] 0.00 0.00—41.6030 Welders – – 1 3.43 [0.00] 0.00 [0.17] 0.00 [0.46] 0.00 1 1.09 0.03—6.0631 Electrical workers 8 1.26 1 0.41 [0.02] 0.00 2 0.80 6 0.87 17 0.93 0.54—1.4932 Wood workers 1 0.47 5 0.70 [0.03] 0.00 [0.85] 0.00 3 1.46 9 0.74 0.34—1.4133 Painters [0.08] 0.00 1 1.19 [0.01] 0.00 [0.19] 0.00 [0.56] 0.00 1 0.60 0.02—3.3234 "Other construction workers" [0.06] 0.00 2 0.70 [0.00] 0.00 [0.08] 0.00 [0.07] 0.00 2 0.65 0.08—2.3435 Bricklayers [0.01] 0.00 [0.10] 0.00 – – [0.00] 0.00 [0.00] 0.00 [0.12] 0.00 0.00—30.5736 Printers 2 0.84 6 1.66 [0.14] 0.00 1 0.43 8 1.53 17 1.24 0.72—1.9937 Chemical process workers 2 0.53 [1.84] 0.00 [0.07] 0.00 1 0.49 3 0.72 6 0.51 0.19—1.1038 Food workers 26 1.41 6 0.62 4 1.13 12 0.90 16 1.27 64 1.11 0.86—1.4239 Beverage workers 4 2.34 [0.54] 0.00 [0.01] 0.00 [0.11] 0.00 [0.80] 0.00 4 1.26 0.34—3.2240 Tobacco workers 7 2.94 [0.31] 0.00 – – [0.46] 0.00 [0.49] 0.00 7 1.92 0.77—3.9641 Glass makers etc 3 0.67 8 1.18 [0.09] 0.00 10 2.27 12 1.08 33 1.23 0.85—1.7342 Packers 2 1.55 11 0.92 1 2.69 14 1.32 26 1.56 54 1.32 0.99—1.7243 Engine operators [0.04] 0.00 3 1.57 [0.00] 0.00 [0.14] 0.00 [1.02] 0.00 3 0.96 0.20—2.8144 Public safety workers [0.14] 0.00 1 2.10 1 13.55 [1.35] 0.00 2 1.47 4 1.18 0.32—3.0245 Cooks and stewards [0.05] 0.00 11 0.80 [1.45] 0.00 17 1.11 38 1.53 66 1.19 0.92—1.5146 Domestic assistants 25 0.87 14 0.93 [0.45] 0.00 33 0.83 56 0.86 128 0.86 0.72—1.0247 Waiters 13 2.68 22 1.94 1 6.84 31 1.92 46 1.82 113 1.96 1.63—2.3548 Building caretakers 96 1.16 62 1.33 3 1.05 75 1.08 61 0.92 297 1.11 0.99—1.2449 Chimney sweeps [0.01] 0.00 [0.02] 0.00 – – [0.01] 0.00 [0.00] 0.00 [0.04] 0.00 0.00—89.9250 Hairdressers 3 0.59 4 0.92 [0.11] 0.00 4 0.97 11 1.04 22 0.91 0.57—1.3851 Launderers 9 0.96 1 0.27 2 3.96 10 1.66 28 2.10 50 1.52 1.13—2.0052 Military personnel [0.05] 0.00 [0.04] 0.00 – – [0.02] 0.00 [0.04] 0.00 [0.15] 0.00 0.00—24.7353 "Other workers" 38 1.61 19 1.31 5 1.84 37 1.04 27 0.92 126 1.19 1.00—1.4254 Economically inactive 626 0.99 316 0.98 7 0.72 495 1.04 1310 0.96 2754 0.98 0.95—1.02
1-54 All categories 1230 1.00 863 1.00 38 1.00 1098 1.00 2330 1.00 5559 1.00 # REF. #
Obs = observed number of cases; SIR = standardised incidence ratio; 95% CI = 95% confidence interval
9 Index Prev Next

Acta Oncologica - Pukkala et al, 2008 Cancer of the pharynx
Observed number of cancer of the pharynx among men in the Nordic countries and standardised incidence ratios 1961-2005, by countryand occupational category
Denmark Finland Iceland Norway Sweden Total
No Occupational category Obs SIR Obs SIR Obs SIR Obs SIR Obs SIR Obs SIR 95% CI
1 Technical workers, etc 118 0.81 73 0.86 1 0.99 48 0.55 361 0.78 601 0.77 0.71—0.832 Laboratory assistants 2 0.71 1 0.44 [0.18] 0.00 4 1.02 4 1.24 11 0.89 0.44—1.593 Physicians 7 0.62 2 0.41 [0.34] 0.00 10 0.96 15 0.67 34 0.69 0.48—0.964 Dentists 4 1.11 [1.00] 0.00 [0.10] 0.00 1 0.21 6 0.58 11 0.56 0.28—0.995 Nurses [0.19] 0.00 [0.38] 0.00 [0.00] 0.00 1 1.50 [2.13] 0.00 1 0.30 0.01—1.656 Assistant nurses [3.60] 0.00 1 2.64 [0.04] 0.00 1 0.60 8 0.93 10 0.70 0.34—1.297 "Other health workers" 9 0.92 6 1.32 [0.09] 0.00 6 1.49 15 0.82 36 0.98 0.69—1.368 Teachers 48 0.74 19 0.57 3 2.30 25 0.40 80 0.63 175 0.61 0.52—0.709 Religious workers etc 22 0.92 29 1.41 1 1.18 19 0.64 93 0.91 164 0.93 0.80—1.0810 Artistic workers 19 2.47 14 2.11 1 4.50 20 2.34 62 2.17 116 2.24 1.87—2.6911 Journalists 9 2.39 8 2.50 [0.13] 0.00 5 1.29 20 1.47 42 1.71 1.23—2.3112 Administrators 160 1.07 51 1.03 4 2.19 104 1.04 179 1.09 498 1.07 0.98—1.1713 Clerical workers 81 1.16 32 1.03 3 1.46 58 0.76 205 1.12 379 1.04 0.94—1.1514 Sales agents 35 0.94 48 1.03 1 0.93 100 1.17 339 1.25 523 1.18 1.09—1.2915 Shop workers 168 1.14 24 1.14 1 1.32 35 0.96 113 1.31 341 1.17 1.05—1.3016 Farmers 64 0.25 107 0.58 1 0.36 91 0.44 172 0.43 435 0.41 0.38—0.4517 Gardeners 15 0.40 24 0.81 [0.09] 0.00 29 0.54 93 0.60 161 0.59 0.50—0.6818 Fishermen 19 1.31 2 0.79 3 1.28 57 0.82 12 0.74 93 0.88 0.71—1.0819 Forestry workers 1 0.19 21 0.59 [0.02] 0.00 14 0.36 48 0.42 84 0.44 0.35—0.5420 Miners and quarry workers 4 2.36 7 1.20 [0.03] 0.00 14 1.16 10 0.34 35 0.71 0.50—0.9921 Seamen 32 1.87 14 1.76 2 3.71 140 2.16 53 2.00 241 2.06 1.82—2.3422 Transport workers 20 0.62 17 0.78 [0.97] 0.00 30 0.95 85 0.99 152 0.88 0.75—1.0323 Drivers 137 1.22 74 0.97 3 1.87 111 1.19 265 1.16 590 1.15 1.06—1.2524 Postal workers 20 0.86 9 0.79 [0.17] 0.00 21 1.20 54 1.09 104 1.02 0.84—1.2425 Textile workers 16 0.90 6 0.87 [0.27] 0.00 10 0.59 38 0.77 70 0.77 0.60—0.9726 Shoe and leather workers 2 0.48 4 1.34 [0.05] 0.00 6 0.85 29 1.53 41 1.23 0.89—1.6727 Smelting workers 60 1.31 7 0.64 [0.44] 0.00 30 1.20 65 0.80 162 0.99 0.85—1.1528 Mechanics 137 1.14 71 0.91 1 0.62 137 1.05 393 0.96 739 1.00 0.93—1.0729 Plumbers 10 0.89 7 0.53 [0.25] 0.00 17 1.09 38 0.81 72 0.82 0.64—1.0430 Welders – – 14 1.00 [0.10] 0.00 22 1.20 57 1.01 93 1.05 0.85—1.2831 Electrical workers 37 1.20 36 1.04 [1.01] 0.00 45 0.77 124 0.84 242 0.89 0.78—1.0132 Wood workers 59 0.75 63 0.86 1 1.27 117 0.86 210 0.83 450 0.83 0.76—0.9133 Painters 37 1.38 31 1.91 [0.31] 0.00 31 1.34 77 1.02 176 1.24 1.07—1.4434 "Other construction workers" 81 0.89 72 1.50 1 0.55 42 1.43 150 1.08 346 1.12 1.01—1.2435 Bricklayers 38 1.31 11 1.44 – – 20 1.47 46 1.41 115 1.39 1.16—1.6736 Printers 31 1.55 6 0.72 [0.30] 0.00 13 0.84 64 1.46 114 1.30 1.08—1.5637 Chemical process workers 20 1.26 12 0.94 [0.14] 0.00 28 0.92 57 0.92 117 0.97 0.81—1.1638 Food workers 59 1.08 11 1.21 [1.15] 0.00 49 1.39 64 1.02 183 1.13 0.97—1.3039 Beverage workers 23 3.52 [0.57] 0.00 [0.02] 0.00 2 3.35 7 1.98 32 2.84 1.94—4.0140 Tobacco workers 1 1.08 [0.10] 0.00 [0.00] 0.00 [0.52] 0.00 [0.30] 0.00 1 0.54 0.01—3.0141 Glass makers etc 27 0.88 12 0.88 1 4.43 24 1.31 70 1.00 134 1.01 0.85—1.1942 Packers 39 1.49 34 1.28 [0.64] 0.00 85 1.61 166 1.34 324 1.41 1.26—1.5743 Engine operators 30 1.01 30 0.77 1 0.92 30 0.87 106 0.95 197 0.91 0.79—1.0544 Public safety workers 17 0.65 10 0.47 1 1.38 17 0.75 53 0.79 98 0.71 0.58—0.8645 Cooks and stewards 17 7.14 6 3.75 [0.38] 0.00 27 2.38 26 1.97 76 2.63 2.07—3.2946 Domestic assistants [0.03] 0.00 [0.06] 0.00 [0.00] 0.00 [0.11] 0.00 3 1.89 3 1.68 0.35—4.9047 Waiters 35 7.46 7 4.24 [0.04] 0.00 32 6.91 36 5.40 110 6.22 5.16—7.5048 Building caretakers 33 1.24 19 1.10 [0.24] 0.00 12 0.98 51 1.01 115 1.07 0.89—1.2949 Chimney sweeps 2 2.49 3 2.34 – – 4 3.29 8 2.12 17 2.41 1.40—3.8550 Hairdressers 5 0.66 [0.39] 0.00 [0.06] 0.00 10 2.97 25 2.10 40 1.72 1.23—2.3451 Launderers [3.64] 0.00 [0.38] 0.00 [0.02] 0.00 3 1.51 13 1.52 16 1.10 0.63—1.7852 Military personnel 15 0.93 5 0.64 – – 18 0.86 31 0.82 69 0.83 0.65—1.0553 "Other workers" 149 1.70 30 1.44 3 1.13 108 1.14 191 1.28 481 1.35 1.24—1.4854 Economically inactive 99 1.42 191 1.77 2 0.94 110 2.01 509 2.00 911 1.86 1.74—1.99
1-54 All categories 2073 1.00 1281 1.00 35 1.00 1993 1.00 4999 1.00 10381 1.00 # REF. #
Obs = observed number of cases; SIR = standardised incidence ratio; 95% CI = 95% confidence interval
10 Index Prev Next

Acta Oncologica - Pukkala et al, 2008 Cancer of the pharynx
Observed number of cancer of the pharynx among women in the Nordic countries and standardised incidence ratios 1961-2005, bycountry and occupational category
Denmark Finland Iceland Norway Sweden Total
No Occupational category Obs SIR Obs SIR Obs SIR Obs SIR Obs SIR Obs SIR 95% CI
1 Technical workers, etc 3 1.06 2 0.61 [0.05] 0.00 1 0.99 2 0.22 8 0.49 0.21—0.972 Laboratory assistants 3 1.33 1 0.58 [0.07] 0.00 [1.22] 0.00 [3.18] 0.00 4 0.47 0.13—1.213 Physicians 3 3.27 [0.80] 0.00 [0.01] 0.00 [0.50] 0.00 1 0.45 4 0.89 0.24—2.294 Dentists 2 2.47 2 2.55 [0.01] 0.00 [0.41] 0.00 2 1.28 6 1.68 0.62—3.655 Nurses 16 1.00 3 0.34 1 2.92 8 0.83 20 0.74 48 0.78 0.57—1.036 Assistant nurses 16 1.29 2 0.24 1 2.36 5 0.53 53 1.08 77 0.97 0.76—1.217 "Other health workers" 4 0.44 3 0.44 [0.10] 0.00 4 0.42 17 1.02 28 0.66 0.44—0.968 Teachers 13 0.61 10 0.64 [0.60] 0.00 10 0.55 43 0.69 76 0.64 0.51—0.809 Religious workers etc 4 1.44 10 1.15 [0.09] 0.00 3 0.68 17 0.77 34 0.89 0.62—1.2510 Artistic workers 1 0.77 2 1.49 [0.08] 0.00 5 3.79 7 1.74 15 1.86 1.04—3.0711 Journalists 1 3.14 1 1.20 [0.02] 0.00 2 5.51 3 1.59 7 2.04 0.82—4.2112 Administrators 14 1.78 5 1.69 [0.06] 0.00 2 0.46 10 1.08 31 1.27 0.86—1.8013 Clerical workers 99 1.15 65 1.24 1 0.56 62 1.09 177 1.21 404 1.17 1.07—1.2914 Sales agents 2 2.77 7 0.93 [0.21] 0.00 8 1.05 27 1.29 44 1.19 0.86—1.6015 Shop workers 56 1.04 22 0.84 1 0.85 34 0.75 75 0.90 188 0.90 0.78—1.0316 Farmers 13 0.34 26 1.50 1 1.19 25 0.88 7 0.78 72 0.77 0.60—0.9717 Gardeners 5 1.02 31 0.67 [0.03] 0.00 8 0.47 22 1.01 66 0.74 0.57—0.9418 Fishermen [0.20] 0.00 [0.11] 0.00 [0.03] 0.00 [0.24] 0.00 [0.08] 0.00 [0.65] 0.00 0.00—5.6519 Forestry workers [0.05] 0.00 [0.20] 0.00 [0.00] 0.00 [0.33] 0.00 [0.49] 0.00 [1.08] 0.00 0.00—3.4120 Miners and quarry workers [0.00] 0.00 [0.09] 0.00 [0.00] 0.00 [0.02] 0.00 [0.12] 0.00 [0.23] 0.00 0.00—15.9021 Seamen – – [0.03] 0.00 – – [0.06] 0.00 [0.02] 0.00 [0.10] 0.00 0.00—36.8022 Transport workers [0.05] 0.00 [1.25] 0.00 [0.03] 0.00 [0.26] 0.00 3 2.07 3 0.98 0.20—2.8823 Drivers 3 2.09 [0.64] 0.00 [0.02] 0.00 [0.94] 0.00 4 1.07 7 1.03 0.41—2.1324 Postal workers 2 0.70 8 1.02 1 2.43 9 0.82 25 1.02 45 0.97 0.71—1.2925 Textile workers 24 1.30 19 1.06 [0.64] 0.00 13 0.78 31 0.65 87 0.86 0.69—1.0626 Shoe and leather workers 3 2.15 6 2.75 [0.04] 0.00 [1.20] 0.00 2 0.55 11 1.31 0.65—2.3427 Smelting workers 1 2.90 [0.51] 0.00 [0.00] 0.00 1 6.77 1 0.92 3 1.44 0.30—4.2028 Mechanics 4 1.11 2 0.83 [0.01] 0.00 1 0.66 15 1.38 22 1.19 0.75—1.8129 Plumbers [0.02] 0.00 [0.01] 0.00 – – [0.01] 0.00 [0.02] 0.00 [0.06] 0.00 0.00—61.7030 Welders – – 1 4.98 [0.00] 0.00 [0.12] 0.00 [0.46] 0.00 1 1.28 0.03—7.1431 Electrical workers 10 1.98 1 0.61 [0.01] 0.00 3 1.81 6 0.99 20 1.38 0.85—2.1432 Wood workers 2 1.24 3 0.68 [0.01] 0.00 [0.55] 0.00 3 1.60 8 0.94 0.41—1.8633 Painters [0.06] 0.00 [0.53] 0.00 [0.00] 0.00 [0.12] 0.00 [0.49] 0.00 [1.21] 0.00 0.00—3.0534 "Other construction workers" [0.04] 0.00 1 0.57 [0.00] 0.00 [0.05] 0.00 [0.07] 0.00 1 0.52 0.01—2.8935 Bricklayers [0.01] 0.00 [0.06] 0.00 – – [0.00] 0.00 [0.00] 0.00 [0.07] 0.00 0.00—51.4336 Printers 1 0.56 2 0.87 [0.05] 0.00 1 0.68 3 0.66 7 0.69 0.28—1.4237 Chemical process workers [2.75] 0.00 [1.17] 0.00 [0.02] 0.00 2 1.54 8 2.31 10 1.15 0.55—2.1138 Food workers 17 1.25 3 0.51 2 1.47 11 1.37 13 1.28 46 1.18 0.86—1.5739 Beverage workers 3 2.39 [0.33] 0.00 [0.00] 0.00 [0.07] 0.00 1 1.54 4 1.73 0.47—4.4340 Tobacco workers 7 3.97 [0.18] 0.00 – – 1 3.39 [0.40] 0.00 8 3.03 1.31—5.9741 Glass makers etc 5 1.43 2 0.47 [0.04] 0.00 4 1.43 13 1.41 24 1.21 0.78—1.8142 Packers 4 4.15 5 0.68 [0.13] 0.00 7 1.07 20 1.45 36 1.25 0.88—1.7343 Engine operators [0.04] 0.00 5 4.06 [0.00] 0.00 [0.10] 0.00 1 1.01 6 2.54 0.93—5.5444 Public safety workers [0.09] 0.00 [0.31] 0.00 [0.02] 0.00 1 1.35 [1.43] 0.00 1 0.39 0.01—2.1545 Cooks and stewards [0.03] 0.00 10 1.14 [0.47] 0.00 16 1.79 15 0.74 41 1.06 0.76—1.4446 Domestic assistants 14 0.68 7 0.70 [0.13] 0.00 16 0.67 66 1.10 103 0.90 0.74—1.0947 Waiters 10 2.73 13 1.79 [0.05] 0.00 10 1.00 31 1.55 64 1.56 1.20—2.0048 Building caretakers 70 1.20 37 1.24 [0.99] 0.00 51 1.20 60 1.06 218 1.16 1.01—1.3249 Chimney sweeps [0.00] 0.00 [0.01] 0.00 – – [0.01] 0.00 [0.00] 0.00 [0.02] 0.00 0.00—150.3350 Hairdressers 5 1.33 7 2.43 [0.05] 0.00 3 1.14 10 1.11 25 1.37 0.88—2.0251 Launderers 4 0.62 1 0.44 1 6.87 4 1.10 12 1.15 22 0.96 0.60—1.4552 Military personnel [0.03] 0.00 [0.03] 0.00 – – [0.01] 0.00 [0.05] 0.00 [0.13] 0.00 0.00—28.2653 "Other workers" 23 1.36 14 1.52 2 1.94 20 0.91 29 1.15 88 1.18 0.95—1.4654 Economically inactive 374 0.92 209 1.03 4 1.18 324 1.12 1079 0.99 1990 1.00 0.95—1.04
1-54 All categories 841 1.00 548 1.00 15 1.00 675 1.00 1934 1.00 4013 1.00 # REF. #
Obs = observed number of cases; SIR = standardised incidence ratio; 95% CI = 95% confidence interval
11 Index Prev Next

Acta Oncologica - Pukkala et al, 2008 Cancer of the oropharynx
Observed number of cancer of the oropharynx among men in the Nordic countries and standardised incidence ratios 1961-2005, bycountry and occupational category
Denmark Finland Iceland Norway Sweden Total
No Occupational category Obs SIR Obs SIR Obs SIR Obs SIR Obs SIR Obs SIR 95% CI
1 Technical workers, etc 60 0.73 34 0.90 1 3.45 26 0.67 148 0.75 269 0.75 0.67—0.852 Laboratory assistants 2 1.26 1 0.97 [0.06] 0.00 2 1.24 2 1.12 7 1.15 0.46—2.373 Physicians 5 0.79 [2.20] 0.00 [0.10] 0.00 6 1.37 6 0.59 17 0.73 0.43—1.174 Dentists 4 1.95 [0.44] 0.00 [0.03] 0.00 [1.92] 0.00 2 0.45 6 0.68 0.25—1.485 Nurses [0.11] 0.00 [0.20] 0.00 [0.00] 0.00 1 2.77 [1.31] 0.00 1 0.50 0.01—2.806 Assistant nurses [2.05] 0.00 [0.21] 0.00 [0.01] 0.00 [0.63] 0.00 2 0.49 2 0.29 0.03—1.047 "Other health workers" 7 1.28 3 1.55 [0.03] 0.00 4 2.41 6 0.76 20 1.18 0.72—1.828 Teachers 27 0.73 9 0.64 [0.39] 0.00 8 0.29 38 0.67 82 0.60 0.48—0.759 Religious workers etc 12 0.91 9 0.95 [0.26] 0.00 8 0.64 39 0.82 68 0.82 0.64—1.0410 Artistic workers 10 2.34 8 2.81 1 15.11 9 2.61 40 3.26 68 2.97 2.31—3.7611 Journalists 6 2.85 5 3.71 [0.04] 0.00 2 1.23 10 1.70 23 2.09 1.33—3.1412 Administrators 104 1.25 21 1.02 1 1.99 46 1.14 55 0.86 227 1.09 0.96—1.2413 Clerical workers 45 1.15 17 1.36 1 1.68 18 0.60 90 1.23 171 1.10 0.95—1.2814 Sales agents 20 0.95 17 0.89 [0.30] 0.00 45 1.37 163 1.48 245 1.34 1.18—1.5215 Shop workers 95 1.16 8 0.87 1 4.60 14 0.93 52 1.48 170 1.20 1.04—1.4016 Farmers 27 0.19 31 0.50 [0.79] 0.00 20 0.29 41 0.32 119 0.30 0.25—0.3517 Gardeners 6 0.29 8 0.70 [0.03] 0.00 6 0.33 32 0.60 52 0.50 0.37—0.6618 Fishermen 9 1.11 1 1.10 1 1.51 16 0.66 4 0.72 31 0.79 0.54—1.1219 Forestry workers 1 0.35 3 0.22 [0.01] 0.00 5 0.39 15 0.38 24 0.35 0.22—0.5220 Miners and quarry workers [0.92] 0.00 2 0.88 [0.01] 0.00 7 1.57 2 0.18 11 0.59 0.30—1.0621 Seamen 21 2.17 7 2.16 1 6.62 60 2.36 23 2.25 112 2.30 1.91—2.7722 Transport workers 11 0.61 7 0.85 [0.26] 0.00 13 1.11 34 1.04 65 0.92 0.71—1.1723 Drivers 79 1.26 26 0.84 [0.45] 0.00 44 1.20 114 1.21 263 1.17 1.03—1.3224 Postal workers 3 0.23 4 0.85 [0.05] 0.00 10 1.49 23 1.14 40 0.89 0.64—1.2225 Textile workers 8 0.82 6 2.30 [0.08] 0.00 3 0.51 13 0.76 30 0.85 0.57—1.2126 Shoe and leather workers 2 0.89 [1.12] 0.00 [0.02] 0.00 1 0.43 9 1.51 12 1.03 0.53—1.8027 Smelting workers 37 1.44 3 0.70 [0.13] 0.00 6 0.65 21 0.71 67 0.97 0.75—1.2328 Mechanics 86 1.28 35 1.06 [0.44] 0.00 51 0.98 155 0.92 327 1.02 0.92—1.1429 Plumbers 7 1.11 4 0.72 [0.07] 0.00 9 1.41 9 0.47 29 0.77 0.52—1.1130 Welders – – 6 0.94 [0.03] 0.00 11 1.41 27 1.10 44 1.14 0.83—1.5331 Electrical workers 20 1.15 15 0.99 [0.30] 0.00 22 0.94 56 0.89 113 0.95 0.79—1.1432 Wood workers 35 0.80 19 0.69 1 4.48 42 0.85 59 0.63 156 0.73 0.62—0.8533 Painters 21 1.41 10 1.57 [0.09] 0.00 12 1.43 29 1.02 72 1.24 0.97—1.5634 "Other construction workers" 44 0.89 29 1.61 1 1.95 16 1.40 53 1.05 143 1.10 0.93—1.2935 Bricklayers 13 0.81 4 1.41 – – 7 1.43 16 1.36 40 1.13 0.80—1.5336 Printers 14 1.24 1 0.27 [0.09] 0.00 2 0.32 24 1.33 41 1.04 0.75—1.4137 Chemical process workers 11 1.27 5 0.96 [0.04] 0.00 13 1.21 15 0.67 44 0.94 0.68—1.2638 Food workers 31 1.03 6 1.63 [0.33] 0.00 17 1.33 23 0.99 77 1.10 0.86—1.3739 Beverage workers 14 3.94 [0.22] 0.00 [0.01] 0.00 1 3.30 1 0.80 16 3.00 1.72—4.8840 Tobacco workers [0.49] 0.00 [0.04] 0.00 [0.00] 0.00 [0.18] 0.00 [0.12] 0.00 [0.83] 0.00 0.00—4.4441 Glass makers etc 15 0.89 5 0.89 [0.06] 0.00 9 1.25 21 0.79 50 0.89 0.66—1.1742 Packers 23 1.62 15 1.44 [0.19] 0.00 32 1.69 56 1.25 126 1.43 1.20—1.7043 Engine operators 12 0.73 16 0.98 [0.30] 0.00 12 0.83 45 0.99 85 0.91 0.73—1.1344 Public safety workers 11 0.75 4 0.46 [0.20] 0.00 5 0.58 22 0.77 42 0.69 0.50—0.9445 Cooks and stewards 9 6.74 4 5.29 [0.11] 0.00 9 1.92 12 2.00 34 2.64 1.83—3.6946 Domestic assistants [0.02] 0.00 [0.03] 0.00 [0.00] 0.00 [0.05] 0.00 1 1.10 1 1.00 0.03—5.5747 Waiters 18 7.03 4 4.97 [0.01] 0.00 12 6.64 17 5.79 51 6.28 4.68—8.2648 Building caretakers 18 1.24 6 0.90 [0.07] 0.00 5 1.04 17 0.86 46 1.00 0.74—1.3449 Chimney sweeps 1 2.22 1 2.04 – – 1 2.20 4 2.59 7 2.38 0.96—4.9150 Hairdressers 2 0.48 [0.16] 0.00 [0.01] 0.00 3 2.47 11 2.56 16 1.63 0.93—2.6451 Launderers [1.99] 0.00 [0.15] 0.00 [0.01] 0.00 [0.71] 0.00 7 2.27 7 1.18 0.47—2.4252 Military personnel 9 0.97 3 0.86 – – 6 0.71 19 1.19 37 0.99 0.70—1.3753 "Other workers" 82 1.70 11 1.36 [0.75] 0.00 37 1.11 68 1.28 198 1.38 1.20—1.5854 Economically inactive 51 1.45 73 1.87 1 1.57 46 2.20 205 2.04 376 1.92 1.73—2.12
1-54 All categories 1148 1.00 506 1.00 10 1.00 760 1.00 1956 1.00 4380 1.00 # REF. #
Obs = observed number of cases; SIR = standardised incidence ratio; 95% CI = 95% confidence interval
12 Index Prev Next

Acta Oncologica - Pukkala et al, 2008 Cancer of the oropharynx
Observed number of cancer of the oropharynx among women in the Nordic countries and standardised incidence ratios 1961-2005, bycountry and occupational category
Denmark Finland Iceland Norway Sweden Total
No Occupational category Obs SIR Obs SIR Obs SIR Obs SIR Obs SIR Obs SIR 95% CI
1 Technical workers, etc 3 1.83 [1.53] 0.00 [0.02] 0.00 1 1.82 1 0.20 5 0.57 0.18—1.322 Laboratory assistants 3 2.28 1 1.29 [0.03] 0.00 [0.62] 0.00 [2.22] 0.00 4 0.81 0.22—2.063 Physicians 2 3.74 [0.38] 0.00 [0.01] 0.00 [0.24] 0.00 1 0.73 3 1.18 0.24—3.464 Dentists 2 4.25 2 6.56 [0.00] 0.00 [0.19] 0.00 1 1.22 5 2.80 0.91—6.525 Nurses 9 0.97 2 0.50 1 6.33 5 1.00 14 0.98 31 0.95 0.64—1.356 Assistant nurses 6 0.83 1 0.30 1 5.13 4 0.80 34 1.24 46 1.07 0.78—1.427 "Other health workers" [5.27] 0.00 1 0.35 [0.05] 0.00 [4.65] 0.00 11 1.14 12 0.53 0.28—0.938 Teachers 9 0.72 6 0.93 [0.30] 0.00 7 0.77 26 0.78 48 0.78 0.57—1.039 Religious workers etc 3 1.85 5 1.15 [0.04] 0.00 2 0.89 12 0.91 22 1.03 0.64—1.5610 Artistic workers 1 1.34 1 1.64 [0.03] 0.00 3 4.80 4 1.81 9 2.13 0.98—4.0511 Journalists 1 5.46 [0.36] 0.00 [0.01] 0.00 [0.18] 0.00 2 1.88 3 1.66 0.34—4.8612 Administrators 7 1.55 1 0.75 [0.02] 0.00 2 0.98 5 1.01 15 1.17 0.65—1.9213 Clerical workers 63 1.26 29 1.27 [0.80] 0.00 34 1.24 100 1.28 226 1.26 1.11—1.4414 Sales agents 1 2.38 2 0.71 [0.09] 0.00 3 0.98 17 1.84 23 1.47 0.93—2.2115 Shop workers 30 0.96 6 0.61 1 1.95 16 0.77 41 1.13 94 0.95 0.77—1.1616 Farmers 4 0.18 7 1.31 1 2.66 10 0.83 4 1.07 26 0.59 0.39—0.8717 Gardeners 2 0.70 3 0.21 [0.01] 0.00 [7.33] 0.00 4 0.45 9 0.27 0.12—0.5118 Fishermen [0.12] 0.00 [0.04] 0.00 [0.01] 0.00 [0.11] 0.00 [0.03] 0.00 [0.32] 0.00 0.00—11.5719 Forestry workers [0.03] 0.00 [0.08] 0.00 [0.00] 0.00 [0.15] 0.00 [0.23] 0.00 [0.50] 0.00 0.00—7.4020 Miners and quarry workers [0.00] 0.00 [0.03] 0.00 [0.00] 0.00 [0.01] 0.00 [0.06] 0.00 [0.11] 0.00 0.00—35.1021 Seamen – – [0.01] 0.00 – – [0.03] 0.00 [0.01] 0.00 [0.05] 0.00 0.00—72.4422 Transport workers [0.03] 0.00 [0.41] 0.00 [0.01] 0.00 [0.13] 0.00 1 1.33 1 0.75 0.02—4.1823 Drivers [0.83] 0.00 [0.28] 0.00 [0.01] 0.00 [0.46] 0.00 [2.07] 0.00 [3.65] 0.00 0.00—1.0124 Postal workers 1 0.61 5 1.76 [0.17] 0.00 5 1.00 14 1.19 25 1.17 0.75—1.7225 Textile workers 15 1.41 7 1.10 [0.30] 0.00 3 0.46 18 1.02 43 1.03 0.75—1.3926 Shoe and leather workers 3 3.72 1 1.28 [0.02] 0.00 [0.48] 0.00 [1.38] 0.00 4 1.16 0.32—2.9627 Smelting workers [0.20] 0.00 [0.18] 0.00 [0.00] 0.00 1 12.61 [0.59] 0.00 1 0.96 0.02—5.3428 Mechanics 3 1.43 2 2.11 [0.00] 0.00 [0.68] 0.00 8 1.45 13 1.40 0.75—2.4029 Plumbers [0.01] 0.00 [0.00] 0.00 – – [0.01] 0.00 [0.01] 0.00 [0.04] 0.00 0.00—104.5430 Welders – – 1 10.90 [0.00] 0.00 [0.07] 0.00 [0.28] 0.00 1 2.26 0.06—12.5931 Electrical workers 6 2.05 1 1.37 [0.00] 0.00 1 1.31 4 1.26 12 1.58 0.82—2.7632 Wood workers 1 1.07 [1.47] 0.00 [0.00] 0.00 [0.28] 0.00 2 1.97 3 0.81 0.17—2.3733 Painters [0.04] 0.00 [0.18] 0.00 [0.00] 0.00 [0.06] 0.00 [0.25] 0.00 [0.53] 0.00 0.00—7.0034 "Other construction workers" [0.03] 0.00 [0.52] 0.00 [0.00] 0.00 [0.02] 0.00 [0.05] 0.00 [0.61] 0.00 0.00—6.0135 Bricklayers [0.01] 0.00 [0.02] 0.00 – – [0.00] 0.00 [0.00] 0.00 [0.03] 0.00 0.00—128.1836 Printers 1 0.97 1 1.16 [0.03] 0.00 [0.64] 0.00 3 1.40 5 1.06 0.35—2.4837 Chemical process workers [1.58] 0.00 [0.42] 0.00 [0.01] 0.00 1 1.80 4 2.59 5 1.22 0.40—2.8438 Food workers 9 1.14 2 0.99 [0.63] 0.00 3 0.89 5 1.25 19 1.06 0.64—1.6639 Beverage workers 1 1.40 [0.11] 0.00 [0.00] 0.00 [0.04] 0.00 [0.24] 0.00 1 0.91 0.02—5.0940 Tobacco workers 1 0.99 [0.06] 0.00 – – [0.11] 0.00 [0.19] 0.00 1 0.73 0.02—4.0741 Glass makers etc 2 0.99 2 1.31 [0.02] 0.00 2 1.63 4 0.94 10 1.11 0.53—2.0442 Packers 4 7.17 2 0.76 [0.06] 0.00 4 1.39 11 1.82 21 1.73 1.07—2.6443 Engine operators [0.02] 0.00 2 4.26 [0.00] 0.00 [0.05] 0.00 [0.60] 0.00 2 1.75 0.21—6.3144 Public safety workers [0.05] 0.00 [0.13] 0.00 [0.01] 0.00 1 2.95 [0.89] 0.00 1 0.70 0.02—3.9245 Cooks and stewards [0.02] 0.00 4 1.26 [0.23] 0.00 5 1.41 5 0.67 14 0.97 0.53—1.6246 Domestic assistants 6 0.51 3 0.73 [0.06] 0.00 7 0.71 28 0.99 44 0.81 0.59—1.0947 Waiters 7 3.33 9 3.21 [0.02] 0.00 4 0.91 15 1.88 35 2.02 1.41—2.8148 Building caretakers 49 1.45 12 1.15 [0.47] 0.00 25 1.29 27 1.11 113 1.28 1.06—1.5449 Chimney sweeps [0.00] 0.00 [0.00] 0.00 – – [0.00] 0.00 [0.00] 0.00 [0.01] 0.00 0.00—366.8150 Hairdressers 2 0.92 5 4.34 [0.03] 0.00 1 0.86 7 1.56 15 1.66 0.93—2.7451 Launderers 1 0.27 [0.72] 0.00 [0.07] 0.00 [1.46] 0.00 5 1.35 6 0.62 0.23—1.3452 Military personnel [0.02] 0.00 [0.02] 0.00 – – [0.01] 0.00 [0.04] 0.00 [0.08] 0.00 0.00—44.8153 "Other workers" 19 1.96 6 1.76 2 4.26 7 0.70 10 0.87 44 1.25 0.91—1.6854 Economically inactive 208 0.89 62 0.98 1 0.60 120 1.17 364 0.89 755 0.93 0.87—1.00
1-54 All categories 485 1.00 194 1.00 7 1.00 277 1.00 812 1.00 1775 1.00 # REF. #
Obs = observed number of cases; SIR = standardised incidence ratio; 95% CI = 95% confidence interval
13 Index Prev Next

Acta Oncologica - Pukkala et al, 2008 Cancer of the nasopharynx
Observed number of cancer of the nasopharynx among men in the Nordic countries and standardised incidence ratios 1961-2005, bycountry and occupational category
Denmark Finland Iceland Norway Sweden Total
No Occupational category Obs SIR Obs SIR Obs SIR Obs SIR Obs SIR Obs SIR 95% CI
1 Technical workers, etc 21 1.01 21 1.23 [0.31] 0.00 5 0.37 83 0.92 130 0.92 0.77—1.092 Laboratory assistants [0.41] 0.00 [0.45] 0.00 [0.05] 0.00 [0.66] 0.00 2 3.88 2 0.96 0.12—3.463 Physicians [1.63] 0.00 1 1.02 [0.09] 0.00 3 1.73 2 0.47 6 0.69 0.25—1.504 Dentists [0.50] 0.00 [0.20] 0.00 [0.03] 0.00 [0.79] 0.00 1 0.50 1 0.28 0.01—1.585 Nurses [0.03] 0.00 [0.08] 0.00 [0.00] 0.00 [0.09] 0.00 [0.40] 0.00 [0.59] 0.00 0.00—6.206 Assistant nurses [0.50] 0.00 1 13.18 [0.02] 0.00 1 3.37 3 1.74 5 1.91 0.62—4.467 "Other health workers" [1.45] 0.00 2 2.14 [0.02] 0.00 1 1.46 4 1.09 7 1.03 0.42—2.138 Teachers 5 0.55 4 0.60 2 5.53 10 1.02 15 0.64 36 0.73 0.51—1.019 Religious workers etc 1 0.28 2 0.49 1 4.04 3 0.61 18 0.92 25 0.77 0.50—1.1410 Artistic workers 1 0.87 1 0.74 [0.06] 0.00 2 1.37 4 0.71 8 0.83 0.36—1.6311 Journalists 1 1.81 1 1.53 [0.04] 0.00 [0.64] 0.00 1 0.37 3 0.65 0.13—1.9112 Administrators 15 0.68 18 1.79 [0.49] 0.00 12 0.69 36 1.05 81 0.96 0.76—1.1913 Clerical workers 15 1.48 4 0.63 [0.57] 0.00 12 0.91 30 0.80 61 0.90 0.69—1.1614 Sales agents 5 0.93 17 1.79 1 3.45 9 0.59 51 0.92 83 0.97 0.77—1.2015 Shop workers 27 1.21 7 1.63 [0.22] 0.00 6 0.98 20 1.15 60 1.19 0.91—1.5416 Farmers 26 0.65 22 0.58 [0.72] 0.00 37 0.91 80 0.89 165 0.79 0.68—0.9217 Gardeners 4 0.69 10 1.64 [0.03] 0.00 5 0.49 37 1.10 56 1.00 0.76—1.3118 Fishermen 5 2.32 1 1.94 [0.73] 0.00 22 1.64 1 0.28 29 1.42 0.95—2.0419 Forestry workers [0.84] 0.00 9 1.22 [0.00] 0.00 4 0.53 15 0.61 28 0.69 0.46—1.0020 Miners and quarry workers 1 3.69 4 3.27 [0.01] 0.00 4 1.79 3 0.47 12 1.19 0.62—2.0821 Seamen 3 1.22 3 1.84 [0.16] 0.00 18 1.58 7 1.26 31 1.46 0.99—2.0722 Transport workers 3 0.62 4 0.87 [0.26] 0.00 7 1.25 18 1.01 32 0.96 0.66—1.3623 Drivers 23 1.38 18 1.14 2 4.46 16 0.97 54 1.17 113 1.19 0.99—1.4224 Postal workers 4 1.22 3 1.27 [0.05] 0.00 4 1.29 14 1.36 25 1.31 0.85—1.9425 Textile workers 1 0.36 [1.41] 0.00 [0.07] 0.00 [3.26] 0.00 8 0.74 9 0.49 0.22—0.9326 Shoe and leather workers [0.66] 0.00 [0.61] 0.00 [0.02] 0.00 2 1.42 7 1.61 9 1.27 0.58—2.4227 Smelting workers 6 0.89 [2.27] 0.00 [0.12] 0.00 1 0.22 21 1.19 28 0.89 0.59—1.2928 Mechanics 15 0.85 10 0.63 1 2.05 27 1.19 82 0.99 135 0.97 0.82—1.1529 Plumbers 1 0.61 [2.70] 0.00 [0.07] 0.00 2 0.75 11 1.15 14 0.84 0.46—1.4130 Welders – – 2 0.71 [0.03] 0.00 5 1.65 12 1.10 19 1.13 0.68—1.7731 Electrical workers 4 0.92 6 0.85 [0.31] 0.00 10 1.00 27 0.94 47 0.93 0.68—1.2432 Wood workers 4 0.34 15 0.98 [0.23] 0.00 26 1.04 70 1.28 115 1.08 0.90—1.2933 Painters 5 1.25 4 1.19 [0.09] 0.00 3 0.69 15 0.94 27 0.97 0.64—1.4134 "Other construction workers" 11 0.76 10 0.99 [0.55] 0.00 5 0.96 29 0.97 55 0.91 0.69—1.1935 Bricklayers 11 2.53 3 1.86 – – 6 2.36 8 1.13 28 1.80 1.20—2.6036 Printers 4 1.39 1 0.60 [0.09] 0.00 3 1.11 15 1.72 23 1.43 0.91—2.1537 Chemical process workers 2 0.81 4 1.53 [0.04] 0.00 5 0.87 14 1.04 25 1.03 0.67—1.5238 Food workers 9 1.09 3 1.61 [0.33] 0.00 8 1.22 17 1.28 37 1.22 0.86—1.6939 Beverage workers 1 0.97 [0.12] 0.00 [0.00] 0.00 [0.08] 0.00 [0.78] 0.00 1 0.50 0.01—2.7740 Tobacco workers [0.15] 0.00 [0.02] 0.00 [0.00] 0.00 [0.10] 0.00 [0.06] 0.00 [0.34] 0.00 0.00—10.9741 Glass makers etc 6 1.26 4 1.43 [0.07] 0.00 10 3.06 13 0.89 33 1.29 0.89—1.8142 Packers 8 1.92 6 1.09 [0.18] 0.00 8 0.80 26 0.96 48 1.02 0.76—1.3643 Engine operators 11 2.50 10 1.26 [0.33] 0.00 4 0.68 24 1.07 49 1.20 0.88—1.5844 Public safety workers 3 0.75 4 0.92 [0.20] 0.00 6 1.46 11 0.83 24 0.93 0.59—1.3845 Cooks and stewards [0.35] 0.00 1 2.99 [0.12] 0.00 4 2.05 7 2.68 12 2.24 1.16—3.9146 Domestic assistants [0.00] 0.00 [0.01] 0.00 [0.00] 0.00 [0.02] 0.00 [0.32] 0.00 [0.35] 0.00 0.00—10.4647 Waiters 5 6.81 [0.33] 0.00 [0.01] 0.00 4 4.79 3 2.25 12 3.69 1.91—6.4548 Building caretakers 2 0.48 7 1.96 [0.06] 0.00 1 0.46 13 1.19 23 1.10 0.70—1.6549 Chimney sweeps [0.12] 0.00 1 3.71 – – [0.22] 0.00 2 2.63 3 2.19 0.45—6.4050 Hairdressers 2 1.69 [0.08] 0.00 [0.02] 0.00 [0.64] 0.00 6 2.33 8 1.78 0.77—3.5151 Launderers [0.57] 0.00 [0.08] 0.00 [0.01] 0.00 2 5.34 2 1.09 4 1.39 0.38—3.5752 Military personnel [2.21] 0.00 1 0.63 – – 2 0.57 4 0.53 7 0.47 0.19—0.9753 "Other workers" 22 1.62 1 0.23 3 4.14 25 1.37 35 1.08 86 1.24 0.99—1.5354 Economically inactive 19 1.52 17 0.78 [0.64] 0.00 8 0.80 56 1.03 100 1.00 0.83—1.22
1-54 All categories 312 1.00 263 1.00 10 1.00 358 1.00 1037 1.00 1980 1.00 # REF. #
Obs = observed number of cases; SIR = standardised incidence ratio; 95% CI = 95% confidence interval
14 Index Prev Next

Acta Oncologica - Pukkala et al, 2008 Cancer of the nasopharynx
Observed number of cancer of the nasopharynx among women in the Nordic countries and standardised incidence ratios 1961-2005,by country and occupational category
Denmark Finland Iceland Norway Sweden Total
No Occupational category Obs SIR Obs SIR Obs SIR Obs SIR Obs SIR Obs SIR 95% CI
1 Technical workers, etc [0.45] 0.00 2 2.35 [0.02] 0.00 [0.17] 0.00 1 0.54 3 0.90 0.18—2.622 Laboratory assistants [0.34] 0.00 [0.45] 0.00 [0.04] 0.00 [0.21] 0.00 [0.50] 0.00 [1.54] 0.00 0.00—2.403 Physicians [0.14] 0.00 [0.22] 0.00 [0.01] 0.00 [0.09] 0.00 [0.41] 0.00 [0.87] 0.00 0.00—4.224 Dentists [0.13] 0.00 [0.21] 0.00 [0.00] 0.00 [0.08] 0.00 1 2.97 1 1.32 0.03—7.375 Nurses 6 2.39 1 0.44 [0.18] 0.00 3 1.84 6 1.06 16 1.30 0.74—2.116 Assistant nurses 5 2.59 [2.27] 0.00 [0.23] 0.00 [1.56] 0.00 11 1.12 16 1.01 0.58—1.647 "Other health workers" [1.44] 0.00 [1.85] 0.00 [0.05] 0.00 2 1.19 2 0.61 4 0.48 0.13—1.238 Teachers 3 0.92 4 0.97 [0.31] 0.00 1 0.31 8 0.61 16 0.67 0.38—1.089 Religious workers etc [0.44] 0.00 3 1.35 [0.04] 0.00 [0.78] 0.00 2 0.47 5 0.64 0.21—1.5010 Artistic workers [0.21] 0.00 1 2.85 [0.05] 0.00 1 4.09 1 1.20 3 1.78 0.37—5.2111 Journalists [0.05] 0.00 1 4.59 [0.01] 0.00 [0.06] 0.00 [0.38] 0.00 1 1.38 0.03—7.6812 Administrators 1 0.78 1 1.31 [0.04] 0.00 [0.83] 0.00 [1.96] 0.00 2 0.41 0.05—1.4813 Clerical workers 14 1.04 15 1.11 1 1.01 8 0.78 34 1.10 72 1.04 0.82—1.3114 Sales agents 1 8.65 3 1.48 [0.11] 0.00 3 1.88 3 0.58 10 1.11 0.53—2.0415 Shop workers 8 0.92 9 1.30 [0.66] 0.00 6 0.72 22 1.09 45 1.00 0.73—1.3416 Farmers 7 1.15 6 1.29 [0.46] 0.00 5 0.89 2 0.87 20 1.05 0.64—1.6117 Gardeners 2 2.52 11 0.88 [0.01] 0.00 4 1.22 6 1.09 23 1.04 0.66—1.5718 Fishermen [0.03] 0.00 [0.03] 0.00 [0.02] 0.00 [0.04] 0.00 [0.02] 0.00 [0.14] 0.00 0.00—26.8219 Forestry workers [0.01] 0.00 [0.05] 0.00 [0.00] 0.00 [0.06] 0.00 [0.11] 0.00 [0.23] 0.00 0.00—15.7120 Miners and quarry workers [0.00] 0.00 [0.02] 0.00 [0.00] 0.00 [0.00] 0.00 [0.03] 0.00 [0.05] 0.00 0.00—70.0721 Seamen – – [0.01] 0.00 – – [0.01] 0.00 [0.00] 0.00 [0.02] 0.00 0.00—180.5222 Transport workers [0.01] 0.00 [0.33] 0.00 [0.02] 0.00 [0.05] 0.00 1 3.13 1 1.38 0.03—7.6623 Drivers 2 8.68 [0.17] 0.00 [0.01] 0.00 [0.17] 0.00 [0.76] 0.00 2 1.49 0.18—5.4024 Postal workers 1 2.16 3 1.42 1 4.11 1 0.49 6 1.08 12 1.15 0.60—2.0125 Textile workers 2 0.67 4 0.84 [0.34] 0.00 4 1.16 9 0.70 19 0.78 0.47—1.2226 Shoe and leather workers [0.23] 0.00 1 1.72 [0.02] 0.00 [0.24] 0.00 1 1.05 2 0.99 0.12—3.5727 Smelting workers [0.06] 0.00 [0.14] 0.00 [0.00] 0.00 [0.02] 0.00 1 4.46 1 2.26 0.06—12.6128 Mechanics 1 1.75 [0.63] 0.00 [0.01] 0.00 [0.28] 0.00 4 1.67 5 1.29 0.42—3.0029 Plumbers [0.00] 0.00 [0.00] 0.00 – – [0.00] 0.00 [0.00] 0.00 [0.01] 0.00 0.00—358.5030 Welders – – [0.05] 0.00 [0.00] 0.00 [0.02] 0.00 [0.08] 0.00 [0.15] 0.00 0.00—24.2931 Electrical workers 1 1.25 [0.42] 0.00 [0.00] 0.00 1 3.29 1 0.76 3 1.06 0.22—3.0932 Wood workers [0.26] 0.00 1 0.84 [0.01] 0.00 [0.10] 0.00 1 2.57 2 1.03 0.12—3.7233 Painters [0.01] 0.00 [0.15] 0.00 [0.00] 0.00 [0.02] 0.00 [0.11] 0.00 [0.29] 0.00 0.00—12.8234 "Other construction workers" [0.01] 0.00 1 2.08 [0.00] 0.00 [0.01] 0.00 [0.01] 0.00 1 1.96 0.05—10.9235 Bricklayers [0.00] 0.00 [0.01] 0.00 – – [0.00] 0.00 [0.00] 0.00 [0.02] 0.00 0.00—214.9036 Printers [0.29] 0.00 [0.62] 0.00 [0.03] 0.00 1 3.42 [1.06] 0.00 1 0.44 0.01—2.4437 Chemical process workers [0.45] 0.00 [0.31] 0.00 [0.01] 0.00 [0.25] 0.00 2 2.38 2 1.07 0.13—3.8738 Food workers 2 0.91 1 0.63 2 2.72 2 1.24 3 1.12 10 1.13 0.54—2.0939 Beverage workers 1 4.75 [0.09] 0.00 [0.00] 0.00 [0.01] 0.00 [0.18] 0.00 1 2.03 0.05—11.2940 Tobacco workers 2 6.86 [0.05] 0.00 – – [0.07] 0.00 [0.09] 0.00 2 4.02 0.49—14.5141 Glass makers etc 2 3.59 [1.13] 0.00 [0.02] 0.00 2 3.75 4 1.83 8 1.81 0.78—3.5642 Packers [0.16] 0.00 2 1.01 [0.07] 0.00 [1.24] 0.00 3 0.89 5 0.73 0.24—1.7143 Engine operators [0.01] 0.00 1 3.13 [0.00] 0.00 [0.02] 0.00 [0.18] 0.00 1 1.92 0.05—10.6744 Public safety workers [0.02] 0.00 [0.08] 0.00 [0.01] 0.00 [0.13] 0.00 [0.27] 0.00 [0.51] 0.00 0.00—7.2345 Cooks and stewards [0.01] 0.00 5 2.15 [0.24] 0.00 4 2.14 7 1.27 16 1.60 0.92—2.6046 Domestic assistants 2 0.60 1 0.39 [0.07] 0.00 1 0.21 14 0.99 18 0.72 0.43—1.1447 Waiters 2 3.33 1 0.53 [0.03] 0.00 4 2.09 8 1.55 15 1.56 0.87—2.5748 Building caretakers 8 0.83 15 1.90 [0.52] 0.00 11 1.40 10 0.71 44 1.10 0.80—1.4849 Chimney sweeps [0.00] 0.00 [0.00] 0.00 – – [0.00] 0.00 [0.00] 0.00 [0.01] 0.00 0.00—657.3050 Hairdressers 1 1.72 2 2.66 [0.02] 0.00 [0.51] 0.00 1 0.50 4 1.04 0.28—2.6651 Launderers 2 1.86 [0.61] 0.00 1 13.88 4 5.38 4 1.39 11 2.04 1.02—3.6552 Military personnel [0.01] 0.00 [0.01] 0.00 – – [0.00] 0.00 [0.01] 0.00 [0.02] 0.00 0.00—159.7953 "Other workers" 1 0.36 2 0.81 [0.56] 0.00 4 0.97 4 0.66 11 0.69 0.34—1.2354 Economically inactive 60 0.89 50 0.90 3 1.75 67 1.01 304 1.03 484 0.99 0.91—1.09
1-54 All categories 137 1.00 147 1.00 8 1.00 139 1.00 487 1.00 918 1.00 # REF. #
Obs = observed number of cases; SIR = standardised incidence ratio; 95% CI = 95% confidence interval
15 Index Prev Next

Acta Oncologica - Pukkala et al, 2008 Oesophageal cancer
Observed number of oesophageal cancer among men in the Nordic countries and standardised incidence ratios 1961-2005, by countryand occupational category
Denmark Finland Iceland Norway Sweden Total
No Occupational category Obs SIR Obs SIR Obs SIR Obs SIR Obs SIR Obs SIR 95% CI
1 Technical workers, etc 233 0.82 121 0.67 5 1.60 70 0.57 590 0.78 1019 0.76 0.71—0.802 Laboratory assistants 6 1.06 3 0.67 [0.57] 0.00 9 1.50 2 0.53 20 0.98 0.60—1.513 Physicians 14 0.62 3 0.29 [1.26] 0.00 8 0.49 17 0.49 42 0.49 0.36—0.674 Dentists 5 0.73 [2.23] 0.00 1 3.29 4 0.54 10 0.58 20 0.59 0.36—0.915 Nurses [0.33] 0.00 [0.55] 0.00 [0.00] 0.00 [0.64] 0.00 3 1.74 3 0.92 0.19—2.706 Assistant nurses 4 0.59 [0.50] 0.00 [0.13] 0.00 3 1.07 13 1.10 20 0.91 0.55—1.407 "Other health workers" 10 0.50 8 0.79 [0.35] 0.00 5 0.80 14 0.49 37 0.57 0.40—0.788 Teachers 75 0.61 24 0.32 2 0.44 43 0.48 128 0.65 272 0.55 0.49—0.629 Religious workers etc 39 0.78 28 0.68 2 0.64 19 0.41 102 0.68 190 0.66 0.57—0.7610 Artistic workers 10 0.64 14 0.96 [0.82] 0.00 17 1.25 68 1.47 109 1.20 0.99—1.4511 Journalists 12 1.59 4 0.57 1 2.11 6 1.01 27 1.26 50 1.18 0.87—1.5512 Administrators 308 1.00 80 0.70 7 0.87 157 0.96 311 1.06 863 0.97 0.91—1.0413 Clerical workers 100 0.73 67 0.89 13 1.41 111 0.89 312 0.99 603 0.91 0.84—0.9914 Sales agents 56 0.77 88 0.82 2 0.43 158 1.09 505 1.11 809 1.03 0.96—1.1015 Shop workers 317 1.02 51 1.13 2 0.63 78 1.41 172 1.17 620 1.11 1.02—1.2016 Farmers 384 0.67 456 0.85 4 0.29 230 0.56 470 0.59 1544 0.66 0.63—0.7017 Gardeners 71 0.86 62 0.83 [0.45] 0.00 71 0.70 214 0.73 418 0.76 0.69—0.8418 Fishermen 39 1.34 7 1.01 10 1.41 119 0.92 30 0.97 205 1.01 0.88—1.1519 Forestry workers 13 1.08 113 1.31 [0.06] 0.00 64 0.85 162 0.76 352 0.91 0.82—1.0120 Miners and quarry workers 2 0.53 16 1.16 [0.12] 0.00 21 1.01 61 1.17 100 1.10 0.91—1.3421 Seamen 46 1.42 31 1.66 5 2.44 162 1.58 88 1.93 332 1.65 1.48—1.8322 Transport workers 55 0.80 41 0.77 3 0.70 47 0.86 135 0.88 281 0.84 0.75—0.9423 Drivers 263 1.17 186 1.07 5 0.85 204 1.38 468 1.24 1126 1.21 1.14—1.2824 Postal workers 28 0.63 32 1.20 1 1.21 27 0.93 73 0.88 161 0.87 0.75—1.0225 Textile workers 39 1.02 17 0.94 [1.42] 0.00 20 0.63 89 0.95 165 0.90 0.77—1.0526 Shoe and leather workers 8 0.86 7 0.88 [0.31] 0.00 14 1.02 55 1.48 84 1.23 0.98—1.5227 Smelting workers 116 1.30 26 0.95 [1.89] 0.00 48 1.12 136 0.92 326 1.06 0.95—1.1828 Mechanics 268 1.13 162 0.93 7 1.24 236 1.15 739 1.08 1412 1.08 1.02—1.1429 Plumbers 25 1.16 34 1.17 1 1.07 32 1.35 92 1.16 184 1.19 1.03—1.3830 Welders – – 26 0.94 [0.33] 0.00 26 0.99 89 0.99 141 0.98 0.83—1.1531 Electrical workers 69 1.20 80 1.09 5 1.51 83 0.91 220 0.93 457 0.99 0.90—1.0832 Wood workers 144 0.89 194 1.04 4 1.17 187 0.77 353 0.77 882 0.84 0.78—0.8933 Painters 75 1.40 40 1.02 [1.36] 0.00 50 1.23 141 1.06 306 1.14 1.02—1.2834 "Other construction workers" 239 1.20 168 1.39 12 1.80 66 1.39 330 1.32 815 1.31 1.22—1.4035 Bricklayers 74 1.27 19 0.98 – – 26 1.08 61 1.02 180 1.11 0.96—1.2936 Printers 53 1.39 18 1.01 [1.09] 0.00 31 1.27 98 1.36 200 1.30 1.13—1.5037 Chemical process workers 34 1.00 31 1.05 3 4.81 57 1.05 98 0.88 223 0.97 0.85—1.1138 Food workers 114 1.02 27 1.26 6 1.10 80 1.30 144 1.28 371 1.19 1.07—1.3139 Beverage workers 44 3.20 4 2.78 [0.09] 0.00 [0.63] 0.00 13 2.03 61 2.73 2.09—3.5140 Tobacco workers 5 2.36 [0.25] 0.00 [0.01] 0.00 [0.96] 0.00 [0.50] 0.00 5 1.30 0.42—3.0341 Glass makers etc 65 1.00 39 1.26 2 2.12 36 1.22 126 1.03 268 1.07 0.95—1.2142 Packers 89 1.56 78 1.21 3 0.96 153 1.65 293 1.32 616 1.40 1.30—1.5243 Engine operators 62 1.04 88 1.02 5 1.26 63 1.22 204 1.10 422 1.09 0.99—1.2044 Public safety workers 48 0.89 35 0.70 1 0.34 49 1.25 87 0.80 220 0.86 0.76—0.9945 Cooks and stewards 8 1.78 6 2.01 4 3.03 41 2.40 37 1.93 96 2.13 1.72—2.6046 Domestic assistants [0.05] 0.00 [0.20] 0.00 [0.00] 0.00 [0.14] 0.00 3 1.98 3 1.57 0.32—4.6047 Waiters 41 4.34 7 2.37 [0.14] 0.00 21 2.83 31 3.12 100 3.34 2.75—4.0748 Building caretakers 55 0.95 28 0.66 1 0.73 28 1.38 98 1.14 210 1.01 0.88—1.1649 Chimney sweeps 1 0.64 9 2.90 – – 5 2.43 9 1.45 24 1.86 1.19—2.7650 Hairdressers 13 0.80 1 1.10 1 5.21 7 1.18 23 1.05 45 1.00 0.73—1.3351 Launderers 8 1.00 2 2.26 [0.13] 0.00 8 2.27 10 0.64 28 0.99 0.66—1.4452 Military personnel 28 0.93 14 0.88 – – 30 0.91 66 1.04 138 0.97 0.82—1.1453 "Other workers" 277 1.53 65 1.29 14 1.18 204 1.16 365 1.35 925 1.34 1.26—1.4354 Economically inactive 191 1.14 461 1.54 9 1.08 154 1.62 659 1.60 1474 1.50 1.43—1.58
1-54 All categories 4283 1.00 3121 1.00 141 1.00 3388 1.00 8644 1.00 19577 1.00 # REF. #
Obs = observed number of cases; SIR = standardised incidence ratio; 95% CI = 95% confidence interval
16 Index Prev Next

Acta Oncologica - Pukkala et al, 2008 Oesophageal cancer
Observed number of oesophageal cancer among women in the Nordic countries and standardised incidence ratios 1961-2005, bycountry and occupational category
Denmark Finland Iceland Norway Sweden Total
No Occupational category Obs SIR Obs SIR Obs SIR Obs SIR Obs SIR Obs SIR 95% CI
1 Technical workers, etc 7 1.35 7 0.87 [0.09] 0.00 [1.37] 0.00 9 0.75 23 0.86 0.54—1.292 Laboratory assistants 2 0.54 7 1.46 [0.14] 0.00 1 0.55 [2.35] 0.00 10 0.78 0.37—1.443 Physicians 7 4.10 [1.83] 0.00 [0.03] 0.00 1 1.32 [2.51] 0.00 8 1.17 0.50—2.304 Dentists 2 1.32 [3.13] 0.00 [0.01] 0.00 2 2.99 2 0.88 6 0.79 0.29—1.725 Nurses 20 0.66 13 0.54 [0.82] 0.00 5 0.35 35 0.92 73 0.68 0.53—0.856 Assistant nurses 20 0.91 19 0.67 1 0.79 9 0.63 54 0.85 103 0.80 0.66—0.977 "Other health workers" 19 1.10 13 0.62 [0.22] 0.00 10 0.68 18 0.87 60 0.81 0.62—1.048 Teachers 40 1.06 36 0.70 [1.39] 0.00 26 0.94 60 0.70 162 0.79 0.68—0.939 Religious workers etc 5 0.98 16 0.87 [0.23] 0.00 6 0.87 22 0.87 49 0.87 0.65—1.1610 Artistic workers 5 1.87 1 0.26 [0.18] 0.00 3 1.38 8 1.51 17 1.20 0.70—1.9311 Journalists 1 1.75 [2.55] 0.00 [0.04] 0.00 2 3.67 3 1.25 6 0.98 0.36—2.1412 Administrators 18 1.12 6 0.69 [0.17] 0.00 7 0.95 19 1.53 50 1.12 0.83—1.4813 Clerical workers 162 1.05 123 0.78 4 0.88 89 0.99 276 1.31 654 1.06 0.98—1.1414 Sales agents 2 1.42 17 0.58 1 1.74 15 1.03 46 1.35 81 1.01 0.80—1.2615 Shop workers 111 1.04 90 0.93 4 1.23 78 0.98 143 0.97 426 0.98 0.90—1.0816 Farmers 49 0.66 101 1.12 1 0.37 43 0.73 12 0.85 206 0.86 0.75—0.9817 Gardeners 8 0.83 213 0.97 [0.10] 0.00 19 0.55 46 1.16 286 0.94 0.84—1.0618 Fishermen [0.38] 0.00 1 2.33 [0.07] 0.00 [0.40] 0.00 [0.13] 0.00 1 0.71 0.02—3.9619 Forestry workers [0.10] 0.00 [0.80] 0.00 [0.01] 0.00 1 1.64 1 1.25 2 0.86 0.10—3.1120 Miners and quarry workers [0.01] 0.00 [0.42] 0.00 [0.01] 0.00 [0.03] 0.00 [0.18] 0.00 [0.63] 0.00 0.00—5.8221 Seamen – – 2 36.17 [0.00] 0.00 [0.09] 0.00 1 67.80 3 18.63 3.84—54.4522 Transport workers [0.11] 0.00 4 0.74 [0.10] 0.00 [0.39] 0.00 1 0.48 5 0.62 0.20—1.4423 Drivers 5 1.86 1 0.51 [0.03] 0.00 5 3.25 5 1.03 16 1.45 0.83—2.3524 Postal workers 8 1.42 35 1.13 2 1.75 16 0.87 34 0.85 95 0.99 0.80—1.2125 Textile workers 29 0.81 83 1.11 3 1.19 35 1.10 90 0.98 240 1.01 0.89—1.1526 Shoe and leather workers 4 1.52 8 0.90 [0.13] 0.00 2 0.90 10 1.45 24 1.16 0.74—1.7227 Smelting workers [0.65] 0.00 2 0.96 [0.01] 0.00 [0.21] 0.00 5 3.26 7 1.56 0.63—3.2228 Mechanics 5 0.79 8 0.92 [0.02] 0.00 3 1.19 16 1.00 32 0.95 0.65—1.3429 Plumbers [0.06] 0.00 [0.01] 0.00 – – [0.02] 0.00 [0.02] 0.00 [0.11] 0.00 0.00—34.8530 Welders – – [0.55] 0.00 [0.00] 0.00 [0.16] 0.00 [0.50] 0.00 [1.21] 0.00 0.00—3.0431 Electrical workers 8 0.90 6 1.37 [0.02] 0.00 2 0.76 10 1.13 26 1.05 0.69—1.5432 Wood workers 2 0.68 13 0.68 [0.03] 0.00 1 1.14 2 0.78 18 0.71 0.42—1.1233 Painters 1 8.75 2 0.97 [0.01] 0.00 [0.20] 0.00 2 2.75 5 1.60 0.52—3.7434 "Other construction workers" [0.09] 0.00 10 1.17 [0.00] 0.00 [0.08] 0.00 [0.07] 0.00 10 1.14 0.54—2.0935 Bricklayers [0.02] 0.00 [0.25] 0.00 – – [0.00] 0.00 [0.00] 0.00 [0.28] 0.00 0.00—13.2936 Printers 3 0.89 8 0.92 [0.18] 0.00 2 0.79 10 1.40 23 1.05 0.67—1.5837 Chemical process workers 6 1.13 5 1.04 [0.09] 0.00 4 1.79 7 1.19 22 1.20 0.75—1.8238 Food workers 25 0.97 22 0.86 5 1.10 18 1.19 31 1.66 101 1.12 0.93—1.3739 Beverage workers 5 2.01 1 0.65 [0.01] 0.00 [0.12] 0.00 1 0.82 7 1.30 0.52—2.6940 Tobacco workers 3 0.88 1 1.19 – – 3 5.64 [0.68] 0.00 7 1.28 0.52—2.6441 Glass makers etc 5 0.79 19 1.11 1 8.18 6 1.26 20 1.30 51 1.17 0.87—1.5442 Packers 4 2.21 39 1.30 2 4.13 12 1.03 23 0.97 80 1.18 0.94—1.4743 Engine operators [0.05] 0.00 3 0.66 [0.01] 0.00 [0.14] 0.00 4 3.49 7 1.18 0.48—2.4444 Public safety workers [0.21] 0.00 [1.11] 0.00 [0.10] 0.00 [1.53] 0.00 3 2.06 3 0.68 0.14—1.9945 Cooks and stewards [0.07] 0.00 36 1.01 3 1.57 17 0.95 40 1.06 96 1.03 0.83—1.2646 Domestic assistants 43 1.07 36 1.00 1 1.68 39 0.85 78 0.88 197 0.93 0.81—1.0747 Waiters 16 2.31 23 0.89 [0.19] 0.00 27 1.52 53 1.43 119 1.35 1.13—1.6248 Building caretakers 111 0.95 135 1.05 2 0.53 84 1.10 110 1.17 442 1.05 0.96—1.1649 Chimney sweeps [0.01] 0.00 [0.05] 0.00 – – [0.01] 0.00 [0.00] 0.00 [0.07] 0.00 0.00—49.3150 Hairdressers 6 0.87 6 0.59 [0.14] 0.00 8 1.81 18 1.29 38 1.07 0.76—1.4751 Launderers 17 1.29 13 1.22 [0.67] 0.00 9 1.30 28 1.37 67 1.29 1.00—1.6452 Military personnel [0.07] 0.00 1 20.68 – – [0.02] 0.00 1 31.72 2 12.03 1.46—43.4453 "Other workers" 41 1.24 33 0.91 2 0.58 29 0.75 50 1.22 155 1.02 0.87—1.1954 Economically inactive 878 1.00 1137 1.09 17 1.32 606 1.07 1962 0.95 4600 1.01 0.98—1.04
1-54 All categories 1703 1.00 2355 1.00 49 1.00 1245 1.00 3369 1.00 8721 1.00 # REF. #
Obs = observed number of cases; SIR = standardised incidence ratio; 95% CI = 95% confidence interval
17 Index Prev Next

Acta Oncologica - Pukkala et al, 2008 Adenocarcinoma of the oesophagus
Observed number of adenocarcinoma of the oesophagus among men in the Nordic countries and standardised incidence ratios1961-2005, by country and occupational category
Denmark Finland Iceland Norway Sweden Total
No Occupational category Obs SIR Obs SIR Obs SIR Obs SIR Obs SIR Obs SIR 95% CI
1 Technical workers, etc 98 0.85 44 0.93 2 1.52 16 0.50 187 0.83 347 0.82 0.74—0.922 Laboratory assistants 1 0.44 1 0.83 [0.24] 0.00 3 2.12 [1.54] 0.00 5 0.75 0.24—1.753 Physicians 4 0.43 1 0.36 [0.50] 0.00 [3.66] 0.00 6 0.55 11 0.41 0.20—0.734 Dentists 1 0.36 [0.55] 0.00 [0.13] 0.00 [1.67] 0.00 2 0.39 3 0.29 0.06—0.865 Nurses [0.14] 0.00 [0.18] 0.00 [0.00] 0.00 [0.19] 0.00 1 1.23 1 0.76 0.02—4.216 Assistant nurses 2 0.72 [0.17] 0.00 [0.06] 0.00 [0.58] 0.00 2 0.55 4 0.55 0.15—1.417 "Other health workers" 3 0.37 1 0.40 [0.14] 0.00 3 2.23 3 0.36 10 0.49 0.24—0.908 Teachers 25 0.49 8 0.42 [1.85] 0.00 13 0.60 55 0.88 101 0.65 0.53—0.799 Religious workers etc 12 0.60 8 0.72 2 1.63 6 0.58 36 0.77 64 0.71 0.55—0.9110 Artistic workers 1 0.16 4 1.09 [0.32] 0.00 3 0.98 16 1.17 24 0.89 0.57—1.3211 Journalists 4 1.31 1 0.57 [0.19] 0.00 3 2.22 4 0.63 12 0.95 0.49—1.6612 Administrators 120 0.96 26 0.91 [3.00] 0.00 26 0.74 72 0.93 244 0.90 0.80—1.0313 Clerical workers 37 0.67 12 0.69 4 1.18 17 0.61 86 0.99 156 0.82 0.70—0.9614 Sales agents 19 0.65 21 0.81 1 0.58 30 1.02 124 0.98 195 0.92 0.80—1.0515 Shop workers 113 0.91 14 1.20 [1.20] 0.00 17 1.32 45 1.07 189 0.99 0.86—1.1416 Farmers 234 0.99 95 0.89 2 0.40 69 0.97 173 0.97 573 0.96 0.89—1.0417 Gardeners 31 0.94 12 0.71 [0.16] 0.00 18 0.90 53 0.74 114 0.81 0.67—0.9718 Fishermen 16 1.38 2 1.40 5 1.67 20 0.82 5 0.68 48 1.01 0.74—1.3419 Forestry workers 9 1.86 15 0.77 [0.03] 0.00 13 0.96 51 0.99 88 0.99 0.79—1.2220 Miners and quarry workers 2 1.37 4 1.27 [0.05] 0.00 4 0.96 20 1.53 30 1.37 0.92—1.9621 Seamen 14 1.09 9 1.99 2 2.48 36 1.58 14 1.16 75 1.41 1.11—1.7722 Transport workers 30 1.08 10 0.80 [1.59] 0.00 15 1.27 30 0.71 85 0.89 0.71—1.1023 Drivers 95 1.07 42 0.98 2 0.86 39 1.22 131 1.22 309 1.13 1.01—1.2624 Postal workers 11 0.60 10 1.57 [0.30] 0.00 2 0.35 15 0.66 38 0.71 0.50—0.9825 Textile workers 13 0.86 3 0.76 [0.50] 0.00 4 0.64 19 0.84 39 0.81 0.57—1.1026 Shoe and leather workers 2 0.55 1 0.60 [0.11] 0.00 5 2.10 8 0.98 16 1.00 0.57—1.6327 Smelting workers 53 1.50 9 1.46 [0.71] 0.00 8 0.94 34 0.93 104 1.19 0.98—1.4428 Mechanics 103 1.09 57 1.33 5 2.21 48 1.05 222 1.14 435 1.15 1.04—1.2629 Plumbers 9 1.06 8 1.10 [0.37] 0.00 10 1.87 24 1.08 51 1.17 0.87—1.5330 Welders – – 5 0.67 [0.14] 0.00 5 0.76 22 0.81 32 0.77 0.53—1.0931 Electrical workers 25 1.10 21 1.11 5 3.60 24 1.16 61 0.87 136 1.01 0.86—1.2032 Wood workers 61 0.95 37 0.91 3 2.32 46 0.94 99 0.86 246 0.91 0.80—1.0333 Painters 29 1.36 10 1.12 [0.53] 0.00 6 0.77 31 0.91 76 1.05 0.83—1.3134 "Other construction workers" 109 1.40 28 1.08 6 2.26 12 1.23 78 1.27 233 1.31 1.15—1.4935 Bricklayers 27 1.17 5 1.18 – – 7 1.47 12 0.81 51 1.09 0.81—1.4336 Printers 22 1.46 2 0.44 [0.44] 0.00 6 1.16 29 1.41 59 1.29 0.98—1.6637 Chemical process workers 15 1.12 10 1.42 1 4.31 13 1.29 36 1.32 75 1.29 1.02—1.6238 Food workers 39 0.88 10 1.98 2 1.03 17 1.41 44 1.51 112 1.21 1.00—1.4639 Beverage workers 7 1.32 [0.33] 0.00 [0.03] 0.00 [0.18] 0.00 3 1.98 10 1.36 0.65—2.5040 Tobacco workers 2 2.45 [0.06] 0.00 [0.00] 0.00 [0.16] 0.00 [0.14] 0.00 2 1.69 0.20—6.1141 Glass makers etc 26 1.01 11 1.49 [0.35] 0.00 3 0.48 36 1.13 76 1.06 0.83—1.3342 Packers 34 1.52 10 0.69 2 1.79 19 1.09 69 1.28 134 1.22 1.03—1.4543 Engine operators 31 1.30 24 1.11 4 2.53 17 1.46 55 1.06 131 1.19 1.00—1.4144 Public safety workers 21 0.96 13 1.10 [1.10] 0.00 9 1.13 31 0.98 74 1.00 0.78—1.2545 Cooks and stewards 1 0.58 1 1.23 [0.54] 0.00 11 2.86 7 1.20 20 1.57 0.96—2.4246 Domestic assistants [0.02] 0.00 [0.05] 0.00 [0.00] 0.00 [0.04] 0.00 2 3.34 2 2.86 0.35—10.3247 Waiters 3 0.85 4 4.75 [0.06] 0.00 1 0.64 9 3.02 17 1.90 1.10—3.0448 Building caretakers 17 0.75 6 0.63 [0.47] 0.00 4 1.02 15 0.69 42 0.72 0.52—0.9749 Chimney sweeps [0.62] 0.00 3 4.41 – – 2 4.91 2 1.14 7 2.02 0.81—4.1750 Hairdressers 2 0.31 [0.19] 0.00 1 12.67 [1.15] 0.00 5 0.91 8 0.60 0.26—1.1851 Launderers 4 1.25 [0.20] 0.00 [0.04] 0.00 1 1.48 2 0.51 7 0.87 0.35—1.7952 Military personnel 9 0.72 3 0.68 – – 9 1.07 18 0.96 39 0.88 0.63—1.2153 "Other workers" 87 1.24 11 1.00 3 0.68 36 1.16 88 1.34 225 1.23 1.08—1.4154 Economically inactive 72 1.27 73 1.46 2 0.64 15 1.04 117 1.11 279 1.22 1.08—1.37
1-54 All categories 1705 1.00 705 1.00 54 1.00 691 1.00 2309 1.00 5464 1.00 # REF. #
Obs = observed number of cases; SIR = standardised incidence ratio; 95% CI = 95% confidence interval
18 Index Prev Next

Acta Oncologica - Pukkala et al, 2008 Adenocarcinoma of the oesophagus
Observed number of adenocarcinoma of the oesophagus among women in the Nordic countries and standardised incidence ratios1961-2005, by country and occupational category
Denmark Finland Iceland Norway Sweden Total
No Occupational category Obs SIR Obs SIR Obs SIR Obs SIR Obs SIR Obs SIR 95% CI
1 Technical workers, etc 3 2.35 2 2.16 [0.03] 0.00 [0.29] 0.00 3 1.37 8 1.70 0.73—3.352 Laboratory assistants [0.89] 0.00 1 1.80 [0.04] 0.00 [0.35] 0.00 [0.46] 0.00 1 0.43 0.01—2.423 Physicians 1 2.36 [0.22] 0.00 [0.01] 0.00 [0.14] 0.00 [0.47] 0.00 1 0.79 0.02—4.384 Dentists [0.38] 0.00 [0.28] 0.00 [0.00] 0.00 [0.11] 0.00 1 2.44 1 0.84 0.02—4.685 Nurses 9 1.20 1 0.36 [0.25] 0.00 1 0.36 8 1.17 19 0.94 0.57—1.476 Assistant nurses 4 0.74 1 0.33 1 2.74 3 1.06 13 1.14 22 0.96 0.60—1.457 "Other health workers" 5 1.16 3 1.30 [0.06] 0.00 4 1.47 3 0.79 15 1.14 0.64—1.878 Teachers 10 1.08 4 0.74 [0.40] 0.00 3 0.59 16 1.06 33 0.93 0.64—1.319 Religious workers etc [1.28] 0.00 1 0.44 [0.07] 0.00 1 0.75 3 0.65 5 0.52 0.17—1.2210 Artistic workers 1 1.51 [0.41] 0.00 [0.05] 0.00 [0.39] 0.00 [0.95] 0.00 1 0.40 0.01—2.2511 Journalists [0.14] 0.00 [0.28] 0.00 [0.01] 0.00 [0.10] 0.00 [0.43] 0.00 [0.96] 0.00 0.00—3.8312 Administrators 5 1.26 2 2.22 [0.05] 0.00 1 0.77 4 1.87 12 1.43 0.74—2.5013 Clerical workers 30 0.79 14 0.82 [1.37] 0.00 8 0.49 54 1.42 106 0.96 0.79—1.1614 Sales agents [0.35] 0.00 2 0.75 1 5.83 1 0.44 8 1.46 12 1.10 0.57—1.9215 Shop workers 22 0.83 13 1.33 [0.99] 0.00 18 1.28 27 1.07 80 1.05 0.83—1.3016 Farmers 18 0.97 5 0.77 1 1.25 7 0.69 3 1.47 34 0.90 0.62—1.2517 Gardeners 2 0.83 15 0.80 [0.03] 0.00 2 0.33 7 1.05 26 0.77 0.50—1.1218 Fishermen [0.09] 0.00 [0.04] 0.00 [0.02] 0.00 [0.07] 0.00 [0.02] 0.00 [0.25] 0.00 0.00—14.7419 Forestry workers [0.03] 0.00 [0.08] 0.00 [0.00] 0.00 [0.11] 0.00 [0.14] 0.00 [0.36] 0.00 0.00—10.2520 Miners and quarry workers [0.00] 0.00 [0.03] 0.00 [0.00] 0.00 [0.01] 0.00 [0.03] 0.00 [0.07] 0.00 0.00—51.5721 Seamen – – [0.01] 0.00 – – [0.02] 0.00 [0.00] 0.00 [0.03] 0.00 0.00—138.4422 Transport workers [0.03] 0.00 1 2.01 [0.03] 0.00 [0.07] 0.00 [0.37] 0.00 1 1.00 0.03—5.5923 Drivers 2 3.04 1 4.64 [0.01] 0.00 [0.28] 0.00 1 1.16 4 1.98 0.54—5.0724 Postal workers 3 2.15 [2.97] 0.00 [0.36] 0.00 1 0.32 4 0.57 8 0.54 0.23—1.0625 Textile workers 7 0.79 11 1.62 1 1.38 5 0.99 12 0.80 36 0.99 0.69—1.3726 Shoe and leather workers 1 1.54 1 1.20 [0.04] 0.00 [0.36] 0.00 2 1.75 4 1.32 0.36—3.3927 Smelting workers [0.16] 0.00 [0.20] 0.00 [0.00] 0.00 [0.04] 0.00 2 7.17 2 2.97 0.36—10.7228 Mechanics 1 0.65 1 1.18 [0.01] 0.00 [0.43] 0.00 1 0.36 3 0.53 0.11—1.5629 Plumbers [0.02] 0.00 [0.00] 0.00 – – [0.00] 0.00 [0.00] 0.00 [0.02] 0.00 0.00—159.8030 Welders – – [0.06] 0.00 [0.00] 0.00 [0.03] 0.00 [0.09] 0.00 [0.19] 0.00 0.00—19.3231 Electrical workers 2 0.93 1 1.98 [0.01] 0.00 [0.47] 0.00 [1.58] 0.00 3 0.64 0.13—1.8632 Wood workers [0.72] 0.00 1 0.58 [0.01] 0.00 [0.16] 0.00 [0.46] 0.00 1 0.32 0.01—1.8133 Painters 1 35.67 1 5.17 [0.00] 0.00 [0.04] 0.00 [0.13] 0.00 2 5.18 0.63—18.7134 "Other construction workers" [0.02] 0.00 [0.71] 0.00 [0.00] 0.00 [0.02] 0.00 [0.01] 0.00 [0.76] 0.00 0.00—4.8635 Bricklayers [0.00] 0.00 [0.03] 0.00 – – [0.00] 0.00 [0.00] 0.00 [0.03] 0.00 0.00—120.0236 Printers 2 2.45 2 2.43 [0.05] 0.00 [0.40] 0.00 1 0.83 5 1.52 0.49—3.5437 Chemical process workers 1 0.77 1 2.30 [0.03] 0.00 1 2.67 1 1.01 4 1.28 0.35—3.2938 Food workers 4 0.63 2 0.86 [1.31] 0.00 1 0.40 4 1.33 11 0.71 0.35—1.2739 Beverage workers [0.60] 0.00 [0.13] 0.00 [0.00] 0.00 [0.02] 0.00 [0.19] 0.00 [0.94] 0.00 0.00—3.9140 Tobacco workers 1 1.23 [0.08] 0.00 – – [0.07] 0.00 [0.12] 0.00 1 0.92 0.02—5.1341 Glass makers etc 1 0.65 [1.60] 0.00 1 29.24 [0.80] 0.00 4 1.52 6 0.91 0.33—1.9842 Packers 3 6.76 5 1.76 [0.14] 0.00 [1.98] 0.00 6 1.51 14 1.49 0.82—2.5143 Engine operators [0.01] 0.00 [0.45] 0.00 [0.00] 0.00 [0.03] 0.00 [0.22] 0.00 [0.71] 0.00 0.00—5.1744 Public safety workers [0.05] 0.00 [0.10] 0.00 [0.03] 0.00 [0.29] 0.00 [0.27] 0.00 [0.74] 0.00 0.00—5.0045 Cooks and stewards [0.02] 0.00 5 1.58 2 3.77 3 1.05 5 0.86 15 1.21 0.68—2.0046 Domestic assistants 18 1.81 3 0.93 1 6.18 10 1.38 8 0.57 40 1.15 0.82—1.5747 Waiters 4 2.39 1 0.38 [0.05] 0.00 4 1.32 5 0.81 14 1.03 0.57—1.7348 Building caretakers 21 0.73 8 0.73 1 0.94 15 1.14 22 1.46 67 0.97 0.75—1.2349 Chimney sweeps [0.00] 0.00 [0.00] 0.00 – – [0.00] 0.00 [0.00] 0.00 [0.01] 0.00 0.00—355.3050 Hairdressers 2 1.18 1 1.02 [0.04] 0.00 2 2.55 5 2.01 10 1.67 0.80—3.0851 Launderers 3 0.92 1 1.11 [0.19] 0.00 1 0.90 4 1.24 9 1.03 0.47—1.9652 Military personnel [0.02] 0.00 [0.01] 0.00 – – [0.00] 0.00 [0.01] 0.00 [0.04] 0.00 0.00—103.5253 "Other workers" 8 0.99 2 0.60 1 1.00 6 0.87 13 1.93 30 1.15 0.78—1.6454 Economically inactive 223 1.04 86 1.15 4 1.16 100 1.25 302 0.92 715 1.02 0.94—1.09
1-54 All categories 418 1.00 199 1.00 14 1.00 198 1.00 552 1.00 1381 1.00 # REF. #
Obs = observed number of cases; SIR = standardised incidence ratio; 95% CI = 95% confidence interval
19 Index Prev Next

Acta Oncologica - Pukkala et al, 2008 Stomach cancer
Observed number of stomach cancer among men in the Nordic countries and standardised incidence ratios 1961-2005, by country andoccupational category
Denmark Finland Iceland Norway Sweden Total
No Occupational category Obs SIR Obs SIR Obs SIR Obs SIR Obs SIR Obs SIR 95% CI
1 Technical workers, etc 453 0.79 581 0.79 4 0.45 362 0.66 2298 0.84 3698 0.80 0.78—0.832 Laboratory assistants 5 0.43 9 0.50 3 1.77 30 1.01 10 1.24 57 0.83 0.63—1.073 Physicians 35 0.72 13 0.31 3 0.82 51 0.58 63 0.52 165 0.54 0.47—0.634 Dentists 9 0.67 2 0.21 [0.81] 0.00 16 0.40 30 0.47 57 0.45 0.34—0.585 Nurses 2 3.45 [1.82] 0.00 [0.02] 0.00 2 0.92 5 1.36 9 1.09 0.50—2.076 Assistant nurses 11 0.82 5 3.34 1 2.52 17 1.07 56 1.30 90 1.21 0.97—1.497 "Other health workers" 38 0.89 37 0.83 [1.03] 0.00 30 0.87 84 0.77 189 0.81 0.71—0.948 Teachers 170 0.69 213 0.69 12 0.90 343 0.76 460 0.69 1198 0.71 0.67—0.759 Religious workers etc 84 0.75 102 0.60 5 0.54 158 0.63 372 0.70 721 0.67 0.63—0.7210 Artistic workers 33 0.93 50 0.80 2 0.81 48 0.67 116 0.70 249 0.74 0.65—0.8311 Journalists 7 0.44 16 0.52 [1.43] 0.00 15 0.49 57 0.72 95 0.60 0.49—0.7412 Administrators 545 0.81 368 0.73 25 1.03 713 0.78 832 0.69 2483 0.75 0.72—0.7813 Clerical workers 245 0.83 293 0.84 29 1.04 501 0.77 1067 0.86 2135 0.83 0.80—0.8714 Sales agents 131 0.85 397 0.83 9 0.65 735 0.89 1518 0.86 2790 0.86 0.83—0.8915 Shop workers 598 0.85 146 0.78 8 0.84 251 0.91 466 0.86 1469 0.86 0.81—0.9016 Farmers 1320 0.97 2963 1.07 31 0.76 2580 0.95 3899 1.02 10793 1.01 0.99—1.0317 Gardeners 173 0.89 329 0.94 2 1.47 529 0.88 1349 1.04 2382 0.97 0.94—1.0118 Fishermen 80 1.27 35 0.99 25 1.21 1113 1.41 175 1.23 1428 1.36 1.29—1.4319 Forestry workers 28 0.96 467 1.16 [0.20] 0.00 442 0.92 1017 1.08 1954 1.05 1.01—1.1020 Miners and quarry workers 4 0.44 87 1.35 [0.32] 0.00 145 1.23 312 1.41 548 1.33 1.22—1.4521 Seamen 88 1.34 90 1.08 7 1.16 678 1.27 212 1.15 1075 1.23 1.16—1.3022 Transport workers 134 0.93 221 0.88 12 0.92 283 0.96 548 0.94 1198 0.93 0.88—0.9823 Drivers 562 1.17 803 1.06 24 1.35 879 1.11 1579 1.12 3847 1.11 1.08—1.1524 Postal workers 78 0.91 109 0.91 3 1.18 165 0.97 301 0.90 656 0.92 0.85—0.9925 Textile workers 98 1.09 74 0.86 5 1.14 193 1.02 406 0.98 776 0.99 0.92—1.0626 Shoe and leather workers 25 1.09 33 0.84 1 1.03 104 1.19 186 1.03 349 1.05 0.95—1.1727 Smelting workers 217 1.14 152 1.18 8 1.37 250 1.01 694 1.10 1321 1.10 1.04—1.1628 Mechanics 535 1.04 752 0.99 25 1.51 1126 1.05 2756 1.07 5194 1.05 1.02—1.0829 Plumbers 51 1.12 125 1.01 3 1.07 134 1.12 349 1.17 662 1.12 1.04—1.2130 Welders – – 120 1.12 2 2.05 114 0.95 345 1.13 581 1.09 1.00—1.1831 Electrical workers 114 0.97 312 1.01 9 0.93 508 1.08 835 0.99 1778 1.02 0.97—1.0732 Wood workers 349 0.97 962 1.06 9 0.89 1456 1.04 2128 1.05 4904 1.04 1.01—1.0733 Painters 110 0.95 182 0.99 2 0.50 248 1.03 557 0.99 1099 1.00 0.94—1.0634 "Other construction workers" 576 1.21 685 1.16 25 1.28 332 1.25 1301 1.19 2919 1.20 1.15—1.2435 Bricklayers 140 1.06 89 0.95 – – 168 1.20 292 1.12 689 1.10 1.02—1.1836 Printers 72 0.89 72 0.96 2 0.64 121 0.91 265 0.97 532 0.94 0.87—1.0337 Chemical process workers 101 1.26 130 0.99 6 3.11 354 1.07 567 1.15 1158 1.12 1.06—1.1838 Food workers 280 1.12 98 1.02 18 1.06 411 1.14 528 1.13 1335 1.12 1.06—1.1839 Beverage workers 40 1.24 8 1.16 1 3.70 2 0.97 30 1.01 81 1.14 0.91—1.4240 Tobacco workers 3 0.55 1 0.90 [0.02] 0.00 6 0.99 1 0.52 11 0.75 0.38—1.3541 Glass makers etc 174 1.16 153 1.10 3 1.03 161 1.00 541 1.06 1032 1.07 1.01—1.1442 Packers 164 1.18 359 1.18 7 0.72 673 1.21 1148 1.16 2351 1.18 1.13—1.2343 Engine operators 159 1.22 413 1.12 13 1.10 317 1.21 809 1.12 1711 1.15 1.09—1.2044 Public safety workers 113 0.93 224 0.99 9 1.01 230 1.03 398 0.99 974 0.99 0.93—1.0645 Cooks and stewards 11 1.13 10 0.80 5 1.29 97 1.10 83 1.21 206 1.13 0.98—1.2946 Domestic assistants [0.11] 0.00 1 0.93 [0.01] 0.00 [0.59] 0.00 6 1.28 7 1.08 0.44—2.2347 Waiters 28 1.28 10 0.85 1 2.71 30 0.74 55 1.59 124 1.14 0.95—1.3548 Building caretakers 157 1.15 225 1.10 5 1.15 144 1.21 425 1.10 956 1.12 1.06—1.2049 Chimney sweeps 9 2.73 15 1.00 – – 17 1.45 25 1.07 66 1.24 0.96—1.5850 Hairdressers 27 0.70 3 0.69 1 1.92 36 1.03 91 0.99 158 0.93 0.79—1.0851 Launderers 21 1.13 5 1.22 2 4.53 20 0.96 69 1.06 117 1.07 0.90—1.2952 Military personnel 45 0.82 47 0.78 – – 138 0.92 203 0.91 433 0.89 0.81—0.9853 "Other workers" 481 1.16 254 1.04 35 0.97 1206 1.08 1386 1.15 3362 1.11 1.08—1.1554 Economically inactive 704 1.38 1837 1.10 22 0.84 664 1.03 1986 1.05 5213 1.10 1.07—1.13
1-54 All categories 9637 1.00 14687 1.00 424 1.00 19346 1.00 35291 1.00 79385 1.00 # REF. #
Obs = observed number of cases; SIR = standardised incidence ratio; 95% CI = 95% confidence interval
20 Index Prev Next

Acta Oncologica - Pukkala et al, 2008 Stomach cancer
Observed number of stomach cancer among women in the Nordic countries and standardised incidence ratios 1961-2005, by countryand occupational category
Denmark Finland Iceland Norway Sweden Total
No Occupational category Obs SIR Obs SIR Obs SIR Obs SIR Obs SIR Obs SIR 95% CI
1 Technical workers, etc 12 0.79 38 0.82 [0.42] 0.00 5 0.51 59 0.86 114 0.81 0.68—0.982 Laboratory assistants 11 1.08 26 0.98 [0.69] 0.00 15 1.06 12 1.01 64 1.01 0.77—1.283 Physicians 3 0.60 7 0.63 [0.15] 0.00 1 0.16 4 0.29 15 0.42 0.23—0.694 Dentists 1 0.22 15 0.99 [0.05] 0.00 2 0.33 14 1.06 32 0.82 0.56—1.165 Nurses 85 0.94 120 0.90 3 0.80 102 0.97 164 0.75 474 0.86 0.78—0.946 Assistant nurses 61 0.97 141 0.95 2 0.37 86 0.85 399 1.12 689 1.03 0.95—1.117 "Other health workers" 42 0.81 111 0.97 2 1.99 106 0.91 101 0.87 362 0.90 0.82—1.008 Teachers 80 0.73 193 0.73 4 0.62 152 0.67 332 0.66 761 0.69 0.64—0.749 Religious workers etc 11 0.73 88 0.79 [1.03] 0.00 61 1.14 101 0.69 261 0.80 0.71—0.9010 Artistic workers 7 0.83 10 0.48 [0.84] 0.00 17 0.92 28 0.92 62 0.79 0.60—1.0111 Journalists 1 0.59 7 0.52 [0.21] 0.00 5 1.18 6 0.44 19 0.57 0.34—0.8912 Administrators 31 0.62 37 0.80 [0.77] 0.00 50 0.78 63 0.84 181 0.77 0.67—0.8913 Clerical workers 389 0.87 712 0.85 22 1.07 535 0.73 984 0.83 2642 0.82 0.79—0.8514 Sales agents 4 0.94 140 0.97 2 0.81 122 0.87 190 0.86 458 0.90 0.82—0.9815 Shop workers 343 1.06 465 0.96 15 1.06 630 0.96 849 0.97 2302 0.98 0.94—1.0216 Farmers 192 0.87 429 1.08 12 1.04 503 0.95 108 1.10 1244 0.99 0.94—1.0517 Gardeners 27 0.94 1025 1.01 [0.39] 0.00 317 1.05 269 1.11 1638 1.03 0.98—1.0818 Fishermen 1 0.91 5 2.45 3 9.22 1 0.32 3 3.70 13 1.76 0.94—3.0219 Forestry workers [0.29] 0.00 4 1.04 [0.05] 0.00 5 1.07 3 0.63 12 0.88 0.46—1.5420 Miners and quarry workers [0.02] 0.00 2 1.03 [0.02] 0.00 [0.21] 0.00 [0.97] 0.00 2 0.63 0.08—2.2921 Seamen – – [0.37] 0.00 [0.00] 0.00 [0.71] 0.00 [0.09] 0.00 [1.16] 0.00 0.00—3.1922 Transport workers [0.32] 0.00 21 0.81 1 2.34 7 2.26 17 1.35 46 1.09 0.80—1.4523 Drivers 8 1.01 15 1.45 [0.16] 0.00 8 0.65 32 1.18 63 1.09 0.84—1.3924 Postal workers 12 0.70 130 0.86 3 0.60 133 0.85 227 0.99 505 0.90 0.82—0.9825 Textile workers 113 1.06 363 1.01 15 1.45 317 1.04 617 1.05 1425 1.04 0.99—1.1026 Shoe and leather workers 11 1.41 39 0.90 3 5.55 28 1.34 49 1.13 130 1.12 0.94—1.3327 Smelting workers 3 1.56 8 0.79 [0.02] 0.00 1 0.71 12 1.44 24 1.10 0.71—1.6428 Mechanics 24 1.32 44 1.01 [0.07] 0.00 24 1.11 128 1.38 220 1.25 1.10—1.4329 Plumbers [0.21] 0.00 [0.08] 0.00 – – 1 8.17 [0.08] 0.00 1 2.00 0.05—11.1530 Welders – – 5 1.68 [0.00] 0.00 1 0.99 2 0.75 8 1.20 0.52—2.3731 Electrical workers 37 1.45 28 1.14 1 11.80 27 1.25 62 1.23 155 1.27 1.09—1.4932 Wood workers 10 1.18 101 1.11 1 6.40 7 1.07 14 0.97 133 1.10 0.93—1.3033 Painters [0.35] 0.00 11 1.07 [0.04] 0.00 2 1.29 5 1.17 18 1.09 0.65—1.7234 "Other construction workers" [0.29] 0.00 54 1.37 [0.02] 0.00 1 1.60 1 2.36 56 1.37 1.03—1.7835 Bricklayers [0.05] 0.00 2 1.68 – – [0.03] 0.00 [0.01] 0.00 2 1.56 0.19—5.6536 Printers 14 1.41 39 0.90 [0.75] 0.00 35 1.50 56 1.30 144 1.19 1.01—1.4137 Chemical process workers 18 1.13 32 1.38 [0.38] 0.00 16 0.79 42 1.18 108 1.13 0.94—1.3738 Food workers 85 1.12 128 1.05 23 1.20 153 1.12 137 1.14 526 1.11 1.02—1.2139 Beverage workers 11 1.44 6 0.83 [0.05] 0.00 2 2.21 12 1.48 31 1.29 0.88—1.8440 Tobacco workers 14 1.34 5 1.27 – – 5 0.89 3 0.77 27 1.13 0.74—1.6441 Glass makers etc 12 0.66 93 1.12 1 1.96 47 1.13 98 1.07 251 1.07 0.94—1.2142 Packers 10 1.88 168 1.15 2 1.01 117 1.16 166 1.15 463 1.16 1.06—1.2743 Engine operators [0.14] 0.00 19 0.83 [0.03] 0.00 2 2.19 12 2.11 33 1.12 0.77—1.5744 Public safety workers 2 2.79 12 2.18 [0.39] 0.00 13 1.03 9 1.05 36 1.30 0.91—1.7945 Cooks and stewards [0.22] 0.00 200 1.17 7 0.90 175 1.03 244 0.97 626 1.04 0.96—1.1246 Domestic assistants 126 1.04 172 0.97 3 1.24 420 0.99 628 1.10 1349 1.04 0.99—1.1047 Waiters 25 1.21 128 0.98 1 1.27 185 1.19 248 1.07 587 1.09 1.00—1.1848 Building caretakers 359 1.01 623 1.03 18 1.15 724 1.14 697 1.16 2421 1.10 1.05—1.1449 Chimney sweeps [0.04] 0.00 [0.26] 0.00 – – [0.08] 0.00 [0.01] 0.00 [0.39] 0.00 0.00—9.5350 Hairdressers 15 0.74 51 1.00 [0.62] 0.00 25 0.64 79 0.99 170 0.89 0.76—1.0351 Launderers 46 1.15 50 1.01 2 0.73 71 1.09 163 1.21 332 1.14 1.02—1.2752 Military personnel [0.21] 0.00 [0.34] 0.00 – – [0.12] 0.00 [0.17] 0.00 [0.83] 0.00 0.00—4.4353 "Other workers" 102 1.01 185 1.05 14 0.95 333 1.02 288 1.13 922 1.06 0.99—1.1354 Economically inactive 3033 1.03 4853 1.04 49 0.91 6256 1.03 13464 1.01 27655 1.02 1.01—1.03
1-54 All categories 5391 1.00 11160 1.00 209 1.00 11851 1.00 21201 1.00 49812 1.00 # REF. #
Obs = observed number of cases; SIR = standardised incidence ratio; 95% CI = 95% confidence interval
21 Index Prev Next

Acta Oncologica - Pukkala et al, 2008 Cardia cancer
Observed number of cardia cancer among men in the Nordic countries and standardised incidence ratios 1961-2005, by country andoccupational category
Denmark Finland Iceland Norway Sweden Total
No Occupational category Obs SIR Obs SIR Obs SIR Obs SIR Obs SIR Obs SIR 95% CI
1 Technical workers, etc 139 0.76 111 0.82 1 0.56 92 0.82 345 0.86 688 0.83 0.77—0.892 Laboratory assistants 1 0.27 3 0.90 1 2.87 9 1.61 2 0.91 16 1.06 0.60—1.723 Physicians 9 0.61 3 0.38 [0.71] 0.00 13 0.83 15 0.81 40 0.70 0.50—0.954 Dentists 6 1.38 [1.73] 0.00 [0.17] 0.00 [6.99] 0.00 8 0.90 14 0.63 0.35—1.065 Nurses [0.20] 0.00 [0.39] 0.00 [0.00] 0.00 [0.58] 0.00 1 0.85 1 0.42 0.01—2.366 Assistant nurses 4 0.92 2 5.80 [0.09] 0.00 4 1.47 11 1.73 21 1.51 0.94—2.317 "Other health workers" 13 0.99 10 1.26 [0.20] 0.00 7 1.16 15 0.99 45 1.06 0.77—1.428 Teachers 67 0.85 35 0.62 4 1.53 63 0.75 91 0.87 260 0.80 0.71—0.909 Religious workers etc 26 0.78 21 0.67 1 0.57 33 0.75 68 0.85 149 0.78 0.67—0.9210 Artistic workers 11 1.05 12 1.08 1 2.11 11 0.85 23 0.95 58 0.98 0.74—1.2711 Journalists [4.94] 0.00 6 1.09 [0.28] 0.00 3 0.54 11 0.99 20 0.73 0.44—1.1312 Administrators 173 0.85 70 0.79 7 1.61 128 0.81 131 0.89 509 0.84 0.77—0.9213 Clerical workers 73 0.81 41 0.68 3 0.60 87 0.75 136 0.85 340 0.79 0.71—0.8714 Sales agents 45 0.94 66 0.79 2 0.79 138 0.99 206 0.88 457 0.90 0.82—0.9915 Shop workers 186 0.90 25 0.73 [1.76] 0.00 47 0.91 68 0.89 326 0.88 0.79—0.9816 Farmers 411 1.05 478 1.05 5 0.69 378 0.92 380 1.03 1652 1.01 0.96—1.0617 Gardeners 52 0.93 51 0.85 [0.24] 0.00 83 0.85 147 1.05 333 0.94 0.84—1.0518 Fishermen 31 1.60 4 0.69 2 0.46 182 1.45 16 1.08 235 1.38 1.22—1.5719 Forestry workers 5 0.60 73 1.06 [0.04] 0.00 60 0.81 95 0.93 233 0.92 0.81—1.0520 Miners and quarry workers 1 0.38 12 1.09 [0.07] 0.00 25 1.26 33 1.30 71 1.20 0.94—1.5221 Seamen 38 1.81 13 0.89 1 0.86 118 1.22 22 0.97 192 1.23 1.07—1.4222 Transport workers 36 0.80 49 1.13 2 0.86 58 1.13 79 0.97 224 1.00 0.88—1.1423 Drivers 169 1.14 150 1.11 3 0.89 152 1.08 236 1.21 710 1.14 1.06—1.2324 Postal workers 27 0.95 23 1.09 [0.45] 0.00 25 0.89 29 0.69 104 0.87 0.72—1.0525 Textile workers 20 0.77 6 0.41 2 2.62 36 1.16 42 0.94 106 0.90 0.75—1.0926 Shoe and leather workers 6 0.93 4 0.61 [0.16] 0.00 12 0.89 23 1.36 45 1.03 0.75—1.3827 Smelting workers 67 1.13 32 1.46 [1.06] 0.00 39 0.95 59 0.82 197 1.01 0.88—1.1628 Mechanics 171 1.08 121 0.90 7 2.15 208 1.08 392 1.11 899 1.06 1.00—1.1429 Plumbers 15 1.06 25 1.13 [0.53] 0.00 25 1.14 50 1.23 115 1.16 0.96—1.3930 Welders – – 17 0.84 [0.20] 0.00 21 0.87 50 1.04 88 0.95 0.76—1.1731 Electrical workers 44 1.18 63 1.13 3 1.51 91 1.07 140 1.13 341 1.12 1.01—1.2432 Wood workers 97 0.90 159 1.03 3 1.61 243 1.04 223 0.99 725 1.01 0.94—1.0833 Painters 37 1.04 24 0.76 [0.75] 0.00 46 1.17 58 0.88 165 0.95 0.82—1.1134 "Other construction workers" 161 1.17 114 1.15 6 1.57 52 1.15 126 1.05 459 1.13 1.03—1.2435 Bricklayers 43 1.09 19 1.19 – – 25 1.08 46 1.57 133 1.24 1.04—1.4636 Printers 24 0.96 11 0.82 [0.61] 0.00 28 1.21 25 0.68 88 0.89 0.71—1.0937 Chemical process workers 34 1.46 29 1.26 [0.35] 0.00 55 1.04 79 1.48 197 1.29 1.12—1.4838 Food workers 84 1.12 15 0.89 5 1.66 79 1.33 62 1.11 245 1.17 1.03—1.3239 Beverage workers 17 1.80 3 2.56 [0.05] 0.00 [0.54] 0.00 5 1.70 25 1.77 1.14—2.6140 Tobacco workers 1 0.67 1 5.10 [0.00] 0.00 [0.93] 0.00 [0.26] 0.00 2 0.69 0.08—2.5041 Glass makers etc 49 1.10 23 0.95 [0.52] 0.00 23 0.82 64 1.05 159 1.01 0.86—1.1842 Packers 43 1.09 66 1.27 1 0.58 109 1.21 119 1.13 338 1.17 1.05—1.3043 Engine operators 42 1.06 70 1.06 2 0.88 60 1.25 101 1.07 275 1.10 0.98—1.2444 Public safety workers 34 0.93 39 0.98 3 1.86 29 0.77 67 1.20 172 1.00 0.86—1.1645 Cooks and stewards 3 1.01 1 0.43 2 2.60 10 0.62 6 0.59 22 0.68 0.43—1.0346 Domestic assistants [0.03] 0.00 [0.17] 0.00 [0.00] 0.00 [0.13] 0.00 2 2.11 2 1.55 0.19—5.6247 Waiters 9 1.39 2 0.90 [0.08] 0.00 7 0.99 4 0.76 22 1.04 0.65—1.5848 Building caretakers 47 1.18 47 1.35 [0.72] 0.00 23 1.18 44 1.07 161 1.18 1.01—1.3849 Chimney sweeps 4 3.89 2 0.78 – – 1 0.51 4 1.27 11 1.26 0.63—2.2650 Hairdressers 5 0.45 1 1.36 1 9.73 6 1.05 8 0.74 21 0.73 0.45—1.1251 Launderers 6 1.10 1 1.41 2 27.71 4 1.17 11 1.41 24 1.38 0.88—2.0552 Military personnel 23 1.23 8 0.70 – – 33 1.11 36 1.05 100 1.06 0.87—1.2953 "Other workers" 134 1.09 48 1.16 6 0.92 180 1.04 127 0.99 495 1.05 0.96—1.1454 Economically inactive 129 1.03 296 1.17 3 0.62 85 0.92 178 0.95 691 1.04 0.97—1.12
1-54 All categories 2872 1.00 2505 1.00 79 1.00 3246 1.00 4319 1.00 13021 1.00 # REF. #
Obs = observed number of cases; SIR = standardised incidence ratio; 95% CI = 95% confidence interval
22 Index Prev Next

Acta Oncologica - Pukkala et al, 2008 Cardia cancer
Observed number of cardia cancer among women in the Nordic countries and standardised incidence ratios 1961-2005, by country andoccupational category
Denmark Finland Iceland Norway Sweden Total
No Occupational category Obs SIR Obs SIR Obs SIR Obs SIR Obs SIR Obs SIR 95% CI
1 Technical workers, etc 3 1.18 [4.08] 0.00 [0.05] 0.00 1 0.72 7 1.27 11 0.81 0.40—1.452 Laboratory assistants 5 2.84 1 0.42 [0.08] 0.00 [1.89] 0.00 1 0.75 7 0.94 0.38—1.943 Physicians [0.83] 0.00 [0.95] 0.00 [0.01] 0.00 [0.79] 0.00 1 0.83 1 0.26 0.01—1.464 Dentists 1 1.33 [1.42] 0.00 [0.01] 0.00 1 1.39 3 2.99 5 1.28 0.42—2.995 Nurses 11 0.74 15 1.27 [0.38] 0.00 14 0.97 13 0.77 53 0.91 0.68—1.196 Assistant nurses 9 0.85 13 0.97 [0.50] 0.00 9 0.63 33 1.15 64 0.95 0.73—1.217 "Other health workers" 7 0.82 12 1.17 [0.11] 0.00 13 0.85 13 1.36 45 1.03 0.75—1.388 Teachers 14 0.77 21 0.87 [0.67] 0.00 21 0.73 33 0.89 89 0.82 0.66—1.009 Religious workers etc 1 0.40 14 1.44 [0.10] 0.00 4 0.57 6 0.50 25 0.79 0.51—1.1710 Artistic workers 3 2.23 1 0.54 [0.08] 0.00 3 1.31 2 0.84 9 1.13 0.52—2.1511 Journalists 1 3.55 2 1.64 [0.02] 0.00 [0.56] 0.00 2 1.84 5 1.58 0.51—3.6812 Administrators 5 0.62 7 1.67 [0.07] 0.00 4 0.51 4 0.73 20 0.78 0.48—1.2113 Clerical workers 86 1.14 57 0.75 3 1.54 69 0.73 85 0.93 300 0.88 0.79—0.9914 Sales agents 1 1.43 11 0.81 [0.21] 0.00 14 0.88 7 0.51 33 0.75 0.52—1.0515 Shop workers 52 0.98 31 0.69 [1.24] 0.00 78 0.94 67 1.11 228 0.94 0.83—1.0716 Farmers 31 0.85 38 0.98 1 1.03 67 1.07 5 0.94 142 0.98 0.84—1.1617 Gardeners 4 0.84 99 1.02 [0.03] 0.00 28 0.77 30 1.91 161 1.04 0.89—1.2218 Fishermen [0.18] 0.00 [0.19] 0.00 1 29.89 [0.41] 0.00 [0.05] 0.00 1 1.15 0.03—6.4119 Forestry workers [0.05] 0.00 [0.36] 0.00 [0.00] 0.00 1 1.61 1 3.02 2 1.46 0.18—5.2820 Miners and quarry workers [0.00] 0.00 1 5.45 [0.00] 0.00 [0.03] 0.00 [0.08] 0.00 1 3.40 0.09—18.9621 Seamen – – [0.03] 0.00 – – [0.09] 0.00 [0.01] 0.00 [0.13] 0.00 0.00—28.2622 Transport workers [0.05] 0.00 3 1.23 [0.03] 0.00 2 4.87 2 2.11 7 1.80 0.72—3.7123 Drivers 2 1.52 [0.94] 0.00 [0.01] 0.00 1 0.63 3 1.41 6 1.00 0.37—2.1824 Postal workers 2 0.71 11 0.78 [0.42] 0.00 19 0.98 15 0.90 47 0.88 0.64—1.1725 Textile workers 25 1.41 28 0.83 2 2.43 42 1.20 34 0.94 131 1.06 0.90—1.2626 Shoe and leather workers 2 1.54 4 0.99 [0.04] 0.00 3 1.23 2 0.73 11 1.04 0.52—1.8627 Smelting workers [0.32] 0.00 [0.95] 0.00 [0.00] 0.00 [0.20] 0.00 1 1.48 1 0.46 0.01—2.5928 Mechanics 4 1.30 4 1.00 [0.01] 0.00 4 1.48 10 1.44 22 1.32 0.82—1.9929 Plumbers [0.03] 0.00 [0.01] 0.00 – – 1 58.70 [0.01] 0.00 1 15.47 0.39—86.1830 Welders – – [0.27] 0.00 [0.00] 0.00 [0.15] 0.00 1 4.10 1 1.50 0.04—8.3831 Electrical workers 6 1.38 5 2.32 [0.01] 0.00 2 0.72 6 1.54 19 1.44 0.87—2.2632 Wood workers 3 2.08 9 1.05 [0.01] 0.00 1 1.13 2 1.76 15 1.24 0.70—2.0533 Painters [0.06] 0.00 1 1.05 [0.00] 0.00 [0.21] 0.00 [0.31] 0.00 1 0.65 0.02—3.6334 "Other construction workers" [0.05] 0.00 5 1.33 [0.00] 0.00 [0.08] 0.00 [0.04] 0.00 5 1.28 0.41—2.9835 Bricklayers [0.01] 0.00 1 9.11 – – [0.00] 0.00 [0.00] 0.00 1 8.09 0.20—45.1036 Printers 2 1.21 5 1.25 [0.07] 0.00 5 1.81 7 2.36 19 1.66 1.00—2.5937 Chemical process workers 3 1.14 4 1.84 [0.03] 0.00 3 1.23 5 2.08 15 1.55 0.87—2.5538 Food workers 14 1.10 14 1.22 2 1.25 20 1.23 3 0.41 53 1.07 0.80—1.4039 Beverage workers 4 3.20 [0.69] 0.00 [0.00] 0.00 [0.12] 0.00 1 2.15 5 1.98 0.64—4.6140 Tobacco workers 1 0.59 1 2.69 – – [0.61] 0.00 [0.28] 0.00 2 0.67 0.08—2.4341 Glass makers etc 2 0.65 7 0.90 [0.04] 0.00 9 1.76 3 0.47 21 0.94 0.58—1.4342 Packers 3 3.36 25 1.82 [0.17] 0.00 12 0.97 12 1.24 52 1.41 1.05—1.8543 Engine operators [0.02] 0.00 3 1.43 [0.00] 0.00 [0.14] 0.00 4 7.45 7 2.50 1.01—5.1544 Public safety workers 1 9.01 2 3.87 [0.03] 0.00 4 2.55 2 2.71 9 3.03 1.39—5.7545 Cooks and stewards [0.04] 0.00 19 1.18 [0.62] 0.00 26 1.33 22 1.52 67 1.32 1.02—1.6846 Domestic assistants 21 1.05 17 1.03 [0.19] 0.00 52 1.05 32 0.89 122 1.00 0.84—1.1947 Waiters 4 1.16 13 1.08 1 14.88 31 1.63 19 1.27 68 1.38 1.07—1.7448 Building caretakers 62 1.06 57 1.00 [1.27] 0.00 104 1.31 43 1.16 266 1.14 1.01—1.2849 Chimney sweeps [0.01] 0.00 [0.02] 0.00 – – [0.01] 0.00 [0.00] 0.00 [0.04] 0.00 0.00—90.7550 Hairdressers [3.37] 0.00 4 0.84 [0.07] 0.00 2 0.42 7 1.16 13 0.69 0.36—1.1751 Launderers 10 1.52 4 0.85 [0.20] 0.00 4 0.53 12 1.52 30 1.11 0.75—1.5952 Military personnel [0.03] 0.00 [0.03] 0.00 – – [0.02] 0.00 [0.02] 0.00 [0.10] 0.00 0.00—36.6053 "Other workers" 15 0.91 17 1.03 2 1.65 38 0.93 15 0.90 87 0.95 0.76—1.1754 Economically inactive 441 0.97 470 1.04 6 1.32 652 1.01 761 0.96 2330 0.99 0.95—1.03
1-54 All categories 861 1.00 1056 1.00 18 1.00 1364 1.00 1337 1.00 4636 1.00 # REF. #
Obs = observed number of cases; SIR = standardised incidence ratio; 95% CI = 95% confidence interval
23 Index Prev Next

Acta Oncologica - Pukkala et al, 2008 Cancer of the small intestine
Observed number of cancer of the small intestine among men in the Nordic countries and standardised incidence ratios 1961-2005, bycountry and occupational category
Denmark Finland Iceland Norway Sweden Total
No Occupational category Obs SIR Obs SIR Obs SIR Obs SIR Obs SIR Obs SIR 95% CI
1 Technical workers, etc 52 1.11 58 1.05 2 1.74 32 0.80 324 1.00 468 1.00 0.92—1.102 Laboratory assistants 1 1.06 2 1.46 [0.21] 0.00 1 0.54 2 1.15 6 0.98 0.36—2.143 Physicians 5 1.29 2 0.63 [0.41] 0.00 8 1.60 18 1.20 33 1.20 0.83—1.694 Dentists 2 1.80 [0.65] 0.00 [0.11] 0.00 [2.23] 0.00 7 0.97 9 0.80 0.36—1.515 Nurses [0.05] 0.00 1 4.78 [0.00] 0.00 [0.26] 0.00 [0.99] 0.00 1 0.66 0.02—3.696 Assistant nurses 1 0.90 1 5.05 [0.05] 0.00 2 2.44 5 0.94 9 1.20 0.55—2.277 "Other health workers" 2 0.59 4 1.31 [0.12] 0.00 3 1.58 15 1.21 24 1.15 0.74—1.718 Teachers 23 1.13 33 1.47 1 0.65 24 0.84 95 1.13 176 1.12 0.97—1.309 Religious workers etc 9 1.03 13 1.02 1 0.96 15 1.06 70 1.07 108 1.06 0.88—1.2810 Artistic workers 2 0.73 6 1.38 [0.28] 0.00 3 0.73 24 1.22 35 1.12 0.78—1.5611 Journalists [1.27] 0.00 3 1.41 [0.17] 0.00 2 1.10 11 1.20 16 1.10 0.63—1.7912 Administrators 48 0.90 47 1.40 1 0.41 55 1.13 143 1.18 294 1.13 1.01—1.2713 Clerical workers 22 0.94 21 0.97 5 1.80 39 1.05 155 1.18 242 1.12 0.99—1.2714 Sales agents 11 0.90 40 1.26 2 1.41 52 1.24 227 1.19 332 1.19 1.07—1.3315 Shop workers 60 1.11 8 0.58 1 1.02 20 1.17 77 1.25 166 1.12 0.97—1.3116 Farmers 73 0.70 129 0.91 2 0.52 92 0.84 244 0.78 540 0.81 0.74—0.8817 Gardeners 10 0.68 14 0.66 [0.12] 0.00 27 0.97 93 0.79 144 0.80 0.68—0.9418 Fishermen 10 2.02 3 1.60 4 1.48 35 0.99 8 0.65 60 1.05 0.80—1.3519 Forestry workers [2.19] 0.00 20 0.80 [0.02] 0.00 23 1.14 58 0.68 101 0.76 0.63—0.9320 Miners and quarry workers [0.68] 0.00 2 0.50 [0.04] 0.00 8 1.35 21 0.99 31 0.97 0.66—1.3821 Seamen 7 1.32 9 1.66 1 1.44 30 0.97 22 1.16 69 1.13 0.88—1.4322 Transport workers 11 0.95 13 0.82 [1.31] 0.00 17 1.07 66 1.02 107 0.98 0.81—1.1823 Drivers 39 1.03 54 1.04 1 0.50 57 1.29 175 1.10 326 1.10 0.99—1.2324 Postal workers 11 1.53 6 0.76 1 4.15 9 1.08 50 1.44 77 1.32 1.04—1.6525 Textile workers 13 1.91 4 0.80 1 2.52 10 1.13 48 1.28 76 1.30 1.02—1.6326 Shoe and leather workers 4 2.35 1 0.46 [0.08] 0.00 2 0.55 20 1.38 27 1.22 0.81—1.7827 Smelting workers 9 0.60 8 1.04 1 1.68 20 1.63 44 0.73 82 0.86 0.68—1.0728 Mechanics 41 1.01 54 1.04 2 1.03 55 0.89 279 0.96 431 0.97 0.88—1.0629 Plumbers 6 1.67 5 0.58 1 3.22 8 1.10 41 1.23 61 1.15 0.88—1.4730 Welders – – 7 0.82 [0.12] 0.00 14 1.65 39 1.01 60 1.08 0.82—1.3831 Electrical workers 13 1.38 19 0.85 1 0.81 34 1.23 113 1.12 180 1.11 0.96—1.2932 Wood workers 22 0.79 40 0.76 [1.06] 0.00 68 0.99 171 0.91 301 0.89 0.80—1.0033 Painters 9 0.98 10 0.89 [0.44] 0.00 6 0.53 57 1.04 82 0.94 0.75—1.1734 "Other construction workers" 41 1.15 35 1.02 5 2.21 14 1.00 99 0.98 194 1.04 0.90—1.1935 Bricklayers 7 0.69 4 0.73 – – 10 1.47 26 1.07 47 1.00 0.74—1.3436 Printers 7 1.10 6 1.12 1 2.64 8 1.10 32 1.06 54 1.09 0.82—1.4237 Chemical process workers 2 0.33 9 1.04 [0.19] 0.00 9 0.60 55 1.22 75 1.00 0.79—1.2638 Food workers 24 1.24 5 0.80 3 1.93 14 0.81 41 0.89 87 0.96 0.77—1.1839 Beverage workers 3 1.24 [0.41] 0.00 [0.02] 0.00 [0.24] 0.00 3 1.19 6 1.07 0.39—2.3340 Tobacco workers 2 5.06 [0.07] 0.00 [0.00] 0.00 1 3.95 [0.21] 0.00 3 3.21 0.66—9.3841 Glass makers etc 10 0.87 14 1.53 [0.28] 0.00 5 0.57 59 1.17 88 1.10 0.88—1.3642 Packers 9 0.87 27 1.46 1 1.10 20 0.77 76 0.85 133 0.92 0.77—1.0943 Engine operators 9 0.88 29 1.13 [1.34] 0.00 12 0.75 86 1.11 136 1.04 0.88—1.2344 Public safety workers 3 0.32 15 1.03 1 1.11 14 1.24 44 0.96 77 0.94 0.74—1.1745 Cooks and stewards 2 2.65 1 1.00 1 2.13 5 0.95 7 0.83 16 1.01 0.57—1.6346 Domestic assistants [0.01] 0.00 [0.06] 0.00 [0.00] 0.00 [0.05] 0.00 2 2.42 2 2.13 0.26—7.7147 Waiters 3 1.83 3 3.10 [0.05] 0.00 3 1.36 2 0.46 11 1.20 0.60—2.1448 Building caretakers 14 1.36 11 0.91 [0.36] 0.00 7 1.20 32 0.91 64 1.00 0.77—1.2849 Chimney sweeps [0.26] 0.00 1 1.12 – – 1 1.70 4 1.54 6 1.38 0.51—3.0150 Hairdressers 3 1.02 [0.26] 0.00 [0.06] 0.00 1 0.61 10 1.12 14 1.01 0.55—1.6951 Launderers 1 0.70 [0.26] 0.00 [0.03] 0.00 1 1.01 10 1.56 12 1.31 0.68—2.3052 Military personnel 5 1.06 2 0.39 – – 13 1.28 27 0.99 47 1.00 0.73—1.3253 "Other workers" 37 1.17 11 0.76 4 1.10 40 0.84 94 0.87 186 0.90 0.78—1.0454 Economically inactive 46 1.40 78 1.07 1 0.38 27 1.09 139 0.84 291 0.98 0.87—1.10
1-54 All categories 744 1.00 888 1.00 45 1.00 976 1.00 3570 1.00 6223 1.00 # REF. #
Obs = observed number of cases; SIR = standardised incidence ratio; 95% CI = 95% confidence interval
24 Index Prev Next

Acta Oncologica - Pukkala et al, 2008 Cancer of the small intestine
Observed number of cancer of the small intestine among women in the Nordic countries and standardised incidence ratios 1961-2005,by country and occupational category
Denmark Finland Iceland Norway Sweden Total
No Occupational category Obs SIR Obs SIR Obs SIR Obs SIR Obs SIR Obs SIR 95% CI
1 Technical workers, etc 4 2.01 3 0.67 [0.08] 0.00 1 0.70 13 1.06 21 1.04 0.64—1.582 Laboratory assistants 1 0.71 4 1.59 [0.13] 0.00 [1.77] 0.00 1 0.32 6 0.67 0.25—1.463 Physicians 1 1.52 2 1.81 [0.02] 0.00 1 1.40 2 0.73 6 1.14 0.42—2.494 Dentists 1 1.70 3 2.56 [0.01] 0.00 [0.59] 0.00 5 2.27 9 1.97 0.90—3.745 Nurses 16 1.37 14 1.09 1 1.61 16 1.14 35 0.94 82 1.07 0.85—1.336 Assistant nurses 12 1.43 12 0.94 [0.82] 0.00 22 1.56 71 1.10 117 1.16 0.97—1.397 "Other health workers" 5 0.75 11 1.09 [0.18] 0.00 14 1.01 22 1.02 52 0.99 0.74—1.308 Teachers 16 1.10 26 1.12 1 0.95 19 0.73 88 1.05 150 1.01 0.86—1.189 Religious workers etc 4 2.02 13 1.12 [0.16] 0.00 4 0.62 30 1.12 51 1.08 0.81—1.4210 Artistic workers [1.05] 0.00 2 1.05 [0.14] 0.00 1 0.52 5 0.94 8 0.77 0.33—1.5211 Journalists [0.22] 0.00 3 2.46 [0.03] 0.00 [0.53] 0.00 4 1.63 7 1.57 0.63—3.2412 Administrators 6 0.96 3 0.73 [0.11] 0.00 11 1.73 14 1.17 34 1.18 0.82—1.6513 Clerical workers 62 1.04 76 1.01 2 0.61 77 0.93 210 1.01 427 1.00 0.91—1.0914 Sales agents [0.54] 0.00 9 0.82 [0.36] 0.00 16 1.44 27 0.91 52 0.99 0.74—1.2915 Shop workers 37 0.90 27 0.68 [2.09] 0.00 69 1.00 137 1.04 270 0.95 0.84—1.0716 Farmers 26 0.91 15 0.62 3 1.96 44 0.97 11 0.94 99 0.89 0.72—1.0817 Gardeners 3 0.81 74 1.05 [0.05] 0.00 28 1.03 34 0.98 139 1.02 0.86—1.2118 Fishermen [0.14] 0.00 [0.16] 0.00 [0.05] 0.00 [0.36] 0.00 [0.11] 0.00 [0.82] 0.00 0.00—4.5019 Forestry workers [0.04] 0.00 [0.31] 0.00 [0.01] 0.00 2 3.83 [0.73] 0.00 2 1.24 0.15—4.4920 Miners and quarry workers [0.00] 0.00 [0.13] 0.00 [0.00] 0.00 [0.03] 0.00 [0.17] 0.00 [0.33] 0.00 0.00—11.1121 Seamen – – [0.04] 0.00 [0.00] 0.00 1 12.11 [0.02] 0.00 1 7.20 0.18—40.1222 Transport workers [0.04] 0.00 1 0.52 [0.05] 0.00 1 2.63 1 0.49 3 0.68 0.14—1.9723 Drivers 2 1.95 1 1.07 [0.03] 0.00 [1.39] 0.00 6 1.21 9 1.08 0.49—2.0524 Postal workers 2 0.92 11 0.93 2 2.73 13 0.82 48 1.28 76 1.11 0.88—1.3925 Textile workers 8 0.58 34 1.27 [1.23] 0.00 26 1.06 76 0.98 144 1.00 0.85—1.1826 Shoe and leather workers 1 0.99 2 0.60 [0.06] 0.00 2 1.13 7 1.18 12 0.99 0.51—1.7427 Smelting workers [0.25] 0.00 [0.77] 0.00 [0.00] 0.00 [0.21] 0.00 4 2.58 4 1.43 0.39—3.6728 Mechanics 5 2.08 6 1.70 [0.01] 0.00 2 0.90 14 0.89 27 1.13 0.75—1.6529 Plumbers [0.02] 0.00 [0.01] 0.00 – – [0.02] 0.00 [0.02] 0.00 [0.07] 0.00 0.00—52.8530 Welders – – [0.28] 0.00 [0.00] 0.00 [0.17] 0.00 [0.57] 0.00 [1.02] 0.00 0.00—3.6031 Electrical workers 5 1.48 2 0.87 [0.01] 0.00 1 0.42 5 0.57 13 0.77 0.41—1.3232 Wood workers [1.12] 0.00 8 1.19 [0.02] 0.00 1 1.22 3 1.16 12 1.06 0.55—1.8633 Painters [0.04] 0.00 [0.79] 0.00 [0.01] 0.00 1 5.48 [0.70] 0.00 1 0.58 0.01—3.2334 "Other construction workers" [0.03] 0.00 1 0.38 [0.00] 0.00 [0.07] 0.00 [0.08] 0.00 1 0.35 0.01—1.9535 Bricklayers [0.01] 0.00 [0.09] 0.00 – – [0.00] 0.00 [0.00] 0.00 [0.11] 0.00 0.00—34.6936 Printers 2 1.55 3 0.88 [0.11] 0.00 [2.12] 0.00 5 0.75 10 0.74 0.35—1.3537 Chemical process workers 3 1.47 2 1.15 [0.05] 0.00 4 2.11 9 1.70 18 1.63 0.97—2.5838 Food workers 10 1.01 14 1.55 3 1.18 10 0.83 21 1.31 58 1.17 0.89—1.5139 Beverage workers [0.96] 0.00 1 1.99 [0.01] 0.00 [0.11] 0.00 [1.01] 0.00 1 0.39 0.01—2.1540 Tobacco workers 4 3.04 2 7.01 – – [0.41] 0.00 [0.64] 0.00 6 2.27 0.83—4.9341 Glass makers etc 2 0.83 2 0.31 [0.07] 0.00 2 0.49 9 0.64 15 0.55 0.31—0.9142 Packers 1 1.44 14 1.24 1 3.94 13 1.32 23 1.09 52 1.20 0.90—1.5843 Engine operators [0.02] 0.00 2 1.09 [0.00] 0.00 [0.14] 0.00 1 0.78 3 0.91 0.19—2.6744 Public safety workers [0.08] 0.00 [0.44] 0.00 [0.04] 0.00 [1.21] 0.00 2 1.22 2 0.59 0.07—2.1245 Cooks and stewards [0.03] 0.00 14 1.10 2 2.16 16 1.19 34 1.10 66 1.14 0.88—1.4546 Domestic assistants 19 1.23 11 0.80 [0.27] 0.00 35 0.99 73 0.91 138 0.95 0.81—1.1347 Waiters 2 0.75 11 1.02 [0.10] 0.00 16 1.07 32 1.00 61 1.01 0.77—1.2948 Building caretakers 39 0.86 34 0.78 1 0.53 65 1.01 88 1.07 227 0.96 0.84—1.0949 Chimney sweeps [0.00] 0.00 [0.02] 0.00 – – [0.01] 0.00 [0.00] 0.00 [0.04] 0.00 0.00—103.9650 Hairdressers 3 1.12 3 0.72 [0.10] 0.00 5 1.30 13 0.98 24 1.00 0.64—1.4851 Launderers 4 0.79 3 0.88 [0.30] 0.00 4 0.74 18 1.07 29 0.93 0.63—1.3452 Military personnel [0.03] 0.00 1 21.70 – – [0.02] 0.00 [0.05] 0.00 1 7.26 0.18—40.4753 "Other workers" 9 0.70 17 1.26 2 1.02 28 0.84 36 0.98 92 0.94 0.75—1.1554 Economically inactive 351 1.01 303 1.03 10 1.54 409 1.01 1696 0.98 2769 1.00 0.96—1.04
1-54 All categories 666 1.00 800 1.00 28 1.00 980 1.00 2933 1.00 5407 1.00 # REF. #
Obs = observed number of cases; SIR = standardised incidence ratio; 95% CI = 95% confidence interval
25 Index Prev Next

Acta Oncologica - Pukkala et al, 2008 Colon cancer
Observed number of colon cancer among men in the Nordic countries and standardised incidence ratios 1961-2005, by country andoccupational category
Denmark Finland Iceland Norway Sweden Total
No Occupational category Obs SIR Obs SIR Obs SIR Obs SIR Obs SIR Obs SIR 95% CI
1 Technical workers, etc 1514 1.10 855 1.21 12 0.92 956 1.02 4518 1.08 7855 1.09 1.06—1.112 Laboratory assistants 23 0.85 14 0.82 2 0.81 59 1.29 13 0.75 111 1.01 0.84—1.223 Physicians 139 1.20 57 1.40 6 1.11 139 1.11 202 1.08 543 1.14 1.05—1.244 Dentists 38 1.16 8 0.93 2 1.56 63 1.12 106 1.11 217 1.12 0.98—1.285 Nurses 1 0.67 2 0.96 [0.02] 0.00 5 1.10 10 1.30 18 1.14 0.67—1.806 Assistant nurses 38 1.17 1 0.56 [0.57] 0.00 21 0.97 54 0.86 114 0.95 0.79—1.157 "Other health workers" 85 0.86 36 0.91 2 1.39 44 0.93 171 1.07 338 0.97 0.88—1.088 Teachers 597 0.99 297 1.00 22 1.13 685 1.00 1094 1.03 2695 1.01 0.97—1.059 Religious workers etc 308 1.18 192 1.22 19 1.49 394 1.11 962 1.20 1875 1.18 1.13—1.2410 Artistic workers 82 1.03 71 1.25 5 1.42 121 1.16 275 1.09 554 1.11 1.02—1.2111 Journalists 51 1.37 34 1.24 2 1.02 40 0.89 139 1.19 266 1.16 1.03—1.3112 Administrators 1875 1.19 615 1.36 33 0.97 1502 1.19 1946 1.17 5971 1.20 1.17—1.2313 Clerical workers 767 1.13 337 1.13 48 1.26 1051 1.11 1992 1.13 4195 1.13 1.09—1.1614 Sales agents 450 1.27 495 1.17 21 1.09 1268 1.16 2805 1.10 5039 1.14 1.11—1.1715 Shop workers 1760 1.11 202 1.14 24 1.82 437 1.04 857 1.05 3280 1.09 1.05—1.1316 Farmers 2143 0.68 1692 0.80 28 0.49 2439 0.77 3724 0.80 10026 0.76 0.75—0.7817 Gardeners 321 0.72 253 0.85 2 1.13 623 0.80 1408 0.84 2607 0.81 0.78—0.8518 Fishermen 154 1.09 22 0.80 32 1.06 892 0.91 171 0.95 1271 0.94 0.89—0.9919 Forestry workers 43 0.66 206 0.60 [0.28] 0.00 452 0.79 942 0.77 1643 0.75 0.71—0.7820 Miners and quarry workers 18 0.92 56 1.03 1 1.98 155 0.99 264 0.90 494 0.94 0.86—1.0321 Seamen 195 1.31 91 1.24 13 1.50 813 1.05 285 1.12 1397 1.11 1.05—1.1722 Transport workers 346 1.02 262 1.19 14 0.78 451 1.08 888 1.01 1961 1.04 1.00—1.0923 Drivers 1139 1.06 766 1.11 27 1.07 1280 1.15 2217 1.07 5429 1.09 1.06—1.1224 Postal workers 189 0.91 130 1.23 4 1.21 257 1.19 498 1.07 1078 1.08 1.02—1.1525 Textile workers 178 0.90 99 1.39 6 1.03 259 1.05 586 1.09 1128 1.07 1.01—1.1326 Shoe and leather workers 54 1.10 26 0.84 [1.25] 0.00 120 1.17 257 1.19 457 1.14 1.04—1.2527 Smelting workers 440 1.04 123 1.15 6 0.75 351 1.09 809 0.97 1729 1.02 0.97—1.0728 Mechanics 1180 1.02 716 1.05 10 0.42 1677 1.08 3803 1.00 7386 1.02 1.00—1.0529 Plumbers 117 1.15 108 0.96 3 0.75 189 1.07 496 1.13 913 1.09 1.03—1.1730 Welders – – 101 0.96 [1.44] 0.00 187 0.93 457 0.94 745 0.94 0.87—1.0131 Electrical workers 288 1.08 296 1.03 13 0.92 722 1.05 1296 1.01 2615 1.03 0.99—1.0732 Wood workers 740 0.91 661 0.89 9 0.63 1731 0.93 2337 0.88 5478 0.90 0.88—0.9333 Painters 260 0.99 162 1.05 7 1.20 324 1.06 757 1.00 1510 1.02 0.97—1.0734 "Other construction workers" 941 0.92 417 0.88 32 1.14 345 0.97 1387 0.98 3122 0.95 0.92—0.9835 Bricklayers 295 1.01 61 0.79 – – 164 0.90 328 0.96 848 0.95 0.88—1.0136 Printers 232 1.28 77 1.13 4 0.87 215 1.19 430 1.08 958 1.15 1.08—1.2337 Chemical process workers 188 1.08 101 0.87 1 0.38 384 0.95 595 0.94 1269 0.95 0.90—1.0138 Food workers 499 0.90 87 1.03 22 0.99 454 0.98 610 0.96 1672 0.95 0.90—0.9939 Beverage workers 88 1.32 6 1.06 [0.37] 0.00 3 0.66 45 1.25 142 1.25 1.06—1.4840 Tobacco workers 16 1.40 1 0.99 [0.03] 0.00 10 1.45 2 0.72 29 1.31 0.88—1.8841 Glass makers etc 291 0.88 109 0.90 4 1.03 252 1.14 662 0.96 1318 0.97 0.91—1.0242 Packers 304 1.03 269 1.07 10 0.77 811 1.18 1294 1.03 2688 1.07 1.03—1.1143 Engine operators 288 0.98 355 1.05 21 1.25 386 1.01 1076 1.05 2126 1.03 0.99—1.0844 Public safety workers 341 1.21 218 1.11 14 1.16 332 1.11 730 1.23 1635 1.18 1.13—1.2445 Cooks and stewards 21 1.01 15 1.28 5 0.90 107 0.83 111 1.09 259 0.96 0.85—1.0946 Domestic assistants [0.23] 0.00 [0.88] 0.00 [0.02] 0.00 [1.05] 0.00 11 1.45 11 1.13 0.56—2.0147 Waiters 67 1.54 7 0.63 [0.58] 0.00 84 1.51 62 1.17 220 1.34 1.18—1.5348 Building caretakers 292 0.98 169 1.01 9 1.62 164 1.10 554 1.15 1188 1.08 1.02—1.1449 Chimney sweeps 20 2.71 15 1.25 – – 23 1.50 46 1.36 104 1.52 1.25—1.8450 Hairdressers 84 0.98 2 0.60 [0.82] 0.00 39 0.88 149 1.19 274 1.06 0.94—1.1951 Launderers 46 1.10 4 1.16 1 1.88 26 0.98 90 1.01 167 1.03 0.89—1.2052 Military personnel 166 1.20 70 1.11 – – 265 1.05 401 1.13 902 1.12 1.05—1.1953 "Other workers" 920 1.04 182 0.93 56 1.12 1252 0.95 1408 0.92 3818 0.96 0.93—0.9954 Economically inactive 995 1.13 1007 0.98 38 1.13 561 0.87 2167 0.97 4768 0.99 0.96—1.02
1-54 All categories 21627 1.00 12158 1.00 590 1.00 25584 1.00 48497 1.00 108456 1.00 # REF. #
Obs = observed number of cases; SIR = standardised incidence ratio; 95% CI = 95% confidence interval
26 Index Prev Next

Acta Oncologica - Pukkala et al, 2008 Colon cancer
Observed number of colon cancer among women in the Nordic countries and standardised incidence ratios 1961-2005, by country andoccupational category
Denmark Finland Iceland Norway Sweden Total
No Occupational category Obs SIR Obs SIR Obs SIR Obs SIR Obs SIR Obs SIR 95% CI
1 Technical workers, etc 77 1.06 88 1.22 1 0.94 32 0.94 203 1.03 401 1.06 0.97—1.172 Laboratory assistants 49 0.99 42 1.01 2 1.22 40 0.88 30 0.74 163 0.91 0.78—1.063 Physicians 21 0.85 17 0.98 [0.36] 0.00 21 1.13 50 1.20 109 1.07 0.88—1.294 Dentists 23 1.06 21 0.96 1 8.14 21 1.28 38 1.04 104 1.08 0.89—1.305 Nurses 428 0.98 210 1.00 4 0.46 352 0.98 620 1.01 1614 0.99 0.94—1.046 Assistant nurses 302 1.00 219 0.97 13 1.05 379 1.04 995 0.97 1908 0.99 0.94—1.037 "Other health workers" 239 0.95 182 1.04 1 0.42 376 1.03 325 0.96 1123 0.99 0.93—1.058 Teachers 563 1.06 432 1.07 11 0.73 678 1.00 1338 0.98 3022 1.01 0.97—1.059 Religious workers etc 68 0.93 185 1.05 5 2.13 186 1.09 393 0.95 837 1.00 0.93—1.0710 Artistic workers 33 0.82 35 1.11 3 1.58 44 0.82 80 0.94 195 0.92 0.80—1.0611 Journalists 15 1.88 17 0.82 [0.46] 0.00 10 0.74 32 0.82 74 0.91 0.71—1.1412 Administrators 262 1.11 62 0.91 [1.68] 0.00 190 1.08 236 1.19 750 1.11 1.03—1.1913 Clerical workers 2297 1.06 1424 1.11 57 1.21 2398 1.06 3709 1.10 9885 1.08 1.06—1.1014 Sales agents 27 1.31 214 1.05 9 1.62 346 1.02 559 1.06 1155 1.05 0.99—1.1215 Shop workers 1556 1.01 770 1.06 32 1.00 2057 1.04 2456 1.06 6871 1.04 1.01—1.0616 Farmers 942 0.87 424 0.82 14 0.55 1286 0.90 174 0.82 2840 0.87 0.84—0.9017 Gardeners 113 0.81 1197 0.84 3 3.46 749 0.87 602 0.97 2664 0.88 0.84—0.9118 Fishermen 8 1.48 5 1.68 1 1.31 3 0.30 2 1.00 19 0.90 0.54—1.4119 Forestry workers 3 2.14 2 0.35 [0.10] 0.00 15 0.96 12 0.95 32 0.90 0.62—1.2720 Miners and quarry workers [0.09] 0.00 1 0.39 [0.03] 0.00 [0.68] 0.00 1 0.35 2 0.32 0.04—1.1721 Seamen – – 1 1.70 [0.00] 0.00 1 0.44 [0.26] 0.00 2 0.64 0.08—2.3222 Transport workers [1.54] 0.00 46 1.23 1 1.07 13 1.32 35 1.02 95 1.13 0.92—1.3823 Drivers 34 0.91 18 1.14 [0.35] 0.00 34 0.90 74 0.95 160 0.94 0.81—1.1024 Postal workers 105 1.30 234 1.05 13 1.16 480 1.07 652 1.03 1484 1.06 1.01—1.1225 Textile workers 516 1.02 548 1.07 15 0.67 872 1.15 1523 1.06 3474 1.08 1.04—1.1126 Shoe and leather workers 29 0.79 61 0.98 [1.17] 0.00 44 0.82 112 1.03 246 0.94 0.83—1.0627 Smelting workers 8 0.89 11 0.75 [0.05] 0.00 5 0.96 21 0.84 45 0.84 0.61—1.1228 Mechanics 96 1.12 57 0.90 [0.17] 0.00 63 1.00 260 1.00 476 1.01 0.92—1.1129 Plumbers [1.02] 0.00 [0.13] 0.00 – – 1 2.41 [0.28] 0.00 1 0.54 0.01—3.0230 Welders – – 2 0.44 [0.01] 0.00 7 1.76 5 0.60 14 0.82 0.45—1.3831 Electrical workers 133 1.11 41 1.08 [0.17] 0.00 72 1.08 122 0.85 368 1.00 0.90—1.1132 Wood workers 49 1.21 103 0.79 [0.33] 0.00 19 0.87 35 0.84 206 0.88 0.77—1.0133 Painters 1 0.65 21 1.41 [0.09] 0.00 8 1.55 8 0.69 38 1.14 0.81—1.5634 "Other construction workers" 2 1.58 52 0.96 [0.05] 0.00 3 1.50 1 0.83 58 0.98 0.75—1.2735 Bricklayers [0.26] 0.00 [1.81] 0.00 – – [0.10] 0.00 [0.03] 0.00 [2.21] 0.00 0.00—1.6736 Printers 57 1.23 77 1.23 1 0.59 60 0.99 132 1.16 327 1.15 1.03—1.2837 Chemical process workers 80 1.08 38 1.15 3 3.73 73 1.32 98 1.06 292 1.14 1.02—1.2838 Food workers 350 0.96 170 0.97 43 1.02 370 1.01 285 0.98 1218 0.98 0.93—1.0439 Beverage workers 36 1.05 4 0.40 [0.10] 0.00 5 1.61 21 1.12 66 0.99 0.77—1.2740 Tobacco workers 43 0.92 8 1.41 – – 10 0.80 10 0.92 71 0.93 0.73—1.1841 Glass makers etc 91 1.06 122 1.02 [1.12] 0.00 121 1.02 286 1.17 620 1.09 1.01—1.1842 Packers 31 1.23 224 1.05 4 0.92 308 1.06 372 1.00 939 1.04 0.97—1.1043 Engine operators 1 1.66 28 0.84 [0.06] 0.00 4 1.16 13 0.69 46 0.82 0.60—1.0944 Public safety workers 3 0.99 7 0.89 [0.86] 0.00 43 1.15 26 1.06 79 1.07 0.85—1.3445 Cooks and stewards 2 2.01 261 1.08 28 1.66 467 1.11 502 0.87 1260 1.00 0.95—1.0646 Domestic assistants 554 0.96 241 0.97 6 1.17 1009 0.93 1319 0.96 3129 0.95 0.92—0.9947 Waiters 108 1.14 230 1.18 3 1.70 488 1.11 579 0.99 1408 1.07 1.02—1.1348 Building caretakers 1553 0.93 764 0.91 38 1.13 1791 0.95 1435 0.98 5581 0.95 0.92—0.9749 Chimney sweeps [0.20] 0.00 1 2.62 – – [0.28] 0.00 [0.02] 0.00 1 1.13 0.03—6.3050 Hairdressers 95 0.97 86 1.16 [1.49] 0.00 126 1.15 243 1.08 550 1.08 1.00—1.1851 Launderers 193 1.02 55 0.80 2 0.35 149 0.89 324 1.02 723 0.97 0.90—1.0452 Military personnel [0.98] 0.00 2 3.46 – – 1 2.22 [0.57] 0.00 3 1.17 0.24—3.4153 "Other workers" 472 1.00 244 0.96 31 0.96 916 0.96 693 1.08 2356 1.00 0.96—1.0454 Economically inactive 13154 1.00 6086 1.01 115 1.00 12539 0.99 31314 0.99 63208 0.99 0.99—1.00
1-54 All categories 24822 1.00 15390 1.00 460 1.00 29285 1.00 52355 1.00 122312 1.00 # REF. #
Obs = observed number of cases; SIR = standardised incidence ratio; 95% CI = 95% confidence interval
27 Index Prev Next

Acta Oncologica - Pukkala et al, 2008 Rectal cancer
Observed number of rectal cancer among men in the Nordic countries and standardised incidence ratios 1961-2005, by country andoccupational category
Denmark Finland Iceland Norway Sweden Total
No Occupational category Obs SIR Obs SIR Obs SIR Obs SIR Obs SIR Obs SIR 95% CI
1 Technical workers, etc 954 1.00 643 1.13 4 0.85 523 0.91 2915 0.99 5039 1.00 0.97—1.032 Laboratory assistants 21 1.11 11 0.79 2 2.16 33 1.18 17 1.28 84 1.12 0.89—1.383 Physicians 74 0.92 23 0.69 3 1.54 53 0.69 125 0.95 278 0.86 0.76—0.974 Dentists 24 1.05 4 0.57 [0.43] 0.00 40 1.17 66 1.00 134 1.02 0.86—1.215 Nurses [1.03] 0.00 3 1.83 [0.01] 0.00 1 0.34 5 0.83 9 0.77 0.35—1.466 Assistant nurses 21 0.93 2 1.40 [0.21] 0.00 11 0.84 36 0.80 70 0.85 0.66—1.087 "Other health workers" 70 1.01 47 1.45 1 1.87 25 0.86 96 0.86 239 0.99 0.87—1.128 Teachers 358 0.86 223 0.92 7 0.99 371 0.88 646 0.86 1605 0.87 0.83—0.929 Religious workers etc 195 1.07 146 1.13 6 1.28 224 1.04 527 0.93 1098 1.00 0.94—1.0610 Artistic workers 59 1.06 59 1.27 1 0.78 78 1.23 164 0.92 361 1.05 0.94—1.1611 Journalists 24 0.93 27 1.19 [0.71] 0.00 26 0.94 72 0.88 149 0.94 0.80—1.1012 Administrators 1153 1.05 398 1.08 12 0.97 839 1.09 1210 1.05 3612 1.07 1.03—1.1013 Clerical workers 438 0.92 269 1.10 16 1.15 580 1.01 1300 1.06 2603 1.03 0.99—1.0714 Sales agents 252 1.02 379 1.09 6 0.84 752 1.13 1996 1.13 3385 1.11 1.08—1.1515 Shop workers 1135 1.03 165 1.14 3 0.62 275 1.07 577 1.01 2155 1.03 0.99—1.0816 Farmers 1764 0.81 1563 0.89 12 0.58 1544 0.81 2753 0.88 7636 0.85 0.83—0.8717 Gardeners 275 0.89 204 0.84 [0.65] 0.00 427 0.91 1129 0.98 2035 0.94 0.90—0.9818 Fishermen 107 1.07 14 0.62 14 1.28 526 0.88 130 1.06 791 0.93 0.87—1.0019 Forestry workers 38 0.83 215 0.76 [0.10] 0.00 298 0.86 761 0.91 1312 0.87 0.82—0.9220 Miners and quarry workers 13 0.94 46 1.03 [0.18] 0.00 77 0.80 170 0.84 306 0.86 0.76—0.9621 Seamen 114 1.09 67 1.11 [3.18] 0.00 517 1.09 187 1.06 885 1.08 1.01—1.1522 Transport workers 231 0.98 186 1.04 5 0.76 280 1.11 629 1.04 1331 1.04 0.99—1.1023 Drivers 815 1.08 636 1.12 10 1.09 785 1.14 1509 1.04 3755 1.08 1.05—1.1224 Postal workers 126 0.87 89 1.03 [1.23] 0.00 151 1.14 321 0.99 687 1.00 0.93—1.0825 Textile workers 178 1.28 56 0.95 1 0.46 154 1.04 394 1.07 783 1.10 1.02—1.1726 Shoe and leather workers 39 1.13 25 0.97 2 4.27 74 1.19 159 1.09 299 1.11 0.99—1.2427 Smelting workers 309 1.03 86 0.97 2 0.67 213 1.08 575 1.00 1185 1.02 0.96—1.0828 Mechanics 806 0.99 550 0.99 10 1.15 1003 1.05 2628 0.99 4997 1.00 0.97—1.0329 Plumbers 93 1.30 101 1.09 [1.43] 0.00 130 1.19 329 1.07 653 1.12 1.04—1.2130 Welders – – 77 0.89 [0.53] 0.00 141 1.14 378 1.10 596 1.08 0.99—1.1631 Electrical workers 209 1.11 215 0.92 4 0.77 436 1.03 925 1.02 1789 1.02 0.97—1.0732 Wood workers 561 0.99 603 0.99 6 1.14 1096 0.97 1722 0.95 3988 0.97 0.94—1.0033 Painters 220 1.20 123 0.96 4 1.84 201 1.08 583 1.12 1131 1.11 1.05—1.1834 "Other construction workers" 705 0.97 402 1.02 13 1.27 222 1.01 962 0.99 2304 0.99 0.95—1.0335 Bricklayers 237 1.15 71 1.12 – – 126 1.13 264 1.12 698 1.13 1.05—1.2236 Printers 129 1.01 63 1.11 1 0.58 133 1.19 315 1.13 641 1.11 1.03—1.2037 Chemical process workers 140 1.14 91 0.96 1 1.03 281 1.13 455 1.05 968 1.07 1.01—1.1438 Food workers 388 0.99 68 0.98 11 1.35 284 1.00 510 1.16 1261 1.06 1.00—1.1239 Beverage workers 71 1.49 4 0.86 [0.13] 0.00 5 1.69 32 1.29 112 1.40 1.16—1.6840 Tobacco workers 6 0.74 1 1.19 [0.01] 0.00 2 0.47 3 1.55 12 0.79 0.41—1.3841 Glass makers etc 251 1.08 103 1.04 2 1.41 144 1.05 481 1.01 981 1.04 0.97—1.1042 Packers 216 1.03 241 1.15 7 1.47 501 1.18 953 1.10 1918 1.12 1.07—1.1743 Engine operators 236 1.14 291 1.05 8 1.32 267 1.12 707 0.99 1509 1.05 0.99—1.1044 Public safety workers 213 1.09 183 1.14 5 1.15 212 1.17 442 1.06 1055 1.10 1.04—1.1745 Cooks and stewards 13 0.88 16 1.70 3 1.47 91 1.15 82 1.13 205 1.15 1.00—1.3246 Domestic assistants 1 6.14 2 2.92 [0.00] 0.00 2 3.09 3 0.53 8 1.12 0.48—2.2147 Waiters 51 1.62 6 0.67 [0.21] 0.00 57 1.66 45 1.19 159 1.41 1.21—1.6548 Building caretakers 220 1.05 138 1.00 5 2.41 93 1.00 330 0.99 786 1.01 0.94—1.0949 Chimney sweeps 5 0.97 12 1.19 – – 10 1.06 24 1.01 51 1.05 0.78—1.3850 Hairdressers 64 1.07 2 0.70 [0.29] 0.00 24 0.89 110 1.28 200 1.13 0.99—1.3051 Launderers 29 0.99 2 0.69 [0.20] 0.00 16 0.98 51 0.83 98 0.89 0.72—1.0852 Military personnel 118 1.24 45 0.88 – – 162 1.06 243 0.99 568 1.04 0.96—1.1353 "Other workers" 689 1.10 160 0.98 16 0.87 793 0.99 1121 1.06 2779 1.04 1.00—1.0854 Economically inactive 698 1.07 911 1.00 13 1.04 320 0.80 1419 0.91 3361 0.95 0.92—0.98
1-54 All categories 15156 1.00 10067 1.00 216 1.00 15629 1.00 33586 1.00 74654 1.00 # REF. #
Obs = observed number of cases; SIR = standardised incidence ratio; 95% CI = 95% confidence interval
28 Index Prev Next

Acta Oncologica - Pukkala et al, 2008 Rectal cancer
Observed number of rectal cancer among women in the Nordic countries and standardised incidence ratios 1961-2005, by country andoccupational category
Denmark Finland Iceland Norway Sweden Total
No Occupational category Obs SIR Obs SIR Obs SIR Obs SIR Obs SIR Obs SIR 95% CI
1 Technical workers, etc 42 1.30 51 1.15 [0.48] 0.00 10 0.66 112 1.05 215 1.08 0.94—1.232 Laboratory assistants 14 0.63 22 0.86 1 1.39 15 0.75 28 1.09 80 0.85 0.67—1.063 Physicians 7 0.65 12 1.12 1 7.32 7 0.86 26 1.10 53 0.99 0.74—1.304 Dentists 10 1.04 21 1.61 [0.05] 0.00 9 1.27 19 0.98 59 1.20 0.91—1.555 Nurses 176 0.91 141 1.09 2 0.56 139 0.88 287 0.87 745 0.92 0.85—0.996 Assistant nurses 121 0.90 128 0.93 3 0.59 145 0.91 576 1.02 973 0.97 0.91—1.047 "Other health workers" 102 0.92 121 1.13 [1.02] 0.00 175 1.10 182 0.97 580 1.03 0.95—1.118 Teachers 218 0.93 216 0.88 3 0.49 282 0.95 729 0.99 1448 0.95 0.90—1.009 Religious workers etc 32 0.99 109 0.99 1 1.06 65 0.87 216 0.93 423 0.94 0.85—1.0310 Artistic workers 18 1.03 16 0.83 [0.80] 0.00 19 0.82 50 1.07 103 0.96 0.79—1.1711 Journalists 4 1.12 10 0.79 1 5.12 5 0.84 20 0.94 40 0.92 0.65—1.2512 Administrators 106 1.02 39 0.93 [0.67] 0.00 71 0.93 110 1.03 326 0.99 0.89—1.1013 Clerical workers 1028 1.07 898 1.15 20 1.01 1093 1.12 1871 1.03 4910 1.08 1.05—1.1114 Sales agents 15 1.66 122 0.99 1 0.46 164 1.14 297 1.09 599 1.09 1.01—1.1815 Shop workers 718 1.06 453 1.03 16 1.24 899 1.06 1259 1.06 3345 1.05 1.02—1.0916 Farmers 417 0.88 279 0.92 10 1.03 469 0.78 100 0.92 1275 0.85 0.81—0.9017 Gardeners 59 0.96 752 0.89 1 3.00 327 0.91 302 0.96 1441 0.91 0.87—0.9618 Fishermen 2 0.84 2 1.13 [0.31] 0.00 3 0.71 [1.02] 0.00 7 0.72 0.29—1.4819 Forestry workers [0.62] 0.00 [3.42] 0.00 [0.04] 0.00 10 1.52 4 0.61 14 0.81 0.44—1.3620 Miners and quarry workers [0.04] 0.00 [1.53] 0.00 [0.01] 0.00 [0.31] 0.00 [1.52] 0.00 [3.41] 0.00 0.00—1.0821 Seamen – – [0.37] 0.00 [0.00] 0.00 1 1.03 [0.16] 0.00 1 0.66 0.02—3.7022 Transport workers 1 1.48 25 1.12 [0.36] 0.00 3 0.69 20 1.10 49 1.07 0.79—1.4123 Drivers 18 1.08 11 1.14 [0.15] 0.00 14 0.85 42 0.97 85 0.99 0.79—1.2224 Postal workers 28 0.78 147 1.10 6 1.34 185 0.96 335 1.01 701 1.00 0.93—1.0825 Textile workers 245 1.09 291 0.95 2 0.24 381 1.19 744 1.04 1663 1.06 1.01—1.1126 Shoe and leather workers 19 1.16 28 0.74 [0.43] 0.00 31 1.36 63 1.16 141 1.07 0.91—1.2627 Smelting workers 4 1.00 8 0.90 [0.02] 0.00 2 0.86 6 0.44 20 0.70 0.43—1.0828 Mechanics 34 0.89 38 0.99 [0.08] 0.00 25 0.93 133 0.96 230 0.95 0.83—1.0829 Plumbers [0.44] 0.00 [0.08] 0.00 – – 1 5.51 [0.17] 0.00 1 1.15 0.03—6.4230 Welders – – 3 1.05 [0.00] 0.00 4 2.24 7 1.45 14 1.48 0.81—2.4831 Electrical workers 62 1.16 17 0.72 [0.07] 0.00 35 1.22 81 1.06 195 1.07 0.93—1.2332 Wood workers 16 0.88 81 1.04 [0.13] 0.00 7 0.74 19 0.84 123 0.96 0.80—1.1433 Painters [0.69] 0.00 6 0.67 [0.04] 0.00 4 1.81 8 1.29 18 0.99 0.59—1.5734 "Other construction workers" 2 3.55 33 1.02 [0.02] 0.00 1 1.16 [0.70] 0.00 36 1.05 0.73—1.4535 Bricklayers [0.11] 0.00 1 0.94 – – [0.05] 0.00 1 49.94 2 1.61 0.20—5.8236 Printers 21 1.01 48 1.26 [0.68] 0.00 39 1.49 56 0.94 164 1.13 0.97—1.3237 Chemical process workers 38 1.15 24 1.20 [0.31] 0.00 22 0.93 49 1.02 133 1.06 0.90—1.2638 Food workers 161 1.00 108 1.03 15 0.91 133 0.85 181 1.23 598 1.02 0.94—1.1139 Beverage workers 12 0.78 1 0.17 [0.04] 0.00 [1.33] 0.00 6 0.64 19 0.59 0.36—0.9240 Tobacco workers 36 1.71 2 0.59 – – 9 1.67 11 1.96 58 1.64 1.24—2.1241 Glass makers etc 43 1.12 79 1.09 [0.45] 0.00 49 0.96 119 0.94 290 1.00 0.90—1.1342 Packers 11 0.98 134 1.05 6 3.65 127 1.03 202 1.05 480 1.05 0.96—1.1543 Engine operators 2 7.15 19 0.94 [0.02] 0.00 [1.54] 0.00 7 0.65 28 0.85 0.57—1.2344 Public safety workers 3 2.20 3 0.63 [0.31] 0.00 13 0.84 23 1.64 42 1.17 0.84—1.5845 Cooks and stewards [0.44] 0.00 159 1.09 4 0.64 190 1.07 298 1.03 651 1.05 0.97—1.1446 Domestic assistants 238 0.93 154 1.03 3 1.62 440 0.96 732 1.01 1567 0.99 0.94—1.0447 Waiters 45 1.06 139 1.18 1 1.46 203 1.09 311 1.05 699 1.09 1.01—1.1748 Building caretakers 710 0.96 495 0.98 17 1.36 809 1.01 760 1.01 2791 0.99 0.96—1.0349 Chimney sweeps [0.08] 0.00 1 4.22 – – 2 17.37 [0.01] 0.00 3 6.71 1.38—19.6150 Hairdressers 48 1.11 45 1.00 1 1.63 36 0.77 126 1.06 256 1.01 0.89—1.1451 Launderers 77 0.92 37 0.91 [2.06] 0.00 82 1.16 151 0.96 347 0.98 0.88—1.0952 Military personnel [0.43] 0.00 [0.38] 0.00 – – [0.20] 0.00 1 2.68 1 0.72 0.02—4.0253 "Other workers" 247 1.18 140 0.92 9 0.71 440 1.08 349 1.05 1185 1.06 1.00—1.1354 Economically inactive 5759 0.99 3560 1.00 55 1.27 5292 0.99 15692 0.99 30358 0.99 0.98—1.00
1-54 All categories 10969 1.00 9229 1.00 179 1.00 12487 1.00 26721 1.00 59585 1.00 # REF. #
Obs = observed number of cases; SIR = standardised incidence ratio; 95% CI = 95% confidence interval
29 Index Prev Next

Acta Oncologica - Pukkala et al, 2008 Liver cancer
Observed number of liver cancer among men in the Nordic countries and standardised incidence ratios 1961-2005, by country andoccupational category
Denmark Finland Iceland Norway Sweden Total
No Occupational category Obs SIR Obs SIR Obs SIR Obs SIR Obs SIR Obs SIR 95% CI
1 Technical workers, etc 180 0.89 182 0.93 1 0.72 52 0.78 641 0.86 1056 0.87 0.82—0.932 Laboratory assistants 8 1.96 7 1.48 [0.26] 0.00 1 0.30 [2.85] 0.00 16 1.05 0.60—1.703 Physicians 13 0.79 15 1.32 2 3.37 12 1.28 22 0.66 64 0.90 0.70—1.154 Dentists 8 1.68 1 0.41 [0.13] 0.00 3 0.72 16 0.94 28 0.98 0.65—1.425 Nurses 2 9.17 [0.49] 0.00 [0.00] 0.00 [0.31] 0.00 [1.40] 0.00 2 0.83 0.10—2.996 Assistant nurses 3 0.62 [0.40] 0.00 [0.06] 0.00 1 0.61 14 1.21 18 0.98 0.58—1.547 "Other health workers" 15 1.03 12 1.05 [0.17] 0.00 7 1.96 25 0.87 59 1.01 0.77—1.308 Teachers 55 0.63 72 0.86 4 1.89 26 0.52 126 0.67 283 0.69 0.61—0.789 Religious workers etc 22 0.59 41 0.94 1 0.69 16 0.61 163 1.13 243 0.96 0.85—1.0910 Artistic workers 15 1.28 22 1.37 2 5.07 10 1.29 65 1.45 114 1.41 1.17—1.6911 Journalists 13 2.36 15 1.90 [0.22] 0.00 5 1.51 41 1.95 74 1.95 1.53—2.4512 Administrators 261 1.14 147 1.13 1 0.25 114 1.20 351 1.15 874 1.15 1.07—1.2313 Clerical workers 110 1.09 90 1.03 6 1.33 55 0.78 332 1.04 593 1.02 0.94—1.1014 Sales agents 72 1.36 170 1.39 4 1.78 113 1.35 628 1.37 987 1.37 1.29—1.4615 Shop workers 268 1.15 59 1.19 [1.53] 0.00 29 0.94 175 1.20 531 1.16 1.06—1.2616 Farmers 152 0.35 376 0.57 4 0.59 122 0.49 411 0.46 1065 0.47 0.45—0.5017 Gardeners 38 0.60 69 0.79 [0.22] 0.00 33 0.55 205 0.65 345 0.66 0.59—0.7318 Fishermen 19 0.88 4 0.48 2 0.62 68 0.89 18 0.53 111 0.78 0.64—0.9319 Forestry workers 1 0.11 73 0.72 [0.03] 0.00 19 0.42 172 0.76 265 0.69 0.61—0.7820 Miners and quarry workers 1 0.34 23 1.44 [0.05] 0.00 13 1.08 63 1.16 100 1.17 0.96—1.4321 Seamen 48 2.07 24 1.13 1 1.03 122 2.10 75 1.61 270 1.80 1.60—2.0322 Transport workers 58 1.14 63 0.97 2 0.95 32 1.02 157 1.00 312 1.02 0.91—1.1423 Drivers 213 1.29 230 1.16 4 1.42 108 1.28 451 1.21 1006 1.22 1.15—1.3024 Postal workers 21 0.67 33 1.07 1 2.41 21 1.27 92 1.08 168 1.02 0.88—1.1925 Textile workers 22 0.75 23 1.07 3 4.17 20 1.06 98 0.98 166 0.97 0.84—1.1426 Shoe and leather workers 6 0.82 11 1.17 [0.16] 0.00 6 0.74 49 1.18 72 1.08 0.85—1.3627 Smelting workers 70 1.07 21 0.66 2 2.14 25 1.01 159 1.03 277 1.00 0.89—1.1228 Mechanics 182 1.04 191 0.98 3 1.14 126 1.08 670 0.98 1172 1.00 0.94—1.0629 Plumbers 24 1.53 43 1.34 1 2.22 20 1.52 104 1.32 192 1.37 1.19—1.5830 Welders – – 32 1.11 [0.15] 0.00 10 0.69 78 0.92 120 0.93 0.78—1.1131 Electrical workers 35 0.85 80 0.99 1 0.65 53 1.04 243 1.06 412 1.02 0.93—1.1332 Wood workers 113 0.94 232 1.04 2 1.21 93 0.66 357 0.72 797 0.81 0.76—0.8733 Painters 45 1.13 61 1.34 1 1.50 24 1.01 126 0.91 257 1.03 0.91—1.1734 "Other construction workers" 130 0.84 145 1.02 3 0.95 24 0.88 287 1.09 589 1.00 0.92—1.0835 Bricklayers 52 1.19 29 1.25 – – 24 1.70 61 0.96 166 1.15 0.99—1.3436 Printers 42 1.52 27 1.40 1 1.98 27 1.97 87 1.22 184 1.39 1.20—1.6037 Chemical process workers 21 0.80 30 0.89 [0.30] 0.00 32 1.00 112 0.94 195 0.93 0.80—1.0738 Food workers 62 0.74 18 0.73 2 0.73 39 1.09 139 1.19 260 0.99 0.87—1.1139 Beverage workers 31 2.91 1 0.59 [0.04] 0.00 [0.31] 0.00 17 2.47 49 2.50 1.85—3.3140 Tobacco workers 2 1.17 1 3.45 [0.00] 0.00 1 1.79 2 4.02 6 1.96 0.72—4.2741 Glass makers etc 49 0.98 28 0.80 [0.45] 0.00 24 1.43 113 0.89 214 0.93 0.82—1.0742 Packers 50 1.12 93 1.24 2 1.27 78 1.44 288 1.22 511 1.24 1.14—1.3643 Engine operators 52 1.18 106 1.10 1 0.53 28 0.98 216 1.16 403 1.13 1.02—1.2544 Public safety workers 46 1.14 66 1.15 1 0.71 29 1.27 114 1.07 256 1.12 0.99—1.2745 Cooks and stewards 10 3.03 6 1.89 [0.61] 0.00 20 2.09 55 2.99 91 2.60 2.09—3.1946 Domestic assistants [0.04] 0.00 [0.25] 0.00 [0.00] 0.00 [0.07] 0.00 4 2.84 4 2.26 0.62—5.7847 Waiters 33 4.54 9 3.01 [0.06] 0.00 22 5.19 37 3.94 101 4.22 3.47—5.1348 Building caretakers 44 0.98 52 1.04 [0.71] 0.00 16 1.37 97 1.06 209 1.05 0.92—1.2049 Chimney sweeps 1 0.87 5 1.38 – – 1 0.84 12 1.96 19 1.57 0.94—2.4550 Hairdressers 13 1.04 1 0.98 [0.08] 0.00 9 2.61 34 1.49 57 1.43 1.08—1.8551 Launderers 5 0.82 3 2.95 [0.07] 0.00 5 2.42 16 0.98 29 1.13 0.76—1.6352 Military personnel 22 1.08 11 0.65 – – 15 0.83 57 0.92 105 0.90 0.74—1.0853 "Other workers" 228 1.65 78 1.33 3 0.51 119 1.14 315 1.09 743 1.25 1.16—1.3454 Economically inactive 220 1.52 482 1.43 7 1.75 79 1.53 702 1.64 1490 1.54 1.46—1.62
1-54 All categories 3206 1.00 3613 1.00 68 1.00 1951 1.00 8892 1.00 17730 1.00 # REF. #
Obs = observed number of cases; SIR = standardised incidence ratio; 95% CI = 95% confidence interval
30 Index Prev Next

Acta Oncologica - Pukkala et al, 2008 Liver cancer
Observed number of liver cancer among women in the Nordic countries and standardised incidence ratios 1961-2005, by country andoccupational category
Denmark Finland Iceland Norway Sweden Total
No Occupational category Obs SIR Obs SIR Obs SIR Obs SIR Obs SIR Obs SIR 95% CI
1 Technical workers, etc 6 1.07 5 0.50 1 16.52 2 1.58 14 0.72 28 0.77 0.51—1.112 Laboratory assistants 2 0.52 9 1.52 [0.10] 0.00 [1.75] 0.00 4 0.99 15 0.96 0.54—1.583 Physicians [1.85] 0.00 2 0.85 1 37.51 [0.71] 0.00 3 0.74 6 0.67 0.24—1.454 Dentists 4 2.41 2 0.59 [0.01] 0.00 [0.65] 0.00 3 0.83 9 0.97 0.44—1.835 Nurses 29 0.88 20 0.67 1 1.67 10 0.75 66 1.09 126 0.92 0.77—1.096 Assistant nurses 31 1.32 38 1.12 [0.85] 0.00 10 0.73 84 0.83 163 0.94 0.81—1.107 "Other health workers" 22 1.17 27 1.05 [0.16] 0.00 19 1.35 23 0.69 91 0.99 0.79—1.218 Teachers 31 0.78 50 0.83 [0.99] 0.00 16 0.62 99 0.72 196 0.74 0.65—0.859 Religious workers etc 2 0.36 19 0.81 [0.16] 0.00 10 1.53 28 0.68 59 0.77 0.58—0.9910 Artistic workers 4 1.34 3 0.66 [0.14] 0.00 3 1.43 12 1.42 22 1.21 0.76—1.8311 Journalists [0.63] 0.00 2 0.66 [0.03] 0.00 [0.51] 0.00 3 0.78 5 0.62 0.20—1.4512 Administrators 19 1.06 6 0.60 1 7.81 5 0.72 13 0.65 44 0.80 0.58—1.0713 Clerical workers 145 0.87 178 0.95 2 0.62 75 0.86 334 1.00 734 0.94 0.88—1.0114 Sales agents [1.55] 0.00 30 0.93 3 7.37 14 1.00 47 0.86 94 0.92 0.74—1.1215 Shop workers 114 0.97 111 0.99 2 0.89 70 0.89 257 1.11 554 1.02 0.94—1.1116 Farmers 50 0.62 58 0.66 1 0.54 45 0.76 13 0.57 167 0.66 0.57—0.7717 Gardeners 9 0.85 194 0.82 [0.06] 0.00 25 0.71 56 0.90 284 0.83 0.74—0.9318 Fishermen 1 2.44 [0.48] 0.00 [0.05] 0.00 1 2.59 [0.20] 0.00 2 1.31 0.16—4.7419 Forestry workers [0.11] 0.00 [0.89] 0.00 [0.01] 0.00 [0.61] 0.00 2 1.59 2 0.70 0.08—2.5120 Miners and quarry workers [0.01] 0.00 [0.42] 0.00 [0.00] 0.00 [0.03] 0.00 [0.28] 0.00 [0.73] 0.00 0.00—5.0321 Seamen – – [0.08] 0.00 – – [0.09] 0.00 [0.03] 0.00 [0.19] 0.00 0.00—19.2222 Transport workers [0.12] 0.00 7 1.14 [0.07] 0.00 [0.38] 0.00 6 1.77 13 1.29 0.69—2.2123 Drivers 5 1.70 1 0.43 [0.02] 0.00 [1.47] 0.00 9 1.17 15 1.04 0.58—1.7124 Postal workers 8 1.28 40 1.14 2 2.47 17 0.95 68 1.09 135 1.10 0.93—1.3025 Textile workers 51 1.28 85 1.04 1 0.61 27 0.86 150 1.03 314 1.05 0.94—1.1726 Shoe and leather workers 1 0.34 11 1.11 [0.08] 0.00 3 1.35 16 1.46 31 1.19 0.81—1.6927 Smelting workers 2 2.77 4 1.70 [0.00] 0.00 [0.19] 0.00 6 2.48 12 2.11 1.09—3.6828 Mechanics 5 0.73 10 1.02 [0.01] 0.00 3 1.20 33 1.29 51 1.14 0.85—1.5029 Plumbers [0.07] 0.00 [0.02] 0.00 – – [0.02] 0.00 [0.03] 0.00 [0.13] 0.00 0.00—28.5030 Welders – – 3 4.52 [0.00] 0.00 [0.14] 0.00 1 1.23 4 2.46 0.67—6.3031 Electrical workers 5 0.52 9 1.67 [0.01] 0.00 4 1.53 17 1.21 35 1.10 0.77—1.5332 Wood workers 1 0.31 16 0.76 [0.02] 0.00 1 1.20 3 0.73 21 0.72 0.44—1.1033 Painters [0.13] 0.00 5 2.12 [0.01] 0.00 [0.20] 0.00 [1.15] 0.00 5 1.30 0.42—3.0434 "Other construction workers" [0.10] 0.00 13 1.43 [0.00] 0.00 [0.08] 0.00 [0.12] 0.00 13 1.38 0.74—2.3635 Bricklayers [0.02] 0.00 [0.28] 0.00 – – [0.00] 0.00 [0.00] 0.00 [0.30] 0.00 0.00—12.1036 Printers 6 1.62 11 1.12 [0.13] 0.00 2 0.81 19 1.67 38 1.38 0.98—1.9037 Chemical process workers 4 0.67 7 1.32 [0.06] 0.00 5 2.24 7 0.75 23 1.01 0.64—1.5138 Food workers 24 0.84 25 0.89 7 2.30 17 1.13 32 1.07 105 1.00 0.83—1.2239 Beverage workers 4 1.41 1 0.61 [0.01] 0.00 [0.12] 0.00 4 2.05 9 1.37 0.63—2.6040 Tobacco workers 8 2.07 1 1.08 – – 1 1.87 3 2.82 13 2.04 1.08—3.4841 Glass makers etc 9 1.30 28 1.48 [0.08] 0.00 6 1.26 26 1.07 69 1.25 0.98—1.5942 Packers 2 1.00 33 0.98 [0.32] 0.00 8 0.69 49 1.31 92 1.08 0.87—1.3343 Engine operators [0.05] 0.00 7 1.35 [0.00] 0.00 [0.12] 0.00 3 1.66 10 1.39 0.67—2.5644 Public safety workers [0.26] 0.00 [1.21] 0.00 [0.06] 0.00 1 0.67 1 0.41 2 0.37 0.04—1.3345 Cooks and stewards [0.08] 0.00 46 1.19 [1.25] 0.00 15 0.86 65 1.08 126 1.07 0.90—1.2746 Domestic assistants 38 0.85 38 0.99 [0.39] 0.00 38 0.86 111 0.78 225 0.83 0.73—0.9547 Waiters 14 1.80 34 1.14 [0.13] 0.00 26 1.48 81 1.38 155 1.36 1.16—1.5948 Building caretakers 147 1.12 174 1.27 [2.46] 0.00 92 1.23 187 1.25 600 1.21 1.12—1.3149 Chimney sweeps [0.01] 0.00 [0.06] 0.00 – – [0.01] 0.00 [0.00] 0.00 [0.08] 0.00 0.00—43.6950 Hairdressers 9 1.21 15 1.31 [0.09] 0.00 8 1.83 20 0.91 52 1.15 0.86—1.5051 Launderers 26 1.76 17 1.49 [0.44] 0.00 8 1.16 33 1.01 84 1.27 1.01—1.5752 Military personnel 1 13.01 [0.07] 0.00 – – [0.02] 0.00 [0.06] 0.00 1 4.58 0.12—25.5253 "Other workers" 36 0.97 41 1.02 2 0.85 33 0.87 67 1.03 179 0.98 0.85—1.1454 Economically inactive 1046 1.03 1050 1.03 9 1.07 580 1.08 3257 1.00 5942 1.02 0.99—1.04
1-54 All categories 1921 1.00 2486 1.00 33 1.00 1200 1.00 5335 1.00 10975 1.00 # REF. #
Obs = observed number of cases; SIR = standardised incidence ratio; 95% CI = 95% confidence interval
31 Index Prev Next

Acta Oncologica - Pukkala et al, 2008 Hemangiosarcoma of the liver
Observed number of hemangiosarcoma of the liver among men in the Nordic countries and standardised incidence ratios 1961-2005,by country and occupational category
Denmark Finland Iceland Norway Sweden Total
No Occupational category Obs SIR Obs SIR Obs SIR Obs SIR Obs SIR Obs SIR 95% CI
1 Technical workers, etc – – [0.96] 0.00 – – [0.15] 0.00 4 1.08 4 0.83 0.23—2.132 Laboratory assistants – – [0.02] 0.00 – – [0.01] 0.00 [0.02] 0.00 [0.05] 0.00 0.00—77.433 Physicians – – [0.06] 0.00 – – [0.01] 0.00 [0.16] 0.00 [0.23] 0.00 0.00—15.794 Dentists – – [0.01] 0.00 – – [0.01] 0.00 [0.08] 0.00 [0.10] 0.00 0.00—38.315 Nurses – – [0.00] 0.00 – – [0.00] 0.00 [0.01] 0.00 [0.01] 0.00 0.00—315.346 Assistant nurses – – [0.00] 0.00 – – [0.00] 0.00 [0.06] 0.00 [0.06] 0.00 0.00—57.877 "Other health workers" – – [0.05] 0.00 – – [0.01] 0.00 [0.15] 0.00 [0.20] 0.00 0.00—18.448 Teachers – – [0.44] 0.00 – – [0.08] 0.00 1 1.11 1 0.70 0.02—3.919 Religious workers etc – – [0.19] 0.00 – – [0.04] 0.00 1 1.32 1 1.01 0.03—5.6410 Artistic workers – – 1 13.16 – – [0.01] 0.00 [0.22] 0.00 1 3.26 0.08—18.1811 Journalists – – [0.04] 0.00 – – [0.01] 0.00 [0.10] 0.00 [0.15] 0.00 0.00—25.1012 Administrators – – [0.58] 0.00 – – [0.15] 0.00 [1.45] 0.00 [2.18] 0.00 0.00—1.6913 Clerical workers – – 1 2.73 – – [0.14] 0.00 3 2.03 4 2.01 0.55—5.1614 Sales agents – – 1 1.74 – – 1 8.03 2 0.91 4 1.38 0.38—3.5415 Shop workers – – [0.26] 0.00 – – [0.06] 0.00 [0.67] 0.00 [0.98] 0.00 0.00—3.7516 Farmers – – 3 1.36 – – [0.28] 0.00 [3.84] 0.00 3 0.47 0.10—1.3917 Gardeners – – [0.39] 0.00 – – [0.11] 0.00 [1.33] 0.00 [1.83] 0.00 0.00—2.0118 Fishermen – – [0.03] 0.00 – – [0.11] 0.00 [0.15] 0.00 [0.29] 0.00 0.00—12.8519 Forestry workers – – [0.49] 0.00 – – [0.07] 0.00 1 1.02 1 0.65 0.02—3.6420 Miners and quarry workers – – [0.08] 0.00 – – [0.02] 0.00 [0.24] 0.00 [0.34] 0.00 0.00—11.0121 Seamen – – [0.10] 0.00 – – 1 10.43 [0.21] 0.00 1 2.47 0.06—13.7822 Transport workers – – 1 3.37 – – [0.07] 0.00 [0.74] 0.00 1 0.90 0.02—5.0323 Drivers – – 1 0.98 – – [0.13] 0.00 4 2.24 5 1.70 0.55—3.9824 Postal workers – – [0.14] 0.00 – – [0.02] 0.00 1 2.57 1 1.82 0.05—10.1425 Textile workers – – [0.09] 0.00 – – [0.03] 0.00 [0.44] 0.00 [0.55] 0.00 0.00—6.6926 Shoe and leather workers – – [0.04] 0.00 – – [0.01] 0.00 [0.18] 0.00 [0.22] 0.00 0.00—16.7027 Smelting workers – – [0.13] 0.00 – – [0.04] 0.00 2 2.87 2 2.30 0.28—8.3228 Mechanics – – 3 3.27 – – [0.20] 0.00 5 1.54 8 1.83 0.79—3.6029 Plumbers – – 1 6.00 – – [0.02] 0.00 [0.37] 0.00 1 1.79 0.05—9.9930 Welders – – [0.16] 0.00 – – [0.03] 0.00 [0.43] 0.00 [0.62] 0.00 0.00—5.9531 Electrical workers – – [0.40] 0.00 – – [0.09] 0.00 [1.10] 0.00 [1.59] 0.00 0.00—2.3232 Wood workers – – 1 1.13 – – [0.23] 0.00 [2.24] 0.00 1 0.30 0.01—1.6633 Painters – – [0.20] 0.00 – – [0.03] 0.00 1 1.54 1 1.13 0.03—6.2934 "Other construction workers" – – [0.61] 0.00 – – [0.03] 0.00 [1.20] 0.00 [1.84] 0.00 0.00—2.0035 Bricklayers – – [0.10] 0.00 – – [0.02] 0.00 1 3.42 1 2.43 0.06—13.5136 Printers – – [0.10] 0.00 – – [0.02] 0.00 2 5.92 2 4.42 0.54—15.9837 Chemical process workers – – [0.16] 0.00 – – [0.04] 0.00 2 3.82 2 2.75 0.33—9.9238 Food workers – – [0.12] 0.00 – – 1 18.77 [0.52] 0.00 1 1.45 0.04—8.0839 Beverage workers – – [0.01] 0.00 – – [0.00] 0.00 [0.03] 0.00 [0.03] 0.00 0.00—106.3040 Tobacco workers – – [0.00] 0.00 – – [0.00] 0.00 [0.00] 0.00 [0.00] 0.00 0.00—813.6441 Glass makers etc – – [0.16] 0.00 – – [0.02] 0.00 [0.58] 0.00 [0.77] 0.00 0.00—4.7842 Packers – – [0.33] 0.00 – – [0.07] 0.00 3 2.89 3 2.09 0.43—6.1043 Engine operators – – [0.49] 0.00 – – [0.04] 0.00 [0.87] 0.00 [1.41] 0.00 0.00—2.6244 Public safety workers – – [0.26] 0.00 – – [0.04] 0.00 [0.51] 0.00 [0.81] 0.00 0.00—4.5745 Cooks and stewards – – [0.01] 0.00 – – [0.01] 0.00 [0.09] 0.00 [0.12] 0.00 0.00—30.3246 Domestic assistants – – [0.00] 0.00 – – [0.00] 0.00 [0.01] 0.00 [0.01] 0.00 0.00—405.6247 Waiters – – [0.01] 0.00 – – [0.01] 0.00 [0.05] 0.00 [0.07] 0.00 0.00—56.5348 Building caretakers – – 1 5.06 – – [0.01] 0.00 [0.41] 0.00 1 1.61 0.04—8.9849 Chimney sweeps – – [0.02] 0.00 – – [0.00] 0.00 [0.03] 0.00 [0.05] 0.00 0.00—79.9850 Hairdressers – – [0.00] 0.00 – – [0.01] 0.00 1 9.32 1 8.63 0.22—48.0751 Launderers – – [0.00] 0.00 – – [0.00] 0.00 [0.07] 0.00 [0.08] 0.00 0.00—45.3952 Military personnel – – [0.11] 0.00 – – [0.05] 0.00 [0.33] 0.00 [0.48] 0.00 0.00—7.7253 "Other workers" – – [0.24] 0.00 – – [0.14] 0.00 2 1.57 2 1.21 0.15—4.3854 Economically inactive – – 1 1.35 – – [0.02] 0.00 5 2.86 6 2.39 0.88—5.20
1-54 All categories – – 15 1.00 – – 3 1.00 41 1.00 59 1.00 # REF. #
Obs = observed number of cases; SIR = standardised incidence ratio; 95% CI = 95% confidence interval
32 Index Prev Next

Acta Oncologica - Pukkala et al, 2008 Hemangiosarcoma of the liver
Observed number of hemangiosarcoma of the liver among women in the Nordic countries and standardised incidence ratios 1961-2005,by country and occupational category
Denmark Finland Iceland Norway Sweden Total
No Occupational category Obs SIR Obs SIR Obs SIR Obs SIR Obs SIR Obs SIR 95% CI
1 Technical workers, etc – – [0.08] 0.00 [0.00] 0.00 [0.01] 0.00 [0.15] 0.00 [0.25] 0.00 0.00—15.052 Laboratory assistants – – [0.05] 0.00 [0.00] 0.00 [0.01] 0.00 [0.04] 0.00 [0.11] 0.00 0.00—33.393 Physicians – – [0.02] 0.00 [0.00] 0.00 [0.00] 0.00 [0.03] 0.00 [0.06] 0.00 0.00—61.694 Dentists – – [0.02] 0.00 – – [0.00] 0.00 [0.03] 0.00 [0.05] 0.00 0.00—70.425 Nurses – – [0.28] 0.00 [0.02] 0.00 [0.09] 0.00 1 2.16 1 1.17 0.03—6.546 Assistant nurses – – [0.29] 0.00 [0.04] 0.00 [0.09] 0.00 [0.83] 0.00 [1.25] 0.00 0.00—2.967 "Other health workers" – – [0.22] 0.00 [0.01] 0.00 [0.08] 0.00 [0.28] 0.00 [0.58] 0.00 0.00—6.388 Teachers – – 1 2.01 [0.04] 0.00 [0.15] 0.00 [1.09] 0.00 1 0.56 0.01—3.139 Religious workers etc – – 1 4.59 [0.01] 0.00 [0.04] 0.00 [0.34] 0.00 1 1.67 0.04—9.3110 Artistic workers – – [0.04] 0.00 [0.01] 0.00 [0.01] 0.00 [0.07] 0.00 [0.12] 0.00 0.00—30.5711 Journalists – – [0.03] 0.00 [0.00] 0.00 [0.00] 0.00 [0.03] 0.00 [0.06] 0.00 0.00—60.4412 Administrators – – 1 12.79 [0.01] 0.00 [0.03] 0.00 [0.16] 0.00 1 3.71 0.09—20.6513 Clerical workers – – 2 1.24 [0.14] 0.00 1 2.03 1 0.38 4 0.82 0.22—2.1114 Sales agents – – [0.22] 0.00 [0.02] 0.00 [0.04] 0.00 [0.38] 0.00 [0.66] 0.00 0.00—5.6215 Shop workers – – [0.90] 0.00 [0.10] 0.00 1 2.64 1 0.62 2 0.67 0.08—2.4216 Farmers – – [0.40] 0.00 [0.11] 0.00 [0.19] 0.00 [0.16] 0.00 [0.86] 0.00 0.00—4.3017 Gardeners – – 1 0.67 [0.00] 0.00 [0.12] 0.00 [0.42] 0.00 1 0.49 0.01—2.7418 Fishermen – – [0.00] 0.00 [0.00] 0.00 [0.00] 0.00 [0.00] 0.00 [0.01] 0.00 0.00—473.4419 Forestry workers – – [0.01] 0.00 [0.00] 0.00 [0.00] 0.00 [0.01] 0.00 [0.02] 0.00 0.00—193.0020 Miners and quarry workers – – [0.00] 0.00 [0.00] 0.00 [0.00] 0.00 [0.00] 0.00 [0.01] 0.00 0.00—720.8521 Seamen – – [0.00] 0.00 – – [0.00] 0.00 [0.00] 0.00 [0.00] 0.00 0.00—2513.4022 Transport workers – – [0.04] 0.00 [0.00] 0.00 [0.00] 0.00 [0.02] 0.00 [0.07] 0.00 0.00—52.1623 Drivers – – [0.02] 0.00 [0.00] 0.00 [0.01] 0.00 [0.07] 0.00 [0.10] 0.00 0.00—38.3224 Postal workers – – [0.26] 0.00 [0.04] 0.00 [0.09] 0.00 1 2.27 1 1.21 0.03—6.7625 Textile workers – – 1 1.75 1 9.10 [0.10] 0.00 3 3.27 5 2.95 0.96—6.8826 Shoe and leather workers – – [0.07] 0.00 [0.01] 0.00 [0.01] 0.00 [0.07] 0.00 [0.15] 0.00 0.00—24.0527 Smelting workers – – [0.02] 0.00 [0.00] 0.00 [0.00] 0.00 [0.02] 0.00 [0.04] 0.00 0.00—95.3128 Mechanics – – [0.08] 0.00 [0.00] 0.00 [0.01] 0.00 [0.19] 0.00 [0.28] 0.00 0.00—13.0029 Plumbers – – [0.00] 0.00 – – [0.00] 0.00 [0.00] 0.00 [0.00] 0.00 0.00—6515.5730 Welders – – [0.01] 0.00 – – [0.00] 0.00 [0.01] 0.00 [0.01] 0.00 0.00—247.9831 Electrical workers – – [0.05] 0.00 [0.00] 0.00 [0.01] 0.00 [0.10] 0.00 [0.17] 0.00 0.00—21.8332 Wood workers – – [0.15] 0.00 [0.00] 0.00 [0.01] 0.00 [0.03] 0.00 [0.19] 0.00 0.00—19.7433 Painters – – [0.02] 0.00 [0.00] 0.00 [0.00] 0.00 [0.01] 0.00 [0.03] 0.00 0.00—131.7534 "Other construction workers" – – [0.06] 0.00 [0.00] 0.00 [0.00] 0.00 [0.00] 0.00 [0.06] 0.00 0.00—63.9935 Bricklayers – – [0.00] 0.00 – – [0.00] 0.00 [0.00] 0.00 [0.00] 0.00 0.00—1711.5036 Printers – – [0.07] 0.00 [0.01] 0.00 [0.01] 0.00 [0.08] 0.00 [0.17] 0.00 0.00—22.1537 Chemical process workers – – [0.04] 0.00 [0.00] 0.00 [0.01] 0.00 [0.06] 0.00 [0.11] 0.00 0.00—32.1438 Food workers – – [0.19] 0.00 1 5.36 [0.05] 0.00 [0.19] 0.00 1 1.59 0.04—8.8539 Beverage workers – – [0.01] 0.00 [0.00] 0.00 [0.00] 0.00 [0.01] 0.00 [0.02] 0.00 0.00—155.2440 Tobacco workers – – [0.01] 0.00 – – [0.00] 0.00 [0.01] 0.00 [0.01] 0.00 0.00—252.4441 Glass makers etc – – [0.14] 0.00 [0.01] 0.00 [0.02] 0.00 1 5.88 1 2.97 0.08—16.5742 Packers – – [0.25] 0.00 [0.02] 0.00 [0.05] 0.00 [0.26] 0.00 [0.58] 0.00 0.00—6.4143 Engine operators – – [0.04] 0.00 [0.00] 0.00 [0.00] 0.00 [0.02] 0.00 [0.06] 0.00 0.00—62.0944 Public safety workers – – [0.01] 0.00 [0.00] 0.00 [0.01] 0.00 [0.02] 0.00 [0.04] 0.00 0.00—99.9845 Cooks and stewards – – [0.25] 0.00 [0.09] 0.00 [0.05] 0.00 [0.39] 0.00 [0.78] 0.00 0.00—4.7046 Domestic assistants – – [0.25] 0.00 [0.03] 0.00 1 6.29 1 1.01 2 1.40 0.17—5.0447 Waiters – – [0.24] 0.00 [0.01] 0.00 [0.07] 0.00 1 2.55 1 1.41 0.04—7.8648 Building caretakers – – 3 3.43 [0.17] 0.00 [0.34] 0.00 2 1.88 5 2.04 0.66—4.7649 Chimney sweeps – – [0.00] 0.00 – – [0.00] 0.00 [0.00] 0.00 [0.00] 0.00 0.00—5739.7150 Hairdressers – – [0.09] 0.00 [0.01] 0.00 [0.02] 0.00 [0.16] 0.00 [0.27] 0.00 0.00—13.6251 Launderers – – [0.07] 0.00 [0.04] 0.00 [0.02] 0.00 1 4.90 1 3.02 0.08—16.8152 Military personnel – – [0.00] 0.00 – – [0.00] 0.00 [0.00] 0.00 [0.00] 0.00 0.00—1924.4253 "Other workers" – – [0.27] 0.00 [0.15] 0.00 [0.18] 0.00 [0.46] 0.00 [1.06] 0.00 0.00—3.4954 Economically inactive – – 6 1.11 [0.61] 0.00 1 0.97 22 1.10 29 1.07 0.72—1.54
1-54 All categories – – 16 1.00 2 1.00 4 1.00 35 1.00 57 1.00 # REF. #
Obs = observed number of cases; SIR = standardised incidence ratio; 95% CI = 95% confidence interval
33 Index Prev Next

Acta Oncologica - Pukkala et al, 2008 Cancer of the gallbladder
Observed number of cancer of the gallbladder among men in the Nordic countries and standardised incidence ratios 1961-2005, bycountry and occupational category
Denmark Finland Iceland Norway Sweden Total
No Occupational category Obs SIR Obs SIR Obs SIR Obs SIR Obs SIR Obs SIR 95% CI
1 Technical workers, etc 103 0.99 90 0.87 [0.79] 0.00 35 0.71 281 1.06 509 0.98 0.89—1.062 Laboratory assistants 2 0.95 2 0.82 [0.14] 0.00 1 0.41 1 1.27 6 0.75 0.28—1.643 Physicians 10 1.13 6 1.01 1 3.06 11 1.56 8 0.69 36 1.07 0.75—1.474 Dentists 1 0.41 1 0.76 [0.09] 0.00 2 0.64 6 0.97 10 0.76 0.36—1.405 Nurses [0.11] 0.00 [0.27] 0.00 [0.00] 0.00 [0.23] 0.00 1 3.50 1 1.12 0.03—6.236 Assistant nurses 1 0.41 [0.22] 0.00 [0.03] 0.00 3 2.46 6 1.48 10 1.26 0.60—2.317 "Other health workers" 13 1.67 3 0.50 [0.08] 0.00 2 0.75 10 0.96 28 1.04 0.69—1.508 Teachers 38 0.84 45 1.03 1 0.86 31 0.83 68 1.04 183 0.95 0.82—1.109 Religious workers etc 26 1.26 27 1.16 [0.77] 0.00 21 1.06 44 0.87 118 1.03 0.86—1.2310 Artistic workers 9 1.40 8 0.94 [0.20] 0.00 4 0.70 16 1.00 37 1.00 0.71—1.3811 Journalists 2 0.69 5 1.20 [0.12] 0.00 [2.46] 0.00 11 1.45 18 1.04 0.62—1.6512 Administrators 103 0.84 69 0.98 2 0.97 74 1.05 127 1.09 375 0.98 0.89—1.0913 Clerical workers 45 0.83 43 0.91 2 0.89 51 0.99 138 1.15 279 1.02 0.90—1.1414 Sales agents 30 1.07 58 0.90 [1.16] 0.00 76 1.23 184 1.08 348 1.07 0.96—1.1815 Shop workers 140 1.10 30 1.16 [0.77] 0.00 19 0.84 50 0.95 239 1.04 0.92—1.1816 Farmers 185 0.74 322 0.89 6 1.78 119 0.64 244 0.66 876 0.75 0.70—0.8017 Gardeners 29 0.81 50 1.07 [0.10] 0.00 34 0.77 99 0.79 212 0.84 0.74—0.9618 Fishermen 10 0.87 5 1.08 3 1.65 65 1.16 10 0.73 93 1.06 0.86—1.3019 Forestry workers 6 1.12 45 0.84 [0.02] 0.00 26 0.78 72 0.79 149 0.81 0.69—0.9620 Miners and quarry workers 2 1.20 11 1.30 [0.03] 0.00 13 1.49 15 0.71 41 1.02 0.73—1.3921 Seamen 13 1.09 13 1.14 2 3.81 57 1.35 15 0.85 100 1.19 0.98—1.4522 Transport workers 30 1.15 30 0.86 1 0.93 19 0.84 50 0.88 130 0.92 0.77—1.0923 Drivers 97 1.11 114 1.10 1 0.67 81 1.32 149 1.09 442 1.13 1.03—1.2424 Postal workers 8 0.51 16 0.98 [0.20] 0.00 7 0.57 39 1.21 70 0.91 0.71—1.1525 Textile workers 18 1.10 11 0.96 [0.33] 0.00 11 0.79 48 1.21 88 1.08 0.86—1.3326 Shoe and leather workers 6 1.44 3 0.59 [0.07] 0.00 8 1.33 21 1.22 38 1.17 0.82—1.6027 Smelting workers 42 1.21 23 1.35 [0.46] 0.00 24 1.33 58 0.96 147 1.12 0.96—1.3228 Mechanics 102 1.09 102 0.99 [1.44] 0.00 92 1.09 261 1.05 557 1.05 0.96—1.1429 Plumbers 10 1.21 15 0.90 [0.23] 0.00 11 1.15 27 0.93 63 0.99 0.76—1.2730 Welders – – 17 1.14 [0.08] 0.00 12 1.15 39 1.32 68 1.24 0.96—1.5731 Electrical workers 24 1.13 40 0.95 [0.84] 0.00 34 0.91 88 1.08 186 1.02 0.88—1.1732 Wood workers 45 0.69 117 0.97 1 1.17 96 0.92 154 0.79 413 0.85 0.77—0.9333 Painters 21 1.00 28 1.16 2 5.60 15 0.86 60 1.12 126 1.08 0.91—1.2834 "Other construction workers" 82 0.94 76 1.00 1 0.60 20 1.01 82 0.78 261 0.90 0.80—1.0235 Bricklayers 33 1.37 14 1.12 – – 15 1.46 25 0.99 87 1.21 0.97—1.4936 Printers 12 0.82 9 0.89 [0.29] 0.00 11 1.09 33 1.25 65 1.06 0.81—1.3537 Chemical process workers 18 1.24 22 1.25 [0.15] 0.00 26 1.11 55 1.16 121 1.18 0.98—1.4138 Food workers 53 1.17 8 0.62 2 1.58 31 1.18 40 0.89 134 1.02 0.86—1.2139 Beverage workers 7 1.21 1 1.10 [0.02] 0.00 [0.23] 0.00 [2.82] 0.00 8 0.82 0.35—1.6140 Tobacco workers 1 1.01 [0.15] 0.00 [0.00] 0.00 [0.40] 0.00 [0.18] 0.00 1 0.58 0.01—3.2141 Glass makers etc 25 0.92 21 1.13 1 4.49 16 1.31 42 0.85 105 0.98 0.81—1.1842 Packers 31 1.23 43 1.08 4 5.44 39 0.99 104 1.10 221 1.11 0.97—1.2643 Engine operators 25 1.06 55 1.09 [1.01] 0.00 21 1.01 74 1.06 175 1.06 0.91—1.2344 Public safety workers 25 1.13 31 1.02 1 1.38 16 0.96 55 1.42 128 1.18 0.99—1.4045 Cooks and stewards 1 0.57 3 1.73 [0.34] 0.00 10 1.42 13 2.00 27 1.56 1.03—2.2746 Domestic assistants [0.02] 0.00 [0.16] 0.00 [0.00] 0.00 1 17.42 1 2.50 2 3.12 0.38—11.2847 Waiters 5 1.27 4 2.50 [0.04] 0.00 2 0.65 3 0.91 14 1.17 0.64—1.9648 Building caretakers 25 1.01 26 0.96 [0.33] 0.00 12 1.39 40 1.09 103 1.06 0.87—1.2849 Chimney sweeps [0.60] 0.00 1 0.52 – – [0.86] 0.00 1 0.44 2 0.36 0.04—1.2850 Hairdressers 10 1.41 [0.53] 0.00 [0.05] 0.00 4 1.58 12 1.36 26 1.37 0.89—2.0151 Launderers 1 0.29 2 3.70 [0.03] 0.00 5 3.31 11 1.76 19 1.62 0.97—2.5352 Military personnel 12 1.21 6 0.69 – – 12 0.92 19 0.88 49 0.92 0.68—1.2253 "Other workers" 89 1.18 22 0.70 4 1.35 94 1.22 140 1.21 349 1.16 1.04—1.2854 Economically inactive 127 1.37 242 1.30 [1.94] 0.00 52 1.32 247 1.39 668 1.34 1.24—1.45
1-54 All categories 1753 1.00 1935 1.00 35 1.00 1441 1.00 3397 1.00 8561 1.00 # REF. #
Obs = observed number of cases; SIR = standardised incidence ratio; 95% CI = 95% confidence interval
34 Index Prev Next

Acta Oncologica - Pukkala et al, 2008 Cancer of the gallbladder
Observed number of cancer of the gallbladder among women in the Nordic countries and standardised incidence ratios 1961-2005, bycountry and occupational category
Denmark Finland Iceland Norway Sweden Total
No Occupational category Obs SIR Obs SIR Obs SIR Obs SIR Obs SIR Obs SIR 95% CI
1 Technical workers, etc 5 0.60 6 0.36 [0.08] 0.00 3 1.38 21 0.71 35 0.62 0.43—0.862 Laboratory assistants 4 0.75 11 1.08 [0.13] 0.00 4 1.29 4 0.88 23 0.99 0.63—1.483 Physicians 4 1.48 4 1.02 [0.03] 0.00 1 0.76 [5.75] 0.00 9 0.66 0.30—1.254 Dentists 2 0.82 1 0.17 [0.01] 0.00 1 0.82 2 0.35 6 0.39 0.14—0.855 Nurses 31 0.63 26 0.51 1 1.33 14 0.59 63 0.66 135 0.61 0.52—0.736 Assistant nurses 25 0.74 49 0.83 1 0.90 19 0.80 101 0.65 195 0.72 0.62—0.827 "Other health workers" 20 0.71 44 0.99 [0.20] 0.00 23 0.90 43 0.86 130 0.88 0.74—1.048 Teachers 43 0.74 95 0.91 [1.28] 0.00 34 0.71 147 0.67 319 0.74 0.67—0.839 Religious workers etc 4 0.49 34 0.88 1 4.85 9 0.77 34 0.56 82 0.69 0.55—0.8510 Artistic workers 2 0.43 9 1.16 [0.17] 0.00 5 1.30 6 0.46 22 0.75 0.47—1.1311 Journalists [0.92] 0.00 4 0.76 [0.04] 0.00 [0.92] 0.00 4 0.68 8 0.62 0.27—1.2212 Administrators 20 0.73 9 0.52 [0.16] 0.00 10 0.76 31 0.98 70 0.78 0.61—0.9913 Clerical workers 203 0.84 276 0.85 7 1.68 150 0.95 392 0.75 1028 0.82 0.77—0.8714 Sales agents 2 0.86 60 1.05 [0.53] 0.00 28 1.01 84 0.89 174 0.96 0.83—1.1115 Shop workers 171 0.96 199 1.01 2 0.67 132 0.93 354 0.91 858 0.94 0.88—1.0116 Farmers 116 0.96 136 0.85 2 0.80 101 0.92 42 1.02 397 0.91 0.83—1.0117 Gardeners 8 0.50 393 0.93 [0.09] 0.00 68 1.06 98 0.91 567 0.93 0.86—1.0118 Fishermen 2 3.31 [0.82] 0.00 [0.07] 0.00 [0.69] 0.00 [0.35] 0.00 2 0.79 0.10—2.8519 Forestry workers [0.16] 0.00 [1.57] 0.00 [0.01] 0.00 [1.07] 0.00 1 0.48 1 0.20 0.01—1.1420 Miners and quarry workers [0.01] 0.00 1 1.29 [0.00] 0.00 [0.05] 0.00 1 2.29 2 1.57 0.19—5.6721 Seamen – – [0.14] 0.00 – – [0.16] 0.00 [0.03] 0.00 [0.33] 0.00 0.00—11.2922 Transport workers [0.18] 0.00 8 0.74 [0.10] 0.00 1 1.50 6 1.12 15 0.88 0.49—1.4523 Drivers 3 0.69 2 0.50 [0.03] 0.00 2 0.75 13 1.08 20 0.87 0.53—1.3424 Postal workers 11 1.15 69 1.12 [1.07] 0.00 30 0.91 93 0.91 203 0.98 0.85—1.1225 Textile workers 65 1.10 147 1.01 2 0.89 53 0.88 226 0.88 493 0.94 0.86—1.0326 Shoe and leather workers 2 0.46 14 0.79 [0.12] 0.00 4 0.96 20 1.05 40 0.88 0.63—1.2027 Smelting workers 1 0.94 1 0.24 [0.00] 0.00 [0.33] 0.00 5 1.33 7 0.75 0.30—1.5528 Mechanics 10 1.01 13 0.75 [0.02] 0.00 4 0.88 48 1.17 75 1.03 0.81—1.2929 Plumbers [0.12] 0.00 [0.03] 0.00 – – [0.03] 0.00 [0.03] 0.00 [0.21] 0.00 0.00—17.6630 Welders – – 1 0.88 [0.00] 0.00 [0.24] 0.00 1 0.87 2 0.79 0.10—2.8531 Electrical workers 20 1.44 15 1.62 [0.02] 0.00 3 0.65 20 0.90 58 1.16 0.88—1.5032 Wood workers 10 2.14 39 1.04 [0.03] 0.00 3 2.01 6 0.94 58 1.16 0.88—1.5033 Painters [0.19] 0.00 3 0.72 [0.01] 0.00 [0.35] 0.00 1 0.54 4 0.60 0.16—1.5534 "Other construction workers" [0.16] 0.00 16 0.98 [0.00] 0.00 [0.14] 0.00 [0.17] 0.00 16 0.95 0.54—1.5435 Bricklayers [0.03] 0.00 [0.50] 0.00 – – [0.01] 0.00 [0.00] 0.00 [0.54] 0.00 0.00—6.8636 Printers 6 1.09 16 0.92 [0.16] 0.00 2 0.43 17 0.90 41 0.88 0.63—1.2037 Chemical process workers 8 0.91 4 0.43 [0.08] 0.00 6 1.46 20 1.28 38 1.00 0.71—1.3738 Food workers 55 1.31 48 0.96 4 0.98 26 0.93 51 0.97 184 1.04 0.90—1.2039 Beverage workers 6 1.40 3 1.01 [0.01] 0.00 [0.21] 0.00 1 0.28 10 0.91 0.44—1.6740 Tobacco workers 9 1.55 2 1.22 – – 4 3.82 1 0.57 16 1.56 0.89—2.5441 Glass makers etc 8 0.80 28 0.83 [0.11] 0.00 16 1.85 34 0.84 86 0.93 0.74—1.1442 Packers 6 2.03 61 1.02 [0.43] 0.00 26 1.22 60 0.95 153 1.03 0.88—1.2143 Engine operators [0.07] 0.00 7 0.76 [0.01] 0.00 [0.22] 0.00 1 0.39 8 0.67 0.29—1.3144 Public safety workers [0.41] 0.00 3 1.42 [0.09] 0.00 5 1.82 5 1.45 13 1.47 0.79—2.5245 Cooks and stewards [0.12] 0.00 56 0.82 3 1.78 37 1.09 114 1.05 210 0.99 0.86—1.1346 Domestic assistants 59 0.88 41 0.60 2 3.83 77 0.90 258 1.06 437 0.94 0.86—1.0347 Waiters 9 0.79 49 0.94 2 11.83 30 0.93 94 0.92 184 0.93 0.80—1.0748 Building caretakers 217 1.09 272 1.12 5 1.50 139 1.02 323 1.24 956 1.13 1.06—1.2149 Chimney sweeps [0.02] 0.00 [0.11] 0.00 – – [0.02] 0.00 [0.00] 0.00 [0.15] 0.00 0.00—24.4950 Hairdressers 9 0.83 16 0.80 [0.12] 0.00 9 1.12 27 0.77 61 0.82 0.63—1.0651 Launderers 21 0.94 18 0.88 3 5.09 12 0.92 55 0.95 109 0.95 0.79—1.1552 Military personnel [0.12] 0.00 [0.11] 0.00 – – [0.03] 0.00 [0.06] 0.00 [0.31] 0.00 0.00—11.7553 "Other workers" 58 1.05 71 1.00 3 0.96 71 1.02 105 0.95 308 0.99 0.89—1.1154 Economically inactive 1712 1.05 2091 1.11 6 0.53 1174 1.06 6186 1.07 11169 1.07 1.05—1.09
1-54 All categories 2967 1.00 4471 1.00 44 1.00 2336 1.00 9219 1.00 19037 1.00 # REF. #
Obs = observed number of cases; SIR = standardised incidence ratio; 95% CI = 95% confidence interval
35 Index Prev Next

Acta Oncologica - Pukkala et al, 2008 Pancreatic cancer
Observed number of pancreatic cancer among men in the Nordic countries and standardised incidence ratios 1961-2005, by country andoccupational category
Denmark Finland Iceland Norway Sweden Total
No Occupational category Obs SIR Obs SIR Obs SIR Obs SIR Obs SIR Obs SIR 95% CI
1 Technical workers, etc 482 0.99 463 0.93 6 1.25 256 0.81 1570 0.95 2777 0.94 0.90—0.972 Laboratory assistants 10 1.01 15 1.24 3 3.24 19 1.18 6 0.91 53 1.16 0.87—1.523 Physicians 45 1.11 37 1.29 1 0.51 45 0.98 74 1.00 202 1.06 0.92—1.214 Dentists 14 1.22 3 0.49 [0.48] 0.00 18 0.88 33 0.87 68 0.89 0.69—1.135 Nurses [0.51] 0.00 [1.33] 0.00 [0.01] 0.00 1 0.67 2 0.67 3 0.47 0.10—1.386 Assistant nurses 9 0.78 1 0.87 [0.23] 0.00 12 1.48 31 1.20 53 1.13 0.84—1.487 "Other health workers" 41 1.14 21 0.74 [0.53] 0.00 25 1.42 69 1.07 156 1.06 0.90—1.248 Teachers 191 0.91 163 0.77 5 0.70 202 0.83 377 0.90 938 0.86 0.81—0.929 Religious workers etc 87 0.94 106 0.95 5 1.06 99 0.76 308 0.95 605 0.91 0.84—0.9910 Artistic workers 28 0.96 43 1.06 1 0.78 42 1.11 118 1.17 232 1.10 0.97—1.2611 Journalists 9 0.67 21 1.05 1 1.35 17 1.05 58 1.22 106 1.08 0.90—1.3112 Administrators 569 1.01 319 0.98 11 0.89 457 0.98 728 1.07 2084 1.02 0.97—1.0613 Clerical workers 250 1.01 215 0.99 19 1.36 336 0.98 739 1.03 1559 1.01 0.96—1.0614 Sales agents 154 1.18 304 0.99 5 0.71 457 1.10 1138 1.10 2058 1.09 1.04—1.1315 Shop workers 648 1.12 113 0.89 5 1.02 161 1.08 363 1.11 1290 1.09 1.03—1.1516 Farmers 814 0.74 1354 0.85 7 0.34 1042 0.82 1607 0.80 4824 0.81 0.78—0.8317 Gardeners 116 0.73 181 0.84 2 2.97 235 0.79 616 0.87 1150 0.83 0.79—0.8818 Fishermen 63 1.18 26 1.27 14 1.20 427 1.12 66 0.86 596 1.10 1.01—1.1919 Forestry workers 11 0.47 235 0.93 [0.11] 0.00 155 0.68 498 0.97 899 0.88 0.83—0.9420 Miners and quarry workers 5 0.67 50 1.25 [0.19] 0.00 69 1.16 132 1.06 256 1.11 0.98—1.2521 Seamen 82 1.45 59 1.11 2 0.62 331 1.18 106 1.00 580 1.16 1.07—1.2622 Transport workers 112 0.91 185 1.16 6 0.91 159 1.04 351 1.01 813 1.03 0.96—1.1023 Drivers 482 1.18 557 1.12 11 1.17 437 1.06 945 1.12 2432 1.12 1.08—1.1624 Postal workers 74 0.99 83 1.09 2 1.62 85 1.02 196 1.02 440 1.03 0.94—1.1325 Textile workers 72 0.97 52 0.99 3 1.42 117 1.25 197 0.87 441 0.98 0.90—1.0826 Shoe and leather workers 18 0.97 18 0.78 2 4.31 50 1.21 89 0.94 177 1.00 0.86—1.1527 Smelting workers 160 0.99 73 0.93 1 0.34 128 1.04 388 1.10 750 1.04 0.97—1.1228 Mechanics 458 1.06 467 0.95 8 0.89 634 1.12 1641 1.07 3208 1.06 1.02—1.0929 Plumbers 35 0.91 92 1.13 [1.46] 0.00 64 1.01 212 1.19 403 1.11 1.00—1.2230 Welders – – 79 1.06 1 1.85 70 1.02 198 1.03 348 1.04 0.93—1.1531 Electrical workers 117 1.16 229 1.12 7 1.32 247 1.00 513 1.00 1113 1.04 0.98—1.1032 Wood workers 298 1.00 553 1.01 3 0.57 666 0.95 1001 0.90 2521 0.94 0.91—0.9833 Painters 92 0.94 118 1.04 3 1.42 107 0.91 321 1.02 641 0.99 0.92—1.0734 "Other construction workers" 410 1.05 378 1.07 6 0.57 152 1.13 574 0.95 1520 1.02 0.97—1.0735 Bricklayers 115 1.05 50 0.88 – – 67 0.96 156 1.08 388 1.02 0.92—1.1336 Printers 83 1.21 60 1.22 5 2.95 86 1.28 172 1.06 406 1.16 1.06—1.2837 Chemical process workers 70 1.06 76 0.90 [0.98] 0.00 178 1.11 298 1.10 622 1.07 0.99—1.1638 Food workers 199 0.95 81 1.32 7 0.84 205 1.15 255 0.97 747 1.04 0.96—1.1139 Beverage workers 48 1.79 10 2.41 [0.14] 0.00 5 3.55 19 1.20 82 1.70 1.35—2.1140 Tobacco workers 3 0.68 1 1.39 [0.01] 0.00 6 2.11 [1.13] 0.00 10 1.10 0.53—2.0241 Glass makers etc 132 1.06 88 1.00 1 0.68 90 1.09 259 0.90 570 0.98 0.90—1.0642 Packers 104 0.92 253 1.36 12 2.49 316 1.17 642 1.19 1327 1.19 1.13—1.2643 Engine operators 110 1.01 240 0.99 5 0.80 158 1.14 457 1.08 970 1.05 0.99—1.1244 Public safety workers 92 0.91 162 1.14 5 1.10 133 1.18 271 1.13 663 1.10 1.02—1.1945 Cooks and stewards 11 1.34 12 1.47 1 0.48 66 1.42 53 1.26 143 1.34 1.13—1.5746 Domestic assistants [0.09] 0.00 [0.61] 0.00 [0.01] 0.00 [0.36] 0.00 2 0.66 2 0.49 0.06—1.7647 Waiters 29 1.58 14 1.80 1 4.60 23 1.11 33 1.53 100 1.45 1.19—1.7748 Building caretakers 136 1.21 107 0.87 2 0.97 82 1.41 239 1.14 566 1.12 1.03—1.2249 Chimney sweeps 4 1.42 14 1.55 – – 10 1.70 16 1.15 44 1.39 1.01—1.8750 Hairdressers 27 0.85 6 2.38 1 3.34 16 0.93 62 1.20 112 1.08 0.90—1.3051 Launderers 21 1.37 4 1.57 1 4.89 17 1.66 35 0.95 78 1.19 0.94—1.4952 Military personnel 52 1.08 35 0.80 – – 85 1.01 121 0.88 293 0.93 0.83—1.0553 "Other workers" 368 1.06 143 0.98 19 1.04 546 1.03 677 1.03 1753 1.03 0.99—1.0854 Economically inactive 433 1.09 993 1.18 19 1.45 261 0.94 1067 1.07 2773 1.10 1.06—1.14
1-54 All categories 7993 1.00 8962 1.00 219 1.00 9672 1.00 20099 1.00 46945 1.00 # REF. #
Obs = observed number of cases; SIR = standardised incidence ratio; 95% CI = 95% confidence interval
36 Index Prev Next

Acta Oncologica - Pukkala et al, 2008 Pancreatic cancer
Observed number of pancreatic cancer among women in the Nordic countries and standardised incidence ratios 1961-2005, by countryand occupational category
Denmark Finland Iceland Norway Sweden Total
No Occupational category Obs SIR Obs SIR Obs SIR Obs SIR Obs SIR Obs SIR 95% CI
1 Technical workers, etc 21 0.91 35 0.90 1 2.36 10 1.13 74 1.10 141 1.02 0.86—1.202 Laboratory assistants 15 0.96 21 0.91 2 3.18 17 1.36 6 0.45 61 0.94 0.72—1.203 Physicians 7 0.93 9 0.99 [0.14] 0.00 3 0.58 12 0.86 31 0.86 0.59—1.224 Dentists 3 0.44 9 0.69 [0.05] 0.00 9 1.92 9 0.71 30 0.81 0.55—1.155 Nurses 129 0.95 111 0.95 4 1.20 84 0.87 199 0.93 527 0.93 0.86—1.026 Assistant nurses 94 0.98 131 1.00 4 0.85 90 0.92 342 0.96 661 0.97 0.89—1.047 "Other health workers" 93 1.20 98 0.98 [0.92] 0.00 92 0.91 120 1.03 403 1.02 0.92—1.128 Teachers 167 1.02 217 0.93 8 1.41 144 0.77 435 0.90 971 0.91 0.85—0.979 Religious workers etc 18 0.80 87 0.94 [0.89] 0.00 47 1.00 126 0.88 278 0.91 0.81—1.0210 Artistic workers 9 0.73 16 0.91 [0.69] 0.00 23 1.52 26 0.88 74 0.98 0.77—1.2311 Journalists 2 0.78 5 0.43 [0.17] 0.00 6 1.63 12 0.89 25 0.79 0.51—1.1712 Administrators 78 1.06 43 1.11 [0.62] 0.00 65 1.28 77 1.10 263 1.12 1.00—1.2713 Clerical workers 699 1.03 756 1.04 19 1.07 599 0.95 1252 1.07 3325 1.03 1.00—1.0714 Sales agents 1 0.16 131 1.06 [2.03] 0.00 100 0.96 204 1.06 436 1.02 0.93—1.1215 Shop workers 479 0.99 428 0.99 10 0.85 550 0.97 862 1.05 2329 1.00 0.96—1.0516 Farmers 247 0.74 290 0.87 11 1.19 356 0.82 63 0.78 967 0.81 0.76—0.8717 Gardeners 48 1.11 859 0.96 [0.31] 0.00 214 0.83 176 0.79 1297 0.91 0.86—0.9618 Fishermen [1.68] 0.00 [1.81] 0.00 1 3.60 4 1.44 1 1.38 6 0.82 0.30—1.7919 Forestry workers 1 2.28 1 0.29 [0.04] 0.00 [4.43] 0.00 3 0.67 5 0.39 0.13—0.9120 Miners and quarry workers [0.04] 0.00 [1.61] 0.00 [0.01] 0.00 1 5.44 2 2.03 3 1.06 0.22—3.1121 Seamen – – [0.30] 0.00 [0.00] 0.00 [0.63] 0.00 [0.09] 0.00 [1.02] 0.00 0.00—3.6122 Transport workers 1 2.05 27 1.16 [0.32] 0.00 2 0.74 16 1.35 46 1.19 0.87—1.5923 Drivers 11 0.92 8 0.88 [0.13] 0.00 11 1.03 48 1.75 78 1.32 1.04—1.6424 Postal workers 28 1.09 123 0.91 5 1.23 123 0.96 249 1.12 528 1.03 0.94—1.1225 Textile workers 202 1.25 306 0.98 6 0.73 254 1.10 506 0.97 1274 1.03 0.98—1.0926 Shoe and leather workers 14 1.18 29 0.76 1 2.42 29 1.79 45 1.16 118 1.12 0.93—1.3427 Smelting workers 2 0.68 9 1.00 [0.02] 0.00 1 0.74 13 1.52 25 1.14 0.74—1.6928 Mechanics 38 1.37 47 1.24 [0.06] 0.00 24 1.33 101 1.12 210 1.20 1.05—1.3829 Plumbers [0.30] 0.00 [0.07] 0.00 – – [0.11] 0.00 [0.09] 0.00 [0.57] 0.00 0.00—6.5030 Welders – – 3 1.14 [0.00] 0.00 [1.01] 0.00 6 2.11 9 1.39 0.64—2.6431 Electrical workers 34 0.87 21 1.00 [0.06] 0.00 20 1.07 50 1.01 125 0.97 0.82—1.1632 Wood workers 10 0.77 76 0.94 [0.12] 0.00 6 0.99 19 1.32 111 0.97 0.81—1.1733 Painters [0.52] 0.00 13 1.44 [0.03] 0.00 2 1.40 6 1.47 21 1.39 0.86—2.1234 "Other construction workers" [0.42] 0.00 35 1.01 [0.02] 0.00 [0.56] 0.00 1 2.41 36 1.00 0.70—1.3935 Bricklayers [0.08] 0.00 [1.09] 0.00 – – [0.03] 0.00 [0.01] 0.00 [1.20] 0.00 0.00—3.0736 Printers 17 1.12 38 1.01 1 1.53 15 0.84 49 1.22 120 1.08 0.90—1.2937 Chemical process workers 32 1.33 26 1.28 [0.31] 0.00 14 0.86 32 0.97 104 1.11 0.91—1.3438 Food workers 136 1.17 99 0.92 13 0.84 126 1.15 104 0.98 478 1.05 0.96—1.1539 Beverage workers 25 2.16 4 0.64 [0.04] 0.00 1 1.16 4 0.57 34 1.32 0.92—1.8540 Tobacco workers 22 1.40 2 0.57 – – 5 1.28 3 0.80 32 1.19 0.81—1.6841 Glass makers etc 37 1.32 65 0.89 [0.40] 0.00 36 1.05 97 1.13 235 1.06 0.93—1.2042 Packers 13 1.60 115 0.89 4 2.51 87 1.03 138 1.04 357 1.00 0.90—1.1143 Engine operators [0.21] 0.00 19 0.94 [0.02] 0.00 [0.89] 0.00 8 1.26 27 0.98 0.64—1.4244 Public safety workers [1.06] 0.00 2 0.43 [0.31] 0.00 6 0.54 12 1.44 20 0.79 0.48—1.2245 Cooks and stewards 1 3.15 132 0.89 6 0.97 124 0.96 250 1.17 513 1.03 0.94—1.1246 Domestic assistants 191 1.05 148 1.00 2 1.06 314 0.96 482 0.96 1137 0.98 0.92—1.0447 Waiters 43 1.37 122 1.06 1 1.50 149 1.16 232 1.11 547 1.13 1.04—1.2348 Building caretakers 564 1.05 571 1.09 16 1.30 619 1.14 637 1.19 2407 1.12 1.08—1.1749 Chimney sweeps [0.05] 0.00 [0.24] 0.00 – – 1 12.38 [0.01] 0.00 1 2.68 0.07—14.9150 Hairdressers 32 1.05 48 1.09 [0.58] 0.00 41 1.29 97 1.25 218 1.18 1.03—1.3551 Launderers 77 1.27 40 0.93 5 2.34 59 1.16 124 1.07 305 1.12 1.00—1.2552 Military personnel [0.31] 0.00 [0.29] 0.00 – – [0.12] 0.00 [0.19] 0.00 [0.91] 0.00 0.00—4.0753 "Other workers" 162 1.07 153 1.00 13 1.09 290 1.05 278 1.20 896 1.09 1.02—1.1654 Economically inactive 4140 0.97 3970 1.03 37 0.87 4082 1.01 11294 0.98 23523 0.99 0.98—1.00
1-54 All categories 7943 1.00 9498 1.00 170 1.00 8855 1.00 18902 1.00 45368 1.00 # REF. #
Obs = observed number of cases; SIR = standardised incidence ratio; 95% CI = 95% confidence interval
37 Index Prev Next

Acta Oncologica - Pukkala et al, 2008 Nasal cancer
Observed number of nasal cancer among men in the Nordic countries and standardised incidence ratios 1961-2005, by country andoccupational category
Denmark Finland Iceland Norway Sweden Total
No Occupational category Obs SIR Obs SIR Obs SIR Obs SIR Obs SIR Obs SIR 95% CI
1 Technical workers, etc 56 1.15 24 0.78 [0.47] 0.00 15 0.56 111 0.88 206 0.88 0.77—1.012 Laboratory assistants 1 1.04 [0.76] 0.00 [0.08] 0.00 [1.33] 0.00 [0.62] 0.00 1 0.27 0.01—1.483 Physicians 3 0.75 [1.75] 0.00 [0.19] 0.00 5 1.37 4 0.70 12 0.78 0.40—1.374 Dentists [1.17] 0.00 1 2.75 [0.05] 0.00 2 1.22 [2.85] 0.00 3 0.49 0.10—1.455 Nurses [0.05] 0.00 [0.11] 0.00 [0.00] 0.00 [0.16] 0.00 1 3.01 1 1.54 0.04—8.586 Assistant nurses 2 1.72 [0.10] 0.00 [0.02] 0.00 [0.64] 0.00 4 1.90 6 1.49 0.55—3.257 "Other health workers" 3 0.87 2 1.15 [0.05] 0.00 [1.45] 0.00 4 0.82 9 0.78 0.36—1.488 Teachers 21 0.99 6 0.48 [0.66] 0.00 11 0.55 22 0.68 60 0.69 0.53—0.899 Religious workers etc 6 0.67 9 1.28 [0.46] 0.00 12 1.14 19 0.75 46 0.88 0.65—1.1810 Artistic workers 3 1.09 4 1.63 [0.13] 0.00 2 0.65 3 0.39 12 0.74 0.38—1.3011 Journalists [1.30] 0.00 1 0.83 [0.07] 0.00 1 0.75 4 1.10 6 0.80 0.29—1.7312 Administrators 54 0.99 25 1.31 2 1.70 43 1.16 40 0.81 164 1.02 0.87—1.1913 Clerical workers 25 1.06 13 1.03 2 1.46 23 0.83 42 0.79 105 0.89 0.73—1.0714 Sales agents 14 1.12 15 0.83 [0.67] 0.00 21 0.64 68 0.88 118 0.84 0.70—1.0015 Shop workers 45 0.83 8 1.03 [0.48] 0.00 14 1.13 28 1.15 95 0.95 0.77—1.1716 Farmers 65 0.61 72 0.84 3 1.48 83 0.88 118 0.87 341 0.81 0.72—0.9017 Gardeners 6 0.40 12 0.97 [0.07] 0.00 14 0.60 40 0.81 72 0.72 0.56—0.9118 Fishermen 9 1.81 1 0.89 2 1.82 36 1.21 8 1.51 56 1.33 1.00—1.7219 Forestry workers 2 0.92 16 1.09 [0.01] 0.00 19 1.09 38 1.05 75 1.06 0.84—1.3320 Miners and quarry workers 1 1.50 2 0.84 [0.02] 0.00 3 0.63 6 0.67 12 0.72 0.37—1.2521 Seamen 6 1.12 1 0.32 1 3.32 21 0.91 12 1.55 41 1.03 0.74—1.4022 Transport workers 13 1.10 6 0.64 [0.63] 0.00 13 1.05 24 0.93 56 0.93 0.70—1.2123 Drivers 40 1.05 23 0.77 [0.88] 0.00 46 1.36 75 1.18 184 1.11 0.96—1.2824 Postal workers 4 0.53 2 0.44 [0.12] 0.00 8 1.20 18 1.27 32 0.97 0.66—1.3725 Textile workers 4 0.59 4 1.37 [0.21] 0.00 9 1.24 21 1.33 38 1.15 0.82—1.5826 Shoe and leather workers 6 3.62 2 1.56 [0.04] 0.00 3 0.94 6 0.93 17 1.35 0.79—2.1627 Smelting workers 15 1.00 3 0.66 [0.28] 0.00 22 2.24 26 1.03 66 1.20 0.93—1.5328 Mechanics 40 0.99 31 1.05 [0.87] 0.00 55 1.18 105 0.91 231 0.99 0.87—1.1329 Plumbers 2 0.55 3 0.61 [0.14] 0.00 2 0.37 20 1.50 27 0.99 0.65—1.4430 Welders – – 5 1.05 [0.05] 0.00 8 1.37 16 1.07 29 1.13 0.76—1.6231 Electrical workers 5 0.52 11 0.87 [0.50] 0.00 24 1.16 39 0.99 79 0.95 0.76—1.1932 Wood workers 74 2.64 46 1.46 1 1.94 74 1.35 160 2.04 355 1.84 1.66—2.0433 Painters 14 1.52 4 0.61 [0.19] 0.00 7 0.75 18 0.80 43 0.90 0.65—1.2134 "Other construction workers" 39 1.12 36 1.75 1 1.00 10 0.92 51 1.19 137 1.24 1.05—1.4735 Bricklayers 9 0.89 3 0.91 – – 4 0.73 13 1.28 29 1.00 0.67—1.4336 Printers 8 1.24 1 0.33 [0.15] 0.00 5 0.91 8 0.66 22 0.81 0.51—1.2237 Chemical process workers 9 1.51 7 1.40 [0.09] 0.00 10 0.80 21 1.10 47 1.10 0.81—1.4638 Food workers 13 0.67 3 0.84 2 2.42 13 0.92 16 0.84 47 0.83 0.61—1.1039 Beverage workers 6 2.58 [0.24] 0.00 [0.02] 0.00 [0.13] 0.00 2 1.79 8 2.09 0.90—4.1240 Tobacco workers 1 2.63 1 24.56 [0.00] 0.00 1 4.44 [0.08] 0.00 3 4.10 0.85—11.9841 Glass makers etc 10 0.88 6 1.14 1 6.87 14 2.09 19 0.91 50 1.13 0.84—1.4942 Packers 10 0.99 13 1.19 1 2.12 14 0.66 39 1.02 77 0.95 0.75—1.1943 Engine operators 8 0.78 18 1.23 1 1.65 11 0.95 34 1.08 72 1.05 0.82—1.3244 Public safety workers 9 0.93 12 1.42 [0.45] 0.00 8 0.89 13 0.72 42 0.92 0.66—1.2445 Cooks and stewards 2 2.69 [0.55] 0.00 1 5.15 2 0.52 6 1.81 11 1.27 0.63—2.2746 Domestic assistants [0.01] 0.00 [0.03] 0.00 [0.00] 0.00 [0.03] 0.00 [0.31] 0.00 [0.39] 0.00 0.00—9.5847 Waiters 3 1.94 1 1.86 [0.02] 0.00 1 0.59 3 1.74 8 1.45 0.63—2.8648 Building caretakers 14 1.38 10 1.40 [0.19] 0.00 5 1.08 9 0.60 38 1.02 0.72—1.4149 Chimney sweeps [0.26] 0.00 1 1.87 – – [0.47] 0.00 1 0.96 2 0.86 0.10—3.1250 Hairdressers 2 0.69 [0.15] 0.00 [0.03] 0.00 3 2.21 3 0.81 8 0.98 0.42—1.9451 Launderers 4 2.80 [0.15] 0.00 [0.02] 0.00 [0.81] 0.00 4 1.51 8 1.58 0.68—3.1252 Military personnel 1 0.20 1 0.36 – – 3 0.42 6 0.57 11 0.43 0.22—0.7753 "Other workers" 38 1.23 6 0.70 1 0.58 39 0.95 40 0.86 124 0.96 0.81—1.1554 Economically inactive 22 0.78 49 1.07 2 1.61 31 1.38 77 1.03 181 1.05 0.91—1.22
1-54 All categories 747 1.00 520 1.00 21 1.00 770 1.00 1465 1.00 3523 1.00 # REF. #
Obs = observed number of cases; SIR = standardised incidence ratio; 95% CI = 95% confidence interval
38 Index Prev Next

Acta Oncologica - Pukkala et al, 2008 Nasal cancer
Observed number of nasal cancer among women in the Nordic countries and standardised incidence ratios 1961-2005, by country andoccupational category
Denmark Finland Iceland Norway Sweden Total
No Occupational category Obs SIR Obs SIR Obs SIR Obs SIR Obs SIR Obs SIR 95% CI
1 Technical workers, etc 1 0.70 1 0.51 [0.05] 0.00 1 1.82 5 1.34 8 1.04 0.45—2.052 Laboratory assistants [1.01] 0.00 [1.13] 0.00 [0.08] 0.00 1 1.39 [1.00] 0.00 1 0.25 0.01—1.413 Physicians [0.48] 0.00 [0.48] 0.00 [0.02] 0.00 [0.31] 0.00 [0.84] 0.00 [2.11] 0.00 0.00—1.744 Dentists [0.43] 0.00 1 1.80 [0.01] 0.00 [0.27] 0.00 1 1.50 2 1.04 0.13—3.755 Nurses 8 0.95 4 0.70 1 2.41 4 0.72 11 0.98 28 0.89 0.59—1.296 Assistant nurses 7 1.16 5 0.82 [0.53] 0.00 3 0.56 21 1.08 36 0.96 0.67—1.337 "Other health workers" 6 1.23 2 0.42 [0.12] 0.00 5 0.88 3 0.46 16 0.73 0.42—1.188 Teachers 12 1.14 8 0.74 [0.71] 0.00 8 0.74 27 1.05 55 0.94 0.71—1.229 Religious workers etc [1.44] 0.00 2 0.41 [0.11] 0.00 [2.67] 0.00 7 0.84 9 0.52 0.24—0.9810 Artistic workers [0.74] 0.00 2 2.39 [0.09] 0.00 [0.85] 0.00 1 0.62 3 0.72 0.15—2.1211 Journalists [0.16] 0.00 1 1.81 [0.02] 0.00 [0.21] 0.00 1 1.34 2 1.18 0.14—4.2812 Administrators 3 0.67 1 0.55 [0.08] 0.00 [2.85] 0.00 2 0.53 6 0.46 0.17—1.0113 Clerical workers 37 0.86 44 1.28 3 1.40 38 1.09 69 1.11 191 1.08 0.94—1.2514 Sales agents [0.40] 0.00 4 0.75 1 4.00 8 1.42 12 1.27 25 1.19 0.77—1.7615 Shop workers 27 0.91 17 0.88 [1.42] 0.00 24 0.80 32 0.81 100 0.84 0.69—1.0216 Farmers 15 0.72 9 0.71 1 0.95 18 0.81 3 0.75 46 0.76 0.55—1.0117 Gardeners 1 0.37 37 1.02 [0.03] 0.00 9 0.69 15 1.44 62 0.99 0.76—1.2818 Fishermen [0.11] 0.00 [0.08] 0.00 [0.04] 0.00 [0.15] 0.00 [0.04] 0.00 [0.40] 0.00 0.00—9.1719 Forestry workers [0.03] 0.00 [0.15] 0.00 [0.00] 0.00 [0.22] 0.00 [0.22] 0.00 [0.62] 0.00 0.00—5.9220 Miners and quarry workers [0.00] 0.00 [0.06] 0.00 [0.00] 0.00 [0.01] 0.00 [0.05] 0.00 [0.13] 0.00 0.00—28.7321 Seamen – – [0.02] 0.00 – – [0.03] 0.00 [0.01] 0.00 [0.06] 0.00 0.00—64.4622 Transport workers [0.03] 0.00 2 2.06 [0.04] 0.00 [0.15] 0.00 [0.62] 0.00 2 1.11 0.13—4.0023 Drivers 1 1.36 1 2.36 [0.02] 0.00 [0.59] 0.00 4 2.69 6 1.85 0.68—4.0224 Postal workers [1.58] 0.00 5 0.86 1 2.00 10 1.43 13 1.17 29 1.11 0.75—1.6025 Textile workers 11 1.12 12 0.90 [0.85] 0.00 9 0.73 27 1.13 59 0.98 0.75—1.2726 Shoe and leather workers 1 1.38 2 1.22 [0.05] 0.00 1 1.16 [1.80] 0.00 4 0.79 0.21—2.0227 Smelting workers [0.17] 0.00 1 2.60 [0.00] 0.00 [0.08] 0.00 [0.45] 0.00 1 0.92 0.02—5.1128 Mechanics 3 1.74 [1.68] 0.00 [0.01] 0.00 1 1.03 7 1.50 11 1.21 0.61—2.1729 Plumbers [0.02] 0.00 [0.00] 0.00 – – [0.01] 0.00 [0.01] 0.00 [0.03] 0.00 0.00—110.6430 Welders – – [0.13] 0.00 [0.00] 0.00 [0.06] 0.00 [0.17] 0.00 [0.36] 0.00 0.00—10.3331 Electrical workers 3 1.25 1 0.96 [0.01] 0.00 2 1.96 4 1.55 10 1.42 0.68—2.6032 Wood workers 3 3.71 4 1.18 [0.01] 0.00 [0.32] 0.00 3 3.92 10 1.88 0.90—3.4633 Painters [0.03] 0.00 [0.40] 0.00 [0.00] 0.00 [0.08] 0.00 [0.21] 0.00 [0.72] 0.00 0.00—5.1534 "Other construction workers" [0.02] 0.00 1 0.71 [0.00] 0.00 [0.03] 0.00 [0.03] 0.00 1 0.68 0.02—3.7635 Bricklayers [0.00] 0.00 [0.05] 0.00 – – [0.00] 0.00 [0.00] 0.00 [0.05] 0.00 0.00—70.6936 Printers [0.91] 0.00 [1.65] 0.00 [0.07] 0.00 1 1.01 4 1.98 5 0.89 0.29—2.0737 Chemical process workers 1 0.70 [0.87] 0.00 [0.03] 0.00 2 2.28 2 1.24 5 1.04 0.34—2.4238 Food workers 10 1.41 3 0.66 2 1.16 9 1.56 7 1.41 31 1.29 0.87—1.8339 Beverage workers 2 3.03 1 3.89 [0.00] 0.00 [0.04] 0.00 [0.32] 0.00 3 2.33 0.48—6.8240 Tobacco workers 1 1.10 [0.15] 0.00 – – [0.22] 0.00 [0.19] 0.00 1 0.69 0.02—3.8341 Glass makers etc 2 1.17 1 0.32 [0.05] 0.00 2 1.08 6 1.42 11 1.00 0.50—1.8042 Packers 3 6.05 7 1.26 [0.17] 0.00 10 2.25 6 0.94 26 1.52 0.99—2.2343 Engine operators [0.01] 0.00 1 1.13 [0.00] 0.00 [0.05] 0.00 [0.37] 0.00 1 0.76 0.02—4.2244 Public safety workers [0.05] 0.00 [0.20] 0.00 [0.03] 0.00 [0.55] 0.00 1 1.98 1 0.75 0.02—4.1545 Cooks and stewards [0.02] 0.00 8 1.27 [0.64] 0.00 5 0.73 7 0.71 20 0.85 0.52—1.3146 Domestic assistants 11 0.99 9 1.40 [0.19] 0.00 13 0.76 31 1.22 64 1.06 0.82—1.3547 Waiters 2 1.08 3 0.58 [0.07] 0.00 7 1.03 8 0.82 20 0.84 0.52—1.3048 Building caretakers 28 0.87 31 1.43 3 2.29 34 1.20 18 0.70 114 1.04 0.87—1.2549 Chimney sweeps [0.00] 0.00 [0.01] 0.00 – – [0.00] 0.00 [0.00] 0.00 [0.02] 0.00 0.00—204.4350 Hairdressers 3 1.60 3 1.54 [0.07] 0.00 [1.75] 0.00 7 1.76 13 1.35 0.72—2.3151 Launderers 5 1.37 2 1.13 [0.21] 0.00 3 1.13 4 0.76 14 1.03 0.56—1.7352 Military personnel [0.02] 0.00 [0.02] 0.00 – – [0.01] 0.00 [0.02] 0.00 [0.06] 0.00 0.00—64.0553 "Other workers" 9 1.00 4 0.61 1 0.75 12 0.82 11 0.97 37 0.86 0.61—1.1954 Economically inactive 253 1.05 156 1.04 6 1.35 243 1.08 529 0.98 1187 1.02 0.97—1.08
1-54 All categories 469 1.00 396 1.00 19 1.00 483 1.00 909 1.00 2276 1.00 # REF. #
Obs = observed number of cases; SIR = standardised incidence ratio; 95% CI = 95% confidence interval
39 Index Prev Next

Acta Oncologica - Pukkala et al, 2008 Adenocarcinoma of the nose
Observed number of adenocarcinoma of the nose among men in the Nordic countries and standardised incidence ratios 1961-2005, bycountry and occupational category
Denmark Finland Iceland Norway Sweden Total
No Occupational category Obs SIR Obs SIR Obs SIR Obs SIR Obs SIR Obs SIR 95% CI
1 Technical workers, etc – – 1 0.49 [0.04] 0.00 1 0.26 15 0.69 17 0.61 0.36—0.982 Laboratory assistants – – [0.05] 0.00 [0.01] 0.00 [0.19] 0.00 [0.10] 0.00 [0.34] 0.00 0.00—10.923 Physicians – – [0.12] 0.00 [0.02] 0.00 1 2.04 1 1.05 2 1.27 0.15—4.594 Dentists – – [0.02] 0.00 [0.00] 0.00 [0.23] 0.00 [0.48] 0.00 [0.74] 0.00 0.00—5.025 Nurses – – [0.00] 0.00 [0.00] 0.00 [0.02] 0.00 [0.05] 0.00 [0.07] 0.00 0.00—50.246 Assistant nurses – – [0.00] 0.00 [0.00] 0.00 [0.08] 0.00 1 2.97 1 2.36 0.06—13.137 "Other health workers" – – [0.11] 0.00 [0.00] 0.00 [0.19] 0.00 [0.81] 0.00 [1.12] 0.00 0.00—3.288 Teachers – – [0.93] 0.00 [0.06] 0.00 1 0.35 9 1.67 10 1.08 0.52—1.999 Religious workers etc – – [0.42] 0.00 [0.04] 0.00 [1.41] 0.00 2 0.49 2 0.34 0.04—1.2110 Artistic workers – – 1 5.92 [0.01] 0.00 [0.42] 0.00 [1.33] 0.00 1 0.52 0.01—2.8911 Journalists – – [0.08] 0.00 [0.01] 0.00 [0.18] 0.00 1 1.64 1 1.14 0.03—6.3312 Administrators – – 2 1.56 [0.12] 0.00 8 1.62 9 1.09 19 1.30 0.78—2.0313 Clerical workers – – 1 1.20 [0.13] 0.00 3 0.78 2 0.22 6 0.43 0.16—0.9514 Sales agents – – 1 0.79 [0.07] 0.00 1 0.23 13 0.99 15 0.80 0.45—1.3115 Shop workers – – [0.55] 0.00 [0.04] 0.00 [1.75] 0.00 4 0.93 4 0.60 0.16—1.5516 Farmers – – 2 0.36 [0.19] 0.00 10 0.84 10 0.46 22 0.56 0.35—0.8417 Gardeners – – 1 1.14 [0.01] 0.00 4 1.33 2 0.24 7 0.57 0.23—1.1818 Fishermen – – [0.07] 0.00 [0.10] 0.00 4 1.04 2 2.28 6 1.22 0.45—2.6619 Forestry workers – – [1.09] 0.00 [0.00] 0.00 [2.21] 0.00 1 0.16 1 0.11 0.00—0.6020 Miners and quarry workers – – 1 5.71 [0.00] 0.00 1 1.59 1 0.66 3 1.29 0.27—3.7821 Seamen – – [0.22] 0.00 [0.03] 0.00 4 1.23 [1.33] 0.00 4 0.83 0.23—2.1222 Transport workers – – 1 1.53 [0.07] 0.00 2 1.19 4 0.84 7 0.98 0.39—2.0123 Drivers – – 1 0.45 [0.09] 0.00 9 1.95 6 0.55 16 0.89 0.51—1.4524 Postal workers – – [0.31] 0.00 [0.01] 0.00 [0.91] 0.00 2 0.84 2 0.55 0.07—2.0025 Textile workers – – [0.20] 0.00 [0.02] 0.00 [0.94] 0.00 2 0.75 2 0.52 0.06—1.8826 Shoe and leather workers – – 1 12.23 [0.00] 0.00 [0.41] 0.00 2 1.92 3 1.95 0.40—5.7127 Smelting workers – – [0.31] 0.00 [0.03] 0.00 1 0.76 4 0.94 5 0.85 0.27—1.9728 Mechanics – – 3 1.48 [0.08] 0.00 8 1.24 17 0.85 28 0.98 0.65—1.4229 Plumbers – – [0.36] 0.00 [0.01] 0.00 [0.75] 0.00 2 0.87 2 0.58 0.07—2.1030 Welders – – [0.33] 0.00 [0.00] 0.00 1 1.18 [2.64] 0.00 1 0.26 0.01—1.4631 Electrical workers – – 2 2.27 [0.04] 0.00 2 0.69 6 0.88 10 0.94 0.45—1.7332 Wood workers – – 6 2.85 1 22.08 27 3.77 88 6.83 122 5.50 4.60—6.5633 Painters – – [0.47] 0.00 [0.02] 0.00 1 0.82 2 0.52 3 0.54 0.11—1.5934 "Other construction workers" – – 3 2.07 [0.09] 0.00 2 1.36 6 0.84 11 1.09 0.54—1.9435 Bricklayers – – [0.23] 0.00 – – 1 1.39 1 0.58 2 0.75 0.09—2.7136 Printers – – 1 4.96 [0.01] 0.00 1 1.31 1 0.49 3 0.99 0.20—2.8937 Chemical process workers – – 1 2.80 [0.01] 0.00 1 0.61 3 0.95 5 0.97 0.32—2.2638 Food workers – – 2 7.69 [0.08] 0.00 2 1.08 [3.25] 0.00 4 0.73 0.20—1.8839 Beverage workers – – [0.01] 0.00 [0.00] 0.00 [0.02] 0.00 1 5.58 1 4.58 0.12—25.5440 Tobacco workers – – [0.00] 0.00 – – [0.03] 0.00 [0.02] 0.00 [0.05] 0.00 0.00—78.2941 Glass makers etc – – [0.36] 0.00 1 67.31 [0.92] 0.00 1 0.29 2 0.42 0.05—1.5142 Packers – – [0.75] 0.00 [0.05] 0.00 1 0.36 6 0.95 7 0.71 0.28—1.4543 Engine operators – – 3 2.78 [0.06] 0.00 2 1.22 4 0.75 9 1.11 0.51—2.1244 Public safety workers – – 1 1.78 [0.04] 0.00 [1.18] 0.00 3 0.98 4 0.83 0.22—2.1145 Cooks and stewards – – [0.03] 0.00 [0.02] 0.00 [0.54] 0.00 [0.55] 0.00 [1.14] 0.00 0.00—3.2346 Domestic assistants – – [0.00] 0.00 [0.00] 0.00 [0.00] 0.00 [0.05] 0.00 [0.05] 0.00 0.00—71.9247 Waiters – – [0.03] 0.00 [0.00] 0.00 [0.23] 0.00 [0.30] 0.00 [0.56] 0.00 0.00—6.6148 Building caretakers – – [0.47] 0.00 [0.02] 0.00 1 1.61 3 1.27 4 1.15 0.31—2.9449 Chimney sweeps – – [0.04] 0.00 – – [0.06] 0.00 [0.18] 0.00 [0.28] 0.00 0.00—13.2050 Hairdressers – – [0.01] 0.00 [0.00] 0.00 [0.18] 0.00 [0.64] 0.00 [0.83] 0.00 0.00—4.4451 Launderers – – [0.01] 0.00 [0.00] 0.00 [0.11] 0.00 [0.46] 0.00 [0.58] 0.00 0.00—6.3452 Military personnel – – [0.21] 0.00 – – [1.06] 0.00 [1.87] 0.00 [3.15] 0.00 0.00—1.1753 "Other workers" – – [0.58] 0.00 [0.17] 0.00 1 0.19 2 0.26 3 0.22 0.05—0.6454 Economically inactive – – [2.49] 0.00 [0.12] 0.00 2 0.66 7 0.63 9 0.53 0.24—1.01
1-54 All categories – – 35 1.00 2 1.00 103 1.00 246 1.00 386 1.00 # REF. #
Obs = observed number of cases; SIR = standardised incidence ratio; 95% CI = 95% confidence interval
40 Index Prev Next

Acta Oncologica - Pukkala et al, 2008 Adenocarcinoma of the nose
Observed number of adenocarcinoma of the nose among women in the Nordic countries and standardised incidence ratios 1961-2005,by country and occupational category
Denmark Finland Iceland Norway Sweden Total
No Occupational category Obs SIR Obs SIR Obs SIR Obs SIR Obs SIR Obs SIR 95% CI
1 Technical workers, etc – – [0.14] 0.00 – – [0.04] 0.00 [0.30] 0.00 [0.49] 0.00 0.00—7.592 Laboratory assistants – – [0.08] 0.00 – – [0.07] 0.00 [0.08] 0.00 [0.23] 0.00 0.00—15.843 Physicians – – [0.04] 0.00 – – [0.03] 0.00 [0.07] 0.00 [0.14] 0.00 0.00—27.324 Dentists – – [0.04] 0.00 – – [0.02] 0.00 [0.05] 0.00 [0.12] 0.00 0.00—31.945 Nurses – – [0.42] 0.00 – – [0.48] 0.00 1 1.13 1 0.56 0.01—3.126 Assistant nurses – – 1 2.31 – – 1 2.06 2 1.29 4 1.62 0.44—4.157 "Other health workers" – – [0.34] 0.00 – – 1 1.92 [0.53] 0.00 1 0.72 0.02—4.038 Teachers – – [0.76] 0.00 – – 3 3.31 3 1.47 6 1.62 0.59—3.529 Religious workers etc – – [0.36] 0.00 – – [0.24] 0.00 [0.66] 0.00 [1.26] 0.00 0.00—2.9310 Artistic workers – – [0.06] 0.00 – – [0.08] 0.00 1 7.83 1 3.77 0.10—21.0011 Journalists – – [0.04] 0.00 – – [0.02] 0.00 [0.06] 0.00 [0.12] 0.00 0.00—31.8012 Administrators – – [0.13] 0.00 – – [0.25] 0.00 [0.29] 0.00 [0.67] 0.00 0.00—5.5213 Clerical workers – – 2 0.83 – – 4 1.23 5 1.00 11 1.03 0.52—1.8514 Sales agents – – [0.35] 0.00 – – [0.54] 0.00 1 1.43 1 0.63 0.02—3.4915 Shop workers – – 3 2.27 – – 2 0.67 1 0.33 6 0.82 0.30—1.7816 Farmers – – [0.74] 0.00 – – 1 0.45 [0.29] 0.00 1 0.31 0.01—1.7217 Gardeners – – 1 0.45 – – [1.33] 0.00 2 2.52 3 0.69 0.14—2.0118 Fishermen – – [0.00] 0.00 – – [0.01] 0.00 [0.00] 0.00 [0.02] 0.00 0.00—174.5219 Forestry workers – – [0.01] 0.00 – – [0.02] 0.00 [0.02] 0.00 [0.05] 0.00 0.00—74.2520 Miners and quarry workers – – [0.00] 0.00 – – [0.00] 0.00 [0.00] 0.00 [0.01] 0.00 0.00—436.9821 Seamen – – [0.00] 0.00 – – [0.00] 0.00 [0.00] 0.00 [0.01] 0.00 0.00—725.5822 Transport workers – – [0.06] 0.00 – – [0.01] 0.00 [0.05] 0.00 [0.13] 0.00 0.00—29.5023 Drivers – – [0.03] 0.00 – – [0.05] 0.00 [0.12] 0.00 [0.20] 0.00 0.00—18.4924 Postal workers – – [0.38] 0.00 – – 3 4.62 1 1.08 4 2.05 0.56—5.2425 Textile workers – – [0.86] 0.00 – – 2 1.60 1 0.56 3 0.77 0.16—2.2526 Shoe and leather workers – – [0.11] 0.00 – – [0.09] 0.00 [0.14] 0.00 [0.33] 0.00 0.00—11.1227 Smelting workers – – [0.02] 0.00 – – [0.01] 0.00 [0.04] 0.00 [0.07] 0.00 0.00—54.1028 Mechanics – – [0.11] 0.00 – – [0.10] 0.00 1 2.71 1 1.73 0.04—9.6329 Plumbers – – [0.00] 0.00 – – [0.00] 0.00 [0.00] 0.00 [0.00] 0.00 0.00—3104.2630 Welders – – [0.01] 0.00 – – [0.00] 0.00 [0.01] 0.00 [0.03] 0.00 0.00—133.7531 Electrical workers – – [0.08] 0.00 – – [0.10] 0.00 1 4.83 1 2.58 0.07—14.3632 Wood workers – – [0.22] 0.00 – – [0.03] 0.00 [0.06] 0.00 [0.31] 0.00 0.00—11.8533 Painters – – [0.03] 0.00 – – [0.01] 0.00 [0.02] 0.00 [0.05] 0.00 0.00—74.2734 "Other construction workers" – – [0.09] 0.00 – – [0.00] 0.00 [0.00] 0.00 [0.09] 0.00 0.00—40.8335 Bricklayers – – [0.00] 0.00 – – [0.00] 0.00 [0.00] 0.00 [0.00] 0.00 0.00—1203.8036 Printers – – [0.11] 0.00 – – [0.10] 0.00 [0.16] 0.00 [0.36] 0.00 0.00—10.1337 Chemical process workers – – [0.06] 0.00 – – [0.09] 0.00 [0.12] 0.00 [0.27] 0.00 0.00—13.5538 Food workers – – [0.30] 0.00 – – 1 1.70 [0.37] 0.00 1 0.80 0.02—4.4339 Beverage workers – – 1 60.83 – – [0.00] 0.00 [0.02] 0.00 1 22.60 0.57—125.9340 Tobacco workers – – [0.01] 0.00 – – [0.02] 0.00 [0.02] 0.00 [0.05] 0.00 0.00—77.9741 Glass makers etc – – [0.20] 0.00 – – [0.19] 0.00 1 3.03 1 1.38 0.04—7.7142 Packers – – 1 2.73 – – 1 2.20 1 2.02 3 2.28 0.47—6.6743 Engine operators – – [0.06] 0.00 – – [0.00] 0.00 [0.03] 0.00 [0.09] 0.00 0.00—40.1644 Public safety workers – – [0.01] 0.00 – – [0.05] 0.00 [0.04] 0.00 [0.11] 0.00 0.00—34.8145 Cooks and stewards – – 1 2.45 – – [0.68] 0.00 1 1.39 2 1.11 0.13—4.0046 Domestic assistants – – [0.41] 0.00 – – 1 0.59 3 1.55 4 0.99 0.27—2.5447 Waiters – – [0.35] 0.00 – – 1 1.46 1 1.36 2 1.13 0.14—4.0848 Building caretakers – – 1 0.73 – – 2 0.71 1 0.52 4 0.66 0.18—1.6849 Chimney sweeps – – [0.00] 0.00 – – [0.00] 0.00 [0.00] 0.00 [0.00] 0.00 0.00—3341.9950 Hairdressers – – 1 7.89 – – [0.17] 0.00 [0.31] 0.00 1 1.63 0.04—9.0951 Launderers – – [0.11] 0.00 – – [0.27] 0.00 [0.39] 0.00 [0.77] 0.00 0.00—4.7952 Military personnel – – [0.00] 0.00 – – [0.00] 0.00 [0.00] 0.00 [0.00] 0.00 0.00—1292.6753 "Other workers" – – 1 2.31 – – 1 0.70 [0.86] 0.00 2 0.74 0.09—2.6654 Economically inactive – – 12 1.37 – – 23 1.05 41 1.02 76 1.07 0.84—1.34
1-54 All categories – – 25 1.00 – – 47 1.00 69 1.00 141 1.00 # REF. #
Obs = observed number of cases; SIR = standardised incidence ratio; 95% CI = 95% confidence interval
41 Index Prev Next

Acta Oncologica - Pukkala et al, 2008 Laryngeal cancer
Observed number of laryngeal cancer among men in the Nordic countries and standardised incidence ratios 1961-2005, by country andoccupational category
Denmark Finland Iceland Norway Sweden Total
No Occupational category Obs SIR Obs SIR Obs SIR Obs SIR Obs SIR Obs SIR 95% CI
1 Technical workers, etc 266 0.83 95 0.50 1 0.47 71 0.52 466 0.81 899 0.74 0.69—0.792 Laboratory assistants 4 0.63 3 0.64 [0.38] 0.00 4 0.61 [2.68] 0.00 11 0.53 0.27—0.963 Physicians 17 0.66 4 0.37 1 1.29 13 0.76 12 0.47 47 0.59 0.43—0.784 Dentists 8 1.04 [2.28] 0.00 [0.22] 0.00 4 0.52 14 1.09 26 0.85 0.55—1.245 Nurses [0.38] 0.00 [0.51] 0.00 [0.01] 0.00 [0.78] 0.00 [1.22] 0.00 [2.89] 0.00 0.00—1.286 Assistant nurses 6 0.78 [0.47] 0.00 [0.09] 0.00 1 0.34 14 1.57 21 1.04 0.65—1.607 "Other health workers" 13 0.58 10 0.91 [0.21] 0.00 7 1.05 22 1.01 52 0.84 0.63—1.108 Teachers 75 0.53 32 0.41 1 0.35 46 0.48 99 0.68 253 0.55 0.48—0.629 Religious workers etc 47 0.83 27 0.63 1 0.53 31 0.64 78 0.70 184 0.70 0.61—0.8110 Artistic workers 17 0.97 19 1.22 [0.52] 0.00 16 1.10 40 1.14 92 1.11 0.89—1.3611 Journalists 10 1.18 9 1.16 2 6.53 3 0.47 26 1.59 50 1.27 0.95—1.6812 Administrators 323 0.92 108 0.88 6 1.28 156 0.91 254 1.14 847 0.97 0.91—1.0413 Clerical workers 131 0.85 61 0.74 5 0.96 115 0.87 261 1.08 573 0.93 0.86—1.0114 Sales agents 93 1.14 118 1.00 7 2.58 193 1.28 428 1.22 839 1.19 1.12—1.2815 Shop workers 344 0.99 49 1.01 5 2.67 52 0.86 130 1.16 580 1.02 0.94—1.1016 Farmers 252 0.38 413 0.69 1 0.14 148 0.37 238 0.39 1052 0.46 0.44—0.4917 Gardeners 52 0.56 55 0.67 [0.24] 0.00 56 0.54 128 0.57 291 0.58 0.51—0.6518 Fishermen 52 1.61 5 0.65 6 1.18 160 1.21 18 0.75 241 1.20 1.05—1.3619 Forestry workers 11 0.81 119 1.21 [0.04] 0.00 36 0.48 89 0.54 255 0.73 0.64—0.8220 Miners and quarry workers 4 0.96 16 1.00 [0.08] 0.00 24 1.09 36 0.88 80 0.96 0.76—1.2021 Seamen 62 1.75 30 1.47 4 3.06 196 1.75 86 2.41 378 1.85 1.67—2.0422 Transport workers 85 1.10 49 0.80 [2.50] 0.00 65 1.12 114 0.96 313 0.98 0.88—1.1023 Drivers 346 1.39 233 1.21 4 1.05 244 1.51 399 1.37 1226 1.37 1.29—1.4524 Postal workers 48 0.96 33 1.12 [0.44] 0.00 26 0.87 65 1.02 172 0.99 0.85—1.1525 Textile workers 47 1.10 25 1.27 1 1.35 30 0.91 79 1.09 182 1.08 0.94—1.2526 Shoe and leather workers 11 1.06 15 1.71 [0.15] 0.00 18 1.30 43 1.49 87 1.40 1.12—1.7327 Smelting workers 130 1.32 40 1.32 1 0.90 60 1.33 143 1.24 374 1.29 1.17—1.4328 Mechanics 285 1.08 213 1.12 2 0.54 268 1.20 588 1.11 1356 1.12 1.06—1.1829 Plumbers 21 0.89 26 0.82 1 1.71 28 1.07 73 1.20 149 1.04 0.89—1.2230 Welders – – 42 1.43 [0.22] 0.00 28 0.94 76 1.11 146 1.14 0.97—1.3431 Electrical workers 82 1.29 75 0.94 1 0.45 109 1.10 210 1.17 477 1.13 1.03—1.2332 Wood workers 170 0.94 200 0.95 2 0.99 193 0.77 254 0.72 819 0.82 0.77—0.8833 Painters 70 1.18 54 1.23 1 1.22 58 1.37 120 1.17 303 1.22 1.09—1.3634 "Other construction workers" 256 1.16 201 1.43 5 1.18 64 1.26 225 1.16 751 1.23 1.15—1.3235 Bricklayers 75 1.16 19 0.86 – – 29 1.15 44 0.95 167 1.05 0.90—1.2336 Printers 44 1.05 25 1.33 [0.69] 0.00 29 1.12 75 1.36 173 1.21 1.04—1.4137 Chemical process workers 58 1.53 42 1.29 [0.36] 0.00 72 1.28 75 0.87 247 1.16 1.02—1.3138 Food workers 166 1.34 25 1.07 6 1.99 86 1.34 96 1.11 379 1.26 1.14—1.3939 Beverage workers 43 2.89 3 1.91 [0.05] 0.00 2 2.64 11 2.20 59 2.65 2.02—3.4240 Tobacco workers 2 0.85 [0.26] 0.00 [0.00] 0.00 2 2.03 [0.39] 0.00 4 1.00 0.27—2.5741 Glass makers etc 81 1.12 37 1.08 1 1.80 40 1.26 125 1.32 284 1.22 1.08—1.3742 Packers 87 1.37 94 1.29 [1.74] 0.00 140 1.45 215 1.24 536 1.32 1.21—1.4343 Engine operators 80 1.20 116 1.23 2 0.79 65 1.15 172 1.21 435 1.20 1.09—1.3244 Public safety workers 60 0.98 45 0.81 [1.74] 0.00 55 1.34 73 0.89 233 0.97 0.85—1.1045 Cooks and stewards 14 2.88 7 2.20 1 1.14 47 2.51 27 1.84 96 2.27 1.84—2.7746 Domestic assistants [0.05] 0.00 [0.19] 0.00 [0.00] 0.00 1 6.52 [1.10] 0.00 1 0.67 0.02—3.7347 Waiters 59 5.91 4 1.29 [0.09] 0.00 23 2.86 16 2.05 102 3.52 2.90—4.2748 Building caretakers 86 1.34 54 1.13 [0.68] 0.00 40 1.90 75 1.14 255 1.28 1.13—1.4549 Chimney sweeps 2 1.16 4 1.09 – – [2.19] 0.00 7 1.46 13 1.05 0.56—1.8050 Hairdressers 13 0.71 1 0.99 [0.13] 0.00 12 1.94 40 2.35 66 1.55 1.20—1.9751 Launderers 4 0.44 1 1.01 [0.07] 0.00 5 1.35 15 1.23 25 0.96 0.62—1.4252 Military personnel 31 0.91 13 0.78 – – 33 0.91 53 1.10 130 0.96 0.81—1.1453 "Other workers" 318 1.61 77 1.33 10 1.45 200 1.12 230 1.10 835 1.28 1.20—1.3754 Economically inactive 226 1.32 516 1.50 7 1.40 125 1.40 448 1.41 1322 1.42 1.35—1.50
1-54 All categories 4787 1.00 3462 1.00 85 1.00 3529 1.00 6625 1.00 18488 1.00 # REF. #
Obs = observed number of cases; SIR = standardised incidence ratio; 95% CI = 95% confidence interval
42 Index Prev Next

Acta Oncologica - Pukkala et al, 2008 Laryngeal cancer
Observed number of laryngeal cancer among women in the Nordic countries and standardised incidence ratios 1961-2005, by countryand occupational category
Denmark Finland Iceland Norway Sweden Total
No Occupational category Obs SIR Obs SIR Obs SIR Obs SIR Obs SIR Obs SIR 95% CI
1 Technical workers, etc 5 1.50 [1.62] 0.00 [0.05] 0.00 [0.68] 0.00 4 0.98 9 0.92 0.42—1.752 Laboratory assistants 2 0.79 1 1.01 [0.09] 0.00 [0.82] 0.00 2 1.67 5 0.89 0.29—2.073 Physicians 1 0.91 [0.39] 0.00 [0.01] 0.00 [0.32] 0.00 [0.97] 0.00 1 0.36 0.01—2.004 Dentists [0.96] 0.00 1 2.21 [0.01] 0.00 [0.27] 0.00 1 1.41 2 0.83 0.10—3.015 Nurses 8 0.42 [4.98] 0.00 [0.40] 0.00 3 0.46 2 0.17 13 0.30 0.16—0.526 Assistant nurses 13 0.89 1 0.19 1 2.12 2 0.30 24 1.09 41 0.84 0.60—1.137 "Other health workers" 9 0.83 [4.07] 0.00 [0.12] 0.00 8 1.24 10 1.37 27 0.94 0.62—1.368 Teachers 8 0.32 3 0.32 [0.70] 0.00 6 0.50 17 0.62 34 0.46 0.32—0.649 Religious workers etc 3 0.91 4 0.98 [0.10] 0.00 [3.01] 0.00 3 0.33 10 0.51 0.25—0.9510 Artistic workers 2 1.27 1 1.39 [0.09] 0.00 1 1.13 2 1.13 6 1.19 0.44—2.6011 Journalists 1 2.74 [0.48] 0.00 [0.02] 0.00 [0.25] 0.00 [0.83] 0.00 1 0.51 0.01—2.8712 Administrators 15 1.55 [1.56] 0.00 [0.07] 0.00 2 0.70 6 1.56 23 1.28 0.81—1.9213 Clerical workers 94 0.92 35 1.16 2 0.98 47 1.21 65 0.94 243 1.00 0.89—1.1414 Sales agents 1 1.13 3 0.67 [0.21] 0.00 1 0.21 14 1.61 19 0.99 0.60—1.5515 Shop workers 56 0.85 8 0.47 1 0.79 30 0.95 42 1.04 137 0.88 0.74—1.0416 Farmers 15 0.32 7 0.68 3 3.43 8 0.41 2 0.61 35 0.43 0.30—0.6017 Gardeners 5 0.83 19 0.60 [0.03] 0.00 5 0.42 5 0.47 34 0.56 0.39—0.7918 Fishermen 1 4.09 [0.07] 0.00 [0.04] 0.00 [0.17] 0.00 [0.03] 0.00 1 1.83 0.05—10.1819 Forestry workers [0.07] 0.00 [0.13] 0.00 [0.00] 0.00 [0.24] 0.00 [0.23] 0.00 [0.67] 0.00 0.00—5.5020 Miners and quarry workers [0.00] 0.00 [0.06] 0.00 [0.00] 0.00 [0.01] 0.00 [0.06] 0.00 [0.13] 0.00 0.00—27.3721 Seamen – – [0.01] 0.00 – – [0.04] 0.00 [0.01] 0.00 [0.06] 0.00 0.00—62.9422 Transport workers [0.07] 0.00 2 2.29 [0.03] 0.00 [0.18] 0.00 3 4.66 5 2.79 0.90—6.5023 Drivers 3 1.73 [0.37] 0.00 [0.02] 0.00 [0.64] 0.00 6 3.48 9 2.00 0.92—3.8024 Postal workers 2 0.57 2 0.39 [0.44] 0.00 7 0.94 10 0.84 21 0.74 0.46—1.1325 Textile workers 19 0.85 7 0.61 [0.63] 0.00 8 0.75 18 0.82 52 0.77 0.58—1.0126 Shoe and leather workers 1 0.59 3 2.07 [0.03] 0.00 [0.78] 0.00 4 2.33 8 1.41 0.61—2.7827 Smelting workers [0.41] 0.00 1 2.88 [0.00] 0.00 1 9.54 [0.54] 0.00 2 1.42 0.17—5.1428 Mechanics 8 1.87 5 3.34 1 95.06 4 3.93 9 1.74 27 2.25 1.48—3.2829 Plumbers [0.03] 0.00 [0.00] 0.00 – – [0.01] 0.00 [0.01] 0.00 [0.05] 0.00 0.00—77.7430 Welders – – 1 8.65 [0.00] 0.00 [0.08] 0.00 1 4.86 2 4.93 0.60—17.8131 Electrical workers 12 2.02 3 3.31 [0.01] 0.00 2 1.78 4 1.38 21 1.93 1.19—2.9532 Wood workers 1 0.52 3 0.99 [0.01] 0.00 1 2.58 2 2.31 7 1.12 0.45—2.3133 Painters [0.07] 0.00 [0.35] 0.00 [0.00] 0.00 1 11.65 1 4.42 2 2.70 0.33—9.7534 "Other construction workers" [0.05] 0.00 10 8.09 [0.00] 0.00 [0.03] 0.00 [0.03] 0.00 10 7.39 3.54—13.5835 Bricklayers [0.01] 0.00 [0.04] 0.00 – – [0.00] 0.00 [0.00] 0.00 [0.05] 0.00 0.00—69.3636 Printers 3 1.40 3 2.08 [0.06] 0.00 4 4.19 4 1.91 14 2.09 1.14—3.5137 Chemical process workers 2 0.60 [0.77] 0.00 [0.03] 0.00 2 2.33 2 1.23 6 0.91 0.33—1.9738 Food workers 30 1.82 3 0.76 2 1.40 5 0.93 6 1.30 46 1.44 1.06—1.9239 Beverage workers 5 3.27 [0.22] 0.00 [0.00] 0.00 [0.05] 0.00 [0.28] 0.00 5 2.39 0.78—5.5840 Tobacco workers 5 2.35 [0.13] 0.00 – – [0.18] 0.00 [0.20] 0.00 5 1.89 0.62—4.4241 Glass makers etc 6 1.45 3 1.09 [0.04] 0.00 2 1.06 7 1.57 18 1.36 0.80—2.1442 Packers 1 0.85 6 1.22 [0.13] 0.00 5 1.11 5 0.78 17 0.99 0.58—1.5943 Engine operators [0.04] 0.00 4 4.97 [0.00] 0.00 [0.07] 0.00 [0.48] 0.00 4 2.87 0.78—7.3544 Public safety workers [0.11] 0.00 1 5.84 [0.02] 0.00 [0.54] 0.00 4 7.33 5 3.61 1.17—8.4245 Cooks and stewards [0.04] 0.00 4 0.75 [0.47] 0.00 12 2.08 16 1.88 32 1.59 1.09—2.2446 Domestic assistants 32 1.28 5 0.92 [0.13] 0.00 12 0.76 21 0.87 70 0.99 0.77—1.2547 Waiters 19 4.33 8 1.75 [0.05] 0.00 10 1.49 18 1.92 55 2.19 1.65—2.8548 Building caretakers 101 1.40 27 1.43 1 0.99 40 1.36 46 1.86 215 1.47 1.29—1.6849 Chimney sweeps [0.00] 0.00 [0.01] 0.00 – – [0.00] 0.00 [0.00] 0.00 [0.02] 0.00 0.00—183.9250 Hairdressers 2 0.46 9 5.30 [0.06] 0.00 4 2.31 6 1.40 21 1.74 1.07—2.6551 Launderers 7 0.87 5 3.25 1 7.50 4 1.69 5 1.08 22 1.31 0.82—1.9952 Military personnel [0.04] 0.00 [0.02] 0.00 – – [0.01] 0.00 [0.02] 0.00 [0.09] 0.00 0.00—43.2053 "Other workers" 38 1.86 5 0.88 [1.07] 0.00 23 1.52 15 1.33 81 1.51 1.20—1.8854 Economically inactive 486 0.97 134 1.08 4 1.11 169 1.01 462 0.93 1255 0.97 0.92—1.03
1-54 All categories 1022 1.00 337 1.00 16 1.00 429 1.00 874 1.00 2678 1.00 # REF. #
Obs = observed number of cases; SIR = standardised incidence ratio; 95% CI = 95% confidence interval
43 Index Prev Next

Acta Oncologica - Pukkala et al, 2008 Lung cancer
Observed number of lung cancer among men in the Nordic countries and standardised incidence ratios 1961-2005, by country andoccupational category
Denmark Finland Iceland Norway Sweden Total
No Occupational category Obs SIR Obs SIR Obs SIR Obs SIR Obs SIR Obs SIR 95% CI
1 Technical workers, etc 3019 0.91 1503 0.58 9 0.41 855 0.61 5154 0.93 10540 0.82 0.80—0.832 Laboratory assistants 70 1.04 55 0.89 3 0.71 51 0.75 17 0.70 196 0.87 0.75—1.003 Physicians 144 0.53 45 0.30 6 0.67 82 0.46 178 0.73 455 0.53 0.49—0.584 Dentists 36 0.46 9 0.27 [2.08] 0.00 55 0.68 59 0.47 159 0.50 0.43—0.585 Nurses [3.48] 0.00 1 0.20 1 23.30 4 0.56 4 0.42 10 0.40 0.19—0.736 Assistant nurses 61 0.78 1 0.25 [0.97] 0.00 24 0.76 84 1.01 170 0.86 0.74—1.007 "Other health workers" 210 0.87 93 0.59 1 0.41 62 0.90 199 0.95 565 0.83 0.76—0.908 Teachers 769 0.54 371 0.33 17 0.52 428 0.43 834 0.59 2419 0.49 0.47—0.519 Religious workers etc 377 0.61 296 0.51 22 1.03 253 0.50 783 0.75 1731 0.62 0.60—0.6510 Artistic workers 160 0.82 142 0.65 8 1.36 146 0.95 391 1.16 847 0.93 0.87—1.0011 Journalists 85 0.94 76 0.69 6 1.80 59 0.89 169 1.08 395 0.93 0.84—1.0212 Administrators 3415 0.90 1000 0.56 49 0.86 1523 0.84 1992 0.92 7979 0.83 0.81—0.8513 Clerical workers 1412 0.85 936 0.75 64 1.00 1177 0.84 2432 1.04 6021 0.90 0.88—0.9214 Sales agents 855 0.98 1365 0.80 44 1.35 1604 1.01 3796 1.12 7664 1.01 0.99—1.0315 Shop workers 3803 0.98 518 0.78 20 0.90 598 0.95 1204 1.10 6143 0.98 0.95—1.0016 Farmers 3465 0.47 7611 0.77 49 0.52 1995 0.46 2417 0.40 15537 0.56 0.55—0.5717 Gardeners 808 0.77 1056 0.84 4 1.36 637 0.57 1361 0.61 3866 0.68 0.66—0.7118 Fishermen 461 1.29 127 1.02 78 1.52 1654 1.17 227 0.96 2547 1.16 1.12—1.2119 Forestry workers 139 0.88 2074 1.41 [0.47] 0.00 486 0.60 878 0.54 3577 0.88 0.85—0.9120 Miners and quarry workers 48 0.97 450 1.93 1 1.18 325 1.40 621 1.57 1445 1.58 1.50—1.6721 Seamen 547 1.43 353 1.19 23 1.57 2036 1.74 624 1.82 3583 1.62 1.57—1.6822 Transport workers 896 1.07 729 0.78 37 1.22 601 0.97 1201 1.03 3464 0.96 0.93—1.0023 Drivers 3762 1.37 2897 1.05 46 1.07 2415 1.44 3762 1.34 12882 1.28 1.26—1.3124 Postal workers 536 1.05 312 0.72 4 0.70 278 0.88 653 1.06 1783 0.95 0.90—0.9925 Textile workers 527 1.07 291 0.95 6 0.62 309 0.87 721 1.02 1854 0.99 0.94—1.0426 Shoe and leather workers 133 1.08 148 1.07 5 2.34 159 1.07 297 1.04 742 1.06 0.99—1.1427 Smelting workers 1488 1.38 586 1.28 16 1.18 715 1.50 1422 1.27 4227 1.34 1.30—1.3828 Mechanics 3595 1.24 2979 1.10 43 1.07 3123 1.34 6463 1.27 16203 1.24 1.22—1.2629 Plumbers 399 1.55 591 1.33 8 1.20 420 1.55 807 1.37 2225 1.42 1.36—1.4830 Welders – – 443 1.17 2 0.83 444 1.44 909 1.38 1798 1.33 1.27—1.4031 Electrical workers 777 1.15 1055 0.96 26 1.09 1072 1.04 1780 1.03 4710 1.03 1.00—1.0632 Wood workers 2085 1.05 3801 1.16 17 0.71 2370 0.88 2668 0.77 10941 0.96 0.94—0.9733 Painters 858 1.30 792 1.21 8 0.81 593 1.32 1167 1.17 3418 1.23 1.19—1.2834 "Other construction workers" 3075 1.19 3402 1.59 45 0.96 741 1.40 2217 1.18 9480 1.32 1.29—1.3535 Bricklayers 899 1.24 477 1.40 – – 344 1.28 513 1.13 2233 1.25 1.20—1.3036 Printers 545 1.20 236 0.91 9 1.16 325 1.21 711 1.33 1826 1.20 1.14—1.2637 Chemical process workers 534 1.21 522 1.11 6 1.34 786 1.32 857 1.02 2705 1.15 1.11—1.1938 Food workers 1700 1.22 342 1.00 45 1.18 861 1.26 1000 1.18 3948 1.19 1.16—1.2339 Beverage workers 275 1.54 19 0.78 2 3.31 7 0.98 65 1.33 368 1.42 1.28—1.5740 Tobacco workers 51 1.76 8 2.07 [0.05] 0.00 18 1.74 7 1.87 84 1.79 1.43—2.2141 Glass makers etc 1007 1.21 537 1.08 7 1.06 470 1.42 1034 1.12 3055 1.18 1.14—1.2242 Packers 883 1.18 1390 1.28 21 0.96 1449 1.42 2170 1.29 5913 1.30 1.26—1.3343 Engine operators 815 1.11 1501 1.13 25 0.89 828 1.43 1679 1.22 4848 1.20 1.17—1.2344 Public safety workers 686 1.02 688 0.85 16 0.78 476 1.09 787 1.00 2653 0.97 0.93—1.0145 Cooks and stewards 89 1.64 41 0.99 17 1.81 292 1.51 240 1.74 679 1.56 1.44—1.6846 Domestic assistants 1 1.74 [3.29] 0.00 [0.03] 0.00 3 1.93 6 0.64 10 0.68 0.32—1.2447 Waiters 248 2.03 40 1.04 1 1.04 145 1.73 169 2.32 603 1.90 1.75—2.0548 Building caretakers 978 1.30 738 1.01 10 1.05 317 1.45 752 1.18 2795 1.19 1.15—1.2449 Chimney sweeps 30 1.58 62 1.14 – – 41 1.77 79 1.71 212 1.49 1.30—1.7050 Hairdressers 241 1.14 12 0.79 2 1.48 87 1.33 218 1.32 560 1.22 1.12—1.3351 Launderers 121 1.18 15 1.04 [0.92] 0.00 59 1.50 158 1.33 353 1.28 1.15—1.4252 Military personnel 292 0.87 137 0.63 – – 372 0.97 494 1.06 1295 0.92 0.88—0.9853 "Other workers" 2981 1.29 1121 1.29 97 1.15 2128 1.12 2186 1.07 8513 1.18 1.16—1.2154 Economically inactive 3010 1.19 8195 1.47 70 1.19 1032 1.15 3761 1.23 16068 1.33 1.31—1.35
1-54 All categories 53401 1.00 52189 1.00 996 1.00 37334 1.00 64377 1.00 208297 1.00 # REF. #
Obs = observed number of cases; SIR = standardised incidence ratio; 95% CI = 95% confidence interval
44 Index Prev Next

Acta Oncologica - Pukkala et al, 2008 Lung cancer
Observed number of lung cancer among women in the Nordic countries and standardised incidence ratios 1961-2005, by country andoccupational category
Denmark Finland Iceland Norway Sweden Total
No Occupational category Obs SIR Obs SIR Obs SIR Obs SIR Obs SIR Obs SIR 95% CI
1 Technical workers, etc 91 1.06 51 0.91 1 0.42 26 1.05 145 0.96 314 0.98 0.88—1.102 Laboratory assistants 60 0.91 36 1.09 5 1.38 24 0.82 37 0.71 162 0.88 0.76—1.033 Physicians 24 0.86 13 0.97 [0.65] 0.00 5 0.45 20 0.54 62 0.68 0.52—0.884 Dentists 11 0.45 10 0.63 [0.27] 0.00 5 0.54 20 0.78 46 0.61 0.45—0.815 Nurses 351 0.72 121 0.73 10 0.56 143 0.60 306 0.70 931 0.69 0.65—0.746 Assistant nurses 447 1.19 163 0.91 17 0.69 241 0.99 814 1.00 1682 1.03 0.98—1.087 "Other health workers" 185 0.67 108 0.78 [4.99] 0.00 189 0.83 243 0.88 725 0.79 0.73—0.848 Teachers 373 0.59 186 0.59 12 0.39 215 0.51 559 0.55 1345 0.55 0.53—0.589 Religious workers etc 48 0.57 92 0.66 2 0.43 70 0.65 292 0.84 504 0.74 0.68—0.8110 Artistic workers 28 0.70 26 1.07 3 0.77 27 0.88 81 1.25 165 1.01 0.87—1.1711 Journalists 11 1.14 33 2.06 1 1.01 8 0.91 38 1.23 91 1.37 1.10—1.6812 Administrators 285 1.16 71 1.35 3 0.91 88 0.91 134 0.94 581 1.07 0.99—1.1613 Clerical workers 2652 1.01 1255 1.25 79 0.82 1427 1.04 2964 1.18 8377 1.10 1.08—1.1314 Sales agents 19 0.85 191 1.26 10 0.93 180 1.17 368 1.22 768 1.20 1.12—1.2915 Shop workers 1776 1.06 603 1.07 75 1.19 1169 1.07 1617 1.19 5240 1.10 1.07—1.1316 Farmers 516 0.44 192 0.54 20 0.42 301 0.47 60 0.51 1089 0.46 0.44—0.4917 Gardeners 105 0.69 544 0.52 3 1.91 183 0.46 233 0.67 1068 0.54 0.51—0.5818 Fishermen 7 1.13 2 0.90 1 0.63 4 0.68 1 0.89 15 0.89 0.50—1.4619 Forestry workers 2 1.21 4 0.94 1 4.60 7 0.83 10 1.23 24 1.06 0.68—1.5720 Miners and quarry workers [0.11] 0.00 1 0.54 [0.04] 0.00 2 4.25 [2.16] 0.00 3 0.65 0.13—1.8921 Seamen – – 1 2.15 [0.00] 0.00 [1.37] 0.00 [0.28] 0.00 1 0.47 0.01—2.6322 Transport workers 6 3.53 60 2.08 2 1.18 12 1.89 34 1.52 114 1.87 1.56—2.2523 Drivers 54 1.21 20 1.60 1 1.31 23 1.03 112 1.75 210 1.46 1.27—1.6724 Postal workers 85 0.96 172 1.00 18 0.82 238 0.94 449 1.08 962 1.01 0.95—1.0825 Textile workers 759 1.32 361 0.94 31 0.79 397 1.14 791 1.12 2339 1.14 1.09—1.1926 Shoe and leather workers 53 1.22 43 0.89 1 0.49 25 0.98 69 1.25 191 1.09 0.95—1.2627 Smelting workers 21 1.96 14 1.23 [0.10] 0.00 5 1.31 22 1.14 62 1.37 1.05—1.7528 Mechanics 189 1.70 82 1.67 [0.39] 0.00 62 1.77 272 1.49 605 1.60 1.48—1.7329 Plumbers 1 1.45 [0.11] 0.00 – – [0.30] 0.00 2 6.17 3 2.10 0.43—6.1430 Welders – – 5 1.35 [0.02] 0.00 5 1.64 15 1.89 25 1.70 1.10—2.5131 Electrical workers 289 1.86 57 1.89 1 3.09 77 1.96 164 1.60 588 1.79 1.66—1.9532 Wood workers 74 1.48 103 1.03 1 1.58 20 1.45 37 1.18 235 1.20 1.06—1.3633 Painters 3 1.60 20 1.72 [0.17] 0.00 9 2.96 15 1.88 47 1.90 1.40—2.5334 "Other construction workers" 3 2.12 88 2.17 [0.10] 0.00 1 0.85 4 3.42 96 2.17 1.75—2.6535 Bricklayers [0.27] 0.00 1 0.76 – – [0.08] 0.00 [0.04] 0.00 1 0.59 0.01—3.2736 Printers 74 1.33 72 1.49 8 2.46 54 1.69 153 2.12 361 1.71 1.54—1.9037 Chemical process workers 153 1.77 20 0.79 2 1.33 41 1.42 75 1.36 291 1.48 1.32—1.6638 Food workers 529 1.25 158 1.19 120 1.51 227 1.27 213 1.41 1247 1.29 1.22—1.3739 Beverage workers 82 2.05 10 1.33 [0.21] 0.00 3 1.65 15 1.65 110 1.88 1.56—2.2640 Tobacco workers 128 2.30 6 1.42 – – 23 4.10 12 1.74 169 2.33 2.01—2.7141 Glass makers etc 161 1.50 115 1.26 3 1.44 102 1.58 224 1.48 605 1.45 1.34—1.5742 Packers 48 1.59 230 1.41 10 1.27 238 1.56 331 1.53 857 1.50 1.41—1.6143 Engine operators 5 4.61 68 2.61 1 9.61 7 2.74 44 2.43 125 2.61 2.19—3.1144 Public safety workers 1 0.35 8 1.38 1 0.67 22 1.21 29 1.37 61 1.23 0.94—1.5845 Cooks and stewards 1 0.94 191 1.06 24 0.81 199 1.07 346 1.25 761 1.13 1.05—1.2146 Domestic assistants 709 1.11 153 0.84 6 0.68 465 0.90 923 1.08 2256 1.02 0.98—1.0747 Waiters 276 2.40 320 2.12 7 2.08 396 1.74 525 1.71 1524 1.89 1.80—1.9948 Building caretakers 2319 1.26 818 1.31 68 1.12 1262 1.25 1190 1.41 5657 1.29 1.26—1.3249 Chimney sweeps [0.11] 0.00 [0.32] 0.00 – – [0.15] 0.00 [0.03] 0.00 [0.61] 0.00 0.00—6.0650 Hairdressers 105 0.94 81 1.43 1 0.33 86 1.46 223 1.48 496 1.30 1.19—1.4251 Launderers 269 1.31 58 1.13 13 1.33 89 1.15 183 1.24 612 1.25 1.15—1.3552 Military personnel [1.07] 0.00 [0.51] 0.00 – – 1 2.93 [0.79] 0.00 1 0.37 0.01—2.0653 "Other workers" 719 1.37 230 1.21 61 1.01 528 1.02 540 1.40 2078 1.23 1.18—1.2954 Economically inactive 12141 0.94 4032 0.97 244 1.17 5086 1.01 14458 0.90 35961 0.94 0.93—0.95
1-54 All categories 26248 1.00 11299 1.00 867 1.00 14017 1.00 29412 1.00 81843 1.00 # REF. #
Obs = observed number of cases; SIR = standardised incidence ratio; 95% CI = 95% confidence interval
45 Index Prev Next

Acta Oncologica - Pukkala et al, 2008 Adenocarcinoma of the lung
Observed number of adenocarcinoma of the lung among men in the Nordic countries and standardised incidence ratios 1961-2005, bycountry and occupational category
Denmark Finland Iceland Norway Sweden Total
No Occupational category Obs SIR Obs SIR Obs SIR Obs SIR Obs SIR Obs SIR 95% CI
1 Technical workers, etc 758 1.09 289 0.74 3 0.47 230 0.74 1114 0.96 2394 0.93 0.90—0.972 Laboratory assistants 17 1.22 9 0.94 [1.23] 0.00 10 0.71 6 0.83 42 0.91 0.66—1.233 Physicians 45 0.82 9 0.40 2 0.78 20 0.56 41 0.76 117 0.69 0.58—0.834 Dentists 11 0.66 2 0.44 [0.62] 0.00 13 0.81 9 0.35 35 0.55 0.38—0.765 Nurses [0.83] 0.00 1 1.01 [0.01] 0.00 2 1.02 1 0.30 4 0.57 0.15—1.456 Assistant nurses 8 0.47 [0.89] 0.00 [0.29] 0.00 4 0.69 11 0.61 23 0.55 0.35—0.827 "Other health workers" 45 0.93 15 0.68 1 1.43 7 0.52 50 1.18 118 0.93 0.77—1.118 Teachers 183 0.60 71 0.43 4 0.43 114 0.55 214 0.68 586 0.58 0.54—0.639 Religious workers etc 98 0.82 65 0.76 6 0.97 63 0.63 201 0.88 433 0.80 0.73—0.8810 Artistic workers 20 0.53 25 0.79 2 1.19 40 1.32 94 1.33 181 1.05 0.91—1.2211 Journalists 21 1.14 12 0.77 1 1.03 9 0.67 35 1.09 78 0.97 0.76—1.2012 Administrators 765 1.02 200 0.80 16 1.00 284 0.82 383 0.94 1648 0.93 0.89—0.9813 Clerical workers 310 0.92 162 0.98 14 0.78 247 0.90 496 1.09 1229 0.98 0.93—1.0414 Sales agents 196 1.09 218 0.91 17 1.85 324 1.10 719 1.08 1474 1.06 1.01—1.1215 Shop workers 740 0.99 86 0.86 5 0.79 119 0.92 250 1.13 1200 1.00 0.94—1.0516 Farmers 603 0.44 837 0.72 14 0.54 352 0.50 470 0.49 2276 0.54 0.52—0.5617 Gardeners 135 0.69 118 0.71 [0.82] 0.00 89 0.45 240 0.62 582 0.62 0.57—0.6718 Fishermen 93 1.30 20 1.35 19 1.24 242 0.98 39 0.98 413 1.07 0.97—1.1719 Forestry workers 20 0.70 234 1.17 [0.13] 0.00 63 0.47 157 0.56 474 0.74 0.67—0.8120 Miners and quarry workers 10 1.11 55 1.72 [0.24] 0.00 52 1.21 70 0.98 187 1.20 1.04—1.3921 Seamen 123 1.52 59 1.43 7 1.65 412 1.78 121 1.87 722 1.71 1.59—1.8422 Transport workers 165 0.98 103 0.82 12 1.41 115 0.98 246 1.09 641 0.99 0.92—1.0723 Drivers 697 1.25 466 1.17 14 1.13 420 1.28 705 1.25 2302 1.24 1.19—1.2924 Postal workers 137 1.23 46 0.77 1 0.63 47 0.81 131 1.11 362 1.04 0.94—1.1525 Textile workers 112 1.21 39 0.98 2 0.74 62 0.99 129 1.05 344 1.08 0.97—1.2026 Shoe and leather workers 25 1.12 17 0.99 1 1.72 27 1.10 40 0.89 110 1.01 0.83—1.2127 Smelting workers 296 1.34 85 1.40 5 1.31 120 1.37 256 1.28 762 1.33 1.24—1.4328 Mechanics 744 1.27 436 1.13 16 1.37 622 1.34 1302 1.27 3120 1.27 1.22—1.3129 Plumbers 93 1.76 99 1.52 4 2.09 87 1.58 128 1.09 411 1.40 1.27—1.5430 Welders – – 84 1.38 [0.71] 0.00 104 1.56 220 1.55 408 1.51 1.37—1.6731 Electrical workers 158 1.11 148 0.91 8 1.14 211 1.02 340 0.94 865 0.98 0.92—1.0532 Wood workers 402 1.03 462 1.10 7 1.03 427 0.88 469 0.77 1767 0.92 0.88—0.9733 Painters 152 1.15 108 1.23 2 0.71 108 1.34 191 1.05 561 1.16 1.06—1.2634 "Other construction workers" 532 1.11 423 1.53 14 1.03 118 1.17 337 1.01 1424 1.19 1.13—1.2535 Bricklayers 182 1.29 66 1.49 – – 59 1.21 74 0.92 381 1.21 1.10—1.3436 Printers 99 1.05 46 1.20 3 1.34 80 1.52 130 1.21 358 1.22 1.10—1.3537 Chemical process workers 94 1.14 79 1.19 1 0.80 117 1.12 139 0.94 430 1.07 0.97—1.1838 Food workers 296 1.09 39 0.81 11 1.04 139 1.13 161 1.03 646 1.06 0.98—1.1439 Beverage workers 49 1.45 3 0.97 [0.17] 0.00 [1.89] 0.00 10 1.21 62 1.31 1.01—1.6840 Tobacco workers 7 1.39 1 1.84 [0.01] 0.00 1 0.58 1 1.35 10 1.24 0.59—2.2841 Glass makers etc 171 1.08 71 1.03 2 1.08 73 1.14 181 1.06 498 1.07 0.98—1.1742 Packers 139 1.01 205 1.42 7 1.15 254 1.40 306 1.05 911 1.20 1.12—1.2843 Engine operators 149 1.02 222 1.14 5 0.62 171 1.44 329 1.21 876 1.18 1.11—1.2644 Public safety workers 141 1.08 95 0.86 3 0.52 97 1.21 161 0.99 497 1.02 0.93—1.1145 Cooks and stewards 14 1.26 11 1.74 5 1.82 73 1.87 50 1.69 153 1.72 1.47—2.0146 Domestic assistants [0.12] 0.00 [0.36] 0.00 [0.01] 0.00 2 5.62 2 0.78 4 1.18 0.32—3.0147 Waiters 53 2.26 11 1.85 [0.28] 0.00 27 1.68 35 2.23 126 2.05 1.72—2.4448 Building caretakers 181 1.29 82 0.87 2 0.78 58 1.44 132 1.17 455 1.17 1.06—1.2849 Chimney sweeps 2 0.51 5 0.70 – – 10 2.35 17 1.83 34 1.38 0.96—1.9350 Hairdressers 51 1.31 3 1.57 1 2.54 15 1.28 40 1.35 110 1.33 1.10—1.6051 Launderers 22 1.14 2 1.03 [0.25] 0.00 9 1.28 31 1.44 64 1.28 0.99—1.6352 Military personnel 83 1.10 30 0.84 – – 93 1.14 96 0.99 302 1.04 0.93—1.1653 "Other workers" 552 1.24 133 1.18 31 1.31 327 1.02 397 1.12 1440 1.15 1.09—1.2154 Economically inactive 391 1.00 748 1.29 15 0.90 164 1.11 661 1.21 1979 1.18 1.13—1.23
1-54 All categories 10390 1.00 6855 1.00 283 1.00 6933 1.00 12168 1.00 36629 1.00 # REF. #
Obs = observed number of cases; SIR = standardised incidence ratio; 95% CI = 95% confidence interval
46 Index Prev Next

Acta Oncologica - Pukkala et al, 2008 Adenocarcinoma of the lung
Observed number of adenocarcinoma of the lung among women in the Nordic countries and standardised incidence ratios 1961-2005,by country and occupational category
Denmark Finland Iceland Norway Sweden Total
No Occupational category Obs SIR Obs SIR Obs SIR Obs SIR Obs SIR Obs SIR 95% CI
1 Technical workers, etc 30 1.09 18 1.06 [0.90] 0.00 13 1.61 58 1.05 119 1.10 0.92—1.312 Laboratory assistants 21 0.94 13 1.34 1 0.72 9 0.97 13 0.61 57 0.89 0.67—1.153 Physicians 8 0.90 6 1.44 [0.23] 0.00 2 0.56 9 0.64 25 0.81 0.52—1.194 Dentists 5 0.64 5 1.17 [0.10] 0.00 3 1.04 7 0.77 20 0.83 0.51—1.285 Nurses 123 0.80 40 0.81 2 0.30 49 0.65 119 0.75 333 0.75 0.68—0.846 Assistant nurses 149 1.23 52 1.03 4 0.45 88 1.16 302 1.01 595 1.07 0.99—1.167 "Other health workers" 74 0.85 27 0.68 [1.87] 0.00 71 1.00 95 0.93 267 0.88 0.78—1.008 Teachers 131 0.63 85 0.96 8 0.70 84 0.62 243 0.65 551 0.67 0.62—0.739 Religious workers etc 20 0.74 25 0.57 [1.70] 0.00 26 0.77 110 0.84 181 0.76 0.66—0.8810 Artistic workers 10 0.82 4 0.56 1 0.69 10 1.06 28 1.18 53 0.98 0.73—1.2811 Journalists 2 0.64 13 2.82 [0.38] 0.00 6 2.16 11 0.96 32 1.43 0.98—2.0212 Administrators 86 1.15 13 0.85 2 1.69 22 0.72 42 0.80 165 0.95 0.81—1.1013 Clerical workers 933 1.11 369 1.27 26 0.73 455 1.08 1095 1.21 2878 1.16 1.11—1.2014 Sales agents 9 1.30 48 1.17 5 1.30 59 1.28 132 1.27 253 1.25 1.11—1.4215 Shop workers 520 1.01 166 1.07 35 1.53 348 1.07 529 1.17 1598 1.09 1.03—1.1416 Farmers 175 0.48 49 0.56 8 0.48 126 0.67 24 0.57 382 0.55 0.49—0.6017 Gardeners 38 0.81 183 0.68 2 3.63 68 0.59 85 0.74 376 0.69 0.62—0.7618 Fishermen 4 2.06 [0.59] 0.00 1 1.66 [1.78] 0.00 [0.39] 0.00 5 0.94 0.31—2.2019 Forestry workers [0.52] 0.00 1 0.87 1 12.96 1 0.40 1 0.35 4 0.57 0.15—1.4520 Miners and quarry workers [0.03] 0.00 [0.48] 0.00 [0.01] 0.00 [0.15] 0.00 [0.78] 0.00 [1.45] 0.00 0.00—2.5421 Seamen – – [0.15] 0.00 [0.00] 0.00 [0.42] 0.00 [0.11] 0.00 [0.68] 0.00 0.00—5.4522 Transport workers 1 1.92 14 1.87 1 1.62 3 1.50 12 1.55 31 1.69 1.15—2.4023 Drivers 16 1.14 8 2.24 [0.29] 0.00 9 1.29 43 1.83 76 1.57 1.24—1.9724 Postal workers 24 0.88 38 0.82 6 0.76 68 0.88 146 1.03 282 0.94 0.84—1.0625 Textile workers 252 1.41 86 0.84 11 0.82 132 1.30 239 1.07 720 1.16 1.08—1.2526 Shoe and leather workers 19 1.39 12 0.94 1 1.44 4 0.54 26 1.48 62 1.19 0.91—1.5227 Smelting workers 3 0.89 4 1.33 [0.04] 0.00 1 0.82 9 1.31 17 1.17 0.68—1.8728 Mechanics 50 1.40 15 1.11 [0.16] 0.00 17 1.62 84 1.31 166 1.34 1.15—1.5629 Plumbers 1 5.42 [0.03] 0.00 – – [0.10] 0.00 [0.13] 0.00 1 2.26 0.06—12.5930 Welders – – [1.09] 0.00 [0.01] 0.00 1 1.01 4 1.33 5 0.98 0.32—2.2931 Electrical workers 87 1.73 18 2.00 1 8.71 22 1.85 60 1.67 188 1.75 1.52—2.0232 Wood workers 22 1.39 20 0.76 1 4.64 4 0.94 13 1.15 60 1.04 0.79—1.3433 Painters [0.60] 0.00 5 1.59 [0.06] 0.00 2 2.18 5 1.78 12 1.59 0.82—2.7934 "Other construction workers" 2 4.56 17 1.66 [0.04] 0.00 1 2.75 1 2.15 21 1.82 1.13—2.7835 Bricklayers [0.08] 0.00 [0.35] 0.00 – – [0.02] 0.00 [0.01] 0.00 [0.47] 0.00 0.00—7.8636 Printers 25 1.43 20 1.53 3 2.61 12 1.24 41 1.66 101 1.53 1.26—1.8637 Chemical process workers 49 1.83 3 0.45 2 3.85 8 0.93 28 1.52 90 1.47 1.18—1.8138 Food workers 152 1.15 45 1.30 30 1.07 56 1.07 58 1.19 341 1.15 1.04—1.2839 Beverage workers 19 1.55 1 0.52 [0.08] 0.00 [0.55] 0.00 3 1.03 23 1.30 0.82—1.9540 Tobacco workers 41 2.36 3 2.74 – – 6 3.67 2 0.87 52 2.32 1.74—3.0541 Glass makers etc 40 1.16 26 1.06 2 2.67 29 1.51 78 1.53 175 1.35 1.16—1.5642 Packers 13 1.38 53 1.22 2 0.74 63 1.40 107 1.48 238 1.38 1.21—1.5643 Engine operators 3 7.65 14 1.97 1 28.32 4 4.84 12 1.77 34 2.24 1.55—3.1344 Public safety workers [0.81] 0.00 2 1.24 [0.51] 0.00 4 0.74 14 1.73 20 1.22 0.74—1.8845 Cooks and stewards 1 3.03 53 1.10 7 0.70 68 1.26 116 1.30 245 1.21 1.07—1.3746 Domestic assistants 237 1.20 52 1.03 2 0.69 149 0.98 323 1.07 763 1.08 1.01—1.1647 Waiters 75 2.08 65 1.56 3 2.58 114 1.68 152 1.53 409 1.66 1.51—1.8348 Building caretakers 642 1.14 182 1.11 27 1.29 340 1.13 375 1.30 1566 1.17 1.11—1.2349 Chimney sweeps [0.03] 0.00 [0.09] 0.00 – – [0.04] 0.00 [0.01] 0.00 [0.17] 0.00 0.00—21.6750 Hairdressers 40 1.10 23 1.47 [1.07] 0.00 28 1.56 80 1.52 171 1.38 1.19—1.6151 Launderers 87 1.40 18 1.37 4 1.24 27 1.20 60 1.29 196 1.33 1.15—1.5352 Military personnel [0.32] 0.00 [0.17] 0.00 – – [0.11] 0.00 [0.33] 0.00 [0.93] 0.00 0.00—3.9553 "Other workers" 209 1.28 52 1.01 19 0.90 158 1.01 173 1.31 611 1.16 1.08—1.2654 Economically inactive 3608 0.93 1021 0.97 87 1.20 1427 0.95 4640 0.90 10783 0.93 0.91—0.94
1-54 All categories 8056 1.00 2987 1.00 306 1.00 4197 1.00 9807 1.00 25353 1.00 # REF. #
Obs = observed number of cases; SIR = standardised incidence ratio; 95% CI = 95% confidence interval
47 Index Prev Next

Acta Oncologica - Pukkala et al, 2008 Small cell cancer of the lung
Observed number of small cell cancer of the lung among men in the Nordic countries and standardised incidence ratios 1961-2005, bycountry and occupational category
Denmark Finland Iceland Norway Sweden Total
No Occupational category Obs SIR Obs SIR Obs SIR Obs SIR Obs SIR Obs SIR 95% CI
1 Technical workers, etc – – 251 0.60 [4.16] 0.00 152 0.60 463 0.80 866 0.69 0.65—0.742 Laboratory assistants – – 9 0.90 1 1.20 11 0.92 2 0.59 23 0.88 0.56—1.323 Physicians – – 6 0.25 2 1.08 13 0.43 12 0.47 33 0.40 0.28—0.574 Dentists – – 1 0.20 [0.41] 0.00 9 0.66 6 0.48 16 0.51 0.29—0.825 Nurses – – [0.85] 0.00 [0.01] 0.00 [1.37] 0.00 [1.28] 0.00 [3.51] 0.00 0.00—1.056 Assistant nurses – – [0.72] 0.00 [0.18] 0.00 3 0.57 6 0.75 9 0.63 0.29—1.207 "Other health workers" – – 14 0.56 [0.49] 0.00 9 0.77 17 0.84 40 0.70 0.50—0.958 Teachers – – 53 0.30 3 0.47 63 0.37 75 0.49 194 0.38 0.33—0.449 Religious workers etc – – 43 0.47 3 0.72 48 0.56 66 0.62 160 0.55 0.48—0.6510 Artistic workers – – 32 0.92 1 0.85 27 1.03 47 1.36 107 1.10 0.91—1.3411 Journalists – – 13 0.74 2 3.04 17 1.48 18 1.17 50 1.11 0.82—1.4712 Administrators – – 150 0.54 6 0.52 242 0.79 160 0.83 558 0.71 0.65—0.7713 Clerical workers – – 134 0.70 16 1.26 219 0.91 168 0.76 537 0.81 0.74—0.8814 Sales agents – – 216 0.80 10 1.51 254 0.95 337 1.06 817 0.95 0.88—1.0215 Shop workers – – 92 0.85 3 0.69 89 0.81 111 1.00 295 0.89 0.79—0.9916 Farmers – – 1107 0.75 11 0.59 299 0.44 177 0.42 1594 0.62 0.59—0.6517 Gardeners – – 168 0.86 [0.55] 0.00 114 0.62 126 0.71 408 0.73 0.66—0.8018 Fishermen – – 18 0.98 23 2.28 278 1.20 24 1.34 343 1.23 1.11—1.3719 Forestry workers – – 370 1.59 [0.09] 0.00 70 0.54 90 0.70 530 1.08 0.99—1.1720 Miners and quarry workers – – 83 2.22 1 5.84 47 1.20 44 1.34 175 1.59 1.38—1.8521 Seamen – – 50 1.06 4 1.35 334 1.65 59 1.92 447 1.58 1.44—1.7322 Transport workers – – 105 0.71 5 0.81 135 1.27 128 1.07 373 0.98 0.89—1.0923 Drivers – – 495 1.11 5 0.58 446 1.53 376 1.37 1322 1.29 1.23—1.3724 Postal workers – – 49 0.72 1 0.88 42 0.81 48 0.87 140 0.79 0.67—0.9425 Textile workers – – 38 0.81 2 1.05 38 0.65 62 1.10 140 0.85 0.72—1.0126 Shoe and leather workers – – 18 0.87 1 2.39 24 1.01 20 1.06 63 0.99 0.76—1.2627 Smelting workers – – 97 1.36 2 0.74 128 1.60 134 1.45 361 1.46 1.32—1.6228 Mechanics – – 520 1.21 9 1.13 528 1.30 628 1.25 1685 1.25 1.19—1.3129 Plumbers – – 101 1.40 1 0.76 72 1.52 93 1.61 267 1.50 1.33—1.6930 Welders – – 58 0.92 [0.47] 0.00 81 1.45 98 1.36 237 1.24 1.09—1.4131 Electrical workers – – 180 1.01 3 0.64 171 0.95 181 1.01 535 0.99 0.91—1.0832 Wood workers – – 626 1.24 2 0.42 401 0.89 233 0.85 1262 1.02 0.97—1.0833 Painters – – 141 1.38 [2.03] 0.00 93 1.25 102 1.21 336 1.28 1.15—1.4234 "Other construction workers" – – 544 1.63 12 1.30 143 1.59 196 1.32 895 1.54 1.44—1.6435 Bricklayers – – 81 1.53 – – 57 1.26 48 1.31 186 1.38 1.19—1.5936 Printers – – 32 0.78 2 1.30 49 1.07 64 1.25 147 1.05 0.90—1.2437 Chemical process workers – – 93 1.24 2 2.23 120 1.23 83 1.27 298 1.25 1.11—1.4038 Food workers – – 56 1.03 7 0.95 143 1.26 76 1.02 282 1.13 1.00—1.2739 Beverage workers – – 3 0.81 [0.12] 0.00 2 1.45 4 1.16 9 1.04 0.48—1.9740 Tobacco workers – – [0.59] 0.00 [0.01] 0.00 6 3.58 1 2.79 7 2.65 1.07—5.4641 Glass makers etc – – 85 1.08 2 1.55 95 1.68 104 1.31 286 1.33 1.18—1.4942 Packers – – 207 1.22 4 0.93 240 1.43 153 1.19 604 1.28 1.18—1.3943 Engine operators – – 237 1.11 6 1.08 134 1.32 173 1.34 550 1.22 1.13—1.3344 Public safety workers – – 102 0.80 5 1.23 80 1.09 73 0.94 260 0.92 0.82—1.0445 Cooks and stewards – – 4 0.59 6 3.25 34 1.01 24 1.75 68 1.22 0.94—1.5446 Domestic assistants – – [0.44] 0.00 [0.01] 0.00 1 3.52 [1.00] 0.00 1 0.58 0.01—3.2347 Waiters – – 6 0.96 [0.18] 0.00 26 1.81 16 2.11 48 1.69 1.25—2.2548 Building caretakers – – 115 1.02 3 1.58 47 1.30 67 1.43 232 1.17 1.03—1.3449 Chimney sweeps – – 9 1.04 – – 5 1.28 5 1.12 19 1.11 0.67—1.7450 Hairdressers – – 1 0.44 [0.27] 0.00 9 0.83 16 1.12 26 0.94 0.61—1.3751 Launderers – – 3 1.33 [0.18] 0.00 4 0.61 13 1.24 20 1.03 0.63—1.5852 Military personnel – – 20 0.55 – – 70 1.02 43 0.84 133 0.85 0.72—1.0153 "Other workers" – – 190 1.41 19 1.12 378 1.24 152 0.97 739 1.21 1.12—1.3054 Economically inactive – – 1024 1.31 13 1.11 146 1.09 283 1.34 1466 1.29 1.23—1.36
1-54 All categories – – 8050 1.00 198 1.00 6246 1.00 5705 1.00 20199 1.00 # REF. #
Obs = observed number of cases; SIR = standardised incidence ratio; 95% CI = 95% confidence interval
48 Index Prev Next

Acta Oncologica - Pukkala et al, 2008 Small cell cancer of the lung
Observed number of small cell cancer of the lung among women in the Nordic countries and standardised incidence ratios 1961-2005,by country and occupational category
Denmark Finland Iceland Norway Sweden Total
No Occupational category Obs SIR Obs SIR Obs SIR Obs SIR Obs SIR Obs SIR 95% CI
1 Technical workers, etc – – 6 0.62 [0.36] 0.00 3 0.57 17 0.80 26 0.71 0.46—1.042 Laboratory assistants – – 5 0.86 [0.58] 0.00 6 0.96 4 0.51 15 0.74 0.41—1.213 Physicians – – 1 0.42 [0.10] 0.00 [2.32] 0.00 3 0.55 4 0.39 0.11—1.004 Dentists – – 1 0.39 [0.05] 0.00 1 0.52 3 0.85 5 0.62 0.20—1.455 Nurses – – 9 0.31 2 0.69 23 0.45 33 0.54 67 0.46 0.36—0.596 Assistant nurses – – 34 1.10 2 0.52 46 0.87 109 0.94 191 0.94 0.81—1.087 "Other health workers" – – 24 1.00 [0.78] 0.00 39 0.81 32 0.81 95 0.85 0.68—1.038 Teachers – – 19 0.35 [4.91] 0.00 34 0.38 54 0.38 107 0.37 0.30—0.449 Religious workers etc – – 12 0.49 [0.75] 0.00 15 0.66 35 0.72 62 0.64 0.49—0.8210 Artistic workers – – 5 1.20 [0.63] 0.00 4 0.63 9 0.99 18 0.89 0.53—1.4111 Journalists – – 3 1.09 [0.16] 0.00 1 0.54 4 0.92 8 0.88 0.38—1.7312 Administrators – – 13 1.46 [0.56] 0.00 16 0.82 18 0.94 47 0.98 0.72—1.3013 Clerical workers – – 200 1.16 11 0.71 313 1.08 388 1.08 912 1.09 1.02—1.1614 Sales agents – – 33 1.33 2 1.14 35 1.19 37 1.02 107 1.16 0.96—1.4015 Shop workers – – 91 0.95 7 0.68 238 1.04 210 1.18 546 1.06 0.98—1.1616 Farmers – – 24 0.45 3 0.39 36 0.28 5 0.39 68 0.34 0.26—0.4317 Gardeners – – 61 0.36 1 3.98 30 0.37 30 0.67 122 0.41 0.35—0.4918 Fishermen – – [0.36] 0.00 [0.26] 0.00 1 0.80 [0.13] 0.00 1 0.50 0.01—2.7919 Forestry workers – – [0.70] 0.00 [0.04] 0.00 1 0.55 3 2.76 4 1.10 0.30—2.8220 Miners and quarry workers – – [0.30] 0.00 [0.01] 0.00 1 9.79 [0.31] 0.00 1 1.39 0.04—7.7321 Seamen – – 1 11.82 – – [0.29] 0.00 [0.04] 0.00 1 2.39 0.06—13.3322 Transport workers – – 8 1.71 [0.27] 0.00 4 2.95 5 1.68 17 1.83 1.07—2.9423 Drivers – – 4 1.87 [0.12] 0.00 8 1.69 17 1.86 29 1.79 1.20—2.5824 Postal workers – – 37 1.29 4 1.10 40 0.75 71 1.23 152 1.06 0.90—1.2425 Textile workers – – 54 0.85 5 0.77 88 1.30 91 1.11 238 1.08 0.96—1.2326 Shoe and leather workers – – 10 1.25 [0.33] 0.00 10 1.96 11 1.66 31 1.55 1.05—2.2027 Smelting workers – – 3 1.59 [0.02] 0.00 2 2.37 1 0.36 6 1.08 0.40—2.3528 Mechanics – – 18 2.16 [0.06] 0.00 11 1.50 49 1.93 78 1.90 1.50—2.3729 Plumbers – – [0.02] 0.00 – – [0.07] 0.00 1 20.60 1 7.27 0.18—40.5230 Welders – – 2 3.07 [0.00] 0.00 2 2.97 3 2.53 7 2.78 1.12—5.7431 Electrical workers – – 16 3.00 [0.05] 0.00 23 2.74 20 1.39 59 2.10 1.60—2.7032 Wood workers – – 20 1.21 [0.10] 0.00 5 1.67 8 1.80 33 1.37 0.95—1.9333 Painters – – 3 1.51 [0.03] 0.00 1 1.52 1 0.93 5 1.33 0.43—3.1134 "Other construction workers" – – 19 2.92 [0.01] 0.00 [0.25] 0.00 [0.17] 0.00 19 2.74 1.65—4.2835 Bricklayers – – 1 4.62 – – [0.02] 0.00 [0.00] 0.00 1 4.19 0.11—23.3736 Printers – – 15 1.86 1 1.94 15 2.30 23 2.41 54 2.19 1.65—2.8637 Chemical process workers – – 6 1.44 [0.25] 0.00 16 2.70 14 1.98 36 2.07 1.45—2.8638 Food workers – – 27 1.25 18 1.40 53 1.48 34 1.92 132 1.50 1.26—1.7839 Beverage workers – – 6 4.91 [0.03] 0.00 [0.39] 0.00 2 2.00 8 3.02 1.30—5.9540 Tobacco workers – – [0.68] 0.00 – – 7 6.49 3 3.11 10 3.67 1.76—6.7541 Glass makers etc – – 22 1.44 [0.33] 0.00 24 1.78 37 1.84 83 1.69 1.34—2.0942 Packers – – 44 1.62 4 3.10 57 1.79 51 1.85 156 1.77 1.52—2.0843 Engine operators – – 10 2.27 [0.02] 0.00 2 3.56 11 3.97 23 2.97 1.88—4.4544 Public safety workers – – [0.95] 0.00 1 4.07 7 1.93 5 1.69 13 1.67 0.89—2.8545 Cooks and stewards – – 32 1.09 7 1.44 49 1.38 57 1.92 145 1.46 1.24—1.7246 Domestic assistants – – 26 0.87 3 2.08 86 0.84 122 1.15 237 0.99 0.87—1.1247 Waiters – – 57 2.23 [0.54] 0.00 80 1.71 70 1.89 207 1.88 1.64—2.1648 Building caretakers – – 169 1.67 12 1.19 276 1.30 170 1.64 627 1.47 1.36—1.5949 Chimney sweeps – – [0.06] 0.00 – – [0.03] 0.00 [0.00] 0.00 [0.09] 0.00 0.00—38.8650 Hairdressers – – 7 0.74 1 2.15 18 1.49 25 1.20 51 1.19 0.89—1.5751 Launderers – – 10 1.21 4 2.48 19 1.24 26 1.62 59 1.43 1.09—1.8552 Military personnel – – [0.10] 0.00 – – [0.07] 0.00 [0.12] 0.00 [0.29] 0.00 0.00—12.7953 "Other workers" – – 44 1.40 15 1.53 114 1.06 85 1.73 258 1.30 1.15—1.4754 Economically inactive – – 614 0.95 38 1.11 887 0.99 1655 0.87 3194 0.92 0.89—0.95
1-54 All categories – – 1826 1.00 141 1.00 2747 1.00 3662 1.00 8376 1.00 # REF. #
Obs = observed number of cases; SIR = standardised incidence ratio; 95% CI = 95% confidence interval
49 Index Prev Next

Acta Oncologica - Pukkala et al, 2008 Squamous cell cancer of the lung
Observed number of squamous cell cancer of the lung among men in the Nordic countries and standardised incidence ratios 1961-2005,by country and occupational category
Denmark Finland Iceland Norway Sweden Total
No Occupational category Obs SIR Obs SIR Obs SIR Obs SIR Obs SIR Obs SIR 95% CI
1 Technical workers, etc 963 0.87 422 0.53 [5.00] 0.00 242 0.58 1758 0.90 3385 0.79 0.77—0.822 Laboratory assistants 18 0.79 16 0.85 [0.97] 0.00 13 0.62 5 0.76 52 0.74 0.56—0.973 Physicians 41 0.45 19 0.42 1 0.48 23 0.43 62 0.74 146 0.53 0.45—0.624 Dentists 6 0.23 3 0.30 [0.46] 0.00 12 0.50 23 0.52 44 0.42 0.31—0.565 Nurses [1.12] 0.00 [1.38] 0.00 [0.01] 0.00 1 0.55 2 0.96 3 0.47 0.10—1.376 Assistant nurses 24 0.92 [1.06] 0.00 [0.23] 0.00 10 1.02 40 1.41 74 1.13 0.89—1.427 "Other health workers" 73 0.89 32 0.65 [0.58] 0.00 20 0.95 72 0.97 197 0.87 0.75—1.008 Teachers 247 0.52 101 0.30 5 0.66 99 0.34 242 0.50 694 0.44 0.40—0.479 Religious workers etc 129 0.61 84 0.48 9 1.77 62 0.40 249 0.70 533 0.59 0.54—0.6410 Artistic workers 60 0.90 33 0.49 3 2.18 37 0.79 138 1.17 271 0.90 0.80—1.0211 Journalists 24 0.78 28 0.82 1 1.28 11 0.55 62 1.13 126 0.90 0.75—1.0712 Administrators 1127 0.87 290 0.52 17 1.25 436 0.78 667 0.83 2537 0.79 0.76—0.8213 Clerical workers 465 0.83 283 0.73 19 1.23 331 0.77 862 1.01 1960 0.87 0.83—0.9114 Sales agents 283 0.96 413 0.77 9 1.15 468 0.95 1344 1.10 2517 0.99 0.95—1.0315 Shop workers 1299 0.98 155 0.76 7 1.31 182 0.95 432 1.11 2075 0.98 0.94—1.0216 Farmers 1183 0.47 2512 0.80 12 0.52 613 0.45 898 0.38 5218 0.55 0.54—0.5717 Gardeners 291 0.80 341 0.87 3 4.11 211 0.59 514 0.61 1360 0.69 0.66—0.7318 Fishermen 168 1.38 38 0.97 19 1.62 558 1.24 93 1.02 876 1.23 1.15—1.3119 Forestry workers 51 0.93 658 1.42 [0.11] 0.00 159 0.61 343 0.56 1211 0.87 0.82—0.9220 Miners and quarry workers 19 1.10 134 1.81 [0.20] 0.00 114 1.56 280 1.88 547 1.75 1.60—1.9021 Seamen 171 1.34 101 1.09 4 1.16 631 1.75 218 1.73 1125 1.58 1.49—1.6822 Transport workers 304 1.06 229 0.77 9 1.23 162 0.83 444 1.04 1148 0.95 0.89—1.0023 Drivers 1330 1.42 901 1.04 13 1.29 762 1.46 1425 1.42 4431 1.33 1.29—1.3724 Postal workers 155 0.91 103 0.76 [1.40] 0.00 92 0.95 232 1.04 582 0.93 0.85—1.0025 Textile workers 161 0.94 104 1.08 1 0.41 110 0.97 277 1.02 653 1.00 0.93—1.0826 Shoe and leather workers 52 1.20 55 1.27 1 1.86 53 1.11 122 1.09 283 1.15 1.02—1.2927 Smelting workers 495 1.35 187 1.29 4 1.23 215 1.43 536 1.27 1437 1.32 1.26—1.3928 Mechanics 1263 1.28 902 1.07 7 0.74 990 1.38 2300 1.26 5462 1.25 1.21—1.2829 Plumbers 125 1.44 185 1.34 [1.57] 0.00 125 1.51 287 1.35 722 1.38 1.29—1.4930 Welders – – 154 1.32 [0.57] 0.00 131 1.40 305 1.34 590 1.35 1.24—1.4631 Electrical workers 274 1.21 354 1.04 6 1.08 343 1.09 646 1.07 1623 1.09 1.04—1.1432 Wood workers 724 1.06 1251 1.20 2 0.35 768 0.91 1024 0.78 3769 0.97 0.94—1.0033 Painters 279 1.24 239 1.16 3 1.27 191 1.35 483 1.30 1195 1.26 1.19—1.3434 "Other construction workers" 1078 1.20 1110 1.63 11 0.99 231 1.41 878 1.23 3308 1.34 1.29—1.3935 Bricklayers 296 1.19 143 1.32 – – 115 1.35 184 1.07 738 1.20 1.12—1.2936 Printers 184 1.19 67 0.85 1 0.55 93 1.13 269 1.41 614 1.21 1.12—1.3137 Chemical process workers 178 1.16 159 1.08 1 0.93 256 1.35 345 1.08 939 1.16 1.09—1.2438 Food workers 613 1.28 109 1.02 9 0.96 308 1.43 390 1.24 1429 1.27 1.20—1.3439 Beverage workers 101 1.63 4 0.53 1 6.87 3 1.57 28 1.50 137 1.52 1.28—1.7940 Tobacco workers 19 1.86 5 4.31 [0.01] 0.00 4 1.20 3 2.23 31 1.93 1.31—2.7441 Glass makers etc 365 1.27 168 1.08 2 1.25 159 1.55 396 1.16 1090 1.23 1.16—1.3042 Packers 343 1.31 437 1.27 4 0.75 468 1.45 860 1.35 2112 1.34 1.29—1.4043 Engine operators 307 1.23 475 1.16 7 1.05 263 1.49 625 1.26 1677 1.25 1.19—1.3144 Public safety workers 227 0.98 196 0.77 3 0.61 149 1.08 268 0.96 843 0.93 0.87—0.9945 Cooks and stewards 27 1.46 7 0.55 4 1.82 85 1.45 90 1.90 213 1.53 1.34—1.7546 Domestic assistants 1 5.18 [0.98] 0.00 [0.01] 0.00 [0.45] 0.00 1 0.37 2 0.47 0.06—1.6847 Waiters 86 2.03 8 0.69 1 4.49 36 1.39 55 2.19 186 1.77 1.53—2.0448 Building caretakers 346 1.32 234 1.01 1 0.42 97 1.44 285 1.19 963 1.20 1.13—1.2849 Chimney sweeps 11 1.71 22 1.25 – – 12 1.65 23 1.39 68 1.42 1.10—1.8050 Hairdressers 77 1.05 2 0.42 [0.31] 0.00 34 1.64 82 1.31 195 1.21 1.05—1.3951 Launderers 38 1.07 3 0.66 [0.24] 0.00 27 2.17 60 1.34 128 1.31 1.10—1.5652 Military personnel 97 0.88 37 0.56 – – 100 0.85 180 1.10 414 0.91 0.82—1.0053 "Other workers" 1040 1.31 348 1.26 17 0.83 685 1.14 820 1.05 2910 1.18 1.13—1.2254 Economically inactive 1086 1.17 2494 1.43 21 1.48 303 1.12 1407 1.25 5311 1.30 1.27—1.34
1-54 All categories 18324 1.00 16355 1.00 238 1.00 11603 1.00 23634 1.00 70154 1.00 # REF. #
Obs = observed number of cases; SIR = standardised incidence ratio; 95% CI = 95% confidence interval
50 Index Prev Next

Acta Oncologica - Pukkala et al, 2008 Squamous cell cancer of the lung
Observed number of squamous cell cancer of the lung among women in the Nordic countries and standardised incidence ratios1961-2005, by country and occupational category
Denmark Finland Iceland Norway Sweden Total
No Occupational category Obs SIR Obs SIR Obs SIR Obs SIR Obs SIR Obs SIR 95% CI
1 Technical workers, etc 17 1.06 9 1.08 [0.35] 0.00 3 0.83 25 0.98 54 1.01 0.76—1.312 Laboratory assistants 12 1.01 7 1.36 1 1.86 4 0.88 6 0.86 30 1.03 0.70—1.473 Physicians 6 1.16 3 1.51 [0.11] 0.00 1 0.60 4 0.68 14 0.94 0.52—1.584 Dentists 1 0.22 [2.41] 0.00 [0.04] 0.00 [1.42] 0.00 4 0.90 5 0.39 0.13—0.905 Nurses 69 0.77 24 0.92 1 0.36 19 0.52 62 0.82 175 0.76 0.65—0.886 Assistant nurses 78 1.13 20 0.69 3 0.77 44 1.15 143 1.05 288 1.04 0.93—1.177 "Other health workers" 32 0.62 17 0.77 [0.76] 0.00 16 0.45 37 0.82 102 0.66 0.54—0.808 Teachers 59 0.51 18 0.36 1 0.21 23 0.36 66 0.39 167 0.41 0.35—0.489 Religious workers etc 8 0.51 21 1.04 [0.73] 0.00 10 0.61 40 0.73 79 0.74 0.58—0.9210 Artistic workers 7 0.93 3 0.81 [0.60] 0.00 5 1.06 13 1.19 28 1.02 0.68—1.4811 Journalists 4 2.24 2 0.80 [0.15] 0.00 1 0.75 6 1.18 13 1.20 0.64—2.0512 Administrators 57 1.22 13 1.63 [0.52] 0.00 16 1.10 23 0.97 109 1.17 0.97—1.4113 Clerical workers 455 0.94 188 1.20 12 0.80 207 0.95 504 1.15 1366 1.04 0.99—1.1014 Sales agents 2 0.47 36 1.50 3 1.77 29 1.21 74 1.36 144 1.33 1.13—1.5715 Shop workers 338 1.07 108 1.17 12 1.21 172 0.96 326 1.25 956 1.12 1.05—1.1916 Farmers 83 0.38 34 0.61 3 0.40 39 0.37 10 0.50 169 0.41 0.35—0.4817 Gardeners 20 0.70 68 0.39 [0.26] 0.00 21 0.31 33 0.49 142 0.42 0.36—0.4918 Fishermen [1.15] 0.00 2 5.63 [0.24] 0.00 1 1.06 [0.20] 0.00 3 1.03 0.21—3.0219 Forestry workers [0.31] 0.00 1 1.50 [0.03] 0.00 3 2.09 1 0.68 5 1.28 0.41—2.9820 Miners and quarry workers [0.02] 0.00 [0.30] 0.00 [0.01] 0.00 1 13.87 [0.37] 0.00 1 1.29 0.03—7.1921 Seamen – – [0.07] 0.00 [0.00] 0.00 [0.22] 0.00 [0.04] 0.00 [0.33] 0.00 0.00—11.1822 Transport workers [0.32] 0.00 15 3.08 1 3.69 2 2.03 4 0.99 22 2.10 1.31—3.1723 Drivers 12 1.44 1 0.51 1 8.75 4 1.14 22 2.07 40 1.63 1.16—2.2224 Postal workers 16 0.95 25 0.89 3 0.87 49 1.20 82 1.07 175 1.06 0.91—1.2225 Textile workers 133 1.22 59 0.94 5 0.78 60 1.07 166 1.18 423 1.13 1.03—1.2426 Shoe and leather workers 11 1.34 4 0.51 [0.33] 0.00 3 0.72 13 1.17 31 0.98 0.66—1.3927 Smelting workers 8 3.96 2 1.06 [0.02] 0.00 [0.59] 0.00 3 0.89 13 1.65 0.88—2.8228 Mechanics 47 2.27 14 1.77 [0.06] 0.00 14 2.46 58 1.78 133 1.99 1.68—2.3529 Plumbers [0.13] 0.00 [0.02] 0.00 – – [0.05] 0.00 [0.05] 0.00 [0.25] 0.00 0.00—15.0530 Welders – – 1 1.70 [0.00] 0.00 1 2.15 2 1.59 4 1.73 0.47—4.4231 Electrical workers 59 2.04 6 1.28 [0.05] 0.00 11 1.72 26 1.43 102 1.75 1.44—2.1332 Wood workers 17 1.82 15 0.90 [0.10] 0.00 3 1.35 7 1.29 42 1.24 0.90—1.6833 Painters 1 2.86 6 3.09 [0.03] 0.00 4 7.89 2 1.41 13 3.06 1.63—5.2434 "Other construction workers" [0.27] 0.00 21 3.10 [0.02] 0.00 [0.18] 0.00 3 17.85 24 3.24 2.08—4.8235 Bricklayers [0.05] 0.00 [0.20] 0.00 – – [0.01] 0.00 [0.00] 0.00 [0.27] 0.00 0.00—13.4736 Printers 13 1.25 10 1.28 1 1.93 10 1.97 35 2.65 69 1.86 1.45—2.3637 Chemical process workers 27 1.65 3 0.72 [0.24] 0.00 9 1.92 10 0.96 49 1.37 1.01—1.8138 Food workers 99 1.24 33 1.52 28 2.21 52 1.78 47 1.59 259 1.50 1.33—1.6939 Beverage workers 13 1.71 [1.24] 0.00 [0.03] 0.00 1 3.32 4 2.22 18 1.64 0.97—2.5840 Tobacco workers 21 1.99 [0.69] 0.00 – – 6 6.63 1 0.76 28 2.08 1.38—3.0141 Glass makers etc 28 1.40 25 1.68 1 3.00 16 1.51 35 1.23 105 1.41 1.17—1.7142 Packers 5 0.88 46 1.72 2 1.58 47 1.86 63 1.53 163 1.63 1.40—1.9043 Engine operators 1 5.22 11 2.57 [0.02] 0.00 1 2.57 11 3.74 24 3.07 1.97—4.5744 Public safety workers [0.57] 0.00 2 2.26 [0.24] 0.00 3 1.02 1 0.31 6 0.76 0.28—1.6645 Cooks and stewards [0.20] 0.00 26 0.90 4 0.83 26 0.87 61 1.13 117 1.00 0.83—1.1946 Domestic assistants 133 1.10 18 0.64 [1.45] 0.00 77 0.92 160 1.07 388 1.01 0.92—1.1247 Waiters 68 3.14 75 3.07 3 5.55 76 2.05 118 1.95 340 2.36 2.12—2.6248 Building caretakers 476 1.36 144 1.42 7 0.71 244 1.47 260 1.68 1131 1.45 1.36—1.5349 Chimney sweeps [0.02] 0.00 [0.06] 0.00 – – [0.03] 0.00 [0.00] 0.00 [0.11] 0.00 0.00—34.5050 Hairdressers 19 0.93 13 1.45 [0.48] 0.00 14 1.50 39 1.43 85 1.28 1.02—1.5851 Launderers 65 1.66 12 1.42 [1.63] 0.00 15 1.19 42 1.41 134 1.46 1.23—1.7352 Military personnel [0.20] 0.00 [0.07] 0.00 – – 1 19.80 [0.10] 0.00 1 2.33 0.06—13.0153 "Other workers" 139 1.40 42 1.37 10 1.03 71 0.85 111 1.57 373 1.27 1.15—1.4054 Economically inactive 2302 0.93 599 0.91 36 1.07 767 1.01 2801 0.88 6505 0.92 0.90—0.94
1-54 All categories 4961 1.00 1802 1.00 138 1.00 2202 1.00 5564 1.00 14667 1.00 # REF. #
Obs = observed number of cases; SIR = standardised incidence ratio; 95% CI = 95% confidence interval
51 Index Prev Next

Acta Oncologica - Pukkala et al, 2008 Other and unspecified lung cancer
Observed number of other and unspecified lung cancer among men in the Nordic countries and standardised incidence ratios 1961-2005,by country and occupational category
Denmark Finland Iceland Norway Sweden Total
No Occupational category Obs SIR Obs SIR Obs SIR Obs SIR Obs SIR Obs SIR 95% CI
1 Technical workers, etc – – 541 0.54 6 1.09 185 0.53 1819 0.98 2551 0.79 0.76—0.822 Laboratory assistants – – 21 0.90 1 0.96 13 0.79 4 0.57 39 0.81 0.58—1.113 Physicians – – 11 0.19 1 0.44 16 0.37 63 0.77 91 0.49 0.40—0.604 Dentists – – 3 0.23 [0.52] 0.00 10 0.51 21 0.49 34 0.45 0.31—0.635 Nurses – – [1.84] 0.00 1 81.98 1 0.55 1 0.35 3 0.46 0.10—1.356 Assistant nurses – – 1 0.76 [0.25] 0.00 5 0.67 27 0.94 33 0.88 0.60—1.237 "Other health workers" – – 32 0.52 [0.62] 0.00 24 1.46 60 0.83 116 0.77 0.64—0.928 Teachers – – 146 0.34 5 0.61 115 0.47 303 0.65 569 0.50 0.46—0.549 Religious workers etc – – 104 0.46 4 0.73 55 0.45 267 0.75 430 0.61 0.55—0.6710 Artistic workers – – 52 0.61 1 0.67 34 0.92 112 0.99 199 0.84 0.73—0.9611 Journalists – – 23 0.55 2 2.37 14 0.87 54 1.01 93 0.83 0.67—1.0112 Administrators – – 360 0.51 9 0.62 398 0.91 782 1.01 1549 0.80 0.76—0.8413 Clerical workers – – 357 0.72 14 0.85 279 0.83 906 1.11 1556 0.93 0.89—0.9814 Sales agents – – 518 0.78 8 0.97 396 1.05 1396 1.19 2318 1.04 1.00—1.0815 Shop workers – – 185 0.73 5 0.87 169 1.12 411 1.11 770 0.99 0.92—1.0616 Farmers – – 3155 0.76 11 0.45 466 0.47 872 0.38 4504 0.61 0.59—0.6217 Gardeners – – 429 0.86 1 1.27 151 0.58 481 0.59 1062 0.67 0.64—0.7218 Fishermen – – 51 0.98 16 1.24 399 1.21 71 0.81 537 1.12 1.03—1.2119 Forestry workers – – 812 1.43 [0.12] 0.00 123 0.66 288 0.49 1223 0.91 0.86—0.9620 Miners and quarry workers – – 178 1.98 [0.21] 0.00 76 1.40 227 1.58 481 1.67 1.53—1.8321 Seamen – – 143 1.23 7 1.90 472 1.69 226 1.86 848 1.63 1.52—1.7422 Transport workers – – 292 0.80 9 1.17 134 0.91 383 0.97 818 0.90 0.84—0.9623 Drivers – – 1035 0.98 13 1.20 594 1.49 1256 1.31 2898 1.20 1.15—1.2424 Postal workers – – 114 0.67 2 1.36 73 0.99 242 1.11 431 0.93 0.85—1.0225 Textile workers – – 110 0.88 1 0.39 71 0.85 253 0.97 435 0.93 0.84—1.0226 Shoe and leather workers – – 58 1.02 2 3.58 39 1.15 115 1.05 214 1.07 0.93—1.2227 Smelting workers – – 217 1.19 4 1.16 171 1.54 496 1.22 888 1.26 1.18—1.3528 Mechanics – – 1121 1.07 11 1.08 709 1.27 2233 1.28 4074 1.21 1.18—1.2529 Plumbers – – 206 1.22 2 1.18 106 1.64 299 1.47 613 1.40 1.29—1.5230 Welders – – 147 1.05 2 3.28 102 1.36 286 1.32 537 1.24 1.14—1.3531 Electrical workers – – 373 0.89 8 1.33 251 1.02 613 1.06 1245 1.00 0.94—1.0532 Wood workers – – 1462 1.11 6 0.98 554 0.87 942 0.74 2964 0.92 0.89—0.9533 Painters – – 304 1.17 3 1.22 147 1.41 391 1.09 845 1.17 1.09—1.2534 "Other construction workers" – – 1325 1.57 6 0.50 180 1.46 806 1.17 2317 1.39 1.33—1.4435 Bricklayers – – 187 1.38 – – 80 1.27 207 1.25 474 1.30 1.19—1.4236 Printers – – 91 0.91 3 1.55 76 1.19 248 1.35 418 1.20 1.09—1.3237 Chemical process workers – – 191 1.05 2 1.76 170 1.24 290 0.93 653 1.03 0.96—1.1238 Food workers – – 138 1.03 18 1.81 181 1.14 373 1.24 710 1.17 1.09—1.2639 Beverage workers – – 9 0.91 [0.16] 0.00 1 0.55 23 1.24 33 1.09 0.75—1.5340 Tobacco workers – – 2 1.28 [0.01] 0.00 6 2.59 2 1.54 10 1.93 0.92—3.5441 Glass makers etc – – 213 1.11 [1.71] 0.00 108 1.39 353 1.07 674 1.12 1.04—1.2142 Packers – – 541 1.25 6 1.06 322 1.37 851 1.37 1720 1.33 1.27—1.3943 Engine operators – – 567 1.12 5 0.70 193 1.39 552 1.15 1317 1.16 1.10—1.2344 Public safety workers – – 295 0.93 5 0.95 106 1.03 285 1.05 691 0.99 0.92—1.0745 Cooks and stewards – – 19 1.21 1 0.42 74 1.60 76 1.62 170 1.53 1.31—1.7746 Domestic assistants – – [1.51] 0.00 [0.01] 0.00 [0.38] 0.00 3 0.96 3 0.59 0.12—1.7447 Waiters – – 15 1.03 [0.24] 0.00 43 2.18 63 2.57 121 2.05 1.71—2.4548 Building caretakers – – 307 1.05 3 1.21 72 1.41 268 1.12 650 1.11 1.03—1.2049 Chimney sweeps – – 26 1.23 – – 8 1.49 34 2.14 68 1.61 1.25—2.0450 Hairdressers – – 6 0.96 1 2.96 22 1.45 80 1.35 109 1.35 1.12—1.6351 Launderers – – 7 1.23 [0.24] 0.00 13 1.43 54 1.28 74 1.29 1.01—1.6252 Military personnel – – 50 0.64 – – 85 0.90 175 1.14 310 0.95 0.85—1.0653 "Other workers" – – 450 1.29 29 1.35 475 1.09 817 1.08 1771 1.13 1.08—1.1954 Economically inactive – – 3929 1.59 20 1.32 225 1.11 1410 1.20 5584 1.44 1.41—1.48
1-54 All categories – – 20929 1.00 254 1.00 8792 1.00 22870 1.00 52845 1.00 # REF. #
Obs = observed number of cases; SIR = standardised incidence ratio; 95% CI = 95% confidence interval
52 Index Prev Next

Acta Oncologica - Pukkala et al, 2008 Other and unspecified lung cancer
Observed number of other and unspecified lung cancer among women in the Nordic countries and standardised incidence ratios1961-2005, by country and occupational category
Denmark Finland Iceland Norway Sweden Total
No Occupational category Obs SIR Obs SIR Obs SIR Obs SIR Obs SIR Obs SIR 95% CI
1 Technical workers, etc – – 18 0.86 1 1.35 5 0.71 45 0.91 69 0.89 0.69—1.122 Laboratory assistants – – 11 0.90 3 2.68 5 0.60 14 0.89 33 0.88 0.61—1.243 Physicians – – 3 0.61 [0.22] 0.00 2 0.63 4 0.34 9 0.45 0.20—0.854 Dentists – – 4 0.61 [0.08] 0.00 1 0.39 6 0.71 11 0.62 0.31—1.125 Nurses – – 48 0.77 5 0.90 42 0.63 92 0.63 187 0.67 0.58—0.776 Assistant nurses – – 57 0.83 7 0.88 58 0.85 260 0.99 382 0.94 0.85—1.047 "Other health workers" – – 40 0.76 [1.57] 0.00 53 0.83 79 0.89 172 0.83 0.72—0.978 Teachers – – 64 0.53 3 0.31 64 0.54 196 0.59 327 0.56 0.50—0.629 Religious workers etc – – 34 0.68 2 1.35 18 0.60 107 0.96 161 0.83 0.71—0.9710 Artistic workers – – 14 1.51 2 1.66 8 0.93 31 1.46 55 1.36 1.03—1.7811 Journalists – – 15 2.43 1 3.33 [2.47] 0.00 17 1.70 33 1.74 1.20—2.4412 Administrators – – 32 1.58 1 0.96 25 0.92 51 1.07 109 1.13 0.94—1.3713 Clerical workers – – 498 1.30 30 0.99 392 1.03 977 1.19 1897 1.17 1.12—1.2314 Sales agents – – 74 1.20 [3.37] 0.00 43 1.01 125 1.17 242 1.13 1.00—1.2815 Shop workers – – 238 1.07 21 1.05 355 1.17 552 1.17 1166 1.15 1.08—1.2216 Farmers – – 85 0.54 6 0.40 76 0.42 21 0.49 188 0.48 0.41—0.5517 Gardeners – – 232 0.52 [0.51] 0.00 52 0.47 85 0.70 369 0.54 0.49—0.6018 Fishermen – – [0.92] 0.00 [0.49] 0.00 2 1.24 1 2.52 3 0.88 0.18—2.5619 Forestry workers – – 2 1.15 [0.07] 0.00 2 0.85 5 1.82 9 1.30 0.59—2.4720 Miners and quarry workers – – 1 1.29 [0.02] 0.00 [0.13] 0.00 [0.70] 0.00 1 0.62 0.02—3.4521 Seamen – – [0.16] 0.00 [0.00] 0.00 [0.38] 0.00 [0.09] 0.00 [0.64] 0.00 0.00—5.8022 Transport workers – – 23 1.95 [0.53] 0.00 2 1.13 13 1.70 38 1.75 1.24—2.4023 Drivers – – 7 1.46 [0.23] 0.00 2 0.32 30 1.46 39 1.23 0.87—1.6824 Postal workers – – 72 1.05 5 0.73 70 1.00 150 1.08 297 1.04 0.93—1.1725 Textile workers – – 162 1.03 9 0.69 98 1.03 295 1.15 564 1.08 0.99—1.1726 Shoe and leather workers – – 17 0.88 [0.68] 0.00 7 0.99 19 0.95 43 0.91 0.66—1.2327 Smelting workers – – 5 1.09 [0.03] 0.00 2 1.89 9 1.44 16 1.34 0.77—2.1828 Mechanics – – 35 1.81 [0.11] 0.00 16 1.66 81 1.34 132 1.47 1.24—1.7529 Plumbers – – [0.04] 0.00 – – [0.08] 0.00 1 10.08 1 4.55 0.12—25.3330 Welders – – 2 1.45 [0.01] 0.00 1 1.16 6 2.41 9 1.90 0.87—3.6131 Electrical workers – – 17 1.53 [0.11] 0.00 20 1.84 58 1.71 95 1.70 1.37—2.0832 Wood workers – – 48 1.18 [0.21] 0.00 8 2.09 9 0.87 65 1.18 0.91—1.5133 Painters – – 6 1.31 [0.06] 0.00 2 2.38 7 2.62 15 1.84 1.03—3.0334 "Other construction workers" – – 31 1.83 [0.03] 0.00 [0.33] 0.00 [0.37] 0.00 31 1.75 1.19—2.4835 Bricklayers – – [0.55] 0.00 – – [0.02] 0.00 [0.01] 0.00 [0.58] 0.00 0.00—6.3836 Printers – – 27 1.40 3 2.83 10 1.15 54 2.19 94 1.75 1.42—2.1437 Chemical process workers – – 8 0.78 [0.49] 0.00 7 0.88 23 1.20 38 1.01 0.71—1.3838 Food workers – – 53 0.98 44 1.70 54 1.10 74 1.36 225 1.22 1.07—1.4039 Beverage workers – – 3 0.96 [0.07] 0.00 2 3.94 6 1.77 11 1.55 0.78—2.7840 Tobacco workers – – 3 1.70 – – 3 2.02 6 2.59 12 2.15 1.11—3.7641 Glass makers etc – – 42 1.14 [0.68] 0.00 31 1.76 74 1.43 147 1.38 1.17—1.6242 Packers – – 87 1.33 2 0.77 63 1.50 110 1.46 262 1.41 1.25—1.5943 Engine operators – – 33 3.21 [0.04] 0.00 [0.71] 0.00 10 1.78 43 2.58 1.87—3.4844 Public safety workers – – 4 1.69 [0.50] 0.00 7 1.36 9 1.31 20 1.34 0.82—2.0845 Cooks and stewards – – 80 1.08 6 0.61 44 0.86 112 1.08 242 1.02 0.89—1.1546 Domestic assistants – – 57 0.77 1 0.34 119 0.84 318 1.07 495 0.96 0.88—1.0547 Waiters – – 123 2.07 1 0.91 108 1.72 185 1.68 417 1.79 1.62—1.9748 Building caretakers – – 323 1.25 22 1.11 354 1.27 385 1.29 1084 1.27 1.19—1.3549 Chimney sweeps – – [0.12] 0.00 – – [0.04] 0.00 [0.01] 0.00 [0.17] 0.00 0.00—21.6850 Hairdressers – – 38 1.69 [1.00] 0.00 21 1.27 79 1.57 138 1.53 1.29—1.8051 Launderers – – 18 0.84 5 1.52 23 1.08 55 1.00 101 1.00 0.82—1.2152 Military personnel – – [0.17] 0.00 – – [0.10] 0.00 [0.24] 0.00 [0.50] 0.00 0.00—7.3753 "Other workers" – – 92 1.19 17 0.86 157 1.08 171 1.27 437 1.16 1.06—1.2754 Economically inactive – – 1798 0.99 83 1.21 1427 1.04 5362 0.92 8670 0.95 0.93—0.97
1-54 All categories – – 4684 1.00 280 1.00 3861 1.00 10379 1.00 19204 1.00 # REF. #
Obs = observed number of cases; SIR = standardised incidence ratio; 95% CI = 95% confidence interval
53 Index Prev Next

Acta Oncologica - Pukkala et al, 2008 Mesothelioma in the pleura/peritoneum
Observed number of mesothelioma in the pleura/peritoneum among men in the Nordic countries and standardised incidence ratios1961-2005, by country and occupational category
Denmark Finland Iceland Norway Sweden Total
No Occupational category Obs SIR Obs SIR Obs SIR Obs SIR Obs SIR Obs SIR 95% CI
1 Technical workers, etc 136 1.53 98 1.43 [0.59] 0.00 46 0.97 285 1.17 565 1.26 1.16—1.362 Laboratory assistants 1 0.56 3 1.70 1 8.64 2 0.93 2 1.27 9 1.22 0.56—2.323 Physicians 4 0.56 2 0.50 [0.23] 0.00 2 0.36 5 0.44 13 0.46 0.24—0.794 Dentists 1 0.47 [0.79] 0.00 [0.06] 0.00 1 0.40 2 0.37 4 0.37 0.10—0.945 Nurses [0.10] 0.00 [0.23] 0.00 [0.00] 0.00 [0.30] 0.00 1 1.52 1 0.78 0.02—4.336 Assistant nurses [2.15] 0.00 1 4.58 [0.02] 0.00 [0.91] 0.00 5 1.35 6 0.86 0.31—1.867 "Other health workers" 5 0.79 2 0.55 [0.06] 0.00 1 0.48 6 0.67 14 0.67 0.36—1.128 Teachers 14 0.36 14 0.49 [0.85] 0.00 13 0.40 39 0.59 80 0.48 0.38—0.609 Religious workers etc 7 0.44 13 0.83 [0.53] 0.00 6 0.38 25 0.51 51 0.53 0.40—0.7010 Artistic workers 6 1.20 4 0.74 1 6.92 5 1.08 9 0.61 25 0.84 0.54—1.2411 Journalists [2.40] 0.00 2 0.77 [0.08] 0.00 [2.06] 0.00 1 0.15 3 0.22 0.04—0.6312 Administrators 87 0.89 34 0.82 1 0.77 37 0.69 55 0.64 214 0.76 0.67—0.8713 Clerical workers 28 0.64 26 1.01 1 0.71 23 0.55 67 0.71 145 0.70 0.59—0.8214 Sales agents 14 0.60 32 0.83 [0.75] 0.00 26 0.57 78 0.56 150 0.61 0.52—0.7115 Shop workers 63 0.64 12 0.68 [0.50] 0.00 9 0.46 31 0.68 115 0.63 0.53—0.7616 Farmers 32 0.18 54 0.35 1 0.49 18 0.16 51 0.26 156 0.24 0.21—0.2817 Gardeners 9 0.34 6 0.24 [0.06] 0.00 13 0.43 17 0.22 45 0.28 0.20—0.3818 Fishermen 4 0.43 1 0.49 1 0.74 16 0.43 4 0.49 26 0.44 0.29—0.6519 Forestry workers 1 0.26 10 0.33 [0.01] 0.00 7 0.33 11 0.19 29 0.26 0.17—0.3720 Miners and quarry workers 1 0.83 5 1.02 [0.02] 0.00 4 0.62 10 0.68 20 0.73 0.45—1.1321 Seamen 26 2.53 18 2.68 1 2.84 61 1.74 37 2.77 143 2.18 1.85—2.5622 Transport workers 21 0.97 15 0.81 2 2.96 10 0.56 37 0.80 85 0.81 0.65—1.0023 Drivers 56 0.78 56 0.86 1 0.96 24 0.48 63 0.54 200 0.66 0.57—0.7524 Postal workers 9 0.64 8 0.86 [0.11] 0.00 5 0.56 11 0.45 33 0.58 0.40—0.8225 Textile workers 9 0.73 3 0.51 [0.20] 0.00 6 0.62 21 0.83 39 0.73 0.52—1.0026 Shoe and leather workers 2 0.67 1 0.40 [0.04] 0.00 3 0.80 4 0.44 10 0.54 0.26—1.0027 Smelting workers 101 3.53 6 0.65 1 3.29 22 1.66 46 1.12 176 1.90 1.64—2.2028 Mechanics 187 2.46 104 1.63 [0.98] 0.00 148 2.11 412 1.95 851 2.02 1.88—2.1629 Plumbers 27 3.92 36 3.29 1 6.34 47 5.68 129 5.29 240 4.74 4.18—5.3830 Welders – – 22 1.98 [0.06] 0.00 20 1.99 49 1.66 91 1.79 1.44—2.2031 Electrical workers 31 1.69 70 2.52 1 1.61 62 1.98 128 1.70 292 1.90 1.70—2.1332 Wood workers 109 2.13 84 1.39 [0.54] 0.00 145 1.92 156 1.23 494 1.57 1.44—1.7133 Painters 22 1.28 30 2.22 [0.23] 0.00 19 1.55 73 1.92 144 1.77 1.51—2.0934 "Other construction workers" 56 0.88 53 1.34 2 1.77 33 2.17 124 1.80 268 1.42 1.26—1.6035 Bricklayers 20 1.07 13 2.07 – – 16 2.15 28 1.68 77 1.57 1.24—1.9636 Printers 11 0.90 4 0.59 [0.20] 0.00 6 0.75 14 0.63 35 0.71 0.49—0.9937 Chemical process workers 14 1.28 10 0.93 [0.10] 0.00 25 1.58 45 1.49 94 1.39 1.12—1.7038 Food workers 16 0.45 5 0.65 [0.76] 0.00 5 0.27 12 0.37 38 0.40 0.28—0.5539 Beverage workers 3 0.67 1 2.12 1 82.99 [0.28] 0.00 2 1.21 7 1.02 0.41—2.0940 Tobacco workers 2 2.91 [0.09] 0.00 [0.00] 0.00 [0.26] 0.00 [0.15] 0.00 2 1.68 0.20—6.0741 Glass makers etc 17 0.81 15 1.36 1 6.97 14 1.44 50 1.42 97 1.26 1.02—1.5342 Packers 19 1.03 24 1.10 [0.44] 0.00 30 1.09 60 1.01 133 1.04 0.88—1.2343 Engine operators 34 1.78 41 1.26 2 2.95 26 1.45 54 0.96 157 1.24 1.06—1.4544 Public safety workers 14 0.81 14 0.79 [0.46] 0.00 13 1.06 33 0.98 74 0.91 0.71—1.1445 Cooks and stewards [1.45] 0.00 [1.13] 0.00 1 4.27 4 0.68 5 0.81 10 0.67 0.32—1.2346 Domestic assistants [0.02] 0.00 [0.05] 0.00 [0.00] 0.00 [0.06] 0.00 [0.50] 0.00 [0.62] 0.00 0.00—5.9247 Waiters 3 0.97 1 0.89 [0.03] 0.00 [2.43] 0.00 2 0.62 6 0.61 0.22—1.3248 Building caretakers 16 0.86 12 0.86 1 5.47 12 1.95 28 1.21 69 1.11 0.86—1.4149 Chimney sweeps 1 1.99 2 1.90 – – [0.64] 0.00 5 2.63 8 1.95 0.84—3.8550 Hairdressers 2 0.38 [0.29] 0.00 [0.04] 0.00 [1.78] 0.00 2 0.32 4 0.29 0.08—0.7551 Launderers 1 0.39 1 3.23 [0.02] 0.00 1 0.94 4 0.90 7 0.83 0.34—1.7252 Military personnel 12 1.28 2 0.30 – – 14 1.14 17 0.83 45 0.92 0.67—1.2353 "Other workers" 65 1.11 11 0.67 1 0.53 44 0.90 58 0.80 179 0.90 0.78—1.0454 Economically inactive 46 0.82 65 0.91 1 0.78 18 0.82 108 0.99 238 0.92 0.81—1.04
1-54 All categories 1365 1.00 1046 1.00 23 1.00 1062 1.00 2521 1.00 6017 1.00 # REF. #
Obs = observed number of cases; SIR = standardised incidence ratio; 95% CI = 95% confidence interval
54 Index Prev Next

Acta Oncologica - Pukkala et al, 2008 Mesothelioma in the pleura/peritoneum
Observed number of mesothelioma in the pleura/peritoneum among women in the Nordic countries and standardised incidenceratios 1961-2005, by country and occupational category
Denmark Finland Iceland Norway Sweden Total
No Occupational category Obs SIR Obs SIR Obs SIR Obs SIR Obs SIR Obs SIR 95% CI
1 Technical workers, etc [1.16] 0.00 2 0.94 [0.00] 0.00 1 3.29 3 1.24 6 1.00 0.37—2.172 Laboratory assistants [0.81] 0.00 4 3.10 [0.00] 0.00 [0.37] 0.00 1 1.55 5 1.60 0.52—3.743 Physicians [0.38] 0.00 2 3.94 [0.00] 0.00 [0.14] 0.00 1 1.83 3 1.91 0.39—5.574 Dentists 1 2.96 1 1.69 [0.00] 0.00 [0.11] 0.00 [0.43] 0.00 2 1.36 0.16—4.925 Nurses 6 0.88 2 0.30 [0.03] 0.00 4 1.37 7 0.96 19 0.80 0.48—1.266 Assistant nurses 1 0.21 5 0.72 1 18.60 8 2.62 14 1.10 29 1.05 0.70—1.507 "Other health workers" 4 1.03 4 0.75 [0.01] 0.00 2 0.70 5 1.17 15 0.92 0.51—1.528 Teachers 8 0.96 15 1.24 [0.05] 0.00 4 0.77 15 0.93 42 1.00 0.72—1.369 Religious workers etc [1.14] 0.00 3 0.56 [0.01] 0.00 [1.35] 0.00 7 1.33 10 0.76 0.37—1.4110 Artistic workers 1 1.63 2 2.13 [0.01] 0.00 [0.38] 0.00 3 2.89 6 2.01 0.74—4.3811 Journalists [0.13] 0.00 1 1.59 [0.00] 0.00 1 9.20 [0.48] 0.00 2 1.48 0.18—5.3512 Administrators 2 0.55 3 1.51 [0.01] 0.00 3 2.42 [2.30] 0.00 8 0.87 0.38—1.7213 Clerical workers 42 1.22 44 1.13 [0.19] 0.00 18 1.05 42 1.03 146 1.11 0.94—1.3014 Sales agents 1 3.14 11 1.93 [0.03] 0.00 2 1.01 5 0.91 19 1.40 0.84—2.1915 Shop workers 23 0.95 20 0.91 [0.14] 0.00 18 1.28 34 1.35 95 1.11 0.90—1.3616 Farmers 9 0.55 5 0.40 [0.11] 0.00 8 0.93 4 1.91 26 0.65 0.43—0.9617 Gardeners 3 1.40 26 0.65 [0.00] 0.00 4 0.74 2 0.31 35 0.65 0.45—0.9018 Fishermen [0.08] 0.00 [0.08] 0.00 [0.00] 0.00 1 13.42 [0.02] 0.00 1 3.76 0.10—20.9719 Forestry workers [0.02] 0.00 [0.16] 0.00 [0.00] 0.00 [0.11] 0.00 [0.14] 0.00 [0.44] 0.00 0.00—8.3820 Miners and quarry workers [0.00] 0.00 [0.07] 0.00 – – [0.01] 0.00 [0.03] 0.00 [0.11] 0.00 0.00—32.7921 Seamen – – [0.02] 0.00 – – [0.02] 0.00 [0.00] 0.00 [0.04] 0.00 0.00—96.3822 Transport workers [0.02] 0.00 3 2.70 [0.00] 0.00 [0.08] 0.00 [0.40] 0.00 3 1.85 0.38—5.4123 Drivers 2 3.31 1 2.05 [0.00] 0.00 [0.28] 0.00 1 1.02 4 1.70 0.46—4.3524 Postal workers 1 0.79 9 1.37 [0.05] 0.00 3 0.94 11 1.52 24 1.31 0.84—1.9525 Textile workers 10 1.23 19 1.29 1 9.16 4 0.88 26 1.81 60 1.44 1.10—1.8526 Shoe and leather workers 2 3.36 2 1.08 [0.00] 0.00 [0.33] 0.00 [1.11] 0.00 4 1.03 0.28—2.6327 Smelting workers [0.15] 0.00 [0.44] 0.00 [0.00] 0.00 [0.05] 0.00 [0.31] 0.00 [0.94] 0.00 0.00—3.9128 Mechanics 1 0.70 4 2.11 [0.00] 0.00 1 2.23 2 0.65 8 1.17 0.51—2.3129 Plumbers [0.01] 0.00 [0.00] 0.00 – – [0.00] 0.00 [0.00] 0.00 [0.03] 0.00 0.00—142.4030 Welders – – [0.15] 0.00 – – [0.04] 0.00 [0.12] 0.00 [0.30] 0.00 0.00—12.3031 Electrical workers 3 1.50 1 0.86 [0.00] 0.00 1 2.00 4 2.34 9 1.67 0.76—3.1832 Wood workers 2 3.03 9 2.34 [0.00] 0.00 [0.18] 0.00 [0.51] 0.00 11 2.12 1.06—3.8033 Painters [0.03] 0.00 1 2.24 [0.00] 0.00 [0.04] 0.00 [0.14] 0.00 1 1.54 0.04—8.5834 "Other construction workers" [0.02] 0.00 3 1.97 [0.00] 0.00 [0.01] 0.00 [0.02] 0.00 3 1.90 0.39—5.5735 Bricklayers [0.00] 0.00 1 19.68 – – [0.00] 0.00 [0.00] 0.00 1 17.73 0.45—98.7636 Printers [0.77] 0.00 2 1.08 [0.01] 0.00 1 2.48 2 1.57 5 1.16 0.38—2.7137 Chemical process workers [1.22] 0.00 [0.97] 0.00 [0.00] 0.00 1 2.70 1 0.98 2 0.56 0.07—2.0238 Food workers 5 0.86 6 1.19 [0.19] 0.00 5 2.13 7 2.36 23 1.40 0.89—2.1139 Beverage workers [0.58] 0.00 [0.28] 0.00 [0.00] 0.00 [0.02] 0.00 1 5.48 1 0.93 0.02—5.1940 Tobacco workers [0.80] 0.00 1 6.20 – – [0.07] 0.00 [0.12] 0.00 1 0.87 0.02—4.8341 Glass makers etc 3 2.10 7 1.99 [0.00] 0.00 1 1.22 5 1.84 16 1.89 1.08—3.0642 Packers 3 7.30 7 1.12 [0.02] 0.00 [1.99] 0.00 5 1.24 15 1.18 0.66—1.9543 Engine operators [0.01] 0.00 3 2.94 – – [0.03] 0.00 1 3.85 4 3.02 0.82—7.7444 Public safety workers [0.05] 0.00 [0.22] 0.00 [0.00] 0.00 [0.24] 0.00 1 3.14 1 1.20 0.03—6.6645 Cooks and stewards [0.02] 0.00 9 1.33 [0.08] 0.00 3 1.22 6 1.07 18 1.21 0.72—1.9146 Domestic assistants 16 1.75 3 0.44 [0.03] 0.00 4 0.59 9 0.61 32 0.85 0.58—1.2047 Waiters 2 1.25 8 1.36 [0.01] 0.00 5 1.70 7 1.15 22 1.33 0.84—2.0248 Building caretakers 25 0.93 33 1.40 [0.16] 0.00 14 1.06 27 1.76 99 1.25 1.02—1.5249 Chimney sweeps [0.00] 0.00 [0.01] 0.00 – – [0.00] 0.00 [0.00] 0.00 [0.02] 0.00 0.00—212.4750 Hairdressers 1 0.64 [2.18] 0.00 [0.01] 0.00 [0.76] 0.00 2 0.76 3 0.42 0.09—1.2351 Launderers 2 0.66 4 2.06 [0.03] 0.00 1 0.97 3 0.97 10 1.10 0.53—2.0252 Military personnel [0.02] 0.00 [0.02] 0.00 – – [0.00] 0.00 [0.01] 0.00 [0.05] 0.00 0.00—71.3553 "Other workers" 10 1.32 7 0.97 [0.15] 0.00 4 0.59 8 1.15 29 1.01 0.68—1.4554 Economically inactive 204 0.98 132 0.86 [0.48] 0.00 58 0.90 276 0.87 670 0.90 0.84—0.97
1-54 All categories 393 1.00 425 1.00 2 1.00 180 1.00 548 1.00 1548 1.00 # REF. #
Obs = observed number of cases; SIR = standardised incidence ratio; 95% CI = 95% confidence interval
55 Index Prev Next

Acta Oncologica - Pukkala et al, 2008 Breast cancer
Observed number of breast cancer among men in the Nordic countries and standardised incidence ratios 1961-2005, by country andoccupational category
Denmark Finland Iceland Norway Sweden Total
No Occupational category Obs SIR Obs SIR Obs SIR Obs SIR Obs SIR Obs SIR 95% CI
1 Technical workers, etc 32 1.01 24 1.30 2 3.15 10 0.68 103 1.05 171 1.04 0.90—1.212 Laboratory assistants [0.62] 0.00 [0.47] 0.00 [0.12] 0.00 1 1.42 [0.46] 0.00 1 0.42 0.01—2.343 Physicians 4 1.50 1 0.92 1 3.90 1 0.51 4 0.89 11 1.05 0.52—1.884 Dentists [0.76] 0.00 [0.23] 0.00 [0.06] 0.00 3 3.45 2 0.89 5 1.20 0.39—2.805 Nurses [0.04] 0.00 [0.07] 0.00 [0.00] 0.00 1 12.43 [0.25] 0.00 1 2.29 0.06—12.756 Assistant nurses 1 1.34 [0.06] 0.00 [0.03] 0.00 [0.33] 0.00 1 0.63 2 0.73 0.09—2.637 "Other health workers" 3 1.34 1 1.00 [0.07] 0.00 1 1.34 6 1.58 11 1.40 0.70—2.508 Teachers 11 0.79 9 1.18 [0.93] 0.00 13 1.19 34 1.33 67 1.14 0.88—1.449 Religious workers etc 3 0.50 6 1.41 [0.60] 0.00 6 1.07 17 0.86 32 0.89 0.61—1.2510 Artistic workers 4 2.22 3 2.05 [0.16] 0.00 6 3.68 5 0.83 18 1.63 0.97—2.5711 Journalists 1 1.18 [0.70] 0.00 [0.09] 0.00 1 1.41 12 4.28 14 2.72 1.49—4.5612 Administrators 36 1.00 15 1.35 [1.47] 0.00 15 0.76 51 1.33 117 1.10 0.91—1.3113 Clerical workers 16 1.04 11 1.53 2 1.19 20 1.36 49 1.19 98 1.22 0.99—1.4914 Sales agents 9 1.12 18 1.71 1 1.18 12 0.70 60 1.01 100 1.04 0.86—1.2715 Shop workers 41 1.15 4 0.86 [0.61] 0.00 4 0.61 17 0.90 66 0.99 0.77—1.2616 Farmers 58 0.81 29 0.63 4 1.63 50 1.01 86 0.82 227 0.83 0.72—0.9417 Gardeners 9 0.90 7 0.99 [0.08] 0.00 9 0.76 39 1.02 64 0.95 0.73—1.2218 Fishermen 4 1.26 1 1.61 1 0.66 14 0.92 5 1.23 25 1.02 0.66—1.5019 Forestry workers 2 1.37 4 0.49 [0.01] 0.00 7 0.78 17 0.62 30 0.65 0.44—0.9320 Miners and quarry workers 2 4.66 1 0.76 [0.03] 0.00 6 2.46 8 1.19 17 1.55 0.90—2.4921 Seamen 4 1.20 2 1.11 [0.41] 0.00 10 0.83 7 1.18 23 0.98 0.62—1.4622 Transport workers 6 0.78 6 1.19 [0.78] 0.00 7 1.06 21 1.05 40 1.00 0.71—1.3623 Drivers 14 0.58 7 0.41 [1.17] 0.00 13 0.74 56 1.15 90 0.83 0.66—1.0224 Postal workers 2 0.42 1 0.39 [0.14] 0.00 5 1.46 11 1.01 19 0.87 0.52—1.3625 Textile workers 2 0.46 2 1.19 1 4.04 5 1.32 10 0.82 20 0.90 0.55—1.3926 Shoe and leather workers 1 0.92 [0.72] 0.00 [0.05] 0.00 1 0.63 5 1.02 7 0.84 0.34—1.7327 Smelting workers 11 1.16 1 0.39 2 5.74 4 0.79 16 0.84 34 0.93 0.64—1.3028 Mechanics 31 1.20 18 1.05 [1.16] 0.00 25 1.03 84 0.94 158 1.00 0.86—1.1729 Plumbers 1 0.44 1 0.34 [0.18] 0.00 2 0.72 8 0.78 12 0.65 0.34—1.1430 Welders – – 5 1.72 [0.07] 0.00 3 0.96 13 1.13 21 1.19 0.74—1.8231 Electrical workers 13 2.17 3 0.40 [0.69] 0.00 15 1.39 20 0.66 51 0.92 0.68—1.2132 Wood workers 14 0.77 13 0.76 [0.65] 0.00 23 0.80 59 0.97 109 0.87 0.72—1.0533 Painters 7 1.20 3 0.80 [0.26] 0.00 8 1.68 19 1.10 37 1.16 0.82—1.6034 "Other construction workers" 18 0.79 13 1.18 1 0.77 5 0.89 22 0.68 59 0.81 0.61—1.0435 Bricklayers 6 0.92 2 1.13 – – 1 0.35 9 1.15 18 0.95 0.56—1.5036 Printers 7 1.71 2 1.09 1 4.61 4 1.41 20 2.14 34 1.86 1.28—2.5937 Chemical process workers 8 2.08 6 2.08 [0.12] 0.00 9 1.42 14 0.96 37 1.33 0.94—1.8438 Food workers 13 1.04 3 1.43 [0.99] 0.00 2 0.28 16 1.09 34 0.91 0.63—1.2739 Beverage workers 2 1.37 [0.13] 0.00 [0.02] 0.00 1 12.82 [0.84] 0.00 3 1.19 0.24—3.4740 Tobacco workers [0.25] 0.00 [0.03] 0.00 [0.00] 0.00 [0.11] 0.00 [0.07] 0.00 [0.45] 0.00 0.00—8.1641 Glass makers etc 7 0.95 2 0.66 1 5.49 5 1.44 7 0.44 22 0.73 0.46—1.1142 Packers 3 0.46 13 2.14 [0.57] 0.00 8 0.74 27 0.93 51 0.96 0.72—1.2743 Engine operators 3 0.45 7 0.81 2 2.55 4 0.66 13 0.54 29 0.63 0.42—0.9044 Public safety workers 8 1.28 4 0.83 2 3.54 10 2.13 18 1.28 42 1.38 0.99—1.8645 Cooks and stewards 2 4.35 1 3.10 1 3.76 6 2.97 1 0.40 11 1.97 0.98—3.5246 Domestic assistants [0.01] 0.00 [0.02] 0.00 [0.00] 0.00 [0.02] 0.00 [0.22] 0.00 [0.27] 0.00 0.00—13.8647 Waiters 1 1.07 [0.32] 0.00 [0.03] 0.00 4 4.59 1 0.78 6 1.74 0.64—3.7948 Building caretakers 13 1.97 7 1.78 [0.24] 0.00 1 0.42 18 1.58 39 1.59 1.13—2.1749 Chimney sweeps [0.17] 0.00 [0.28] 0.00 – – [0.24] 0.00 1 1.25 1 0.67 0.02—3.7450 Hairdressers 2 1.06 [0.09] 0.00 [0.04] 0.00 2 2.95 3 1.05 7 1.26 0.51—2.6051 Launderers [0.95] 0.00 [0.09] 0.00 [0.02] 0.00 [0.41] 0.00 3 1.47 3 0.86 0.18—2.5052 Military personnel 4 1.24 2 1.16 – – 4 1.05 7 0.85 17 1.00 0.58—1.6053 "Other workers" 26 1.33 7 1.50 2 0.91 23 1.11 26 0.74 84 1.02 0.81—1.2654 Economically inactive 21 1.18 29 1.16 3 1.84 12 1.06 76 1.40 141 1.28 1.09—1.51
1-54 All categories 486 1.00 294 1.00 27 1.00 402 1.00 1127 1.00 2336 1.00 # REF. #
Obs = observed number of cases; SIR = standardised incidence ratio; 95% CI = 95% confidence interval
56 Index Prev Next

Acta Oncologica - Pukkala et al, 2008 Breast cancer
Observed number of breast cancer among women in the Nordic countries and standardised incidence ratios 1961-2005, by country andoccupational category
Denmark Finland Iceland Norway Sweden Total
No Occupational category Obs SIR Obs SIR Obs SIR Obs SIR Obs SIR Obs SIR 95% CI
1 Technical workers, etc 248 1.23 771 1.32 8 0.94 156 1.36 1130 1.18 2313 1.24 1.19—1.292 Laboratory assistants 192 1.21 358 1.18 15 1.25 167 1.29 457 1.20 1189 1.21 1.14—1.283 Physicians 108 1.61 211 1.41 1 0.57 66 1.23 316 1.28 702 1.35 1.25—1.454 Dentists 102 1.74 184 1.57 1 1.31 53 1.26 198 1.24 538 1.42 1.31—1.555 Nurses 1324 1.13 2024 1.31 60 1.17 1153 1.13 3121 1.14 7682 1.18 1.15—1.206 Assistant nurses 809 0.92 1300 0.94 63 0.91 923 0.94 4965 0.96 8060 0.95 0.93—0.977 "Other health workers" 835 1.25 1367 1.18 19 1.21 1008 1.05 2019 1.13 5248 1.14 1.11—1.178 Teachers 1971 1.27 3467 1.35 109 1.16 2231 1.16 7537 1.18 15315 1.22 1.20—1.249 Religious workers etc 230 1.14 1918 1.19 20 1.47 570 1.21 2822 1.18 5560 1.19 1.16—1.2210 Artistic workers 130 1.32 300 1.30 10 0.90 166 1.22 515 1.24 1121 1.26 1.18—1.3311 Journalists 34 1.51 181 1.29 5 1.63 53 1.36 277 1.38 550 1.36 1.25—1.4812 Administrators 784 1.35 689 1.40 8 1.05 563 1.26 1123 1.19 3167 1.28 1.24—1.3313 Clerical workers 7672 1.25 10490 1.20 343 1.24 6903 1.21 17656 1.17 43064 1.20 1.19—1.2114 Sales agents 63 1.19 1171 1.07 32 1.21 813 1.16 2073 1.09 4152 1.10 1.06—1.1315 Shop workers 4067 1.03 4049 1.01 157 0.96 4309 1.00 7611 0.99 20193 1.00 0.99—1.0216 Farmers 2001 0.71 1489 0.79 90 0.82 2176 0.82 697 0.89 6453 0.78 0.76—0.8017 Gardeners 283 0.79 4230 0.74 4 1.07 1184 0.75 1599 0.83 7300 0.76 0.74—0.7818 Fishermen 8 0.55 7 0.47 7 1.49 17 0.74 5 0.72 44 0.69 0.50—0.9219 Forestry workers 4 1.05 22 0.73 [0.59] 0.00 19 0.62 40 0.84 85 0.75 0.60—0.9320 Miners and quarry workers [0.23] 0.00 14 1.32 [0.07] 0.00 1 0.48 9 0.71 24 0.94 0.60—1.3921 Seamen – – 4 0.79 [0.02] 0.00 1 0.18 3 1.39 8 0.63 0.27—1.2322 Transport workers 2 0.51 217 1.30 6 1.45 34 1.22 139 0.96 398 1.15 1.04—1.2723 Drivers 78 0.77 74 0.69 1 0.43 84 0.88 331 0.84 568 0.81 0.75—0.8824 Postal workers 207 1.01 1204 1.05 44 0.84 1170 1.11 2566 1.09 5191 1.08 1.05—1.1125 Textile workers 1243 0.94 2519 1.01 85 1.01 1538 1.02 3957 0.99 9342 0.99 0.97—1.0126 Shoe and leather workers 103 1.04 334 1.08 9 1.92 88 0.81 307 0.99 841 1.01 0.94—1.0827 Smelting workers 17 0.70 55 0.77 1 4.23 16 1.03 100 0.88 189 0.84 0.73—0.9728 Mechanics 213 0.86 306 0.85 2 1.87 152 1.05 1041 0.95 1714 0.93 0.88—0.9729 Plumbers 1 0.51 1 0.97 – – [1.15] 0.00 4 1.69 6 0.92 0.34—2.0130 Welders – – 22 0.65 [0.12] 0.00 10 0.76 42 0.82 74 0.75 0.59—0.9531 Electrical workers 338 0.97 271 0.95 1 1.22 167 1.04 568 0.92 1345 0.95 0.90—1.0032 Wood workers 89 0.79 439 0.73 1 0.60 58 1.07 138 0.71 725 0.75 0.70—0.8133 Painters 6 1.41 71 0.93 [0.49] 0.00 14 1.19 41 0.84 132 0.93 0.78—1.1034 "Other construction workers" [3.23] 0.00 190 0.90 [0.31] 0.00 2 0.42 8 0.96 200 0.88 0.76—1.0135 Bricklayers 1 1.52 3 0.35 – – [0.27] 0.00 [0.30] 0.00 4 0.41 0.11—1.0536 Printers 157 1.24 386 1.13 6 0.74 192 1.37 468 1.08 1209 1.15 1.09—1.2237 Chemical process workers 187 0.96 146 0.90 2 0.62 108 0.88 283 0.88 726 0.90 0.84—0.9738 Food workers 800 0.82 689 0.85 164 0.84 628 0.85 796 0.90 3077 0.86 0.83—0.8939 Beverage workers 90 1.02 44 1.03 1 2.26 6 0.86 54 1.01 195 1.02 0.88—1.1740 Tobacco workers 137 1.11 21 0.85 – – 25 0.95 39 1.03 222 1.04 0.92—1.1941 Glass makers etc 207 0.85 510 0.84 4 0.74 260 0.99 825 0.94 1806 0.91 0.87—0.9542 Packers 62 0.91 1007 0.95 16 0.92 588 0.97 1199 0.95 2872 0.95 0.92—0.9943 Engine operators 4 1.65 157 0.86 [0.28] 0.00 11 1.01 83 0.75 255 0.83 0.73—0.9444 Public safety workers 7 1.09 65 1.36 6 1.73 81 1.12 158 1.01 317 1.11 0.99—1.2445 Cooks and stewards 3 1.20 1158 0.95 70 1.09 787 0.98 1675 0.99 3693 0.98 0.94—1.0146 Domestic assistants 1316 0.89 1346 0.92 19 1.09 2003 0.93 5226 0.93 9910 0.93 0.91—0.9447 Waiters 297 1.16 1072 0.96 9 1.11 948 1.01 1745 0.98 4071 0.99 0.96—1.0348 Building caretakers 3692 0.87 3291 0.83 102 0.76 3404 0.86 4463 0.87 14952 0.86 0.84—0.8749 Chimney sweeps [0.36] 0.00 1 0.51 – – [0.49] 0.00 [0.23] 0.00 1 0.33 0.01—1.8450 Hairdressers 300 1.10 432 0.99 9 0.90 265 1.02 977 1.09 1983 1.06 1.01—1.1051 Launderers 426 0.90 250 0.88 16 0.84 257 0.79 808 0.93 1757 0.89 0.85—0.9452 Military personnel 5 2.06 10 1.52 – – 3 2.00 8 1.32 26 1.57 1.03—2.3053 "Other workers" 1270 1.04 1213 0.92 145 0.99 2029 0.96 2165 0.92 6822 0.95 0.93—0.9854 Economically inactive 30068 0.97 22004 0.96 491 0.98 25539 0.99 87868 0.96 165970 0.97 0.96—0.97
1-54 All categories 62191 1.00 73754 1.00 2162 1.00 62999 1.00 172255 1.00 373361 1.00 # REF. #
Obs = observed number of cases; SIR = standardised incidence ratio; 95% CI = 95% confidence interval
57 Index Prev Next

Acta Oncologica - Pukkala et al, 2008 Ductal breast cancer
Observed number of ductal breast cancer among women in the Nordic countries and standardised incidence ratios 1961-2005, bycountry and occupational category
Denmark Finland Iceland Norway Sweden Total
No Occupational category Obs SIR Obs SIR Obs SIR Obs SIR Obs SIR Obs SIR 95% CI
1 Technical workers, etc – – 575 1.30 8 1.19 110 1.34 403 1.17 1096 1.25 1.18—1.332 Laboratory assistants – – 283 1.25 11 1.16 101 1.12 211 1.15 606 1.19 1.10—1.293 Physicians – – 152 1.34 1 0.74 44 1.19 119 1.17 316 1.25 1.12—1.394 Dentists – – 131 1.54 1 1.66 31 1.10 70 1.30 233 1.39 1.23—1.585 Nurses – – 1481 1.28 49 1.22 810 1.13 1052 1.12 3392 1.19 1.15—1.236 Assistant nurses – – 965 0.95 52 0.95 646 0.92 1804 0.96 3467 0.95 0.92—0.987 "Other health workers" – – 1016 1.18 14 1.13 732 1.09 764 1.12 2526 1.14 1.09—1.188 Teachers – – 2519 1.33 90 1.22 1569 1.18 2553 1.14 6731 1.22 1.19—1.259 Religious workers etc – – 1422 1.16 14 1.31 394 1.20 1144 1.18 2974 1.17 1.13—1.2210 Artistic workers – – 220 1.28 7 0.81 115 1.25 197 1.32 539 1.27 1.17—1.3911 Journalists – – 136 1.31 4 1.67 37 1.36 94 1.27 271 1.30 1.16—1.4712 Administrators – – 517 1.41 7 1.18 373 1.22 400 1.18 1297 1.28 1.21—1.3513 Clerical workers – – 7792 1.21 270 1.24 4645 1.19 5673 1.14 18380 1.18 1.17—1.2014 Sales agents – – 850 1.07 29 1.41 518 1.16 590 1.13 1987 1.11 1.07—1.1615 Shop workers – – 2941 1.02 126 0.98 2909 1.01 1736 0.95 7712 1.00 0.97—1.0216 Farmers – – 990 0.76 65 0.76 1385 0.83 178 0.83 2618 0.80 0.77—0.8417 Gardeners – – 2880 0.73 4 1.37 745 0.75 355 0.87 3984 0.74 0.72—0.7718 Fishermen – – 5 0.47 5 1.36 11 0.69 [1.80] 0.00 21 0.65 0.40—1.0019 Forestry workers – – 17 0.78 [0.46] 0.00 10 0.49 8 0.60 35 0.62 0.44—0.8720 Miners and quarry workers – – 13 1.77 [0.06] 0.00 1 0.67 4 0.96 18 1.38 0.82—2.1821 Seamen – – 4 1.05 [0.02] 0.00 1 0.26 1 0.98 6 0.69 0.25—1.5022 Transport workers – – 171 1.46 4 1.24 24 1.24 44 0.96 243 1.31 1.15—1.4923 Drivers – – 58 0.74 1 0.55 51 0.78 118 0.84 228 0.80 0.70—0.9124 Postal workers – – 859 1.04 35 0.85 781 1.10 653 1.01 2328 1.05 1.01—1.0925 Textile workers – – 1808 1.02 68 1.04 970 1.03 652 0.94 3498 1.01 0.97—1.0426 Shoe and leather workers – – 239 1.08 8 2.20 51 0.74 44 0.81 342 0.98 0.88—1.0927 Smelting workers – – 40 0.79 1 5.45 12 1.06 36 0.97 89 0.90 0.72—1.1028 Mechanics – – 220 0.84 1 1.18 107 1.12 303 0.91 631 0.91 0.84—0.9929 Plumbers – – 1 1.28 – – [0.83] 0.00 4 3.66 5 1.85 0.60—4.3230 Welders – – 13 0.52 [0.10] 0.00 7 0.73 16 0.78 36 0.65 0.46—0.9031 Electrical workers – – 212 1.00 1 1.56 111 1.03 194 0.99 518 1.00 0.92—1.0932 Wood workers – – 330 0.78 [1.29] 0.00 40 1.05 54 0.82 424 0.80 0.73—0.8833 Painters – – 54 0.98 [0.39] 0.00 9 1.13 21 1.38 84 1.07 0.86—1.3334 "Other construction workers" – – 131 0.90 [0.24] 0.00 1 0.29 4 1.09 136 0.89 0.75—1.0635 Bricklayers – – 1 0.16 – – [0.19] 0.00 [0.14] 0.00 1 0.16 0.00—0.8636 Printers – – 281 1.13 4 0.63 121 1.32 107 0.89 513 1.10 1.01—1.2037 Chemical process workers – – 99 0.86 [2.51] 0.00 82 1.03 78 0.98 259 0.94 0.83—1.0638 Food workers – – 491 0.85 126 0.82 416 0.88 144 0.82 1177 0.86 0.81—0.9139 Beverage workers – – 31 1.04 1 2.90 2 0.42 6 0.65 40 0.91 0.65—1.2340 Tobacco workers – – 16 0.93 – – 19 1.19 17 1.83 52 1.22 0.91—1.6041 Glass makers etc – – 372 0.86 3 0.70 166 0.97 201 0.90 742 0.89 0.83—0.9642 Packers – – 735 0.97 10 0.74 380 0.96 303 0.98 1428 0.97 0.92—1.0243 Engine operators – – 117 0.89 [0.22] 0.00 6 0.75 30 0.71 153 0.84 0.71—0.9844 Public safety workers – – 48 1.37 4 1.48 50 1.02 64 0.95 166 1.08 0.92—1.2545 Cooks and stewards – – 829 0.95 49 0.98 475 0.94 318 0.99 1671 0.95 0.91—1.0046 Domestic assistants – – 977 0.91 16 1.19 1295 0.93 1593 0.93 3881 0.92 0.89—0.9547 Waiters – – 785 0.97 8 1.26 603 0.98 371 1.04 1767 0.99 0.94—1.0448 Building caretakers – – 2368 0.85 78 0.75 2273 0.86 1106 0.85 5825 0.85 0.83—0.8749 Chimney sweeps – – 1 0.72 – – [0.33] 0.00 [0.11] 0.00 1 0.55 0.01—3.0550 Hairdressers – – 332 1.05 6 0.77 179 1.04 287 1.07 804 1.05 0.98—1.1351 Launderers – – 181 0.92 12 0.82 187 0.91 143 1.04 523 0.94 0.86—1.0352 Military personnel – – 8 1.59 – – 2 1.77 3 0.99 13 1.41 0.75—2.4253 "Other workers" – – 864 0.91 120 1.05 1353 0.94 573 0.91 2910 0.93 0.89—0.9654 Economically inactive – – 14772 0.94 375 0.96 15558 0.98 15503 0.94 46208 0.96 0.95—0.96
1-54 All categories – – 52353 1.00 1688 1.00 40518 1.00 40346 1.00 134905 1.00 # REF. #
Obs = observed number of cases; SIR = standardised incidence ratio; 95% CI = 95% confidence interval
58 Index Prev Next

Acta Oncologica - Pukkala et al, 2008 Lobular breast cancer
Observed number of lobular breast cancer among women in the Nordic countries and standardised incidence ratios 1961-2005, bycountry and occupational category
Denmark Finland Iceland Norway Sweden Total
No Occupational category Obs SIR Obs SIR Obs SIR Obs SIR Obs SIR Obs SIR 95% CI
1 Technical workers, etc – – 118 1.47 [0.68] 0.00 16 1.73 74 1.00 208 1.27 1.11—1.452 Laboratory assistants – – 35 0.87 2 2.00 18 1.85 47 1.23 102 1.14 0.94—1.393 Physicians – – 38 1.84 [0.15] 0.00 7 1.80 34 1.58 79 1.71 1.36—2.134 Dentists – – 23 1.59 [0.06] 0.00 5 1.80 20 1.72 48 1.66 1.22—2.205 Nurses – – 319 1.55 4 0.94 89 1.11 242 1.19 654 1.32 1.23—1.436 Assistant nurses – – 155 0.89 4 0.72 73 0.92 378 0.93 610 0.92 0.85—1.007 "Other health workers" – – 192 1.27 1 0.78 71 1.00 184 1.27 448 1.22 1.11—1.338 Teachers – – 495 1.50 11 1.40 191 1.35 624 1.28 1321 1.36 1.29—1.449 Religious workers etc – – 287 1.27 3 2.61 44 1.24 237 1.17 571 1.23 1.13—1.3310 Artistic workers – – 43 1.39 2 2.12 13 1.38 48 1.50 106 1.45 1.20—1.7511 Journalists – – 30 1.64 [0.27] 0.00 5 1.70 32 2.01 67 1.79 1.39—2.2812 Administrators – – 105 1.60 [0.65] 0.00 46 1.48 105 1.46 256 1.51 1.34—1.7113 Clerical workers – – 1404 1.23 42 1.84 559 1.39 1275 1.16 3280 1.23 1.19—1.2714 Sales agents – – 152 1.14 [2.25] 0.00 50 1.27 134 1.18 336 1.17 1.05—1.3015 Shop workers – – 465 0.95 9 0.66 258 0.89 370 0.87 1102 0.91 0.85—0.9616 Farmers – – 139 0.71 5 0.54 121 0.77 52 1.12 317 0.78 0.70—0.8717 Gardeners – – 401 0.65 [0.31] 0.00 69 0.73 79 0.81 549 0.68 0.63—0.7418 Fishermen – – 1 0.56 1 2.51 2 1.19 [0.40] 0.00 4 0.94 0.26—2.4019 Forestry workers – – 1 0.27 [0.05] 0.00 1 0.47 3 0.99 5 0.56 0.18—1.3020 Miners and quarry workers – – [1.13] 0.00 [0.01] 0.00 [0.16] 0.00 2 2.13 2 0.90 0.11—3.2321 Seamen – – [0.68] 0.00 [0.00] 0.00 [0.41] 0.00 [0.20] 0.00 [1.30] 0.00 0.00—2.8522 Transport workers – – 15 0.81 1 2.83 1 0.49 10 1.04 27 0.88 0.58—1.2823 Drivers – – 8 0.57 [0.20] 0.00 8 1.15 29 0.94 45 0.87 0.63—1.1624 Postal workers – – 145 1.06 6 1.36 78 1.12 170 1.15 399 1.11 1.01—1.2325 Textile workers – – 252 0.86 7 0.98 62 0.77 178 1.09 499 0.92 0.84—1.0026 Shoe and leather workers – – 30 0.82 1 2.46 4 0.68 15 1.16 50 0.90 0.67—1.1827 Smelting workers – – 8 0.97 [0.02] 0.00 [1.28] 0.00 7 0.84 15 0.84 0.47—1.3928 Mechanics – – 35 0.79 1 11.51 4 0.43 65 0.88 105 0.82 0.68—1.0029 Plumbers – – [0.14] 0.00 – – [0.09] 0.00 [0.23] 0.00 [0.46] 0.00 0.00—8.0230 Welders – – 7 1.57 [0.01] 0.00 1 0.91 4 0.91 12 1.21 0.62—2.1131 Electrical workers – – 37 0.98 [0.07] 0.00 6 0.56 29 0.67 72 0.78 0.61—0.9932 Wood workers – – 36 0.53 [0.15] 0.00 2 0.49 8 0.56 46 0.53 0.39—0.7133 Painters – – 11 1.23 [0.04] 0.00 [0.83] 0.00 1 0.30 12 0.91 0.47—1.5934 "Other construction workers" – – 16 0.74 [0.02] 0.00 [0.37] 0.00 [0.76] 0.00 16 0.70 0.40—1.1435 Bricklayers – – [1.03] 0.00 – – [0.02] 0.00 [0.03] 0.00 [1.08] 0.00 0.00—3.4136 Printers – – 41 0.99 [0.65] 0.00 15 1.77 26 0.98 82 1.06 0.84—1.3237 Chemical process workers – – 17 0.90 1 3.74 10 1.37 8 0.44 36 0.81 0.57—1.1238 Food workers – – 73 0.78 8 0.49 41 0.96 24 0.60 146 0.76 0.64—0.8939 Beverage workers – – 4 0.85 [0.03] 0.00 1 1.98 5 2.32 10 1.35 0.65—2.4940 Tobacco workers – – 3 1.09 – – 1 0.87 3 1.38 7 1.15 0.46—2.3741 Glass makers etc – – 55 0.76 [0.45] 0.00 11 0.68 43 0.85 109 0.78 0.65—0.9442 Packers – – 91 0.73 [1.45] 0.00 44 1.16 76 1.09 211 0.90 0.79—1.0343 Engine operators – – 10 0.45 [0.02] 0.00 [0.91] 0.00 4 0.43 14 0.43 0.24—0.7244 Public safety workers – – 7 1.14 1 3.48 4 0.80 18 1.32 30 1.20 0.81—1.7145 Cooks and stewards – – 135 0.93 10 1.84 49 1.12 58 0.80 252 0.95 0.84—1.0746 Domestic assistants – – 145 0.78 [1.47] 0.00 81 0.66 318 0.87 544 0.80 0.74—0.8747 Waiters – – 122 0.89 [0.66] 0.00 57 0.97 66 0.80 245 0.88 0.77—0.9948 Building caretakers – – 343 0.76 13 1.14 217 0.82 198 0.68 771 0.76 0.70—0.8149 Chimney sweeps – – [0.21] 0.00 – – [0.04] 0.00 [0.02] 0.00 [0.27] 0.00 0.00—13.5050 Hairdressers – – 48 0.89 1 1.19 21 1.27 73 1.22 143 1.09 0.92—1.2851 Launderers – – 20 0.65 [1.60] 0.00 8 0.45 29 0.90 57 0.69 0.52—0.8952 Military personnel – – 1 1.06 – – [0.13] 0.00 [0.62] 0.00 1 0.59 0.02—3.3053 "Other workers" – – 152 0.96 10 0.81 146 1.02 141 1.01 449 0.99 0.90—1.0954 Economically inactive – – 2245 0.96 37 0.88 1101 0.94 3643 0.94 7026 0.94 0.92—0.97
1-54 All categories – – 8515 1.00 181 1.00 3611 1.00 9189 1.00 21496 1.00 # REF. #
Obs = observed number of cases; SIR = standardised incidence ratio; 95% CI = 95% confidence interval
59 Index Prev Next

Acta Oncologica - Pukkala et al, 2008 Cancer of the cervix uteri
Observed number of cancer of the cervix uteri among women in the Nordic countries and standardised incidence ratios 1961-2005, bycountry and occupational category
Denmark Finland Iceland Norway Sweden Total
No Occupational category Obs SIR Obs SIR Obs SIR Obs SIR Obs SIR Obs SIR 95% CI
1 Technical workers, etc 34 0.96 28 0.96 [1.01] 0.00 21 1.10 89 0.80 172 0.88 0.75—1.022 Laboratory assistants 21 0.76 15 1.00 3 2.29 14 0.66 38 1.00 91 0.88 0.71—1.083 Physicians 5 0.43 5 0.68 [0.18] 0.00 2 0.22 21 0.78 33 0.59 0.41—0.834 Dentists 3 0.29 5 0.72 [0.07] 0.00 4 0.54 9 0.48 21 0.48 0.30—0.745 Nurses 101 0.50 47 0.62 6 1.18 102 0.65 214 0.68 470 0.62 0.57—0.686 Assistant nurses 166 1.08 61 0.81 5 0.69 140 0.96 607 1.05 979 1.02 0.96—1.097 "Other health workers" 56 0.48 41 0.66 1 0.60 116 0.76 161 0.81 375 0.70 0.64—0.788 Teachers 151 0.57 75 0.55 8 0.81 175 0.55 436 0.63 845 0.59 0.55—0.639 Religious workers etc 26 0.74 55 0.73 1 0.71 46 0.61 184 0.69 312 0.69 0.62—0.7710 Artistic workers 20 1.17 13 1.11 1 0.96 14 0.61 51 1.07 99 0.98 0.80—1.2011 Journalists 3 0.75 8 1.10 1 3.41 6 0.94 23 1.03 41 1.01 0.73—1.3812 Administrators 100 0.97 25 0.98 [0.64] 0.00 74 1.05 118 1.12 317 1.04 0.93—1.1613 Clerical workers 975 0.90 446 0.99 27 0.97 815 0.85 1746 1.02 4009 0.95 0.92—0.9814 Sales agents 12 1.28 52 0.78 4 1.72 108 0.94 271 1.18 447 1.06 0.96—1.1615 Shop workers 710 1.02 224 1.00 19 1.23 692 1.00 1141 1.19 2786 1.07 1.04—1.1216 Farmers 238 0.49 144 0.93 2 0.22 246 0.61 55 0.62 685 0.60 0.55—0.6417 Gardeners 44 0.70 287 0.71 [0.34] 0.00 147 0.60 154 0.65 632 0.66 0.61—0.7218 Fishermen 2 0.78 [0.94] 0.00 [0.46] 0.00 8 2.35 2 2.42 12 1.47 0.76—2.5619 Forestry workers 1 1.48 [1.66] 0.00 [0.06] 0.00 8 1.71 8 1.45 17 1.35 0.79—2.1720 Miners and quarry workers [0.04] 0.00 2 2.63 [0.01] 0.00 1 3.25 1 0.75 4 1.63 0.44—4.1621 Seamen – – 1 3.80 [0.00] 0.00 [0.86] 0.00 [0.25] 0.00 1 0.72 0.02—4.0422 Transport workers [0.70] 0.00 18 1.60 [0.33] 0.00 4 0.83 25 1.31 47 1.30 0.96—1.7323 Drivers 22 1.21 11 2.03 [0.22] 0.00 23 1.58 66 1.55 122 1.51 1.26—1.8024 Postal workers 31 0.85 50 0.72 2 0.45 158 0.88 255 0.89 496 0.86 0.79—0.9425 Textile workers 298 1.26 180 1.16 6 0.87 284 1.08 586 1.10 1354 1.13 1.07—1.1926 Shoe and leather workers 24 1.35 18 0.95 [0.41] 0.00 26 1.32 64 1.51 132 1.33 1.12—1.5827 Smelting workers 11 2.51 3 0.68 [0.02] 0.00 4 1.78 16 1.27 34 1.43 0.99—2.0128 Mechanics 68 1.52 20 0.98 [0.09] 0.00 28 1.11 161 1.25 277 1.26 1.12—1.4229 Plumbers [0.32] 0.00 [0.05] 0.00 – – [0.17] 0.00 [0.24] 0.00 [0.78] 0.00 0.00—4.7230 Welders – – 1 0.62 [0.01] 0.00 5 2.46 6 1.10 12 1.31 0.68—2.3031 Electrical workers 100 1.59 16 1.14 [0.08] 0.00 46 1.62 91 1.23 253 1.41 1.25—1.5932 Wood workers 29 1.43 51 1.31 [0.17] 0.00 5 0.61 24 1.09 109 1.22 1.01—1.4733 Painters [0.77] 0.00 10 2.14 [0.05] 0.00 2 1.04 6 1.04 18 1.36 0.81—2.1534 "Other construction workers" 1 1.71 33 2.07 [0.03] 0.00 [0.67] 0.00 [0.86] 0.00 34 1.88 1.30—2.6335 Bricklayers [0.12] 0.00 2 4.12 – – 1 25.25 [0.03] 0.00 3 4.45 0.92—13.0036 Printers 32 1.41 20 0.97 1 1.27 36 1.47 61 1.14 150 1.23 1.05—1.4437 Chemical process workers 61 1.73 9 0.89 [0.28] 0.00 35 1.62 45 1.11 150 1.39 1.18—1.6338 Food workers 263 1.51 49 0.94 21 1.15 141 1.16 132 1.16 606 1.26 1.17—1.3739 Beverage workers 31 1.90 5 1.69 [0.04] 0.00 2 1.86 17 2.42 55 2.01 1.51—2.6140 Tobacco workers 38 1.67 [1.61] 0.00 – – 7 1.36 8 1.66 53 1.54 1.16—2.0241 Glass makers etc 70 1.60 50 1.36 3 5.94 58 1.25 147 1.36 328 1.39 1.25—1.5542 Packers 15 1.23 100 1.55 1 0.66 130 1.27 222 1.39 468 1.38 1.26—1.5143 Engine operators [0.44] 0.00 13 1.23 [0.03] 0.00 3 1.82 13 1.13 29 1.20 0.80—1.7244 Public safety workers [1.21] 0.00 3 1.12 1 3.01 12 1.20 19 1.05 35 1.08 0.75—1.5045 Cooks and stewards 1 2.23 76 0.99 8 1.44 168 1.29 290 1.33 543 1.26 1.16—1.3746 Domestic assistants 285 1.08 79 0.92 1 0.70 340 0.98 779 1.17 1484 1.09 1.04—1.1547 Waiters 106 2.26 102 1.61 1 1.26 239 1.54 368 1.59 816 1.64 1.53—1.7548 Building caretakers 990 1.30 359 1.38 9 0.79 810 1.33 937 1.54 3105 1.38 1.34—1.4349 Chimney sweeps [0.05] 0.00 [0.13] 0.00 – – [0.07] 0.00 [0.02] 0.00 [0.28] 0.00 0.00—13.2950 Hairdressers 52 1.10 34 1.37 [1.18] 0.00 48 1.03 148 1.36 282 1.23 1.10—1.3851 Launderers 85 1.00 27 1.34 [1.49] 0.00 73 1.36 147 1.27 332 1.20 1.08—1.3452 Military personnel 1 2.27 1 4.22 – – [0.21] 0.00 [0.61] 0.00 2 1.33 0.16—4.8253 "Other workers" 280 1.28 96 1.18 19 1.40 341 1.01 378 1.33 1114 1.19 1.12—1.2654 Economically inactive 5446 0.99 1846 1.02 51 1.10 4944 1.05 11170 0.94 23457 0.98 0.97—0.99
1-54 All categories 11008 1.00 4816 1.00 202 1.00 10712 1.00 21510 1.00 48248 1.00 # REF. #
Obs = observed number of cases; SIR = standardised incidence ratio; 95% CI = 95% confidence interval
60 Index Prev Next

Acta Oncologica - Pukkala et al, 2008 Cancer of the corpus uteri
Observed number of cancer of the corpus uteri among women in the Nordic countries and standardised incidence ratios 1961-2005, bycountry and occupational category
Denmark Finland Iceland Norway Sweden Total
No Occupational category Obs SIR Obs SIR Obs SIR Obs SIR Obs SIR Obs SIR 95% CI
1 Technical workers, etc 54 1.10 100 1.11 [1.12] 0.00 29 1.23 188 1.04 371 1.07 0.97—1.192 Laboratory assistants 31 0.88 57 1.04 1 0.57 35 1.24 44 0.89 168 0.99 0.85—1.153 Physicians 24 1.44 25 1.13 [0.29] 0.00 17 1.50 44 1.06 110 1.19 0.99—1.444 Dentists 15 1.02 44 1.85 [0.13] 0.00 9 0.97 30 0.95 98 1.24 1.00—1.515 Nurses 326 1.14 315 1.14 7 0.84 210 0.94 587 1.09 1445 1.08 1.03—1.146 Assistant nurses 178 0.85 258 0.89 8 0.74 229 1.03 915 0.95 1588 0.93 0.89—0.987 "Other health workers" 215 1.29 263 1.18 2 0.86 219 1.01 288 0.90 987 1.06 1.00—1.138 Teachers 414 1.14 607 1.21 15 1.03 457 1.10 1295 1.06 2788 1.11 1.07—1.159 Religious workers etc 61 1.23 278 1.22 5 2.29 132 1.29 433 1.12 909 1.18 1.10—1.2610 Artistic workers 30 1.21 50 1.29 5 2.74 31 1.03 96 1.23 212 1.22 1.07—1.4011 Journalists 8 1.48 36 1.40 [0.49] 0.00 9 1.06 41 1.13 94 1.23 0.99—1.5112 Administrators 179 1.18 105 1.29 4 2.69 116 1.20 181 1.06 585 1.17 1.08—1.2713 Clerical workers 1762 1.18 1824 1.13 36 0.82 1429 1.09 3353 1.08 8404 1.11 1.09—1.1314 Sales agents 19 1.39 244 1.07 3 0.62 183 1.13 406 1.02 855 1.06 0.99—1.1315 Shop workers 1041 1.03 846 0.94 34 1.20 1039 0.99 1895 1.02 4855 1.00 0.97—1.0316 Farmers 614 0.85 425 0.91 19 0.91 645 1.01 157 1.03 1860 0.93 0.89—0.9817 Gardeners 81 0.86 1427 0.94 2 2.90 349 0.90 506 1.04 2365 0.95 0.91—0.9918 Fishermen 2 0.55 5 1.56 1 1.35 3 0.56 [1.50] 0.00 11 0.76 0.38—1.3619 Forestry workers 2 2.09 1 0.15 [0.10] 0.00 11 1.41 11 1.04 25 0.96 0.62—1.4220 Miners and quarry workers [0.04] 0.00 1 0.36 [0.02] 0.00 [0.44] 0.00 1 0.38 2 0.34 0.04—1.2221 Seamen – – [0.84] 0.00 [0.00] 0.00 [1.29] 0.00 [0.28] 0.00 [2.42] 0.00 0.00—1.5322 Transport workers 1 1.00 52 1.23 1 1.33 10 1.63 33 1.14 97 1.22 0.99—1.4923 Drivers 17 0.68 15 0.75 2 5.47 13 0.60 52 0.68 99 0.69 0.56—0.8424 Postal workers 61 1.15 265 1.01 5 0.51 247 1.00 614 1.13 1192 1.07 1.01—1.1325 Textile workers 314 0.93 585 1.01 16 0.94 339 0.94 1025 1.00 2279 0.98 0.94—1.0226 Shoe and leather workers 28 1.12 80 1.09 [0.89] 0.00 25 0.94 91 1.13 224 1.09 0.95—1.2427 Smelting workers 9 1.51 19 1.10 [0.05] 0.00 1 0.29 21 0.88 50 0.99 0.73—1.3028 Mechanics 58 0.97 63 0.82 [0.17] 0.00 24 0.69 220 0.94 365 0.90 0.81—1.0029 Plumbers [0.56] 0.00 [0.17] 0.00 – – 1 3.61 [0.32] 0.00 1 0.76 0.02—4.2130 Welders – – 5 0.83 [0.01] 0.00 1 0.35 10 1.12 16 0.90 0.51—1.4531 Electrical workers 87 1.04 37 0.74 [0.14] 0.00 35 0.91 115 0.89 274 0.91 0.81—1.0232 Wood workers 32 1.13 140 0.93 [0.29] 0.00 16 1.25 36 0.93 224 0.97 0.85—1.1133 Painters [1.00] 0.00 17 0.93 [0.07] 0.00 6 2.09 8 0.78 31 0.96 0.65—1.3634 "Other construction workers" [0.78] 0.00 53 0.91 [0.04] 0.00 3 2.79 [1.22] 0.00 56 0.91 0.69—1.1835 Bricklayers [0.17] 0.00 1 0.48 – – [0.07] 0.00 [0.04] 0.00 1 0.43 0.01—2.3836 Printers 27 0.87 63 0.85 1 0.71 33 1.01 99 1.04 223 0.95 0.83—1.0837 Chemical process workers 38 0.77 25 0.65 1 1.54 24 0.82 82 1.09 170 0.88 0.76—1.0338 Food workers 211 0.86 206 1.04 20 0.57 152 0.85 206 0.96 795 0.91 0.85—0.9739 Beverage workers 14 0.63 8 0.72 [0.09] 0.00 3 1.76 8 0.60 33 0.68 0.47—0.9640 Tobacco workers 26 0.85 5 0.80 – – 6 0.95 12 1.28 49 0.93 0.69—1.2341 Glass makers etc 67 1.14 130 0.93 1 1.09 63 0.98 168 0.82 429 0.92 0.83—1.0142 Packers 11 0.64 219 0.87 2 0.59 156 1.04 310 1.05 698 0.97 0.90—1.0543 Engine operators 1 2.22 44 1.08 [0.04] 0.00 2 0.84 12 0.58 59 0.92 0.70—1.1844 Public safety workers 3 1.69 7 0.82 [0.65] 0.00 15 0.90 19 0.82 44 0.87 0.63—1.1645 Cooks and stewards 2 3.18 262 0.98 13 1.01 202 1.06 413 1.04 892 1.03 0.96—1.1046 Domestic assistants 363 0.95 286 1.06 4 1.07 529 1.03 1150 1.06 2332 1.03 0.99—1.0847 Waiters 47 0.74 203 0.86 [1.45] 0.00 194 0.86 361 0.82 805 0.83 0.78—0.8948 Building caretakers 985 0.91 812 0.89 35 1.31 899 0.93 1046 0.92 3777 0.92 0.89—0.9549 Chimney sweeps [0.11] 0.00 1 1.88 – – [0.13] 0.00 [0.02] 0.00 1 1.26 0.03—7.0350 Hairdressers 80 1.26 93 1.07 1 0.71 57 0.96 192 0.98 423 1.04 0.95—1.1451 Launderers 110 0.89 65 0.88 5 1.20 57 0.72 200 0.91 437 0.87 0.80—0.9652 Military personnel 1 1.49 [0.91] 0.00 – – [0.32] 0.00 [0.72] 0.00 1 0.38 0.01—2.1353 "Other workers" 298 0.97 262 0.92 27 1.01 447 0.90 512 1.00 1546 0.95 0.90—1.0054 Economically inactive 7676 0.98 5807 0.99 111 1.19 5821 1.00 22847 0.99 42262 0.99 0.98—1.00
1-54 All categories 15623 1.00 16741 1.00 387 1.00 14533 1.00 40333 1.00 87617 1.00 # REF. #
Obs = observed number of cases; SIR = standardised incidence ratio; 95% CI = 95% confidence interval
61 Index Prev Next

Acta Oncologica - Pukkala et al, 2008 Choriocarcinoma
Observed number of choriocarcinoma among women in the Nordic countries and standardised incidence ratios 1961-2005, by countryand occupational category
Denmark Finland Iceland Norway Sweden Total
No Occupational category Obs SIR Obs SIR Obs SIR Obs SIR Obs SIR Obs SIR 95% CI
1 Technical workers, etc [0.04] 0.00 [0.34] 0.00 [0.01] 0.00 1 12.98 [0.52] 0.00 1 1.01 0.03—5.642 Laboratory assistants [0.04] 0.00 [0.15] 0.00 [0.01] 0.00 [0.07] 0.00 [0.29] 0.00 [0.56] 0.00 0.00—6.593 Physicians [0.01] 0.00 [0.09] 0.00 [0.00] 0.00 1 32.86 [0.15] 0.00 1 3.47 0.09—19.314 Dentists [0.01] 0.00 [0.05] 0.00 [0.00] 0.00 [0.02] 0.00 [0.08] 0.00 [0.17] 0.00 0.00—22.175 Nurses [0.21] 0.00 2 2.62 [0.03] 0.00 [0.49] 0.00 [1.41] 0.00 2 0.69 0.08—2.486 Assistant nurses [0.18] 0.00 1 1.57 [0.06] 0.00 [0.46] 0.00 3 1.06 4 0.96 0.26—2.467 "Other health workers" [0.12] 0.00 [0.59] 0.00 [0.01] 0.00 1 2.10 2 1.92 3 1.34 0.28—3.918 Teachers 2 6.18 [1.18] 0.00 [0.06] 0.00 [1.07] 0.00 4 1.18 6 1.00 0.37—2.179 Religious workers etc [0.04] 0.00 [0.92] 0.00 [0.01] 0.00 [0.26] 0.00 3 2.05 3 1.12 0.23—3.2610 Artistic workers [0.02] 0.00 [0.12] 0.00 [0.01] 0.00 [0.07] 0.00 [0.23] 0.00 [0.43] 0.00 0.00—8.4811 Journalists [0.00] 0.00 1 14.50 [0.00] 0.00 [0.02] 0.00 [0.11] 0.00 1 4.77 0.12—26.5912 Administrators [0.09] 0.00 1 4.07 [0.00] 0.00 1 4.63 [0.51] 0.00 2 1.89 0.23—6.8213 Clerical workers 2 1.63 2 0.48 [0.20] 0.00 2 0.70 5 0.66 11 0.68 0.34—1.2214 Sales agents [0.01] 0.00 2 4.25 [0.01] 0.00 [0.24] 0.00 [0.79] 0.00 2 1.32 0.16—4.7615 Shop workers 1 1.53 1 0.62 [0.08] 0.00 3 1.89 1 0.36 6 0.90 0.33—1.9616 Farmers 1 2.02 1 1.70 1 36.64 [0.62] 0.00 [0.33] 0.00 3 1.45 0.30—4.2517 Gardeners [0.06] 0.00 2 1.17 [0.00] 0.00 1 2.72 [0.60] 0.00 3 1.10 0.23—3.2118 Fishermen [0.00] 0.00 [0.01] 0.00 [0.00] 0.00 [0.01] 0.00 [0.00] 0.00 [0.02] 0.00 0.00—170.5919 Forestry workers [0.00] 0.00 [0.01] 0.00 [0.00] 0.00 [0.01] 0.00 [0.02] 0.00 [0.04] 0.00 0.00—90.1520 Miners and quarry workers [0.00] 0.00 [0.00] 0.00 [0.00] 0.00 [0.00] 0.00 [0.01] 0.00 [0.01] 0.00 0.00—370.4521 Seamen – – [0.00] 0.00 [0.00] 0.00 [0.00] 0.00 [0.00] 0.00 [0.01] 0.00 0.00—513.3522 Transport workers [0.00] 0.00 [0.06] 0.00 [0.00] 0.00 [0.02] 0.00 [0.07] 0.00 [0.15] 0.00 0.00—24.8023 Drivers [0.02] 0.00 [0.05] 0.00 [0.00] 0.00 [0.04] 0.00 [0.21] 0.00 [0.32] 0.00 0.00—11.4324 Postal workers 1 28.02 [0.46] 0.00 [0.01] 0.00 [0.51] 0.00 2 2.06 3 1.51 0.31—4.4225 Textile workers [0.23] 0.00 [0.95] 0.00 [0.02] 0.00 1 1.84 2 1.86 3 1.07 0.22—3.1226 Shoe and leather workers [0.02] 0.00 [0.12] 0.00 [0.00] 0.00 [0.04] 0.00 [0.09] 0.00 [0.27] 0.00 0.00—13.7127 Smelting workers [0.00] 0.00 [0.03] 0.00 – – [0.01] 0.00 1 17.83 1 10.62 0.27—59.1928 Mechanics [0.05] 0.00 1 6.77 [0.00] 0.00 [0.07] 0.00 1 1.91 2 2.54 0.31—9.1729 Plumbers [0.00] 0.00 [0.00] 0.00 – – [0.00] 0.00 [0.00] 0.00 [0.00] 0.00 0.00—1302.8330 Welders – – [0.01] 0.00 [0.00] 0.00 [0.01] 0.00 [0.03] 0.00 [0.05] 0.00 0.00—67.5731 Electrical workers 1 13.92 [0.14] 0.00 [0.00] 0.00 [0.08] 0.00 [0.30] 0.00 1 1.67 0.04—9.3232 Wood workers [0.02] 0.00 [0.21] 0.00 [0.00] 0.00 [0.02] 0.00 [0.10] 0.00 [0.36] 0.00 0.00—10.3433 Painters [0.00] 0.00 [0.03] 0.00 [0.00] 0.00 [0.00] 0.00 [0.02] 0.00 [0.06] 0.00 0.00—60.7034 "Other construction workers" [0.00] 0.00 [0.07] 0.00 [0.00] 0.00 [0.00] 0.00 [0.01] 0.00 [0.08] 0.00 0.00—48.6435 Bricklayers [0.00] 0.00 [0.00] 0.00 – – [0.00] 0.00 [0.00] 0.00 [0.00] 0.00 0.00—1075.6936 Printers [0.02] 0.00 1 6.59 [0.01] 0.00 [0.06] 0.00 [0.19] 0.00 1 2.32 0.06—12.9237 Chemical process workers [0.03] 0.00 [0.06] 0.00 [0.00] 0.00 [0.05] 0.00 [0.13] 0.00 [0.27] 0.00 0.00—13.6938 Food workers [0.17] 0.00 [0.29] 0.00 [0.10] 0.00 [0.24] 0.00 1 3.66 1 0.93 0.02—5.1939 Beverage workers [0.01] 0.00 [0.01] 0.00 [0.00] 0.00 [0.00] 0.00 [0.01] 0.00 [0.05] 0.00 0.00—78.9540 Tobacco workers [0.02] 0.00 [0.01] 0.00 – – [0.01] 0.00 [0.01] 0.00 [0.06] 0.00 0.00—65.3041 Glass makers etc [0.05] 0.00 [0.24] 0.00 [0.00] 0.00 [0.11] 0.00 [0.35] 0.00 [0.74] 0.00 0.00—4.9642 Packers [0.01] 0.00 1 2.48 [0.01] 0.00 [0.21] 0.00 1 2.13 2 1.81 0.22—6.5243 Engine operators [0.00] 0.00 [0.07] 0.00 [0.00] 0.00 [0.01] 0.00 [0.07] 0.00 [0.14] 0.00 0.00—25.4544 Public safety workers [0.00] 0.00 [0.02] 0.00 [0.00] 0.00 [0.02] 0.00 [0.10] 0.00 [0.15] 0.00 0.00—25.1845 Cooks and stewards [0.00] 0.00 1 2.01 [0.02] 0.00 [0.23] 0.00 1 2.00 2 1.61 0.19—5.8046 Domestic assistants [0.25] 0.00 [0.68] 0.00 [0.00] 0.00 [0.70] 0.00 3 1.14 3 0.70 0.15—2.0647 Waiters [0.05] 0.00 [0.49] 0.00 [0.00] 0.00 [0.34] 0.00 [0.54] 0.00 [1.42] 0.00 0.00—2.6048 Building caretakers [0.69] 0.00 3 2.08 [0.03] 0.00 [1.22] 0.00 1 0.50 4 0.74 0.20—1.9149 Chimney sweeps – – [0.00] 0.00 – – [0.00] 0.00 [0.00] 0.00 [0.00] 0.00 0.00—3155.7150 Hairdressers [0.05] 0.00 [0.19] 0.00 [0.01] 0.00 [0.14] 0.00 [0.42] 0.00 [0.81] 0.00 0.00—4.5851 Launderers [0.07] 0.00 [0.09] 0.00 [0.00] 0.00 [0.10] 0.00 1 4.59 1 2.07 0.05—11.5652 Military personnel [0.00] 0.00 [0.00] 0.00 – – [0.00] 0.00 [0.00] 0.00 [0.01] 0.00 0.00—409.1053 "Other workers" [0.20] 0.00 [0.56] 0.00 [0.07] 0.00 [0.90] 0.00 1 1.05 1 0.37 0.01—2.0754 Economically inactive 2 0.46 8 1.18 [0.19] 0.00 14 1.35 30 1.13 54 1.12 0.84—1.46
1-54 All categories 10 1.00 28 1.00 1 1.00 25 1.00 63 1.00 127 1.00 # REF. #
Obs = observed number of cases; SIR = standardised incidence ratio; 95% CI = 95% confidence interval
62 Index Prev Next

Acta Oncologica - Pukkala et al, 2008 Ovarian cancer
Observed number of ovarian cancer among women in the Nordic countries and standardised incidence ratios 1961-2005, by country andoccupational category
Denmark Finland Iceland Norway Sweden Total
No Occupational category Obs SIR Obs SIR Obs SIR Obs SIR Obs SIR Obs SIR 95% CI
1 Technical workers, etc 63 1.51 63 0.89 1 1.03 26 1.13 219 1.10 372 1.11 1.00—1.232 Laboratory assistants 37 1.18 49 1.24 [1.42] 0.00 22 0.80 52 0.76 160 0.95 0.82—1.113 Physicians 9 0.66 18 1.02 [0.25] 0.00 15 1.32 40 0.82 82 0.90 0.71—1.114 Dentists 12 1.00 18 1.07 [0.10] 0.00 4 0.43 32 0.95 66 0.92 0.71—1.175 Nurses 258 1.09 195 0.98 9 1.34 206 0.97 565 0.98 1233 1.00 0.95—1.066 Assistant nurses 180 1.00 191 0.96 11 1.21 199 0.96 1043 0.99 1624 0.98 0.94—1.037 "Other health workers" 153 1.13 163 1.03 4 2.09 219 1.05 354 0.98 893 1.03 0.97—1.108 Teachers 365 1.19 395 1.12 7 0.59 407 1.00 1264 0.96 2438 1.02 0.98—1.069 Religious workers etc 39 0.95 219 1.18 2 1.10 89 0.90 487 1.04 836 1.05 0.98—1.1210 Artistic workers 31 1.53 36 1.23 [1.44] 0.00 29 0.97 91 1.06 187 1.12 0.97—1.3011 Journalists 2 0.43 24 1.29 [0.39] 0.00 6 0.73 39 0.96 71 0.98 0.76—1.2312 Administrators 139 1.13 62 0.99 2 1.76 106 1.10 192 1.00 501 1.05 0.97—1.1513 Clerical workers 1404 1.12 1245 1.07 26 0.73 1342 1.05 3448 1.08 7465 1.08 1.05—1.1014 Sales agents 10 0.91 169 1.05 4 1.04 170 1.03 467 1.11 820 1.07 1.00—1.1515 Shop workers 837 1.01 643 1.07 36 1.59 1071 1.07 1935 1.08 4522 1.07 1.04—1.1016 Farmers 488 0.85 338 1.03 16 0.97 582 0.93 169 0.99 1593 0.93 0.88—0.9717 Gardeners 60 0.81 924 0.92 [0.57] 0.00 365 0.96 436 0.96 1785 0.94 0.89—0.9818 Fishermen [2.98] 0.00 2 0.89 [0.59] 0.00 8 1.57 2 1.29 12 0.96 0.50—1.6819 Forestry workers 3 3.82 2 0.45 [0.08] 0.00 7 0.97 16 1.52 28 1.21 0.81—1.7520 Miners and quarry workers [0.06] 0.00 3 1.64 [0.01] 0.00 [0.42] 0.00 [2.66] 0.00 3 0.60 0.12—1.7621 Seamen – – [0.63] 0.00 [0.00] 0.00 [1.22] 0.00 [0.40] 0.00 [2.25] 0.00 0.00—1.6422 Transport workers 1 1.21 24 0.86 [0.59] 0.00 5 0.83 37 1.17 67 1.00 0.77—1.2723 Drivers 18 0.84 16 1.12 [0.29] 0.00 21 1.02 85 1.04 140 1.01 0.86—1.2024 Postal workers 50 1.14 192 1.08 4 0.53 231 0.95 552 1.04 1029 1.03 0.97—1.0925 Textile workers 270 0.96 435 1.11 12 0.87 453 1.23 1046 1.07 2216 1.09 1.05—1.1426 Shoe and leather workers 24 1.14 41 0.84 [0.72] 0.00 29 1.08 96 1.26 190 1.09 0.95—1.2627 Smelting workers 5 0.96 5 0.44 [0.04] 0.00 2 0.62 26 1.07 38 0.86 0.61—1.1828 Mechanics 57 1.08 54 1.02 [0.13] 0.00 28 0.83 251 1.05 390 1.03 0.93—1.1429 Plumbers 1 2.55 [0.13] 0.00 – – 1 3.98 2 4.64 4 3.33 0.91—8.5230 Welders – – 2 0.46 [0.01] 0.00 5 1.88 16 1.57 23 1.33 0.85—2.0031 Electrical workers 74 1.00 25 0.68 [0.12] 0.00 32 0.86 169 1.26 300 1.06 0.95—1.1932 Wood workers 31 1.30 80 0.81 [0.24] 0.00 14 1.17 51 1.25 176 1.00 0.86—1.1633 Painters [0.92] 0.00 8 0.66 [0.06] 0.00 5 1.85 7 0.66 20 0.76 0.46—1.1734 "Other construction workers" 1 1.41 39 1.02 [0.04] 0.00 1 0.98 [1.54] 0.00 41 0.99 0.71—1.3435 Bricklayers [0.14] 0.00 [1.33] 0.00 – – [0.06] 0.00 [0.06] 0.00 [1.59] 0.00 0.00—2.3336 Printers 23 0.85 67 1.31 1 0.86 42 1.28 128 1.32 261 1.25 1.11—1.4137 Chemical process workers 47 1.11 41 1.60 [0.51] 0.00 32 1.10 66 0.89 186 1.08 0.94—1.2538 Food workers 185 0.90 112 0.85 31 1.09 189 1.07 220 1.05 737 0.98 0.91—1.0539 Beverage workers 21 1.06 3 0.41 1 13.97 3 1.89 6 0.46 34 0.82 0.56—1.1440 Tobacco workers 22 0.80 4 0.97 – – 10 1.50 15 1.71 51 1.09 0.81—1.4341 Glass makers etc 54 1.05 118 1.25 [0.75] 0.00 76 1.21 212 1.06 460 1.12 1.03—1.2342 Packers 10 0.69 188 1.13 4 1.47 154 1.06 332 1.14 688 1.11 1.03—1.1943 Engine operators 1 2.02 25 0.90 [0.04] 0.00 4 1.80 19 0.86 49 0.93 0.69—1.2344 Public safety workers 2 1.31 6 0.93 1 1.85 18 1.11 28 0.93 55 1.00 0.76—1.3145 Cooks and stewards [0.53] 0.00 211 1.13 9 0.86 215 1.11 459 1.14 894 1.13 1.06—1.2046 Domestic assistants 346 1.10 208 1.03 5 1.63 523 1.02 1230 1.02 2312 1.03 0.99—1.0847 Waiters 83 1.48 154 0.94 1 0.84 213 0.97 431 1.02 882 1.02 0.96—1.0948 Building caretakers 900 0.99 629 1.00 23 1.07 870 0.95 1131 0.98 3553 0.98 0.95—1.0149 Chimney sweeps [0.06] 0.00 1 2.98 – – [0.12] 0.00 [0.04] 0.00 1 1.79 0.05—9.9950 Hairdressers 66 1.20 77 1.24 [1.24] 0.00 71 1.19 220 1.12 434 1.16 1.05—1.2751 Launderers 111 1.09 56 1.14 4 1.17 89 1.13 216 1.02 476 1.07 0.98—1.1752 Military personnel 2 3.81 1 1.39 – – [0.29] 0.00 [1.06] 0.00 3 1.15 0.24—3.3753 "Other workers" 271 1.04 192 0.96 21 0.97 468 0.97 576 1.10 1528 1.03 0.97—1.0854 Economically inactive 6393 0.96 3765 0.94 79 1.03 6137 0.97 21361 0.97 37735 0.96 0.95—0.97
1-54 All categories 13159 1.00 11538 1.00 314 1.00 14814 1.00 39839 1.00 79664 1.00 # REF. #
Obs = observed number of cases; SIR = standardised incidence ratio; 95% CI = 95% confidence interval
63 Index Prev Next

Acta Oncologica - Pukkala et al, 2008 Cancer of the fallopian tube
Observed number of cancer of the fallopian tube among women in the Nordic countries and standardised incidence ratios 1961-2005,by country and occupational category
Denmark Finland Iceland Norway Sweden Total
No Occupational category Obs SIR Obs SIR Obs SIR Obs SIR Obs SIR Obs SIR 95% CI
1 Technical workers, etc [1.24] 0.00 5 1.29 [0.05] 0.00 [0.78] 0.00 2 0.39 7 0.63 0.25—1.302 Laboratory assistants 2 2.11 1 0.45 [0.06] 0.00 [0.86] 0.00 2 0.97 5 0.81 0.26—1.893 Physicians [0.41] 0.00 2 2.05 [0.01] 0.00 [0.33] 0.00 1 0.74 3 0.98 0.20—2.864 Dentists 1 2.78 3 3.47 [0.00] 0.00 [0.26] 0.00 1 1.18 5 2.15 0.70—5.015 Nurses 10 1.42 24 2.12 [0.23] 0.00 9 1.30 17 1.16 60 1.49 1.14—1.926 Assistant nurses 5 0.92 18 1.66 1 3.11 11 1.58 20 0.72 55 1.07 0.81—1.407 "Other health workers" 2 0.49 10 1.16 [0.08] 0.00 11 1.70 10 1.04 33 1.15 0.79—1.618 Teachers 10 1.09 16 0.82 1 2.30 17 1.35 30 0.88 74 0.98 0.77—1.239 Religious workers etc [1.23] 0.00 10 0.95 [0.06] 0.00 3 0.96 9 0.73 22 0.81 0.51—1.2210 Artistic workers [0.59] 0.00 4 2.50 [0.05] 0.00 4 4.64 6 2.71 14 2.64 1.44—4.4211 Journalists [0.14] 0.00 1 0.98 [0.01] 0.00 [0.26] 0.00 1 0.93 2 0.80 0.10—2.8912 Administrators 7 1.94 3 0.89 [0.03] 0.00 2 0.72 5 1.02 17 1.16 0.68—1.8613 Clerical workers 54 1.43 87 1.35 2 1.57 38 0.99 90 1.08 271 1.20 1.07—1.3514 Sales agents [0.33] 0.00 7 0.86 [0.10] 0.00 4 1.04 7 0.74 18 0.82 0.49—1.3015 Shop workers 28 1.15 37 1.14 [0.70] 0.00 29 1.02 65 1.58 159 1.25 1.07—1.4616 Farmers 8 0.47 9 0.65 1 2.33 15 0.98 1 0.27 34 0.67 0.47—0.9417 Gardeners 1 0.45 37 0.77 [0.01] 0.00 11 1.15 9 0.88 58 0.82 0.63—1.0718 Fishermen [0.09] 0.00 [0.11] 0.00 [0.02] 0.00 [0.16] 0.00 [0.03] 0.00 [0.41] 0.00 0.00—8.9219 Forestry workers [0.02] 0.00 [0.24] 0.00 [0.00] 0.00 [0.21] 0.00 [0.26] 0.00 [0.73] 0.00 0.00—5.0220 Miners and quarry workers [0.00] 0.00 [0.09] 0.00 [0.00] 0.00 [0.01] 0.00 [0.07] 0.00 [0.18] 0.00 0.00—21.0621 Seamen – – [0.03] 0.00 [0.00] 0.00 [0.04] 0.00 [0.01] 0.00 [0.08] 0.00 0.00—44.9322 Transport workers [0.02] 0.00 2 1.46 [0.02] 0.00 1 5.32 1 1.34 4 1.70 0.46—4.3623 Drivers 1 1.56 [0.80] 0.00 [0.01] 0.00 1 1.59 1 0.46 3 0.70 0.15—2.0624 Postal workers 2 1.53 11 1.20 [0.20] 0.00 7 1.01 18 1.40 38 1.25 0.88—1.7125 Textile workers 8 0.95 20 1.00 [0.30] 0.00 6 0.71 24 1.20 58 1.01 0.77—1.3126 Shoe and leather workers [0.63] 0.00 4 1.58 [0.02] 0.00 1 1.57 2 1.25 7 1.29 0.52—2.6627 Smelting workers [0.16] 0.00 2 3.39 [0.00] 0.00 [0.11] 0.00 4 6.23 6 4.00 1.47—8.7028 Mechanics 1 0.62 3 1.06 [0.01] 0.00 1 1.06 6 1.00 11 0.97 0.48—1.7329 Plumbers [0.01] 0.00 [0.01] 0.00 – – [0.01] 0.00 [0.01] 0.00 [0.04] 0.00 0.00—96.3330 Welders – – [0.25] 0.00 [0.00] 0.00 2 21.03 [0.28] 0.00 2 3.17 0.38—11.4431 Electrical workers 2 0.89 2 0.97 [0.00] 0.00 1 0.92 8 2.37 13 1.48 0.79—2.5332 Wood workers 2 2.76 4 0.80 [0.01] 0.00 2 5.22 3 2.83 11 1.53 0.76—2.7433 Painters 1 37.43 1 1.59 [0.00] 0.00 1 12.24 [0.26] 0.00 3 2.99 0.62—8.7334 "Other construction workers" [0.02] 0.00 1 0.56 [0.00] 0.00 [0.03] 0.00 [0.04] 0.00 1 0.53 0.01—2.9535 Bricklayers [0.00] 0.00 [0.07] 0.00 – – [0.00] 0.00 [0.00] 0.00 [0.08] 0.00 0.00—46.9136 Printers 3 3.73 4 1.52 [0.03] 0.00 2 2.34 2 0.87 11 1.66 0.83—2.9737 Chemical process workers 2 1.59 1 0.76 [0.01] 0.00 [0.76] 0.00 5 2.94 8 1.58 0.68—3.1238 Food workers 2 0.32 6 0.90 2 2.46 9 2.03 6 1.36 25 1.11 0.72—1.6439 Beverage workers [0.58] 0.00 [0.36] 0.00 [0.00] 0.00 [0.05] 0.00 [0.26] 0.00 [1.25] 0.00 0.00—2.9540 Tobacco workers 1 1.24 [0.21] 0.00 – – [0.14] 0.00 [0.21] 0.00 1 0.73 0.02—4.0741 Glass makers etc 2 1.29 5 1.02 [0.02] 0.00 4 2.36 5 1.06 16 1.24 0.71—2.0242 Packers [0.44] 0.00 12 1.38 [0.07] 0.00 6 1.53 14 2.12 32 1.62 1.11—2.2943 Engine operators [0.02] 0.00 2 1.36 [0.00] 0.00 1 12.60 [0.64] 0.00 3 1.36 0.28—3.9844 Public safety workers [0.04] 0.00 [0.33] 0.00 [0.02] 0.00 [0.45] 0.00 1 1.29 1 0.62 0.02—3.4545 Cooks and stewards [0.02] 0.00 10 1.08 1 4.16 7 1.58 5 0.63 23 1.05 0.67—1.5846 Domestic assistants 12 1.29 13 1.26 [0.06] 0.00 7 0.55 29 1.05 61 1.02 0.78—1.3147 Waiters 6 3.61 6 0.69 [0.04] 0.00 5 0.85 8 0.88 25 0.99 0.64—1.4648 Building caretakers 17 0.63 30 0.97 [0.50] 0.00 18 0.69 31 1.19 96 0.87 0.70—1.0649 Chimney sweeps [0.00] 0.00 [0.02] 0.00 – – [0.00] 0.00 [0.00] 0.00 [0.02] 0.00 0.00—152.9450 Hairdressers 3 1.86 8 2.47 [0.05] 0.00 2 1.23 12 2.45 25 2.19 1.41—3.2351 Launderers 7 2.33 1 0.42 [0.06] 0.00 1 0.53 3 0.72 12 1.05 0.54—1.8352 Military personnel [0.02] 0.00 [0.05] 0.00 – – [0.01] 0.00 [0.03] 0.00 [0.11] 0.00 0.00—34.8053 "Other workers" 11 1.43 6 0.60 [0.59] 0.00 13 0.94 10 0.83 40 0.90 0.65—1.2354 Economically inactive 173 0.91 143 0.80 1 0.49 106 0.87 410 0.90 833 0.88 0.82—0.94
1-54 All categories 384 1.00 571 1.00 9 1.00 358 1.00 884 1.00 2206 1.00 # REF. #
Obs = observed number of cases; SIR = standardised incidence ratio; 95% CI = 95% confidence interval
64 Index Prev Next

Acta Oncologica - Pukkala et al, 2008 Cancer of the vulva
Observed number of cancer of the vulva among women in the Nordic countries and standardised incidence ratios 1961-2005, by countryand occupational category
Denmark Finland Iceland Norway Sweden Total
No Occupational category Obs SIR Obs SIR Obs SIR Obs SIR Obs SIR Obs SIR 95% CI
1 Technical workers, etc 5 1.31 4 0.54 [0.10] 0.00 3 1.12 9 0.54 21 0.68 0.42—1.052 Laboratory assistants 3 1.18 5 1.21 [0.14] 0.00 2 0.56 2 0.50 12 0.83 0.43—1.453 Physicians 2 1.53 [1.77] 0.00 [0.02] 0.00 [1.51] 0.00 4 1.11 6 0.73 0.27—1.594 Dentists 1 0.86 2 0.90 [0.01] 0.00 [1.32] 0.00 2 0.65 5 0.64 0.21—1.505 Nurses 20 0.86 7 0.34 [0.62] 0.00 25 0.92 37 0.71 89 0.72 0.58—0.886 Assistant nurses 16 1.01 13 0.58 1 1.04 24 0.89 81 0.93 135 0.88 0.75—1.057 "Other health workers" 9 0.67 12 0.69 1 5.12 20 0.71 26 0.89 68 0.77 0.60—0.978 Teachers 21 0.75 31 0.77 1 0.87 53 0.99 88 0.76 194 0.81 0.71—0.939 Religious workers etc 3 0.77 17 0.93 1 5.72 13 0.97 23 0.62 57 0.78 0.59—1.0110 Artistic workers 5 2.31 1 0.31 [0.15] 0.00 1 0.23 4 0.55 11 0.64 0.32—1.1511 Journalists 1 2.40 2 0.97 [0.04] 0.00 1 0.95 4 1.20 8 1.16 0.50—2.2812 Administrators 9 0.71 9 1.28 [0.11] 0.00 12 0.83 13 0.75 43 0.83 0.60—1.1213 Clerical workers 120 1.06 111 0.86 4 1.09 159 0.92 260 0.93 654 0.94 0.87—1.0114 Sales agents 1 0.91 24 1.15 [0.36] 0.00 31 1.08 42 0.92 98 1.01 0.82—1.2315 Shop workers 73 0.89 69 0.96 3 1.33 157 1.03 195 1.03 497 1.00 0.91—1.0916 Farmers 45 0.78 63 1.16 [1.55] 0.00 94 0.81 21 1.09 223 0.89 0.78—1.0217 Gardeners 6 0.80 136 0.96 [0.06] 0.00 63 0.92 60 1.20 265 0.99 0.88—1.1218 Fishermen [0.29] 0.00 [0.30] 0.00 [0.06] 0.00 1 1.34 [0.17] 0.00 1 0.64 0.02—3.5619 Forestry workers [0.07] 0.00 [0.58] 0.00 [0.01] 0.00 3 2.60 [1.04] 0.00 3 1.05 0.22—3.0720 Miners and quarry workers [0.00] 0.00 [0.26] 0.00 [0.00] 0.00 [0.05] 0.00 [0.23] 0.00 [0.55] 0.00 0.00—6.7521 Seamen – – [0.06] 0.00 [0.00] 0.00 [0.17] 0.00 [0.03] 0.00 [0.26] 0.00 0.00—14.2822 Transport workers [0.08] 0.00 5 1.37 [0.06] 0.00 [0.77] 0.00 3 1.02 8 1.07 0.46—2.1023 Drivers 2 1.02 1 0.63 [0.03] 0.00 4 1.35 6 0.92 13 1.00 0.53—1.7024 Postal workers 5 1.15 19 0.86 [0.72] 0.00 34 0.97 51 1.00 109 0.96 0.80—1.1625 Textile workers 32 1.20 58 1.13 [1.32] 0.00 65 1.04 129 1.08 284 1.09 0.97—1.2226 Shoe and leather workers 1 0.52 6 0.97 [0.08] 0.00 6 1.36 11 1.23 24 1.11 0.71—1.6627 Smelting workers [0.46] 0.00 6 4.14 [0.00] 0.00 [0.38] 0.00 1 0.50 7 1.63 0.65—3.3628 Mechanics 5 1.14 6 0.95 [0.01] 0.00 4 0.82 22 1.03 37 1.00 0.71—1.3829 Plumbers [0.06] 0.00 [0.01] 0.00 – – [0.03] 0.00 [0.03] 0.00 [0.13] 0.00 0.00—29.0230 Welders – – [0.46] 0.00 [0.00] 0.00 [0.29] 0.00 1 1.40 1 0.68 0.02—3.7731 Electrical workers 8 1.30 5 1.31 [0.01] 0.00 5 0.99 12 1.02 30 1.12 0.75—1.6032 Wood workers 2 0.95 20 1.55 [0.03] 0.00 [1.63] 0.00 1 0.29 23 1.14 0.72—1.7133 Painters [0.08] 0.00 3 2.02 [0.01] 0.00 [0.38] 0.00 [0.98] 0.00 3 1.03 0.21—3.0034 "Other construction workers" [0.07] 0.00 10 1.83 [0.00] 0.00 [0.15] 0.00 [0.11] 0.00 10 1.73 0.83—3.1835 Bricklayers [0.01] 0.00 [0.18] 0.00 – – [0.01] 0.00 [0.00] 0.00 [0.20] 0.00 0.00—18.2436 Printers [2.41] 0.00 4 0.63 [0.11] 0.00 9 1.82 9 0.95 22 0.95 0.59—1.4437 Chemical process workers 5 1.29 2 0.61 [0.05] 0.00 7 1.58 12 1.56 26 1.34 0.88—1.9738 Food workers 21 1.10 22 1.26 2 0.70 28 0.94 31 1.27 104 1.11 0.92—1.3539 Beverage workers 3 1.69 1 1.00 [0.01] 0.00 [0.23] 0.00 1 0.63 5 1.08 0.35—2.5340 Tobacco workers 2 0.82 2 3.53 – – 2 1.86 2 2.33 8 1.63 0.70—3.2041 Glass makers etc 7 1.58 9 0.75 [0.08] 0.00 15 1.62 26 1.30 57 1.25 0.94—1.6242 Packers 1 0.76 22 1.04 [0.27] 0.00 20 0.88 35 1.13 78 1.02 0.81—1.2843 Engine operators [0.03] 0.00 5 1.51 [0.01] 0.00 [0.25] 0.00 1 0.66 6 1.17 0.43—2.5544 Public safety workers [0.16] 0.00 [0.81] 0.00 [0.05] 0.00 4 1.36 4 1.76 8 1.28 0.55—2.5345 Cooks and stewards [0.05] 0.00 23 0.93 1 0.99 35 0.99 51 1.02 110 0.99 0.82—1.2046 Domestic assistants 32 1.05 20 0.77 [0.29] 0.00 112 1.27 144 1.19 308 1.16 1.04—1.3047 Waiters 6 1.22 31 1.60 1 8.36 38 1.10 47 0.97 123 1.14 0.96—1.3648 Building caretakers 99 1.12 110 1.29 1 0.49 161 1.11 127 1.02 498 1.12 1.02—1.2249 Chimney sweeps [0.01] 0.00 [0.04] 0.00 – – [0.02] 0.00 [0.00] 0.00 [0.07] 0.00 0.00—51.0450 Hairdressers 3 0.59 7 0.93 [0.14] 0.00 10 1.14 13 0.70 33 0.82 0.57—1.1651 Launderers 13 1.29 4 0.58 [0.32] 0.00 17 1.24 32 1.19 66 1.14 0.88—1.4552 Military personnel [0.05] 0.00 1 16.96 – – [0.03] 0.00 1 16.55 2 9.81 1.19—35.4353 "Other workers" 28 1.12 21 0.82 2 0.90 87 1.16 64 1.18 202 1.11 0.97—1.2854 Economically inactive 709 1.01 641 1.02 13 1.73 1128 0.99 2667 1.01 5158 1.01 0.98—1.04
1-54 All categories 1324 1.00 1570 1.00 31 1.00 2453 1.00 4375 1.00 9753 1.00 # REF. #
Obs = observed number of cases; SIR = standardised incidence ratio; 95% CI = 95% confidence interval
65 Index Prev Next

Acta Oncologica - Pukkala et al, 2008 Vaginal cancer
Observed number of vaginal cancer among women in the Nordic countries and standardised incidence ratios 1961-2005, by country andoccupational category
Denmark Finland Iceland Norway Sweden Total
No Occupational category Obs SIR Obs SIR Obs SIR Obs SIR Obs SIR Obs SIR 95% CI
1 Technical workers, etc 3 1.82 1 0.48 [0.03] 0.00 1 1.72 7 1.36 12 1.26 0.65—2.212 Laboratory assistants 1 0.87 2 1.73 [0.04] 0.00 1 1.34 [1.27] 0.00 4 0.92 0.25—2.343 Physicians [0.55] 0.00 [0.50] 0.00 [0.01] 0.00 [0.31] 0.00 [1.14] 0.00 [2.51] 0.00 0.00—1.474 Dentists [0.49] 0.00 [0.57] 0.00 [0.00] 0.00 [0.27] 0.00 [0.94] 0.00 [2.28] 0.00 0.00—1.625 Nurses 14 1.45 10 1.69 [0.19] 0.00 1 0.17 5 0.32 30 0.80 0.54—1.156 Assistant nurses 6 0.87 7 1.13 [0.25] 0.00 3 0.52 37 1.39 53 1.16 0.87—1.527 "Other health workers" 2 0.36 8 1.65 [0.05] 0.00 7 1.18 13 1.45 30 1.18 0.80—1.698 Teachers 10 0.83 9 0.81 [0.35] 0.00 8 0.72 25 0.71 52 0.74 0.56—0.989 Religious workers etc 1 0.61 6 1.15 [0.05] 0.00 2 0.72 3 0.27 12 0.57 0.30—1.0010 Artistic workers 1 1.16 [0.89] 0.00 [0.04] 0.00 [0.86] 0.00 [2.23] 0.00 1 0.20 0.01—1.1411 Journalists [0.18] 0.00 [0.58] 0.00 [0.01] 0.00 [0.22] 0.00 1 0.98 1 0.50 0.01—2.7712 Administrators 13 2.52 2 1.02 [0.03] 0.00 2 0.71 4 0.78 21 1.39 0.86—2.1213 Clerical workers 42 0.85 34 0.95 3 3.19 31 0.86 109 1.26 219 1.05 0.92—1.2014 Sales agents [0.46] 0.00 8 1.45 [0.10] 0.00 8 1.51 19 1.44 35 1.42 0.99—1.9815 Shop workers 34 1.00 29 1.48 [0.58] 0.00 22 0.72 61 1.07 146 1.03 0.88—1.2116 Farmers 12 0.50 15 1.10 1 2.21 20 0.95 6 1.12 54 0.84 0.63—1.0917 Gardeners 4 1.29 26 0.69 [0.02] 0.00 12 0.95 8 0.54 50 0.73 0.54—0.9718 Fishermen [0.12] 0.00 [0.08] 0.00 [0.02] 0.00 2 12.99 1 20.68 3 7.09 1.46—20.7319 Forestry workers [0.03] 0.00 [0.15] 0.00 [0.00] 0.00 1 4.37 [0.31] 0.00 1 1.38 0.03—7.6720 Miners and quarry workers [0.00] 0.00 [0.07] 0.00 [0.00] 0.00 [0.01] 0.00 [0.07] 0.00 [0.15] 0.00 0.00—24.6621 Seamen – – [0.02] 0.00 – – [0.04] 0.00 [0.01] 0.00 [0.06] 0.00 0.00—61.8722 Transport workers [0.03] 0.00 1 0.98 [0.02] 0.00 [0.16] 0.00 1 1.13 2 0.94 0.11—3.4123 Drivers 1 1.18 1 2.26 [0.01] 0.00 1 1.69 3 1.50 6 1.54 0.56—3.3524 Postal workers 1 0.55 6 1.00 [0.19] 0.00 8 1.12 17 1.07 32 1.03 0.70—1.4525 Textile workers 7 0.62 12 0.87 [0.41] 0.00 11 0.93 47 1.35 77 1.07 0.84—1.3426 Shoe and leather workers [0.84] 0.00 [1.68] 0.00 [0.02] 0.00 [0.85] 0.00 6 2.27 6 1.00 0.37—2.1727 Smelting workers [0.20] 0.00 [0.40] 0.00 [0.00] 0.00 [0.09] 0.00 3 4.75 3 2.28 0.47—6.6528 Mechanics 3 1.51 2 1.15 [0.00] 0.00 3 3.00 7 1.07 15 1.33 0.74—2.1929 Plumbers [0.02] 0.00 [0.00] 0.00 – – [0.01] 0.00 [0.01] 0.00 [0.04] 0.00 0.00—94.1030 Welders – – 1 7.59 [0.00] 0.00 [0.07] 0.00 1 4.38 2 4.68 0.57—16.9231 Electrical workers 2 0.72 1 0.93 [0.00] 0.00 3 2.80 5 1.37 11 1.28 0.64—2.3032 Wood workers [0.93] 0.00 2 0.57 [0.01] 0.00 [0.34] 0.00 3 2.81 5 0.86 0.28—2.0033 Painters [0.04] 0.00 1 2.48 [0.00] 0.00 [0.08] 0.00 1 3.36 2 2.45 0.30—8.8734 "Other construction workers" [0.03] 0.00 2 1.39 [0.00] 0.00 [0.03] 0.00 [0.03] 0.00 2 1.30 0.16—4.7035 Bricklayers [0.01] 0.00 [0.05] 0.00 – – [0.00] 0.00 [0.00] 0.00 [0.05] 0.00 0.00—68.0536 Printers [1.05] 0.00 3 1.75 [0.03] 0.00 1 1.02 2 0.70 6 0.90 0.33—1.9737 Chemical process workers 3 1.80 3 3.35 [0.01] 0.00 2 2.28 7 3.04 15 2.61 1.46—4.3038 Food workers 6 0.73 2 0.43 1 1.25 7 1.24 10 1.41 26 0.99 0.64—1.4439 Beverage workers 2 2.59 [0.26] 0.00 [0.00] 0.00 [0.05] 0.00 [0.46] 0.00 2 1.30 0.16—4.6840 Tobacco workers 1 0.94 [0.15] 0.00 – – [0.21] 0.00 [0.27] 0.00 1 0.59 0.02—3.3041 Glass makers etc [1.97] 0.00 3 0.93 [0.02] 0.00 3 1.60 9 1.49 15 1.14 0.64—1.8842 Packers 2 3.50 9 1.58 [0.07] 0.00 6 1.34 9 0.98 26 1.30 0.85—1.9043 Engine operators [0.02] 0.00 3 3.29 [0.00] 0.00 [0.06] 0.00 1 2.00 4 2.70 0.73—6.9044 Public safety workers [0.07] 0.00 [0.22] 0.00 [0.02] 0.00 [0.55] 0.00 [0.68] 0.00 [1.53] 0.00 0.00—2.4245 Cooks and stewards [0.02] 0.00 6 0.91 [0.32] 0.00 10 1.55 19 1.35 35 1.27 0.89—1.7746 Domestic assistants 8 0.62 6 0.87 [0.10] 0.00 15 0.90 31 0.89 60 0.84 0.64—1.0847 Waiters 3 1.39 8 1.50 [0.03] 0.00 11 1.62 18 1.27 40 1.40 1.00—1.9148 Building caretakers 54 1.45 32 1.41 [0.64] 0.00 32 1.12 44 1.22 162 1.30 1.11—1.5149 Chimney sweeps [0.00] 0.00 [0.01] 0.00 – – [0.00] 0.00 [0.00] 0.00 [0.02] 0.00 0.00—198.0150 Hairdressers 2 0.92 3 1.46 [0.04] 0.00 1 0.57 2 0.35 8 0.68 0.30—1.3551 Launderers 7 1.67 3 1.64 [0.11] 0.00 2 0.78 13 1.70 25 1.53 0.99—2.2652 Military personnel [0.02] 0.00 [0.02] 0.00 – – [0.01] 0.00 [0.02] 0.00 [0.07] 0.00 0.00—56.2553 "Other workers" 15 1.43 7 1.01 3 4.98 11 0.74 23 1.44 59 1.21 0.92—1.5654 Economically inactive 287 1.01 137 0.88 1 0.42 215 1.05 714 0.92 1354 0.95 0.90—1.00
1-54 All categories 547 1.00 411 1.00 9 1.00 463 1.00 1295 1.00 2725 1.00 # REF. #
Obs = observed number of cases; SIR = standardised incidence ratio; 95% CI = 95% confidence interval
66 Index Prev Next

Acta Oncologica - Pukkala et al, 2008 Prostate cancer
Observed number of prostate cancer among men in the Nordic countries and standardised incidence ratios 1961-2005, by country andoccupational category
Denmark Finland Iceland Norway Sweden Total
No Occupational category Obs SIR Obs SIR Obs SIR Obs SIR Obs SIR Obs SIR 95% CI
1 Technical workers, etc 2306 1.07 3886 1.17 49 1.16 2373 1.06 17827 1.11 26441 1.11 1.09—1.122 Laboratory assistants 41 0.96 82 1.04 8 1.00 118 1.07 84 1.13 333 1.06 0.95—1.183 Physicians 217 1.16 240 1.24 23 1.22 332 1.05 771 1.07 1583 1.10 1.05—1.164 Dentists 62 1.21 48 1.19 1 0.24 184 1.29 441 1.20 736 1.22 1.13—1.315 Nurses [2.23] 0.00 11 1.42 [0.03] 0.00 11 1.21 26 1.04 48 1.09 0.80—1.456 Assistant nurses 44 0.88 8 1.33 2 1.26 55 1.01 213 0.93 322 0.94 0.85—1.057 "Other health workers" 198 1.26 207 1.12 5 1.00 121 1.03 609 1.02 1140 1.08 1.01—1.148 Teachers 1023 1.09 1638 1.12 80 1.22 1822 1.08 4485 1.07 9048 1.09 1.06—1.119 Religious workers etc 474 1.10 873 1.22 65 1.51 1000 1.13 3423 1.13 5835 1.14 1.11—1.1710 Artistic workers 164 1.27 302 1.12 15 1.25 273 1.06 1036 1.08 1790 1.10 1.05—1.1511 Journalists 66 1.12 133 1.04 8 1.21 114 1.04 441 1.00 762 1.03 0.96—1.1012 Administrators 2816 1.11 2851 1.31 137 1.12 3603 1.14 7249 1.16 16656 1.17 1.15—1.1913 Clerical workers 1102 1.03 1614 1.14 143 1.06 2480 1.06 7119 1.07 12458 1.07 1.05—1.0914 Sales agents 662 1.19 2151 1.07 85 1.23 3084 1.11 10450 1.09 16432 1.10 1.08—1.1215 Shop workers 2664 1.04 838 0.99 45 0.98 1035 1.02 3178 1.02 7760 1.02 1.00—1.0516 Farmers 4722 0.89 10239 0.99 167 0.81 8859 1.04 17038 1.00 41025 0.99 0.98—1.0017 Gardeners 710 0.96 1203 0.84 6 0.96 1792 0.90 5503 0.89 9214 0.89 0.87—0.9118 Fishermen 204 0.91 127 0.97 95 0.98 2219 0.88 585 0.89 3230 0.89 0.86—0.9219 Forestry workers 90 0.82 1241 0.76 [0.98] 0.00 1345 0.89 3839 0.86 6515 0.84 0.82—0.8720 Miners and quarry workers 27 0.84 252 0.99 [1.69] 0.00 358 0.92 928 0.87 1565 0.89 0.85—0.9421 Seamen 263 1.17 418 1.19 25 0.84 1860 0.99 1047 1.12 3613 1.05 1.02—1.0922 Transport workers 510 0.94 1099 1.03 68 1.04 1066 1.02 3389 1.02 6132 1.02 0.99—1.0423 Drivers 1649 0.98 3308 0.99 74 0.85 2736 1.01 7737 0.99 15504 0.99 0.98—1.0124 Postal workers 328 1.03 513 1.02 20 1.68 546 0.99 1768 1.02 3175 1.02 0.99—1.0625 Textile workers 284 0.88 381 1.10 11 0.52 637 1.01 1797 0.91 3110 0.94 0.91—0.9826 Shoe and leather workers 70 0.86 139 0.93 2 0.43 256 0.95 812 1.05 1279 1.00 0.95—1.0627 Smelting workers 657 1.00 459 0.90 19 0.67 859 1.06 2802 0.91 4796 0.95 0.92—0.9728 Mechanics 1781 0.98 3177 0.99 81 1.01 3625 0.96 13730 0.96 22394 0.96 0.95—0.9829 Plumbers 177 1.12 563 1.06 15 1.10 398 0.94 1639 0.99 2792 1.00 0.97—1.0430 Welders – – 535 1.10 5 1.07 422 0.90 1909 1.02 2871 1.01 0.98—1.0531 Electrical workers 399 0.98 1303 0.98 39 0.85 1679 1.00 4875 0.99 8295 0.99 0.97—1.0132 Wood workers 1219 0.94 3336 0.94 44 0.88 4685 0.99 9423 0.97 18707 0.97 0.95—0.9833 Painters 384 0.93 721 0.98 14 0.68 764 0.99 2758 0.99 4641 0.98 0.96—1.0134 "Other construction workers" 1481 0.88 2031 0.92 95 1.01 841 0.95 5137 1.00 9585 0.96 0.94—0.9735 Bricklayers 487 1.04 379 1.03 – – 432 0.93 1218 0.96 2516 0.98 0.94—1.0236 Printers 295 1.05 349 1.09 15 0.97 439 0.98 1508 1.00 2606 1.02 0.98—1.0537 Chemical process workers 261 0.92 483 0.87 8 0.87 873 0.84 2126 0.93 3751 0.90 0.87—0.9338 Food workers 876 0.99 382 0.94 71 0.90 1155 0.98 2310 0.97 4794 0.97 0.95—1.0039 Beverage workers 111 1.05 18 0.67 [1.35] 0.00 8 0.81 124 0.95 261 0.95 0.84—1.0840 Tobacco workers 22 1.16 4 0.78 [0.11] 0.00 13 0.73 11 1.06 50 0.95 0.71—1.2641 Glass makers etc 499 0.94 566 1.00 18 1.34 522 0.95 2379 0.93 3984 0.94 0.92—0.9742 Packers 484 1.00 1155 0.97 40 0.87 1752 1.00 4424 0.97 7855 0.98 0.96—1.0043 Engine operators 465 1.00 1591 0.99 61 1.08 948 1.02 3716 0.97 6781 0.98 0.96—1.0044 Public safety workers 509 1.12 1073 1.16 47 1.10 781 1.04 2483 1.10 4893 1.11 1.08—1.1445 Cooks and stewards 40 1.26 42 0.84 19 1.05 311 1.01 339 0.90 751 0.96 0.89—1.0346 Domestic assistants 1 2.94 [4.25] 0.00 [0.06] 0.00 2 0.82 17 0.70 20 0.63 0.39—0.9847 Waiters 77 1.16 50 1.09 2 1.12 149 1.10 212 1.09 490 1.10 1.01—1.2048 Building caretakers 506 1.05 782 0.99 25 1.20 389 1.02 1759 1.01 3461 1.01 0.98—1.0549 Chimney sweeps 11 0.97 52 0.94 – – 40 1.05 136 1.07 239 1.03 0.91—1.1750 Hairdressers 138 0.99 7 0.46 3 1.11 111 1.00 437 0.95 696 0.95 0.88—1.0251 Launderers 67 0.98 20 1.25 3 1.51 75 1.12 345 1.05 510 1.05 0.97—1.1552 Military personnel 240 1.16 325 1.07 – – 641 1.06 1510 1.11 2716 1.10 1.06—1.1453 "Other workers" 1401 1.00 774 0.86 195 1.09 3346 0.98 5402 0.97 11118 0.97 0.95—0.9954 Economically inactive 1510 1.03 3673 0.81 97 0.85 1239 0.72 6175 0.78 12694 0.80 0.79—0.82
1-54 All categories 34794 1.00 57652 1.00 2050 1.00 64778 1.00 180699 1.00 339973 1.00 # REF. #
Obs = observed number of cases; SIR = standardised incidence ratio; 95% CI = 95% confidence interval
67 Index Prev Next

Acta Oncologica - Pukkala et al, 2008 Testicular cancer
Observed number of testicular cancer among men in the Nordic countries and standardised incidence ratios 1961-2005, by country andoccupational category
Denmark Finland Iceland Norway Sweden Total
No Occupational category Obs SIR Obs SIR Obs SIR Obs SIR Obs SIR Obs SIR 95% CI
1 Technical workers, etc 128 1.01 79 1.14 [2.34] 0.00 130 1.19 343 1.04 680 1.06 0.99—1.152 Laboratory assistants 1 0.43 1 0.52 [0.50] 0.00 3 0.68 6 1.54 11 0.84 0.42—1.513 Physicians 16 1.72 4 1.00 [0.59] 0.00 18 1.55 29 1.48 67 1.48 1.15—1.884 Dentists 6 1.83 [0.83] 0.00 [0.17] 0.00 5 1.03 2 0.27 13 0.78 0.42—1.345 Nurses 1 5.12 [0.55] 0.00 [0.03] 0.00 1 0.70 4 0.92 6 0.91 0.34—1.996 Assistant nurses 2 0.63 [0.56] 0.00 [0.36] 0.00 4 2.40 7 0.66 13 0.80 0.42—1.367 "Other health workers" 11 1.40 2 0.56 [0.21] 0.00 5 1.05 11 0.71 29 0.91 0.61—1.318 Teachers 68 1.15 32 1.35 1 0.36 67 0.88 109 1.09 277 1.06 0.94—1.199 Religious workers etc 17 0.92 26 1.42 3 1.62 42 1.22 140 1.38 228 1.30 1.15—1.4910 Artistic workers 4 0.65 11 2.12 2 4.14 11 1.23 32 1.45 60 1.40 1.07—1.8011 Journalists 5 1.63 1 0.42 [0.32] 0.00 6 1.31 16 1.46 28 1.31 0.87—1.9012 Administrators 121 1.04 46 1.39 [1.93] 0.00 110 1.10 130 1.39 407 1.18 1.07—1.3013 Clerical workers 81 1.37 25 1.24 6 1.54 74 0.96 128 1.10 314 1.14 1.02—1.2714 Sales agents 35 1.10 29 0.89 2 1.36 85 1.06 193 1.06 344 1.05 0.94—1.1715 Shop workers 134 1.19 11 0.66 2 0.97 49 1.19 50 0.88 246 1.07 0.95—1.2216 Farmers 155 0.84 81 1.10 5 1.21 128 1.00 152 1.07 521 0.97 0.89—1.0617 Gardeners 21 0.80 15 0.86 [0.19] 0.00 51 1.34 70 0.99 157 1.03 0.88—1.2018 Fishermen 11 0.95 1 0.76 9 1.13 45 0.87 6 0.83 72 0.90 0.70—1.1319 Forestry workers 2 0.58 18 0.86 [0.06] 0.00 15 0.62 35 0.67 70 0.70 0.54—0.8820 Miners and quarry workers 1 0.88 1 0.28 [0.12] 0.00 14 1.30 7 0.44 23 0.73 0.46—1.1021 Seamen 14 0.93 12 2.29 [1.34] 0.00 52 0.78 12 0.74 90 0.86 0.69—1.0622 Transport workers 22 0.92 16 1.30 [1.18] 0.00 27 1.00 55 1.15 120 1.07 0.89—1.2823 Drivers 85 0.93 42 0.81 2 0.61 99 1.01 151 0.96 379 0.94 0.85—1.0424 Postal workers 20 0.98 10 1.23 [0.30] 0.00 25 1.48 32 0.88 87 1.06 0.85—1.3125 Textile workers 16 1.25 7 1.83 [0.56] 0.00 10 0.82 27 1.23 60 1.17 0.89—1.5026 Shoe and leather workers 2 0.72 1 0.62 [0.10] 0.00 5 1.12 12 1.72 20 1.25 0.77—1.9427 Smelting workers 31 0.80 2 0.30 1 1.07 19 0.87 37 0.87 90 0.81 0.65—1.0028 Mechanics 99 1.00 51 0.89 2 0.41 140 1.02 209 0.74 501 0.87 0.79—0.9429 Plumbers 7 0.72 6 0.63 [0.64] 0.00 13 0.74 34 1.09 60 0.88 0.67—1.1330 Welders – – 8 0.68 1 2.79 15 0.68 33 0.77 57 0.74 0.56—0.9631 Electrical workers 30 1.08 21 0.76 3 0.89 51 0.81 111 0.99 216 0.92 0.81—1.0632 Wood workers 65 1.03 33 0.80 4 1.98 120 1.07 142 1.01 364 1.02 0.92—1.1333 Painters 25 1.15 11 1.06 1 1.33 17 0.87 33 0.76 87 0.91 0.73—1.1234 "Other construction workers" 54 0.85 18 0.66 8 1.50 21 0.72 57 0.75 158 0.79 0.67—0.9235 Bricklayers 26 1.10 3 0.69 – – 9 0.81 20 1.27 58 1.06 0.80—1.3736 Printers 23 1.31 7 1.03 [0.73] 0.00 20 1.22 40 1.31 90 1.25 1.01—1.5437 Chemical process workers 13 1.16 9 1.04 [0.28] 0.00 15 0.63 27 0.80 64 0.82 0.63—1.0538 Food workers 39 0.92 6 0.97 [3.29] 0.00 31 1.04 31 0.90 107 0.92 0.76—1.1139 Beverage workers 5 1.06 [0.35] 0.00 [0.05] 0.00 2 2.10 3 1.61 10 1.26 0.61—2.3240 Tobacco workers 1 1.78 [0.07] 0.00 [0.00] 0.00 [0.37] 0.00 1 4.82 2 1.66 0.20—5.9841 Glass makers etc 14 0.62 12 1.24 [0.62] 0.00 12 0.65 38 0.91 76 0.82 0.65—1.0342 Packers 12 0.67 15 0.89 4 2.25 38 0.86 75 1.09 144 0.96 0.82—1.1343 Engine operators 15 0.63 17 0.61 5 1.64 32 0.80 57 0.76 126 0.74 0.62—0.8844 Public safety workers 14 0.69 10 0.68 3 2.19 24 1.14 59 1.16 110 1.02 0.84—1.2345 Cooks and stewards 1 0.48 [1.76] 0.00 [1.14] 0.00 10 0.76 16 1.22 27 0.86 0.57—1.2546 Domestic assistants [0.03] 0.00 [0.05] 0.00 [0.00] 0.00 [0.17] 0.00 1 0.30 1 0.28 0.01—1.5447 Waiters 7 1.95 [1.79] 0.00 [0.17] 0.00 4 0.82 10 1.64 21 1.27 0.79—1.9448 Building caretakers 27 1.45 13 1.22 [0.27] 0.00 14 1.18 42 1.13 96 1.22 0.99—1.5049 Chimney sweeps 1 1.49 [0.76] 0.00 – – 2 1.82 4 1.50 7 1.35 0.54—2.7750 Hairdressers 6 1.10 1 3.58 [0.12] 0.00 1 0.34 6 1.07 14 0.97 0.53—1.6351 Launderers 3 1.18 [0.27] 0.00 [0.02] 0.00 2 1.25 5 1.20 10 1.16 0.56—2.1352 Military personnel 14 0.94 12 1.83 – – 32 1.47 23 0.87 81 1.16 0.92—1.4453 "Other workers" 63 0.94 10 0.75 9 1.65 62 0.85 67 0.86 211 0.89 0.78—1.0254 Economically inactive 44 1.12 78 1.33 8 1.32 64 1.21 215 1.04 409 1.12 1.02—1.24
1-54 All categories 1618 1.00 814 1.00 81 1.00 1851 1.00 3155 1.00 7519 1.00 # REF. #
Obs = observed number of cases; SIR = standardised incidence ratio; 95% CI = 95% confidence interval
68 Index Prev Next

Acta Oncologica - Pukkala et al, 2008 Testicular seminoma
Observed number of testicular seminoma among men in the Nordic countries and standardised incidence ratios 1961-2005, by countryand occupational category
Denmark Finland Iceland Norway Sweden Total
No Occupational category Obs SIR Obs SIR Obs SIR Obs SIR Obs SIR Obs SIR 95% CI
1 Technical workers, etc 51 0.97 51 1.07 [1.75] 0.00 89 1.17 247 1.04 438 1.06 0.96—1.162 Laboratory assistants [0.97] 0.00 1 0.77 [0.36] 0.00 1 0.32 6 2.17 8 0.95 0.41—1.863 Physicians 3 0.78 2 0.73 [0.43] 0.00 12 1.49 26 1.85 43 1.48 1.07—1.994 Dentists 2 1.47 [0.56] 0.00 [0.13] 0.00 5 1.48 2 0.38 9 0.84 0.38—1.595 Nurses [0.08] 0.00 [0.37] 0.00 [0.02] 0.00 1 1.01 2 0.64 3 0.66 0.14—1.926 Assistant nurses [1.32] 0.00 [0.38] 0.00 [0.25] 0.00 2 1.74 5 0.67 7 0.66 0.27—1.367 "Other health workers" 3 0.92 [2.47] 0.00 [0.16] 0.00 3 0.91 8 0.73 14 0.69 0.38—1.178 Teachers 29 1.18 23 1.40 1 0.48 46 0.87 84 1.18 183 1.10 0.95—1.279 Religious workers etc 7 0.91 17 1.36 2 1.46 31 1.30 100 1.38 157 1.33 1.14—1.5610 Artistic workers 2 0.78 9 2.53 2 5.63 8 1.28 21 1.33 42 1.47 1.06—1.9911 Journalists 1 0.78 1 0.61 [0.23] 0.00 6 1.88 11 1.40 19 1.34 0.81—2.0912 Administrators 46 0.95 28 1.22 [1.46] 0.00 74 1.06 90 1.35 238 1.14 1.00—1.2913 Clerical workers 34 1.38 17 1.22 6 2.11 53 0.99 91 1.09 201 1.13 0.98—1.3014 Sales agents 19 1.44 16 0.72 2 1.82 62 1.11 138 1.06 237 1.06 0.94—1.2115 Shop workers 54 1.16 7 0.61 2 1.33 37 1.29 36 0.89 136 1.05 0.89—1.2516 Farmers 60 0.79 58 1.13 3 0.98 84 0.96 102 1.00 307 0.96 0.86—1.0717 Gardeners 10 0.92 7 0.58 [0.14] 0.00 33 1.24 54 1.06 104 1.03 0.85—1.2518 Fishermen 8 1.65 1 1.11 5 0.87 35 0.97 5 0.97 54 1.02 0.77—1.3319 Forestry workers 1 0.70 10 0.69 [0.04] 0.00 10 0.59 24 0.64 45 0.64 0.47—0.8620 Miners and quarry workers [0.47] 0.00 1 0.40 [0.08] 0.00 11 1.46 7 0.61 19 0.86 0.52—1.3521 Seamen 7 1.12 9 2.49 [0.98] 0.00 40 0.86 8 0.69 64 0.92 0.71—1.1822 Transport workers 11 1.12 15 1.75 [0.88] 0.00 18 0.94 43 1.24 87 1.19 0.95—1.4723 Drivers 34 0.90 30 0.84 1 0.42 59 0.86 103 0.91 227 0.88 0.77—1.0024 Postal workers 4 0.48 5 0.90 [0.22] 0.00 20 1.70 24 0.93 53 1.02 0.77—1.3425 Textile workers 9 1.69 5 1.90 [0.41] 0.00 6 0.70 16 1.01 36 1.10 0.77—1.5326 Shoe and leather workers 2 1.74 1 0.90 [0.07] 0.00 4 1.29 10 2.01 17 1.63 0.95—2.6127 Smelting workers 14 0.86 1 0.22 1 1.48 14 0.92 28 0.92 58 0.86 0.66—1.1228 Mechanics 43 1.04 37 0.94 1 0.28 94 0.98 140 0.70 315 0.83 0.74—0.9229 Plumbers 3 0.73 4 0.61 [0.47] 0.00 11 0.89 23 1.03 41 0.90 0.64—1.2230 Welders – – 4 0.50 1 3.88 12 0.78 23 0.75 40 0.74 0.53—1.0131 Electrical workers 12 1.04 17 0.90 2 0.82 40 0.91 80 1.00 151 0.96 0.82—1.1332 Wood workers 31 1.18 26 0.91 1 0.68 82 1.05 95 0.95 235 1.01 0.88—1.1433 Painters 11 1.22 7 0.98 1 1.84 14 1.02 25 0.80 58 0.94 0.72—1.2234 "Other construction workers" 20 0.75 15 0.80 4 1.04 15 0.73 35 0.65 89 0.72 0.58—0.8835 Bricklayers 12 1.21 1 0.33 – – 6 0.78 14 1.24 33 1.03 0.71—1.4536 Printers 8 1.09 6 1.30 [0.54] 0.00 14 1.22 30 1.38 58 1.27 0.96—1.6437 Chemical process workers 3 0.64 6 1.01 [0.20] 0.00 10 0.60 18 0.75 37 0.72 0.51—0.9938 Food workers 18 1.02 5 1.17 [2.36] 0.00 21 1.01 23 0.93 67 0.96 0.74—1.2239 Beverage workers 4 2.03 [0.24] 0.00 [0.04] 0.00 2 3.01 3 2.27 9 2.13 0.97—4.0440 Tobacco workers [0.24] 0.00 [0.05] 0.00 [0.00] 0.00 [0.26] 0.00 [0.15] 0.00 [0.69] 0.00 0.00—5.3641 Glass makers etc 5 0.54 7 1.06 [0.45] 0.00 8 0.62 29 0.98 49 0.83 0.62—1.1042 Packers 5 0.66 11 0.95 4 3.15 27 0.88 49 1.00 96 0.96 0.78—1.1743 Engine operators 7 0.70 12 0.63 4 1.81 26 0.92 43 0.80 92 0.81 0.66—1.0044 Public safety workers 10 1.18 9 0.90 3 2.98 16 1.10 47 1.29 85 1.21 0.96—1.4945 Cooks and stewards [0.87] 0.00 [1.19] 0.00 [0.83] 0.00 5 0.54 7 0.75 12 0.56 0.29—0.9846 Domestic assistants [0.01] 0.00 [0.04] 0.00 [0.00] 0.00 [0.12] 0.00 1 0.42 1 0.39 0.01—2.1847 Waiters 2 1.31 [1.20] 0.00 [0.13] 0.00 3 0.88 9 2.08 14 1.32 0.72—2.2148 Building caretakers 17 2.20 5 0.68 [0.20] 0.00 8 0.98 31 1.17 61 1.22 0.94—1.5749 Chimney sweeps [0.28] 0.00 [0.53] 0.00 – – 2 2.60 2 1.05 4 1.15 0.31—2.9450 Hairdressers 2 0.88 1 5.26 [0.09] 0.00 [2.05] 0.00 5 1.24 8 0.93 0.40—1.8251 Launderers [1.05] 0.00 [0.19] 0.00 [0.02] 0.00 1 0.89 4 1.33 5 0.93 0.30—2.1652 Military personnel 5 0.82 10 2.20 – – 20 1.29 17 0.90 52 1.15 0.86—1.5153 "Other workers" 23 0.82 7 0.77 8 2.02 44 0.87 53 0.95 135 0.92 0.77—1.0854 Economically inactive 20 1.16 55 1.39 5 1.14 44 1.21 158 1.08 282 1.15 1.03—1.30
1-54 All categories 672 1.00 560 1.00 59 1.00 1289 1.00 2255 1.00 4835 1.00 # REF. #
Obs = observed number of cases; SIR = standardised incidence ratio; 95% CI = 95% confidence interval
69 Index Prev Next

Acta Oncologica - Pukkala et al, 2008 Testicular non-seminoma
Observed number of testicular non-seminoma among men in the Nordic countries and standardised incidence ratios 1961-2005, bycountry and occupational category
Denmark Finland Iceland Norway Sweden Total
No Occupational category Obs SIR Obs SIR Obs SIR Obs SIR Obs SIR Obs SIR 95% CI
1 Technical workers, etc 78 1.04 27 1.28 [0.59] 0.00 36 1.42 96 1.02 237 1.10 0.97—1.252 Laboratory assistants 1 0.73 [0.59] 0.00 [0.14] 0.00 1 1.00 [1.14] 0.00 2 0.47 0.06—1.703 Physicians 13 2.37 2 1.65 [0.15] 0.00 5 1.86 3 0.53 23 1.52 0.96—2.274 Dentists 4 2.06 [0.25] 0.00 [0.04] 0.00 [1.09] 0.00 [2.10] 0.00 4 0.74 0.20—1.895 Nurses 1 8.79 [0.18] 0.00 [0.01] 0.00 [0.37] 0.00 2 1.59 3 1.56 0.32—4.556 Assistant nurses 2 1.06 [0.18] 0.00 [0.10] 0.00 1 2.63 2 0.65 5 0.89 0.29—2.087 "Other health workers" 8 1.72 2 1.83 [0.06] 0.00 1 0.89 3 0.68 14 1.23 0.67—2.078 Teachers 40 1.14 9 1.29 [0.73] 0.00 17 0.96 25 0.88 91 1.02 0.82—1.269 Religious workers etc 10 0.92 9 1.59 1 2.09 9 1.11 40 1.37 69 1.27 0.99—1.6110 Artistic workers 2 0.55 2 1.27 [0.13] 0.00 2 0.99 11 1.75 17 1.25 0.73—2.0011 Journalists 4 2.22 [0.71] 0.00 [0.08] 0.00 [1.07] 0.00 5 1.59 9 1.32 0.60—2.5112 Administrators 75 1.08 16 1.64 [0.47] 0.00 25 1.11 40 1.51 156 1.21 1.04—1.4213 Clerical workers 48 1.38 8 1.33 [1.05] 0.00 16 0.93 37 1.12 109 1.18 0.98—1.4314 Sales agents 17 0.91 12 1.24 [0.38] 0.00 18 1.01 55 1.07 102 1.04 0.86—1.2615 Shop workers 80 1.20 4 0.79 [0.57] 0.00 10 1.07 14 0.88 108 1.11 0.92—1.3416 Farmers 95 0.87 23 1.10 2 1.82 28 1.06 50 1.23 198 1.00 0.87—1.1417 Gardeners 11 0.71 7 1.35 [0.05] 0.00 9 1.14 16 0.80 43 0.88 0.64—1.1918 Fishermen 3 0.44 [0.39] 0.00 4 1.81 8 0.73 1 0.49 16 0.71 0.41—1.1619 Forestry workers 1 0.49 7 1.15 [0.02] 0.00 5 1.01 11 0.75 24 0.86 0.55—1.2920 Miners and quarry workers 1 1.50 [1.05] 0.00 [0.03] 0.00 3 1.28 [4.51] 0.00 4 0.47 0.13—1.1921 Seamen 7 0.79 3 1.94 [0.36] 0.00 7 0.48 4 0.87 21 0.70 0.43—1.0722 Transport workers 11 0.78 1 0.28 [0.30] 0.00 8 1.37 12 0.91 32 0.86 0.59—1.2223 Drivers 51 0.95 11 0.72 1 1.13 26 1.18 48 1.07 137 1.00 0.85—1.1924 Postal workers 16 1.33 5 2.04 [0.08] 0.00 5 1.32 8 0.77 34 1.18 0.82—1.6525 Textile workers 7 0.93 2 1.77 [0.15] 0.00 4 1.58 11 1.77 24 1.37 0.87—2.0326 Shoe and leather workers [1.63] 0.00 [0.48] 0.00 [0.03] 0.00 [0.91] 0.00 2 1.00 2 0.40 0.05—1.4327 Smelting workers 17 0.75 1 0.51 [0.26] 0.00 4 0.84 9 0.74 31 0.74 0.50—1.0528 Mechanics 57 0.97 14 0.81 1 0.73 30 0.98 69 0.87 171 0.91 0.78—1.0629 Plumbers 4 0.70 2 0.71 [0.17] 0.00 1 0.25 11 1.25 18 0.84 0.50—1.3230 Welders – – 4 1.10 [0.10] 0.00 3 0.60 10 0.82 17 0.82 0.48—1.3131 Electrical workers 18 1.10 3 0.36 1 1.07 8 0.57 31 0.97 61 0.85 0.65—1.0932 Wood workers 34 0.91 7 0.57 3 5.35 25 1.03 47 1.17 116 1.01 0.84—1.2233 Painters 15 1.17 4 1.31 [0.21] 0.00 [4.27] 0.00 8 0.64 27 0.83 0.54—1.2034 "Other construction workers" 34 0.91 3 0.38 4 2.74 6 0.91 22 1.02 69 0.92 0.72—1.1735 Bricklayers 14 1.01 2 1.57 – – 3 1.27 6 1.33 25 1.14 0.74—1.6836 Printers 15 1.46 1 0.48 [0.19] 0.00 5 1.34 10 1.15 31 1.24 0.84—1.7637 Chemical process workers 10 1.51 3 1.16 [0.08] 0.00 5 0.98 9 0.93 27 1.12 0.74—1.6338 Food workers 21 0.84 1 0.54 [0.93] 0.00 7 1.09 8 0.82 37 0.84 0.59—1.1639 Beverage workers 1 0.36 [0.10] 0.00 [0.02] 0.00 [0.23] 0.00 [0.54] 0.00 1 0.28 0.01—1.5340 Tobacco workers 1 3.05 [0.02] 0.00 – – [0.08] 0.00 1 16.91 2 4.12 0.50—14.8741 Glass makers etc 9 0.68 5 1.72 [0.17] 0.00 2 0.49 9 0.76 25 0.78 0.50—1.1542 Packers 7 0.66 4 0.80 [0.51] 0.00 9 0.94 26 1.33 46 1.02 0.74—1.3643 Engine operators 8 0.57 5 0.61 1 1.20 4 0.43 14 0.65 32 0.60 0.41—0.8444 Public safety workers 5 0.42 1 0.23 [0.36] 0.00 6 1.28 12 0.83 24 0.67 0.43—0.9945 Cooks and stewards 1 0.83 [0.56] 0.00 [0.31] 0.00 3 1.00 9 2.39 13 1.47 0.78—2.5146 Domestic assistants [0.02] 0.00 [0.02] 0.00 [0.00] 0.00 [0.04] 0.00 [0.97] 0.00 [1.05] 0.00 0.00—3.5247 Waiters 5 2.40 [0.57] 0.00 [0.05] 0.00 [1.10] 0.00 1 0.57 6 1.08 0.40—2.3548 Building caretakers 10 0.92 7 2.22 [0.07] 0.00 6 2.26 11 1.03 34 1.24 0.86—1.7349 Chimney sweeps 1 2.52 [0.22] 0.00 – – [0.24] 0.00 2 2.63 3 1.85 0.38—5.4150 Hairdressers 4 1.24 [0.09] 0.00 [0.03] 0.00 [0.65] 0.00 1 0.63 5 0.90 0.29—2.1051 Launderers 3 1.99 [0.08] 0.00 [0.01] 0.00 1 2.91 1 0.86 5 1.61 0.52—3.7652 Military personnel 9 1.01 2 1.03 – – 9 1.89 6 0.80 26 1.13 0.74—1.6553 "Other workers" 40 1.02 3 0.76 1 0.67 15 0.95 14 0.63 73 0.89 0.69—1.1154 Economically inactive 24 1.07 20 1.12 3 1.79 14 1.14 57 0.93 118 1.02 0.85—1.23
1-54 All categories 953 1.00 242 1.00 22 1.00 410 1.00 900 1.00 2527 1.00 # REF. #
Obs = observed number of cases; SIR = standardised incidence ratio; 95% CI = 95% confidence interval
70 Index Prev Next

Acta Oncologica - Pukkala et al, 2008 Cancer of the penis
Observed number of cancer of the penis among men in the Nordic countries and standardised incidence ratios 1961-2005, by countryand occupational category
Denmark Finland Iceland Norway Sweden Total
No Occupational category Obs SIR Obs SIR Obs SIR Obs SIR Obs SIR Obs SIR 95% CI
1 Technical workers, etc 60 0.95 22 0.79 2 3.16 45 1.26 165 0.82 294 0.89 0.80—1.002 Laboratory assistants [1.22] 0.00 2 2.80 [0.12] 0.00 2 1.16 1 0.86 5 1.01 0.33—2.363 Physicians 4 0.76 2 1.25 [0.25] 0.00 1 0.20 4 0.42 11 0.51 0.25—0.914 Dentists 2 1.31 [0.33] 0.00 [0.06] 0.00 3 1.34 1 0.22 6 0.69 0.25—1.505 Nurses [0.07] 0.00 [0.12] 0.00 [0.00] 0.00 [0.21] 0.00 [0.77] 0.00 [1.17] 0.00 0.00—3.146 Assistant nurses 3 2.01 [0.11] 0.00 [0.03] 0.00 1 1.22 3 0.84 7 1.16 0.47—2.407 "Other health workers" 4 0.90 1 0.66 [0.07] 0.00 4 2.13 9 1.13 18 1.13 0.67—1.798 Teachers 26 0.93 8 0.73 2 2.23 17 0.62 37 0.69 90 0.75 0.60—0.929 Religious workers etc 8 0.67 5 0.75 2 3.26 19 1.36 36 0.84 70 0.92 0.72—1.1710 Artistic workers 1 0.28 3 1.38 [0.16] 0.00 1 0.25 12 0.97 17 0.76 0.44—1.2211 Journalists 3 1.79 3 2.84 [0.10] 0.00 2 1.15 17 2.91 25 2.40 1.55—3.5412 Administrators 74 1.05 14 0.85 1 0.64 54 1.11 72 0.95 215 1.01 0.88—1.1513 Clerical workers 32 1.04 14 1.32 1 0.56 38 1.06 92 1.12 177 1.10 0.95—1.2714 Sales agents 18 1.12 16 1.03 1 1.10 52 1.23 138 1.15 225 1.15 1.01—1.3115 Shop workers 80 1.13 4 0.58 [0.62] 0.00 18 1.12 36 0.94 138 1.04 0.88—1.2316 Farmers 103 0.73 58 0.88 1 0.38 93 0.75 176 0.90 431 0.81 0.74—0.8917 Gardeners 22 1.12 10 0.99 [0.08] 0.00 26 0.89 57 0.78 115 0.87 0.72—1.0418 Fishermen 4 0.63 1 1.12 2 1.32 33 0.88 5 0.64 45 0.83 0.61—1.1219 Forestry workers 2 0.70 11 0.93 [0.01] 0.00 20 0.90 63 1.19 96 1.07 0.86—1.3020 Miners and quarry workers 1 1.17 3 1.54 [0.02] 0.00 8 1.35 16 1.20 28 1.27 0.84—1.8321 Seamen 17 2.53 3 1.12 [0.42] 0.00 25 0.85 12 1.01 57 1.11 0.84—1.4422 Transport workers 13 0.87 7 0.94 2 2.39 9 0.58 37 0.94 68 0.87 0.68—1.1023 Drivers 62 1.29 27 1.07 4 3.36 58 1.36 129 1.29 280 1.29 1.15—1.4524 Postal workers 11 1.16 3 0.78 [0.16] 0.00 11 1.27 22 0.99 47 1.06 0.78—1.4125 Textile workers 14 1.61 2 0.84 [0.27] 0.00 7 0.76 19 0.81 42 0.96 0.69—1.2926 Shoe and leather workers 2 0.94 3 2.89 [0.06] 0.00 3 0.75 7 0.76 15 0.91 0.51—1.5127 Smelting workers 21 1.10 3 0.80 [0.38] 0.00 11 0.89 42 1.12 77 1.05 0.83—1.3228 Mechanics 47 0.91 24 0.93 1 0.86 60 1.01 175 0.97 307 0.96 0.86—1.0829 Plumbers 7 1.50 9 2.09 2 10.52 10 1.48 20 0.97 48 1.31 0.97—1.7430 Welders – – 4 0.91 [0.07] 0.00 6 0.80 18 0.75 28 0.78 0.52—1.1231 Electrical workers 15 1.23 10 0.89 [0.71] 0.00 27 1.02 54 0.85 106 0.93 0.77—1.1332 Wood workers 25 0.69 23 0.91 [0.69] 0.00 57 0.82 97 0.82 202 0.81 0.70—0.9333 Painters 8 0.68 9 1.65 [0.29] 0.00 7 0.60 38 1.10 62 0.97 0.75—1.2534 "Other construction workers" 43 0.96 19 1.16 [1.36] 0.00 14 1.01 70 1.10 146 1.04 0.89—1.2235 Bricklayers 9 0.68 4 1.55 – – 2 0.29 13 0.85 28 0.74 0.49—1.0736 Printers 7 0.84 1 0.37 1 4.42 6 0.84 25 1.31 40 1.07 0.76—1.4537 Chemical process workers 5 0.66 3 0.71 [0.12] 0.00 18 1.14 29 1.02 55 0.98 0.74—1.2738 Food workers 18 0.73 2 0.66 [1.06] 0.00 24 1.35 32 1.11 76 1.01 0.79—1.2639 Beverage workers 6 2.08 1 5.00 [0.02] 0.00 [0.19] 0.00 3 1.85 10 2.03 0.98—3.7440 Tobacco workers 1 2.03 [0.04] 0.00 [0.00] 0.00 1 3.62 [0.13] 0.00 2 2.12 0.26—7.6741 Glass makers etc 14 0.97 3 0.66 [0.17] 0.00 12 1.40 31 0.98 60 1.01 0.77—1.3042 Packers 21 1.63 6 0.67 2 3.24 33 1.23 73 1.28 135 1.27 1.07—1.5043 Engine operators 13 0.99 14 1.10 [0.81] 0.00 18 1.20 50 1.02 95 1.05 0.85—1.2844 Public safety workers 8 0.63 8 1.12 1 1.81 12 1.07 31 1.07 60 0.99 0.75—1.2745 Cooks and stewards 1 1.06 [0.53] 0.00 [0.27] 0.00 3 0.60 9 1.64 13 1.06 0.57—1.8246 Domestic assistants [0.01] 0.00 [0.03] 0.00 [0.00] 0.00 [0.04] 0.00 1 1.64 1 1.44 0.04—8.0447 Waiters 4 2.13 [0.53] 0.00 [0.03] 0.00 4 1.86 3 1.08 11 1.49 0.75—2.6748 Building caretakers 7 0.54 4 0.68 [0.25] 0.00 9 1.49 23 1.00 43 0.90 0.65—1.2149 Chimney sweeps [0.33] 0.00 1 2.32 – – [0.59] 0.00 1 0.61 2 0.67 0.08—2.4250 Hairdressers 5 1.32 [0.13] 0.00 [0.04] 0.00 1 0.58 5 0.90 11 0.98 0.49—1.7551 Launderers 2 1.08 [0.13] 0.00 [0.02] 0.00 4 3.94 4 1.01 10 1.43 0.69—2.6352 Military personnel 9 1.42 2 0.79 – – 12 1.31 18 1.07 41 1.18 0.84—1.6053 "Other workers" 41 1.05 9 1.28 2 0.84 51 0.98 75 1.09 178 1.05 0.91—1.2254 Economically inactive 63 1.73 51 1.40 1 0.64 38 1.27 146 1.33 299 1.40 1.25—1.56
1-54 All categories 966 1.00 432 1.00 28 1.00 990 1.00 2252 1.00 4668 1.00 # REF. #
Obs = observed number of cases; SIR = standardised incidence ratio; 95% CI = 95% confidence interval
71 Index Prev Next

Acta Oncologica - Pukkala et al, 2008 Kidney cancer
Observed number of kidney cancer among men in the Nordic countries and standardised incidence ratios 1961-2005, by country andoccupational category
Denmark Finland Iceland Norway Sweden Total
No Occupational category Obs SIR Obs SIR Obs SIR Obs SIR Obs SIR Obs SIR 95% CI
1 Technical workers, etc 418 1.02 652 1.10 6 0.67 332 0.91 2239 1.05 3647 1.04 1.01—1.082 Laboratory assistants 3 0.37 16 1.08 3 1.81 12 0.69 8 0.78 42 0.80 0.58—1.083 Physicians 29 0.87 41 1.19 4 1.19 35 0.75 95 0.99 204 0.95 0.83—1.094 Dentists 10 1.02 8 1.14 1 1.11 20 0.97 50 1.05 89 1.03 0.83—1.275 Nurses 1 2.17 3 1.51 [0.03] 0.00 [2.18] 0.00 3 0.60 7 0.72 0.29—1.496 Assistant nurses 8 0.82 2 1.07 1 2.22 4 0.50 44 1.30 59 1.10 0.83—1.417 "Other health workers" 25 0.85 30 0.92 2 2.17 19 1.05 83 1.02 159 0.98 0.84—1.148 Teachers 151 0.85 197 0.79 15 1.20 217 0.83 510 0.94 1090 0.88 0.83—0.939 Religious workers etc 85 1.14 130 0.97 10 1.21 111 0.83 415 0.99 751 0.98 0.91—1.0510 Artistic workers 26 1.11 45 0.95 4 1.81 46 1.18 135 1.04 256 1.06 0.94—1.2011 Journalists 9 0.81 25 1.08 2 1.53 16 0.93 80 1.32 132 1.17 0.98—1.3812 Administrators 469 1.02 416 1.14 26 1.29 479 1.02 911 1.11 2301 1.08 1.04—1.1213 Clerical workers 208 1.03 263 1.11 27 1.17 371 1.05 941 1.06 1810 1.06 1.01—1.1114 Sales agents 141 1.32 402 1.16 7 0.60 429 1.06 1419 1.10 2398 1.11 1.07—1.1615 Shop workers 553 1.20 179 1.19 5 0.60 173 1.08 441 1.06 1351 1.13 1.07—1.1916 Farmers 563 0.64 1256 0.80 31 0.93 862 0.78 1746 0.79 4458 0.77 0.75—0.7917 Gardeners 102 0.81 185 0.79 1 0.90 244 0.88 701 0.85 1233 0.84 0.80—0.8918 Fishermen 61 1.43 19 0.93 18 0.83 393 1.11 81 0.93 572 1.08 1.00—1.1819 Forestry workers 7 0.38 192 0.69 [0.20] 0.00 155 0.76 495 0.82 849 0.77 0.72—0.8220 Miners and quarry workers 4 0.70 49 1.09 1 2.84 67 1.15 157 1.05 278 1.07 0.95—1.2121 Seamen 59 1.27 83 1.38 8 1.44 339 1.15 139 1.06 628 1.17 1.08—1.2622 Transport workers 104 1.03 187 1.08 12 1.12 187 1.21 466 1.06 956 1.09 1.02—1.1623 Drivers 355 1.08 688 1.19 10 0.62 519 1.21 1175 1.09 2747 1.13 1.09—1.1824 Postal workers 62 0.98 94 1.10 4 2.00 68 0.84 232 0.99 460 0.99 0.90—1.0825 Textile workers 62 1.07 62 1.12 4 1.18 104 1.18 243 0.92 475 1.01 0.93—1.1126 Shoe and leather workers 15 1.05 22 0.93 1 1.39 46 1.24 102 0.97 186 1.03 0.89—1.1927 Smelting workers 166 1.28 66 0.77 2 0.41 138 1.15 442 1.05 814 1.07 1.00—1.1528 Mechanics 350 1.00 622 1.10 16 0.99 627 1.06 2054 1.06 3669 1.06 1.02—1.0929 Plumbers 41 1.31 104 1.08 2 0.78 72 1.04 252 1.12 471 1.11 1.02—1.2230 Welders – – 112 1.20 2 2.04 105 1.34 314 1.23 533 1.25 1.14—1.3631 Electrical workers 101 1.22 245 1.01 14 1.44 267 1.02 662 0.99 1289 1.02 0.97—1.0832 Wood workers 243 1.02 563 0.97 7 0.79 606 0.90 1183 0.91 2602 0.93 0.89—0.9733 Painters 80 1.01 117 0.94 2 0.57 119 1.05 353 0.94 671 0.96 0.89—1.0434 "Other construction workers" 300 1.00 373 0.99 11 0.59 137 1.01 667 0.94 1488 0.97 0.92—1.0235 Bricklayers 90 1.04 51 0.84 – – 72 1.07 172 1.01 385 1.00 0.90—1.1036 Printers 49 0.88 63 1.08 1 0.34 83 1.20 199 0.98 395 1.01 0.92—1.1237 Chemical process workers 41 0.80 99 1.03 [1.61] 0.00 121 0.81 309 0.98 570 0.93 0.85—1.0138 Food workers 181 1.09 89 1.28 11 0.79 190 1.11 341 1.07 812 1.10 1.03—1.1839 Beverage workers 30 1.46 4 0.91 [0.24] 0.00 2 1.00 16 0.88 52 1.15 0.86—1.5040 Tobacco workers 4 1.21 1 1.24 [0.01] 0.00 5 1.93 2 1.40 12 1.47 0.76—2.5741 Glass makers etc 91 0.93 87 0.87 4 1.60 91 1.08 323 0.93 596 0.94 0.87—1.0242 Packers 101 1.16 194 0.96 12 1.52 264 1.03 693 1.10 1264 1.07 1.01—1.1343 Engine operators 87 0.99 326 1.14 12 1.08 147 0.98 570 1.08 1142 1.08 1.02—1.1444 Public safety workers 91 1.12 174 1.09 9 1.17 144 1.30 350 1.15 768 1.16 1.08—1.2445 Cooks and stewards 11 1.68 14 1.37 3 0.80 59 1.18 68 1.24 155 1.24 1.06—1.4546 Domestic assistants [0.07] 0.00 1 1.77 [0.01] 0.00 1 2.35 2 0.45 4 0.72 0.20—1.8447 Waiters 28 2.00 11 1.11 [0.42] 0.00 29 1.36 28 0.97 96 1.29 1.04—1.5748 Building caretakers 86 0.98 133 1.01 2 0.63 61 1.08 249 1.03 531 1.02 0.93—1.1149 Chimney sweeps 2 0.88 8 0.81 – – 6 1.03 26 1.47 42 1.18 0.85—1.5950 Hairdressers 36 1.45 2 0.73 [0.54] 0.00 20 1.21 61 0.98 119 1.11 0.93—1.3351 Launderers 11 0.91 3 1.06 [0.30] 0.00 10 1.02 38 0.85 62 0.89 0.68—1.1452 Military personnel 41 0.97 76 1.37 – – 118 1.24 182 1.02 417 1.12 1.02—1.2453 "Other workers" 280 1.04 147 0.93 37 1.22 510 1.06 697 0.91 1671 0.98 0.93—1.0354 Economically inactive 304 1.13 785 1.01 23 1.03 239 0.98 1225 1.05 2576 1.04 1.00—1.08
1-54 All categories 6375 1.00 9716 1.00 373 1.00 9491 1.00 24389 1.00 50344 1.00 # REF. #
Obs = observed number of cases; SIR = standardised incidence ratio; 95% CI = 95% confidence interval
72 Index Prev Next

Acta Oncologica - Pukkala et al, 2008 Kidney cancer
Observed number of kidney cancer among women in the Nordic countries and standardised incidence ratios 1961-2005, by country andoccupational category
Denmark Finland Iceland Norway Sweden Total
No Occupational category Obs SIR Obs SIR Obs SIR Obs SIR Obs SIR Obs SIR 95% CI
1 Technical workers, etc 12 0.83 21 0.58 [0.61] 0.00 6 0.80 49 0.75 88 0.71 0.57—0.872 Laboratory assistants 9 0.89 16 0.74 [0.91] 0.00 6 0.61 10 0.68 41 0.72 0.52—0.973 Physicians 3 0.63 7 0.80 [0.16] 0.00 1 0.25 11 0.78 22 0.69 0.43—1.054 Dentists 2 0.47 4 0.38 [0.06] 0.00 1 0.29 10 0.84 17 0.56 0.33—0.905 Nurses 68 0.81 100 0.92 6 1.36 58 0.75 183 0.91 415 0.87 0.79—0.966 Assistant nurses 47 0.77 85 0.72 5 0.81 72 0.93 342 0.99 551 0.91 0.83—0.987 "Other health workers" 40 0.83 68 0.75 2 1.59 71 0.91 124 1.09 305 0.92 0.82—1.038 Teachers 75 0.72 205 1.00 4 0.52 120 0.82 380 0.84 784 0.86 0.80—0.929 Religious workers etc 7 0.49 94 1.05 1 0.85 25 0.68 117 0.84 244 0.87 0.77—0.9910 Artistic workers 6 0.80 18 1.14 [0.96] 0.00 7 0.62 25 0.88 56 0.87 0.66—1.1311 Journalists [1.60] 0.00 10 0.95 [0.24] 0.00 2 0.68 11 0.85 23 0.81 0.52—1.2212 Administrators 44 0.97 33 0.97 [0.78] 0.00 30 0.81 46 0.71 153 0.84 0.72—0.9813 Clerical workers 420 0.97 621 0.95 24 1.00 458 0.95 1034 0.92 2557 0.94 0.90—0.9814 Sales agents 3 0.75 114 1.14 5 1.91 59 0.84 158 0.93 339 0.97 0.88—1.0815 Shop workers 298 0.99 374 1.00 14 0.91 370 0.89 763 1.01 1819 0.98 0.94—1.0316 Farmers 174 0.84 226 0.96 14 1.21 317 1.09 75 1.09 806 0.99 0.93—1.0617 Gardeners 21 0.77 692 0.99 1 2.55 196 1.12 177 0.88 1087 0.99 0.93—1.0518 Fishermen 1 0.95 [1.46] 0.00 [0.39] 0.00 1 0.48 1 1.56 3 0.53 0.11—1.5619 Forestry workers [0.28] 0.00 2 0.72 [0.05] 0.00 2 0.62 5 1.21 9 0.86 0.39—1.6320 Miners and quarry workers [0.02] 0.00 [1.24] 0.00 [0.01] 0.00 [0.15] 0.00 1 1.06 1 0.42 0.01—2.3621 Seamen – – [0.32] 0.00 [0.00] 0.00 [0.48] 0.00 [0.09] 0.00 [0.89] 0.00 0.00—4.1622 Transport workers [0.30] 0.00 28 1.47 1 2.36 1 0.47 11 0.97 41 1.23 0.88—1.6723 Drivers 6 0.80 5 0.62 [0.19] 0.00 5 0.62 28 1.05 44 0.87 0.63—1.1724 Postal workers 13 0.82 119 1.05 6 1.14 102 1.07 230 1.11 470 1.07 0.98—1.1825 Textile workers 113 1.12 252 0.99 11 1.12 139 0.88 472 1.04 987 1.01 0.95—1.0726 Shoe and leather workers 1 0.13 27 0.85 2 3.90 11 0.97 42 1.20 83 0.97 0.77—1.2027 Smelting workers 3 1.65 9 1.19 [0.02] 0.00 1 0.89 6 0.71 19 1.00 0.60—1.5728 Mechanics 14 0.79 26 0.81 [0.09] 0.00 14 1.04 116 1.33 170 1.13 0.97—1.3129 Plumbers [0.17] 0.00 [0.07] 0.00 – – [0.09] 0.00 [0.10] 0.00 [0.43] 0.00 0.00—8.5330 Welders – – 4 1.66 [0.01] 0.00 [0.88] 0.00 3 1.02 7 1.12 0.45—2.3131 Electrical workers 29 1.17 18 0.91 [0.08] 0.00 14 0.98 53 1.11 114 1.07 0.89—1.2832 Wood workers 13 1.57 63 0.95 [0.16] 0.00 4 0.86 10 0.71 90 0.96 0.78—1.1933 Painters [0.32] 0.00 6 0.77 [0.04] 0.00 [1.09] 0.00 2 0.52 8 0.61 0.26—1.2134 "Other construction workers" [0.25] 0.00 39 1.45 [0.03] 0.00 [0.41] 0.00 [0.41] 0.00 39 1.39 0.99—1.9035 Bricklayers [0.05] 0.00 [0.87] 0.00 – – [0.02] 0.00 [0.01] 0.00 [0.95] 0.00 0.00—3.8736 Printers 13 1.38 28 0.88 1 1.24 14 1.08 42 1.12 98 1.06 0.86—1.2937 Chemical process workers 19 1.27 9 0.54 [0.37] 0.00 10 0.85 35 1.15 73 0.98 0.77—1.2438 Food workers 73 1.01 88 1.01 16 0.81 86 1.12 94 1.00 357 1.02 0.92—1.1339 Beverage workers 12 1.71 2 0.40 [0.05] 0.00 1 1.53 3 0.50 18 0.96 0.57—1.5240 Tobacco workers 11 1.14 3 1.07 – – 3 1.11 5 1.41 22 1.18 0.74—1.7841 Glass makers etc 17 0.97 49 0.81 1 1.87 27 1.07 75 0.93 169 0.92 0.79—1.0742 Packers 3 0.59 124 1.15 2 1.03 78 1.28 123 1.01 330 1.11 1.00—1.2443 Engine operators [0.14] 0.00 19 1.11 [0.03] 0.00 1 1.32 3 0.45 23 0.93 0.59—1.4044 Public safety workers [0.61] 0.00 11 2.90 [0.39] 0.00 7 0.94 7 0.85 25 1.22 0.79—1.8045 Cooks and stewards [0.19] 0.00 120 1.01 8 1.08 104 1.20 176 0.95 408 1.03 0.93—1.1346 Domestic assistants 130 1.15 108 0.91 2 0.92 192 0.85 435 0.96 867 0.95 0.89—1.0247 Waiters 21 1.08 96 0.96 [0.83] 0.00 85 0.92 198 1.05 400 1.00 0.91—1.1048 Building caretakers 362 1.10 446 1.08 21 1.40 444 1.13 540 1.13 1813 1.11 1.06—1.1749 Chimney sweeps [0.03] 0.00 [0.21] 0.00 – – [0.06] 0.00 [0.01] 0.00 [0.31] 0.00 0.00—11.9150 Hairdressers 23 1.21 34 0.92 1 1.29 21 0.90 70 0.95 149 0.97 0.82—1.1451 Launderers 41 1.10 24 0.71 [2.45] 0.00 25 0.72 111 1.10 201 0.96 0.84—1.1052 Military personnel 2 10.28 [0.32] 0.00 – – [0.10] 0.00 [0.21] 0.00 2 2.44 0.30—8.8053 "Other workers" 100 1.08 134 1.07 17 1.13 195 0.97 221 1.05 667 1.04 0.96—1.1254 Economically inactive 2571 1.02 2893 1.04 51 0.96 2765 1.04 10324 1.01 18604 1.02 1.01—1.04
1-54 All categories 4820 1.00 7474 1.00 216 1.00 6151 1.00 16957 1.00 35618 1.00 # REF. #
Obs = observed number of cases; SIR = standardised incidence ratio; 95% CI = 95% confidence interval
73 Index Prev Next

Acta Oncologica - Pukkala et al, 2008 Cancer of the kidney and renal pelvis
Observed number of cancer of the kidney and renal pelvis among men in the Nordic countries and standardised incidence ratios1961-2005, by country and occupational category
Denmark Finland Iceland Norway Sweden Total
No Occupational category Obs SIR Obs SIR Obs SIR Obs SIR Obs SIR Obs SIR 95% CI
1 Technical workers, etc 166 1.04 34 0.99 [0.46] 0.00 43 1.05 247 1.13 490 1.08 0.99—1.182 Laboratory assistants 2 0.63 2 2.40 [0.08] 0.00 5 2.51 [0.99] 0.00 9 1.27 0.58—2.413 Physicians 17 1.28 2 1.02 [0.19] 0.00 7 1.33 13 1.33 39 1.28 0.91—1.754 Dentists 5 1.31 [0.42] 0.00 [0.04] 0.00 2 0.85 8 1.61 15 1.29 0.72—2.135 Nurses [0.18] 0.00 1 10.07 [0.00] 0.00 [0.20] 0.00 1 2.26 2 2.18 0.26—7.876 Assistant nurses 6 1.58 [0.09] 0.00 [0.02] 0.00 1 1.09 2 0.59 9 1.10 0.50—2.097 "Other health workers" 20 1.74 2 1.02 [0.05] 0.00 1 0.50 8 0.96 31 1.30 0.88—1.858 Teachers 60 0.86 11 0.77 1 1.49 24 0.83 52 0.93 148 0.87 0.74—1.029 Religious workers etc 23 0.77 7 0.90 [0.46] 0.00 17 1.14 45 1.07 92 0.97 0.78—1.1910 Artistic workers 10 1.10 1 0.36 [0.13] 0.00 8 1.79 22 1.64 41 1.37 0.98—1.8611 Journalists 6 1.38 3 2.21 [0.07] 0.00 [1.93] 0.00 4 0.65 13 0.94 0.50—1.6012 Administrators 201 1.11 21 0.95 [1.23] 0.00 50 0.94 93 1.09 365 1.06 0.96—1.1813 Clerical workers 89 1.14 16 1.09 [1.40] 0.00 43 1.05 114 1.23 262 1.15 1.02—1.3014 Sales agents 49 1.19 25 1.20 [0.70] 0.00 40 0.86 153 1.15 267 1.10 0.98—1.2415 Shop workers 184 1.01 13 1.50 [0.46] 0.00 21 1.15 50 1.15 268 1.06 0.94—1.2016 Farmers 212 0.59 72 0.67 2 0.96 83 0.65 127 0.55 496 0.60 0.55—0.6617 Gardeners 42 0.84 9 0.62 [0.06] 0.00 24 0.73 62 0.72 137 0.74 0.63—0.8818 Fishermen 13 0.79 1 0.73 2 1.90 38 0.92 4 0.44 58 0.83 0.63—1.0819 Forestry workers 5 0.67 10 0.59 [0.01] 0.00 11 0.46 27 0.43 53 0.48 0.36—0.6220 Miners and quarry workers 3 1.34 4 1.48 [0.02] 0.00 4 0.59 17 1.10 28 1.03 0.68—1.4921 Seamen 25 1.43 6 1.67 1 3.26 54 1.59 19 1.41 105 1.52 1.26—1.8522 Transport workers 41 1.03 17 1.56 1 1.53 26 1.42 55 1.19 140 1.21 1.02—1.4323 Drivers 141 1.12 42 1.24 [0.88] 0.00 42 0.86 104 0.94 329 1.03 0.92—1.1424 Postal workers 21 0.85 5 0.96 [0.13] 0.00 7 0.77 23 0.95 56 0.88 0.67—1.1525 Textile workers 31 1.37 3 0.85 [0.21] 0.00 21 2.01 29 1.05 84 1.30 1.04—1.6126 Shoe and leather workers 2 0.36 3 1.93 [0.04] 0.00 8 1.86 12 1.09 25 1.11 0.72—1.6427 Smelting workers 63 1.28 5 0.94 [0.29] 0.00 16 1.15 45 1.03 129 1.15 0.96—1.3628 Mechanics 150 1.12 34 1.01 2 2.41 75 1.10 234 1.16 495 1.13 1.04—1.2329 Plumbers 14 1.19 6 1.08 1 7.17 10 1.28 31 1.33 62 1.27 0.98—1.6330 Welders – – 11 2.13 [0.05] 0.00 14 1.56 31 1.18 56 1.39 1.05—1.8031 Electrical workers 38 1.22 18 1.28 1 1.99 33 1.10 80 1.17 170 1.18 1.01—1.3732 Wood workers 81 0.87 38 1.02 [0.51] 0.00 63 0.80 99 0.73 281 0.81 0.72—0.9233 Painters 35 1.16 9 1.17 1 4.76 19 1.46 47 1.20 111 1.23 1.02—1.4834 "Other construction workers" 96 0.81 18 0.75 1 1.01 22 1.44 68 0.92 205 0.88 0.77—1.0135 Bricklayers 32 0.96 3 0.77 – – 11 1.40 19 1.07 65 1.03 0.80—1.3236 Printers 35 1.66 4 1.20 [0.16] 0.00 11 1.42 24 1.14 74 1.39 1.09—1.7437 Chemical process workers 29 1.45 7 1.23 [0.09] 0.00 13 0.75 32 0.97 81 1.07 0.85—1.3338 Food workers 67 1.04 3 0.72 2 2.52 31 1.57 42 1.26 145 1.18 1.01—1.3939 Beverage workers 6 0.77 1 3.58 [0.01] 0.00 [0.20] 0.00 1 0.53 8 0.79 0.34—1.5540 Tobacco workers 2 1.54 [0.05] 0.00 [0.00] 0.00 [0.30] 0.00 1 6.77 3 1.68 0.35—4.9041 Glass makers etc 46 1.21 4 0.67 [0.13] 0.00 12 1.25 38 1.05 100 1.11 0.91—1.3542 Packers 54 1.59 19 1.51 [0.47] 0.00 29 0.98 75 1.15 177 1.25 1.08—1.4443 Engine operators 24 0.70 18 1.09 1 1.71 15 0.89 47 0.87 105 0.86 0.71—1.0444 Public safety workers 48 1.52 12 1.24 [0.43] 0.00 13 1.01 42 1.34 115 1.34 1.12—1.6145 Cooks and stewards 3 1.24 1 1.73 [0.19] 0.00 3 0.54 3 0.55 10 0.70 0.34—1.2946 Domestic assistants [0.03] 0.00 [0.04] 0.00 [0.00] 0.00 [0.05] 0.00 [0.41] 0.00 [0.53] 0.00 0.00—7.0147 Waiters 7 1.37 1 1.83 [0.02] 0.00 2 0.83 1 0.34 11 1.00 0.50—1.7948 Building caretakers 30 0.88 8 0.95 [0.20] 0.00 7 1.11 31 1.25 76 1.03 0.81—1.2949 Chimney sweeps 1 1.15 1 1.63 – – 1 1.49 4 2.19 7 1.76 0.71—3.6250 Hairdressers 6 0.62 1 5.84 [0.03] 0.00 1 0.53 10 1.54 18 0.98 0.58—1.5551 Launderers 4 0.83 [0.17] 0.00 [0.02] 0.00 [1.14] 0.00 3 0.64 7 0.65 0.26—1.3352 Military personnel 13 0.79 6 2.00 – – 14 1.24 16 0.86 49 0.99 0.74—1.3153 "Other workers" 113 1.10 5 0.50 3 1.68 70 1.27 87 1.09 278 1.12 0.99—1.2554 Economically inactive 120 1.20 65 1.16 2 1.71 24 0.96 124 1.06 335 1.12 1.01—1.25
1-54 All categories 2491 1.00 608 1.00 21 1.00 1089 1.00 2526 1.00 6735 1.00 # REF. #
Obs = observed number of cases; SIR = standardised incidence ratio; 95% CI = 95% confidence interval
74 Index Prev Next

Acta Oncologica - Pukkala et al, 2008 Cancer of the kidney and renal pelvis
Observed number of cancer of the kidney and renal pelvis among women in the Nordic countries and standardised incidence ratios1961-2005, by country and occupational category
Denmark Finland Iceland Norway Sweden Total
No Occupational category Obs SIR Obs SIR Obs SIR Obs SIR Obs SIR Obs SIR 95% CI
1 Technical workers, etc 9 1.70 2 1.26 [0.03] 0.00 2 2.47 5 0.77 18 1.27 0.75—2.002 Laboratory assistants 3 0.82 1 1.06 1 20.23 2 1.86 1 0.78 8 1.14 0.49—2.253 Physicians [1.75] 0.00 1 2.74 [0.01] 0.00 [0.43] 0.00 2 1.48 3 0.77 0.16—2.244 Dentists 1 0.64 [0.52] 0.00 [0.00] 0.00 [0.37] 0.00 1 0.84 2 0.55 0.07—1.995 Nurses 29 0.94 9 1.90 [0.30] 0.00 8 0.95 20 1.00 66 1.02 0.79—1.306 Assistant nurses 28 1.25 7 1.28 1 2.14 7 0.81 32 0.95 75 1.06 0.84—1.337 "Other health workers" 15 0.84 2 0.48 [0.08] 0.00 11 1.29 17 1.54 45 1.08 0.79—1.458 Teachers 29 0.77 18 1.89 [0.52] 0.00 16 1.03 49 1.12 112 1.04 0.87—1.269 Religious workers etc 3 0.57 5 1.35 1 11.51 1 0.25 4 0.30 14 0.53 0.29—0.8910 Artistic workers 1 0.37 4 5.62 [0.06] 0.00 [1.22] 0.00 3 1.08 8 1.07 0.46—2.1011 Journalists 1 1.72 1 2.08 [0.01] 0.00 1 3.16 3 2.39 6 2.27 0.83—4.9412 Administrators 19 1.15 4 2.51 [0.06] 0.00 3 0.75 8 1.26 34 1.19 0.82—1.6613 Clerical workers 173 1.09 41 1.37 3 1.80 68 1.30 137 1.23 422 1.19 1.08—1.3114 Sales agents 2 1.35 4 0.79 1 4.64 9 1.20 19 1.13 35 1.13 0.78—1.5715 Shop workers 134 1.22 14 0.78 [1.23] 0.00 54 1.18 91 1.19 293 1.16 1.04—1.3116 Farmers 42 0.55 6 0.44 [1.08] 0.00 20 0.62 7 1.06 75 0.57 0.45—0.7217 Gardeners 4 0.40 19 0.51 [0.04] 0.00 20 1.02 15 0.74 58 0.66 0.50—0.8618 Fishermen [0.39] 0.00 [0.08] 0.00 [0.03] 0.00 [0.23] 0.00 1 15.66 1 1.26 0.03—7.0419 Forestry workers [0.10] 0.00 [0.14] 0.00 [0.00] 0.00 [0.37] 0.00 [0.41] 0.00 [1.03] 0.00 0.00—3.5920 Miners and quarry workers [0.01] 0.00 [0.07] 0.00 [0.00] 0.00 [0.02] 0.00 [0.09] 0.00 [0.18] 0.00 0.00—20.0321 Seamen – – [0.01] 0.00 – – [0.05] 0.00 [0.01] 0.00 [0.07] 0.00 0.00—51.0522 Transport workers [0.11] 0.00 1 1.01 [0.04] 0.00 [0.23] 0.00 1 0.87 2 0.79 0.10—2.8723 Drivers 4 1.45 [0.37] 0.00 [0.01] 0.00 2 2.28 1 0.39 7 1.06 0.43—2.1924 Postal workers 6 1.02 6 1.06 [0.43] 0.00 13 1.27 28 1.33 53 1.22 0.92—1.6025 Textile workers 57 1.55 18 1.39 [1.03] 0.00 15 0.89 45 0.96 135 1.18 1.00—1.4026 Shoe and leather workers 5 1.84 [1.60] 0.00 [0.05] 0.00 2 1.64 8 2.24 15 1.64 0.92—2.7027 Smelting workers [0.66] 0.00 [0.38] 0.00 [0.00] 0.00 1 8.13 1 1.20 2 1.00 0.12—3.6028 Mechanics 13 2.00 1 0.64 [0.00] 0.00 1 0.69 12 1.39 27 1.49 0.98—2.1629 Plumbers [0.06] 0.00 [0.00] 0.00 – – [0.01] 0.00 [0.01] 0.00 [0.08] 0.00 0.00—44.3330 Welders – – [0.11] 0.00 [0.00] 0.00 [0.10] 0.00 [0.28] 0.00 [0.48] 0.00 0.00—7.6331 Electrical workers 15 1.66 [0.86] 0.00 [0.01] 0.00 1 0.64 6 1.26 22 1.35 0.85—2.0532 Wood workers 1 0.33 3 0.88 [0.01] 0.00 [0.52] 0.00 [1.37] 0.00 4 0.48 0.13—1.2333 Painters 1 8.81 [0.38] 0.00 [0.00] 0.00 [0.12] 0.00 [0.38] 0.00 1 0.99 0.03—5.5434 "Other construction workers" [0.09] 0.00 2 1.37 [0.00] 0.00 [0.05] 0.00 [0.04] 0.00 2 1.23 0.15—4.4335 Bricklayers [0.02] 0.00 [0.04] 0.00 – – [0.00] 0.00 [0.00] 0.00 [0.07] 0.00 0.00—55.5736 Printers 4 1.17 2 1.27 [0.07] 0.00 3 2.18 6 1.60 15 1.47 0.82—2.4337 Chemical process workers 10 1.83 [0.85] 0.00 [0.04] 0.00 1 0.79 3 0.98 14 1.31 0.72—2.2038 Food workers 29 1.09 [4.49] 0.00 2 1.13 8 0.95 19 1.99 58 1.14 0.87—1.4739 Beverage workers 6 2.35 [0.26] 0.00 [0.00] 0.00 [0.07] 0.00 1 1.64 7 2.00 0.80—4.1240 Tobacco workers 4 1.15 [0.15] 0.00 – – [0.28] 0.00 1 2.75 5 1.17 0.38—2.7441 Glass makers etc 4 0.62 2 0.66 [0.04] 0.00 3 1.10 11 1.35 20 0.98 0.60—1.5242 Packers 3 1.60 2 0.37 [0.19] 0.00 7 1.05 19 1.55 31 1.17 0.80—1.6643 Engine operators [0.05] 0.00 2 2.37 [0.00] 0.00 [0.08] 0.00 [0.63] 0.00 2 1.24 0.15—4.5044 Public safety workers [0.22] 0.00 [0.19] 0.00 [0.04] 0.00 2 2.35 1 1.28 3 1.44 0.30—4.2245 Cooks and stewards [0.07] 0.00 6 0.98 [0.77] 0.00 10 1.07 14 0.75 30 0.86 0.58—1.2346 Domestic assistants 32 0.77 5 0.83 [0.24] 0.00 28 1.15 44 1.00 109 0.94 0.78—1.1347 Waiters 9 1.27 6 1.25 [0.07] 0.00 5 0.50 26 1.35 46 1.12 0.82—1.4948 Building caretakers 104 0.86 29 1.34 2 1.34 52 1.20 38 0.80 225 0.96 0.84—1.0949 Chimney sweeps [0.01] 0.00 [0.01] 0.00 – – [0.01] 0.00 [0.00] 0.00 [0.03] 0.00 0.00—128.9350 Hairdressers 9 1.31 3 1.65 [0.05] 0.00 7 2.77 7 0.94 26 1.39 0.91—2.0451 Launderers 11 0.80 2 1.10 [0.27] 0.00 3 0.80 17 1.66 33 1.11 0.76—1.5552 Military personnel [0.07] 0.00 [0.01] 0.00 – – [0.01] 0.00 [0.02] 0.00 [0.11] 0.00 0.00—33.2053 "Other workers" 41 1.21 11 1.72 1 0.74 22 1.00 18 0.86 93 1.10 0.89—1.3554 Economically inactive 882 0.98 148 0.96 7 1.39 246 0.91 961 0.93 2244 0.95 0.91—0.99
1-54 All categories 1743 1.00 387 1.00 19 1.00 654 1.00 1703 1.00 4506 1.00 # REF. #
Obs = observed number of cases; SIR = standardised incidence ratio; 95% CI = 95% confidence interval
75 Index Prev Next

Acta Oncologica - Pukkala et al, 2008 Cancer of the bladder, ureter, and urethra
Observed number of cancer of the bladder, ureter, and urethra among men in the Nordic countries and standardised incidence ratios1961-2005, by country and occupational category
Denmark Finland Iceland Norway Sweden Total
No Occupational category Obs SIR Obs SIR Obs SIR Obs SIR Obs SIR Obs SIR 95% CI
1 Technical workers, etc 1776 1.03 676 0.91 9 0.72 715 0.89 4503 1.07 7679 1.02 1.00—1.052 Laboratory assistants 48 1.40 14 0.80 3 1.27 42 1.07 17 0.93 124 1.11 0.93—1.323 Physicians 121 0.82 51 1.20 6 1.16 107 0.99 220 1.17 505 1.03 0.94—1.124 Dentists 48 1.16 8 0.87 [1.23] 0.00 48 1.00 110 1.16 214 1.10 0.96—1.265 Nurses 1 0.53 2 1.12 [0.03] 0.00 1 0.27 7 0.88 11 0.72 0.36—1.296 Assistant nurses 50 1.22 1 0.70 [0.57] 0.00 28 1.48 80 1.28 159 1.28 1.09—1.497 "Other health workers" 121 0.97 33 0.76 1 0.72 43 1.05 172 1.08 370 1.00 0.90—1.118 Teachers 611 0.80 258 0.82 17 0.92 473 0.81 938 0.87 2297 0.84 0.80—0.879 Religious workers etc 277 0.84 158 0.96 5 0.41 277 0.91 762 0.95 1479 0.92 0.87—0.9610 Artistic workers 95 0.95 65 1.07 5 1.48 98 1.09 331 1.30 594 1.17 1.08—1.2711 Journalists 45 0.96 29 0.97 2 1.06 34 0.88 128 1.09 238 1.02 0.89—1.1512 Administrators 2035 1.02 517 1.03 29 0.90 1192 1.09 1849 1.12 5622 1.07 1.04—1.1013 Clerical workers 885 1.04 362 1.08 43 1.19 797 0.97 2041 1.16 4128 1.09 1.06—1.1214 Sales agents 547 1.23 476 1.03 14 0.76 1054 1.11 3004 1.19 5095 1.16 1.12—1.1915 Shop workers 2132 1.07 188 1.01 14 1.11 366 1.01 909 1.11 3609 1.07 1.04—1.1116 Farmers 2282 0.57 2135 0.84 31 0.58 2022 0.73 2977 0.67 9447 0.68 0.67—0.7017 Gardeners 429 0.77 284 0.85 1 0.61 488 0.71 1289 0.79 2491 0.77 0.74—0.8118 Fishermen 205 1.16 23 0.71 34 1.15 1005 1.17 183 1.05 1450 1.14 1.08—1.2019 Forestry workers 71 0.86 381 0.99 [0.26] 0.00 349 0.69 798 0.67 1599 0.74 0.71—0.7820 Miners and quarry workers 24 0.98 78 1.29 [0.50] 0.00 106 0.77 272 0.94 480 0.94 0.86—1.0321 Seamen 231 1.26 108 1.34 12 1.42 813 1.21 314 1.24 1478 1.23 1.17—1.3022 Transport workers 486 1.12 265 1.05 13 0.76 391 1.07 952 1.07 2107 1.08 1.03—1.1223 Drivers 1621 1.21 822 1.10 32 1.32 1152 1.18 2346 1.12 5973 1.15 1.12—1.1824 Postal workers 296 1.12 112 0.96 2 0.63 208 1.11 488 1.06 1106 1.07 1.01—1.1425 Textile workers 273 1.11 78 0.96 4 0.73 241 1.11 537 1.02 1133 1.05 0.99—1.1226 Shoe and leather workers 76 1.24 23 0.64 1 0.84 94 1.04 234 1.13 428 1.08 0.98—1.1927 Smelting workers 658 1.25 142 1.17 6 0.79 316 1.12 807 0.98 1929 1.10 1.05—1.1528 Mechanics 1636 1.14 773 1.05 21 0.91 1574 1.17 4134 1.08 8138 1.11 1.08—1.1329 Plumbers 166 1.31 149 1.23 5 1.31 195 1.27 507 1.15 1022 1.21 1.14—1.2930 Welders – – 131 1.22 2 1.47 198 1.15 491 0.99 822 1.06 0.99—1.1331 Electrical workers 395 1.20 307 1.01 11 0.80 682 1.15 1363 1.05 2758 1.09 1.05—1.1332 Wood workers 985 0.97 878 1.02 14 1.02 1562 0.96 2259 0.88 5698 0.94 0.91—0.9633 Painters 395 1.21 160 0.93 10 1.78 291 1.09 786 1.06 1642 1.08 1.03—1.1434 "Other construction workers" 1259 0.98 583 1.07 27 1.00 336 1.09 1387 1.01 3592 1.02 0.98—1.0535 Bricklayers 393 1.08 94 1.06 – – 154 0.96 335 1.00 976 1.03 0.97—1.1036 Printers 260 1.16 81 1.13 8 1.80 198 1.27 471 1.19 1018 1.19 1.12—1.2737 Chemical process workers 219 1.01 141 1.11 2 0.81 367 1.03 660 1.07 1389 1.05 1.00—1.1138 Food workers 790 1.14 111 1.20 23 1.09 442 1.09 702 1.11 2068 1.12 1.07—1.1739 Beverage workers 98 1.19 2 0.31 [0.36] 0.00 3 0.81 50 1.44 153 1.20 1.02—1.4040 Tobacco workers 15 1.06 1 0.91 [0.03] 0.00 9 1.48 4 1.44 29 1.20 0.80—1.7241 Glass makers etc 417 1.01 149 1.12 4 1.09 215 1.12 701 1.03 1486 1.05 0.99—1.1042 Packers 380 1.03 302 1.06 12 0.97 706 1.17 1300 1.06 2700 1.08 1.04—1.1343 Engine operators 360 0.98 416 1.15 15 0.93 363 1.10 1066 1.05 2220 1.06 1.02—1.1044 Public safety workers 430 1.22 242 1.12 8 0.69 260 1.00 625 1.05 1565 1.09 1.04—1.1545 Cooks and stewards 36 1.42 8 0.66 7 1.31 116 1.05 142 1.38 309 1.21 1.08—1.3546 Domestic assistants 1 3.74 [1.04] 0.00 [0.02] 0.00 2 2.23 4 0.54 7 0.72 0.29—1.4947 Waiters 103 1.96 11 1.00 2 3.59 50 1.03 83 1.54 249 1.50 1.32—1.6948 Building caretakers 413 1.11 215 1.12 9 1.71 148 1.14 491 1.05 1276 1.10 1.04—1.1649 Chimney sweeps 16 1.74 16 1.17 – – 15 1.12 58 1.71 105 1.49 1.23—1.8150 Hairdressers 142 1.33 5 1.34 1 1.28 53 1.37 158 1.27 359 1.31 1.18—1.4551 Launderers 49 0.93 4 1.05 1 2.00 30 1.28 102 1.15 186 1.10 0.95—1.2752 Military personnel 204 1.16 62 0.98 – – 245 1.13 404 1.12 915 1.12 1.05—1.1953 "Other workers" 1268 1.16 195 0.88 63 1.32 1155 1.00 1400 0.94 4081 1.02 0.99—1.0554 Economically inactive 1189 1.14 1391 1.10 36 1.11 443 0.81 1934 0.90 4993 1.00 0.97—1.02
1-54 All categories 27063 1.00 13716 1.00 565 1.00 22272 1.00 47885 1.00 111501 1.00 # REF. #
Obs = observed number of cases; SIR = standardised incidence ratio; 95% CI = 95% confidence interval
76 Index Prev Next

Acta Oncologica - Pukkala et al, 2008 Cancer of the bladder, ureter, and urethra
Observed number of cancer of the bladder, ureter, and urethra among women in the Nordic countries and standardised incidenceratios 1961-2005, by country and occupational category
Denmark Finland Iceland Norway Sweden Total
No Occupational category Obs SIR Obs SIR Obs SIR Obs SIR Obs SIR Obs SIR 95% CI
1 Technical workers, etc 30 1.15 21 1.19 [0.45] 0.00 8 0.95 67 1.04 126 1.08 0.90—1.282 Laboratory assistants 17 0.93 17 1.60 [0.68] 0.00 10 0.87 14 0.98 58 1.05 0.79—1.353 Physicians 8 0.91 6 1.45 [0.14] 0.00 2 0.43 8 0.58 24 0.76 0.49—1.134 Dentists 6 0.77 6 1.02 [0.05] 0.00 3 0.72 6 0.51 21 0.71 0.44—1.085 Nurses 141 0.91 67 1.25 2 0.56 85 0.94 209 1.05 504 1.00 0.92—1.106 Assistant nurses 137 1.25 64 1.05 6 1.16 90 0.98 356 1.06 653 1.08 1.00—1.177 "Other health workers" 89 1.00 55 1.19 [1.00] 0.00 90 0.97 129 1.15 363 1.07 0.96—1.188 Teachers 144 0.75 97 0.90 2 0.33 152 0.89 415 0.94 810 0.88 0.82—0.949 Religious workers etc 27 1.03 44 1.05 2 2.16 33 0.77 126 0.92 232 0.93 0.82—1.0610 Artistic workers 11 0.80 12 1.50 1 1.33 14 1.04 34 1.22 72 1.13 0.88—1.4211 Journalists [2.86] 0.00 3 0.56 [0.18] 0.00 3 0.88 9 0.71 15 0.61 0.34—1.0112 Administrators 97 1.19 16 0.91 1 1.44 48 1.08 89 1.38 251 1.20 1.06—1.3613 Clerical workers 893 1.14 374 1.12 20 1.04 640 1.12 1335 1.21 3262 1.16 1.12—1.2014 Sales agents 9 1.24 71 1.27 3 1.37 100 1.14 222 1.32 405 1.26 1.15—1.3915 Shop workers 544 1.01 216 1.08 10 0.78 538 1.06 889 1.20 2197 1.09 1.05—1.1416 Farmers 204 0.53 131 0.89 3 0.30 272 0.73 42 0.63 652 0.66 0.62—0.7217 Gardeners 40 0.81 320 0.78 [0.33] 0.00 153 0.68 158 0.80 671 0.76 0.71—0.8218 Fishermen [1.94] 0.00 [0.83] 0.00 [0.31] 0.00 2 0.79 1 1.58 3 0.48 0.10—1.4019 Forestry workers 1 1.97 [1.59] 0.00 [0.04] 0.00 2 0.50 3 0.74 6 0.59 0.22—1.2820 Miners and quarry workers [0.03] 0.00 [0.73] 0.00 [0.01] 0.00 1 5.80 2 2.17 3 1.61 0.33—4.7221 Seamen – – [0.14] 0.00 [0.00] 0.00 [0.58] 0.00 [0.09] 0.00 [0.80] 0.00 0.00—4.5922 Transport workers [0.53] 0.00 16 1.50 [0.34] 0.00 3 1.21 12 1.08 31 1.24 0.84—1.7523 Drivers 23 1.72 2 0.48 1 7.32 10 1.03 28 1.09 64 1.20 0.93—1.5424 Postal workers 33 1.15 64 1.03 6 1.34 134 1.17 202 0.99 439 1.06 0.97—1.1725 Textile workers 190 1.06 156 1.09 10 1.14 233 1.19 460 1.02 1049 1.07 1.01—1.1426 Shoe and leather workers 13 0.99 17 0.97 1 2.24 16 1.15 46 1.34 93 1.17 0.95—1.4427 Smelting workers [3.17] 0.00 4 0.96 [0.02] 0.00 1 0.76 9 1.10 14 0.83 0.46—1.4028 Mechanics 52 1.66 17 0.98 [0.07] 0.00 19 1.19 92 1.09 180 1.21 1.04—1.4029 Plumbers [0.33] 0.00 [0.03] 0.00 – – [0.11] 0.00 [0.10] 0.00 [0.56] 0.00 0.00—6.5630 Welders – – 1 0.83 [0.00] 0.00 [0.99] 0.00 3 1.06 4 0.80 0.22—2.0431 Electrical workers 50 1.15 5 0.52 [0.07] 0.00 20 1.18 48 1.03 123 1.05 0.88—1.2632 Wood workers 12 0.82 32 0.87 [0.13] 0.00 1 0.18 11 0.81 56 0.79 0.60—1.0233 Painters 2 3.64 8 1.91 [0.04] 0.00 1 0.76 4 1.06 15 1.52 0.85—2.5134 "Other construction workers" [0.43] 0.00 15 0.95 [0.02] 0.00 [0.51] 0.00 [0.41] 0.00 15 0.87 0.49—1.4435 Bricklayers 1 11.27 1 1.97 – – [0.03] 0.00 [0.01] 0.00 2 3.16 0.38—11.4136 Printers 29 1.76 24 1.39 3 4.18 21 1.35 49 1.35 126 1.46 1.22—1.7437 Chemical process workers 39 1.49 7 0.76 [0.34] 0.00 19 1.34 38 1.28 103 1.29 1.07—1.5738 Food workers 133 1.03 47 0.95 13 0.77 99 1.04 86 0.93 378 0.99 0.89—1.0939 Beverage workers 16 1.33 3 1.05 [0.04] 0.00 [0.80] 0.00 10 1.70 29 1.34 0.90—1.9340 Tobacco workers 32 1.94 4 2.46 – – 9 2.78 5 1.43 50 2.01 1.49—2.6541 Glass makers etc 37 1.19 29 0.87 1 2.33 46 1.51 88 1.12 201 1.16 1.01—1.3342 Packers 7 0.78 71 1.19 3 1.71 90 1.20 143 1.20 314 1.19 1.06—1.3343 Engine operators [0.24] 0.00 9 0.97 [0.03] 0.00 1 1.17 4 0.63 14 0.84 0.46—1.4144 Public safety workers 1 1.00 2 0.95 [0.34] 0.00 11 1.14 11 1.37 25 1.18 0.77—1.7545 Cooks and stewards [0.34] 0.00 75 1.12 8 1.21 129 1.18 192 1.06 404 1.11 1.00—1.2246 Domestic assistants 193 0.95 69 1.04 1 0.49 292 1.04 481 1.10 1036 1.05 0.99—1.1147 Waiters 61 1.82 75 1.42 1 1.37 146 1.30 271 1.46 554 1.44 1.32—1.5648 Building caretakers 682 1.17 248 1.05 8 0.61 487 1.00 521 1.12 1946 1.09 1.04—1.1449 Chimney sweeps [0.06] 0.00 [0.11] 0.00 – – [0.07] 0.00 [0.01] 0.00 [0.25] 0.00 0.00—14.6550 Hairdressers 43 1.25 25 1.25 [0.61] 0.00 37 1.33 88 1.21 193 1.24 1.08—1.4351 Launderers 66 1.00 22 1.12 1 0.44 48 1.11 111 1.12 248 1.07 0.95—1.2252 Military personnel 1 2.89 [0.13] 0.00 – – [0.11] 0.00 [0.20] 0.00 1 1.26 0.03—7.0353 "Other workers" 199 1.21 66 0.94 19 1.46 223 0.91 239 1.16 746 1.07 0.99—1.1554 Economically inactive 4292 0.96 1648 0.96 57 1.27 3190 0.98 9256 0.93 18443 0.95 0.94—0.96
1-54 All categories 8605 1.00 4282 1.00 183 1.00 7532 1.00 16622 1.00 37224 1.00 # REF. #
Obs = observed number of cases; SIR = standardised incidence ratio; 95% CI = 95% confidence interval
77 Index Prev Next

Acta Oncologica - Pukkala et al, 2008 Malignant melanoma of the skin
Observed number ofmalignant melanoma of the skin among men in the Nordic countries and standardised incidence ratios 1961-2005,by country and occupational category
Denmark Finland Iceland Norway Sweden Total
No Occupational category Obs SIR Obs SIR Obs SIR Obs SIR Obs SIR Obs SIR 95% CI
1 Technical workers, etc 485 1.23 611 1.33 10 2.28 630 1.30 2436 1.24 4172 1.26 1.22—1.302 Laboratory assistants 13 1.72 11 0.92 3 3.79 33 1.61 18 1.15 78 1.38 1.09—1.723 Physicians 39 1.25 43 1.60 [1.36] 0.00 94 1.74 149 1.52 325 1.54 1.38—1.714 Dentists 21 2.15 8 1.50 [0.42] 0.00 41 1.75 66 1.52 136 1.65 1.40—1.955 Nurses [0.52] 0.00 1 0.46 [0.02] 0.00 6 1.35 10 0.92 17 0.94 0.55—1.516 Assistant nurses 9 0.94 2 0.94 [0.29] 0.00 12 1.48 32 0.85 55 0.95 0.72—1.247 "Other health workers" 27 1.03 29 1.20 [0.41] 0.00 23 1.11 97 1.27 176 1.19 1.03—1.388 Teachers 259 1.46 268 1.47 5 0.91 401 1.20 815 1.48 1748 1.40 1.34—1.479 Religious workers etc 103 1.56 174 1.59 7 1.89 214 1.38 622 1.40 1120 1.44 1.36—1.5310 Artistic workers 22 1.07 36 1.01 2 2.10 63 1.45 127 1.04 250 1.13 0.99—1.2711 Journalists 17 1.68 15 0.88 1 1.69 31 1.52 89 1.56 153 1.45 1.24—1.7012 Administrators 588 1.43 362 1.37 12 1.64 761 1.52 944 1.47 2667 1.46 1.41—1.5213 Clerical workers 240 1.30 201 1.23 10 1.11 525 1.37 1038 1.41 2014 1.37 1.31—1.4314 Sales agents 102 1.04 272 1.10 4 0.92 537 1.31 1393 1.27 2308 1.24 1.20—1.3015 Shop workers 466 1.17 122 1.06 2 0.56 198 1.05 397 1.11 1185 1.11 1.05—1.1816 Farmers 523 0.70 902 1.00 7 0.58 645 0.76 1010 0.77 3087 0.81 0.78—0.8417 Gardeners 85 0.82 154 0.99 [0.40] 0.00 187 0.79 409 0.74 835 0.79 0.74—0.8518 Fishermen 26 0.69 9 0.72 11 0.98 124 0.41 46 0.80 216 0.51 0.45—0.5819 Forestry workers 10 0.68 104 0.56 [0.08] 0.00 98 0.62 208 0.51 420 0.55 0.50—0.6020 Miners and quarry workers 1 0.22 25 0.82 [0.17] 0.00 44 0.78 62 0.57 132 0.66 0.55—0.7821 Seamen 44 1.01 42 1.00 5 2.02 332 1.03 122 1.18 545 1.06 0.97—1.1522 Transport workers 116 1.32 109 0.95 11 2.82 184 1.22 388 1.10 808 1.14 1.06—1.2223 Drivers 216 0.74 337 0.82 4 0.59 357 0.77 760 0.81 1674 0.79 0.76—0.8324 Postal workers 74 1.19 61 1.01 [0.73] 0.00 96 1.18 272 1.37 503 1.25 1.14—1.3625 Textile workers 31 0.66 31 0.87 1 0.79 82 1.08 211 1.19 356 1.05 0.95—1.1726 Shoe and leather workers 7 0.63 15 0.99 [0.25] 0.00 31 1.08 62 1.01 115 0.99 0.82—1.1927 Smelting workers 90 0.77 44 0.77 2 1.03 100 0.87 220 0.73 456 0.77 0.70—0.8428 Mechanics 292 0.94 356 0.86 4 0.52 556 0.85 1392 0.82 2600 0.84 0.81—0.8829 Plumbers 16 0.56 58 0.82 1 0.88 73 0.91 159 0.83 307 0.82 0.74—0.9230 Welders – – 60 0.80 [0.48] 0.00 73 0.74 168 0.69 301 0.72 0.64—0.8031 Electrical workers 75 0.96 191 1.03 10 2.03 296 1.00 634 1.01 1206 1.01 0.96—1.0732 Wood workers 176 0.84 313 0.84 8 2.13 600 0.95 782 0.84 1879 0.87 0.83—0.9133 Painters 72 1.03 60 0.71 1 0.67 97 0.92 245 0.86 475 0.87 0.79—0.9534 "Other construction workers" 198 0.83 191 0.79 5 0.58 108 0.76 386 0.76 888 0.78 0.73—0.8335 Bricklayers 91 1.20 36 0.93 – – 47 0.76 114 0.95 288 0.97 0.87—1.0936 Printers 67 1.30 57 1.27 [1.38] 0.00 88 1.15 219 1.23 431 1.22 1.11—1.3437 Chemical process workers 27 0.65 68 1.00 [0.61] 0.00 132 0.99 181 0.81 408 0.88 0.79—0.9638 Food workers 108 0.76 59 1.22 3 0.54 162 1.01 249 1.04 581 0.97 0.90—1.0639 Beverage workers 18 1.11 2 0.68 [0.09] 0.00 4 1.10 10 0.82 34 0.97 0.67—1.3640 Tobacco workers 5 2.06 1 1.76 [0.00] 0.00 3 1.42 [1.22] 0.00 9 1.42 0.65—2.6941 Glass makers etc 62 0.77 66 0.92 3 2.91 88 0.98 235 0.88 454 0.89 0.81—0.9742 Packers 43 0.63 140 1.02 3 0.95 218 0.93 381 0.86 785 0.88 0.82—0.9543 Engine operators 68 0.87 196 0.94 [5.11] 0.00 171 0.95 363 0.81 798 0.87 0.81—0.9344 Public safety workers 110 1.53 122 1.08 2 0.65 150 1.38 368 1.32 752 1.31 1.22—1.4145 Cooks and stewards 5 0.85 14 1.59 [1.80] 0.00 62 1.05 53 0.93 134 1.01 0.86—1.2046 Domestic assistants [0.07] 0.00 [0.38] 0.00 [0.01] 0.00 [0.66] 0.00 3 0.38 3 0.33 0.07—0.9747 Waiters 12 1.09 4 0.45 [0.23] 0.00 26 1.13 20 0.69 62 0.86 0.66—1.1148 Building caretakers 60 0.85 73 0.83 1 0.99 62 1.07 155 0.83 351 0.87 0.78—0.9649 Chimney sweeps 1 0.49 3 0.46 – – 3 0.53 11 0.72 18 0.61 0.36—0.9650 Hairdressers 20 0.98 2 1.05 [0.24] 0.00 12 0.78 63 1.41 97 1.17 0.95—1.4351 Launderers 3 0.30 1 0.50 [0.09] 0.00 8 0.90 28 0.86 40 0.75 0.53—1.0252 Military personnel 42 0.96 48 1.09 – – 124 1.12 209 1.27 423 1.17 1.06—1.2853 "Other workers" 199 0.90 105 1.00 10 0.84 327 0.80 485 0.91 1126 0.88 0.83—0.9354 Economically inactive 132 0.85 371 0.81 9 0.95 132 0.58 613 0.66 1257 0.70 0.67—0.74
1-54 All categories 5516 1.00 6585 1.00 157 1.00 9471 1.00 19529 1.00 41258 1.00 # REF. #
Obs = observed number of cases; SIR = standardised incidence ratio; 95% CI = 95% confidence interval
78 Index Prev Next

Acta Oncologica - Pukkala et al, 2008 Malignant melanoma of the skin
Observed number of malignant melanoma of the skin among women in the Nordic countries and standardised incidence ratios1961-2005, by country and occupational category
Denmark Finland Iceland Norway Sweden Total
No Occupational category Obs SIR Obs SIR Obs SIR Obs SIR Obs SIR Obs SIR 95% CI
1 Technical workers, etc 22 0.99 52 1.08 1 1.05 40 1.81 136 1.11 251 1.16 1.03—1.322 Laboratory assistants 31 1.78 21 0.84 1 0.81 27 1.13 59 1.10 139 1.15 0.97—1.363 Physicians 13 1.74 22 1.79 [0.16] 0.00 13 1.35 33 1.00 81 1.30 1.03—1.614 Dentists 8 1.23 20 1.97 [0.07] 0.00 14 1.94 32 1.60 74 1.69 1.32—2.125 Nurses 143 1.10 160 1.25 6 1.22 196 1.03 410 1.20 915 1.15 1.08—1.236 Assistant nurses 91 0.95 117 0.99 5 0.71 161 0.86 590 0.90 964 0.91 0.85—0.967 "Other health workers" 92 1.24 121 1.23 [1.60] 0.00 207 1.19 270 1.17 690 1.19 1.11—1.288 Teachers 253 1.47 283 1.31 19 2.04 497 1.43 1025 1.29 2077 1.35 1.29—1.419 Religious workers etc 29 1.29 147 1.13 1 0.75 104 1.21 376 1.19 657 1.18 1.09—1.2710 Artistic workers 8 0.74 17 0.89 1 0.97 29 1.22 40 0.75 95 0.88 0.71—1.0811 Journalists 2 0.81 12 1.02 [0.29] 0.00 15 2.10 27 1.05 56 1.18 0.89—1.5312 Administrators 76 1.19 54 1.33 2 3.18 89 1.16 126 1.06 347 1.15 1.04—1.2813 Clerical workers 790 1.17 851 1.17 29 1.05 1327 1.30 2156 1.16 5153 1.20 1.16—1.2314 Sales agents 7 1.19 96 1.01 3 1.29 116 1.08 241 1.09 463 1.07 0.98—1.1715 Shop workers 451 1.04 321 0.93 16 1.04 757 1.02 900 1.03 2445 1.01 0.97—1.0516 Farmers 269 0.86 170 0.98 4 0.43 372 0.88 85 0.96 900 0.89 0.84—0.9517 Gardeners 33 0.83 526 1.01 [0.34] 0.00 195 0.76 211 1.00 965 0.94 0.88—1.0018 Fishermen [1.62] 0.00 2 1.52 [0.45] 0.00 2 0.48 [0.80] 0.00 4 0.48 0.13—1.2319 Forestry workers [0.42] 0.00 [2.60] 0.00 [0.06] 0.00 4 0.74 3 0.54 7 0.50 0.20—1.0220 Miners and quarry workers [0.02] 0.00 [0.94] 0.00 [0.01] 0.00 [0.38] 0.00 [1.53] 0.00 [2.88] 0.00 0.00—1.2821 Seamen – – [0.43] 0.00 [0.00] 0.00 1 0.99 [0.31] 0.00 1 0.57 0.01—3.1822 Transport workers [0.43] 0.00 16 1.07 1 2.94 7 1.37 24 1.31 48 1.22 0.90—1.6223 Drivers 10 0.90 10 1.13 [0.22] 0.00 13 0.76 38 0.77 71 0.82 0.64—1.0324 Postal workers 22 0.98 108 1.08 7 1.54 210 1.15 326 1.18 673 1.15 1.06—1.2425 Textile workers 130 0.90 197 0.90 4 0.57 215 0.94 417 0.98 963 0.94 0.88—1.0026 Shoe and leather workers 10 0.92 22 0.81 1 2.50 12 0.71 27 0.81 72 0.81 0.64—1.0227 Smelting workers 3 1.14 8 1.28 [0.02] 0.00 2 0.67 12 0.86 25 0.97 0.63—1.4328 Mechanics 18 0.67 19 0.62 [0.09] 0.00 27 1.10 86 0.65 150 0.70 0.60—0.8229 Plumbers [0.22] 0.00 [0.08] 0.00 – – [0.22] 0.00 [0.33] 0.00 [0.85] 0.00 0.00—4.3530 Welders – – [2.72] 0.00 [0.01] 0.00 2 0.77 6 0.88 8 0.66 0.29—1.3031 Electrical workers 34 0.90 15 0.64 [0.07] 0.00 28 1.00 55 0.72 132 0.80 0.67—0.9532 Wood workers 9 0.73 43 0.81 [0.16] 0.00 4 0.40 21 0.87 77 0.77 0.61—0.9633 Painters [0.45] 0.00 8 1.20 [0.05] 0.00 4 1.89 2 0.34 14 0.92 0.50—1.5434 "Other construction workers" [0.34] 0.00 18 0.92 [0.03] 0.00 1 1.14 [1.12] 0.00 19 0.87 0.52—1.3635 Bricklayers [0.07] 0.00 2 2.64 – – [0.05] 0.00 [0.04] 0.00 2 2.16 0.26—7.8036 Printers 8 0.58 30 1.01 [0.76] 0.00 21 0.91 51 1.00 110 0.93 0.77—1.1237 Chemical process workers 27 1.28 11 0.78 [0.27] 0.00 22 1.10 29 0.78 89 0.96 0.77—1.1838 Food workers 97 0.91 68 0.94 16 0.88 70 0.60 79 0.83 330 0.81 0.72—0.9039 Beverage workers 7 0.74 4 1.04 [0.04] 0.00 1 0.79 2 0.36 14 0.69 0.38—1.1740 Tobacco workers 11 0.83 2 0.90 – – [3.76] 0.00 2 0.46 15 0.64 0.36—1.0541 Glass makers etc 20 0.76 44 0.83 2 4.00 47 1.06 80 0.79 193 0.86 0.74—0.9942 Packers 10 1.35 78 0.84 2 1.33 90 0.88 130 0.90 310 0.89 0.80—1.0043 Engine operators 1 3.91 10 0.64 [0.03] 0.00 [2.12] 0.00 9 0.63 20 0.62 0.38—0.9644 Public safety workers 1 1.48 3 0.75 [0.32] 0.00 21 1.71 29 1.34 54 1.39 1.04—1.8145 Cooks and stewards 1 3.70 96 0.90 8 1.45 113 0.93 157 0.87 375 0.91 0.82—1.0046 Domestic assistants 147 0.90 122 0.98 1 0.71 289 0.86 618 0.92 1177 0.91 0.86—0.9647 Waiters 20 0.72 83 0.87 [0.78] 0.00 116 0.74 172 0.88 391 0.82 0.75—0.9148 Building caretakers 416 0.90 311 0.90 8 0.70 475 0.70 443 0.76 1653 0.80 0.76—0.8349 Chimney sweeps [0.04] 0.00 [0.17] 0.00 – – [0.09] 0.00 [0.03] 0.00 [0.34] 0.00 0.00—10.9650 Hairdressers 36 1.20 36 0.97 1 0.89 44 1.00 117 1.08 234 1.06 0.93—1.2151 Launderers 42 0.81 21 0.82 2 1.31 48 0.96 71 0.79 184 0.84 0.73—0.9752 Military personnel 1 3.75 [0.50] 0.00 – – [0.29] 0.00 1 1.16 2 1.04 0.13—3.7553 "Other workers" 116 0.87 101 0.88 10 0.74 375 1.03 242 0.89 844 0.94 0.88—1.0154 Economically inactive 3243 0.98 1986 0.95 48 1.06 3493 0.97 9337 0.97 18107 0.97 0.95—0.98
1-54 All categories 6758 1.00 6464 1.00 199 1.00 9916 1.00 19303 1.00 42640 1.00 # REF. #
Obs = observed number of cases; SIR = standardised incidence ratio; 95% CI = 95% confidence interval
79 Index Prev Next

Acta Oncologica - Pukkala et al, 2008 Skin melanoma, upper limbs
Observed number of skin melanoma, upper limbs among men in the Nordic countries and standardised incidence ratios 1961-2005, bycountry and occupational category
Denmark Finland Iceland Norway Sweden Total
No Occupational category Obs SIR Obs SIR Obs SIR Obs SIR Obs SIR Obs SIR 95% CI
1 Technical workers, etc 68 1.44 103 1.73 1 1.35 75 1.71 380 1.27 627 1.39 1.29—1.512 Laboratory assistants [0.90] 0.00 1 0.65 1 8.11 1 0.54 6 2.33 9 1.28 0.59—2.443 Physicians 7 1.88 5 1.44 [0.21] 0.00 7 1.43 30 1.98 49 1.78 1.32—2.364 Dentists 3 2.54 [0.69] 0.00 [0.07] 0.00 2 0.95 12 1.83 17 1.60 0.93—2.565 Nurses [0.06] 0.00 [0.28] 0.00 [0.00] 0.00 1 2.43 2 1.14 3 1.19 0.25—3.486 Assistant nurses 2 1.74 [0.28] 0.00 [0.04] 0.00 1 1.36 4 0.69 7 0.88 0.35—1.807 "Other health workers" 2 0.64 2 0.64 [0.06] 0.00 3 1.58 19 1.65 26 1.32 0.86—1.938 Teachers 31 1.45 36 1.56 [0.87] 0.00 38 1.26 132 1.55 237 1.48 1.30—1.689 Religious workers etc 10 1.28 25 1.75 4 6.77 26 1.84 112 1.63 177 1.68 1.45—1.9410 Artistic workers 4 1.63 7 1.54 [0.14] 0.00 6 1.52 20 1.09 37 1.25 0.88—1.7311 Journalists 3 2.52 2 0.91 [0.09] 0.00 2 1.07 17 1.97 24 1.72 1.10—2.5612 Administrators 73 1.49 42 1.23 3 2.86 72 1.57 151 1.60 341 1.52 1.37—1.6913 Clerical workers 34 1.54 17 0.81 1 0.77 67 1.93 167 1.53 286 1.52 1.35—1.7114 Sales agents 14 1.19 35 1.12 [0.63] 0.00 50 1.34 194 1.19 293 1.20 1.07—1.3515 Shop workers 57 1.20 17 1.16 [0.51] 0.00 19 1.11 69 1.29 162 1.22 1.04—1.4216 Farmers 61 0.68 122 1.07 2 1.21 53 0.69 122 0.68 360 0.78 0.70—0.8717 Gardeners 9 0.73 18 0.92 [0.06] 0.00 12 0.56 49 0.62 88 0.67 0.53—0.8218 Fishermen 2 0.44 1 0.63 1 0.57 7 0.25 5 0.62 16 0.37 0.21—0.6019 Forestry workers [1.74] 0.00 9 0.39 [0.01] 0.00 6 0.41 25 0.44 40 0.41 0.30—0.5620 Miners and quarry workers [0.52] 0.00 5 1.31 [0.03] 0.00 3 0.58 8 0.51 16 0.63 0.36—1.0321 Seamen 4 0.77 4 0.74 1 2.73 22 0.75 23 1.52 54 0.98 0.73—1.2722 Transport workers 11 1.07 17 1.17 1 1.81 19 1.38 55 1.06 103 1.13 0.93—1.3823 Drivers 25 0.72 58 1.12 1 1.00 31 0.73 114 0.81 229 0.85 0.75—0.9724 Postal workers 15 2.02 7 0.91 [0.10] 0.00 7 0.94 44 1.50 73 1.40 1.10—1.7625 Textile workers 3 0.54 3 0.67 1 6.03 12 1.74 27 1.08 46 1.09 0.80—1.4526 Shoe and leather workers 3 2.29 2 1.04 [0.03] 0.00 4 1.53 7 0.85 16 1.13 0.65—1.8427 Smelting workers 8 0.57 2 0.28 [0.26] 0.00 11 1.05 34 0.78 55 0.73 0.55—0.9528 Mechanics 28 0.75 45 0.85 [1.16] 0.00 39 0.65 209 0.83 321 0.80 0.71—0.8929 Plumbers 1 0.29 2 0.22 [0.17] 0.00 8 1.10 21 0.73 32 0.66 0.45—0.9330 Welders – – 7 0.72 [0.07] 0.00 8 0.89 23 0.62 38 0.68 0.48—0.9331 Electrical workers 10 1.06 22 0.93 [0.75] 0.00 28 1.04 109 1.15 169 1.09 0.93—1.2632 Wood workers 22 0.88 36 0.76 [0.54] 0.00 51 0.89 101 0.75 210 0.79 0.69—0.9133 Painters 9 1.09 8 0.75 [0.21] 0.00 6 0.62 36 0.87 59 0.84 0.64—1.0834 "Other construction workers" 21 0.74 22 0.72 2 1.56 10 0.77 50 0.69 105 0.72 0.60—0.8735 Bricklayers 10 1.11 7 1.43 – – 2 0.35 15 0.88 34 0.93 0.64—1.3036 Printers 14 2.28 4 0.69 [0.21] 0.00 8 1.15 37 1.38 63 1.37 1.06—1.7637 Chemical process workers 3 0.61 7 0.81 [0.08] 0.00 10 0.83 23 0.72 43 0.75 0.54—1.0138 Food workers 8 0.47 5 0.82 [0.75] 0.00 16 1.10 31 0.89 60 0.82 0.63—1.0639 Beverage workers 2 1.05 [0.37] 0.00 [0.01] 0.00 [0.33] 0.00 [1.72] 0.00 2 0.46 0.06—1.6640 Tobacco workers [0.28] 0.00 [0.07] 0.00 [0.00] 0.00 [0.19] 0.00 [0.18] 0.00 [0.73] 0.00 0.00—5.0441 Glass makers etc 7 0.73 9 0.99 1 6.78 7 0.86 26 0.67 50 0.76 0.56—1.0042 Packers 4 0.49 18 1.04 1 2.40 16 0.75 40 0.63 79 0.72 0.57—0.8943 Engine operators 5 0.54 24 0.91 [0.76] 0.00 12 0.74 53 0.79 94 0.79 0.64—0.9644 Public safety workers 12 1.43 9 0.62 [0.46] 0.00 14 1.40 52 1.24 87 1.15 0.92—1.4245 Cooks and stewards [0.70] 0.00 [1.13] 0.00 [0.28] 0.00 6 1.12 8 0.92 14 0.87 0.47—1.4546 Domestic assistants [0.01] 0.00 [0.05] 0.00 [0.00] 0.00 [0.06] 0.00 [1.25] 0.00 [1.37] 0.00 0.00—2.6947 Waiters 3 2.30 1 0.87 [0.04] 0.00 2 0.96 3 0.69 9 1.00 0.46—1.9148 Building caretakers 6 0.72 9 0.80 [0.13] 0.00 4 0.76 20 0.73 39 0.75 0.53—1.0249 Chimney sweeps [0.24] 0.00 [0.82] 0.00 – – [0.52] 0.00 4 1.75 4 1.03 0.28—2.6450 Hairdressers 2 0.83 [0.24] 0.00 [0.04] 0.00 1 0.71 11 1.72 14 1.33 0.73—2.2451 Launderers [1.19] 0.00 [0.25] 0.00 [0.01] 0.00 1 1.23 1 0.22 2 0.29 0.04—1.0552 Military personnel 5 0.94 9 1.59 – – 6 0.60 29 1.16 49 1.07 0.79—1.4153 "Other workers" 21 0.80 7 0.53 [1.65] 0.00 34 0.90 64 0.85 126 0.82 0.68—0.9754 Economically inactive 16 0.86 48 0.80 2 1.41 16 0.76 78 0.57 160 0.67 0.58—0.79
1-54 All categories 658 1.00 839 1.00 23 1.00 862 1.00 2872 1.00 5254 1.00 # REF. #
Obs = observed number of cases; SIR = standardised incidence ratio; 95% CI = 95% confidence interval
80 Index Prev Next

Acta Oncologica - Pukkala et al, 2008 Skin melanoma, upper limbs
Observed number of skin melanoma, upper limbs among women in the Nordic countries and standardised incidence ratios 1961-2005,by country and occupational category
Denmark Finland Iceland Norway Sweden Total
No Occupational category Obs SIR Obs SIR Obs SIR Obs SIR Obs SIR Obs SIR 95% CI
1 Technical workers, etc 6 1.49 11 1.23 [0.15] 0.00 6 1.88 16 0.68 39 0.98 0.70—1.342 Laboratory assistants 4 1.29 1 0.21 [0.20] 0.00 5 1.38 6 0.60 16 0.74 0.42—1.213 Physicians 5 3.67 6 2.60 [0.03] 0.00 1 0.69 2 0.32 14 1.23 0.67—2.064 Dentists 2 1.68 4 2.18 [0.01] 0.00 1 0.89 6 1.56 13 1.62 0.86—2.775 Nurses 20 0.86 29 1.22 1 1.24 25 0.86 84 1.27 159 1.11 0.95—1.296 Assistant nurses 16 0.91 16 0.74 [1.05] 0.00 25 0.87 112 0.89 169 0.87 0.75—1.017 "Other health workers" 23 1.70 22 1.22 [0.25] 0.00 34 1.26 43 0.97 122 1.18 0.99—1.418 Teachers 54 1.76 58 1.46 3 1.91 76 1.44 200 1.31 391 1.41 1.28—1.569 Religious workers etc 5 1.22 25 1.03 1 4.38 21 1.60 70 1.17 122 1.20 1.00—1.4310 Artistic workers 2 1.03 2 0.57 [0.16] 0.00 3 0.80 10 0.99 17 0.87 0.51—1.3911 Journalists 1 2.24 4 1.85 [0.05] 0.00 1 0.92 8 1.63 14 1.62 0.89—2.7212 Administrators 10 0.85 10 1.35 [0.09] 0.00 15 1.25 24 1.06 59 1.09 0.83—1.4113 Clerical workers 137 1.11 159 1.19 4 0.96 205 1.26 442 1.23 947 1.21 1.13—1.2914 Sales agents 1 0.92 17 1.01 [0.37] 0.00 30 1.65 36 0.84 84 1.06 0.84—1.3115 Shop workers 85 1.07 51 0.82 3 1.31 126 1.01 164 0.94 429 0.97 0.88—1.0616 Farmers 63 1.09 26 0.89 1 0.66 85 1.14 16 0.96 191 1.06 0.92—1.2217 Gardeners 7 0.94 97 1.08 [0.05] 0.00 43 0.94 42 0.99 189 1.02 0.88—1.1818 Fishermen [0.30] 0.00 [0.23] 0.00 [0.07] 0.00 [0.67] 0.00 [0.16] 0.00 [1.43] 0.00 0.00—2.5819 Forestry workers [0.08] 0.00 [0.47] 0.00 [0.01] 0.00 1 1.06 [1.09] 0.00 1 0.39 0.01—2.1520 Miners and quarry workers [0.00] 0.00 [0.16] 0.00 [0.00] 0.00 [0.06] 0.00 [0.30] 0.00 [0.52] 0.00 0.00—7.0821 Seamen – – [0.08] 0.00 [0.00] 0.00 [0.16] 0.00 [0.06] 0.00 [0.30] 0.00 0.00—12.2722 Transport workers [0.08] 0.00 [2.63] 0.00 [0.06] 0.00 1 1.27 [3.53] 0.00 1 0.14 0.00—0.7923 Drivers 1 0.49 2 1.23 [0.03] 0.00 5 1.85 9 0.95 17 1.07 0.63—1.7224 Postal workers 3 0.72 21 1.18 1 1.49 26 0.87 56 1.03 107 1.00 0.83—1.2125 Textile workers 25 0.94 32 0.83 1 0.86 45 1.12 89 1.04 192 1.00 0.87—1.1526 Shoe and leather workers 1 0.50 7 1.45 [0.07] 0.00 3 1.01 2 0.30 13 0.79 0.42—1.3427 Smelting workers [0.48] 0.00 2 1.80 [0.00] 0.00 [0.45] 0.00 3 1.10 5 1.05 0.34—2.4528 Mechanics 6 1.21 3 0.54 [0.01] 0.00 3 0.74 21 0.82 33 0.82 0.56—1.1529 Plumbers [0.04] 0.00 [0.02] 0.00 – – [0.03] 0.00 [0.06] 0.00 [0.15] 0.00 0.00—24.8030 Welders – – [0.50] 0.00 [0.00] 0.00 [0.38] 0.00 2 1.55 2 0.92 0.11—3.3331 Electrical workers 2 0.29 3 0.69 [0.01] 0.00 7 1.52 12 0.81 24 0.78 0.50—1.1632 Wood workers 4 1.75 10 1.07 [0.02] 0.00 [1.58] 0.00 2 0.43 16 0.89 0.51—1.4533 Painters [0.08] 0.00 1 0.84 [0.01] 0.00 2 5.66 1 0.87 4 1.44 0.39—3.6834 "Other construction workers" [0.06] 0.00 1 0.30 [0.00] 0.00 1 7.22 [0.21] 0.00 2 0.54 0.06—1.9435 Bricklayers [0.01] 0.00 [0.14] 0.00 – – [0.01] 0.00 [0.01] 0.00 [0.17] 0.00 0.00—22.0436 Printers 5 2.00 9 1.69 [0.12] 0.00 1 0.26 9 0.91 24 1.11 0.71—1.6537 Chemical process workers 7 1.80 4 1.59 [0.04] 0.00 3 0.89 6 0.82 20 1.17 0.71—1.8038 Food workers 12 0.61 14 1.10 2 0.71 14 0.69 15 0.79 57 0.76 0.58—0.9939 Beverage workers [1.73] 0.00 1 1.49 [0.00] 0.00 [0.21] 0.00 [1.11] 0.00 1 0.27 0.01—1.5040 Tobacco workers 1 0.41 [0.39] 0.00 – – [0.66] 0.00 [0.86] 0.00 1 0.23 0.01—1.2941 Glass makers etc 5 1.04 6 0.64 [0.08] 0.00 7 0.94 22 1.10 40 0.96 0.68—1.3142 Packers 3 2.19 18 1.09 1 4.37 17 0.97 22 0.77 61 0.95 0.73—1.2243 Engine operators [0.04] 0.00 [2.80] 0.00 [0.00] 0.00 [0.32] 0.00 1 0.37 1 0.17 0.00—0.9444 Public safety workers [0.12] 0.00 1 1.39 [0.06] 0.00 6 2.88 4 0.99 11 1.57 0.78—2.8145 Cooks and stewards [0.05] 0.00 14 0.74 1 1.08 26 1.22 38 1.07 79 1.03 0.82—1.2946 Domestic assistants 21 0.70 19 0.86 [0.24] 0.00 43 0.74 130 1.01 213 0.89 0.78—1.0247 Waiters 5 0.99 18 1.04 [0.11] 0.00 20 0.76 35 0.90 78 0.89 0.70—1.1148 Building caretakers 70 0.82 46 0.76 3 1.55 84 0.73 79 0.70 282 0.75 0.67—0.8449 Chimney sweeps [0.01] 0.00 [0.03] 0.00 – – [0.02] 0.00 [0.01] 0.00 [0.06] 0.00 0.00—61.1050 Hairdressers 3 0.56 3 0.45 [0.18] 0.00 7 0.98 18 0.85 31 0.77 0.52—1.0951 Launderers 9 0.93 4 0.90 [0.27] 0.00 9 1.02 19 1.06 41 1.00 0.72—1.3552 Military personnel 1 20.07 [0.09] 0.00 – – [0.04] 0.00 [0.16] 0.00 1 2.91 0.07—16.1953 "Other workers" 20 0.82 24 1.17 [2.07] 0.00 55 0.92 42 0.79 141 0.88 0.75—1.0454 Economically inactive 581 0.97 339 0.95 10 1.29 567 0.93 1876 0.98 3373 0.97 0.94—1.00
1-54 All categories 1226 1.00 1140 1.00 32 1.00 1655 1.00 3794 1.00 7847 1.00 # REF. #
Obs = observed number of cases; SIR = standardised incidence ratio; 95% CI = 95% confidence interval
81 Index Prev Next

Acta Oncologica - Pukkala et al, 2008 Non-melanoma skin cancer
Observed number of non-melanoma skin cancer among men in the Nordic countries and standardised incidence ratios 1961-2005, bycountry and occupational category
Denmark Finland Iceland Norway Sweden Total
No Occupational category Obs SIR Obs SIR Obs SIR Obs SIR Obs SIR Obs SIR 95% CI
1 Technical workers, etc – – 448 1.18 5 1.08 526 1.16 2946 1.10 3925 1.12 1.09—1.162 Laboratory assistants – – 7 0.81 1 1.19 27 1.23 10 1.12 45 1.11 0.81—1.493 Physicians – – 32 1.47 [1.96] 0.00 126 1.98 206 1.75 364 1.77 1.60—1.974 Dentists – – 2 0.41 [0.44] 0.00 30 1.08 88 1.47 120 1.29 1.08—1.545 Nurses – – 1 1.07 [0.01] 0.00 2 1.03 10 2.42 13 1.85 0.99—3.176 Assistant nurses – – 2 3.12 [0.21] 0.00 11 1.01 57 1.50 70 1.41 1.10—1.787 "Other health workers" – – 24 1.08 1 1.80 23 0.99 118 1.15 166 1.12 0.96—1.308 Teachers – – 163 1.00 5 0.72 405 1.21 817 1.24 1390 1.19 1.13—1.269 Religious workers etc – – 97 1.15 3 0.63 221 1.25 663 1.32 984 1.28 1.21—1.3710 Artistic workers – – 30 0.97 [1.29] 0.00 71 1.38 154 0.97 255 1.05 0.93—1.1911 Journalists – – 12 0.79 3 4.20 21 0.96 77 1.07 113 1.03 0.85—1.2412 Administrators – – 345 1.30 17 1.32 874 1.38 1410 1.29 2646 1.32 1.27—1.3713 Clerical workers – – 195 1.11 12 0.81 520 1.13 1372 1.23 2099 1.19 1.14—1.2414 Sales agents – – 247 1.04 5 0.68 631 1.17 1860 1.16 2743 1.15 1.11—1.1915 Shop workers – – 86 0.91 3 0.59 204 1.02 525 1.03 818 1.01 0.94—1.0816 Farmers – – 1432 1.03 19 0.84 1521 0.93 2830 0.93 5802 0.95 0.93—0.9817 Gardeners – – 148 0.85 2 2.86 368 0.95 952 0.90 1470 0.90 0.86—0.9518 Fishermen – – 16 0.90 7 0.66 280 0.58 166 1.45 469 0.75 0.69—0.8219 Forestry workers – – 132 0.68 [0.10] 0.00 252 0.87 446 0.59 830 0.67 0.62—0.7120 Miners and quarry workers – – 37 1.22 [0.18] 0.00 78 1.04 147 0.82 262 0.92 0.82—1.0421 Seamen – – 46 1.09 4 1.25 416 1.12 238 1.51 704 1.23 1.14—1.3222 Transport workers – – 182 1.37 5 0.73 214 1.05 609 1.05 1010 1.09 1.03—1.1623 Drivers – – 348 0.92 7 0.77 485 0.91 1195 0.93 2035 0.93 0.89—0.9724 Postal workers – – 63 1.03 1 0.75 87 0.84 328 1.12 479 1.05 0.96—1.1425 Textile workers – – 37 0.85 5 2.12 99 0.80 345 1.01 486 0.95 0.87—1.0426 Shoe and leather workers – – 16 0.83 [0.52] 0.00 43 0.85 140 1.03 199 0.97 0.84—1.1127 Smelting workers – – 58 0.91 3 0.99 133 0.86 381 0.73 575 0.78 0.71—0.8428 Mechanics – – 366 0.97 14 1.59 660 0.89 2120 0.89 3160 0.90 0.87—0.9429 Plumbers – – 54 0.90 3 2.03 76 0.92 269 1.00 402 0.97 0.88—1.0730 Welders – – 51 0.98 [0.49] 0.00 97 1.04 255 0.85 403 0.90 0.82—1.0031 Electrical workers – – 153 1.01 4 0.79 335 1.02 799 1.00 1291 1.01 0.96—1.0732 Wood workers – – 417 0.92 4 0.72 849 0.91 1415 0.84 2685 0.87 0.84—0.9133 Painters – – 72 0.81 [2.18] 0.00 124 0.84 414 0.87 610 0.85 0.79—0.9234 "Other construction workers" – – 223 0.81 12 1.16 158 0.94 788 0.90 1181 0.89 0.84—0.9435 Bricklayers – – 36 0.78 – – 75 0.84 188 0.87 299 0.85 0.76—0.9536 Printers – – 43 1.19 2 1.18 103 1.21 268 1.10 416 1.14 1.03—1.2537 Chemical process workers – – 79 1.23 [0.97] 0.00 179 0.91 331 0.85 589 0.90 0.83—0.9838 Food workers – – 35 0.74 10 1.12 189 0.84 401 0.99 635 0.93 0.86—1.0039 Beverage workers – – 5 1.44 [0.16] 0.00 2 1.04 16 0.75 23 0.85 0.54—1.2840 Tobacco workers – – 3 5.11 [0.01] 0.00 4 1.24 1 0.58 8 1.44 0.62—2.8441 Glass makers etc – – 58 0.87 3 2.02 113 1.07 413 0.96 587 0.97 0.90—1.0642 Packers – – 135 0.92 5 0.97 270 0.82 748 0.97 1158 0.93 0.87—0.9843 Engine operators – – 200 1.10 11 1.77 169 0.94 589 0.95 969 0.98 0.92—1.0444 Public safety workers – – 124 1.12 7 1.51 178 1.21 479 1.30 788 1.25 1.16—1.3445 Cooks and stewards – – 3 0.48 1 0.50 37 0.61 54 0.88 95 0.73 0.59—0.8946 Domestic assistants – – [0.75] 0.00 [0.00] 0.00 [0.52] 0.00 4 0.92 4 0.71 0.19—1.8247 Waiters – – 3 0.54 [0.21] 0.00 23 0.87 40 1.29 66 1.04 0.81—1.3348 Building caretakers – – 92 0.92 1 0.43 92 1.27 274 0.92 459 0.97 0.89—1.0649 Chimney sweeps – – 10 1.50 – – 7 0.97 18 0.89 35 1.02 0.71—1.4350 Hairdressers – – [1.78] 0.00 [0.29] 0.00 24 1.13 84 1.03 108 1.03 0.85—1.2551 Launderers – – 7 3.53 [0.22] 0.00 16 1.24 55 0.96 78 1.08 0.85—1.3552 Military personnel – – 41 1.32 – – 150 1.24 309 1.32 500 1.29 1.19—1.4153 "Other workers" – – 95 0.84 27 1.41 690 1.07 851 0.90 1663 0.96 0.92—1.0154 Economically inactive – – 611 0.96 11 0.86 259 0.85 1125 0.89 2006 0.91 0.87—0.95
1-54 All categories – – 7122 1.00 223 1.00 12547 1.00 30398 1.00 50290 1.00 # REF. #
Obs = observed number of cases; SIR = standardised incidence ratio; 95% CI = 95% confidence interval
82 Index Prev Next
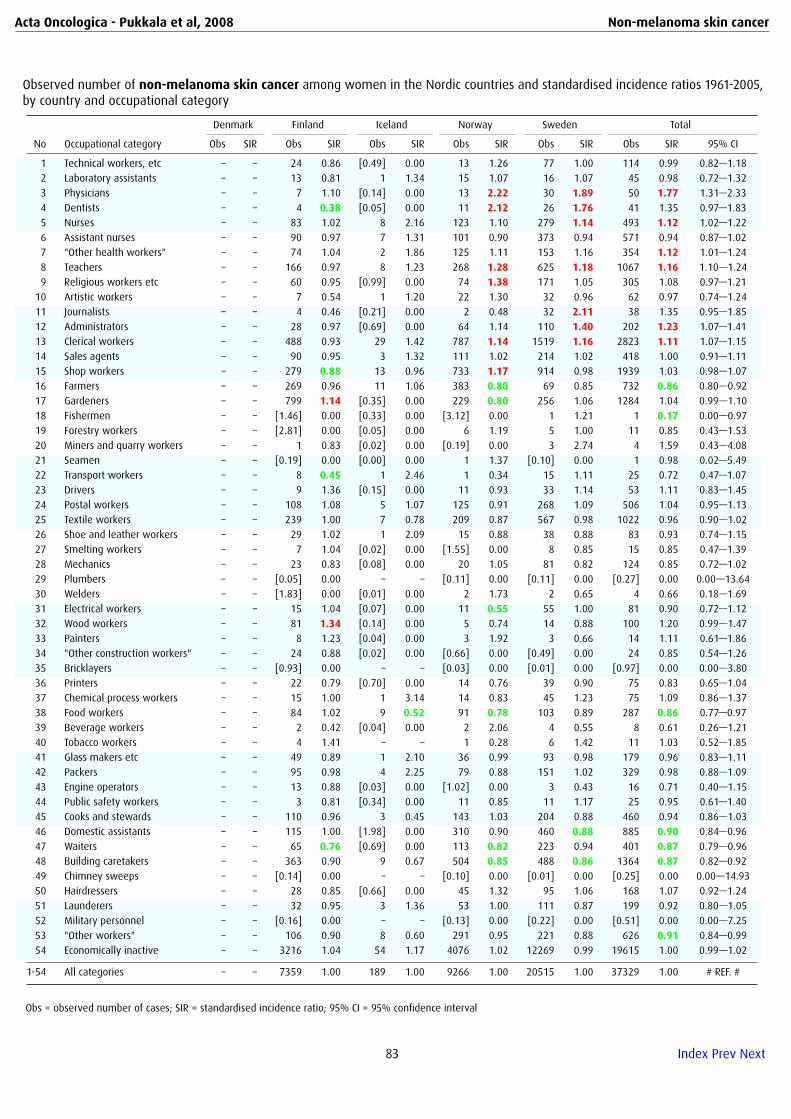
Acta Oncologica - Pukkala et al, 2008 Non-melanoma skin cancer
Observed number of non-melanoma skin cancer among women in the Nordic countries and standardised incidence ratios 1961-2005,by country and occupational category
Denmark Finland Iceland Norway Sweden Total
No Occupational category Obs SIR Obs SIR Obs SIR Obs SIR Obs SIR Obs SIR 95% CI
1 Technical workers, etc – – 24 0.86 [0.49] 0.00 13 1.26 77 1.00 114 0.99 0.82—1.182 Laboratory assistants – – 13 0.81 1 1.34 15 1.07 16 1.07 45 0.98 0.72—1.323 Physicians – – 7 1.10 [0.14] 0.00 13 2.22 30 1.89 50 1.77 1.31—2.334 Dentists – – 4 0.38 [0.05] 0.00 11 2.12 26 1.76 41 1.35 0.97—1.835 Nurses – – 83 1.02 8 2.16 123 1.10 279 1.14 493 1.12 1.02—1.226 Assistant nurses – – 90 0.97 7 1.31 101 0.90 373 0.94 571 0.94 0.87—1.027 "Other health workers" – – 74 1.04 2 1.86 125 1.11 153 1.16 354 1.12 1.01—1.248 Teachers – – 166 0.97 8 1.23 268 1.28 625 1.18 1067 1.16 1.10—1.249 Religious workers etc – – 60 0.95 [0.99] 0.00 74 1.38 171 1.05 305 1.08 0.97—1.2110 Artistic workers – – 7 0.54 1 1.20 22 1.30 32 0.96 62 0.97 0.74—1.2411 Journalists – – 4 0.46 [0.21] 0.00 2 0.48 32 2.11 38 1.35 0.95—1.8512 Administrators – – 28 0.97 [0.69] 0.00 64 1.14 110 1.40 202 1.23 1.07—1.4113 Clerical workers – – 488 0.93 29 1.42 787 1.14 1519 1.16 2823 1.11 1.07—1.1514 Sales agents – – 90 0.95 3 1.32 111 1.02 214 1.02 418 1.00 0.91—1.1115 Shop workers – – 279 0.88 13 0.96 733 1.17 914 0.98 1939 1.03 0.98—1.0716 Farmers – – 269 0.96 11 1.06 383 0.80 69 0.85 732 0.86 0.80—0.9217 Gardeners – – 799 1.14 [0.35] 0.00 229 0.80 256 1.06 1284 1.04 0.99—1.1018 Fishermen – – [1.46] 0.00 [0.33] 0.00 [3.12] 0.00 1 1.21 1 0.17 0.00—0.9719 Forestry workers – – [2.81] 0.00 [0.05] 0.00 6 1.19 5 1.00 11 0.85 0.43—1.5320 Miners and quarry workers – – 1 0.83 [0.02] 0.00 [0.19] 0.00 3 2.74 4 1.59 0.43—4.0821 Seamen – – [0.19] 0.00 [0.00] 0.00 1 1.37 [0.10] 0.00 1 0.98 0.02—5.4922 Transport workers – – 8 0.45 1 2.46 1 0.34 15 1.11 25 0.72 0.47—1.0723 Drivers – – 9 1.36 [0.15] 0.00 11 0.93 33 1.14 53 1.11 0.83—1.4524 Postal workers – – 108 1.08 5 1.07 125 0.91 268 1.09 506 1.04 0.95—1.1325 Textile workers – – 239 1.00 7 0.78 209 0.87 567 0.98 1022 0.96 0.90—1.0226 Shoe and leather workers – – 29 1.02 1 2.09 15 0.88 38 0.88 83 0.93 0.74—1.1527 Smelting workers – – 7 1.04 [0.02] 0.00 [1.55] 0.00 8 0.85 15 0.85 0.47—1.3928 Mechanics – – 23 0.83 [0.08] 0.00 20 1.05 81 0.82 124 0.85 0.72—1.0229 Plumbers – – [0.05] 0.00 – – [0.11] 0.00 [0.11] 0.00 [0.27] 0.00 0.00—13.6430 Welders – – [1.83] 0.00 [0.01] 0.00 2 1.73 2 0.65 4 0.66 0.18—1.6931 Electrical workers – – 15 1.04 [0.07] 0.00 11 0.55 55 1.00 81 0.90 0.72—1.1232 Wood workers – – 81 1.34 [0.14] 0.00 5 0.74 14 0.88 100 1.20 0.99—1.4733 Painters – – 8 1.23 [0.04] 0.00 3 1.92 3 0.66 14 1.11 0.61—1.8634 "Other construction workers" – – 24 0.88 [0.02] 0.00 [0.66] 0.00 [0.49] 0.00 24 0.85 0.54—1.2635 Bricklayers – – [0.93] 0.00 – – [0.03] 0.00 [0.01] 0.00 [0.97] 0.00 0.00—3.8036 Printers – – 22 0.79 [0.70] 0.00 14 0.76 39 0.90 75 0.83 0.65—1.0437 Chemical process workers – – 15 1.00 1 3.14 14 0.83 45 1.23 75 1.09 0.86—1.3738 Food workers – – 84 1.02 9 0.52 91 0.78 103 0.89 287 0.86 0.77—0.9739 Beverage workers – – 2 0.42 [0.04] 0.00 2 2.06 4 0.55 8 0.61 0.26—1.2140 Tobacco workers – – 4 1.41 – – 1 0.28 6 1.42 11 1.03 0.52—1.8541 Glass makers etc – – 49 0.89 1 2.10 36 0.99 93 0.98 179 0.96 0.83—1.1142 Packers – – 95 0.98 4 2.25 79 0.88 151 1.02 329 0.98 0.88—1.0943 Engine operators – – 13 0.88 [0.03] 0.00 [1.02] 0.00 3 0.43 16 0.71 0.40—1.1544 Public safety workers – – 3 0.81 [0.34] 0.00 11 0.85 11 1.17 25 0.95 0.61—1.4045 Cooks and stewards – – 110 0.96 3 0.45 143 1.03 204 0.88 460 0.94 0.86—1.0346 Domestic assistants – – 115 1.00 [1.98] 0.00 310 0.90 460 0.88 885 0.90 0.84—0.9647 Waiters – – 65 0.76 [0.69] 0.00 113 0.82 223 0.94 401 0.87 0.79—0.9648 Building caretakers – – 363 0.90 9 0.67 504 0.85 488 0.86 1364 0.87 0.82—0.9249 Chimney sweeps – – [0.14] 0.00 – – [0.10] 0.00 [0.01] 0.00 [0.25] 0.00 0.00—14.9350 Hairdressers – – 28 0.85 [0.66] 0.00 45 1.32 95 1.06 168 1.07 0.92—1.2451 Launderers – – 32 0.95 3 1.36 53 1.00 111 0.87 199 0.92 0.80—1.0552 Military personnel – – [0.16] 0.00 – – [0.13] 0.00 [0.22] 0.00 [0.51] 0.00 0.00—7.2553 "Other workers" – – 106 0.90 8 0.60 291 0.95 221 0.88 626 0.91 0.84—0.9954 Economically inactive – – 3216 1.04 54 1.17 4076 1.02 12269 0.99 19615 1.00 0.99—1.02
1-54 All categories – – 7359 1.00 189 1.00 9266 1.00 20515 1.00 37329 1.00 # REF. #
Obs = observed number of cases; SIR = standardised incidence ratio; 95% CI = 95% confidence interval
83 Index Prev Next

Acta Oncologica - Pukkala et al, 2008 Non-melanoma skin cancer, upper limbs
Observed number of non-melanoma skin cancer, upper limbs among men in the Nordic countries and standardised incidence ratios1961-2005, by country and occupational category
Denmark Finland Iceland Norway Sweden Total
No Occupational category Obs SIR Obs SIR Obs SIR Obs SIR Obs SIR Obs SIR 95% CI
1 Technical workers, etc – – 30 0.96 [0.41] 0.00 41 1.06 349 1.19 420 1.16 1.05—1.272 Laboratory assistants – – [0.74] 0.00 [0.08] 0.00 4 2.12 2 1.63 6 1.53 0.56—3.333 Physicians – – 4 2.24 [0.19] 0.00 20 3.71 28 2.12 52 2.52 1.89—3.314 Dentists – – [0.39] 0.00 [0.04] 0.00 3 1.27 14 2.12 17 1.81 1.05—2.905 Nurses – – 1 10.63 [0.00] 0.00 [0.17] 0.00 4 6.23 5 5.50 1.79—12.836 Assistant nurses – – [0.08] 0.00 [0.02] 0.00 1 1.08 1 0.23 2 0.37 0.04—1.347 "Other health workers" – – 3 1.70 [0.05] 0.00 1 0.50 10 0.89 14 0.93 0.51—1.578 Teachers – – 13 0.98 [0.64] 0.00 32 1.11 92 1.23 137 1.17 0.99—1.389 Religious workers etc – – 5 0.71 [0.43] 0.00 11 0.72 58 1.03 74 0.94 0.73—1.1710 Artistic workers – – 2 0.79 [0.12] 0.00 7 1.59 21 1.20 30 1.22 0.82—1.7411 Journalists – – 1 0.82 1 15.25 [1.89] 0.00 7 0.87 9 0.81 0.37—1.5312 Administrators – – 23 1.11 [1.19] 0.00 60 1.10 120 1.05 203 1.06 0.93—1.2213 Clerical workers – – 15 1.11 [1.34] 0.00 36 0.91 135 1.12 186 1.06 0.92—1.2314 Sales agents – – 20 1.07 1 1.50 44 0.94 181 1.04 246 1.03 0.91—1.1615 Shop workers – – 7 0.89 [0.45] 0.00 10 0.58 51 0.91 68 0.83 0.65—1.0516 Farmers – – 81 0.82 3 1.44 122 0.86 301 0.99 507 0.93 0.85—1.0117 Gardeners – – 15 1.13 [0.06] 0.00 40 1.19 110 1.00 165 1.05 0.90—1.2218 Fishermen – – 1 0.79 [0.94] 0.00 21 0.50 21 1.79 43 0.77 0.55—1.0319 Forestry workers – – 12 0.79 [0.01] 0.00 25 0.99 35 0.44 72 0.60 0.47—0.7620 Miners and quarry workers – – 2 0.84 [0.02] 0.00 8 1.22 21 1.11 31 1.11 0.75—1.5721 Seamen – – 4 1.22 1 3.47 62 1.93 31 1.83 98 1.86 1.51—2.2722 Transport workers – – 20 1.96 [0.62] 0.00 21 1.18 61 0.99 102 1.13 0.93—1.3723 Drivers – – 38 1.24 1 1.22 43 0.93 113 0.80 195 0.89 0.78—1.0324 Postal workers – – 7 1.46 [0.12] 0.00 9 0.98 41 1.30 57 1.25 0.95—1.6225 Textile workers – – 2 0.62 1 4.81 7 0.65 37 1.04 47 0.95 0.70—1.2626 Shoe and leather workers – – 1 0.71 [0.04] 0.00 4 0.90 11 0.80 16 0.82 0.47—1.3227 Smelting workers – – 5 1.04 [0.28] 0.00 17 1.25 35 0.64 57 0.78 0.59—1.0128 Mechanics – – 39 1.29 2 2.58 62 0.96 257 0.99 360 1.01 0.92—1.1329 Plumbers – – 6 1.22 [0.13] 0.00 4 0.55 26 0.88 36 0.86 0.60—1.1930 Welders – – 3 0.66 [0.05] 0.00 6 0.75 29 0.86 38 0.82 0.58—1.1231 Electrical workers – – 9 0.72 1 2.19 23 0.81 83 0.93 116 0.89 0.74—1.0732 Wood workers – – 33 0.97 1 2.03 83 1.03 161 0.92 278 0.96 0.85—1.0833 Painters – – 7 1.02 [0.20] 0.00 11 0.85 37 0.74 55 0.78 0.59—1.0234 "Other construction workers" – – 21 1.00 1 1.09 18 1.21 89 0.97 129 1.01 0.85—1.2035 Bricklayers – – 3 0.86 – – 8 1.03 22 0.97 33 0.97 0.67—1.3736 Printers – – 6 2.02 [0.15] 0.00 4 0.54 27 1.01 37 0.99 0.70—1.3737 Chemical process workers – – 5 0.97 [0.08] 0.00 22 1.27 40 0.98 67 1.06 0.82—1.3438 Food workers – – 3 0.80 1 1.29 10 0.51 29 0.68 43 0.64 0.46—0.8639 Beverage workers – – 1 3.88 [0.01] 0.00 [0.17] 0.00 2 0.89 3 1.12 0.23—3.2740 Tobacco workers – – 1 21.90 [0.00] 0.00 [0.29] 0.00 [0.19] 0.00 1 1.90 0.05—10.5741 Glass makers etc – – 5 0.94 [0.13] 0.00 7 0.76 45 0.99 57 0.95 0.72—1.2342 Packers – – 9 0.80 [0.46] 0.00 19 0.65 90 1.12 118 0.97 0.81—1.1643 Engine operators – – 16 1.08 1 1.79 26 1.66 71 1.04 114 1.15 0.96—1.3844 Public safety workers – – 8 0.92 [0.42] 0.00 15 1.17 49 1.20 72 1.15 0.90—1.4545 Cooks and stewards – – [0.53] 0.00 [0.17] 0.00 6 1.13 8 1.15 14 1.08 0.59—1.8146 Domestic assistants – – [0.05] 0.00 [0.00] 0.00 [0.04] 0.00 [0.58] 0.00 [0.67] 0.00 0.00—5.4847 Waiters – – [0.48] 0.00 [0.02] 0.00 1 0.43 4 1.13 5 0.79 0.26—1.8348 Building caretakers – – 8 1.06 1 5.19 5 0.78 32 1.02 46 1.01 0.74—1.3549 Chimney sweeps – – [0.51] 0.00 – – 1 1.56 1 0.44 2 0.59 0.07—2.1250 Hairdressers – – [0.14] 0.00 [0.03] 0.00 2 1.07 11 1.30 13 1.24 0.66—2.1151 Launderers – – [0.15] 0.00 [0.02] 0.00 [1.13] 0.00 4 0.66 4 0.55 0.15—1.4052 Military personnel – – 7 2.56 – – 11 1.08 34 1.33 52 1.35 1.01—1.7753 "Other workers" – – 4 0.46 3 1.76 73 1.27 82 0.83 162 0.97 0.83—1.1454 Economically inactive – – 40 0.88 1 0.93 26 0.93 127 0.93 194 0.92 0.80—1.06
1-54 All categories – – 546 1.00 20 1.00 1092 1.00 3250 1.00 4908 1.00 # REF. #
Obs = observed number of cases; SIR = standardised incidence ratio; 95% CI = 95% confidence interval
84 Index Prev Next

Acta Oncologica - Pukkala et al, 2008 Non-melanoma skin cancer, upper limbs
Observed number of non-melanoma skin cancer, upper limbs among women in the Nordic countries and standardised incidenceratios 1961-2005, by country and occupational category
Denmark Finland Iceland Norway Sweden Total
No Occupational category Obs SIR Obs SIR Obs SIR Obs SIR Obs SIR Obs SIR 95% CI
1 Technical workers, etc – – 1 0.43 [0.06] 0.00 [1.16] 0.00 11 1.16 12 0.92 0.48—1.612 Laboratory assistants – – [1.34] 0.00 [0.09] 0.00 2 1.32 1 0.49 3 0.60 0.12—1.773 Physicians – – 1 1.82 [0.02] 0.00 3 4.87 2 0.98 6 1.86 0.68—4.054 Dentists – – 1 1.30 [0.01] 0.00 6 11.03 3 1.69 10 3.23 1.55—5.955 Nurses – – 4 0.58 1 2.12 14 1.15 35 1.18 54 1.10 0.83—1.436 Assistant nurses – – 6 0.79 [0.68] 0.00 11 0.89 43 0.88 60 0.86 0.66—1.117 "Other health workers" – – 4 0.68 [0.13] 0.00 12 0.99 20 1.22 36 1.04 0.73—1.448 Teachers – – 10 0.73 [0.80] 0.00 33 1.46 87 1.36 130 1.29 1.08—1.539 Religious workers etc – – 5 0.92 [0.12] 0.00 3 0.52 23 1.14 31 0.99 0.67—1.4010 Artistic workers – – [1.05] 0.00 [0.10] 0.00 3 1.69 4 0.98 7 1.00 0.40—2.0511 Journalists – – [0.70] 0.00 [0.02] 0.00 [0.45] 0.00 4 2.15 4 1.32 0.36—3.3712 Administrators – – 3 1.30 [0.09] 0.00 4 0.69 16 1.71 23 1.31 0.83—1.9713 Clerical workers – – 46 1.08 1 0.39 60 0.81 192 1.19 299 1.07 0.95—1.1914 Sales agents – – 5 0.69 [0.30] 0.00 9 0.82 15 0.63 29 0.69 0.46—0.9815 Shop workers – – 19 0.75 4 2.31 79 1.20 109 1.00 211 1.05 0.91—1.2016 Farmers – – 18 0.92 [1.33] 0.00 47 0.97 11 1.25 76 0.97 0.77—1.2217 Gardeners – – 51 0.96 [0.05] 0.00 38 1.32 36 1.28 125 1.13 0.95—1.3518 Fishermen – – [0.11] 0.00 [0.04] 0.00 [0.33] 0.00 [0.09] 0.00 [0.58] 0.00 0.00—6.3719 Forestry workers – – [0.21] 0.00 [0.01] 0.00 1 1.90 [0.59] 0.00 1 0.75 0.02—4.2020 Miners and quarry workers – – 1 11.52 [0.00] 0.00 [0.02] 0.00 [0.13] 0.00 1 4.10 0.10—22.8321 Seamen – – [0.02] 0.00 [0.00] 0.00 [0.08] 0.00 [0.01] 0.00 [0.11] 0.00 0.00—34.3222 Transport workers – – [1.42] 0.00 1 20.27 [0.32] 0.00 3 1.84 4 1.17 0.32—2.9923 Drivers – – 1 1.86 [0.02] 0.00 1 0.79 3 0.83 5 0.92 0.30—2.1524 Postal workers – – 11 1.39 [0.61] 0.00 19 1.31 27 0.91 57 1.08 0.82—1.4025 Textile workers – – 16 0.87 3 2.60 18 0.74 76 1.16 113 1.04 0.86—1.2526 Shoe and leather workers – – 1 0.45 [0.06] 0.00 1 0.58 2 0.40 4 0.45 0.12—1.1427 Smelting workers – – [0.53] 0.00 [0.00] 0.00 [0.18] 0.00 2 1.69 2 1.06 0.13—3.8228 Mechanics – – 2 0.92 [0.01] 0.00 1 0.50 7 0.58 10 0.62 0.30—1.1329 Plumbers – – [0.00] 0.00 – – [0.01] 0.00 [0.01] 0.00 [0.03] 0.00 0.00—115.1430 Welders – – [0.15] 0.00 [0.00] 0.00 1 7.56 [0.40] 0.00 1 1.46 0.04—8.1331 Electrical workers – – 3 2.49 [0.01] 0.00 [2.13] 0.00 6 0.88 9 0.89 0.41—1.6932 Wood workers – – 10 2.12 [0.02] 0.00 [0.73] 0.00 4 2.05 14 1.89 1.03—3.1633 Painters – – [0.51] 0.00 [0.00] 0.00 [0.17] 0.00 [0.55] 0.00 [1.23] 0.00 0.00—2.9934 "Other construction workers" – – 2 0.98 [0.00] 0.00 [0.07] 0.00 [0.06] 0.00 2 0.92 0.11—3.3335 Bricklayers – – [0.07] 0.00 – – [0.00] 0.00 [0.00] 0.00 [0.07] 0.00 0.00—51.7336 Printers – – 1 0.45 [0.09] 0.00 2 1.05 6 1.16 9 0.96 0.44—1.8237 Chemical process workers – – 2 1.71 [0.04] 0.00 [1.76] 0.00 7 1.64 9 1.24 0.57—2.3638 Food workers – – 3 0.47 2 0.91 13 1.09 12 0.92 30 0.90 0.60—1.2839 Beverage workers – – [0.36] 0.00 [0.01] 0.00 1 9.66 1 1.22 2 1.56 0.19—5.6240 Tobacco workers – – 1 4.66 – – [0.36] 0.00 [0.51] 0.00 1 0.92 0.02—5.1141 Glass makers etc – – 4 0.94 1 16.96 4 1.06 8 0.71 17 0.88 0.51—1.4042 Packers – – 8 1.06 1 4.45 7 0.75 23 1.34 39 1.13 0.81—1.5543 Engine operators – – 3 2.56 [0.00] 0.00 [0.12] 0.00 [0.92] 0.00 3 1.36 0.28—3.9744 Public safety workers – – [0.28] 0.00 [0.04] 0.00 1 0.76 2 1.69 3 1.06 0.22—3.1145 Cooks and stewards – – 6 0.69 [0.86] 0.00 15 1.09 22 0.86 43 0.88 0.64—1.1946 Domestic assistants – – 7 0.81 [0.25] 0.00 28 0.80 49 0.81 84 0.80 0.64—1.0047 Waiters – – 7 1.03 [0.09] 0.00 16 1.12 35 1.30 58 1.20 0.91—1.5648 Building caretakers – – 29 0.95 2 1.16 49 0.79 47 0.73 127 0.80 0.67—0.9549 Chimney sweeps – – [0.01] 0.00 – – [0.01] 0.00 [0.00] 0.00 [0.02] 0.00 0.00—154.9050 Hairdressers – – 3 1.16 [0.08] 0.00 2 0.56 11 1.02 16 0.94 0.54—1.5351 Launderers – – 5 1.96 [0.29] 0.00 5 0.93 13 0.92 23 1.03 0.65—1.5452 Military personnel – – [0.02] 0.00 – – [0.02] 0.00 [0.03] 0.00 [0.06] 0.00 0.00—62.9953 "Other workers" – – 9 0.99 [1.70] 0.00 16 0.50 18 0.62 43 0.60 0.43—0.8154 Economically inactive – – 238 1.10 8 1.38 413 1.06 1379 0.97 2038 1.00 0.96—1.05
1-54 All categories – – 547 1.00 24 1.00 938 1.00 2375 1.00 3884 1.00 # REF. #
Obs = observed number of cases; SIR = standardised incidence ratio; 95% CI = 95% confidence interval
85 Index Prev Next

Acta Oncologica - Pukkala et al, 2008 Eye cancer
Observed number of eye cancer among men in the Nordic countries and standardised incidence ratios 1961-2005, by country andoccupational category
Denmark Finland Iceland Norway Sweden Total
No Occupational category Obs SIR Obs SIR Obs SIR Obs SIR Obs SIR Obs SIR 95% CI
1 Technical workers, etc 46 1.03 39 0.96 1 2.58 39 1.24 172 1.02 297 1.04 0.93—1.172 Laboratory assistants [0.87] 0.00 1 0.97 [0.07] 0.00 4 2.72 1 0.99 6 1.35 0.49—2.933 Physicians 3 0.82 5 2.13 [0.13] 0.00 4 1.01 10 1.25 22 1.22 0.76—1.844 Dentists 2 1.83 [0.49] 0.00 [0.04] 0.00 3 1.73 6 1.60 11 1.55 0.77—2.775 Nurses [0.05] 0.00 [0.16] 0.00 [0.00] 0.00 [0.22] 0.00 [0.67] 0.00 [1.10] 0.00 0.00—3.356 Assistant nurses [1.07] 0.00 [0.15] 0.00 [0.02] 0.00 1 1.51 4 1.33 5 1.02 0.33—2.387 "Other health workers" 3 0.96 6 2.71 [0.04] 0.00 [1.55] 0.00 6 0.90 15 1.11 0.62—1.828 Teachers 26 1.30 16 0.96 1 1.91 21 0.93 44 0.99 108 1.04 0.86—1.259 Religious workers etc 6 0.74 8 0.85 [0.36] 0.00 13 1.14 32 0.89 59 0.91 0.69—1.1710 Artistic workers 2 0.80 [3.26] 0.00 [0.09] 0.00 4 1.21 12 1.16 18 0.92 0.55—1.4611 Journalists 4 3.38 2 1.28 [0.06] 0.00 2 1.35 5 1.02 13 1.41 0.75—2.4212 Administrators 47 0.96 28 1.15 1 1.17 51 1.30 57 0.92 184 1.05 0.91—1.2113 Clerical workers 27 1.23 17 1.07 [1.01] 0.00 34 1.15 67 0.99 145 1.06 0.90—1.2514 Sales agents 12 1.04 21 0.90 1 2.02 37 1.09 103 1.03 174 1.02 0.88—1.1915 Shop workers 53 1.08 10 0.97 [0.36] 0.00 12 0.88 30 0.94 105 1.00 0.82—1.2116 Farmers 88 0.94 105 1.02 2 1.41 98 1.10 175 1.13 468 1.06 0.97—1.1617 Gardeners 7 0.53 18 1.14 [0.05] 0.00 22 0.98 49 0.83 96 0.87 0.70—1.0618 Fishermen 2 0.44 3 2.18 [0.90] 0.00 25 0.86 8 1.28 38 0.90 0.64—1.2419 Forestry workers 5 2.61 14 0.75 [0.01] 0.00 12 0.73 35 0.81 66 0.82 0.64—1.0520 Miners and quarry workers 1 1.70 1 0.33 [0.01] 0.00 5 1.03 9 0.81 16 0.82 0.47—1.3321 Seamen 6 1.20 3 0.74 [0.24] 0.00 27 1.09 8 0.81 44 1.00 0.73—1.3422 Transport workers 15 1.44 12 1.07 [0.46] 0.00 17 1.32 47 1.45 91 1.35 1.09—1.6623 Drivers 26 0.75 38 0.98 3 4.48 27 0.75 90 1.07 184 0.95 0.82—1.1024 Postal workers 3 0.44 6 1.04 [0.09] 0.00 7 1.02 14 0.76 30 0.79 0.53—1.1325 Textile workers 6 0.99 1 0.27 [0.15] 0.00 5 0.70 18 0.94 30 0.83 0.56—1.1926 Shoe and leather workers 1 0.68 [1.61] 0.00 [0.03] 0.00 5 1.66 11 1.48 17 1.25 0.73—2.0127 Smelting workers 17 1.22 3 0.53 [0.20] 0.00 9 0.90 19 0.61 48 0.79 0.58—1.0528 Mechanics 36 0.96 41 1.07 [0.68] 0.00 46 0.92 173 1.15 296 1.07 0.95—1.2029 Plumbers 3 0.89 11 1.68 [0.11] 0.00 5 0.85 16 0.92 35 1.05 0.73—1.4630 Welders – – 9 1.39 [0.04] 0.00 4 0.59 23 1.13 36 1.07 0.75—1.4831 Electrical workers 3 0.33 16 0.96 [0.41] 0.00 18 0.81 61 1.15 98 0.97 0.78—1.1832 Wood workers 23 0.90 41 1.07 1 2.64 54 0.98 111 1.15 230 1.07 0.94—1.2133 Painters 9 1.07 10 1.18 [0.15] 0.00 6 0.64 30 1.06 55 1.00 0.76—1.3134 "Other construction workers" 33 1.06 28 1.10 1 1.26 12 1.05 44 0.84 118 0.97 0.81—1.1735 Bricklayers 10 1.07 4 1.00 – – 5 0.90 11 0.88 30 0.96 0.65—1.3736 Printers 3 0.50 2 0.49 [0.13] 0.00 5 0.85 18 1.13 28 0.87 0.58—1.2637 Chemical process workers 5 0.94 5 0.78 [0.07] 0.00 11 0.89 25 1.07 46 0.97 0.71—1.2938 Food workers 15 0.86 5 1.06 1 1.63 13 0.92 21 0.89 55 0.91 0.68—1.1839 Beverage workers [2.08] 0.00 1 3.37 [0.01] 0.00 [0.18] 0.00 1 0.75 2 0.51 0.06—1.8540 Tobacco workers [0.34] 0.00 [0.06] 0.00 [0.00] 0.00 [0.22] 0.00 [0.11] 0.00 [0.72] 0.00 0.00—5.1141 Glass makers etc 11 1.08 8 1.18 [0.11] 0.00 8 1.13 17 0.65 44 0.88 0.64—1.1842 Packers 10 1.12 15 1.09 [0.35] 0.00 24 1.12 36 0.77 85 0.93 0.74—1.1543 Engine operators 11 1.17 24 1.24 2 4.22 15 1.17 46 1.13 98 1.18 0.96—1.4444 Public safety workers 15 1.73 12 1.13 [0.33] 0.00 6 0.65 19 0.78 52 0.98 0.73—1.2845 Cooks and stewards 1 1.43 2 2.72 [0.16] 0.00 3 0.70 1 0.21 7 0.66 0.27—1.3746 Domestic assistants [0.01] 0.00 [0.04] 0.00 [0.00] 0.00 [0.04] 0.00 [0.52] 0.00 [0.61] 0.00 0.00—6.0647 Waiters 1 0.71 [0.72] 0.00 [0.02] 0.00 [1.81] 0.00 1 0.42 2 0.32 0.04—1.1448 Building caretakers 10 1.11 7 0.79 [0.15] 0.00 6 1.26 16 0.85 39 0.94 0.67—1.2849 Chimney sweeps [0.24] 0.00 [0.66] 0.00 – – 1 2.06 1 0.73 2 0.72 0.09—2.6250 Hairdressers 3 1.16 [0.19] 0.00 [0.02] 0.00 2 1.47 4 0.87 9 1.03 0.47—1.9551 Launderers 1 0.80 [0.19] 0.00 [0.01] 0.00 1 1.23 2 0.61 4 0.72 0.20—1.8552 Military personnel 2 0.43 5 1.33 – – 10 1.28 21 1.50 38 1.26 0.89—1.7253 "Other workers" 32 1.15 9 0.84 2 1.53 39 0.98 59 1.04 141 1.03 0.88—1.2254 Economically inactive 33 1.23 46 0.80 [1.02] 0.00 14 0.65 69 0.75 162 0.81 0.70—0.95
1-54 All categories 678 1.00 658 1.00 16 1.00 792 1.00 1858 1.00 4002 1.00 # REF. #
Obs = observed number of cases; SIR = standardised incidence ratio; 95% CI = 95% confidence interval
86 Index Prev Next

Acta Oncologica - Pukkala et al, 2008 Eye cancer
Observed number of eye cancer among women in the Nordic countries and standardised incidence ratios 1961-2005, by country andoccupational category
Denmark Finland Iceland Norway Sweden Total
No Occupational category Obs SIR Obs SIR Obs SIR Obs SIR Obs SIR Obs SIR 95% CI
1 Technical workers, etc 2 1.05 5 1.21 [0.04] 0.00 2 1.72 9 1.11 18 1.18 0.70—1.862 Laboratory assistants 1 0.70 3 1.29 [0.06] 0.00 2 1.45 2 0.77 8 1.03 0.44—2.023 Physicians 1 1.59 1 0.98 [0.01] 0.00 1 1.77 1 0.52 4 0.97 0.26—2.474 Dentists [0.55] 0.00 [1.00] 0.00 [0.00] 0.00 [0.46] 0.00 2 1.45 2 0.59 0.07—2.135 Nurses 6 0.54 19 1.60 [0.23] 0.00 15 1.41 17 0.72 57 0.99 0.75—1.296 Assistant nurses 9 1.09 14 1.18 [0.27] 0.00 12 1.14 45 1.06 80 1.09 0.86—1.367 "Other health workers" 5 0.79 10 1.06 [0.07] 0.00 12 1.15 20 1.38 47 1.15 0.85—1.548 Teachers 11 0.77 17 0.81 [0.46] 0.00 20 0.98 63 1.18 111 1.01 0.84—1.229 Religious workers etc 1 0.53 9 0.84 [0.07] 0.00 5 0.99 15 0.81 30 0.83 0.56—1.1810 Artistic workers 1 1.07 3 1.74 [0.04] 0.00 3 2.01 2 0.57 9 1.17 0.54—2.2311 Journalists 1 4.75 [1.11] 0.00 [0.01] 0.00 2 4.86 [1.64] 0.00 3 0.89 0.18—2.6012 Administrators 4 0.71 7 1.90 [0.03] 0.00 2 0.41 10 1.28 23 1.05 0.66—1.5713 Clerical workers 47 0.81 73 1.05 1 0.92 70 1.10 133 1.01 324 1.00 0.90—1.1214 Sales agents [0.51] 0.00 10 1.04 [0.11] 0.00 7 0.85 15 0.85 32 0.88 0.60—1.2515 Shop workers 38 1.01 33 0.91 1 1.67 57 1.13 89 1.17 218 1.08 0.95—1.2416 Farmers 37 1.37 22 1.10 [0.42] 0.00 32 1.00 9 1.27 100 1.15 0.95—1.4017 Gardeners 3 0.87 46 0.75 [0.01] 0.00 24 1.25 20 1.03 93 0.90 0.72—1.1018 Fishermen [0.14] 0.00 [0.14] 0.00 [0.02] 0.00 [0.26] 0.00 [0.06] 0.00 [0.62] 0.00 0.00—5.9419 Forestry workers [0.04] 0.00 [0.26] 0.00 [0.00] 0.00 [0.37] 0.00 [0.44] 0.00 [1.11] 0.00 0.00—3.3320 Miners and quarry workers [0.00] 0.00 [0.11] 0.00 [0.00] 0.00 [0.02] 0.00 [0.11] 0.00 [0.24] 0.00 0.00—15.2021 Seamen – – [0.04] 0.00 – – [0.06] 0.00 [0.02] 0.00 [0.11] 0.00 0.00—32.7522 Transport workers [0.04] 0.00 2 1.15 [0.01] 0.00 [0.30] 0.00 1 0.76 3 0.88 0.18—2.5823 Drivers 1 1.02 1 1.18 [0.01] 0.00 2 1.93 4 1.23 8 1.30 0.56—2.5724 Postal workers 2 1.00 14 1.30 [0.17] 0.00 8 0.66 23 1.03 47 0.99 0.73—1.3225 Textile workers 7 0.55 25 1.05 1 2.97 11 0.60 43 1.01 87 0.89 0.71—1.1026 Shoe and leather workers [0.95] 0.00 1 0.33 [0.02] 0.00 1 0.75 2 0.61 4 0.47 0.13—1.1927 Smelting workers [0.23] 0.00 1 1.43 [0.00] 0.00 1 6.23 [0.98] 0.00 2 0.96 0.12—3.4828 Mechanics 5 2.11 3 0.94 [0.00] 0.00 1 0.60 7 0.72 16 0.94 0.54—1.5329 Plumbers [0.02] 0.00 [0.01] 0.00 – – [0.01] 0.00 [0.02] 0.00 [0.06] 0.00 0.00—66.5330 Welders – – 1 3.82 [0.00] 0.00 [0.13] 0.00 [0.40] 0.00 1 1.25 0.03—6.9931 Electrical workers 8 2.43 5 2.33 [0.00] 0.00 1 0.54 1 0.18 15 1.17 0.66—1.9432 Wood workers [1.08] 0.00 3 0.49 [0.01] 0.00 [0.60] 0.00 2 1.21 5 0.53 0.17—1.2433 Painters [0.04] 0.00 [0.73] 0.00 [0.00] 0.00 [0.14] 0.00 [0.44] 0.00 [1.35] 0.00 0.00—2.7434 "Other construction workers" [0.03] 0.00 3 1.28 [0.00] 0.00 [0.05] 0.00 [0.06] 0.00 3 1.20 0.25—3.5135 Bricklayers [0.01] 0.00 [0.08] 0.00 – – [0.00] 0.00 [0.00] 0.00 [0.09] 0.00 0.00—41.7436 Printers 1 0.83 1 0.32 [0.03] 0.00 1 0.62 2 0.50 5 0.50 0.16—1.1737 Chemical process workers 1 0.54 2 1.27 [0.01] 0.00 [1.44] 0.00 4 1.28 7 0.87 0.35—1.8038 Food workers 10 1.08 5 0.62 [0.76] 0.00 5 0.56 6 0.67 26 0.72 0.47—1.0639 Beverage workers [0.85] 0.00 [0.45] 0.00 [0.00] 0.00 [0.08] 0.00 2 3.57 2 1.03 0.13—3.7340 Tobacco workers 3 2.53 [0.25] 0.00 – – [0.32] 0.00 1 2.68 4 1.88 0.51—4.8141 Glass makers etc 4 1.74 8 1.40 [0.02] 0.00 3 0.97 10 1.19 25 1.28 0.83—1.8942 Packers 1 1.53 8 0.79 [0.06] 0.00 11 1.52 4 0.32 24 0.79 0.51—1.1743 Engine operators [0.02] 0.00 3 1.80 [0.00] 0.00 [0.11] 0.00 [0.87] 0.00 3 1.12 0.23—3.2744 Public safety workers [0.06] 0.00 1 2.61 [0.02] 0.00 [0.85] 0.00 [1.19] 0.00 1 0.40 0.01—2.2345 Cooks and stewards [0.02] 0.00 14 1.24 1 3.61 9 0.92 7 0.41 31 0.80 0.55—1.1446 Domestic assistants 14 0.98 7 0.58 [0.08] 0.00 30 1.16 54 1.09 105 1.03 0.85—1.2547 Waiters 1 0.41 10 1.02 [0.03] 0.00 6 0.54 19 1.05 36 0.87 0.61—1.2048 Building caretakers 53 1.30 42 1.10 [0.58] 0.00 47 1.01 49 1.01 191 1.10 0.95—1.2649 Chimney sweeps [0.00] 0.00 [0.02] 0.00 – – [0.01] 0.00 [0.00] 0.00 [0.03] 0.00 0.00—117.5250 Hairdressers 2 0.80 9 2.41 [0.05] 0.00 2 0.67 6 0.73 19 1.09 0.66—1.7051 Launderers 4 0.87 2 0.66 [0.08] 0.00 3 0.76 16 1.74 25 1.20 0.78—1.7752 Military personnel [0.02] 0.00 [0.04] 0.00 – – [0.02] 0.00 [0.04] 0.00 [0.12] 0.00 0.00—30.2053 "Other workers" 17 1.46 12 1.00 1 1.80 20 0.81 20 0.91 70 0.99 0.77—1.2554 Economically inactive 293 0.99 245 1.00 4 1.70 309 1.00 956 1.00 1807 1.00 0.95—1.05
1-54 All categories 594 1.00 700 1.00 9 1.00 737 1.00 1691 1.00 3731 1.00 # REF. #
Obs = observed number of cases; SIR = standardised incidence ratio; 95% CI = 95% confidence interval
87 Index Prev Next

Acta Oncologica - Pukkala et al, 2008 Malignant melanoma of the eye
Observed number ofmalignant melanoma of the eye among men in the Nordic countries and standardised incidence ratios 1961-2005,by country and occupational category
Denmark Finland Iceland Norway Sweden Total
No Occupational category Obs SIR Obs SIR Obs SIR Obs SIR Obs SIR Obs SIR 95% CI
1 Technical workers, etc 43 1.10 34 0.92 1 3.54 39 1.40 130 0.98 247 1.04 0.92—1.182 Laboratory assistants [0.76] 0.00 1 1.05 [0.05] 0.00 3 2.31 1 1.42 5 1.33 0.43—3.103 Physicians 3 0.94 4 1.85 [0.11] 0.00 2 0.57 7 1.14 16 1.06 0.61—1.724 Dentists 2 2.10 [0.45] 0.00 [0.02] 0.00 3 1.96 5 1.68 10 1.69 0.81—3.115 Nurses [0.05] 0.00 [0.15] 0.00 [0.00] 0.00 [0.19] 0.00 [0.44] 0.00 [0.82] 0.00 0.00—4.486 Assistant nurses [0.93] 0.00 [0.14] 0.00 [0.01] 0.00 1 1.71 3 1.32 4 1.01 0.28—2.597 "Other health workers" 3 1.10 6 2.98 [0.03] 0.00 [1.36] 0.00 5 0.96 14 1.23 0.67—2.078 Teachers 24 1.38 14 0.92 [0.41] 0.00 17 0.85 35 1.02 90 1.03 0.83—1.279 Religious workers etc 5 0.71 8 0.93 [0.28] 0.00 13 1.30 22 0.80 48 0.90 0.66—1.1910 Artistic workers 2 0.91 [2.98] 0.00 [0.07] 0.00 3 1.03 11 1.35 16 0.98 0.56—1.5911 Journalists 3 2.91 2 1.41 [0.04] 0.00 1 0.77 4 1.03 10 1.30 0.63—2.4012 Administrators 41 0.96 24 1.09 1 1.34 46 1.33 41 0.81 153 1.02 0.87—1.1913 Clerical workers 23 1.20 15 1.05 [0.85] 0.00 31 1.19 59 1.08 128 1.11 0.93—1.3214 Sales agents 11 1.09 20 0.94 1 2.34 31 1.03 83 1.03 146 1.03 0.87—1.2115 Shop workers 48 1.12 8 0.85 [0.29] 0.00 12 0.99 20 0.78 88 0.97 0.78—1.2016 Farmers 78 0.95 98 1.08 2 1.60 87 1.12 149 1.13 414 1.08 0.98—1.1917 Gardeners 4 0.34 12 0.85 [0.04] 0.00 18 0.91 41 0.83 75 0.79 0.62—0.9918 Fishermen 2 0.50 2 1.63 [0.62] 0.00 21 0.82 7 1.33 32 0.87 0.60—1.2319 Forestry workers 3 1.78 12 0.71 [0.01] 0.00 10 0.69 27 0.75 52 0.75 0.56—0.9920 Miners and quarry workers 1 1.92 1 0.37 [0.01] 0.00 5 1.16 7 0.76 14 0.83 0.46—1.4021 Seamen 6 1.37 2 0.55 [0.19] 0.00 26 1.18 7 0.86 41 1.07 0.77—1.4522 Transport workers 13 1.43 11 1.10 [0.40] 0.00 15 1.33 38 1.44 77 1.35 1.06—1.6823 Drivers 25 0.82 35 1.00 2 3.70 25 0.78 76 1.13 163 0.99 0.85—1.1524 Postal workers 3 0.50 6 1.15 [0.08] 0.00 7 1.16 8 0.54 24 0.75 0.48—1.1125 Textile workers 6 1.13 1 0.30 [0.13] 0.00 4 0.64 16 1.00 27 0.87 0.57—1.2726 Shoe and leather workers 1 0.77 [1.44] 0.00 [0.03] 0.00 5 1.89 10 1.57 16 1.36 0.78—2.2027 Smelting workers 16 1.31 3 0.59 [0.17] 0.00 8 0.90 13 0.50 40 0.77 0.55—1.0428 Mechanics 30 0.92 36 1.03 [0.51] 0.00 38 0.86 144 1.19 248 1.06 0.94—1.2029 Plumbers 2 0.68 11 1.85 [0.09] 0.00 4 0.77 10 0.72 27 0.96 0.63—1.3930 Welders – – 9 1.51 [0.03] 0.00 4 0.67 16 1.00 29 1.04 0.69—1.4931 Electrical workers 3 0.38 13 0.86 [0.29] 0.00 17 0.87 49 1.17 82 0.97 0.77—1.2032 Wood workers 20 0.89 37 1.08 1 3.22 46 0.95 92 1.16 196 1.06 0.92—1.2233 Painters 6 0.82 10 1.31 [0.13] 0.00 6 0.73 23 0.98 45 0.96 0.70—1.2934 "Other construction workers" 27 0.98 25 1.10 1 1.67 10 0.99 41 0.94 104 0.99 0.82—1.2035 Bricklayers 9 1.10 4 1.12 – – 4 0.82 10 0.96 27 1.00 0.66—1.4536 Printers 3 0.57 2 0.53 [0.10] 0.00 5 0.97 14 1.10 24 0.89 0.57—1.3237 Chemical process workers 5 1.07 5 0.86 [0.06] 0.00 11 1.00 22 1.13 43 1.05 0.76—1.4138 Food workers 14 0.91 4 0.94 1 1.91 13 1.04 18 0.92 50 0.96 0.71—1.2639 Beverage workers [1.84] 0.00 1 3.76 [0.01] 0.00 [0.16] 0.00 1 0.89 2 0.59 0.07—2.1240 Tobacco workers [0.30] 0.00 [0.05] 0.00 [0.00] 0.00 [0.19] 0.00 [0.09] 0.00 [0.63] 0.00 0.00—5.8441 Glass makers etc 9 1.01 8 1.30 [0.09] 0.00 7 1.12 14 0.65 38 0.89 0.63—1.2242 Packers 9 1.14 13 1.05 [0.30] 0.00 20 1.06 32 0.82 74 0.94 0.74—1.1843 Engine operators 8 0.97 23 1.31 1 2.77 13 1.14 37 1.13 82 1.17 0.93—1.4544 Public safety workers 13 1.71 10 1.04 [0.28] 0.00 4 0.49 12 0.63 39 0.87 0.62—1.1945 Cooks and stewards 1 1.63 2 2.95 [0.12] 0.00 3 0.80 [3.63] 0.00 6 0.68 0.25—1.4846 Domestic assistants [0.01] 0.00 [0.04] 0.00 [0.00] 0.00 [0.03] 0.00 [0.36] 0.00 [0.43] 0.00 0.00—8.5847 Waiters 1 0.80 [0.67] 0.00 [0.01] 0.00 [1.60] 0.00 1 0.53 2 0.37 0.04—1.3448 Building caretakers 8 1.01 7 0.88 [0.14] 0.00 5 1.19 14 0.92 34 0.96 0.66—1.3449 Chimney sweeps [0.21] 0.00 [0.59] 0.00 – – 1 2.33 1 0.91 2 0.86 0.10—3.0950 Hairdressers 3 1.31 [0.18] 0.00 [0.02] 0.00 2 1.66 3 0.78 8 1.06 0.46—2.1051 Launderers 1 0.90 [0.18] 0.00 [0.01] 0.00 1 1.40 2 0.73 4 0.84 0.23—2.1652 Military personnel 2 0.49 5 1.44 – – 8 1.16 19 1.72 34 1.33 0.92—1.8653 "Other workers" 28 1.14 6 0.62 2 1.80 32 0.91 50 1.06 118 1.00 0.84—1.2054 Economically inactive 27 1.12 43 0.83 [0.81] 0.00 10 0.53 59 0.79 139 0.81 0.69—0.96
1-54 All categories 595 1.00 593 1.00 13 1.00 697 1.00 1509 1.00 3407 1.00 # REF. #
Obs = observed number of cases; SIR = standardised incidence ratio; 95% CI = 95% confidence interval
88 Index Prev Next

Acta Oncologica - Pukkala et al, 2008 Malignant melanoma of the eye
Observed number of malignant melanoma of the eye among women in the Nordic countries and standardised incidence ratios1961-2005, by country and occupational category
Denmark Finland Iceland Norway Sweden Total
No Occupational category Obs SIR Obs SIR Obs SIR Obs SIR Obs SIR Obs SIR 95% CI
1 Technical workers, etc 2 1.17 4 1.05 [0.04] 0.00 2 2.01 6 1.00 14 1.11 0.61—1.872 Laboratory assistants 1 0.78 3 1.39 [0.06] 0.00 1 0.84 [1.72] 0.00 5 0.78 0.25—1.823 Physicians 1 1.76 1 1.06 [0.01] 0.00 [0.49] 0.00 1 0.73 3 0.89 0.18—2.594 Dentists [0.50] 0.00 [0.93] 0.00 [0.00] 0.00 [0.40] 0.00 2 1.91 2 0.70 0.08—2.525 Nurses 6 0.60 16 1.46 [0.21] 0.00 11 1.20 15 0.84 48 1.00 0.74—1.326 Assistant nurses 9 1.22 13 1.18 [0.23] 0.00 10 1.10 34 1.08 66 1.12 0.86—1.427 "Other health workers" 5 0.88 10 1.15 [0.06] 0.00 8 0.88 13 1.23 36 1.06 0.74—1.468 Teachers 8 0.62 15 0.77 [0.42] 0.00 16 0.91 50 1.25 89 0.99 0.79—1.219 Religious workers etc 1 0.59 9 0.91 [0.06] 0.00 4 0.92 10 0.75 24 0.82 0.52—1.2110 Artistic workers [0.84] 0.00 3 1.88 [0.04] 0.00 2 1.55 1 0.39 6 0.94 0.35—2.0511 Journalists 1 5.28 [1.03] 0.00 [0.01] 0.00 2 5.64 [1.20] 0.00 3 1.08 0.22—3.1512 Administrators 3 0.59 6 1.76 [0.02] 0.00 1 0.24 5 0.86 15 0.81 0.45—1.3313 Clerical workers 39 0.75 69 1.08 1 1.04 63 1.15 103 1.03 275 1.01 0.90—1.1414 Sales agents [0.46] 0.00 10 1.12 [0.09] 0.00 4 0.56 13 0.92 27 0.88 0.58—1.2815 Shop workers 36 1.06 28 0.83 1 1.99 52 1.19 67 1.10 184 1.06 0.92—1.2316 Farmers 30 1.23 20 1.07 [0.31] 0.00 29 1.04 6 1.05 85 1.11 0.88—1.3717 Gardeners 3 0.96 44 0.77 [0.01] 0.00 20 1.20 17 1.08 84 0.91 0.72—1.1218 Fishermen [0.13] 0.00 [0.13] 0.00 [0.02] 0.00 [0.22] 0.00 [0.05] 0.00 [0.55] 0.00 0.00—6.7519 Forestry workers [0.03] 0.00 [0.24] 0.00 [0.00] 0.00 [0.32] 0.00 [0.35] 0.00 [0.94] 0.00 0.00—3.9220 Miners and quarry workers [0.00] 0.00 [0.10] 0.00 – – [0.02] 0.00 [0.08] 0.00 [0.20] 0.00 0.00—18.0821 Seamen – – [0.03] 0.00 – – [0.05] 0.00 [0.01] 0.00 [0.10] 0.00 0.00—38.2922 Transport workers [0.03] 0.00 2 1.24 [0.01] 0.00 [0.26] 0.00 1 0.99 3 1.02 0.21—2.9923 Drivers 1 1.14 1 1.27 [0.01] 0.00 2 2.24 2 0.83 6 1.20 0.44—2.6224 Postal workers 1 0.55 12 1.20 [0.14] 0.00 8 0.76 21 1.20 42 1.05 0.76—1.4225 Textile workers 6 0.52 23 1.04 1 4.50 10 0.63 31 0.87 71 0.83 0.65—1.0526 Shoe and leather workers [0.86] 0.00 1 0.36 [0.01] 0.00 1 0.86 1 0.36 3 0.40 0.08—1.1627 Smelting workers [0.21] 0.00 1 1.54 [0.00] 0.00 [0.14] 0.00 [0.74] 0.00 1 0.58 0.01—3.2028 Mechanics 5 2.34 3 1.01 [0.00] 0.00 1 0.69 7 0.93 16 1.14 0.65—1.8429 Plumbers [0.02] 0.00 [0.01] 0.00 – – [0.01] 0.00 [0.01] 0.00 [0.05] 0.00 0.00—80.0930 Welders – – 1 4.11 [0.00] 0.00 [0.12] 0.00 [0.29] 0.00 1 1.55 0.04—8.6331 Electrical workers 6 2.02 4 2.01 [0.00] 0.00 [1.60] 0.00 1 0.24 11 1.02 0.51—1.8332 Wood workers [0.98] 0.00 3 0.53 [0.01] 0.00 [0.52] 0.00 2 1.60 5 0.60 0.19—1.3933 Painters [0.04] 0.00 [0.68] 0.00 [0.00] 0.00 [0.12] 0.00 [0.34] 0.00 [1.17] 0.00 0.00—3.1534 "Other construction workers" [0.03] 0.00 3 1.37 [0.00] 0.00 [0.05] 0.00 [0.04] 0.00 3 1.30 0.27—3.8035 Bricklayers [0.01] 0.00 [0.07] 0.00 – – [0.00] 0.00 [0.00] 0.00 [0.08] 0.00 0.00—45.7936 Printers 1 0.92 [2.88] 0.00 [0.03] 0.00 1 0.71 1 0.31 3 0.35 0.07—1.0237 Chemical process workers 1 0.59 2 1.37 [0.01] 0.00 [1.25] 0.00 3 1.20 6 0.87 0.32—1.8938 Food workers 10 1.19 5 0.67 [0.57] 0.00 5 0.65 6 0.81 26 0.82 0.54—1.2139 Beverage workers [0.77] 0.00 [0.42] 0.00 [0.00] 0.00 [0.07] 0.00 2 4.26 2 1.16 0.14—4.1940 Tobacco workers 3 2.79 [0.23] 0.00 – – [0.28] 0.00 1 3.37 4 2.12 0.58—5.4341 Glass makers etc 4 1.93 8 1.51 [0.01] 0.00 3 1.12 7 1.05 22 1.31 0.82—1.9942 Packers 1 1.69 8 0.85 [0.04] 0.00 11 1.75 4 0.40 24 0.91 0.59—1.3643 Engine operators [0.02] 0.00 2 1.29 [0.00] 0.00 [0.10] 0.00 [0.63] 0.00 2 0.87 0.11—3.1544 Public safety workers [0.06] 0.00 1 2.81 [0.01] 0.00 [0.73] 0.00 [0.83] 0.00 1 0.50 0.01—2.8045 Cooks and stewards [0.02] 0.00 13 1.24 1 5.43 8 0.94 7 0.48 29 0.86 0.58—1.2446 Domestic assistants 13 1.01 7 0.63 [0.05] 0.00 26 1.15 41 1.06 87 1.02 0.82—1.2647 Waiters 1 0.45 10 1.10 [0.02] 0.00 5 0.52 16 1.07 32 0.89 0.61—1.2648 Building caretakers 46 1.25 39 1.10 [0.41] 0.00 44 1.09 37 0.95 166 1.09 0.94—1.2749 Chimney sweeps [0.00] 0.00 [0.02] 0.00 – – [0.01] 0.00 [0.00] 0.00 [0.03] 0.00 0.00—130.0950 Hairdressers 2 0.89 9 2.60 [0.05] 0.00 2 0.77 3 0.47 16 1.09 0.62—1.7751 Launderers 4 0.96 2 0.71 [0.05] 0.00 3 0.87 15 1.93 24 1.31 0.84—1.9652 Military personnel [0.02] 0.00 [0.04] 0.00 – – [0.01] 0.00 [0.03] 0.00 [0.10] 0.00 0.00—36.7653 "Other workers" 15 1.43 12 1.07 1 2.41 18 0.84 12 0.69 58 0.95 0.72—1.2354 Economically inactive 271 1.01 225 0.99 2 1.18 269 0.99 805 1.01 1572 1.01 0.96—1.06
1-54 All categories 536 1.00 648 1.00 7 1.00 642 1.00 1369 1.00 3202 1.00 # REF. #
Obs = observed number of cases; SIR = standardised incidence ratio; 95% CI = 95% confidence interval
89 Index Prev Next

Acta Oncologica - Pukkala et al, 2008 Brain cancer
Observed number of brain cancer among men in the Nordic countries and standardised incidence ratios 1961-2005, by country andoccupational category
Denmark Finland Iceland Norway Sweden Total
No Occupational category Obs SIR Obs SIR Obs SIR Obs SIR Obs SIR Obs SIR 95% CI
1 Technical workers, etc 447 1.02 476 1.05 3 0.49 322 1.03 1830 1.10 3078 1.07 1.03—1.112 Laboratory assistants 7 0.81 13 1.09 2 1.82 15 1.07 13 1.06 50 1.04 0.78—1.383 Physicians 57 1.66 38 1.44 3 1.46 48 1.31 93 1.13 239 1.32 1.16—1.494 Dentists 12 1.13 6 1.13 [0.61] 0.00 16 1.01 49 1.32 83 1.19 0.95—1.485 Nurses [0.54] 0.00 3 1.31 [0.03] 0.00 1 0.38 12 1.36 16 1.12 0.64—1.816 Assistant nurses 6 0.56 3 1.32 [0.34] 0.00 3 0.51 35 1.07 47 0.90 0.66—1.207 "Other health workers" 35 1.16 34 1.41 [0.59] 0.00 23 1.60 84 1.26 176 1.30 1.12—1.508 Teachers 193 1.00 175 0.99 7 0.87 242 1.11 475 1.04 1092 1.04 0.98—1.109 Religious workers etc 59 0.80 137 1.25 9 1.70 106 1.00 417 1.11 728 1.08 1.01—1.1710 Artistic workers 27 1.14 31 0.88 5 3.62 32 1.06 89 0.86 184 0.95 0.82—1.0911 Journalists 11 0.95 20 1.19 1 1.19 19 1.37 46 0.93 97 1.05 0.85—1.2812 Administrators 535 1.15 276 1.08 15 1.31 404 1.15 640 1.10 1870 1.12 1.07—1.1813 Clerical workers 206 0.98 175 1.10 15 1.11 261 0.97 677 1.04 1334 1.02 0.97—1.0814 Sales agents 116 1.03 268 1.10 6 0.88 333 1.12 1020 1.05 1743 1.07 1.02—1.1215 Shop workers 479 1.04 119 1.05 6 1.17 140 1.08 321 1.03 1065 1.04 0.98—1.1116 Farmers 794 0.95 820 0.93 18 0.96 647 0.96 1299 0.98 3578 0.96 0.93—0.9917 Gardeners 108 0.90 146 0.96 [0.63] 0.00 150 0.82 516 0.97 920 0.93 0.87—0.9918 Fishermen 45 1.01 12 0.97 11 0.73 212 0.89 47 0.84 327 0.89 0.80—1.0019 Forestry workers 13 0.76 160 0.88 [0.11] 0.00 119 0.93 311 0.80 603 0.84 0.78—0.9120 Miners and quarry workers 8 1.46 30 1.00 1 4.26 35 0.83 93 0.90 167 0.92 0.79—1.0721 Seamen 66 1.29 44 1.07 3 0.84 212 0.93 82 0.86 407 0.97 0.88—1.0722 Transport workers 112 1.09 112 1.01 6 0.98 117 1.06 314 1.03 661 1.04 0.96—1.1223 Drivers 322 0.93 393 0.98 11 1.10 327 0.98 769 0.93 1822 0.95 0.91—1.0024 Postal workers 71 1.02 55 0.92 2 1.74 55 0.93 192 1.08 375 1.02 0.92—1.1325 Textile workers 57 1.01 40 1.15 1 0.53 63 1.07 162 0.95 323 1.00 0.90—1.1226 Shoe and leather workers 13 0.96 22 1.48 1 2.55 22 0.93 54 0.85 112 0.96 0.80—1.1627 Smelting workers 125 0.91 53 0.95 3 1.05 82 0.95 275 0.96 538 0.95 0.87—1.0328 Mechanics 354 0.97 428 1.05 8 0.75 446 0.97 1550 1.05 2786 1.02 0.99—1.0629 Plumbers 31 0.93 65 0.94 2 1.24 52 0.93 167 0.99 317 0.96 0.86—1.0730 Welders – – 71 0.95 [0.64] 0.00 72 1.09 203 0.98 346 0.99 0.90—1.1131 Electrical workers 101 1.12 168 0.91 5 0.76 221 1.08 516 0.97 1011 0.99 0.93—1.0532 Wood workers 240 0.99 368 1.00 7 1.30 472 1.01 807 0.91 1894 0.96 0.92—1.0133 Painters 89 1.08 84 1.01 2 0.92 75 0.94 274 1.03 524 1.02 0.94—1.1134 "Other construction workers" 273 0.94 233 0.96 11 0.92 90 0.88 437 0.90 1044 0.92 0.87—0.9835 Bricklayers 88 0.99 31 0.80 – – 58 1.23 113 1.00 290 1.01 0.90—1.1336 Printers 64 1.08 41 0.92 [1.96] 0.00 56 1.04 156 0.99 317 1.00 0.90—1.1237 Chemical process workers 58 1.15 80 1.20 2 2.16 88 0.85 190 0.88 418 0.96 0.87—1.0538 Food workers 171 1.01 39 0.82 8 0.98 122 1.01 211 0.96 551 0.97 0.90—1.0639 Beverage workers 17 0.82 3 1.04 [0.13] 0.00 2 0.94 12 0.99 34 0.89 0.62—1.2540 Tobacco workers 3 0.98 1 1.83 [0.01] 0.00 2 1.15 2 1.86 8 1.24 0.54—2.4541 Glass makers etc 79 0.81 71 1.00 1 0.66 59 0.92 247 1.00 457 0.95 0.87—1.0442 Packers 81 0.96 136 1.00 5 1.09 185 1.02 435 1.01 842 1.01 0.94—1.0843 Engine operators 81 0.89 197 0.97 10 1.40 120 0.98 396 0.99 804 0.98 0.91—1.0544 Public safety workers 68 0.83 107 0.97 3 0.64 84 1.04 244 1.01 506 0.97 0.89—1.0645 Cooks and stewards 1 0.14 8 0.88 3 1.19 41 1.01 49 0.99 102 0.94 0.77—1.1446 Domestic assistants 1 12.18 [0.36] 0.00 [0.01] 0.00 1 2.46 7 1.05 9 1.20 0.55—2.2747 Waiters 16 1.09 15 1.64 [0.31] 0.00 10 0.60 31 1.24 72 1.09 0.86—1.3848 Building caretakers 105 1.23 86 0.99 4 2.39 39 0.93 152 0.85 386 0.98 0.88—1.0849 Chimney sweeps 5 2.05 3 0.46 – – 4 0.94 9 0.66 21 0.78 0.49—1.2050 Hairdressers 27 1.12 [1.97] 0.00 1 2.81 9 0.77 38 0.91 75 0.94 0.74—1.1851 Launderers 13 1.10 [2.00] 0.00 [0.15] 0.00 6 0.87 27 0.90 46 0.91 0.66—1.2152 Military personnel 61 1.27 50 1.17 – – 78 1.05 150 1.09 339 1.12 1.01—1.2553 "Other workers" 247 0.90 77 0.73 17 0.95 334 1.03 485 0.94 1160 0.94 0.88—0.9954 Economically inactive 236 1.01 488 1.00 11 0.78 159 0.92 883 0.98 1777 0.98 0.94—1.03
1-54 All categories 6434 1.00 6511 1.00 229 1.00 6891 1.00 17706 1.00 37771 1.00 # REF. #
Obs = observed number of cases; SIR = standardised incidence ratio; 95% CI = 95% confidence interval
90 Index Prev Next

Acta Oncologica - Pukkala et al, 2008 Brain cancer
Observed number of brain cancer among women in the Nordic countries and standardised incidence ratios 1961-2005, by country andoccupational category
Denmark Finland Iceland Norway Sweden Total
No Occupational category Obs SIR Obs SIR Obs SIR Obs SIR Obs SIR Obs SIR 95% CI
1 Technical workers, etc 32 1.36 80 1.15 1 1.06 11 0.78 130 1.18 254 1.16 1.03—1.322 Laboratory assistants 17 0.95 37 1.02 2 1.48 27 1.69 42 0.99 125 1.10 0.92—1.313 Physicians 13 1.68 23 1.30 [0.21] 0.00 9 1.38 22 0.78 67 1.11 0.86—1.414 Dentists 3 0.44 7 0.48 [0.09] 0.00 7 1.38 17 0.93 34 0.76 0.53—1.065 Nurses 156 1.16 219 1.18 7 1.19 125 0.99 321 1.02 828 1.08 1.01—1.166 Assistant nurses 110 1.08 174 1.02 4 0.47 112 0.90 619 1.05 1019 1.03 0.96—1.097 "Other health workers" 76 0.99 121 0.85 1 0.55 110 0.92 178 0.87 486 0.89 0.82—0.988 Teachers 191 1.09 341 1.09 16 1.50 251 1.07 786 1.08 1585 1.09 1.03—1.149 Religious workers etc 32 1.37 223 1.18 2 1.27 52 0.90 285 1.05 594 1.09 1.01—1.1910 Artistic workers 7 0.62 23 0.83 3 2.33 18 1.09 49 1.03 100 0.96 0.79—1.1611 Journalists 2 0.76 19 1.12 [0.34] 0.00 5 1.04 23 1.01 49 1.03 0.76—1.3612 Administrators 66 0.97 60 1.02 1 1.05 56 1.06 123 1.14 306 1.06 0.95—1.1913 Clerical workers 758 1.07 1107 1.05 27 0.83 705 0.99 1769 1.02 4366 1.03 1.00—1.0614 Sales agents 3 0.48 130 0.95 4 1.23 80 0.98 206 0.93 423 0.94 0.86—1.0315 Shop workers 440 0.95 487 0.98 15 0.75 566 1.05 922 1.02 2430 1.00 0.96—1.0416 Farmers 292 0.90 220 0.88 16 1.15 330 1.05 80 0.89 938 0.94 0.88—1.0117 Gardeners 35 0.83 702 0.93 [0.48] 0.00 174 0.91 196 0.86 1107 0.91 0.86—0.9718 Fishermen 2 1.18 1 0.52 2 3.66 2 0.70 3 3.72 10 1.28 0.61—2.3519 Forestry workers 1 2.24 2 0.54 [0.07] 0.00 4 1.01 5 0.91 12 0.88 0.45—1.5420 Miners and quarry workers [0.03] 0.00 1 0.73 [0.01] 0.00 1 4.00 [1.43] 0.00 2 0.65 0.08—2.3321 Seamen – – [0.62] 0.00 [0.00] 0.00 1 1.45 1 4.00 2 1.28 0.16—4.6322 Transport workers [0.46] 0.00 19 0.86 1 1.92 5 1.44 15 0.88 40 0.92 0.66—1.2523 Drivers 18 1.51 5 0.39 [0.26] 0.00 10 0.86 58 1.29 91 1.12 0.90—1.3724 Postal workers 18 0.74 139 0.96 7 1.08 117 0.90 285 1.04 566 0.97 0.90—1.0625 Textile workers 161 1.03 316 1.00 12 1.07 176 0.98 500 1.05 1165 1.02 0.96—1.0826 Shoe and leather workers 14 1.19 34 0.86 1 1.61 7 0.53 35 0.94 91 0.89 0.72—1.0927 Smelting workers 3 1.04 11 1.20 [0.03] 0.00 [1.94] 0.00 15 1.15 29 1.08 0.72—1.5428 Mechanics 37 1.26 44 0.98 [0.12] 0.00 12 0.67 130 1.03 223 1.02 0.89—1.1629 Plumbers [0.22] 0.00 [0.13] 0.00 – – [0.15] 0.00 [0.26] 0.00 [0.75] 0.00 0.00—4.9030 Welders – – 6 1.51 [0.01] 0.00 4 2.43 6 1.03 16 1.39 0.80—2.2631 Electrical workers 41 0.99 36 1.06 [0.11] 0.00 18 0.88 76 1.06 171 1.02 0.88—1.1932 Wood workers 17 1.27 68 0.88 [0.21] 0.00 10 1.46 20 0.90 115 0.96 0.80—1.1533 Painters [0.50] 0.00 11 1.12 [0.06] 0.00 3 1.99 6 1.06 20 1.14 0.70—1.7634 "Other construction workers" [0.38] 0.00 31 1.09 [0.04] 0.00 1 1.71 1 1.08 33 1.09 0.75—1.5335 Bricklayers [0.08] 0.00 [1.07] 0.00 – – [0.03] 0.00 [0.03] 0.00 [1.22] 0.00 0.00—3.0336 Printers 21 1.40 50 1.16 2 1.94 11 0.65 42 0.83 126 1.00 0.84—1.1837 Chemical process workers 26 1.12 20 0.97 [0.43] 0.00 19 1.26 36 0.95 101 1.04 0.85—1.2638 Food workers 117 1.02 99 0.95 28 1.12 75 0.84 104 0.99 423 0.96 0.88—1.0639 Beverage workers 11 1.03 2 0.36 [0.06] 0.00 [0.89] 0.00 4 0.62 17 0.72 0.42—1.1540 Tobacco workers 14 0.94 10 3.14 – – 2 0.65 4 0.90 30 1.17 0.79—1.6741 Glass makers etc 27 0.94 76 0.99 [0.69] 0.00 23 0.70 108 1.06 234 0.97 0.85—1.1042 Packers 12 1.49 143 1.06 2 0.87 76 1.00 151 1.01 384 1.04 0.94—1.1543 Engine operators [0.28] 0.00 21 0.92 [0.04] 0.00 4 2.93 19 1.53 44 1.19 0.86—1.6044 Public safety workers [0.81] 0.00 9 1.55 1 2.16 15 1.72 22 1.23 47 1.39 1.02—1.8545 Cooks and stewards [0.29] 0.00 164 1.06 5 0.58 93 0.98 219 1.09 481 1.05 0.96—1.1546 Domestic assistants 178 1.02 164 0.91 5 2.06 231 0.90 585 0.90 1163 0.92 0.87—0.9747 Waiters 30 0.98 131 0.94 [1.05] 0.00 113 0.98 221 1.05 495 1.00 0.91—1.0948 Building caretakers 471 0.94 471 0.94 23 1.32 460 0.94 607 1.01 2032 0.96 0.92—1.0049 Chimney sweeps [0.04] 0.00 [0.26] 0.00 – – [0.06] 0.00 [0.03] 0.00 [0.39] 0.00 0.00—9.5450 Hairdressers 31 0.99 58 1.08 1 0.87 23 0.72 108 1.04 221 1.00 0.87—1.1451 Launderers 63 1.12 31 0.83 3 1.13 47 1.20 109 1.06 253 1.06 0.94—1.2052 Military personnel [0.29] 0.00 1 1.37 – – [0.19] 0.00 [0.67] 0.00 1 0.53 0.01—2.9653 "Other workers" 144 1.00 159 0.95 21 1.12 241 0.92 275 1.00 840 0.97 0.91—1.0454 Economically inactive 3579 0.99 3022 1.01 58 0.90 3009 1.04 10676 0.99 20344 1.00 0.98—1.01
1-54 All categories 7269 1.00 9328 1.00 271 1.00 7451 1.00 20214 1.00 44533 1.00 # REF. #
Obs = observed number of cases; SIR = standardised incidence ratio; 95% CI = 95% confidence interval
91 Index Prev Next

Acta Oncologica - Pukkala et al, 2008 Glioma
Observed number of glioma among men in the Nordic countries and standardised incidence ratios 1961-2005, by country and occupationalcategory
Denmark Finland Iceland Norway Sweden Total
No Occupational category Obs SIR Obs SIR Obs SIR Obs SIR Obs SIR Obs SIR 95% CI
1 Technical workers, etc 42 0.91 248 1.15 1 0.27 185 1.10 983 1.15 1459 1.13 1.08—1.192 Laboratory assistants 1 1.08 11 1.92 2 2.95 8 1.08 7 1.06 29 1.36 0.91—1.953 Physicians 5 1.41 19 1.52 3 2.41 23 1.20 42 1.00 92 1.17 0.94—1.444 Dentists 1 0.88 5 2.03 [0.38] 0.00 7 0.85 24 1.27 37 1.19 0.84—1.645 Nurses [0.06] 0.00 1 0.88 [0.02] 0.00 1 0.65 9 1.97 11 1.51 0.75—2.696 Assistant nurses 2 1.75 1 0.87 [0.21] 0.00 1 0.33 17 1.01 21 0.94 0.58—1.447 "Other health workers" 6 1.87 14 1.24 [0.35] 0.00 11 1.46 42 1.25 73 1.30 1.02—1.648 Teachers 23 1.14 86 1.03 3 0.61 131 1.13 229 0.97 472 1.03 0.94—1.129 Religious workers etc 7 0.92 66 1.26 6 1.89 61 1.11 221 1.15 361 1.16 1.05—1.2910 Artistic workers 5 1.97 14 0.84 3 3.62 18 1.15 49 0.92 89 1.00 0.80—1.2311 Journalists 1 0.81 9 1.14 [0.50] 0.00 10 1.37 24 0.94 44 1.04 0.75—1.3912 Administrators 56 1.16 126 1.07 13 1.94 205 1.14 330 1.14 730 1.14 1.06—1.2213 Clerical workers 27 1.20 93 1.28 9 1.14 135 0.97 355 1.08 619 1.08 1.00—1.1714 Sales agents 18 1.48 136 1.20 1 0.25 170 1.12 523 1.06 848 1.10 1.02—1.1715 Shop workers 52 1.07 62 1.15 4 1.31 75 1.10 167 1.05 360 1.08 0.97—1.2016 Farmers 66 0.80 359 0.97 12 1.11 308 0.96 629 1.00 1374 0.97 0.92—1.0217 Gardeners 16 1.32 69 1.00 [0.36] 0.00 68 0.75 268 1.02 421 0.97 0.88—1.0718 Fishermen 5 1.03 6 1.13 4 0.43 100 0.84 19 0.70 134 0.81 0.68—0.9619 Forestry workers 1 0.57 70 0.84 [0.07] 0.00 51 0.82 145 0.75 267 0.78 0.70—0.8820 Miners and quarry workers 2 3.41 11 0.79 1 6.87 16 0.74 42 0.80 72 0.81 0.63—1.0221 Seamen 7 1.22 14 0.74 2 0.94 102 0.85 36 0.75 161 0.82 0.71—0.9622 Transport workers 8 0.75 41 0.81 2 0.56 69 1.23 162 1.06 282 1.03 0.92—1.1623 Drivers 42 1.11 177 0.94 6 1.00 171 0.98 372 0.88 768 0.92 0.86—0.9924 Postal workers 5 0.67 25 0.90 [0.66] 0.00 26 0.85 99 1.10 155 0.99 0.85—1.1625 Textile workers 5 0.84 16 1.03 [1.07] 0.00 28 0.97 68 0.81 117 0.86 0.72—1.0326 Shoe and leather workers 1 0.70 14 2.15 1 4.57 11 0.95 25 0.81 52 1.03 0.77—1.3527 Smelting workers 15 0.98 25 0.99 3 1.79 50 1.13 126 0.88 219 0.95 0.83—1.0928 Mechanics 41 1.03 210 1.09 7 1.09 244 1.01 802 1.06 1304 1.06 1.00—1.1129 Plumbers 3 0.81 24 0.73 1 1.04 29 0.98 73 0.84 130 0.84 0.71—1.0030 Welders – – 34 0.94 [0.39] 0.00 39 1.10 120 1.12 193 1.08 0.93—1.2431 Electrical workers 9 0.90 66 0.75 3 0.75 99 0.92 274 1.00 451 0.93 0.85—1.0232 Wood workers 18 0.70 164 1.00 3 0.95 235 1.00 395 0.90 815 0.94 0.88—1.0133 Painters 8 0.90 39 1.02 2 1.56 41 1.01 140 1.05 230 1.04 0.91—1.1834 "Other construction workers" 27 0.87 103 0.94 8 1.11 47 0.88 226 0.93 411 0.93 0.84—1.0235 Bricklayers 6 0.63 13 0.75 – – 30 1.26 58 1.03 107 1.00 0.83—1.2136 Printers 6 0.92 19 0.90 [1.18] 0.00 27 0.95 89 1.10 141 1.02 0.87—1.2137 Chemical process workers 6 1.11 41 1.32 2 3.65 37 0.71 90 0.84 176 0.90 0.77—1.0438 Food workers 19 1.04 16 0.72 5 1.05 67 1.09 100 0.90 207 0.95 0.83—1.0939 Beverage workers 3 1.27 2 1.55 [0.08] 0.00 1 0.83 7 1.15 13 1.18 0.63—2.0240 Tobacco workers [0.33] 0.00 1 3.93 [0.00] 0.00 2 2.29 [0.55] 0.00 3 1.49 0.31—4.3641 Glass makers etc 10 0.96 33 1.00 1 1.12 31 0.93 127 1.02 202 1.00 0.87—1.1542 Packers 11 1.21 57 0.92 4 1.50 105 1.14 224 1.04 401 1.05 0.95—1.1643 Engine operators 7 0.72 78 0.81 5 1.16 63 0.96 182 0.89 335 0.88 0.79—0.9844 Public safety workers 9 1.06 43 0.84 1 0.36 52 1.27 128 1.04 233 1.03 0.90—1.1745 Cooks and stewards [0.83] 0.00 7 1.60 1 0.66 19 0.88 24 0.94 51 0.95 0.70—1.2446 Domestic assistants [0.01] 0.00 [0.14] 0.00 [0.01] 0.00 [0.22] 0.00 4 1.18 4 1.06 0.29—2.7147 Waiters 1 0.57 6 1.35 [0.19] 0.00 5 0.57 15 1.14 27 0.96 0.63—1.3948 Building caretakers 9 0.98 48 1.22 2 2.13 23 1.07 69 0.78 151 0.95 0.81—1.1149 Chimney sweeps [0.27] 0.00 1 0.34 – – 2 0.91 3 0.43 6 0.48 0.18—1.0550 Hairdressers 4 1.57 [0.90] 0.00 1 4.60 4 0.67 20 0.96 29 0.95 0.64—1.3751 Launderers 3 2.45 [0.92] 0.00 [0.08] 0.00 2 0.58 15 1.00 20 0.97 0.59—1.4952 Military personnel 9 1.75 31 1.48 – – 44 1.12 83 1.19 167 1.24 1.06—1.4453 "Other workers" 23 0.75 29 0.60 10 0.96 163 1.01 242 0.94 467 0.92 0.84—1.0154 Economically inactive 34 1.22 182 0.88 4 0.48 72 0.81 400 0.87 692 0.87 0.81—0.94
1-54 All categories 685 1.00 2965 1.00 136 1.00 3524 1.00 8923 1.00 16233 1.00 # REF. #
Obs = observed number of cases; SIR = standardised incidence ratio; 95% CI = 95% confidence interval
92 Index Prev Next

Acta Oncologica - Pukkala et al, 2008 Glioma
Observed number of glioma among women in the Nordic countries and standardised incidence ratios 1961-2005, by country andoccupational category
Denmark Finland Iceland Norway Sweden Total
No Occupational category Obs SIR Obs SIR Obs SIR Obs SIR Obs SIR Obs SIR 95% CI
1 Technical workers, etc 2 1.05 22 1.07 1 2.90 4 0.82 45 1.23 74 1.15 0.90—1.452 Laboratory assistants 1 0.66 10 0.95 1 1.95 6 1.10 10 0.73 28 0.89 0.59—1.283 Physicians 2 3.27 9 1.70 [0.08] 0.00 6 2.69 10 1.09 27 1.55 1.02—2.254 Dentists 1 1.86 3 0.76 [0.03] 0.00 4 2.29 6 0.99 14 1.14 0.62—1.915 Nurses 11 1.03 53 0.99 1 0.45 48 1.13 113 1.08 226 1.06 0.93—1.216 Assistant nurses 5 0.61 58 1.19 2 0.66 34 0.83 188 0.96 287 0.97 0.86—1.087 "Other health workers" 8 1.32 29 0.71 1 1.50 37 0.92 60 0.89 135 0.87 0.73—1.038 Teachers 11 0.78 93 1.05 6 1.49 90 1.13 298 1.24 498 1.17 1.07—1.279 Religious workers etc 3 1.63 72 1.29 [0.59] 0.00 20 1.02 100 1.13 195 1.17 1.02—1.3510 Artistic workers [0.90] 0.00 8 1.00 [0.48] 0.00 7 1.25 20 1.26 35 1.13 0.79—1.5811 Journalists [0.22] 0.00 5 1.03 [0.13] 0.00 2 1.23 8 1.06 15 1.04 0.58—1.7212 Administrators 7 1.31 19 1.13 [0.36] 0.00 20 1.13 38 1.08 84 1.11 0.89—1.3813 Clerical workers 56 0.98 297 0.99 15 1.25 243 1.00 589 1.01 1200 1.00 0.95—1.0614 Sales agents [0.48] 0.00 38 1.02 1 0.82 29 1.07 70 0.96 138 0.99 0.84—1.1715 Shop workers 38 1.05 140 1.02 5 0.68 183 1.02 326 1.06 692 1.04 0.96—1.1216 Farmers 29 1.17 62 1.01 8 1.55 93 0.94 26 0.89 218 0.99 0.87—1.1317 Gardeners [3.19] 0.00 183 0.95 [0.17] 0.00 55 0.90 67 0.86 305 0.91 0.81—1.0218 Fishermen [0.13] 0.00 1 1.95 2 9.42 1 1.06 1 3.76 5 2.42 0.79—5.6519 Forestry workers [0.03] 0.00 [0.98] 0.00 [0.02] 0.00 1 0.79 1 0.54 2 0.48 0.06—1.7320 Miners and quarry workers [0.00] 0.00 [0.35] 0.00 [0.00] 0.00 1 11.81 [0.49] 0.00 1 1.07 0.03—5.9721 Seamen – – [0.19] 0.00 [0.00] 0.00 1 4.34 1 12.44 2 3.98 0.48—14.3922 Transport workers [0.04] 0.00 3 0.51 [0.20] 0.00 1 0.84 7 1.23 11 0.85 0.42—1.5223 Drivers 3 3.13 [3.64] 0.00 [0.10] 0.00 3 0.77 17 1.12 23 0.97 0.61—1.4524 Postal workers 1 0.53 40 1.01 3 1.23 37 0.83 94 1.01 175 0.96 0.83—1.1225 Textile workers 12 0.96 80 0.95 4 0.99 61 1.01 161 1.00 318 0.99 0.89—1.1026 Shoe and leather workers 2 2.12 8 0.75 [0.23] 0.00 2 0.44 13 1.03 25 0.86 0.56—1.2827 Smelting workers 1 4.21 2 0.81 [0.01] 0.00 [0.65] 0.00 3 0.68 6 0.77 0.28—1.6728 Mechanics 5 2.07 11 0.90 [0.05] 0.00 4 0.65 50 1.16 70 1.09 0.85—1.3829 Plumbers [0.02] 0.00 [0.04] 0.00 – – [0.05] 0.00 [0.08] 0.00 [0.19] 0.00 0.00—19.6330 Welders – – 4 3.55 [0.00] 0.00 1 1.79 2 1.02 7 1.92 0.77—3.9631 Electrical workers 2 0.58 11 1.12 [0.04] 0.00 6 0.86 30 1.24 49 1.10 0.81—1.4632 Wood workers 1 0.93 17 0.82 [0.07] 0.00 5 2.19 5 0.67 28 0.89 0.59—1.2833 Painters [0.04] 0.00 2 0.75 [0.02] 0.00 [0.51] 0.00 3 1.57 5 0.97 0.31—2.2634 "Other construction workers" [0.03] 0.00 9 1.23 [0.01] 0.00 [0.19] 0.00 1 3.36 10 1.28 0.61—2.3535 Bricklayers [0.01] 0.00 [0.28] 0.00 – – [0.01] 0.00 [0.01] 0.00 [0.31] 0.00 0.00—11.8836 Printers 3 2.43 13 1.09 1 2.68 4 0.69 16 0.94 37 1.01 0.71—1.4037 Chemical process workers 4 2.10 5 0.91 [0.15] 0.00 8 1.55 7 0.55 24 0.94 0.60—1.4038 Food workers 5 0.55 27 0.97 8 0.89 22 0.74 41 1.17 103 0.93 0.77—1.1339 Beverage workers 1 1.10 [1.46] 0.00 [0.02] 0.00 [0.29] 0.00 1 0.47 2 0.41 0.05—1.5040 Tobacco workers 3 2.37 3 3.63 – – [1.09] 0.00 3 1.96 9 1.91 0.87—3.6241 Glass makers etc 3 1.27 22 1.06 [0.26] 0.00 8 0.71 36 1.03 69 0.99 0.77—1.2642 Packers [0.65] 0.00 44 1.21 1 1.21 28 1.10 53 1.05 126 1.11 0.93—1.3243 Engine operators [0.03] 0.00 4 0.64 [0.01] 0.00 1 2.16 5 1.18 10 0.91 0.44—1.6744 Public safety workers [0.07] 0.00 4 2.50 [0.17] 0.00 4 1.48 9 1.56 17 1.65 0.96—2.6445 Cooks and stewards [0.02] 0.00 45 1.08 1 0.32 35 1.13 68 1.03 149 1.05 0.89—1.2346 Domestic assistants 17 1.23 51 1.03 3 3.48 78 0.91 202 0.95 351 0.97 0.87—1.0747 Waiters 3 1.15 37 0.96 [0.37] 0.00 36 0.93 69 0.98 145 0.96 0.82—1.1348 Building caretakers 39 0.97 120 0.90 8 1.25 154 0.95 191 0.95 512 0.95 0.87—1.0349 Chimney sweeps [0.00] 0.00 [0.07] 0.00 – – [0.02] 0.00 [0.01] 0.00 [0.10] 0.00 0.00—35.5750 Hairdressers 2 0.77 21 1.41 [0.40] 0.00 6 0.55 33 0.94 62 0.97 0.74—1.2451 Launderers 10 2.26 9 0.93 3 3.21 19 1.47 37 1.07 78 1.25 0.99—1.5652 Military personnel [0.02] 0.00 [0.21] 0.00 – – [0.06] 0.00 [0.21] 0.00 [0.51] 0.00 0.00—7.1853 "Other workers" 14 1.20 42 0.93 11 1.63 80 0.92 85 0.92 232 0.95 0.84—1.0954 Economically inactive 285 0.95 742 1.00 13 0.55 1025 1.03 3570 0.98 5635 0.99 0.96—1.01
1-54 All categories 590 1.00 2478 1.00 99 1.00 2513 1.00 6789 1.00 12469 1.00 # REF. #
Obs = observed number of cases; SIR = standardised incidence ratio; 95% CI = 95% confidence interval
93 Index Prev Next

Acta Oncologica - Pukkala et al, 2008 Meningeoma
Observed number of meningeoma among men in the Nordic countries and standardised incidence ratios 1961-2005, by country andoccupational category
Denmark Finland Iceland Norway Sweden Total
No Occupational category Obs SIR Obs SIR Obs SIR Obs SIR Obs SIR Obs SIR 95% CI
1 Technical workers, etc 55 0.98 87 0.96 1 0.67 52 0.98 352 1.02 547 1.00 0.92—1.092 Laboratory assistants 3 2.73 1 0.42 [0.25] 0.00 2 0.86 4 1.87 10 1.22 0.59—2.253 Physicians 16 3.56 5 0.95 [0.49] 0.00 6 0.99 23 1.40 50 1.53 1.13—2.014 Dentists 1 0.73 [1.06] 0.00 [0.15] 0.00 3 1.15 11 1.43 15 1.16 0.65—1.925 Nurses [0.07] 0.00 [0.40] 0.00 [0.00] 0.00 [0.43] 0.00 1 0.70 1 0.43 0.01—2.386 Assistant nurses [1.36] 0.00 1 2.50 [0.07] 0.00 1 1.06 13 2.09 15 1.67 0.93—2.757 "Other health workers" 4 1.04 8 1.66 [0.14] 0.00 6 2.59 19 1.40 37 1.50 1.05—2.068 Teachers 31 1.24 43 1.20 2 1.05 39 1.07 114 1.24 229 1.20 1.05—1.369 Religious workers etc 7 0.72 29 1.35 2 1.54 17 0.98 70 0.94 125 1.01 0.85—1.2010 Artistic workers 3 1.00 3 0.43 2 6.02 3 0.60 22 1.04 33 0.90 0.62—1.2711 Journalists 1 0.68 6 1.77 1 4.79 5 2.18 9 0.90 22 1.27 0.79—1.9212 Administrators 56 0.93 57 1.09 2 0.68 61 1.05 137 1.08 313 1.05 0.94—1.1713 Clerical workers 28 1.05 33 1.00 3 0.88 41 0.92 130 0.94 235 0.96 0.84—1.0914 Sales agents 18 1.27 51 1.03 1 0.58 54 1.12 210 1.03 334 1.05 0.95—1.1715 Shop workers 67 1.13 17 0.75 1 0.81 25 1.17 60 0.93 170 1.01 0.87—1.1716 Farmers 79 0.71 162 0.85 3 0.63 88 0.82 278 0.88 610 0.84 0.77—0.9117 Gardeners 12 0.77 26 0.82 [0.16] 0.00 28 0.94 101 0.84 167 0.85 0.73—0.9918 Fishermen 8 1.44 [2.62] 0.00 5 1.43 31 0.82 13 1.02 57 0.92 0.69—1.1919 Forestry workers 1 0.45 31 0.82 [0.02] 0.00 24 1.18 66 0.75 122 0.82 0.69—0.9820 Miners and quarry workers 2 2.92 9 1.44 [0.05] 0.00 8 1.19 27 1.21 46 1.28 0.94—1.7021 Seamen 9 1.45 6 0.71 1 1.18 35 0.94 22 1.10 73 1.00 0.79—1.2622 Transport workers 18 1.38 27 1.16 4 2.54 17 0.92 68 1.02 134 1.09 0.92—1.2923 Drivers 40 0.94 99 1.20 [2.45] 0.00 52 0.97 180 1.06 371 1.06 0.95—1.1724 Postal workers 8 0.91 7 0.57 2 6.73 9 0.95 42 1.13 68 1.00 0.77—1.2725 Textile workers 8 1.12 8 1.09 [0.48] 0.00 9 0.95 50 1.31 75 1.20 0.94—1.5026 Shoe and leather workers 1 0.58 1 0.32 [0.10] 0.00 4 1.08 16 1.08 22 0.94 0.59—1.4227 Smelting workers 19 1.11 9 0.77 [0.70] 0.00 10 0.72 70 1.12 108 1.02 0.85—1.2428 Mechanics 44 0.97 89 1.07 [2.49] 0.00 69 0.91 305 0.99 507 0.99 0.90—1.0829 Plumbers 3 0.72 11 0.78 1 2.57 10 1.10 43 1.22 68 1.08 0.84—1.3730 Welders – – 20 1.35 [0.14] 0.00 10 0.91 36 0.87 66 0.98 0.76—1.2431 Electrical workers 13 1.16 38 1.03 [1.52] 0.00 48 1.42 112 1.03 211 1.10 0.96—1.2632 Wood workers 23 0.74 85 1.10 3 2.30 83 1.09 161 0.82 355 0.93 0.84—1.0333 Painters 12 1.17 22 1.27 [0.53] 0.00 12 0.94 49 0.85 95 0.97 0.78—1.1834 "Other construction workers" 26 0.71 49 0.97 3 1.05 9 0.55 84 0.79 171 0.80 0.69—0.9335 Bricklayers 16 1.43 7 0.87 – – 11 1.45 27 1.07 61 1.17 0.90—1.5136 Printers 9 1.22 5 0.56 [0.47] 0.00 8 0.92 30 0.93 52 0.90 0.67—1.1837 Chemical process workers 9 1.42 12 0.88 [0.23] 0.00 10 0.61 44 0.93 75 0.90 0.71—1.1238 Food workers 23 1.08 9 0.92 3 1.48 19 0.98 53 1.11 107 1.07 0.88—1.2939 Beverage workers 2 0.80 [0.60] 0.00 [0.03] 0.00 [0.36] 0.00 2 0.75 4 0.65 0.18—1.6740 Tobacco workers [0.38] 0.00 [0.11] 0.00 [0.00] 0.00 [0.27] 0.00 2 8.96 2 2.03 0.25—7.3341 Glass makers etc 10 0.82 10 0.69 [0.36] 0.00 14 1.36 44 0.83 78 0.86 0.68—1.0842 Packers 7 0.67 25 0.89 1 0.89 29 1.02 89 0.95 151 0.93 0.79—1.0943 Engine operators 16 1.40 49 1.18 3 1.75 19 0.95 106 1.28 193 1.23 1.06—1.4144 Public safety workers 7 0.67 27 1.19 2 1.72 12 0.91 51 1.03 99 1.02 0.83—1.2445 Cooks and stewards 1 1.19 [1.72] 0.00 1 1.69 6 0.91 10 1.05 18 0.93 0.55—1.4846 Domestic assistants [0.01] 0.00 [0.07] 0.00 [0.00] 0.00 1 14.83 1 0.90 2 1.58 0.19—5.7047 Waiters 3 1.79 4 2.32 [0.07] 0.00 1 0.38 6 1.24 14 1.28 0.70—2.1448 Building caretakers 16 1.49 15 0.83 1 2.25 6 0.90 29 0.76 67 0.90 0.70—1.1549 Chimney sweeps [0.30] 0.00 [1.36] 0.00 – – 1 1.47 4 1.43 5 0.98 0.32—2.2850 Hairdressers 5 1.62 [0.40] 0.00 [0.09] 0.00 2 1.08 11 1.20 18 1.24 0.73—1.9551 Launderers 1 0.66 [0.41] 0.00 [0.04] 0.00 1 0.92 6 0.91 8 0.83 0.36—1.6452 Military personnel 5 0.82 10 1.18 – – 16 1.26 24 0.84 55 0.98 0.74—1.2853 "Other workers" 39 1.17 20 0.92 4 0.90 61 1.20 106 0.93 230 1.03 0.90—1.1754 Economically inactive 32 1.17 111 1.10 4 1.19 29 1.09 232 1.26 408 1.19 1.08—1.31
1-54 All categories 817 1.00 1344 1.00 56 1.00 1117 1.00 3775 1.00 7109 1.00 # REF. #
Obs = observed number of cases; SIR = standardised incidence ratio; 95% CI = 95% confidence interval
94 Index Prev Next

Acta Oncologica - Pukkala et al, 2008 Meningeoma
Observed number of meningeoma among women in the Nordic countries and standardised incidence ratios 1961-2005, by country andoccupational category
Denmark Finland Iceland Norway Sweden Total
No Occupational category Obs SIR Obs SIR Obs SIR Obs SIR Obs SIR Obs SIR 95% CI
1 Technical workers, etc 8 1.40 38 1.25 [0.52] 0.00 4 0.70 59 1.24 109 1.21 1.01—1.462 Laboratory assistants 1 0.22 13 0.81 1 1.37 10 1.59 22 1.15 47 1.01 0.74—1.343 Physicians 6 3.17 9 1.16 [0.11] 0.00 3 1.20 10 0.81 28 1.14 0.76—1.644 Dentists 2 1.20 3 0.49 [0.05] 0.00 2 1.06 7 0.89 14 0.79 0.43—1.335 Nurses 42 1.28 103 1.26 5 1.58 48 0.95 135 1.00 333 1.09 0.98—1.226 Assistant nurses 21 0.85 70 0.94 1 0.22 51 1.02 283 1.11 426 1.04 0.95—1.157 "Other health workers" 18 0.96 53 0.85 [0.98] 0.00 45 0.97 68 0.77 184 0.85 0.73—0.988 Teachers 56 1.28 164 1.20 8 1.40 103 1.13 331 1.05 662 1.12 1.03—1.209 Religious workers etc 8 1.40 87 1.04 2 2.39 17 0.75 128 1.07 242 1.04 0.92—1.1810 Artistic workers [2.72] 0.00 9 0.74 3 4.39 6 0.96 22 1.07 40 0.94 0.67—1.2911 Journalists 1 1.58 11 1.48 [0.18] 0.00 1 0.53 13 1.31 26 1.30 0.85—1.9012 Administrators 18 1.10 31 1.21 1 2.01 25 1.24 54 1.15 129 1.18 0.99—1.4013 Clerical workers 187 1.07 511 1.11 8 0.46 268 0.99 747 1.02 1721 1.04 0.99—1.0914 Sales agents 1 0.67 65 1.12 3 1.78 25 0.89 84 0.88 178 0.96 0.83—1.1215 Shop workers 107 0.96 218 1.01 10 0.94 225 1.12 366 0.98 926 1.01 0.95—1.0816 Farmers 54 0.67 80 0.80 6 0.84 116 1.05 36 0.91 292 0.87 0.77—0.9717 Gardeners 8 0.78 255 0.81 [0.25] 0.00 65 0.96 86 0.92 414 0.85 0.77—0.9418 Fishermen [0.41] 0.00 [0.80] 0.00 [0.29] 0.00 [1.12] 0.00 2 5.86 2 0.68 0.08—2.4419 Forestry workers [0.11] 0.00 1 0.63 [0.04] 0.00 1 0.67 3 1.30 5 0.90 0.29—2.1120 Miners and quarry workers [0.01] 0.00 [0.58] 0.00 [0.01] 0.00 [0.10] 0.00 [0.61] 0.00 [1.30] 0.00 0.00—2.8421 Seamen – – [0.27] 0.00 [0.00] 0.00 [0.27] 0.00 [0.11] 0.00 [0.65] 0.00 0.00—5.6622 Transport workers [0.11] 0.00 5 0.55 [0.26] 0.00 4 2.99 7 0.97 16 0.89 0.51—1.4423 Drivers 2 0.70 5 0.88 [0.14] 0.00 5 1.11 23 1.19 35 1.08 0.75—1.5024 Postal workers 2 0.34 64 1.03 2 0.59 48 0.99 125 1.09 241 1.03 0.90—1.1625 Textile workers 36 0.96 138 1.02 8 1.43 53 0.87 216 1.10 451 1.04 0.94—1.1426 Shoe and leather workers 2 0.71 18 1.07 1 3.26 2 0.44 15 0.99 38 0.96 0.68—1.3227 Smelting workers 1 1.46 7 1.80 [0.02] 0.00 [0.80] 0.00 8 1.45 16 1.47 0.84—2.3928 Mechanics 9 1.27 16 0.82 [0.07] 0.00 3 0.46 47 0.88 75 0.87 0.68—1.0929 Plumbers [0.05] 0.00 [0.05] 0.00 – – [0.06] 0.00 [0.12] 0.00 [0.28] 0.00 0.00—12.9730 Welders – – 1 0.56 [0.01] 0.00 2 2.94 2 0.79 5 1.00 0.32—2.3331 Electrical workers 11 1.11 17 1.13 [0.05] 0.00 9 1.19 31 1.02 68 1.08 0.84—1.3732 Wood workers 5 1.55 34 1.04 [0.11] 0.00 4 1.48 9 0.95 52 1.07 0.80—1.4133 Painters [0.12] 0.00 5 1.19 [0.03] 0.00 3 5.27 3 1.25 11 1.50 0.75—2.6934 "Other construction workers" [0.09] 0.00 10 0.86 [0.02] 0.00 1 4.31 [0.42] 0.00 11 0.88 0.44—1.5835 Bricklayers [0.02] 0.00 [0.46] 0.00 – – [0.01] 0.00 [0.02] 0.00 [0.51] 0.00 0.00—7.2636 Printers 6 1.68 23 1.25 1 1.84 4 0.66 14 0.66 48 0.96 0.71—1.2837 Chemical process workers 3 0.55 4 0.45 [0.22] 0.00 5 0.94 19 1.21 31 0.87 0.59—1.2438 Food workers 33 1.20 46 1.04 14 1.09 37 1.18 43 0.99 173 1.08 0.93—1.2639 Beverage workers 3 1.21 1 0.43 [0.03] 0.00 [0.34] 0.00 1 0.38 5 0.64 0.21—1.4940 Tobacco workers 4 1.14 4 3.00 – – 1 1.03 [1.83] 0.00 9 1.18 0.54—2.2441 Glass makers etc 8 1.16 32 0.97 [0.35] 0.00 10 0.85 51 1.20 101 1.07 0.88—1.3042 Packers 2 1.04 53 0.92 1 0.85 28 1.02 62 1.00 146 0.97 0.83—1.1443 Engine operators [0.07] 0.00 9 0.91 [0.02] 0.00 2 3.55 10 1.87 21 1.32 0.82—2.0244 Public safety workers [0.18] 0.00 1 0.40 1 4.39 4 1.22 7 0.88 13 0.92 0.49—1.5745 Cooks and stewards [0.07] 0.00 68 1.04 4 0.93 27 0.84 91 1.08 190 1.02 0.89—1.1846 Domestic assistants 33 0.79 76 0.99 2 1.68 89 0.99 260 0.93 460 0.94 0.85—1.0347 Waiters 6 0.83 55 0.92 [0.55] 0.00 39 0.93 89 1.03 189 0.96 0.84—1.1148 Building caretakers 119 1.00 214 1.01 12 1.36 176 0.96 273 1.08 794 1.02 0.95—1.1049 Chimney sweeps [0.01] 0.00 [0.11] 0.00 – – [0.02] 0.00 [0.01] 0.00 [0.16] 0.00 0.00—23.4550 Hairdressers 7 0.92 23 0.99 1 1.57 11 0.95 46 1.05 88 1.02 0.81—1.2551 Launderers 13 0.97 11 0.71 [1.31] 0.00 18 1.35 48 1.13 90 1.04 0.84—1.2852 Military personnel [0.07] 0.00 1 2.93 – – [0.08] 0.00 [0.30] 0.00 1 1.26 0.03—7.0253 "Other workers" 35 1.02 68 0.96 9 0.92 83 0.85 137 1.18 332 1.01 0.91—1.1354 Economically inactive 859 1.01 1212 0.99 36 1.11 921 1.00 4391 0.98 7419 0.99 0.96—1.01
1-54 All categories 1737 1.00 3942 1.00 140 1.00 2604 1.00 8484 1.00 16907 1.00 # REF. #
Obs = observed number of cases; SIR = standardised incidence ratio; 95% CI = 95% confidence interval
95 Index Prev Next

Acta Oncologica - Pukkala et al, 2008 Thyroid cancer
Observed number of thyroid cancer among men in the Nordic countries and standardised incidence ratios 1961-2005, by country andoccupational category
Denmark Finland Iceland Norway Sweden Total
No Occupational category Obs SIR Obs SIR Obs SIR Obs SIR Obs SIR Obs SIR 95% CI
1 Technical workers, etc 43 1.14 125 1.16 2 0.61 36 0.66 278 1.04 484 1.03 0.94—1.122 Laboratory assistants 1 1.34 2 0.70 2 3.31 1 0.40 2 1.17 8 0.95 0.41—1.883 Physicians 1 0.33 5 0.80 2 1.69 5 0.73 12 0.92 25 0.82 0.53—1.224 Dentists 1 1.10 1 0.78 [0.34] 0.00 4 1.36 6 1.01 12 1.05 0.54—1.835 Nurses [0.04] 0.00 1 1.70 [0.01] 0.00 [0.48] 0.00 [1.27] 0.00 1 0.42 0.01—2.336 Assistant nurses [0.91] 0.00 1 1.69 [0.17] 0.00 [1.10] 0.00 7 1.37 8 1.01 0.44—2.007 "Other health workers" 4 1.51 5 0.88 [0.32] 0.00 4 1.49 14 1.30 27 1.22 0.80—1.778 Teachers 20 1.21 45 1.11 4 0.89 48 1.20 82 1.15 199 1.15 1.00—1.329 Religious workers etc 7 1.03 24 0.90 5 1.70 22 1.11 58 0.98 116 1.00 0.84—1.2010 Artistic workers 1 0.47 12 1.45 1 1.29 5 0.91 12 0.72 31 0.93 0.63—1.3211 Journalists [1.01] 0.00 2 0.51 [0.47] 0.00 2 0.79 10 1.25 14 0.88 0.48—1.4812 Administrators 46 1.11 75 1.26 7 1.02 64 0.97 104 1.05 296 1.09 0.97—1.2213 Clerical workers 25 1.35 58 1.56 10 1.27 49 1.01 122 1.13 264 1.20 1.06—1.3514 Sales agents 6 0.61 57 1.01 4 1.01 55 0.98 160 1.00 282 0.99 0.88—1.1115 Shop workers 40 0.96 19 0.72 2 0.69 22 0.95 42 0.83 125 0.86 0.73—1.0316 Farmers 57 0.73 190 0.95 9 0.81 143 1.02 240 0.98 639 0.95 0.88—1.0217 Gardeners 9 0.81 32 0.93 [0.38] 0.00 33 0.95 62 0.66 136 0.78 0.66—0.9218 Fishermen 1 0.26 [2.88] 0.00 12 1.49 73 1.60 7 0.70 93 1.32 1.07—1.6219 Forestry workers 2 1.23 24 0.59 [0.07] 0.00 19 0.75 75 1.09 120 0.88 0.73—1.0520 Miners and quarry workers [0.51] 0.00 5 0.74 1 7.85 7 0.90 14 0.79 27 0.82 0.54—1.1921 Seamen 2 0.47 9 0.95 2 1.01 49 1.20 18 1.14 80 1.10 0.88—1.3822 Transport workers 9 0.99 26 1.03 7 1.93 18 0.90 52 1.02 112 1.03 0.85—1.2423 Drivers 24 0.81 99 1.08 2 0.35 49 0.82 156 1.17 330 1.03 0.92—1.1524 Postal workers 8 1.37 11 0.79 [0.68] 0.00 12 1.06 25 0.84 56 0.91 0.69—1.1825 Textile workers 2 0.39 7 0.88 1 0.89 11 0.99 32 1.07 53 0.96 0.72—1.2526 Shoe and leather workers 1 0.79 6 1.75 [0.23] 0.00 4 0.86 11 0.94 22 1.03 0.65—1.5627 Smelting workers 10 0.84 13 1.01 [1.66] 0.00 20 1.24 43 0.87 86 0.94 0.75—1.1628 Mechanics 26 0.82 110 1.15 8 1.37 82 0.99 234 0.97 460 1.01 0.92—1.1029 Plumbers 3 1.04 13 0.81 1 1.12 8 0.81 23 0.83 48 0.84 0.62—1.1130 Welders – – 16 0.91 1 2.84 9 0.79 38 1.17 64 1.03 0.80—1.3231 Electrical workers 5 0.65 42 0.97 6 1.71 38 1.03 89 1.04 180 1.02 0.88—1.1832 Wood workers 24 1.11 86 1.02 2 0.66 80 0.91 140 0.91 332 0.95 0.85—1.0533 Painters 9 1.25 19 0.99 1 0.82 14 0.93 49 1.08 92 1.05 0.84—1.2834 "Other construction workers" 37 1.38 40 0.73 4 0.61 17 0.89 64 0.76 162 0.85 0.73—0.9935 Bricklayers 12 1.52 5 0.57 – – 7 0.80 22 1.12 46 1.02 0.75—1.3636 Printers 9 1.76 9 0.86 [1.07] 0.00 5 0.50 20 0.79 43 0.83 0.60—1.1137 Chemical process workers 5 1.09 16 1.04 1 1.83 18 0.91 36 0.96 76 0.98 0.77—1.2338 Food workers 17 1.13 12 1.10 2 0.42 31 1.36 34 0.91 96 1.06 0.86—1.2939 Beverage workers 7 3.80 [0.67] 0.00 [0.08] 0.00 [0.37] 0.00 1 0.47 8 1.57 0.68—3.0940 Tobacco workers 1 3.41 [0.13] 0.00 [0.00] 0.00 [0.34] 0.00 [0.18] 0.00 1 1.06 0.03—5.9241 Glass makers etc 6 0.69 9 0.55 1 1.15 9 0.77 36 0.86 61 0.77 0.59—0.9942 Packers 4 0.52 31 0.99 2 0.75 29 0.84 79 1.06 145 0.96 0.82—1.1343 Engine operators 8 1.00 42 0.89 3 0.76 28 1.27 70 1.07 151 1.03 0.88—1.2144 Public safety workers 10 1.38 31 1.20 5 1.87 15 1.00 51 1.31 112 1.25 1.04—1.5045 Cooks and stewards [0.60] 0.00 3 1.34 [1.37] 0.00 8 1.09 7 0.90 18 0.93 0.55—1.4846 Domestic assistants [0.01] 0.00 [0.09] 0.00 [0.00] 0.00 [0.07] 0.00 2 2.05 2 1.74 0.21—6.2747 Waiters 2 1.59 2 0.88 [0.16] 0.00 2 0.66 6 1.53 12 1.13 0.58—1.9748 Building caretakers 9 1.15 21 1.04 2 1.95 13 1.61 30 0.98 75 1.10 0.87—1.3849 Chimney sweeps [0.21] 0.00 1 0.68 – – 2 2.53 3 1.36 6 1.28 0.47—2.7950 Hairdressers 3 1.35 [0.47] 0.00 [0.20] 0.00 4 1.81 12 1.67 19 1.55 0.93—2.4151 Launderers 2 1.85 1 2.16 [0.10] 0.00 1 0.78 3 0.58 7 0.87 0.35—1.7952 Military personnel 7 1.79 20 2.01 – – 15 1.19 21 0.95 63 1.29 0.99—1.6653 "Other workers" 22 0.91 21 0.86 9 0.87 55 0.86 84 0.93 191 0.90 0.78—1.0354 Economically inactive 29 1.20 108 0.91 9 1.14 50 1.34 175 1.14 371 1.08 0.98—1.20
1-54 All categories 577 1.00 1512 1.00 130 1.00 1295 1.00 2973 1.00 6487 1.00 # REF. #
Obs = observed number of cases; SIR = standardised incidence ratio; 95% CI = 95% confidence interval
96 Index Prev Next

Acta Oncologica - Pukkala et al, 2008 Thyroid cancer
Observed number of thyroid cancer among women in the Nordic countries and standardised incidence ratios 1961-2005, by country andoccupational category
Denmark Finland Iceland Norway Sweden Total
No Occupational category Obs SIR Obs SIR Obs SIR Obs SIR Obs SIR Obs SIR 95% CI
1 Technical workers, etc 3 0.82 46 0.97 2 1.76 10 1.59 42 1.11 103 1.07 0.88—1.302 Laboratory assistants 6 2.19 20 0.88 1 0.70 5 0.73 20 1.37 52 1.08 0.80—1.413 Physicians [1.21] 0.00 18 1.47 1 4.99 2 0.70 2 0.21 23 0.88 0.56—1.324 Dentists [1.07] 0.00 7 0.83 [0.08] 0.00 [2.18] 0.00 10 1.57 17 0.94 0.55—1.515 Nurses 25 1.16 138 1.19 8 1.39 57 1.08 101 0.93 329 1.08 0.97—1.206 Assistant nurses 11 0.71 119 1.21 12 1.43 49 0.96 202 1.00 393 1.05 0.95—1.167 "Other health workers" 10 0.82 104 1.20 [1.90] 0.00 47 0.95 67 0.96 228 1.04 0.91—1.188 Teachers 29 1.05 184 0.99 14 1.29 100 0.99 239 0.96 566 0.99 0.91—1.079 Religious workers etc 2 0.55 134 1.01 3 1.93 35 1.42 83 0.88 257 1.00 0.89—1.1310 Artistic workers 2 1.05 16 0.89 [1.18] 0.00 9 1.28 21 1.27 48 1.08 0.79—1.4311 Journalists [0.41] 0.00 6 0.57 [0.32] 0.00 1 0.49 9 1.14 16 0.76 0.43—1.2312 Administrators 4 0.36 31 0.81 1 1.39 22 0.95 28 0.75 86 0.78 0.62—0.9613 Clerical workers 97 0.89 585 0.90 36 1.12 274 0.94 546 0.93 1538 0.92 0.88—0.9714 Sales agents [0.97] 0.00 74 0.94 1 0.38 23 0.65 63 0.80 161 0.82 0.70—0.9615 Shop workers 60 0.82 244 0.90 15 0.84 195 0.91 287 0.92 801 0.90 0.84—0.9716 Farmers 63 1.22 138 1.05 8 0.74 171 1.30 40 1.26 420 1.18 1.07—1.3017 Gardeners 2 0.30 382 1.06 [0.40] 0.00 84 1.08 76 0.97 544 1.04 0.95—1.1318 Fishermen [0.26] 0.00 1 0.93 [0.51] 0.00 3 2.59 [0.28] 0.00 4 1.22 0.33—3.1219 Forestry workers [0.07] 0.00 1 0.49 [0.07] 0.00 1 0.67 1 0.53 3 0.54 0.11—1.5820 Miners and quarry workers [0.01] 0.00 1 1.47 [0.01] 0.00 [0.11] 0.00 [0.48] 0.00 1 0.78 0.02—4.3421 Seamen – – [0.41] 0.00 [0.01] 0.00 1 3.56 [0.09] 0.00 1 1.27 0.03—7.0622 Transport workers [0.07] 0.00 9 0.82 [0.40] 0.00 [1.48] 0.00 7 1.15 16 0.84 0.48—1.3723 Drivers 1 0.55 8 1.02 1 3.97 4 0.82 17 1.12 31 1.03 0.70—1.4724 Postal workers 1 0.26 81 1.03 7 1.34 54 1.00 99 1.05 242 1.03 0.91—1.1725 Textile workers 22 0.90 171 1.02 9 1.10 69 0.93 173 1.03 444 1.00 0.91—1.1026 Shoe and leather workers 2 1.12 21 1.01 [0.47] 0.00 5 0.93 14 1.07 42 1.01 0.73—1.3727 Smelting workers 1 2.27 6 1.27 [0.02] 0.00 [0.80] 0.00 4 0.91 11 1.06 0.53—1.9028 Mechanics 9 2.08 24 0.95 [0.11] 0.00 3 0.41 49 1.13 85 1.06 0.85—1.3129 Plumbers [0.04] 0.00 [0.08] 0.00 – – [0.06] 0.00 [0.09] 0.00 [0.27] 0.00 0.00—13.4530 Welders – – 5 2.04 [0.02] 0.00 [0.70] 0.00 3 1.51 8 1.55 0.67—3.0631 Electrical workers 13 2.13 27 1.26 [0.09] 0.00 11 1.36 24 0.98 75 1.24 0.98—1.5632 Wood workers 6 3.00 32 0.82 [0.18] 0.00 4 1.47 11 1.44 53 1.03 0.77—1.3433 Painters [0.08] 0.00 5 0.96 [0.06] 0.00 1 1.71 [1.96] 0.00 6 0.76 0.28—1.6634 "Other construction workers" [0.06] 0.00 13 0.97 [0.04] 0.00 [0.25] 0.00 1 3.12 14 1.00 0.54—1.6735 Bricklayers [0.01] 0.00 [0.53] 0.00 – – [0.01] 0.00 [0.01] 0.00 [0.57] 0.00 0.00—6.4636 Printers 3 1.30 20 0.82 [0.92] 0.00 4 0.56 12 0.68 39 0.75 0.53—1.0237 Chemical process workers 3 0.84 5 0.46 [0.32] 0.00 6 0.98 12 0.91 26 0.77 0.50—1.1238 Food workers 21 1.20 49 0.92 15 0.71 39 1.07 40 1.09 164 0.99 0.85—1.1639 Beverage workers 1 0.60 3 1.08 [0.04] 0.00 [0.35] 0.00 1 0.44 5 0.70 0.23—1.6440 Tobacco workers 2 0.86 3 1.92 – – [1.33] 0.00 1 0.66 6 0.89 0.33—1.9441 Glass makers etc 4 0.93 37 0.90 1 1.69 19 1.44 39 1.11 100 1.06 0.87—1.2942 Packers 1 0.82 69 0.98 1 0.56 21 0.70 58 1.12 150 0.96 0.82—1.1343 Engine operators [0.04] 0.00 13 1.04 [0.04] 0.00 [0.57] 0.00 2 0.48 15 0.87 0.48—1.4344 Public safety workers [0.14] 0.00 4 1.11 [0.38] 0.00 3 0.84 3 0.47 10 0.71 0.34—1.3045 Cooks and stewards [0.05] 0.00 103 1.19 5 0.77 38 0.96 63 0.88 209 1.02 0.89—1.1746 Domestic assistants 28 1.02 108 0.97 3 1.80 97 0.92 219 0.96 455 0.96 0.87—1.0547 Waiters 3 0.64 68 0.87 [0.92] 0.00 39 0.83 78 1.06 188 0.92 0.80—1.0648 Building caretakers 71 0.89 291 1.08 12 0.90 218 1.11 235 1.13 827 1.08 1.01—1.1549 Chimney sweeps [0.01] 0.00 [0.13] 0.00 – – [0.02] 0.00 [0.01] 0.00 [0.17] 0.00 0.00—22.0050 Hairdressers 4 0.79 26 0.82 2 1.54 7 0.53 21 0.59 60 0.69 0.53—0.8951 Launderers 9 1.01 19 1.03 [1.81] 0.00 8 0.50 26 0.71 62 0.76 0.58—0.9752 Military personnel [0.05] 0.00 [0.51] 0.00 – – [0.08] 0.00 [0.23] 0.00 [0.86] 0.00 0.00—4.2853 "Other workers" 29 1.28 83 0.89 23 1.46 93 0.88 96 1.01 324 0.97 0.87—1.0854 Economically inactive 646 1.04 1530 1.02 51 0.97 1357 1.03 3919 1.03 7503 1.02 1.00—1.05
1-54 All categories 1194 1.00 5082 1.00 232 1.00 3189 1.00 7064 1.00 16761 1.00 # REF. #
Obs = observed number of cases; SIR = standardised incidence ratio; 95% CI = 95% confidence interval
97 Index Prev Next

Acta Oncologica - Pukkala et al, 2008 Follicular thyroid cancer
Observed number of follicular thyroid cancer among men in the Nordic countries and standardised incidence ratios 1961-2005, bycountry and occupational category
Denmark Finland Iceland Norway Sweden Total
No Occupational category Obs SIR Obs SIR Obs SIR Obs SIR Obs SIR Obs SIR 95% CI
1 Technical workers, etc – – 12 0.77 [0.40] 0.00 3 0.48 16 1.02 31 0.81 0.55—1.162 Laboratory assistants – – [0.39] 0.00 [0.08] 0.00 [0.29] 0.00 [0.15] 0.00 [0.91] 0.00 0.00—4.063 Physicians – – [0.90] 0.00 [0.18] 0.00 2 2.45 [0.85] 0.00 2 0.73 0.09—2.634 Dentists – – [0.19] 0.00 [0.04] 0.00 [0.33] 0.00 [0.35] 0.00 [0.92] 0.00 0.00—4.025 Nurses – – [0.06] 0.00 [0.00] 0.00 [0.05] 0.00 [0.13] 0.00 [0.23] 0.00 0.00—15.776 Assistant nurses – – [0.05] 0.00 [0.02] 0.00 [0.13] 0.00 [0.34] 0.00 [0.54] 0.00 0.00—6.857 "Other health workers" – – 1 1.16 [0.05] 0.00 2 6.43 3 4.78 6 3.24 1.19—7.048 Teachers – – 5 0.80 [0.63] 0.00 6 1.32 2 0.43 13 0.81 0.43—1.389 Religious workers etc – – 2 0.55 [0.42] 0.00 1 0.43 4 1.02 7 0.68 0.27—1.4010 Artistic workers – – 2 1.60 [0.11] 0.00 1 1.54 1 1.04 4 1.34 0.37—3.4411 Journalists – – 1 1.64 [0.06] 0.00 1 3.41 [0.46] 0.00 2 1.40 0.17—5.0712 Administrators – – 15 1.55 3 2.57 5 0.64 4 0.84 27 1.15 0.76—1.6813 Clerical workers – – 9 1.42 2 1.52 7 1.23 4 0.73 22 1.17 0.73—1.7714 Sales agents – – 4 0.44 2 2.99 7 1.06 6 0.73 19 0.77 0.46—1.2015 Shop workers – – 4 1.02 [0.45] 0.00 3 1.12 2 0.75 9 0.93 0.42—1.7616 Farmers – – 43 1.00 1 0.50 13 0.76 10 1.28 67 0.96 0.74—1.2217 Gardeners – – 5 0.81 [0.06] 0.00 4 0.96 [3.51] 0.00 9 0.65 0.30—1.2318 Fishermen – – [0.56] 0.00 [0.97] 0.00 5 0.91 [0.36] 0.00 5 0.68 0.22—1.5819 Forestry workers – – 2 0.27 [0.01] 0.00 3 0.97 4 1.58 9 0.70 0.32—1.3220 Miners and quarry workers – – [1.18] 0.00 [0.02] 0.00 [0.94] 0.00 [0.71] 0.00 [2.85] 0.00 0.00—1.2921 Seamen – – [1.57] 0.00 [0.29] 0.00 [4.75] 0.00 2 2.82 2 0.27 0.03—0.9922 Transport workers – – 9 1.97 1 1.59 1 0.42 1 0.39 12 1.18 0.61—2.0723 Drivers – – 23 1.55 [0.83] 0.00 8 1.13 4 0.57 35 1.18 0.82—1.6424 Postal workers – – 1 0.44 [0.12] 0.00 [1.28] 0.00 3 1.97 4 0.77 0.21—1.9725 Textile workers – – [1.47] 0.00 [0.20] 0.00 1 0.74 1 0.89 2 0.48 0.06—1.7426 Shoe and leather workers – – 1 1.54 [0.05] 0.00 1 1.79 1 2.95 3 1.88 0.39—5.5027 Smelting workers – – 2 0.87 [0.26] 0.00 5 2.60 [1.97] 0.00 7 1.09 0.44—2.2428 Mechanics – – 24 1.60 [0.79] 0.00 13 1.33 19 1.50 56 1.47 1.11—1.9129 Plumbers – – 2 0.80 1 7.80 2 1.72 [1.42] 0.00 5 0.96 0.31—2.2430 Welders – – 3 1.22 1 24.41 1 0.75 2 1.05 7 1.22 0.49—2.5131 Electrical workers – – 4 0.63 [0.44] 0.00 5 1.17 6 1.21 15 0.94 0.52—1.5432 Wood workers – – 11 0.70 [0.49] 0.00 4 0.37 8 1.24 23 0.69 0.44—1.0433 Painters – – 2 0.60 [0.20] 0.00 3 1.65 3 1.51 8 1.09 0.47—2.1534 "Other construction workers" – – 3 0.29 1 1.09 3 1.34 2 0.60 9 0.54 0.25—1.0335 Bricklayers – – 2 1.24 – – [1.07] 0.00 [0.78] 0.00 2 0.58 0.07—2.0836 Printers – – 1 0.65 [0.16] 0.00 1 0.87 4 2.97 6 1.43 0.52—3.1137 Chemical process workers – – 4 1.58 [0.09] 0.00 1 0.42 1 0.69 6 0.93 0.34—2.0338 Food workers – – 1 0.55 1 1.28 3 1.11 1 0.61 6 0.87 0.32—1.8839 Beverage workers – – [0.12] 0.00 [0.01] 0.00 [0.04] 0.00 [0.08] 0.00 [0.25] 0.00 0.00—14.7340 Tobacco workers – – [0.02] 0.00 [0.00] 0.00 [0.04] 0.00 [0.01] 0.00 [0.07] 0.00 0.00—50.8041 Glass makers etc – – 1 0.38 [0.13] 0.00 2 1.44 [1.85] 0.00 3 0.50 0.10—1.4542 Packers – – 4 0.73 [0.45] 0.00 5 1.23 1 0.35 10 0.78 0.37—1.4343 Engine operators – – 9 1.22 1 1.80 8 3.13 2 0.61 20 1.45 0.89—2.2444 Public safety workers – – 7 1.65 2 4.67 1 0.55 7 3.16 17 1.95 1.14—3.1245 Cooks and stewards – – [0.28] 0.00 [0.19] 0.00 2 2.38 [0.47] 0.00 2 1.13 0.14—4.0746 Domestic assistants – – [0.02] 0.00 [0.00] 0.00 [0.01] 0.00 [0.08] 0.00 [0.11] 0.00 0.00—33.4847 Waiters – – 1 3.68 [0.02] 0.00 [0.35] 0.00 1 4.56 2 2.31 0.28—8.3648 Building caretakers – – 3 0.84 [0.21] 0.00 3 3.18 1 0.71 7 1.14 0.46—2.3549 Chimney sweeps – – [0.26] 0.00 – – [0.09] 0.00 [0.11] 0.00 [0.47] 0.00 0.00—7.8450 Hairdressers – – [0.08] 0.00 [0.03] 0.00 [0.26] 0.00 1 3.35 1 1.51 0.04—8.4251 Launderers – – [0.07] 0.00 [0.02] 0.00 1 6.42 [0.21] 0.00 1 2.18 0.06—12.1452 Military personnel – – 6 4.29 – – 1 0.70 2 1.52 9 2.17 0.99—4.1253 "Other workers" – – 6 1.39 4 2.33 9 1.19 3 0.88 22 1.29 0.81—1.9654 Economically inactive – – 27 1.11 [1.19] 0.00 6 1.63 10 1.48 43 1.20 0.87—1.61
1-54 All categories – – 262 1.00 20 1.00 153 1.00 142 1.00 577 1.00 # REF. #
Obs = observed number of cases; SIR = standardised incidence ratio; 95% CI = 95% confidence interval
98 Index Prev Next

Acta Oncologica - Pukkala et al, 2008 Follicular thyroid cancer
Observed number of follicular thyroid cancer among women in the Nordic countries and standardised incidence ratios 1961-2005, bycountry and occupational category
Denmark Finland Iceland Norway Sweden Total
No Occupational category Obs SIR Obs SIR Obs SIR Obs SIR Obs SIR Obs SIR 95% CI
1 Technical workers, etc – – 1 0.24 [0.13] 0.00 1 1.27 [2.14] 0.00 2 0.28 0.03—1.002 Laboratory assistants – – 2 0.85 [0.16] 0.00 2 2.22 2 2.00 6 1.36 0.50—2.953 Physicians – – [1.02] 0.00 [0.03] 0.00 [0.37] 0.00 [0.61] 0.00 [2.03] 0.00 0.00—1.824 Dentists – – 2 1.93 [0.01] 0.00 [0.29] 0.00 1 2.87 3 1.78 0.37—5.205 Nurses – – 11 0.92 2 2.87 7 1.00 6 1.00 26 1.01 0.66—1.496 Assistant nurses – – 17 1.38 2 2.00 4 0.59 10 0.87 33 1.04 0.72—1.477 "Other health workers" – – 11 1.14 [0.22] 0.00 5 0.77 3 0.73 19 0.93 0.56—1.458 Teachers – – 16 0.75 1 0.78 15 1.14 9 0.66 41 0.83 0.59—1.129 Religious workers etc – – 7 0.66 [0.18] 0.00 [3.24] 0.00 11 1.90 18 0.91 0.54—1.4410 Artistic workers – – 2 1.16 [0.14] 0.00 [0.95] 0.00 1 1.08 3 0.80 0.17—2.3411 Journalists – – 1 0.89 [0.04] 0.00 [0.27] 0.00 1 2.24 2 1.07 0.13—3.8612 Administrators – – 3 0.82 [0.09] 0.00 3 0.98 2 0.97 8 0.90 0.39—1.7713 Clerical workers – – 58 0.83 6 1.58 38 0.96 25 0.80 127 0.88 0.74—1.0514 Sales agents – – 5 0.50 [0.33] 0.00 3 0.60 3 0.86 11 0.59 0.29—1.0515 Shop workers – – 42 1.12 2 0.95 34 1.10 16 1.18 94 1.12 0.91—1.3716 Farmers – – 22 1.06 [1.33] 0.00 25 1.21 1 0.80 48 1.09 0.80—1.4517 Gardeners – – 70 1.10 [0.05] 0.00 10 0.80 7 2.19 87 1.09 0.88—1.3518 Fishermen – – [0.14] 0.00 [0.06] 0.00 [0.16] 0.00 [0.01] 0.00 [0.37] 0.00 0.00—9.9519 Forestry workers – – 1 3.72 [0.01] 0.00 [0.23] 0.00 [0.09] 0.00 1 1.68 0.04—9.3820 Miners and quarry workers – – 1 8.44 [0.00] 0.00 [0.01] 0.00 [0.03] 0.00 1 6.29 0.16—35.0221 Seamen – – [0.04] 0.00 [0.00] 0.00 [0.04] 0.00 [0.01] 0.00 [0.08] 0.00 0.00—44.0522 Transport workers – – 1 0.56 [0.05] 0.00 [0.19] 0.00 [0.32] 0.00 1 0.43 0.01—2.3923 Drivers – – 2 2.34 [0.03] 0.00 1 1.49 1 1.20 4 1.67 0.46—4.2924 Postal workers – – 14 1.26 [0.64] 0.00 9 1.22 9 1.98 32 1.35 0.93—1.9125 Textile workers – – 27 1.10 [1.02] 0.00 16 1.48 9 1.49 52 1.22 0.91—1.6026 Shoe and leather workers – – 2 0.65 [0.06] 0.00 [0.78] 0.00 [0.48] 0.00 2 0.45 0.06—1.6427 Smelting workers – – [0.72] 0.00 [0.00] 0.00 [0.10] 0.00 1 4.29 1 0.94 0.02—5.2628 Mechanics – – 4 1.23 [0.01] 0.00 1 0.99 [2.17] 0.00 5 0.78 0.25—1.8129 Plumbers – – [0.01] 0.00 – – [0.01] 0.00 [0.01] 0.00 [0.02] 0.00 0.00—176.2530 Welders – – [0.26] 0.00 [0.00] 0.00 [0.09] 0.00 [0.12] 0.00 [0.47] 0.00 0.00—7.8231 Electrical workers – – 3 1.37 [0.01] 0.00 1 0.89 2 1.55 6 1.30 0.48—2.8332 Wood workers – – 4 0.64 [0.02] 0.00 1 2.73 1 2.43 6 0.85 0.31—1.8433 Painters – – 2 2.62 [0.01] 0.00 [0.08] 0.00 [0.10] 0.00 2 2.10 0.25—7.5834 "Other construction workers" – – 2 0.81 [0.00] 0.00 [0.03] 0.00 [0.02] 0.00 2 0.79 0.10—2.8535 Bricklayers – – [0.08] 0.00 – – [0.00] 0.00 [0.00] 0.00 [0.08] 0.00 0.00—43.7236 Printers – – 2 0.62 [0.11] 0.00 [0.99] 0.00 [0.82] 0.00 2 0.39 0.05—1.4137 Chemical process workers – – [1.62] 0.00 [0.04] 0.00 [0.87] 0.00 [0.58] 0.00 [3.10] 0.00 0.00—1.1938 Food workers – – 3 0.36 2 0.78 5 0.93 1 0.72 11 0.62 0.31—1.1139 Beverage workers – – [0.47] 0.00 [0.01] 0.00 [0.05] 0.00 [0.08] 0.00 [0.60] 0.00 0.00—6.1340 Tobacco workers – – 1 3.83 – – [0.19] 0.00 [0.07] 0.00 1 1.93 0.05—10.7541 Glass makers etc – – 9 1.52 [0.07] 0.00 6 3.19 5 3.14 20 2.11 1.29—3.2642 Packers – – 13 1.24 [0.21] 0.00 6 1.36 2 0.88 21 1.21 0.75—1.8543 Engine operators – – [1.72] 0.00 [0.00] 0.00 [0.07] 0.00 [0.25] 0.00 [2.04] 0.00 0.00—1.8144 Public safety workers – – [0.39] 0.00 [0.05] 0.00 [0.52] 0.00 [0.41] 0.00 [1.36] 0.00 0.00—2.7145 Cooks and stewards – – 15 1.30 [0.81] 0.00 7 1.19 1 0.39 23 1.11 0.70—1.6646 Domestic assistants – – 12 0.98 [0.21] 0.00 14 0.93 18 1.64 44 1.14 0.83—1.5347 Waiters – – 11 1.09 [0.11] 0.00 5 0.74 3 1.05 19 0.96 0.58—1.4948 Building caretakers – – 48 1.22 1 0.62 34 1.19 9 1.03 92 1.17 0.95—1.4449 Chimney sweeps – – [0.02] 0.00 – – [0.00] 0.00 [0.00] 0.00 [0.03] 0.00 0.00—145.0350 Hairdressers – – 5 1.32 [0.14] 0.00 3 1.64 1 0.56 9 1.19 0.54—2.2651 Launderers – – [3.14] 0.00 [0.23] 0.00 1 0.42 [1.23] 0.00 1 0.14 0.00—0.8052 Military personnel – – [0.04] 0.00 – – [0.01] 0.00 [0.02] 0.00 [0.06] 0.00 0.00—57.0053 "Other workers" – – 11 0.89 6 3.19 8 0.55 [4.31] 0.00 25 0.75 0.49—1.1154 Economically inactive – – 263 1.01 6 0.93 182 1.00 133 0.98 584 1.00 0.92—1.08
1-54 All categories – – 726 1.00 28 1.00 447 1.00 294 1.00 1495 1.00 # REF. #
Obs = observed number of cases; SIR = standardised incidence ratio; 95% CI = 95% confidence interval
99 Index Prev Next

Acta Oncologica - Pukkala et al, 2008 Papillary thyroid cancer
Observed number of papillary thyroid cancer among men in the Nordic countries and standardised incidence ratios 1961-2005, bycountry and occupational category
Denmark Finland Iceland Norway Sweden Total
No Occupational category Obs SIR Obs SIR Obs SIR Obs SIR Obs SIR Obs SIR 95% CI
1 Technical workers, etc – – 85 1.19 2 0.80 21 0.63 48 1.05 156 1.02 0.87—1.192 Laboratory assistants – – 1 0.51 2 4.43 1 0.70 1 1.84 5 1.15 0.37—2.673 Physicians – – 5 1.20 1 1.14 2 0.52 2 0.74 10 0.86 0.41—1.584 Dentists – – 1 1.19 [0.27] 0.00 2 1.22 [1.01] 0.00 3 0.80 0.16—2.345 Nurses – – 1 2.20 [0.01] 0.00 [0.35] 0.00 [0.56] 0.00 1 0.73 0.02—4.056 Assistant nurses – – 1 2.15 [0.13] 0.00 [0.58] 0.00 3 2.34 4 1.63 0.44—4.187 "Other health workers" – – 3 0.82 [0.23] 0.00 1 0.66 [2.01] 0.00 4 0.54 0.15—1.388 Teachers – – 30 1.15 2 0.60 33 1.39 12 0.84 77 1.14 0.90—1.439 Religious workers etc – – 19 1.04 5 2.31 13 1.16 12 0.88 49 1.08 0.80—1.4310 Artistic workers – – 9 1.68 1 1.74 2 0.66 5 1.71 17 1.43 0.83—2.2911 Journalists – – 1 0.40 [0.35] 0.00 [1.45] 0.00 [1.44] 0.00 1 0.17 0.00—0.9712 Administrators – – 50 1.34 4 0.81 35 0.98 13 1.02 102 1.13 0.93—1.3713 Clerical workers – – 35 1.56 7 1.23 24 0.91 11 0.72 77 1.10 0.87—1.3814 Sales agents – – 44 1.26 2 0.69 33 1.14 19 0.80 98 1.08 0.88—1.3215 Shop workers – – 9 0.52 2 0.95 9 0.68 10 1.36 30 0.75 0.51—1.0716 Farmers – – 93 0.93 7 0.89 72 1.17 21 1.24 193 1.04 0.90—1.2017 Gardeners – – 20 0.99 [0.27] 0.00 15 0.92 6 0.71 41 0.91 0.65—1.2318 Fishermen – – [1.55] 0.00 11 1.79 39 1.82 1 1.17 51 1.70 1.27—2.2319 Forestry workers – – 14 0.59 [0.05] 0.00 9 0.79 10 1.64 33 0.80 0.55—1.1220 Miners and quarry workers – – 3 0.74 1 10.46 4 1.01 2 1.08 10 1.00 0.48—1.8421 Seamen – – 7 1.20 1 0.69 33 1.48 4 2.05 45 1.43 1.04—1.9122 Transport workers – – 10 0.68 5 1.90 11 1.07 6 0.94 32 0.94 0.65—1.3323 Drivers – – 56 0.99 2 0.47 23 0.70 24 1.18 105 0.92 0.76—1.1124 Postal workers – – 8 0.92 [0.48] 0.00 8 1.37 [4.67] 0.00 16 0.81 0.47—1.3225 Textile workers – – 4 0.88 1 1.29 6 1.14 1 0.38 12 0.91 0.47—1.5926 Shoe and leather workers – – 4 2.09 [0.16] 0.00 2 0.97 [0.75] 0.00 6 1.23 0.45—2.6827 Smelting workers – – 6 0.79 [1.20] 0.00 7 0.86 8 1.57 21 0.96 0.59—1.4628 Mechanics – – 66 1.08 7 1.61 36 0.79 34 0.93 143 0.97 0.82—1.1429 Plumbers – – 8 0.78 [0.66] 0.00 2 0.36 2 0.50 12 0.59 0.30—1.0230 Welders – – 9 0.75 [0.26] 0.00 6 0.89 8 1.42 23 0.93 0.59—1.4031 Electrical workers – – 29 1.02 6 2.28 25 1.21 17 1.14 77 1.16 0.91—1.4532 Wood workers – – 49 1.02 2 0.91 48 1.09 17 0.97 116 1.04 0.87—1.2533 Painters – – 10 0.88 1 1.14 2 0.27 7 1.28 20 0.79 0.48—1.2234 "Other construction workers" – – 26 0.83 3 0.62 8 0.79 5 0.56 42 0.76 0.55—1.0335 Bricklayers – – 3 0.60 – – 4 0.92 3 1.56 10 0.89 0.43—1.6336 Printers – – 5 0.72 [0.79] 0.00 3 0.55 2 0.51 10 0.58 0.28—1.0837 Chemical process workers – – 10 1.05 1 2.52 6 0.63 5 1.26 22 0.94 0.59—1.4338 Food workers – – 10 1.48 1 0.30 21 1.85 3 0.70 35 1.36 0.95—1.8939 Beverage workers – – [0.39] 0.00 [0.06] 0.00 [0.26] 0.00 [0.21] 0.00 [0.92] 0.00 0.00—4.0240 Tobacco workers – – [0.08] 0.00 [0.00] 0.00 [0.16] 0.00 [0.03] 0.00 [0.26] 0.00 0.00—14.1541 Glass makers etc – – 5 0.49 1 1.58 5 0.80 4 0.78 15 0.67 0.38—1.1142 Packers – – 21 1.13 2 1.06 13 0.77 7 0.88 43 0.95 0.69—1.2843 Engine operators – – 26 0.87 2 0.68 14 1.11 11 1.15 53 0.96 0.72—1.2644 Public safety workers – – 14 0.87 3 1.53 9 1.16 14 2.06 40 1.23 0.88—1.6745 Cooks and stewards – – 2 1.27 [1.02] 0.00 2 0.48 2 1.21 6 0.71 0.26—1.5646 Domestic assistants – – [0.05] 0.00 [0.00] 0.00 [0.05] 0.00 2 5.07 2 4.00 0.48—14.4547 Waiters – – 1 0.61 [0.12] 0.00 [1.63] 0.00 3 4.17 4 0.98 0.27—2.5048 Building caretakers – – 13 1.09 [0.70] 0.00 8 1.88 2 0.44 23 1.07 0.68—1.6149 Chimney sweeps – – 1 1.16 – – [0.41] 0.00 1 3.02 2 1.25 0.15—4.5250 Hairdressers – – [0.29] 0.00 [0.15] 0.00 1 0.91 1 1.41 2 0.89 0.11—3.2151 Launderers – – 1 3.48 [0.07] 0.00 [0.63] 0.00 [0.51] 0.00 1 0.67 0.02—3.7252 Military personnel – – 11 1.63 – – 10 1.38 2 0.54 23 1.30 0.82—1.9553 "Other workers" – – 11 0.76 5 0.68 20 0.66 11 1.21 47 0.77 0.56—1.0254 Economically inactive – – 52 0.83 5 0.87 22 1.25 21 0.90 100 0.92 0.75—1.11
1-54 All categories – – 902 1.00 95 1.00 670 1.00 403 1.00 2070 1.00 # REF. #
Obs = observed number of cases; SIR = standardised incidence ratio; 95% CI = 95% confidence interval
100 Index Prev Next

Acta Oncologica - Pukkala et al, 2008 Papillary thyroid cancer
Observed number of papillary thyroid cancer among women in the Nordic countries and standardised incidence ratios 1961-2005, bycountry and occupational category
Denmark Finland Iceland Norway Sweden Total
No Occupational category Obs SIR Obs SIR Obs SIR Obs SIR Obs SIR Obs SIR 95% CI
1 Technical workers, etc – – 43 1.08 2 2.13 8 1.79 10 0.94 63 1.13 0.87—1.452 Laboratory assistants – – 17 0.93 1 0.85 3 0.65 7 1.18 28 0.93 0.62—1.343 Physicians – – 18 1.73 1 6.21 1 0.53 [3.20] 0.00 20 1.28 0.78—1.984 Dentists – – 5 0.79 [0.06] 0.00 [1.32] 0.00 3 1.85 8 0.86 0.37—1.695 Nurses – – 116 1.23 6 1.29 36 0.98 27 0.96 185 1.13 0.98—1.316 Assistant nurses – – 95 1.26 10 1.45 43 1.21 54 0.95 202 1.15 1.01—1.337 "Other health workers" – – 80 1.16 [1.56] 0.00 28 0.86 22 1.05 130 1.05 0.88—1.258 Teachers – – 158 1.09 12 1.36 70 1.05 54 0.83 294 1.03 0.92—1.159 Religious workers etc – – 123 1.09 2 1.58 25 1.51 22 0.69 172 1.06 0.91—1.2310 Artistic workers – – 12 0.81 [0.94] 0.00 6 1.35 3 0.65 21 0.85 0.53—1.3011 Journalists – – 4 0.48 [0.26] 0.00 [1.38] 0.00 2 0.88 6 0.49 0.18—1.0612 Administrators – – 26 0.83 1 1.75 16 1.09 8 0.76 51 0.89 0.66—1.1713 Clerical workers – – 473 0.92 28 1.07 181 0.98 148 1.06 830 0.96 0.89—1.0214 Sales agents – – 60 1.01 1 0.47 13 0.69 14 0.89 88 0.92 0.73—1.1315 Shop workers – – 176 0.88 12 0.83 117 0.90 40 0.85 345 0.88 0.79—0.9816 Farmers – – 86 1.02 7 0.81 98 1.35 12 1.94 203 1.18 1.03—1.3617 Gardeners – – 235 1.02 [0.32] 0.00 48 1.11 6 0.61 289 1.02 0.91—1.1418 Fishermen – – 1 1.26 [0.41] 0.00 2 2.67 [0.05] 0.00 3 1.50 0.31—4.3819 Forestry workers – – [1.51] 0.00 [0.06] 0.00 1 1.09 [0.35] 0.00 1 0.35 0.01—1.9620 Miners and quarry workers – – [0.44] 0.00 [0.01] 0.00 [0.08] 0.00 [0.11] 0.00 [0.64] 0.00 0.00—5.8121 Seamen – – [0.35] 0.00 [0.00] 0.00 1 5.48 [0.04] 0.00 1 1.75 0.04—9.7422 Transport workers – – 7 0.95 [0.32] 0.00 [0.99] 0.00 1 0.64 8 0.78 0.34—1.5423 Drivers – – 5 0.80 1 4.95 1 0.31 4 1.00 11 0.81 0.40—1.4424 Postal workers – – 54 0.95 7 1.68 31 0.95 19 1.08 111 1.00 0.83—1.2025 Textile workers – – 127 1.06 8 1.22 33 0.86 17 1.00 185 1.02 0.88—1.1826 Shoe and leather workers – – 16 1.08 [0.37] 0.00 5 1.78 [1.33] 0.00 21 1.09 0.67—1.6727 Smelting workers – – 4 1.21 [0.02] 0.00 [0.57] 0.00 [1.02] 0.00 4 0.81 0.22—2.0828 Mechanics – – 18 0.95 [0.08] 0.00 1 0.23 14 1.49 33 1.00 0.69—1.4129 Plumbers – – [0.07] 0.00 – – [0.04] 0.00 [0.04] 0.00 [0.14] 0.00 0.00—25.6030 Welders – – 5 2.54 [0.01] 0.00 [0.52] 0.00 1 1.58 6 1.92 0.70—4.1731 Electrical workers – – 23 1.32 [0.07] 0.00 4 0.81 4 0.69 31 1.10 0.75—1.5632 Wood workers – – 24 0.90 [0.15] 0.00 2 1.11 2 1.03 28 0.91 0.61—1.3233 Painters – – 2 0.54 [0.04] 0.00 1 2.69 [0.45] 0.00 3 0.65 0.13—1.9034 "Other construction workers" – – 9 1.08 [0.03] 0.00 [0.17] 0.00 [0.12] 0.00 9 1.04 0.48—1.9835 Bricklayers – – [0.37] 0.00 – – [0.01] 0.00 [0.00] 0.00 [0.39] 0.00 0.00—9.5436 Printers – – 14 0.77 [0.75] 0.00 3 0.73 2 0.58 19 0.72 0.43—1.1237 Chemical process workers – – 4 0.53 [0.26] 0.00 5 1.44 3 1.38 12 0.89 0.46—1.5538 Food workers – – 36 0.97 10 0.58 21 1.05 4 0.86 71 0.90 0.70—1.1439 Beverage workers – – 3 1.64 [0.03] 0.00 [0.23] 0.00 [0.24] 0.00 3 1.28 0.26—3.7540 Tobacco workers – – 2 1.92 – – [0.63] 0.00 [0.23] 0.00 2 1.05 0.13—3.7841 Glass makers etc – – 24 0.82 1 2.09 10 1.31 6 0.99 41 0.94 0.67—1.2842 Packers – – 44 0.88 1 0.70 13 0.75 12 1.41 70 0.90 0.70—1.1443 Engine operators – – 12 1.30 [0.03] 0.00 [0.41] 0.00 2 1.65 14 1.29 0.70—2.1644 Public safety workers – – 4 1.40 [0.31] 0.00 2 0.93 2 0.83 8 1.04 0.45—2.0445 Cooks and stewards – – 74 1.17 3 0.57 17 0.83 9 1.00 103 1.05 0.87—1.2846 Domestic assistants – – 88 1.01 3 2.24 54 0.95 51 0.94 196 0.98 0.86—1.1347 Waiters – – 50 0.84 [0.75] 0.00 29 1.07 8 0.87 87 0.90 0.72—1.1148 Building caretakers – – 197 1.04 10 0.94 122 1.03 56 1.57 385 1.08 0.98—1.2049 Chimney sweeps – – [0.09] 0.00 – – [0.01] 0.00 [0.00] 0.00 [0.11] 0.00 0.00—34.8550 Hairdressers – – 20 0.82 2 1.83 2 0.25 7 0.93 31 0.76 0.51—1.0751 Launderers – – 14 1.16 [1.44] 0.00 5 0.59 1 0.29 20 0.79 0.48—1.2252 Military personnel – – [0.44] 0.00 – – [0.06] 0.00 [0.10] 0.00 [0.60] 0.00 0.00—6.1653 "Other workers" – – 59 0.85 16 1.25 53 0.83 24 1.32 152 0.93 0.79—1.0954 Economically inactive – – 951 1.00 43 1.01 635 1.02 406 1.02 2035 1.01 0.97—1.05
1-54 All categories – – 3618 1.00 188 1.00 1746 1.00 1087 1.00 6639 1.00 # REF. #
Obs = observed number of cases; SIR = standardised incidence ratio; 95% CI = 95% confidence interval
101 Index Prev Next

Acta Oncologica - Pukkala et al, 2008 Cancer of the glandula suprarenalis
Observed number of cancer of the glandula suprarenalis among men in the Nordic countries and standardised incidence ratios1961-2005, by country and occupational category
Denmark Finland Iceland Norway Sweden Total
No Occupational category Obs SIR Obs SIR Obs SIR Obs SIR Obs SIR Obs SIR 95% CI
1 Technical workers, etc 9 0.99 14 0.86 [0.20] 0.00 7 1.00 26 0.86 56 0.89 0.67—1.162 Laboratory assistants [0.18] 0.00 [0.41] 0.00 [0.03] 0.00 [0.32] 0.00 [0.20] 0.00 [1.15] 0.00 0.00—3.213 Physicians 3 4.07 [0.93] 0.00 [0.05] 0.00 [0.81] 0.00 1 0.69 4 1.00 0.27—2.574 Dentists [0.22] 0.00 [0.20] 0.00 [0.02] 0.00 [0.35] 0.00 [0.67] 0.00 [1.46] 0.00 0.00—2.525 Nurses [0.01] 0.00 [0.06] 0.00 [0.00] 0.00 [0.06] 0.00 [0.13] 0.00 [0.26] 0.00 0.00—14.426 Assistant nurses [0.22] 0.00 [0.06] 0.00 [0.00] 0.00 1 7.36 1 1.83 2 2.07 0.25—7.497 "Other health workers" [0.66] 0.00 2 2.14 [0.02] 0.00 [0.33] 0.00 1 0.85 3 0.96 0.20—2.828 Teachers 2 0.51 7 1.08 1 4.45 4 0.84 4 0.49 18 0.77 0.45—1.219 Religious workers etc [1.65] 0.00 [3.86] 0.00 [0.16] 0.00 3 1.27 9 1.37 12 0.82 0.43—1.4410 Artistic workers 2 3.70 [1.32] 0.00 [0.04] 0.00 [0.68] 0.00 1 0.54 3 0.68 0.14—1.9811 Journalists [0.25] 0.00 1 1.54 [0.02] 0.00 [0.31] 0.00 1 1.13 2 0.94 0.11—3.4012 Administrators 12 1.18 8 0.79 1 3.10 7 0.88 15 1.38 43 1.09 0.79—1.4713 Clerical workers 4 0.86 2 0.30 [0.35] 0.00 4 0.65 9 0.75 19 0.64 0.38—1.0014 Sales agents 2 0.82 6 0.62 [0.18] 0.00 4 0.59 20 1.13 32 0.87 0.59—1.2315 Shop workers 12 1.14 2 0.49 [0.13] 0.00 5 1.70 6 1.07 25 1.07 0.69—1.5816 Farmers 9 0.47 48 1.04 [0.46] 0.00 14 0.89 12 0.46 83 0.77 0.61—0.9517 Gardeners 5 1.80 4 0.61 [0.02] 0.00 2 0.46 9 0.89 20 0.84 0.51—1.2918 Fishermen 2 2.01 [0.61] 0.00 [0.43] 0.00 2 0.36 [1.08] 0.00 4 0.46 0.12—1.1719 Forestry workers 1 2.43 5 0.64 [0.00] 0.00 [3.05] 0.00 11 1.47 17 0.91 0.53—1.4520 Miners and quarry workers [0.13] 0.00 1 0.79 [0.01] 0.00 [0.99] 0.00 2 1.03 3 0.69 0.14—2.0221 Seamen 1 0.90 2 1.20 [0.10] 0.00 8 1.52 1 0.57 12 1.21 0.63—2.1222 Transport workers [2.19] 0.00 7 1.43 [0.16] 0.00 5 1.92 8 1.45 20 1.30 0.80—2.0123 Drivers 9 1.17 9 0.58 [0.27] 0.00 5 0.65 19 1.27 42 0.91 0.65—1.2324 Postal workers [1.41] 0.00 2 0.82 [0.03] 0.00 1 0.74 5 1.55 8 0.95 0.41—1.8725 Textile workers 3 2.24 3 1.92 [0.04] 0.00 1 0.72 2 0.61 9 1.19 0.54—2.2526 Shoe and leather workers [0.33] 0.00 [0.69] 0.00 [0.01] 0.00 [0.56] 0.00 1 0.80 1 0.35 0.01—1.9527 Smelting workers 4 1.29 5 2.06 1 14.13 6 2.98 8 1.48 24 1.85 1.18—2.7528 Mechanics 8 0.98 18 1.14 1 3.46 14 1.32 29 1.08 70 1.14 0.88—1.4329 Plumbers [0.74] 0.00 5 1.90 [0.04] 0.00 1 0.78 4 1.30 10 1.29 0.62—2.3730 Welders – – 5 1.95 [0.02] 0.00 1 0.66 4 1.09 10 1.29 0.62—2.3731 Electrical workers 2 1.02 4 0.59 [0.18] 0.00 5 1.06 17 1.79 28 1.21 0.80—1.7532 Wood workers 8 1.46 22 1.30 [0.13] 0.00 15 1.37 22 1.31 67 1.33 1.03—1.6933 Painters [1.83] 0.00 6 1.70 [0.05] 0.00 3 1.61 3 0.61 12 0.98 0.51—1.7134 "Other construction workers" 9 1.27 13 1.17 [0.33] 0.00 2 0.85 10 1.09 34 1.13 0.78—1.5835 Bricklayers 4 1.97 [1.76] 0.00 – – 1 0.90 [2.16] 0.00 5 0.71 0.23—1.6536 Printers 2 1.53 2 1.25 [0.06] 0.00 2 1.65 1 0.35 7 1.00 0.40—2.0537 Chemical process workers 2 1.67 3 1.13 [0.02] 0.00 1 0.41 2 0.49 8 0.77 0.33—1.5238 Food workers 4 1.04 2 1.05 [0.18] 0.00 4 1.42 4 0.98 14 1.09 0.60—1.8339 Beverage workers [0.50] 0.00 [0.13] 0.00 [0.00] 0.00 [0.04] 0.00 [0.23] 0.00 [0.91] 0.00 0.00—4.0540 Tobacco workers [0.08] 0.00 [0.02] 0.00 [0.00] 0.00 [0.04] 0.00 [0.02] 0.00 [0.16] 0.00 0.00—22.9941 Glass makers etc 4 1.77 4 1.41 [0.04] 0.00 1 0.68 5 1.09 14 1.25 0.68—2.1042 Packers 1 0.49 11 1.88 1 9.93 11 2.61 11 1.35 35 1.72 1.20—2.3943 Engine operators 2 0.99 11 1.42 1 5.06 6 2.16 11 1.51 31 1.55 1.05—2.1944 Public safety workers 2 1.12 4 0.89 [0.12] 0.00 [1.87] 0.00 1 0.23 7 0.55 0.22—1.1445 Cooks and stewards [0.16] 0.00 [0.31] 0.00 [0.07] 0.00 1 1.08 1 1.16 2 0.86 0.10—3.1146 Domestic assistants [0.00] 0.00 [0.02] 0.00 [0.00] 0.00 [0.01] 0.00 [0.10] 0.00 [0.12] 0.00 0.00—29.7347 Waiters 2 5.50 [0.30] 0.00 [0.01] 0.00 [0.38] 0.00 [0.44] 0.00 2 1.34 0.16—4.8448 Building caretakers [2.04] 0.00 4 1.03 [0.04] 0.00 [0.95] 0.00 5 1.51 9 0.88 0.40—1.6749 Chimney sweeps [0.05] 0.00 [0.29] 0.00 – – [0.10] 0.00 [0.25] 0.00 [0.69] 0.00 0.00—5.3650 Hairdressers 1 1.76 [0.08] 0.00 [0.01] 0.00 [0.27] 0.00 1 1.27 2 1.16 0.14—4.2051 Launderers [0.27] 0.00 [0.08] 0.00 [0.00] 0.00 [0.16] 0.00 [0.56] 0.00 [1.08] 0.00 0.00—3.4252 Military personnel 1 1.06 3 2.11 – – 2 1.16 4 1.63 10 1.53 0.73—2.8253 "Other workers" 9 1.38 6 1.28 [0.44] 0.00 7 0.92 7 0.71 29 1.00 0.67—1.4354 Economically inactive 6 0.77 29 1.08 [0.33] 0.00 3 0.76 13 0.78 51 0.92 0.68—1.21
1-54 All categories 147 1.00 280 1.00 6 1.00 159 1.00 327 1.00 919 1.00 # REF. #
Obs = observed number of cases; SIR = standardised incidence ratio; 95% CI = 95% confidence interval
102 Index Prev Next

Acta Oncologica - Pukkala et al, 2008 Cancer of the glandula suprarenalis
Observed number of cancer of the glandula suprarenalis among women in the Nordic countries and standardised incidence ratios1961-2005, by country and occupational category
Denmark Finland Iceland Norway Sweden Total
No Occupational category Obs SIR Obs SIR Obs SIR Obs SIR Obs SIR Obs SIR 95% CI
1 Technical workers, etc [0.42] 0.00 [1.59] 0.00 [0.02] 0.00 1 3.50 2 1.12 3 0.73 0.15—2.132 Laboratory assistants 1 3.09 [0.86] 0.00 [0.02] 0.00 1 3.20 3 4.56 5 2.29 0.74—5.353 Physicians [0.14] 0.00 [0.40] 0.00 [0.00] 0.00 [0.13] 0.00 [0.45] 0.00 [1.11] 0.00 0.00—3.314 Dentists [0.12] 0.00 [0.35] 0.00 [0.00] 0.00 [0.10] 0.00 [0.30] 0.00 [0.87] 0.00 0.00—4.245 Nurses 2 0.83 4 0.90 [0.11] 0.00 2 0.82 3 0.59 11 0.76 0.38—1.366 Assistant nurses 2 1.09 4 0.96 [0.17] 0.00 4 1.69 6 0.63 16 0.89 0.51—1.447 "Other health workers" 2 1.45 4 1.19 [0.03] 0.00 1 0.44 4 1.22 11 1.07 0.53—1.928 Teachers 3 0.96 7 0.93 [0.19] 0.00 1 0.22 11 0.94 22 0.81 0.51—1.239 Religious workers etc [0.41] 0.00 10 2.33 [0.03] 0.00 2 1.79 4 0.93 16 1.58 0.90—2.5610 Artistic workers [0.20] 0.00 [0.65] 0.00 [0.02] 0.00 [0.31] 0.00 [0.77] 0.00 [1.96] 0.00 0.00—1.8811 Journalists [0.05] 0.00 1 2.48 [0.01] 0.00 [0.09] 0.00 1 2.71 2 2.17 0.26—7.8412 Administrators 2 1.61 [1.38] 0.00 [0.02] 0.00 3 3.07 1 0.58 6 1.12 0.41—2.4513 Clerical workers 7 0.54 27 1.06 [0.64] 0.00 9 0.67 32 1.13 75 0.93 0.73—1.1614 Sales agents [0.11] 0.00 2 0.60 [0.06] 0.00 [1.43] 0.00 [3.63] 0.00 2 0.23 0.03—0.8415 Shop workers 9 1.08 10 0.81 1 2.65 8 0.81 12 0.79 40 0.87 0.62—1.1816 Farmers 4 0.69 5 0.79 [0.25] 0.00 6 1.09 3 2.03 18 0.93 0.55—1.4717 Gardeners [0.75] 0.00 21 1.09 [0.01] 0.00 6 1.76 6 1.58 33 1.21 0.84—1.7018 Fishermen [0.03] 0.00 [0.05] 0.00 [0.01] 0.00 [0.05] 0.00 [0.01] 0.00 [0.15] 0.00 0.00—24.2119 Forestry workers [0.01] 0.00 [0.09] 0.00 [0.00] 0.00 [0.07] 0.00 [0.09] 0.00 [0.26] 0.00 0.00—13.9620 Miners and quarry workers [0.00] 0.00 [0.03] 0.00 [0.00] 0.00 [0.00] 0.00 [0.02] 0.00 [0.06] 0.00 0.00—58.0021 Seamen – – [0.01] 0.00 [0.00] 0.00 [0.01] 0.00 [0.00] 0.00 [0.03] 0.00 0.00—120.1422 Transport workers [0.01] 0.00 [0.54] 0.00 [0.01] 0.00 [0.07] 0.00 [0.28] 0.00 [0.91] 0.00 0.00—4.0723 Drivers [0.22] 0.00 2 6.44 [0.01] 0.00 [0.22] 0.00 [0.73] 0.00 2 1.35 0.16—4.8724 Postal workers [0.45] 0.00 1 0.28 1 8.20 2 0.82 4 0.87 8 0.72 0.31—1.4125 Textile workers 2 0.70 9 1.13 [0.20] 0.00 4 1.26 14 1.73 29 1.30 0.87—1.8726 Shoe and leather workers 2 9.23 2 2.05 [0.01] 0.00 [0.24] 0.00 3 4.75 7 3.38 1.36—6.9627 Smelting workers [0.05] 0.00 [0.23] 0.00 [0.00] 0.00 [0.04] 0.00 1 4.71 1 1.88 0.05—10.5028 Mechanics [0.55] 0.00 [1.11] 0.00 [0.00] 0.00 [0.33] 0.00 4 1.92 4 0.98 0.27—2.5129 Plumbers [0.00] 0.00 [0.00] 0.00 – – [0.00] 0.00 [0.00] 0.00 [0.01] 0.00 0.00—282.9230 Welders – – [0.10] 0.00 [0.00] 0.00 [0.03] 0.00 [0.09] 0.00 [0.23] 0.00 0.00—16.2731 Electrical workers 2 2.59 3 3.66 [0.00] 0.00 [0.38] 0.00 [1.17] 0.00 5 1.59 0.52—3.7132 Wood workers [0.25] 0.00 2 1.03 [0.00] 0.00 [0.13] 0.00 1 2.76 3 1.12 0.23—3.2733 Painters [0.01] 0.00 [0.24] 0.00 [0.00] 0.00 [0.03] 0.00 [0.09] 0.00 [0.37] 0.00 0.00—9.8734 "Other construction workers" [0.01] 0.00 [0.72] 0.00 [0.00] 0.00 [0.01] 0.00 [0.01] 0.00 [0.75] 0.00 0.00—4.8935 Bricklayers [0.00] 0.00 [0.03] 0.00 – – [0.00] 0.00 [0.00] 0.00 [0.03] 0.00 0.00—125.0536 Printers [0.28] 0.00 1 0.96 [0.02] 0.00 [0.31] 0.00 [0.84] 0.00 1 0.40 0.01—2.2437 Chemical process workers [0.43] 0.00 1 1.92 [0.01] 0.00 [0.28] 0.00 [0.63] 0.00 1 0.53 0.01—2.9838 Food workers 3 1.43 2 0.76 1 2.15 1 0.63 [1.76] 0.00 7 0.82 0.33—1.6939 Beverage workers 1 4.88 [0.14] 0.00 [0.00] 0.00 [0.02] 0.00 [0.11] 0.00 1 2.12 0.05—11.8440 Tobacco workers [0.29] 0.00 [0.08] 0.00 – – [0.06] 0.00 [0.08] 0.00 [0.50] 0.00 0.00—7.4241 Glass makers etc [0.53] 0.00 1 0.52 [0.01] 0.00 [0.61] 0.00 1 0.59 2 0.42 0.05—1.5142 Packers [0.15] 0.00 2 0.59 [0.04] 0.00 [1.38] 0.00 2 0.81 4 0.54 0.15—1.3843 Engine operators [0.01] 0.00 [0.56] 0.00 [0.00] 0.00 [0.03] 0.00 [0.20] 0.00 [0.80] 0.00 0.00—4.6344 Public safety workers [0.02] 0.00 1 7.22 [0.01] 0.00 [0.16] 0.00 [0.28] 0.00 1 1.66 0.04—9.2745 Cooks and stewards [0.01] 0.00 5 1.32 [0.15] 0.00 3 1.84 4 1.19 12 1.34 0.69—2.3446 Domestic assistants 2 0.63 2 0.46 [0.04] 0.00 7 1.54 5 0.47 16 0.71 0.40—1.1547 Waiters [0.58] 0.00 5 1.47 [0.02] 0.00 2 0.95 2 0.57 9 0.93 0.43—1.7748 Building caretakers 12 1.30 22 1.74 [0.31] 0.00 12 1.34 12 1.22 58 1.42 1.07—1.8349 Chimney sweeps [0.00] 0.00 [0.01] 0.00 – – [0.00] 0.00 [0.00] 0.00 [0.01] 0.00 0.00—430.3150 Hairdressers [0.56] 0.00 3 2.28 [0.02] 0.00 [0.59] 0.00 2 1.16 5 1.19 0.39—2.7851 Launderers 2 1.95 [0.94] 0.00 [0.05] 0.00 [0.68] 0.00 [1.75] 0.00 2 0.45 0.05—1.6352 Military personnel [0.01] 0.00 [0.02] 0.00 – – [0.00] 0.00 [0.01] 0.00 [0.04] 0.00 0.00—99.5753 "Other workers" 3 1.13 4 0.98 [0.35] 0.00 5 1.05 7 1.55 19 1.16 0.70—1.8154 Economically inactive 74 1.08 71 0.91 2 1.73 54 1.07 187 1.02 388 1.02 0.92—1.12
1-54 All categories 135 1.00 234 1.00 5 1.00 134 1.00 337 1.00 845 1.00 # REF. #
Obs = observed number of cases; SIR = standardised incidence ratio; 95% CI = 95% confidence interval
103 Index Prev Next

Acta Oncologica - Pukkala et al, 2008 Cancer of the glandula parathyreioeda
Observed number of cancer of the glandula parathyreioeda among men in the Nordic countries and standardised incidence ratios1961-2005, by country and occupational category
Denmark Finland Iceland Norway Sweden Total
No Occupational category Obs SIR Obs SIR Obs SIR Obs SIR Obs SIR Obs SIR 95% CI
1 Technical workers, etc [0.45] 0.00 [0.29] 0.00 [0.02] 0.00 1 3.45 [1.96] 0.00 1 0.33 0.01—1.852 Laboratory assistants [0.01] 0.00 [0.01] 0.00 [0.00] 0.00 [0.01] 0.00 [0.01] 0.00 [0.05] 0.00 0.00—78.923 Physicians 1 23.40 [0.02] 0.00 [0.01] 0.00 [0.03] 0.00 [0.09] 0.00 1 5.19 0.13—28.904 Dentists [0.01] 0.00 [0.00] 0.00 [0.00] 0.00 [0.01] 0.00 [0.05] 0.00 [0.08] 0.00 0.00—47.285 Nurses [0.00] 0.00 [0.00] 0.00 [0.00] 0.00 [0.00] 0.00 [0.01] 0.00 [0.01] 0.00 0.00—315.336 Assistant nurses [0.01] 0.00 [0.00] 0.00 [0.00] 0.00 [0.00] 0.00 1 26.02 1 18.20 0.46—101.407 "Other health workers" [0.04] 0.00 [0.02] 0.00 [0.00] 0.00 [0.01] 0.00 [0.08] 0.00 [0.14] 0.00 0.00—26.068 Teachers [0.20] 0.00 [0.09] 0.00 [0.04] 0.00 [0.18] 0.00 [0.54] 0.00 [1.05] 0.00 0.00—3.519 Religious workers etc [0.10] 0.00 [0.08] 0.00 [0.02] 0.00 1 12.72 [0.43] 0.00 1 1.41 0.04—7.8810 Artistic workers [0.03] 0.00 [0.02] 0.00 [0.01] 0.00 [0.02] 0.00 [0.12] 0.00 [0.21] 0.00 0.00—17.9411 Journalists [0.01] 0.00 [0.01] 0.00 [0.00] 0.00 [0.01] 0.00 [0.06] 0.00 [0.10] 0.00 0.00—38.8212 Administrators [0.57] 0.00 [0.17] 0.00 [0.06] 0.00 [0.26] 0.00 1 1.37 1 0.56 0.01—3.1013 Clerical workers [0.23] 0.00 [0.10] 0.00 [0.06] 0.00 [0.21] 0.00 3 3.65 3 2.10 0.43—6.1314 Sales agents [0.12] 0.00 [0.14] 0.00 [0.03] 0.00 [0.21] 0.00 4 3.31 4 2.34 0.64—5.9815 Shop workers 1 1.67 1 15.33 [0.02] 0.00 [0.11] 0.00 [0.39] 0.00 2 1.69 0.20—6.1116 Farmers 4 3.05 1 1.78 [0.09] 0.00 [0.36] 0.00 2 1.00 7 1.62 0.65—3.3417 Gardeners [0.18] 0.00 [0.08] 0.00 [0.00] 0.00 [0.12] 0.00 [0.76] 0.00 [1.15] 0.00 0.00—3.2118 Fishermen [0.05] 0.00 [0.01] 0.00 [0.05] 0.00 [0.15] 0.00 [0.08] 0.00 [0.34] 0.00 0.00—10.8019 Forestry workers [0.03] 0.00 [0.09] 0.00 [0.00] 0.00 [0.07] 0.00 [0.55] 0.00 [0.74] 0.00 0.00—4.9520 Miners and quarry workers [0.01] 0.00 [0.02] 0.00 [0.00] 0.00 [0.03] 0.00 1 7.16 1 5.15 0.13—28.6721 Seamen [0.05] 0.00 [0.02] 0.00 [0.02] 0.00 [0.19] 0.00 1 8.11 1 2.47 0.06—13.7822 Transport workers [0.12] 0.00 [0.06] 0.00 [0.03] 0.00 [0.08] 0.00 [0.36] 0.00 [0.65] 0.00 0.00—5.6823 Drivers [0.37] 0.00 [0.20] 0.00 [0.05] 0.00 1 3.75 1 0.98 2 1.05 0.13—3.7924 Postal workers [0.07] 0.00 [0.04] 0.00 [0.00] 0.00 [0.04] 0.00 1 4.41 1 2.66 0.07—14.8325 Textile workers [0.07] 0.00 [0.02] 0.00 [0.01] 0.00 [0.04] 0.00 [0.24] 0.00 [0.38] 0.00 0.00—9.6826 Shoe and leather workers [0.02] 0.00 1 103.80 [0.00] 0.00 [0.01] 0.00 [0.10] 0.00 1 7.12 0.18—39.6727 Smelting workers [0.14] 0.00 [0.03] 0.00 1 75.76 [0.06] 0.00 [0.39] 0.00 1 1.57 0.04—8.7528 Mechanics [0.40] 0.00 [0.25] 0.00 [0.04] 0.00 [0.37] 0.00 3 1.64 3 1.04 0.21—3.0329 Plumbers [0.03] 0.00 [0.04] 0.00 [0.01] 0.00 [0.05] 0.00 [0.21] 0.00 [0.34] 0.00 0.00—10.9430 Welders – – [0.05] 0.00 [0.00] 0.00 [0.06] 0.00 [0.24] 0.00 [0.35] 0.00 0.00—10.5531 Electrical workers [0.08] 0.00 1 8.87 [0.02] 0.00 [0.18] 0.00 [0.64] 0.00 1 0.97 0.02—5.3932 Wood workers [0.30] 0.00 [0.23] 0.00 [0.03] 0.00 [0.33] 0.00 [1.21] 0.00 [2.09] 0.00 0.00—1.7733 Painters [0.09] 0.00 [0.05] 0.00 [0.01] 0.00 [0.06] 0.00 1 2.91 1 1.82 0.05—10.1634 "Other construction workers" [0.41] 0.00 [0.13] 0.00 [0.05] 0.00 [0.08] 0.00 [0.67] 0.00 [1.34] 0.00 0.00—2.7635 Bricklayers [0.11] 0.00 [0.02] 0.00 – – [0.03] 0.00 [0.15] 0.00 [0.31] 0.00 0.00—11.8236 Printers [0.06] 0.00 [0.03] 0.00 [0.01] 0.00 [0.04] 0.00 [0.20] 0.00 [0.34] 0.00 0.00—10.9437 Chemical process workers [0.07] 0.00 [0.04] 0.00 [0.00] 0.00 [0.06] 0.00 [0.30] 0.00 [0.47] 0.00 0.00—7.7938 Food workers [0.20] 0.00 [0.03] 0.00 [0.03] 0.00 [0.08] 0.00 1 3.38 1 1.57 0.04—8.7439 Beverage workers [0.02] 0.00 [0.00] 0.00 [0.00] 0.00 [0.00] 0.00 [0.02] 0.00 [0.05] 0.00 0.00—78.5240 Tobacco workers [0.00] 0.00 [0.00] 0.00 [0.00] 0.00 [0.00] 0.00 [0.00] 0.00 [0.01] 0.00 0.00—524.8841 Glass makers etc [0.12] 0.00 [0.04] 0.00 [0.01] 0.00 [0.05] 0.00 2 6.06 2 3.63 0.44—13.1342 Packers [0.12] 0.00 [0.08] 0.00 [0.02] 0.00 [0.12] 0.00 [0.61] 0.00 [0.94] 0.00 0.00—3.9343 Engine operators [0.10] 0.00 [0.11] 0.00 [0.03] 0.00 [0.11] 0.00 [0.51] 0.00 [0.86] 0.00 0.00—4.2944 Public safety workers [0.11] 0.00 [0.07] 0.00 [0.02] 0.00 [0.05] 0.00 [0.30] 0.00 [0.55] 0.00 0.00—6.6945 Cooks and stewards [0.01] 0.00 [0.01] 0.00 [0.01] 0.00 1 30.13 [0.06] 0.00 1 8.64 0.22—48.1646 Domestic assistants [0.00] 0.00 [0.00] 0.00 [0.00] 0.00 [0.00] 0.00 [0.01] 0.00 [0.01] 0.00 0.00—443.8447 Waiters [0.02] 0.00 [0.01] 0.00 [0.00] 0.00 [0.01] 0.00 [0.03] 0.00 [0.07] 0.00 0.00—56.3948 Building caretakers [0.11] 0.00 [0.06] 0.00 [0.01] 0.00 [0.03] 0.00 [0.24] 0.00 [0.46] 0.00 0.00—8.1149 Chimney sweeps [0.00] 0.00 [0.00] 0.00 – – [0.00] 0.00 [0.02] 0.00 [0.03] 0.00 0.00—142.5650 Hairdressers [0.03] 0.00 [0.00] 0.00 [0.00] 0.00 [0.01] 0.00 [0.05] 0.00 [0.10] 0.00 0.00—37.3651 Launderers [0.02] 0.00 [0.00] 0.00 [0.00] 0.00 [0.00] 0.00 [0.04] 0.00 [0.06] 0.00 0.00—59.7052 Military personnel [0.04] 0.00 [0.02] 0.00 – – [0.08] 0.00 [0.15] 0.00 [0.30] 0.00 0.00—12.3653 "Other workers" 1 3.10 [0.06] 0.00 [0.09] 0.00 1 5.78 [0.73] 0.00 2 1.46 0.18—5.2654 Economically inactive 1 2.67 [0.40] 0.00 [0.05] 0.00 [0.11] 0.00 1 0.77 2 0.89 0.11—3.23
1-54 All categories 8 1.00 4 1.00 1 1.00 5 1.00 23 1.00 41 1.00 # REF. #
Obs = observed number of cases; SIR = standardised incidence ratio; 95% CI = 95% confidence interval
104 Index Prev Next

Acta Oncologica - Pukkala et al, 2008 Cancer of the glandula parathyreioeda
Observed number of cancer of the glandula parathyreioeda among women in the Nordic countries and standardised incidence ratios1961-2005, by country and occupational category
Denmark Finland Iceland Norway Sweden Total
No Occupational category Obs SIR Obs SIR Obs SIR Obs SIR Obs SIR Obs SIR 95% CI
1 Technical workers, etc [0.03] 0.00 [0.06] 0.00 – – [0.03] 0.00 1 2.60 1 2.00 0.05—11.162 Laboratory assistants [0.02] 0.00 [0.03] 0.00 – – [0.03] 0.00 [0.09] 0.00 [0.18] 0.00 0.00—20.743 Physicians [0.01] 0.00 [0.02] 0.00 – – [0.01] 0.00 [0.09] 0.00 [0.13] 0.00 0.00—29.034 Dentists [0.01] 0.00 [0.01] 0.00 – – [0.01] 0.00 [0.07] 0.00 [0.10] 0.00 0.00—37.105 Nurses [0.20] 0.00 [0.15] 0.00 – – [0.26] 0.00 2 1.76 2 1.15 0.14—4.156 Assistant nurses [0.14] 0.00 [0.14] 0.00 – – [0.25] 0.00 [2.03] 0.00 [2.56] 0.00 0.00—1.447 "Other health workers" [0.11] 0.00 [0.12] 0.00 – – [0.24] 0.00 3 4.50 3 2.63 0.54—7.688 Teachers [0.25] 0.00 [0.25] 0.00 – – 2 4.30 3 1.20 5 1.44 0.47—3.369 Religious workers etc [0.03] 0.00 [0.14] 0.00 – – [0.11] 0.00 2 2.46 2 1.83 0.22—6.6010 Artistic workers 1 57.31 [0.02] 0.00 – – [0.03] 0.00 [0.16] 0.00 1 4.24 0.11—23.6411 Journalists [0.00] 0.00 [0.01] 0.00 – – [0.01] 0.00 [0.08] 0.00 [0.10] 0.00 0.00—36.1012 Administrators [0.10] 0.00 [0.04] 0.00 – – [0.11] 0.00 [0.35] 0.00 [0.60] 0.00 0.00—6.1113 Clerical workers [0.99] 0.00 1 1.24 – – [1.40] 0.00 6 0.92 7 0.72 0.29—1.4914 Sales agents [0.01] 0.00 [0.11] 0.00 – – [0.17] 0.00 [0.82] 0.00 [1.11] 0.00 0.00—3.3315 Shop workers 1 1.47 [0.41] 0.00 – – [1.08] 0.00 4 1.01 5 0.82 0.27—1.9116 Farmers [0.48] 0.00 1 5.67 – – [0.63] 0.00 [0.30] 0.00 1 0.63 0.02—3.5217 Gardeners [0.06] 0.00 1 1.62 – – [0.38] 0.00 [1.03] 0.00 1 0.48 0.01—2.6818 Fishermen [0.00] 0.00 [0.00] 0.00 – – [0.01] 0.00 [0.00] 0.00 [0.01] 0.00 0.00—282.5219 Forestry workers [0.00] 0.00 [0.00] 0.00 – – [0.01] 0.00 [0.02] 0.00 [0.03] 0.00 0.00—112.5720 Miners and quarry workers [0.00] 0.00 [0.00] 0.00 – – [0.00] 0.00 [0.01] 0.00 [0.01] 0.00 0.00—534.0721 Seamen – – [0.00] 0.00 – – [0.00] 0.00 [0.00] 0.00 [0.00] 0.00 0.00—1399.0122 Transport workers [0.00] 0.00 [0.02] 0.00 – – [0.01] 0.00 [0.06] 0.00 [0.09] 0.00 0.00—40.0723 Drivers [0.02] 0.00 [0.01] 0.00 – – [0.02] 0.00 1 6.42 1 4.85 0.12—27.0024 Postal workers [0.03] 0.00 [0.12] 0.00 – – [0.26] 0.00 2 1.70 2 1.26 0.15—4.5625 Textile workers [0.23] 0.00 1 4.07 – – [0.36] 0.00 [2.17] 0.00 1 0.33 0.01—1.8626 Shoe and leather workers [0.02] 0.00 [0.03] 0.00 – – [0.03] 0.00 [0.17] 0.00 [0.25] 0.00 0.00—14.8827 Smelting workers [0.00] 0.00 [0.01] 0.00 – – [0.00] 0.00 [0.05] 0.00 [0.07] 0.00 0.00—55.2628 Mechanics [0.04] 0.00 [0.03] 0.00 – – [0.04] 0.00 [0.49] 0.00 [0.60] 0.00 0.00—6.1329 Plumbers [0.00] 0.00 [0.00] 0.00 – – [0.00] 0.00 [0.00] 0.00 [0.00] 0.00 0.00—2457.6730 Welders – – [0.00] 0.00 – – [0.00] 0.00 [0.02] 0.00 [0.02] 0.00 0.00—150.6131 Electrical workers [0.06] 0.00 [0.03] 0.00 – – [0.04] 0.00 1 3.59 1 2.51 0.06—13.9832 Wood workers [0.02] 0.00 [0.07] 0.00 – – [0.01] 0.00 [0.08] 0.00 [0.18] 0.00 0.00—20.6333 Painters [0.00] 0.00 [0.01] 0.00 – – [0.00] 0.00 [0.02] 0.00 [0.03] 0.00 0.00—111.8434 "Other construction workers" [0.00] 0.00 [0.02] 0.00 – – [0.00] 0.00 [0.00] 0.00 [0.03] 0.00 0.00—136.0035 Bricklayers [0.00] 0.00 [0.00] 0.00 – – [0.00] 0.00 [0.00] 0.00 [0.00] 0.00 0.00—3363.8836 Printers 1 48.18 [0.04] 0.00 – – [0.03] 0.00 1 4.94 2 6.83 0.83—24.6737 Chemical process workers [0.03] 0.00 [0.02] 0.00 – – [0.03] 0.00 [0.16] 0.00 [0.24] 0.00 0.00—15.6038 Food workers [0.16] 0.00 [0.09] 0.00 – – 1 5.65 [0.45] 0.00 1 1.14 0.03—6.3439 Beverage workers [0.02] 0.00 [0.00] 0.00 – – [0.00] 0.00 [0.03] 0.00 [0.05] 0.00 0.00—74.3340 Tobacco workers [0.02] 0.00 [0.00] 0.00 – – [0.01] 0.00 [0.02] 0.00 [0.05] 0.00 0.00—73.6841 Glass makers etc [0.04] 0.00 [0.06] 0.00 – – [0.06] 0.00 1 2.29 1 1.66 0.04—9.2842 Packers [0.01] 0.00 [0.11] 0.00 – – 1 6.73 [0.63] 0.00 1 1.12 0.03—6.2243 Engine operators [0.00] 0.00 [0.02] 0.00 – – [0.00] 0.00 [0.04] 0.00 [0.06] 0.00 0.00—58.0044 Public safety workers [0.00] 0.00 [0.00] 0.00 – – [0.02] 0.00 [0.05] 0.00 [0.07] 0.00 0.00—50.5945 Cooks and stewards [0.00] 0.00 [0.12] 0.00 – – 1 5.30 [0.82] 0.00 1 0.88 0.02—4.9246 Domestic assistants 1 3.97 [0.12] 0.00 – – [0.50] 0.00 4 1.76 5 1.59 0.52—3.7147 Waiters [0.04] 0.00 [0.11] 0.00 – – [0.23] 0.00 1 1.08 1 0.76 0.02—4.2648 Building caretakers [0.73] 0.00 1 2.63 – – 1 1.02 3 1.30 5 1.14 0.37—2.6549 Chimney sweeps [0.00] 0.00 [0.00] 0.00 – – [0.00] 0.00 [0.00] 0.00 [0.00] 0.00 0.00—8666.0450 Hairdressers [0.04] 0.00 [0.04] 0.00 – – [0.06] 0.00 [0.41] 0.00 [0.56] 0.00 0.00—6.6351 Launderers [0.08] 0.00 [0.03] 0.00 – – [0.08] 0.00 [0.46] 0.00 [0.65] 0.00 0.00—5.7252 Military personnel [0.00] 0.00 [0.00] 0.00 – – [0.00] 0.00 [0.00] 0.00 [0.00] 0.00 0.00—1425.8653 "Other workers" 1 4.84 [0.13] 0.00 – – 1 1.97 3 2.80 5 2.61 0.85—6.0854 Economically inactive 6 1.04 2 0.98 – – 8 1.34 47 0.96 63 1.00 0.77—1.28
1-54 All categories 11 1.00 7 1.00 – – 15 1.00 85 1.00 118 1.00 # REF. #
Obs = observed number of cases; SIR = standardised incidence ratio; 95% CI = 95% confidence interval
105 Index Prev Next

Acta Oncologica - Pukkala et al, 2008 Cancer of the thymus
Observed number of cancer of the thymus among men in the Nordic countries and standardised incidence ratios 1961-2005, by countryand occupational category
Denmark Finland Iceland Norway Sweden Total
No Occupational category Obs SIR Obs SIR Obs SIR Obs SIR Obs SIR Obs SIR 95% CI
1 Technical workers, etc 6 1.37 7 1.46 [0.13] 0.00 2 0.56 22 1.59 37 1.39 0.98—1.912 Laboratory assistants [0.09] 0.00 [0.12] 0.00 [0.02] 0.00 1 6.64 1 9.69 2 4.10 0.50—14.813 Physicians 1 2.85 [0.28] 0.00 1 26.46 1 2.53 [0.66] 0.00 3 1.75 0.36—5.104 Dentists [0.10] 0.00 [0.06] 0.00 [0.01] 0.00 [0.17] 0.00 [0.30] 0.00 [0.64] 0.00 0.00—5.775 Nurses [0.00] 0.00 [0.02] 0.00 [0.00] 0.00 [0.03] 0.00 1 18.09 1 8.86 0.22—49.386 Assistant nurses [0.10] 0.00 [0.02] 0.00 [0.01] 0.00 [0.06] 0.00 1 4.25 1 2.35 0.06—13.117 "Other health workers" 1 3.13 [0.26] 0.00 [0.01] 0.00 [0.15] 0.00 [0.51] 0.00 1 0.80 0.02—4.438 Teachers 1 0.54 1 0.50 1 6.24 [2.40] 0.00 1 0.27 4 0.40 0.11—1.019 Religious workers etc [0.78] 0.00 2 1.84 [0.11] 0.00 1 0.88 3 1.03 6 0.99 0.36—2.1610 Artistic workers [0.25] 0.00 [0.38] 0.00 [0.03] 0.00 [0.32] 0.00 [0.83] 0.00 [1.80] 0.00 0.00—2.0511 Journalists [0.12] 0.00 1 5.43 [0.02] 0.00 [0.15] 0.00 1 2.56 2 2.33 0.28—8.4212 Administrators 6 1.21 2 0.71 [0.19] 0.00 5 1.38 5 1.08 18 1.11 0.66—1.7513 Clerical workers 4 1.87 [1.80] 0.00 [0.23] 0.00 1 0.36 4 0.77 9 0.74 0.34—1.4114 Sales agents 2 1.75 2 0.74 [0.12] 0.00 5 1.70 12 1.55 21 1.43 0.89—2.1915 Shop workers 5 1.00 1 0.82 [0.09] 0.00 2 1.46 2 0.81 10 0.98 0.47—1.8116 Farmers 6 0.65 14 1.28 [0.30] 0.00 6 1.00 9 0.90 35 0.96 0.67—1.3317 Gardeners [1.34] 0.00 4 2.24 [0.01] 0.00 1 0.58 2 0.49 7 0.79 0.32—1.6218 Fishermen 2 4.25 1 6.85 [0.28] 0.00 1 0.46 [0.43] 0.00 4 1.15 0.31—2.9319 Forestry workers [0.20] 0.00 3 1.38 [0.00] 0.00 1 0.88 [3.00] 0.00 4 0.61 0.17—1.5720 Miners and quarry workers [0.06] 0.00 2 5.66 [0.00] 0.00 [0.41] 0.00 1 1.24 3 1.84 0.38—5.3721 Seamen [0.51] 0.00 [0.46] 0.00 [0.06] 0.00 1 0.43 3 4.07 4 0.98 0.27—2.5122 Transport workers [1.14] 0.00 2 1.51 [0.10] 0.00 1 0.93 1 0.40 4 0.65 0.18—1.6723 Drivers [3.65] 0.00 3 0.65 [0.18] 0.00 5 1.49 4 0.61 12 0.65 0.34—1.1424 Postal workers 1 1.45 1 1.49 [0.02] 0.00 [0.58] 0.00 2 1.46 4 1.20 0.33—3.0825 Textile workers [0.64] 0.00 [0.42] 0.00 [0.03] 0.00 [0.55] 0.00 [1.32] 0.00 [2.96] 0.00 0.00—1.2526 Shoe and leather workers [0.16] 0.00 [0.17] 0.00 [0.01] 0.00 [0.20] 0.00 2 4.23 2 1.97 0.24—7.1327 Smelting workers [1.42] 0.00 1 1.55 [0.05] 0.00 1 1.21 1 0.45 3 0.58 0.12—1.6928 Mechanics [3.80] 0.00 4 0.89 [0.18] 0.00 6 1.27 5 0.42 15 0.60 0.34—0.9929 Plumbers 2 5.92 2 2.58 [0.03] 0.00 1 1.73 2 1.47 7 2.27 0.91—4.6930 Welders – – [0.78] 0.00 [0.01] 0.00 [0.72] 0.00 [1.70] 0.00 [3.21] 0.00 0.00—1.1531 Electrical workers [0.88] 0.00 2 1.00 [0.12] 0.00 2 0.93 3 0.70 7 0.74 0.30—1.5332 Wood workers 3 1.17 7 1.60 [0.09] 0.00 2 0.44 8 1.17 20 1.09 0.66—1.6833 Painters 5 5.72 2 2.05 [0.03] 0.00 1 1.32 1 0.48 9 1.91 0.87—3.6234 "Other construction workers" 2 0.60 3 1.04 [0.21] 0.00 3 2.95 5 1.33 13 1.16 0.62—1.9935 Bricklayers 1 1.07 [0.47] 0.00 – – 2 4.44 [0.90] 0.00 3 1.09 0.23—3.1936 Printers 2 3.39 [0.46] 0.00 [0.03] 0.00 [0.55] 0.00 1 0.80 3 1.04 0.21—3.0337 Chemical process workers 1 1.74 [0.75] 0.00 [0.02] 0.00 1 1.05 2 1.22 4 1.02 0.28—2.6138 Food workers 1 0.55 [0.55] 0.00 [0.14] 0.00 [1.16] 0.00 4 2.34 5 0.93 0.30—2.1739 Beverage workers [0.24] 0.00 [0.03] 0.00 [0.00] 0.00 [0.03] 0.00 [0.09] 0.00 [0.39] 0.00 0.00—9.5040 Tobacco workers [0.04] 0.00 [0.01] 0.00 – – [0.01] 0.00 [0.01] 0.00 [0.07] 0.00 0.00—55.8441 Glass makers etc 2 1.84 1 1.27 [0.03] 0.00 1 1.56 6 3.09 10 2.23 1.07—4.1042 Packers 1 1.03 [1.55] 0.00 [0.07] 0.00 4 2.38 4 1.23 9 1.20 0.55—2.2743 Engine operators 1 1.04 3 1.31 [0.12] 0.00 3 2.33 4 1.26 11 1.40 0.70—2.5144 Public safety workers [0.87] 0.00 [1.23] 0.00 [0.08] 0.00 1 1.28 1 0.52 2 0.41 0.05—1.4845 Cooks and stewards [0.07] 0.00 [0.09] 0.00 [0.04] 0.00 1 2.38 [0.38] 0.00 1 1.00 0.03—5.5646 Domestic assistants [0.00] 0.00 [0.00] 0.00 [0.00] 0.00 [0.00] 0.00 [0.04] 0.00 [0.05] 0.00 0.00—74.7447 Waiters [0.16] 0.00 [0.08] 0.00 [0.01] 0.00 [0.16] 0.00 1 5.18 1 1.64 0.04—9.1248 Building caretakers 3 3.07 [1.01] 0.00 [0.02] 0.00 [0.41] 0.00 [1.32] 0.00 3 0.80 0.17—2.3449 Chimney sweeps [0.03] 0.00 [0.08] 0.00 – – [0.04] 0.00 [0.11] 0.00 [0.25] 0.00 0.00—14.8350 Hairdressers 1 3.69 [0.02] 0.00 [0.01] 0.00 [0.11] 0.00 [0.33] 0.00 1 1.34 0.03—7.4851 Launderers [0.13] 0.00 [0.02] 0.00 [0.00] 0.00 1 15.51 [0.24] 0.00 1 2.17 0.05—12.1052 Military personnel 1 2.19 [0.45] 0.00 – – 1 1.23 2 1.74 4 1.40 0.38—3.5753 "Other workers" 3 0.99 [1.21] 0.00 2 6.93 2 0.69 6 1.52 13 1.14 0.61—1.9554 Economically inactive 5 1.67 3 0.58 [0.25] 0.00 1 0.69 6 0.94 15 0.92 0.52—1.52
1-54 All categories 69 1.00 74 1.00 4 1.00 68 1.00 139 1.00 354 1.00 # REF. #
Obs = observed number of cases; SIR = standardised incidence ratio; 95% CI = 95% confidence interval
106 Index Prev Next

Acta Oncologica - Pukkala et al, 2008 Cancer of the thymus
Observed number of cancer of the thymus among women in the Nordic countries and standardised incidence ratios 1961-2005, bycountry and occupational category
Denmark Finland Iceland Norway Sweden Total
No Occupational category Obs SIR Obs SIR Obs SIR Obs SIR Obs SIR Obs SIR 95% CI
1 Technical workers, etc [0.19] 0.00 3 4.70 – – [0.08] 0.00 1 1.35 4 2.41 0.66—6.182 Laboratory assistants [0.15] 0.00 1 3.02 – – 1 10.24 1 3.79 3 3.58 0.74—10.463 Physicians [0.06] 0.00 1 6.44 – – [0.04] 0.00 1 5.28 2 4.48 0.54—16.194 Dentists [0.06] 0.00 [0.14] 0.00 – – 1 34.99 [0.12] 0.00 1 2.91 0.07—16.235 Nurses 3 2.76 2 1.20 – – [0.80] 0.00 4 1.90 9 1.59 0.73—3.026 Assistant nurses 2 2.44 2 1.25 – – 1 1.26 4 1.03 9 1.26 0.58—2.407 "Other health workers" 1 1.60 1 0.75 – – [0.73] 0.00 1 0.74 3 0.75 0.15—2.188 Teachers 2 1.42 4 1.39 – – 2 1.42 5 1.07 13 1.26 0.67—2.159 Religious workers etc [0.19] 0.00 [1.67] 0.00 – – 1 2.82 1 0.56 2 0.50 0.06—1.8010 Artistic workers [0.09] 0.00 [0.25] 0.00 – – [0.10] 0.00 [0.32] 0.00 [0.76] 0.00 0.00—4.8611 Journalists [0.02] 0.00 [0.16] 0.00 – – [0.03] 0.00 [0.15] 0.00 [0.35] 0.00 0.00—10.4212 Administrators [0.56] 0.00 [0.52] 0.00 – – [0.33] 0.00 [0.69] 0.00 [2.11] 0.00 0.00—1.7513 Clerical workers 5 0.87 12 1.25 – – 4 0.93 12 1.05 33 1.06 0.73—1.4914 Sales agents [0.05] 0.00 1 0.79 – – 2 4.07 1 0.72 4 1.25 0.34—3.2015 Shop workers 8 2.12 4 0.86 – – 3 0.89 8 1.32 23 1.29 0.82—1.9416 Farmers 4 1.53 3 1.26 – – 1 0.49 [0.50] 0.00 8 1.06 0.46—2.1017 Gardeners 1 2.95 5 0.71 – – [1.24] 0.00 1 0.66 7 0.69 0.28—1.4218 Fishermen [0.01] 0.00 1 57.82 – – [0.02] 0.00 [0.00] 0.00 1 18.37 0.46—102.3619 Forestry workers [0.00] 0.00 [0.03] 0.00 – – [0.03] 0.00 [0.04] 0.00 [0.10] 0.00 0.00—37.6320 Miners and quarry workers [0.00] 0.00 [0.01] 0.00 – – [0.00] 0.00 [0.01] 0.00 [0.02] 0.00 0.00—147.7121 Seamen – – [0.01] 0.00 – – [0.00] 0.00 [0.00] 0.00 [0.01] 0.00 0.00—306.2822 Transport workers [0.00] 0.00 [0.20] 0.00 – – [0.02] 0.00 [0.12] 0.00 [0.34] 0.00 0.00—10.7223 Drivers [0.10] 0.00 [0.12] 0.00 – – [0.07] 0.00 [0.29] 0.00 [0.58] 0.00 0.00—6.4024 Postal workers [0.21] 0.00 [1.35] 0.00 – – [0.77] 0.00 3 1.57 3 0.71 0.15—2.0725 Textile workers [1.28] 0.00 3 1.01 – – [1.05] 0.00 3 0.96 6 0.71 0.26—1.5526 Shoe and leather workers [0.10] 0.00 1 2.72 – – [0.08] 0.00 [0.25] 0.00 1 1.26 0.03—7.0327 Smelting workers [0.02] 0.00 [0.08] 0.00 – – [0.01] 0.00 [0.09] 0.00 [0.21] 0.00 0.00—17.7028 Mechanics [0.24] 0.00 [0.40] 0.00 – – [0.11] 0.00 [0.85] 0.00 [1.60] 0.00 0.00—2.3029 Plumbers [0.00] 0.00 [0.00] 0.00 – – [0.00] 0.00 [0.00] 0.00 [0.01] 0.00 0.00—664.3330 Welders – – [0.04] 0.00 – – [0.01] 0.00 [0.04] 0.00 [0.08] 0.00 0.00—43.5631 Electrical workers 1 2.94 [0.31] 0.00 – – [0.12] 0.00 1 2.04 2 1.58 0.19—5.7232 Wood workers [0.11] 0.00 [0.72] 0.00 – – [0.04] 0.00 [0.15] 0.00 [1.02] 0.00 0.00—3.6133 Painters [0.00] 0.00 [0.09] 0.00 – – [0.01] 0.00 [0.04] 0.00 [0.15] 0.00 0.00—25.4334 "Other construction workers" [0.00] 0.00 1 3.73 – – [0.00] 0.00 [0.01] 0.00 1 3.56 0.09—19.8435 Bricklayers [0.00] 0.00 [0.01] 0.00 – – [0.00] 0.00 [0.00] 0.00 [0.01] 0.00 0.00—316.6236 Printers 1 8.02 1 2.47 – – [0.10] 0.00 [0.34] 0.00 2 2.06 0.25—7.4437 Chemical process workers [0.19] 0.00 [0.19] 0.00 – – 1 11.16 [0.25] 0.00 1 1.38 0.03—7.6938 Food workers 2 2.13 1 1.02 – – [0.55] 0.00 2 2.95 5 1.59 0.52—3.7039 Beverage workers [0.09] 0.00 [0.05] 0.00 – – [0.01] 0.00 [0.04] 0.00 [0.19] 0.00 0.00—19.3040 Tobacco workers [0.13] 0.00 [0.03] 0.00 – – [0.02] 0.00 [0.03] 0.00 [0.20] 0.00 0.00—18.0341 Glass makers etc [0.24] 0.00 [0.72] 0.00 – – [0.20] 0.00 1 1.44 1 0.54 0.01—3.0242 Packers [0.07] 0.00 2 1.58 – – [0.46] 0.00 [1.00] 0.00 2 0.72 0.09—2.5943 Engine operators [0.00] 0.00 1 4.77 – – [0.01] 0.00 [0.08] 0.00 1 3.30 0.08—18.3744 Public safety workers 1 148.35 [0.05] 0.00 – – [0.06] 0.00 [0.12] 0.00 1 4.17 0.11—23.2145 Cooks and stewards [0.00] 0.00 3 2.10 – – [0.58] 0.00 2 1.62 5 1.54 0.50—3.6046 Domestic assistants 2 1.40 2 1.21 – – 3 1.94 6 1.45 13 1.48 0.79—2.5347 Waiters [0.26] 0.00 1 0.78 – – 1 1.40 [1.37] 0.00 2 0.55 0.07—1.9948 Building caretakers [4.19] 0.00 2 0.43 – – 8 2.55 2 0.54 12 0.76 0.39—1.3349 Chimney sweeps [0.00] 0.00 [0.00] 0.00 – – [0.00] 0.00 [0.00] 0.00 [0.00] 0.00 0.00—1165.3550 Hairdressers [0.25] 0.00 [0.49] 0.00 – – 1 5.36 1 1.43 2 1.23 0.15—4.4351 Launderers [0.46] 0.00 [0.35] 0.00 – – [0.24] 0.00 [0.66] 0.00 [1.71] 0.00 0.00—2.1652 Military personnel [0.00] 0.00 [0.01] 0.00 – – [0.00] 0.00 [0.00] 0.00 [0.01] 0.00 0.00—268.7053 "Other workers" 1 0.83 2 1.30 – – 2 1.24 1 0.56 6 0.98 0.36—2.1354 Economically inactive 27 0.87 28 0.95 – – 12 0.75 71 0.99 138 0.93 0.79—1.10
1-54 All categories 61 1.00 88 1.00 – – 44 1.00 133 1.00 326 1.00 # REF. #
Obs = observed number of cases; SIR = standardised incidence ratio; 95% CI = 95% confidence interval
107 Index Prev Next
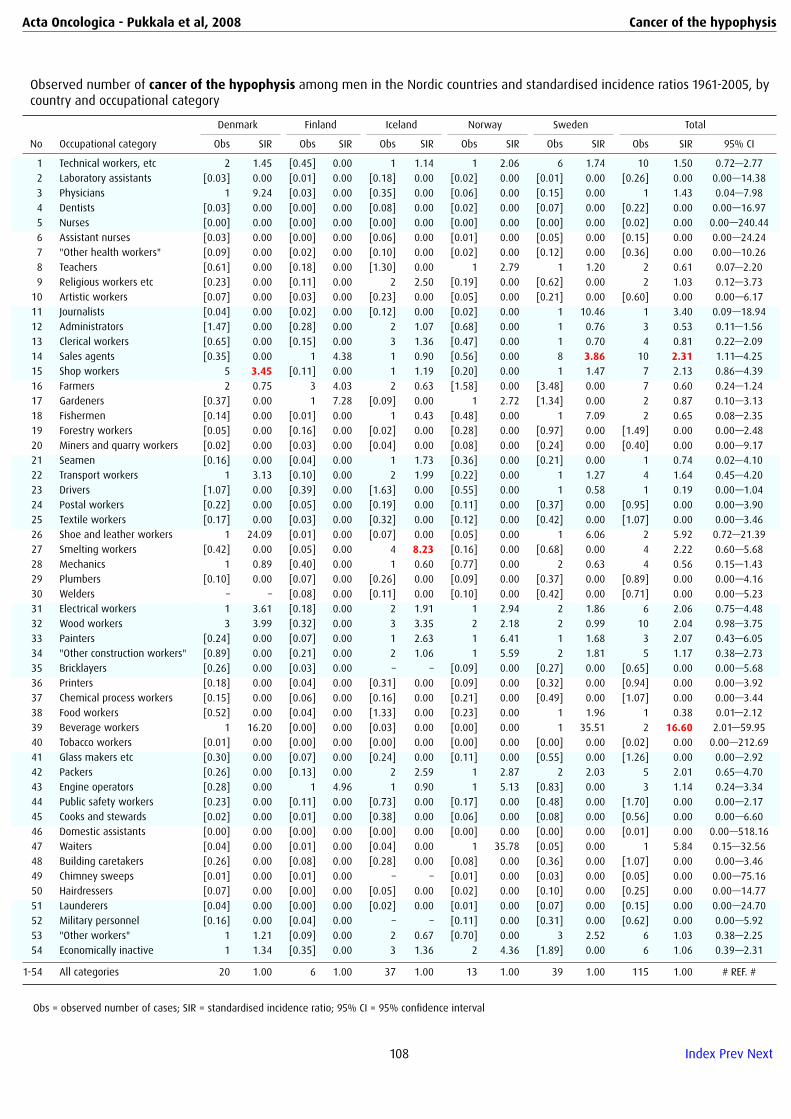
Acta Oncologica - Pukkala et al, 2008 Cancer of the hypophysis
Observed number of cancer of the hypophysis among men in the Nordic countries and standardised incidence ratios 1961-2005, bycountry and occupational category
Denmark Finland Iceland Norway Sweden Total
No Occupational category Obs SIR Obs SIR Obs SIR Obs SIR Obs SIR Obs SIR 95% CI
1 Technical workers, etc 2 1.45 [0.45] 0.00 1 1.14 1 2.06 6 1.74 10 1.50 0.72—2.772 Laboratory assistants [0.03] 0.00 [0.01] 0.00 [0.18] 0.00 [0.02] 0.00 [0.01] 0.00 [0.26] 0.00 0.00—14.383 Physicians 1 9.24 [0.03] 0.00 [0.35] 0.00 [0.06] 0.00 [0.15] 0.00 1 1.43 0.04—7.984 Dentists [0.03] 0.00 [0.00] 0.00 [0.08] 0.00 [0.02] 0.00 [0.07] 0.00 [0.22] 0.00 0.00—16.975 Nurses [0.00] 0.00 [0.00] 0.00 [0.00] 0.00 [0.00] 0.00 [0.00] 0.00 [0.02] 0.00 0.00—240.446 Assistant nurses [0.03] 0.00 [0.00] 0.00 [0.06] 0.00 [0.01] 0.00 [0.05] 0.00 [0.15] 0.00 0.00—24.247 "Other health workers" [0.09] 0.00 [0.02] 0.00 [0.10] 0.00 [0.02] 0.00 [0.12] 0.00 [0.36] 0.00 0.00—10.268 Teachers [0.61] 0.00 [0.18] 0.00 [1.30] 0.00 1 2.79 1 1.20 2 0.61 0.07—2.209 Religious workers etc [0.23] 0.00 [0.11] 0.00 2 2.50 [0.19] 0.00 [0.62] 0.00 2 1.03 0.12—3.7310 Artistic workers [0.07] 0.00 [0.03] 0.00 [0.23] 0.00 [0.05] 0.00 [0.21] 0.00 [0.60] 0.00 0.00—6.1711 Journalists [0.04] 0.00 [0.02] 0.00 [0.12] 0.00 [0.02] 0.00 1 10.46 1 3.40 0.09—18.9412 Administrators [1.47] 0.00 [0.28] 0.00 2 1.07 [0.68] 0.00 1 0.76 3 0.53 0.11—1.5613 Clerical workers [0.65] 0.00 [0.15] 0.00 3 1.36 [0.47] 0.00 1 0.70 4 0.81 0.22—2.0914 Sales agents [0.35] 0.00 1 4.38 1 0.90 [0.56] 0.00 8 3.86 10 2.31 1.11—4.2515 Shop workers 5 3.45 [0.11] 0.00 1 1.19 [0.20] 0.00 1 1.47 7 2.13 0.86—4.3916 Farmers 2 0.75 3 4.03 2 0.63 [1.58] 0.00 [3.48] 0.00 7 0.60 0.24—1.2417 Gardeners [0.37] 0.00 1 7.28 [0.09] 0.00 1 2.72 [1.34] 0.00 2 0.87 0.10—3.1318 Fishermen [0.14] 0.00 [0.01] 0.00 1 0.43 [0.48] 0.00 1 7.09 2 0.65 0.08—2.3519 Forestry workers [0.05] 0.00 [0.16] 0.00 [0.02] 0.00 [0.28] 0.00 [0.97] 0.00 [1.49] 0.00 0.00—2.4820 Miners and quarry workers [0.02] 0.00 [0.03] 0.00 [0.04] 0.00 [0.08] 0.00 [0.24] 0.00 [0.40] 0.00 0.00—9.1721 Seamen [0.16] 0.00 [0.04] 0.00 1 1.73 [0.36] 0.00 [0.21] 0.00 1 0.74 0.02—4.1022 Transport workers 1 3.13 [0.10] 0.00 2 1.99 [0.22] 0.00 1 1.27 4 1.64 0.45—4.2023 Drivers [1.07] 0.00 [0.39] 0.00 [1.63] 0.00 [0.55] 0.00 1 0.58 1 0.19 0.00—1.0424 Postal workers [0.22] 0.00 [0.05] 0.00 [0.19] 0.00 [0.11] 0.00 [0.37] 0.00 [0.95] 0.00 0.00—3.9025 Textile workers [0.17] 0.00 [0.03] 0.00 [0.32] 0.00 [0.12] 0.00 [0.42] 0.00 [1.07] 0.00 0.00—3.4626 Shoe and leather workers 1 24.09 [0.01] 0.00 [0.07] 0.00 [0.05] 0.00 1 6.06 2 5.92 0.72—21.3927 Smelting workers [0.42] 0.00 [0.05] 0.00 4 8.23 [0.16] 0.00 [0.68] 0.00 4 2.22 0.60—5.6828 Mechanics 1 0.89 [0.40] 0.00 1 0.60 [0.77] 0.00 2 0.63 4 0.56 0.15—1.4329 Plumbers [0.10] 0.00 [0.07] 0.00 [0.26] 0.00 [0.09] 0.00 [0.37] 0.00 [0.89] 0.00 0.00—4.1630 Welders – – [0.08] 0.00 [0.11] 0.00 [0.10] 0.00 [0.42] 0.00 [0.71] 0.00 0.00—5.2331 Electrical workers 1 3.61 [0.18] 0.00 2 1.91 1 2.94 2 1.86 6 2.06 0.75—4.4832 Wood workers 3 3.99 [0.32] 0.00 3 3.35 2 2.18 2 0.99 10 2.04 0.98—3.7533 Painters [0.24] 0.00 [0.07] 0.00 1 2.63 1 6.41 1 1.68 3 2.07 0.43—6.0534 "Other construction workers" [0.89] 0.00 [0.21] 0.00 2 1.06 1 5.59 2 1.81 5 1.17 0.38—2.7335 Bricklayers [0.26] 0.00 [0.03] 0.00 – – [0.09] 0.00 [0.27] 0.00 [0.65] 0.00 0.00—5.6836 Printers [0.18] 0.00 [0.04] 0.00 [0.31] 0.00 [0.09] 0.00 [0.32] 0.00 [0.94] 0.00 0.00—3.9237 Chemical process workers [0.15] 0.00 [0.06] 0.00 [0.16] 0.00 [0.21] 0.00 [0.49] 0.00 [1.07] 0.00 0.00—3.4438 Food workers [0.52] 0.00 [0.04] 0.00 [1.33] 0.00 [0.23] 0.00 1 1.96 1 0.38 0.01—2.1239 Beverage workers 1 16.20 [0.00] 0.00 [0.03] 0.00 [0.00] 0.00 1 35.51 2 16.60 2.01—59.9540 Tobacco workers [0.01] 0.00 [0.00] 0.00 [0.00] 0.00 [0.00] 0.00 [0.00] 0.00 [0.02] 0.00 0.00—212.6941 Glass makers etc [0.30] 0.00 [0.07] 0.00 [0.24] 0.00 [0.11] 0.00 [0.55] 0.00 [1.26] 0.00 0.00—2.9242 Packers [0.26] 0.00 [0.13] 0.00 2 2.59 1 2.87 2 2.03 5 2.01 0.65—4.7043 Engine operators [0.28] 0.00 1 4.96 1 0.90 1 5.13 [0.83] 0.00 3 1.14 0.24—3.3444 Public safety workers [0.23] 0.00 [0.11] 0.00 [0.73] 0.00 [0.17] 0.00 [0.48] 0.00 [1.70] 0.00 0.00—2.1745 Cooks and stewards [0.02] 0.00 [0.01] 0.00 [0.38] 0.00 [0.06] 0.00 [0.08] 0.00 [0.56] 0.00 0.00—6.6046 Domestic assistants [0.00] 0.00 [0.00] 0.00 [0.00] 0.00 [0.00] 0.00 [0.00] 0.00 [0.01] 0.00 0.00—518.1647 Waiters [0.04] 0.00 [0.01] 0.00 [0.04] 0.00 1 35.78 [0.05] 0.00 1 5.84 0.15—32.5648 Building caretakers [0.26] 0.00 [0.08] 0.00 [0.28] 0.00 [0.08] 0.00 [0.36] 0.00 [1.07] 0.00 0.00—3.4649 Chimney sweeps [0.01] 0.00 [0.01] 0.00 – – [0.01] 0.00 [0.03] 0.00 [0.05] 0.00 0.00—75.1650 Hairdressers [0.07] 0.00 [0.00] 0.00 [0.05] 0.00 [0.02] 0.00 [0.10] 0.00 [0.25] 0.00 0.00—14.7751 Launderers [0.04] 0.00 [0.00] 0.00 [0.02] 0.00 [0.01] 0.00 [0.07] 0.00 [0.15] 0.00 0.00—24.7052 Military personnel [0.16] 0.00 [0.04] 0.00 – – [0.11] 0.00 [0.31] 0.00 [0.62] 0.00 0.00—5.9253 "Other workers" 1 1.21 [0.09] 0.00 2 0.67 [0.70] 0.00 3 2.52 6 1.03 0.38—2.2554 Economically inactive 1 1.34 [0.35] 0.00 3 1.36 2 4.36 [1.89] 0.00 6 1.06 0.39—2.31
1-54 All categories 20 1.00 6 1.00 37 1.00 13 1.00 39 1.00 115 1.00 # REF. #
Obs = observed number of cases; SIR = standardised incidence ratio; 95% CI = 95% confidence interval
108 Index Prev Next

Acta Oncologica - Pukkala et al, 2008 Cancer of the hypophysis
Observed number of cancer of the hypophysis among women in the Nordic countries and standardised incidence ratios 1961-2005, bycountry and occupational category
Denmark Finland Iceland Norway Sweden Total
No Occupational category Obs SIR Obs SIR Obs SIR Obs SIR Obs SIR Obs SIR 95% CI
1 Technical workers, etc [0.05] 0.00 [0.03] 0.00 [0.11] 0.00 [0.02] 0.00 [0.15] 0.00 [0.36] 0.00 0.00—10.262 Laboratory assistants [0.04] 0.00 [0.02] 0.00 [0.14] 0.00 [0.02] 0.00 [0.04] 0.00 [0.26] 0.00 0.00—14.463 Physicians [0.02] 0.00 [0.01] 0.00 [0.02] 0.00 [0.01] 0.00 [0.03] 0.00 [0.09] 0.00 0.00—42.234 Dentists [0.01] 0.00 [0.01] 0.00 [0.01] 0.00 [0.01] 0.00 [0.03] 0.00 [0.07] 0.00 0.00—54.195 Nurses [0.28] 0.00 [0.10] 0.00 1 1.71 [0.19] 0.00 [0.45] 0.00 1 0.62 0.02—3.466 Assistant nurses [0.21] 0.00 [0.10] 0.00 [0.95] 0.00 [0.19] 0.00 1 1.35 1 0.46 0.01—2.547 "Other health workers" [0.16] 0.00 [0.08] 0.00 [0.20] 0.00 [0.18] 0.00 [0.25] 0.00 [0.87] 0.00 0.00—4.258 Teachers [0.37] 0.00 [0.20] 0.00 1 0.94 [0.33] 0.00 1 1.08 2 0.69 0.08—2.519 Religious workers etc [0.05] 0.00 [0.09] 0.00 [0.15] 0.00 1 12.22 [0.32] 0.00 1 1.45 0.04—8.0510 Artistic workers [0.02] 0.00 [0.02] 0.00 1 8.04 [0.02] 0.00 [0.06] 0.00 1 3.99 0.10—22.2211 Journalists [0.01] 0.00 [0.01] 0.00 [0.03] 0.00 [0.01] 0.00 [0.03] 0.00 [0.08] 0.00 0.00—43.4812 Administrators [0.14] 0.00 [0.03] 0.00 [0.08] 0.00 [0.08] 0.00 [0.15] 0.00 [0.49] 0.00 0.00—7.5713 Clerical workers 2 1.33 [0.64] 0.00 4 1.16 2 1.92 1 0.41 9 0.99 0.45—1.8814 Sales agents [0.01] 0.00 [0.10] 0.00 [0.31] 0.00 [0.14] 0.00 1 2.49 1 1.04 0.03—5.8115 Shop workers 1 1.05 [0.34] 0.00 2 0.98 [0.87] 0.00 1 0.57 4 0.67 0.18—1.7216 Farmers 1 1.51 [0.28] 0.00 2 1.59 [0.55] 0.00 [0.17] 0.00 3 1.03 0.21—3.0017 Gardeners [0.09] 0.00 1 1.43 [0.05] 0.00 [0.33] 0.00 [0.44] 0.00 1 0.62 0.02—3.4718 Fishermen [0.00] 0.00 [0.00] 0.00 [0.05] 0.00 [0.00] 0.00 [0.00] 0.00 [0.06] 0.00 0.00—57.6819 Forestry workers [0.00] 0.00 [0.00] 0.00 [0.01] 0.00 [0.01] 0.00 [0.01] 0.00 [0.03] 0.00 0.00—133.2720 Miners and quarry workers [0.00] 0.00 [0.00] 0.00 [0.00] 0.00 [0.00] 0.00 [0.00] 0.00 [0.00] 0.00 0.00—778.4721 Seamen – – [0.00] 0.00 [0.00] 0.00 [0.00] 0.00 [0.00] 0.00 [0.00] 0.00 0.00—1679.3522 Transport workers [0.00] 0.00 [0.02] 0.00 [0.05] 0.00 [0.00] 0.00 [0.03] 0.00 [0.10] 0.00 0.00—35.3923 Drivers [0.02] 0.00 [0.01] 0.00 [0.03] 0.00 [0.02] 0.00 [0.05] 0.00 [0.13] 0.00 0.00—28.3324 Postal workers [0.05] 0.00 [0.11] 0.00 1 1.61 [0.20] 0.00 2 4.47 3 2.11 0.44—6.1725 Textile workers [0.33] 0.00 [0.25] 0.00 1 0.99 [0.30] 0.00 3 2.68 4 1.33 0.36—3.4126 Shoe and leather workers [0.02] 0.00 [0.03] 0.00 [0.06] 0.00 [0.02] 0.00 [0.09] 0.00 [0.22] 0.00 0.00—16.7527 Smelting workers [0.01] 0.00 [0.01] 0.00 [0.00] 0.00 [0.00] 0.00 [0.02] 0.00 [0.04] 0.00 0.00—100.1428 Mechanics [0.06] 0.00 1 30.78 [0.01] 0.00 [0.03] 0.00 [0.20] 0.00 1 2.98 0.08—16.6329 Plumbers [0.00] 0.00 [0.00] 0.00 – – [0.00] 0.00 [0.00] 0.00 [0.00] 0.00 0.00—3740.0630 Welders – – [0.00] 0.00 [0.00] 0.00 [0.00] 0.00 [0.01] 0.00 [0.01] 0.00 0.00—297.0631 Electrical workers [0.09] 0.00 [0.02] 0.00 [0.01] 0.00 [0.03] 0.00 [0.11] 0.00 [0.26] 0.00 0.00—14.4332 Wood workers [0.03] 0.00 [0.06] 0.00 [0.02] 0.00 [0.01] 0.00 [0.03] 0.00 [0.15] 0.00 0.00—24.2233 Painters [0.00] 0.00 [0.01] 0.00 [0.01] 0.00 [0.00] 0.00 [0.01] 0.00 [0.03] 0.00 0.00—135.5234 "Other construction workers" [0.00] 0.00 1 36.76 [0.01] 0.00 [0.00] 0.00 [0.00] 0.00 1 28.76 0.73—160.2535 Bricklayers [0.00] 0.00 [0.00] 0.00 – – [0.00] 0.00 [0.00] 0.00 [0.00] 0.00 0.00—3484.0036 Printers [0.03] 0.00 [0.03] 0.00 [0.11] 0.00 [0.03] 0.00 [0.09] 0.00 [0.29] 0.00 0.00—12.9237 Chemical process workers [0.05] 0.00 [0.02] 0.00 [0.04] 0.00 [0.02] 0.00 [0.07] 0.00 [0.20] 0.00 0.00—18.2438 Food workers [0.24] 0.00 [0.08] 0.00 [2.46] 0.00 [0.15] 0.00 1 4.39 1 0.32 0.01—1.7639 Beverage workers [0.02] 0.00 [0.00] 0.00 [0.01] 0.00 [0.00] 0.00 [0.01] 0.00 [0.05] 0.00 0.00—75.1040 Tobacco workers [0.03] 0.00 [0.00] 0.00 – – [0.00] 0.00 [0.01] 0.00 [0.05] 0.00 0.00—80.0641 Glass makers etc [0.06] 0.00 [0.06] 0.00 [0.07] 0.00 [0.05] 0.00 [0.19] 0.00 [0.43] 0.00 0.00—8.6342 Packers [0.02] 0.00 [0.10] 0.00 [0.22] 0.00 [0.12] 0.00 1 3.47 1 1.35 0.03—7.5043 Engine operators [0.00] 0.00 [0.02] 0.00 [0.00] 0.00 [0.00] 0.00 [0.01] 0.00 [0.04] 0.00 0.00—100.4944 Public safety workers [0.00] 0.00 [0.00] 0.00 [0.04] 0.00 [0.02] 0.00 [0.02] 0.00 [0.08] 0.00 0.00—44.3145 Cooks and stewards [0.00] 0.00 [0.12] 0.00 [0.78] 0.00 [0.17] 0.00 [0.45] 0.00 [1.52] 0.00 0.00—2.4346 Domestic assistants [0.36] 0.00 [0.14] 0.00 [0.21] 0.00 [0.44] 0.00 1 0.96 1 0.46 0.01—2.5547 Waiters [0.07] 0.00 [0.10] 0.00 [0.11] 0.00 1 5.30 1 2.16 2 2.17 0.26—7.8548 Building caretakers 1 0.97 [0.43] 0.00 3 1.98 1 1.23 1 0.91 6 1.23 0.45—2.6749 Chimney sweeps [0.00] 0.00 [0.00] 0.00 – – [0.00] 0.00 [0.00] 0.00 [0.00] 0.00 0.00—10860.6550 Hairdressers [0.07] 0.00 [0.04] 0.00 [0.12] 0.00 [0.04] 0.00 [0.18] 0.00 [0.45] 0.00 0.00—8.2151 Launderers [0.12] 0.00 [0.04] 0.00 1 4.40 [0.07] 0.00 [0.25] 0.00 1 1.44 0.04—8.0152 Military personnel [0.00] 0.00 [0.00] 0.00 – – [0.00] 0.00 [0.00] 0.00 [0.00] 0.00 0.00—2243.2853 "Other workers" 1 3.35 [0.13] 0.00 2 1.07 1 2.40 [0.49] 0.00 4 1.25 0.34—3.2154 Economically inactive 9 1.21 5 1.50 7 1.21 6 1.25 25 1.02 52 1.13 0.85—1.49
1-54 All categories 15 1.00 8 1.00 26 1.00 12 1.00 40 1.00 101 1.00 # REF. #
Obs = observed number of cases; SIR = standardised incidence ratio; 95% CI = 95% confidence interval
109 Index Prev Next

Acta Oncologica - Pukkala et al, 2008 Cancer of the corpus pineale
Observed number of cancer of the corpus pineale among men in the Nordic countries and standardised incidence ratios 1961-2005, bycountry and occupational category
Denmark Finland Iceland Norway Sweden Total
No Occupational category Obs SIR Obs SIR Obs SIR Obs SIR Obs SIR Obs SIR 95% CI
1 Technical workers, etc – – [0.91] 0.00 – – [0.23] 0.00 – – [1.15] 0.00 0.00—3.212 Laboratory assistants – – [0.02] 0.00 – – [0.01] 0.00 – – [0.03] 0.00 0.00—115.053 Physicians – – [0.05] 0.00 – – [0.03] 0.00 – – [0.08] 0.00 0.00—48.104 Dentists – – [0.01] 0.00 – – [0.01] 0.00 – – [0.02] 0.00 0.00—178.855 Nurses – – [0.00] 0.00 – – [0.00] 0.00 – – [0.01] 0.00 0.00—494.076 Assistant nurses – – [0.00] 0.00 – – [0.00] 0.00 – – [0.01] 0.00 0.00—553.707 "Other health workers" – – [0.05] 0.00 – – [0.01] 0.00 – – [0.06] 0.00 0.00—62.768 Teachers – – [0.35] 0.00 – – [0.19] 0.00 – – [0.53] 0.00 0.00—6.949 Religious workers etc – – [0.22] 0.00 – – [0.07] 0.00 – – [0.29] 0.00 0.00—12.8610 Artistic workers – – [0.07] 0.00 – – [0.02] 0.00 – – [0.09] 0.00 0.00—43.2311 Journalists – – [0.03] 0.00 – – [0.01] 0.00 – – [0.04] 0.00 0.00—85.7012 Administrators – – 1 1.95 – – 1 4.80 – – 2 2.77 0.34—10.0113 Clerical workers – – [0.32] 0.00 – – [0.13] 0.00 – – [0.45] 0.00 0.00—8.1414 Sales agents – – 1 2.05 – – 1 7.26 – – 2 3.19 0.39—11.5315 Shop workers – – [0.23] 0.00 – – [0.08] 0.00 – – [0.31] 0.00 0.00—12.0716 Farmers – – 1 0.56 – – [0.13] 0.00 – – 1 0.52 0.01—2.9117 Gardeners – – [0.30] 0.00 – – [0.02] 0.00 – – [0.33] 0.00 0.00—11.3018 Fishermen – – [0.02] 0.00 – – [0.05] 0.00 – – [0.07] 0.00 0.00—49.6519 Forestry workers – – [0.37] 0.00 – – [0.01] 0.00 – – [0.38] 0.00 0.00—9.6420 Miners and quarry workers – – [0.06] 0.00 – – [0.01] 0.00 – – [0.08] 0.00 0.00—49.1821 Seamen – – [0.08] 0.00 – – [0.12] 0.00 – – [0.20] 0.00 0.00—18.3022 Transport workers – – [0.25] 0.00 – – [0.03] 0.00 – – [0.28] 0.00 0.00—13.2623 Drivers – – [0.80] 0.00 – – [0.16] 0.00 – – [0.97] 0.00 0.00—3.8224 Postal workers – – [0.12] 0.00 – – [0.03] 0.00 – – [0.15] 0.00 0.00—23.9325 Textile workers – – [0.07] 0.00 – – [0.01] 0.00 – – [0.08] 0.00 0.00—46.0726 Shoe and leather workers – – [0.03] 0.00 – – [0.00] 0.00 – – [0.03] 0.00 0.00—115.6927 Smelting workers – – [0.11] 0.00 – – [0.03] 0.00 – – [0.15] 0.00 0.00—25.2928 Mechanics – – 1 1.20 – – [0.24] 0.00 – – 1 0.93 0.02—5.1829 Plumbers – – [0.14] 0.00 – – [0.03] 0.00 – – [0.17] 0.00 0.00—21.8730 Welders – – 1 6.81 – – [0.04] 0.00 – – 1 5.24 0.13—29.1931 Electrical workers – – [0.37] 0.00 – – [0.10] 0.00 – – [0.47] 0.00 0.00—7.8332 Wood workers – – [0.78] 0.00 – – [0.14] 0.00 – – [0.92] 0.00 0.00—3.9933 Painters – – [0.17] 0.00 – – [0.03] 0.00 – – [0.19] 0.00 0.00—19.3534 "Other construction workers" – – 3 6.03 – – [0.05] 0.00 – – 3 5.48 1.13—16.0135 Bricklayers – – 1 12.18 – – [0.01] 0.00 – – 1 10.43 0.26—58.0936 Printers – – [0.09] 0.00 – – [0.03] 0.00 – – [0.12] 0.00 0.00—30.9337 Chemical process workers – – [0.13] 0.00 – – [0.03] 0.00 – – [0.16] 0.00 0.00—22.6738 Food workers – – 1 10.57 – – [0.04] 0.00 – – 1 7.45 0.19—41.4939 Beverage workers – – [0.01] 0.00 – – [0.00] 0.00 – – [0.01] 0.00 0.00—419.4340 Tobacco workers – – [0.00] 0.00 – – [0.00] 0.00 – – [0.00] 0.00 0.00—2954.6041 Glass makers etc – – 1 6.95 – – [0.03] 0.00 – – 1 5.64 0.14—31.4542 Packers – – 1 3.63 – – [0.06] 0.00 – – 1 2.99 0.08—16.6443 Engine operators – – [0.40] 0.00 – – 1 12.30 – – 1 2.08 0.05—11.5844 Public safety workers – – [0.23] 0.00 – – [0.03] 0.00 – – [0.26] 0.00 0.00—14.1345 Cooks and stewards – – [0.02] 0.00 – – [0.03] 0.00 – – [0.05] 0.00 0.00—76.3446 Domestic assistants – – [0.00] 0.00 – – [0.00] 0.00 – – [0.00] 0.00 0.00—3696.9847 Waiters – – [0.02] 0.00 – – [0.01] 0.00 – – [0.03] 0.00 0.00—136.4348 Building caretakers – – [0.18] 0.00 – – [0.03] 0.00 – – [0.21] 0.00 0.00—17.8249 Chimney sweeps – – [0.01] 0.00 – – [0.00] 0.00 – – [0.02] 0.00 0.00—238.6050 Hairdressers – – [0.00] 0.00 – – [0.00] 0.00 – – [0.01] 0.00 0.00—510.8051 Launderers – – [0.00] 0.00 – – [0.00] 0.00 – – [0.01] 0.00 0.00—630.0952 Military personnel – – [0.08] 0.00 – – [0.03] 0.00 – – [0.11] 0.00 0.00—32.7053 "Other workers" – – [0.21] 0.00 – – [0.09] 0.00 – – [0.30] 0.00 0.00—12.2454 Economically inactive – – 1 1.28 – – [0.11] 0.00 – – 1 1.13 0.03—6.27
1-54 All categories – – 13 1.00 – – 3 1.00 – – 16 1.00 # REF. #
Obs = observed number of cases; SIR = standardised incidence ratio; 95% CI = 95% confidence interval
110 Index Prev Next

Acta Oncologica - Pukkala et al, 2008 Cancer of the corpus pineale
Observed number of cancer of the corpus pineale among women in the Nordic countries and standardised incidence ratios 1961-2005,by country and occupational category
Denmark Finland Iceland Norway Sweden Total
No Occupational category Obs SIR Obs SIR Obs SIR Obs SIR Obs SIR Obs SIR 95% CI
1 Technical workers, etc – – [0.22] 0.00 – – [0.02] 0.00 – – [0.24] 0.00 0.00—15.432 Laboratory assistants – – [0.11] 0.00 – – [0.02] 0.00 – – [0.13] 0.00 0.00—28.383 Physicians – – [0.06] 0.00 – – [0.01] 0.00 – – [0.06] 0.00 0.00—57.254 Dentists – – [0.04] 0.00 – – [0.01] 0.00 – – [0.05] 0.00 0.00—80.905 Nurses – – 1 1.81 – – [0.17] 0.00 – – 1 1.39 0.04—7.756 Assistant nurses – – [0.47] 0.00 – – [0.16] 0.00 – – [0.63] 0.00 0.00—5.897 "Other health workers" – – 1 2.44 – – [0.14] 0.00 – – 1 1.81 0.05—10.078 Teachers – – 1 1.13 – – [0.29] 0.00 – – 1 0.85 0.02—4.749 Religious workers etc – – 1 1.63 – – [0.07] 0.00 – – 1 1.46 0.04—8.1610 Artistic workers – – [0.08] 0.00 – – [0.02] 0.00 – – [0.10] 0.00 0.00—35.9311 Journalists – – [0.05] 0.00 – – [0.01] 0.00 – – [0.06] 0.00 0.00—66.3812 Administrators – – [0.18] 0.00 – – [0.06] 0.00 – – [0.25] 0.00 0.00—15.0413 Clerical workers – – 2 0.64 – – [0.84] 0.00 – – 2 0.51 0.06—1.8314 Sales agents – – 1 2.67 – – 1 11.21 – – 2 4.31 0.52—15.5715 Shop workers – – 2 1.51 – – 1 1.63 – – 3 1.55 0.32—4.5216 Farmers – – 1 1.68 – – 1 2.84 – – 2 2.11 0.26—7.6217 Gardeners – – 2 1.16 – – [0.21] 0.00 – – 2 1.03 0.12—3.7218 Fishermen – – [0.01] 0.00 – – [0.00] 0.00 – – [0.01] 0.00 0.00—424.5919 Forestry workers – – [0.01] 0.00 – – [0.00] 0.00 – – [0.01] 0.00 0.00—262.7720 Miners and quarry workers – – [0.00] 0.00 – – [0.00] 0.00 – – [0.00] 0.00 0.00—1082.4921 Seamen – – [0.00] 0.00 – – [0.00] 0.00 – – [0.00] 0.00 0.00—1226.7222 Transport workers – – [0.06] 0.00 – – [0.00] 0.00 – – [0.06] 0.00 0.00—60.1823 Drivers – – [0.04] 0.00 – – [0.01] 0.00 – – [0.05] 0.00 0.00—71.7124 Postal workers – – [0.37] 0.00 – – [0.15] 0.00 – – [0.52] 0.00 0.00—7.1125 Textile workers – – 1 1.23 – – [0.18] 0.00 – – 1 1.01 0.03—5.6126 Shoe and leather workers – – [0.10] 0.00 – – [0.01] 0.00 – – [0.11] 0.00 0.00—32.2827 Smelting workers – – [0.02] 0.00 – – [0.00] 0.00 – – [0.03] 0.00 0.00—144.3328 Mechanics – – [0.12] 0.00 – – [0.02] 0.00 – – [0.14] 0.00 0.00—26.6929 Plumbers – – [0.00] 0.00 – – [0.00] 0.00 – – [0.00] 0.00 0.00—6858.7630 Welders – – [0.01] 0.00 – – [0.00] 0.00 – – [0.01] 0.00 0.00—250.2931 Electrical workers – – [0.11] 0.00 – – [0.02] 0.00 – – [0.13] 0.00 0.00—28.7632 Wood workers – – [0.19] 0.00 – – [0.01] 0.00 – – [0.20] 0.00 0.00—18.5733 Painters – – [0.02] 0.00 – – [0.00] 0.00 – – [0.03] 0.00 0.00—145.5134 "Other construction workers" – – 1 16.05 – – [0.00] 0.00 – – 1 15.88 0.40—88.4635 Bricklayers – – [0.00] 0.00 – – [0.00] 0.00 – – [0.00] 0.00 0.00—1411.3336 Printers – – [0.12] 0.00 – – [0.02] 0.00 – – [0.14] 0.00 0.00—27.3137 Chemical process workers – – [0.05] 0.00 – – [0.02] 0.00 – – [0.07] 0.00 0.00—52.1738 Food workers – – [0.26] 0.00 – – [0.09] 0.00 – – [0.35] 0.00 0.00—10.4039 Beverage workers – – [0.01] 0.00 – – [0.00] 0.00 – – [0.01] 0.00 0.00—257.4140 Tobacco workers – – [0.01] 0.00 – – [0.00] 0.00 – – [0.01] 0.00 0.00—347.6041 Glass makers etc – – [0.20] 0.00 – – [0.04] 0.00 – – [0.23] 0.00 0.00—15.8842 Packers – – [0.34] 0.00 – – [0.08] 0.00 – – [0.42] 0.00 0.00—8.7343 Engine operators – – [0.06] 0.00 – – [0.00] 0.00 – – [0.06] 0.00 0.00—58.3644 Public safety workers – – [0.02] 0.00 – – [0.01] 0.00 – – [0.03] 0.00 0.00—143.8545 Cooks and stewards – – 1 2.44 – – [0.10] 0.00 – – 1 1.97 0.05—10.9946 Domestic assistants – – [0.52] 0.00 – – 1 3.95 – – 1 1.30 0.03—7.2447 Waiters – – [0.39] 0.00 – – [0.13] 0.00 – – [0.51] 0.00 0.00—7.1648 Building caretakers – – 2 1.56 – – 1 1.80 – – 3 1.63 0.34—4.7849 Chimney sweeps – – [0.00] 0.00 – – [0.00] 0.00 – – [0.00] 0.00 0.00—7244.6650 Hairdressers – – [0.15] 0.00 – – [0.03] 0.00 – – [0.19] 0.00 0.00—19.8551 Launderers – – [0.09] 0.00 – – [0.04] 0.00 – – [0.13] 0.00 0.00—29.3252 Military personnel – – [0.00] 0.00 – – [0.00] 0.00 – – [0.00] 0.00 0.00—1474.2853 "Other workers" – – [0.44] 0.00 – – [0.28] 0.00 – – [0.72] 0.00 0.00—5.1354 Economically inactive – – 7 1.01 – – 3 1.06 – – 10 1.03 0.49—1.89
1-54 All categories – – 24 1.00 – – 8 1.00 – – 32 1.00 # REF. #
Obs = observed number of cases; SIR = standardised incidence ratio; 95% CI = 95% confidence interval
111 Index Prev Next

Acta Oncologica - Pukkala et al, 2008 Bone cancer
Observed number of bone cancer among men in the Nordic countries and standardised incidence ratios 1961-2005, by country andoccupational category
Denmark Finland Iceland Norway Sweden Total
No Occupational category Obs SIR Obs SIR Obs SIR Obs SIR Obs SIR Obs SIR 95% CI
1 Technical workers, etc 16 0.99 24 0.86 1 1.83 9 0.55 109 1.20 159 1.05 0.90—1.222 Laboratory assistants [0.32] 0.00 [0.73] 0.00 [0.10] 0.00 3 4.02 [0.63] 0.00 3 1.19 0.24—3.473 Physicians 1 0.77 1 0.61 [0.18] 0.00 2 1.02 8 1.80 12 1.26 0.65—2.214 Dentists [0.39] 0.00 [0.33] 0.00 [0.05] 0.00 1 1.14 [1.99] 0.00 1 0.27 0.01—1.535 Nurses [0.02] 0.00 [0.13] 0.00 [0.00] 0.00 [0.13] 0.00 [0.48] 0.00 [0.76] 0.00 0.00—4.886 Assistant nurses 1 2.55 [0.13] 0.00 [0.04] 0.00 [0.32] 0.00 2 1.11 3 1.12 0.23—3.277 "Other health workers" 2 1.78 6 4.02 [0.05] 0.00 4 5.17 4 1.09 16 2.25 1.29—3.668 Teachers 5 0.70 11 1.02 [0.71] 0.00 13 1.12 22 0.91 51 0.94 0.70—1.239 Religious workers etc 1 0.35 7 1.05 [0.45] 0.00 8 1.41 23 1.13 39 1.08 0.77—1.4810 Artistic workers [0.91] 0.00 2 0.91 1 8.36 1 0.61 3 0.53 7 0.67 0.27—1.3711 Journalists 1 2.34 3 2.86 [0.07] 0.00 1 1.35 2 0.74 7 1.40 0.56—2.8812 Administrators 17 0.98 19 1.19 3 3.36 15 0.78 34 1.06 88 1.03 0.83—1.2713 Clerical workers 11 1.39 11 1.07 3 2.82 15 1.02 37 1.03 77 1.10 0.87—1.3814 Sales agents 4 0.95 14 0.91 [0.54] 0.00 13 0.78 45 0.84 76 0.84 0.66—1.0615 Shop workers 18 1.04 7 0.99 [0.43] 0.00 9 1.30 16 0.94 50 1.03 0.76—1.3516 Farmers 27 0.85 53 0.90 [1.40] 0.00 35 0.85 76 1.01 191 0.91 0.79—1.0517 Gardeners 4 0.87 11 1.12 [0.04] 0.00 12 1.13 29 0.97 56 1.02 0.77—1.3218 Fishermen [1.64] 0.00 1 1.22 [1.39] 0.00 19 1.37 5 1.59 25 1.20 0.78—1.7719 Forestry workers [0.66] 0.00 4 0.34 [0.01] 0.00 7 0.91 25 1.14 36 0.85 0.60—1.1820 Miners and quarry workers 1 4.81 1 0.51 [0.02] 0.00 4 1.69 5 0.86 11 1.06 0.53—1.9021 Seamen 5 2.67 4 1.53 [0.32] 0.00 18 1.44 10 1.90 37 1.64 1.15—2.2622 Transport workers 3 0.81 3 0.43 [0.48] 0.00 3 0.49 22 1.28 31 0.90 0.61—1.2723 Drivers 18 1.42 33 1.31 2 2.37 17 0.94 57 1.26 127 1.24 1.05—1.4824 Postal workers 3 1.20 5 1.33 [0.09] 0.00 1 0.29 3 0.30 12 0.61 0.32—1.0725 Textile workers 5 2.34 [2.27] 0.00 1 7.20 5 1.49 9 0.94 20 1.14 0.70—1.7726 Shoe and leather workers [0.51] 0.00 [0.99] 0.00 [0.03] 0.00 [1.41] 0.00 5 1.38 5 0.76 0.25—1.7827 Smelting workers 6 1.17 4 1.10 [0.23] 0.00 6 1.23 13 0.81 29 0.97 0.65—1.3928 Mechanics 6 0.44 24 0.94 [0.93] 0.00 25 1.00 86 1.05 141 0.96 0.81—1.1329 Plumbers 2 1.58 [4.35] 0.00 1 7.26 2 0.67 9 0.97 14 0.78 0.42—1.3030 Welders – – 8 1.74 [0.06] 0.00 2 0.58 15 1.33 25 1.29 0.83—1.9031 Electrical workers 6 1.78 11 0.97 1 1.63 11 0.98 16 0.55 45 0.81 0.59—1.0832 Wood workers 9 0.98 23 0.96 [0.45] 0.00 25 0.94 46 0.93 103 0.94 0.78—1.1433 Painters 1 0.33 9 1.66 [0.19] 0.00 9 1.98 19 1.28 38 1.36 0.96—1.8634 "Other construction workers" 16 1.45 15 0.94 2 1.89 7 1.23 29 1.07 69 1.13 0.88—1.4335 Bricklayers 1 0.29 2 0.80 – – 1 0.38 4 0.63 8 0.54 0.23—1.0636 Printers 1 0.45 3 1.08 [0.18] 0.00 5 1.68 5 0.58 14 0.84 0.46—1.4037 Chemical process workers 2 1.05 3 0.71 [0.07] 0.00 5 0.84 8 0.67 18 0.74 0.44—1.1838 Food workers 6 0.95 1 0.33 [0.59] 0.00 5 0.73 11 0.90 23 0.79 0.50—1.1939 Beverage workers 1 1.30 [0.18] 0.00 [0.01] 0.00 [0.11] 0.00 [0.68] 0.00 1 0.57 0.01—3.1840 Tobacco workers [0.12] 0.00 [0.03] 0.00 [0.00] 0.00 [0.10] 0.00 [0.06] 0.00 [0.31] 0.00 0.00—11.7441 Glass makers etc 4 1.10 4 0.89 1 8.58 2 0.56 11 0.80 22 0.86 0.54—1.3142 Packers 2 0.63 10 1.14 1 2.89 8 0.77 29 1.20 50 1.07 0.79—1.4143 Engine operators 5 1.48 14 1.10 1 1.61 2 0.30 19 0.87 41 0.91 0.65—1.2344 Public safety workers 3 0.95 9 1.27 1 2.74 9 2.02 20 1.52 42 1.49 1.07—2.0145 Cooks and stewards [0.27] 0.00 [0.54] 0.00 [0.23] 0.00 2 0.91 [2.69] 0.00 2 0.34 0.04—1.2246 Domestic assistants [0.00] 0.00 [0.02] 0.00 [0.00] 0.00 [0.02] 0.00 [0.36] 0.00 [0.41] 0.00 0.00—8.9747 Waiters [0.55] 0.00 [0.54] 0.00 [0.03] 0.00 [0.91] 0.00 [1.39] 0.00 [3.41] 0.00 0.00—1.0848 Building caretakers 1 0.31 7 1.25 [0.11] 0.00 3 1.27 10 1.01 21 0.99 0.61—1.5149 Chimney sweeps [0.09] 0.00 1 2.36 – – [0.24] 0.00 [0.74] 0.00 1 0.67 0.02—3.7450 Hairdressers 4 4.28 [0.13] 0.00 [0.03] 0.00 2 3.02 1 0.42 7 1.70 0.68—3.5051 Launderers [0.44] 0.00 [0.13] 0.00 [0.01] 0.00 [0.39] 0.00 1 0.59 1 0.38 0.01—2.1052 Military personnel 2 1.18 4 1.53 – – 6 1.50 13 1.70 25 1.57 1.02—2.3253 "Other workers" 11 1.07 4 0.58 [1.43] 0.00 23 1.21 12 0.41 50 0.75 0.56—0.9954 Economically inactive 10 1.05 45 1.23 [1.16] 0.00 13 1.15 53 1.04 121 1.10 0.92—1.32
1-54 All categories 242 1.00 421 1.00 19 1.00 388 1.00 981 1.00 2051 1.00 # REF. #
Obs = observed number of cases; SIR = standardised incidence ratio; 95% CI = 95% confidence interval
112 Index Prev Next

Acta Oncologica - Pukkala et al, 2008 Bone cancer
Observed number of bone cancer among women in the Nordic countries and standardised incidence ratios 1961-2005, by country andoccupational category
Denmark Finland Iceland Norway Sweden Total
No Occupational category Obs SIR Obs SIR Obs SIR Obs SIR Obs SIR Obs SIR 95% CI
1 Technical workers, etc 1 1.64 2 0.97 [0.07] 0.00 [0.48] 0.00 7 1.78 10 1.40 0.67—2.572 Laboratory assistants [0.47] 0.00 1 0.92 [0.09] 0.00 [0.55] 0.00 [1.38] 0.00 1 0.28 0.01—1.553 Physicians 1 4.97 1 1.90 [0.01] 0.00 [0.23] 0.00 [0.97] 0.00 2 1.03 0.12—3.724 Dentists [0.18] 0.00 [0.46] 0.00 [0.01] 0.00 [0.19] 0.00 1 1.48 1 0.66 0.02—3.695 Nurses 5 1.42 7 1.27 [0.38] 0.00 7 1.59 14 1.21 33 1.30 0.89—1.826 Assistant nurses 4 1.52 6 1.13 [0.54] 0.00 2 0.47 15 0.71 27 0.79 0.52—1.167 "Other health workers" [2.00] 0.00 1 0.23 [0.12] 0.00 4 0.95 8 1.10 13 0.72 0.39—1.248 Teachers 5 1.09 7 0.73 2 2.81 6 0.72 40 1.49 60 1.20 0.91—1.549 Religious workers etc [0.60] 0.00 6 1.09 [0.10] 0.00 3 1.49 5 0.53 14 0.79 0.43—1.3310 Artistic workers [0.30] 0.00 [0.83] 0.00 [0.08] 0.00 [0.60] 0.00 2 1.16 2 0.57 0.07—2.0411 Journalists [0.07] 0.00 [0.52] 0.00 [0.02] 0.00 [0.17] 0.00 [0.82] 0.00 [1.59] 0.00 0.00—2.3112 Administrators 1 0.56 1 0.55 [0.05] 0.00 3 1.54 1 0.26 6 0.63 0.23—1.3713 Clerical workers 20 1.08 36 1.11 3 1.42 31 1.22 48 0.76 138 0.97 0.82—1.1514 Sales agents [0.16] 0.00 5 1.11 1 5.16 3 0.93 8 0.92 17 1.02 0.59—1.6315 Shop workers 7 0.58 18 1.12 1 0.81 16 0.81 29 0.82 71 0.84 0.66—1.0616 Farmers 7 0.83 8 0.83 1 1.28 19 1.55 3 0.84 38 1.10 0.78—1.5017 Gardeners [1.09] 0.00 18 0.66 [0.03] 0.00 7 0.96 8 0.87 33 0.74 0.51—1.0418 Fishermen [0.04] 0.00 [0.06] 0.00 1 28.44 [0.10] 0.00 [0.03] 0.00 1 3.60 0.09—20.0619 Forestry workers [0.01] 0.00 1 8.18 [0.00] 0.00 [0.14] 0.00 [0.21] 0.00 1 2.04 0.05—11.3720 Miners and quarry workers [0.00] 0.00 [0.05] 0.00 [0.00] 0.00 [0.01] 0.00 [0.05] 0.00 [0.11] 0.00 0.00—33.5521 Seamen – – [0.02] 0.00 [0.00] 0.00 [0.02] 0.00 [0.01] 0.00 [0.05] 0.00 0.00—73.3922 Transport workers [0.01] 0.00 1 1.32 [0.03] 0.00 [0.12] 0.00 [0.62] 0.00 1 0.65 0.02—3.6123 Drivers [0.31] 0.00 [0.40] 0.00 [0.02] 0.00 [0.42] 0.00 [1.64] 0.00 [2.78] 0.00 0.00—1.3324 Postal workers 3 4.80 5 1.04 1 2.68 7 1.45 9 0.86 25 1.18 0.77—1.7525 Textile workers 8 1.95 10 0.93 [0.59] 0.00 10 1.44 21 1.07 49 1.16 0.86—1.5426 Shoe and leather workers [0.31] 0.00 [1.32] 0.00 [0.03] 0.00 [0.50] 0.00 1 0.66 1 0.27 0.01—1.5227 Smelting workers [0.08] 0.00 [0.31] 0.00 [0.00] 0.00 [0.07] 0.00 1 2.10 1 1.08 0.03—6.0028 Mechanics [0.76] 0.00 [1.47] 0.00 [0.01] 0.00 1 1.54 7 1.48 8 1.05 0.45—2.0829 Plumbers [0.01] 0.00 [0.00] 0.00 – – [0.01] 0.00 [0.01] 0.00 [0.02] 0.00 0.00—155.5630 Welders – – [0.12] 0.00 [0.00] 0.00 [0.06] 0.00 [0.20] 0.00 [0.38] 0.00 0.00—9.6531 Electrical workers 3 2.81 [1.03] 0.00 [0.01] 0.00 [0.72] 0.00 3 1.14 6 1.10 0.40—2.3932 Wood workers [0.35] 0.00 [2.67] 0.00 [0.01] 0.00 [0.24] 0.00 [0.81] 0.00 [4.09] 0.00 0.00—0.9033 Painters [0.01] 0.00 [0.32] 0.00 [0.00] 0.00 [0.05] 0.00 [0.21] 0.00 [0.60] 0.00 0.00—6.1134 "Other construction workers" [0.01] 0.00 2 1.92 [0.00] 0.00 [0.02] 0.00 [0.03] 0.00 2 1.81 0.22—6.5335 Bricklayers [0.00] 0.00 [0.03] 0.00 – – [0.00] 0.00 [0.00] 0.00 [0.04] 0.00 0.00—98.2736 Printers [0.39] 0.00 1 0.71 [0.06] 0.00 1 1.57 1 0.52 3 0.68 0.14—1.9837 Chemical process workers [0.61] 0.00 [0.70] 0.00 [0.02] 0.00 [0.55] 0.00 [1.47] 0.00 [3.36] 0.00 0.00—1.1038 Food workers 5 1.68 5 1.41 1 0.68 4 1.18 4 0.94 19 1.22 0.73—1.9039 Beverage workers 1 3.56 [0.20] 0.00 [0.00] 0.00 [0.03] 0.00 [0.27] 0.00 1 1.28 0.03—7.1440 Tobacco workers 1 2.56 [0.11] 0.00 – – [0.12] 0.00 [0.17] 0.00 1 1.25 0.03—6.9941 Glass makers etc [0.74] 0.00 3 1.18 [0.04] 0.00 2 1.66 3 0.76 8 0.94 0.41—1.8642 Packers [0.21] 0.00 10 2.24 [0.12] 0.00 2 0.72 2 0.34 14 1.04 0.57—1.7543 Engine operators [0.01] 0.00 [0.74] 0.00 [0.00] 0.00 [0.05] 0.00 [0.44] 0.00 [1.24] 0.00 0.00—2.9744 Public safety workers [0.02] 0.00 [0.19] 0.00 [0.03] 0.00 [0.33] 0.00 [0.61] 0.00 [1.17] 0.00 0.00—3.1545 Cooks and stewards [0.01] 0.00 6 1.15 1 2.14 1 0.27 9 1.09 17 0.96 0.56—1.5446 Domestic assistants 3 0.66 8 1.35 1 8.17 6 0.60 24 0.97 42 0.93 0.67—1.2547 Waiters [0.81] 0.00 4 0.90 [0.06] 0.00 4 0.93 9 1.07 17 0.94 0.55—1.5148 Building caretakers 10 0.76 14 0.80 2 2.11 22 1.21 23 0.97 71 0.97 0.76—1.2249 Chimney sweeps [0.00] 0.00 [0.01] 0.00 – – [0.00] 0.00 [0.00] 0.00 [0.01] 0.00 0.00—295.1050 Hairdressers [0.83] 0.00 2 1.15 [0.08] 0.00 [1.15] 0.00 7 1.81 9 1.17 0.54—2.2351 Launderers 2 1.36 2 1.49 [0.13] 0.00 3 2.00 4 0.93 11 1.26 0.63—2.2552 Military personnel [0.01] 0.00 [0.02] 0.00 – – [0.01] 0.00 [0.02] 0.00 [0.06] 0.00 0.00—64.9453 "Other workers" 4 1.06 9 1.62 1 0.90 9 0.94 16 1.51 39 1.27 0.91—1.7454 Economically inactive 101 1.04 119 1.07 [3.67] 0.00 114 0.96 471 1.05 805 1.03 0.96—1.11
1-54 All categories 192 1.00 319 1.00 16 1.00 287 1.00 804 1.00 1618 1.00 # REF. #
Obs = observed number of cases; SIR = standardised incidence ratio; 95% CI = 95% confidence interval
113 Index Prev Next

Acta Oncologica - Pukkala et al, 2008 Chondrosarcoma
Observed number of chondrosarcoma among men in the Nordic countries and standardised incidence ratios 1961-2005, by country andoccupational category
Denmark Finland Iceland Norway Sweden Total
No Occupational category Obs SIR Obs SIR Obs SIR Obs SIR Obs SIR Obs SIR 95% CI
1 Technical workers, etc – – 11 0.76 1 2.07 [4.45] 0.00 40 0.96 52 0.85 0.64—1.122 Laboratory assistants – – [0.38] 0.00 [0.09] 0.00 1 5.03 [0.31] 0.00 1 1.03 0.03—5.733 Physicians – – [0.85] 0.00 [0.16] 0.00 [0.53] 0.00 3 1.46 3 0.84 0.17—2.444 Dentists – – [0.17] 0.00 [0.05] 0.00 [0.25] 0.00 [0.90] 0.00 [1.38] 0.00 0.00—2.685 Nurses – – [0.07] 0.00 [0.00] 0.00 [0.03] 0.00 [0.24] 0.00 [0.35] 0.00 0.00—10.656 Assistant nurses – – [0.07] 0.00 [0.03] 0.00 [0.08] 0.00 [0.84] 0.00 [1.02] 0.00 0.00—3.617 "Other health workers" – – 3 3.84 [0.04] 0.00 2 9.79 3 1.80 8 2.97 1.28—5.858 Teachers – – 7 1.26 [0.63] 0.00 5 1.51 11 0.98 23 1.11 0.71—1.679 Religious workers etc – – 3 0.85 [0.40] 0.00 1 0.66 12 1.26 16 1.07 0.61—1.7410 Artistic workers – – 1 0.88 [0.11] 0.00 1 2.30 1 0.39 3 0.70 0.15—2.0611 Journalists – – 2 3.66 [0.06] 0.00 [0.20] 0.00 2 1.62 4 1.96 0.53—5.0112 Administrators – – 5 0.60 3 3.49 5 0.96 11 0.78 24 0.84 0.54—1.2613 Clerical workers – – 6 1.15 3 3.11 5 1.27 20 1.25 34 1.30 0.90—1.8214 Sales agents – – 7 0.89 [0.51] 0.00 4 0.89 23 0.96 34 0.92 0.64—1.2915 Shop workers – – 4 1.11 [0.38] 0.00 3 1.60 9 1.18 16 1.19 0.68—1.9216 Farmers – – 21 0.71 [1.31] 0.00 10 0.87 31 1.00 62 0.85 0.65—1.0817 Gardeners – – 8 1.63 [0.04] 0.00 1 0.37 8 0.63 17 0.83 0.48—1.3318 Fishermen – – [0.41] 0.00 [1.19] 0.00 4 1.09 4 3.00 8 1.21 0.52—2.3919 Forestry workers – – 3 0.51 [0.01] 0.00 4 1.95 15 1.60 22 1.27 0.80—1.9220 Miners and quarry workers – – 1 1.01 [0.02] 0.00 1 1.61 3 1.19 5 1.20 0.39—2.8121 Seamen – – 3 2.25 [0.29] 0.00 7 2.09 4 1.72 14 1.92 1.05—3.2222 Transport workers – – 3 0.83 [0.45] 0.00 [1.61] 0.00 8 1.04 11 0.82 0.41—1.4723 Drivers – – 18 1.41 2 2.61 5 1.05 31 1.52 56 1.45 1.09—1.8824 Postal workers – – 2 1.04 [0.08] 0.00 [0.96] 0.00 1 0.23 3 0.41 0.08—1.1925 Textile workers – – [1.13] 0.00 1 8.05 [0.87] 0.00 5 1.22 6 0.97 0.35—2.1026 Shoe and leather workers – – [0.49] 0.00 [0.03] 0.00 [0.38] 0.00 2 1.34 2 0.84 0.10—3.0227 Smelting workers – – 1 0.54 [0.21] 0.00 2 1.52 6 0.86 9 0.87 0.40—1.6628 Mechanics – – 15 1.14 [0.81] 0.00 9 1.34 44 1.20 68 1.18 0.92—1.5029 Plumbers – – [2.23] 0.00 1 8.23 [0.81] 0.00 5 1.20 6 0.82 0.30—1.7830 Welders – – 3 1.25 [0.05] 0.00 2 2.13 4 0.77 9 1.05 0.48—2.0031 Electrical workers – – 5 0.85 1 1.91 3 0.98 7 0.53 16 0.70 0.40—1.1432 Wood workers – – 10 0.83 [0.41] 0.00 7 1.01 16 0.75 33 0.81 0.56—1.1433 Painters – – 4 1.46 [0.18] 0.00 [1.21] 0.00 10 1.55 14 1.32 0.72—2.2234 "Other construction workers" – – 7 0.87 2 2.17 1 0.64 14 1.20 24 1.08 0.69—1.6135 Bricklayers – – 1 0.79 – – [0.70] 0.00 [2.72] 0.00 1 0.21 0.01—1.1936 Printers – – 3 2.10 [0.16] 0.00 1 1.20 3 0.78 7 1.12 0.45—2.3037 Chemical process workers – – 2 0.93 [0.07] 0.00 [1.60] 0.00 6 1.16 8 0.89 0.38—1.7538 Food workers – – 1 0.66 [0.52] 0.00 2 1.09 4 0.75 7 0.76 0.31—1.5739 Beverage workers – – [0.09] 0.00 [0.01] 0.00 [0.03] 0.00 [0.29] 0.00 [0.42] 0.00 0.00—8.7340 Tobacco workers – – [0.02] 0.00 [0.00] 0.00 [0.03] 0.00 [0.03] 0.00 [0.07] 0.00 0.00—51.3241 Glass makers etc – – 3 1.31 1 9.81 1 1.03 4 0.67 9 0.96 0.44—1.8242 Packers – – 1 0.22 1 3.26 3 1.07 9 0.87 14 0.78 0.43—1.3143 Engine operators – – 7 1.07 1 1.83 1 0.54 7 0.72 16 0.86 0.49—1.3944 Public safety workers – – 4 1.10 [0.33] 0.00 3 2.59 9 1.50 16 1.44 0.82—2.3445 Cooks and stewards – – [0.29] 0.00 [0.20] 0.00 [0.59] 0.00 [1.25] 0.00 [2.32] 0.00 0.00—1.5946 Domestic assistants – – [0.01] 0.00 [0.00] 0.00 [0.00] 0.00 [0.18] 0.00 [0.20] 0.00 0.00—18.5347 Waiters – – [0.30] 0.00 [0.03] 0.00 [0.24] 0.00 [0.64] 0.00 [1.20] 0.00 0.00—3.0948 Building caretakers – – 5 1.75 [0.10] 0.00 [0.67] 0.00 4 0.92 9 1.13 0.52—2.1449 Chimney sweeps – – 1 4.63 – – [0.06] 0.00 [0.33] 0.00 1 1.63 0.04—9.1050 Hairdressers – – [0.06] 0.00 [0.03] 0.00 [0.17] 0.00 [1.02] 0.00 [1.29] 0.00 0.00—2.8651 Launderers – – [0.06] 0.00 [0.01] 0.00 [0.10] 0.00 1 1.36 1 1.10 0.03—6.1352 Military personnel – – 4 2.94 – – 4 3.76 9 2.59 17 2.88 1.68—4.6153 "Other workers" – – 2 0.57 [1.32] 0.00 5 1.00 3 0.24 10 0.45 0.22—0.8354 Economically inactive – – 27 1.50 [0.99] 0.00 2 0.56 21 0.94 50 1.11 0.83—1.47
1-54 All categories – – 214 1.00 17 1.00 105 1.00 433 1.00 769 1.00 # REF. #
Obs = observed number of cases; SIR = standardised incidence ratio; 95% CI = 95% confidence interval
114 Index Prev Next

Acta Oncologica - Pukkala et al, 2008 Chondrosarcoma
Observed number of chondrosarcoma among women in the Nordic countries and standardised incidence ratios 1961-2005, by countryand occupational category
Denmark Finland Iceland Norway Sweden Total
No Occupational category Obs SIR Obs SIR Obs SIR Obs SIR Obs SIR Obs SIR 95% CI
1 Technical workers, etc – – 1 1.00 [0.04] 0.00 [0.15] 0.00 7 3.70 8 2.60 1.12—5.122 Laboratory assistants – – [0.53] 0.00 [0.06] 0.00 [0.16] 0.00 [0.76] 0.00 [1.52] 0.00 0.00—2.433 Physicians – – 1 3.83 [0.01] 0.00 [0.07] 0.00 [0.49] 0.00 1 1.21 0.03—6.714 Dentists – – [0.22] 0.00 [0.00] 0.00 [0.05] 0.00 [0.32] 0.00 [0.59] 0.00 0.00—6.215 Nurses – – 4 1.48 [0.23] 0.00 1 0.75 6 1.10 11 1.13 0.56—2.026 Assistant nurses – – 1 0.38 [0.34] 0.00 1 0.78 7 0.69 9 0.63 0.29—1.197 "Other health workers" – – [2.13] 0.00 [0.07] 0.00 1 0.80 2 0.56 3 0.43 0.09—1.258 Teachers – – 3 0.64 1 2.30 1 0.40 23 1.84 28 1.39 0.92—2.019 Religious workers etc – – 4 1.50 [0.06] 0.00 [0.61] 0.00 1 0.21 5 0.62 0.20—1.4410 Artistic workers – – [0.40] 0.00 [0.06] 0.00 [0.18] 0.00 2 2.43 2 1.37 0.17—4.9711 Journalists – – [0.25] 0.00 [0.02] 0.00 [0.05] 0.00 [0.39] 0.00 [0.71] 0.00 0.00—5.2112 Administrators – – [0.86] 0.00 [0.03] 0.00 2 3.39 [1.89] 0.00 2 0.59 0.07—2.1413 Clerical workers – – 16 1.03 2 1.48 11 1.50 20 0.68 49 0.91 0.68—1.2114 Sales agents – – 3 1.43 [0.13] 0.00 1 1.06 4 1.03 8 1.13 0.49—2.2315 Shop workers – – 8 1.05 1 1.21 9 1.61 11 0.72 29 0.99 0.66—1.4216 Farmers – – 3 0.74 [0.50] 0.00 7 2.01 1 0.62 11 1.14 0.57—2.0417 Gardeners – – 8 0.66 [0.02] 0.00 3 1.49 1 0.26 12 0.67 0.34—1.1618 Fishermen – – [0.03] 0.00 1 42.94 [0.03] 0.00 [0.01] 0.00 1 10.34 0.26—57.6119 Forestry workers – – 1 17.29 [0.00] 0.00 [0.04] 0.00 [0.09] 0.00 1 5.16 0.13—28.7720 Miners and quarry workers – – [0.02] 0.00 [0.00] 0.00 [0.00] 0.00 [0.02] 0.00 [0.05] 0.00 0.00—78.4021 Seamen – – [0.01] 0.00 [0.00] 0.00 [0.01] 0.00 [0.00] 0.00 [0.02] 0.00 0.00—174.5522 Transport workers – – [0.35] 0.00 [0.02] 0.00 [0.03] 0.00 [0.30] 0.00 [0.70] 0.00 0.00—5.2723 Drivers – – [0.19] 0.00 [0.01] 0.00 [0.13] 0.00 [0.77] 0.00 [1.09] 0.00 0.00—3.3824 Postal workers – – 3 1.33 1 3.91 2 1.45 3 0.65 9 1.06 0.48—2.0125 Textile workers – – 7 1.42 [0.36] 0.00 [1.94] 0.00 9 1.09 16 1.03 0.59—1.6826 Shoe and leather workers – – [0.61] 0.00 [0.02] 0.00 [0.14] 0.00 1 1.57 1 0.71 0.02—3.9527 Smelting workers – – [0.14] 0.00 [0.00] 0.00 [0.02] 0.00 1 4.56 1 2.61 0.07—14.5228 Mechanics – – [0.68] 0.00 [0.01] 0.00 [0.18] 0.00 5 2.31 5 1.65 0.54—3.8529 Plumbers – – [0.00] 0.00 – – [0.00] 0.00 [0.00] 0.00 [0.01] 0.00 0.00—457.0730 Welders – – [0.06] 0.00 [0.00] 0.00 [0.02] 0.00 [0.10] 0.00 [0.18] 0.00 0.00—20.9431 Electrical workers – – [0.50] 0.00 [0.00] 0.00 [0.20] 0.00 3 2.44 3 1.55 0.32—4.5432 Wood workers – – [1.23] 0.00 [0.01] 0.00 [0.07] 0.00 [0.38] 0.00 [1.70] 0.00 0.00—2.1833 Painters – – [0.15] 0.00 [0.00] 0.00 [0.02] 0.00 [0.10] 0.00 [0.27] 0.00 0.00—13.7234 "Other construction workers" – – [0.47] 0.00 [0.00] 0.00 [0.01] 0.00 [0.02] 0.00 [0.49] 0.00 0.00—7.5235 Bricklayers – – [0.02] 0.00 – – [0.00] 0.00 [0.00] 0.00 [0.02] 0.00 0.00—214.5136 Printers – – [0.66] 0.00 [0.04] 0.00 [0.18] 0.00 [0.87] 0.00 [1.74] 0.00 0.00—2.1237 Chemical process workers – – [0.32] 0.00 [0.01] 0.00 [0.15] 0.00 [0.65] 0.00 [1.14] 0.00 0.00—3.2438 Food workers – – 3 1.83 [0.94] 0.00 [0.94] 0.00 1 0.55 4 0.75 0.20—1.9239 Beverage workers – – [0.09] 0.00 [0.00] 0.00 [0.01] 0.00 [0.11] 0.00 [0.21] 0.00 0.00—17.3940 Tobacco workers – – [0.05] 0.00 – – [0.03] 0.00 [0.07] 0.00 [0.16] 0.00 0.00—23.2341 Glass makers etc – – 2 1.68 [0.03] 0.00 [0.33] 0.00 2 1.15 4 1.22 0.33—3.1242 Packers – – 3 1.43 [0.08] 0.00 [0.78] 0.00 2 0.78 5 0.91 0.30—2.1243 Engine operators – – [0.35] 0.00 [0.00] 0.00 [0.01] 0.00 [0.21] 0.00 [0.57] 0.00 0.00—6.4444 Public safety workers – – [0.08] 0.00 [0.01] 0.00 [0.09] 0.00 [0.32] 0.00 [0.51] 0.00 0.00—7.2445 Cooks and stewards – – 2 0.83 1 3.56 [1.08] 0.00 5 1.42 8 1.10 0.48—2.1746 Domestic assistants – – 4 1.50 1 14.54 1 0.35 8 0.70 14 0.82 0.45—1.3847 Waiters – – 3 1.43 [0.04] 0.00 [1.20] 0.00 4 1.11 7 1.01 0.40—2.0748 Building caretakers – – 6 0.76 1 1.71 8 1.54 9 0.87 24 1.00 0.64—1.4949 Chimney sweeps – – [0.00] 0.00 – – [0.00] 0.00 [0.00] 0.00 [0.01] 0.00 0.00—689.9250 Hairdressers – – 1 1.25 [0.05] 0.00 [0.33] 0.00 3 1.69 4 1.35 0.37—3.4751 Launderers – – 2 3.31 [0.08] 0.00 1 2.36 2 1.11 5 1.72 0.56—4.0252 Military personnel – – [0.01] 0.00 – – [0.00] 0.00 [0.01] 0.00 [0.02] 0.00 0.00—154.8753 "Other workers" – – 5 1.94 1 1.42 2 0.73 9 1.90 17 1.58 0.92—2.5354 Economically inactive – – 50 1.06 [2.19] 0.00 32 0.92 196 1.05 278 1.03 0.91—1.16
1-54 All categories – – 144 1.00 10 1.00 83 1.00 348 1.00 585 1.00 # REF. #
Obs = observed number of cases; SIR = standardised incidence ratio; 95% CI = 95% confidence interval
115 Index Prev Next
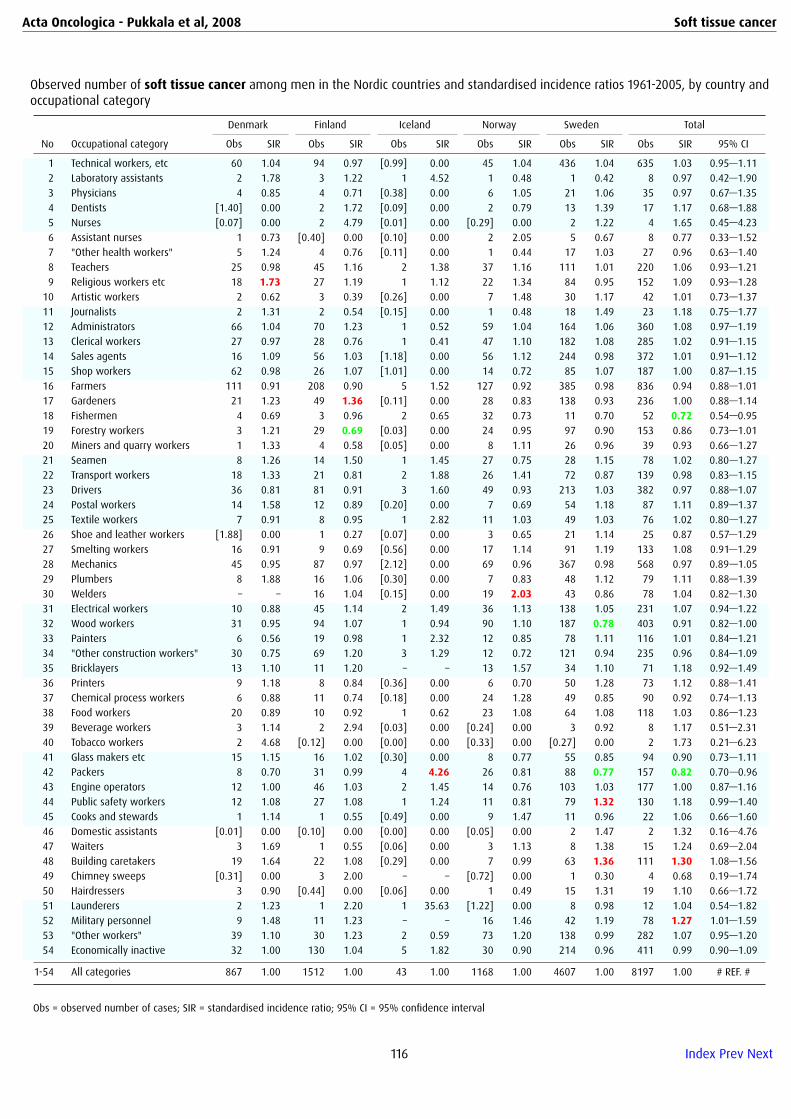
Acta Oncologica - Pukkala et al, 2008 Soft tissue cancer
Observed number of soft tissue cancer among men in the Nordic countries and standardised incidence ratios 1961-2005, by country andoccupational category
Denmark Finland Iceland Norway Sweden Total
No Occupational category Obs SIR Obs SIR Obs SIR Obs SIR Obs SIR Obs SIR 95% CI
1 Technical workers, etc 60 1.04 94 0.97 [0.99] 0.00 45 1.04 436 1.04 635 1.03 0.95—1.112 Laboratory assistants 2 1.78 3 1.22 1 4.52 1 0.48 1 0.42 8 0.97 0.42—1.903 Physicians 4 0.85 4 0.71 [0.38] 0.00 6 1.05 21 1.06 35 0.97 0.67—1.354 Dentists [1.40] 0.00 2 1.72 [0.09] 0.00 2 0.79 13 1.39 17 1.17 0.68—1.885 Nurses [0.07] 0.00 2 4.79 [0.01] 0.00 [0.29] 0.00 2 1.22 4 1.65 0.45—4.236 Assistant nurses 1 0.73 [0.40] 0.00 [0.10] 0.00 2 2.05 5 0.67 8 0.77 0.33—1.527 "Other health workers" 5 1.24 4 0.76 [0.11] 0.00 1 0.44 17 1.03 27 0.96 0.63—1.408 Teachers 25 0.98 45 1.16 2 1.38 37 1.16 111 1.01 220 1.06 0.93—1.219 Religious workers etc 18 1.73 27 1.19 1 1.12 22 1.34 84 0.95 152 1.09 0.93—1.2810 Artistic workers 2 0.62 3 0.39 [0.26] 0.00 7 1.48 30 1.17 42 1.01 0.73—1.3711 Journalists 2 1.31 2 0.54 [0.15] 0.00 1 0.48 18 1.49 23 1.18 0.75—1.7712 Administrators 66 1.04 70 1.23 1 0.52 59 1.04 164 1.06 360 1.08 0.97—1.1913 Clerical workers 27 0.97 28 0.76 1 0.41 47 1.10 182 1.08 285 1.02 0.91—1.1514 Sales agents 16 1.09 56 1.03 [1.18] 0.00 56 1.12 244 0.98 372 1.01 0.91—1.1215 Shop workers 62 0.98 26 1.07 [1.01] 0.00 14 0.72 85 1.07 187 1.00 0.87—1.1516 Farmers 111 0.91 208 0.90 5 1.52 127 0.92 385 0.98 836 0.94 0.88—1.0117 Gardeners 21 1.23 49 1.36 [0.11] 0.00 28 0.83 138 0.93 236 1.00 0.88—1.1418 Fishermen 4 0.69 3 0.96 2 0.65 32 0.73 11 0.70 52 0.72 0.54—0.9519 Forestry workers 3 1.21 29 0.69 [0.03] 0.00 24 0.95 97 0.90 153 0.86 0.73—1.0120 Miners and quarry workers 1 1.33 4 0.58 [0.05] 0.00 8 1.11 26 0.96 39 0.93 0.66—1.2721 Seamen 8 1.26 14 1.50 1 1.45 27 0.75 28 1.15 78 1.02 0.80—1.2722 Transport workers 18 1.33 21 0.81 2 1.88 26 1.41 72 0.87 139 0.98 0.83—1.1523 Drivers 36 0.81 81 0.91 3 1.60 49 0.93 213 1.03 382 0.97 0.88—1.0724 Postal workers 14 1.58 12 0.89 [0.20] 0.00 7 0.69 54 1.18 87 1.11 0.89—1.3725 Textile workers 7 0.91 8 0.95 1 2.82 11 1.03 49 1.03 76 1.02 0.80—1.2726 Shoe and leather workers [1.88] 0.00 1 0.27 [0.07] 0.00 3 0.65 21 1.14 25 0.87 0.57—1.2927 Smelting workers 16 0.91 9 0.69 [0.56] 0.00 17 1.14 91 1.19 133 1.08 0.91—1.2928 Mechanics 45 0.95 87 0.97 [2.12] 0.00 69 0.96 367 0.98 568 0.97 0.89—1.0529 Plumbers 8 1.88 16 1.06 [0.30] 0.00 7 0.83 48 1.12 79 1.11 0.88—1.3930 Welders – – 16 1.04 [0.15] 0.00 19 2.03 43 0.86 78 1.04 0.82—1.3031 Electrical workers 10 0.88 45 1.14 2 1.49 36 1.13 138 1.05 231 1.07 0.94—1.2232 Wood workers 31 0.95 94 1.07 1 0.94 90 1.10 187 0.78 403 0.91 0.82—1.0033 Painters 6 0.56 19 0.98 1 2.32 12 0.85 78 1.11 116 1.01 0.84—1.2134 "Other construction workers" 30 0.75 69 1.20 3 1.29 12 0.72 121 0.94 235 0.96 0.84—1.0935 Bricklayers 13 1.10 11 1.20 – – 13 1.57 34 1.10 71 1.18 0.92—1.4936 Printers 9 1.18 8 0.84 [0.36] 0.00 6 0.70 50 1.28 73 1.12 0.88—1.4137 Chemical process workers 6 0.88 11 0.74 [0.18] 0.00 24 1.28 49 0.85 90 0.92 0.74—1.1338 Food workers 20 0.89 10 0.92 1 0.62 23 1.08 64 1.08 118 1.03 0.86—1.2339 Beverage workers 3 1.14 2 2.94 [0.03] 0.00 [0.24] 0.00 3 0.92 8 1.17 0.51—2.3140 Tobacco workers 2 4.68 [0.12] 0.00 [0.00] 0.00 [0.33] 0.00 [0.27] 0.00 2 1.73 0.21—6.2341 Glass makers etc 15 1.15 16 1.02 [0.30] 0.00 8 0.77 55 0.85 94 0.90 0.73—1.1142 Packers 8 0.70 31 0.99 4 4.26 26 0.81 88 0.77 157 0.82 0.70—0.9643 Engine operators 12 1.00 46 1.03 2 1.45 14 0.76 103 1.03 177 1.00 0.87—1.1644 Public safety workers 12 1.08 27 1.08 1 1.24 11 0.81 79 1.32 130 1.18 0.99—1.4045 Cooks and stewards 1 1.14 1 0.55 [0.49] 0.00 9 1.47 11 0.96 22 1.06 0.66—1.6046 Domestic assistants [0.01] 0.00 [0.10] 0.00 [0.00] 0.00 [0.05] 0.00 2 1.47 2 1.32 0.16—4.7647 Waiters 3 1.69 1 0.55 [0.06] 0.00 3 1.13 8 1.38 15 1.24 0.69—2.0448 Building caretakers 19 1.64 22 1.08 [0.29] 0.00 7 0.99 63 1.36 111 1.30 1.08—1.5649 Chimney sweeps [0.31] 0.00 3 2.00 – – [0.72] 0.00 1 0.30 4 0.68 0.19—1.7450 Hairdressers 3 0.90 [0.44] 0.00 [0.06] 0.00 1 0.49 15 1.31 19 1.10 0.66—1.7251 Launderers 2 1.23 1 2.20 1 35.63 [1.22] 0.00 8 0.98 12 1.04 0.54—1.8252 Military personnel 9 1.48 11 1.23 – – 16 1.46 42 1.19 78 1.27 1.01—1.5953 "Other workers" 39 1.10 30 1.23 2 0.59 73 1.20 138 0.99 282 1.07 0.95—1.2054 Economically inactive 32 1.00 130 1.04 5 1.82 30 0.90 214 0.96 411 0.99 0.90—1.09
1-54 All categories 867 1.00 1512 1.00 43 1.00 1168 1.00 4607 1.00 8197 1.00 # REF. #
Obs = observed number of cases; SIR = standardised incidence ratio; 95% CI = 95% confidence interval
116 Index Prev Next

Acta Oncologica - Pukkala et al, 2008 Soft tissue cancer
Observed number of soft tissue cancer among women in the Nordic countries and standardised incidence ratios 1961-2005, by countryand occupational category
Denmark Finland Iceland Norway Sweden Total
No Occupational category Obs SIR Obs SIR Obs SIR Obs SIR Obs SIR Obs SIR 95% CI
1 Technical workers, etc 4 1.71 7 0.71 [0.11] 0.00 2 1.40 13 0.66 26 0.78 0.51—1.142 Laboratory assistants 1 0.57 7 1.31 1 6.20 1 0.58 8 1.28 18 1.18 0.70—1.863 Physicians 1 1.29 4 1.61 [0.02] 0.00 [0.74] 0.00 6 1.28 11 1.26 0.63—2.264 Dentists 2 2.92 3 1.27 [0.01] 0.00 1 1.62 3 0.88 9 1.27 0.58—2.425 Nurses 11 0.81 26 0.95 [0.69] 0.00 9 0.68 52 0.90 98 0.87 0.71—1.066 Assistant nurses 10 0.99 22 0.83 1 1.11 11 0.87 97 0.94 141 0.92 0.78—1.087 "Other health workers" 6 0.77 29 1.35 [0.21] 0.00 12 0.92 33 0.94 80 1.03 0.81—1.288 Teachers 15 0.85 57 1.19 2 1.57 23 0.89 129 1.00 226 1.02 0.89—1.169 Religious workers etc 4 1.71 24 0.92 [0.18] 0.00 6 0.95 52 1.13 86 1.06 0.85—1.3110 Artistic workers [1.17] 0.00 3 0.74 [0.14] 0.00 3 1.55 7 0.82 13 0.82 0.44—1.4111 Journalists 1 3.84 3 1.18 [0.04] 0.00 1 1.95 4 1.00 9 1.23 0.56—2.3312 Administrators 6 0.86 5 0.58 [0.10] 0.00 9 1.42 21 1.09 41 0.99 0.71—1.3513 Clerical workers 87 1.23 146 0.92 1 0.28 91 1.14 311 0.99 636 1.01 0.94—1.1014 Sales agents [0.63] 0.00 30 1.36 [0.37] 0.00 15 1.30 48 1.10 93 1.18 0.96—1.4515 Shop workers 42 0.90 70 0.87 1 0.45 61 0.95 168 0.91 342 0.91 0.81—1.0116 Farmers 27 0.81 60 1.30 [1.49] 0.00 33 0.74 16 0.92 136 0.95 0.81—1.1317 Gardeners 9 2.12 145 1.08 [0.05] 0.00 16 0.61 52 1.10 222 1.05 0.92—1.1918 Fishermen [0.17] 0.00 [0.31] 0.00 [0.06] 0.00 1 3.09 [0.16] 0.00 1 0.97 0.02—5.4219 Forestry workers [0.04] 0.00 [0.61] 0.00 [0.01] 0.00 1 2.18 1 0.94 2 0.92 0.11—3.3120 Miners and quarry workers [0.00] 0.00 [0.24] 0.00 [0.00] 0.00 [0.03] 0.00 [0.26] 0.00 [0.53] 0.00 0.00—6.9621 Seamen – – [0.09] 0.00 [0.00] 0.00 [0.08] 0.00 [0.04] 0.00 [0.20] 0.00 0.00—18.3122 Transport workers [0.05] 0.00 2 0.54 [0.06] 0.00 [0.38] 0.00 5 1.55 7 0.94 0.38—1.9423 Drivers [1.19] 0.00 3 1.54 [0.03] 0.00 [1.32] 0.00 7 0.90 10 0.81 0.39—1.5024 Postal workers 2 0.81 27 1.14 1 1.41 12 0.77 65 1.22 107 1.12 0.92—1.3525 Textile workers 12 0.77 57 1.08 2 1.74 27 1.07 120 1.14 218 1.09 0.96—1.2526 Shoe and leather workers [1.17] 0.00 5 0.77 1 15.67 2 1.11 11 1.36 19 1.08 0.65—1.6827 Smelting workers [0.28] 0.00 3 1.97 [0.00] 0.00 [0.19] 0.00 1 0.43 4 0.92 0.25—2.3628 Mechanics 1 0.35 6 0.84 [0.02] 0.00 4 1.86 25 1.06 36 1.01 0.71—1.4029 Plumbers [0.02] 0.00 [0.02] 0.00 – – [0.01] 0.00 [0.04] 0.00 [0.10] 0.00 0.00—37.8830 Welders – – 1 1.71 [0.00] 0.00 [0.16] 0.00 1 1.04 2 1.17 0.14—4.2431 Electrical workers 2 0.50 8 1.61 [0.01] 0.00 2 0.87 16 1.21 28 1.14 0.76—1.6532 Wood workers [1.32] 0.00 16 1.21 [0.02] 0.00 1 1.37 1 0.25 18 0.94 0.55—1.4833 Painters [0.05] 0.00 4 2.49 [0.01] 0.00 1 6.02 2 1.89 7 2.42 0.97—4.9934 "Other construction workers" [0.04] 0.00 4 0.78 [0.00] 0.00 [0.07] 0.00 [0.15] 0.00 4 0.74 0.20—1.9135 Bricklayers [0.01] 0.00 [0.18] 0.00 – – [0.00] 0.00 [0.00] 0.00 [0.20] 0.00 0.00—18.8336 Printers 1 0.68 6 0.87 [0.11] 0.00 [2.16] 0.00 10 1.03 17 0.83 0.49—1.3337 Chemical process workers 3 1.31 8 2.34 [0.04] 0.00 4 2.11 7 0.92 22 1.44 0.90—2.1838 Food workers 6 0.53 13 0.73 6 2.28 9 0.76 21 0.95 55 0.84 0.63—1.0939 Beverage workers 1 0.95 3 3.07 [0.01] 0.00 [0.10] 0.00 2 1.44 6 1.71 0.63—3.7140 Tobacco workers [1.46] 0.00 [0.55] 0.00 – – [0.45] 0.00 1 1.13 1 0.30 0.01—1.6641 Glass makers etc 2 0.71 11 0.87 [0.08] 0.00 2 0.50 28 1.38 43 1.08 0.78—1.4542 Packers [0.80] 0.00 22 0.99 [0.23] 0.00 7 0.74 32 1.06 61 0.97 0.74—1.2543 Engine operators [0.03] 0.00 6 1.64 [0.00] 0.00 [0.13] 0.00 1 0.48 7 1.19 0.48—2.4544 Public safety workers [0.08] 0.00 2 2.21 [0.05] 0.00 2 1.81 5 1.68 9 1.76 0.80—3.3445 Cooks and stewards [0.03] 0.00 33 1.30 [0.89] 0.00 10 0.73 38 0.88 81 0.97 0.77—1.2146 Domestic assistants 16 0.91 19 0.68 [0.24] 0.00 38 1.09 110 0.90 183 0.90 0.78—1.0447 Waiters 2 0.66 12 0.55 [0.11] 0.00 15 1.04 56 1.25 85 1.01 0.81—1.2548 Building caretakers 46 0.91 80 0.94 2 1.10 64 1.07 107 0.90 299 0.95 0.85—1.0649 Chimney sweeps [0.00] 0.00 [0.04] 0.00 – – [0.01] 0.00 [0.00] 0.00 [0.06] 0.00 0.00—62.8150 Hairdressers 2 0.64 11 1.31 [0.13] 0.00 2 0.51 25 1.26 40 1.13 0.81—1.5451 Launderers 4 0.71 3 0.45 1 3.92 3 0.56 23 1.00 34 0.83 0.58—1.1652 Military personnel [0.03] 0.00 [0.10] 0.00 – – [0.02] 0.00 [0.10] 0.00 [0.24] 0.00 0.00—15.2453 "Other workers" 16 1.11 17 0.63 2 1.02 28 0.90 54 1.01 117 0.91 0.76—1.0954 Economically inactive 397 1.06 550 1.00 8 1.19 485 1.06 2330 1.00 3770 1.01 0.98—1.05
1-54 All categories 739 1.00 1573 1.00 29 1.00 1014 1.00 4125 1.00 7480 1.00 # REF. #
Obs = observed number of cases; SIR = standardised incidence ratio; 95% CI = 95% confidence interval
117 Index Prev Next

Acta Oncologica - Pukkala et al, 2008 Fibrosarcoma
Observed number of fibrosarcoma among men in the Nordic countries and standardised incidence ratios 1961-2005, by country andoccupational category
Denmark Finland Iceland Norway Sweden Total
No Occupational category Obs SIR Obs SIR Obs SIR Obs SIR Obs SIR Obs SIR 95% CI
1 Technical workers, etc – – 31 0.97 – – 4 1.21 68 1.22 103 1.14 0.94—1.382 Laboratory assistants – – [0.79] 0.00 – – [0.18] 0.00 [0.23] 0.00 [1.21] 0.00 0.00—3.053 Physicians – – 1 0.54 – – [0.46] 0.00 3 1.19 4 0.83 0.23—2.124 Dentists – – [0.39] 0.00 – – [0.22] 0.00 2 1.59 2 1.07 0.13—3.885 Nurses – – [0.13] 0.00 – – [0.01] 0.00 1 6.99 1 3.52 0.09—19.616 Assistant nurses – – [0.12] 0.00 – – [0.09] 0.00 [0.97] 0.00 [1.18] 0.00 0.00—3.137 "Other health workers" – – 2 1.12 – – [0.20] 0.00 [2.25] 0.00 2 0.47 0.06—1.708 Teachers – – 13 1.00 – – 4 1.64 15 1.09 32 1.09 0.75—1.549 Religious workers etc – – 10 1.36 – – 2 1.47 10 0.89 22 1.10 0.69—1.6710 Artistic workers – – 1 0.39 – – [0.42] 0.00 4 1.16 5 0.78 0.25—1.8211 Journalists – – [1.23] 0.00 – – [0.18] 0.00 5 3.03 5 1.63 0.53—3.8112 Administrators – – 16 0.82 – – 2 0.40 23 0.99 41 0.86 0.62—1.1713 Clerical workers – – 8 0.62 – – 8 2.06 27 1.11 43 1.05 0.76—1.4114 Sales agents – – 16 0.86 – – 5 1.06 39 1.10 60 1.02 0.78—1.3115 Shop workers – – 9 1.12 – – 2 1.17 12 1.09 23 1.11 0.70—1.6616 Farmers – – 82 0.95 – – 11 0.80 71 1.04 164 0.98 0.84—1.1417 Gardeners – – 18 1.43 – – 1 0.29 23 0.95 42 1.04 0.75—1.4118 Fishermen – – [1.14] 0.00 – – 2 0.44 2 0.76 4 0.48 0.13—1.2319 Forestry workers – – 9 0.61 – – 4 1.53 14 0.79 27 0.77 0.51—1.1220 Miners and quarry workers – – [2.38] 0.00 – – 1 1.40 2 0.46 3 0.40 0.08—1.1721 Seamen – – 5 1.56 – – 2 0.58 6 1.61 13 1.26 0.67—2.1522 Transport workers – – 8 0.88 – – 2 1.12 7 0.61 17 0.76 0.44—1.2123 Drivers – – 21 0.69 – – 2 0.40 30 1.03 53 0.82 0.61—1.0724 Postal workers – – 3 0.64 – – 2 2.06 3 0.45 8 0.65 0.28—1.2925 Textile workers – – 2 0.66 – – 2 1.84 7 0.90 11 0.93 0.46—1.6626 Shoe and leather workers – – [1.30] 0.00 – – 1 1.98 4 1.23 5 0.99 0.32—2.3027 Smelting workers – – 3 0.65 – – [1.48] 0.00 8 0.65 11 0.60 0.30—1.0728 Mechanics – – 28 0.92 – – 5 0.75 54 1.03 87 0.97 0.78—1.2029 Plumbers – – 7 1.38 – – 1 1.30 10 1.64 18 1.51 0.89—2.3930 Welders – – 5 1.01 – – 1 1.25 6 0.91 12 0.97 0.50—1.7031 Electrical workers – – 16 1.23 – – 5 1.72 19 1.08 40 1.19 0.85—1.6232 Wood workers – – 41 1.31 – – 12 1.52 27 0.70 80 1.03 0.82—1.2833 Painters – – 7 1.04 – – 4 2.83 12 1.10 23 1.20 0.76—1.8134 "Other construction workers" – – 24 1.18 – – 1 0.63 25 1.19 50 1.16 0.86—1.5435 Bricklayers – – 4 1.22 – – 1 1.21 3 0.60 8 0.88 0.38—1.7336 Printers – – 3 0.95 – – [0.79] 0.00 7 1.26 10 1.05 0.50—1.9437 Chemical process workers – – 4 0.79 – – 1 0.52 7 0.74 12 0.73 0.38—1.2838 Food workers – – 3 0.80 – – 1 0.47 12 1.33 16 1.07 0.61—1.7439 Beverage workers – – [0.24] 0.00 – – [0.01] 0.00 1 1.81 1 1.24 0.03—6.9240 Tobacco workers – – [0.04] 0.00 – – [0.04] 0.00 [0.04] 0.00 [0.12] 0.00 0.00—31.3441 Glass makers etc – – 6 1.12 – – 1 1.03 12 1.20 19 1.17 0.70—1.8242 Packers – – 12 1.10 – – 2 0.61 14 0.74 28 0.85 0.56—1.2243 Engine operators – – 16 1.06 – – 1 0.61 13 0.89 30 0.96 0.65—1.3744 Public safety workers – – 9 1.05 – – [1.30] 0.00 6 0.74 15 0.83 0.47—1.3845 Cooks and stewards – – [0.60] 0.00 – – 3 5.39 3 1.98 6 2.25 0.82—4.8946 Domestic assistants – – [0.04] 0.00 – – [0.00] 0.00 [0.14] 0.00 [0.18] 0.00 0.00—21.0047 Waiters – – 1 1.75 – – 1 3.88 2 2.52 4 2.47 0.67—6.3248 Building caretakers – – 14 1.95 – – 1 1.53 11 1.49 26 1.71 1.12—2.5049 Chimney sweeps – – 1 1.91 – – [0.07] 0.00 [0.48] 0.00 1 0.93 0.02—5.1750 Hairdressers – – [0.15] 0.00 – – [0.21] 0.00 2 1.13 2 0.94 0.11—3.3851 Launderers – – 1 6.49 – – [0.12] 0.00 [1.26] 0.00 1 0.65 0.02—3.6152 Military personnel – – 4 1.39 – – 2 2.00 2 0.44 8 0.95 0.41—1.8753 "Other workers" – – 15 1.75 – – 8 1.27 23 1.01 46 1.22 0.89—1.6354 Economically inactive – – 47 1.05 – – 3 0.90 34 0.92 84 0.99 0.79—1.22
1-54 All categories – – 526 1.00 – – 111 1.00 691 1.00 1328 1.00 # REF. #
Obs = observed number of cases; SIR = standardised incidence ratio; 95% CI = 95% confidence interval
118 Index Prev Next

Acta Oncologica - Pukkala et al, 2008 Fibrosarcoma
Observed number of fibrosarcoma among women in the Nordic countries and standardised incidence ratios 1961-2005, by country andoccupational category
Denmark Finland Iceland Norway Sweden Total
No Occupational category Obs SIR Obs SIR Obs SIR Obs SIR Obs SIR Obs SIR 95% CI
1 Technical workers, etc – – [2.44] 0.00 [0.00] 0.00 [0.09] 0.00 4 1.81 4 0.84 0.23—2.162 Laboratory assistants – – 4 2.78 [0.01] 0.00 [0.11] 0.00 [0.47] 0.00 4 1.98 0.54—5.063 Physicians – – 2 3.33 [0.00] 0.00 [0.05] 0.00 [0.47] 0.00 2 1.78 0.22—6.444 Dentists – – [0.69] 0.00 [0.00] 0.00 [0.05] 0.00 2 4.94 2 1.76 0.21—6.365 Nurses – – 8 1.09 [0.03] 0.00 [0.75] 0.00 7 1.02 15 1.00 0.56—1.656 Assistant nurses – – 6 0.77 [0.05] 0.00 1 1.48 12 1.03 19 0.94 0.57—1.477 "Other health workers" – – 9 1.50 [0.01] 0.00 [0.82] 0.00 1 0.26 10 0.94 0.45—1.738 Teachers – – 17 1.25 [0.05] 0.00 2 1.15 11 0.71 30 0.97 0.65—1.389 Religious workers etc – – 2 0.33 [0.01] 0.00 [0.40] 0.00 3 0.64 5 0.45 0.15—1.0510 Artistic workers – – 1 0.94 [0.01] 0.00 [0.14] 0.00 1 1.03 2 0.92 0.11—3.3111 Journalists – – 2 2.85 [0.00] 0.00 [0.03] 0.00 [0.44] 0.00 2 1.70 0.21—6.1412 Administrators – – 1 0.44 [0.01] 0.00 [0.45] 0.00 1 0.45 2 0.40 0.05—1.4613 Clerical workers – – 42 0.97 [0.18] 0.00 10 1.94 39 1.02 91 1.05 0.84—1.2814 Sales agents – – 10 1.54 [0.02] 0.00 1 1.05 11 1.80 22 1.62 1.01—2.4515 Shop workers – – 22 0.90 [0.13] 0.00 3 0.73 28 1.07 53 0.97 0.73—1.2716 Farmers – – 19 1.28 [0.11] 0.00 4 1.27 2 0.78 25 1.21 0.78—1.7917 Gardeners – – 52 1.17 [0.00] 0.00 2 1.13 8 1.13 62 1.16 0.89—1.4918 Fishermen – – [0.09] 0.00 [0.00] 0.00 [0.02] 0.00 [0.02] 0.00 [0.14] 0.00 0.00—26.8719 Forestry workers – – [0.18] 0.00 [0.00] 0.00 [0.02] 0.00 [0.14] 0.00 [0.35] 0.00 0.00—10.6020 Miners and quarry workers – – [0.08] 0.00 [0.00] 0.00 [0.00] 0.00 [0.03] 0.00 [0.11] 0.00 0.00—32.9521 Seamen – – [0.02] 0.00 – – [0.00] 0.00 [0.00] 0.00 [0.03] 0.00 0.00—124.8922 Transport workers – – [1.22] 0.00 [0.00] 0.00 [0.02] 0.00 2 5.12 2 1.22 0.15—4.4023 Drivers – – [0.53] 0.00 [0.00] 0.00 [0.08] 0.00 [0.91] 0.00 [1.53] 0.00 0.00—2.4224 Postal workers – – 9 1.24 [0.05] 0.00 [1.09] 0.00 8 1.11 17 1.09 0.63—1.7425 Textile workers – – 18 1.10 [0.10] 0.00 5 2.47 19 1.16 42 1.20 0.87—1.6326 Shoe and leather workers – – 3 1.47 [0.00] 0.00 [0.14] 0.00 [1.24] 0.00 3 0.87 0.18—2.5627 Smelting workers – – [0.48] 0.00 [0.00] 0.00 [0.01] 0.00 [0.28] 0.00 [0.77] 0.00 0.00—4.7628 Mechanics – – 2 0.96 [0.00] 0.00 [0.15] 0.00 4 1.33 6 1.14 0.42—2.4929 Plumbers – – [0.00] 0.00 – – [0.00] 0.00 [0.00] 0.00 [0.01] 0.00 0.00—451.8330 Welders – – 1 6.30 – – [0.01] 0.00 [0.10] 0.00 1 3.80 0.10—21.1731 Electrical workers – – 2 1.52 [0.00] 0.00 [0.15] 0.00 3 1.83 5 1.61 0.52—3.7632 Wood workers – – 4 0.94 [0.00] 0.00 [0.04] 0.00 [0.47] 0.00 4 0.84 0.23—2.1533 Painters – – 1 2.01 [0.00] 0.00 [0.01] 0.00 [0.13] 0.00 1 1.56 0.04—8.7034 "Other construction workers" – – 1 0.58 [0.00] 0.00 [0.00] 0.00 [0.01] 0.00 1 0.58 0.01—3.2235 Bricklayers – – [0.06] 0.00 – – [0.00] 0.00 [0.00] 0.00 [0.06] 0.00 0.00—64.2636 Printers – – [2.07] 0.00 [0.01] 0.00 [0.17] 0.00 1 0.75 1 0.28 0.01—1.5637 Chemical process workers – – 1 0.93 [0.00] 0.00 [0.14] 0.00 [1.07] 0.00 1 0.44 0.01—2.4438 Food workers – – 3 0.53 1 5.35 [0.88] 0.00 3 0.89 7 0.69 0.28—1.4339 Beverage workers – – [0.32] 0.00 [0.00] 0.00 [0.01] 0.00 [0.22] 0.00 [0.55] 0.00 0.00—6.7640 Tobacco workers – – [0.18] 0.00 – – [0.04] 0.00 [0.12] 0.00 [0.35] 0.00 0.00—10.6341 Glass makers etc – – 4 1.03 [0.00] 0.00 [0.28] 0.00 2 0.71 6 0.86 0.31—1.8742 Packers – – 5 0.72 [0.02] 0.00 1 1.54 6 1.41 12 1.01 0.52—1.7643 Engine operators – – 3 2.71 [0.00] 0.00 [0.01] 0.00 [0.22] 0.00 3 2.25 0.46—6.5944 Public safety workers – – [0.25] 0.00 [0.00] 0.00 [0.06] 0.00 [0.28] 0.00 [0.59] 0.00 0.00—6.2245 Cooks and stewards – – 7 0.91 [0.08] 0.00 [1.09] 0.00 5 0.74 12 0.77 0.40—1.3446 Domestic assistants – – 7 0.90 [0.03] 0.00 5 1.86 18 1.10 30 1.12 0.75—1.5947 Waiters – – 3 0.46 [0.01] 0.00 1 1.00 10 1.51 14 0.99 0.54—1.6648 Building caretakers – – 19 0.72 [0.15] 0.00 3 0.78 13 0.76 35 0.74 0.51—1.0249 Chimney sweeps – – [0.01] 0.00 – – [0.00] 0.00 [0.00] 0.00 [0.01] 0.00 0.00—256.4750 Hairdressers – – 5 2.05 [0.00] 0.00 [0.29] 0.00 4 1.60 9 1.72 0.79—3.2651 Launderers – – 2 0.93 [0.03] 0.00 [0.42] 0.00 2 0.55 4 0.64 0.17—1.6452 Military personnel – – [0.02] 0.00 – – [0.00] 0.00 [0.01] 0.00 [0.03] 0.00 0.00—129.5053 "Other workers" – – 4 0.49 [0.15] 0.00 1 0.49 9 1.21 14 0.79 0.43—1.3254 Economically inactive – – 182 1.02 1 1.91 43 0.97 368 0.99 594 1.00 0.92—1.08
1-54 All categories – – 483 1.00 2 1.00 82 1.00 607 1.00 1174 1.00 # REF. #
Obs = observed number of cases; SIR = standardised incidence ratio; 95% CI = 95% confidence interval
119 Index Prev Next

Acta Oncologica - Pukkala et al, 2008 Liposarcoma
Observed number of liposarcoma among men in the Nordic countries and standardised incidence ratios 1961-2005, by country andoccupational category
Denmark Finland Iceland Norway Sweden Total
No Occupational category Obs SIR Obs SIR Obs SIR Obs SIR Obs SIR Obs SIR 95% CI
1 Technical workers, etc – – 17 0.76 [0.38] 0.00 14 1.70 72 1.00 103 1.00 0.82—1.212 Laboratory assistants – – [0.59] 0.00 [0.07] 0.00 1 2.67 [0.43] 0.00 1 0.68 0.02—3.803 Physicians – – [1.31] 0.00 [0.12] 0.00 2 2.05 6 1.77 8 1.38 0.60—2.724 Dentists – – 1 3.79 [0.04] 0.00 2 4.57 2 1.25 5 2.14 0.69—4.995 Nurses – – [0.11] 0.00 [0.00] 0.00 [0.06] 0.00 1 3.33 1 2.15 0.05—11.996 Assistant nurses – – [0.11] 0.00 [0.03] 0.00 [0.15] 0.00 [1.32] 0.00 [1.60] 0.00 0.00—2.307 "Other health workers" – – [1.19] 0.00 [0.04] 0.00 [0.37] 0.00 5 1.78 5 1.13 0.37—2.658 Teachers – – 14 1.57 [0.49] 0.00 9 1.54 22 1.17 45 1.32 0.96—1.779 Religious workers etc – – 11 2.05 [0.31] 0.00 3 1.09 19 1.24 33 1.39 0.96—1.9510 Artistic workers – – 1 0.57 [0.08] 0.00 1 1.23 10 2.25 12 1.69 0.87—2.9511 Journalists – – 2 2.41 [0.05] 0.00 [0.36] 0.00 2 0.95 4 1.20 0.33—3.0712 Administrators – – 18 1.41 [0.62] 0.00 7 0.74 27 1.03 52 1.06 0.79—1.3913 Clerical workers – – 7 0.87 1 1.31 8 1.08 35 1.21 51 1.13 0.84—1.4814 Sales agents – – 16 1.32 [0.38] 0.00 8 0.98 43 1.01 67 1.06 0.82—1.3415 Shop workers – – 4 0.71 [0.32] 0.00 3 0.86 17 1.24 24 1.04 0.66—1.5416 Farmers – – 36 0.79 2 2.00 18 0.91 60 0.91 116 0.88 0.73—1.0517 Gardeners – – 12 1.55 [0.03] 0.00 2 0.38 32 1.26 46 1.20 0.88—1.6018 Fishermen – – 2 3.16 [1.11] 0.00 4 0.59 2 0.75 8 0.72 0.31—1.4119 Forestry workers – – 6 0.65 [0.01] 0.00 6 1.61 12 0.65 24 0.76 0.49—1.1320 Miners and quarry workers – – [1.51] 0.00 [0.02] 0.00 [1.17] 0.00 4 0.84 4 0.54 0.15—1.3721 Seamen – – 3 1.45 [0.23] 0.00 6 0.95 5 1.18 14 1.09 0.60—1.8322 Transport workers – – 6 1.07 1 2.96 6 1.94 9 0.63 22 0.95 0.59—1.4323 Drivers – – 25 1.24 1 1.58 8 0.89 40 1.12 74 1.13 0.89—1.4224 Postal workers – – 5 1.67 [0.06] 0.00 1 0.61 12 1.52 18 1.43 0.85—2.2725 Textile workers – – 1 0.56 1 10.08 3 1.81 8 0.99 13 1.11 0.59—1.9126 Shoe and leather workers – – [0.76] 0.00 [0.02] 0.00 1 1.50 4 1.27 5 1.09 0.35—2.5427 Smelting workers – – 3 1.06 [0.17] 0.00 [2.40] 0.00 16 1.21 19 1.02 0.61—1.5928 Mechanics – – 18 0.88 [0.74] 0.00 16 1.28 43 0.66 77 0.78 0.62—0.9829 Plumbers – – 2 0.58 [0.10] 0.00 2 1.33 10 1.34 14 1.12 0.61—1.8830 Welders – – 6 1.62 [0.05] 0.00 3 1.68 5 0.57 14 0.98 0.54—1.6531 Electrical workers – – 10 1.10 1 2.12 8 1.44 24 1.05 43 1.13 0.82—1.5332 Wood workers – – 17 0.91 [0.34] 0.00 11 0.84 33 0.81 61 0.84 0.64—1.0833 Painters – – 2 0.47 [0.14] 0.00 2 0.91 13 1.08 17 0.91 0.53—1.4634 "Other construction workers" – – 8 0.66 2 2.52 [2.79] 0.00 22 0.98 32 0.84 0.57—1.1835 Bricklayers – – 1 0.51 – – 1 0.76 8 1.51 10 1.17 0.56—2.1536 Printers – – 1 0.45 [0.12] 0.00 [1.46] 0.00 7 1.03 8 0.76 0.33—1.4937 Chemical process workers – – 1 0.30 [0.05] 0.00 4 1.39 7 0.70 12 0.74 0.38—1.2938 Food workers – – 3 1.25 [0.47] 0.00 4 1.19 6 0.59 13 0.79 0.42—1.3639 Beverage workers – – 1 6.91 [0.01] 0.00 [0.06] 0.00 1 1.74 2 2.56 0.31—9.2540 Tobacco workers – – [0.03] 0.00 [0.00] 0.00 [0.05] 0.00 [0.05] 0.00 [0.13] 0.00 0.00—29.3641 Glass makers etc – – 4 1.13 [0.09] 0.00 2 1.13 7 0.63 13 0.79 0.42—1.3442 Packers – – 7 1.03 1 3.63 6 1.19 14 0.70 28 0.87 0.58—1.2643 Engine operators – – 15 1.47 [0.47] 0.00 1 0.30 14 0.80 30 0.96 0.64—1.3644 Public safety workers – – 8 1.44 1 3.72 4 1.84 17 1.64 30 1.64 1.10—2.3445 Cooks and stewards – – 1 2.30 [0.17] 0.00 3 2.76 2 0.99 6 1.62 0.59—3.5346 Domestic assistants – – [0.02] 0.00 [0.00] 0.00 [0.01] 0.00 [0.24] 0.00 [0.27] 0.00 0.00—13.5847 Waiters – – [0.44] 0.00 [0.02] 0.00 [0.44] 0.00 2 1.93 2 1.03 0.12—3.7248 Building caretakers – – 1 0.23 [0.07] 0.00 [1.14] 0.00 16 1.99 17 1.25 0.73—2.0049 Chimney sweeps – – 2 6.19 – – [0.12] 0.00 [0.59] 0.00 2 1.94 0.24—7.0350 Hairdressers – – [0.10] 0.00 [0.02] 0.00 [0.32] 0.00 1 0.52 1 0.42 0.01—2.3451 Launderers – – [0.10] 0.00 [0.01] 0.00 [0.19] 0.00 2 1.43 2 1.18 0.14—4.2652 Military personnel – – 3 1.42 – – 2 0.97 11 1.82 16 1.57 0.90—2.5553 "Other workers" – – 4 0.76 [1.06] 0.00 6 0.67 23 0.96 33 0.84 0.58—1.1854 Economically inactive – – 23 0.93 3 3.60 2 0.42 41 1.03 69 0.98 0.76—1.24
1-54 All categories – – 328 1.00 14 1.00 190 1.00 794 1.00 1326 1.00 # REF. #
Obs = observed number of cases; SIR = standardised incidence ratio; 95% CI = 95% confidence interval
120 Index Prev Next

Acta Oncologica - Pukkala et al, 2008 Liposarcoma
Observed number of liposarcoma among women in the Nordic countries and standardised incidence ratios 1961-2005, by country andoccupational category
Denmark Finland Iceland Norway Sweden Total
No Occupational category Obs SIR Obs SIR Obs SIR Obs SIR Obs SIR Obs SIR 95% CI
1 Technical workers, etc – – 2 0.84 [0.03] 0.00 [0.21] 0.00 1 0.34 3 0.54 0.11—1.582 Laboratory assistants – – [1.23] 0.00 1 23.85 [0.24] 0.00 3 2.97 4 1.58 0.43—4.063 Physicians – – 2 3.31 [0.01] 0.00 [0.10] 0.00 2 2.78 4 2.80 0.76—7.164 Dentists – – 2 3.92 [0.00] 0.00 [0.09] 0.00 [0.51] 0.00 2 1.81 0.22—6.545 Nurses – – 6 0.95 [0.17] 0.00 3 1.58 7 0.81 16 0.94 0.54—1.536 Assistant nurses – – 3 0.51 1 4.79 2 1.13 13 0.83 19 0.81 0.49—1.267 "Other health workers" – – 5 1.02 [0.05] 0.00 [1.79] 0.00 4 0.74 9 0.74 0.34—1.418 Teachers – – 8 0.75 [0.34] 0.00 3 0.82 17 0.86 28 0.81 0.54—1.179 Religious workers etc – – 5 0.78 [0.05] 0.00 2 2.31 12 1.70 19 1.32 0.80—2.0610 Artistic workers – – [0.94] 0.00 [0.03] 0.00 [0.26] 0.00 3 2.34 3 1.19 0.25—3.4811 Journalists – – 1 1.73 [0.01] 0.00 [0.07] 0.00 [0.60] 0.00 1 0.79 0.02—4.4212 Administrators – – 1 0.50 [0.02] 0.00 2 2.40 5 1.70 8 1.38 0.60—2.7213 Clerical workers – – 38 1.06 [0.84] 0.00 8 0.72 36 0.77 82 0.87 0.69—1.0714 Sales agents – – 9 1.90 [0.09] 0.00 [1.44] 0.00 6 0.90 15 1.16 0.65—1.9215 Shop workers – – 12 0.70 [0.50] 0.00 8 0.94 28 1.04 48 0.90 0.67—1.2016 Farmers – – 8 0.89 [0.35] 0.00 4 0.71 3 1.10 15 0.85 0.48—1.4017 Gardeners – – 26 0.99 [0.01] 0.00 4 1.19 6 0.86 36 0.98 0.69—1.3618 Fishermen – – [0.06] 0.00 [0.02] 0.00 [0.04] 0.00 [0.02] 0.00 [0.15] 0.00 0.00—25.2219 Forestry workers – – [0.13] 0.00 [0.00] 0.00 [0.06] 0.00 [0.16] 0.00 [0.35] 0.00 0.00—10.5420 Miners and quarry workers – – [0.05] 0.00 [0.00] 0.00 [0.00] 0.00 [0.04] 0.00 [0.09] 0.00 0.00—40.6821 Seamen – – [0.02] 0.00 – – [0.01] 0.00 [0.01] 0.00 [0.04] 0.00 0.00—99.3422 Transport workers – – 2 2.69 [0.01] 0.00 [0.05] 0.00 1 2.12 3 2.34 0.48—6.8523 Drivers – – 2 4.53 [0.01] 0.00 [0.18] 0.00 1 0.84 3 1.64 0.34—4.8124 Postal workers – – 7 1.40 [0.15] 0.00 2 0.94 8 1.01 17 1.12 0.65—1.7925 Textile workers – – 8 0.73 [0.28] 0.00 1 0.32 18 1.18 27 0.91 0.60—1.3226 Shoe and leather workers – – 1 0.74 [0.02] 0.00 [0.23] 0.00 3 2.57 4 1.44 0.39—3.7027 Smelting workers – – 2 6.35 [0.00] 0.00 [0.03] 0.00 [0.35] 0.00 2 2.90 0.35—10.4628 Mechanics – – [1.55] 0.00 [0.00] 0.00 1 3.52 4 1.14 5 0.94 0.30—2.1829 Plumbers – – [0.00] 0.00 – – [0.00] 0.00 [0.01] 0.00 [0.01] 0.00 0.00—290.8930 Welders – – [0.13] 0.00 [0.00] 0.00 [0.02] 0.00 [0.15] 0.00 [0.30] 0.00 0.00—12.1531 Electrical workers – – 2 1.74 [0.00] 0.00 [0.32] 0.00 3 1.52 5 1.45 0.47—3.4032 Wood workers – – 1 0.37 [0.00] 0.00 [0.10] 0.00 [0.60] 0.00 1 0.30 0.01—1.6533 Painters – – [0.34] 0.00 [0.00] 0.00 [0.02] 0.00 [0.16] 0.00 [0.52] 0.00 0.00—7.0734 "Other construction workers" – – [0.99] 0.00 [0.00] 0.00 [0.01] 0.00 [0.02] 0.00 [1.02] 0.00 0.00—3.6035 Bricklayers – – [0.04] 0.00 – – [0.00] 0.00 [0.00] 0.00 [0.04] 0.00 0.00—96.3836 Printers – – 1 0.68 [0.03] 0.00 [0.28] 0.00 2 1.37 3 0.92 0.19—2.7037 Chemical process workers – – 3 4.25 [0.01] 0.00 [0.24] 0.00 1 0.89 4 1.92 0.52—4.9138 Food workers – – 5 1.38 [0.61] 0.00 2 1.33 4 1.21 11 1.22 0.61—2.1839 Beverage workers – – 1 5.08 [0.00] 0.00 [0.01] 0.00 1 4.79 2 4.75 0.58—17.1840 Tobacco workers – – [0.11] 0.00 – – [0.06] 0.00 [0.13] 0.00 [0.29] 0.00 0.00—12.5341 Glass makers etc – – 4 1.50 [0.02] 0.00 1 1.86 4 1.34 9 1.45 0.66—2.7542 Packers – – 4 0.86 [0.05] 0.00 [1.23] 0.00 6 1.35 10 0.96 0.46—1.7743 Engine operators – – 1 1.28 [0.00] 0.00 [0.02] 0.00 [0.31] 0.00 1 0.90 0.02—4.9944 Public safety workers – – [0.20] 0.00 [0.01] 0.00 [0.14] 0.00 2 4.29 2 2.44 0.30—8.8345 Cooks and stewards – – 6 1.12 [0.22] 0.00 [1.66] 0.00 4 0.61 10 0.73 0.35—1.3446 Domestic assistants – – 6 0.96 [0.06] 0.00 3 0.69 17 0.90 26 0.88 0.58—1.2947 Waiters – – 2 0.42 [0.02] 0.00 3 1.60 9 1.38 14 1.07 0.58—1.7948 Building caretakers – – 21 1.20 [0.45] 0.00 8 1.03 17 0.94 46 1.05 0.77—1.4049 Chimney sweeps – – [0.01] 0.00 – – [0.00] 0.00 [0.00] 0.00 [0.01] 0.00 0.00—341.6250 Hairdressers – – 5 2.72 [0.03] 0.00 [0.51] 0.00 4 1.38 9 1.70 0.78—3.2351 Launderers – – [1.31] 0.00 1 16.13 1 1.50 3 0.88 5 0.92 0.30—2.1552 Military personnel – – [0.03] 0.00 – – [0.00] 0.00 [0.02] 0.00 [0.04] 0.00 0.00—86.1753 "Other workers" – – 7 1.22 [0.44] 0.00 4 0.99 3 0.37 14 0.76 0.42—1.2854 Economically inactive – – 108 1.00 4 2.31 67 1.21 352 1.02 531 1.04 0.96—1.13
1-54 All categories – – 327 1.00 7 1.00 129 1.00 613 1.00 1076 1.00 # REF. #
Obs = observed number of cases; SIR = standardised incidence ratio; 95% CI = 95% confidence interval
121 Index Prev Next

Acta Oncologica - Pukkala et al, 2008 Other/unknown site
Observed number of other/unknown site among men in the Nordic countries and standardised incidence ratios 1961-2005, by countryand occupational category
Denmark Finland Iceland Norway Sweden Total
No Occupational category Obs SIR Obs SIR Obs SIR Obs SIR Obs SIR Obs SIR 95% CI
1 Technical workers, etc 166 0.79 203 0.74 3 0.92 215 0.64 1770 0.97 2357 0.89 0.86—0.932 Laboratory assistants 4 0.96 8 1.21 1 1.62 11 0.64 8 0.90 32 0.85 0.58—1.203 Physicians 14 0.81 5 0.31 [1.35] 0.00 39 0.78 56 0.68 114 0.68 0.57—0.824 Dentists [4.98] 0.00 1 0.29 [0.31] 0.00 15 0.67 40 0.98 56 0.78 0.59—1.015 Nurses [0.23] 0.00 1 1.31 [0.01] 0.00 [1.40] 0.00 5 1.18 6 0.90 0.33—1.966 Assistant nurses 5 1.00 [0.62] 0.00 [0.15] 0.00 12 1.34 35 1.25 52 1.22 0.91—1.607 "Other health workers" 14 0.93 12 0.76 1 2.66 10 0.52 79 1.15 116 0.97 0.81—1.178 Teachers 75 0.82 87 0.74 6 1.24 171 0.66 387 0.82 726 0.77 0.72—0.839 Religious workers etc 26 0.67 44 0.71 2 0.62 109 0.77 318 0.89 499 0.83 0.76—0.9110 Artistic workers 8 0.67 16 0.71 [0.88] 0.00 34 0.83 99 0.90 157 0.84 0.72—0.9911 Journalists 7 1.25 8 0.73 [0.49] 0.00 12 0.68 75 1.48 102 1.20 0.98—1.4512 Administrators 243 1.03 156 0.85 7 0.84 435 0.85 673 0.97 1514 0.93 0.88—0.9713 Clerical workers 96 0.94 98 0.80 8 0.84 320 0.86 707 0.95 1229 0.91 0.86—0.9614 Sales agents 59 1.09 162 0.96 5 1.04 426 0.94 1197 1.11 1849 1.05 1.00—1.1015 Shop workers 224 0.95 68 0.98 2 0.60 156 0.98 374 1.07 824 1.01 0.94—1.0816 Farmers 316 0.69 882 0.96 9 0.64 1168 0.81 1414 0.77 3789 0.81 0.79—0.8417 Gardeners 56 0.86 111 0.91 [0.43] 0.00 275 0.83 611 0.90 1053 0.88 0.83—0.9318 Fishermen 27 1.25 8 0.68 6 0.78 502 1.19 79 1.09 622 1.16 1.07—1.2519 Forestry workers 9 0.94 165 1.19 [0.07] 0.00 231 0.90 401 0.81 806 0.90 0.84—0.9620 Miners and quarry workers 7 2.42 25 1.14 [0.13] 0.00 75 1.16 116 0.96 223 1.06 0.93—1.2121 Seamen 22 0.95 36 1.21 3 1.37 389 1.28 137 1.28 587 1.26 1.16—1.3622 Transport workers 64 1.24 79 0.88 5 1.12 157 0.94 364 0.98 669 0.97 0.90—1.0523 Drivers 177 1.07 282 1.03 11 1.76 526 1.19 992 1.11 1988 1.12 1.07—1.1724 Postal workers 32 0.98 40 0.93 3 3.54 92 1.01 186 0.95 353 0.97 0.87—1.0825 Textile workers 35 1.20 34 1.14 3 2.06 91 0.87 225 1.03 388 1.01 0.92—1.1226 Shoe and leather workers 8 1.11 12 0.92 [0.32] 0.00 57 1.24 77 0.90 154 1.01 0.87—1.1927 Smelting workers 68 1.04 54 1.22 3 1.52 179 1.33 365 1.06 669 1.13 1.05—1.2228 Mechanics 188 1.07 279 1.03 8 1.33 717 1.18 1729 1.06 2921 1.09 1.05—1.1329 Plumbers 14 0.89 53 1.19 2 2.01 80 1.18 207 1.11 356 1.13 1.01—1.2530 Welders – – 51 1.26 1 2.85 94 1.31 230 1.07 376 1.15 1.04—1.2731 Electrical workers 46 1.11 113 1.01 5 1.39 261 0.98 555 0.99 980 0.99 0.93—1.0632 Wood workers 137 1.13 259 0.84 4 1.12 716 0.92 947 0.88 2063 0.90 0.86—0.9433 Painters 52 1.30 78 1.24 1 0.68 161 1.24 326 1.04 618 1.13 1.05—1.2234 "Other construction workers" 164 1.07 238 1.22 5 0.71 167 1.15 618 1.07 1192 1.10 1.04—1.1735 Bricklayers 51 1.16 35 1.09 – – 90 1.17 163 1.16 339 1.16 1.04—1.2936 Printers 32 1.15 27 1.00 [1.16] 0.00 62 0.85 176 1.04 297 0.99 0.89—1.1137 Chemical process workers 33 1.27 42 0.91 [0.65] 0.00 212 1.20 316 1.23 603 1.19 1.10—1.2938 Food workers 101 1.20 31 0.91 8 1.42 239 1.22 269 1.02 648 1.11 1.03—1.2039 Beverage workers 12 1.18 2 0.85 [0.10] 0.00 [1.35] 0.00 16 1.10 30 1.05 0.71—1.5040 Tobacco workers 2 1.21 1 2.45 [0.01] 0.00 6 1.93 2 1.68 11 1.73 0.86—3.0941 Glass makers etc 51 1.03 51 1.05 1 1.04 111 1.25 338 1.18 552 1.16 1.07—1.2642 Packers 57 1.30 130 1.26 2 0.62 374 1.26 525 1.02 1088 1.13 1.07—1.2043 Engine operators 40 0.89 115 0.86 2 0.48 170 1.15 474 1.09 801 1.05 0.98—1.1244 Public safety workers 47 1.12 67 0.85 4 1.31 118 0.95 267 1.04 503 1.00 0.91—1.0945 Cooks and stewards 4 1.25 6 1.30 [1.39] 0.00 65 1.30 61 1.35 136 1.30 1.10—1.5446 Domestic assistants [0.04] 0.00 [0.42] 0.00 [0.00] 0.00 [0.37] 0.00 3 0.80 3 0.66 0.14—1.9247 Waiters 12 1.78 5 1.15 [0.15] 0.00 26 1.16 42 1.79 85 1.49 1.19—1.8448 Building caretakers 51 1.15 76 1.10 3 2.10 69 1.08 198 1.00 397 1.05 0.95—1.1649 Chimney sweeps [1.14] 0.00 5 1.02 – – 5 0.79 19 1.31 29 1.08 0.72—1.5550 Hairdressers 9 0.71 [1.34] 0.00 [0.20] 0.00 23 1.23 76 1.47 108 1.28 1.06—1.5451 Launderers 8 1.30 1 0.70 [0.13] 0.00 11 0.97 36 0.97 56 1.00 0.76—1.3052 Military personnel 26 1.20 17 0.72 – – 87 0.96 155 1.01 285 0.98 0.88—1.1053 "Other workers" 161 1.20 99 1.22 8 0.64 641 1.09 672 1.08 1581 1.10 1.05—1.1554 Economically inactive 177 1.45 629 1.36 16 1.83 412 1.33 1107 1.20 2341 1.28 1.23—1.33
1-54 All categories 3237 1.00 5007 1.00 148 1.00 10624 1.00 20317 1.00 39333 1.00 # REF. #
Obs = observed number of cases; SIR = standardised incidence ratio; 95% CI = 95% confidence interval
122 Index Prev Next

Acta Oncologica - Pukkala et al, 2008 Other/unknown site
Observed number of other/unknown site among women in the Nordic countries and standardised incidence ratios 1961-2005, bycountry and occupational category
Denmark Finland Iceland Norway Sweden Total
No Occupational category Obs SIR Obs SIR Obs SIR Obs SIR Obs SIR Obs SIR 95% CI
1 Technical workers, etc 9 0.74 25 0.89 [0.52] 0.00 8 0.77 93 0.93 135 0.89 0.75—1.052 Laboratory assistants 7 0.83 15 0.92 [0.79] 0.00 13 0.88 21 0.86 56 0.86 0.65—1.123 Physicians 3 0.75 3 0.46 [0.14] 0.00 2 0.31 18 0.81 26 0.66 0.43—0.974 Dentists 2 0.56 10 1.07 [0.05] 0.00 4 0.67 14 0.77 30 0.81 0.54—1.155 Nurses 51 0.71 63 0.76 3 0.80 87 0.77 263 0.85 467 0.81 0.74—0.886 Assistant nurses 52 1.02 76 0.82 2 0.39 90 0.81 492 0.94 712 0.91 0.84—0.987 "Other health workers" 42 1.03 73 1.03 3 2.75 106 0.87 162 0.92 386 0.94 0.85—1.048 Teachers 66 0.75 122 0.74 6 0.89 198 0.86 518 0.75 910 0.77 0.72—0.829 Religious workers etc 16 1.33 59 0.89 1 0.97 60 1.07 181 0.83 317 0.90 0.81—1.0010 Artistic workers 4 0.62 10 0.80 [0.83] 0.00 14 0.75 30 0.69 58 0.71 0.54—0.9211 Journalists 4 3.01 6 0.71 [0.20] 0.00 3 0.68 13 0.65 26 0.76 0.50—1.1112 Administrators 40 1.05 17 0.62 2 3.03 62 0.97 82 0.83 203 0.89 0.77—1.0213 Clerical workers 321 0.89 478 0.93 21 1.05 624 0.83 1613 0.94 3057 0.91 0.88—0.9414 Sales agents 4 1.20 93 1.08 4 1.78 119 0.88 234 0.94 454 0.95 0.87—1.0415 Shop workers 242 0.96 270 0.89 11 0.84 645 0.94 1091 0.98 2259 0.96 0.92—1.0016 Farmers 145 0.83 258 1.12 16 1.58 515 0.95 83 0.84 1017 0.96 0.90—1.0217 Gardeners 21 0.92 591 0.95 [0.34] 0.00 313 0.99 285 0.98 1210 0.97 0.91—1.0218 Fishermen 2 2.24 1 0.78 [0.34] 0.00 4 1.22 [0.94] 0.00 7 1.04 0.42—2.1519 Forestry workers [0.23] 0.00 1 0.40 [0.04] 0.00 6 1.16 4 0.65 11 0.78 0.39—1.4020 Miners and quarry workers [0.02] 0.00 2 1.81 [0.02] 0.00 [0.21] 0.00 [1.43] 0.00 2 0.72 0.09—2.6021 Seamen – – [0.22] 0.00 [0.00] 0.00 1 1.32 [0.15] 0.00 1 0.89 0.02—4.9422 Transport workers [0.26] 0.00 13 0.81 [0.39] 0.00 4 1.26 15 0.89 32 0.87 0.60—1.2323 Drivers 4 0.64 4 0.62 [0.16] 0.00 14 1.09 45 1.12 67 1.02 0.79—1.2924 Postal workers 17 1.27 99 1.06 2 0.46 132 0.84 339 1.09 589 1.02 0.94—1.1025 Textile workers 102 1.22 204 0.93 8 0.92 272 0.93 650 0.99 1236 0.98 0.92—1.0326 Shoe and leather workers 3 0.49 31 1.17 [0.49] 0.00 18 0.88 56 1.12 108 1.04 0.86—1.2627 Smelting workers 1 0.67 7 1.12 [0.02] 0.00 2 1.30 10 0.79 20 0.91 0.56—1.4128 Mechanics 12 0.83 23 0.87 [0.07] 0.00 25 1.15 156 1.22 216 1.13 0.99—1.2929 Plumbers [0.16] 0.00 [0.05] 0.00 – – [0.12] 0.00 1 6.14 1 2.02 0.05—11.2830 Welders – – 1 0.54 [0.01] 0.00 3 2.66 4 0.88 8 1.07 0.46—2.1031 Electrical workers 24 1.18 17 1.14 [0.07] 0.00 28 1.26 82 1.15 151 1.17 1.00—1.3732 Wood workers 8 1.18 58 1.04 [0.13] 0.00 6 0.86 19 0.90 91 1.00 0.81—1.2333 Painters 2 7.39 5 0.80 [0.04] 0.00 [1.66] 0.00 7 1.22 14 1.00 0.55—1.6834 "Other construction workers" [0.21] 0.00 35 1.46 1 49.46 1 1.48 [0.66] 0.00 37 1.45 1.02—2.0035 Bricklayers [0.04] 0.00 [0.80] 0.00 – – [0.03] 0.00 [0.02] 0.00 [0.89] 0.00 0.00—4.1536 Printers 6 0.77 22 0.84 [0.68] 0.00 28 1.25 60 1.09 116 1.04 0.86—1.2437 Chemical process workers 17 1.38 10 0.72 1 3.23 21 1.05 64 1.45 113 1.24 1.04—1.5038 Food workers 55 0.92 72 0.96 23 1.35 148 1.08 168 1.25 466 1.10 1.00—1.2039 Beverage workers 12 2.09 2 0.46 [0.04] 0.00 3 3.01 8 0.93 25 1.27 0.82—1.8840 Tobacco workers 15 1.91 3 1.21 – – 6 1.18 5 0.95 29 1.40 0.94—2.0141 Glass makers etc 20 1.38 49 0.96 1 2.09 41 0.98 113 0.96 224 0.99 0.87—1.1342 Packers 2 0.48 88 0.97 3 1.75 107 1.05 177 1.00 377 1.00 0.91—1.1143 Engine operators 1 8.88 19 1.36 [0.03] 0.00 3 3.03 11 1.08 34 1.34 0.93—1.8744 Public safety workers [0.50] 0.00 6 1.81 [0.36] 0.00 8 0.59 10 0.78 24 0.79 0.50—1.1745 Cooks and stewards [0.17] 0.00 82 0.79 6 0.90 154 0.92 299 1.14 541 1.00 0.92—1.0946 Domestic assistants 96 1.02 95 0.91 2 1.01 413 1.00 734 1.11 1340 1.05 1.00—1.1147 Waiters 23 1.44 97 1.20 [0.68] 0.00 186 1.18 293 1.08 599 1.14 1.05—1.2348 Building caretakers 324 1.18 361 1.00 11 0.83 663 1.01 735 1.07 2094 1.05 1.01—1.1049 Chimney sweeps [0.03] 0.00 [0.16] 0.00 – – [0.09] 0.00 [0.01] 0.00 [0.29] 0.00 0.00—12.7350 Hairdressers 14 0.87 32 1.04 [0.68] 0.00 40 1.03 94 0.85 180 0.91 0.79—1.0551 Launderers 28 0.90 32 1.07 [2.17] 0.00 50 0.78 146 1.02 256 0.95 0.84—1.0752 Military personnel 2 12.53 1 4.94 – – [0.13] 0.00 [0.35] 0.00 3 3.56 0.73—10.4053 "Other workers" 83 1.07 101 0.94 18 1.40 324 0.97 288 0.94 814 0.97 0.91—1.0454 Economically inactive 2149 1.01 2875 1.08 43 0.91 5810 1.06 14918 1.02 25795 1.03 1.02—1.05
1-54 All categories 4051 1.00 6617 1.00 188 1.00 11384 1.00 24704 1.00 46944 1.00 # REF. #
Obs = observed number of cases; SIR = standardised incidence ratio; 95% CI = 95% confidence interval
123 Index Prev Next

Acta Oncologica - Pukkala et al, 2008 Non-Hodgkin lymphoma
Observed number of non-Hodgkin lymphoma among men in the Nordic countries and standardised incidence ratios 1961-2005, bycountry and occupational category
Denmark Finland Iceland Norway Sweden Total
No Occupational category Obs SIR Obs SIR Obs SIR Obs SIR Obs SIR Obs SIR 95% CI
1 Technical workers, etc 422 1.04 598 1.08 10 1.61 332 1.11 1958 1.04 3320 1.05 1.02—1.092 Laboratory assistants 5 0.63 12 0.86 1 0.84 12 0.92 6 0.54 36 0.76 0.53—1.053 Physicians 40 1.21 36 1.12 4 1.78 47 1.32 107 1.21 234 1.22 1.08—1.394 Dentists 11 1.12 7 1.07 1 1.67 15 0.99 36 0.86 70 0.94 0.74—1.195 Nurses [0.47] 0.00 3 1.35 [0.03] 0.00 4 1.61 9 1.38 16 1.36 0.78—2.216 Assistant nurses 5 0.51 4 1.87 [0.37] 0.00 4 0.72 29 0.92 42 0.85 0.61—1.157 "Other health workers" 31 1.09 32 1.07 [0.64] 0.00 13 0.97 62 0.86 138 0.95 0.81—1.138 Teachers 187 1.05 248 1.11 17 1.98 207 0.99 518 1.03 1177 1.05 0.99—1.119 Religious workers etc 75 1.03 108 0.84 7 1.24 106 1.05 398 1.02 694 0.99 0.92—1.0710 Artistic workers 19 0.84 46 1.06 2 1.32 23 0.81 125 1.09 215 1.02 0.89—1.1611 Journalists 10 0.93 19 0.91 1 1.11 22 1.69 45 0.84 97 0.98 0.79—1.1912 Administrators 451 1.01 370 1.12 17 1.30 367 1.09 704 1.02 1909 1.05 1.01—1.1013 Clerical workers 189 0.96 223 1.06 13 0.85 252 1.01 755 1.00 1432 1.00 0.95—1.0614 Sales agents 93 0.89 318 1.03 10 1.31 296 1.07 1118 1.02 1835 1.02 0.98—1.0715 Shop workers 448 1.01 135 0.98 5 0.88 129 1.08 368 1.03 1085 1.02 0.96—1.0816 Farmers 770 0.91 1298 0.98 24 1.11 689 1.06 1712 1.01 4493 0.99 0.96—1.0217 Gardeners 113 0.94 200 0.98 [0.72] 0.00 142 0.83 595 0.92 1050 0.92 0.86—0.9718 Fishermen 45 1.09 18 1.02 14 0.89 206 0.95 65 0.95 348 0.97 0.87—1.0719 Forestry workers 19 1.09 179 0.75 [0.14] 0.00 110 0.92 422 0.90 730 0.86 0.80—0.9320 Miners and quarry workers 4 0.75 52 1.34 [0.25] 0.00 34 0.89 133 1.12 223 1.11 0.97—1.2621 Seamen 38 0.84 46 0.87 8 2.06 170 0.82 105 0.98 367 0.88 0.80—0.9822 Transport workers 85 0.88 169 1.11 4 0.58 99 0.97 354 0.95 711 0.98 0.91—1.0523 Drivers 323 1.02 507 0.99 10 0.91 317 1.05 993 1.08 2150 1.04 1.00—1.0924 Postal workers 62 0.99 92 1.20 1 0.77 66 1.22 229 1.15 450 1.14 1.04—1.2525 Textile workers 45 0.82 48 1.00 2 0.89 60 1.09 212 1.02 367 1.00 0.90—1.1126 Shoe and leather workers 9 0.67 21 1.02 [0.47] 0.00 17 0.80 74 0.94 121 0.90 0.75—1.0827 Smelting workers 123 0.98 79 1.06 3 0.90 68 0.87 300 0.89 573 0.93 0.86—1.0128 Mechanics 349 1.04 498 0.98 12 1.06 398 0.94 1628 0.97 2885 0.98 0.94—1.0129 Plumbers 37 1.21 88 1.03 [1.76] 0.00 41 0.81 193 1.01 359 1.00 0.90—1.1130 Welders – – 74 0.85 [0.72] 0.00 45 0.74 222 0.98 341 0.91 0.82—1.0131 Electrical workers 79 0.97 217 0.97 6 0.85 180 0.95 599 1.02 1081 0.99 0.93—1.0532 Wood workers 235 1.02 450 0.90 3 0.50 425 0.96 1057 1.01 2170 0.97 0.93—1.0233 Painters 77 1.01 85 0.78 4 1.63 77 1.06 318 1.03 561 0.99 0.91—1.0734 "Other construction workers" 272 0.96 295 0.91 11 0.85 84 0.91 527 0.94 1189 0.93 0.88—0.9935 Bricklayers 84 1.00 51 0.97 – – 33 0.77 143 1.05 311 0.99 0.88—1.1036 Printers 55 1.02 50 0.93 3 1.44 46 0.94 172 0.98 326 0.98 0.88—1.0937 Chemical process workers 45 0.93 90 1.06 [1.07] 0.00 101 1.09 239 0.96 475 0.99 0.91—1.0938 Food workers 163 1.03 50 0.82 12 1.30 99 0.90 268 1.03 592 0.99 0.91—1.0739 Beverage workers 20 1.05 4 1.03 [0.15] 0.00 4 2.00 11 0.79 39 1.00 0.71—1.3640 Tobacco workers 4 1.31 1 1.39 [0.01] 0.00 3 2.01 2 1.65 10 1.54 0.74—2.8341 Glass makers etc 74 0.80 90 1.01 2 1.20 56 0.96 243 0.85 465 0.88 0.81—0.9742 Packers 79 0.97 187 1.05 8 1.50 183 1.13 502 1.01 959 1.04 0.98—1.1143 Engine operators 84 0.99 275 1.08 4 0.52 124 1.11 435 0.98 922 1.02 0.96—1.0944 Public safety workers 86 1.09 154 1.08 5 1.00 84 1.13 268 1.01 597 1.05 0.97—1.1445 Cooks and stewards 4 0.64 7 0.69 1 0.38 30 0.81 46 0.92 88 0.83 0.67—1.0346 Domestic assistants [0.07] 0.00 [0.55] 0.00 [0.01] 0.00 1 2.45 3 0.58 4 0.65 0.18—1.6547 Waiters 14 1.09 13 1.31 [0.31] 0.00 17 1.15 25 0.98 69 1.09 0.84—1.3748 Building caretakers 101 1.23 112 0.96 4 2.02 53 1.37 198 1.00 468 1.07 0.98—1.1749 Chimney sweeps 2 0.91 7 0.83 – – 2 0.52 11 0.73 22 0.75 0.47—1.1350 Hairdressers 28 1.19 4 1.64 [0.37] 0.00 14 1.33 49 0.98 95 1.09 0.88—1.3351 Launderers 15 1.30 [2.52] 0.00 [0.19] 0.00 5 0.81 34 0.94 54 0.96 0.72—1.2552 Military personnel 46 1.09 55 1.08 – – 78 1.12 164 1.03 343 1.06 0.96—1.1853 "Other workers" 269 1.06 112 0.82 15 0.74 290 0.99 606 1.01 1292 0.99 0.94—1.0454 Economically inactive 285 1.22 721 1.08 9 0.60 111 0.73 935 1.00 2061 1.03 0.99—1.08
1-54 All categories 6129 1.00 8558 1.00 253 1.00 6391 1.00 20330 1.00 41661 1.00 # REF. #
Obs = observed number of cases; SIR = standardised incidence ratio; 95% CI = 95% confidence interval
124 Index Prev Next

Acta Oncologica - Pukkala et al, 2008 Non-Hodgkin lymphoma
Observed number of non-Hodgkin lymphoma among women in the Nordic countries and standardised incidence ratios 1961-2005, bycountry and occupational category
Denmark Finland Iceland Norway Sweden Total
No Occupational category Obs SIR Obs SIR Obs SIR Obs SIR Obs SIR Obs SIR 95% CI
1 Technical workers, etc 22 1.24 57 1.12 [0.57] 0.00 11 1.08 62 0.81 152 0.98 0.83—1.152 Laboratory assistants 20 1.54 26 0.92 5 6.19 10 0.83 27 1.24 88 1.16 0.93—1.433 Physicians 7 1.18 12 0.96 1 7.18 7 1.47 21 1.19 48 1.17 0.86—1.564 Dentists 5 0.95 19 1.46 [0.05] 0.00 3 0.79 14 1.04 41 1.15 0.83—1.575 Nurses 106 1.02 149 1.04 4 1.08 97 1.00 246 1.07 602 1.04 0.96—1.136 Assistant nurses 67 0.89 149 1.03 6 1.13 100 1.02 449 1.12 771 1.06 0.99—1.147 "Other health workers" 70 1.17 124 1.08 [1.11] 0.00 87 0.94 140 1.03 421 1.04 0.95—1.158 Teachers 124 0.94 259 1.00 7 1.06 184 1.06 505 0.98 1079 0.99 0.94—1.059 Religious workers etc 24 1.35 150 1.14 1 1.01 46 1.04 162 0.95 383 1.05 0.95—1.1610 Artistic workers 9 0.98 17 0.80 1 1.29 12 0.94 35 1.06 74 0.96 0.76—1.2111 Journalists 2 1.02 9 0.66 [0.19] 0.00 4 1.11 19 1.24 34 0.98 0.68—1.3712 Administrators 58 1.07 43 0.94 2 3.27 32 0.78 59 0.79 194 0.90 0.78—1.0313 Clerical workers 563 1.05 902 1.06 25 1.24 564 1.03 1269 1.00 3323 1.03 1.00—1.0714 Sales agents 5 1.03 126 1.03 1 0.48 89 1.35 183 1.04 404 1.09 0.99—1.2015 Shop workers 349 0.96 431 0.96 5 0.39 449 1.01 800 1.03 2034 1.00 0.95—1.0416 Farmers 202 0.79 269 1.00 8 0.88 271 0.97 63 0.92 813 0.92 0.86—0.9917 Gardeners 32 0.97 763 0.97 2 6.41 151 0.88 204 1.02 1152 0.97 0.91—1.0218 Fishermen [1.30] 0.00 3 1.71 [0.33] 0.00 4 1.67 [0.66] 0.00 7 1.09 0.44—2.2419 Forestry workers [0.34] 0.00 4 1.16 [0.04] 0.00 5 1.44 4 0.91 13 1.11 0.59—1.9020 Miners and quarry workers [0.02] 0.00 [1.40] 0.00 [0.01] 0.00 [0.19] 0.00 1 0.94 1 0.37 0.01—2.0721 Seamen – – [0.42] 0.00 [0.00] 0.00 [0.55] 0.00 [0.13] 0.00 [1.10] 0.00 0.00—3.3522 Transport workers [0.36] 0.00 21 0.97 1 3.04 5 1.95 14 1.13 41 1.10 0.79—1.4923 Drivers 8 0.88 11 1.05 [0.15] 0.00 6 0.65 39 1.27 64 1.07 0.82—1.3724 Postal workers 21 1.10 109 0.81 3 0.73 95 0.93 200 0.91 428 0.89 0.81—0.9825 Textile workers 114 0.94 284 0.94 8 1.05 147 1.01 428 0.97 981 0.96 0.91—1.0326 Shoe and leather workers 9 1.01 27 0.73 1 2.45 8 0.75 39 1.15 84 0.92 0.73—1.1427 Smelting workers 2 0.92 8 0.92 1 58.16 5 3.36 10 1.05 26 1.19 0.78—1.7428 Mechanics 25 1.17 36 0.91 1 13.62 7 0.50 101 1.07 170 1.00 0.86—1.1629 Plumbers 1 4.83 [0.10] 0.00 – – 1 8.92 1 7.05 3 5.39 1.11—15.7630 Welders – – 2 0.63 [0.01] 0.00 2 1.65 5 1.37 9 1.12 0.51—2.1331 Electrical workers 38 1.26 36 1.38 [0.06] 0.00 16 1.02 49 0.92 139 1.11 0.94—1.3232 Wood workers 15 1.50 73 0.96 [0.13] 0.00 6 1.09 16 1.01 110 1.03 0.85—1.2433 Painters [0.39] 0.00 10 1.11 [0.04] 0.00 1 0.82 3 0.71 14 0.94 0.51—1.5834 "Other construction workers" 1 3.37 34 1.14 [0.02] 0.00 [0.49] 0.00 [0.54] 0.00 35 1.12 0.78—1.5635 Bricklayers [0.06] 0.00 2 1.93 – – [0.03] 0.00 [0.02] 0.00 2 1.75 0.21—6.3436 Printers 11 0.97 36 0.94 [0.68] 0.00 12 0.92 37 0.94 96 0.93 0.76—1.1437 Chemical process workers 16 0.90 14 0.72 2 6.97 11 0.93 30 0.96 73 0.91 0.71—1.1438 Food workers 88 1.01 92 0.91 10 0.63 77 1.03 84 0.91 351 0.95 0.85—1.0539 Beverage workers 6 0.73 2 0.35 [0.04] 0.00 2 2.71 2 0.35 12 0.59 0.30—1.0340 Tobacco workers 16 1.42 3 0.93 – – [2.28] 0.00 4 1.08 23 1.12 0.71—1.6841 Glass makers etc 22 1.03 79 1.10 [0.43] 0.00 27 1.04 87 1.04 215 1.06 0.93—1.2142 Packers 4 0.65 142 1.12 1 0.65 60 0.97 132 1.06 339 1.06 0.95—1.1843 Engine operators [0.18] 0.00 17 0.83 [0.02] 0.00 [1.02] 0.00 8 0.98 25 0.84 0.54—1.2344 Public safety workers [0.68] 0.00 6 1.21 [0.31] 0.00 8 1.00 17 1.63 31 1.27 0.86—1.8045 Cooks and stewards [0.23] 0.00 123 0.86 7 1.20 80 1.00 169 0.95 379 0.93 0.84—1.0346 Domestic assistants 157 1.15 131 0.85 1 0.60 223 1.04 447 0.94 959 0.98 0.92—1.0447 Waiters 32 1.39 122 1.01 [0.68] 0.00 86 0.91 166 0.89 406 0.95 0.86—1.0548 Building caretakers 404 1.03 481 0.99 12 1.03 431 1.04 506 1.05 1834 1.03 0.98—1.0749 Chimney sweeps [0.04] 0.00 1 4.24 – – [0.06] 0.00 [0.01] 0.00 1 2.88 0.07—16.0450 Hairdressers 32 1.34 47 1.02 [0.72] 0.00 23 0.94 73 0.90 175 0.99 0.86—1.1551 Launderers 47 1.06 43 1.12 4 2.16 31 0.95 85 0.88 210 0.98 0.86—1.1352 Military personnel [0.23] 0.00 [0.50] 0.00 – – [0.14] 0.00 1 3.05 1 0.83 0.02—4.6553 "Other workers" 108 0.97 158 1.04 11 0.91 201 0.93 231 1.06 709 1.00 0.93—1.0854 Economically inactive 2937 0.99 3206 1.01 43 1.03 2208 1.00 9786 1.00 18180 1.00 0.98—1.01
1-54 All categories 5779 1.00 8868 1.00 174 1.00 5905 1.00 17033 1.00 37759 1.00 # REF. #
Obs = observed number of cases; SIR = standardised incidence ratio; 95% CI = 95% confidence interval
125 Index Prev Next

Acta Oncologica - Pukkala et al, 2008 Hodgkin lymphoma
Observed number of Hodgkin lymphoma among men in the Nordic countries and standardised incidence ratios 1961-2005, by countryand occupational category
Denmark Finland Iceland Norway Sweden Total
No Occupational category Obs SIR Obs SIR Obs SIR Obs SIR Obs SIR Obs SIR 95% CI
1 Technical workers, etc 64 0.96 89 0.99 2 2.30 42 0.86 291 1.02 488 0.99 0.91—1.082 Laboratory assistants 4 3.08 3 1.25 [0.18] 0.00 1 0.43 2 1.10 10 1.25 0.60—2.303 Physicians 7 1.34 6 1.16 [0.30] 0.00 6 0.96 14 1.01 33 1.07 0.74—1.514 Dentists 2 1.22 1 0.93 [0.08] 0.00 3 1.09 7 1.08 13 1.08 0.57—1.855 Nurses [0.08] 0.00 1 1.95 [0.01] 0.00 [0.42] 0.00 2 1.52 3 1.29 0.27—3.766 Assistant nurses 1 0.62 [0.51] 0.00 [0.07] 0.00 [1.04] 0.00 7 1.24 8 0.90 0.39—1.787 "Other health workers" 4 0.88 7 1.46 [0.09] 0.00 4 1.60 8 0.68 23 0.97 0.62—1.468 Teachers 28 0.95 39 1.17 1 0.84 31 0.86 64 0.85 163 0.93 0.80—1.089 Religious workers etc 10 0.89 26 1.16 [0.75] 0.00 14 0.78 54 0.85 104 0.90 0.74—1.0910 Artistic workers [3.63] 0.00 8 1.15 [0.20] 0.00 2 0.39 22 1.22 32 0.94 0.65—1.3311 Journalists [1.73] 0.00 2 0.60 [0.11] 0.00 2 0.86 11 1.27 15 0.93 0.52—1.5312 Administrators 57 0.82 41 0.83 2 1.43 59 0.97 107 0.99 266 0.92 0.82—1.0413 Clerical workers 29 0.90 31 0.99 1 0.57 44 0.96 120 1.01 225 0.98 0.86—1.1214 Sales agents 12 0.70 39 0.82 1 1.17 54 1.01 178 1.02 284 0.97 0.86—1.0915 Shop workers 71 1.02 12 0.54 2 2.84 16 0.74 55 1.01 156 0.92 0.79—1.0816 Farmers 106 0.85 199 1.17 4 1.74 146 1.07 278 0.99 733 1.03 0.96—1.1117 Gardeners 13 0.72 29 0.99 [0.08] 0.00 32 0.94 106 1.01 180 0.96 0.83—1.1218 Fishermen 6 0.89 2 0.81 1 0.44 41 0.91 9 0.80 59 0.87 0.66—1.1219 Forestry workers 3 1.17 34 0.98 [0.02] 0.00 27 1.07 87 1.12 151 1.08 0.92—1.2620 Miners and quarry workers [0.82] 0.00 4 0.68 [0.04] 0.00 8 1.04 25 1.25 37 1.08 0.76—1.4821 Seamen 5 0.64 9 1.12 2 3.94 38 0.96 16 0.90 70 0.95 0.74—1.2022 Transport workers 16 1.07 22 1.05 [0.75] 0.00 24 1.27 47 0.87 109 1.00 0.83—1.2023 Drivers 55 1.05 85 1.11 1 0.74 61 1.05 142 0.97 344 1.03 0.93—1.1424 Postal workers 12 1.15 7 0.60 [0.14] 0.00 9 0.82 36 1.11 64 0.97 0.75—1.2425 Textile workers 9 1.06 7 1.04 [0.23] 0.00 14 1.30 37 1.09 67 1.11 0.86—1.4126 Shoe and leather workers 1 0.49 4 1.36 [0.05] 0.00 6 1.28 14 1.02 25 1.07 0.69—1.5827 Smelting workers 21 0.99 13 1.19 1 2.69 20 1.27 51 0.92 106 1.02 0.84—1.2428 Mechanics 70 1.25 71 0.88 2 1.32 96 1.22 265 1.01 504 1.05 0.96—1.1529 Plumbers 8 1.55 12 0.89 1 4.47 10 1.06 34 1.13 65 1.11 0.86—1.4230 Welders – – 10 0.67 [0.11] 0.00 18 1.69 31 0.89 59 0.98 0.74—1.2631 Electrical workers 14 1.00 36 0.99 1 1.00 31 0.89 66 0.72 148 0.83 0.71—0.9832 Wood workers 46 1.24 79 1.11 1 1.36 77 0.91 179 1.04 382 1.04 0.94—1.1533 Painters 18 1.45 12 0.74 [0.30] 0.00 14 0.95 48 0.95 92 0.97 0.79—1.1934 "Other construction workers" 39 0.88 41 0.86 2 1.17 24 1.31 104 1.09 210 1.01 0.89—1.1635 Bricklayers 13 0.95 13 1.75 – – 12 1.40 31 1.39 69 1.33 1.04—1.6836 Printers 10 1.09 10 1.12 [0.29] 0.00 7 0.73 23 0.82 50 0.89 0.66—1.1837 Chemical process workers 13 1.72 13 1.00 [0.12] 0.00 16 0.82 39 0.92 81 0.98 0.78—1.2238 Food workers 26 1.02 8 0.87 2 1.98 26 1.16 50 1.20 112 1.12 0.93—1.3539 Beverage workers 3 0.96 [0.57] 0.00 [0.02] 0.00 [0.32] 0.00 1 0.40 4 0.61 0.17—1.5740 Tobacco workers 1 2.18 [0.11] 0.00 [0.00] 0.00 [0.34] 0.00 [0.19] 0.00 1 0.90 0.02—5.0441 Glass makers etc 17 1.17 17 1.21 [0.20] 0.00 14 1.24 39 0.83 87 1.00 0.80—1.2442 Packers 13 1.02 25 0.93 [0.58] 0.00 29 0.85 97 1.13 164 1.03 0.88—1.2043 Engine operators 16 1.16 44 1.12 1 1.00 21 1.00 73 1.01 155 1.05 0.90—1.2344 Public safety workers 21 1.70 20 0.92 [0.60] 0.00 18 1.26 41 0.97 100 1.10 0.90—1.3345 Cooks and stewards 1 0.90 3 1.55 1 2.70 4 0.57 3 0.35 12 0.64 0.33—1.1146 Domestic assistants [0.01] 0.00 [0.08] 0.00 [0.00] 0.00 [0.06] 0.00 1 0.94 1 0.82 0.02—4.5847 Waiters 1 0.44 1 0.51 [0.05] 0.00 2 0.68 3 0.69 7 0.61 0.24—1.2548 Building caretakers 15 1.17 15 0.88 [0.18] 0.00 6 0.78 34 0.98 70 0.96 0.75—1.2249 Chimney sweeps [0.37] 0.00 1 0.78 – – [0.76] 0.00 3 1.23 4 0.82 0.22—2.1150 Hairdressers 5 1.37 [0.41] 0.00 [0.05] 0.00 1 0.46 9 1.12 15 1.05 0.59—1.7351 Launderers [1.75] 0.00 [0.40] 0.00 [0.02] 0.00 1 0.79 6 1.05 7 0.77 0.31—1.5852 Military personnel 9 1.24 6 0.73 – – 19 1.59 20 0.86 54 1.07 0.80—1.3953 "Other workers" 51 1.22 29 1.37 [2.28] 0.00 59 0.94 117 1.13 256 1.11 0.98—1.2554 Economically inactive 31 0.81 102 0.90 2 0.99 31 0.83 184 1.01 350 0.94 0.85—1.04
1-54 All categories 977 1.00 1288 1.00 31 1.00 1240 1.00 3291 1.00 6827 1.00 # REF. #
Obs = observed number of cases; SIR = standardised incidence ratio; 95% CI = 95% confidence interval
126 Index Prev Next

Acta Oncologica - Pukkala et al, 2008 Hodgkin lymphoma
Observed number of Hodgkin lymphoma among women in the Nordic countries and standardised incidence ratios 1961-2005, bycountry and occupational category
Denmark Finland Iceland Norway Sweden Total
No Occupational category Obs SIR Obs SIR Obs SIR Obs SIR Obs SIR Obs SIR 95% CI
1 Technical workers, etc 1 0.54 9 1.38 [0.08] 0.00 1 0.94 7 0.70 18 0.92 0.55—1.462 Laboratory assistants [1.39] 0.00 4 1.23 [0.09] 0.00 2 1.58 5 1.56 11 1.20 0.60—2.143 Physicians 1 1.64 [1.68] 0.00 [0.02] 0.00 [0.57] 0.00 [2.35] 0.00 1 0.19 0.00—1.074 Dentists 1 1.85 2 1.44 [0.00] 0.00 3 6.23 1 0.58 7 1.68 0.68—3.475 Nurses 14 1.30 11 0.67 [0.35] 0.00 10 1.08 28 0.95 63 0.95 0.73—1.226 Assistant nurses 4 0.50 14 0.92 1 1.29 10 1.18 50 0.95 79 0.93 0.74—1.167 "Other health workers" 9 1.47 16 1.23 [0.14] 0.00 10 1.06 23 1.28 58 1.24 0.94—1.618 Teachers 13 0.94 29 1.03 [0.69] 0.00 16 0.82 52 0.78 110 0.85 0.71—1.039 Religious workers etc [1.84] 0.00 11 0.63 [0.10] 0.00 2 0.44 22 0.92 35 0.73 0.51—1.0210 Artistic workers 2 2.15 1 0.39 [0.07] 0.00 [1.46] 0.00 4 0.91 7 0.74 0.30—1.5311 Journalists [0.21] 0.00 2 1.29 [0.02] 0.00 [0.38] 0.00 1 0.49 3 0.71 0.15—2.0912 Administrators 3 0.54 2 0.37 1 22.44 8 1.69 14 1.39 28 1.09 0.72—1.5713 Clerical workers 66 1.18 80 0.85 3 1.19 46 0.78 177 1.12 372 1.01 0.91—1.1114 Sales agents [0.49] 0.00 9 0.70 [0.19] 0.00 7 0.78 25 1.03 41 0.88 0.63—1.1915 Shop workers 36 0.97 32 0.73 1 0.68 34 0.74 100 1.06 203 0.91 0.79—1.0416 Farmers 27 1.04 29 1.11 2 2.46 40 1.27 16 1.56 114 1.21 1.00—1.4517 Gardeners 5 1.50 81 1.17 [0.04] 0.00 15 0.82 30 1.21 131 1.13 0.95—1.3418 Fishermen [0.13] 0.00 [0.17] 0.00 [0.03] 0.00 [0.22] 0.00 1 11.49 1 1.56 0.04—8.7119 Forestry workers [0.03] 0.00 [0.33] 0.00 [0.01] 0.00 [0.31] 0.00 [0.54] 0.00 [1.22] 0.00 0.00—3.0220 Miners and quarry workers [0.00] 0.00 [0.13] 0.00 [0.00] 0.00 [0.02] 0.00 [0.13] 0.00 [0.28] 0.00 0.00—12.9721 Seamen – – [0.06] 0.00 [0.00] 0.00 [0.05] 0.00 [0.02] 0.00 [0.14] 0.00 0.00—27.0122 Transport workers [0.04] 0.00 [1.95] 0.00 1 32.00 [0.28] 0.00 2 1.18 3 0.75 0.16—2.2023 Drivers [0.95] 0.00 1 0.89 [0.01] 0.00 [0.94] 0.00 [3.95] 0.00 1 0.14 0.00—0.8024 Postal workers 2 1.03 21 1.62 1 2.64 14 1.19 23 0.85 61 1.13 0.86—1.4525 Textile workers 11 0.88 31 1.08 [0.76] 0.00 16 0.81 45 0.79 103 0.87 0.72—1.0526 Shoe and leather workers [0.93] 0.00 2 0.57 [0.04] 0.00 3 2.12 6 1.40 11 1.08 0.54—1.9327 Smelting workers 1 4.37 1 1.24 [0.00] 0.00 [0.12] 0.00 2 1.75 4 1.74 0.47—4.4528 Mechanics 5 2.19 2 0.51 [0.00] 0.00 1 0.62 12 1.01 20 1.01 0.62—1.5629 Plumbers [0.02] 0.00 [0.01] 0.00 – – [0.01] 0.00 [0.02] 0.00 [0.06] 0.00 0.00—61.0030 Welders – – 1 2.98 [0.00] 0.00 [0.11] 0.00 1 2.10 2 2.17 0.26—7.8531 Electrical workers 2 0.62 2 0.66 [0.01] 0.00 2 1.15 3 0.45 9 0.61 0.28—1.1632 Wood workers 1 0.95 3 0.43 [0.02] 0.00 1 2.00 [2.02] 0.00 5 0.47 0.15—1.1133 Painters [0.04] 0.00 [0.87] 0.00 [0.01] 0.00 [0.12] 0.00 [0.55] 0.00 [1.59] 0.00 0.00—2.3334 "Other construction workers" [0.03] 0.00 3 1.14 [0.00] 0.00 [0.04] 0.00 [0.08] 0.00 3 1.07 0.22—3.1435 Bricklayers [0.01] 0.00 [0.10] 0.00 – – [0.00] 0.00 [0.00] 0.00 [0.11] 0.00 0.00—34.6136 Printers [1.19] 0.00 5 1.26 [0.08] 0.00 [1.69] 0.00 4 0.78 9 0.75 0.34—1.4237 Chemical process workers 1 0.54 [1.85] 0.00 [0.03] 0.00 1 0.69 3 0.76 5 0.55 0.18—1.2738 Food workers 10 1.10 8 0.84 [1.89] 0.00 8 0.90 8 0.66 34 0.82 0.57—1.1539 Beverage workers 2 2.29 3 5.72 [0.00] 0.00 [0.07] 0.00 1 1.28 6 2.67 0.98—5.8140 Tobacco workers 2 1.65 [0.28] 0.00 – – 2 5.18 [0.44] 0.00 4 1.72 0.47—4.4141 Glass makers etc 2 0.89 11 1.59 [0.05] 0.00 2 0.65 8 0.77 23 1.01 0.64—1.5242 Packers 1 1.57 12 1.00 [0.17] 0.00 5 0.72 15 0.95 33 0.93 0.64—1.3043 Engine operators [0.02] 0.00 3 1.50 [0.01] 0.00 [0.09] 0.00 1 1.01 4 1.29 0.35—3.3044 Public safety workers [0.07] 0.00 2 3.66 [0.03] 0.00 [0.73] 0.00 2 1.25 4 1.34 0.37—3.4345 Cooks and stewards [0.02] 0.00 17 1.18 [0.61] 0.00 18 1.73 23 0.94 58 1.16 0.88—1.5046 Domestic assistants 13 0.93 16 0.94 [0.17] 0.00 19 0.72 60 0.88 108 0.86 0.71—1.0447 Waiters 2 0.82 15 1.20 [0.09] 0.00 9 0.84 26 1.10 52 1.06 0.79—1.3848 Building caretakers 55 1.35 44 0.94 [1.09] 0.00 40 0.95 70 1.08 209 1.07 0.94—1.2349 Chimney sweeps [0.00] 0.00 [0.02] 0.00 – – [0.00] 0.00 [0.00] 0.00 [0.03] 0.00 0.00—113.9050 Hairdressers 2 0.80 5 1.01 [0.13] 0.00 2 0.66 7 0.70 16 0.78 0.44—1.2651 Launderers 8 1.76 1 0.29 [0.19] 0.00 2 0.49 15 1.18 26 1.04 0.68—1.5352 Military personnel [0.02] 0.00 [0.06] 0.00 – – [0.01] 0.00 [0.05] 0.00 [0.14] 0.00 0.00—25.5053 "Other workers" 16 1.38 21 1.36 [1.49] 0.00 22 0.97 35 1.22 94 1.18 0.95—1.4454 Economically inactive 280 0.91 331 1.05 9 2.12 424 1.09 1302 1.01 2346 1.02 0.98—1.06
1-54 All categories 598 1.00 893 1.00 19 1.00 795 1.00 2230 1.00 4535 1.00 # REF. #
Obs = observed number of cases; SIR = standardised incidence ratio; 95% CI = 95% confidence interval
127 Index Prev Next

Acta Oncologica - Pukkala et al, 2008 Multiple myeloma
Observed number of multiple myeloma among men in the Nordic countries and standardised incidence ratios 1961-2005, by countryand occupational category
Denmark Finland Iceland Norway Sweden Total
No Occupational category Obs SIR Obs SIR Obs SIR Obs SIR Obs SIR Obs SIR 95% CI
1 Technical workers, etc 220 0.97 175 1.00 [2.39] 0.00 192 1.13 904 1.01 1491 1.02 0.97—1.072 Laboratory assistants 6 1.33 4 0.95 [0.48] 0.00 4 0.47 3 0.77 17 0.79 0.46—1.263 Physicians 17 0.91 13 1.30 [1.02] 0.00 25 1.04 33 0.82 88 0.94 0.75—1.164 Dentists 4 0.74 2 0.93 [0.25] 0.00 6 0.56 22 1.10 34 0.88 0.61—1.235 Nurses [0.25] 0.00 1 2.06 [0.01] 0.00 1 1.19 3 1.58 5 1.43 0.46—3.346 Assistant nurses 7 1.30 [0.42] 0.00 [0.11] 0.00 4 0.95 14 1.01 25 1.04 0.67—1.547 "Other health workers" 18 1.11 8 0.80 [0.26] 0.00 8 0.87 46 1.34 80 1.14 0.91—1.428 Teachers 102 1.03 73 0.99 4 1.10 143 1.12 215 0.95 537 1.01 0.93—1.109 Religious workers etc 54 1.29 46 1.17 1 0.43 66 0.97 186 1.07 353 1.09 0.98—1.2110 Artistic workers 16 1.23 16 1.12 1 1.55 15 0.76 45 0.83 93 0.91 0.74—1.1211 Journalists 6 0.98 5 0.72 [0.36] 0.00 7 0.82 26 1.04 44 0.93 0.68—1.2512 Administrators 270 1.06 117 1.02 3 0.49 217 0.89 350 0.99 957 0.99 0.93—1.0513 Clerical workers 99 0.89 66 0.87 10 1.48 170 0.95 377 1.00 722 0.96 0.90—1.0414 Sales agents 46 0.78 110 1.03 3 0.85 211 0.98 572 1.06 942 1.02 0.95—1.0815 Shop workers 274 1.06 45 1.02 1 0.42 78 0.99 172 0.99 570 1.02 0.94—1.1116 Farmers 498 1.00 581 1.04 11 1.11 689 1.07 1091 1.12 2870 1.07 1.03—1.1117 Gardeners 72 1.02 77 1.01 [0.31] 0.00 151 0.99 401 1.13 701 1.07 1.00—1.1618 Fishermen 18 0.76 7 0.97 4 0.68 185 0.95 44 1.16 258 0.96 0.85—1.0819 Forestry workers 7 0.67 75 0.85 [0.05] 0.00 116 1.00 250 0.97 448 0.95 0.87—1.0420 Miners and quarry workers 4 1.25 13 0.93 [0.10] 0.00 33 1.08 75 1.20 125 1.13 0.95—1.3521 Seamen 22 0.87 17 0.91 2 1.23 123 0.83 53 0.97 217 0.88 0.77—1.0022 Transport workers 53 0.96 65 1.15 7 2.16 88 1.10 186 1.00 399 1.05 0.95—1.1523 Drivers 156 0.86 181 1.04 7 1.48 204 0.95 445 1.00 993 0.97 0.91—1.0424 Postal workers 29 0.83 33 1.23 [0.59] 0.00 45 1.05 83 0.84 190 0.93 0.81—1.0725 Textile workers 27 0.84 20 1.09 [0.99] 0.00 44 0.91 101 0.89 192 0.90 0.78—1.0426 Shoe and leather workers 5 0.63 8 0.99 [0.22] 0.00 16 0.77 51 1.12 80 0.97 0.77—1.2127 Smelting workers 99 1.38 29 1.05 [1.44] 0.00 64 1.01 150 0.84 342 1.00 0.90—1.1128 Mechanics 206 1.07 147 0.85 4 0.89 285 0.96 727 0.90 1369 0.93 0.88—0.9829 Plumbers 15 0.87 35 1.23 [0.73] 0.00 41 1.22 99 1.06 190 1.09 0.95—1.2630 Welders – – 30 1.15 1 3.61 33 0.90 96 0.92 160 0.95 0.82—1.1131 Electrical workers 44 0.97 72 1.00 3 1.13 128 0.98 280 1.01 527 1.00 0.92—1.0932 Wood workers 120 0.90 169 0.88 2 0.77 399 1.10 573 1.03 1263 1.01 0.96—1.0733 Painters 40 0.92 45 1.13 [1.08] 0.00 44 0.73 151 0.94 280 0.92 0.82—1.0334 "Other construction workers" 200 1.19 116 0.94 8 1.55 75 1.08 292 0.97 691 1.04 0.96—1.1235 Bricklayers 47 0.97 22 1.10 – – 55 1.53 62 0.85 186 1.05 0.91—1.2136 Printers 28 0.92 17 0.99 [0.86] 0.00 27 0.77 63 0.74 135 0.80 0.68—0.9537 Chemical process workers 24 0.84 32 1.09 [0.48] 0.00 98 1.20 129 0.96 283 1.03 0.92—1.1638 Food workers 99 1.07 16 0.75 5 1.25 92 1.00 148 1.09 360 1.05 0.94—1.1639 Beverage workers 8 0.71 3 2.05 [0.07] 0.00 [0.79] 0.00 7 0.91 18 0.85 0.50—1.3440 Tobacco workers 1 0.54 1 4.00 [0.01] 0.00 1 0.70 [0.59] 0.00 3 0.73 0.15—2.1341 Glass makers etc 45 0.83 35 1.14 1 1.39 57 1.33 147 1.00 285 1.03 0.92—1.1642 Packers 39 0.81 67 1.03 3 1.31 121 0.88 268 1.00 498 0.96 0.88—1.0443 Engine operators 47 0.96 88 1.04 4 1.29 72 0.98 212 0.97 423 0.99 0.90—1.0944 Public safety workers 45 0.98 56 1.12 5 2.25 68 1.16 143 1.13 317 1.12 1.00—1.2545 Cooks and stewards 5 1.41 7 2.39 [1.05] 0.00 21 0.86 21 0.94 54 0.99 0.75—1.3046 Domestic assistants [0.04] 0.00 [0.22] 0.00 [0.00] 0.00 [0.19] 0.00 [1.77] 0.00 [2.23] 0.00 0.00—1.6647 Waiters 8 1.06 4 1.44 1 9.01 13 1.20 11 0.95 37 1.13 0.79—1.5548 Building caretakers 54 1.11 37 0.85 3 3.09 26 0.87 117 1.13 237 1.05 0.92—1.1949 Chimney sweeps 4 3.22 2 0.63 – – 3 0.99 8 1.10 17 1.15 0.67—1.8550 Hairdressers 7 0.50 2 2.28 [0.16] 0.00 6 0.68 31 1.17 46 0.91 0.67—1.2251 Launderers 13 1.92 1 1.11 [0.09] 0.00 6 1.14 22 1.16 42 1.31 0.95—1.7852 Military personnel 22 0.95 19 1.24 – – 35 0.77 75 1.00 151 0.95 0.81—1.1153 "Other workers" 150 1.01 49 0.96 6 0.66 281 1.05 317 0.98 803 1.00 0.93—1.0754 Economically inactive 143 0.96 280 0.97 8 1.24 118 0.85 409 0.84 958 0.90 0.84—0.96
1-54 All categories 3543 1.00 3139 1.00 108 1.00 5010 1.00 10306 1.00 22106 1.00 # REF. #
Obs = observed number of cases; SIR = standardised incidence ratio; 95% CI = 95% confidence interval
128 Index Prev Next

Acta Oncologica - Pukkala et al, 2008 Multiple myeloma
Observed number ofmultiple myeloma among women in the Nordic countries and standardised incidence ratios 1961-2005, by countryand occupational category
Denmark Finland Iceland Norway Sweden Total
No Occupational category Obs SIR Obs SIR Obs SIR Obs SIR Obs SIR Obs SIR 95% CI
1 Technical workers, etc 8 0.92 16 1.05 [0.23] 0.00 5 1.11 33 1.02 62 1.02 0.78—1.302 Laboratory assistants 6 1.00 11 1.22 [0.36] 0.00 3 0.48 4 0.59 24 0.84 0.54—1.263 Physicians 3 1.04 [3.60] 0.00 1 14.61 1 0.39 11 1.61 16 1.00 0.57—1.634 Dentists [2.59] 0.00 5 1.03 [0.03] 0.00 1 0.43 8 1.35 14 0.89 0.49—1.495 Nurses 49 0.95 49 1.08 [1.86] 0.00 56 1.16 96 0.95 250 1.01 0.89—1.146 Assistant nurses 37 1.01 53 1.04 3 1.20 44 0.90 164 0.97 301 0.98 0.87—1.097 "Other health workers" 33 1.12 39 1.00 [0.51] 0.00 44 0.87 51 0.92 167 0.95 0.82—1.118 Teachers 67 1.06 98 1.09 1 0.32 104 1.11 226 1.02 496 1.05 0.97—1.159 Religious workers etc 4 0.46 40 1.11 [0.47] 0.00 24 1.02 65 0.95 133 0.97 0.82—1.1510 Artistic workers 8 1.72 [6.74] 0.00 [0.39] 0.00 6 0.80 14 1.00 28 0.84 0.56—1.2211 Journalists 1 1.04 5 1.10 [0.10] 0.00 2 1.08 10 1.57 18 1.30 0.77—2.0612 Administrators 35 1.26 12 0.81 [0.35] 0.00 24 0.96 30 0.92 101 1.00 0.83—1.2213 Clerical workers 231 0.89 269 0.95 18 1.85 287 0.92 569 1.03 1374 0.97 0.92—1.0214 Sales agents 2 0.83 44 0.95 1 0.89 48 0.94 74 0.86 169 0.90 0.78—1.0515 Shop workers 175 0.96 154 0.93 4 0.61 269 0.96 379 0.99 981 0.96 0.91—1.0316 Farmers 126 0.99 142 1.17 7 1.41 258 1.22 37 1.07 570 1.14 1.05—1.2417 Gardeners 18 1.09 356 1.06 1 6.07 143 1.14 90 0.89 608 1.05 0.97—1.1318 Fishermen [0.64] 0.00 1 1.47 [0.16] 0.00 2 1.45 1 3.06 4 1.26 0.34—3.2219 Forestry workers [0.17] 0.00 [1.28] 0.00 [0.02] 0.00 1 0.46 4 1.93 5 0.87 0.28—2.0420 Miners and quarry workers [0.01] 0.00 1 1.68 [0.00] 0.00 [0.09] 0.00 [0.46] 0.00 1 0.86 0.02—4.7621 Seamen – – [0.12] 0.00 [0.00] 0.00 [0.31] 0.00 [0.04] 0.00 [0.48] 0.00 0.00—7.7322 Transport workers [0.18] 0.00 4 0.45 [0.17] 0.00 [1.35] 0.00 5 0.88 9 0.55 0.25—1.0523 Drivers 5 1.10 3 0.86 [0.07] 0.00 6 1.13 9 0.70 23 0.87 0.55—1.3124 Postal workers 7 0.72 62 1.20 1 0.43 71 1.12 100 0.97 241 1.05 0.92—1.1925 Textile workers 63 1.03 103 0.87 6 1.42 134 1.19 226 0.96 532 1.00 0.92—1.0926 Shoe and leather workers 8 1.79 16 1.10 [0.21] 0.00 5 0.63 15 0.84 44 0.98 0.71—1.3127 Smelting workers 2 1.83 1 0.29 [0.01] 0.00 1 1.45 6 1.47 10 1.07 0.51—1.9728 Mechanics 11 1.04 18 1.24 [0.04] 0.00 6 0.67 40 0.94 75 0.98 0.77—1.2229 Plumbers [0.11] 0.00 [0.03] 0.00 – – [0.06] 0.00 [0.05] 0.00 [0.24] 0.00 0.00—15.3330 Welders – – [1.01] 0.00 [0.00] 0.00 1 1.93 [1.39] 0.00 1 0.34 0.01—1.9131 Electrical workers 5 0.34 7 0.85 [0.03] 0.00 13 1.39 26 1.10 51 0.91 0.68—1.2032 Wood workers 5 1.01 28 0.91 [0.06] 0.00 4 1.33 10 1.46 47 1.03 0.76—1.3733 Painters [0.19] 0.00 4 1.14 [0.02] 0.00 [0.71] 0.00 3 1.56 7 1.10 0.44—2.2734 "Other construction workers" [0.15] 0.00 13 1.00 [0.01] 0.00 [0.27] 0.00 [0.20] 0.00 13 0.95 0.51—1.6235 Bricklayers [0.03] 0.00 1 2.51 – – [0.01] 0.00 [0.01] 0.00 1 2.23 0.06—12.4436 Printers 12 2.12 13 0.90 1 2.87 5 0.56 16 0.86 47 0.98 0.72—1.3037 Chemical process workers 7 0.77 10 1.29 [0.16] 0.00 5 0.62 20 1.31 42 1.04 0.75—1.4138 Food workers 44 1.00 30 0.73 8 0.97 52 0.96 59 1.23 193 0.99 0.86—1.1439 Beverage workers 6 1.41 1 0.42 [0.02] 0.00 2 4.66 2 0.65 11 1.08 0.54—1.9340 Tobacco workers 5 0.86 3 2.26 – – 3 1.54 1 0.57 12 1.11 0.57—1.9441 Glass makers etc 11 1.04 23 0.83 1 4.76 19 1.11 41 1.02 95 0.99 0.80—1.2142 Packers 3 0.98 54 1.09 [0.84] 0.00 42 1.00 63 1.03 162 1.04 0.89—1.2143 Engine operators [0.08] 0.00 4 0.52 [0.01] 0.00 [0.45] 0.00 1 0.32 5 0.44 0.14—1.0344 Public safety workers [0.38] 0.00 1 0.57 [0.16] 0.00 7 1.33 5 1.24 13 1.12 0.60—1.9245 Cooks and stewards [0.12] 0.00 63 1.13 4 1.27 73 1.16 104 1.09 244 1.12 0.99—1.2746 Domestic assistants 58 0.84 61 1.10 3 3.17 168 1.05 224 0.99 514 1.01 0.92—1.1047 Waiters 11 0.94 47 1.06 1 2.86 59 0.93 89 0.92 207 0.96 0.84—1.1048 Building caretakers 209 1.04 207 1.06 4 0.62 272 1.01 234 0.97 926 1.01 0.95—1.0849 Chimney sweeps [0.02] 0.00 [0.09] 0.00 – – [0.04] 0.00 [0.00] 0.00 [0.15] 0.00 0.00—23.9350 Hairdressers 10 0.87 12 0.72 [0.29] 0.00 14 0.89 28 0.76 64 0.79 0.61—1.0151 Launderers 14 0.62 16 0.98 [1.06] 0.00 27 1.08 53 1.02 110 0.94 0.78—1.1352 Military personnel [0.12] 0.00 [0.11] 0.00 – – [0.06] 0.00 [0.10] 0.00 [0.39] 0.00 0.00—9.5653 "Other workers" 54 0.95 69 1.19 9 1.43 122 0.90 120 1.13 374 1.03 0.93—1.1454 Economically inactive 1602 1.03 1383 0.98 16 0.74 1926 0.98 5186 1.00 10113 1.00 0.98—1.02
1-54 All categories 2955 1.00 3552 1.00 90 1.00 4359 1.00 8552 1.00 19508 1.00 # REF. #
Obs = observed number of cases; SIR = standardised incidence ratio; 95% CI = 95% confidence interval
129 Index Prev Next

Acta Oncologica - Pukkala et al, 2008 Leukaemia
Observed number of leukaemia among men in the Nordic countries and standardised incidence ratios 1961-2005, by country andoccupational category
Denmark Finland Iceland Norway Sweden Total
No Occupational category Obs SIR Obs SIR Obs SIR Obs SIR Obs SIR Obs SIR 95% CI
1 Technical workers, etc 449 0.95 317 0.98 4 0.87 243 0.98 1397 0.99 2410 0.98 0.94—1.022 Laboratory assistants 14 1.47 6 0.75 [0.83] 0.00 12 0.98 3 0.40 35 0.92 0.64—1.283 Physicians 27 0.68 16 0.86 3 1.73 41 1.20 61 0.94 148 0.93 0.79—1.094 Dentists 14 1.23 6 1.49 [0.46] 0.00 23 1.50 31 0.98 74 1.18 0.92—1.485 Nurses [0.52] 0.00 [1.07] 0.00 [0.01] 0.00 1 0.71 1 0.23 2 0.28 0.03—0.996 Assistant nurses 6 0.53 2 2.10 [0.22] 0.00 8 1.36 18 0.77 34 0.82 0.57—1.147 "Other health workers" 36 1.05 13 0.71 [0.46] 0.00 15 1.14 54 0.99 118 0.98 0.82—1.178 Teachers 233 1.13 122 0.92 7 1.08 179 0.96 374 1.02 915 1.02 0.95—1.089 Religious workers etc 95 1.06 90 1.21 6 1.42 99 1.01 300 1.05 590 1.07 0.99—1.1610 Artistic workers 28 1.01 30 1.14 [1.14] 0.00 34 1.21 83 0.97 175 1.04 0.89—1.2011 Journalists 14 1.08 15 1.18 [0.64] 0.00 13 1.06 39 0.98 81 1.03 0.82—1.2812 Administrators 564 1.04 220 1.06 15 1.45 366 1.06 523 0.98 1688 1.03 0.98—1.0813 Clerical workers 237 1.00 160 1.16 15 1.28 299 1.18 592 1.03 1303 1.07 1.01—1.1314 Sales agents 140 1.13 215 1.11 6 1.02 347 1.15 899 1.07 1607 1.10 1.05—1.1515 Shop workers 559 1.02 77 0.95 6 1.41 107 0.95 239 0.89 988 0.97 0.91—1.0416 Farmers 1005 0.94 1021 1.03 15 0.88 910 1.03 1419 1.01 4370 1.00 0.97—1.0317 Gardeners 157 1.04 126 0.93 [0.56] 0.00 204 0.97 505 0.97 992 0.97 0.91—1.0418 Fishermen 35 0.70 15 1.16 8 0.76 215 0.80 39 0.70 312 0.78 0.70—0.8819 Forestry workers 19 0.85 149 0.95 [0.09] 0.00 157 0.99 324 0.86 649 0.91 0.84—0.9820 Miners and quarry workers 5 0.73 36 1.43 [0.17] 0.00 33 0.77 97 1.04 171 1.02 0.87—1.1821 Seamen 39 0.74 38 1.13 2 0.71 176 0.84 88 1.07 343 0.90 0.81—1.0022 Transport workers 119 1.01 112 1.12 7 1.29 121 1.09 274 0.97 633 1.03 0.95—1.1123 Drivers 394 1.03 321 1.02 9 1.12 314 1.03 743 1.07 1781 1.05 1.00—1.1024 Postal workers 76 1.04 43 0.88 [1.00] 0.00 55 0.91 146 0.95 320 0.95 0.85—1.0625 Textile workers 72 1.05 33 1.00 2 1.14 58 0.87 162 0.97 327 0.97 0.87—1.0826 Shoe and leather workers 13 0.76 9 0.62 [0.37] 0.00 27 0.94 68 1.04 117 0.93 0.78—1.1127 Smelting workers 147 0.98 50 1.01 2 0.82 83 0.94 256 0.97 538 0.97 0.89—1.0528 Mechanics 383 0.94 300 0.95 5 0.62 401 0.95 1261 1.00 2350 0.97 0.94—1.0229 Plumbers 38 1.05 49 0.94 [1.29] 0.00 49 1.02 131 0.90 267 0.95 0.84—1.0730 Welders – – 59 1.21 [0.49] 0.00 49 0.93 186 1.11 294 1.09 0.97—1.2331 Electrical workers 104 1.10 131 0.99 5 1.04 197 1.06 439 1.00 876 1.02 0.96—1.0932 Wood workers 258 0.91 337 0.98 4 0.89 466 0.93 833 1.00 1898 0.96 0.92—1.0133 Painters 83 0.90 78 1.09 1 0.57 85 1.01 228 0.94 475 0.97 0.88—1.0634 "Other construction workers" 367 1.02 205 0.92 7 0.76 96 0.98 451 1.01 1126 0.99 0.93—1.0535 Bricklayers 106 1.04 35 0.98 – – 49 0.99 103 0.95 293 0.99 0.88—1.1136 Printers 57 0.89 20 0.63 1 0.67 50 1.00 139 1.05 267 0.96 0.85—1.0837 Chemical process workers 48 0.79 49 0.92 1 1.23 130 1.15 219 1.10 447 1.05 0.95—1.1538 Food workers 210 1.08 40 1.03 9 1.30 137 1.08 204 1.00 600 1.05 0.97—1.1439 Beverage workers 28 1.16 2 0.76 1 8.09 1 0.80 12 1.07 44 1.12 0.81—1.5040 Tobacco workers 5 1.25 [0.46] 0.00 [0.01] 0.00 4 2.02 [0.91] 0.00 9 1.22 0.56—2.3241 Glass makers etc 115 0.99 31 0.55 2 1.58 59 0.97 233 1.05 440 0.97 0.88—1.0642 Packers 101 0.97 107 0.91 6 1.52 182 0.95 383 0.97 779 0.96 0.89—1.0343 Engine operators 108 1.05 146 0.95 8 1.44 114 1.08 356 1.05 732 1.04 0.96—1.1144 Public safety workers 101 1.05 107 1.18 5 1.28 101 1.24 209 1.04 523 1.11 1.02—1.2145 Cooks and stewards 6 0.80 5 0.88 3 1.61 28 0.79 39 1.07 81 0.93 0.74—1.1646 Domestic assistants [0.08] 0.00 [0.42] 0.00 [0.01] 0.00 [0.29] 0.00 4 1.12 4 0.91 0.25—2.3447 Waiters 18 1.12 6 1.10 [0.20] 0.00 21 1.37 21 1.13 66 1.19 0.92—1.5148 Building caretakers 111 1.07 85 1.08 1 0.61 40 0.94 166 1.06 403 1.05 0.95—1.1649 Chimney sweeps 1 0.38 7 1.24 – – 5 1.19 11 0.97 24 1.01 0.65—1.5050 Hairdressers 25 0.84 1 0.61 [0.27] 0.00 13 1.06 33 0.84 72 0.86 0.68—1.0951 Launderers 7 0.48 1 0.61 1 6.38 6 0.82 22 0.78 37 0.71 0.50—0.9952 Military personnel 51 1.06 35 1.25 – – 63 0.97 131 1.10 280 1.08 0.96—1.2153 "Other workers" 360 1.14 89 0.96 10 0.65 364 0.98 465 0.97 1288 1.01 0.96—1.0754 Economically inactive 349 1.07 522 0.96 11 0.99 183 0.90 721 0.98 1786 0.98 0.94—1.03
1-54 All categories 7537 1.00 5689 1.00 188 1.00 7033 1.00 15735 1.00 36182 1.00 # REF. #
Obs = observed number of cases; SIR = standardised incidence ratio; 95% CI = 95% confidence interval
130 Index Prev Next

Acta Oncologica - Pukkala et al, 2008 Leukaemia
Observed number of leukaemia among women in the Nordic countries and standardised incidence ratios 1961-2005, by country andoccupational category
Denmark Finland Iceland Norway Sweden Total
No Occupational category Obs SIR Obs SIR Obs SIR Obs SIR Obs SIR Obs SIR 95% CI
1 Technical workers, etc 12 0.71 24 0.99 [0.45] 0.00 5 0.79 53 1.04 94 0.95 0.77—1.162 Laboratory assistants 9 0.77 26 1.89 1 1.52 6 0.73 12 0.84 54 1.11 0.83—1.453 Physicians 4 0.71 3 0.51 [0.12] 0.00 6 1.72 16 1.37 29 1.08 0.72—1.554 Dentists 4 0.80 6 0.86 [0.04] 0.00 2 0.65 7 0.77 19 0.79 0.47—1.235 Nurses 105 1.05 53 0.76 4 1.33 59 0.94 156 1.02 377 0.97 0.88—1.076 Assistant nurses 79 1.12 73 0.99 3 0.71 58 0.94 283 1.05 496 1.04 0.95—1.137 "Other health workers" 64 1.12 72 1.24 1 1.10 51 0.79 94 1.04 282 1.04 0.93—1.178 Teachers 128 1.04 153 1.16 5 0.89 125 1.00 331 0.96 742 1.02 0.95—1.099 Religious workers etc 25 1.49 57 0.94 2 2.36 29 0.95 126 1.09 239 1.07 0.94—1.2110 Artistic workers 7 0.78 10 0.95 [0.65] 0.00 7 0.72 26 1.18 50 0.96 0.72—1.2711 Journalists [1.86] 0.00 12 1.76 [0.16] 0.00 [2.44] 0.00 10 0.98 22 1.02 0.64—1.5512 Administrators 51 0.96 25 1.09 1 2.07 25 0.78 48 0.95 150 0.94 0.80—1.1113 Clerical workers 492 0.98 422 1.00 19 1.18 389 0.98 913 1.08 2235 1.03 0.98—1.0714 Sales agents 3 0.64 60 0.90 3 1.74 74 1.18 121 1.01 261 1.02 0.90—1.1515 Shop workers 347 0.99 240 1.02 11 1.09 323 0.95 535 1.03 1456 1.00 0.95—1.0516 Farmers 238 0.98 170 1.03 5 0.66 251 1.01 40 0.84 704 0.99 0.92—1.0617 Gardeners 46 1.45 447 0.99 1 3.70 155 1.06 141 1.04 790 1.03 0.96—1.1118 Fishermen 3 2.44 [0.95] 0.00 [0.27] 0.00 2 1.19 1 2.23 6 1.31 0.48—2.8519 Forestry workers 1 3.11 2 1.10 [0.03] 0.00 1 0.40 2 0.68 6 0.79 0.29—1.7120 Miners and quarry workers [0.02] 0.00 1 1.22 [0.01] 0.00 [0.12] 0.00 [0.70] 0.00 1 0.60 0.02—3.3221 Seamen – – [0.21] 0.00 [0.00] 0.00 1 2.56 [0.09] 0.00 1 1.46 0.04—8.1122 Transport workers [0.35] 0.00 14 1.16 1 3.39 2 1.13 4 0.47 21 0.92 0.57—1.4023 Drivers 12 1.39 3 0.58 [0.12] 0.00 5 0.75 27 1.33 47 1.15 0.84—1.5324 Postal workers 18 0.98 62 0.86 2 0.62 67 0.84 160 1.08 309 0.96 0.86—1.0825 Textile workers 120 1.03 146 0.89 8 1.21 114 0.83 273 0.90 661 0.91 0.84—0.9826 Shoe and leather workers 8 0.94 20 0.99 [0.38] 0.00 13 1.34 17 0.73 58 0.94 0.71—1.2127 Smelting workers [2.09] 0.00 3 0.63 [0.01] 0.00 1 1.12 4 0.64 8 0.57 0.25—1.1328 Mechanics 20 0.99 16 0.77 [0.05] 0.00 11 1.00 63 1.00 110 0.96 0.79—1.1529 Plumbers 2 9.22 [0.04] 0.00 – – [0.07] 0.00 [0.09] 0.00 2 4.71 0.57—17.0230 Welders – – [1.53] 0.00 [0.01] 0.00 1 1.43 4 1.66 5 1.08 0.35—2.5231 Electrical workers 33 1.17 15 1.18 1 17.04 11 0.95 39 1.10 99 1.13 0.92—1.3732 Wood workers 9 0.95 38 0.91 [0.11] 0.00 2 0.54 12 1.14 61 0.93 0.71—1.1933 Painters [0.37] 0.00 4 0.82 [0.03] 0.00 [0.86] 0.00 2 0.70 6 0.67 0.25—1.4634 "Other construction workers" [0.29] 0.00 15 0.86 [0.02] 0.00 [0.34] 0.00 [0.36] 0.00 15 0.81 0.45—1.3435 Bricklayers [0.06] 0.00 [0.56] 0.00 – – [0.02] 0.00 [0.01] 0.00 [0.65] 0.00 0.00—5.7136 Printers 4 0.37 17 0.83 [0.55] 0.00 12 1.08 28 1.06 61 0.88 0.67—1.1337 Chemical process workers 19 1.10 15 1.40 [0.23] 0.00 8 0.81 25 1.19 67 1.13 0.88—1.4438 Food workers 81 0.97 62 1.11 17 1.28 52 0.80 58 0.92 270 0.96 0.85—1.0839 Beverage workers 9 1.11 2 0.62 [0.03] 0.00 [0.51] 0.00 6 1.51 17 1.08 0.63—1.7240 Tobacco workers 18 1.63 1 0.56 – – 2 0.84 2 0.81 23 1.30 0.82—1.9541 Glass makers etc 18 0.89 39 1.01 [0.38] 0.00 21 1.01 57 1.02 135 0.99 0.84—1.1742 Packers 4 0.68 88 1.29 3 2.32 49 0.98 89 1.06 233 1.11 0.98—1.2643 Engine operators [0.15] 0.00 9 0.83 [0.02] 0.00 1 1.67 5 0.95 15 0.89 0.50—1.4644 Public safety workers [0.71] 0.00 4 1.55 [0.28] 0.00 8 1.27 3 0.42 15 0.88 0.49—1.4545 Cooks and stewards [0.23] 0.00 85 1.08 7 1.37 76 1.00 128 1.04 296 1.05 0.93—1.1746 Domestic assistants 121 0.92 70 0.86 1 0.66 203 1.04 326 1.00 721 0.98 0.91—1.0647 Waiters 22 0.99 59 0.93 [0.53] 0.00 72 0.94 109 0.86 262 0.90 0.80—1.0248 Building caretakers 369 0.96 266 0.98 7 0.69 347 1.08 342 1.04 1331 1.01 0.96—1.0749 Chimney sweeps [0.04] 0.00 [0.13] 0.00 – – [0.04] 0.00 [0.01] 0.00 [0.22] 0.00 0.00—16.8850 Hairdressers 19 0.84 18 0.74 [0.60] 0.00 19 0.96 48 0.89 104 0.86 0.71—1.0451 Launderers 48 1.11 16 0.73 [1.65] 0.00 23 0.77 80 1.21 167 1.03 0.88—1.1952 Military personnel [0.22] 0.00 [0.20] 0.00 – – [0.08] 0.00 [0.22] 0.00 [0.72] 0.00 0.00—5.1253 "Other workers" 107 0.99 82 1.00 7 0.69 159 0.96 156 1.06 511 0.99 0.91—1.0854 Economically inactive 2992 1.00 1957 1.01 37 1.00 2572 1.03 6614 0.98 14172 1.00 0.98—1.02
1-54 All categories 5671 1.00 4982 1.00 147 1.00 5420 1.00 11596 1.00 27816 1.00 # REF. #
Obs = observed number of cases; SIR = standardised incidence ratio; 95% CI = 95% confidence interval
131 Index Prev Next

Acta Oncologica - Pukkala et al, 2008 Chronic lymphatic leukaemia
Observed number of chronic lymphatic leukaemia among men in the Nordic countries and standardised incidence ratios 1961-2005,by country and occupational category
Denmark Finland Iceland Norway Sweden Total
No Occupational category Obs SIR Obs SIR Obs SIR Obs SIR Obs SIR Obs SIR 95% CI
1 Technical workers, etc – – 131 1.00 3 2.05 92 1.02 635 0.96 861 0.98 0.91—1.042 Laboratory assistants – – [3.16] 0.00 [0.25] 0.00 6 1.36 1 0.30 7 0.63 0.25—1.293 Physicians – – 3 0.40 1 1.75 10 0.80 38 1.27 52 1.03 0.77—1.354 Dentists – – 1 0.60 [0.15] 0.00 6 1.07 15 1.02 22 1.00 0.62—1.515 Nurses – – [0.34] 0.00 [0.00] 0.00 [0.45] 0.00 1 0.64 1 0.43 0.01—2.376 Assistant nurses – – 2 7.21 [0.06] 0.00 4 1.87 9 0.90 15 1.20 0.67—1.987 "Other health workers" – – 4 0.52 [0.15] 0.00 3 0.63 15 0.61 22 0.59 0.37—0.898 Teachers – – 54 0.98 3 1.43 72 1.06 188 1.10 317 1.07 0.96—1.209 Religious workers etc – – 32 1.08 3 2.14 36 1.02 136 1.06 207 1.07 0.93—1.2210 Artistic workers – – 15 1.38 [0.37] 0.00 13 1.27 42 1.06 70 1.14 0.89—1.4511 Journalists – – 6 1.13 [0.21] 0.00 4 0.91 17 0.93 27 0.96 0.63—1.4012 Administrators – – 89 1.01 6 1.62 131 1.04 246 0.99 472 1.01 0.93—1.1113 Clerical workers – – 78 1.31 4 0.96 106 1.14 273 1.02 461 1.09 0.99—1.1914 Sales agents – – 93 1.13 2 0.96 115 1.05 396 1.02 606 1.04 0.96—1.1315 Shop workers – – 27 0.82 2 1.37 42 1.03 116 0.92 187 0.93 0.80—1.0716 Farmers – – 477 1.04 8 1.28 401 1.23 667 1.04 1553 1.09 1.03—1.1417 Gardeners – – 66 1.11 [0.21] 0.00 82 1.06 228 0.95 376 1.00 0.90—1.1018 Fishermen – – 5 0.85 3 0.95 84 0.85 19 0.75 111 0.83 0.69—1.0119 Forestry workers – – 63 0.92 [0.03] 0.00 75 1.28 147 0.85 285 0.95 0.84—1.0620 Miners and quarry workers – – 16 1.47 [0.05] 0.00 11 0.71 41 0.95 68 0.98 0.76—1.2421 Seamen – – 13 0.90 [0.92] 0.00 51 0.67 39 1.02 103 0.80 0.66—0.9622 Transport workers – – 59 1.35 [1.94] 0.00 43 1.05 130 0.96 232 1.04 0.92—1.1923 Drivers – – 128 0.97 4 1.50 113 1.03 338 1.05 583 1.03 0.95—1.1224 Postal workers – – 21 1.01 [0.36] 0.00 24 1.10 73 1.04 118 1.05 0.87—1.2525 Textile workers – – 15 1.03 [0.64] 0.00 17 0.69 74 0.97 106 0.91 0.75—1.1026 Shoe and leather workers – – 5 0.77 [0.14] 0.00 4 0.38 28 0.95 37 0.80 0.56—1.1027 Smelting workers – – 22 1.01 [0.84] 0.00 27 0.84 116 0.95 165 0.94 0.80—1.0928 Mechanics – – 130 0.99 1 0.39 145 0.95 583 0.99 859 0.98 0.92—1.0529 Plumbers – – 20 0.93 [0.43] 0.00 12 0.69 65 0.96 97 0.91 0.74—1.1130 Welders – – 15 0.78 [0.15] 0.00 11 0.57 89 1.14 115 0.98 0.82—1.1831 Electrical workers – – 48 0.89 2 1.37 66 0.98 208 1.02 324 0.99 0.89—1.1132 Wood workers – – 150 0.98 1 0.64 164 0.88 403 1.06 718 1.00 0.93—1.0733 Painters – – 35 1.13 1 1.68 32 1.04 107 0.96 175 1.01 0.87—1.1734 "Other construction workers" – – 88 0.90 3 1.01 39 1.10 199 0.98 329 0.97 0.87—1.0835 Bricklayers – – 14 0.88 – – 9 0.49 52 1.05 75 0.90 0.70—1.1236 Printers – – 12 0.93 [0.49] 0.00 19 1.05 66 1.08 97 1.05 0.85—1.2837 Chemical process workers – – 18 0.80 1 3.51 40 0.97 91 1.01 150 0.97 0.83—1.1438 Food workers – – 11 0.67 2 0.81 46 0.99 84 0.89 143 0.90 0.76—1.0639 Beverage workers – – 2 1.73 [0.05] 0.00 [0.44] 0.00 4 0.80 6 0.90 0.33—1.9640 Tobacco workers – – [0.20] 0.00 [0.00] 0.00 3 4.20 [0.42] 0.00 3 2.25 0.46—6.5641 Glass makers etc – – 16 0.67 1 2.27 22 1.00 99 0.97 138 0.93 0.79—1.1042 Packers – – 49 0.96 3 2.13 59 0.85 168 0.94 279 0.93 0.82—1.0443 Engine operators – – 62 0.96 1 0.55 37 0.98 171 1.10 271 1.04 0.93—1.1744 Public safety workers – – 42 1.09 1 0.73 37 1.25 97 1.05 177 1.09 0.94—1.2745 Cooks and stewards – – 2 0.92 2 3.39 7 0.55 18 1.11 29 0.92 0.61—1.3146 Domestic assistants – – [0.19] 0.00 [0.00] 0.00 [0.10] 0.00 3 2.25 3 1.84 0.38—5.3947 Waiters – – [2.03] 0.00 [0.06] 0.00 6 1.09 7 0.83 13 0.81 0.43—1.3848 Building caretakers – – 38 1.11 [0.64] 0.00 11 0.72 73 1.06 122 1.02 0.86—1.2249 Chimney sweeps – – 3 1.21 – – 3 1.96 5 0.96 11 1.19 0.60—2.1450 Hairdressers – – [0.70] 0.00 [0.09] 0.00 5 1.13 15 0.82 20 0.85 0.52—1.3151 Launderers – – [0.70] 0.00 [0.06] 0.00 3 1.13 12 0.91 15 0.90 0.50—1.4952 Military personnel – – 17 1.53 – – 20 0.84 63 1.12 100 1.09 0.90—1.3353 "Other workers" – – 36 0.89 3 0.56 132 0.98 246 1.13 417 1.05 0.95—1.1554 Economically inactive – – 233 0.95 3 0.81 63 0.89 268 0.86 567 0.90 0.83—0.98
1-54 All categories – – 2466 1.00 64 1.00 2563 1.00 7224 1.00 12317 1.00 # REF. #
Obs = observed number of cases; SIR = standardised incidence ratio; 95% CI = 95% confidence interval
132 Index Prev Next

Acta Oncologica - Pukkala et al, 2008 Chronic lymphatic leukaemia
Observed number of chronic lymphatic leukaemia among women in the Nordic countries and standardised incidence ratios 1961-2005,by country and occupational category
Denmark Finland Iceland Norway Sweden Total
No Occupational category Obs SIR Obs SIR Obs SIR Obs SIR Obs SIR Obs SIR 95% CI
1 Technical workers, etc – – 7 0.95 [0.11] 0.00 [1.90] 0.00 21 1.13 28 1.00 0.67—1.452 Laboratory assistants – – 7 1.62 1 5.71 [2.61] 0.00 2 0.45 10 0.87 0.42—1.603 Physicians – – [1.73] 0.00 [0.04] 0.00 2 1.86 7 1.72 9 1.30 0.60—2.474 Dentists – – [2.45] 0.00 [0.01] 0.00 [0.96] 0.00 2 0.59 2 0.29 0.04—1.065 Nurses – – 15 0.69 1 1.12 16 0.78 66 1.16 98 0.98 0.80—1.206 Assistant nurses – – 26 1.07 1 0.80 24 1.16 90 0.93 141 0.99 0.84—1.167 "Other health workers" – – 24 1.30 1 4.08 17 0.81 36 1.11 78 1.08 0.85—1.358 Teachers – – 45 1.04 1 0.63 44 1.12 121 0.96 211 1.00 0.88—1.159 Religious workers etc – – 21 1.20 [0.25] 0.00 13 1.33 47 1.18 81 1.20 0.96—1.5010 Artistic workers – – 4 1.21 [0.20] 0.00 1 0.32 8 1.00 13 0.89 0.47—1.5211 Journalists – – 2 0.91 [0.05] 0.00 [0.77] 0.00 3 0.82 5 0.75 0.24—1.7412 Administrators – – 10 1.36 [0.17] 0.00 11 1.06 20 1.10 41 1.14 0.81—1.5413 Clerical workers – – 146 1.07 7 1.47 115 0.89 357 1.13 625 1.06 0.98—1.1514 Sales agents – – 24 1.03 1 1.76 27 1.30 39 0.86 91 1.01 0.81—1.2415 Shop workers – – 83 1.04 4 1.24 121 1.04 216 1.05 424 1.04 0.95—1.1516 Farmers – – 72 1.13 4 1.52 102 1.17 15 0.85 193 1.13 0.98—1.3017 Gardeners – – 153 0.91 [0.09] 0.00 61 1.18 47 0.87 261 0.96 0.85—1.0818 Fishermen – – [0.34] 0.00 [0.08] 0.00 [0.58] 0.00 [0.17] 0.00 [1.17] 0.00 0.00—3.1619 Forestry workers – – 1 1.58 [0.01] 0.00 [0.91] 0.00 1 0.88 2 0.74 0.09—2.6820 Miners and quarry workers – – [0.31] 0.00 [0.00] 0.00 [0.04] 0.00 [0.27] 0.00 [0.61] 0.00 0.00—6.0021 Seamen – – [0.06] 0.00 – – [0.13] 0.00 [0.03] 0.00 [0.22] 0.00 0.00—17.1622 Transport workers – – 5 1.15 1 10.13 [0.56] 0.00 2 0.64 8 0.98 0.43—1.9423 Drivers – – [1.69] 0.00 [0.04] 0.00 2 0.91 9 1.22 11 0.97 0.48—1.7424 Postal workers – – 19 0.76 2 1.80 9 0.34 60 1.05 90 0.82 0.66—1.0125 Textile workers – – 48 0.82 3 1.27 47 1.03 103 0.85 201 0.88 0.77—1.0126 Shoe and leather workers – – 9 1.27 [0.13] 0.00 2 0.62 2 0.21 13 0.66 0.35—1.1227 Smelting workers – – 1 0.60 [0.00] 0.00 1 3.41 [2.36] 0.00 2 0.46 0.06—1.6728 Mechanics – – 5 0.71 [0.02] 0.00 5 1.37 23 0.96 33 0.95 0.66—1.3429 Plumbers – – [0.01] 0.00 – – [0.02] 0.00 [0.03] 0.00 [0.07] 0.00 0.00—56.5230 Welders – – [0.49] 0.00 [0.00] 0.00 1 4.56 1 1.19 2 1.29 0.16—4.6831 Electrical workers – – 7 1.77 1 54.12 4 1.05 13 0.98 25 1.19 0.77—1.7532 Wood workers – – 19 1.26 [0.04] 0.00 1 0.79 1 0.26 21 1.04 0.64—1.5933 Painters – – 1 0.60 [0.01] 0.00 [0.29] 0.00 1 0.94 2 0.66 0.08—2.3734 "Other construction workers" – – 4 0.62 [0.00] 0.00 [0.12] 0.00 [0.12] 0.00 4 0.60 0.16—1.5335 Bricklayers – – [0.20] 0.00 – – [0.01] 0.00 [0.00] 0.00 [0.21] 0.00 0.00—17.7636 Printers – – 9 1.28 [0.17] 0.00 2 0.55 11 1.09 22 1.05 0.66—1.5937 Chemical process workers – – 5 1.31 [0.08] 0.00 2 0.61 14 1.71 21 1.37 0.85—2.0938 Food workers – – 18 0.90 7 1.60 21 0.95 24 0.97 70 0.98 0.76—1.2439 Beverage workers – – 2 1.71 [0.01] 0.00 [0.18] 0.00 3 1.91 5 1.71 0.55—3.9940 Tobacco workers – – 1 1.54 – – [0.76] 0.00 [0.98] 0.00 1 0.42 0.01—2.3341 Glass makers etc – – 14 1.03 [0.12] 0.00 6 0.87 26 1.19 46 1.08 0.79—1.4442 Packers – – 29 1.20 [0.45] 0.00 15 0.88 36 1.10 80 1.08 0.85—1.3443 Engine operators – – 5 1.34 [0.01] 0.00 1 5.29 2 1.06 8 1.37 0.59—2.7044 Public safety workers – – 1 1.13 [0.09] 0.00 2 0.89 2 0.86 5 0.90 0.29—2.1045 Cooks and stewards – – 26 0.94 2 1.13 20 0.77 61 1.27 109 1.05 0.87—1.2746 Domestic assistants – – 25 0.89 [0.54] 0.00 64 0.98 130 1.09 219 1.03 0.90—1.1747 Waiters – – 17 0.79 [0.18] 0.00 31 1.19 52 1.03 100 1.02 0.84—1.2448 Building caretakers – – 93 0.95 1 0.28 105 0.95 119 0.94 318 0.94 0.84—1.0549 Chimney sweeps – – [0.04] 0.00 – – [0.02] 0.00 [0.00] 0.00 [0.06] 0.00 0.00—59.8250 Hairdressers – – 8 0.96 [0.16] 0.00 6 0.94 17 0.82 31 0.87 0.59—1.2451 Launderers – – 6 0.74 [0.60] 0.00 8 0.79 32 1.21 46 1.02 0.74—1.3652 Military personnel – – [0.05] 0.00 – – [0.02] 0.00 [0.06] 0.00 [0.14] 0.00 0.00—25.6553 "Other workers" – – 22 0.77 1 0.30 51 0.90 53 0.94 127 0.88 0.74—1.0454 Economically inactive – – 759 1.02 9 0.73 811 1.03 2633 0.98 4212 1.00 0.97—1.03
1-54 All categories – – 1798 1.00 48 1.00 1771 1.00 4528 1.00 8145 1.00 # REF. #
Obs = observed number of cases; SIR = standardised incidence ratio; 95% CI = 95% confidence interval
133 Index Prev Next

Acta Oncologica - Pukkala et al, 2008 Acute myeloid leukaemia
Observed number of acute myeloid leukaemia among men in the Nordic countries and standardised incidence ratios 1961-2005, bycountry and occupational category
Denmark Finland Iceland Norway Sweden Total
No Occupational category Obs SIR Obs SIR Obs SIR Obs SIR Obs SIR Obs SIR 95% CI
1 Technical workers, etc 121 0.90 85 0.94 [1.55] 0.00 87 0.96 334 1.04 627 0.98 0.91—1.062 Laboratory assistants 3 1.10 5 2.23 [0.30] 0.00 3 0.68 1 0.53 12 1.04 0.54—1.813 Physicians 13 1.17 8 1.54 1 1.72 18 1.45 9 0.60 49 1.11 0.82—1.474 Dentists 3 0.94 2 1.80 [0.14] 0.00 9 1.62 5 0.70 19 1.11 0.67—1.735 Nurses [0.15] 0.00 [0.30] 0.00 [0.01] 0.00 1 1.89 [1.07] 0.00 1 0.49 0.01—2.716 Assistant nurses 1 0.31 [0.28] 0.00 [0.08] 0.00 2 0.95 3 0.57 6 0.55 0.20—1.197 "Other health workers" 10 1.02 3 0.59 [0.16] 0.00 6 1.26 13 1.06 32 1.00 0.68—1.418 Teachers 73 1.25 37 1.00 2 0.91 59 0.87 80 0.95 251 1.00 0.89—1.149 Religious workers etc 22 0.88 33 1.59 1 0.70 41 1.16 74 1.14 171 1.16 1.00—1.3410 Artistic workers 8 1.02 7 0.95 [0.38] 0.00 7 0.69 21 1.08 43 0.95 0.69—1.2811 Journalists 4 1.09 3 0.85 [0.22] 0.00 4 0.90 10 1.12 21 1.01 0.62—1.5412 Administrators 151 0.99 67 1.17 4 1.23 144 1.17 115 0.99 481 1.06 0.97—1.1613 Clerical workers 72 1.07 30 0.79 7 1.87 110 1.21 142 1.12 361 1.10 1.00—1.2214 Sales agents 42 1.19 55 1.02 1 0.53 121 1.12 207 1.12 426 1.11 1.01—1.2215 Shop workers 161 1.03 17 0.74 4 2.95 37 0.91 61 1.00 280 0.99 0.88—1.1216 Farmers 310 1.04 280 1.05 4 0.75 280 0.89 272 0.96 1146 0.98 0.93—1.0417 Gardeners 38 0.89 27 0.72 [0.17] 0.00 69 0.92 99 0.91 233 0.88 0.78—1.0118 Fishermen 8 0.56 4 1.14 3 0.83 84 0.88 9 0.79 108 0.84 0.70—1.0119 Forestry workers 7 1.11 41 0.94 [0.03] 0.00 43 0.76 66 0.84 157 0.85 0.73—0.9920 Miners and quarry workers 3 1.53 11 1.57 [0.06] 0.00 13 0.85 18 0.90 45 1.02 0.74—1.3621 Seamen 11 0.71 14 1.50 1 1.08 56 0.74 12 0.67 94 0.79 0.64—0.9622 Transport workers 30 0.89 32 1.17 1 0.58 46 1.16 61 0.95 170 1.02 0.88—1.1923 Drivers 119 1.08 104 1.18 3 1.13 118 1.08 198 1.27 542 1.16 1.07—1.2724 Postal workers 22 1.05 11 0.81 [0.33] 0.00 14 0.65 30 0.90 77 0.86 0.68—1.0725 Textile workers 22 1.12 12 1.33 1 1.82 23 0.97 34 0.98 92 1.05 0.85—1.2926 Shoe and leather workers 2 0.41 1 0.25 [0.11] 0.00 10 0.99 15 1.17 28 0.88 0.58—1.2727 Smelting workers 44 1.01 12 0.88 2 2.52 25 0.79 54 0.96 137 0.94 0.80—1.1128 Mechanics 125 1.07 77 0.88 1 0.38 138 0.91 285 1.01 626 0.98 0.90—1.0629 Plumbers 14 1.35 15 1.03 [0.42] 0.00 19 1.10 26 0.80 74 0.99 0.77—1.2430 Welders – – 21 1.51 [0.17] 0.00 25 1.30 43 1.11 89 1.23 0.99—1.5231 Electrical workers 26 0.95 34 0.92 1 0.61 77 1.15 108 1.08 246 1.06 0.93—1.2032 Wood workers 76 0.95 99 1.05 2 1.41 174 0.97 172 0.98 523 0.98 0.90—1.0733 Painters 16 0.61 22 1.11 [0.58] 0.00 39 1.30 49 0.94 126 0.98 0.82—1.1634 "Other construction workers" 103 1.00 54 0.88 2 0.66 33 0.94 101 1.08 293 0.99 0.88—1.1135 Bricklayers 27 0.93 9 0.92 – – 16 0.90 17 0.74 69 0.87 0.67—1.1036 Printers 14 0.76 3 0.34 [0.51] 0.00 15 0.83 26 0.89 58 0.77 0.59—1.0037 Chemical process workers 15 0.85 16 1.08 [0.26] 0.00 53 1.32 44 1.06 128 1.12 0.94—1.3338 Food workers 55 0.98 15 1.39 2 0.92 59 1.30 49 1.12 180 1.14 0.98—1.3239 Beverage workers 10 1.42 [0.73] 0.00 1 27.78 [0.47] 0.00 2 0.89 13 1.23 0.66—2.1140 Tobacco workers 2 1.75 [0.13] 0.00 [0.00] 0.00 [0.69] 0.00 [0.20] 0.00 2 0.92 0.11—3.3341 Glass makers etc 33 0.99 5 0.32 [0.40] 0.00 23 1.06 50 1.05 111 0.93 0.78—1.1342 Packers 30 1.00 26 0.80 [1.24] 0.00 69 1.01 77 0.94 202 0.94 0.82—1.0843 Engine operators 22 0.74 45 1.04 5 2.78 42 1.10 81 1.09 195 1.04 0.90—1.2044 Public safety workers 27 1.00 26 1.04 2 1.63 40 1.38 46 1.03 141 1.11 0.94—1.3145 Cooks and stewards 2 0.91 3 1.88 [0.63] 0.00 13 1.02 5 0.60 23 0.90 0.57—1.3546 Domestic assistants [0.02] 0.00 [0.11] 0.00 [0.00] 0.00 [0.11] 0.00 1 1.18 1 0.92 0.02—5.1247 Waiters 4 0.83 [1.53] 0.00 [0.07] 0.00 7 1.27 5 1.17 16 0.99 0.56—1.6048 Building caretakers 32 1.07 27 1.26 1 2.03 15 0.99 35 1.09 110 1.11 0.92—1.3449 Chimney sweeps [0.76] 0.00 3 1.92 – – 2 1.33 3 1.19 8 1.26 0.54—2.4850 Hairdressers 7 0.83 [0.45] 0.00 [0.09] 0.00 6 1.37 5 0.58 18 0.82 0.49—1.3051 Launderers 2 0.49 [0.45] 0.00 1 21.59 2 0.77 3 0.49 8 0.60 0.26—1.1852 Military personnel 19 1.38 13 1.64 – – 29 1.23 27 0.98 88 1.21 0.97—1.4953 "Other workers" 105 1.14 26 1.01 2 0.41 131 0.99 77 0.77 341 0.96 0.87—1.0754 Economically inactive 84 0.86 127 0.87 6 1.60 59 0.84 123 0.86 399 0.87 0.79—0.96
1-54 All categories 2150 1.00 1567 1.00 61 1.00 2516 1.00 3403 1.00 9697 1.00 # REF. #
Obs = observed number of cases; SIR = standardised incidence ratio; 95% CI = 95% confidence interval
134 Index Prev Next

Acta Oncologica - Pukkala et al, 2008 Acute myeloid leukaemia
Observed number of acute myeloid leukaemia among women in the Nordic countries and standardised incidence ratios 1961-2005, bycountry and occupational category
Denmark Finland Iceland Norway Sweden Total
No Occupational category Obs SIR Obs SIR Obs SIR Obs SIR Obs SIR Obs SIR 95% CI
1 Technical workers, etc 3 0.52 7 0.80 [0.22] 0.00 5 1.86 20 1.26 35 1.05 0.73—1.462 Laboratory assistants 6 1.44 9 1.83 [0.30] 0.00 4 1.18 5 1.04 24 1.36 0.87—2.033 Physicians 3 1.59 2 0.93 [0.05] 0.00 3 2.10 8 2.12 16 1.72 0.98—2.804 Dentists 2 1.19 3 1.26 [0.01] 0.00 [1.25] 0.00 3 1.08 8 0.99 0.43—1.945 Nurses 39 1.17 20 0.80 2 1.56 20 0.76 48 1.01 129 0.97 0.82—1.156 Assistant nurses 30 1.23 26 0.99 1 0.54 19 0.74 96 1.14 172 1.06 0.91—1.237 "Other health workers" 15 0.79 21 1.02 [0.41] 0.00 20 0.76 24 0.84 80 0.84 0.67—1.058 Teachers 35 0.84 64 1.38 3 1.24 46 0.90 107 1.02 255 1.03 0.91—1.179 Religious workers etc 5 0.88 19 0.86 1 2.75 10 0.80 36 0.98 71 0.92 0.72—1.1610 Artistic workers [2.96] 0.00 2 0.54 [0.27] 0.00 5 1.27 7 1.02 14 0.79 0.43—1.3211 Journalists [0.65] 0.00 7 2.91 [0.07] 0.00 [1.01] 0.00 5 1.56 12 1.63 0.84—2.8612 Administrators 15 0.85 7 0.87 1 5.60 8 0.62 16 1.04 47 0.87 0.64—1.1513 Clerical workers 158 0.92 132 0.89 5 0.72 183 1.12 288 1.11 766 1.02 0.95—1.1014 Sales agents 2 1.29 16 0.71 2 2.95 24 0.98 40 1.15 84 1.00 0.80—1.2415 Shop workers 124 1.06 84 1.03 6 1.45 138 1.01 156 1.01 508 1.03 0.94—1.1216 Farmers 84 1.04 41 0.78 [2.92] 0.00 97 0.98 12 0.92 234 0.94 0.83—1.0717 Gardeners 13 1.24 161 1.08 [0.11] 0.00 62 1.06 39 0.98 275 1.06 0.95—1.2018 Fishermen [0.41] 0.00 [0.32] 0.00 [0.11] 0.00 [0.68] 0.00 [0.13] 0.00 [1.66] 0.00 0.00—2.2219 Forestry workers 1 9.25 1 1.63 [0.01] 0.00 [1.02] 0.00 1 1.14 3 1.14 0.23—3.3220 Miners and quarry workers [0.01] 0.00 1 3.68 [0.00] 0.00 [0.05] 0.00 [0.22] 0.00 1 1.81 0.05—10.0921 Seamen – – [0.08] 0.00 [0.00] 0.00 1 6.28 [0.03] 0.00 1 3.75 0.09—20.9022 Transport workers [0.12] 0.00 6 1.48 [0.11] 0.00 2 2.71 1 0.38 9 1.18 0.54—2.2423 Drivers 3 1.01 1 0.55 [0.05] 0.00 3 1.11 6 0.95 13 0.93 0.50—1.6024 Postal workers 8 1.29 28 1.13 [1.25] 0.00 38 1.17 49 1.09 123 1.13 0.94—1.3425 Textile workers 29 0.73 53 0.95 2 0.80 40 0.74 74 0.86 198 0.83 0.72—0.9626 Shoe and leather workers 3 1.02 6 0.87 [0.15] 0.00 5 1.30 6 0.90 20 0.98 0.60—1.5127 Smelting workers [0.72] 0.00 [1.62] 0.00 [0.00] 0.00 [0.38] 0.00 2 1.02 2 0.43 0.05—1.5428 Mechanics 3 0.42 5 0.70 [0.02] 0.00 3 0.67 21 1.08 32 0.84 0.57—1.1929 Plumbers [0.06] 0.00 [0.02] 0.00 – – [0.03] 0.00 [0.03] 0.00 [0.14] 0.00 0.00—25.9530 Welders – – [0.54] 0.00 [0.00] 0.00 [0.30] 0.00 2 2.56 2 1.23 0.15—4.4531 Electrical workers 11 1.10 2 0.44 [0.02] 0.00 6 1.27 7 0.64 26 0.86 0.56—1.2632 Wood workers 1 0.31 8 0.56 [0.04] 0.00 1 0.66 6 1.83 16 0.72 0.41—1.1633 Painters [0.13] 0.00 2 1.19 [0.01] 0.00 [0.35] 0.00 [0.87] 0.00 2 0.66 0.08—2.3734 "Other construction workers" [0.10] 0.00 5 0.87 [0.01] 0.00 [0.14] 0.00 [0.12] 0.00 5 0.81 0.26—1.9035 Bricklayers [0.02] 0.00 [0.19] 0.00 – – [0.01] 0.00 [0.00] 0.00 [0.22] 0.00 0.00—16.8636 Printers 1 0.27 2 0.28 [0.23] 0.00 8 1.79 10 1.26 21 0.89 0.55—1.3737 Chemical process workers 3 0.51 5 1.39 [0.09] 0.00 4 1.01 3 0.48 15 0.76 0.42—1.2538 Food workers 31 1.08 27 1.42 9 1.69 22 0.86 18 0.99 107 1.11 0.92—1.3439 Beverage workers [2.82] 0.00 [1.08] 0.00 [0.01] 0.00 [0.21] 0.00 1 0.90 1 0.19 0.00—1.0740 Tobacco workers 6 1.56 [0.60] 0.00 – – [0.94] 0.00 2 2.67 8 1.30 0.56—2.5641 Glass makers etc 5 0.71 8 0.61 [0.16] 0.00 9 1.07 12 0.71 34 0.74 0.52—1.0442 Packers 2 0.99 37 1.58 2 4.04 22 1.09 22 0.88 85 1.20 0.96—1.4843 Engine operators [0.06] 0.00 4 1.07 [0.01] 0.00 [0.25] 0.00 1 0.59 5 0.86 0.28—2.0244 Public safety workers [0.24] 0.00 3 3.42 [0.11] 0.00 3 1.20 1 0.43 7 1.15 0.46—2.3845 Cooks and stewards [0.08] 0.00 28 1.06 3 1.54 35 1.18 32 0.93 98 1.06 0.86—1.2946 Domestic assistants 48 1.08 21 0.76 1 1.79 78 1.03 94 0.99 242 0.99 0.88—1.1347 Waiters 7 0.90 21 0.96 [0.22] 0.00 23 0.75 28 0.75 79 0.81 0.64—1.0148 Building caretakers 134 1.03 92 1.01 2 0.53 143 1.11 112 1.18 483 1.08 0.99—1.1849 Chimney sweeps [0.01] 0.00 [0.05] 0.00 – – [0.02] 0.00 [0.00] 0.00 [0.08] 0.00 0.00—48.4650 Hairdressers 9 1.17 4 0.48 [0.28] 0.00 7 0.88 15 0.91 35 0.86 0.60—1.1951 Launderers 15 1.03 7 0.95 [0.61] 0.00 6 0.51 19 1.02 47 0.89 0.65—1.1852 Military personnel [0.07] 0.00 [0.08] 0.00 – – [0.03] 0.00 [0.07] 0.00 [0.25] 0.00 0.00—14.4953 "Other workers" 34 0.92 34 1.22 1 0.25 61 0.92 50 1.15 180 1.01 0.87—1.1654 Economically inactive 1015 1.02 633 1.01 18 1.23 966 1.01 1852 0.98 4484 1.00 0.97—1.03
1-54 All categories 1903 1.00 1665 1.00 59 1.00 2130 1.00 3357 1.00 9114 1.00 # REF. #
Obs = observed number of cases; SIR = standardised incidence ratio; 95% CI = 95% confidence interval
135 Index Prev Next

Acta Oncologica - Pukkala et al, 2008 Mycosis fungoides
Observed number of mycosis fungoides among men in the Nordic countries and standardised incidence ratios 1961-2005, by countryand occupational category
Denmark Finland Iceland Norway Sweden Total
No Occupational category Obs SIR Obs SIR Obs SIR Obs SIR Obs SIR Obs SIR 95% CI
1 Technical workers, etc 12 0.90 13 0.98 [0.30] 0.00 13 1.78 96 0.88 134 0.93 0.79—1.112 Laboratory assistants [0.26] 0.00 [0.33] 0.00 [0.05] 0.00 [0.35] 0.00 [0.33] 0.00 [1.32] 0.00 0.00—2.783 Physicians 1 0.88 [0.77] 0.00 [0.10] 0.00 2 2.13 9 1.85 12 1.54 0.80—2.694 Dentists 1 3.23 [0.16] 0.00 [0.03] 0.00 [0.41] 0.00 2 0.77 3 0.86 0.18—2.515 Nurses [0.01] 0.00 [0.04] 0.00 [0.00] 0.00 [0.04] 0.00 [0.17] 0.00 [0.27] 0.00 0.00—13.496 Assistant nurses [0.31] 0.00 [0.04] 0.00 [0.01] 0.00 [0.16] 0.00 2 1.08 2 0.84 0.10—3.057 "Other health workers" [0.97] 0.00 1 1.36 [0.02] 0.00 1 2.74 2 0.45 4 0.61 0.17—1.578 Teachers 9 1.57 4 0.72 [0.39] 0.00 3 0.58 29 1.09 45 1.03 0.75—1.389 Religious workers etc 5 1.95 5 1.67 [0.24] 0.00 4 1.48 27 1.25 41 1.36 0.98—1.8510 Artistic workers 1 1.28 1 0.95 1 15.32 1 1.27 5 0.73 9 0.94 0.43—1.7811 Journalists [0.36] 0.00 2 3.82 [0.04] 0.00 [0.35] 0.00 2 0.59 4 0.86 0.23—2.2012 Administrators 14 0.90 11 1.30 [0.56] 0.00 8 0.86 60 1.22 93 1.12 0.91—1.3713 Clerical workers 5 0.77 5 0.92 1 1.73 9 1.27 44 0.85 64 0.90 0.69—1.1514 Sales agents 4 1.18 6 0.77 [0.32] 0.00 7 0.86 86 1.16 103 1.10 0.91—1.3315 Shop workers 15 0.97 7 2.06 [0.22] 0.00 2 0.62 21 0.93 45 1.00 0.73—1.3416 Farmers 16 0.51 32 0.88 [0.82] 0.00 17 0.78 147 0.94 212 0.86 0.75—0.9817 Gardeners 1 0.23 1 0.19 [0.03] 0.00 2 0.35 43 0.79 47 0.67 0.49—0.8918 Fishermen 2 1.47 1 2.13 [0.64] 0.00 7 0.99 3 0.50 13 0.84 0.45—1.4319 Forestry workers [0.65] 0.00 12 1.88 [0.00] 0.00 1 0.25 33 0.83 46 0.90 0.66—1.2020 Miners and quarry workers [0.19] 0.00 1 0.97 [0.01] 0.00 4 3.43 14 1.46 19 1.58 0.95—2.4721 Seamen 3 2.13 [1.36] 0.00 1 6.33 5 0.84 11 1.37 20 1.18 0.72—1.8322 Transport workers 1 0.29 4 0.98 [0.29] 0.00 3 0.97 19 0.81 27 0.79 0.52—1.1523 Drivers 14 1.35 12 0.92 [0.48] 0.00 6 0.70 63 1.05 95 1.03 0.83—1.2624 Postal workers 3 1.50 1 0.52 [0.05] 0.00 2 1.25 17 1.20 23 1.16 0.74—1.7525 Textile workers 4 2.06 1 0.79 [0.07] 0.00 1 0.57 22 1.26 28 1.24 0.83—1.8026 Shoe and leather workers 2 4.16 [0.55] 0.00 [0.01] 0.00 [0.73] 0.00 9 1.14 11 1.14 0.57—2.0427 Smelting workers 5 1.24 2 1.02 [0.12] 0.00 4 1.67 22 0.81 33 0.93 0.64—1.3028 Mechanics 15 1.36 7 0.55 [0.46] 0.00 14 1.18 119 1.10 155 1.08 0.92—1.2629 Plumbers 1 1.02 1 0.46 [0.07] 0.00 1 0.73 7 0.56 10 0.58 0.28—1.0730 Welders – – 2 0.96 [0.03] 0.00 1 0.63 16 1.27 19 1.17 0.70—1.8331 Electrical workers 3 1.19 6 1.10 2 7.23 2 0.38 31 0.89 44 0.91 0.66—1.2232 Wood workers 4 0.51 15 1.12 [0.23] 0.00 12 0.89 92 1.09 123 1.03 0.86—1.2333 Painters 4 1.56 5 1.77 [0.10] 0.00 2 0.89 22 0.94 33 1.06 0.73—1.4934 "Other construction workers" 5 0.50 6 0.69 1 1.97 1 0.37 37 0.79 50 0.73 0.54—0.9635 Bricklayers 2 0.71 1 0.72 – – 1 0.74 12 1.10 16 0.97 0.55—1.5736 Printers [1.72] 0.00 1 0.77 [0.09] 0.00 4 2.93 15 1.29 20 1.24 0.76—1.9237 Chemical process workers 3 1.75 2 0.92 [0.04] 0.00 8 2.68 25 1.18 38 1.35 0.96—1.8538 Food workers 6 1.11 2 1.28 [0.31] 0.00 5 1.46 18 0.92 31 1.02 0.69—1.4539 Beverage workers 2 3.10 [0.10] 0.00 [0.01] 0.00 [0.04] 0.00 3 2.23 5 2.34 0.76—5.4640 Tobacco workers [0.11] 0.00 [0.02] 0.00 [0.00] 0.00 [0.05] 0.00 [0.08] 0.00 [0.27] 0.00 0.00—13.7941 Glass makers etc 5 1.54 [2.27] 0.00 [0.06] 0.00 4 2.39 18 0.84 27 0.94 0.62—1.3642 Packers 3 1.04 7 1.51 [0.17] 0.00 7 1.37 50 1.15 67 1.19 0.92—1.5143 Engine operators 2 0.71 9 1.40 1 3.21 5 1.69 30 0.98 47 1.09 0.80—1.4544 Public safety workers 6 2.07 2 0.55 [0.21] 0.00 3 1.35 14 0.84 25 0.97 0.63—1.4345 Cooks and stewards [0.20] 0.00 [0.23] 0.00 [0.11] 0.00 3 3.00 9 3.00 12 2.65 1.37—4.6346 Domestic assistants [0.00] 0.00 [0.01] 0.00 [0.00] 0.00 [0.01] 0.00 [0.22] 0.00 [0.24] 0.00 0.00—15.0647 Waiters [0.41] 0.00 [0.21] 0.00 [0.01] 0.00 1 2.34 2 1.26 3 1.13 0.23—3.3048 Building caretakers 5 1.72 4 1.32 [0.06] 0.00 1 0.90 19 1.14 29 1.22 0.82—1.7549 Chimney sweeps [0.07] 0.00 [0.23] 0.00 – – [0.12] 0.00 3 2.96 3 2.10 0.43—6.1450 Hairdressers 1 1.17 [0.06] 0.00 [0.02] 0.00 [0.33] 0.00 4 1.05 5 0.98 0.32—2.2951 Launderers [0.41] 0.00 [0.06] 0.00 [0.01] 0.00 [0.20] 0.00 3 1.11 3 0.88 0.18—2.5952 Military personnel [1.30] 0.00 3 2.42 – – 4 2.11 7 0.81 14 1.07 0.59—1.8053 "Other workers" 13 1.53 6 1.67 2 2.58 4 0.42 48 0.92 73 0.98 0.76—1.2354 Economically inactive 12 1.51 20 1.17 1 1.81 4 0.90 94 1.01 131 1.07 0.90—1.26
1-54 All categories 210 1.00 221 1.00 10 1.00 189 1.00 1486 1.00 2116 1.00 # REF. #
Obs = observed number of cases; SIR = standardised incidence ratio; 95% CI = 95% confidence interval
136 Index Prev Next

Acta Oncologica - Pukkala et al, 2008 Mycosis fungoides
Observed number of mycosis fungoides among women in the Nordic countries and standardised incidence ratios 1961-2005, by countryand occupational category
Denmark Finland Iceland Norway Sweden Total
No Occupational category Obs SIR Obs SIR Obs SIR Obs SIR Obs SIR Obs SIR 95% CI
1 Technical workers, etc 1 2.72 [0.90] 0.00 [0.03] 0.00 [0.16] 0.00 [3.43] 0.00 1 0.20 0.01—1.142 Laboratory assistants [0.27] 0.00 [0.44] 0.00 [0.03] 0.00 1 5.19 1 2.80 2 1.54 0.19—5.573 Physicians [0.12] 0.00 1 4.34 [0.00] 0.00 [0.08] 0.00 1 1.63 2 1.91 0.23—6.894 Dentists 1 9.28 [0.20] 0.00 [0.00] 0.00 [0.06] 0.00 [0.66] 0.00 1 0.98 0.02—5.445 Nurses 3 1.41 1 0.43 [0.11] 0.00 1 0.66 10 0.91 15 0.88 0.49—1.456 Assistant nurses 2 1.28 2 0.93 1 5.56 3 1.96 22 1.26 30 1.31 0.89—1.887 "Other health workers" 2 1.63 2 1.10 [0.04] 0.00 4 2.71 8 1.44 16 1.58 0.90—2.568 Teachers 4 1.46 5 1.26 [0.21] 0.00 3 1.05 17 0.70 29 0.85 0.57—1.239 Religious workers etc 1 2.72 2 0.84 [0.03] 0.00 [0.72] 0.00 6 0.89 9 0.88 0.40—1.6610 Artistic workers [0.18] 0.00 [0.35] 0.00 [0.02] 0.00 1 4.69 3 1.95 4 1.73 0.47—4.4311 Journalists [0.04] 0.00 [0.21] 0.00 [0.01] 0.00 [0.06] 0.00 1 1.51 1 1.02 0.03—5.6812 Administrators [1.10] 0.00 1 1.30 [0.01] 0.00 1 1.43 3 0.82 5 0.80 0.26—1.8713 Clerical workers 13 1.18 24 1.82 [0.64] 0.00 7 0.79 48 0.80 92 0.98 0.79—1.2114 Sales agents [0.10] 0.00 3 1.63 [0.04] 0.00 1 0.86 14 1.20 18 1.21 0.72—1.9215 Shop workers 6 0.81 12 1.91 [0.31] 0.00 10 1.37 49 1.03 77 1.12 0.88—1.4016 Farmers 2 0.38 3 0.78 [0.16] 0.00 2 0.41 [5.25] 0.00 7 0.36 0.15—0.7517 Gardeners 1 1.48 11 1.06 [0.01] 0.00 1 0.34 14 1.06 27 0.99 0.65—1.4418 Fishermen [0.03] 0.00 [0.03] 0.00 [0.01] 0.00 [0.04] 0.00 [0.04] 0.00 [0.14] 0.00 0.00—26.1519 Forestry workers [0.01] 0.00 [0.05] 0.00 [0.00] 0.00 [0.06] 0.00 [0.25] 0.00 [0.36] 0.00 0.00—10.3720 Miners and quarry workers [0.00] 0.00 [0.02] 0.00 [0.00] 0.00 [0.00] 0.00 [0.05] 0.00 [0.07] 0.00 0.00—53.6621 Seamen – – [0.01] 0.00 [0.00] 0.00 [0.01] 0.00 [0.00] 0.00 [0.02] 0.00 0.00—183.0222 Transport workers [0.01] 0.00 [0.29] 0.00 [0.00] 0.00 [0.04] 0.00 [0.69] 0.00 [1.04] 0.00 0.00—3.5423 Drivers [0.18] 0.00 [0.16] 0.00 [0.00] 0.00 1 6.58 [1.35] 0.00 1 0.54 0.01—3.0024 Postal workers 1 2.59 2 1.06 2 26.22 3 1.80 9 0.73 17 1.04 0.60—1.6625 Textile workers 2 0.81 6 1.44 [0.12] 0.00 2 0.79 35 1.07 45 1.07 0.78—1.4326 Shoe and leather workers 1 5.46 [0.51] 0.00 [0.01] 0.00 1 5.41 2 0.81 4 1.19 0.32—3.0527 Smelting workers [0.04] 0.00 [0.12] 0.00 [0.00] 0.00 [0.02] 0.00 1 2.41 1 1.67 0.04—9.2828 Mechanics 1 2.25 [0.57] 0.00 [0.00] 0.00 [0.24] 0.00 1 0.20 2 0.32 0.04—1.1729 Plumbers [0.00] 0.00 [0.00] 0.00 – – [0.00] 0.00 [0.00] 0.00 [0.01] 0.00 0.00—363.6730 Welders – – [0.05] 0.00 [0.00] 0.00 [0.02] 0.00 1 8.54 1 5.48 0.14—30.5131 Electrical workers [0.62] 0.00 1 2.41 [0.00] 0.00 [0.26] 0.00 2 0.75 3 0.76 0.16—2.2232 Wood workers [0.21] 0.00 2 1.96 [0.00] 0.00 [0.09] 0.00 [0.73] 0.00 2 0.98 0.12—3.5333 Painters [0.01] 0.00 [0.13] 0.00 [0.00] 0.00 [0.02] 0.00 [0.23] 0.00 [0.38] 0.00 0.00—9.6634 "Other construction workers" [0.01] 0.00 1 2.54 [0.00] 0.00 [0.01] 0.00 [0.02] 0.00 1 2.36 0.06—13.1335 Bricklayers [0.00] 0.00 [0.01] 0.00 – – [0.00] 0.00 [0.00] 0.00 [0.02] 0.00 0.00—230.4536 Printers [0.23] 0.00 [0.56] 0.00 [0.02] 0.00 1 4.54 1 0.42 2 0.58 0.07—2.1137 Chemical process workers [0.36] 0.00 [0.27] 0.00 [0.00] 0.00 [0.20] 0.00 4 2.04 4 1.43 0.39—3.6638 Food workers 2 1.11 1 0.72 [0.36] 0.00 [1.27] 0.00 3 0.45 6 0.52 0.19—1.1439 Beverage workers 1 6.04 [0.08] 0.00 [0.00] 0.00 [0.01] 0.00 1 2.18 2 2.80 0.34—10.1340 Tobacco workers [0.23] 0.00 [0.04] 0.00 – – [0.04] 0.00 [0.21] 0.00 [0.53] 0.00 0.00—7.0241 Glass makers etc 1 2.28 [1.00] 0.00 [0.01] 0.00 1 2.33 7 1.40 9 1.31 0.60—2.4842 Packers [0.13] 0.00 5 2.86 [0.03] 0.00 [1.04] 0.00 4 0.51 9 0.83 0.38—1.5743 Engine operators [0.00] 0.00 [0.29] 0.00 [0.00] 0.00 [0.02] 0.00 1 3.89 1 1.77 0.04—9.8644 Public safety workers [0.01] 0.00 [0.08] 0.00 [0.01] 0.00 [0.13] 0.00 1 2.46 1 1.57 0.04—8.7645 Cooks and stewards [0.00] 0.00 [2.08] 0.00 [0.10] 0.00 1 0.72 11 0.79 12 0.68 0.35—1.1946 Domestic assistants 1 0.36 2 0.84 [0.02] 0.00 3 0.83 35 1.13 41 1.03 0.74—1.4047 Waiters [0.47] 0.00 3 1.70 [0.02] 0.00 [1.57] 0.00 9 0.70 12 0.72 0.37—1.2648 Building caretakers 6 0.75 4 0.59 [0.19] 0.00 8 1.19 34 1.05 52 0.96 0.72—1.2649 Chimney sweeps [0.00] 0.00 [0.00] 0.00 – – [0.00] 0.00 [0.00] 0.00 [0.01] 0.00 0.00—673.6250 Hairdressers [0.49] 0.00 1 1.44 [0.03] 0.00 [0.42] 0.00 5 1.18 6 1.02 0.37—2.2251 Launderers 2 2.22 1 1.96 [0.03] 0.00 [0.56] 0.00 5 0.66 8 0.84 0.36—1.6552 Military personnel [0.00] 0.00 [0.01] 0.00 – – [0.00] 0.00 [0.00] 0.00 [0.02] 0.00 0.00—191.2253 "Other workers" 4 1.76 [2.22] 0.00 [0.27] 0.00 3 0.85 11 0.80 18 0.82 0.48—1.2954 Economically inactive 58 0.99 31 0.70 1 1.15 43 1.05 789 1.04 922 1.02 0.96—1.09
1-54 All categories 116 1.00 127 1.00 4 1.00 102 1.00 1169 1.00 1518 1.00 # REF. #
Obs = observed number of cases; SIR = standardised incidence ratio; 95% CI = 95% confidence interval
137 Index Prev Next

Acta Oncologica - Pukkala et al, 2008 Borderline tumour of the ovary
Observed number of borderline tumour of the ovary among women in the Nordic countries and standardised incidence ratios 1961-2005,by country and occupational category
Denmark Finland Iceland Norway Sweden Total
No Occupational category Obs SIR Obs SIR Obs SIR Obs SIR Obs SIR Obs SIR 95% CI
1 Technical workers, etc – – 18 0.92 1 1.69 3 0.57 32 0.86 54 0.86 0.65—1.132 Laboratory assistants – – 9 0.94 1 1.34 3 0.56 7 0.38 20 0.59 0.36—0.913 Physicians – – 4 0.79 [0.10] 0.00 [2.14] 0.00 4 0.38 8 0.45 0.19—0.894 Dentists – – 3 0.86 [0.04] 0.00 1 0.67 6 1.03 10 0.92 0.44—1.705 Nurses – – 49 1.01 3 1.03 34 0.79 91 0.90 177 0.91 0.78—1.056 Assistant nurses – – 46 1.10 8 1.84 41 0.98 241 1.22 336 1.17 1.05—1.317 "Other health workers" – – 38 1.03 2 2.04 30 0.80 70 0.98 140 0.96 0.81—1.138 Teachers – – 74 0.95 4 0.72 66 0.85 194 0.82 338 0.85 0.76—0.959 Religious workers etc – – 55 1.01 2 2.52 24 1.25 93 0.92 174 0.99 0.86—1.1510 Artistic workers – – 9 1.21 1 1.65 4 0.79 13 0.81 27 0.93 0.61—1.3511 Journalists – – 3 0.68 [0.17] 0.00 1 0.62 3 0.38 7 0.50 0.20—1.0312 Administrators – – 14 0.88 1 2.77 23 1.38 29 0.81 67 0.97 0.75—1.2313 Clerical workers – – 285 1.05 16 0.96 234 1.10 560 1.04 1095 1.05 0.99—1.1214 Sales agents – – 38 1.15 1 0.75 22 1.10 73 1.19 134 1.16 0.98—1.3715 Shop workers – – 128 1.11 6 0.65 138 0.95 279 1.25 551 1.12 1.03—1.2216 Farmers – – 54 1.02 3 0.56 65 0.87 22 0.87 144 0.91 0.77—1.0717 Gardeners – – 132 0.86 [0.20] 0.00 37 0.82 31 0.61 200 0.80 0.70—0.9218 Fishermen – – [0.45] 0.00 2 7.66 1 1.16 [0.21] 0.00 3 1.69 0.35—4.9319 Forestry workers – – 1 1.17 [0.04] 0.00 [1.02] 0.00 4 2.63 5 1.45 0.47—3.3920 Miners and quarry workers – – [0.28] 0.00 [0.00] 0.00 [0.09] 0.00 [0.44] 0.00 [0.82] 0.00 0.00—4.5221 Seamen – – [0.18] 0.00 [0.00] 0.00 [0.21] 0.00 [0.11] 0.00 [0.50] 0.00 0.00—7.4422 Transport workers – – 4 0.85 1 5.14 2 1.77 10 1.88 17 1.50 0.87—2.4023 Drivers – – 4 1.21 1 7.65 7 1.90 15 1.01 27 1.23 0.81—1.7924 Postal workers – – 43 1.28 1 0.38 50 1.37 89 1.19 183 1.24 1.07—1.4425 Textile workers – – 84 1.18 4 1.01 39 0.98 97 0.99 224 1.05 0.92—1.2026 Shoe and leather workers – – 10 1.13 [0.23] 0.00 4 1.37 9 1.16 23 1.16 0.74—1.7427 Smelting workers – – [2.02] 0.00 [0.01] 0.00 1 1.45 6 1.49 7 1.04 0.42—2.1428 Mechanics – – 14 1.31 [0.05] 0.00 5 1.04 55 1.47 74 1.40 1.10—1.7529 Plumbers – – [0.04] 0.00 – – [0.05] 0.00 1 9.01 1 5.18 0.13—28.8430 Welders – – 1 0.97 [0.01] 0.00 1 1.63 3 1.40 5 1.32 0.43—3.0731 Electrical workers – – 8 0.89 [0.05] 0.00 9 1.62 26 1.19 43 1.18 0.85—1.5932 Wood workers – – 16 0.95 [0.10] 0.00 3 1.42 7 0.98 26 0.99 0.65—1.4633 Painters – – 1 0.45 [0.03] 0.00 [0.42] 0.00 [1.71] 0.00 1 0.23 0.01—1.2734 "Other construction workers" – – 6 1.05 [0.02] 0.00 [0.19] 0.00 [0.37] 0.00 6 0.95 0.35—2.0735 Bricklayers – – [0.23] 0.00 – – [0.01] 0.00 [0.01] 0.00 [0.25] 0.00 0.00—14.6036 Printers – – 17 1.65 [0.47] 0.00 9 2.01 18 1.28 44 1.50 1.09—2.0137 Chemical process workers – – 5 1.10 [0.16] 0.00 2 0.53 6 0.62 13 0.71 0.38—1.2238 Food workers – – 16 0.70 10 0.93 22 1.04 33 1.41 81 1.04 0.82—1.2939 Beverage workers – – 1 0.84 [0.02] 0.00 [0.26] 0.00 1 0.76 2 0.72 0.09—2.5940 Tobacco workers – – [0.67] 0.00 – – [0.62] 0.00 3 2.65 3 1.24 0.26—3.6241 Glass makers etc – – 12 0.69 1 3.33 16 1.92 31 1.16 60 1.14 0.87—1.4642 Packers – – 34 1.13 1 1.13 19 1.00 47 1.25 101 1.15 0.95—1.4043 Engine operators – – 12 2.26 [0.02] 0.00 [0.50] 0.00 5 1.14 17 1.67 0.97—2.6744 Public safety workers – – 2 1.34 [0.19] 0.00 2 0.85 5 0.71 9 0.82 0.37—1.5545 Cooks and stewards – – 37 1.02 3 0.94 33 1.56 53 1.21 126 1.21 1.01—1.4446 Domestic assistants – – 47 1.03 [0.80] 0.00 57 0.94 185 0.95 289 0.96 0.85—1.0847 Waiters – – 37 1.11 [0.48] 0.00 32 1.08 46 0.97 115 1.04 0.86—1.2548 Building caretakers – – 107 0.95 11 1.70 139 1.06 164 1.06 421 1.04 0.94—1.1449 Chimney sweeps – – [0.06] 0.00 – – [0.02] 0.00 [0.01] 0.00 [0.08] 0.00 0.00—43.7850 Hairdressers – – 16 1.21 1 1.44 8 0.92 31 1.02 56 1.06 0.80—1.3751 Launderers – – 10 1.28 [0.86] 0.00 9 1.03 31 1.51 50 1.32 0.98—1.7452 Military personnel – – [0.21] 0.00 – – [0.07] 0.00 [0.30] 0.00 [0.58] 0.00 0.00—6.3453 "Other workers" – – 33 0.84 6 0.75 69 0.96 112 1.51 220 1.14 1.00—1.3054 Economically inactive – – 584 0.95 26 1.00 595 0.97 2146 0.94 3351 0.95 0.92—0.98
1-54 All categories – – 2121 1.00 117 1.00 1860 1.00 4987 1.00 9085 1.00 # REF. #
Obs = observed number of cases; SIR = standardised incidence ratio; 95% CI = 95% confidence interval
138 Index Prev Next

Acta Oncologica - Pukkala et al, 2008 All malignant neoplasms
Observed number of all malignant neoplasms among men in the Nordic countries and standardised incidence ratios 1961-2005, bycountry and occupational category
Denmark Finland Iceland Norway Sweden Total
No Occupational category Obs SIR Obs SIR Obs SIR Obs SIR Obs SIR Obs SIR 95% CI
1 Technical workers, etc 14472 0.98 13197 0.95 156 0.93 9201 0.90 57315 1.03 94341 0.99 0.99—1.002 Laboratory assistants 293 0.99 313 0.93 37 1.16 498 1.00 254 0.95 1395 0.98 0.93—1.033 Physicians 1094 0.89 733 0.92 70 1.03 1278 0.93 2484 0.98 5659 0.94 0.92—0.974 Dentists 341 0.96 132 0.78 6 0.36 612 1.00 1264 1.00 2355 0.97 0.94—1.015 Nurses 9 0.55 36 0.92 1 2.55 43 0.79 119 0.94 208 0.87 0.76—1.006 Assistant nurses 320 0.91 38 1.12 4 0.50 240 1.02 884 1.02 1486 0.99 0.94—1.047 "Other health workers" 1026 0.96 730 0.93 13 0.70 527 1.01 2131 1.00 4427 0.98 0.95—1.018 Teachers 5393 0.83 4914 0.84 250 1.01 6453 0.86 13521 0.94 30531 0.88 0.87—0.899 Religious workers etc 2519 0.91 2994 0.96 188 1.15 3572 0.92 11046 1.01 20319 0.97 0.96—0.9910 Artistic workers 858 1.00 1119 0.99 60 1.34 1191 1.05 3636 1.08 6864 1.05 1.02—1.0711 Journalists 416 1.03 525 0.96 28 1.10 474 0.96 1740 1.11 3183 1.05 1.01—1.0912 Administrators 17050 1.01 9072 1.01 436 1.03 14314 1.04 23185 1.07 64057 1.04 1.03—1.0513 Clerical workers 7123 0.97 5910 0.99 536 1.12 10114 0.99 24553 1.06 48236 1.02 1.01—1.0314 Sales agents 4141 1.07 8354 0.99 259 1.07 12899 1.08 36697 1.10 62350 1.08 1.07—1.0815 Shop workers 17514 1.03 3364 0.96 168 0.99 4610 1.01 11203 1.04 36859 1.02 1.01—1.0316 Farmers 23400 0.71 38820 0.90 508 0.72 28709 0.83 49126 0.84 140563 0.83 0.82—0.8317 Gardeners 3872 0.83 5174 0.87 18 0.81 6787 0.81 18408 0.86 34259 0.85 0.84—0.8518 Fishermen 1736 1.12 524 0.94 429 1.07 10869 1.02 2210 0.97 15768 1.02 1.00—1.0419 Forestry workers 564 0.82 6639 0.96 [3.69] 0.00 5023 0.80 12567 0.81 24793 0.84 0.83—0.8520 Miners and quarry workers 205 0.97 1398 1.28 6 0.91 1774 1.04 3855 1.01 7238 1.06 1.04—1.0821 Seamen 2143 1.30 1742 1.19 138 1.24 10124 1.20 4119 1.23 18266 1.22 1.20—1.2322 Transport workers 3713 1.01 4250 0.97 228 1.01 4654 1.03 11584 1.01 24429 1.01 1.00—1.0223 Drivers 13551 1.14 14290 1.04 329 1.02 13842 1.13 29686 1.07 71698 1.09 1.08—1.1024 Postal workers 2237 0.98 2021 0.96 49 1.16 2426 1.02 6302 1.03 13035 1.01 0.99—1.0325 Textile workers 2184 1.03 1469 1.02 59 0.81 2651 1.00 6749 0.98 13112 1.00 0.98—1.0126 Shoe and leather workers 528 1.00 592 0.94 15 0.95 1184 1.05 2900 1.07 5219 1.04 1.01—1.0727 Smelting workers 5382 1.15 2240 1.04 89 0.88 3991 1.13 10713 0.99 22415 1.05 1.04—1.0728 Mechanics 13654 1.08 13773 1.02 286 0.92 18230 1.07 51641 1.03 97584 1.04 1.03—1.0529 Plumbers 1382 1.23 2488 1.11 50 0.98 2208 1.14 6372 1.10 12500 1.12 1.10—1.1430 Welders – – 2256 1.09 18 0.96 2323 1.06 6903 1.05 11500 1.06 1.04—1.0831 Electrical workers 3264 1.11 5601 0.99 188 1.01 7763 1.03 17406 1.01 34222 1.02 1.01—1.0332 Wood workers 8632 0.99 15088 1.01 170 0.94 19253 0.96 31210 0.92 74353 0.95 0.95—0.9633 Painters 3192 1.12 3279 1.06 69 0.94 3567 1.07 10020 1.02 20127 1.05 1.04—1.0634 "Other construction workers" 11543 1.04 10939 1.14 360 1.00 4235 1.08 18733 1.03 45810 1.06 1.05—1.0735 Bricklayers 3503 1.10 1680 1.08 – – 2120 1.07 4519 1.02 11822 1.06 1.04—1.0836 Printers 2236 1.12 1383 1.02 53 0.90 2172 1.09 5725 1.09 11569 1.08 1.06—1.1037 Chemical process workers 2035 1.08 2306 1.00 32 0.97 4608 1.03 8087 0.99 17068 1.01 1.00—1.0338 Food workers 6389 1.05 1697 1.01 288 1.01 5450 1.08 8611 1.04 22435 1.05 1.04—1.0639 Beverage workers 1049 1.41 104 0.91 4 0.85 54 1.04 538 1.16 1749 1.27 1.21—1.3340 Tobacco workers 154 1.25 26 1.30 [0.35] 0.00 96 1.24 40 1.09 316 1.23 1.10—1.3741 Glass makers etc 3664 1.02 2454 1.01 62 1.24 2684 1.10 8908 0.99 17772 1.02 1.00—1.0342 Packers 3491 1.09 5670 1.11 179 1.09 8722 1.15 17283 1.07 35345 1.10 1.08—1.1143 Engine operators 3343 1.04 7058 1.05 218 1.01 4703 1.11 14018 1.03 29340 1.05 1.04—1.0644 Public safety workers 3176 1.06 4015 1.02 158 1.02 3555 1.09 8532 1.08 19436 1.07 1.05—1.0845 Cooks and stewards 331 1.42 252 1.10 78 1.08 1655 1.17 1675 1.20 3991 1.19 1.16—1.2346 Domestic assistants 4 1.57 4 0.24 [0.23] 0.00 14 1.20 93 0.81 115 0.79 0.66—0.9547 Waiters 913 1.84 251 1.15 8 1.05 832 1.36 1046 1.45 3050 1.48 1.43—1.5448 Building caretakers 3643 1.13 3376 1.00 87 1.25 1922 1.15 6622 1.05 15650 1.07 1.05—1.0949 Chimney sweeps 114 1.40 261 1.06 – – 203 1.20 557 1.23 1135 1.20 1.13—1.2750 Hairdressers 950 1.04 54 0.78 10 0.97 539 1.11 1823 1.13 3376 1.09 1.06—1.1351 Launderers 454 1.01 75 1.08 10 1.50 339 1.17 1188 1.03 2066 1.05 1.01—1.1052 Military personnel 1557 1.03 1175 0.96 – – 2807 1.04 4996 1.07 10535 1.04 1.02—1.0653 "Other workers" 11351 1.16 4090 1.03 668 1.06 14839 1.02 19863 1.01 50811 1.05 1.04—1.0554 Economically inactive 11625 1.17 25506 1.14 456 1.04 6968 0.94 29385 0.99 73940 1.06 1.05—1.07
1-54 All categories 233733 1.00 245451 1.00 7532 1.00 279921 1.00 634045 1.00 1400682 1.00 # REF. #
Obs = observed number of cases; SIR = standardised incidence ratio; 95% CI = 95% confidence interval
139 Index Prev Next

Acta Oncologica - Pukkala et al, 2008 All malignant neoplasms
Observed number of all malignant neoplasms among women in the Nordic countries and standardised incidence ratios 1961-2005, bycountry and occupational category
Denmark Finland Iceland Norway Sweden Total
No Occupational category Obs SIR Obs SIR Obs SIR Obs SIR Obs SIR Obs SIR 95% CI
1 Technical workers, etc 796 1.09 1651 1.11 17 0.72 441 1.14 3039 1.05 5944 1.08 1.05—1.102 Laboratory assistants 551 1.02 894 1.10 40 1.17 479 1.03 954 1.02 2918 1.05 1.01—1.083 Physicians 266 1.10 438 1.19 6 1.06 186 0.97 704 1.01 1600 1.06 1.01—1.124 Dentists 225 1.05 440 1.22 2 0.87 163 1.03 519 1.04 1349 1.09 1.03—1.155 Nurses 4157 0.97 4543 1.10 154 0.99 3491 0.96 8553 1.00 20898 1.01 0.99—1.026 Assistant nurses 3127 1.00 3810 0.94 191 0.88 3412 0.95 15098 0.98 25638 0.97 0.96—0.987 "Other health workers" 2449 1.00 3476 1.07 37 0.80 3521 0.99 5354 1.02 14837 1.02 1.00—1.048 Teachers 5435 1.00 8093 1.11 267 0.95 6808 0.99 19518 1.00 40121 1.02 1.01—1.039 Religious workers etc 700 0.96 4233 1.09 51 1.22 1763 1.03 6925 1.02 13672 1.04 1.02—1.0610 Artistic workers 378 1.02 666 1.09 31 0.92 523 1.02 1383 1.10 2981 1.07 1.03—1.1111 Journalists 95 1.17 434 1.12 8 0.90 158 1.14 657 1.11 1352 1.12 1.06—1.1812 Administrators 2481 1.12 1507 1.14 32 1.25 1816 1.08 3057 1.07 8893 1.10 1.08—1.1213 Clerical workers 23863 1.08 26565 1.10 900 1.06 23079 1.07 51572 1.09 125979 1.09 1.08—1.0914 Sales agents 206 1.04 3552 1.04 96 1.10 3110 1.07 6850 1.06 13814 1.06 1.04—1.0715 Shop workers 14979 1.02 12250 0.99 524 0.99 17582 1.00 28353 1.03 73688 1.02 1.01—1.0216 Farmers 7757 0.75 6526 0.90 303 0.81 10020 0.87 2321 0.89 26927 0.84 0.83—0.8517 Gardeners 1132 0.85 18024 0.86 18 1.41 5812 0.84 6386 0.90 31372 0.86 0.85—0.8718 Fishermen 41 0.77 42 0.88 17 1.21 80 0.89 26 1.09 206 0.90 0.78—1.0319 Forestry workers 16 1.14 50 0.53 1 0.54 118 0.91 144 0.90 329 0.82 0.74—0.9220 Miners and quarry workers [0.89] 0.00 31 0.81 [0.34] 0.00 7 0.97 19 0.48 57 0.66 0.50—0.8621 Seamen – – 9 0.71 [0.06] 0.00 9 0.42 5 0.90 23 0.58 0.37—0.8722 Transport workers 15 1.02 677 1.17 17 1.23 121 1.20 502 1.08 1332 1.14 1.08—1.2023 Drivers 374 1.00 262 0.89 6 0.89 325 0.91 1214 1.03 2181 0.98 0.94—1.0324 Postal workers 792 1.02 3712 1.01 161 0.93 4188 1.01 8455 1.06 17308 1.03 1.02—1.0525 Textile workers 5233 1.06 8236 1.01 284 0.93 6727 1.05 15701 1.02 36181 1.03 1.01—1.0426 Shoe and leather workers 379 1.03 972 0.96 21 1.28 450 0.97 1296 1.09 3118 1.02 0.99—1.0627 Smelting workers 95 1.06 218 0.92 2 2.58 54 0.99 352 1.00 721 0.98 0.91—1.0628 Mechanics 1034 1.15 1027 0.94 4 1.26 593 1.03 3675 1.05 6333 1.04 1.02—1.0729 Plumbers 6 0.75 1 0.38 – – 6 1.43 10 1.67 23 1.11 0.70—1.6630 Welders – – 78 0.87 [0.30] 0.00 53 1.19 153 1.06 284 1.02 0.91—1.1531 Electrical workers 1483 1.18 765 1.02 4 1.46 707 1.13 2006 1.02 4965 1.08 1.05—1.1132 Wood workers 450 1.09 1803 0.88 3 0.56 205 0.99 543 0.91 3004 0.92 0.89—0.9533 Painters 13 0.83 263 1.07 [1.51] 0.00 66 1.42 141 0.90 483 1.03 0.94—1.1334 "Other construction workers" 12 0.98 897 1.12 1 1.08 15 0.82 17 0.77 942 1.11 1.04—1.1835 Bricklayers 2 0.81 17 0.60 – – 1 1.00 1 1.36 21 0.65 0.40—0.9936 Printers 542 1.16 1148 1.08 26 0.96 666 1.19 1658 1.15 4040 1.13 1.10—1.1737 Chemical process workers 842 1.15 508 0.96 11 0.95 534 1.08 1171 1.04 3066 1.06 1.02—1.1038 Food workers 3629 1.01 2560 0.93 653 1.00 3029 0.97 3346 1.02 13217 0.99 0.97—1.0039 Beverage workers 430 1.28 120 0.79 2 1.28 34 1.23 199 0.97 785 1.09 1.01—1.1640 Tobacco workers 624 1.33 95 1.10 – – 139 1.26 150 1.13 1008 1.27 1.19—1.3541 Glass makers etc 962 1.09 1883 0.96 20 1.13 1172 1.10 3125 1.04 7162 1.03 1.01—1.0642 Packers 281 1.11 3592 1.04 71 1.15 2694 1.07 4701 1.05 11339 1.06 1.04—1.0843 Engine operators 14 1.78 578 1.02 1 1.06 44 1.18 290 0.92 927 1.00 0.94—1.0744 Public safety workers 24 0.89 175 1.27 11 0.90 324 1.06 464 1.09 998 1.10 1.03—1.1745 Cooks and stewards 10 1.06 3944 1.01 246 1.06 3647 1.05 6531 1.03 14378 1.03 1.01—1.0446 Domestic assistants 5459 0.98 4046 0.94 74 1.11 8745 0.96 17860 0.99 36184 0.97 0.96—0.9847 Waiters 1321 1.38 3560 1.06 30 1.10 4204 1.10 7020 1.07 16135 1.09 1.08—1.1148 Building caretakers 16237 1.01 12891 0.97 464 0.97 16124 0.99 18027 1.02 63743 1.00 0.99—1.0149 Chimney sweeps [1.43] 0.00 6 0.93 – – 3 1.36 [0.54] 0.00 9 0.85 0.39—1.6050 Hairdressers 1026 1.05 1367 1.06 17 0.58 1050 1.03 3171 1.08 6631 1.06 1.03—1.0951 Launderers 1850 1.03 955 0.93 66 0.90 1331 0.95 3424 1.02 7626 1.00 0.97—1.0252 Military personnel 16 1.71 20 1.36 – – 5 1.00 13 0.90 54 1.24 0.93—1.6253 "Other workers" 5010 1.10 4051 0.97 514 1.04 8244 0.97 8295 1.04 26114 1.02 1.00—1.0354 Economically inactive 117999 0.99 86283 1.00 1767 1.03 109954 1.01 338703 0.98 654706 0.99 0.98—0.99
1-54 All categories 234818 1.00 243944 1.00 7171 1.00 258032 1.00 613651 1.00 1357616 1.00 # REF. #
Obs = observed number of cases; SIR = standardised incidence ratio; 95% CI = 95% confidence interval
140 Index Prev Next