OBSTACLES TO THE IMPLEMENTATION OF TOTAL QUALITY MANAGEMENT AND ORGANIZATIONAL PERFORMANCE IN...
30
OBSTACLES TO THE IMPLEMENTATION OF TOTAL QUALITY MANAGEMENT AND ORGANIZATIONAL PERFORMANCE IN PRIVATE HIGHER LEARNING INSTITUTIONS 1 Okungu Norah Atieno, 2 Dr. Ojera Patrick, 3 Kwama Leonard Ogweno 1 KCA University, School of Business and Public Management, P.O Box 3207- 40100 Kisumu, Kenya; 2 Maseno University, School of Business and Economics, Private Bag, Maseno, Kenya: Abstract This paper aims to identify the main obstacles to the implementation of Total Quality Management. The study is to test the structural order which would enhance Total Quality Management and at the same time seek to discover the systems sensitivity to the human resources with its ultimate effect on performance. To do so, the findings of a stratified sample size comprising of top management team, academic heads of departments, lecturers, support staff and students was obtained for the study. Structured questionnaires were administered and an interview schedule was arranged for a number of members chosen at random and all class representatives. Secondary data was obtained from the University reports on the Total Quality Management implementation and progress. Descriptive statistics have been used to analyse data. The data has been presented in terms of tables and graphs. The study revealed that the implementation of Total Quality Management in KCA University is facing challenges because members do not yet know how best to implement it. At the same time some members are not aware of Total Quality Management principles and do not understand how it works. The study only relied on an accessible sample within the University and was based on their word not considering the fact that sometimes people would respond depending on what they think you want to hear and not sincerely. The result of this study does not only identify the obstacles of TQM but also provides a reference to the managers of this learning institutions as well as the wider business world. The research provides a direction for 1
Transcript of OBSTACLES TO THE IMPLEMENTATION OF TOTAL QUALITY MANAGEMENT AND ORGANIZATIONAL PERFORMANCE IN...
OBSTACLES TO THE IMPLEMENTATION OF TOTAL QUALITY MANAGEMENTAND ORGANIZATIONAL PERFORMANCE IN PRIVATE HIGHER LEARNING
INSTITUTIONS 1Okungu Norah Atieno, 2Dr. Ojera Patrick, 3Kwama Leonard
Ogweno1KCA University, School of Business and Public Management, P.O Box 3207- 40100 Kisumu, Kenya;
2Maseno University, School of Business and Economics, Private Bag, Maseno, Kenya:
AbstractThis paper aims to identify the main obstacles to theimplementation of Total Quality Management. The study is totest the structural order which would enhance Total QualityManagement and at the same time seek to discover the systemssensitivity to the human resources with its ultimate effecton performance. To do so, the findings of a stratifiedsample size comprising of top management team, academicheads of departments, lecturers, support staff and studentswas obtained for the study. Structured questionnaires wereadministered and an interview schedule was arranged for anumber of members chosen at random and all classrepresentatives. Secondary data was obtained from theUniversity reports on the Total Quality Managementimplementation and progress. Descriptive statistics havebeen used to analyse data. The data has been presented interms of tables and graphs. The study revealed that theimplementation of Total Quality Management in KCA Universityis facing challenges because members do not yet know howbest to implement it. At the same time some members are notaware of Total Quality Management principles and do notunderstand how it works. The study only relied on anaccessible sample within the University and was based ontheir word not considering the fact that sometimes peoplewould respond depending on what they think you want to hearand not sincerely. The result of this study does not onlyidentify the obstacles of TQM but also provides a referenceto the managers of this learning institutions as well as thewider business world. The research provides a direction for
1

both TQM scholars and managers and it can serve as a roadmapand a challenge to quality driven organizations.
Key Words – Total Quality Management,
IntroductionBy 1991, 93 per cent of manufacturing companies and 69 per
cent of service companies had implemented some form of
quality management practices. Despite this large and still
growing interest in quality management, however a recent
study of Total Quality Management (TQM) effectiveness
conducted by Soltani et al. (2003) found that less than a
third of the respondents rated their Quality Management
initiatives as having been “reasonably” or” very” successful
with other respondents providing a neutral or in a minority
of cases, a negative evaluation. (International Journal of
operations & Production Management). In the past few years,
a growing number of learning institutions faced with
mounting challenges of declining enrolments, cost
containment and public pressure for accountability, have
sought improved performance by joining industry in adapting
the quality management approaches of quality authorities
such as Deming (1986), Juran, Gryna and Bingham (1979), and
Ishikawa (1990). The American Council on Education (1993)
found that 70 per cent of higher education institutions are
using Total Quality Management (TQM) techniques. Higher
education has taken a different dimension in Kenya today.
Since it is very important to provide quality higher
2
education, the institutions have been working on measures to
improve the quality of their services and products. The
institutions are important for various reasons such as
providing human capital, offering learning opportunities and
providing avenue for research and development. Considering
the fact that higher education is being driven towards
commercial competition imposed by economic forces resulting
from the development of global education markets and the
reduction of government funding. They are now forced to seek
other financial sources and must try by all means to provide
high quality services.
A review of TQM Literature
Owlia and Aspinwall (1996) examined the views of different
professionals and practitioners on the quality of higher
education and concluded that customer orientation in higher
education is a generally acceptable principle. With the
changes in the environment the management of learning
institutions is presenting very unique challenges and
opportunities. This can be seen in the regular changes in
the curriculum at all levels of education. Even though the
government owns some of the learning institutions there are
a number that are privately owned. The private institutions
are self funded and face a lot of competition, which make
them put in consideration how well they would continuously
improve the quality of service they offer. As a result most
3
of them have tried different quality improvement models such
as Total Quality Management (TQM), Just in Time (JIT) and
Kaizen (Continuous improvement). Total quality Management
has been one of the models tried. Although higher education
institutions are increasingly adopting quality management
practices, there is evidence that many institutions are
struggling with the implementation challenges. If
educational institutions do not overcome these challenges,
they will not sustain their quality management efforts and
achieve anticipated results. (Innovative Higher Education,
Vol 20, No. 1 1995)
Management of Higher Learning Institutions in Kenya
The education sector has a major role to play in the
development of the Kenyan economy. The establishment of
private universities in Kenya and Africa as a whole is
relatively new. At independence there were about seven
universities in Africa. However by 2005 there were eighty
five and 316 public universities in Africa, Kihara (2005).
Kenya is leading in this expansion of private higher
learning institution in East Africa with sixteen in the year
2006 compared to three in 1980. This article is to examine
how these institutions can be able to overcome the obstacles
in achieving quality management which has been a challenge
to many universities. KCAU has taken the initiative to
ensure that quality management is practiced. The current
4
practice is that all the departments’ work towards achieving
the best quality.
There have been performance appraisals that are done every
six months and each employee is rated based on his
performance. Targets are set and employees are motivated to
achieve them.
Quality is maintained in finance, academic, human resource,
research and development. The organization defines what it
does, services provided and an avenue for customers to
question the performance of the university. All the members
are expected to be responsible and accountable to the
university. This is described in the mission statement which
addresses the need of diverse stakeholders such as
undertaking research, providing quality general academic and
career focused learning opportunities, offering relevant
learner support with the help of information and
communication technology, creating conducive working and
learning environment, contributing to a good and responsible
society by imparting moral values for sustainable individual
and societal development,, participating in his social
responsibility activities and meeting the needs of the
global competitive society.
The main strategic issues here are what Quality of education
are we going to provide, to whom are we going to provide
this and how will we be the best in the industry or how will
we compete effectively? In the past learning institutions
5
did not think about quality management since it was assumed
as the culture of all of them. Due to political, economic
social and technological challenges facing the education
industry its important to redirect strategies towards
ensuring quality production and working on issues that may
hinder effective quality management.
Statement of the problem
The private higher learning institutions provide
opportunities for students who cannot access places in the
few public learning institutions as well as a way of
creating human intellectual capital, providing avenue for
research and development. In Kenya there are 20 private
Universities as compared to 7 public universities.
Therefore, there is intense competition among the private
institutions. Each one of them is working on achieving
maximum quality possible both on the services and products
offered. As a result some have opted for the adoption of
Total Quality Management. Despite the widespread use of
Total Quality Management still most organizations have not
achieved the expected performance such as high enrolment,
minimum labour turnover, elimination of conflicts within
management and maximum employee motivation. However it is
not clear why this undesirable situation persists.
Even though Total Quality Management has been applied in
some institutions of higher learning and has experienced a
6
number of challenges such as low enrolment, high labour
turnover and even low morale among employees. The focus of
this study is to identify the main obstacles to the
implementation of Total Quality management. Previous studies
have been done on Total Quality Management and its impact in
different organizations; however, little research has been
done to determine the main obstacles in the implementation
of Total Quality Management in private higher institutions.
A primary concern among survey-based researchers has been
the issue of what makes Total quality Management work. There
are instances of failure to the implementation of Total
Quality Management or problems in the implementation of
Total quality management in different organizations and
especially in learning institutions where researchers have
not ventured enough to identify the obstacles in Total
Quality Management implementation. This brings us to the
question as to why Total Quality Management implementation
fails especially in higher learning institutions. The study
therefore seeks to determine the obstacles in the
implementation of Total Quality Management practices in
higher learning institutions with specifics to KCA
University.
Purpose of the study
The study was to determine the obstacles in the
implementation of Total Quality Management processes within
7
higher learning institutions with specific attention to
KCAU. The general objective of the study was to investigate
the main obstacles in Total Quality Management
implementation especially in KCA University in reference to
identifying the key obstacles to the realization of Total
Quality Management implementation in KCA University, to
determine how control the effects of the obstacles on
organizational performance and to find out ways of
overcoming these obstacles.
Methodology
A cross- section research design was used in which samples
from different groups were picked to indicate particular
characteristics at a particular period of time. It was
chosen because it was the most appropriate given that it was
affordable and data can be quickly collected. Moreover the
results obtained from the sample can be generalized to the
entire KCA University population. Furthermore the
characteristics of the variables measured take a longer time
to change. It involved administering questionnaire and
survey questions to a sample of KCA university employees and
students.
The study was conducted in KCA University at the Main Campus
in Nairobi, Kisumu Campus and the Kericho and Eldoret
affiliated colleges. KCA is a private university offering
certificate, diploma and undergraduate courses.
8

The research was carried out in all the university campuses
an. The population composed of 412 employees of the
university and 3500 students. The sample population size was
54 administration staff, 276 lecturers, 82 support staff and
1050 students. Given the small population the researcher
used questionnaires and an interview schedule. The
dimensions used were administration, lecturers, support
staff and students. Thereafter a random sampling technique
was used to identify the respondents except for the
administration where all of them were given questionnaires.
Finally a total of 1234 respondents emerged.
An interview was arranged for the Deputy Vice Chancellors,
Directors, Heads of departments, 30 lecturers chosen at
random, 20 employees and class representatives.
Table 1 : A table indicating the category, population nand
sample size selected.
Category Population Sample sizeAdministration 54 54Lecturers 276 100Support staff 82 30Students 3500 1050
To achieve the objectives of this study, primary was
collected from the various departments. Secondary data was
collected from the university reports on the progress of TQM
implementation and Minutes of TQM meetings.9
A questionnaire was administered to the top management,
middle and lower level managers, supervisors, lecturers,
employees and a percentage of the student population.
Interview schedule was also organized where 10 management
staff was selected to represent the various departments and
30 lecturers picked at random.
Preliminary techniques such as frequencies, distributions
and percentages were used for data evaluation. Descriptive
statistics particularly the mean and standard deviations
were also used to summarize both qualitative and
quantitative data. Pearson’s’ product moment correlation was
used to test the relationship between TQM applications
Processes and performance. The data was presented using
graphs and charts.
Data was also collected through interviewing a number of
staff and student representatives.
Findings
This section presents the results of the study.
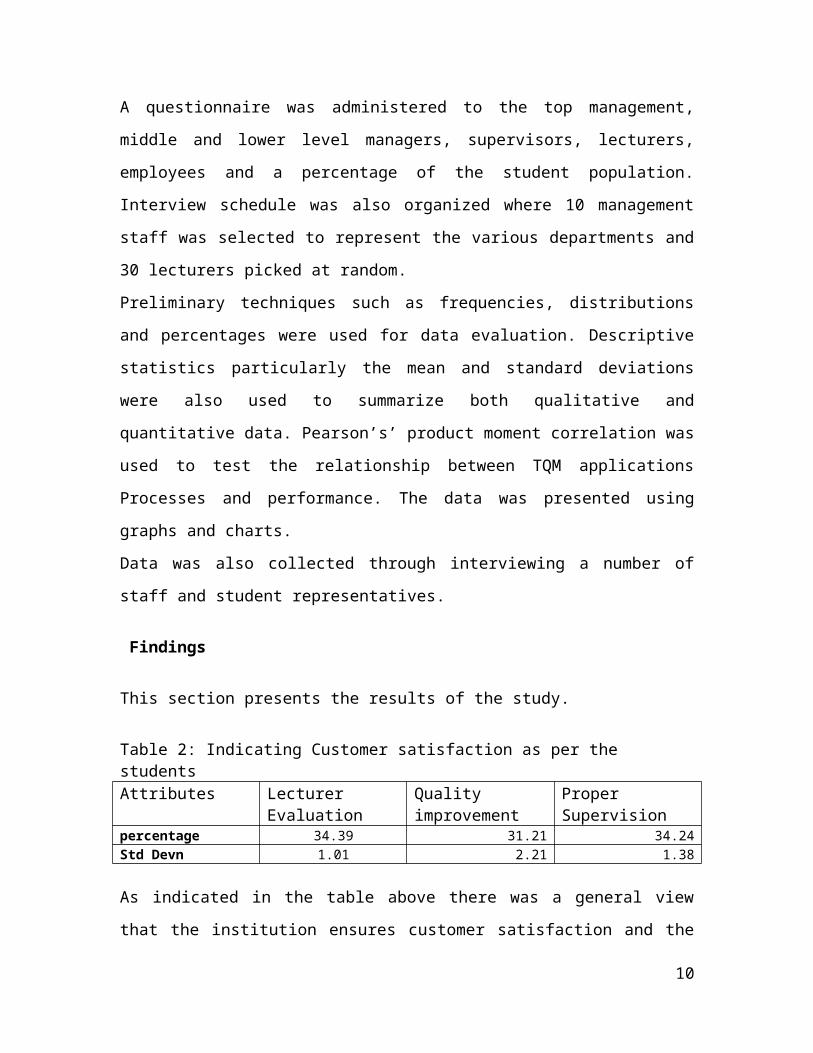
Table 2: Indicating Customer satisfaction as per the studentsAttributes Lecturer
EvaluationQuality improvement
Proper Supervision
percentage 34.39 31.21 34.24Std Devn 1.01 2.21 1.38
As indicated in the table above there was a general view
that the institution ensures customer satisfaction and the
10
students indicated variables such as regular lecturer
evaluations, quality improvement and proper supervision.
During the interview 34 percent of the student leaders
mentioned lecturer evaluation as a means of effective
customer satisfaction, 31 per cent cited quality improvement
in form of availing resources and making adjustment where
necessary while another 34 per cent talked of proper
supervision they experience in the institution.
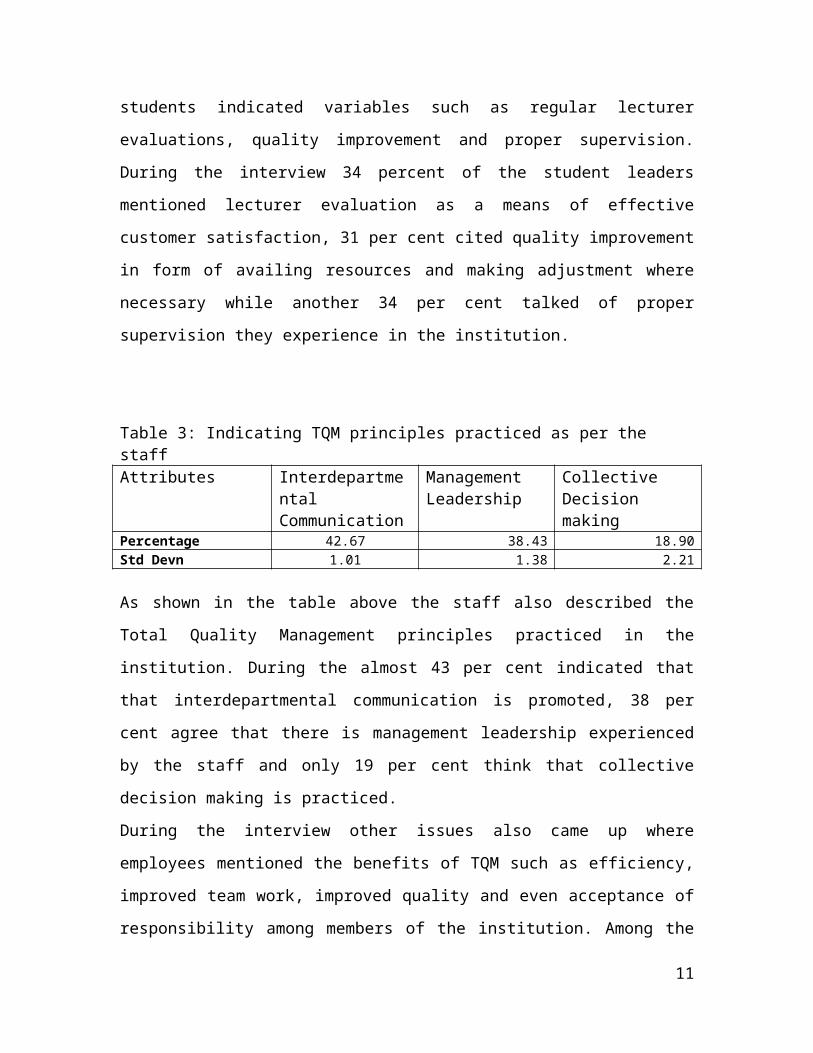
Table 3: Indicating TQM principles practiced as per the staffAttributes Interdepartme
ntal Communication
Management Leadership
Collective Decision making
Percentage 42.67 38.43 18.90Std Devn 1.01 1.38 2.21
As shown in the table above the staff also described the
Total Quality Management principles practiced in the
institution. During the almost 43 per cent indicated that
that interdepartmental communication is promoted, 38 per
cent agree that there is management leadership experienced
by the staff and only 19 per cent think that collective
decision making is practiced.
During the interview other issues also came up where
employees mentioned the benefits of TQM such as efficiency,
improved team work, improved quality and even acceptance of
responsibility among members of the institution. Among the
11

staff lecturers tend to think that the whole process is one
sided and the students do not understand what its all about
and this is one of the reasons why sill TQM implementation
is facing hurdles. Not everybody in the organization knows
what is happening.
Employees also indicated that as much as they are informed
of what is required they are not well trained hence they are
not well prepared for the changes that affect them during
implementation and this may result in resistance to the
implementation of TQM.
Generally there were mixed reactions coming from employees
where some have the fear of unknown and the rest are very
cautious of what they involve in within the organization. As
concerns organizational policies the implementation of TQM
as affected to some extent the policies of the organization
but the employees can not say the specifics. None of them
reported any changes in the organizational structure that
they were aware of. They also indicated that TQM has not
helped much in achieving organizational objectives yet.
4.2 Analysis of Data:
The following table summarizes the Students’ opinion on
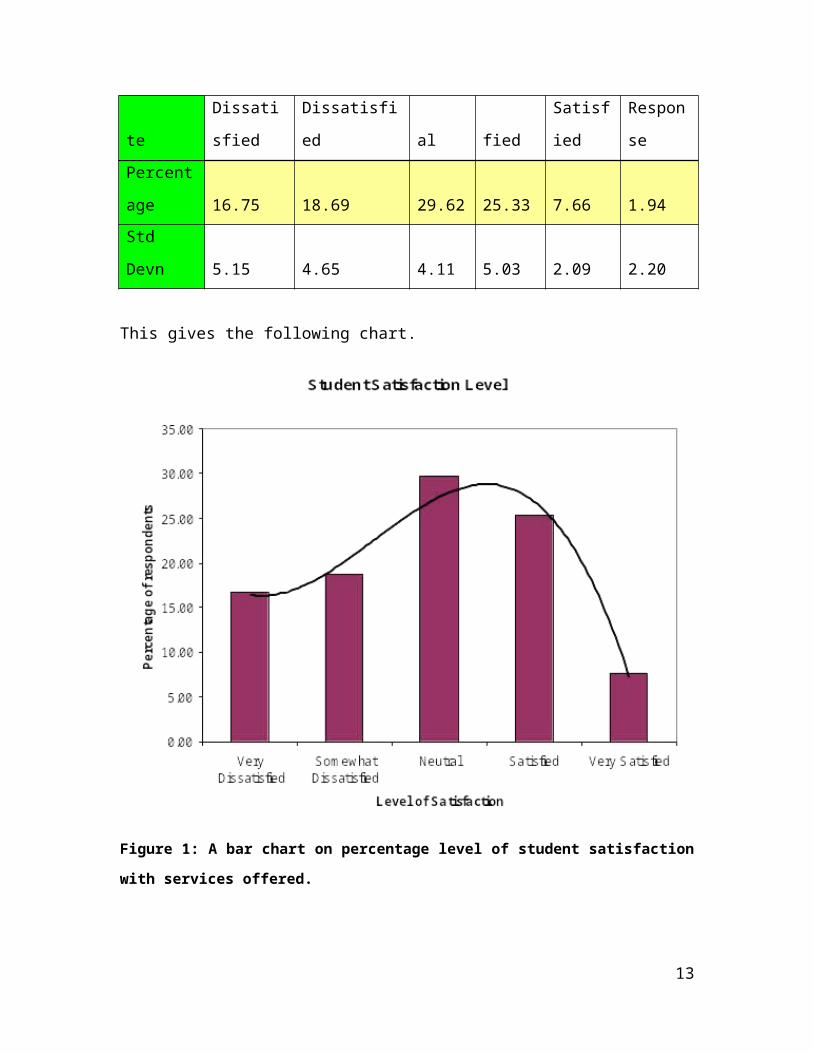
satisfaction with services offered by the university:Table 4: A table of percentage level of student satisfaction with
services offered.
Attribu Very Somewhat Neutr Satis Very No12
te
Dissati
sfied
Dissatisfi
ed al fied
Satisf
ied
Respon
sePercent
age 16.75 18.69 29.62 25.33 7.66 1.94Std
Devn 5.15 4.65 4.11 5.03 2.09 2.20
This gives the following chart.
Figure 1: A bar chart on percentage level of student satisfaction
with services offered.
13

From the table and the chart above, only 30 percent of the
students are either satisfied or very satisfied while 30%
are indifferent and 40 percent generally dissatisfied. This
casts a question on the success of implementation of TQM
principles. The percentages show below average success and
therefore bring in the question of finding out what
obstacles hinder the implementation of Total Quality
Management as described in the objectives.
Lecturing Staff Opinion:
1. On the level of adoption of TQM practices.
Table 5: A table of percentage level of adoption of TQM services
as per staff opinion.
Attribu
te
Strongl
y
Disagr
ee
Disagr
ee
Don’
t
Know
Agre
e
Strong
ly
Agree
No
Respons
ePercent
age 10.23 24.62
17.0
5
36.7
4 10.23 1.14
14

Std
Devn 2.42 2.81 1.70 4.00 2.25 0.65
The following chart explains the lecturers’ perception.
Fig. 2: A bar chart on percentage level of adoption of TQM as per
lecturer opinion.
Generally as shown both in the table and graph over 47
percent agree that the TQM practices enumerated in the
questionnaires have been adopted. 17 percent are indifferent
while the rest (35%) disagree. To a good extent we conclude
that TQM principles have been adopted by the university
management, however there are hurdles in the process that
must be worked on to define how these obstacles can be
achieved as outlined in the objectives.
15
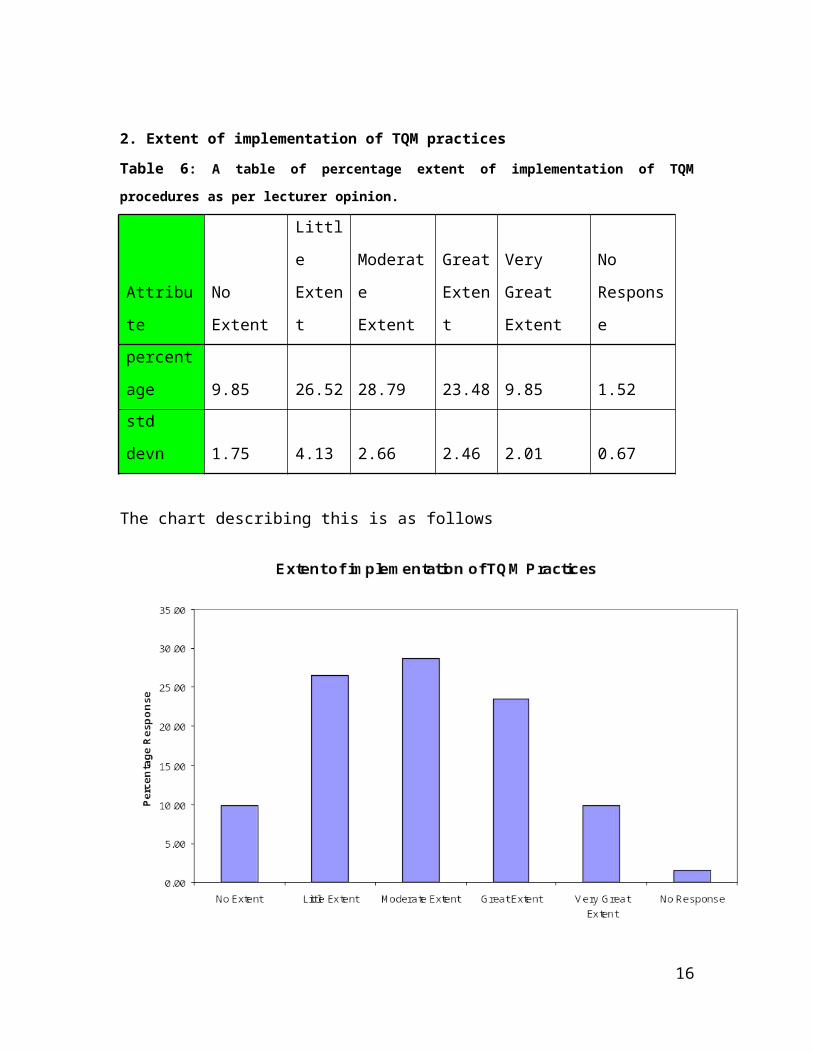
2. Extent of implementation of TQM practices
Table 6: A table of percentage extent of implementation of TQMprocedures as per lecturer opinion.
Attribu
te
No
Extent
Littl
e
Exten
t
Moderat
e
Extent
Great
Exten
t
Very
Great
Extent
No
Respons
epercent
age 9.85 26.52 28.79 23.48 9.85 1.52std
devn 1.75 4.13 2.66 2.46 2.01 0.67
The chart describing this is as follows
16
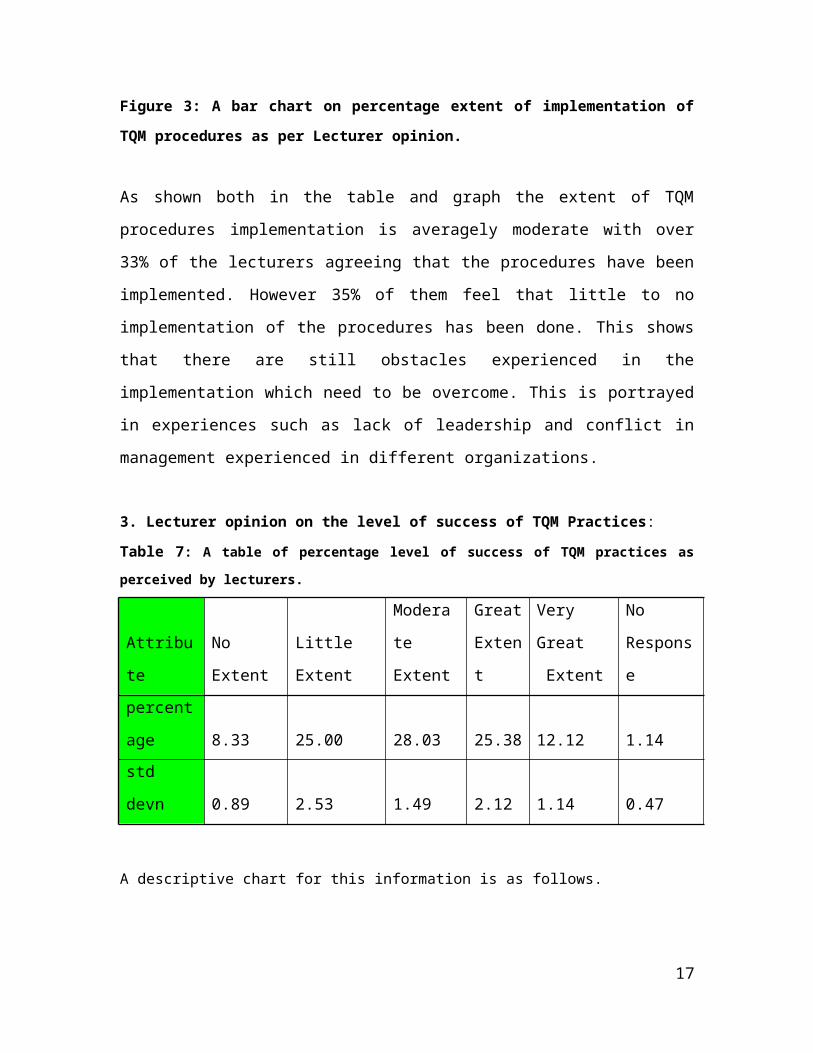
Figure 3: A bar chart on percentage extent of implementation of
TQM procedures as per Lecturer opinion.
As shown both in the table and graph the extent of TQM
procedures implementation is averagely moderate with over
33% of the lecturers agreeing that the procedures have been
implemented. However 35% of them feel that little to no
implementation of the procedures has been done. This shows
that there are still obstacles experienced in the
implementation which need to be overcome. This is portrayed
in experiences such as lack of leadership and conflict in
management experienced in different organizations.
3. Lecturer opinion on the level of success of TQM Practices:
Table 7: A table of percentage level of success of TQM practices asperceived by lecturers.
Attribu
te
No
Extent
Little
Extent
Modera
te
Extent
Great
Exten
t
Very
Great
Extent
No
Respons
epercent
age 8.33 25.00 28.03 25.38 12.12 1.14std
devn 0.89 2.53 1.49 2.12 1.14 0.47
A descriptive chart for this information is as follows.
17

Figure 4: A bar chart on percentage level of success of TQM
practices as perceived by lecturers.
The extent of success TQM procedures is also averagely
moderate with over 37% of the lecturers agreeing that the
procedures have been successful. Conversely, 32% of them
feel that there is little to no success of the TQM practice.
This in relation to the objectives shows that the challenges
that are experienced are being managed effectively and with
proper training, communication and leadership TQM will be a
success.
The Administration’s Opinion:
1. On the level of adoption of TQM practices.
18

Table 8: A table of percentage level of adoption of TQM practices
as per the administrative staff.
Attribu
te
Strongl
y
Disagr
ee
Disagr
ee
Don’t
Know
Agre
e
Strong
ly
Agree
No
Respons
epercent
age 9.09 20.45 13.64
38.6
4 13.64 4.55Std
Devn 1.04 1.44 1.69 2.29 1.12 0.52
This has been used to construct the chart in Figure 5
Figure 5: A bar chart on percentage level of adoption of TQM
practices as per the Administrative staff.
19
From the graph and the chart we note that over 52 percent of
the managing staff feel that TQM practices have been
adopted. Only 13 percent are indifferent. However 29 percent
are not upbeat in the level of adoption. Comparing this with
lecturer opinion, we see a slight difference of opinion. The
administrators agree more than lecturers on the level of
adoption of the practices. At this point the lecturers tend
to be the hurdle in adopting TQM practices and therefore
there is need to make the lecturers understand the need of
TQM. As TQM affects the whole organization if the lecturers
are left behind the organization would not achieve its
objectives. It therefore means that lecturers’ indifference
is an obstacle in implementing Total Quality Management
principles.
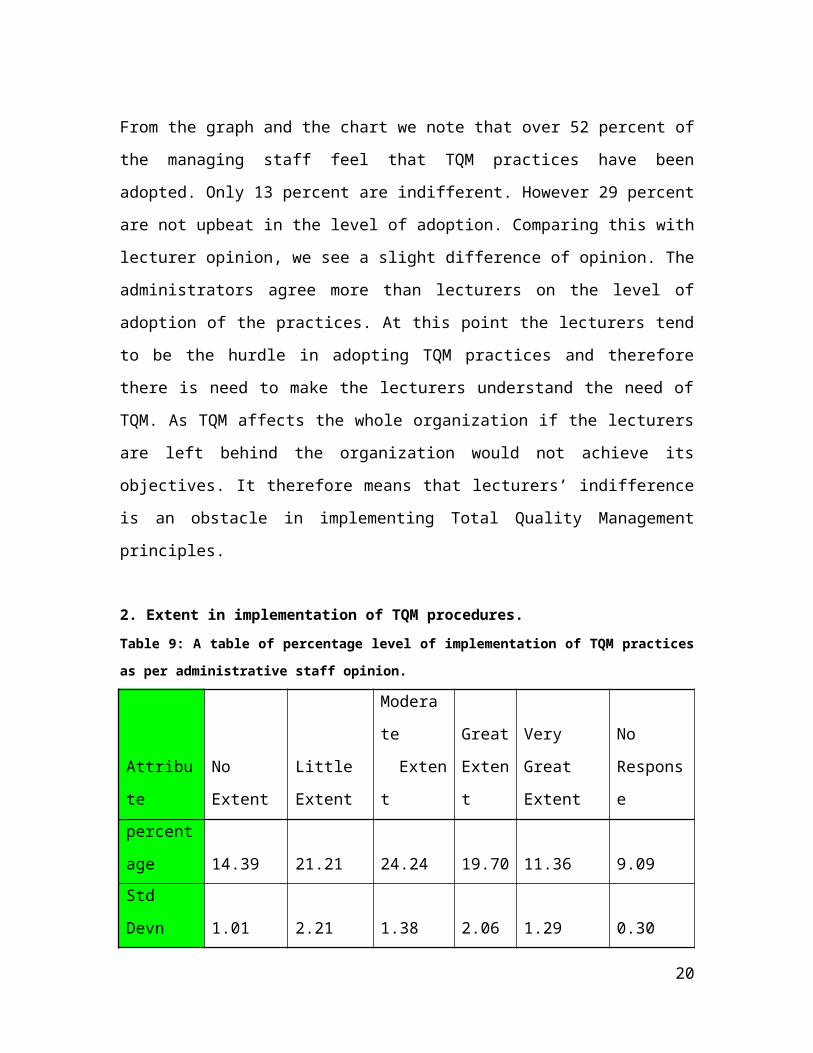
2. Extent in implementation of TQM procedures.Table 9: A table of percentage level of implementation of TQM practices
as per administrative staff opinion.
Attribu
te
No
Extent
Little
Extent
Modera
te
Exten
t
Great
Exten
t
Very
Great
Extent
No
Respons
epercent
age 14.39 21.21 24.24 19.70 11.36 9.09Std
Devn 1.01 2.21 1.38 2.06 1.29 0.30
20
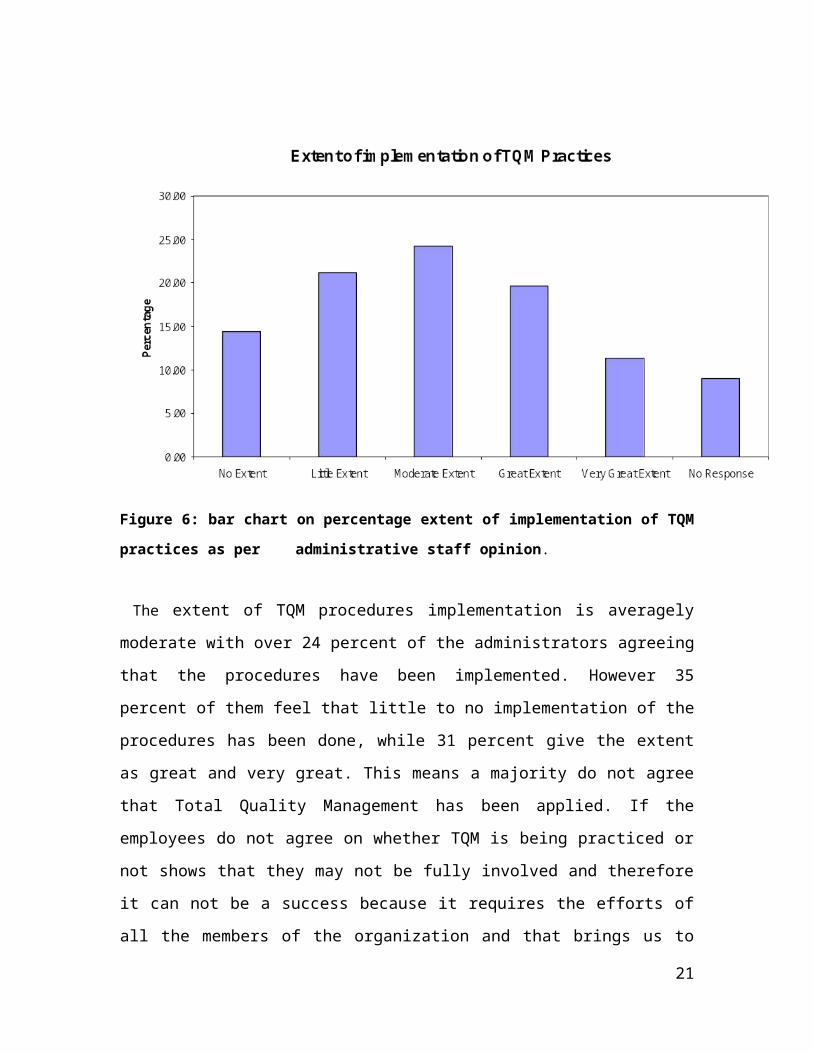
Figure 6: bar chart on percentage extent of implementation of TQM
practices as per administrative staff opinion.
The extent of TQM procedures implementation is averagely
moderate with over 24 percent of the administrators agreeing
that the procedures have been implemented. However 35
percent of them feel that little to no implementation of the
procedures has been done, while 31 percent give the extent
as great and very great. This means a majority do not agree
that Total Quality Management has been applied. If the
employees do not agree on whether TQM is being practiced or
not shows that they may not be fully involved and therefore
it can not be a success because it requires the efforts of
all the members of the organization and that brings us to
21

the objective of how to overcome the obstacles experienced
in TQM implementation.
3. Extent of success on implementation of TQM procedures:Table 10: A table of percentage extent of success on implementation of
TQM procedures as per administrators’ opinion.
Attribu
te
No
Extent
Littl
e
Exten
t
Modera
te
Exten
t
Great
Exten
t
Very
Great
Extent
No
Respons
epercent
age 11.36 18.94 34.09 16.67 9.85 9.09Std
Devn 0.81 1.35 1.30 1.34 1.08 0.30
22

Figure 7: A bar chart on percentage extent of success on
implementation of TQM procedures as per administrators’ opinion.
As shown above in the table and graph above the extent of
success of TQM procedures is also averagely moderate with
over 35 percent of the administrators agreeing that the
procedures have been successful while 30 percent of them
feel that there is little to no success of the TQM
practices. 35 percent is not a majority and therefore there
is still a problem in implementation success meaning that
the obstacles in successful implementation are being felt.
These could be lack of training, inadequate information and
even poor leadership skills.
Correlation Analysis:
23
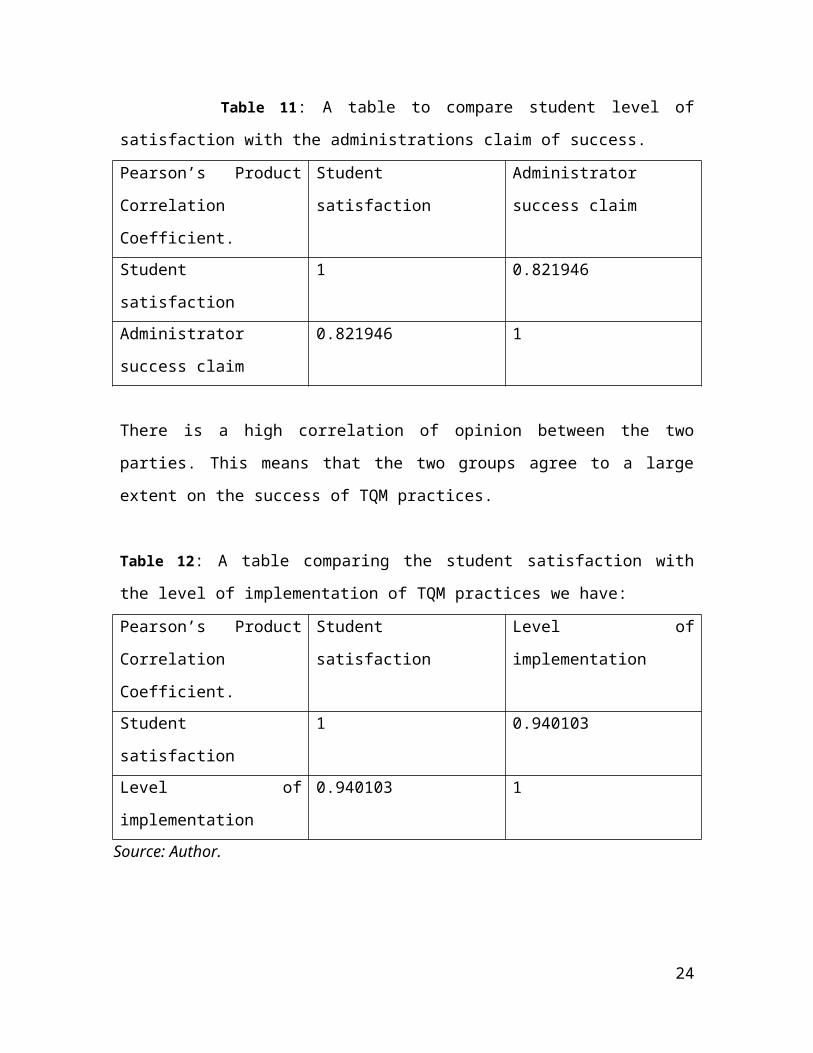
Table 11: A table to compare student level of
satisfaction with the administrations claim of success.
Pearson’s Product
Correlation
Coefficient.
Student
satisfaction
Administrator
success claim
Student
satisfaction
1 0.821946
Administrator
success claim
0.821946 1
There is a high correlation of opinion between the two
parties. This means that the two groups agree to a large
extent on the success of TQM practices.
Table 12: A table comparing the student satisfaction with
the level of implementation of TQM practices we have:
Pearson’s Product
Correlation
Coefficient.
Student
satisfaction
Level of
implementation
Student
satisfaction
1 0.940103
Level of
implementation
0.940103 1
Source: Author.
24
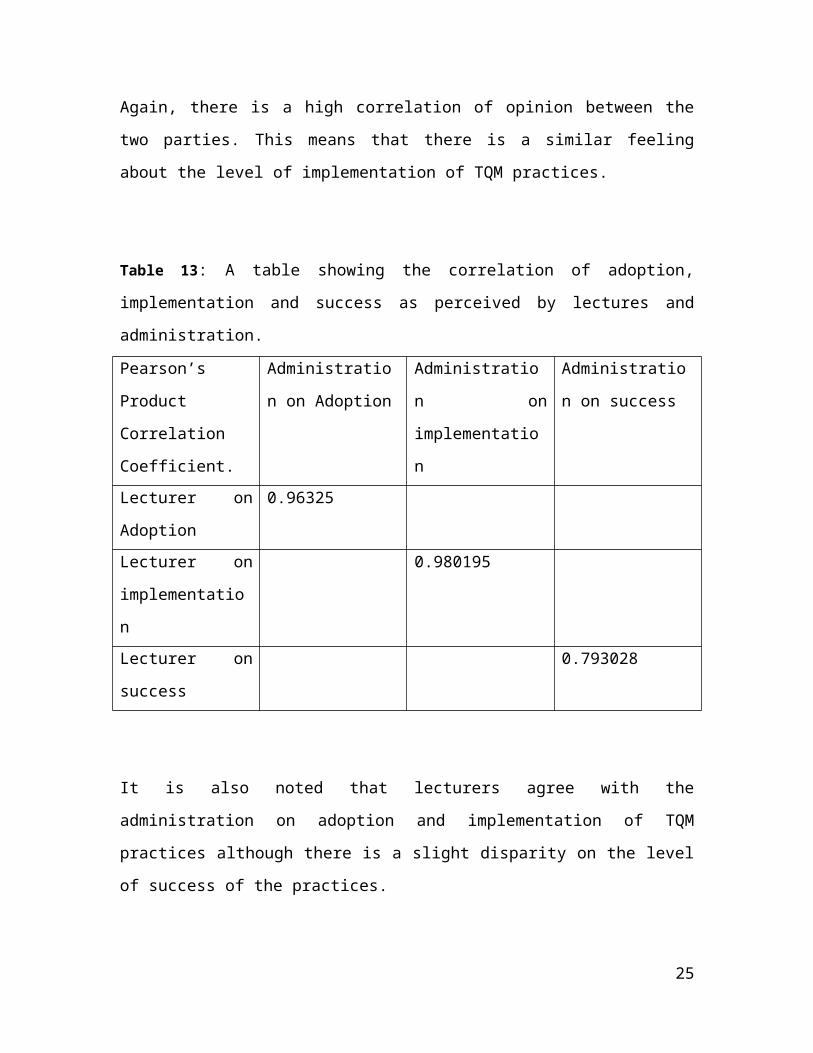
Again, there is a high correlation of opinion between the
two parties. This means that there is a similar feeling
about the level of implementation of TQM practices.
Table 13: A table showing the correlation of adoption,
implementation and success as perceived by lectures and
administration.
Pearson’s
Product
Correlation
Coefficient.
Administratio
n on Adoption
Administratio
n on
implementatio
n
Administratio
n on success
Lecturer on
Adoption
0.96325
Lecturer on
implementatio
n
0.980195
Lecturer on
success
0.793028
It is also noted that lecturers agree with the
administration on adoption and implementation of TQM
practices although there is a slight disparity on the level
of success of the practices.
25
Conclusions
It can be concluded that Total Quality Management is being
practiced in KCA University but the different people
affected do not agree on how it is being implemented and how
it should be implemented. The top management argues that its
being the way it should while the lecturers and the support
staff have a different opinion. As concerns the students
there are a number who are not sure of what is going on
while there are those who are satisfied with the services as
well as dissatisfied. It therefore shows that Total Quality
management has not made the ultimate impact ad is still
experiencing some obstacles in its implementation.
The research explores the relationship between Total Quality
Management and organizational performance and concluded that
principles such as feedback for continuous improvement, top
management support, employee involvement, employee
empowerment and customer focus are directly related to level
of student satisfaction, staff motivation, improved student
enrolment, low labour turnover and team work.
26
ReferencesAshok, R. (1996). Total Quality Management. Across
Functional Perspective, New York, Donnelley/Crawford’s
Ville.
Association of Commonwealth universities (2005) commonwealth
Universities Yearbook 79th Edition
Barrie G. Dale (2006), Managing Quality.4th Edition
Christopher & Larker (W.P 96-01). Quality Strategy,
strategic control systems and organizational
Performance. The Wharton school University of
Pennsylvania Philadelphia.
Collins B.G (1995) Dictionary of Sociology.
27

Creg Bounds, Gipsy Ranney, Lyle Yorks & Mel Adams (2004).
Total Quality Management (Toward the emerging
Paradigm).
Fred R. David, Strategic Management. (Concepts and Cases)
Heinz Wehrich & Harold Kootnz (2001). Management (A global
Perspective). 10th Edition.
Innovative Higher Education (1995), Vol 20
Ishikawa Kaoru (1984) Guide to Quality Control. 2nd Edition.
Ishikawa Kaoru (1988) The pursing Performance. 1st Edition
James G. March (1991) Organizational Learning. 1st Edition
James, W.D & Bowen D.E., Management Theory and Total
Quality. (Improving research and practice through
Theory Development). The Academy of Management Review,
Vol 19 (July 1994 PP392-392)
Joel, R.E (1990), Total Quality Management. USIU
John A. Pearce 11 and Richard B. Robinson Jnr. Formulation,
Implementation and control. 9th Edition
28

John Butman & Juran, J.M (1997), Quality & a Century of
Improvement
Juran, J.M & Kenneth S. Stevens (2000), Overcoming
Resistance to Organizational Change.
Juran, J.M (1997), A lifetime of Influence
Juran, J.M (1992), Quality by Design. The new steps in
planning quality into goods and services. New York, the
Free Press (McMillan, Inc)
Laurie J. Mulins. Management and Organizations. 4th Edition.
Olive, M. Mugenda (2003). Research Methods Quantitative and
Qualitative approaches, Nairobi ACTS Press 1999.
Pearce &Robinson (2005), Strategic Management. New York,
McGraw Hill.
Tom Peters & Nancy Austin (1986), A Passion for Excellence.
New York, Boston, Warner Books- USA.
29
Thomas C. P., Total Quality Management Implementation and
Competitive Advantage. A Review and Empirical Study.
Strategic Management Journal Vol. 144 No. (1 February
2001)
Thomas T. J. and Waterman R. H (2006), In Search of
Excellence. New York, Boston, Warner Books- USA
T. N. Chhabra. Principles and Practices of Management. 2nd
Edition
Uma Sekaran, (2003). Research Methods for business. 4th
Edition Southern Illinois University, John Wiley &Sons
Inc.
Wentland, E.J. & Smith, K.W (1993). Survey Research Methods.
University of Chicago Press.
30