Nusiebeh Nahar Falah Alrwashdeh Economics and Finance ...
239
i A Study on Jordanian Commercial Banking – An Empirical Investigation on the Effects of Liquidity Risk, Risk-Based Capital Requirements and Capital Regulations Nusiebeh Nahar Falah Alrwashdeh Economics and Finance School of Business University of Portsmouth April 2021 The thesis is submitted in partial fulfillment of the requirements for the award of the degree of Doctor of Philosophy in Economics and Finance from the University of Portsmouth.
-
Upload
khangminh22 -
Category
Documents
-
view
4 -
download
0
Transcript of Nusiebeh Nahar Falah Alrwashdeh Economics and Finance ...

i
A Study on Jordanian Commercial Banking – An Empirical
Investigation on the Effects of Liquidity Risk, Risk-Based Capital
Requirements and Capital Regulations
Nusiebeh Nahar Falah Alrwashdeh
Economics and Finance
School of Business
University of Portsmouth
April 2021
The thesis is submitted in partial fulfillment of the requirements for the award of the degree
of Doctor of Philosophy in Economics and Finance from the University of Portsmouth.

ii
ABSTRACT
The research contained in this thesis investigates the main determinants of Jordanian bank
performance and related issues covering liquidity risk, risk-based capital requirements and
capital regulations using data for 13 Jordanian commercial banks covering the period 2003-
2015. This period includes measures taken by policy makers, including the Central Bank of
Jordan (CBJ), to liberalize and reform the Jordanian banking sector to improve bank
performance. The thesis is structured as follows: chapter one introduces the subject matter of
the thesis; chapter two provides a select survey of the literature. Chapter three briefly
discusses developments in the Jordanian banking sector, including the reform measures since
the 1990s. Chapters four, five, six and seven are the core empirical chapters of the thesis.
Chapter four examines the impact of competition, liquidity risk and market interest rate
environment on Jordanian banks’ profitability using Fixed Effects (FE), Random Effects
(RE) and Generalized Method of Moments (GMM) methods. The findings of chapter four
provide evidence that reform policies favored the overall profitability and efficiency of the
Jordanian banking sector. However, the evidence suggests the need for improvements in bank
competition. Liquidity risk is shown to have a significant positive impact on profitability,
while the banks’ size, capital adequacy ratio, and equity to assets all reduce profitability
measures. Chapter five examines the relationship between bank efficiency/productivity,
capital, and risk using Three-Stage Least Square (3SLS) methods. The results show that
return on assets (ROA), capital, size and stock market development (SMD) are essential for
Jordanian banks’ efficiency and risk measures. Chapter six measures how competition and
efficiency of the banking sector influence the cost of credit for borrowing firms using data
from 118 firms using fixed effect and random effect method. The findings indicate that firm
size, bank competition, and GDP are the main drivers of firms borrowing costs. Chapter seven
studies the impact of bank funding liquidity risk on Jordanian commercial banks' risk-taking
behavior and analyses the impact of the CBJ 2000 imposed deposit insurance scheme on
Jordanian banks' liquidity creation using a FE, a RE and difference in difference methods
(DD). In relation to the risk determinants, the results show that large-capitalized banks tend
to be involved in riskier investment decisions than their less capitalized counterparts. Also,
an increase in deposit funding increases both liquidity creation and risk-weighted assets. The
difference in differences results indicates that after the introduction of the deposit insurance
scheme, banks with excessive deposits have lower rates of liquidity funding risk, and
consequently reduced probability to default.

iii
ACKNOWLEDGEMENTS
First, I must thank God as nothing is achievable in my life without god. I would also like to
express my considerable gratitude to my principal advisor, Dr. Everton Dockery, for his
guidance, support, and the time he has devoted to me during the development of the present
study. He generously spent innumerable hours designing my reading, reading many incomplete
drafts, providing several comments and suggestions, and encouraging my research. Without
his advice and encouragement over the four years, I have worked on this thesis, the subject
matter of the thesis would never have happened. The final product has benefited in all respects
from his guidance and I cannot overstate my gratitude. I have been extremely fortunate to have
him as my advisor.
For my Ph.D. study, without the support and love that my family (parents, brothers, sisters
friends and husband) has provided me would not have been possible. To my parents whom I
cannot thank adequately enough for their patient care and love, to my brothers and sisters for
their encouragement, continuous support and help. To my husband who support me to finish
the viva in a relax mind. Unfortunately, during the final stages of my Ph.D., my mother passed
away to which I also dedicate this achievement to her. I would like to acknowledge those I
came in contact with while completing this body of work to support me when I experienced
stressful and some difficult periods.

iv
CONTENTS
Table of Contents
ABSTRACT ............................................................................................................................................ ii
ACKNOWLEDGEMENTS .......................................................................................................................... iii
CONTENTS .............................................................................................................................................. iv
DECLARATION .......................................................................................................................................... i
LIST OF TABLES ........................................................................................................................................ ii
LIST OF FIGURES ...................................................................................................................................... v
LIST OF ABBREVIATIONS ........................................................................................................................ vi
CHAPTER 1 .............................................................................................................................................. 9
1.1 Research background and motivation to the study of Commercial Banking in Jordan
9
1.2 Research Objectives ................................................................................................................ 16
1.3 Research Method .................................................................................................................... 21
1.4 Research summary and conclusion ......................................................................................... 25
CHAPTER 2 ............................................................................................................................................ 28
2.1 Introduction ............................................................................................................................ 28
2.2 Bank profitability indicators literature review ........................................................................ 33
2.3 Capital and capital adequacy requirements literature review ............................................... 39
2.4 Risk-based capital literature review ........................................................................................ 42
2.5 Capital regulations literature review ...................................................................................... 45
2.6 Bank liquidity, liquidity risk, and credit risk literature review ................................................ 47
2.7 Summary and Conclusion........................................................................................................ 50
CHAPTER 3 ............................................................................................................................................ 58
3.1 Introduction ............................................................................................................................ 58
3.2 Overview of the banking system in Jordan ............................................................................. 61
3.2.3 CBJ Regulation and the Implementation of Basel II and III in Jordan .................................. 67
3.3 Financial soundness indicators of the Jordanian banking sector ........................................... 68
3.3.1 Assets, Deposits and Loans Structure................................................................................... 68
3.3.2 Sources and uses of funds of Jordanian banks ..................................................................... 72
3.3.3 Financial strength indicators for the Jordanian banking sector ........................................... 72
3.4 Summary and Conclusion........................................................................................................ 79
CHAPTER 4 ............................................................................................................................................ 80
4.1 Introduction ............................................................................................................................ 80

v
4.2 Literature review ..................................................................................................................... 81
4.2.1 Literature review on bank competitive conditions ............................................................... 81
4.2.2 Literature review of the impact of risk on bank profitability ............................................... 83
4.2.3 Literature review on the impact of market interest rate on bank profitability .................... 84
4.2.4 Literature review on bank profitability indicators................................................................ 85
4.2.5 Research Questions .............................................................................................................. 87
4.3 Data and Methodology ..................................................................................................... 88
4.3.1 Data ...................................................................................................................................... 88
4.3.2 Competition model ............................................................................................................... 90
4.3.3 Liquidity risk model .............................................................................................................. 93
4.3.4 Interest rate model............................................................................................................... 95
4.3.5 Descriptive statistics ............................................................................................................. 96
4.3.6 Empirical models .................................................................................................................. 99
4.3.6.1 Models of competition and bank profitability .............................................................. 99
4.3.6.2 Models of liquidity risk and bank profitability ............................................................ 102
4.3.6.3 Models of interest rate, risk-taking, and bank profitability ........................................ 103
4.4. Empirical results ................................................................................................................... 105
4.5 Summary and conclusion ...................................................................................................... 128
CHAPTER 5 .......................................................................................................................................... 131
5.1 Introduction ........................................................................................................................ 131
5.2 Literature review ................................................................................................................... 132
5.3 Background on risk analysis, efficiency and bank regulations in Jordan .............................. 136
5.4 Empirical Approach ............................................................................................................... 137
5.4.1 Data .................................................................................................................................... 137
5.4.2 Descriptive statistics ........................................................................................................... 138
5.4.3. Efficiency and risk models ................................................................................................. 139
5.4.5 Empirical methodology ...................................................................................................... 142
5.5 Results ................................................................................................................................... 142
5.6 Summary and conclusion ...................................................................................................... 150
CHAPTER 6 .......................................................................................................................................... 152
6.1 Introduction ........................................................................................................................ 152
6.2 Literature review ................................................................................................................... 153
6.3 Empirical Approach ............................................................................................................... 155
6.3.1 Data .................................................................................................................................... 155
6.3.2 Descriptive statistics ........................................................................................................... 156
6.3.3. Efficiency and cost of credit models .................................................................................. 156

vi
6.3.4 Empirical methodology ...................................................................................................... 158
6.4 Results ................................................................................................................................... 159
6.4.1 Efficiency, Competition and cost of credit results .............................................................. 159
6.6 Summary and conclusion ...................................................................................................... 162
Chapter 7 ............................................................................................................................................. 163
Liquidity Funding and Risk-Taking Behavior of Jordanian Commercial Banks .................................... 163
7.1 Introduction .......................................................................................................................... 163
7.2 Literature review ................................................................................................................... 165
7.2.1 Theoretical motivation ....................................................................................................... 166
7.3 Institutional background of the Jordanian banking system .................................................. 167
7.4. Methodology ........................................................................................................................ 169
7.4.1 Data and empirical models ................................................................................................ 170
7.5 Results ................................................................................................................................... 191
7.6 Summary and Conclusion...................................................................................................... 195
CHAPTER 8 .......................................................................................................................................... 198
Concluding Remarks............................................................................................................................ 198
8.2 Summary of the main findings .............................................................................................. 199
8.5 Research Limitations ............................................................................................................. 208
8.6 Directions for future research ............................................................................................... 209
Bibliography ................................................................................................................................ 210
Appendixes .......................................................................................................................................... 230

i
DECLARATION
“Whilst registered as a candidate for the above degree, I have not been registered
for any other research award. The results and conclusions embodied in this thesis
are the work of the named candidate and have not been submitted for any other
academic award.”
Signed:
Word Count: 82149

ii
LIST OF TABLES
Chapter 1:
Introduction
TABLE 1 1 SELECTED BANK INDICATORS 2003-2015. ........................................................................................... 12
Chapter 3:
Background of the Jordanian Banking Sector
TABLE 3 1 PROFILE OF THE JORDANIAN BANKS UNTIL 2015. ............................................................................... 63 TABLE 3 2 ASSETS, LOANS, AND DEPOSITS STRUCTURE FOR JORDANIAN BANKS 2003-2015. ............................ 70 TABLE 3 3 FINANCIAL SOUNDNESS INDICATORS FOR THE JORDANIAN BANKING SECTOR 2003-2015. .............. 78
Chapter 4:
Assessing the Effects of Competition, Risk, and Market Interest Rate on Bank Profitability:
An Empirical Analysis of the Jordanian Banking Sector
TABLE 4. 1VARIABLES CONSIDERED IN ASSESSING THE IMPACT OF COMPETITION ON THE JORDANIAN BANKS'
PROFITABILITY (2003-2015). ........................................................................................................................ 88 TABLE 4. 2VARIABLES CONSIDERED IN ASSESSING THE IMPACT OF LIQUIDITY RISK ON JORDANIAN BANKS
PROFITABILITY (2003-2015). ........................................................................................................................ 89 TABLE 4. 3VARIABLES CONSIDERED IN ASSESSING THE IMPACT OF INTEREST RATE ON JORDANIAN BANKS
PROFITABILITY AND RISK TAKING (2003-2015). ........................................................................................... 90 TABLE 4. 4SUMMARY STATISTICS (COMPETITION MODEL). ................................................................................. 97 TABLE 4. 5SUMMARY STATISTIC (LIQUIDITY RISK MODEL). ................................................................................. 98 TABLE 4. 6 SUMMARY STATISTIC (INTEREST RATE MODEL). ................................................................................ 99 TABLE 4. 7INTERPRETING THE ROSSE-PANZAR H-STATISTIC. ............................................................................. 100 TABLE 4. 8THE ROSSE-PANZAR H-STATISTIC RESULTS FOR JORDANIAN COMMERCIAL BANKS COMPETITIVE
ENVIRONMENT AND EQUILIBRIUM TEST USING COMMISSION AND RETURN ON ASSETS (2003-2005). . 108 TABLE 4. 9THE ROSSE-PANZAR H-STATISTIC RESULTS FOR JORDANIAN COMMERCIAL BANKS COMPETITIVE
ENVIRONMENT AND EQUILIBRIUM TEST USING COMMISSION AND RETURN ON ASSETS (2006-2008). . 109 TABLE 4. 10THE ROSSE-PANZAR H-STATISTIC RESULTS FOR JORDANIAN COMMERCIAL BANKS COMPETITIVE
ENVIRONMENT AND EQUILIBRIUM TEST USING COMMISSION AND RETURN ON ASSETS (2009-2011). . 110 TABLE 4. 11THE ROSSE-PANZAR H-STATISTIC RESULTS FOR JORDANIAN COMMERCIAL BANKS COMPETITIVE
ENVIRONMENT AND EQUILIBRIUM TEST USING COMMISSION AND RETURN ON ASSETS (2012-2014). . 111 TABLE 4. 12THE ROSSE-PANZAR H-STATISTIC RESULTS FOR JORDANIAN COMMERCIAL BANKS COMPETITIVE
ENVIRONMENT AND EQUILIBRIUM TEST USING COMMISSION AND RETURN ON ASSETS (2015-2017). . 112 TABLE 4. 13EMPIRICAL RESULTS OF GMM MODEL OF THE IMPACT OF COMPETITION (LERNER INDEX) ON THE
JORDANIAN COMMERCIAL BANKS PROFITABILITY (2003-2015)................................................................ 113 TABLE 4. 14EMPIRICAL RESULTS OF POOLED OLS OF THE IMPACT OF LIQUIDITY RISK ON THE JORDANIAN
COMMERCIAL BANKS PROFITABILITY (2003-2015), CO3 MEASURED BY TOTAL ASSETS. .......................... 117 TABLE 4. 15EMPIRICAL RESULTS OF FIXED AND RANDOM EFFECT MODEL OF THE IMPACT OF LIQUIDITY RISK
ON THE JORDANIAN COMMERCIAL BANKS PROFITABILITY (2003-2015). CO3 MEASURED BY TOTAL ASSETS
................................................................................................................................................................... 118

iii
TABLE 4. 16EMPIRICAL RESULTS OF POOLED OLS FOR THE IMPACT OF LIQUIDITY RISK ON THE JORDANIAN
COMMERCIAL BANKS PROFITABILITY (2003-2015), CO3 MEASURED BY TOTAL LOANS. .......................... 119 TABLE 4. 17EMPIRICAL RESULTS OF FIXED AND RANDOM EFFECT MODEL FOR THE IMPACT OF LIQUIDITY RISK
ON THE JORDANIAN COMMERCIAL BANKS PROFITABILITY (2003-2015). CO3 MEASURED BY TOTAL LOANS
................................................................................................................................................................... 120 TABLE 4. 18EMPIRICAL RESULTS OF POOLED OLS FOR THE IMPACT OF LIQUIDITY RISK ON THE JORDANIAN
COMMERCIAL BANKS PROFITABILITY (2003-2015) , CO3 MEASURED BY TOTAL DEPOSITS. ..................... 121 TABLE 4. 19EMPIRICAL RESULTS OF FIXED AND RANDOM EFFECT MODEL FOR THE IMPACT OF LIQUIDITY RISK
ON THE JORDANIAN COMMERCIAL BANKS PROFITABILITY (2003-2015). CO3 MEASURED BY TOTAL
DEPOSITS .................................................................................................................................................... 122 TABLE 4. 20EMPIRICAL RESULTS OF THE POOLED OLS FOR THE IMPACT OF INTEREST RATE ON JORDANIAN
COMMERCIAL BANKS PROFITABILITY AND RISK-TAKING TAKING (2003- 2015). ....................................... 125 TABLE 4. 21EMPIRICAL STATIC RESULTS OF INSTRUMENTAL VARIABLE ESTIMATION OF THE IMPACT OF
INTEREST RATE ON JORDANIAN COMMERCIAL BANKS PROFITABILITY AND RISK-TAKING (2003 -2015). 126 TABLE 4. 22EMPIRICAL DYNAMIC RESULTS OF GMM ESTIMATION OF THE IMPACT OF INTEREST RATE ON
JORDANIAN COMMERCIAL BANKS PROFITABILITY AND RISK-TAKING (2003 -2015). ................................ 127
Chapter 5:
The Relationship between Bank Efficiency, Capital and Risk: Evidence from Jordan’s
Banking System
TABLE 5.2 VARIABLES’ DEFINITIONS AND SOURCES ........................................................................................... 137 TABLE 5.3 SUMMARY STATISTICS (EFFICIENCY MODEL) .................................................................................... 138 TABLE 5.4 AVERAGE DEA EFFICIENCY SCORES USING MALMQUIST INDEX (2003-2015) ................................... 141 TABLE 5.5THREE-STAGE LEAST SQUARE ESTIMATION FOR THE RELATIONSHIP BETWEEN BANK CAPITAL,
TECHNICAL EFFICIENCY AND RISK-TAKING IN THE JORDANIAN BANKING SYSTEM. .................................. 145 TABLE 5.6 THREE-STAGE LEAST SQUARE ESTIMATION FOR THE RELATIONSHIP BETWEEN BANK CAPITAL,
TECHNOLOGICAL EFFICIENCY AND RISK-TAKING IN THE JORDANIAN BANKING SYSTEM. ........................ 146 TABLE 5.7 THREE-STAGE LEAST SQUARE ESTIMATION FOR THE RELATIONSHIP BETWEEN BANK CAPITAL, PURE
TECHNICAL EFFICIENCY AND RISK-TAKING IN THE JORDANIAN BANKING SYSTEM. .................................. 147 TABLE 5.8 THREE-STAGE LEAST SQUARE ESTIMATION FOR THE RELATIONSHIP BETWEEN BANK CAPITAL, SCALE
EFFICIENCY AND RISK-TAKING IN JORDANIAN BANKING SYSTEM. ............................................................ 148 TABLE 5.9 THREE-STAGE LEAST SQUARE ESTIMATION FOR THE RELATIONSHIP BETWEEN BANK CAPITAL, TOTAL
FACTOR PRODUCTIVITY AND RISK-TAKING IN JORDANIAN BANKING SYSTEM. ........................................ 149
Chapter 6:
The Impact of Bank Efficiency and Competition on Cost of Credit: Evidence from Jordan’s
Banking System
TABLE 6.1 VARIABLES’ DEFINITIONS AND SOURCES (COST OF CREDIT MODEL). ............................................... 155 TABLE 6.2 SUMMARY STATISTICS (COST OF CREDIT MODEL) ............................................................................ 156 TABLE 6.3 OLS, FIXED AND RANDOM ESTIMATIONS FOR THE RELATIONSHIP BETWEEN COST OF CREDIT, BANK
EFFICIENCY AND COMPETITION. ................................................................................................................ 160 TABLE 6.4 OLS, FIXED AND RANDOM ESTIMATIONS FOR THE RELATIONSHIP BETWEEN COST OF CREDIT, BANK
EFFICIENCY (TOTAL FACTOR PRODUCTIVITY) AND COMPETITION (LARGE AND SMALL COMPANIES 2003-
2015). ......................................................................................................................................................... 161

iv
Chapter 7:
Liquidity Funding and Risk-Taking Behavior of Jordanian Commercial Banks (2003-2015)
TABLE 7.1 THE JORDANIAN FINANCIAL AND BANKING SECTOR ASSETS TO GDP (2003-2017). ......................... 169 TABLE 7.2 VARIABLES’ DESCRIPTION AND DEFINITIONS .................................................................................... 171 TABLE 7.3 SUMMARY STATISTICS ....................................................................................................................... 172 TABLE 7.4 SUMMARY OF LIQUIDITY CREATION CALCULATION: LIQUIDITY CLASSIFICATION OF BANK ACTIVITIES.
................................................................................................................................................................... 173 TABLE 7.5 EMPIRICAL RESULTS OF POOLED OLS, FE OF THE JORDANIAN COMMERCIAL BANKS LIQUIDITY
CREATION (2003-2015) .............................................................................................................................. 177 TABLE 7.6 EMPIRICAL RESULTS OF POOLED OLS, FE OF THE JORDANIAN COMMERCIAL BANKS LLP (2003-2015).
................................................................................................................................................................... 178 TABLE 7.7 EMPIRICAL RESULTS OF POOLED OLS, FE OF THE JORDANIAN COMMERCIAL BANKS RWA (2003-
2015). ......................................................................................................................................................... 179 TABLE 7.8 EMPIRICAL RESULTS OF POOLED OLS, FE OF THE JORDANIAN COMMERCIAL BANKS Z-SCORE (2003-
2015). ......................................................................................................................................................... 180 TABLE 7.9 EMPIRICAL RESULTS OF POOLED OLS, RE OF THE JORDANIAN COMMERCIAL BANKS’ LIQUIDITY
FUNDING (2003-2015). .............................................................................................................................. 181 TABLE 7.10 EMPIRICAL RESULTS OF GLS, FE, AND RE OF THE JORDANIAN COMMERCIAL BANKS (LIQUIDITY
CREATION, LOAN LOSS PROVISION, RISK WEIGHTED ASSETS, AND Z-SCORE) FOR THE PERIOD 2003-2006.
................................................................................................................................................................... 183 TABLE 7.11 EMPIRICAL RESULTS OF GLS, FE, AND RE OF THE JORDANIAN COMMERCIAL BANKS (LIQUIDITY
CREATION, LOAN LOSS PROVISION, RISK WEIGHTED ASSETS, AND Z-SCORE) FOR THE PERIOD 2007-2009.
................................................................................................................................................................... 184 TABLE 7.12 EMPIRICAL RESULTS OF GLS, FE, AND RE OF THE JORDANIAN COMMERCIAL BANKS (LIQUIDITY
CREATION, LOAN LOSS PROVISION, RISK WEIGHTED ASSETS, AND Z-SCORE) FOR THE PERIOD 2010-2015.
................................................................................................................................................................... 185 TABLE 7.13 EMPIRICAL RESULTS OF GLS, RE, AND FE OF THE JORDANIAN COMMERCIAL LIQUIDITY FUNDING.
................................................................................................................................................................... 186 TABLE 7.14A EMPIRICAL RESULTS FOR THE IMPACT OF THE DEPOSIT INSURANCE SCHEME ON THE JORDANIAN
BANKING LIQUIDITY CREATION USING DID APPROACH FOR THE PERIOD (1995-2015). ........................... 188 TABLE 7.15B EMPIRICAL RESULTS OF THE IMPACT OF THE DEPOSIT INSURANCE SCHEME ON THE JORDANIAN
BANKING LIQUIDITY CREATION USING DID APPROACH FOR THE PERIOD (1995-2015). ........................... 189 TABLE 7.16A THE IMPACT OF THE DEPOSIT INSURANCE ON THE JORDANIAN BANKING LIQUIDITY CREATION
USING DID APPROACH FOR THE PRE AND POST-PERIOD OF THE SCHEME. .............................................. 190 TABLE 7.17B THE IMPACT OF THE DEPOSIT INSURANCE ON THE JORDANIAN BANKING LIQUIDITY CREATION
USING DID APPROACH FOR THE PRE AND POST-PERIOD OF THE SCHEME. .............................................. 191

v
LIST OF FIGURES
Chapter 3:
Background of the Jordanian Banking Sector
FIGURE 3.1 TOTAL ASSETS IN FOREIGN AND LOCAL CURRENCY (2003-2015). ..................................................... 70
FIGURE 3.2 TOTAL DEPOSITS IN FOREIGN AND LOCAL CURRENCY (2003-2015). ................................................. 71
FIGURE 3.3 TOTAL LOANS IN FOREIGN AND LOCAL CURRENCY (2003-2015). ..................................................... 71
FIGURE 3.4 NON-PERFORMING LOANS TO TOTAL LOANS (2003-2015). .............................................................. 73
FIGURE 3.5 COVERAGE RATIO (2003-2015). ......................................................................................................... 73
FIGURE 3.6 CAPITAL ADEQUACY RATIO (2003-2015). .......................................................................................... 74
FIGURE 3.7 LEVERAGE RATIO (2003-2015). .......................................................................................................... 75
FIGURE 3.8 INTEREST MARGIN TO GROSS INCOME (2003-2015). ........................................................................ 76
FIGURE 3.9 RATE OF RETURN ON EQUITY (2003-2015). ....................................................................................... 77
FIGURE 3.10 RATE OF RETURN ON ASSETS (2003-2015). ..................................................................................... 77
FIGURE 3.11 LIQUIDITY RATIO (2003-2015). ........................................................................................................ 78
Chapter 7:
Liquidity Funding and Risk-Taking Behavior of Jordanian Commercial Banks (2003-2015)
FIGURE 7.1 THE JORDANIAN FINANCIAL SECTOR ASSETS GDP (2003-2017). ..................................................... 168 FIGURE 7.2 THE JORDANIAN BANKING SECTOR ASSETS GDP (2003-2017). ....................................................... 169

vi
LIST OF ABBREVIATIONS
- ABJ – Association of Banks in Jordan
- ASE – Amman Stock Exchange BHC – Bank Holding Company
- ATM – Automated Teller Machine.
- BCBS – Basel Committee on Banking Supervision
- CAP – Total Capital
- CBJ – Central Bank of Jordan
- CD – Certificates of Deposit
- CEE – Central and Eastern European
- CIN – Cost-to-Income Ratio
- CR – Concentration Ratio
- DEA – Data Envelopment Analysis
- DID – Difference-in-Difference Approach
- DMU – Decision Making Unit
- ECB – European Central Bank
- EU – European Union
- EVA – Economic Value Added
- FE – Fixed Effect
- FED – Federal Reserve
- GDP – Gross domestic product
- GLS – Generalised least squares model
- GMM – General Method of Moments
- HHI – Herfindahl–Hirschman Index

vii
- IAS – International Accounting Standard
- IMF – International Monetary Fund
- INF – Inflation
- IV – Instrumental Variable
- JD – Jordanian Dinar
- JDIC – Jordanian Deposit Insurance Corporation
- JODIBOR – Interbank Lending Interest Rates
- LC – Liquidity Creation
- LTD – Loan-to-Deposit Ratio
- LGMM – Local Generalized Method of Moments
- MENA – Middle East and North Africa
- MPI – Malmquist Productivity Index
- MS – Market Share
- NIM – Net interest margin
- NPL – non-performing loans
- NS – Non-Structural Model
- OECD – Organisation for Economic Co-operation and Development
- OLS – Ordinary least squares model
- Q – Tobin’s Q Ratio
- RE – Random Effects
- REPO – Repurchase Agreement Rate
- ROA – Return on assets
- ROE – Return on equity
- RWA – Risk Weights of Assets

viii
- SCP – Structure Conduct Performance Hypothesis
- SEC – Securities Exchange Commission
- SEE – South Eastern European
- SSA – Sub-Saharan Africa countries
- SUR – Seemingly unrelated regression model
- TA – Total Assets
- UK – The United Kingdom
- US – the United State of America
- WB – World Bank
- WTO – World Trade Organization
- 3SLS – Three-Stage Least Squares
- 2SLS – Two-Stages Least Square

9
CHAPTER 1
Introduction
1.1 Research background and motivation to the study of Commercial
Banking in Jordan
The global financial crisis of 2007-2010 impacted the world economy in many ways, including
deep financial losses in asset value, bankruptcies, and the rethinking of regulation applied to
international financial markets and institutions. The global financial crisis that originated in the
United States of America (USA), because of subprime lending had a global impact and
spillover into Jordan. This indicates that the USA's financial sector problems can significantly
impact the real economy of a developing country such as Jordan. In the immediate onset of the
2008 crisis, the central banks have immediately affected the governments and regulators
devised by measures designed to stabilize their financial systems and in particularly the
banking sector. Central bankers aimed to protect the financial institutions and, in particular, the
banks, against potential risks and economic shocks , to safeguard the economies and provide
signal to international financial markets and the global economy. Those careful and thoughtful
measures were being taken to safeguard the international financial system and to ensure the
continued growth and development of the global economy. It is recognized that the
performance of financial sector is very sensitive to changes the business cycle (Smirlock, 1985,
Berger and DeYoung, 1997b), inflation (Molyneux and Thornton, 1992, Demirguc-Kunt and
Levine, 2000), as well as the interest rate environment (Bourke, 1989).
Particularly the banking sectors are driven by internal and external factors. Internal
factors are those related to bank-specific characteristics such as size, capital, liquidity, risk, and
capital requirements. In contrast, external factors are associated with the extrinsic legal and
economic environments governing the banking industry. As a developing country exposed to
global shocks, Jordan's economy was not protected from the severity of economic and financial
shocks. Jordan has been confronting several shocks, including the global financial crisis and
the Arab Spring since 2007. It also had a severe dampening effect on the domestic economy.
The imposition of a tight fiscal policy that followed these crises is accompanied by prudent
monetary policy (which was accompanied by several cuts in interest rates in 2007-2010) from

10
the Central Bank of Jordan (CBJ). It helped in some ways to maintain the economic and
monetary stability to sustain growth rates, high levels of reserves and price stability. While
financial stability was maintained by the CBJ via the application of prudent supervisory and
legislative policy. It may be argued to consistent with the policy measures imposed by the G7
countries central banks. Besides the imposition of these measures, the management of the
banking system in the aftermath of global banking crisis contributed towards protecting the
financial system against the recurrence of a crisis, given that the banking system is relatively
conservative in its approach to banking, with high levels of capital and low exposure to
sovereign euro denominated debt.
Since 1948 Jordan’s banking sector has been one of the strongest performing sectors of
the Jordanian economy. Therefore, it’s given a special role in Jordan’s financial system, the
banking sector has played an active role in terms of development and growth of the economy,
in the provision of credit facilities for the household and business sectors which enabled the
economy to continue on an upward trajectory growth trend. Currently, the number of banks in
Jordan stands at 25 banks are engaged in the conventional banking business. In 1934 only 2
banks were operating in Jordan, but increased to five by 1955. During the 1990s, 25 banks
operated in Jordan’s banking sector, thirteen engaged in commercial banking activities, three
in Islamic banking activity, and nine are foreign commercial banks. Commercial banks provide
customers with various services (modern and traditional) such as accepting deposits and
granting credit to households, businesses and other outlets. Other income-generating activities
include the provision of credit card, economic and financial consulting, bill collection, and
financing government development and economic plans. Deposits are the most important
sources of funds for these banks who are Islamic banks aside. They generate the majority of
their earnings (or profits) from the spread rate, which is the difference between the debt interest
and credit interest.
In 2003, Jordanian banks conducted their banking operations through a network of 581
branches and 158 representative offices, compared to 786 branches and 83 representative
offices in 2015. The banking sector is a key sector of the Jordanian economy which is
accounted in 2015 for 18.82 percent of Gross Domestic Product (GDP) compared to 3.85
percent of GDP in 2003. It its widely considered a profitable sector for local and foreign
investors with a return on assets (ROA) of 1.3 per cent in 2015 compared to 0.07 per cent in
2003, and return on equity (ROE) of 10.3 percent in 2015 compared to 9.9 percent in 2003.

11
The primary source of income for Jordanian banks is the Interest yield from loans with interest
margins accounting for around 77.4 per cent of total banks income in 2015 compared to 63.7
percent in 2003.
Despite the political and economic risks in the Middle East and North Africa region
(MENA), the banking system in Jordan provided stability due to resilience and the soundness
of its financial position that continued to improve and demonstrated the robust nature of the
banking sector. As a result, the banking sector has been an integral source of support to the
economy during periods of economic uncertainty. Furthermore, aided by the CBJ pro-growth
monetary stance, which followed from the growth in deposits and profits at commercial banks
during the period represented by the data used in the present study, the banking sector continued
to post healthy performance.
Historically, monetary policy in Jordan has evolved over two stages. The first stage in
1964-1990, is characterized by the use of direct and traditional monetary instruments such as
setting of interest rates to control banks operations, while the second stage from 1991-to the
present was largely influenced by the banking crisis of 1989 which as a result of its impact on
the Jordanian economy compelled the government to co-operate with the World Bank and the
IMF to develop a structural reform program so as to enable to restructure and rebuild the
economy in the aftermath of the crisis. One of the main goals of the structural reform program
was to improve the structure and efficiency of Jordanian banks which was enabled because of
measures designed to liberalize the banking system.
Prior to the 1980s banking in Jordan was dominated by domestic banks as foreign banks
found it extremely difficult to penetrate the domestic banking market and it is a large degree
helped to insulate the local banking market from foreign competition. Thus, Jordanian
commercial banks operated in an oligopolistic environment which meant that interest rates on
both credits and deposits were determined monopolistically. Over the period of 1988–1991
following the devaluation of Jordanian Dinar (JD) the CBJ increased interest rates as a way of
incentivizing Jordanian citizens to save. But as a result of the financial difficulties, combined
with the collapse of Petra Bank and six other financial institutions linked to it. The banking
system suffered by crisis which came from climaxed in August 1989 as a result of inadequate
banking regulations which ignored widespread fraud in the banking sector. Moreover, since
the level of market abuse had reached a level such that it could no longer go unnoticed. The
CBJ was forced to implement measures which one are compelled the Jordanian banks to
12
comply with operating ratios while imposing credit limits also. It would force the banks to
carryout proper risk credit analysis on all loan advances. The second reason is the high level of
Non-performing loans (NPL) resulting from the overexposure of the banks to the real estate
market. And finally, the speculative activity of banks in the foreign exchange market was
exposed by many banks to excessive foreign exchange exposure.
From the early 1990s to onward the CBJ implemented a series of measures designed to
facilitate the deregulation of the Jordanian financial system. One of the key policy measures
was the removal of restrictions on interest rates to help promote a diversified, efficient, and
competitive banking system, as it was thought that the operational flexibility of the banks was
one way of increasing their competitiveness. Following these measures, the interest rate
margins increased at Jordanian banks and the CBJ adopted a floating policy for both debit and
credit markets interest rate. Another crucial policy change was the decision to allow market
forces to set market interest rates. While the decision to remove restrictions on investment
activities had favourable effect on all the important indicators of bank performance.
During the period of 2003-2015, most of these indicators are reflected by a significant
improvement in assets quality, profitability and efficiency of the Jordanian banking sector.
However, it is worth noting that the financial crises had temporary and mitigating effect on the
development of these indicators, especially during the period represented by the global banking
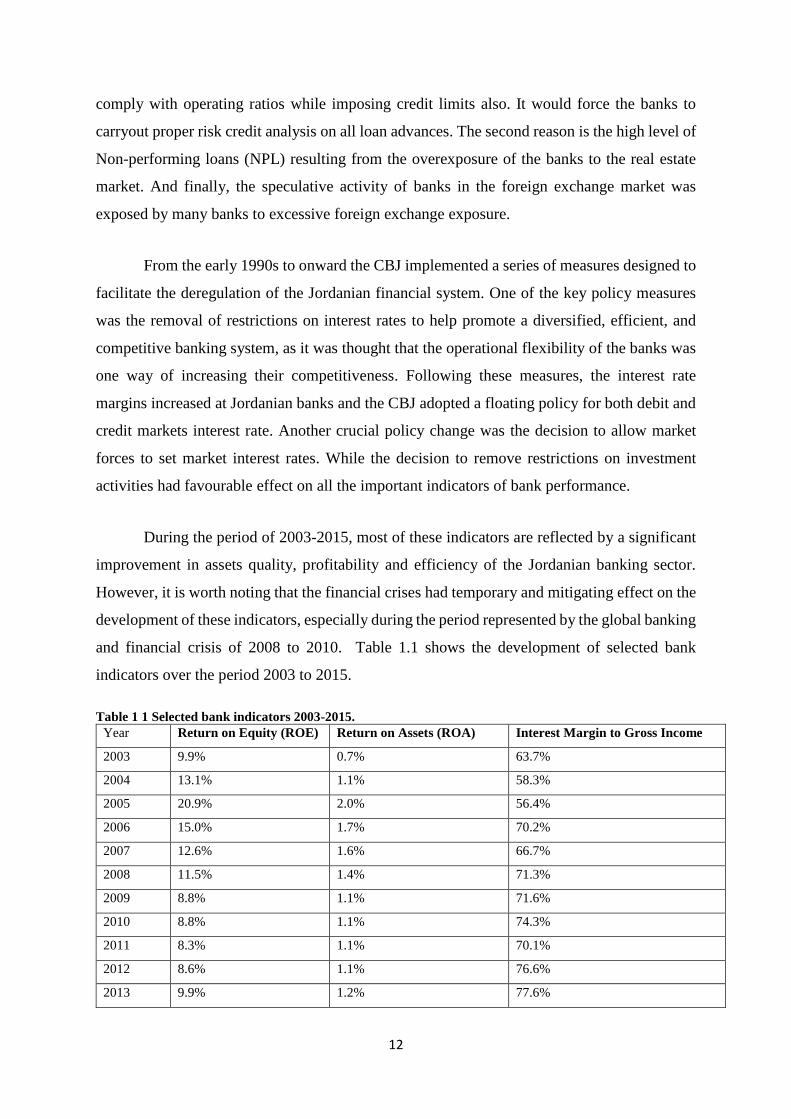
and financial crisis of 2008 to 2010. Table 1.1 shows the development of selected bank
indicators over the period 2003 to 2015.
Table 1 1 Selected bank indicators 2003-2015.
Year Return on Equity (ROE) Return on Assets (ROA) Interest Margin to Gross Income
2003 9.9% 0.7% 63.7%
2004 13.1% 1.1% 58.3%
2005 20.9% 2.0% 56.4%
2006 15.0% 1.7% 70.2%
2007 12.6% 1.6% 66.7%
2008 11.5% 1.4% 71.3%
2009 8.8% 1.1% 71.6%
2010 8.8% 1.1% 74.3%
2011 8.3% 1.1% 70.1%
2012 8.6% 1.1% 76.6%
2013 9.9% 1.2% 77.6%

13
2014 11.1% 1.4% 77.9%
2015 10.3 1.3% 77.4%
Source: CBJ Database 2003-2015
Bank managers usually face difficult choices to secure high returns for their
shareholders while keeping risks under control. These excessive risk intentions are then
controlled by the CBJ regulatory measures which are designed to maintain the stability of the
banking system. Following the CBJ reforms which created a low-interest-rate environment in
an effort to stimulate lending and the channeling of funds for the development of the economy,
the Jordanian Deposit Insurance Corporation (JDIC) was established in 2000s as a part of the
reform programs to protect deposit-taking institutions against potential internal and external
shocks. In addition, the CBJ also encouraged the integration of risk management policies in
banking operations to enhance the safety and soundness of banks and to strengthen the financial
system as a whole. The imposition of stress testing exercises in all banks was seen as a
necessary requirement following the Basel Committee on Banking Supervision (BCBS)
announcement in 2009. A bank’s stress test is one conducted under various hypothetical
scenarios for example, an economic recession, a crisis in financial markets, or external shocks,
designed to determine whether a bank is adequately capitalized to withstand the effects of any
adverse economic development that would ultimately impair a bank’s balance sheet.
The 2008 global financial crises on the Jordanian economy were largely felt in the real
sector of the economy. This was due in part to the country's high dependence on imported food
and oil and the cost of external finance which became more difficult and expensive to access,
causing shareholders in Jordan to value cash at a premium since the crisis (Ahid and Augustine,
2012). As a result, the profitability of the banking sector was deeply affected. In a study by
(Ahid and Augustine, 2012) on Jordanian banking. The authors split the post-financial crisis
period in Jordan into two stages. The first stage extends from April 2008 to December 2008
and the second stage runs from the period 2008 – 2011. The findings note that during the first
period, the impact of the crises was driven by the downturn in the values of grants from
developed and international donors who were adversely affected by the crises. The response of
the CBJ was to apply measures to protect the banking sector to ensure its bank stability against
the crises. One such measure was the imposition of strict loan classification to reduce
unnecessary exposure, with interest rate set at 10.5 percent for housing loans.
Despite such measures, many depositors withdrew their savings in large amounts which

14
led to a decline in the number of deposits in foreign currency from 5370.1 million JD in 2007
to 4754.1 million JD in 2008. However, confidence in the stability of Jordanian banks was
restored when the government declared that it would fully guarantee all bank deposits. To
prevent a further run-on Jordanian banks, the CBJ required the banks to increase their capital
(both in JD and foreign currency) to cover any potential liquidity shortages. The CBJ also
decreed that the banks should stress test conditions against liquidity levels. And following the
widespread imposition of Basel III, stress testing became one of the main tools applied by
banks in their effort to withstand regional and global shocks and thereby hedge against potential
risky positions. According to the CBJ the results of these tests are not only helped in
determining the required level of capital and liquidity but also protected the banking system.
To strengthen the solvency of banks and their ability to face banking risk with some
degree of confidence. In 2000 the CBJ amended the 2000 law regarding the minimum capital
of licensed banks. In this respect the CBJ raised the minimum capital of banks to 100 million
JDs for Jordanian banks and 50 million JD for branches of foreign banks. In 2011, the CBJ
amended the 1971 Act with respect to medium-term grants of licensed banks to increase bank
lending to the real sectors of the economy to boost economic growth and the economy
following the recession. In 2012 the CBJ updated the operational framework for monetary
policy to steer the level of bank reserves surplus and interest rate lending between banks. In a
move that would help to make Jordanian banks more flexible with respect to bank liquidity
management, the CBJ continued to apply the corridor system within the operational framework
for monetary policy whereby the CBJ sets the floor and ceiling of policy rate while at the same
time allowing other money market rates such as the interbank rate to wander within this floor
and ceiling.
On the regulatory front in 2013 the CBJ updated many instructions in the field of
banking supervision and regulation and 2014 issued a number of instructions related to
corporate governance and the role of audit committee in the branches of foreign banks
operating in the banking sector of Jordan. Other policy measures that had a calming effect on
the banking crises were the government’s guarantee of all bank deposits until the end of
December 2009, which helped to re-establish investors trust as earlier noted. During this period
the CBJ cut interest rates three times until April 2009, thus bringing the benchmark rate to 5.25
percent. In an effort to enhance bank liquidity the CBJ reduced banks' reserve requirements
from 10 percent to 7 percent in October 2008 (European Commission, 2010).

15
The importance of the study is to investigate the impact of the reform program, Arab
Spring, Global Financial Crises and the Basel I, II, and III on the Jordanian commercial banks
during the 2003 and 2015 as the Jordanian market faced a huge event affected the banking
sector directly as mentioned above. The research studied of 13 Jordanian commercial banks
that are listed in Amman Stock Exchange which they present 94% of the Jordanian banking
system assets, the minimum CAR of the CBJ is 12% and the Jordanian commercial banks CAR
reached 21% which give the importance to study the impact of the high CAR on the bank
performance and the risk-taking behavior. The research examines eleven hypotheses covering
four empirical topics that investigated the factors which affecting the Jordanian commercial
banks performance, competition, efficiency, capital and risk-taking behavior, which they are
trend areas needs to study especially after the Global financial crises 2008. One of the main
reasons behind this investigation is the rare of the studies that examined the same topic in the
Middle East in general and especially in Jordan. Findings of the study takes it’s important as it
give and highlight the impact of the new capital requirement regulations, liquidity risk and risk-
based capital regulation on the Jordanian commercial banks which directly may help the CBJ
regulators to take the right and logical decision to improve and enhance the sector. It is helping
the banks manager as well to take the right decision in order to minimize the banks risks. The
study results have its main impact on the soundness and the safety of the Jordanian banking
system as the policy maker can see the impact of the reform, liberalization and deregulation
policy they did adopt on the banking system which give them a sight of the efficient of the
adopted policy.
The study only focused on one aspect of banking sector indicators which is a risk and
overlooked indicators related to productivity, efficiency and profitability. Thus, there is a need
for a comprehensive empirical assessment of the impact of the recent CBJ reforms on
performance, risk and efficiency indicators. This research is the first of its kind to cover an
extended time span from 2003 until 2015 while considering the effects of some major
incidences namely the 2008 global financial crises, Basel II and III accords announcements
and regional political shocks such as the Arab Spring in the Middle East area and especially
Jordan which makes a direct contribution to the existing literature by filling this gap in the
Middle East area. The study's importance may be important to examine it for the Palestine,
Syrian, Iraq and Lebanon banking system as it will show the impact of immigration from those
countries as a result of war on the banking system. The huge amount of money that moved to
Jordan due to the huge number of refugees also has a huge impact on the banks' performance.

16
There is a considerable gap in the literature on banking performance indicators in
Middle Eastern countries especially Jordan. And despite the reforms undertaken there have
been few attempts to assess the impact of the reform program on the efficiency, profitability
and risk behavior of the Jordanian banking sector. Most of the recent studies that have assessed
the impact of the reform policies are qualitative such as (Al-Fayoumi and Abuzayed, 2009).
While empirical studies such as (Maghyereh, 2008) ignored the significant effects of the 2008
financial crises on the CBJ reforms and bank indicators. Also, this study only assessed the
impact of the reforms on a set of efficiency indicators. Another study by (Jarrah, 2010)
examined the systematic, non-systematic, and total risk of Jordan’s banking sector using data
covering the period 2001-2009.
1.2 Research Objectives
In this section we will focus on the study objectives that have been developed over the years
by researchers in banking and link the study hypotheses to the related economic theories and a
stream of the previous literature. Based on the existing literature, the underlying objectives of
this research are five-fold:
First to investigate the impact of bank-specific market structure, and macroeconomic
variables on different profitability measures. Second, to measure the impact of competition,
risk and the interest rate environment on the profitability and risk-taking behavior of Jordanian
commercial banks. Third, to examine the relationship between bank efficiency, capital, and
risk of Jordanian commercial banks. Fourth, to address how competition and efficiency of the
banking sector influence the cost of credit for borrowing firms using data from 118 firms. And
finally, to examine the impact of liquidity funding measures on the risk of Jordanian
commercial banks and to assess the impact of the deposit insurance scheme applied in Jordan
on the liquidity creation of Jordanian commercial banks. The period of our analysis covers
2003 to 2015 and our sample consists of 13 commercial banks operating in Jordan’s banking
sector.
The study seeks to answer the following research questions:
• How and in what ways have the competitive conditions affected by the profitability of
Jordanian banks?

17
• Does liquidity risk influence the profitability of Jordanian banks?
• To what extent have changes in interest rates affected the profitability of Jordanian
banks?
• Which market type monopoly, monopolistic competition or perfect competition, best
represents the Jordanian banking sector?
• Does bank capital affect the risk-taking behavior of Jordanian banks?
• Does bank capital affect the efficiency of Jordanian banks?
• To what extent does risk affect the efficiency of Jordanian banks?
• Does bank size affect liquidity funding?
• Does capitalization affect the liquidity funding requirement of Jordanian banks?
• To what extent have crisis periods affected the liquidity funding requirements of
Jordanian banks?
• Does the size of a bank affect its liquidity creation?
• Does bank capitalization affect liquidity creation?
• To what extent has crises periods affected the liquidity creation of Jordanian banks?
To reach the study objectives and questions, we examined the following hypothesis:
H1.1: There is a positive relationship between bank competition and profitability.
Given its importance in extending the literature for Jordanian banks, the empirical evidence
offers some guidance in this respect. Only a few studies address the role of bank competition
in relation to bank profitability. (Buchs and Mathiesen, 2005), for example, reveals that
banking competition helps foster higher economic growth which leads to improving bank
profitability. Also, (Petria et al., 2015); (Hsieh and Lee, 2010), (Coccorese, 2004) and
(Demirguc-Kunt and Peria, 2010) found a positive impact of competition on bank profitability.
H1.2: There is a significant positive relationship between liquidity risk and profitability.

18
Because few studies have addressed the role of bank liquidity risk using Jordanian bank data,
our second hypothesis holds out the prospect for finding such a relationship. Some prior studies
such as (Arif and Nauman Anees, 2012) who examined the effect of liquidity risk on banks’
profitability found a significant positive effect of liquidity risk on bank profitability. (Bourke,
1989) found evidence of a positive relationship between liquidity risk and bank profitability
for 90 banks in Europe, North America, and Australia. (Naceur and Kandil, 2008) also found
a positive significant influence of liquidity risk on financial profitability.
H1.3: There is a positive relationship between the interest rate and profitability.
To fill the literature gap of the impact of the interest rate on the Jordanian bank profitability
especially after the liberalization, our empirical evidence offers some guidance in this respect.
We hypothesized our third hypothesis. (Bourke, 1989) for example investigate the determinants
of bank profitability, he found that interest rates are positively related to profitability.
(Molyneux and Thornton, 1992) replicated (Bourke, 1989) study and found that interest rates
have a significant positive association with bank profitability. (Genay and Podjasek, 2014) also,
found that the low-interest-rate environment is associated with decreased profitability for
banks. Similar findings were postulated by (Bikker and Vervliet, 2018) for all U.S. commercial
and savings banks.
H2.1: There is a positive relationship between bank capital and efficiency.
Few studies address the relation of bank capital into bank efficiency of the Jordanian banks and
as a result of its importance in extending the literature, we hypothesized our fourth hypothesis.
(Kwan et al., 1997) for example, found that bank efficiency is affected by bank capital and they
argued that banks with more capital operate more efficiently than banks with less capital.
(Fiordelisi et al., 2011b) found that higher bank capital levels increase bank efficiency.
H2.2: There is a negative relationship between risk and bank efficiency.
Our fifth hypothesis addresses the relation of bank risk to the Jordanian banks' bank efficiency,
which covers the gap in the literature of the Jordanian bank studies. (Fiordelisi et al., 2011b)

19
for example, found that inefficient banks typically have higher risk levels. Also, (Berger and
De Young, 1997) and (Williams, 2004) suggest that declines in efficiency will temporarily lead
to increases in banks’ risk. (Jeitschko and Jeung, 2005) indicating that bank managers tend to
take on more risk when the banks have lower levels of capital or the banks are less efficient.
H2.3: There is a negative relationship between capital and risk.
Studying the impact of the capital requirement regulation and the relationship between capital
and risk of the Jordanian banks takes its important especially after implementing the
requirements. we are extending the literature by hypothesized our sixth hypothesis. Several
studies found that the incorrect design of capital requirements leads to excessive risk-taking
behaviour by banks (Yehuda and Kahane, 1977, Kim and Santomero, 1988, and Koehn and
Santomero, 1980). (Shrieves and Dahl, 1992), (Jacques and Nigro, 1997) and (Matejašák et al.,
2009) all share the view that banks tend to adjust their capital ratio by increasing capital and
decreasing their risk when the regulatory pressure increases. Empirical studies such as
(Demsetz et al, 1997) and (Salas and Saurina, 2003) report a negative effect of capital on the
levels of risk taken by banks. (Demsetz et al., 1996) and (Salas and Saurina, 2003) report a
negative effect of capital on the levels of bank risk taken by banks.
H3.1: There is a negative relationship between bank efficiency and the cost of credit.
There is shortage of studies that address the relationship between Jordanian bank efficiency
and the cost of credit. We are filling the gap by hypothesized our seventh hypothesis.
(Shamshur and Weill, 2019) found that bank efficiency reduces the cost of credit, where
improvements in bank efficiency tend to be strongly associated with a lower cost of credit.
(Sapienza, 2002) note that efficient banks can offer borrowing firms’ loans at lower costs than
their less efficient competitors.
H4.1. Lower funding liquidity risk incentivises banks to take more risk.
The importance of extending the literature for the relationship between bank risk and bank
funding liquidity risk. The empirical evidence offers some guidance in this respect, extending
the few studies that address this relationship. Based on the theoretical insights of (Acharya and

20
Naqvi, 2012) and (Wagner, 2007), banks with higher deposits were characterized as having
less funding liquidity risk, which then feeds into the bank risk-taking behaviour. (Jensen, 1986)
found that banks with lower funding liquidity risk might be tempted to make poor investment
decisions that increase bank risk-taking behaviour. (Acharya and Naqvi, 2012) found that
banks have lower funding liquidity risk because of large amounts of deposit inflows, which
leads bank managers to take more risk by aggressively lowering the lending rate to increase
loan volumes to enhance their own compensation.
H4.2. Banks with higher capital buffers are less risk-taking in response to lower funding
liquidity risks.
Given the importance of the capital requirement regulation, we are extending the literature for
Jordanian banks by addressing the relationship between bank capital and bank risk-taking.
(Konishi and Yasuda, 2004) for example found that the implementation of capital adequacy
requirements has reduced risk-taking by commercial banks. Similarly, (Repullo, 2005) finds
that bank risk-taking is negatively related to capital requirements. Empirical studies such as
(Demsetz et al, 1997) and (Salas and Saurina, 2003) report a negative effect of capital on the
levels of risk taken by banks.
H4.3. Larger banks take less risk in response to lower funding liquidity risk.
Only a few studies address the relationship between bank size and bank risk-taking of the
Jordanian banks. Our hypothesis extending the literature for Jordanian banks which offers some
guidance in this respect. Earlier on (Demsetz and Strahan, 1997) provided evidence that
increases in banks’ total assets reduce firm-specific risk. Similarly, larger banks take less risk
as bank size increases banking stability as founded by (Mercieca et al., 2007) and (Stiroh,
2004). (Wagner, 2007) also notes that banking system instability increases with higher
liquidity.
H4.4. In response to reductions in funding liquidity risk, bank risk decreased during the Global
Financial Crisis.

21
Finally, and after the last global financial crises 2008, few studies address the relationship
between bank risk and the global financial crises for Jordanian banks. In this aspect, we
hypothesized our last hypothesis to offers some guidance in this respect. (Ivashina and
Scharfstein, 2010) for example found that bank excessive lending behaviour during times of
access to large deposit funding contributed to the triggering of the 2008 global financial crises.
In the next chapter (chapter 2) the study focuses on the theories related to that have
been developed over the years by researchers in banking and related to the study objectives and
hypotheses.
1.3 Research Method
Several econometric methodologies are implemented in this study to provide a rigorous and
robust set of empirical evidence on the effects of liquidity risk, risk-based capital requirements
and capital regulations on Jordanian banks.
Following the work of (Olalere, Bin Omar, & Kamil, 2017); (Sufian & Habibullah,
2009); (Nathan & Neave, 2016), we use the methods of Pooled OLS, Fixed Effects (FE),
Random Effects (RE), and Generalized Methods of Moments (GMM) approaches to aid our
research strategy in Chapter 4, that is the first empirical chapter. This chapter aims to
empirically assess the impact of competition, liquidity risk, interest rate, bank profitability, and
risk-taking behavior. We start our analysis by implementing the model of (Panzar and Rosse,
1987) which is based on a test statistic H, to assess the state of competition in the Jordanian
banking sector. Since the H-statistic measures the elasticity of total revenues with respect to
factor input prices and is calculated from a reduced-form bank revenue equation, it will allow
us to gauge how a change in input prices is reflected in the equilibrium revenues earned by
banks. Both the FE and RE methods are used to account for biasness in omitted variables that
arise from ignoring the time-invariant characteristics that are correlated with the dependent
variables and which cannot be accounted for. The GMM method is a dynamic modeling
technique that permits the inclusion of lagged dependent variable as one of the right-hand side
variables while accounting for the endogenous nature of some of the variables by replacing
them with their lagged and lagged different values.
In chapter 5, we empirically examine whether there exists any relationship between bank
efficiency and productivity, capital and risk in the Jordanian banking system. This chapter uses
22
the pooled OLS, FE and RE methods previously discussed in addition to the Three-Stage Least
Square (3SLS) method which I use to estimate a system of equations that employ different risk
indicators. This method has been used by (Tan and Floros, 2013) and (Rime, 2001). 3SLS is a
remedy for the problem of endogeneity between bank efficiency, risk and capital. It should be
noted that 3SLS estimates systems of structural equations where some equations contain
endogenous variables among the list of explanatory variables. These endogenous variables are
then defined in the system as the dependent variables of the other equations in the system and
thus enables us to define other endogenous variables other than the dependent variables. The
reason for using 3SLS is that it not only provides consistent estimates of the parameters but is
also a full information modeling technique that estimates all the parameters simultaneously and
incorporates the cross-equation correlations and produces parameter estimates which are
asymptotically more efficient than Two-Stage Least Square (2SLS). To calculate bank
efficiency (Eff/O), I use the Malmquist Productivity Index (MPI) which uses distance functions
to measure changes in productivity. I measure technical efficiencies using the non-parametric
method, Data envelopment analysis (DEA) technique which has been used by (Paul &
Kourouche, 2008) and (Alkhathlan and Abdul Malik, 2010a) among others.
Chapter 6 is the third empirical chapter and investigates the effects of bank efficiency
and competition on the cost of credit for borrowing firms empirically. We estimate our cost of
credit models using Pooled OLS, FE and RE methods. We evaluate five models incorporating
each one of the efficiency measures as the leading independent variables while controlling for
a set of firms, industry, and macroeconomic variables. We start our analysis by pooling the
panel data and estimating it using ordinary least squares (OLS) regression. This method ignores
the firms' heterogeneities and un order to correct for this bias, we use both FE and RE
approaches to account for the distinct nature of each firm and control for the unobserved fixed
effects that are constant over time and correlated with the dependent variables, such as Jordan's
geographical location and cultural norms. These methods capture the within-variation across
firms and time-related shocks that affect all firms such as global financial crises (Bjorvatn and
Farzanegan, 2013). We also use RE method, wherein the main difference between RE and FE
is that RE uses GLS to produce the estimates while assuming that the unobserved heterogeneity
is uncorrelated with the regressors. To calculate bank efficiency (Eff/O), I use the Malmquist
Productivity Index (MPI) which uses distance functions to measure changes in productivity. I
measure technical efficiencies using the non-parametric method, Data envelopment analysis
(DEA) technique. We use the non-parametric methods represented by the Malmquist index

23
proposed by (Malmquist, 1953) and later developed by (Douglas et al., 1982). This index
measures total factor productivity between two banks or one bank over time. We also measure
technical efficiencies using the non-parametric method, DEA. DEA technique utilizes the
number of variables (inputs and outputs) and not their prices and thus does not require any
relationship between inputs and outputs. Using more than one form of inputs and outputs of
the Decision-Making Unit (DMU) is one of the DEA advantages (Graham et al., 2005).
Defining and selecting banks’ inputs and outputs for the DEA method is based on one of three
approaches, production approach, intermediation approach, and value-added approach. We
also use the intermediation approach in the selection of inputs and outputs which defines the
bank as an intermediary that transfers assets from surplus units to deficit units (Paul and
Kourouche, 2008), (Alkhathlan and Malik, 2010). In calculating the index we are using four
inputs (number of full-time employees, total deposits, total assets, and interest expenses) and
two outputs (loans and interest income) following (Varesi, 2015). Loans are considered one
form of output from deposits (inputs) as noted by (Sealey and Lindley, 1977), (Lang and
Welzel, 1996), and (Ashton and Pham, 2011).
Chapter 7 is the fourth empirical chapter which investigates the impact of banks’
funding liquidity risk on Jordanian commercial banks' risk-taking behavior. For this empirical
exercise, I use the FE and RE estimation methodologies to empirically define the main
determinants of the different risk measures of Jordanian commercial banks. The analysis
undertaken is extended to determine the major factors of the banks' liquidity funding. I also use
the Difference in Difference (DID) method to analyze the impact of the deposit insurance
scheme which was implemented in Jordan in 2000 as way of gauging Jordanian banks' liquidity
creation. In this respect, I compared changes in liquidity creation before and after the
implementation of deposit insurance. The DID approach is usually used to estimate the effect
of a specific intervention (deposit insurance scheme) by comparing the changes in outcomes
over time between a group that is enrolled in a program and a group that is not. The DID
approach also provides results that are robust to the potential endogeneity bias as noted by
(Cao, Zhun et al., 2011).
While some researchers may prefer one measure over another. There is no consensus
regarding the best measure by which to gauge competition. Therefore, the choice of Panzer
Ross techniques involves trade-offs. The usefulness of the different approaches hinges on data
availability, the conceptions of competition assumed, and the questions being addressed. This
study objective is to present the most widely applied methods in banking, highlighting their

24
strengths and weaknesses. This method has been used by several authors to determine the
structure of banking market in some countries that have the same conditions. For example, in
Tunisia, (Haffani, 2002) examined the market structure of Tunisian’s banking sector during the
period 1980 to 1999, by using the Panzar-Rosse assessment. This study of competition shows
that throughout this period, the Jordanian banking market has been characterized by a
monopolistic structure, but the indicator of competition has steadily increased since. This
method has been much more widely used in empirical banking studies.
Since the data from developing country, it is appropriate to observe and duplicate (with
some modifications) the methods used by (Bourk, 1989). Using multiple regression analysis,
(Bourk 1989) examined the relationship between profitability and various independent
variables such as interest rate, liquidity concentration, market growth, and inflation. The
proxies for profitability are return on assets, return on capital and value added. The value-added
concepts introduced by (Bourk 1989) is a proxy that allows testing of the expense’s theory and
risk-aversion theory. The used variables in the study regression and directly influence the bank
profitability are used to test the expense-preference theory, the risk- aversion theory, and the
structure-conduct-performance theory. For example, the capital ratio, liquidity, and other
variables as an internal variable used to test the (Bourk 1989) hypothesis that well capitalized
banks enjoy access to cheaper resources of fund maintained in the loan portfolio, which
improve profitability as the case in the Jordanian commercial banks. In the case of liquidity,
banks with higher liquidity will prevent themselves from long term investments opportunities
and thus reduce their cost and expenses. Other overhead cost will have an adverse effect on
profitability. The study tested hypotheses and results that are in line with and supports the
existence of the expense-preference and the risk- aversion theory.
The panel data are commonly used because it gives more informative data. It consists
of both cross-sectional information that captures individual variability and time series
information, which captures dynamic adjustment. Moreover, it allows the studying of impact
of macroeconomic and financial industry development on profitability after controlling bank-
specific characteristics as in this study. The study used panel data, the panel data regression
techniques have two models, Fixed effect model and Random effect model (Sarafidies &
Wansbeek, 2020). Using the FE and RE is the appropriate technique for the data that has been
used.
An important aspect of this model is reorganization that changes in both capital and risk

25
have an exogenous as well as an endogenous character. Hence, the present study differs from
previous studies, it examines the most banks in the H.K. of Jordan, namely those have at least
five years financial statement throughout the estimation period. It should be stressed that Jordan
banking market has not reached a high level of development and hence sophisticated financial
instruments are not widely available which make the used method is the more appropriate in
regards to the data availability and the consider the changes in the regulation especially in term
of bank capital and risk.
1.4 Research summary and conclusion
Chapter 2 presents a survey of the literature on banking sector performance indicators and
discusses the main theoretical and empirical findings of previous studies and identify the main
gaps in the literature that present thesis fills as applied to the Jordanian banking sector. The
chapter covers separate performance indicators and lists the existing evidence of its impact
performance and risk-taking behavior.
Chapter 3 discuss the evolution of the Jordanian banking sector and consider the recent
reforms that have helped shaped the banking sector into a more modern banking system. The
chapter highlights the reform phases while addressing the objectives of each phase and how
it affected bank performance. Chapter 4 shows that the Jordanian banks results support the
favourable spillovers of the reform policies on Jordanian banks' overall profitability and
efficiency. However, the evidence suggests that there is still a need to improve the banking
market and that higher total banks assets may not necessarily lead to higher profits. Moreover,
careful management is required for the larger number of deposits and the acquired capital by
Jordanian banks due to the inward migration of Iraqi and Syrian refugees to Jordan in recent
times.
Chapter 5 is one of the first attempts to assess the effects of the CBJ reforms and
deregulation policies on the productivity of the banking system in Jordan. The analysis
provides robust evidence in favor of the positive effects of these reforms. The range of
policies adopted by Jordanian banks such as the increase in their dependence on interbank
funding and the capital reserve as well as their enhanced access to the deposit market, have
all contributed to the improvement of profitability, cost-efficiency and overall operational
efficiency. Another important factor contributing to enhancing Jordanian bank efficiency
during the study period was the decline in total provisions, which reduced the banks' total

26
expenses. The decrease in non-performing loans (NPLs) further improved banks overall
operational efficiency.
Chapter 6 assess the impact of reform program and deregulations on the Jordanian
banking system and the impact of banks competition and efficiency on the cost of credit for
a 118 Jordanian firm in response to the imposed capital requirements covering the period
2003-2015 as well. The results show the favorable impact of the program and liberalization
on the bank efficiency which improve the household and business to accesses credit.
Chapter 7 turns to in an examination of liquidity funding and risk-taking behavior of
Jordanian Commercial Banks. The findings show that bank size and capital buffers help
minimize Jordanian commercial banks' risk-taking behavior in response to decreased funding
liquidity risk. Jordanian commercial banks are the more conservative even during the
financial crises as they are monitored and controlled by the CBJ. Findings reveal that the
implementation of the deposit insurance scheme from 2000 onwards did not change the
negative relationship between bank capital and liquidity creation. There appears to be a clear
tradeoff between imposing bank capital requirements to maintain the financial system
stability and the process of liquidity creation to enhance banks’ capital assets. However, this
trade-off needs to be carefully considered when decision-makers and regulators design new
policies or levy new measures on Jordanian commercial banks.
The issues examined throughout this thesis are motivated by several recent studies. In
chapter four, our study builds on the work of (Molyneux and Thornton, 1992) and (Bikkera
and Vervliet, 2018). We extend the analysis to data on a sample of 13 Jordanian commercial
banks by incorporating more variables and assessing the impact of competition, liquidity risk
and interest rate on bank profitability and risk-taking behavior. The study also makes use of
more factors to show its impact on Jordanian bank profitability. Chapter five builds on the
contribution of (Tan and Floros 2013) by extending their study using data for 13 Jordanian
commercial banks to examine the magnitude and direction of the dynamic relationships
between bank efficiency/productivity, capital and risk in response to the imposed capital
requirements covering the period 2003-2015. Chapter six examined the impact of banks
competition and efficiency on the cost of credit for a 118 Jordanian firm in response to the
imposed capital requirements covering the period 2003-2015 on the contribution of
(Shamshur and Weill, 2019) and (Fungáˇcováa et al., 2017). Chapter seven builds on the
contribution of (Khan et al., 2017) by investigating the relationship between funding liquidity

27
and bank risk-taking and extend their study by looking at the impact of imposed Jordanian
deposit insurance scheme.

28
CHAPTER 2
Liquidity Risk, Risk-Based Capital Requirements, and
Capital Adequacy Regulations: A Review of the Literature
2.1 Introduction
The Middle East and North African countries promote reform programs in order to promote a
rapid and lasting economic growth and an efficient financial system. The MENA region covers
Afghanistan, Algeria, Bahrain, Djibouti, Egypt, the Islamic Republic of Iran, Iraq, Jordan,
Kuwait, Lebanon, Libya, Mauritania, Morocco, Oman, Pakistan, Qatar, Saudi Arabia, Somalia,
Sudan, the Syrian Arab Republic, Tunisia, the United Arab Emirates, West Bank and Gaza,
and Yemen. In the MENA countries, progress on financial system reforms has been uneven.
Some countries now have a well-developed financial system, particularly banking sectors, such
as the Gulf Cooperation Council countries (GCC, comprising Bahrain, Kuwait, Oman, Qatar,
Saudi Arabia, and the United Arab Emirates or U.A.E.), Lebanon, and Jordan. Others have
made important advances over the past three decades. In terms of regulation and supervision,
GCC countries, Jordan, Lebanon, Morocco, and Tunisia, they took strengthened banking
supervision and regulation steps, such as conforming to international Basel standards by
reducing non-performing loans and increasing capital adequacy ratios. Most of the MENA
countries experienced financial development although in a few countries’ political instability
or conflict. In financial development, the research shows that the MENA region ranks well
below the industrialized countries but above most other developing country regions. Egypt,
Jordan, Morocco, and Tunisia are the countries in the MENA region that have been important
advances in financial system development since the 1960s while in the countries, the level of
financial development has improved only slightly. The MENA countries (Egypt, Jordan,
Lebanon, Morocco, and Tunisia) share similarities in terms of economic structure. Despite the
substantial transformation of the countries’ banking and financial system in recent years. In the
MENA region, the banking system has many similarities but are also quite different from each
other. For example, Egypt, Jordan, Morocco, and Tunisia are classified as lower-middle-
income countries, while Lebanon classified as a middle-income country. The financial
development has been shown to have a main role in enhancing the economic growth (Beck et
al, 2006); however, empirical evidence indicates that without the necessary institutional

29
development, financial systems may lead to increased risk (Demirguc-Kunt and Detragiache,
2006). Cross country differences are apparent for example, Jordan outperforming the other
countries in the MENA region in terms of stock market development and the capital adequacy
ratio.
In 1988 the agreement referred to as the Bank established the Basel Accord for
International Settlement (BIS) for measuring bank capital adequacy for banks in the Group of
Ten (G-Ten) countries and Luxembourg. This Accord established a framework consisting of
several core rules designed to regulate bank capital and to minimize credit risk, referred to as
Basel I which classified bank assets into five risk categories in percentages (0%, 10%, 20%,
50%, and 100%) depending on the nature of the debtor. Cash, central bank and government
debt are classified as 0% risk assets. The 50% category which includes residential mortgages
and private sector debt is classified as 100% risk asset. This framework mandated the minimum
required capital, Tier 1 and Tier 2 equal to at least 8 percent of a bank’s capital adequacy
requirements which became standard for banks internationally. Since the BCBS do not have
legal influence, members are free to choose whether to implement the established standards
and the methods of applications. A major criticism of Base I concerned the arbitrary nature in
which it was applied especially the 8 percent minimum capital requirement applied to risk-
weighted assets remained irrespective of (a) whether the degree of credit-risk varied over the
business cycle (b) whether the bank was domiciled in an industrialised or developing country
and (c) the types of risk banks engaged with. As a result of the limitations of Basel I, the
framework was amended in 1996 and went into effect in 1998 and required all commercial
banks engaged in significant trading activity to set aside additional capital under the 8 percent
mandate to cover the market risks in their trading accounts. In addition, a new Tier III capital
was brought in consisting of short-term subordinated debt which could be used to accommodate
the capital requirements on market risk. Considering other emerging limitations, such as
operational risk, which include fraud, computer failure and poor documentation which many
observers considered as significant risk. In 1999 the Basel Committee proposed a new capital
adequacy framework referred to as Basel II. Basel II which is based on three mutually
reinforcing pillars – minimum capital requirements, a supervisory review process and the
effective use of market discipline was supported by central bank governors and bank
supervisors in the G-10 countries and came into effect in June 2005. Basel II adopted the
minimum capital requirements of 8 percent, but also distinguished the required minimum
capital ratio based on three tiers. The higher the tier, the fewer securities banks can include in

30
it. Another important part of the Basel II framework is improving the calculation formula for
Risk-Weighted Assets (RWA), which imposed a penalty for the excessive risk-taking
behaviour by banks whenever the banks significantly increased risk-weighted assets
intentionally. Risk-weighted assets are used as a denominator in the calculation of the
regulatory capital ratio and is calculated by using the sum of assets that are multiplied by the
corresponding risk weight for each type of asset. Steering these measures was meant to create
uniform conditions for better risk measurement and regulating international competition on
financial markets.
Following the adverse effects of the 2008 global financial crisis exposed deficiencies
in the Basel I and II framework. Many banks encountered difficulties to maintain adequate
liquidity, primarily due to the lack of traditional funding sources, due to the valuation of assets
and due to capital adequacy issues, which resulted in large financial losses. As a result, in 2010
the G-10 central banks and supervisory authorities established a set of new regulations, named
Basel III in the form of a substantial strengthening of the existing regulatory capital framework
and which requires increased minimum Common Equity Tier 1 capital from 4 percent to 4.5
percent and minimum Tier 1 capital from 4 percent to 6 percent in an effort to mitigate the
adverse effects of the financial crises as well as to prevent future potential crisis and bank
bailouts. The thinking behind Basel III was to ensure a build-up of bank capital buffers that
can be drawn down during periods of financial stress, strengthen the quality of bank capital,
and introduce a leverage ratio requirement that would control the excess of leverage.
Following the Basel III regulations, the banks become entitled to increase their core
capital ratio from 4 to 6 percent to ensure the overall financial system's efficiency and stability
and lower the risk of default. Basel III adopted the same guidelines of Basel II in calculating
risk-weighted assets and introduced leverage and liquidity requirements to ensure that banks
have sufficient liquidity to hedge against excessive borrowings and in comparison, to Basel II,
Basel III adopted stricter regulatory capital ratios.
The introduction of the various Basel capital accords has motivated a stream of studies
that have examined the effects of bank capital regulations on banks’ risk-taking behavior and
management. The main findings of most of these studies indicate that bank financing decisions
are influenced by several factors, such as capital adequacy regulations, risk-based capital and
liquidity risk management. As with other central banks, the central bank of Jordan (CBJ)
attempted to enhance the integrity and stability of the financial sector in Jordan through the

31
application of the Basel international standards, particularly the standards of the Basel I and II
and Basel III post the global financial crisis. In 2005, a higher committee chaired by the deputy
governor of the CBJ was formed to discuss the adoption of new standards of credit risk, market
risk, operational risk, market discipline and the supervisory review. The CBJ began
implementing the Basel II standards in the first quarter of 2008. The first phase incorporated
Basel II capital adequacy ratios' adoption and utilised different measures to assess operational
and market risks. In 2011, the CBJ informed the banks to start implementing the requirements
of Basel III by increasing the proportion of liquidity coverage, legal liquidity ratio, and capital
adequacy ratio.
Several empirical studies investigate the determinants of bank profitability such as
(Short, 1979); (Bourke, 1989); (Molyneux and Thornton, 1992); (Abreu and Mendes, 2001);
(Mamatzakis and Remoundos, 2003); (Goddard et al., 2004); (Pasiouras and Kosmidou, 2007);
(Bennaceur, 2008); (Albertazzi and Gambacorta, 2009); (Lee and Hsieh, 2013); (Sufian and
Habibullah, 2009); (Naceur and Omran, 2011). The drivers of bank profitability are categorized
into internal and external factors. The internal factors are related to a bank’s management and
strategies while the external factors are related to the economic and legal environments inside
the country. Factors such as loan loss expenses, loan/deposit ratio, capital, liquidity ratios,
market dynamics, interest rates, concentration and overhead expenditures are investigated in
the literature considering their effect on profitability. The findings covering these factors are
found to be sensitive to the sample selection, bank size, level of capital and the adopted risk
management practices. Studies such as (Abreu and Mendes, 2001) found a positive impact of
risk on bank profitability in France, Spain, Portugal and Germany. (Ahmed and Khababa, 1999)
examined the impact of business risk, market size and the size of the Saudi banks’ profit and
found that business risk and bank size are the only significant drivers of profitability, while
business risk and bank size had a significant and negative influence on banks' profitability.
Since the introduction of the 1988 Basel Capital Accord, Capital adequacy requirements
became one of the most important measures of bank asset-liability management. Bank
regulators are required to assess whether banks are adequately capitalized to ensure the stability
of the banking system against temporal shocks. Several empirical studies have focused on
investigating the impact of the introduction of the Basel Capital Accord in 1988 on capital
adequacy requirements across different countries. Empirical evidence suggests that capital
adequacy requirements amplify demand and supply-side shocks in the US (Blum, 1999),
reduce the risk-taking behavior of US commercial banks (Konishi and Yasuda, 2004) and force

32
less-capitalized banks to increase their capital levels (Zhang et al., 2008).
Another strand of the literature discusses the theoretical and empirical effects of risk-
based capital regulations on financial systems. However, in terms of bank performance, capital
ratio is considered a better performance indicator than the risk-based capital ratio (Avery and
Berger, 1991). Some studies have shown that risk-based capital requirements have minor
effects on loan growth (Allen et al., 1994). On the other hand, it has been argued by (Brinkmann
and Horvitz et al., 1995) that risk-based capital requirements have influenced banks' portfolio
decisions and loan growth significantly.
Many banks have reduced their credit supply to meet capital regulations when they were
first introduced in the late 1980s, but after the global financial crises, capital regulation
requirements became a major concern for bank managers and regulators. As suggested by
(Yehuda Kahane, 1977) capital regulations cannot reduce the overall bank portfolio risk unless
the assets included in the portfolio are subject to these regulations but has noted by (Keely and
Furlong, 1990), capital regulation can potentially reduce asset risk, while (Santos, 1999)
showed that capital regulation improves bank's stability. Regarding the risk (Hussain and
Hassan, 2005) suggest that banks' portfolio risk dropped following the adoption of capital
requirement regulations while (Delis et al., 2011), and (Beatty and Gron, 2001), suggest that
capital regulations reduce risk in general but for banks with high market power the risk
mitigation effects become weaker though in some cases, they can be reversed.
It is widely recognized that financial institutions require effective management to hedge
against different types of operational risks. Several studies on developing and developed
countries have examined different risk measures and the related practices that were adopted by
different banks to mitigate potential losses. In classical theories, there is a close relationship
between liquidity risk and credit risk (Bryant, 1980). Previous studies by (Goldstein and
Pauzner, 2005), (Goderis et al., 2011), (Gatev et al., 2009), (Cai and Thakor, 2011), and
(Acharya and Viswanathan, 2011) have shown that the inter-correlations between liquidity and
credit risk affect bank stability. However, since the 2008 financial crises, the literature in this
area has produced mixed results. For example, (Archarya and Viswanathan, 2011) find
evidence which suggests a positive relationship between liquidity and credit risks while
(Goderis et al., 2011), (Gatev et al., 2009), (Cai and Thakor, 2011), and (Acharya and
Viswanathan, 2011) report evidence suggesting that the relationship between liquidity and
credit risk is negative. In a study of advanced economies, (Chen et al., 2018) found that liquidity

33
risk reduced profitability due to the higher cost of fund but increases banks’ net interest margins
while (Young and Jang, 2016) found that the implementation of the Basel III net stable funding
ratio standards had significant positive effects on U.S bank liquidity management.
Given the various themes of this thesis, the purpose of the present chapter is to provide a
review of a selection of the most important literature covering the work presented in the
empirical chapters of the thesis. The chapter is divided into six subsections wherein section 2.2
focuses on studies on banks’ profitability indicators. Section 2.3 discusses capital and capital
adequacy requirements while section 2.4 discusses the literature on the risk-based capital,
section 2.5 capital regulation and its impact on banks’ performance and section 2.6 the related
literature on bank's liquidity, liquidity and credit risk. Section 2.7 concludes the chapter.
2.2 Bank profitability indicators literature review
Banks, like all businesses, operate to maximize profit or shareholder wealth by earning more
money than what they pay in expenses. Some of this also comes in the form of fees that banks
charge for services provided and the interest on assets. Normally interest paid on bank liabilities
is the major expense of banks. Loans to individuals, businesses and other organizations and the
securities that it holds are the major assets of banks, while deposits and the money it borrows
forms its liabilities. Over the years, bank profitability has been a popular research topic with
most studies investigating the determinants of bank profitability. These include (Moylneux and
Thornton, 1992), (Demerguç-Kunt and Huizingha, 1999), (Barajas et al. 1999), (Bashir,2000),
(Ben Naceur and Goaied, 2001), (Abreu and Mendes, 2002), (Guru et al., 2002), (Jiang et al.,
2003) and (Pasiouras and Kosmidou, 2007).
(Pasiouras and Kosmidou, 2007) found evidence of a positive and significant relationship
between bank size and profitability, while (Abreu and Mendes, 2001), using a loans-to-assets
ratio as a proxy for risk, found a positive impact of risk on bank profitability for banks in
France, Spain, Portugal and Germany. On the other hand, a negative and significant
relationship was found between the level of risk and bank profitability by (Bourke, 1989) and
(Molyneux and Thornton, 1992). (Bourke, 1989), (Demirgüç-Kunt andHuizinga, 1999),
(Abreu, and Mendes, 2001), (Goddard et al., 2004); (Pasiouras and Kosmidou, 2007), and
(Bennaceur, 2008) found that banks with a high level of equity relative to their assets have
higher profitability than their counterparts and (Goddard et al., 2004) report that the cost-
income ratio affects bank profitability positively. Other studies such as (Bourke, 1989),
(Molyneux and Thornton, 1992), (Demirgüç-Kunt and Huizinga, 1999), (Athanasoglou et al.,

34
2008), (Albertazzi and Gambacorta, 2009) indicate a positive relationship between inflation,
GDP growth and bank profitability. According to (Bourke, 1989) and (Molyneux and
Thornton, 1992), high bank concentration ratio (CR) enhances profitability, though
(Demirgüç-Kunt and Huizinga, 1999) and ((Staikouras and Wood, 2011) have argued that
concentration ratio reduces profitability.
Bank liquidity, capital adequacy, deposit growth, credit risk, GDP, and inflation are
considered the main determinants of bank performance (Azam and Siddiqui, 2012). (Flamini
et al., 2009) suggests that credit risk, market power, capital, size, GDP and inflation are the
most important profitability triggers. At the same time (Ahmed and Khababa, 1999) considers
business risk, market size, market concentration and bank size as the main determinants of
bank profitability. (Short, 1979) and (Bourke, 1989) examined the determinants of bank
profitability using a linear functional form and found that linear modeling yields better results
relative to other functional forms. (Short, 1979) found that greater market power leads to higher
profitability, while concentration ratio was not significant in influencing profitability.
(Smirlock, 1985) investigated the relationships between bank profitability, market share (MS),
and market concentration using annual data consisting of 2700 banks over the period 1973-
1978. Using different profits proxies, ROE, return on total capital and return on total assets and
a wide set of control variables such as growth in market deposits, a ratio of demand deposits to
total deposit, total bank assets, the effect of holding company affiliation and state law with
respect to multibank holding companies, he estimated cross-sectional profit. The findings
indicate that concentration is insignificant in explaining bank profit rates. The results also
showed that market share is positively and significantly related to profitability. Additionally,
the control variables: growth in assets, market deposits, and the ratio of demand deposits to
total deposit were found to have a positive relationship with profitability while holding a
company affiliation and state law had negative coefficients. Using annual financial data for 90
banks across twelve countries/regions (Belgium, New York, Denmark, Australia, Ireland,
Massachusetts, California, Canada, England and Wales, Holland, Norway and Spain.) for the
period 1972-1982, (Bourke, 1989) investigate the determinants of bank profitability. Using
capital ratio, liquidity, staff expenses, concentration, government ownership, interest rate,
market growth and inflation as independent variables and return on capital, return on assets,
value-added return on total assets as dependent variables. The results showed that all capital
ratios, liquidity ratios and interest rates are positively related to profitability. Government
ownership and staff expenses were found to have an inverse relationship with pre-tax return on
35
assets. Concentration is moderately and positively related to pre-tax return on assets and
negatively with the value-added. (Molyneux and Thornton, 1992) replicated (Bourke, 1989)
study using annual data for a sample of banks covering 18 European countries for the period
1986-1989. They used government ownership, concentration, long-term bond rate, money
supply, capital and reserves, cash and bank deposits, consumer price index, and staff expenses
as independent variables and net profit before and after taxes as dependent variables. The
findings indicate that staff expenses have a positive relationship with ROA and that government
ownership and the level of interest rates have a significant positive associations with ROE,
which contrast with the findings of (Bourke, 1989). Liquidity was found to have a weak and
inverse relationship with profitability due to the costs of liquidity holdings. And in line with
(Bourke, 1989), concentration was found to have a positive and statistically significant impact
on pre-tax return on assets.
Using ROA and ROE as proxies for bank profitability, (Berger, 1995) examined the
impact of concentration, market share, x-efficiency, scale efficiency, and other control
variables on profitability. The findings revealed that X-efficiency and market share have a
positive impact on bank profitability and that the concentration-profit relationship is
ambiguous as its influence was primarily due to the level of correlation with other variables,
particularly market share. (Ahmed and Khababa, 1999) using ROE, ROA, and PEPS as profit
measures, examined the impact of business risk, market size, and bank size on bank
profitability for a sample of eleven commercial banks in Saudi Arabia for the period 1987-
1992. They found that business risk and bank size are the only significant drivers of
profitability, while business risk and bank size had a significant but negative influence on
banks' profitability. (Demirgüç-Kunt and Huizinga, 1999) contributed to the existing literature
on bank profitability by investigating the determinants of the commercial bank profitability
using annual data of 80 banks from developed and developing countries and applied the
weighted least squares method. Their findings indicate that well-capitalized banks had lower
funding costs than less capitalized banks due to the low probability of the cost of bankruptcy
and that well-capitalized banks had lower needs for external funding relative to less capitalized
banks. The results also find the presence of a positive relationship between capital ratio and
profitability but found no evidence of a relationship between profitability and overhead
expenses as banks usually transfer these costs to their customers invoices. The reported
findings also show that loans to total assets negatively influenced bank profitability, whilst
short-term funding had a negative but significant impact on profitability. A negative

36
relationship between profitability and non-interest earning assets was also reported, since banks
with high non-interest earning assets were found to be less profitable while banks that consider
deposits as their main source of funding were found to be less profitable due primarily to the
nature of deposits which required high branching costs and other related expenses.
Interestingly, in the case of developing countries, the findings suggest that foreign banks
produced greater profitability than domestic banks, with a high level of concentration
accounting for the enhanced profitability owing to the lack of competition. This particular
result contradicts (Abreu and Gulamhussen, 2015) findings, who reported a negative
relationship between the level of concentration and bank profitability.
In their contribution to the literature, (Guru et al., 1999) examined the determinants of
high-profitable banks in Malaysia using quarterly data for a sample of seventeen banks during
the period 1986 to 1995. They used liquidity, capital adequacy, expenses management, assets
composition, firm size, inflation, market growth, market interest, market share and regulation
as explanatory variables and used net income before and after-tax as a percentage of total assets,
net income before and after-tax as a percentage of shareholders capital, and reserves are used
as proxies for bank profitability. They found that poor management was the main reason for a
low-profit share, while liquidity, high capitalization, and asset composition reduced
profitability. The size variable was found to have no impact on the profitability of Malaysian
banks, while market growth was reported to have a negative relationship with bank profitability
which contradicts the findings reported by (Bourke, 1989).
(Chirwa, 2003) also investigate the relationship between market structure and
profitability of commercial banks in Malawi using annual time series data for eight commercial
Banks during 1970-1994. The study employed as explanatory variables the ratio of capital to
assets, total deposits of the banking industry, growth rate of total deposits, the ratio of demand
deposits to total deposits, loans to assets, concentration, and bank size, while ROA, ROE, and
ROC were used as measures of profitability. Based on the work of (Gilbert, 1984), (Smirlock,
1985), (Clark, 1986), and (Maudos, 1998). (Chirwa, 2003) report that demand deposit to
deposits ratio and concentration had positive and significant effects on commercial bank
profitability, and that loan to assets ratio had a positive and significant impact on bank’s
profitability in both the short and long-run. (Goddard et al., 2004) add to the literature by
examining the profitability drivers for European banks for a selection of six countries during
the period 1992 to 1998 using both static and dynamic GMM models. The findings of
(Goddard et al., 2004) showed that off-balance-sheet activities and profitability are positively
37
correlated, but only for English banks while more generally, the profitability was found to be
influenced by liquidity and capital to assets ratio. (Al-tamimi, 2008) compared the determinants
of bank performance between the national and foreign banks in the United Arab Emirates
(UAE) during the period 1987 to 2002. The findings indicate that bank size and portfolio
composition are the significant determinants of national banks’ profitability, while for foreign
banks, capitalization, leverage economic condition, and capital productivity are the main
drivers of profitability. The findings also suggest that concentration, portfolio composition and
costs are more relevant to the profit shares of national banks than foreign banks. In another
related study, (Bennaceur, 2008) looked at the impact of bank-specific characteristics, covering
financial structure and macroeconomic indicators in the Tunisian banking industry from 1980
to 2000 and used NIM and ROA bank profit measures. The ratio of equity capital to total assets,
overhead to total assets, the ratio of bank’s loans to total assets, the ratio of noninterest-bearing
assets to total assets, bank concentration, GDP, inflation and bank size were used as
independent variables. The study applied both Fixed Effects (FE) and Random Effects (RE)
methods. The reported results indicate positive relationships between the two profitability
measures and the amount of capital and that a well-capitalized bank can raise capital with low
costs. ROA was reported to be significantly and cyclically correlated with large overheads and
bank loans, while noninterest-bearing assets had no significant impact on both NIM and return
on assets, proving that interest-bearing assets are the main sources of bank profit. Interestingly,
bank size showed a negative and significant impact on profitability which contradicts the
findings of (DeYoung and Rice, 2006), while stock market capitalization was found to enhance
bank profitability. However, the level of concentration had a negative and significant impact
on net interest margin.
In another strand of the literature, (Athanasoglou et al., 2008) examined a wide scope
of bank-specific, industry-related and macroeconomic profitability determinants using panel
data for a group of South-Eastern European (SEE) credit institutions. Using a fixed effect and
a random effect method. The results indicate that bank size had a positive and significant impact
on bank profitability contrary to (Goddard et al., 2004), and also showed that all bank-specific
determinants significantly affect bank profitability, except the liquidity variable. Bank
concentration and capital were reported to be significant drivers of profitability, which is
consistent with the findings of (Goddard et al., 2004), while Loan-loss provisions and operating
expenses are significant moderators of profitability. Bank loans were found to have no
significant bearing on the profitability of SEE credit institutions. Regarding the
38
macroeconomic indicators, inflation was the only found to be a significant driver of bank
profitability.
(Flamini, et.al., 2009) studied the determinants of bank profitability using a sample of
389 banks for a sample of 41 Sub-Saharan Africa countries (SSA) for the period 1998 to 2006
using the c two-step GMM approach. They found that all foreign banks in SSA channeled their
activities into the service sector to avoid financing riskier sectors such as agricultural. Bank
size, diversification, capital and private ownership were found to be the main drivers of bank
profitability which support the reported findings of (Athanasoglou et al., 2008). (Dietrich and
Wanzenried, 2011), using a sample of 453 Swiss commercial banks for the period 1999-2006,
looked at bank profitability by employing internal and external determinants of bank
profitability (with ROA and ROE being proxies of profitability). They found that profit is
significantly driven by capitalization, bank loans and GDP growth while those banks with a
higher share of interest income were found to be less profitable than their counterparts.
(Al-Jarrah, 2010) examined the competitiveness and contestability in the Jordanian’s
banking industry for the period 2001-2005 using (Panzar and Rosse, 1987) “H statistic”. He
found that the Jordanian’s banking market cannot be characterized by either perfect
competition or monopoly and the banks found to earn their revenues as if operating under
conditions of monopolistic competition in that period. The analysis of changes in competitive
structure shows a lower degree of competition in the later years of the sample period and the
large banks operating in a relatively more competitive environment compared to small . These
developments trigger the need for further structural deregulations and liberalization to the
banking system of Jordan, to reduce the market concentration and enhance the
competitiveness of this market.
(Heffernan and Fu, 2011) examined the profitability of 96 Chinese banks for the period
1999-2006 using EVA, return on average assets (ROAA), return on average equity (ROAE)
and NIM as proxies of bank profitability and estimated the GMM motivated method. The
findings suggest that EVA and NIM are better performance indicators than the remaining
variables while specialization and bank profitability are positively correlated. The findings also
indicate that banks that finance rural development were more profitable than their counterparts,
and that bank listings, ownership, and size had no significant impact on the profitability of
Chinese banks. However, loan loss reserve ratio was found to enhance all profitability
measures, except for the variable ROAE.

39
Following the approach of (Brooks, 2008), (Anbar and Alper, 2011) examined bank-
specific and macroeconomic determinants of bank profitability in Turkey for the period 2002-
2010 using FE approach. Their findings indicate a positive and significant relationships
between bank size, asset size in relation to the profitability measures ROA and ROE and NIM,
which highlights the profit impact of economies of scale. A negative and significant influence
of assets quality and loans on ROA was also found. More recently, (Hussainey et al., 2018)
looked at the impact of efficiency on the performance of 151 Islamic banks with a global
presence for the period between January 2013 and December 2013 by estimating OLS model.
They found bank cost-to-income ratio (CIN) to be negatively associated with the performance
of Islamic banks globally and a positive association between risk-based capital adequacy, the
existence of Sharia auditing department and the performance of Islamic banks, but the evidence
on the impact of bank size on profitability was inconclusive.
(Guglielmo,etal, 2017) examined the internal and external factors impact on the banking
sector in the Middle East and North Africa region, on the profitability. They found that the size
does not appear to play a role determinant of profitability, whilst the liquidity ratio and net
interest revenues seem to have a negative and positive effect respectively; GDP has a positive
effect.
Using uses the generalized method of moments (GMM), Least Squares (LS) and
Generalized Linear Model (GLM), (Huq, et al, 2020) examined the impact of competition and
cost efficiency on the profitability of banks using an unbalanced panel of emerging economic
MENA countries over the period between 2011 and 2017. They found a significant and
negative impact of competition on profitability of banks. They suggested that MENA banks
should more improve the process of managing and monitoring the loan segment business;
reducing the level of credit risk leads to higher profitability.
2.3 Capital and capital adequacy requirements literature review
It is well established that capital adequacy plays a significant role in maintaining the safety and
soundness of banking systems globally. This is because, capital adequacy and capital adequacy
regulation ensures that banks are adequately capitalized and thus equipped to withstand
unexpected shocks that might otherwise impact negatively on bank operation such that it affects
bank depositors. The term capital adequacy reflects the capacity and efficiency of banks to
measure, control and monitor every type of risk. The importance of capital adequacy for the

40
Jordanian banking system is not limited to simply providing sufficient capital coverage to
hedge against potential risks but is also directed towards developing proper strategies in the
maintenance of sufficient levels of capital that is higher than the imposed fixed regulatory
capital ratio.
Understanding how capital requirements are operating and what effects they have on risk
and efficiency measures of the banking sector is essential for maintaining the balance between
liquidity reserves as a form of protection and profitability. Thus, steering the capital adequacy
requirement may be considered one of the most important policy measures of Basel II, if only
because it helped to protect the global banking system from the adverse effects of potential
stresses and the risk of default. In turn, it has given rise to a growing literature covering issues
ranging from best practice, stress testing, scenario analysis relating to bank’s portfolio, among
other related issues. For example, (Bernanke et al, 1999) used cross-sectional data of state-by-
state US banks for the period 1990-1991 and report that banks’ capital-to-asset ratio had a
positive impact on loan growth, while (Cecchetti and Li, 2008) and (Blum, 1999) found that
capital adequacy requirements may amplify demand and supply-side shocks. (Choi, 2000) in a
study of Korean banks found that the imposition of the 8 percent capital adequacy requirement
on banks led to a decline in bank lending, while (Konishi and Yasuda, 2004) argue that applying
capital adequacy requirements reduced the risk-taking behavior of commercial banks. In their
study of Spanish banks, (Barrios and Blanco, 2003) analyzed how banks set their capital ratios
(the rate of equity capital over assets). (Barrios and Blanco, 2003) report that the imposed
regulatory constraints were not significant in explaining the effectiveness of Spanish
commercial banks but that the biggest impact had more to do with the pressure of market forces.
(Toby, 2008) investigated the effects of capital adequacy regulation on Nigerian bank asset
quality for the period 2002-2004. The capital adequacy ratios are captured by equity to-total
assets, equity-to-loans and advances, and permanent assets-to-equity. The reported findings
indicate that equity-to-total assets ratio is insignificant in determining the level of classified
loans in the total loans’ portfolio, while an increase in the equity-to-loans and advances ratio
are found to significantly reduce the ratio of classified loans as a percentage of equity stock. It
is also noted that a high ETA can minimize the ratio of operating expenses to total revenue
because of economies of scale and scope and that the ratios of equity to loans and advances
have a significant inverse association with CLR.
In their study of 12 Chinese commercial banks for the period 2004-2006, (Zhang et al.,
2008) examined the impact of capital adequacy requirement on bank’s risk-taking behavior by

41
applying the GMM method. (Zhang et al., 2008) found that the compulsory enforcement of
capital adequacy requirements forced less-capitalized banks to increase their capital levels and
that higher capital level reduced the overall risk-taking behavior of banks, particular the
portfolio risk of banks.
In response to the 2008 global financial crises, (Kudinska and Konovalova, 2012)
examined the main determinants of bank capital adequacy for Latvian banks using a stepwise
method to estimate a regression model incorporating bank capital adequacy ratio as the main
independent variable (cap-adeq) and report credit risk to be the most important driver of bank
capital adequacy. The findings suggest that during the financial crises, Latvian commercial
banks were operating on the verge of capital adequacy as a result of substantial losses during
the period of the crises which resulted in the use of inflows of new shares and subordinated
capital. Provisions for outstanding debts and banks’ assets were also found to be key factors
influencing the capital of Latvian commercial banks. (Bridges et al., 2014) examined the effect
of changes in micro-prudential regulatory capital requirements on bank capital ratios and bank
lending for 53 UK banks using (FE). (Bridges et al., 2014) found that changes in capital
requirements had a significant effect on the observed capital ratio which is consistent with the
findings of (Alfon et al., 2005) and (Francis and Osborne, 2010) and also note that in response
to an increase in capital requirements, the banks examined raised their capital ratios above the
minimum requirement while also reducing their lending. (Lee et al., 2015), following a
disequilibrium equation modeling approach which is considers the diversity of ownership
structures of Chinese banks and examined the impact of the capital regulatory regime on the
effectiveness of Chinese bank capital levels on 15 listed and 62 unlisted banks considering new
regulations enforced by bank regulators in 2004 following China’s membership of the World
Trade Organization (WTO) in 2001 for the period 2004- 2011. The found that the Chinese
regulatory regime induced banks to increase their capital level and that CBRC regulations
affected unlisted banks, joint-equity banks and foreign bank's capital levels strongly. The
findings also show that the new regulations influenced bank capital movements more so than
recent market pressures. On the issue of the banks' ownership, the findings indicate that
regulations had the expected risk control effects in localized and less centralized rural and
urban commercial banks. (Daniel, 2015) examined the relationship between liquidity, capital
adequacy, bank size and GDP growth rate for a sample of Kenyan commercial banks. The
findings suggest that capital adequacy, bank size and GDP growth rate had a significant effect

42
on the liquidity of Kenyan commercial banks. (Klepczarek, 2015) using data for 49 European
banks, looked at the impact of both financial and economic indicators on the level of bank
capital following the 2008 global financial crisis, in particular, the factors affecting common
equity Tier1 ratio (CET1) which is a measure of the relationship between core capital and the
risk-weighted assets of banks. The reported findings suggest that the increase in the ratio of
risk weights of assets (RWA) reduced banks’ capital buffer and that competitive pressure is
positively correlated with capital adequacy while the profitability indicators and the average
inflation rate on capital adequacy was found to have no effect.
2.4 Risk-based capital literature review
To enhance the risk coverage of the capital framework, new rules of solvency margins were
imposed by bank regulators. These rules placed higher capital weights on bank assets and
during the early phase of transition in the implementation of the new rules many banks
struggled to adapt to the new capital framework. This was most certainly the case with
Jordanian banks as some bank assets proved inadequate for banks to maintain a diversified
portfolio of liquid and profitable assets. Therefore, understanding the wealth effects of these
standards is critical in any attempt to allocate capital across various activities of banks’
operations and activities. Early studies along this direction, such as (Gjerde and Semmen,
1995) examined the effectiveness of risk-based capital adequacy standards when bank’s
deposits are fully insured by using the level of bank leverage as a measure of the effectiveness
of different bank regulation mechanisms and a state-preference model that incorporate the
requirements of the risk-based capital plan. Gjerde and Semmen, 1995, found the risk-based
capital plan to be an effective regulatory mechanism and, moreover, that a combination of
risk-based equity ratio and leverage restriction appear to be the best approach to manage
portfolio risk’s, which is consistent with the findings of (Mayer, 1992). Similarly, (Cai and
Thakor, 2011) showed that risk-based capital requirements reduced bank lending, while
(Jacques and Nigro, 1997a) report that the new regulations reduced the portfolio risks of US
banks, and (Blum, 1999) report that capital requirements are associated with higher risks but
only if the costs of raising new capital are excessively high. Moreover, (Acosta et al., 2018)
found that leverage ratio and risk-based capital requirements are beneficial for bank stability.
(Eyssell and Arshadi, 1990), using data for a sample of 27 banks examined the wealth effects
of risk-based capital requirement by employing seemingly unrelated regression (SUR)

43
approach. (Eyssell and Arshadi, 1990) found that at the time of the announcement of the new
risk-based capital requirements, the equity values of large publicly traded banks decreased
and the banks with deficient capital ratios suffered the greatest loss in value.
(Cooper et al. 1991) added to the debate by investigating the effects of risk-based capital
requirements adoption for a number of international banks in the US, UK, Canada, and Japan
for the period 1985-1989. For securities prices, a market model approach was used to derive
abnormal returns changes in the periods surrounding the announcements. They used the OLS
and the variance of two-index model. (Cooper et al. 1991) report mixed results for the impact
of the new regulations on equity returns in Japanese banks due to the uncertainty among
investors regarding the new risk-adjusted capital rules. On the other hand, and in response to
the announcements, the findings indicate a significant decline in equity returns for US,
Canadian, and UK banks. In an influential paper, (Shrieves and Dahl, 1992) investigate the
relationship between risk and capital using data for US commercial banks for the period 1983-
1987 by utilizing a simultaneous equation approach. They found that risk exposure and
capital levels are simultaneously related and that the majority of US banks raised their asset
risk posture to mitigate the effects of increases in capital level.
(Ediz et al., 1998) examined the impact of risk-based capital requirements on UK bank
behavior by using quarterly data over the period 1989-1995. They formulated a dynamic,
multivariate panel regression model in which changes in capital ratios depend on the lagged
level of the ratio, in addition to a range of control variables such as net interest income over
total risk-weighted assets, fee income over total risk-weighted assets, bank deposits over total
deposits, total off-balance-sheet exposures over total risk-weighted assets, and provisions
over total risk-weighted assets. The regression results concluded that UK banks responded to
risk-based capital requirements by adjusting their portfolio risk, while capital ratios have not
changed. (Shrieves and Dahl, 1992) also found that banks met capital requirements by raising
new capital rather than alternating the loan composition in assets portfolio. Their finding also
suggests that capital regulations were effective in reinforcing banks' stability without
disrupting banks’ lending choices. Using a simultaneous equation modeling approach by
(Shrieves and Dahl, 1992), (Rime, 2001) examined the impact of regulatory capital
requirements on Swiss banks' risk-taking behavior by using the ratio of capital to total assets
and the ratio of capital to risk-weighted assets (RCWA) as dependent variables. (Rime, 2001)
found that regulatory pressure had a significant and positive impact on the ratio of the bank
capital to total assets but no significant impact on bank risk-taking while a positive and

44
significant relationship is observed between risk and ratio of capital to total assets. Size is
found to increase risk and reduce capital while regulatory pressure and PCAU have
significant positive effects on the ratio of capital to RWA and no significant impact on banks'
risk. (Calem and Rob, 1999) examined the required value of economic capital that is
necessary to cover credit risk. They found that required capital cover varies substantially with
portfolio risk, bank geography, assets’ diversification and loan characteristics and that the
regulatory capital standards were generally much too high for banks with regionally
diversified portfolios and that adopting regulatory capital requirements would most likely
reduce the incentive for such institutions to engage in regulatory capital arbitrage. (Hussain
and Hassan, 2005) using data of banks in developing countries examined the impact of capital
requirements on credit risk-taking. They employed both 3SLS and GMM methods and found
that these regulations did not raise the banks’ capital ratio and that bank size reduced capital
while also increasing bank risk taking behavior.
(Francis and Osborne, 2010) examined the efficacy of regulatory capital requirements
for a sample of UK banks’ during the period 1998-2006 using FE and GMM methods. They
found that these requirements direct banks’ capital management practices to maintain targeted
buffers above regulatory thresholds. (Hogan, 2015) examined both the capital and risk-based
capital ratio of US banks holding companies for the period 1999-2010 to predict banks’ equity
risk and risk of solvency. He measured bank’s equity risk by the standard deviation of their
stock returns and the risk of solvency by bank’s Z-scores. He report that risk-based capital
ratio was not a better predictor of bank risk than the standard capital ratio and that the capital
ratio is consistently and significantly much better than the risk-based capital ratio as a
predictor of both stock return volatility and banks’ Z-scores which are in line with the findings
of (Dowd et al., 2011) who found that risk-based capital regulations based on the Basel
accords suffered from the lack of information which meant that risk-based capital ratio is a
poor performance indicator.
(Lemonakis. et al, 2015) measured the efficiency of the banking industry in the Middle
East and North Africa (MENA) region during the period: 2003–2012. Using external and
internal to the firm factors and panel data econometric modelling. They attempt to present
new evidence on the relationship between efficiency, capital and risk of MENA region’s
banking industry. They found that bank capitalization is positively related to efficiency and
profitability and negatively to size, amount and quality of loans and risk measured with
Altman’s Z-score and negative relationship between efficiency and risk.

45
2.5 Capital regulations literature review
The maintenance of a robust infrastructure and legislative structure is generally considered
to be the main factors for achieving a stable financial system. In line with this objective, the
Central Bank of Jordan has sought to develop the financial system’s infrastructure and the
relevant financial regulations in order to improve the legislative scheme of the financial
system in order to secure the stability of the Jordanian financial system, especially given the
experiences of OECD countries which showed that inadequate supervisory and regulatory
rules can contribute significantly to initiating and intensifying crises faced by banks. In this
regard, it is important to investigate how capital regulations have affect the stability and safety
of Jordanian banks' since very little or no evidence of this exists in the current literature.
One of the earliest studies examining the effectiveness of infrastructure and legislative
structure is detailed in the work of (Kahane, 1977) who looked at the effectiveness of
regulatory instruments in protecting intermediary's solvency and found that capital regulation
was unable to reduce overall bank portfolio risk unless the asset composition of the bank’s
portfolio is subject to these regulations and that constraining the portfolio composition of the
intermediary cannot generally be regarded as an effective means for bounding the firm's
probability of bankruptcy. (Keeley and Furlong, 1990), using a mean-variance approach
examined the effects of bank capital regulation on the asset and bankruptcy risk of insured,
utility-maximizing banks. They found that the shift in the risk-return frontier is triggered
manly by capital regulations. (Mayer, 1992) studied the consequences of capital regulations
on the portfolio choices of commercial banks. He concluded that risk-based deposit insurance
premiums are stronger moderators for portfolio risk than capital requirements. In contrast to
a setting of incomplete markets, limited liability and shareholder-utility-maximizing banks,
he found that capital regulation can potentially reduce asset risk which is consistent with the
findings of (Keeley and Furlong, 1990). (Mayer, 1992) point out that there are three possible
scenarios when capital requirements are unexpectedly introduced by complete-market,
deposit-insured and value-maximizing banks. The first one is that no increase in capital is
observed and the bank invests in a combination of one risky asset and one riskless asset, the
second scenario is when no increase in capital is observed and the bank invests in a
combination of two risky assets and the third scenario occurs when the bank invests only in
one single risky asset to meet the imposed requirements.
(Cai and Thakor, 2011) analyzed the effects of capital regulation on bank behavior

46
using data of US banks for the period 1986-1993. (Cai and Thakor, 2011) report that increases
in risk-based capital requirements and regulatory subsidies stochastically reduced aggregate
bank lending especially for those banks with higher capital costs. In addition, (Barrios and
Blanco, 2003) using a disequilibrium estimation approach examined how 76 Spanish
commercial banks (over the period 1985-1991) set their rate of equity capital over assets
(capital ratios) to avoid bankruptcies. They report that regulatory constraints are not
significant moderators of capital augmentations in Spanish commercial banks and that the
pressure of market forces is the main determinant of banks' capital requirements. This finding
is in clear contrast with the findings of (Kim and Santomero, 1988) who showed that tight
capital regulations encouraged banks to reduce their credit facilities which adversely affected
the level of productive investments. (Gonzalez, 2005) also examined the impact of bank
regulation on bank risk-taking using a panel of 251 banks from 36 countries using a two-
stage least squares method. The findings show that regulatory restrictions influenced banks’
risk-taking behavior though this was inconsistent. (Uhde and Heimeshoff, 2009) examined
the effects of capital regulation on the European bank's stability for the period 1997 -2005
and found Eastern European banking markets to be less diversified and more concentrated.
These markets are more prone to financial fragility. The findings also showed that market
concentration harmed European banks’ financial soundness.
(Stolz and Wedow, 2011) analyzed the effect of the business cycle on the regulatory
capital buffers of German local banks for the period 1993-2004 using GMM method. They
report that capital buffers behaved counter-cyclically and that the results varied depending on
the level of bank capitalization, where less-capitalized banks decreased capital buffers and
raise risk-weighted assets over the business cycle while well-capitalized banks maintained
capital buffers and risk-weighted assets in booms and increased capital buffers by
accumulating capital and lowering risk-weighted assets during the market downturn.
(Teixeira et al., 2014) investigated the impact of capital requirements on banks’ equity capital
using panel data for a sample of 560 banks from the US and Europe. They found that
regulatory capital requirements are not the main determinants of banks’ capital structure.
According to the type and region of the bank, the determinants of the banks’ share of equity
vary. Based on the work (Blundell and Bond, 1998), (Abreu and Gulamhussen, 2015)
examined the impact of the new Federal Reserve (FED) regulations on capital levels and
buffers held by banks before the U.S. financial crisis using a sample of 4433 banks. They
found that the Federal regulations failed to force the banks to build capital buffers or alter

47
their adjustment speeds during the economic upturn that preceded the crisis. (Rahman et al.,
2015) using a panel dataset of 30 Bangladeshi commercial banks for the period 2008-2012,
examined the impact of bank size on bank regulatory capital ratios and risk-taking behavior
by employing GMM and simulated equation models. They found that large banks are riskier
and have a higher level of capital relative to their smaller counterparts and that bank risk
exposure decreased with a high level of regulatory capital. (Ashraf et al., 2016) using annual
data consisting of 8689 banks from 58 countries examined whether common equity-based
and risk-based capital requirements forced banks to restrict dividend payments or not using
the random-effects method. They found that banks paid lower dividends in countries where
regulators imposed common equity-based capital regulation but after extending the sample
period from 1998 to 2012, they found that regulatory capital requirements are less effective
in restricting bank dividend payments during the crisis period.
(Yameen and Ali, 2016) evaluated the financial soundness of thirteen Jordanian
commercial banks, between 2002 and 2011. They found that all the Jordanian Commercial
banks are financially sound. They concluded that the Bank meter could help the commercial
Jordanian banks’ internal management to avoid insolvency issues with proper control over their
operations. (Al-Homaidi. Etal, 2018) examined the relationship between the extent of voluntary
disclosure level and profitability of Yemeni Islamic banks and measure the level of voluntary
disclosure information and its association with the profitability of 30 annual reports of Yemeni
Islamic banks covering the period from 2005 up to 2014. They found that corporate governance
information, corporate social disclosure, bank size and bank age have a negative and significant
relationship with return on assets. Concerning (ROE), the results reveal that background about
the Islamic bank, financial ratios, corporate governance information, corporate social
disclosure, zakat information, and bank size have a negative and significant effect with return
on equity.
(Haryanto, 2020) analyzed the factors that affect the profitability of Islamic banks in
Indonesia using quarterly data from 2006-2019. He aimed to analyze the effect of efficiency,
risk, liquidity, capital and macroeconomic conditions on the profitability of Islamic banks in
Indonesia. He found that the efficiency and risk had a positive effect on profitability. Inflation
has a negative effect on profitability. While liquidity, CAR and GDP do not affect the
profitability of Islamic banks.
2.6 Bank liquidity, liquidity risk, and credit risk literature review

48
Banks are widely known to experience various types of risk, ranging from interest rate risk
to credit risk. Therefore, understanding risks and their impact on bank performance is critical
to all banks which also applies to Jordanian banks since banks in Jordan are themselves
exposed to different types of risks and because of the important role that Jordanian banks play
in the financial system and the real economy. Therefore, if these bank specific risks are not
properly managed, they may have untold repercussions for the real economy. It is worth
noting that the banking sector in Jordan does not have a functioning credit risk management
system to be able to anticipate future risks that might affect the system. As a result, serious
events have risen due to such inadequacy. One example of this is the excessive losses incurred
by the Housing Bank, which is one of the largest banks in Jordan, a result of the collapse of
subsidiaries in neighbouring countries such as Syria. In light of these losses, bank officials
confirmed that such losses could have been avoided had there been a functioning credit risk
management system in place to correctly anticipate future crises. Therefore, identifying the
major type of risks faced by Jordanian banks should assist in helping the Central Bank of
Jordan’s reform policies in the direction of mitigating these risks while also maintaining the
stability of the banking system.
Using annual data of banks in 12 advanced economies during the period 1994-2006,
(Chen et al., 2018) employed alternative liquidity risk measures besides liquidity ratio and
examined the main drivers of liquidity risk while also using a set of control variables
consisting of bank-specific, supervisory and macroeconomic characteristics. The authors
used 2SLS IV methods. The finding indicates that liquidity risk reduced profitability due to
the higher cost of funds but increased banks’ net interest margins. The study classified the
financial systems of the countries’ in the sample as either bank-based or market-based, and
report liquidity risk to be negatively correlated with bank performance mainly in market-
based financial systems. (Cucinelli, 2013), using annual data for 1080 listed and non-listed
Eurozone banks for the period 2006- 2010, he report that over the long-run well-capitalized
banks have large liquidity covers and high-risk exposures and that assets quality,
capitalization, size, and specialization are significant factors in planning effective liquidity
risk management. (Distinguin, et al., 2013) examined the relationship between bank
regulatory capital and bank liquidity using annual data for European and US publicly traded
commercial banks for the period 2000-2006 using control variables that include total assets,
total loans/total assets, total deposits/total assets, loan loss, provisions/total loans, Tier1
capital/total assets, Tier1 and 2 capital/RWA, ROA, and total interest income/total income.

49
They employed FE and GMM methods and found banks in their sample to be less likely to
regulate capital buffers for the purpose of raising liquidity levels. And considering minimum
liquidity ratios concomitant to capital ratios enforced by the Basel Committee on Banking
Regulation and Supervision, the findings indicate that small banks tended to strengthen their
solvency standards when exposed to liquidity deficits while large banks might underestimate
liquidity risks because of their too-big-to-fail status. (Yan et al., 2014) estimated liquidity risk
for UK banks’ using annual data for the period 1997-2010 by utilizing an exposure-based
cash-flow-at-risk (CFaR) approach that has been adopted by a number of international and
national banks such Barclays, RBS (the Royal Bank of Scotland’s) and Lloyds for liquidity
management. The findings showed that in 2011 RBS faced the largest liquidity risk while
only HSBC managed to maintain positive CFaR throughout the study period. Over the same
period, the most volatile cash flows were observed for Lloyds and Nat-west banks, as
measured by the decreasing cash flow at risk as a percentage of expected cash flow. On the
same issue, (Roman and Sargu, 2015) examined the determinants of liquidity risk for a
sample of banks in CEE countries (Poland, the Czech Republic, Bulgaria, Latvia, Hungary,
Lithuania, Romania) using OLS. They report a significant and positive relationship between
total capital ratio (TCR) and overall liquidity and, moreover, a negative impact of impair
loans on banks’ liquidity. The adverse effects of the global financial turmoil and internal
macroeconomic downturn were found to enhance the overall liquidity profiles of the banks.
Taking a different approach and based on a partial-adjustment model similar to (Berger et al.,
2016) using data for 127,828 U.S. banks during the period 1992-2012 looked at how the
liquidity management plans changed following the 2008 global financial crises 2008 using
FE and GMM. They report that a typical U.S. commercial bank actively managed its balance
sheet liquidity and that the implementation of the Basel III 'net stable funding ratio standards'
had significant positive effects on bank liquidity management. They also report that the loans-
to-core deposits and net stable funding ratio standards are strictly implemented in smaller
banks than bigger banks. (Khan et al., 2017) examined the relationship between funding
liquidity and bank risk-taking for U.S. bank holding companies using quarterly data for the
period 1986-2014 and report evidence which show that banks, in general, with low liquid
profiles, have high-risk exposure. (Aydemir and Guloglu, 2017) examined the impact of
credit and liquidity risks on banks’ spreads during business cycles in emerging markets. Their
findings showed that credit risk was more important than liquidity risk in explaining bank
spreads and that the spread effects of credit and liquidity risks vary over the business cycle.
Interestingly, the findings suggest that during periods of recession, liquidity risk had a larger

50
significant impact on spreads while during economic booms, credit risk replaced liquidity
risk in influencing bank spreads.
(Altarawneh, 2018) investigated the impact of operational risk, credit risk, and liquidity
risk on bank performance in Jordan. He found that operational and credit risks have a
significant negative relationship with ROA while liquidity risk is found to have an
insignificant positive relationship with ROA, the relationship between firm size and ROA is
negative while the relationship between bank age and ROA is found to be positively
significant, the relationship between management change and ROA is positively
insignificant.
2.7 Summary and Conclusion
This chapter presents a survey of the literature underpinning the research contained in this
thesis covering a selection of critical studies that have influenced the growing literature on
the determinants of bank performance, studies on the impact of capital, capital adequacy
requirement, risk-based capital, liquidity risk, capital regulation and other factors on banks’
performance measures. Generally, bank performance is affected by internal and external
factors. In contrast, changes in bank-specific characteristics such as size, capital and risk
management are found to cause significant changes in bank profitability. Liquidity and
liquidity risk are also known to adversely affect bank performance, while capitalization, GDP
growth and inflation are profitability triggers.
Each of the separate themes of the foregoing literature reveals gaps in the literature,
suggesting areas of research using Jordanian data. In this respect and on the issue of risk and
capital adequacy requirement. It is the case that the majority of studies investigating the
impact of capital adequacy requirements on banks’ performance have been more interested
in examining bank specific data from developed countries. Most of these studies report that
high risk is associated with high capital levels and the adoption of capital adequacy rules may
increase bank's riskiness. While other studies have found that the implementation of capital
adequacy requirements reduced risk-taking by commercial banks. This ongoing debate is
lacking in strong empirical evidence from developing countries, especially Middle Eastern
countries.
The Jordanian banking system has a high capital adequacy ratio, which ranged between

51
18-21 percent. These rates are higher than both the Central Bank of Jordan and the Basel
limits of 12 percent and 8 per cent, respectively. Thus, it is of interest to investigate how and
how steering capital requirements have helped stabilize and therefore protect Jordanian
commercial banks against risks. Similar questions can be raised with respect to the impact of
bank risk-based capital on risk exposure and Jordanian commercial bank stability. As this
review has shown, the literature in this area is mixed as some studies have found that risk-
based capital has had a negative impact on bank performance while other studies report that
it has enhanced stability. Other studies have also looked at the impact of risk-based capital
on bank lending behavior and report a minor impact on loan growth. Since high risk-based
capital levels make lending more expensive. In line with risk-based measures, the literature
on the criticality of liquidity and credit risk in influencing bank stability support the existence
of a positive relationship between liquidity and credit risk, especially after the 2008 crisis,
where liquidity risk has been shown to be one of the main reasons for bank failures. Regarding
the impact of capital regulations on the banking sector behavior, one strand of the literature
suggests that capital regulation reduces asset risk, while another strand suggest that adopting
capital requirement regulations increases the chance of bank failure. Bank capital and
operational efficiency are also considered important risk determinants. And the literature in
this area has shown that capital regulations improve banking sector stability because it helps
to foster the efficient allocation of risks while also supporting financial stability.
The empirical study set out in each of the subsequent chapters fills an important gap in
the literature on bank performance determinants by considering the impact of bank-specific,
market structure and macroeconomic variables on different profitability measures for a
sample of 13 Jordanian banks for the period 2003-2015. In this respect Chapter 4, investigate
the profitability of Jordanian banks in light of bank reform and the deregulation programs,
and looks at the impact of competition, risk, and interest rates on bank performance. Chapter
5 studies the relationship between Jordanian banks' capital, risk, and efficiency, while
Chapter 6 examine the impact of Jordanian banking system efficiency and competition on the
cost of credit. Chapter 7 examine liquidity funding risk and the impact of the deposit
insurance scheme on the risk-taking behavior of Jordanian banks.
In consideration of the gaps in the literature previously mentioned, the study seeks to
answer the following research questions:
• How and in what ways have the competitive conditions affected the profitability of

52
Jordanian banks?
• Does liquidity risk influence the profitability of Jordanian banks?
• To what extent have changes in interest rates affected the profitability of Jordanian
banks?
• Which market type monopoly, monopolistic competition, or perfect competition, best
represents the Jordanian banking sector?
• Does bank capital affect the risk-taking behavior of Jordanian banks?
• Does bank capital affect the efficiency of Jordanian banks?
• To what extent does risk affect the efficiency of Jordanian banks?
• Does bank size affect liquidity funding?
• Does capitalization affect the liquidity funding requirement of Jordanian banks?
• To what extent have crisis periods affected the liquidity funding requirements of
Jordanian banks?
• Does the size of a bank affect its liquidity creation?
• Does bank capitalization affect liquidity creation?
• To what extent has crises periods affected the liquidity creation of Jordanian banks?
In relation to these questions, we hypothesize that:
H1.1: There is a positive relationship between bank competition and profitability.
H1.2: There is a significant positive relationship between liquidity risk and profitability.
H1.3: There is a positive relationship between the interest rate and profitability.
H2.1: There is a positive relationship between bank capital and efficiency.
H2.2: There is a negative relationship between risk and bank efficiency.
H2.3: There is a negative relationship between capital and risk.
H3.1: There is a negative relationship between bank efficiency and the cost of credit.
H4.1. Lower funding liquidity risk incentivises banks to take more risk.

53
H4.2. Banks with higher capital buffers are less risk-taking in response to lower funding
liquidity risks.
H4.3. Larger banks take less risk in response to lower funding liquidity risk
H4.4. In response to reductions in funding liquidity risk, bank risk decreased during the Global
Financial Crisis.
In this section we will focus on the theories related to that have been developed over the years
by researchers in banking and related to the study objectives and hypotheses.
Conducting research on the performance of the banks begin between 1970 and 1980.
They applied efficient structure theory and market power theory (Athanasoglou et al., 2006).
Portfolio theory as well helps in determining banks’ profits and used in the study of the
profitability of banks (Nzongang and Atemnkeng, 2006). The bank performance is affected by
the market structure of the industry stated by market power theory which was given by
(Tregenna, 2009). The SCP and the RMP theorem are the two different approaches of the
market power theory. Efficiency theory states that banks are more efficient earn more profits
and it possesses two different approaches named as Scale efficiency hypothesis and X
efficiency. X efficiency states that efficient firms have lower cost hence, they are more
profitable than others. On the other hand, approach of Scale efficiency focuses on high scale
production and ignores any differences in management and technology of production. Large
firms size has the benefit of economies of scale which produce higher profit as a result to the
low per-unit cost. Hence, they have a high market share which leads to higher profits
(Athanasoglou et al., 2006). Balanced portfolio theory also plays a vital role in the study of the
performance of the banks. (Nzongang and Atemnkeng,2006). This theory states that decisions
regarding the policy affect the optimal presence of each asset in the investment of shareholder
which affected by factors such as rate of return, size of the portfolio and risks associated with
the holding of each asset. High profits can be achieved by a possible set of liabilities and assets
which are recognized by management and expenses incurred by banks. Bank performance
affected by risk-return trade-off and the equity to asset ratio. According to financing theory,
high levels of debt and low value of equity to asset ratio results in high risk which results in
high rates of return which also explains the risk-return trade-off theory (Van Ommeren, 2011).
Some studies explained that higher profits can be fetched by high equity to asset ratio. The
market value of the bank increases with high equity ratio according to the signalling hypothesis

54
(Berger, 1995). On the other hand, bankruptcy cost hypothesis states that banks hold high
equity as a result of unexpectedly high bankruptcy costs to avoid financial debt (Berger, 1995).
Starting with the literature assessing competition in the banking sector. They are
divided into two types of research: (1) studies that adopt a structural approach and (2) studies
that adopt a non-structural approach. The structural method has its roots in the theory of
industrial organization that measures competitiveness following the Structure-Conduct-
Performance (SCP) paradigm and the alternative efficiency hypothesis (EH). The SCP
paradigm, having its origin in the work of (Bain, 1951). In our study, we employ one of the
“Non-Structural Model” approach suggested by (Rosse and Panzar 1977) and Panzar and Rosse
(1982, 1987) which used by several scholars to determine the structure of the banking market
in some countries and its impacts on the bank profitability. In Jordan, we used the Panzar-
Rosse assessment as it is the appropriate method that complies with the available data. (Gilbert,
1984), pointed out that a major weakness in most bank market structures studies is the absence
of a theoretical foundation which takes account of bank regulation when considering the effect
of market structure on bank profitability. The competition-efficiency hypothesis recommended
that efficiency leads to reduce banks’ costs which further proceed to higher
profitability. Conversely, studies in favour of SCP hypothesis suggested that less competition
in banks tend to expand their business activities and higher profitability.
The risk- aversion hypothesis was first introduced in the manufacturing industry by
(Galbraith, 1967) and then expanded by (Cave, 1970). The Galbraith- Cave or risk avoidance
hypothesis as referred by (Edwards and Heggested 1973) indicates that banks located in more
concentrated markets may choose to trade off some of their potential monopoly profit for
reduction in risk by choosing safer portfolios. Thus, (Clark, 1986) had indicated that selecting
a safer portfolio of assets and liabilities in line with their risk-preference, banks located in
concentrated markets with monopoly power, may reduce risk at the expense of some monopoly
profit. Hence, the risk avoidance hypothesis may provide an explanation for the lack of
relationship between concentration or monopoly power and profitability. (Clark, 1986) also
analyzed the existence of a systematic interrelationship between market concentration, risk and
profitability as suggested by the risk-avoidance hypothesis. He argued that asset and liability
portfolio selection, risk and profitability are interrelated and hence determined simultaneously.
Thus, he estimated a simultaneous equation model by using the two-stage least squares
technique. The results indicated that concentration had a significant negative effect on overall
bank risk and a significant positive effect on profitability. (Kushner et.al, 1989), examined the

55
impact of firm size on the profit rate and the level of risk for chartered banks and the national
trust and loan companies in Canada. The 10 firms used for the study account for more than 75
% of all trust companies’ assets in Canada. Results somewhat showed mixed support for the
Galbraith-Caves hypothesis. Firstly, the results did not support the hypothesis that larger firms
can reach desirable sets of profit and risk. However, it is suggested that larger firms and firms
with greater market power operate at lower levels of risks. These findings provide evidence in
favour of the risk-avoidance hypothesis among large commercial banks in addition to
demonstrating the importance of risk as a determinant of bank profitability. The implication of
the presence of risk-avoidance behaviour in the banking industry is that credit will only be
extended to safe business firms which are usually large establishments in monopolistic markets.
Several possible explanations have been put forward for the bank’s risk adverse behaviour.
(Vernon, 1971), pointed out that banks are generally controlled by managers rather than
owners. These managers do have considerable control over the risk exposure of their banks in
their daily portfolio decisions. However, the adverse effects of an unsuccessful managerial
decision may far outweigh the rewards for a successful management decision. As a result, a
major impact of managerial control in banking is a tendency is for more risk adverse behaviour.
To this extent, (Edwards and Heggestad, 1973) found that the degree of risk, as measured by
the coefficient of variation of large banks‟ profits over time tends to fall significantly as the
level of concentration in the respective bank’s market increases. Thus, providing further
support for the risk avoidance hypothesis. Another possible explanation provided by
(Heggestad, 1977) was that the banks‟ risk adverse behaviour may be a consequence of
regulation, since one of the main objectives of bank regulation is to limit the risk exposure of
banks by restricting their portfolio choices. Effective portfolio regulation would thus constrain
banks to safer portfolios and thus provide apparent evidence in favour of the risk-avoidance
hypothesis. The structure‐conduct‐performance hypothesis states that highly concentrated
markets positively impact bank profitability through greater market power and therewith the
ability to charge high rates for loans and low rates for deposits. Empirical evidence for the
structure‐conduct‐profit hypothesis is found in (Goddard et al., 2004) for Europe. On the other
hand, the efficient‐structure theory claims that greater market shares are gained from higher
efficiency which increases profitability, see (Berger, 1995). The theory of capital structure
states that a higher use of debt (equity) financing within a certain range, might actually reduce
(increase) firms' cost of capital. Thus, a positive (negative) coefficient estimate for equity-to-
assets indicates an efficient (inefficient) management of banks’ capital structure. Besides
efficiency, competition between banks can influence the stability of the sector (Carletti and

56
Hartmann, 2002). The link between competition and financial stability has been recognized in
theoretical and empirical research. Indeed, competition affects the stability of the sector in the
sense of either fragility or excessive risk-taking (Geraldine and Weill, 2008).
Balanced portfolio theory also plays a vital role in the study of the performance of the
banks. (Nzongang and Atemnkeng,2006). This theory states that decisions regarding the policy
affect the optimal presence of each asset in the investment of shareholder which affected by
factors such as rate of return, size of the portfolio and risks associated with the holding of each
asset. High profits can be achieved by a possible set of liabilities and assets which are
recognized by management and expenses incurred by banks. Bank performance affected by
risk-return trade-off and the equity to asset ratio. According to financing theory, high levels of
debt and low value of equity to asset ratio results in high risk which results in high rates of
return which also explains the risk-return trade-off theory (Van Ommeren, 2011). Some studies
explained that higher profits can be fetched by high equity to asset ratio. The market value of
the bank increases with high equity ratio according to the signalling hypothesis (Berger, 1995).
On the other hand, bankruptcy cost hypothesis states that banks hold high equity as a result of
unexpectedly high bankruptcy costs to avoid financial debt (Berger, 1995).
From a theoretical point of view, sound competition in the banking market is of great
economic importance as it is lowering prices and improves the quality of services and
performance. The degree of competition in the financial sector can influence the efficiency of
the production of financial services (Jiménez et al., 2007). Increased competition in the
financial sector to lead to lower costs and enhanced efficiency and profitability. Furthermore,
competition can affect the quality of financial products, it forces banks to improve their
efficiency, thus will help households and firms access to financial services and finance, which
improve profitability and economic growth. Moreover, the higher the degree of competition in
the banking sector, the higher its efficiency in allocating funds and operating as an intermediary
between lenders and borrowers (De Nicolò and Loukoianova, 2007).
According to financing theory, high levels of debt and low value of equity to asset ratio
result in high risk, resulting in high rates of return, which also explains the risk-return trade-
off theory (Van Ommeren, 2011). Some studies explained that higher profits can be fetched by
high equity to asset ratio. According to the signalling hypothesis, the market value of the bank
increases with high equity ratio (Berger, 1995). On the other hand, bankruptcy cost hypothesis

57
states that banks hold high equity as a result of unexpectedly high bankruptcy costs to avoid
financial debt (Berger, 1995).

58
CHAPTER 3
Background to the Jordanian Banking Sector
3.1 Introduction
The theoretical structural model implies that the financial system is included in one of many
factors that can be treated as economic growth determinants as the institutional framework of
the financial system and its performance is also an important determinant of economic
growth. its stability and development have a positive impact on economic growth. However,
when verifying this hypothesis, some questions appear: Is the relationship between the
financial sector and economic growth strengthened after the last global crisis and the crisis?
(Matysek-Jedrych, 2007) define the financial system as it is the structure of ‘‘interconnected
financial institutions, financial markets and elements of financial system infrastructure;
through this structure, entities belonging to the real environment (first of all households,
enterprises and government) can source funding, invest savings and satisfy the rest of their
needs relating to the financial aspect of their functioning’’ (Matysek-Jedrych 2007).
As one of the financial system main drivers of the economy is the banking system.
Many of the economics is a bank-based financial system. The bank is a financial institution
involved in borrowing and lending money. It plays an important role in the economy by
offering a service of saving and financing for household, people, business, and government.
These services, such as providing loans, are essential for enabling economic growth. The
banking system consists of banks such as commercial banks, investment banks, Islamic
banks, agriculture and industrial banks. Commercial banks play an essential role in the
banking system and the economy, a vital component of the financial system. One of the main
functions of commercial banks is to allocate funds from savers to borrowers efficiently by
providing different and specialized financial services. These financial services help to make
the overall economy more efficient.
(Werner, 2012) shows that the macroeconomic feedback of banking activity had been
neglected. The study that one of three theories of banking has been dominant: The credit
creation theory of banking maintains that through accounting operations each bank can
individually create money out of nothing. The fractional reserve theory states that only who
can collectively create money is the banking system as a whole, and they are a financial

59
intermediary, gathering deposits and lending money. The third one is the financial
intermediation theory which considers banks as financial intermediaries both individually and
collectively, showing that the bank banks are indistinguishable from other non-bank financial
institutions in their behaviour.
The first empirical test published on this issue was (Werner, 2014b), who examine the
actual operations and accounting entries taking place when a ‘live’ bank loan is granted and
paid out. He found that only the credit creation theory was consistent with the observed
empirical evidence. Previous literature discussed the linkage between banking sector
development and economic growth and confirmed that the banking system financing enhance
and improve economic growth. (McKinnon, 1973) found that increases in banking services
and financial activities are accelerating economy toward growth. (King and Levine, 1993)
argued that providing more funds to the economy stimulates the movement of economic
wheels. Using a data for in emerging and developed countries, (Hshin-Yu Liang and Alan
Reichert, 2006) examined the relationship between banking system development and
economic growth and found a strong supply–leading relation between banking sector
development and economic output. Moreover, for 10 Europeanan Union countries throughout
1994 to 2007, (Caporale M. et al, 2009) found that stock and money markets are still
underdeveloped and their contribution to economic growth is limited, whilst banks enhanced
economic growth.
In developing countries, using a data that covered the Palestine banking system during
the period of 1995 to 2011, (Alfara, 2012) discussed the role of the banking sector in financing
economic development and found that banking credits have a positive effect on gross
domestic product. While in some neighborhood countries, (Owdeh, 2012) studied the
relationship between banking sector growth and economic development in Lebanon and
found a positive impact on the role of the banking system in economic growth. Similarly,
(Al-Khatib and Al-Saffar, 2013) examined the relationship between financial development
and economic growth in Jordan and found that banking sector development and economic
growth has a strong demand-leading relationship and the banking system development is
significantly influenced by economic growth.
The previous literature suggested that both bank-specific factors (internal) and
macroeconomic factors (external or environmental), may have an influence on the bank’s
performance (Bourk,1989). The importance of that analysis of both bank-specific factors
(internal) and macroeconomic factors (external or environmental) on the bank’s performance
should be carried out, which will help decision-makers improve banks’ performance by

60
manipulating internal by mitigating/capitalizing on the influence of external factors.
The theoretical and empirical studies show that the banking system affected by various
internal and external variables (Ugwunta et al., 2012). Bank characteristics divided into
internal and external factors. Internal factors include capital adequacy, cost to income ratio,
liquidity; calculated as loans to customers, and the accounting value of the bank’s total assets
and external factors, including the annual inflation rate and real gross domestic product
growth. The internal factors are those that can be controlled by the bank management and
influences decision-making. While external factors are those factors that cannot be controlled
by bank management and influence decision-making. However, managers can analyze the
external factor and environment to benefit from any changes that could be happened.
Over the last years of the deregulations and the economic reform program since 1980,
a number of factors have contributed to the Jordanian banking system performance (internal
and external). For example: In regards to increasing the sector competition, the CBJ attempt
to use deregulation, reform program, and liberalization that promoted by the Central Bank
Directive on the banking system. This directive provides the competitive conditions for all
Jordanian banking institutions, which will influence banks’ profitability. It has its important
for stakeholders such as the central banks, governments, bankers’ associations, and other
financial authorities and the managers of the banks. the mentioned steps that carried by CBJ
it has its role to improve and enhance the economic growth as well. Previous work such as
(Pasiouras and Kosmidou, 2007); (Rajan and Zingales, 1998); and (Levine, 1998) work, show
the impact of both internal and external factors on the banking performance.
The banking sector in Jordan is the cornerstone of the Jordanian economy. This is
because when the real economy was left shaken by the global financial crises of 2008, the
banking sector not only showed considerable resilience also provided much needed liquidity
that enabled the economy to withstand the spillover effects of the negative externalities
brought about as a result of the fallout from the U.S. subprime crisis. Since the beginning of
the 1990s and the launch of the joint venture of the Central Bank of Jordan (CBJ) and the
World Bank (WB) to reform the banking sector following the 1980s crises, the banking sector
continued to grow and with that growth has attracted interest from both domestic and
international investors.
The Jordanian banking system consist of the CBJ including Islamic banks, foreign

61
banks, commercial banks, specialized lending institutions, real estate institutions, saving and
other financial institutions, specialized credit institutions, housing banks, and money-
changing companies. In 2010, the number of working banks stood at 25, including 3 Islamic
and 9 foreign banks. Over the years, Jordanian banks have accommodated the financial needs
of individuals and large corporations and, as a result, has the highest concentrations of credit
payments covering trade, construction, and industry sectors. In terms of total bank equity,
since 2007, the banking sector has experienced continued growth. This has enabled the sector
to support bank lending activity on the one hand, and on the other to support increased non-
distributed bank earnings and the demands of the new minimum capital requirements of the
CBJ.
As is the case in all developed and developing countries, the primary objectives of
commercial banks in Jordan is to maximize shareholder profit. But unlike conventional profit-
seeking banks, Jordanian banks face several types of risk while undertaking banking
operations and also operate in a highly regulated legislative environment which is designed
to maintain the safety and soundness of the banking system. The purpose of this chapter is to
give a brief overview of the developing banking sector in Jordan and thereby provide the
context underpinning the study carried out in this thesis. This is discussed in the next section,
which provides an overview of the development of the Jordanian banking sector starting from
the 1990s, including a brief discussion of the evolution of the CBJ and CBJ regulations in
light of the Basel accords. The structure of this chapter divided into 4 sections as follows:
Section 3.1 introduction. Section 3.2 present the overview of the banking system in Jordan.
Then in section 3.3, we apply indicators of financial soundness to discuss the development
of Jordanian banks' assets and liabilities over the period 1993-2015. Section 3.4 concludes
the chapter.
3.2 Overview of the banking system in Jordan
In the last century, the Jordanian banking sector was founded when the British Othoman Bank
became the first bank to commence banking operation in Jordan in 1925. The Ottoman Bank
operated solely in the market until 1935 when the Arab Bank Limited opened its first branch
in Amman at the end of 1934 (The Ottoman Bank changed its name in 2003 to the Standard
Chartered Bank). However, due to the political instability in Palestine, the Arab Bank was
forced to relocate its headquarters to Amman. On 14 April 1949, two more banks were
62
established, the British Bank for the Middle East and the Arab Nation Bank (ANB). Initially,
the ANB did not practice banking activities and, as a result, was liquidated. In 1957, the Arab
Real Estate Bank commenced conventional banking activities in Jordan as a commercial bank
and also provided specialized real estate finance services. Five more banks were later
established in the 1950s – the Jordan National Bank, Cairo Amman Bank, Rafidain Bank,
Saudi Riyadh Bank, and Intra Banks. Since the Saudi Riyadh Bank did not engage in bank
related activities, its registration was cancelled. In contrast, the activities of Intra Bank were
suspended as a result of its insolvency in 1970. However, it was later re-established in 1977
under the new name of Al-Mashreq Bank following the merger with Jordan Bank when the
latter was liquidated in 1989. In addition, three specialized government owned credit
institutions were established in 1960 – the Agriculture Credit Corporation, the Housing and
Urban Development Corporation, and the Cities and Village Development Corporation, and
in 1961 the Holy Land Bank registered a domestic bank but its registration ceased in 1965.
Barclays Bank was one of the earliest foreign banks to operate in Jordan, followed by HSBC
Bank in the late 1950s.
Until 1964, the Jordanian monetary board did not exercise any influence over the
Jordanian banking sector. It was only when the CBJ was established in 1964 as an
independent legal entity owned by the Jordanian government that the CBJ obtained powers
that made it the only official monetary authority of Jordan. The CBJ is managed by a board
of directors who are appointed by the council of ministers. Its main role is to administer
monetary and credit policies, as well as to ensure the day to day stability of the Jordanian
banking and financial system.
In the 1970s, five banks were established: one Islamic bank (Jordan Islamic Bank for
Finance and Investment) and four domestic banks (Jordan Kuwaiti Bank, Housing Bank for
Trade and Finance, Arab Jordan Investment Bank, and Jordan Gulf Bank, known now as
Jordan Commercial Bank). Two more domestic banks (Arab Banking Corporation and Jordan
Investment and Finance Bank) were established in the 1980s. In the 1990s, four banks were
established, including one Islamic (Islamic International Arab Bank Plc) and three domestics
(Union Bank for saving and Investment, Société Générale De Banque-Jordanie, and Export
and Finance Bank). During the 2000’s, seven banks were established, including a local and
six foreign banks(Standard Chartered Bank, National Bank of Kuwait, Audi Bank, BLOM
Bank, Jordan Dubai Islamic Bank, National Bank of Abu Dhabi, and Al Rajhi Bank). The
CBJ supervised all banking operations in Jordan.
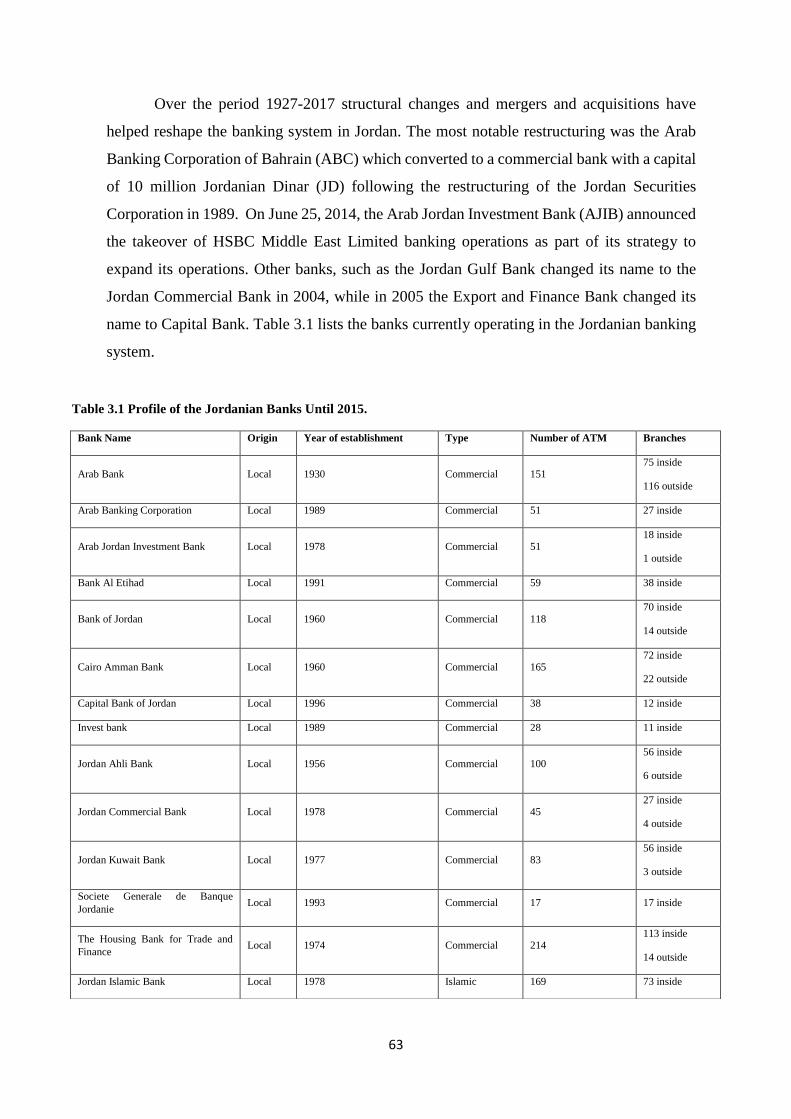
63
Over the period 1927-2017 structural changes and mergers and acquisitions have
helped reshape the banking system in Jordan. The most notable restructuring was the Arab
Banking Corporation of Bahrain (ABC) which converted to a commercial bank with a capital
of 10 million Jordanian Dinar (JD) following the restructuring of the Jordan Securities
Corporation in 1989. On June 25, 2014, the Arab Jordan Investment Bank (AJIB) announced
the takeover of HSBC Middle East Limited banking operations as part of its strategy to
expand its operations. Other banks, such as the Jordan Gulf Bank changed its name to the
Jordan Commercial Bank in 2004, while in 2005 the Export and Finance Bank changed its
name to Capital Bank. Table 3.1 lists the banks currently operating in the Jordanian banking
system.
Table 3.1 Profile of the Jordanian Banks Until 2015.
Branches Number of ATM Type Year of establishment Origin Bank Name
75 inside
116 outside 151 Commercial 1930 Local Arab Bank
27 inside 51 Commercial 1989 Local Arab Banking Corporation
18 inside
1 outside 51 Commercial 1978 Local Arab Jordan Investment Bank
38 inside 59 Commercial 1991 Local Bank Al Etihad
70 inside
14 outside 118 Commercial 1960 Local Bank of Jordan
72 inside
22 outside 165 Commercial 1960 Local Cairo Amman Bank
12 inside 38 Commercial 1996 Local Capital Bank of Jordan
11 inside 28 Commercial 1989 Local Invest bank
56 inside
6 outside 100 Commercial 1956 Local Jordan Ahli Bank
27 inside
4 outside 45 Commercial 1978 Local Jordan Commercial Bank
56 inside
3 outside 83 Commercial 1977 Local Jordan Kuwait Bank
17 inside 17 Commercial 1993 Local Societe Generale de Banque
Jordanie
113 inside
14 outside 214 Commercial 1974 Local
The Housing Bank for Trade and
Finance
73 inside 169 Islamic 1978 Local Jordan Islamic Bank

64
Source: ASE (2015), CBJ (2015); ABJ (2015)
3.2.1 Composition of Jordanian financial sector
The Jordanian banking sector has three types of banks: commercial banks, Islamic banks, and
investment banks. These banks are regulated by the CBJ, with the exception of foreign banks,
who remain subject to their home country regulations. Commercial banks are banks that deal
with traditional borrowing and lending functions while Islamic banks are banks that offer
services and products in accordance with Islamic practices and Shariah Laws. These banks
incur more operational costs than the other Jordanian banks as a result of their role in financing
social services, while their depositors share in the profit and loss of their operations. Investment
banks are, however, more specialized and are involved in selected capital market activities such
as the issuing, distribution and selling of securities, brokerage services and the underwriting of
new share issue and debt. All of these banks, except foreign banks, are listed on the Amman
stock market.
In Jordan, commercial banks dominate the banking market. The average total assets of
commercial, investment, and Islamic banks are approximately 80 percent, 10 percent, and 10
percent respectively. Of these banks, commercial banks play the largest role in the economy
by virtue of their ability to finance various economic sectors, individual and corporate agents.
The operation of investment banks is, however, limited and tend to be more focused on
proprietary trading and brokerage services. The reasons for this can be explained by their
underdeveloped operations, and by the small daily trading volume of the Amman stock
market.
21inside 35 Islamic 2009 Local Jordan Dubai Islamic Bank
41 inside 57 Islamic 1997 Local Islamic International Arab Bank
13 inside 25 Commercial 2004 Foreign Banque Audi
14 inside 14 Commercial 2004 Foreign Blom Bank
2 inside 0 Commercial 1974 Foreign Citi Bank
10 inside 14 Commercial 1951 Foreign Egyptian Arab Land Bank
3 inside 4 Commercial 2009 Foreign National Bank of Abu Dhabi
3 inside 6 Commercial 2004 Foreign National Bank of Kuwait
2 inside 0 Commercial 1957 Foreign Rafidain Bank
6 inside 8 Commercial 2002 Foreign Standard Chartered
6 inside 36 Islamic 2011 Foreign Al Rajhi Bank

65
With regard to bank ownership, domestic banks are owned by Jordanians and foreign
resident’s while foreign banks are fully owned by foreign residents. Article 4 of the 2000
Banking Law states that “no person shall engage in banking activities without first obtaining
a final license from the Central Bank, in accordance with the provisions of this law’’. The
minimum capital required by a foreign bank to operate in Jordan is 50 million JD. Before
1997, foreign ownership of domestic banks had a ceiling of 49 percent, but following the
removal of capital restrictions in 2006, the foreign ownership ceiling was raised to 55 percent
of the total assets of Jordanian banks. At the end of 2014, the total foreign ownership ratio,
Arab and foreign, in Jordanian licensed banks’ capital was 47 percent.
3.2.2 Restructuring the Jordanian banking sector: banking crisis and financial
liberalization.
Prior to the 1980s, the banking sector in Jordan was heavily regulated to protect the domestic
banking market from foreign competition. This suggests that Jordanian commercial banks
operated in an oligopolistic environment whereby the interest rates on both credits and
deposits were determined in a monopolistic manner. Over the period 1988–1991, following
the devaluation of the JD, interest rates were raised to encourage savings. But as a result of
the collapse of Petra Bank and six other financial institutions linked to it, the banking system
suffered a crisis which ultimately dented the confidence of savers in August 1989. The main
reasons for the crisis and the lack of savers confidence were due to inadequate banking
regulations, which fostered widespread fraud (since the monitoring authority were
preoccupied with ensuring that Jordanian banks comply with operating ratios, while at the
same time imposing credit limits in order to force banks to do proper risk credit analysis of
their loan portfolios), the high level of non-performing loans resulting from the overexposure
of banks to the real estate market, and the speculative activities of banks in the foreign
exchange market which resulted in excessive exposure and losses.
In 1989, the Jordanian government, with the assistance of the International Monetary
Fund (IMF) and the World Bank (WB), launched a reform program aimed at restructuring
the banking sector. These reforms gave new powers to the CBJ, including responsibility for
monetary policy and stability, determining the size, cost, and direction of credit facilities and
the restructuring of banks financial portfolios. In parallel with these reforms, in 1993, the
Jordanian government began the process of liberalising the banking system by removing
restrictions on the entry of foreign banks (thereby increasing competition), reducing

66
government direct lending, expanding product deregulation, reducing restrictions on foreign
exchange transactions and the de-regulation and liberalization of financial markets. In line
with the wholesale reforms, all licensed banks and financial companies were instructed by
the CBJ to deposit 35 percent of their total deposits as a required reserve ratio in order to
enhance soundness and confidence in the banking industry. 1992, the CBJ instructed all
commercial banks to restrict the maximum credit in local currency to 5 percent of their total
credit facilities, and in 1997 the CBJ increased the minimum paid-up capital for all domestic
banks to JD 20 million, and foreign banks to JD 10 million. This was later increased to JD 40
million.
In 1995, the CBJ allowed Jordanian banks to grant loans exceeding 100,000 JD and
in 1996 granted banks managers to use 20 percent of their reserve requirements in the inter-
bank market and to invest this sum in loans and other investment in order to enhance bank
revenues. At the same time, the CBJ reduced the mandatory reserve requirements on foreign
currency deposits from 35 percent to 14 percent which gave banks more room to invest this
sum. In the year 1997, the CBJ removed all restrictions on foreign exchange systems and also
allowed foreign investors to invest over 50 percent of their capital in Jordanian banks. In
2000, a new banking law was introduced by the CBJ to improve the global outreach and scope
of local banking services. This law also helped the banking system by protecting deposits, for
example, through the creation of the Deposit Insurance Company, and by regulating the
practice of e-banking. Continuing with the deregulation of the financial system, in 2000 the
CBJ allowed banks to own insurance companies, as well as to decide on the price of
commission and other banking fees, and also allowed banks, in 2005, to control the level of
credit concentrations and foreign currency activity.
Following the Basel II accord, the CBJ implemented measures designed to equip
banks to manage risk based on the best global practices, including also international best
practices in corporate governance practices, as advised by the Organization Economic
Cooperation and Development (OECD), to strengthen corporate governance in Jordanian
banks. As a result, the board of directors of banks were required to adopt clear policy and
procedures regarding the treatment of bank customers covering a wide range of bank business
including clients’ portfolios in foreign currencies. The CBJ also issued a number of
instructions related to corporate governance and audit committee that it required the branches
of foreign banks operating in Jordan to implement.
In 2007 the CBJ amended the method of calculating bank liquidity to ensure that

67
commercial banks were equipped to meet all its obligations at maturity. The CBJ followed
this action in 2008 with instructions regarding the liquidity of Islamic banks to ensure the
safety of their financial position. As a result, Islamic banks were required to maintain cash
balances and semi sufficient cash to cover accrued liability, and were prevented from using
subsidiaries assets to cover local obligations.
3.2.3 CBJ Regulation and the Implementation of Basel II and III in Jordan
The regulatory powers of the CBJ have evolved over the last 15 years and closely follows the
Basel guidelines. The focus of CBJ regulation is on improving the efficiency of the banking
system in order to ensure its stability. Regulation is also aimed at providing sound supervision
of banking activities, bank reporting and data warehousing through the by adoption of
International Accounting Standards (IAS). From the standpoint of capital regulation, the
Basel Committee defines the value of equity ratio to be 8 percent of the risk-weighted assets
which has become an international standard for banks around the globe. As a result of reforms
to the Basel I accord, in 2004 Basel II focused on three risk measures: minimum capital
requirements, banks’ supervision assessment and market discipline of banks. These measures
were designed to create uniform conditions for better risk measurement and the regulation of
international competition on the financial markets. As a result, the CBJ has ensured that all
banks apply Basel II capital adequacy requirements to hedge against different types of risk,
while also instructing banks to steer their capital adequacy ratios according to Basel II
guidelines. To ensure compliance, the CBJ conduct regular field visits to all banks. In 2010
the managers of the central banks and supervisory authorities of selected developed countries
established a set of protective new regulations to mitigate the adverse effects of the 2008
financial crises and to prevent further bank bailouts of too big to fail institutions. Under the
new Basel III framework, banks are required to increase core capital ratio from 4 to 6 percent
to ensure not only the efficiency and stability of the overall financial system but also the risk
of banks default. Following a study on the impact of Basel III on Jordanian banks, in 2011
the CBJ required all banks to increase the proportion of liquidity coverage. Banks were also
required to assess their capabilities with respect to: (a) determining the amount of capital
required to meet the physical risks they might experience, (b) forecasting the capital needed
to face crises, (c) harmonizing between current reserves and reserves required under the Basel
III initiative, and (d) updating the corporate governance.
To strengthen the resilience of the Jordanian banking sector against regional shocks
such as the Arab spring and the war in Yemen. New regulatory and structural reforms were

68
implemented. These include regular stress tests to ensure that banks are adequately
capitalized to withstand regional and global shocks and to be able to hedge against various
types of risks. Based on these tests, banks have also become more capable of being able to
determine their own level of capital and liquidity to protect banking operation
Since 2013, the CBJ has developed and implemented a systematic template of stress
test of potential stressful situations based on the IMF methodology known as Next Generation
Balance Sheet Stress Testing. This method uses Top-down Macro Stress Testing /Satellite
model methodology which considers the impact of macro-economic indicators on non-
performing debt ratio and its proportion of solvency (capital adequacy ratio). This new
generation of balance sheet frameworks is easy to use, since it is Excel-based, and is also
quite flexible as it can incorporate hundreds of banks over a duration of five years and aims
to enrich balance sheet tests with portfolio elements in accordance with Basel II and III. This
approach integrates assumptions about potential shocks to allow the stress testers to simulate
different scenarios, and also translates the simulated response of selected key risk indicators
into an economic assessment of solvency (Schmieder et al., 2011).
3.3 Financial soundness indicators of the Jordanian banking sector
3.3.1 Assets, Deposits and Loans Structure
This section provides an overview of the structure of Jordanian banks' assets and liabilities
between 1993 and 2015. Total bank Assets in Jordanian banks rose from 5979 JD million in
1993 to 47133.2 million JD in 2015. A series of events triggered substantial changes in the
assets/liabilities structure of the Jordanian banking system over the last twenty years
including political incidences associated with the Iraq invasion of Kuwait in 1990, the first
Gulf War in 1990, and the United Nations (UN) sanctions on Iraq. Major sectors such as
transportation, agriculture, and industry were severely affected by the economic sanctions
imposed on Iraq, given the close trading ties between Iraq and Jordan which lead to the halt
in export and import.
Since 1999, several local financial turmoils’ have affected negatively the Jordanian
banking sector, including the bankruptcy of the Philadelphia bank in 2002 and some asset
quality-related problems at Jordan National Bank, Jordan Gulf Bank, Jordan Investment
Bank, and Export Bank in 2001 and 2002 due to provision of loans amounted to 300 million
JD to falsified company (Standard and Poor’s, 2007). The global financial crises of 2007-
2009 also had a serious effect on the operation of the Jordanian banking sector. Before the

69
crisis, Jordanian banks benefited substantially from the rapid rise in the demand for credit,
which was fueled by the economic boom, especially in the real estate sector. But following
the 2008 crisis, the CBJ decided to reduce interest rates to boost economic activity· As a
result of the low rates on deposits at banks, depositors withdrew their money, which led to a
decline in the number of deposits in foreign currency from 5370.1 million JD in 2007 to
4754.1 million JD in 2008. The confidence of Jordanian bank customer only returned when
the government declared that it would fully guarantee all bank deposits. At the same time,
the CBJ imposed the requirement on Jordanian banks that they should increase their capital
(both JD and foreign currency) to cover potential liquidity shortages.
(Alzoubi, 2013) notes that post the global financial crisis, external financing in Jordan
became more difficult and expensive, causing shareholders to value cash at a premium since
the crisis. In the short-term, the profitability of the banking sector was also adversely affected
following the crises (Zeitun and Benjelloun, 2013). With respect to the impact of the financial
crisis, (Ahid and Augustine, 2012) note that the impact of the financial crisis on Jordan can
be separated into two periods. From April 2008 to December 2008, and from 2008 – 2011.
They also noted that during the first period, the impacts of crises were mainly driven by the
downturn in the values of grants from developed and international donors who were
themselves adversely affected by the crises. And although the CBJ applied some policy
measures to protect the banking sector, it had also imposed a much stricter loan classification
designed to reduce unnecessary exposure while also setting interest rate at 10.5 percent for
housing loans (European economy, 2009). During the second period, all sectors in Jordan had
been affected by the crisis, except the banking sector due to the imposed CBJ regulations.
Figure 3.1 shows that just before the onset of the global financial crisis – 2006-2007 –
that total assets were 24237.6 and 26815.6 million JD respectively, compared to the period
following the financial crisis, 2009 and 2010, 31956.9 - 34973.1 million JD respectively. In
2008, total assets were 29796.6 million JD, a change that was due to the increase in bank
capital, deposit growth, the growth of credit facilities to the private sector and the
government.

70
Figure 3.1 Total assets in foreign and local currency (2003-2015).
It is clear from Table 3.2 that the growth of assets, deposits and loans was a direct
outcome of the removal of restrictions on investment activities by the CBJ during the period
of 1993-2015. Over the same period, Jordanian banks' assets increased significantly, rising
from 15701.5 million JDs in 2003 to 47133.2 million JDs at the end of 2015. Bank deposits
are generally considered a good indicator of the strength and effectiveness of the banking
system.
Table 3.2 Assets, loans, and deposits structure for Jordanian Banks 2003-2015.
Year Total Assets (in foreign and
local currency) (MJD)1
Total Deposits (in foreign and
local currency) (MJD)1
Total Loans (in foreign and local
currency) (MJD)1
2003 15701.5 9969.4 5,262.4
2004 17821.1 11564.1 6,189.2
2005 21086.5 13119.3 7,744.3
2006 24237.6 14591.9 9,761.9
2007 26815.6 15988.1 11,295.6
2008 29796.6 18102.6 13,044.3
2009 31956.9 20298.4 13,317.2
2010 34973.1 22504.8 14451.4
2011 37686.4 24377.9 15851.2
2012 39275.4 24969.7 17829.8
2013 42802.8 27593.2 18939.7
2014 44868.1 30261 19274.5
2015 47133.2 32598.5 21103.5
MJD refers to millions of JDs and the JD equals 1.41US Dollars. Values in nominal terms. Source: CBJ Database 1993-2015

71
Figure 3.2 shows total deposits in foreign and domestic currency. Over the period
2003-2015 the general trend of the volume of deposits rose and continued its increasing trend
from 9969.4 million in 2003 to 32598.5 million in 2015, but these rates slowed as a result of
the repercussions of the global financial crisis, as reflected in the decline in interest rate on
bank deposits which declined from 5.2 percent at the end of 2001 to 3.46 percent at the end
of 2012. The nature of bank deposits suggests that the ratio of the total savings deposits to
total deposits is greater than the percentage of total demand deposits to total deposits.
Figure 3.2 Total deposits in foreign and domestic currency (2003-2015).
Another important indicator that reflects the level of financial leverage that the
banking sector provides for the whole economy is the domestic credit (loans) index. Credit
facilities are also the biggest source of revenue for banks. Figure 3.3 shows the trend of the
domestic credit structure granted by Jordanian banks during the period 1993-2015.
Figure 3.3 Total loans in foreign and domestic currency (2003-2015).

72
The figure shows that total domestic credit increased from 5262.4 million JD in 2003
to 21103.5 million JD at the end of 2015. A fall in credit is observed in 2009 due to the global
financial crises. This fall in credit was due to the conservative lending practices of banks and
bank lending criteria, as well as the decline in the demand for loans, especially mortgage
loans. During 2010-2015 the ratio of credit facility began to grow as a result of the imposition
of tighter monetary policy to curb inflationary pressures.
3.3.2 Sources and uses of funds of Jordanian banks
The banking sector in Jordan plays an important role in mobilizing domestic savings and
channeling them in the form of loans to different economic sectors. To accomplish this task,
funds are divided into external (short or medium termed deposits from inter-bank loans,
customers, and loans from the CBJ) and internal (long term subordinated debt by shareholders
and banks’ capital and reserves) sources. Bank funds are mainly channeled in the form of
granted loans for both private and public sectors, purchase of firms’, governments' stocks and
bonds, to create deposits in local and foreign banks, and the purchase of CBJ ' CD’s.
3.3.3 Financial strength indicators for the Jordanian banking sector
The financial strength indicators assess the resilience of the banking sector to internal and
external shocks and risk. Table 3.3 presents the most important strength indicators during the
period 2003– 2015. These indicators can be classified into three main groups. “Asset quality
indicators”, which include the proportion of non-performing debt to total debt and the
coverage ratio. Second, “capital adequacy indicators”, which include capital adequacy ratio
and financial leverage and the last one is “profitability and efficiency” indicators, which
include interest margin to gross income, the rate of ROE, return on assets, and the liquidity
ratio.

73
Figure 3.4 Non-performing loans to total loans (2003-2015).
A significant improvement in Jordanian bank assets quality occurred during the period
2003-2015, Figure 3.4 shows there was an intense decline in the debt ratio of non-performing
loans/total debt from 15.50 percent at the end of 2003 to 4.2 percent at the end of 2008, with
the ratio climbing to an increasing trend in 2011, reaching 8.5 percent. As a result of the
outcome from the financial crisis and the political problems in the region – the Arab Spring
– bank customer struggled to repay bank loans. However, the ratio began a declining trend
from 2012 until 2015 reaching 4.9 percent. This decline in NPLs is attributed to the decision
of banks to write off part of their NPLs in exchange for provisions allocated to them. With
regard to the coverage ratio which measures a bank’s ability to meet non-performing debt.
Figure 3.5 shows the increase in the coverage ratio for the period 2003-2015.
Figure 3. 5 Coverage ratio (2003-2015).

74
The coverage ratio reached its highest level of 80 percent in 2006 before declining in
2009 to 52.0 percent due to the global financial crises, before rising to 79.7 percent in 2014.
The ratio rose significantly in 2015 reaching 74.7 percent as a result of the increase in credit
facilities. The figure suggests that Jordanian banks were able to maintain adequate provisions
to cover more than 60 percent of their debt with the coverage ratio for NPL continuing the
upward trend that started in 2011, reaching 74.7 percent at the end of 2015, which is an
indication of the continuous improvement in Jordanian bank asset quality.
Figure 3. 6 Capital adequacy ratio (2003-2015).
The capital adequacy ratio measures the required minimum capital buffer at banks
and thus their ability to function when faced with potential risks. Banks operating in Jordan
have been able to cope with a high capital adequacy ratio which amount to more than 7
percent for the period 2003-2015. It is worth noting further that Jordanian banks have always
been able to cope with a high mandated capital adequacy ratio that exceeds the minimum
required rate imposed by the CBJ (12 percent) and the minimum required rate suggested by
the Basel Committee (8 percent) as Figure 3.6 shows. The ratio reached to15.9 percent in
2003 and its highest level of 21.4 percent in 2006. As a result, the economic boom just before
the crises that increased banks’ capital size and profits. In fact, the ratio began to increase in
2009 reaching 20.3 percent in 2010, despite the fallout from the global financial crisis which
resulted a decline in the ratio to 18.4 percent in 2013. This decline was due to the continuous
improvement in the credit levels granted by banks to the private sector which usually carries
with it relatively high-risk weights. In 2015 the ratio reached to 19.10 percent, which was
much higher than the limit set by the CBJ (12 percent) and the limit specified by Basel
Committee- Basel III (10.5 percent).

75
Figure 3.7 shows the leverage ratio for Jordanian banks for the period 2003-2015. The
leverage ratio measures how efficient a bank is in financing assets from liabilities and is
calculated by dividing shareholders' rights on total assets. As Figure 3.7 shows that
percentage grew significantly during the period between 2003-2015, reaching 7.5 percent at
the end of 2003 before continuing an upward trend to 13.2 percent in 2007.
Figure 3. 7 Leverage ratio (2003-2015).
As with the other indicators previously discussed, the repercussions of the global
financial crises of 2007-2009 are reflected in the decreasing trend of the leverage ratio from
the period 2008-2013. In 2014, the ratio decreased to 12.5 percent as a result of the credit
facilities expansion before increasing to 12.7 percent in 2015. The high point of the leverage
ratio reflects the productivity and profitability of Jordanian banks as many banks were able
to maintain a high leverage ratio by accumulating profits over time. Figure 3.8, shows the
changes in interest margin to gross income during the period from 2003 to 2015. The interest
margin to gross income ratio measures the contribution to net profit from interest in the bank's
total income and reflects the contribution of the primary banks' functions in banks’ profit.

76
Figure 3. 8 Interest margin to gross income (2003-2015).
Despite the volatile nature of the ratio during the period 2003-2015, it was remained
between 63.7 percent and 77.4 percent, which means that more than two-thirds of income
generated by Jordanian banks come from interest bearing assets. Notice from Figure 3.8 how
the ratio began a sharp decline in 2004 and 2005 before reaching the high point of 58.30
percent. This was as a result to the political problems in the region, referred to at the time as
the Arab Spring, which caused bank customers to walk away without servicing their loans
and interest, thereby forcing banks to focus more on the non-interest sources of income such
as off-balance sheet activities. In 2011, the ratio declined to 70.10 percent as a result of the
CBJ decision to reduce the interest rate and so commenced an upward trend in 2012, reaching
77.40 percent in 2015.
Figure 3.9 shows the return on equity (ROE) which was increased significantly from
9.9 percent in 2003 to 20.9 percent in 2005 due to improvements in bank profitability. But
gradually declined to 8.3 percent in 2011 then start increasing onwards as a result of favorable
economic conditions which helped to enhance the profitability of the banking sector, but then
it declined in 2015 due to unfavorable banking situations.

77
Figure 3. 9 Rate of Return on Equity (2003-2015).
Regarding the return on assets (ROA), Figure 3.10 shows that the ratio has been a
little unstable, reaching 2 percent in 2005 before commencing a steady decline through to
(1.10%) in 2009 as a result of the impact of the global financial crisis. This decline may be
attributed not only to the increase of income tax rate on banks but also to the conservative
approach to bank lending followed by the banking sector.
Figure 3. 10 Rate of return on assets (2003-2015).
Figure 3.11 shows the liquidity ratio which measures a banks liquid assets’ available
to cover its obligations for the banking sector for the period 2003-2015. According to the
bank finance literature, a high level of liquidity is an indication of the degree of soundness of
the banking sector and its ability to fulfill its obligations. A sustained significant decline in
the level of liquidity implies that a bank is faced with liquidity risk. For the period evidence
by the data, Figure 3.11 shows that there was a significant change in the liquidity ratio. For
example, in 2003 the ratio was 179.6 percent, but began to gradually decline as a result of the

78
impact of the global financial crises before increasing in the mid-2008-2009 as a result of
measures adopted by the banks to redirect their investments towards liquid assets at the
expense of credit facilities.
Figure 3. 11 Liquidity ratio (2003-2015).
Table 3 3 Financial soundness indicators for the Jordanian banking sector 2003-2015.
Year
Capital
Adequacy
Ratio
Leverage
Ratio
Return
on
Equity
Return
on Assets
Interest
Margin to
Gross
Income
Coverage
Ratio
Debt ratio of
(non-
performing)
Liquidity
Growth Rate
of Customer
Deposits
Growth
Rate of
Credit
Facilities
2003 15.9% 7.5% 9.9% .7%0 63.7% 51.9% 15.5% 179.6% 6.4% 2.7%
2004 17.8% 8.9% 13.1% 1.1% 58.3% 63.8% 10.5% 173.0% 15.9% 19.3%
2005 17.6% 10.5% 20.9% 2.0% 56.4% 78.4% 6.6% 168.0% 13.4% 25.9%
2006 21.4% 13.2% 15.0% 1.7% 70.2% 80.0% 4.3% 161.4% 11.4% 27.2%
2007 20.8% 13.3% 12.6% 1.6% 66.7% 67.8% 4.1% 157.7% 9.6% 16.1%
2008 18.4% 12.9% 11.5% 1.4% 71.3% 63.4% 4.2% 141.2% 13.2% 17.2%
2009 19.6% 13.0% 8.8% 1.1% 71.6% 52.0% 6.7% 159.1% 12.1% 2.1%
2010 20.3% 13.1% 8.8% 1.1% 74.3% 52.4% 8.2% 161.4% 10.9% 8.6%
2011 19.3% 13.1% 8.3% 1.1% 70.1% 52.3% 8.5% 152.9% 8.3% 9.8%
2012 19.0% 13.3% 8.6% 1.1% 76.6% 69.4% 7.7% 143.5% 2.4% 12.5%
2013 18.4% 12.9% 9.9% 1.2% 77.6% 77.0% 6.8% 149.1% 10.5% 6.3%
2014 18.4% 12.5% 11.1% 1.4% 77.9% 79.7% 5.6% 152.2% 9.3% 5.2%
2015 19.1% 12.7% 10.3 1.3% 77.4% 74.7% 4.9% 149% 7.7% 9.6%
Source: CBJ Database (2003-2015).

79
3.4 Summary and Conclusion
This chapter discussed developments in the Jordanian banking since the 1990s including the
CBJ regulations and its response to the various Basel accords and also provided an overview
of measures of bank profitability and indicators of soundness for the banking sector. Analysis
of the ratios suggests that the performance of the banking sector was affected by the impact of
the global financial crisis and that the recovery of the sector was due to the policy measures
adopted by the CBJ to help mitigate the financial distress experienced by banks which restored
confidence in the banking system.
The following chapters presents an empirical analysis that includes some of the
previously discussed financial indicators using a sample of 13 Jordanian banks for the period
2003-2015 in the light of the CBJ program of reform. To commence, I first investigate the
impact of bank-specific, market structure, and macroeconomic variables on different
profitability measures. Second, I then investigate empirically the impact of competition, risk
and the interest rate environment on the profitability and risk-taking behavior of Jordanian
commercial banks. Third, I examine the relationship between bank efficiency, capital, and risk
of Jordanian commercial banks, and fourth I conclude the investigation by investigating how
competition and efficiency of the banking sector influence the cost of credit for borrowing
firms using data from 118 firms in addition to liquidity funding and Jordanian bank risk-taking
behavior. Fifth, I examine the relationship between liquidity funding and risk-taking behavior
of Jordanian Commercial Banks in addition to the impact of the implementation of the deposit
insurance scheme from 2000 on Jordanian bank capital and liquidity creation.

80
CHAPTER 4
Assessing the Effects of Competition, Risk, and Market
Interest Rate on Bank Profitability: An Empirical Analysis
of the Jordanian Banking Sector
4.1 Introduction
In any economy, the banks’ intermediation role is to channel funds from surplus units to deficit
units to enable growth and development. In this respect, several studies, such as (Asli
Demirguc-Kunt, Laeven and Levine, 2005) and (Gromb and Vayanos, 2010) report evidence
which supports a positive relationship between the level of financial development and
economic growth. In addition, globalization and liberalization of financial services is also
considered to play a significant role to improving the banking industry and can take several
forms – one of which is creating a competitive market via increasing the number of banking
and non-banking financial institutions. Competition in the banking sector levies serious effects
on bank performance indicators such as risk and profitability. Some researchers believe that
increases in competition and financial innovation contribute generally to financial disruptions,
while others such as (Anginer et al., 2012) link financial crises to highly concentrated markets
and government support of the largest banks which mitigate access to finance by medium and
small-sized banks. Therefore, analysing how competition might have shaped the performance
and risk indicators of the Jordanian banking sector will be of interest to bank managers and
policy makers, especially since there is shortage of published empirical research that has
examined the competitiveness of the Jordanian banking sector and, more specifically, the
evolution of competition over the reform periods since 1990.
Studies on bank profitability and its relationship with the business cycle received
renewed attention following the period of recession that followed the recent global financial
crisis. Bank profitability is a predominant indicator of a sound and stable banking sector, but
studies investigating the effect of operating in a low-interest-rate environment on profitability
indicators are rare, especially in developing countries. In regard to this, the purpose of this
chapter is to fill the gap in the literature by firstly, assessing the degree of competition in the
Jordanian banking sector and the extent to which market competitiveness has changed
following the entry of six new banks in the market or not using the non-structural approach of

81
the Panzar-Rosse model for the period 2003-2017 and, secondly, to empirically assess the
impact of competition, interest rate and liquidity risk on bank profitability and risk-taking
behavior for a sample of 13 commercial Jordanian banks for the period 2003-2015 using the
Fixed Effects (FE), Random Effects (RE), Generalized Least Square (GLS), and Generalized
Method of Moments (GMM) methods. According to (Bikker and Haff, 2002), banking markets
can, in general, operate under conditions of either perfectly competitive, monopolistic, or
monopolistic competitive behavior. In the Jordanian context, the banking sector may be
considered highly concentrated and operates under the condition of monopolistic competition
(Hamiltona et al., 2010; Al-jarrah, 2010). Therefore, understanding the market condition under
which Jordanian banks compete is crucial if bank managers, policy makers, and investors, are
to have a clear understanding of how competition, risk, the level of interest rate, and bank
profitability interact together. Interest on loans is the main source of income for Jordanian
banks amounting to 77.4 percent of total income in 2015 and thus it is of interest to know how
changes in interest rate affect bank profitability. Several internal and external factors have also
influenced the banking system's profitability and performance such as individual bank
characteristics, market factors, and macroeconomic indicators. The study examined the local
commercial banks as it covers around 90% of the Jordanian banking system. We excluded the
foreign bank as they are not listed in the Amman Stock Exchange and for the difficulties to
gather the needed data. This chapter is divided into six sections: Section 4.2 presents an
overview of the literature. Section 4.3 presents the data and methodology. Section 4.4 presents
empirical results, and finally, section 4.5 outlines the summary and conclusion.
4.2 Literature review
This section is divided into three parts covering literature on the profitability-investigated
indicators, competitiveness, risk, and interest rate. Most of the related literature apply data
from developed countries while empirical evidence from the Middle East region especially
Jordan is rare.
4.2.1 Literature review on bank competitive conditions
The literature on bank competitiveness generally applies the Panzar-Rosse H statistic (Rosse
and Panzar, 1977; Panzar and Rosse, 1982 and 1987) to investigate the level of bank

82
competition. This approach has been used by scholars such as (Shaffer, 1983), (Nathan and
Neave, 1989), (Molyneux et al., 1996), (De Bandt, 2000), (Hempell, 2005), (Coccorese,
2004), and (Casu and Girardone, 2009). (Shaffer, 1983), for example, examined the
competitive position of banks in New York by applying the Panzar-Rosse method and report
that banks behaved neither as monopolists nor as perfectly competitive entities in long-run
equilibrium. (Nathan and Neave, 1989) using Canadian data assessed the state of competition
using cross-sectional data covering 1982, 1983 and 1984 and report that banking revenues
behave as if earned under monopolistic competition. Banking systems in regions such as U.S.,
Canada, the European Union (EU), India, China, Latin American and Japan, are found by
(Yuan, 2006), (Matthews et al., 2007), (Prasad and Ghosh, 2007), to operate under
monopolistic competition conditions. Semih (Yildirim and Philippatos, 2007) using firm
level data for a sample of 14 Central and Eastern European (CEE) transition economies
analyzed the evolution of competitive conditions in the banking industries for the period
1993-2000 and report findings which suggested that banking markets cannot be characterized
as either perfect competition or monopoly, except for the banking sectors of Macedonia and
Slovakia. Other studies such as (Duncan and Langrin, 2002), (Duncan and Langrin, 2004),
(Mlambo and Ncube, 2011), (Anzoategui et al., 2012), (Simpasa, 2013) and (Ye, 2013),
examine the evolution of competition in developing regions such as South Africa, Jamaica,
Zimbabwe, China, the Middle East, and Turkey. For example, (Anzoategui et al., 2012) using
the (Panzar and Rosse, 1987) approach studied the Tunisian banking sector and report that
banks in Tunisia earned their revenue in a monopolistic competitive environment. Le (2014)
using an unbalanced panel data of 33 commercial banks also applied the Panzar–Rosse
approach and found that Vietnamese commercial banks operate under monopolistic market
conditions. Similarly (Simatele, 2015) using South African data and the Panzar-Rosse
approach examine the relationship between bank structure, performance and competition. He
estimated a revenue equation to obtain the H statistic and found that competition increased
over time and that South African banks operate in a monopolistic competitive market
structure. On the other hand, (Suzuki, 2015) used different concentration ratios and the
Panzar-Rosse method for measuring competition to assess the market structure of the banking
sector of Bangladesh and report a reduction in concentration and an increase in competition
in the banking sector. The results show that the level of competition was higher in the interest-
based regular banking market than in the fee-based non-banking market and that banks in
general faced more competition in the credit market than they did in the deposit market.

83
(Zarein et al., 2015) applied data for the Iranian banking sector and applied the H-
statistic to investigate the competitive condition for the period 2005-2010. To calculate H
statistics, a reduced form of revenue equation was estimated. The results indicate that the
Iranian banking sector operate under conditions of monopolistic competition. (Vardar, 2015),
using Turkish bank data for the period 2002-2012 looked at the impact of bank competition
on the risk-taking behavior of Turkish banks. And after estimating the H-statistic as a measure
of competition, report that competition in Turkey has a negative impact on the financial
fragility of Turkish banks, indicating that banks in a more competitive market tend to take
lower levels of risk. (Al-Muharrami et al., 2006) using the Panzar-Rosse ‘H-statistic’ for the
period covering 1993-2002 examine the monopolistic power of banks of Gulf Cooperation
Council (GCC) countries and report that while Kuwait, Saudi Arabia, and UAE banks have
moderately concentrated markets, they are moving to less concentrated positions, even
though they operate under conditions of monopolistic competition. They also report that
Qatar, Bahrain, and Oman are highly concentrated banking markets, while Omani banks
operate under monopolistic competition.
4.2.2 Literature review of the impact of risk on bank profitability
Liquidity risk adversely affects overall bank earnings/profit and capital/reserve. A liquidity
trap can occur anytime savers begin to withdraw their deposits, during such times banks are
left with two options either to borrow money from the central bank or engage in inter-bank
transactions at high prices. Those banks that maintain sufficient deposits in their account
balances can mitigate the incurred potential losses during these times. The negative side of
liquidity risk is that it can be high enough so as to cause a bank run (Kashyap et al., 2002).
In regard to this, (Shen et al. 2009) used a unbalanced panel dataset of commercial banks in
12 advanced economies (Canada, Australia, Germany, France, Taiwan, Italy, Luxembourg,
Netherlands, Japan, Switzerland, U.K, and the U.S.A) for the period 1994-2006 by employing
alternative liquidity risk measures, besides liquidity ratio and looked at the causes of liquidity
risk. They found that liquidity risk may lower bank profitability (return on average assets and
return on average equities) due to the higher cost of funds, while also increasing banks’ net
interest margins. Furthermore, they classified countries as either bank-based or market-based
financial systems and revealed that liquidity risk is negatively related to bank performance
especially in the market-based financial systems. (Akhtar et al., 2011) using the FE method
84
investigated the significance of variables with liquidity risk management for both
conventional and Islamic banks operating in Pakistan and studied the impact of capital
adequacy, size, networking capital, ROA and ROE, on the liquidity risk management for the
period 2006-2009. They found no significant evidence of a relationship between size and
networking capital to net assets with liquidity risks and that the capital adequacy ratio in
conventional banks and return on assets in Islamic banks significantly influenced liquidity
risk. (Arif and Nauman Anees, 2012) also examined the effect of liquidity risk on banks’
profitability in Pakistan covering the period 2004-2009 by applying multiple regression to
assess the impact of liquidity risk on banks’ profitability and report a significant positive
effect of liquidity risk on bank profitability and some evidence of a negative relationships
between liquidity gap and non-performing loans on profitability.
4.2.3 Literature review on the impact of market interest rate on bank
profitability
There is a growing literature on the impact of market interest rate on bank profitability. In the
province of this literature, (Bourke, 1989) explored profitability determinants based on the
financial statements of 90 banks for 12 developed countries or states using annual data for the
period 1972-1982. Using a set of control variables (capital ratio, liquidity, staff expenses,
concentration, government ownership, interest rate, market growth and inflation) in addition to
return on capital, return on assets, and value-added as dependent variables, the findings indicate
that capital ratios, liquidity ratios and interest rates were all positively correlated with
profitability while government ownership and staff expenses had an inverse relationship with
profitability. The author also reports the presence of weak correlation in the relationship
between pre-tax return on assets and profitability, while concentration is moderately and
positively correlated with pre-tax return on assets and negatively correlated with the value-
added. (Albertazzi and Gambacorta, 2009) using the GMM estimator suggested by (Arellano
and Bond, 1991) combined with data for 10 industrialized countries covering 1981-2003
looked at the effects of both macroeconomic and financial shocks on banking profitability by
studying the link between business cycle fluctuations and banking sector profitability and
report the dispersion of bank profitability among euro-area countries has declining dramatically
since the mid-1990s. It was found that GDP influences both net interest income and loan loss
provisions (via lending activity and credit portfolio quality respectively) and that the higher

85
level of bank profitability in the U.K and U.S.A were at least partly related to their more flexible
cost structure. The authors also note that pro-cyclicality was slightly greater in the U.K. and in
the U.S. and that the net interest income of banks was less affected by fluctuations in long-term
interest rate but more affected by money market interest rate in countries such as Italy, Spain,
and Portugal where banks have more short-term assets. It was found that net interest income
of German banks was not significantly affected by changes in interest rates and that net interest
income positively affected the profitability of banks conventional financial activities. While
the ratio of total loans to GDP was found to be positively correlated with net interest income
and further that stock market capitalization relative to GDP had a strong and significant effect
on net interest income.
(Dietrich and Wanzenried, 2011) analyzed the profitability of commercial banks in
Switzerland from 1999-2006 using data for 453 banks and found a positive relationship
between capitalization and bank loans with profitability, especially when bank’s loan volume
is growing at a much faster rate than the market, and that bank age had no impact on
profitability. On the question of bank ownership, they note that foreign banks were less
profitable than Swiss-owned banks while privately owned banks were found to be more
profitable than state-owned banks and that banks reliant on interest rate yield were likely to
be less profitable. In addition, the authors report that the variables total loan growth, funding
costs, operational efficiency, affect bank profitability positively and that the 2008 financial
crisis had a significant impact on the profitability and productivity of the Swiss banking
industry. On a similar issue, (Genay and Podjasek, 2014) found that the low-interest-rate
environment is associated with decreased profitability for banks, particularly for small
institutions in a sample of US banks from 2003-2013. Similar findings were postulated by
(Bikker and Vervliet, 2018) for all U.S. commercial and savings banks covering the period
2001-2015. Regarding the effects of the low-interest rate environment on bank risk-taking
behavior, the authors found no conclusive evidence to suggest that banks increase their risk
exposure to search for new income sources. However, it was found that banks operating in a
low-interest environment had significantly lowered their level of credit loss provision.
4.2.4 Literature review on bank profitability indicators
Much has been written on bank profitability indicators of which the work of (Molyneux and
Thornton, 1992) is an example. Using annual data for a sample of 18 European banks

86
covering the period 1986-1989, (Molyneux and Thornton, 1992) estimated a simple linear
equation (using government ownership, concentration, long-term bond rate, money supply,
capital and reserves, cash and bank deposits, consumer price index, and staff expenses as
independent variables and net profit after and before tax is used as dependent variables) and
report that staff expenses are positively correlated with ROA and that government ownership
and the level of interest rates had a significant positive association with ROE, which
contradicts the earlier findings of (Bourke, 1989). They also note that due to associated costs
with liquidity holdings, that liquidity had a weak inverse relationship with profitability and
that concentration had somewhat of a positive, statistically significant correlation with pre-
tax return on assets consistent with the findings of (Bourke, 1989). (Demirgüç-Kunt and
Huizinga, 1999) also examined the determinants of commercial bank profitability using data
for a sample of 80 banks drawn from developed and developing countries and found that
well-capitalized banks faced lower cost of funding due to the lower probability of bankruptcy
costs and the fact that these banks have much less need to borrow for assets acquisition. Their
results also confirm a positive association between capital ratio and profitability and that
loans to total assets have a negative influence on profitability, while short-term funding had
a negative and significant impact on profitability. The relationship between profitability and
non-interest earning assets was found to be negative as banks with high non-interest earning
assets were found to be less profitable. The authors further point out that banks that use
deposits as the main source of funding are less profitable because of the nature of deposits
which required high branching and other expenses and that in developing countries foreign
banks were more profitable than domestic banks.
(Graham, 2013), using data for a sample of 55 U.S. banks and 10 Canadian banks for
the period 1997-2009 to assess the impact of liquidity on bank profitability found that
profitability is improved for banks holding a higher proportion of liquid assets. The author
notes that these assets also added to reducing banks' liquidity risk and that the results show
that the relationship between liquid assets and profitability depend on the banks’ business
model. In addition, ((Staikouras and Wood, 2011) using the method of OLS and fixed effect
models, examined both internal and external factors concerning the profitability of European
banking system's (covering domestic and foreign institutions: commercial banks, cooperative
banks, savings banks, and mortgage banks). The authors split their sample into two parts –
large and small banks – and report that European banks’ profitability is primarily influenced
by factors related to management decisions and to the changes in the external macroeconomic

87
environment. They also report that loans to assets ratio are inversely related to banks' return
on assets and the proportion of loan loss provisions to total loans and the variability of interest
rates and the growth of GDP are negatively related to banks’ return on assets.
With regard to the literature on developing and emerging banking markets, (Owusu-
Antwi et al. 2014) investigated the determinants of banks ‘profitability in Ghana using the
GMM method to evaluate the determinants of profitability and report that economic value
added is better than ROA as a measure of bank performance and that inflation does not affect
the performance of banks in Ghana. (Said, 2014) examined the profitability of Malaysian
banks’ profitability using random and fixed effects methods and found a positive relationship
between net stable funding ratio and banks performance indicators (ROE, ROA, and NIM).
The author also found a positive impact of equity and size on the banks profitability and a
negative relationship between cost to income ratio and bank profitability. (Fu et al., 2014)
investigated the influence of bank competition, concentration, regulation, and national
institutions on individual banks' fragility using GMM method and found that greater
concentration and stronger deposit insurance schemes foster financial fragility.
Considering reform measures implemented by the central bank of Jordan over recent
years, it is likely that competition within the banking sector of Jordan will have a positive
effect on bank performance indicators such as profitability. For as the literature suggest bank
profitability and its relationship with the business cycle have received considerable attention
following the global financial crisis and the economic recession that resulted. It is widely
acknowledged that bank profitability is a predominant indicator of a sound and stable banking
sector. However, assessing the competitiveness of the Jordanian banking sector by applying
Panzar-Rosse model is only one objective of this chapter. The second objective is to
empirically assess the impact of liquidity risk and other factors on the profitability of
Jordanian banks. While the third objective is to investigate the effect of operating in a low-
interest-rate environment, utilizing profitability indicators, on Jordanian bank performance
and in these respects the study makes a direct contribution to the existing literature.
4.2.5 Research Questions
In this chapter, I investigate whether or not the deregulation and liberalization program has
affected the performance of Jordan’s banking sector. Our expectation is that the new
regulations should enhance the profitability measures of Jordanian banks. And we empirically
88
investigate how competition, risk, and interest rates affect Jordanian banks’ profitability by
addressing the following questions:
1. Do competitive conditions affect the profitability of Jordanian banks?
2. Does liquidity risk affect the profitability of Jordanian banks?
3. Do interest rates affect the profitability of the Jordanian banks?
4. Which market type monopoly, monopolistic competition or perfect competition, best
represents the Jordanian banking sector?
4.3 Data and Methodology
4.3.1 Data
This section assesses the degree of competition in the Jordanian banking sector by examining
whether market competitiveness changed or not following the entry of six new banks in the
market using the non-structural approach of Panzar-Rosse for the period 2003-2017. I also
empirically assess the impact of competition, liquidity risk, interest rate on bank profitability
and risk-taking behavior using a sample of 13 commercial Jordanian banks for the period 2003-
2015. The study applies data from different sources: bank statements, the CBJ, the ABJ, annual
reports of the ASE, data stream, and Bloomberg. Variables definitions and notations appear in
Tables 4.1-4.3.
Table 4. 1Variables considered in assessing the impact of competition on the Jordanian banks'
profitability (2003-2015). Variable Notation Measurement Type Source
Dependent Variables
Revenue (CF) CF Banks revenues from commotion and fees. Bank-specific Annual Reports
Profitability ROA Net income/Total assets Bank-specific Annual Reports
Independent variables
Unit Price of Labor PL Ratio of personnel expenses to Total Assets. Bank-specific Annual Reports
Unit Price of Capital PK ratio of capital expenses to fixed assets Bank-specific Annual Reports
Unit Price of Funds PF ratio of annual interest expenses to total loanable funds Bank-specific Annual Reports
Number of Branch BR Ratio of number of branches of a bank to the total number of branches. Bank-specific Annual Reports
Bank size SIZE Natural logarithm of total assets Bank-specific Annual Reports

89
Risk RISKASS Ratio of provisions of loan loss to total assets. Bank-specific Annual Reports
Competition Lerner index the difference between price and marginal cost, divided by the price Market structure CBJ
Insurance Premium INStoGDP Insurance premium to GDP. Macro Annual Reports
Inflation rate INF Annual Inflation Rate Macro CBJ
Independent variables
Bank size SIZE Natural logarithm of total assets Bank-specific Annual Reports
Bank risk LLPTL Ratio of provisions of loan loss to total assets. Bank-specific Annual Reports
Liquidity LIQUIDITY Loans/assets Bank-specific Annual Reports
Capitalization CAP Total Shareholder’s equity/total assets Bank-specific Annual Reports
Diversification DIV Non-interest income/gross revenue Bank-specific Annual Reports
Labor productivity LP Gross revenue/total number of employees Bank-specific Annual Reports
Taxation TAXATION Tax/operating profit before tax Bank-specific Annual Reports
Competition Lerner Estimated from the cost function Bank-specific CBJ
Concentration C3 Total assets of largest three banks/total assets of the whole banking
industry
Bank-specific CBJ
Stock market
development
SMD Market capitalization of listed companies/GDP Industry CBJ
Inflation Rate INF Annual inflation rate Macro CBJ
GDP growth rate GDP Annual GDP growth rate Macro CBJ
Source: ASE, CBJ, ABJ
Table 4. 2Variables considered in assessing the impact of liquidity risk on Jordanian banks profitability
(2003-2015). Variable Notation Measurement Type Source
Dependent Variables
Profitability ROA Net income/Total assets Bank-specific Annual Reports
Profitability ROE Net Income/Shareholder's Equity Bank-specific Annual Reports
Tobin’s Q ratio Tobin Market value / Total Asset value Bank-specific Bloomberg
Economic Value Added EVA NOPAT − [WACC Capital Investment] Bank-specific Bloomberg
Independent variables
Bank size SIZE Natural logarithm of total assets Bank-specific Annual Reports
Capital Adequacy ratio-TIER 1 TIER1 TIER 1 Capital Ratio Bank-specific Data Stram
Liquidity Risk LTD Total Loans / Total Deposits Bank-specific Annual Reports
Capitalization ETA Total Equity /Total Assets Bank-specific Annual Reports

90
Net interest margin ratio NIM Net Interest Income/ Total Assets Bank-specific Annual Reports
Cost to income ratio CTI Total Expenses/ Total Income Bank-specific Annual Reports
Cost of fund ratio COF Total Interest Expenses/ Total Deposits Bank-specific Annual Reports
Concentration CO3 Total Assets of Largest 3 Commercial Banks/Total
Assets of the whole Commercial Banks Listed in ASE
Market Structure Annual Reports
GDP Growth rate GDP Annual GDP Growth Rate Macro CBJ
Inflation rate INF Annual Inflation Rate Macro CBJ
Source: ASE, CBJ, Data-Stream.
Table 4. 3Variables considered in assessing the impact of interest rate on Jordanian banks profitability
and risk taking (2003-2015). Variable Notation Measurement Type Source
Dependent Variables
Net Interest Margin NIM Difference between interest income and interest expense
divided by total assets Bank-specific Annual Reports
Profitability ROA Net income/Total assets Bank-specific Annual Reports
Profitability ROE Net Income/Shareholder's Equity Bank-specific Annual Reports
Total Profit Profit Undivided profits and capital reserves Bank-specific Annual Reports
Profit Margin PM Profit before tax/ Total Assets Bank-specific Annual Reports
Total Capital Ratio TCR Total Risk-based Capital to Risk-weighted Assets Bank-specific Annual Reports
Credit Risk PCL Provision for credit losses over total loans Bank-specific Annual Reports
Independent variables
Bank size SIZE Natural Logarithm of total assets Bank-specific Annual Reports
Capitalization CAP Total equity capital over total assets Bank-specific Annual Reports
Diversification DIV Total non-interest income divided by total income Bank-specific Annual Reports
Lending LEN Total loans over total assets Bank-specific Annual Reports
GDP Growth Rate GDP Annual GDP Growth Rate Macro CBJ
Inflation Rate INF Annual inflation Rate Macro CBJ
Short-term interest rate SHTI 6-month money market rate Macro CBJ
Source: ASE, CBJ, Data-Stream.
4.3.2 Competition model
The selection of the variables in the different analysis is motivated by a large number of studies
such as (Zarein et al., 2015), (Vardar, 2015), (Babic et al., 2015), (Matthews et al., 2007), (Casu
and Girardone, 2011), and (Al-Muharrami et al., 2006). I measure bank profitability (dependent

91
variable) in the competition models using four indicators: return on assets (ROA). Revenue
(CF) measures the revenues that come from the bank’s commotion and fees. ROA provides
information about the management's performance in using the banks’ assets to generate income
(Naceur, 2003). This ratio is broadly used to compare the financial performance of banks
because it shows profit per unit of bank assets and acts as a proxy of the overall profitability of
banking operations (Berger and Mester, 1997). Large ROA indicate high profitability.
The analysis undertaken accounts for bank-specific, industry-specific, and
macroeconomic indicators that could affect the profitability of Jordanian banks. For this
purpose, price of labor (ratio of personnel expenses to total assets) price of capital (ratio of
capital expenses to fixed assets) price of funds (ratio of annual interest expenses to total
loanable funds) branches (ratio of number of branches of a bank to the total number of
branches) risk (ratio of provisions of loan loss to total assets), size (bank total assets) and
insurance to GDP (insurance premium to GDP) are included in the model. The analysis is
extended to test the impact of some of the previously listed control variables on ROE and ROA
using the GMM method. These models incorporate other control variables such as liquidity
(ratio of total loans over total assets) that reflect the ability of Jordanian banks to compensate
for the decreases in banks’ liabilities or the increase in the assets’ side of the balance sheet
(Goddard et al., 2013). There is no conclusive evidence reported in the literature on the
profitability effect of liquidity, though (Molyneux and Thornton, 1992) have argued that high
liquidity levels have the effect of dampen profitability, while others such as (Bourke, 1989)
found that liquidity and profitability are positively correlated depending on the banks’ risk
management system.
In this study, the ratio of loan loss provision over total loans (LLPTL) is used to measure
the risk level. Several empirical studies, comprising (Miller and Noulas, 1997), indicate that an
increase in risk exposure decreases bank profitability. Capitalization (ratio of shareholders’
equity over total assets) is used as a proxy for the efficiency of the financial institution. A
positive impact of capitalization on bank profitability is expected for the following reasons.
First, funding costs are lower for well-capitalized banks due to Jordanian banks having a
relatively high level of creditworthiness. Second, well-capitalized Jordanian banks are more
likely to engage in prudent lending which is more likely than not to fosters profit figures. Third,
capital hedges potential losses of risky assets, and finally well-capitalized Jordanian banks are
considered to have lower costs since they borrow less. On this point, (Berger, 1995) has argued
that capitalization can have a negative impact on bank profitability because the higher the level

92
of capitalization that lower the relative risk position of the bank and according to the risk-return
trade-off, lower risks lead to lower returns. This argument is supported by (Modigliani and
Miller, 1963) and more recently by (Dietrich and Wanzenried, 2011). This variable enters the
GMM model as one of the endogenous variables because of the reverse causation effect, since
higher profits can translate into higher capital. Diversification (ratio of non-interest income
over gross revenue) measures the diversity of bank activities. In this regard, (Tan and Floros,
2012) note that banks that engage in different activities are better positioned to be able to raise
their profits and to reduce costs. A countercyclical effect can be observed between
diversification and bank profitability as there is strong competition around fee-income services
which contributes to reducing the individual banks’ profit shares. Labour productivity (ratio of
gross revenue over the total number of employees) acts as another proxy for banks’ efficiency.
I expect the labour productivity variable to have a positive impact on profitability. Taxation
(ratio of tax over operating profit before tax) is used to reflect costs. This variable is used by
(Tan and Floros, 2012) in their study of the Chinese banking industry. And they report a
significant and negative impact of taxation on the profitability of Chinese banks which, they
argued, can be explained by the fact that the high level of taxes increases costs and further leads
to a reduction in bank profitability.
Regarding industry-related indicators, competition is measured using the Lerner index.
Following (Tan, 2016), the structure–conduct–performance (SCP) hypothesis argues that less-
competitive firms in a financial system tend to have a high Lerner index that feeds into large
scales of operation and higher profits. However, the competition-efficiency hypothesis does
argue that in a highly competitive environment, bank managers have more incentive to improve
efficiency and reduce costs, thus enhancing profit shares. In this study, I also use of banking
sector development (ratio of banking sector assets over GDP). Our expectation is that a higher
developed banking sector is likely to foster the demand for banking services, which attracts
more potential competitors to enter the banking market. The subsequent reduction in supply of
banking services relative to the increased demand is expected to increase the prices of banking
services and to further increase bank profitability.
Stock market development is measured as the ratio of the market capitalization of listed
companies over GDP. Banks operating in countries with well-developed stock markets
normally have higher profitability shares than their counterparts for the following reasons.
Firstly, a highly developed stock market provides an alternative pool of funds for firms rather
than conventional bank loans. Which, in turn, reduces the risks of loan default and fosters

93
profitability figures of the banks. Secondly, a developed stock market system also provides
accurate information about listed firms and their investment portfolios which assists banks in
the effective evaluation of the associated investment risks (Tan and Floros, 2012a).
GDP growth rate is a measure of total economic activity within an economy. A high
economic growth encourages banks to lend more and permits them to charge higher margins.
Some previous studies, such as (Pasiouras and Kosmidou, 2007) and (Kosmidou and
Zopounidis, 2008) found a positive effect of economic growth on the profitability of banks
while other studies such as (Tan and Floros, 2012) suggests that high economic growth
improves the business environment and lowers bank entry barriers. The consequent increased
competition can also dampen bank’s profitability. Accordingly, we have no prior expectations
about the profitability impact of GDP growth on Jordanian bank profitability. Similar
ambiguity is also observed for the relationship between inflation and profitability, as it
depends on whether inflation expectations are fully anticipated or not. Generally, high
inflation rates are associated with high loan interest rates which lead to increased banks’ profit
as (Pasiouras and Kosmidou, 2007) notes. And as (Sami Ben Naceur and Omran, 2011)
report, there is a negative relationship between inflation and bank profitability due to banks
failing to fully anticipate inflation.
4.3.3 Liquidity risk model
We measure bank profitability in the liquidity risk models using four indicators – return on
assets (ROA), return on equity (ROE), Tobin Q ratio (TOBIN Q) and Economic Value Added
(EVA). Tobin’s Q ratio is used as a profitability indicator in several studies (Demsetz and
Lehn 1985, (Naushad and Malik, 2015) and (Morck et al., 1986). Tobin’s Q is a measure of
the organization's competence in the market (Morck et al., 1986). To represent the market
performance of a firm, Tobin’s Q is a standard measure of returns on investment as
established by (Bond et al., 2004). EVA is the fourth financial profitability measure used in
our analysis and reflects how much of the accounting profit is converted to economic profit.
A positive EVA reflects the ability of the bank to increase the shareholder's wealth.
Analysis of the study incorporates a large number of control variables. Size is
generally used to measure economies or diseconomies of scale in the banking industry.
According to (Athanasoglou et al., 2008), the profitability effect of banks’ size is
inconclusive. A negative impact of bank size on bank profitability was found by (Sufian,
2009), who mentioned that small banks can earn higher profit more than larger bank because

94
small banks have better performance efficiency and incur lower expenses. However, (Karim
and Alam, 2013) found that bank size has a significant positive impact on the financial
profitability of Bangladeshi commercial banks. Capital Adequacy (Tier-1) captures the share
of bank capital. Tier1 capital is an essential form of capital that includes equity capital and
disclosed reserves. A large number of studies have investigated the link between capital
adequacy and bank profitability in different countries such as the empirical study of (Perera
et al., 2013) who found that adequate capital has a significant positive effect on banks'
profitability. Similar results were found by (Kosmidou, 2008) and (Umoru and Osemwegie,
2016). The introduction of capital adequacy rules normally intensifies banks’ capital and
thereby improve the resilience of banks to negative shocks.
Loans to Deposit (LTD) variable is used as an exogenous instrument for liquidity risk
and is considered to strongly influence banks’ profitability (Rengasamy, 2014). This ratio
indicates the percentage of banks’ loans funded through deposits. The profitability effect of
liquidity risk remains a contentious issue. Some studies report that liquidity risk has a
negative impact on banks’ profitability (Shen et al., 2009) although others (Bourke, 1989)
found a positive significant link between bank liquidity and profitability. Equity to Assets
(ETA) is used to proxy capital strength. (Pasiouras and Kosmidou, 2007) and (Dietrich and
Wanzenried, 2011) note that in the event of loss or liquidation, banks with high capital-asset
ratios are considered relatively safer. A higher equity to assets ratio of banks means lower
needs to external funding and therefore higher profitability. The theory of capital structure
states that higher use of debt (equity) financing within a certain range, called the target capital
structure, might actually reduce (increase) firms‟ cost of capital. Thus, a positive (negative)
coefficient estimate for equity-to-assets indicates an efficient (inefficient) management of
banks‟ capital structure.
Net Interest Margin (NIM) reflects the volume of the traditional borrowing and lending
operations of the bank. This rate measures the gap between what the bank pays for the
depositors and what the bank receives from borrowers. The interest yield is one of the major
income sources for banks. Profit is based on the positive difference between the interest on
loans and interest on deposits. (Muriith, 2016) notes that fluctuations in net interest margin
are one of the main important sources of uncertainty in bank profitability but (Hanweck and
Ryu, 2011) points out that bank net interest margins are negatively related to interest-rate
volatility but positively related to increases in the slope of the yield curve. The cost of Fund
(COF) shows the management efficiency for the banks’ funds. Only a few researchers have

95
studied the effect of the COF on bank profitability. High-cost of funds mean low-profit
shares. (Zarein et al., 2015), (Dietrich & Wanzenried, 2011), and (Islam and Nishiyama,
2016) found that COF has a significantly negative impact on bank profitability. The Cost to
Income (CTI) measures the overheads or expenses required to run a bank and also acts as a
measure for the overall efficiency in managing banks’ expenditures (Pasiouras and
Kosmidou, 2007) and (Dietrich and Wanzenried, 2011). The lower the ratio, the more
profitable the bank is. For example, (Said, 2014) found a negative relationship between cost
to income ratio and bank profitability.
Concentration (CO3) is a measure of the competitiveness of the banking sector.
According to the structure-conduct-performance (SCP) hypothesis, banks in highly
concentrated markets tend to collude and earn more monopoly profits (Short, 1979, Gilbert,
1984 and Athanasoglou et al., 2008). Mixed findings of the relationship between
concentration and bank performances are mentioned in the empirical studies. A positive
impact of concentration on banking performance was suggested by (Staikouras and Wood,
2011b) while a negative relationship between concentration and bank profitability was
reported by (García-Herrero et al., 2009). We also employ the GDP growth rate and Inflation
as macroeconomic indicators. These variables were discussed in the previous section.
4.3.4 Interest rate model
The following dependent variables are used in the interest rate model – NIM, ROA, and
ROE, profit (a measure for the undivided profit and capital reserves). The net effect on profits
might be positive as a result of the low-interest rate environment which results in better
economic outcomes that are proxied by profit margin (before-tax profits as a share of total
assets that reveal the welfare consequences for banks and their customers). Total Capital
Ratio (TCR) (ratio of total risk-based capital over risk-weighted Assets) (Genay and
Podjasek, 2014). As banks engage in risky investments. They constantly search for sufficient
yield, translating into a lower TCR ratio), and credit loss provisions to total loans ratio (PCL)
(A measure for the level of credit risk and acts as a proxy for the provision for credit losses
over total loans. It is hypothesized according to (Athanasoglou et al., 2008) that the negative
impact of credit risk creates a higher level of provisioning on bank profitability).
The following variables are used as control variables – size, lending, capitalization,
diversification, PCL and TCR, real GDP growth, Inflation and short-term interest rate. Most
of these variables have been previously discussed. But other indicators include short-term

96
interest rate which is represented by the 6-month money market rate. In the literature, the
short-term interest rate has received much attention because nominal interest rate steering is
the main instrument that central banks use to stimulate the economy. The effect of short-term
interest rate and the slope of the yield curve for loan loss provisions are positive as founded
by (Bolt, et. al, 2012) and (Borio and Zhu, 2012) who showed that short-term interest rate
negatively affects net interest income and that long-term interest rate positive affects net
interest income. (Alessandri & Nelson, 2015) found that the net interest margin increases
with short-term interest rate (since banks raise their lending rates and reduce their lending
volume in response to higher interest rates). (William, 2002) argue that interest rate volatility
negatively affects net interest margins. (Demirgüç-Kunt and Huizinga, 1999) found a
positive effect of short-term interest rates on the net interest margin for smaller banks.
However, (Delis and Koureatas, 2011) note that low-interest rate reduced the default
probability on outstanding loans, and hence, reduces provisions for non-performing loans.
4.3.5 Descriptive statistics
Tables 4.4-4.6 show the variables’ descriptive statistics. Regarding the competitiveness
model in Table 4.4, The average value of the revenue (CF) is 2 percent, with a standard
deviation of 3.5 percent. The ROA mean value is 2.3 percent, with a standard deviation of
0.69 percent. The average size is 9.1 percent with a standard deviation of 0.48 percent. The
average RiskAss is 0.4 percent, with a standard deviation of 0.4 percent. The average PL is
1.07 percent with a standard deviation of 0.4 percent. The average PF is 3.0 percent with a
standard deviation of 1.1 percent. The average PK is 1.8 percent with a standard deviation of
1.04 percent. The average BR is 7.4 percent with a standard deviation of 5.6 percent. The
average INP to GDP is 1.1 percent with a standard deviation of 8.09 percent. LLPTL, size,
CAP have mean values of 0.70, 9.14 and 14.21 percent and standard deviation values of 6.96,
0.49, and 6.35 percent respectively. Liquidity, taxation, diversification and LP have mean
values of 43.83, 33.37, 16.06 and 4.93 percent, and standard deviation values of 10.5, 45.33,
6.40 and 0.284 percent respectively. Lerner's index and C3 have means of 0.37 and 68.81
percent, and standard deviations of 0.05 and 3.70 percent respectively. BSD, SMD, GDP and
INF have means of 461.21, 8.51, 4.74 and 3.80 percent, and standard deviations of 35.23,
20.12, 2.47 and 3.37 percent respectively.

97
Table 4. 4Summary Statistics (Competition model).
VARIABLES Obs Mean Std. Dev. Min Max
Revenue (CF) 195 2.0507 3.5107 .6980 1.7108
ROA 195 2.3818 .69246 -.01 5.97
Size 195 9.1763 .4898 7.8249 10.4126
RiskAss 195 .4068 .4762 -.9356 3.2434
PL 195 1.0790 .4394 .3994 4.4646
PF 195 3.0121 1.1379 .9787 7.7400
PK 195 1.8211 1.0426 .3989 6.5572
BR 195 7.4432 5.6989 .2890 27.7456
INPtoGDP 195 1.1610 8.0909 1.6909 2.5710
INF 195 3.8086 3.3784 -.7 14
LLPTL 166 .70046 6.9611 -83.9113 19.3130
Size 169 9.1438 .49730 7.8249 10.4126
Cap 169 14.210 6.3536 -31.3545 37.5247
Liquidity 169 43.8393 10.5195 .2785 60.2789
Taxation 169 33.3723 45.3375 -36.2378 401.9836
Diversification 169 16.0606 6.4081 5.8757 52.3875
LP 168 4.9373 .2847 3.3242 5.6586
LernerIndex 169 .3721 .0546 .22 .4365
C3 169 68.8130 3.7012 62.6021 76.0322
BSD 169 461.2179 35.2337 393.5676 512.5951
SMD 169 8.5143 20.1217 .2036 150.9594
GDP 169 4.7430 2.4796 2.3 8.53
Note: statistics calculated using STATA 5.1.
The statistics of the variables in the liquidity risk model are reported in Table 4.5. The
profitability rates ROA, ROE, Q, and EVA have means of 1.43, 10.52, 1.07 and 1.70 percent
respectively with standard deviations of 0.71, 5.55, 0.11 and 3.20 percent respectively. The
means of the bank size ratio is 9.14 percent with standard deviation approaching .49 percent.
Capital adequacy is, on average, 17.91 percent with a standard variation of 5.19 percent.
Liquidity risk is, on average, 60.04 percent with a standard variation of 17.44 percent. Equity
to assets is, on average, 13.20 percent with a standard variation of 4.65 percent. The mean of
the net interest margin is 2.93 percent with a standard deviation of 0.70 percent. The mean of
the cost of the fund is 3.09 percent with a standard deviation of 1.16 percent. The mean of
the cost to income ratio is 56.77 percent with a standard deviation of 19.28 percent. The mean

98
of concentration is 68.81 percent with a standard variation of 3.70 percent. GDP and inflation
rates have average values of 4.74 percent and 4.14 percent respectively with a standard
deviation of 2.47 percent and 3.44 percent.
Table 4. 5Summary Statistic (Liquidity Risk Model).
VARIABLES Obs Mean Std. Dev. Min Max
ROA 169 1.4343 .7122 -1.01 4.97
ROE 169 10.5227 5.5591 -2.24 39.84
Q 167 1.0799 .1193 .9407 1.5085
EVA 168 1.7068 3.2055 -8.0411 15.7714
size 169 9.1438 .4973 7.8249 10.4126
TIER1 154 17.9116 5.1908 9.4 36.07
LTD 169 60.0479 17.4401 .4010 101.9485
ETA 169 13.2010 4.6502 -31.3545 21.9639
NIM 169 2.9356 .7025 1.2743 4.40077
COF 169 3.0906 1.1612 1.1323 7.7400
CTI 169 56.7750 19.2847 15.2895 193.2614
C3 169 68.8130 3.7012 62.6021 76.0322
GDP 169 4.7430 2.4796 2.3 8.53
INF 169 4.1469 3.4460 -.7 14
Note: statistics calculated using STATA 5.1.
Finally, Table 4.6 provides summary statistics for the variables used in the interest rate
model. The profitability rates ROA, ROE, NIM, Profit, and Profit margin have means of 1.43,
10.52, 2.9, 2.15 and 1.9 percent respectively with standard deviations of 0.71, 5.55, 0.70, 5.4,
and .95 percent respectively. The mean value of bank size ratio is 9.1 percent with the
standard deviation approaching .49 percent. Capitalization is, on average, 13.20 percent with
a standard variation of 4.65 percent. Diversification is, on average, 16.06 percent with a
standard variation of 6.40 percent. Lending is, on average, 43.83 percent with a standard
variation of 10.51 percent. The mean of the TCR is 18.03 percent with a standard deviation
of 4.87 percent. The mean of the PCL is 1.28 percent with a standard deviation of 2.24
percent. The mean of the GDP is 5.05 percent with a standard deviation of 2.5 percent. The
mean of the Inflation is 4.14 percent with a standard variation of 3.44 percent. Short-term
interest rate has an average value 4.04 percent with a standard deviation of 1.69 percent.

99
Table 4. 6 Summary Statistic (Interest rate Model).
Variable Obs Mean Std. Dev. Min Max
ROA 169 1.4343 0.7122 -1.01 4.97
ROE 169 10.5227 5.5591 -2.24 39.84
NIM 169 2.9356 0.7025 1.2743 4.4007
Profit 169 2.1508 5.4308 -7.2307 2.8209
Profit margin 169 1.9790 0.9525 -0.9693 6.0685
Size 169 9.1438 .4973 7.8249 10.4126
CAP 169 13.2010 4.6502 -31.3546 21.964
DIV 169 16.0606 6.4081 5.8757 52.3876
LEN 169 43.8393 10.5195 0.2785 60.279
TCR 141 18.0349 4.8713 9.6 36.71
PCL 153 1.2849 2.2437 -0.7266 19.313
GDP 169 5.0584 2.5113 2.3 8.53
INF 169 4.1469 3.4460 -0.7 14
Shortir 117 4.0497 1.6993 2.05 6.734
Shortir2 117 19.2636 15.3733 4.2025 45.34676
Note: statistics calculated using STATA 5.1.
4.3.6 Empirical models
4.3.6.1 Models of competition and bank profitability
Following (Shaffer, 1983) and (Nathan and Neave, 1989), we develop an empirical model to
investigate the impact of competition on bank profitability. We employ (Rosse and Panzar,
1977) and (Panzar and Rosse, 1982, 1987) nonstructural approaches. Using bank-level data
the Panzar–Rosse model uses H-statistic to measure the magnitude of the impact of input
price fluctuations on banks’ equilibrium revenues. The H-statistic measures the elasticity of
total revenues with respect to factor input prices and is calculated from a reduced-form bank
revenue equation following (Gutiérrez de Rozas, 2011). In this regard, there are three possible
scenarios. First, under monopolistic conditions, the increase in input prices can be expected
to raise marginal costs and reduce output and hence total revenues will decline. The second
scenario shows that under monopolistic competitive market conditions, revenues will
increase less proportionally than input prices because the demand for banking products is
inelastic. Third, when banks operate in perfectly competitive markets, it is expected that their
marginal costs and will increase proportionally to input prices. With regard to the H-statistic,
the value varies and interpreted as follows: H ≤ 0 indicates a situation of monopoly. H =1

100
indicates perfect competition; and 0 < H <1 indicates monopolistic competition.
We test whether the variables are in a state of long-run equilibrium which involves
estimating parameter E, where E = 0 indicates equilibrium and E < 0 indicates disequilibrium.
Following (Molyneux et al., 1996), the model is based on a number of assumptions – banks
are treated as single-product firms. In which case Jordanian commercial banks can be
considered to act as an intermediation channel between savings and loans. Since Jordanian
banks are considered to operate as profit maximizing firms and therefore high input prices
are not necessarily associated with high revenue-generating services. Following (Bikker and
Haaf, 2002), the theoretical PR-model is written as the following reduced form revenue
function, where c is a vector of n bank-specific variables and w is the factor price elasticity.
𝑙𝑛 𝑅 = 𝛼 + ∑ 𝛽𝑙𝑛𝑤𝑖𝑚𝑖=1 + ∑ δtlnci
nt=1 (4.1)
𝐻 = ∑ βimi=1 (4.2)
Table 4. 7Interpreting the Rosse-Panzar H-statistic. Competitive environment test
H≤0
Monopoly equilibrium
Perfect colluding oligopoly
Conjectural variations short-rum oligopoly
0<H<1 Monopolistic competition free entry equilibrium
H=1
Perfect competition
Natural monopoly in a perfectly contestable market
Sales maximizing firms subject to breakeven constraints
Equilibrium test
E<0 Disequilibrium
E=0 Equilibrium
Source: (Rosse and Panzar, 1977), (Panzar and Rosse, 1982, 1987), Shaffer (1982, 1983), (Nathan and Neave, 1989), Molyneux et al. (1994), Hondroyiannis et al. (1999), amongst others.
Pooled OLS and Generalized Least Square (GLS) methods are used to empirically test
the Panzar-Rosse model while GLS is used empirically to estimate panel data with no serial
correlation while relaxing the assumption related to heteroskedasticity (Maddala and Lahiri,
2006). We also take natural logarithms of all variables. According to (Matthews et al., 2007)
and (Al-Muharrami et al., 2006), the test for equilibrium can be calculated using the same
revenue function (CF) and return on assets ROA, as shown in the following equations:

101
…………………………………………………………….……
𝐼𝑛𝐶𝐹𝑖𝑡 = 𝛼0 + 𝛼1𝑙𝑛𝑃𝐹𝑖𝑡 𝑖𝑡 + 𝛼2 𝑙𝑛𝑃𝐿𝑖𝑡 + 𝛼3𝑙𝑛𝑃𝐾 + 𝛽1𝑙𝑛𝑅𝐼𝑆𝐾𝐴𝑆𝑆𝑖𝑡 + 𝛽2𝑙𝑛𝑆𝐼𝑍𝐸𝑖𝑡 +
𝛽3𝑙𝑛𝐵𝑅𝑖𝑡 + 𝛾1𝐿𝑛𝐼𝑁𝑆𝑇𝑂𝐺𝐷𝑃𝑡 + 𝛾2𝐿𝑛𝐼𝑁𝐹𝑡 + εit (4.3)
…………………………………………………………………
𝐼𝑛𝑅𝑂𝐴 + 1𝑖𝑡 = 𝛼0⌃ + 𝛼1
⌃ 𝑙𝑛𝑃𝐹𝑖𝑡 + 𝛼2⌃𝑙𝑛𝑃𝐿𝑖𝑡 + 𝛼3
⌃𝑙𝑛𝑃𝐾𝑖𝑡 + 𝛽1⌃𝑙𝑛𝑅𝐼𝑆𝐾𝐴𝑆𝑆𝑖𝑡 + 𝛽2
⌃𝑙𝑛𝑆𝐼𝑍𝐸𝑖𝑡 +
𝛽3⌃𝑙𝑛𝐵𝑅𝑖𝑡 + 𝛾1
⌃ 𝐿𝑛𝐼𝑁𝐹𝑡 + εit (4.4)
Where CF is the revenue from commission and fees. The H statistic equals 𝛼1 + 𝛼2 +
𝛼3. The measure ROA is actually calculated 1+ROA to adjust for (small) negative values ROA.
We define the equilibrium E-statistic as 𝛼1⌃ + 𝛼2
⌃ + 𝛼3⌃. The estimation results appear in Tables
4.8- 4.12.
We check the robustness of our results by using the Generalized Method of Moments
(GMM) difference and system estimators to estimate Models 4.5 and 4.6. The GMM estimator
is used in the current study to account for unobserved heterogeneity, autocorrelation, profit
persistence over time, and endogeneity of some right-hand side variables such as capitalization.
The next section presents a detailed discussion of the GMM method. These models use ROA
and ROE as dependent variables while controlling for bank-specific, industry-specific and
macroeconomic characteristics. These models also incorporate lagged risk measures to test risk
persistence over time.
Lerner index is used as a measure of bank competition in the Jordanian banking sector
and represents the ability to which a particular bank has the power to set its price above
marginal cost. The index value ranges from a maximum of 1 to a minimum of zero, in which
1 represents the largest market power and the lowest competition. Following (Tan, 2016), the
index is calculated as the difference between a bank’s price and marginal cost divided by the
price. The predetermined variables in the models are instrumented using one-period lagged
variables, while the endogenous variables are instrumented using two-periods lagged variables.
The estimation results appear in Table 4.13.
𝑅𝑂𝐴𝑖𝑡 = c + 𝛼0⌃ 𝑅𝑂𝐴𝑖𝑡−1 + 𝛼1
⌃𝑆𝐼𝑍𝐸𝑖𝑡 + 𝛼2⌃𝐿𝐿𝑃𝑇𝐿𝑖𝑡 + 𝛽1
⌃𝐶𝐴𝑃𝑖𝑡 + 𝛽2⌃𝐿𝐼𝑄𝑈𝐼𝐷𝐼𝑇𝑌𝑖𝑡 +
𝛽3⌃𝐷𝐼𝑉𝑖𝑡 + 𝛾1
⌃ 𝑇𝐴𝑋𝐴𝑇𝐼𝑂𝑁𝑖𝑡 + 𝛾2⌃𝐿𝑃𝑖𝑡 + 𝛾3
⌃𝐿𝑒𝑟𝑛𝑒𝑟𝑖𝑡 + 𝛾4⌃𝐶3𝑖𝑡 + 𝛾5
⌃𝑆𝑀𝐷𝑖𝑡 + 𝛾5⌃𝐺𝐷𝑃𝑖𝑡 +
𝛾6⌃𝐼𝑁𝐹𝑖𝑡 + εit (4.5)

102
𝑅𝑂𝐸𝑖𝑡 = c + 𝛼0⌃ 𝑅𝑂𝐸𝑖𝑡−1 + 𝛼1
⌃𝑆𝐼𝑍𝐸𝑖𝑡 + 𝛼2⌃𝐿𝐿𝑃𝑇𝐿𝑖𝑡 + 𝛽1
⌃𝐶𝐴𝑃𝑖𝑡 + 𝛽2⌃𝐿𝐼𝑄𝑈𝐼𝐷𝐼𝑇𝑌𝑖𝑡 +
𝛽3⌃𝐷𝐼𝑉𝑖𝑡 + 𝛾1
⌃ 𝑇𝐴𝑋𝐴𝑇𝐼𝑂𝑁𝑖𝑡 + 𝛾2⌃𝐿𝑃𝑖𝑡 + 𝛾3
⌃𝐿𝑒𝑟𝑛𝑒𝑟𝑖𝑡 + 𝛾4⌃𝐶3𝑖𝑡 + 𝛾5
⌃𝑆𝑀𝐷𝑖𝑡 + 𝛾5⌃𝐺𝐷𝑃𝑖𝑡 +
𝛾6⌃𝐼𝑁𝐹𝑖𝑡 + εit (4.6)
4.3.6.2 Models of liquidity risk and bank profitability
We use pooled OLS, fixed effects, as well as random effects methods to estimate models 4.7-
4.11. These models aim to investigate the relationship between risk measures and bank
profitability using our sample of Jordanian banks. Hausman specification test is applied to each
model to decide whether to use FE or RE models (Hausman, 1978). We start our analysis by
pooling the panel data and estimating it using ordinary least squares (OLS) regression. This
method ignores bank specific heterogeneities and could generate biased and inefficient results.
To correct for this bias, we use both FE and RE approaches to account for the distinct nature
of each bank and control for the unobserved heterogeneity that is constant over time and
correlated with the dependent variables such as Jordan's geographical location and cultural
norms. These methods capture the within-variation across banks and time-related shocks that
affect all banks such as global financial crises (Bjorvatn and Farzanegan, 2013). The main
difference between RE and FE is that RE estimates are produced using GLS method while
assuming that the unobserved heterogeneity is uncorrelated with the regressors. (Gujarati,
2009) states the basic framework for the fixed effects as follows:
𝑌𝑖𝑡 = 𝛼0 + 𝛼1𝐵𝑎𝑛𝑘𝑖𝑡 + 𝛼2𝐼𝑛𝑑𝑖𝑡 + 𝛼3𝑀𝑎𝑐𝑖𝑡 + 𝜈𝑡 (4.7)
Where i refers to an individual bank, t refers to the year, yit is the dependent variable, a is the
intercept term, α is a vector of parameters to be estimated on the explanatory variables. The
explanatory variables are classified into three categories. First, 𝐵𝑎𝑛𝑘𝑖𝑡 is the bank-specific
factors, second, 𝐼𝑛𝑑𝑖𝑡 is the banking industry determinants, and third, 𝑀𝑎𝑐𝑖𝑡 is the
macroeconomic determinants and εit is an error term. We use the performance indicators ROA,
ROE, Tobin Q ratio and EVA as dependent variables and develop the estimation models
following ((Staikouras and Wood, 2011) and (Said, 2014) as follows:
𝑅𝑂𝐴𝑖𝑡 = 𝛼0 + 𝛼1𝑆𝐼𝑍𝐸 𝑖𝑡 + 𝛼2 𝑇𝐼𝐸𝑅1𝑖𝑡 + 𝛼3𝐿𝑇𝐷𝑖𝑡 + 𝛼4𝐸𝑇𝐴𝑖𝑡 + 𝛼5𝑁𝐼𝑀𝑖𝑡 + 𝛼6𝐶𝑇𝐼𝑖𝑡 +
𝛼7𝐶𝑂𝐹𝑖𝑡 + 𝛼8𝐶𝑂3𝑖𝑡 + 𝛼9𝐺𝐷𝑃𝑖𝑡 + 𝛼10𝐼𝑁𝐹𝑖𝑡 + 휀𝑖𝑡 . (4.8)

103
𝑅𝑂𝐸𝑖𝑡 = 𝛼0 + 𝛼1𝑆𝐼𝑍𝐸 𝑖𝑡 + 𝛼2 𝑇𝐼𝐸𝑅1𝑖𝑡 + 𝛼3𝐿𝑇𝐷𝑖𝑡 + 𝛼4𝐸𝑇𝐴𝑖𝑡 + 𝛼5𝑁𝐼𝑀𝑖𝑡 + 𝛼6𝐶𝑇𝐼𝑖𝑡 +
𝛼7𝐶𝑂𝐹𝑖𝑡 + 𝛼8𝐶𝑂3𝑖𝑡 + 𝛼9𝐺𝐷𝑃𝑖𝑡 + 𝛼10𝐼𝑁𝐹𝑖𝑡 + 휀𝑖𝑡 .(4.9)
𝑇𝑜𝑏𝑖𝑛𝑖𝑡 = 𝛼0 + 𝛼1𝑆𝐼𝑍𝐸 𝑖𝑡 + 𝛼2 𝑇𝐼𝐸𝑅1𝑖𝑡 + 𝛼3𝐿𝑇𝐷𝑖𝑡 + 𝛼4𝐸𝑇𝐴𝑖𝑡 + 𝛼5𝑁𝐼𝑀𝑖𝑡 + 𝛼6𝐶𝑇𝐼𝑖𝑡 +
𝛼7𝐶𝑂𝐹𝑖𝑡 + 𝛼8𝐶𝑂3𝑖𝑡 + 𝛼9𝐺𝐷𝑃𝑖𝑡 + 𝛼10𝐼𝑁𝐹𝑖𝑡 + 휀𝑖𝑡 (4.10)
.
𝐸𝑉𝐴𝑖𝑡 = 𝛼0 + 𝛼1𝑆𝐼𝑍𝐸 𝑖𝑡 + 𝛼2 𝑇𝐼𝐸𝑅1𝑖𝑡 + 𝛼3𝐿𝑇𝐷𝑖𝑡 + 𝛼4𝐸𝑇𝐴𝑖𝑡 + 𝛼5𝑁𝐼𝑀𝑖𝑡 + 𝛼6𝐶𝑇𝐼𝑖𝑡 +
𝛼7𝐶𝑂𝐹𝑖𝑡 + 𝛼8𝐶𝑂3𝑖𝑡 + 𝛼9𝐺𝐷𝑃𝑖𝑡 + 𝛼10𝐼𝑁𝐹𝑖𝑡 + 휀𝑖𝑡 (4.11)
The estimation results appear in Tables 4.14 and 4.15.
4.3.6.3 Models of interest rate, risk-taking, and bank profitability
In this part of our analysis we use Pooled OLS and GMM approaches to estimate Models 4.12-
4.13. For our dynamic models we have three precarious issues that should be considered in the
empirical estimation. First, some bank profitability and bank risk-taking determinants are
potentially endogenous. In econometrics, endogeneity broadly refers to situations in which an
explanatory variable is correlated with the error term. This either follows from omitted
variables bias or from causality between the independent and dependent variable (García-
Herrero et al., 2009). Second, it is assumed there are some fixed effects that is specific to each
individual bank that impact the bank’s profitability or risk-taking which are not captured in the
model known as unobserved heterogeneity. Third, the dynamic structure of the models
complicates the estimation. Thus, if the independent variable is correlated with the error term
(e.g. short interest rate) in a regression model, then the estimate of the regression coefficient in
an ordinary least squares (OLS) regression will be biased. In such cases, GMM or IV
approaches are the appropriate techniques to solve the endogeneity problem.
The system GMM estimator is widely implemented in related empirical studies on bank
profitability and bank risk-taking (and allows for consistent estimation when the explanatory
variables (covariates) are correlated with the error terms and are generally used in regression
analysis when there are endogenous variables). The system GMM estimator from (Arellano
and Bover, 1995) and (Blundell and Bond, 1998) provides consistent and unbiased estimates
104
when dealing with endogenous and dynamic models. It uses lagged values of the dependent
variable both in levels and in differences as instruments as well as lagged values of the other,
potentially endogenous regressors. We report a set of diagnostic tests to check whether or not
the data are consistent with the assumptions of the (Arellano and Bond, 1991) estimator. The
Sargan test statistic examines the over-identification restrictions. It essentially tests whether
the instruments are uncorrelated with the error terms in the estimated equation. The Sargan test
statistics for all models appear with a p-value greater than 0.10. Hence, we are unable to reject
the null hypothesis. The second test is the AR (2) Arellano and Bond test for autocorrelation.
The null hypothesis is ‘no autocorrelation’ and relates to the differenced residuals. The p-values
for AR (2) show that all models are free from autocorrelation at the 1 percent level.
In our models, we use the performance indicators NIM, ROA, ROE, Profit, Profit
Margin, PCL, and TCR as dependent variables. Following (Bikker and Vervliet, 2018) we
develop the following models to test the empirical effect of interest rate on the profitability and
risk taking of Jordanian commercial bank. Model 4.14 uses bank profitability measures as the
dependent variables and Model 4.15 uses bank risk-taking measures as dependent variables.
𝛱𝑖𝑡 = 𝑐 + 𝛼𝛱𝑖,𝑡−1 + 𝛽𝑋𝑖𝑡𝐵𝑆 + 𝛾𝑋𝑖𝑡
𝑀𝑎𝑐𝑟𝑜 + 𝛿𝑋𝑖𝑡𝐼𝑅 + 휀𝑖𝑡 (4.12)
𝑟𝑖𝑡 = 𝑐 + 𝛼𝑟𝑖 ,𝑡−1 + 𝛽𝑋𝑖𝑡𝐵𝑆 + 𝛾𝑋𝑖𝑡
𝑀𝑎𝑐𝑟𝑜 + 𝛿𝑋𝑖𝑡𝐼𝑅 + 휀𝑖𝑡 (4.13)
where i refers to an individual bank, t refers to the year, 𝑟𝑖𝑡 is the risk measure variables for
bank i in year t; the degree of risk persistence is captured by the coefficient 𝛼. The other
regressors and the error term are similar to those in previous models. The empirical results
appear in Tables 4.20 and 4.22.
𝑁𝐼𝑀𝑖𝑡 = 𝛼0 + 𝛼1𝑆𝐼𝑍𝐸 𝑖𝑡 + 𝛼2 𝐶𝐴𝑃𝑖𝑡 + 𝛼3𝐷𝐼𝑉𝑖𝑡 + 𝛼4𝐿𝐸𝑁𝑖𝑡 + 𝛼5𝐺𝐷𝑃𝑖𝑡 + 𝛼6𝐼𝑁𝐹𝑖𝑡 +
𝛼7𝑇𝐶𝑅𝑖𝑡 + 𝛼8 𝑃𝐶𝐿𝑖𝑡 + 𝛼9𝑆𝐻𝑇𝐼 + 휀𝑖𝑡 (4.14) .
𝑅𝑂𝐴𝑖𝑡 = 𝛼0 + 𝛼1𝑆𝐼𝑍𝐸 𝑖𝑡 + 𝛼2 𝐶𝐴𝑃𝑖𝑡 + 𝛼3𝐷𝐼𝑉𝑖𝑡 + 𝛼4𝐿𝐸𝑁𝑖𝑡 + 𝛼5𝐺𝐷𝑃𝑖𝑡 + 𝛼6𝐼𝑁𝐹𝑖𝑡 +
𝛼7𝑇𝐶𝑅𝑖𝑡 + 𝛼8 𝑃𝐶𝐿𝑖𝑡 + 𝛼9𝑆𝐻𝑇𝐼 + 휀𝑖𝑡 (4.15) .
𝑅𝑂𝐸𝑖𝑡 = 𝛼0 + 𝛼1𝑆𝐼𝑍𝐸 𝑖𝑡 + 𝛼2 𝐶𝐴𝑃𝑖𝑡 + 𝛼3𝐷𝐼𝑉𝑖𝑡 + 𝛼4𝐿𝐸𝑁𝑖𝑡 + 𝛼5𝐺𝐷𝑃𝑖𝑡 + 𝛼6𝐼𝑁𝐹𝑖𝑡 +
𝛼7𝑇𝐶𝑅𝑖𝑡 + 𝛼8 𝑃𝐶𝐿𝑖𝑡 + 𝛼9𝑆𝐻𝑇𝐼 + 휀𝑖𝑡 (4.16) .
𝑃𝑟𝑜𝑓𝑖𝑡𝑖𝑡 = 𝛼0 + 𝛼1𝑆𝐼𝑍𝐸 𝑖𝑡 + 𝛼2 𝐶𝐴𝑃𝑖𝑡 + 𝛼3𝐷𝐼𝑉𝑖𝑡 + 𝛼4𝐿𝐸𝑁𝑖𝑡 + 𝛼5𝐺𝐷𝑃𝑖𝑡 + 𝛼6𝐼𝑁𝐹𝑖𝑡 +
𝛼7𝑇𝐶𝑅𝑖𝑡 + 𝛼8 𝑃𝐶𝐿𝑖𝑡 + 𝛼9𝑆𝐻𝑇𝐼 + 휀𝑖𝑡 (4.17) .

105
𝑃𝑀𝑖𝑡 = 𝛼0 + 𝛼1𝑆𝐼𝑍𝐸 𝑖𝑡 + 𝛼2 𝐶𝐴𝑃𝑖𝑡 + 𝛼3𝐷𝐼𝑉𝑖𝑡 + 𝛼4𝐿𝐸𝑁𝑖𝑡 + 𝛼5𝐺𝐷𝑃𝑖𝑡 + 𝛼6𝐼𝑁𝐹𝑖𝑡 +
𝛼7𝑇𝐶𝑅𝑖𝑡 + 𝛼8 𝑃𝐶𝐿𝑖𝑡 + +𝛼9𝑆𝐻𝑇𝐼 + 휀𝑖𝑡 (4.18) .
4.4. Empirical results
4.4.1 Competition results
This section discusses the estimates of models covering the following sub-periods (2003-2005,
2006-2008, 2009-2011, 2012-2014, and 2015-2017) as reported in Tables 4.8 to 4.12. The
dependent variable of the Revenue (CF). The H-statistic values are equal to: 0.2662884 (2003-
2005), -0.5767809 (2006-2008), 1.1344102 (2009-2011), .8893453 (2012-2014) and
0.2882701 (2015-2017). This study examines the competitive conditions in Jordan’s banking
industry for the period 2003-2017. This period corresponds to a period characterized by
important reforms undertaken by CBJ and the government to liberalize the financial systems.
The results suggest that Jordan’s banking market cannot be described by either perfect
competition or monopoly over 2003-2017. The results show the estimated parameters of the P-
R model, Revenue (CF) model results indicate that Jordanian commercial banks operate under
monopolistic competitive conditions. The Jordanian commercial banks' competitiveness has
not changed except during the period 2009-2011, wherein the H-statistic has increased to
1.1344102. The positive change in the competitiveness state of the Jordanian banking sector
corresponds to the entry of six new banks in 2004 and 2009 (Bank Audi, National Bank of
Kuwait, Blom Bank, Jordan Dubai Islamic Bank, National Bank of Abu Dhabi and Al Rajhi
Bank). Such improvement was meant by the Jordanian government and the CBJ to renew
customer confidence in the banking system following the 2008 global financial crises. The H
– statistic takes a value between zero and one for the period (2003-2005), (2012-2014), and
(2015-2017) in the second model indicating a monopolistic competitive nature in the Jordanian
banking system. Hence, empirical findings suggest that the Jordanian commercial banks are
competing in a monopolistic competitive nature. That is, banks earned their revenues as if
operating under conditions of monopolistic competition during the study period except 2006-
2008 (the period of global financial crises). The study results support that high concentration
will result in a monopoly as suggested by SCP hypothesis as shown in the result of the sup-
period 2006-2008. These results are incompatible with contestable theory. Empirical findings
reveal that the Jordanian banking sector is under monopolistic competitive nature, but still close
to the monopoly market with high concentration and low competition among banks. the results
106
indicating that the revenue of Jordanian commercial banks appears to be earned in conditions
of monopolistic competition during the sample periods. Our findings not very different from
the findings of the most empirical study’s findings that have been conducted on the banking
sectors in various countries in the same area. The results show a lower degree of competition
in the later years of the sample period. The findings of this study are similar to the findings of
(Le, 2014; Kashi et al., 2015; and Babic et al., 2015). Thus, our overall findings show that the
banking market structure can be characterized as monopolistic competition. This conclusion
holds under a variety of specifications controlling for bank-size, risk and other macroeconomic
variables. These findings show the need for further deregulations and liberalizations to reduce
concentration and enhance competitiveness. The reported results are similar to the findings of
(Demirguc-Kunt and Peria, 2010). According to the results reported in Tables 4.8 to 4.12, the
elasticity of revenues to the financial resources' cost is mixed. In the models (4.3 and 4.4) where
the Revenue (CF) is the dependent variables, the price of labor, and price of capital are positive
and significant in most cases, while the ratio of the number of branches of a bank to the total
number of branches and the price of funds is negative and significant for most cases.
Regarding the GMM estimations reported in Table 4.13, the lagged values of the profit
(ROE) have a positive impact on the current level of ROE. Most of the literature found that
firms that have higher than normal profits at a given point in time tend to sustain the profile of
high profits over time. Similar evidence regarding banks’ profit resilience is rare, profits tend
to persist if a bank’s past rankings were good predictors of its present ranking as in the study
of (Berger et al., 2000) for US banks. This shows that the departure from competitive market
structure is not very large in the Jordanian banking sector. Since, according to (Sinha ad
Sharma, 2014), profit persistence is strongly affected by the state of competition in the banking
sector due to the asymmetry of information. Size also has a negative impact on profitability,
suggesting that larger banks have more complicated bureaucratic procedures that affect their
profitability negatively. Furthermore, these banks may face lessening marginal returns which
causes a decline in their profit shares. The significant and negative impact of diversification on
bank profitability suggests that a diversified investment portfolio causes a decline in bank
profitability. This result can be explained by the fact that utilizing the bank resources across a
variety of businesses reduces the funds available for traditional loan business and precedes a
decline in the interest yield, which is one of the biggest revenue sources for banks.
Concentration (C3) has a negative impact on banks’ profitability (ROA) while the
Lerner index has no statistically significant effect on ROE and ROA. The competitiveness of
Jordanian banks has been and continues to be a problem in the Jordanian banking sector, as

107
concentration is found to impair competitiveness and profitability of the banking sector. This
has been observed by (Bikker and Haaf, 2002) for 21 countries (Australia, Austria, Belgium,
Canada, Denmark, Finland, France, Germany, Greece, Ireland, Italy, Japan, Korea (South),
Luxembourg, Netherlands, New Zealand, Norway, Portugal, Spain, Sweden, Switzerland, UK,
US). A high C3 implies that the assets share of the largest three banks is large relative to all
other Jordanian commercial banks (Arab Bank, The housing bank for trade and finance, Jordan
Ahli Bank). Labor productivity fosters profitability as it reflects the operational efficiency of
the bank system. The positive impact of GDP on both profitability measures suggests that an
economic boom encourages banks to lend more and permits them to charge higher margins in
line with the findings of (Pasiouras and Kosmidou, 2007). It’s worth mentioning that years
2005, 2006 and 2007 was the period of economic boom in Jordan which is clearly shown by
the highest ratio of ROA (2.0, 1.7, 1.6) and ROE du (20.9, 15.0, 12.6) respectively.

108
Table 4. 8The Rosse-Panzar H-statistic Results for Jordanian Commercial Banks Competitive
Environment and Equilibrium Test Using Commission and Return on Assets (2003-2005).
Pooled OLS GLS Pooled OLS GLS
VARIABLES LnCF LnCF Ln1ROA Ln1ROA
LnSIZE 4.6055 *** 4.6055*** .1142 .1142
(.3502) (.3059) (.7540) (.6586)
LnRISkASS .0688 .0688 .0219 .0219
(.0538) (.0470) (.1158) (.1012)
LnBR -.1124 -.1124 -.3689 -.3689
(.1130) (.0988) (.2434) (.2127)
LnPL .2655 .2655* -.6729 * -.6729**
(.1842) (.1609) (.3966) (.3465)
LnPF -.1080 -.1080 -1.6181*** -1.6181***
(.2549) (.2227) (.5489) (.4795)
LnPK .1087 .1087 -.1269 -.1269
(.1436) (.1255) (3093) (.2702)
LnINStoGDP 1.2968 1.2968 5.6592* 5.6592*
(1.6202) (1.4154) (3.4882) (3.0473)
LnINF .5429 .5429 2.5742** 2.5742**
(.5628) (.4916) (1.2117) (1.0585)
Constant -38.4609 -38.4609 -122.1172 -122.1172 *
(35.7274) (31.2111) (76.9178) (67.1946)
H-statistic .2662
E-Statistic -2.4180
Observations 38 38 38 38
R-squared 0.9307 0.5292
Adj R-squared 0.9116 0.3993
Prob > chi2 0.0000 0.0000
Where the dependent variables are: CF is the Revenue, ROA and ROE measured the profitability. The
independent variables are: PL is the Unit Price of Labor, PK is the Unit Price of Capital, PF is the Unit Price of
Funds, BR: Number of Branch, SIZE is the Bank size, RISKASS is the Risk, INStoGDP is the Insurance
Premium, INF is the inflation rate. Note: Standard errors in parentheses, *** p<0.01, ** p<0.05, * p<0.1. H1=
.2655058 + -.1080146 + .1087972 = .2662884. E1 = -.6729218 + -1.618153 + -.1269571 = -
2.4180619.

109
Table 4. 9The Rosse-Panzar H-statistic Results for Jordanian Commercial Banks Competitive
Environment and Equilibrium Test Using Commission and Return on Assets (2006-2008).
Pooled OLS GLS Pooled OLS GLS
VARIABLES LnCF LnCF Ln1ROA Ln1ROA
LnSIZE 4.2496*** 4.2496*** -.2111 .03015
(.4761) (.4142) (.2527) (.6185)
LnRISkASS .0656* .0656* -.0479 ** .0058
(.0432) (.0375) (.0229) (.0561)
LnBR -.1089 -.1089 .1071 -.0893
(.2042) (.1777) (.1084) (.2653)
LnPL -.0135 -.0135 -.1245 .2829
(.2056) (.1788) (.1091) (.2670)
LnPF -.6916* -.6916* .1096 .0655
(.4496) (.3911) (.2386) (.5840)
LnPK .1285 .1285 .1136* .2123
(.1424) (.1238) (.0755) (.1849)
LnINStoGDP 1.2816* 1.2816* -1.0125** -1.5890*
(.8057) (.7009) (.4276) (1.0466)
LnINF -.4473 -.4473 .4912*** .7654*
(.3560) (.3097) (.1889) (.4624)
Constant -30.39* -30.3919* 22.9418*** 36.1595 *
(16.082) (13.9900) (8.5363) (20.8903)
H-statistic -.5767
E-Statistic .0986
Observations 37 37 37 37
R-squared 0.9364 0.3547
Adj R-squared 0.9182 0.1703
Prob > chi2 0.0000 0.3765
Where the dependent variables are:, CF is the Revenue, ROA and ROE measured the profitability. The
independent variables are: PL is the Unit Price of Labor, PK is the Unit Price of Capital, PF is the Unit Price of
Funds, BR: Number of Branch, SIZE is the Bank size, RISKASS is the Risk, INStoGDP is the Insurance
Premium, INF is the inflation rate. Note: Standard errors in parentheses, *** p<0.01, ** p<0.05, * p<0.1. H1= -
.0135975 + -.6916956 + .1285122 = -.5767809. E1 = -.1245797 + .1096084 + .1136269 =
.0986556.
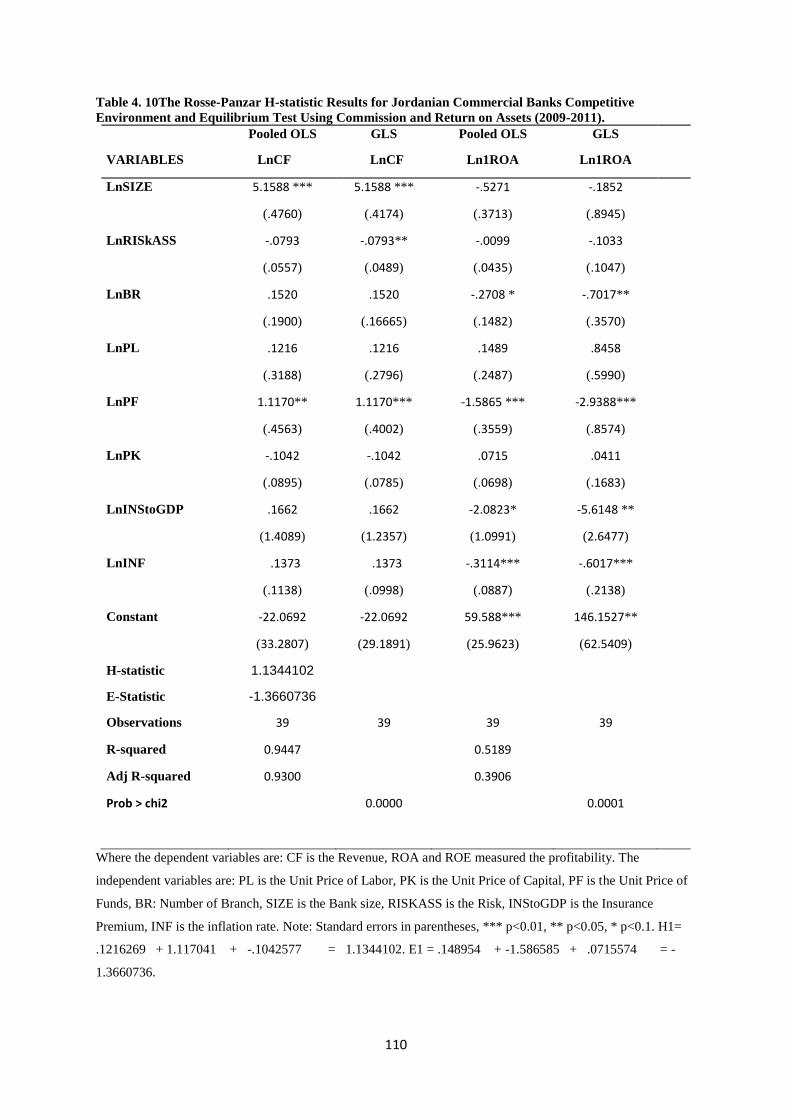
110
Table 4. 10The Rosse-Panzar H-statistic Results for Jordanian Commercial Banks Competitive
Environment and Equilibrium Test Using Commission and Return on Assets (2009-2011).
Pooled OLS GLS Pooled OLS GLS
VARIABLES LnCF LnCF Ln1ROA Ln1ROA
LnSIZE 5.1588 *** 5.1588 *** -.5271 -.1852
(.4760) (.4174) (.3713) (.8945)
LnRISkASS -.0793 -.0793** -.0099 -.1033
(.0557) (.0489) (.0435) (.1047)
LnBR .1520 .1520 -.2708 * -.7017**
(.1900) (.16665) (.1482) (.3570)
LnPL .1216 .1216 .1489 .8458
(.3188) (.2796) (.2487) (.5990)
LnPF 1.1170** 1.1170*** -1.5865 *** -2.9388***
(.4563) (.4002) (.3559) (.8574)
LnPK -.1042 -.1042 .0715 .0411
(.0895) (.0785) (.0698) (.1683)
LnINStoGDP .1662 .1662 -2.0823* -5.6148 **
(1.4089) (1.2357) (1.0991) (2.6477)
LnINF .1373 .1373 -.3114*** -.6017***
(.1138) (.0998) (.0887) (.2138)
Constant -22.0692 -22.0692 59.588*** 146.1527**
(33.2807) (29.1891) (25.9623) (62.5409)
H-statistic 1.1344102
E-Statistic -1.3660736
Observations 39 39 39 39
R-squared 0.9447 0.5189
Adj R-squared 0.9300 0.3906
Prob > chi2 0.0000 0.0001
Where the dependent variables are: CF is the Revenue, ROA and ROE measured the profitability. The
independent variables are: PL is the Unit Price of Labor, PK is the Unit Price of Capital, PF is the Unit Price of
Funds, BR: Number of Branch, SIZE is the Bank size, RISKASS is the Risk, INStoGDP is the Insurance
Premium, INF is the inflation rate. Note: Standard errors in parentheses, *** p<0.01, ** p<0.05, * p<0.1. H1=
.1216269 + 1.117041 + -.1042577 = 1.1344102. E1 = .148954 + -1.586585 + .0715574 = -
1.3660736.

111
Table 4. 11The Rosse-Panzar H-statistic Results for Jordanian Commercial Banks Competitive
Environment and Equilibrium Test Using Commission and Return on Assets (2012-2014).
Pooled OLS GLS Pooled OLS GLS
VARIABLES LnCF LnCF Ln1ROA Ln1ROA
LnSIZE 6.1027*** 6.1027*** .3939* .5236*
(.5073) (.4450) (.2174) (.3380)
LnRISkASS .0148 .0148 -.1104*** -.1398***
(.0759) (.0666) (.0325) (.0506)
LnBR -.44927** -.4492*** -.1929** -.2577**
(.1830) (.1605) (.0784) (.1219)
LnPL 1.0008*** 1.0008*** .2114 * .3857 **
(.2877) (.2523) (.1233) (.1917)
LnPF -.1482 -.1482 -.3947** -.7212***
(.3628) (.3182) (.1554) (.2417)
LnPK .0367 .0367 .1635 .1876**
(.1409) (.1236) (.0604) (.0939)
LnINStoGDP -7.4724 -7.4724 1.3035 7.5620
(11.5126) (10.0972) (4.9338) (7.6714)
LnINF .3667 .3667 -.0499 -.3351
(.4003) (.3511) (.1715) (.2667)
Constant 152.0335 152.0335 -31.2571 -174.7259
(268.0868) (235.1276) (114.8908) (178.6397)
H-statistic .88934
E-Statistic -.01971
Observations 39 39 39 39
R-squared 0.9123 0.5226
Adj R-squared 0.8889 0.3952
Prob > chi2 0.0000 0.0000
Where the dependent variables are: CF is the Revenue, ROA and ROE measured the profitability. The
independent variables are: PL is the Unit Price of Labor, PK is the Unit Price of Capital, PF is the Unit Price of
Funds, BR: Number of Branch, SIZE is the Bank size, RISKASS is the Risk, INStoGDP is the Insurance
Premium, INF is the inflation rate. Note: Standard errors in parentheses, *** p<0.01, ** p<0.05, * p<0.1. H1=
1.000838 + -.1482142 + .0367215 = .8893453. E1 = .211475 + -.3947703 + .1635796 = -.0197157.

112
Table 4. 12The Rosse-Panzar H-statistic Results for Jordanian Commercial Banks Competitive
Environment and Equilibrium Test Using Commission and Return on Assets (2015-2017).
Pooled OLS GLS Pooled OLS GLS
VARIABLES LnCF LnCF Ln1ROA Ln1ROA
LnSIZE 5.4571 *** 5.4571*** -.3293 -.7575 *
(.6364) (.5582) (2645) (.4090)
LnRISkASS .0835 .0835 -.0049 -.0067
(.0863) (.0757) (.0358) (.0555)
LnBR -.4411** -.4411** -.0494 .0717
(.2058) (.1805) (.0855) (.1323)
LnPL .6348 ** .6348 ** .1187 .0531
(.2978) (.2611) (.1237) (.1913)
LnPF -.4710 -.4710 -.4788*** -.5205 **
(.3698) (.3243) (.1537) (.2376)
LnPK .1244 .1244 -.0340 -.1738
(.1979) (.1735) (.0822) (.1271)
LnINStoGDP -1.1201 -1.1201 -.8048 -1.1850
(1.6838) (1.4767) (.6997) (1.0820)
LnINF .0775 .0775* .0066 .0017
(.0503) (.0441) (.0209) (.0323)
Constant 10.9714 10.9714 24.7471 40.4673
(39.7404) (34.8546) (16.5156) (25.5384)
H-statistic .2882
E-Statistic -.3941
Observations 39 39 39 39
R-squared 0.8232 0.3960
Adj R-squared 0.7760 0.2350
Prob > chi2 0.0000 0.0156
Where the dependent variables are: CF is the Revenue, ROA and ROE measured the profitability. The
independent variables are: PL is the Unit Price of Labor, PK is the Unit Price of Capital, PF is the Unit Price of
Funds, BR: Number of Branch, SIZE is the Bank size, RISKASS is the Risk, INStoGDP is the Insurance
Premium, INF is the inflation rate. Note: Standard errors in parentheses, *** p<0.01, ** p<0.05, * p<0.1. H1=
.6348226 + -.4710039 + .1244514 = .2882701. E1 = .1187637+ -.4788663 + -.0340204 = -.394123.

113
Table 4. 13Empirical Results of GMM Model of the Impact of competition (Lerner Index) on the
Jordanian Commercial Banks Profitability (2003-2015). VARIABLES ROA ROE
L.ROA -0.00331
(0.0497)
L2.ROA -0.247***
(0.0475)
L.ROE -0.132**
(0.0631)
L2.ROE -0.0916*
(0.0552)
SIZE -0.816** -8.505***
(0.326) (2.866)
LLPTL -0.00680 -0.00682
(0.00484) (0.0413)
CAP 0.0332** -0.181
(0.0149) (0.122)
LIQUIDITY 0.00171 -0.0220
(0.00430) (0.0376)
DIV -0.0241*** -0.163**
(0.00835) (0.0704)
TAXATION -0.000922 -0.00514
(0.000601) (0.00549)
Lerner 0.121 -1.332
(0.535) (4.330)
CO3 -0.0611** -0.611***
(0.0285) (0.225)
LP 2.363*** 17.86***
(0.396) (3.371)
SMD -0.00578 0.00283
(0.00531) (0.0484)
GDP 0.121*** 0.398*
(0.0251) (0.218)
INF -0.00500 0.0915
(0.00890) (0.0764)
Constant 4.508 84.04***
(4.208) (32.07)
Observations 141 141

114
Number of Bank 13 13
Where the dependent variables are: ROA and ROE measured the profitability. The independent variables are SIZE
is the Bank size, LLPTL is the Bank risk, LIQUIDITY is the Liquidity, CAP is the Capitalization, DIV is the
Diversification, LP is the Labor productivity, TAXATION is the Taxation, Lerner is the Competition, CO3 is the
Concentration, SMD is the Stock market development, INF is the inflation annual rate. GDP is the GDP growth
rate. Note: Standard errors in parentheses *** p<0.01, ** p<0.05, * p<0.1
4.4.2 Liquidity risk results
The estimations result of the liquidity risk models appear in Tables 4.14 and 4.15. The models
are estimated using Pooled OLS, FE, RE methods. We hypothesize a significant and positive
relationship between liquidity risk and profitability for Jordanian commercial banks (H2).
Liquidity risk is measured by total loans to total deposits (LTD). Our results confirm our
hypothesis wherein liquidity risk has a significant positive impact, but only for ROE and Q
models with coefficients of 0.05 and 0.001 respectively. (Tafri et al., 2009) and (Alshatti,
2016) found a similar insignificant effect of the loan to deposits ratio on bank profitability.
Our results are in line with (Bourke, 1989) who found evidence of a positive relationship
between liquidity risk and bank profitability for 90 banks in Europe, North America, and
Australia. The positive relationship between LTD and the Jordanian bank profitability shows
that for the period represented by the data that Jordanian commercial banks used their fund
resources efficiently. The management of bank resources was one of the major concerns for
CBJ regulators who imposed on sight monitoring during the period of banking reform.
With regard to bank size, similar to the competition models, the size coefficients in the
ROA, ROE, Tobin Q, and EVA models are -1.39, -2.26, -0.18, and -0.87 respectively. The
data suggests that larger banks have more complicated bureaucratic procedures that have
affect their profitability negatively. Also, it is likely that these banks may have faced reduced
marginal returns, which would have resulted in declining profitability compared with their
size as suggested by (Staikouras and Wood, 2011) and (Ani et al. 2012). This result also
suggests that higher total assets may not necessarily lead to higher profits. The results may
also be linked to diseconomies of scale suffered by Jordanian banks due to the uncontrolled
increase in the number of deposits and to the inward migration of Iraqi and Syrian refugees
to Jordan.
Capital Adequacy Ratio (Tier-1) and Equity to Assets (ETA) both have a robust
negative effect on ROE as shows in table 4.19 and 4.20. Generally, capital adequacy is used

115
by bank regulators to control banks' ability to withstand a certain amount of losses. The
inward migration of Syrian and Iraqi refugees contributed to the increase in capital adequacy,
size of branches and the capital of Jordanian commercial banks. The capital adequacy ratio
in Jordan reached 12 percent in 2015 exceeding the CBJ minimum rate of 8 percent. Our
results are in line with (Al-Tarawneh et al., 2016) who found a negative correlation between
capital adequacy and Jordanian banks' profitability. The negative ETA indicates that during
the period examined, Jordanian banks adopted a tighter loan policy and, at the same time,
maintained a large share of capital to offset potential losses or crises. These results also
highlight the success of CBJ reforms. Since 1989 the CBJ has initiated a number of reforms
to make the banking system more secure via increasing the paid-up capital of Jordanian banks
to JD 100 million. These findings also support the argument that well-capitalized banks face
lower chances of bankruptcy (Hassan and Bashir, 2003, Bashir, 2003, and Sufian and
Habibullah, 2009).
We use the Net Interest Margin (NIM) to investigate the impact of the interest
environment on bank performance. In line with our hypothesis, NIM has a positive and
statistically significant impact on ROA and ROE. A one percentage increase in NIM fosters
ROA and ROE with 0.18 percent and 0.80 percent respectively. This result corresponds to
the fact that the interest yield is the main source of income for Jordanian banks amounting to
77.4 percent of total income in 2015. (Khrawish and Al-Sa’di, 2011) found a similar positive
relationship between ROA, ROE, and NIM. These results correspond with Jordanian banks’
attempts to extend offered loans while preserving the low levels of Non-Performing Loans
(NPL). The ratio of non-performing loans to total loans continued its downward trend at the
end of 2015 to touch 4.9 percent compared to 7.7 percent, 6.8 percent and 5.6 percent at the
end of 2012, 2013 and 2014 respectively. The coverage ratio for the nonperforming loans
reached 75.0 percent at the end of 2015. Bank net interest margin in Jordan was 2.16 percent
in 2003 and 3.23 percent in 2015. This was induced by the increase in the amounts of offered
loans from Jordanian banks to the households, businesses, and government (in general, the
larger the value of the loan, the greater the net interest margin will be, and the higher the bank
profits are). In line with the increase in bank loans, Jordanian banking sector credit facilities
grew to 9.6 percent to reach 21.1 billion JD in 2015.
The cost of fund (COF) has also a significant negative impact on ROA, ROE, Q, and
EVA with coefficients of -0.99, -0.76, -0.008, and -1.27 respectively. The COF measures the
impact of bank managements’ efficiency over banks' profitability. Therefore, a bank with

116
excellent managerial efficiency will be able to collect low-cost funds, thus enhancing
profitability levels (Dietrich ans Wanzenried, 2011). The negative relationship between COF
and Jordanian banks' profitability is consistent with the fact that banks with higher capital
ratios tend to face a lower cost of funding due to lower prospective bankruptcy costs as
reported by (Demirgüç-Kunt and Huizinga, 1999) and (Pasiouras and Kosmidou, 2007).
These results also support the successful attempts by the CBJ to lower the cost of funds
through increased banking sector liquidity while also inducing banks to lower their lending
rates and to expand credit facilities.
Cost to Income (CTI) negatively influences banks' profitability. CTI coefficients with
ROA, ROE Q, and EVA are -0.02, -0.19, -0.001, and -0.042 respectively. CTI is another
indicator of the operational efficiency of the Jordanian commercial banks, where a high ratio
implies less efficient management. This result meets our expectation that improvements in
efficiency feed into higher profitability. (Trujillo-Ponce, 2013) and (Athanasoglou et al.,
2008) found similar effects of higher CTI on the reduction of banks’ profitability. As a part
of the CBJ objectives during the reform phase, the CBJ designed a unified e-banking
methodology for all processes and for all clients, and also introduced many technological
tools to improve banks’ overall operational efficiency.
Concentration (C3) has a negative impact on banks’ profitability (ROA). A high C3
implies that the assets share of the largest three banks, (Arab Bank, the housing bank for trade
and finance, Jordan Ahli Bank) is large relative to all other Jordanian commercial banks. A
slight improvement is also observed, over a period of 10 years, wherein the concentration
ratio decreased from 60 percent to 53.9 percent in 2015. The analysis provides robust
evidence about the negative impact of concentration on the Jordanian bank profitability by
measuring concentration using assets, loans and deposits.
Regarding the macroeconomic indicators and similar to the competition models, GDP
growth influences banks’ profitability. This result is in line with (Samhan and Al-Khitab,
2015) and suggests that Jordanian banks operate better and earn more profits during good
economic conditions. One reason is that during boom periods (2005, 2006, and 2007) the loan
loss provisions will be low, which improves the quality of banks’ assets and reduce the
chances of default risks. The relationship between inflation and profitability depends on
whether inflation expectations are fully anticipated or not. Inflation has a modest negative
impact on only one of the profitability indicators (Q), reflecting the inability of banks to

117
accurately predict the levels of inflation. Accordingly, banks lose the opportunity to benefit
from the inflationary environment to stimulate profits.
Table 4. 14Empirical Results of Pooled OLS of the Impact of Liquidity Risk on the Jordanian
Commercial Banks Profitability (2003-2015), CO3 measured by Total Assets.
(ROA) (ROE) (Tobin) (EVA)
VARIABLES Pooled OLS Pooled OLS Pooled OLS Pooled OLS
SIZE -0.214** -2.264*** 0.0113 -1.711***
(0.084) (0.729) (0.015) (0.564)
TIER1 -0.0197** -0.197** 0.00146 -0.141**
(0.0092) (0.0796) (0.0016) (0.0616)
LTD 0.00273 0.0537** 0.0011** 0.0037
(0.0025) (0.0223) (0.0004) (0.0172)
ETA 0.0396** -0.542*** -0.0008 0.0858
(0.0171) (0.147) (0.0030) (0.114)
NIM 0.188*** 0.801 0.0022 0.535
(0.0574) (0.494) (0.0102) (0.382)
COF -0.113*** -0.765** -0.0193** -0.971***
(0.0407) (0.350) (0.0075) (0.271)
CTI -0.0233*** -0.195*** -0.0009** -0.0479***
(0.0021) (0.0184) (0.0003) (0.0142)
CO3 0.0035 0.0852 0.0045* 0.0324
(0.0154) (0.133) (0.0027) (0.103)
GDP 0.0682*** 0.240 0.0295*** -0.206
(0.0224) (0.192) (0.00397) (0.149)
INF 0.0002 0.0362 -0.0031 0.0066
(0.0109) (0.0936) (0.0019) (0.0725)
Constant 3.586** 42.62*** 0.556** 21.46**
(1.468) (12.62) (0.262) (9.775)
Observations 154 154 153 154
R-squared 0.654 0.621 0.611 0.270
F 0.0000 0.0000 0.0000 0.0000
Number of banks 13 13 13 13
Where the dependent variables are: ROA and ROE is the profitability measurement, Tobin is the Tobin’s Q
ratio, EVA is the Economic Value Added. The independent variables are: SIZE is the Bank size, TIER1 is the
Capital Adequacy ratio-TIER 1, LTD is the Liquidity Risk, ETA is the Capitalization, NIM is the Net interest
margin ratio, CTI is the Cost to income ratio, COF is the Cost of fund ratio, CO (3), is the Concentration, GDP
is the GDP rate, INF is the inflation rate Note: Standard errors in parentheses, *** p<0.01, ** p<0.05, * p<0.1

118
Table 4. 15Empirical Results of Fixed and Random Effect Model of the Impact of Liquidity Risk on the
Jordanian Commercial Banks Profitability (2003-2015). CO3 measured by Total Assets
(ROA) (ROE) (Tobin) (EVA)
VARIABLES FE RE FE RE
Size -1.3979*** -2.264*** -.1872*** -.8728
(.4222) (.7288) (.0611) (1.135)
TIER1 -.0006 -.1966*** -.0027 -.0335
(.0146) (.0795) (.0021) (.0774)
LTD .0037 .0537*** .0011*** .0123
(.0033) (.0222) (.0004) (.0187)
ETA .0130 -.5416*** -.0041 .0637
(.022) (.1469) (.0032) (.1186)
NIM .0751 .8005* -.0006 -.3479
(.1038) (.4937) (.0150) (.5237)
COF -.0999** -.7647*** -.0058 -1.277***
(.0465) (.3500) (.0069) (.2592)
CTI -.0223*** -.1954*** -.0011*** -.0424***
(.0024) (.0183) (.0003) (.0136)
CO3 -.0545*** .0851 -.0032 -.0244
(.0222) (.1326) (.0032) (.1009)
GDP .0469** .2395 .0261*** -.1680
(.0247) (.1923) (.0035) (.1346)
INF .0048 .0362 -.0030** .0509
(.0108) (.0935) (.0015) (.0639)
Observations 154 154 153 154
R-squared
(Overall)
0.280 0.621 0.221 0.197
F 0.0000 0.0000 0.0000 0.0000
Number of banks 13 13 13 13
Where the dependent variables are: ROA and ROE is the profitability measurement, Tobin is the Tobin’s Q
ratio, EVA is the Economic Value Added. The independent variables are: SIZE is the Bank size, TIER1 is the
Capital Adequacy ratio-TIER 1, LTD is the Liquidity Risk, ETA is the Capitalization, NIM is the Net interest
margin ratio, CTI is the Cost to income ratio, COF is the Cost of fund ratio, CO (3), is the Concentration, GDP
is the GDP rate, INF is the inflation rate Note: Standard errors in parentheses, *** p<0.01, ** p<0.05, * p<0.1

119
Table 4. 16Empirical Results of Pooled OLS for the Impact of Liquidity Risk on the Jordanian
Commercial Banks Profitability (2003-2015), CO3 measured by Total Loans.
(ROA) (ROE) (Tobin) (EVA)
VARIABLES Pooled OLS Pooled OLS Pooled OLS Pooled OLS
SIZE -0.214** -2.335*** 0.00740 -1.794***
(0.0830) (0.715) (0.0148) (0.552)
TIER1 -0.0203** -0.195** 0.00154 -0.130**
(0.00924) (0.0796) (0.00164) (0.0614)
LTD 0.00282 0.0561** 0.00126*** 0.00477
(0.00255) (0.0219) (0.000452) (0.0169)
ETA 0.0404** -0.545*** -0.000968 0.0691
(0.0170) (0.147) (0.00302) (0.113)
NIM 0.186*** 0.748 -0.000687 0.526
(0.0567) (0.489) (0.0101) (0.377)
COF -0.118*** -0.837** -0.0235*** -0.980***
(0.0391) (0.337) (0.00730) (0.260)
CTI -0.0236*** -0.194*** -0.000875** -0.0420***
(0.00210) (0.0181) (0.000374) (0.0140)
CO3 -1.043* -6.167* 0.355 -9.680
(1.491) (12.85) (0.265) (9.913)
GDP 0.0596** 0.252 0.0298*** -0.0608
(0.0239) (0.206) (0.00428) (0.159)
INF -0.000501 0.0312 -0.00339* 0.0126
(0.0109) (0.0940) (0.00196) (0.0725)
Constant 3.124** 44.64*** 0.648*** 30.62***
(1.386) (11.94) (0.247) (9.215)
Observations 154 154 154 154
R-squared 0.655 0.621 0.608 0.274
F 0.0000 0.0000 0.0000 0.0000
Number of banks 13 13 13 13
Where the dependent variables are: ROA and ROE is the profitability measurement, Tobin is the Tobin’s Q
ratio, EVA is the Economic Value Added. The independent variables are: SIZE is the Bank size, TIER1 is the
Capital Adequacy ratio-TIER 1, LTD is the Liquidity Risk, ETA is the Capitalization, NIM is the Net interest
margin ratio, CTI is the Cost to income ratio, COF is the Cost of fund ratio, CO (3), is the Concentration, GDP
is the GDP rate, INF is the inflation rate Note: Standard errors in parentheses, *** p<0.01, ** p<0.05, * p<0.1

120
Table 4. 17Empirical Results of Fixed and Random Effect Model for the Impact of Liquidity Risk on the
Jordanian Commercial Banks Profitability (2003-2015). CO3 measured by Total Loans
(ROA) (ROE) (Tobin) (EVA)
VARIABLES RE FE FE RE
Size -0.214*** -11.91*** -0.239*** -1.502
(0.0830) (3.885) (0.0664) (1.094)
TIER1 -0.0203** 0.0127 -0.00243 -0.0170
(0.00924) (0.122) (0.00208) (0.0761)
LTD 0.00282 0.0392 0.000958* 0.0109
(0.00255) (0.0288) (0.000492) (0.0184)
ETA 0.0404** -0.737*** -0.00483 0.0344
(0.0170) (0.185) (0.00316) (0.116)
NIM 0.186*** 0.0919 -0.00124 -0.346
(0.0567) (0.867) (0.0148) (0.513)
COF -0.118*** -0.188 0.00193 -1.191***
(0.0391) (0.451) (0.00801) (0.253)
CTI -0.0236*** -0.187*** -0.00114*** -0.0371***
(0.00210) (0.0199) (0.000343) (0.0133)
CO3 1.043 -42.08** -0.647* -16.69*
(1.491) (20.05) (0.344) (9.660)
GDP 0.0596** 0.140 0.0270*** -0.0394
(0.0239) (0.209) (0.00360) (0.140)
INF -0.000501 0.0927 -0.00256 0.0641
(0.0109) (0.0928) (0.00160) (0.0639)
Observations 154 154 153 154
R-squared
(Overall)
0.964 0.095 0.107 0.080
F 0.0000 0.0000 0.0000 0.0000
Number of banks 13 13 13 13
Where the dependent variables are: ROA and ROE is the profitability measurement, Tobin is the Tobin’s Q
ratio, EVA is the Economic Value Added. The independent variables are: SIZE is the Bank size, TIER1 is the
Capital Adequacy ratio-TIER 1, LTD is the Liquidity Risk, ETA is the Capitalization, NIM is the Net interest
margin ratio, CTI is the Cost to income ratio, COF is the Cost of fund ratio, CO (3), is the Concentration, GDP
is the GDP rate, INF is the inflation rate Note: Standard errors in parentheses, *** p<0.01, ** p<0.05, * p<0.1

121
Table 4. 18Empirical Results of Pooled OLS for the Impact of Liquidity Risk on the Jordanian
Commercial Banks Profitability (2003-2015) , CO3 measured by Total Deposits.
(ROA) (ROE) (Tobin) (EVA)
VARIABLES Pooled OLS Pooled OLS Pooled OLS Pooled OLS
SIZE -0.178** -2.004*** 0.0165 -1.613***
(0.0848) (0.730) (0.0150) (0.570)
TIER1 -0.0217** -0.210*** 0.00125 -0.146**
(0.00914) (0.0787) (0.00161) (0.0614)
LTD 0.00196 0.0486** 0.00105** 0.00180
(0.00256) (0.0221) (0.000451) (0.0172)
ETA 0.0430** -0.519*** -0.000431 0.0943
(0.0169) (0.145) (0.00297) (0.114)
NIM 0.207*** 0.932* 0.00501 0.585
(0.0572) (0.492) (0.0101) (0.384)
COF -0.0908** -0.607* -0.0162** -0.912***
(0.0409) (0.352) (0.00755) (0.275)
CTI -0.0246*** -0.204*** -0.00110*** -0.0512***
(0.00213) (0.0183) (0.000376) (0.0143)
CO3 -3.043* -26.59* 0.780*** -10.03
(1.640) (14.11) (0.288) (11.02)
GDP 0.0382 0.0300 0.0254*** -0.285*
(0.0243) (0.209) (0.00429) (0.163)
INF -0.00144 0.0211 -0.00362* 0.000907
(0.0108) (0.0929) (0.00192) (0.0725)
Constant 1.307 26.70* 0.239 15.47
(1.644) (14.15) (0.291) (11.05)
Observations 154 154 153 154
R-squared 0.662 0.629 0.623 0.274
F 0.0000 0.0000 0.0000 0.0000
Number of banks 13 13 13 13
Where the dependent variables are: ROA and ROE is the profitability measurement, Tobin is the Tobin’s Q
ratio, EVA is the Economic Value Added. The independent variables are: SIZE is the Bank size, TIER1 is the
Capital Adequacy ratio-TIER 1, LTD is the Liquidity Risk, ETA is the Capitalization, NIM is the Net interest
margin ratio, CTI is the Cost to income ratio, COF is the Cost of fund ratio, CO (3), is the Concentration, GDP
is the GDP rate, INF is the inflation rate Note: Standard errors in parentheses, *** p<0.01, ** p<0.05, * p<0.1

122
Table 4. 19Empirical Results of Fixed and Random Effect Model for the Impact of Liquidity Risk on the
Jordanian Commercial Banks Profitability (2003-2015). CO3 measured by Total Deposits
(ROA) (ROE) (Tobin) (EVA)
VARIABLES RE FE FE RE
Size -0.178** -4.967 -0.142* -0.488
(0.0848) (4.723) (0.0806) (1.206)
TIER1 -0.0217** -0.0542 -0.00334 -0.0429
(0.00914) (0.127) (0.00217) (0.0778)
LTD 0.00196 0.0506* 0.00113** 0.0111
(0.00256) (0.0287) (0.000491) (0.0187)
ETA 0.0430** -0.600*** -0.00298 0.0830
(0.0169) (0.202) (0.00344) (0.119)
NIM 0.207*** 0.274 0.00113 -0.312
(0.0572) (0.899) (0.0153) (0.529)
COF -0.0908** -0.661* -0.00566 -1.235***
(0.0409) (0.397) (0.00702) (0.263)
CTI -0.0246*** -0.188*** -0.00116*** -0.0455***
(0.00213) (0.0205) (0.000351) (0.0138)
CO3 -3.043* -4.960 0.00746 -4.774*
(1.640) (26.92) (0.459) (11.45)
GDP 0.0382 0.0392 0.0256*** -0.225
(0.0243) (0.216) (0.00369) (0.146)
INF -0.00144 0.0488 -0.00313* 0.0468
(0.0108) (0.0959) (0.00166) (0.0645)
Observations 154 154 153 154
R-squared
(Overall)
0.972 0.542 0.716 0.061
F 0.0000 0.0000 0.0000 0.0000
Number of banks 13 13 13 13
Where the dependent variables are: ROA and ROE is the profitability measurement, Tobin is the Tobin’s Q
ratio, EVA is the Economic Value Added. The independent variables are: SIZE is the Bank size, TIER1 is the
Capital Adequacy ratio-TIER 1, LTD is the Liquidity Risk, ETA is the Capitalization, NIM is the Net interest
margin ratio, CTI is the Cost to income ratio, COF is the Cost of fund ratio, CO (3), is the Concentration, GDP
is the GDP rate, INF is the inflation rate Note: Standard errors in parentheses, *** p<0.01, ** p<0.05, * p<0.1

123
4.4.3 Interest rate results
The estimations result of the interest rate and risk-taking models appear in Tables 4.20 - 4.222.
The models are estimated using Pooled OLS and GMM methods. This section empirically
investigates the impact of bank-specific, interest rate environment, and macroeconomic factors
on bank profitability and risk-taking.
Unlike the competition and liquidity risk models, size has a positive and significant
impact on the profit and ROE (Table 4.20 and 4.21). The result suggests that larger banks are
more profitable mainly due to economies of scale (Khan et al., 2017). However, the results also
show that size reduces some profitability indicators such as ROA and profit margin, which can
be explained by the adverse effects of the bureaucratic and routine procedures on banks'
performance and profit. There is also non-robust evidence of the impact of size on the TCR
and PCL risk measures. The statistics for Size shown in Table 4.20 suggests that this variable
reduces risk and that larger banks are more able to mitigate potential credit risks relative to
smaller banks.
Capitalization has a significant and positive impact on all profitability measures. (Al-
Smadi et al., 1970) found a similar relationship between bank capital and profitability of
Jordanian banks Higher bank capitalization is reflected in a better ability to manage assets
and generate profits (Demirgüç-Kunt and Huizinga, 1999). The CBJ efforts during the period
represented by the data contributed to the improvement in stability and soundness of the
monetary and financial systems, resulting in an increase in the capital ratio of the commercial
banks. The high level of capital is also a good indicator of the ability of banks to hedge against
risks. On the other side, capitalization increases both risk and credit measures, as large banks
have a big loan portfolio that translates into higher levels of provision. Tables 4.20 and 4.21
shows that diversification adversely affect the banks’ profitability measures similar to the
competition results. Jordanian commercial banks that relied heavily on non-interest income
(higher diversification) tend to be less profitable. A similar result was confirmed by
(Demirgüç-Kunt and Huizinga, 1999) in their study of 80 countries Non-interest income in
banks is generated via fees and commissions income or trading activities. The risk measures
– total capital ratio and credit risk have negative and statically significant associations with
the profitability measures. In line with (Bikker and Hu, 2002) and (Bolt et al., 2012) higher
credit risk exposure via loans is associated with lower profit margins.
The statistics suggests that short-term interest rate has no significant impact on

124
profitability and risk measures (Table 4.20, 4.21and 4.22). The result could be explained by
the fact that the CBJ adopted low-interest-rate schemes during the reform phases, adversely
affecting the banks’ lending behavior and the volume of their interest yields. As a result,
Jordanian banks started to use a wide range of products and services to improve banks’
profitability and become less reliant on interest income. Table 4.21 also shows that lending
had a positive influence on two profitability measures (NIM and Profit). A similar result was
found by (Dietrich and Wanzenried, 2011). As the relative size of lending increases, banks
become better able at boosting their revenue from the interest income.
GDP has a significant negative impact on profitability measures as shown in Table 4.21,
contrary to the results of model reported in Table 4.25. One explanation for this could be that
high economic growth aligned with the CBJ reforms improved the business environment,
lowered bank entry barriers, and enhanced the competitiveness of banks. The subsequent
increased competition could also have dampened banks’ overall profitability as (Tan and
Floros, 2012) found in their study a negative relationship between bank competition and
profitability. The results in Table 4.26 show that Inflation reduces profitability measures
(ROA, ROE, and Profit Margin). The negative profitability effect of inflation reflects the
inability of Jordanian banks to anticipate inflation and so benefit from the inflationary
environment to enhance bank profits.

125
Table 4. 20Empirical Results of the Pooled OLS for the impact of interest rate on Jordanian Commercial
Banks Profitability and Risk-taking taking (2003- 2015).
Where the dependent variables are: NIM is the Net Interest Margin, ROA and the ROE measured the
profitability, Profit is the Total Profit, PM: is the Profit Margin, TCR is the Total Capital Ratio, PCL is the
Credit Risk. The independent variables are: SIZE is the Bank size, CAP is the Capitalization, DIV is the
Diversification, LEN is the Lending, GDP is the Real GDP Growth, INF is the Inflation rate, SHTI is the Short-
term interest rate. Note: Standard errors in parentheses, *** p<0.01, ** p<0.05, * p<0.1
(NIM) (ROA) (ROE) (Profit) (PM) (TCR) (PCL)
VARIABLES Pooled OLS Pooled OLS Pooled OLS Pooled OLS Pooled OLS Pooled OLS Pooled OLS
SIZE .1449* -.1048 1.744**- 1.277*** -.1014 -1.069 ** -.7603***
(.0886) (0.0943) (.8210) (.0508) (.1232) (.4476) (.2761)
CAP -.0221 .0798** -.2226 .0364* .0917* 1.206*** .3703***
(.0351) (0.0374) (.3257) (.0201) (.0488) (.1204) (0 .1066)
DIV -.0405*** -.0428*** -.2756*** -.0184*** -.0648*** -.1676*** -.0403
(.0109) (.0116) (.1013) (.0062) (.0152) (.0539) (0 .0354)
lEN .0178* -.0083 -.0132 .0104* -.0090 -.2284*** -.2136***
(.0102) (.0109) (.0952) (.0059) (.0142) (.0469) (0 .0228)
PCL -.0071 -.0922** -.9101*** -.0112 -.1146** -.6401***
(.0353) (0.0375) (.3271) (.0202) (0 .0490) (.1696)
TCR .0026 -.0439* -.3697* -.0255** -.0507* -.2492***
(.0220) (.0234) (.2041) (.0126) (0. .0306) (0.0660)
INF .0387 -.0065 0.0156 .0036 -.0076 .1595 .0944
(.0218) (0 .0232) (.2026) (.0098) (0.0304) (.1595) (0.0706)
GDP -.0403 0.0717 .5358 .0387* .098* .2875 -.1072
(.0416) (0.0442) (.3853) (.0238) (0.0578) (.2154) (0 .1354)
SHTI -.0410 -0.5719 -2.596 -.0814 -.7712 -2.738 -2.029*
(.3690) (0.3925) (3.416) (.2116) (0 .5126) (1.906) (1.182)
SHTI2 .0021 0.0750* .3231 .0028 .1010 .2252 .1797
(.0388) (0.0413) (.3597) (.0222) (0.0539) (.2018) (0.1252)
Number of
Obs
85 85 85 85 85 85 85

126
Table 4. 21Empirical Static Results of Instrumental Variable Estimation of the impact of interest rate on
Jordanian Commercial banks Profitability and Risk-taking (2003 -2015).
Where the dependent variables are: NIM is the Net Interest Margin, ROA and the ROE measured the
profitability, Profit is the Total Profit, PM: is the Profit Margin, TCR is the Total Capital Ratio, PCL is the
Credit Risk. The independent variables are: SIZE is the Bank size, CAP is the Capitalization, DIV is the
Diversification, LEN is the Lending, GDP is the Real GDP Growth, INF is the Inflation rate, SHTI is the Short-
term interest rate. Note: Standard errors in parentheses, *** p<0.01, ** p<0.05, * p<0.1
(NIM) (ROA) (ROE) (Profit) (PM) (TCR) (PCL)
VARIABLES GMM GMM GMM GMM GMM GMM GMM
SIZE -0.1755 -0.1048 -3.164 1.277*** -0.7682 -.6659 0.3663
(0.2215) (0.0943) (5.720) (0.0474) (1.0426) (.8961) (1.249)
CAP 0.1343*** 0.0798** -.1693 0.0364* 0.1326** .8632*** 0.1563
(0.0401) (0.0374) (0.5119) (0.0188) (0.0505) (0.2544) (0.1432)
DIV -0.0028 -0.0428*** -0.2726 -0.0184*** -0.0399 0.0680 -0.1048
(0.0102) (0.0116) (0.2146) (0.0058) (0.0300) (0.0460) (0.0635)
lEN 0.0169* -0.0083*** -0.3452 0.0104* -0.0417 -0.0945 -0.2842***
(0.0089) (0.0109) (0.2624) (0.0055) (0.0368) (0.0717) (0.0266)
PCL 0.0305 -0.0922** -1.648** -0.0112 -0.1666 -0.1857
(0.0355) (0.0375) (0.7413) (0.0189) (0.1124) (0.2772)
TCR -0.0280 -0.0439 -0.1684 -0.0255** -0.0459 -0.0786
(0.0241) (0.0234) * (0.2268) (0.0118) (0.0322) (0.0889)
INF 0.0239** -0.0065** .0442 .0035 -0.0172 0.0409 0.0917
(0.0105) (0.0232) (0.1582) (0.0117) (0.00248) (0.0883) (0.0544)
GDP -0.0342 0.0717 -.1444 .0387* -0.0491 0.2825 -0.2092
(0.0361) (0.0442) (5064) (0.0222) (0.1109) (0.2451) (0.1703)
SHTI 0.0558 -0.5719 0.3882 -.0814 -0.0807 -2.966 -0.0625
(0.2156) (0.3925) (3.459) (0.1975) (0.6773) (2.004) (0.5683)
SHTI2 -0.0083 0.0750* 0.1688 .0028 0.0372 0.3080 -0.0262
(0.0216) (0.0413) (0.3404) (0.0208) (0.0612) (0.1939) (0.0455)
Number of
Obs

127
Table 4. 22Empirical Dynamic Results of GMM Estimation of the impact of interest rate on Jordanian
Commercial banks Profitability and Risk-taking (2003 -2015).
(NIM) (ROA) (ROE) (Profit) (PM) (TCR) (PCL)
VARIABLES GMM GMM GMM GMM GMM GMM GMM
L.NIM -0.124
(0.264)
SIZE -1.507** -2.277* -6.154 0.302 -2.901** 1.079 -1.521
(0.562) (1.122) (10.98) (0.366) (1.222) (3.502) (2.328)
CAP 0.0623* 0.238*** 1.068** 0.0120 0.279*** 1.206*** 0.329**
(0.0325) (0.0519) (0.428) (0.0284) (0.0563) (0.268) (0.119)
DIV -0.0137 0.0598** 0.159 0.0045 0.0689** 0.0446 -0.110**
(0.0100) (0.0253) (0.265) (0.00490) (0.0314) (0.106) (0.0389)
LEN 0.0086 -0.0405 -0.483 0.0062 -0.0482 -0.187 -0.304***
(0.0167) (0.0364) (0.365) (0.0142) (0.0400) (0.147) (0.0205)
PCL 0.0320 -0.126 -1.718 0.0134 -0.141 -0.560
(0.0534) (0.116) (1.101) (0.0410) (0.127) (0.436)
TCR -0.0097 -0.0515* -0.372 -0.0001 -0.0545 -0.191**
(0.0157) (0.0271) (0.241) (0.0152) (0.0309) (0.0853)
INF 0.182** -0.197* -2.611** -0.0277 -0.267** 0.473 0.387
(0.0607) (0.0929) (0.994) (0.0660) (0.114) (0.397) (0.260)
GDP 0.199 -0.482** -5.347*** -0.126 -0.639** 1.058 0.576
(0.116) (0.189) (1.765) (0.109) (0.244) (0.726) (0.445)
SHTI 0.140 -0.430* -1.302 0.226 -0.693* -1.779 0.793
(0.214) (0.230) (3.220) (0.133) (0.360) (1.487) (0.567)
SHTI2 -0.0021 0.0948*** 0.249 -0.0195 0.140*** 0.149 -0.0924
(0.0230) (0.0281) (0.431) (0.0163) (0.0412) (0.169) (0.0700)
L.ROA -0.361***
(0.0526)
L.ROE -0.131
(0.116)
L.PROFIT 0.146
(0.187)
L.PM -0.311***
(0.0650)
L.TCR -0.0182
(0.145)

128
L.PCL -0.0611
(0.0625)
Observations 49 49 49 49 49 44 47
Number of bank 13 13 13 13 13 11 12
Where the dependent variables are: NIM is the Net Interest Margin, ROA and the ROE measured the
profitability, Profit is the Total Profit, PM: is the Profit Margin, TCR is the Total Capital Ratio, PCL is the
Credit Risk. The independent variables are: SIZE is the Bank size, CAP is the Capitalization, DIV is the
Diversification, LEN is the Lending, GDP is the Real GDP Growth, INF is the Inflation rate, SHTI is the Short-
term interest rate. Note: Standard errors in parentheses, *** p<0.01, ** p<0.05, * p<0.1
4.5 Summary and conclusion
This chapter investigate the impact of competition, liquidity risk and market interest rate
environment on the profitability of Jordanian banks’ using data for 13 commercial banks for
the period 2003-2015. The chapter attempts to answer the following four questions: (1) do
competitive conditions affect the profitability of Jordanian banks? (2) does liquidity risk
affect the profitability of Jordanian banks? (3) do interest rates affect the profitability of the
Jordanian banks? And (4) which market type monopoly, monopolistic competition or perfect
competition, best represents the Jordanian banking sector?
The analysis employed several econometric approaches to address the study questions
and to ensure the robustness of the results. These methods include Pooled OLS, FE, RE, and
GMM. We start our analysis by developing a Panzar-Rosse model for assessing the state of
competition in the Jordanian banking sector (research question four). The results found that
Jordanian commercial banks operate under monopolistic competition conditions. However,
from 2004 onwards the concentration of the banking sector reduced slightly due to the entry
of six new banks in 2004 and 2009 (Bank Audi, National Bank of Kuwait, Blom Bank, Jordan
Dubai Islamic Bank, National Bank of Abu Dhabi and Al Rajhi Bank).
This chapter fills a gap in the empirical literature about the Jordanian banking sector by
investigating the impact of competition, risk and interest rate on Jordanian commercial banks
profitability. For assessing the reform policies implemented since the 1990s that were
designed to improve banking sector profitability, competition, and stability, the second and
third parts of the empirical analysis investigate the impact of competition, liquidity risk and
the interest rate on a set of profitability and risk measures (How, and in what ways have the
competitive conditions in affected the profitability of Jordanian banks?, Does liquidity risk

129
have an effect on the profitability of Jordanian banks?, To what extent have changes in
interest rates affected the profitability of Jordanian banks?) utilizing a broad list of control
variables that capture bank-specific, market structure and macroeconomic characteristics.
Liquidity risk was found to have a significant positive impact on profitability, while bank’s
size, capital adequacy ratio, and equity to assets all reduced profitability measures. Interest
yield is the main source of income for Jordanian banks and this corresponds to the positive
relationship between net interest margin and profitability measures. The cost of funds and
market concentration both have a significant negative impact on profitability measures. The
negative effects of inflation on profitability reflect the inability of the banks to fully anticipate
inflation and enhance their profits. Capitalization and size are the main risk determinants,
wherein the former reduces risk while the latter encourages the risk-taking behaviour of the
banks. The results support the favourable spillovers of the reform policies on the overall
profitability and efficiency of the Jordanian banking sector which is clearly shown by the
increasing number of banks which improving the competitiveness and it impacts on the bank
performance, minimizing the concentration, decreasing the interest rate which encouraging
lending that affecting investment activities positively. However, there is still a need to
enhance market competition. The result also suggests that higher total banks’ assets may not
necessarily lead to higher profits. Careful management is required for the larger number of
deposits and the acquired capital by Jordanian banks due to the inward migration of Iraqi and
Syrian refugees to Jordan.
The positive change in the competitiveness state of the Jordanian banking sector
corresponds to the entry of six new banks. The reported results are similar to the findings of
(Demirguc-Kunt and Peria, 2010) who found a positive impact of competition on bank
profitability. Our results confirm our hypothesis wherein liquidity risk has a significant
positive impact. Our results are in line with (Bourke, 1989) who found evidence of a positive
relationship between liquidity risk and bank profitability for 90 banks. The results suggest
that short-term interest rate has no significant impact on profitability and risk measures. The
result could be explained by the fact that the CBJ adopted low-interest-rate schemes during
the reform phases, adversely affecting the banks’ lending behavior and the volume of their
interest yields. As a result, Jordanian banks started to use a wide range of products and
services to improve banks’ profitability and become less reliant on interest income. Interest
yield is the main source of income for Jordanian banks and this corresponds to the positive
relationship between net interest margin and profitability measures in line with (Bikker and

130
Hu, 2002).

131
CHAPTER 5
The Relationship between Bank Efficiency, Capital and
Risk: Evidence from Jordan’s Banking System
5.1 Introduction
The Jordanian economy is one of the smallest in the Middle East region, yet possessing one of
the most developed and stable banking systems in the region. The Jordanian financial system
may be described as bank-based financial system in which banks play a vital role in financial
intermediation, transformation of savings into investments, allocation of scarce capital
resources, risk sharing and risk diversification. Over time, the central bank of Jordan (CBJ) has
initiated many reform measures that have been primarily focused on making the banking
system more stable and competitive. As a direct consequence, banks in Jordan had no other
option than to increase their capitalization which culminated in the growth of related banking
activities and increased asset growth demand which, in turn, demanded more bank specific
capital. Many studies in the literature have argued that growing competition only serves to
force banks to engage in more risky activities in order to position themselves at the ahead of
the market (Hellmann et al., 2000, Salas and Saurina 2003, and Goddard and Wilson 2009).
While it has also been argued that capital adequacy requirements, despite its advantage, creates
conditions whereby banks are induced to undertake more risk-taking behavior. In light of these
issues, the purpose of this chapter is to examine whether there exists any relationship between
bank efficiency/productivity, capital, and risk in the Jordanian banking system. The empirical
analysis is based on the Three-Stage Least Square (3SLS) method which we use to estimate a
system of equations that employ different risk indicators for a sample of 13 banks covering the
period 2003-2015. In so doing, this chapter seeks to answer three main related questions. First,
whether efficiency, production, and capital are affected by variation in banks’ risk? Second,
whether efficiency, productivity, and risk are affected by variations in bank capital? Third,
whether capital levels combined with bank risk cause changes in bank efficiency and/or
production? The importance of this study lies in evaluating the policy measures that have been
enforced by the Central Bank of Jordan (CBJ) to liberalize the banking sector in the banks

132
attempts to improve bank efficiency1 and, on the basis of the issues will be examined, fills an
important gap in the literature on banking efficiency in developing countries by using the
Jordanian data. In the literature, only a few studies have looked at the efficiency of the banking
sector in developing countries using Middle East region data (Olson and Zoubi, 2003);
(Hussain and Hassan, 2005); (Caporale et al., 2017). The majority of studies have shown a
preference to investigate these dynamic relations using data for a selection of developed
countries using various approaches. Examples include (Rime, 2001), (Konishi and Yasuda,
2004), (Stolz et al., 2004), and (Tan and Floros, 2013). Thus, the present study is an important
addition to the existing body of studies reported in the literature since 2000. The rest of the
chapter is organized as follows: Section 5.2 provides a brief review of the literature. Section
5.3 presents a historical overview of the impact of regulatory measures on the risk analysis of
the Jordanian banking system. Section 5.4 presents the data and methodology. Section 5.5
presents the empirical results, and Section 5.6 provides the summary and conclusion.
5.2 Literature review
Since the 2008 financial crisis, more focus has been directed towards analyzing and improving
the financial soundness of banking systems. The principal task of bank regulators has been on
ensuring that banks are compliant with capital adequacy requirements. Capital adequacy
measures the ratio of a bank’s capital to bank risk-weighted credit exposures. This ratio reflects
the level of capital buffer at the bank that can support lending policies and mitigate potential
losses. Creating a sound balance between bank capital and risk has become one of the main
objectives of banks globally post the 2008 financial crisis. This was given added emphasis by
the Basel III requirements, which concentrated the minds of banks to maintain the quality of
bank capital base and increase the capital requirements of bank risk-weighted assets.
In our review of the literature in Chapter five, several hypotheses were developed to
1 CBJ has applied several reforms to enhance the banking sector, such as the new banking,
securities, and auditing profession law. As a result, total deposits and credit facilities of licensed
banks has increased, contributing to the growth of commercial banks in Jordan. the CBJ has also
increased loan guarantees for small and medium and entrepreneurs through the restructuring of
the Jordan Loan Guarantee Corporation, and has increased funds available to them through the
provision of CBJ funding programmes in certain industries primarily in technology, media,
telecommunications and the service sector, with other ventures in agribusiness, pharmaceuticals,
water and green energy.

133
explain the relationship between bank risk, capital, and efficiency including the “bad
management” hypothesis as stated by (Berger and DeYoung, 1997) and (Williams, 2004).
According to their view, in-adequate monitoring and managing of credit and operations
adversely affect efficiency and thus increase banks’ risk. The second theory is the “bad luck”
hypothesis. External exogenous shocks increase loan-related problems and do not directly
affect operations’ management and/or the bank risk-taking behavior (Berger and DeYoung,
1997). However, risk increases do require additional managerial efforts and costs. And so, we
would expect bank efficiency to have a negative relationship with risk. The third theory is the
“moral hazard” hypothesis, which suggests that managers of less-capitalized and low-efficient
banks tend to engage in riskier investment decisions than usual (Jeitschko and Jeung, 2005).
Based on this theory, we expect a negative relationship between bank risk and capital. The
theory of capital structure states that a higher use of debt (equity) financing within a certain
range, might actually reduce (increase) firms' cost of capital. Thus, a positive (negative)
coefficient estimate for equity-to-assets indicates an efficient (inefficient) management of
banks’ capital structure. Besides, efficiency and competition between banks can influence the
stability of the sector (Carletti and Hartmann, 2002). The link between competition and
financial stability has been recognized in theoretical and empirical research. Indeed,
competition affects the stability of the sector in the sense of either fragility or excessive risk-
taking (Geraldine and Weill (2008). Balanced portfolio theory also plays a vital role in the
study of the performance of the banks. (Nzongang and Atemnkeng,2006). This theory states
that decisions regarding the policy affect the optimal presence of each asset in the investment
of shareholder which affected by factors such as rate of return, size of the portfolio and risks
associated with the holding of each asset. High profits can be achieved by a possible set of
liabilities and assets which are recognized by management and expenses incurred by banks.
Bank performance affected by risk-return trade-off and the equity to asset ratio. According to
financing theory, high levels of debt and low value of equity to asset ratio results in high risk
which results in high rates of return which also explains the risk-return trade-off theory (Van
Ommeren, 2011). Some studies explained that higher profits can be fetched by high equity to
asset ratio. The market value of the bank increases with high equity ratio according to the
signalling hypothesis (Berger, 1995). On the other hand, bankruptcy cost hypothesis states that
banks hold high equity as a result of unexpectedly high bankruptcy costs to avoid financial debt
(Berger, 1995).
Many empirical studies have investigated the effects of regulation on banks’ efficiency,

134
capital, and risk. In these respects, (Kwan et al., 1997) found that operational efficiency is
affected by bank risk-taking behavior and they argued that banks with more capital operate
more efficiently than banks with less capital. Several studies found that the incorrect design of
capital requirements leads to excessive risk-taking behavior by banks (Yehuda and Kahane,
1977, Kim and Santomero, 1988, and Koehn and Santomero, 1980). While (Shrieves and Dahl,
1992) and (Jacques and Nigro, 1997) found that having the desired balance between level of
capital and risk depends on exogenous factors such as regulation, level of liquid assets,
economic cycle, size, and profitability. In addition, (Shrieves and Dahl, 1992), (Jacques and
Nigro, 1997), and (Matejašák et al., 2009) all share the view that when the regulatory pressure
increase, banks tend to adjust their capital ratio by increasing capital and decreasing their risk.
However, (Stolz et al., 2004) and (Van Roy, 2005) have argued that regulatory pressures tend
to increase banks’ risk-taking behavior. In contrast, (Rob et al., 1999), (Godlewski, 2004),
(Iwatsubo, 2007), and (Distinguin et al., 2013) note that changes in bank's capital and risk
appear to be severely affected by the banks’ ex-ante capital level. (Distinguin et al., 2013) along
with (Hussain and Hassan, 2005) showed that when considering the quality of capital, results
vary according to the banks’ capital ratio, total regulatory capital, Tier-1 capital, or equity.
Using a panel of US commercial banks and BHC data between 1986 and 2008, (Jokipii
and Milne, 2008) found a positive relationship between short term adjustments in banks’ capital
buffers and risk. They also showed that the adjustments of the relationship between capital and
risk depend on the level of bank capitalization. On a related issue, (Eyssell and Arshadi, 1990)
examined the wealth effects of risk-based capital requirement based on daily data for 27 banks
with book asset levels ranging from $3.5billion to $155billion for the period 1986-1988 and
found that at the time of the announcement of new risk-based capital regulations, the equity
values of the largest publicly traded banks decreased, especially in banks with deficient capital
ratios. (Cooper et al. 1991) examined the effects of risk-based capital requirements on the
banking system using weekly data of large international banks in the U.S., U.K, Canada, and
Japan for the period 1985-1989 and found mixed results for equity returns in Japanese banks
due to uncertainty among investors regarding the new risk-adjusted capital rules that were
imposed. But in response to news announcements, a significant decline was observed in the
equity returns of banks in the U.S., Canada, and U.K., with the largest reported decline being
for U.S. bank stocks.
(Ediz et al., 1998) examined the impact of risk-based capital requirements on banks'
risk-taking behavior for a sample of U.K banks over the period 1989-1995. They utilized a

135
dynamic, multivariate panel regression models in which changes in capital ratios depend on
the lagged level of the ratio, in addition to a set of control variables describing the nature of
the banks’ decision-making systems, financial efficiency, and regulatory pressures. They
found that banks met capital requirements by raising new capital rather than by alternating
the loan composition in assets portfolio and that capital regulation could be considered an
effective tool in reinforcing the stability of banks without disrupting banks' choices of
lending. They also note that capital requirements does seem to affect bank behavior in
comparison with the influence of the banks’ own internally generated capital targets.
Using simultaneous equation modeling developed by (Shrieves and Dahl, 1992),
(Rime, 2001) examined the impact of regulatory capital requirements on bank risk-taking
behavior for a sample of Swiss banks for the period 1989-1995. Instead of the multibank
holding company and leverage ratio, the authors developed a composite index of PCAU and
PCAA to represent the regulatory variable. They also used the ratio of capital to total assets
(ROA), and the ratio of capital to risk-weighted assets (RWA). They found that regulatory
pressure had a significant positive impact on the ratio of the bank capital to total assets, but
no significant impact on banks’ risk-taking behavior. They also found a significant positive
relationship between changes in risk and changes in the ratio of capital to total assets is found.
PCAU is also found to have a significant positive impact on RWA but no significant impact
on risk, while PCAA has no significant impact on both RWA and risk. Their results suggest
that banks having lower capital than the minimum regulatory capital requirements take
actions to raise capital adequacy ratio. Their findings also show that regulatory pressure
increases banks’ capital without levying a significant effect on bank risk. For both alternative
measures of capital (capital to risk-weighted assets and capital to total assets), they observed
that bank size has a significant negative impact on capital and has a significant positive impact
on risk.
An Example of empirical evidence from developing countries is found in the work of
(Alkadamani, 2015) who used data covering 46 commercial banks from 4 Middle Eastern
countries during the period 2004-2014 to explore the relationship between capital and risk
decisions. The author found that regulatory pressures increase both banks’ capital and the
banks’ risk-taking behavior and that there was a positive relationship between banks’
profitability and capital. (Hussain and Hassan, 2005) empirically examined the impact of
capital requirements on credit risk-taking using data from 11 developing countries and found
that regulations had no effect on bank capital ratios.

136
Since the 2008 global financial crises, the CBJ has prioritized safety over profitability
inside the Jordanian banking sector with less attention given to studying the impact of bank
adopted safety measures on efficiency and productivity indicators of banks. This chapter takes
up this issue by not only studying the relationships between bank efficiency/productivity,
capital and risk using data for a sample of 13 Jordanian banks covering the period 2003-2015,
on account of these issues, contributes directly to the literature.
5.3 Background on risk analysis, efficiency and bank regulations in Jordan
Jordanian banks have served as agents for the Jordanian government since the 1970s and 1980s.
During these decades, the extensive involvement of the government in the banking sector has
led to serious structural imbalances in the Jordanian banking and financial systems. For
example, the rate of uncollectible loans of Jordanian banks’ portfolios reached 30 percent by
the end of the 1980s. During the 1990s and in response to both the (WB) and IMF economic
adjustment programs, the Jordanian government took steps to liberalize the financial and
banking systems which resulted in measures to minimizing government direct lending, the
removal of interest rates restrictions, promoting bank mergers and acquisitions, reducing
foreign exchanging transaction restrictions, and increasing capital adequacy requirements. As
a result, total deposits and credit facilities of licensed banks increased, reflecting the growth of
commercial banks in Jordan. This led the IMF to note that “by the sheer size of their balance
sheet, commercial banks play the most significant role” in Jordan’s financial sector.
Jordanian banks are also the main funding source for both public and private sectors,
with a capital adequacy ratio of 21 percent, which is well above the prudential requirement of
12 percent. The CBJ’s deregulation of the financial system brought with it deregulated interest
rates and credit allocations, foreign bank entry, and modern supervisory controls (Bdour and
Al-khoury, 2008). At the time, the imposition of these measures was seen as important as they
meant that banking sector regulation, in particular, were broadly consistent with international
norms. These regulations also affected bank payments, government securities transactions,
loans, capital adequacy, risk-based provisioning, internal controls, liquidity management, and
deposit insurance. More recently, CBJ supervision over Jordanian banks has intensified, as a
result of the financial crisis, and has shifted from a risk-based approach to a rule-based
approach. Within this new regulatory environment, banks have become subject to frequent
inspections by the CBJ. And although this would seem to mark a turning point in the history

137
of the Jordanian banking system, only a few studies, such as (Maghyereh, 2008), have
examined the impact of the recent reforms on Jordanian bank efficiency.
5.4 Empirical Approach
5.4.1 Data
This chapter examines the magnitude and direction of the dynamic relationships between bank
efficiency/productivity, capital and risk for 13 Jordanian commercial banks in response to the
imposed capital requirements during the period 2003-2015. Data are sourced from ASE, ABJ,
and CBJ, and the commercial Jordanian bank’s annual reports. Tables 5.1 present variables
definitions and notations.
Table 5 1 Variables’ definitions and sources Variable Notation Measurement Type Source
Dependent Variables
Risk LLPTL
VROA
VROE
Z-score
Loan-loss provision as a fraction to total loans
Standard deviation of ROA
Standard deviation of ROE
Ratio between a bank’s return on assets plus equity capital/total assets
and the standard deviation of the return on assets
Bank-specific Annual Reports
Efficiency TE1,
TE2,
TE3,
TE4
TE5
Technical efficiency
Technological
pure technical efficiency
scale efficiency
productivity
Bank-specific Annual Reports
Capital CAP Book value of capital to total assets Bank-specific Annual Reports
Independent variables
Profitability ROA Return on Assets Bank-specific Annual Reports
Size SIZE Natural logarithm of total assets Bank-specific Annual Reports
Liquidity Liquidity Ratio of loan to total assets Bank-specific Annual Reports
Tax to pre-tax profit Taxation Ratio of tax to pre-tax profit Bank-specific Annual Reports
Non-traditional activity OBSOTA Ratio of off-balance-sheet items to total assets Bank-specific Annual Reports
Labor Productivity LP Ratio of gross total revenue to number of employees Bank-specific Annual Reports
Concentration CO3 The ratio of large three banks in terms of total assets to the total assets
of the banking industry
Industry CBJ
Stock market development SMD Ratio of stock market capitalization over GDP Industry CBJ

138
Inflation Rate INF Annual inflation rate Macro CBJ
GDP Growth Rate GDP Annual GDP growth rate Macro CBJ
5.4.2 Descriptive statistics
Tables 5.2 report the variables’ descriptive statistics. Risk measures (LLPTL, VROA, VROE,
and Z-score) have mean values of 0.70, 0.61, 2.70, and 6.71 and standard deviations of 6.96,
1.34, 1.93 and 6.20 respectively. The mean value of bank TE1, TE2, TE3, TE4, and TE5 are
100.42, 102.33, 100.31, 100.15, and 102.75 with the standard deviation approaching 6.99, 9,
6.35, 4.62, and 10.74 respectively. Capital is, on average, 14.21 with a standard variation of
6.35. ROA is, on average, 1.43 with a standard variation of 0.71. Size is, on average, 9.14 with
a standard variation of 0.49. The Liquidity mean is 43.83 with a standard deviation of 10.51.
The taxation mean is 33.37 with a standard deviation of 45.33. The OBSOTA mean is 26.876
with a standard deviation of 27.09. The LP mean is 4.93 with a standard deviation of 0.28. The
C3 mean is 68.81 with a standard deviation of 3.70. The SMD mean is 8.51 with a standard
deviation of 20.12. The GDP mean is 4.74 with a standard variation of 2.47. The Inflation mean
is 4.14 with a standard variation of 3.44.
Table 5 2Summary statistics (efficiency model)
VARIABLES Obs Mean Std. Dev. Min Max
TE1 169 100.429 6.9908 82 147.6
TE2 169 102.337 9.0058 75.6 128.5
TE3 169 100.313 6.3561 74.1 144
TE4 169 100.153 4.6224 83.3 126.5
TE5 169 102.758 10.7452 75.6 145.5
LLPTL 166 .7004 6.9611 -83.91133 19.3130
VROA 169 .6111 1.3440 .0389872 12.6512
VROE 169 2.7062 1.9373 .3301969 10.6955
Zscor 169 6.7125 6.2032 -.3890879 30.9862
Cap 169 14.2102 6.3536 -31.35458 37.5247
ROA 169 1.4343 .7122 -1.01 4.97
Size 169 9.1438 .4973 7.824972 10.4126
Liquidity 169 43.8393 10.5195 .2785299 60.2789
Taxation 169 33.3723 45.3375 -36.23785 401.9836

139
OBSOTA 169 26.7696 27.0937 0 143.4858
LP 168 4.9373 .2847 3.324286 5.6586
C3 169 68.8130 3.7012 62.60214 76.0322
SMD 169 8.5143 20.1217 .203627 150.9594
GDP 169 4.7430 2.4796 2.3 8.53
INF 169 4.1469 3.4460 -.7 14
Note: statistics calculated using STATA 5.1.
5.4.3. Efficiency and risk models
Our empirical strategy draws on the insights of (Tan and Floros, 2013) and use the 3SLS
simultaneous equations modelling to estimate the following models:
0 1 2 3 4 5it it it it it t
it
EffBRisk Cap Bank Ind Mac
O = + + + + + + (5.1)
0 1 2 3 4 5it it it it it it
it
EffCap Risk Bank Ind Mac
O = + + + + + + (5.2)
0 1 2 3 4 5it it it it t
it
EffCap Risk Bank Ind Mac
O = + + + + + + (5.3)
where the subscript i indicate cross-sectional dimension across banks, while t reflects the
time dimension. RISK is the proxy for the bank’s risk, CAP is the proxy for the bank’s capital
and measured by the equity to total assets ratio. EFF/PROD is the proxy for the bank’s
efficiency and measured using the Malmquist productivity index. Bank, Ind, and Mac are the
bank-specific, industry-specific and macroeconomic factors that influence the
efficiency/productivity–capital–risk relationship, ѵt is a random error term. The purpose of
Model 5.1 is to examine whether efficiency and/or production and capital temporarily existed
prior to any variation in banks' risk, while Model 5.2 looks at whether risk, efficiency and/or
productivity temporarily existed before variations in bank capital and Model 5.3 assesses
whether capital levels combined with bank risk influence changes in bank efficiency and/or
production.
For measuring bank risk, we use four alternative measures – loan-loss provision as a

140
fraction of total loans ratio, volatility of ROA, as measured by the standard deviation of ROA,
volatility of ROE, as measured by the standard deviation of ROE, and Z-Score, measured by
the ratio between a bank’s return on assets plus the equity capital/total assets and the standard
deviation of the return on assets. Bank capital is measured as the value of capital to total assets.
We use the Malmquist Productivity Index (MPI) to calculate efficiency (Eff/O). Malmquist
productivity index uses input and output distance functions to measure changes in productivity.
The index is calculated based on s-technology and is expressed as follows:
00
0
( , )( , , , )
( , )
ss t t
s t s t s
s s
d q qxm q q x x
d q x= (5.4)
In this study, we use the non-parametric methods represented by the Malmquist index
proposed by (Malmquist, 1953) and later developed by (Douglas et al., 1982). This index
measures total factor productivity between two banks or one bank over time. We also measure
technical efficiencies using the non-parametric method, DEA. DEA technique utilizes the
number of variables (inputs and outputs) and not their prices and thus does not require any
relationship between inputs and outputs. Using more than one form of inputs and outputs of
the Decision-Making Unit (DMU) is one of the DEA advantages (Graham et al., 2005).
Defining and selecting banks’ inputs and outputs for the DEA method is based on one of three
approaches, production approach, intermediation approach, and value-added approach. We
also use the intermediation approach in the selection of inputs and outputs which defines the
bank as an intermediary that transfers assets from surplus units to deficit units (Paul and
Kourouche, 2008), (Alkhathlan and Malik, 2010). In calculating the index we use four inputs
(number of full-time employees, total deposits, total assets, and interest expenses) and two
outputs (loans and interest income) following (Varesi, 2015). Loans are considered one form
of output from deposits (inputs) as noted by (Sealey and Lindley, 1977), (Lang and Welzel,
1996), and (Ashton and Pham, 2011). Table 5.3 shows the average DEA scores using the
Malmquist index.

141
Table 5 3Average DEA efficiency scores using Malmquist index (2003-2015) Year Effch (TE1) Techch (TE2) Pech (TE3) Sech (TE4) Tfpch (TE5)
Technical Efficiency Technological Pure Technical Efficiency Scale Efficiency Total Factor Productivity
2003 0.972 1.148 0.985 0.987 1.116
2004 0.984 1.089 0.967 1.017 1.071
2005 1.066 1.002 1.062 1.004 1.068
2006 0.972 1.015 0.985 0.987 0.987
2007 1.035 0.985 1.012 1.023 1.02
2008 0.988 1.088 0.987 1 1.075
2009 1.014 0.92 1.027 0.987 0.933
2010 0.996 1.022 0.993 1.003 1.017
2011 1.02 0.993 1.028 0.992 1.013
2012 0.981 1.05 0.976 1.005 1.03
2013 1.03 0.963 1.014 1.016 0.992
2014 0.994 0.993 1.006 0.989 0.987
2015 0.986 1.007 0.989 0.997 0.993
Average 1.003 1.02 1.002 1 1.022
Note: all Malmquist index averages are geometric means
As presented in Table 5.3 the geometric mean of the DEA test shows that the technical
efficiency of the Jordanian commercial banks (2003-2015) is 1.003 percent, which is higher
for Jordan than in other developing countries. For example, (Yildirim, 2010) estimated the
technical efficiency of Turkish banks at a value of 89 percent. The index scores show that the
deregulation and liberalization of Jordanian commercial banking contributed positively to the
technical efficiency rates over the sample period. The improvement of average technical
efficiency score implies that banks on average produce the same amount of outputs with fewer
resources. The scores also highlight the negative impact of external shocks, such as the 2008
global financial crisis and the local economic downturns following the Arab spring in 2012–
2015. The overall scores of the Malmquist index analysis also shows that Jordanian commercial
banks benefited from deregulation and liberalization.
Our study utilizes a set of control variables (definitions appear in Table 5.1) that
influence the relationship between efficiency, risk, and capital regulations. The set includes
size, bank profitability, taxation, non-traditional banking activity (OBSOTA), labor (LP),
industry-specific concentration (C3), market development (SMD), GDP growth, and inflation.
Estimation results appear in Tables 5.4-5.8.

142
5.4.5 Empirical methodology
We estimate our models using the 3SLS structural equations method, which is widely used in
the literature for estimating similar relationships, see, for example, (Tan and Floros, 2013) and
(Rime, 2001). Since we suspect that endogeneity is an issue regarding the relationship between
bank efficiency, risk, and capital, 3SLS is appropriate to solve this problem. 3SLS estimates
systems of structural equations where some equations contain endogenous variables among the
list of explanatory variables. These endogenous variables are then defined in the system as the
dependent variables of the other equations in the system are independent variable in other
equations. This method also enables us to define other endogenous variables other than the
dependent variables.
Due to this endogeneity, the error disturbances of the equations become correlated with
the endogenous variables, which in turn violate the assumptions of OLS. This method uses an
instrumental-variables approach to present consistent and unbiased estimations. Also, it utilizes
the method of generalized least squares (GLS) to account for the error terms serial correlation
across the equations. This method incorporates three steps, in the first step instrumented values
for all endogenous variables are developed by regressing each endogenous variable on all
exogenous variables in the system. Then we obtain an estimate for the error covariance matrix
of the equations during step two. The final step applies GLS-type estimation using the
covariance matrix of stage two using the instrumented values of stage one as the right-hand
side endogenous variables (Greene, 2012).
5.5 Results
This section presents the 3SLS empirical results for the Models 5.1-5.3. We use four measures
for bank risk (Z-score, LLPTL, VROA, and VROE) and utilize Data Envelopment Analysis
(DEA) in Table 5.5 to employ five efficiency types (technical, pure technical, technological,
scale and total factor productivity).
All five efficiency measures reduce risk levels (mainly z-score and LLPTL). As
improvement in efficiencies and reflects adequate monitoring and managing of credit and
operations that translates into lower risk levels. Scale and technical efficiencies are the largest
and most robust moderators of risk levels. As such, a one unit increase in scale efficiency
reduces risk (z-score) by 1.44 units at the 95 percent confidence level as Table 5.7 shows.

143
Considering the control variables in the technical efficiency table, Table 5.6, ROA has a
positive and statistically significant impact on banks’ risk (z-score), capital and efficiency.
Where for example, a one percent increase in ROA, increase risk, capital, and efficiency by
4.63 percent, 5.9 percent and 12.61 percent at the 99 percent confidence level. Similar to (Tan
and Floros, 2013), banks with high profitability rates are better able to raise and manage their
capital efficiently. Risk (all measures) has a negative impact on capital and efficiency, which
supports our second sub-hypothesis that risk reduces operational efficiency. Size negatively
affects risk in line with (Anderson and Fraser, 2000). As larger banks are better able to mobilize
resources and mitigate potential losses of financial crises and economic downturns.
Liquidity only modestly improves technical efficiency, where one percentage increase in
liquidity foster bank efficiency only by 0.42 percent at the 95 percent confidence level.
However, when using LLPTL risk measure, liquidity tends to reduce efficiency by 1.72
percent. Liquidity has a positive impact on the level of capitalization of Jordanian banks. While
liquidity reduces banks’ risk in line with (Rahman et al., 2015). Others like (Kochubey and
Kowalczyk, 2014) found a similar relationship indicating that banks tend to increase their
liquidity following a decline in the capital ratio. Also, (Altunbas et al., 2007) found a
significantly negative relationship between liquidity and the risk level. The high level of
liquidity ratio based on the CBJ regulations reached 150 percent, which directly contributes to
minimizing banks’ risk and protects them from financial and macroeconomic shocks.
Off-balance sheet activities and taxation increase both banks’ risk (LLPTL) and capital.
Regarding the former, the results show that undertaking these activities helps to increase capital
and profits however with the cost of higher risks. Regarding taxation, the tax ratio in Jordan is
very high amounting to 35 percent. Higher taxation paid by banks reduces bank capital and
consequently adversely affects the managers’ incentives and efforts to control costs and this
entails higher risk exposure levels. The results also show that capital reduces risk levels
following our sub-hypothesis. It acts as a moderator factor for potential losses.
Table 5.5 reports the results of the relationship between bank capital, technological
efficiency, and risk in Jordanian banking. The results show that most of the variables are
consistent compared with the findings in Table 5.4. But unlike the technical efficiency results,
capital tends to increase risk and reduce efficiency when using VROA as a risk measure. Since
the Jordanian banking market, according to (AL-Qaisi, 2018), is highly concentrated and
operates under monopolistic competition, high levels of capital in such markets lead to a

144
decline in bank efficiency (Tan and Floros, 2013). Stock Market Development (SMD) has a
positive impact on bank capital and pure technical efficiency, as it reduces risk (VROA and
VROE) as shown in Table 5.6. The improvement in the Jordanian stock market, especially in
stock pricing, trade size transparency, and volume, provides reliable information for the
investors that help in decreasing wrong investment choices.
Similar results are observed for pure technical, scale, and total factor productivity
efficiency tables 5.6, 5.7, and 5.8. However, the negative impact of the concentration ratio (C3)
on risk, capital, pure technical efficiency, and scale efficiencies become statistically significant
as shown in Tables 5.6-5.7. Less competitive and concentrated bank markets lead to a decline
in banks' operational efficiencies. Additionally, labor (LP) has a positive and statistically
significant robust impact on risk and capital in Tables 5.6-5.8. A one percentage increase in
labor increases risk and capital with 2.99 percent, and 19.24 percent respectively. The argument
is that hiring highly productive labors require higher salaries, which in turn raise the need for
a larger capital buffer to cover their expenses. This, in turn, increases the cost of input and the
banks’ risk exposure in times of financial shocks. Regarding the macroeconomic indicators,
inflation has a positive and robust effect on all efficiency measures. During inflationary periods
in 2008, the number of depositors decreases because of the erosion on the value of money,
forcing bank managers to contribute more efforts to increase bank productivity.

145
Table 5 4Three-stage least square estimation for the relationship between bank capital, technical
efficiency and risk-taking in the Jordanian banking system.
Model where risk = Z-score Model where risk = LLPTL
Eq. (1) Y = Z-score Eq. (2) Y = capital Eq. (3) Y =
efficiency
Eq. (1) Y = LLPTL Eq. (2) Y = capital Eq. (3) Y =
efficiency
Risk -1.103*** (0.0554) -2.719*** (0.111) -5.078*** (0.863) -13.18*** (2.072)
CAP -0.906*** (0.0455) -2.464***(0.0911) -0.197*** (0.0326) -2.595*** (0.275)
TE1 -0.368*** (0.0150) -0.406*** (0.0150) -0.0759*** (0.0114) -0.385*** (0.0399)
SIZE -7.204** (2.966) -7.949** (3.240) -19.59** (8.026) -2.486*** (0.733) -12.62*** (3.424) -32.75*** (9.332)
Liquidity 0.158** (0.0800) 0.174** (0.0883) 0.429** (0.218) -0.131*** (0.0185) -0.664*** (0.158) -1.723*** (0.388)
Taxation 0.0194 (0.0138) 0.0214 (0.0152) 0.0527 (0.0375) 0.0113*** (0.00318) 0.0573***
(0.0171)
0.149*** (0.0450)
OBSOTA -0.0312 (0.0447) -0.0344 (0.0494) -0.0848 (0.122) 0.0220** (0.0105) 0.112** (0.0535) 0.289** (0.140)
SMD 0.198** (0.0911) 0.218** (0.101) 0.538** (0.248) -0.0119 (0.0209) -0.0606 (0.108) -0.157 (0.279)
LP -0.394 (5.230) -0.435 (5.772) -1.072 (14.22) 3.167*** (1.213) 16.08** (6.402) 41.73** (16.55)
ROA 4.637*** (1.261) 5.116*** (1.404) 12.61*** (3.450) -0.258 (0.290) -1.309 (1.521) -3.397 (3.922)
CO3 -0.770** (0.363) -0.850** (0.402) -2.094** (0.989) 0.0310 (0.0832) 0.157 (0.427) 0.408 (1.104)
GDP -1.104** (0.505) -1.218** (0.558) -3.001** (1.376) -0.204* (0.116) -1.034* (0.596) -2.683* (1.555)
INF 0.0933 (0.204) 0.103 (0.225) 0.254 (0.554) 0.0331 (0.0475) 0.168 (0.242) 0.436 (0.629)
Const. 167.5*** (41.57) 184.8*** (45.64) 455.4*** (112.7) 22.98** (10.22) 116.7** (47.95) 302.8** (127.0)
Obs. 131 131 131 129 129 129
chi2 644.40*** 774.07*** 1133.22*** 142.59*** 113.36*** 109.51***
Model where risk = VROA Model where risk = VROE
Eq. (1) Y = VOA Eq. (2) Y = capital Eq. (3) Y =
efficiency
Eq. (1) Y = VOE Eq. (2) Y = capital Eq. (3) Y =
efficiency
Risk 73.67** (36.08) 129.1*** (23.53) 5.272*** (2.004) 6.972 (9.434)
CAP 0.0136*** (0.0051) -1.752*** (0.484) 0.169*** (0.0639) -1.802 (1.255)
TE1 0.00775***(0.0013) -0.571*** (0.190) 0.0693 (0.0477) -0.461** (0.201)
SIZE -0.257** (0.120) 18.89 (15.99) 33.11* (18.32) 0.833 (0.772) -5.348* (2.950) -11.36 (9.079)
Liquidity -0.0114***(0.0030) 0.842* (0.432) 1.475*** (0.446) -0.0600*** (0.0144) 0.327*** (0.115) 0.478 (0.517)
Taxation -0.000625(0.0005) 0.0460 (0.0398) 0.0807 (0.0669) -0.00390 (0.0026) 0.0220* (0.0124) 0.0356 (0.0396)
OBSOTA 0.00216 (0.0016) -0.159 (0.158) -0.279 (0.228) -0.00502 (0.0080) 0.0315 (0.0395) 0.0641 (0.0760)
SMD -0.00671* (0.0034) 0.494 (0.316) 0.866* (0.453) -0.0349** (0.0165) 0.191** (0.0905) 0.286 (0.331)
LP 0.775*** (0.196) -57.10* (33.64) -100.0*** (32.85) 2.313** (0.946) -11.43 (8.098) -11.82 (27.91)
ROA -0.0896* (0.0474) 6.602 (4.336) 11.57* (6.230) 0.134 (0.228) -0.524 (1.343) 0.0915 (3.135)
CO3 0.0181 (0.0136) -1.332 (1.107) -2.334 (1.766) 0.246*** (0.0645) -1.338*** (0.491) -1.948 (2.153)
GDP 0.0798*** (0.0189) -5.882* (3.047) -10.31*** (2.980) 0.175** (0.0891) -0.925* (0.530) -1.259 (1.846)
INF -0.0154** (0.0076) 1.133 (0.777) 1.984* (1.044) -0.0431 (0.0358) 0.213 (0.210) 0.227 (0.594)
Const. -2.913* (1.638) 214.7* (123.1) 376.0* (202.3) -40.42*** (10.84) 231.2*** (52.41) 383.5 (284.1)
Obs. 131 131 131 131 131 131
chi2 146.65*** 13.06 75.16*** 101.09*** 40.27*** 4.77
Where the dependent variables are: LLPTL, VROA, VROE and Z-score are the Risk measurements, TE1, TE2, TE3, TE4, TE5 are
the Efficiency measurments, CAP is the Capital. The independent variables are: ROA is the Profitability, SIZE is the Bank Size, Liquidity is
the Loan to total assets, Taxation is the Tax to pre-tax profit, OBSOTA is the Non-traditional activity, LP is the Labor Productivity, CO3 is
the Concentration, SMD is the Stock market development, INF is the Inflation, GDP is the GDP growth. Standard errors in parentheses
*** p<0.01, ** p<0.05, * p<0.1

146
Table 5 5Three-stage least square estimation for the relationship between bank capital, technological
efficiency and risk-taking in the Jordanian banking system. Model where risk = Z-score Model where risk = LLPTL
Eq. (1) Y = Z-score Eq. (2) Y = capital Eq. (3) Y =
efficiency
Eq. (1) Y =
LLPTL
Eq. (2) Y =
capital
Eq. (3) Y =
efficiency
Risk -0.601 (1.579) 3.308*** (0.498) -3.430 (3.185) 11.23** (4.876)
CAP -0.380 (0.523) 1.038 (1.813) -0.153 (0.117) 1.028 (1.822)
TE2 0.291*** (0.041) 0.0409 (0.453) 0.0709***(0.0212) 0.0925 (0.217)
SIZE -2.288 (5.402) -8.773*** (2.898) 5.475 (18.54) -2.076 (1.274) -11.76*** (3.016) 16.57 (20.28)
Liquidity 0.106 (0.0694) 0.122 (0.136) -0.335 (0.241) -0.137***(0.0192) -0.430 (0.479) 1.598** (0.713)
Taxation 0.0131 (0.0151) 0.0240** (0.0121) -0.0388 (0.0518) 0.0115***(0.0037) 0.0488* (0.0277) -0.115 (0.0729)
OBSOTA -0.0462 (0.0400) 0.00283 (0.106) 0.162 (0.137) 0.0218* (0.0112) 0.0952* (0.0548) -0.215 (0.173)
SMD 0.123 (0.0868) 0.173 (0.149) -0.378 (0.305) -0.0216 (0.0226) -0.00679 (0.131) 0.339 (0.299)
LP -4.457 (4.417) 0.986 (10.25) 15.78 (14.94) 2.621** (1.180) 11.02 (7.827) -26.50 (19.86)
ROA 3.283*** (1.073) 3.040 (4.701) 10.56** (4.107) -0.490* (0.296) -0.862 (2.199) 6.668 (4.156)
CO3 -0.738** (0.310) -0.614 (0.992) 2.392** (1.091) 0.0106 (0.0840) -0.0332 (0.376) -0.228 (1.102)
GDP -0.800* (0.434) -0.930 (1.093) 2.519 (1.553) -0.158 (0.119) -0.880 (0.543) 1.301 (1.815)
INF -0.115 (0.158) 0.112 (0.282) 0.432 (0.520) -0.0164 (0.0491) 0.128 (0.219) 0.439 (0.604)
Const. 71.11 (58.63) 124.2* (63.99) -212.2 (205.4) 8.574 (14.59) 85.37** (37.10) -15.84 (206.2)
Obs. 131 131 131 129 129 129
chi2 101.25*** 41.61*** 49.48*** 128.99*** 35.46*** 10.03
Model where risk = VROA Model where risk = VROE
Eq. (1) Y = VOA Eq. (2) Y = capital Eq. (3) Y =
efficiency
Eq. (1) Y = VOE Eq. (2) Y =
capital
Eq. (3) Y =
efficiency
Risk 20.93*** (2.995) 138.7*** (50.37) 6.385** (3.162) -19.30** (8.181)
CAP 0.0478***(0.0067) -6.631*** (1.855) 0.144** (0.0596) 2.544 (2.047)
TE2 0.00720***(0.0016) -0.151***(0.0272) -0.0475***(0.0137) 0.266 (0.183)
SIZE 0.278* (0.151) -5.828** (2.928) -38.66* (21.69) 0.608 (0.749) -4.691 (3.901) 9.529 (18.73)
Liquidity -0.00941**(0.0040) 0.197** (0.0858) 1.306* (0.695) -0.0557***(0.0140) 0.362** (0.166) 1.058* (0.558)
Taxation -0.0009(0.0007) 0.0201 (0.0146) 0.133 (0.104) -0.00429 (0.0026) 0.0290* (0.0150) -0.0782 (0.0681)
OBSOTA 0.0018 (0.0021) -0.0388 (0.0468) -0.257 (0.327) -0.00528 (0.0078) 0.0363 (0.0476) -0.0944 (0.169)
SMD -0.0115** (0.0045) 0.241** (0.0947) 1.596** (0.767) -0.0296* (0.0167) 0.202* (0.109) -0.536 (0.467)
LP 2.741*** (0.910) -17.06 (11.94) 54.07* (27.81)
ROA -0.0649 (0.0598) 1.360 (1.226) 9.019 (8.290) 0.297 (0.222) -1.741 (1.923) 6.130 (4.750)
CO3 0.0158 (0.0201) -0.331 (0.421) -2.194 (2.879) 0.259*** (0.0633) -1.661** (0.765) 4.976** (2.374)
GDP 0.0999*** (0.0250) -2.090*** (0.551) -13.85** (5.508) 0.156* (0.0894) -1.061* (0.631) 2.837 (2.483)
INF -0.0253** (0.0104) 0.529** (0.220) 3.506** (1.680) -0.0164 (0.0367) 0.144 (0.251) -0.225 (0.852)
Const. -4.411** (2.108) 92.34** (41.35) 612.4** (306.4) -29.73*** (9.071) 199.8*** (68.36) -547.2 (349.1)
Obs. 125 125 125 131 131 131
chi2 88.24*** 122.40*** 14.34 117.17*** 21.77** 8.55
Where the dependent variables are: LLPTL, VROA, VROE and Z-score are the Risk measurements, TE1, TE2, TE3, TE4, TE5 are
the Efficiency measurments, CAP is the Capital. The independent variables are: ROA is the Profitability, SIZE is the Bank Size, Liquidity is
the Loan to total assets, Taxation is the Tax to pre-tax profit, OBSOTA is the Non-traditional activity, LP is the Labor Productivity, CO3 is
the Concentration, SMD is the Stock market development, INF is the Inflation, GDP is the GDP growth. Standard errors in parentheses
*** p<0.01, ** p<0.05, * p<0.1
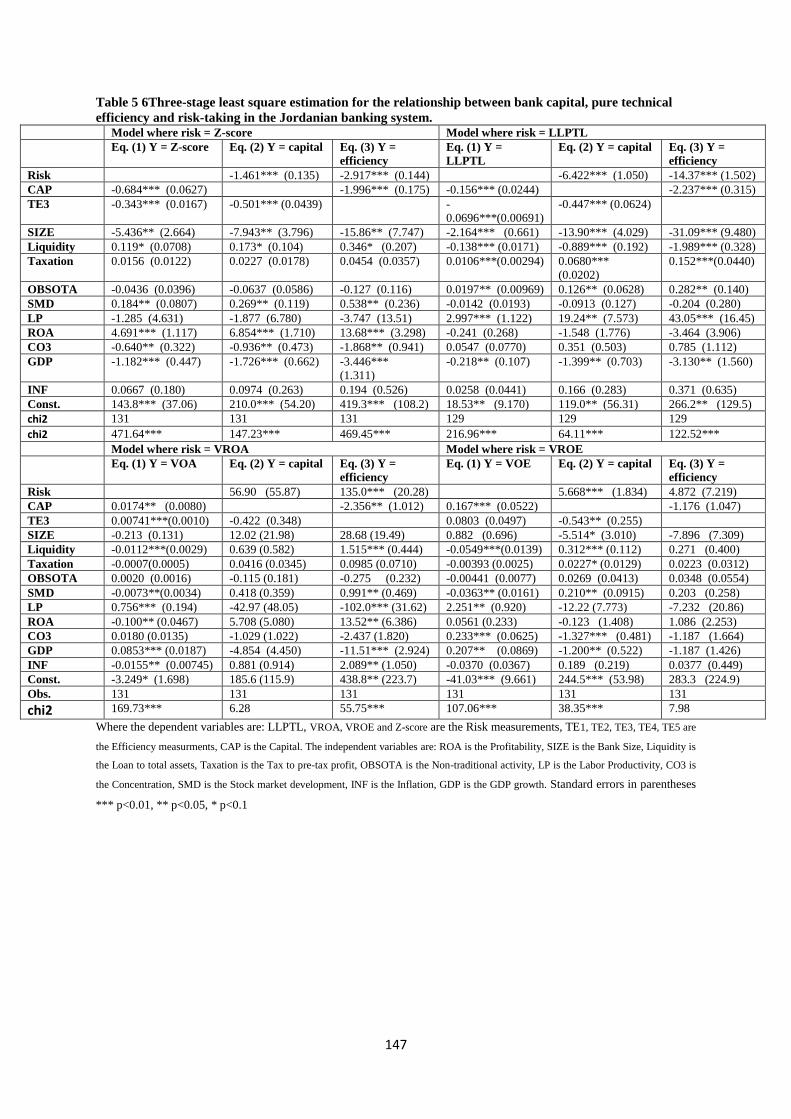
147
Table 5 6Three-stage least square estimation for the relationship between bank capital, pure technical
efficiency and risk-taking in the Jordanian banking system. Model where risk = Z-score Model where risk = LLPTL
Eq. (1) Y = Z-score Eq. (2) Y = capital Eq. (3) Y =
efficiency
Eq. (1) Y =
LLPTL
Eq. (2) Y = capital Eq. (3) Y =
efficiency
Risk -1.461*** (0.135) -2.917*** (0.144) -6.422*** (1.050) -14.37*** (1.502)
CAP -0.684*** (0.0627) -1.996*** (0.175) -0.156*** (0.0244) -2.237*** (0.315)
TE3 -0.343*** (0.0167) -0.501*** (0.0439) -
0.0696***(0.00691)
-0.447*** (0.0624)
SIZE -5.436** (2.664) -7.943** (3.796) -15.86** (7.747) -2.164*** (0.661) -13.90*** (4.029) -31.09*** (9.480)
Liquidity 0.119* (0.0708) 0.173* (0.104) 0.346* (0.207) -0.138*** (0.0171) -0.889*** (0.192) -1.989*** (0.328)
Taxation 0.0156 (0.0122) 0.0227 (0.0178) 0.0454 (0.0357) 0.0106***(0.00294) 0.0680***
(0.0202)
0.152***(0.0440)
OBSOTA -0.0436 (0.0396) -0.0637 (0.0586) -0.127 (0.116) 0.0197** (0.00969) 0.126** (0.0628) 0.282** (0.140)
SMD 0.184** (0.0807) 0.269** (0.119) 0.538** (0.236) -0.0142 (0.0193) -0.0913 (0.127) -0.204 (0.280)
LP -1.285 (4.631) -1.877 (6.780) -3.747 (13.51) 2.997*** (1.122) 19.24** (7.573) 43.05*** (16.45)
ROA 4.691*** (1.117) 6.854*** (1.710) 13.68*** (3.298) -0.241 (0.268) -1.548 (1.776) -3.464 (3.906)
CO3 -0.640** (0.322) -0.936** (0.473) -1.868** (0.941) 0.0547 (0.0770) 0.351 (0.503) 0.785 (1.112)
GDP -1.182*** (0.447) -1.726*** (0.662) -3.446***
(1.311)
-0.218** (0.107) -1.399** (0.703) -3.130** (1.560)
INF 0.0667 (0.180) 0.0974 (0.263) 0.194 (0.526) 0.0258 (0.0441) 0.166 (0.283) 0.371 (0.635)
Const. 143.8*** (37.06) 210.0*** (54.20) 419.3*** (108.2) 18.53** (9.170) 119.0** (56.31) 266.2** (129.5)
chi2 131 131 131 129 129 129
chi2 471.64*** 147.23*** 469.45*** 216.96*** 64.11*** 122.52***
Model where risk = VROA Model where risk = VROE
Eq. (1) Y = VOA Eq. (2) Y = capital Eq. (3) Y =
efficiency
Eq. (1) Y = VOE Eq. (2) Y = capital Eq. (3) Y =
efficiency
Risk 56.90 (55.87) 135.0*** (20.28) 5.668*** (1.834) 4.872 (7.219)
CAP 0.0174** (0.0080) -2.356** (1.012) 0.167*** (0.0522) -1.176 (1.047)
TE3 0.00741***(0.0010) -0.422 (0.348) 0.0803 (0.0497) -0.543** (0.255)
SIZE -0.213 (0.131) 12.02 (21.98) 28.68 (19.49) 0.882 (0.696) -5.514* (3.010) -7.896 (7.309)
Liquidity -0.0112***(0.0029) 0.639 (0.582) 1.515*** (0.444) -0.0549***(0.0139) 0.312*** (0.112) 0.271 (0.400)
Taxation -0.0007(0.0005) 0.0416 (0.0345) 0.0985 (0.0710) -0.00393 (0.0025) 0.0227* (0.0129) 0.0223 (0.0312)
OBSOTA 0.0020 (0.0016) -0.115 (0.181) -0.275 (0.232) -0.00441 (0.0077) 0.0269 (0.0413) 0.0348 (0.0554)
SMD -0.0073**(0.0034) 0.418 (0.359) 0.991** (0.469) -0.0363** (0.0161) 0.210** (0.0915) 0.203 (0.258)
LP 0.756*** (0.194) -42.97 (48.05) -102.0*** (31.62) 2.251** (0.920) -12.22 (7.773) -7.232 (20.86)
ROA -0.100** (0.0467) 5.708 (5.080) 13.52** (6.386) 0.0561 (0.233) -0.123 (1.408) 1.086 (2.253)
CO3 0.0180 (0.0135) -1.029 (1.022) -2.437 (1.820) 0.233*** (0.0625) -1.327*** (0.481) -1.187 (1.664)
GDP 0.0853*** (0.0187) -4.854 (4.450) -11.51*** (2.924) 0.207** (0.0869) -1.200** (0.522) -1.187 (1.426)
INF -0.0155** (0.00745) 0.881 (0.914) 2.089** (1.050) -0.0370 (0.0367) 0.189 (0.219) 0.0377 (0.449)
Const. -3.249* (1.698) 185.6 (115.9) 438.8** (223.7) -41.03*** (9.661) 244.5*** (53.98) 283.3 (224.9)
Obs. 131 131 131 131 131 131
chi2 169.73*** 6.28 55.75*** 107.06*** 38.35*** 7.98
Where the dependent variables are: LLPTL, VROA, VROE and Z-score are the Risk measurements, TE1, TE2, TE3, TE4, TE5 are
the Efficiency measurments, CAP is the Capital. The independent variables are: ROA is the Profitability, SIZE is the Bank Size, Liquidity is
the Loan to total assets, Taxation is the Tax to pre-tax profit, OBSOTA is the Non-traditional activity, LP is the Labor Productivity, CO3 is
the Concentration, SMD is the Stock market development, INF is the Inflation, GDP is the GDP growth. Standard errors in parentheses
*** p<0.01, ** p<0.05, * p<0.1
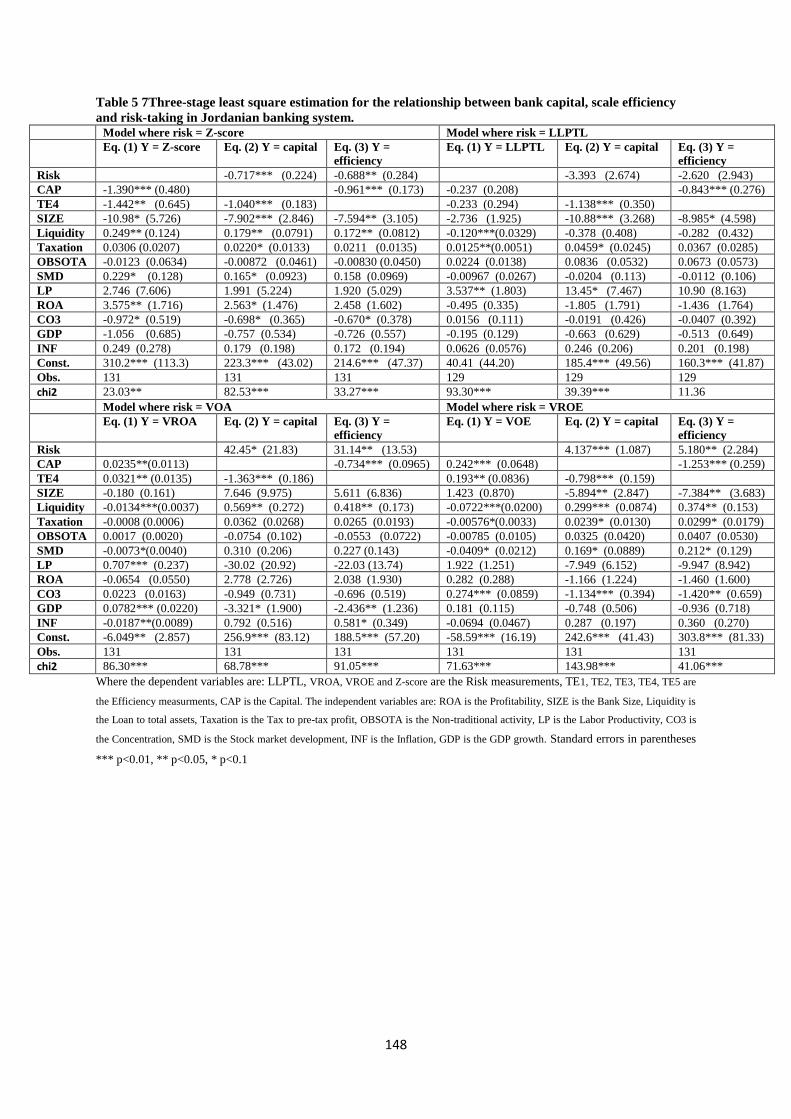
148
Table 5 7Three-stage least square estimation for the relationship between bank capital, scale efficiency
and risk-taking in Jordanian banking system. Model where risk = Z-score Model where risk = LLPTL
Eq. (1) Y = Z-score Eq. (2) Y = capital Eq. (3) Y =
efficiency
Eq. (1) Y = LLPTL Eq. (2) Y = capital Eq. (3) Y =
efficiency
Risk -0.717*** (0.224) -0.688** (0.284) -3.393 (2.674) -2.620 (2.943)
CAP -1.390*** (0.480) -0.961*** (0.173) -0.237 (0.208) -0.843*** (0.276)
TE4 -1.442** (0.645) -1.040*** (0.183) -0.233 (0.294) -1.138*** (0.350)
SIZE -10.98* (5.726) -7.902*** (2.846) -7.594** (3.105) -2.736 (1.925) -10.88*** (3.268) -8.985* (4.598)
Liquidity 0.249** (0.124) 0.179** (0.0791) 0.172** (0.0812) -0.120***(0.0329) -0.378 (0.408) -0.282 (0.432)
Taxation 0.0306 (0.0207) 0.0220* (0.0133) 0.0211 (0.0135) 0.0125**(0.0051) 0.0459* (0.0245) 0.0367 (0.0285)
OBSOTA -0.0123 (0.0634) -0.00872 (0.0461) -0.00830 (0.0450) 0.0224 (0.0138) 0.0836 (0.0532) 0.0673 (0.0573)
SMD 0.229* (0.128) 0.165* (0.0923) 0.158 (0.0969) -0.00967 (0.0267) -0.0204 (0.113) -0.0112 (0.106)
LP 2.746 (7.606) 1.991 (5.224) 1.920 (5.029) 3.537** (1.803) 13.45* (7.467) 10.90 (8.163)
ROA 3.575** (1.716) 2.563* (1.476) 2.458 (1.602) -0.495 (0.335) -1.805 (1.791) -1.436 (1.764)
CO3 -0.972* (0.519) -0.698* (0.365) -0.670* (0.378) 0.0156 (0.111) -0.0191 (0.426) -0.0407 (0.392)
GDP -1.056 (0.685) -0.757 (0.534) -0.726 (0.557) -0.195 (0.129) -0.663 (0.629) -0.513 (0.649)
INF 0.249 (0.278) 0.179 (0.198) 0.172 (0.194) 0.0626 (0.0576) 0.246 (0.206) 0.201 (0.198)
Const. 310.2*** (113.3) 223.3*** (43.02) 214.6*** (47.37) 40.41 (44.20) 185.4*** (49.56) 160.3*** (41.87)
Obs. 131 131 131 129 129 129
chi2 23.03** 82.53*** 33.27*** 93.30*** 39.39*** 11.36
Model where risk = VOA Model where risk = VROE
Eq. (1) Y = VROA Eq. (2) Y = capital Eq. (3) Y =
efficiency
Eq. (1) Y = VOE Eq. (2) Y = capital Eq. (3) Y =
efficiency
Risk 42.45* (21.83) 31.14** (13.53) 4.137*** (1.087) 5.180** (2.284)
CAP 0.0235**(0.0113) -0.734*** (0.0965) 0.242*** (0.0648) -1.253*** (0.259)
TE4 0.0321** (0.0135) -1.363*** (0.186) 0.193** (0.0836) -0.798*** (0.159)
SIZE -0.180 (0.161) 7.646 (9.975) 5.611 (6.836) 1.423 (0.870) -5.894** (2.847) -7.384** (3.683)
Liquidity -0.0134***(0.0037) 0.569** (0.272) 0.418** (0.173) -0.0722***(0.0200) 0.299*** (0.0874) 0.374** (0.153)
Taxation -0.0008 (0.0006) 0.0362 (0.0268) 0.0265 (0.0193) -0.00576*(0.0033) 0.0239* (0.0130) 0.0299* (0.0179)
OBSOTA 0.0017 (0.0020) -0.0754 (0.102) -0.0553 (0.0722) -0.00785 (0.0105) 0.0325 (0.0420) 0.0407 (0.0530)
SMD -0.0073*(0.0040) 0.310 (0.206) 0.227 (0.143) -0.0409* (0.0212) 0.169* (0.0889) 0.212* (0.129)
LP 0.707*** (0.237) -30.02 (20.92) -22.03 (13.74) 1.922 (1.251) -7.949 (6.152) -9.947 (8.942)
ROA -0.0654 (0.0550) 2.778 (2.726) 2.038 (1.930) 0.282 (0.288) -1.166 (1.224) -1.460 (1.600)
CO3 0.0223 (0.0163) -0.949 (0.731) -0.696 (0.519) 0.274*** (0.0859) -1.134*** (0.394) -1.420** (0.659)
GDP 0.0782*** (0.0220) -3.321* (1.900) -2.436** (1.236) 0.181 (0.115) -0.748 (0.506) -0.936 (0.718)
INF -0.0187**(0.0089) 0.792 (0.516) 0.581* (0.349) -0.0694 (0.0467) 0.287 (0.197) 0.360 (0.270)
Const. -6.049** (2.857) 256.9*** (83.12) 188.5*** (57.20) -58.59*** (16.19) 242.6*** (41.43) 303.8*** (81.33)
Obs. 131 131 131 131 131 131
chi2 86.30*** 68.78*** 91.05*** 71.63*** 143.98*** 41.06***
Where the dependent variables are: LLPTL, VROA, VROE and Z-score are the Risk measurements, TE1, TE2, TE3, TE4, TE5 are
the Efficiency measurments, CAP is the Capital. The independent variables are: ROA is the Profitability, SIZE is the Bank Size, Liquidity is
the Loan to total assets, Taxation is the Tax to pre-tax profit, OBSOTA is the Non-traditional activity, LP is the Labor Productivity, CO3 is
the Concentration, SMD is the Stock market development, INF is the Inflation, GDP is the GDP growth. Standard errors in parentheses
*** p<0.01, ** p<0.05, * p<0.1

149
Table 5 8Three-stage least square estimation for the relationship between bank capital, total factor
productivity and risk-taking in Jordanian banking system.
Model where risk = Z-score Model where risk = LLPTL
Eq. (1) Y = Z-score Eq. (2) Y = capital Eq. (3) Y =
efficiency
Eq. (1) Y =
LLPTL
Eq. (2) Y =
capital
Eq. (3) Y = efficiency
Risk -0.0435 (0.624) 0.407 (1.724) -2.593 (2.300) -6.299 (8.017)
CAP -0.103 (1.247) -2.713*** (0.714) -0.261 (0.246) -2.788*** (0.742)
TE5 0.135 (0.414) -0.335*** (0.0861) -0.0745 (0.0962) -0.344***
(0.0826)
SIZE 0.160 (11.99) -9.407*** (2.187) -26.12*** (8.718) -3.143 (2.435) -11.24***
(2.567)
-30.72** (12.19)
Liquidity 0.0838 (0.120) 0.0890 (0.0752) 0.202 (0.222) -0.125***(0.0290) -0.291 (0.347) -0.673 (1.176)
Taxation 0.00767(0.0238) 0.0167* (0.0100) 0.0422 (0.0320) 0.0122**(0.0050) 0.0364* (0.0207) 0.0936 (0.0766)
OBSOTA -0.0637(0.0552) 0.0309 (0.0548) 0.119 (0.150) 0.0230 (0.0141) 0.0714* (0.0430) 0.187 (0.151)
SMD 0.119 (0.174) 0.137 (0.0967) 0.317 (0.292) 0.00356 (0.0375) 0.0539 (0.0940) 0.180 (0.280)
LP -5.813 (8.518) 6.053 (5.124) 19.82 (13.71) 3.565* (1.826) 11.31* (6.154) 29.74 (21.76)
ROA 3.162 (2.534) 2.110 (2.272) 4.172 (6.569) -0.0362 (0.585) 0.674 (1.575) 2.480 (4.705)
CO3 -0.566* (0.342) -0.151 (0.394) -0.120 (1.117) 0.0564 (0.0888) 0.128 (0.336) 0.289 (1.027)
GDP -0.856 (0.805) -0.627 (0.643) -1.284 (1.874) -0.299 (0.187) -0.991** (0.486) -2.645 (1.713)
INF 0.0356 (0.370) 0.286* (0.161) 0.772* (0.444) 0.103 (0.0944) 0.393** (0.164) 1.093** (0.512)
Const. 56.59 (133.9) 108.0** (42.56) 269.2* (146.2) 25.55 (28.44) 102.9*** (30.25) 290.4*** (108.6)
Obs. 131 131 131 129 129 129
chi2 50.11** 55.82*** 24.03** 105.54*** 63.60*** 22.59**
Model where risk = VOA Model where risk = VROE
Eq. (1) Y = VROA Eq. (2) Y = capital Eq. (3) Y =
efficiency
Eq. (1) Y = VOE Eq. (2) Y =
capital
Eq. (3) Y = efficiency
Risk -21.36 (30.20) -65.33 (83.51) 8.597 (7.054) -22.25*** (6.645)
CAP -0.0384 (0.0479) -3.004*** (0.422) 0.112 (0.0749) 2.466 (2.267)
TE5 -0.0129 (0.0149) -0.333*** (0.0475) -0.0445***(0.0128) 0.373 (0.410)
SIZE -0.743 (0.466) -17.58 (11.72) -53.25* (31.85) 1.196 (0.832) -10.59** (4.438) 26.32 (23.98)
Liquidity -0.0069(0.00496) -0.133 (0.315) -0.411 (0.882) -0.0366**(0.0159) 0.318 (0.225) -0.811* (0.485)
Taxation 0.0002(0.000978) 0.0079 (0.0167) 0.0234 (0.0496) -0.0021(0.0030) 0.0196 (0.0217) -0.0482 (0.0759)
OBSOTA 0.00410* (0.00238) 0.0938 (0.0911) 0.285 (0.253) 0.0009(0.0087) -0.0059 (0.0831) 0.0218 (0.198)
SMD -0.0005(0.00699) 0.0118 (0.184) 0.0291 (0.528) -0.0267 (0.0183) 0.234 (0.167) -0.589 (0.504)
LP 1.100*** (0.346) 24.61 (26.33) 74.93 (72.35)
ROA 0.0056 (0.0998) 0.464 (2.306) 1.316 (6.662) 0.690*** (0.260) -5.841 (6.692) 15.43*** (5.583)
CO3 0.00824 (0.0157) 0.150 (0.502) 0.468 (1.437) 0.207*** (0.0725) -1.784 (1.512) 4.612** (2.152)
GDP 0.0547* (0.0329) 1.065 (2.365) 3.287 (6.616) 0.132 (0.0993) -1.158 (0.881) 2.910 (2.667)
INF -0.00531 (0.0145) -0.0649 (0.507) -0.213 (1.439) -0.0222 (0.0380) 0.199 (0.334) -0.488 (0.904)
Const. 3.080 (5.218) 84.78* (44.15) 253.6* (140.0) -19.38* (10.67) 170.7** (80.34) -427.2 (328.9)
Obs. 131 131 131 125 125 125
chi2 115.23*** 81.38*** 62.34*** 84.81*** 10.69 19.28*
Where the dependent variables are: LLPTL, VROA, VROE and Z-score are the Risk measurements, TE1, TE2, TE3, TE4, TE5 are
the Efficiency measurments, CAP is the Capital. The independent variables are: ROA is the Profitability, SIZE is the Bank Size, Liquidity is
the Loan to total assets, Taxation is the Tax to pre-tax profit, OBSOTA is the Non-traditional activity, LP is the Labor Productivity, CO3 is
the Concentration, SMD is the Stock market development, INF is the Inflation, GDP is the GDP growth. Standard errors in parentheses
*** p<0.01, ** p<0.05, * p<0.1

150
5.6 Summary and conclusion
In this chapter, we investigate the relationship between bank efficiency/productivity, capital,
and risk using data for 13 Jordanian commercial banks during the period 2003-2015. Our goal
was to empirically address four hypotheses. And to that task, we applied four risk and
efficiency measures in our three-stage least square structural equation modelling. And in the
measurement of efficiency, we use the Data Envelopment Analysis (DEA) method.
According to financing theory, high levels of debt and low value of equity to asset ratio
results in high risk which results in high rates of return which also explains the risk-return
trade-off theory (Van Ommeren, 2011). Some studies explained that higher profits can be
fetched by high equity to asset ratio which suggested by the study empirical evidence that ROA
has a positive and statistically significant impact on banks’ risk, while risk (all measures) has
a negative impact on capital and efficiency. As suggested by the moral hazard hypothesis,
managers of less-capitalized and low-efficient banks tend to engage in riskier investment
decisions than usual (Jeitschko and Jeung, 2005) and in line with Empirical studies of (Demsetz
et al, 1997) and (Salas and Saurina, 2003) report a negative effect of capital on the levels of
credit risk taken by banks. The empirical results show that there is a negative and significant
relationship between risk (Z-score) and capitalization as found by (Tan and Floros, 2013) in
the context of the Chinese banking industry and suggested the financing theory, high levels of
debt and low value of equity to asset ratio results in high risk. The results also indicate that
bank size tends to reduce both risk and capital. While both off-balance-sheet activities and
taxation are found to increase both banks’ risk (LLPTL) and capital. (Kwan and Eisenbeis,
1997) provide evidence that efficiency and capital are relevant determinants of bank risk.
(Jokipii and Milne, 2008) found a positive relationship between short term adjustments in
banks’ capital buffers and risk. This can be explained by the high concentration rate and the
monopolistic nature of the banking market in Jordan. Stock Market Development (SMD) has
a positive impact on bank capital and efficiency, while concentration ratio negatively affects
risk, capital, pure technical efficiency, and scale efficiencies. Moreover, inflation is found to
have a positive and robust effect on all efficiency measures.
This chapter was one of the first attempts to assess the effects of the CBJ reforms and
deregulation policies on the productivity of the banking system in Jordan. Our analysis
provides robust evidence in favor of the positive effects of these reforms. Policies adopted by

151
the Jordanian banks such as the increase in their dependence on interbank funding and the
capital reserve, as well as their enhanced access to the deposit market, all contributed to
improvements in profitability, cost-efficiency, and the overall operational efficiency of
Jordanian banks. Another important factor that contributed to enhancing the Jordanian banking
system efficiency during the study period is the decline in total provisions, which reduced
banks’ total expenses. The decrease in the NPLs have further improved banks’ overall
operational efficiency. The themes of this chapter carry important implications for Jordanian
policymakers, banks’ managers, ASE, and CBJ regulators. Mainly due to the major role of the
banking system in economic development and growth, which also highlight the efficiency
indicators as critical not only for decision-makers but also to bank managers who need to
choose the right and appropriate regulatory environment. Improving the competitiveness of the
banking sector is one dimension that requires the attention of bank regulators as it was found
to be a significant factor in improving capital and efficiency measures and reducing risks in the
Jordanian banking sector, in addition to contributing significantly to better access to credit by
lowering financing obstacles for firms. Also, close attention should be given towards the
development of the Amman stock market as it provides reliable information for investors that
could help in decreasing wrong investment decisions and risk exposure. Jordanian banks are
also suggested to further engage –cautiously- in the unconventional banks’ off-balance-sheet
activities as they contribute positively to banks’ capital, but at the cost of higher risk.

152
CHAPTER 6
The Impact of Bank Efficiency and Competition on Cost of
Credit: Evidence from Jordan’s Banking System
6.1 Introduction
The Jordanian economy is a mix of different sectors. The services, industrial and banking
sectors are the most important and profitable sectors in Jordan and have a huge contribution to
the economic development. In terms of gross domestic product (GDP) generated, the
mentioned sectors greatly value the Jordanian economy.
Despite its size, the country has one of the most developed and stable banking systems in the
region. Looking at the development of the financial system, the Jordanian financial system may
be categorized as a bank-based financial system in which banks play a pivotal role in financial
intermediation, the transformation of savings into investments, allocation of scarce capital
resources, risk sharing and risk diversification. One of the main roles of the country banking
system is to provide households and business with the needed fund. the relationship between
efficiency and competition on the cost of credit is one of the main subjects that have an impact
on profitability and economic growth.
The objective of this chapter is to empirically test the effects of bank efficiency and
competition on the cost of credit for borrowing firms using pooled OLS, Fixed effect (FE) and
Random Effect (RE) methods based on data from 118 firms. In so doing, this chapter seeks to
answer the main question. Whether competition affects the cost of credit and how changes in
bank efficiency affect the cost of credit? The importance of this study lies in evaluating the
policy measures that have been enforced by the Central Bank of Jordan (CBJ) to liberalize the
banking sector in the banks' attempts to improve bank efficiency and, on the basis of the issues
examined, fills an important gap in the literature on banking efficiency in developing countries
using Jordanian data. In the literature, only a few studies have looked at the efficiency and
competition of the banking sector in developing countries using Middle East region data on the

153
cost of credit. To check for the robustness of the generated results, we use different proxies for
efficiency measures. The rest of the chapter is organized as follows: Section 6.2 provides a
brief review of the literature. Section 6.3 presents the empirical approach. Section 6.4 presents
the empirical results, and Section 6.5 provides the summary and conclusion.
6.2 Literature review
After the financial crisis of 2008, the Central Bank of Jordan prioritized safety over profitability
inside the Jordanian banking sector with less attention is given to studying the impact of bank
adopted safety measures on efficiency and productivity indicators of banks. A large body of
empirical literature considers the influence of bank competition and efficiency on access to
credit. Several studies have investigated how bank competition and efficiency influence access
to credit (Beck et al., 2004); our work departs significantly from the existing empirical
literature by focusing on the role of bank efficiency. The market power hypothesis, i.e. that
greater bank competition is associated with better access to credit. For example, Beck et al.
(2004) found a positive impact of bank concentration on financing obstacles. (Shamshur and
Weill, 2019) found that bank efficiency reduces the cost of credit, where improvements in bank
efficiency tend to be strongly associated with a lower cost of credit. (Sapienza, 2002) note that
efficient banks are more able to offer borrowing firms’ loans at lower costs than their less
efficient competitors. Using a sample of Spanish small and medium-sized enterprises (SMEs),
Carbo-Valverde et al. (2009) analyze the relationship between bank competition and credit
availability, they found that greater bank competition is associated with lower credit
constraints. For a sample of firms from 20 European countries, Ryan et al. (2014) examine the
impact of bank competition measured by the Lerner index on credit. They found that bank
competition diminishes credit constraints.
(Petersen and Rajan, 1995) found that lower loan rates are placed in the concentrated
banking markets which supports the information hypothesis. In contrast, (Sapienza, 2002, for
Italy; Kim et al., 2005, for Norway; and Degryse and Ongena, 2005, for Belgium) supports the
market power hypothesis, and found a positive influence of bank concentration on loan rates.
(Berger et al. 2005) and (Berger et al., 2017) found that large banks grant fewer loans to small
businesses. (Laeven et al. 2014) found that large banks can consequently focus on a different
set of activities to small banks.
Over the last two decades, the cost-efficiency of banks is a broad measure of bank

154
performance that has frequently been utilized in empirical banking literature. It measures the
ability of a bank to operate at a lower cost by comparing its cost structure to that of a best-
practice bank. The goal of improving the performance of financial institutions links to bank
efficiency. One the other hand, recently the effects of bank competition on economic welfare
and growth have huge attention. Increased competition in the banking industry has dubious
benefits due to the peculiar features of the industry. Bank competition can be detrimental to
financial stability, and the information asymmetries influence the relationship between bank
competition and access to credit ( Beck et al., 2006; Berger et al., 2009; Schaeck et al., 2009;
Beck et al., 2013; Ryan et al., 2014 ).
A conflicting prediction of the impact of competition on access to credit has been shown
in the literature. Greater bank competition relaxes financing constraints and leads to lower
lending rates suggested by the market power hypothesis which is in line with the general
economic theory that suggests that greater competition is associated with lower prices. The
information hypothesis arguing that increased bank competition bolsters financing obstacles
and drives up lending rates it is assumed that lower competition increases the incentive for
banks to invest in relationship lending. Thus, a higher level of bank competition lowers
investment in banking relationships and impairs access to credit (Petersen and Rajan, 1995;
Dell’Ariccia and Marquez, 2006).
The majority of studies have shown a preference to investigate these dynamic relations
using data for a selection of developed countries using various approaches. Examples include
(Shamshur and Weill, 2019); (Sapienza, 2002). Thus, the present study is an important addition
to the existing body of studies reported in the literature since 2000. Therefore, this chapter
focuses on determining whether variables such as size, tangible assets, competition, efficiency,
and growth are affecting the cost of credit. Furthermore, it is hoped that investors can use the
results to make better funding decisions and thereby in profitable listed industrial and services
companies in Jordan. This chapter examines how bank efficiency and competition influence
the borrowing cost of 118 Jordanian firms in the industrial and services sector and using data
for a sample of 13 Jordanian banks covering the period 2003-2015, contributes directly to the
literature due to the shortage of studies that address the relationship between Jordanian bank
efficiency and competition on the cost of credit.

155
6.3 Empirical Approach
6.3.1 Data
This chapter examines the magnitude and direction of the dynamic relationships between bank
efficiency/productivity and competition on the cost of credit for 13 Jordanian commercial
banks in response to the imposed capital requirements during the period 2003-2015. For the
cost of credit models, we have a sample of 1521 firm observations for 118 firms in the industrial
and services sector of the Jordanian market. Data are sourced from ASE, ABJ, and CBJ, and
the commercial Jordanian bank’s annual reports. Tables 6.1 present variables definitions and
notations.
Table 6 1Variables’ definitions and sources (cost of credit model). Variables Measurement Type Sources
Dependent Variables
Cost of Credit CostofCredit (financial expenses /total debt) –interbank
interest rate.
Bank-specific Annual Reports
Independent Variables
Firm size Size Natural logarithm of total assets Firm-specific Annual Reports
Tangibility Tangibility tangible fixed assets /total assets Firm-specific Annual Reports
Competition Lerner Measure of market power in the banking
market that compares output pricing and
marginal costs.
Bank-specific World Bank.
Concentration CO3 Assets of three largest banks as a share of
total commercial banking assets
Bank-specific Annual Reports
Efficiency TE1 Technical efficiency Bank-specific Annual Reports
TE2 Technological Bank-specific Annual Reports
TE3 pure technical efficiency Bank-specific Annual Reports
TE4 scale efficiency Bank-specific Annual Reports
TE5 productivity Bank-specific Annual Reports
Inflation Rate INF Annual inflation rate Macro CBJ
GDP Growth rRte GDP Annual GDP growth rate Macro CBJ

156
6.3.2 Descriptive statistics
Tables 6.2 report the variables’ descriptive statistics. The mean value of bank TE1, TE2, TE3,
TE4, and TE5 are 100.42, 102.33, 100.31, 100.15, and 102.75 with the standard deviation
approaching 6.99, 9, 6.35, 4.62, and 10.74 respectively. Regarding the cost of credit models,
firm size, cost of credit, and tangibility have mean values of 7.50, 4.05, and 36.07 and standard
deviations of values 0.61, 7.24, and 27.52 respectively. Lerner and CO3 have mean values of
37.21, 68.81301 and standard deviation values of 5.44 and 3.70 respectively. The five
efficiency measures have mean values of 100.42, 102.33, 100.31, 100.15, 102.75 and standard
deviation values of 6.99, 9.00, 6.35, 4.62, and 10.74 respectively. Inflation and GDP have mean
values of 4.74, 4.14 and standard deviation values of 2.47, and 3.44 respectively.
Table 6 2Summary statistics (cost of credit model)
VARIABLES Obs Mean Std. Dev. Min Max
Cost of Credit 1,164 4.0596 7.2462 -6.495 101.93
Firm Size 1,253 7.5044 .6147 5.7355 9.2513
Tangibility 1,250 36.0709 27.5217 .0033 97.9373
Lerner 1,521 37.2153 5.4468 22 43.6557
C3 1,521 68.8130 3.7012 62.6021 76.0322
TE1 1,521 100.429 6.9908 82 147.6
TE2 1,521 102.337 9.0058 75.6 128.5
TE3 1,521 100.313 6.3561 74.1 144
TE4 1,521 100.153 4.6224 83.3 126.5
TE5 1,521 102.758 10.7452 75.6 145.5
GDP 1,521 4.7430 2.4796 2.3 8.53
INF 1,521 4.1469 3.4460 -.7 14
This table provides descriptive statistics for the main firm-level variables used in the econometric analysis.
Note: statistics calculated using STATA 5.1.
6.3.3. Efficiency and cost of credit models
Our empirical strategy draws on the insights of (Shamshur and Weill, 2019) and use the
pooled, FE, and RE modelling used to estimate the models. TE, TE2, TE3, TE4, and TE5 is
the proxy for the bank’s efficiency and measured using the Malmquist productivity index.
Bank, Ind, and Mac are the bank-specific, industry-specific and macroeconomic factors that

157
influence the efficiency/productivity and cost of credit relationship. We use the Malmquist
Productivity Index (MPI) to calculate efficiency (TE). Malmquist productivity index uses input
and output distance functions to measure changes in productivity. The index is calculated based
on s-technology and is expressed as follows:
00
0
( , )( , , , )
( , )
ss t t
s t s t s
s s
d q qxm q q x x
d q x= (6.1)
In this study, we use the non-parametric methods represented by the Malmquist index
proposed by (Malmquist, 1953) and later developed by (Douglas et al., 1982). This index
measures total factor productivity between two banks or one bank over time. We also measure
technical efficiencies using the non-parametric method, DEA. DEA technique utilizes the
number of variables (inputs and outputs) and not their prices and thus does not require any
relationship between inputs and outputs. Using more than one form of inputs and outputs of
the Decision-Making Unit (DMU) is one of the DEA advantages (Graham et al., 2005).
Defining and selecting banks’ inputs and outputs for the DEA method is based on one of three
approaches, production approach, intermediation approach, and value-added approach. We
also use the intermediation approach in the selection of inputs and outputs which defines the
bank as an intermediary that transfers assets from surplus units to deficit units (Paul and
Kourouche, 2008), (Alkhathlan and Malik, 2010). In calculating the index we use four inputs
(number of full-time employees, total deposits, total assets, and interest expenses) and two
outputs (loans and interest income) following (Varesi, 2015). Loans are considered one form
of output from deposits (inputs) as noted by (Sealey and Lindley, 1977), (Lang and Welzel,
1996), and (Ashton and Pham, 2011).
The key firm-level variable is the cost of credit which measures the difference between
the ratio of financial expenses divided by bank debt and the interbank interest rate. Bank debt
is the sum of short-term and long-term debts (Altunbas et al. 2007). Using the implicit interest
rate component as part of the variable is consistent with the fact that the majority of our sample
consists of micro and small enterprises. These firms in general lack access to non-bank funding
sources, thus loan expenses are their main funding costs. Following (Shamshur and Weill,
2019) we use two firm-level control variables. The first is firm size (natural logarithm of total
assets), since firms of different sizes have different financing needs and patterns. The second
is tangibility (ratio of tangible fixed assets to total assets). A greater share of tangible fixed
assets facilitates credit accesses. We also consider two macro-specific control variables, GDP

158
and Inflation.
Since our main goal is to analyse the impact of bank efficiency and competition on the
cost of credit, we regress the cost of credit on the five efficiency scores and a set of control
variables as shown in Models 6.2 and 6.3 below:
(6.2)
𝐶𝑜𝑠𝑡𝑜𝑓𝐶𝑟𝑒𝑑𝑖𝑡𝑖𝑡 = 𝛼 + 𝛽1 𝑆𝑖𝑧𝑒𝑖𝑡 + 𝛽2 𝑇𝑎𝑛𝑔𝑖𝑏𝑖𝑙𝑖𝑡𝑦𝑖𝑡 + 𝛽3 𝐿𝑒𝑟𝑛𝑒𝑟𝑖𝑡 + 𝛽4 𝐶𝑂3𝑖𝑡 +
𝛽5 𝑇𝐸𝑖𝑡 + 𝛿1 𝐺𝐷𝑃𝑖𝑡 + 𝛿2 𝐼𝑁𝐹𝑖𝑡 + 휀𝑖𝑡 (6.3)
where y it is the cost of bank credit for firm i in year t; X is a set of firm-specific variables (firm
size, tangibility); Z is a set of macro-specific variables (GDP, Inflation) and εit is a random error
term. Our main independent variables are efficiency (TE1, TE1, TE3, TE4, TE5) and
competition (Lerner Index) measures. The endogeneity problem is greatly reduced since bank
efficiency is computed at the bank level, while the cost of credit is firm-level information
obtained from a different data source. All models are estimated with Pooled OLS, FE and RE
methods. Estimation results appear in Table 6.3 and 6.4.
6.3.4 Empirical methodology
We estimate our cost of credit models using Pooled OLS, FE and RE methods. We
estimate five models incorporating each one of the efficiency measures as the main independent
variables while controlling for a set of firm, industry and macroeconomic variables. We start
our analysis by pooling the panel data and estimating it using ordinary least squares (OLS)
regression. This method ignores the firms' heterogeneities and un order to correct for this bias,
we use both FE and RE approaches to account for the distinct nature of each firm and control
for the unobserved fixed effects that are constant over time and correlated with the dependent
variables, such as Jordan's geographical location and cultural norms. These methods capture
the within-variation across firms and time-related shocks that affect all firms such as global
financial crises (Bjorvatn and Farzanegan, 2013). We also use RE method, wherein the main
difference between RE and FE is that RE uses GLS to produce the estimates while assuming
that the unobserved heterogeneity is uncorrelated with the regressors. As we using panel data,
the FE and RE methods are the more appropriate way to estimate the coefficients of the

159
parameter and explain the relationship between variables.
6.4 Results
6.4.1 Efficiency, Competition and cost of credit results
Table 6.3 and 6.4, reports the OLS, FE and RE estimations results of Model 6.2 and 6.3. We
divided the sample into to sub-sample; large and small firm size. The result show that firm size
and GDP are the main moderators of the cost of credit in all models. Our results are in line with
(Fungáčová et al., 2014). Small firms have limited access to credit facilities and they tend to
incur larger loan costs when borrowing from banks relative to bigger firms. The negative
coefficient of GDP implies that during periods of economic development the cost of credit
tends to be smaller due to lower information asymmetries (Godlewski, 2004). A high Lerner
index, which measures the extent of competition between banks, reduces cost of credit.
According to the market power and information hypotheses which suggest that greater bank
competition reduce loan rates. As competition intensifies the operational efficiency of the
banks tends to improve. Efficient banks are more able to offer borrowing firms’ loans at lower
costs than their less efficient competitors as (Sapienza, 2002) notes. Thus, bank efficiency has
no significant impact on the cost of credit. Finally, inflation increases the cost of credit. During
inflationary periods the value of money diminishes and this, in turn, forces firms to borrow
more to sustain their operations. A large demand for loans prompts banks to levy higher charges
for that credit, so borrowing costs rise. greater economic development tends to reduce the cost
of credit. This might be explained by the fact that access to credit is easier in developing
countries, so young, riskier firms are also able to obtain credit.
The results show that no differences in findings in regards to the impact of variables on
the cost of credit for both large and small banks. Th e only difference found with the Tangibility
as the variable show a positive significant impact on the cost of credit in the large size firms
while it is insignificant for the small size firms. The positive relation explained as the
Tangibility defined as the ratio of tangible fixed assets to total assets. A greater share of tangible
fixed assets that could serve as collateral can contribute to easier access to credit and may
indicate better opportunities for obtaining external financing.

160
Table 6 3OLS, Fixed and random estimations for the relationship between cost of credit, bank efficiency and competition. Model where Efficiency =
TE1
Model where Efficiency =
TE2
Model where Efficiency =
TE3
Model where Efficiency =
TE4
Model where Efficiency =
TE5
Pooled OLS RE Pooled OLS FE Pooled OLS FE Pooled
OLS
RE Pooled OLS RE
Size -1.088*** -1.082** -1.082*** -1.858 -1.080*** -1.076** -1.099*** -1.088** -1.096*** -1.097** (0.347) (0.525) (0.348) (1.410) (0.348) (0.525) (0.347) (0.528) (0.347) (0.512) Tangibility 0.0090 0.0084 0.0089 0.0085 0.0089 0.0083 0.0090 0.0084 0.0090 0.0083 (0.0075) (0.0103) (0.0075) (0.0169) (0.0075) (0.0103) (0.0075) (0.0103) (0.0075) (0.0101) TE1 0.0844 0.0706 -0.0784 -0.0886 0.112 0.0936 -0.0129 -0.0100 -0.0348 -0.0440 (0.0932) (0.0856) (0.0702) (0.0665) (0.105) (0.0968) (0.197) (0.180) (0.0760) (0.0704) Lerner -0.0794* -0.0852** -0.0867* -0.101** -0.0829* -0.0880** -0.0655 -0.0737** -0.0694* -0.0780** (0.0428) (0.0393) (0.0443) (0.0407) (0.0432) (0.0397) (0.0401) (0.0368) (0.0409) (0.0377) CO3 0.150 0.150 0.197* 0.191* 0.146 0.146 0.141 0.143 0.162 0.169 (0.105) (0.0977) (0.116) (0.108) (0.105) (0.0975) (0.106) (0.0983) (0.114) (0.106) GDP -0.769*** -0.768*** -0.775*** -0.796*** -0.762*** -0.762*** -0.726*** -0.733*** -0.732*** -0.738*** (0.133) (0.122) (0.132) (0.123) (0.129) (0.119) (0.131) (0.120) (0.125) (0.116) INF 0.167** 0.155** 0.216** 0.217** 0.179** 0.165** 0.143** 0.134** 0.165** 0.163** (0.0683) (0.0627) (0.0908) (0.0869) (0.0713) (0.0655) (0.0627) (0.0575) (0.0792) (0.0733) Const. -1.022 0.666 12.22 20.13 -3.502 -1.412 8.853 8.789 9.698 10.61 (11.88) (11.46) (8.348) (14.89) (12.65) (12.14) (21.56) (20.09) (8.635) (8.850) Obs. 1,162 1,162 1,162 1,162 1,162 1,162 1,162 1,162 1,162 1,162 R-squared 0.048 117 0.048 0.053 0.048 117 0.047 117 0.047 117
Where the dependent variable is: CostofCredit is the Cost of Credit. The independent variables are: Size is the Firm size, Tangibility is the Tangibility, Lerner is the Competition, CO3 is the
Concentration, INF is the Inflation rate, GDP is the GDP growth rate. Standard errors in parentheses *** p<0.01, ** p<0.05, * p<0.1

161
Table 6 4OLS, Fixed and random estimations for the relationship between cost of credit, bank efficiency (total factor productivity) and competition (Large and
Small Companies 2003-2015).
Large Firm Size Small Firms Size
Pooled OLS RE Pooled OLS RE
Size -.3382 -.3382 -18.939 -18.9396
(2.3028) (2.3028) (19.6208) (19.6208)
Tangibility .0903*** .0903*** .0221 .0221
(.0230) (.0230) (.3240) (.3240)
TE5 -.0481 -.0481 -5.5930* -5.5930
(.2026) (.2026) (3.3368) (3.3368)
Lerner -.0908 -.0908 -.3265 -.3265
(.1142) (.1142) (1.7497) (1.7497)
CO3 .0773 .0773 .5231 .5231
(.2922) (.2922) (5.1314) (5.1314)
GDP -.4688 -.4688 6.5157 6.5157
(.3325) (.3325) (5.4854) (5.4854)
INF .1417 .1417 3.4530 3.4530
(.2229) (.2229) (3.4414) (3.4414)
Const. 7.1287 7.1287 650.305 650.305 (30.3846) (30.3846) (427.1104) (427.1104)
Obs. 152 152 999 999
R-squared 0.1490 0.5014 0.0058 0.3577
Where the dependent variable is: CostofCredit is the Cost of Credit. The independent variables are: Size is the Firm size, Tangibility is the Tangibility, Lerner is the Competition, CO3 is the
Concentration, INF is the Inflation rate, GDP is the GDP growth rate. Standard errors in parentheses *** p<0.01, ** p<0.05, * p<0.1

162
6.6 Summary and conclusion
In this chapter, we investigate the relationship between bank efficiency, competition on the
cost of credit using data for 13 Jordanian commercial banks and 118 firms during the period
2003-2015. In the measurement of efficiency, we use the Data Envelopment Analysis (DEA)
method. Unlike what was expected, the efficiency of the banking sector has no impact on firms’
cost of credit, other determinants such as firm size, bank competition, and GDP are found to
be the main moderatos of the borrowing costs. Our results are in line with (Fungáčová et al.,
2014)
This chapter was one of the first attempts to assess the effects of the CBJ reforms and
deregulation policies on the productivity of the banking system in Jordan. Our analysis
provides robust evidence in favor of the positive effects of these reforms. Another important
factor that contributed to enhancing the Jordanian banking system efficiency during the study
period is the decline in total provisions, which reduced banks’ total expenses. The themes of
this chapter carry important implications for Jordanian policymakers, banks’ managers, ASE,
and CBJ regulators. Mainly due to the major role of the banking system in economic
development and growth, which also highlight the efficiency indicators as critical not only for
decision-makers but also to bank managers who need to choose the right and appropriate
regulatory environment. Improving the competitiveness of the banking sector is one dimension
that requires the attention of bank regulators as it was found to be a significant factor in
improving capital and efficiency measures and reducing risks in the Jordanian banking sector,
in addition to contributing significantly to better access to credit by lowering financing
obstacles for firms. Jordanian banks are also suggested to further engage –cautiously- in off-
balance-sheet activities as they contribute positively to banks’ capital, but at the cost of higher
risk.
Thus, our findings are of particular importance to policymakers who aim to design
policies improving access to credit. Specifically, fostering bank efficiency could play an
important role in financing the economy as a whole. The results show that minimizing the entry
restriction of new banks improves competition the market, which will help lower the cost of
fund for the large and small firms, resulting in improved and enhanced growth.

163
Chapter 7
Liquidity Funding and Risk-Taking Behavior of
Jordanian Commercial Banks
7.1 Introduction
Before the global financial crisis of 2008, the banking sector in Jordan did not have a
functioning credit risk management system and, as a result, many banks were found to be either
ill-prepared to be well-positioned to safely manage and control the transmission of shocks to
the financial system or inadequate. This was made more apparent by the excessive losses
incurred by the Housing Bank (Jordan’s largest bank), due to the collapse of subsidiaries in
neighbouring countries such as Syria. At the time of the announcement, banking officials
announced that the financial losses incurred could have been avoided had there been in place
internal credit risk management system capable of anticipating the occurrence of credit events
that might threaten the financial viability of the bank. A credit event or credit risk is not the
only risk faced by banks, since banks are exposed to various types of risk including market
risk, and liquidity risk. While credit risk has received much attention in the literature, it was
only at the height of the global financial crisis that researchers began to pay attention to the
implications of liquidity risk for the financial system and the wider economy. Liquidity risk
measures the ability of banks to cover their obligations and to expand their resources via
acquiring new assets. This suggests that when one bank within the banking system fails to
secure stable liquidity funding it creates a potential threat to the whole banking system.
Banks generally face two types of liquidity risk. The first relate to liquidity funding,
while the second relates to market liquidity. Liquidity financing refers to the sustained efforts
of the banks to satisfy their commitments in due time. The capability of banks to manage this
type of risk has in recent time become increasingly difficult, especially during times of financial
market stresses and failure. For example, the collapse in the value of mortgage related assets
has led to liquidity problems affecting entire financial systems. Such financial system failure
has the potential to impede the ability of banks to meet immediate obligations thereby resulting
in the failure of the banking system. It is for this reason why liquidity risk is considered one of

164
the main threats to financial system stability and, in turn, why maintaining liquidity buffer is
touted as key strategy to mitigate these risks. Several studies, such as (Hong et al., 2014) report
that banks’ failure in managing liquidity risk is one of the main triggers of the 2008 global
financial crises, and (Acharya and Naqvi, 2012) note that maintaining high levels of assets
increase bank risk. (Keeley, 1990), however, notes that deposits tend to decrease liquidity risk,
while deposit insurance increase banks’ moral hazard. The point being that the ensued moral
hazard can lead to a vicious cycle where banks might be tempted to make excessive risk-taking
choices in order to fund their liquidity, thereby threating the bank’s stability. It is for this reason
why studies such as (Acharya and Naqvi, 2012) and (Ivashina and Scharfstein, 2010) advocate
the bank risk-mitigating effects of lowering liquidity funding risks.
The purpose of this chapter is to first investigate the impact of liquidity funding
measures on the risk of Jordanian commercial banks using Fixed (FE) and Random (RE) effects
models. And the second is to analyze the impact of the deposit insurance scheme applied in
Jordan on the liquidity creation of Jordanian commercial banks using the Difference in
Difference (DiD) approach for the period 2003-2015. This study utilizes z-score as a measure
of overall bank risk, liquidity creation as a measure of a bank’s default, and loan-loss provision
and risk-weighted assets as measures of a banks’ assets quality. Our empirical analysis also
incorporates a set of control variables to account for other factors that influence liquidity-
funding risks such as capital, size, interest rate, and selected macroeconomic variables. To
check for the robustness of the generated results, we use different proxies for banks' risk
measures. To the best of our knowledge, the analysis presented in this chapter is the first of its
kind to shed light on the linkages between liquidity-funding measures and the risk-taking
behavior of Jordanian commercial banks as well as the factors affecting their risk levels.
Furthermore, the empirical results navigate the policies of decision-makers into the direction
of effective risk-mitigation and management. Such careful formulation of policies will
hopefully make the banking system less vulnerable to global and regional financial and
economic shocks.
This chapter is organized as follows. Section 7.2 summarizes the literature and the
theoretical motivations for the aim of the study. Section 7.3 presents an overview of the
institutional background of the Jordanian banking system. Section 7.4 describes the data and
methodology. Section 7.5 presents the results and discussion. Finally, the conclusion is
provided in Section 7.6.

165
7.2 Literature review
Until recently, liquidity creation was not a focal theme in the empirical literature. Starting with
the pioneering work of (Berger and Bouwman, 2009), who developed the first detailed liquidity
development measure that includes all bank balance sheet items (assets, liabilities, equity, and
off-balance sheet activities), as well as positive (both illiquid assets and liquid liabilities) and
negative weights (liquid assets, illiquid liabilities, and equity) for measurement of liquid assets
and liquid liabilities, which they applied to a panel of U.S. banks for the period 1993-2003.
(Berger and Bouwman, 2009) report that in general liquidity creation increased over time and
that in large banks the relationship between capital and liquidity creation is positive while the
same relationship is negative for small banks. Others researchers such as (Fidrmuc et al., 2015),
(Berger et al., 2016), and (Fungáčová et al., 2017) extend (Berger and Bouwman’s, 2009)
approach to examine the determinants of liquidity creation and its consequences for financial
stability. While (Lei and Song, 2013), (Fungáčová et al., 2017) have shown that size and
deposit insurance may be among the reasons for the negative association between capital and
liquidity creation which might explain why liquidity creation increases the probability of bank
failure (Fidrmuc et al., 2015). On a related issue, (Berger et al., 2016) note that liquidity
creation is sensitive to regulatory interventions and bailouts and to monetary policy depending
on the general economic conditions, while (Hankir et al., 2011) suggests that bank size might
be a key factor. Using data for Chinese banks, (Lei and Song, 2013) found a negative
relationship between liquidity creation and bank capital and (Berger and Sedunov, 2017) point
to macroeconomic variables such as economic growth as factors with the potential to foster a
positive association between bank liquidity creation in the US. (Fidrmuc et al., 2015) provides
similar reasons for Russia.
Turning to the determinants of risk, (Bluhm and Krahnen, 2014) argue that systemic risk
increases with increase in liquidity supplies from central banks. (Cifuentes et al., 2011) and
(Gauthier et al., 2012) note that capital adequacy, interbank assets, and illiquid assets are
among the risk determinant factors. The risk absorption hypothesis suggests that when banks
have higher risk tolerance, banks with more capital, are better able to absorb more risk, which
allows them to create more liquidity (Bhattacharya and Thakor, 1993, Coval and Thakor, 2005,
Repullo, 2004, and von Thadden, 2004).
Studies such as (Peek and Rosengren, 1995) report evidence which suggest that lending
activities decreased as a result of the reduction in bank capital ratios incurred from loan losses,

166
while (Diamond and Rajan, 2000, 2001) suggest that having more capital translates into larger
liquidity creation. In contrast, (Gorton and Winton, 2005) cautions that increasing bank capital
and deposits can cause a decrease in liquidity creation, while (Berger et al., 1994), (Hancock
et al., 1995) and (Peek and Rosengren, 1995) report the presence of a negative association
between bank liquidity creation and capital.
In order to effectively manage liquidity risks, banks are required to maintain a buffer of
liquidity as one means of protection against possible shocks. Recently, it has been shown by
(Hong et al., 2014) that liquidity risk was one of the main contributors of the 2009-2010 bank
failures. Based on the theoretical insights of (Acharya and Naqvi, 2012) and (Wagner, 2007),
bank risk and quality of assets were found to be positively correlated and banks with higher
deposits were characterized as having less funding liquidity risk, which the feeds into the bank
risk-taking behavior. (Keeley, 1990) noted that deposit insurance can also feed into a bank’s
risk-taking behavior.
Following (Jensen, 1986) hypothesis, it may be argued that when bank managers have
free cash flows, that they might be tempted to make poor investment decisions that increase
bank risk taking behavior. In the literature, there does exists some evidence for the negative
association between bank risk and lower funding liquidity risk. For example, (Ivashina and
Scharfstein, 2010) found that bank excessive lending behavior during times of access to large
deposit funding contributed to the triggering of the 2008 global financial crises. And (Wagner,
2007) notes that banking system instability increases with higher liquidity. However,
(Marques-ibanez et al., 2014) have argued that low-interest rates increase banks risk behavior,
while (Berger and Bouwman, 2012) report findings which indicate that the monetary policy
effects on liquidity creation can be larger for small banks than for large banks. On the other
hand. (Kashyap and Stein, 2000) found no such evidence of the impact of monetary policy on
lending or liquidity creation.
7.2.1 Theoretical motivation
Our fourth empirical investigation well supported by existing theoretical frameworks
in the literature. Starting with (Acharya and Naqvi, 2012) who show theoretically the result of
large amounts of deposit inflows, banks have lower funding liquidity risk and the bank
managers take more risk by lowering the lending rate aggressively to increase loan volumes in
order to enhance their own compensation. For example, if the bank's funding liquidity deficit

167
is sufficiently large, an audit should be performed to investigate managers’ decisions regarding
the lending standard as a part of risk management. In relation to aggressive lending, banks may
face a capital shortfall, which may trigger bank failure. The classical principal-agent theory,
(Cheng et al. 2015) shows that risk-averse managers require higher compensation levels to
work in riskier financial firms that put their wealth under greater uncertainty. Hence, to achieve
the higher compensation levels required by managers to work in riskier banks, they follow
aggressive lending strategies as a result of the large amounts of deposit inflows. We develop
our core hypotheses in the subsequent section.
7.3 Institutional background of the Jordanian banking system
In 2000, Jordan deposit insurance corporation (JODIC) was established as a financially
and administratively independent corporation to reimburse depositors with the maximum
coverage limit of JD 50,000 per depositor. JODIC objective is maintaining the effectiveness of
the explicit-limited deposit insurance system in Jordan as well as providing full protection to
depositors. The ratio of insured depositors reached 97.4 percent of total eligible depositors by
the end of 2018. All Jordanian banks and branches of foreign banks operating in Jordan are
under the umbrella of JODIC. The ultimate objective of JODIC is managing the liquidation
processes efficiently and forcing banks to adopt proper risk management policies. In 2015, the
Central Bank of Jordan (CBJ) informed the banks about a set of instructions for implementing
the Basel III requirements. Starting with the regulatory capital components under the Basel III
agreement, Jordanian banks were required to maintain the following measures as ratios of each
bank risk-weighted assets (RWAs): minimum common equity capital (CET1) of 6.0 percent,
maximum additional Tier-1 capital (AT1) of 1.5 percent, maximum Tier-2 (supplemental)
capital of 2.0 percent, mandatory capital conservation buffer, equivalent to 2.5 percent,
minimum capital adequacy ratio of 12.0 percent for banks inside Jordan and 14 percent for
banks outside Jordan. Domestically-important systemic banks were also required to specify
clearly the methodology for calculating the countercyclical capital buffer and the capital buffer
required to enhance their methodologies for calculating capital levels in the event of operational
risks by including the standardized approach, and to include a section for the calculation of
leverage ratio (LR), and the recalculation of minority interest in regulatory capital.
Following the implementation of the Basel III requirements, capital adequacy
requirements has increased relative to levels that prevailed during the implementation of the
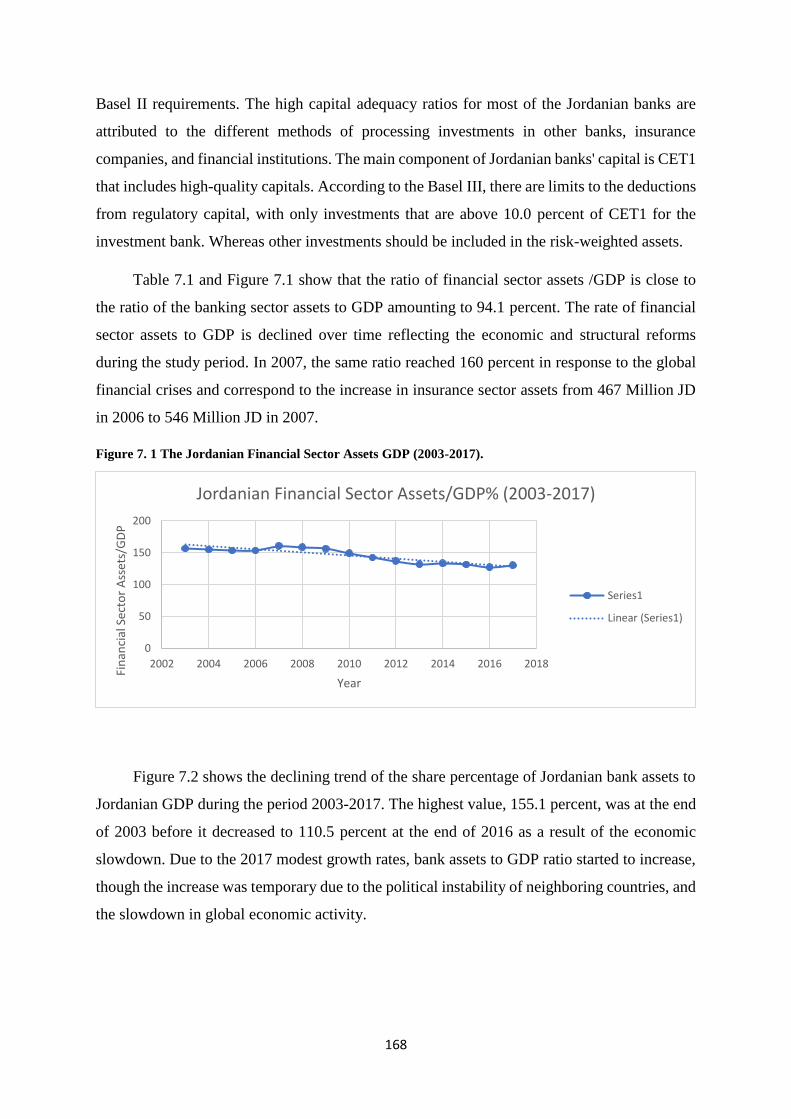
168
Basel II requirements. The high capital adequacy ratios for most of the Jordanian banks are
attributed to the different methods of processing investments in other banks, insurance
companies, and financial institutions. The main component of Jordanian banks' capital is CET1
that includes high-quality capitals. According to the Basel III, there are limits to the deductions
from regulatory capital, with only investments that are above 10.0 percent of CET1 for the
investment bank. Whereas other investments should be included in the risk-weighted assets.
Table 7.1 and Figure 7.1 show that the ratio of financial sector assets /GDP is close to
the ratio of the banking sector assets to GDP amounting to 94.1 percent. The rate of financial
sector assets to GDP is declined over time reflecting the economic and structural reforms
during the study period. In 2007, the same ratio reached 160 percent in response to the global
financial crises and correspond to the increase in insurance sector assets from 467 Million JD
in 2006 to 546 Million JD in 2007.
Figure 7. 1 The Jordanian Financial Sector Assets GDP (2003-2017).
Figure 7.2 shows the declining trend of the share percentage of Jordanian bank assets to
Jordanian GDP during the period 2003-2017. The highest value, 155.1 percent, was at the end
of 2003 before it decreased to 110.5 percent at the end of 2016 as a result of the economic
slowdown. Due to the 2017 modest growth rates, bank assets to GDP ratio started to increase,
though the increase was temporary due to the political instability of neighboring countries, and
the slowdown in global economic activity.
0
50
100
150
200
2002 2004 2006 2008 2010 2012 2014 2016 2018
Fin
anci
al S
ecto
r A
sset
s/G
DP
Year
Jordanian Financial Sector Assets/GDP% (2003-2017)
Series1
Linear (Series1)

169
Figure 7. 2 The Jordanian Banking Sector Assets GDP (2003-2017).
Table 7 1The Jordanian Financial and Banking Sector Assets to GDP (2003-2017).
Year Financial Sector Assets FSA Banking Sector Assets BSA GDP FSA/GDP% BSA/GDP%
2003 24600993368 24354128778 15701500000 156.6793 155.1070
2004 27654935684 27360826500 17821100000 155.1809 153.5305
2005 32326758291 30681845191 21086500000 153.3055 145.5047
2006 37148152638 34819032775 24237600000 153.2666 143.6571
2007 43039454268 40045732144 26815600000 160.5016 149.3374
2008 47307300812 43357261576 29796600000 158.7675 145.5108
2009 49950755209 46142487538 31956900000 156.3066 144.3897
2010 52124970563 48477966019 34973100000 149.0430 138.6150
2011 53618237189 50516950642 37686400000 142.2748 134.0456
2012 53781256010 50851049780 39275400000 136.9337 129.4730
2013 56464591349 53564754962 42802800000 131.9180 125.1431
2014 59842710711 57154358829 44868100000 133.3747 127.3831
2015 61992086490 54600231585 47133200000 131.5253 115.8424
2016 61481192355 53468221280 48383500000 127.0706 110.5092
2017 64117629063 60943120053 49102500000 130.5792 124.1141 Source: ABJ; CBJ (Stability Report).
7.4. Methodology
Our analysis starts with estimating our models using the constant coefficients (pooled
regression) model. The basic results of the pooled models are problematic because they assume
that our cross-sections are not heterogeneous and that the average values of the variables are
constant across banks. To solve this problem, we use a fixed/random effects model (Brooks,
2008). The fixed-effects model decomposes the error term into an entity-specific effect and a
remainder error which varies over time and entities. The estimations results using FE, GLS and
pooled OLS are reported in Tables 7.5 – 7.13.
The random-effects model similar to the fixed-effects model proposes different
intercepts for each entity and/or each time period to get rid of correlations between error terms.
Generally, the random-effects model should be more efficient than the fixed-effects model
0
50
100
150
200
2002 2004 2006 2008 2010 2012 2014 2016 2018
Ban
kin
g Se
cto
r A
sset
s/G
DP
Year
Jordanian Banking Sector Assets/GDP% (2003-2017)
BSA/GDP%
Linear (BSA/GDP%)

170
since fewer parameters will be estimated; therefore, degrees of freedom are saved, since the
GLS method of the random effects removes only exactly as much of the variation in the
variables as is needed to remove the correlation in the error terms. To account for the problem
of endogeneity of some right-hand side variables we use one-period lags of the independent
variables. For example, reverse feedback effects can be found between bank risk measures and
macroeconomic indicators. The argument behind using lagged values is that the current values
of the dependent variable cannot influence the past values of the independent variables
(Bjorvatn & Farzanegan, 2013). Time effects are separated by inducing first differences, that
is with the assumption that time effects are varying over time. Second, the event has been
controlled in the regression and from the sample by the dummy variable which captures the
treatment/intervention effect. And even so, Fixed effects also controls for potential individual
sample effects. For testing the impact of the deposit insurance scheme, we use the DiD
approach. The estimations results appear in Tables 7.14 and 7.15. We compare changes in
liquidity creation before and after the implementation of deposit insurance. DiD is typically
used to estimate the effect of a specific intervention (deposit insurance scheme) by comparing
the changes in outcomes over time between a group that is enrolled in a program and a group
that is not. The DiD approach provides results that are robust to the potential endogeneity bias
(Cao, Zhun et al., 2011).
7.4.1 Data and empirical models
This section empirically examines the nature of the relationship between Jordanian commercial
banks' liquidity funding and risk-taking behavior using annual data during the period 2003-
2015. Our task is to test the four hypotheses earlier discussed in section 7.2.1. The first is that
having low liquidity funding risk incentives banks to take risky decisions and increases the
probabilities of banks default. The second hypothesis is that banks with high capital buffers are
less risk-taking in response during the periods of low funding liquidity risks. The third
hypothesis is that larger banks are less likely to face risks during lower funding liquidity times,
and the final hypothesis is that the 2008 financial crisis caused banks to be less willing to make
risky decisions to fund liquidity. The annual balanced panel data for 13 Jordanian commercial
banks are sourced from ASE, ABJ, and CBJ, and the commercial Jordanian bank’s annual
reports. The selection of the variables is based on the work of (Khan et al., 2017). Tables 7.2 and
7.3 report the list of the variables, their definitions, and their descriptive statistics.

171
Table 7 2Variables’ description and definitions Variable Notation Measurement Type Source
Dependent Variables
Liquidity Creation LC Liquidity creation/total assets. Liquidity creation = 0.5
×illiquid assets + 0.5 ×liquid liabilities −0.5 ×liquid
assets −0.5 ×illiquid liabilities −0.5 ×equity
Bank-specific Annual Reports
Loan loss provision LLP Loan loss provision/ total assets Bank-specific Annual Reports
Risk-weighted asset RWA Risk-weighted asset/total assets Bank-specific Annual Reports
Z-scores Z-scores Log [{return on assets + (equity/asset)}/standard
deviation of return on assets]
Bank-specific Annual Reports
Independent variables
Liquidity Funding Risk Dep Total Deposit /total assets Bank-specific Annual Reports
Capitalization CAP Total equity/total assets Bank-specific Annual Reports
Size Asset Natural logarithm of total assets Bank-specific Annual Reports
Profitability ROA Net income/total assets Bank-specific Annual Reports
Profitability ROE Net income/total equity Bank-specific Annual Reports
Loan Loan Total Loans
None Performing Loans NPL None Performing Loans
Interbank Interest Rate IRB The interest rate on interbank transactions Macro CBJ
Loan Interest Rate IRL The interest rate on loans Macro CBJ
Monetary Policy Interest Rate MIR The repurchase rate
Macro CBJ
GDP Growth Rate GDP Growth rate of GDP Macro CBJ
Unemployment Rate Unemploy unemployment rate Macro CBJ
Inflation Rate INF Annual Inflation Rate Macro CBJ
Realized financial Crisis RFC measured by the use of a dummy variable
Deposit Insurance Scheme JDIC measured by the use of a dummy variable
Source: ASE, CBJ.

172
Table 7 3Summary Statistics
VARIABLES Obs Mean Std. Dev. Min Max
LC 167 28.2883 9.8044 -1.4860 66.4363
Zscor 169 6.7126 6.2033 -0.3891 30.9863
LLP 153 0.4524 4816831 -0.3908 3.2434
RWA 113 68.0309 10.7296 37.4421 96.2632
Dep 169 74.2300 6.5468 54.1497 85.6735
Loan 169 43.8407 10.5181 0.2785 60.2790
CAP 169 13.2016 4.6503 -31.3546 21.9640
Ass 169 9.1439 0.4973 7.8250 10.4126
ROA 169 1.4344 0.7123 -1.01 4.97
ROE 169 10.5228 5.5591 -2.24 39.84
NPL 143 23.0830 84.4496 .2 650
IRB 169 3.5822 1.3296 1.964 6.495
IRL 169 8.7169 0.4759 7.59 9.48
MIR 169 5.0962 1.5348 3.5 8.5
UNM 169 13.2231 0.9244 11.9 14.8
GDP 169 4.7431 2.4796 2.3 8.53
INF 169 4.1469 3.4461 -.7 14
Note: statistics calculated using STATA 5.1.
The risk measures (LC, LLP, RWA, and Z-score) have means of 28.2, 0.45, 68, and 6.71
and standard deviations of 9.8, 0.48, 10.72 and 6.20 respectively. The mean bank Dep is 74.2
with standard deviation approaching 6.5. Loan is, on average, 43.8 with a standard variation of
10.5. CAP is, on average, 13.2 with a standard variation of 4.6. Size is, on average, 9.14 with
a standard variation of 0.49. The ROA mean is 1.4 with a standard deviation of .71. The ROE
mean is 10.5 with standard deviation of 5.5. The NPL mean is 23 with standard deviation of
84.4. The IRB mean is 3.5 with standard deviation of 1.3. The IRL mean is 8.7 with standard
deviation of .47. The MIR mean is 5.09 with standard deviation of 1.5. The UNM mean is 13.2
with standard deviation of .92. The GDP mean is 4.74 with a standard variation of 2.47. The
Inflation mean is 4.14 with a standard variation of 3.44.
For calculating liquidity creation, we consider the following variables – the fixed assets,
loan, intangible assets, investments in affiliates, other assets, cash, balances at banks and
financial institutions, deposits at banks and financial institutions, trading investments available
for sale, investments held to maturity investments, net deposits, loans and borrowing, other

173
liabilities, and total equity. Table 7.4 provides a summary of the list of determinants. Our
empirical approach follows (Berger and Bouwman, 2009):
Liquidity Creation = 0. 5 ×Illiquid Assets + 0. 5 ×Liquid Liabilities −0. 5 ×Liquid
Assets −0. 5 ×Illiquid Liabilities −0. 5 ×Equity. (7.1)
Table 7 4Summary of liquidity creation calculation: liquidity classification of bank activities. Illiquid assets *0.5
Loans Retail Customers, Real Estate Mortgages, Corporate entities, SMEs,
Governmental and public sector, Other loans
Fixed Assets Land, Buildings, Equipment, furniture and fixtures, Vehicles, Computer,
Other fixed assets
Intangible Assets Goodwill, Other intangible assets
Investments in Affiliates &
Financial assets at fair value through other
comprehensive income
Quoted Financial Assets, Unquoted Financial Assets
Other Assets
Accrued revenues and interest, Prepaid expenses, Assets seized by the
Bank, Assets seized by the Bank with customer right to recover, Cheques
under collection, Other
Liquid assets *-0.5
Cash
Cash in treasury
Balances at central banks
Balances at banks and Financial Institutions
Current accounts and demand deposits
Deposits maturing within or less than 3 months
Other
Deposits at Banks and Financial Institutions
Deposits Maturing (3-6) and (6-month -1 Year)
other
Trading Investments
Shares listed on financial markets
Bonds listed on financial market
Available for sale Investments
Shares
Bonds
Investment funds
Held to maturity investments
Treasury bills
Governmental bonds or
government guaranteed bonds
Company bonds and debentures
Other
Liquid liabilities *0.5
Deposits Banks and Financial Institutions Deposits
Customers’ Deposits
Other deposits
Illiquid liabilities *-0.5
Loan and Borrowing Borrowing from the Central Bank of Jordan

174
Other loans and Borrowing
Other Liabilities Other liabilities
Equity *-0.5
Total Shareholders’ equity Paid-in capital
Reserves
Foreign Currency Translation reserve
Revalution reserve for financial assets
Retained Earnings and Proposed Dividends
Other equity
Our collection of dependent variables include provisioning for loan losses that capture
the quality of bank assets (Cebenoyan and Strahan, 2004, Athanasoglou et al., 2014, and Lee
and Hsieh, 2013). Hence, the riskier banks’ assets are the higher the ratio of loan loss
provisioning. Z-score is used to calculate bank risk, with the hypothesis that z-score value and
bank stability are positively correlated (Athanasoglou et al., 2014, Houston et al. 2010, Laeven
and Levine, 2009, and Ramayandi et al., 2014). To break down the cross effects amongst risk
proxies, we multiply the values for banks’ z- scores by −1, such that a higher value indicates
greater risk in all instances. The following models 6.2 - 6.5 analyze the impact of the leading
independent variable liquidity funding risk 𝐷𝑒𝑝 on Jordanian commercial banks liquidity
creation 𝐿𝐶, bank risk-weighted assets 𝑅𝑊𝐴, loan loss provisions 𝐿𝐿𝑃, and z-score. The models
also include a set of control variables. 𝑡 refers to the time span from 2003 to 2017, and 𝑖 denotes
the number of banks 13, 𝐺 refers to country fixed effects and 𝑢 is the error term.
𝐿𝐶𝑖𝑡 = 𝛼 + 𝛽1 𝐷𝑒𝑝𝑖𝑡 + 𝛽2 𝐿𝑜𝑎𝑛𝑖𝑡 + 𝛽3 𝐴𝑠𝑠𝑒𝑡𝑖𝑡 + 𝛽4 𝑅𝑂𝐴𝑖𝑡 + 𝛽5 𝑅𝑂𝐸𝑖𝑡 + 𝛽6 𝐶𝐴𝑃𝑖𝑡 +
𝛽7 𝑁𝑃𝐿𝑖𝑡 + 𝛽8 𝐼𝑅𝐵𝑡 + 𝛽9 𝐼𝑅𝐿𝑡 + 𝛽10 𝑀𝐼𝑅𝑡 + 𝛽11 𝐺𝐷𝑃𝑡 + 𝛽12 𝐼𝑁𝐹𝑡 + 𝛽13 𝑈𝑁𝑀𝑡 +
𝛽14 𝐺𝐹𝐶𝑡 + 𝐺𝑖 + 𝑢𝑖𝑡 (7.2)
𝐿𝐿𝑃𝑖𝑡 = 𝛼 + 𝛽1 𝐷𝑒𝑝𝑖𝑡 + 𝛽2 𝐿𝑜𝑎𝑛𝑖𝑡 + 𝛽3 𝐴𝑠𝑠𝑒𝑡𝑖𝑡 + 𝛽4 𝑅𝑂𝐴𝑖𝑡 + 𝛽5 𝑅𝑂𝐸𝑖𝑡 + 𝛽6 𝐶𝐴𝑃𝑖𝑡 +
𝛽7 𝑁𝑃𝐿𝑖𝑡 + 𝛽8 𝐼𝑅𝐵𝑡 + 𝛽9 𝐼𝑅𝐿𝑡 + 𝛽10 𝑀𝐼𝑅𝑡 + 𝛽11 𝐺𝐷𝑃𝑡 + 𝛽12 𝐼𝑁𝐹𝑡 + 𝛽13 𝑈𝑁𝑀𝑡 +
𝛽14 𝐺𝐹𝐶𝑡 + 𝐺𝑖 + 𝑢𝑖𝑡 (7.3)
𝑅𝑊𝐴𝑖𝑡 = 𝛼 + 𝛽1 𝐷𝑒𝑝𝑖𝑡 + 𝛽2 𝐿𝑜𝑎𝑛𝑖𝑡 + 𝛽3 𝐴𝑠𝑠𝑒𝑡𝑖𝑡 + 𝛽4 𝑅𝑂𝐴𝑖𝑡 + 𝛽5 𝑅𝑂𝐸𝑖𝑡 +
𝛽6 𝐶𝐴𝑃𝑖𝑡 + 𝛽7 𝑁𝑃𝐿𝑖𝑡 + 𝛽8 𝐼𝑅𝐵𝑡 + 𝛽9 𝐼𝑅𝐿𝑡 + 𝛽10 𝑀𝐼𝑅𝑡 + 𝛽11 𝐺𝐷𝑃𝑡 + 𝛽12 𝐼𝑁𝐹𝑡 +
𝛽13 𝑈𝑁𝑀𝑡 + 𝛽14 𝐺𝐹𝐶𝑡 + 𝐺𝑖 + 𝑢𝑖𝑡
(7.4)

175
𝑍 − 𝑠𝑐𝑜𝑟𝑒𝑖𝑡 = 𝛼 + 𝛽1 𝐷𝑒𝑝𝑖𝑡 + 𝛽2 𝐿𝑜𝑎𝑛𝑖𝑡 + 𝛽3 𝐴𝑠𝑠𝑒𝑡𝑖𝑡 + 𝛽4 𝑅𝑂𝐸𝑖𝑡 + 𝛽5 𝑁𝑃𝐿𝑖𝑡 +
𝛽6 𝐼𝑅𝐵𝑡 + 𝛽7 𝐼𝑅𝐿𝑡 + 𝛽8 𝑀𝐼𝑅𝑡 + 𝛽9 𝐺𝐷𝑃𝑡 + 𝛽10 𝐼𝑁𝐹𝑡 + 𝛽11 𝑈𝑁𝑀𝑡 + 𝛽12 𝐺𝐹𝐶𝑡 + 𝐺𝑖 +
𝑢𝑖𝑡 (7.5)
In order to test the impact of introducing the deposit insurance scheme on bank capital
and liquidity creation, Model 6.7 is then developed to estimate coefficients of the ratio of
LC/TA on a group of variables including CAP ratio and bank-specific factors. We estimate
Model 6.7 using data before and after the introduction of deposit insurance scheme in 2000.
Deposit insurance is assumed to decrease the liquidity creating role in influencing bank risks
(Allen and Gale, 2004) based on the “risk absorption” hypothesis. Another hypothesis
“financial fragility/crowding out” states that deposit insurance schemes do not reduce
liquidity creation because insured deposits are less likely to be withdrawn. Differenced values
are used for all independent variables to mitigate the potential endogeneity problem following
(Berger and Bouwman, 2009). This model is estimated using the Difference in Difference
(DiD) approach as follows:
∆𝑌𝑖𝑡 = ∅∆Т𝑖𝑡 + 𝛿∆𝑋𝑖𝑡 + ∆휀𝑖𝑡 (7.6)
where 𝑌𝑖𝑡 is the dependent variable (liquidity creation), ∅ estimate the unbiased effect of the
program, Т is the treatment dummy variable (deposit insurance scheme), when 𝑇=1 the
individual i is participant of the treatment, and 𝑇= 0 if non-participant. δ is the coefficient of
the independent variables and the ε is the error term. Applying the general DiD specification,
we develop Model 6.7 as follows:
∆𝐿𝐶𝑖𝑡 = 𝛼 + 𝛽1 ∆𝐷𝑒𝑝𝑖𝑡 + 𝛽2 ∆𝐿𝑜𝑎𝑛𝑖𝑡 + 𝛽3 ∆𝐴𝑠𝑠𝑒𝑡𝑖𝑡 + 𝛽4 ∆𝑅𝑂𝐴𝑖𝑡 + 𝛽5 ∆𝑅𝑂𝐸𝑖𝑡 +
𝛽6 ∆𝐶𝐴𝑃𝑖𝑡 + 𝛽7∆ 𝑁𝑃𝐿𝑖𝑡 + 𝛽8 ∆𝐽𝐷𝐼𝐶𝑡 + 𝑢𝑖𝑡 (7.7)
Our analysis also identifies the main determinants of funding liquidity risk. Deposits, in
general, are used to measure banks’ funding liquidity risks. Higher bank deposits are
hypothesized to reduce funding liquidity risk (Acharya and Naqvi, 2012). However, in some
instances and due to the deposit insurance, banks with larger deposits are found to be engaged
in riskier decisions. Model 6.8 is used to analyze the impact of selected variables on the
Jordanian commercial banks funding liquidity risk:
𝐷𝑒𝑝𝑖𝑡 = 𝛼 + 𝛽1 𝐿𝑜𝑎𝑛𝑖𝑡 + 𝛽2 𝐴𝑠𝑠𝑒𝑡𝑖𝑡 + 𝛽3 𝑅𝑂𝐴𝑖𝑡 + 𝛽4 𝑅𝑂𝐸𝑖𝑡 + 𝛽5 𝐶𝐴𝑃𝑖𝑡 + 𝛽6 𝑁𝑃𝐿𝑖𝑡 +
𝛽7 𝐼𝑅𝐵𝑡 + 𝛽8 𝐼𝑅𝐿𝑡 + 𝛽9 𝑀𝐼𝑅𝑡 + 𝛽10 𝐺𝐷𝑃𝑡 + 𝛽11 𝐼𝑁𝐹𝑡 + 𝛽12 𝑈𝑁𝑀𝑡 + 𝛽13 𝐺𝐹𝐶𝑡 +

176
𝐺𝑖 + 𝑢𝑖𝑡 (7.8)
Amongst the set of control variables in our models we use capital (CAP), where well-
capitalized banks are found to have low-risk assets portfolio (Altunbas et al., 2007). Bank
Profitability is used as a performance measure, in which it is generally perceived to have a
positive effect on bank capital via increasing the retained earnings and capital (Rime, 2001).
Bank size is found to have a negative association with the volatility of asset returns (Boyd
and Runkle, 1993). According to the theory, loans are found to be associated with higher rates
of deposit funding. While high levels of non-performing loans are found to be associated with
higher capital buffer and risk levels. Our set of control variables also includes GDP growth,
inflation, unemployment, interest rates on interbank transactions, loans and monetary policy
interest rate. We also use a dummy variable to capture the impact of the 2008 global financial
crises.

177
Table 7 5Empirical results of Pooled OLS, FE of the Jordanian commercial banks liquidity creation
(2003-2015) (LC) (LC) (LC)
VARIABLES Pooled OLS GLS FE
LDep 0.2084 0.2084 -0.1078
-0.1365 -0.1365 -0.1576
LLoan .4258*** .4258*** .2421***
-0.0793 -0.0793 -0.0805
LAsset -0.5559 -0.5559 11.0215
-1.6180 -1.6180 -8.2413
LROA -2.5800 -2.5800 -0.1779
-2.1158 -2.1158 -1.9986
LROE 0.1527 0.1527 -0.2271
-0.2524 -0.2524 -0.2395
LCAP -0.3604 -0.3604 0.1442
-0.3544 -0.3544 -0.3641
LNPL -.0201*** -.0201*** -0.0035
-0.0072 -0.0072 -0.0074
LIRB -0.0746 -0.0746 -0.3938
-1.5853 -1.5853 -1.3753
LIRL 1.1535 1.1535 2.4794
-3.5421 -3.5421 -3.2745
LMIR 0.5858 0.5858 -0.6839
-1.6032 -1.6032 -1.5095
LGDP 0.4523 0.4523 1.0026
-0.7869 -0.7869 -0.7442
LINF -0.1487 -0.1487 -0.1366
-0.2757 -0.2757 -0.2341
LUNM -3.3424** -3.3424** -0.9880
-1.4264 -1.4264 -2.0061
LRFC -2.2822 -2.2822 -2.3850
-2.3106 -2.3106 -1.9597
Constant 36.6017 36.6017 -82.0588
-48.6087 -48.6087 -114.8152
Observations 128 128 128
R-squared 0.3575
Adj R-squared 0.2779
F 0.0000 0.0000 0.0002
Number of banks 13 13 13

178
Where the dependent variables are: LC is the Liquidity Creation, LLP is the Loan loss provision, RWA is the
Risk-weighted asset, Z-scores is the Z-scores that measured the risk. The independent variables are: Dep is the
liquidity funding risk, CAP is the Capitalization, Asset is the Size, ROA and ROE measured the profitability,
Loan is the loan, NPL is the None performing loans, IRB is the Interbank Interest Rate, IRL is the Loan Interest
Rate, MIR is the Monetary policy interest rate, GDP is the GDP growth rate, UNM is the Unemployment rate,
INF is the inflation rate, RFC is the Realized financial crisis, JDIC is the Deposit Insurance Scheme. Note:
Standard errors in parentheses, *** p<0.01, ** p<0.05, * p<0.1
Table 7 6Empirical results of Pooled OLS, FE of the Jordanian commercial banks LLP (2003-2015). (LLP) (LLP) (LLP)
VARIABLES Pooled OLS GLSLS FE
LDep -0.0060 -0.0060 0.0060
-0.0072 -0.0072 -0.0096
LLoan 0.0025 0.0025 -0.0039
-0.0043 -0.0043 -0.0049
LAsset .1862* .1862* 0.4876
-0.0984 -0.0984 -0.4965
LROA -.2647** -.2647** -.2471**
-0.1134 -0.1134 -0.1190
LROE 0.0011 0.0011 0.0050
-0.0135 -0.0135 -0.0143
LCAP 0.0254 0.0254 0.0359
-0.0193 -0.0193 -0.0220
LNPL 0.0000 0.0000 0.0002
-0.0004 -0.0004 -0.0005
LIRB -.2736*** -.2736*** -.2101**
-0.0844 -0.0844 -0.0824
LIRL 0.0615 0.0615 0.0823
-0.1905 -0.1905 -0.1994
LMIR .2042** .2042** 0.1489
-0.0860 -0.0860 -0.0915
LGDP . -.0467617 . -.0467617 -0.0496
-0.0436 -0.0436 -0.0466
LINF .0398** .0398** .0394***
-0.0153 -0.0153 -0.0147
LUNM 0.0774 0.0774 0.1278
-0.0773 -0.0773 -0.1211
LRFC -0.0294 -0.0294 -0.0160
-0.1250 -0.1250 -0.1192
Constant -2.4383 -2.4383 -6.8055
-2.7005 -2.7005 -6.9636
Observations 124 124 124

179
R-squared 0.3341
Adj R-squared 0.2486
F 0.0000 0.0000 0.0002
Number of banks 13 13 13
Where the dependent variables are: LC is the Liquidity Creation, LLP is the Loan loss provision, RWA is the
Risk-weighted asset, Z-scores is the Z-scores that measured the risk. The independent variables are: Dep is the
liquidity funding risk, CAP is the Capitalization, Asset is the Size, ROA and ROE measured the profitability,
Loan is the loan, NPL is the None performing loans, IRB is the Interbank Interest Rate, IRL is the Loan Interest
Rate, MIR is the Monetary policy interest rate, GDP is the GDP growth rate, UNM is the Unemployment rate,
INF is the inflation rate, RFC is the Realized financial crisis, JDIC is the Deposit Insurance Scheme. Note:
Standard errors in parentheses, *** p<0.01, ** p<0.05, * p<0.1
Table 7 7Empirical results of Pooled OLS, FE of the Jordanian commercial banks RWA (2003-2015). (RWA) (RWA) (RWA)
VARIABLES Pooled OLS GLSLS FE
LDep -0.1833 -0.2639 -.3235705**
-0.1949 -0.1750 -0.1562
LLoan .4977*** .2151** 0.0650
-0.1136 -0.0924 -0.0811
LAsset -4.9626** -3.6682 -35.0218***
-2.2552 -3.7979 -13.0864
LROA -0.4959 -2.5253 -3.7208
-3.4538 -2.7684 -2.4111
LROE -0.2859 -0.0258 0.1084
-0.4391 -0.3528 -0.3042
LCAP 0.2262 .90636* .9328**
-0.5612 -0.4811 -0.4728
LNPL -.03264*** -0.0129 -0.0099
-0.0097 -0.0084 -0.0073
LIRB -0.7349 0.1362 2.0048
-2.4893 -1.8014 -1.6275
LIRL -0.9301 -3.1986 -5.4006
-9.8834 -7.1200 -5.9779
LMIR -2.0590 -2.6824 -5.2055**
-3.9981 -2.8507 -2.5374
LGDP 0.7967 0.5316 0.4961
-1.4925 -1.0596 -0.8841
LINF -0.0230 0.0383 0.0255
-0.5135 -0.3692 -0.3125
LUNM 0.8501 -0.0669 -2.5051

180
-3.6958 -2.6311 -2.3136
LRFC 0.1432 0.8414 0.5201
-4.3363 -3.1028 -2.6282
Constant 113.8762 142.2711 501.6895***
-121.5409 -95.1537 -152.2763
Observations 110 110 110
R-squared 0.3543
Adj R-squared 0.2592
F 0.0001 0.0000 0.0000
Number of banks 13 13 13
Where the dependent variables are: LC is the Liquidity Creation, LLP is the Loan loss provision, RWA is the
Risk-weighted asset, Z-scores is the Z-scores that measured the risk. The independent variables are: Dep is the
liquidity funding risk, CAP is the Capitalization, Asset is the Size, ROA and ROE measured the profitability,
Loan is the loan, NPL is the None performing loans, IRB is the Interbank Interest Rate, IRL is the Loan Interest
Rate, MIR is the Monetary policy interest rate, GDP is the GDP growth rate, UNM is the Unemployment rate,
INF is the inflation rate, RFC is the Realized financial crisis, JDIC is the Deposit Insurance Scheme. Note:
Standard errors in parentheses, *** p<0.01, ** p<0.05, * p<0.1
Table 7 8Empirical results of Pooled OLS, FE of the Jordanian commercial banks Z-score (2003-2015).
(Z-score) (Z-score) (Z-score)
VARIABLES Pooled OLS GLSLS RE
LDep -.1814* -.0703 -.0703
(.0954) (.1139) (.1139)
LLoan -.0225 -.0743 -.0743
(.0673) (.0664) (.0664)
LAsset .6306 1.4419 1.4419
(1.3779) (2.2147) (2.2147)
LROE -.3124*** -.2459** -.2459**
(.1035) (.1054) (.1054)
LNPL -.0047 -.0007 -.0007
(.0061) (.0063) (.0063)
LIRB -2.3452* -1.9194 -1.9194
(1.3405) (1.2148) (1.2148)
LIRL 2.5483 2.4660 2.4660
(2.9815) (1.3171) (2.6942)
LMIR 1.5203 1.1945 1.3171
(1.3203) (0.0936) (1.1945)
LGDP .7594 .6379 .6379
(.6677) (.6026) (.6026)

181
LINF .19847 .1945 .1945
(.2351) (.2107) (.2107)
LUNM 1.9986* 2.2118** 2.2118**
(1.1715) (1.1029) (1.1029)
LRFC -1.0533 -1.0062 -1.0062
(1.9432) (1.7381) (1.7381)
Constant -47.1137 -63.4813 -63.4813
(37.5145) (41.3831) (41.3831)
Observations 130 130 130
R-squared 0.2420
Adj R-squared 0.1643
F 0.0007 0.0002 0.0002
Number of banks 13 13 13
Where the dependent variables are: LC is the Liquidity Creation, LLP is the Loan loss provision, RWA is the
Risk-weighted asset, Z-scores is the Z-scores that measured the risk. The independent variables are: Dep is the
liquidity funding risk, CAP is the Capitalization, Asset is the Size, ROA and ROE measured the profitability,
Loan is the loan, NPL is the None performing loans, IRB is the Interbank Interest Rate, IRL is the Loan Interest
Rate, MIR is the Monetary policy interest rate, GDP is the GDP growth rate, UNM is the Unemployment rate,
INF is the inflation rate, RFC is the Realized financial crisis, JDIC is the Deposit Insurance Scheme. Note:
Standard errors in parentheses, *** p<0.01, ** p<0.05, * p<0.1
Table 7 9Empirical results of Pooled OLS, RE of the Jordanian commercial banks’ liquidity funding
(2003-2015). (Funding Liquidity) (Funding Liquidity) (Funding Liquidity)
VARIABLES Pooled OLS GLS RE
LLoan -.1491*** -.1008** -.1008**
(.0509) (.0438) (.0438)
LAsset .4880 1.6575 1.6575
(1.0444) (2.7097) (2.7097)
LROA 2.0854 .0975 .0975
(1.3969) (1.1338) (1.1338)
LROE -.3275** -.2553** -.2553**
(.1666) (.1343) (.1343)
LCAP -1.3204*** -.7682*** -.7682***
(.2049) (.1885) (.1885)
LNPL .0005 .0002 .0002
(.0048) * (.0041) (.0041)
LIRB -1.7440 -1.9643*** -1.9643**
(1.0549) (.7776) (.7776)
LIRL -3.4454* -1.8950 -1.8950

182
(2.0276) (1.6613) (1.6613)
LMIR 1.2916 1.0400 1.0400
(1.0648) (.8213) (.8213)
LGDP -.5132 -.0209 -.0209
(.4865) (.3928) (.3928)
LINF .1764 .1153 .1153
(.1833) (.1348) (.1348)
LUNM -2.1945*** -1.2231 -1.2231
(.9423) (.8675) (.8675)
LRFC 1.3107 .1842 .1842
(1.4649) (1.0859) (1.0859)
Constant 154.6503 110.5548*** 110.5548
(27.4836) (42.4802) (42.4802) ***
Observations 143 143 143
R-squared 0.4685
Adj R-squared 0.4150
F 0.0000 0.0000 0.0000
Number of banks 13 13 13
Where the dependent variables are: LC is the Liquidity Creation, LLP is the Loan loss provision, RWA is the
Risk-weighted asset, Z-scores is the Z-scores that measured the risk. The independent variables are: Dep is the
liquidity funding risk, CAP is the Capitalization, Asset is the Size, ROA and ROE measured the profitability,
Loan is the loan, NPL is the None performing loans, IRB is the Interbank Interest Rate, IRL is the Loan Interest
Rate, MIR is the Monetary policy interest rate, GDP is the GDP growth rate, UNM is the Unemployment rate,
INF is the inflation rate, RFC is the Realized financial crisis, JDIC is the Deposit Insurance Scheme. Note:
Standard errors in parentheses, *** p<0.01, ** p<0.05, * p<0.

183
Table 7 10Empirical results of GLS, FE, and RE of the Jordanian commercial banks (liquidity creation, loan loss provision, risk weighted assets, and z-score) for
the period 2003-2006. LC LLP Z-score
VARIABLES OLS GLS RE OLS GLS RE OLS GLS RE
LDep 1.0005** .3934 .3934 -.0143 -.0143 -.0143 -.0594 -.0594 -.0594
(.3611) (.4589) (.4589) (.0221) (.0221) (.0221) (.1035) (.1035) (.1035)
LLoan 1.2349*** .5638 .5638 -.0250 -.0250 -.0250 -.1627 -.1627 -.1627
(.3054) (.3984) (.3984) (.0193) (.0193) (.0193) (.1039) (.1039) (.1039)
LAsset 9.2836* 3.8092 3.8092 -.6013* -.6013* -.6013* -3.1601* -3.1601* -3.1601*
(5.2071) (9.1444) (9.1444) (.3331) (.3331) (.3331) (1.8441) (1.8441) (1.8441)
LROA -5.7465* -3.9550 -3.9550 .0305 .0305 .0305
(3.3924) (2.7664) (2.7664) (.2115) (.2115) (.2115)
LROE .65906 .4775 .4775 -.0215 -.0215 -.0215 -.0764 -.0764 -.0764
(.3394) (.2992) (.2992) (.0212) (.0212) (.0212) (.0576) (.0576) (.0576)
LCAP .61092 .1323 .1323 -.0141 -.0141 -.0141
(.8584) (.7400) (.7400) (.0516) (.0516) (.0516)
LNPL .1899 .1070 .1070 -.0032 -.0032 -.0032 .0297 .0297 .0297
(.1900) (.18343) (.18343) (.01190) (.01190) (.01190) (.0646) (.0646) (.0646)
Constant -193.0002** -65.8450 -65.8450 8.1909 8.1909 8.1909 36.0536 36.0536 36.0536
(66.007) (104.2056) (104.2056) (4.14026) * (4.14026) * (4.14026) * (20.9211) (20.9211) (20.9211)
Observations 23 23 23 23 23 23 24 24 24
R-squared 0.6465 0.4096 0.4572
Adj R-squared 0.4815 0.1340 0.3064
F 0.0126 0.2451 0.0370
Prob > chi2 0.7574 0.7574 0.1668 0.1668 0.0097 0.0097

184
Number of banks 13 13 13 13 13 13 13 13 13
Where the dependent variables are: LC is the Liquidity Creation, LLP is the Loan loss provision, RWA is the Risk-weighted asset, Z-scores is the Z-scores that measured the
risk. The independent variables are: Dep is the liquidity funding risk, CAP is the Capitalization, Asset is the Size, ROA and ROE measured the profitability, Loan is the loan,
NPL is the None performing loans. Note: Standard errors in parentheses, *** p<0.01, ** p<0.05, * p<0.1
Table 7 11Empirical results of GLS, FE, and RE of the Jordanian commercial banks (liquidity creation, loan loss provision, risk weighted assets, and z-score) for
the period 2007-2009. LC LLP RWA Z-score
VARIABLES OLS GLS RE OLS GLS FE OLS GLS FE OLS GLS RE
LDep 0.2754 0.2177 0.2177 -0.0103 -0.0103 .0823 ** -.4501** -.4501** -0.5061 -0.0199 -0.0265 -0.0265
-0.2090 -0.2205 -0.2205 -0.0167 -0.0167 -0.0337 -0.2154 -0.2154 -0.4158 -114253 -0.1235 -0.1235
LLoan 0.2499 0.1517 0.1517 0.0050 0.0050 -0.0271 .4727** .4727** 0.1122 0.0294 -0.0059 -0.0059
-0.1666 -0.1526 -0.1526 .0127681) .0127681) -0.0171 -0.1781 -0.1781 -0.2355 -0.0891 -0.0896 -0.0896
LAsset -0.7423 -0.1830 -0.1830 0.3640 0.3640 1.9264 -12.1214*** -12.1214*** 31.4667 -1.6149 -1.3223 -1.3223
-2.7034 -3.2381 -3.2381 -0.3918 -0.3918 -2.6136 -2.8770 -2.8770 -35.1219 -1.6978 -1.9756 -1.9756
LROA -2.2277 -2.0044 -2.0044 -0.4324 -0.4324 -0.3815 -3.9372 -3.9372 -6.2448
-3.1179 -3.3827 -3.3827 -0.2723 -0.2723 -0.5497 -3.3191 -3.3191 -7.3269
LROE 0.1282 0.1091 0.1091 0.0330 0.0330 .0946* -0.4822 -0.4822 -0.2600 -.3018 * -0.1834 -0.1834
-0.4775 -0.4363 -0.4363 -0.0381 -0.0381 -0.0459 -0.5100 -0.5100 -0.6095 -0.1633 -0.1756 -0.1756
LCAP -0.1803 0.0001 0.0001 0.0701 0.0701 .1678** -0.0387 -0.0387 0.8172
-0.6613 -0.6289 -0.6289 -0.0516 -0.0516 -0.0692 -0.7068 -0.7068 .9106676)
LNPL -.0422*** -.0277** -.0277** -0.0001 -0.0001 -0.0003 -.0631*** -.0631*** -.0516** -.0168** -.0178** -.0178**
-0.0110 -0.0113 -0.0113 -0.0009 -0.0009 -0.0013 -0.0117 -0.0117 -0.0181 -0.0071 -0.0076 -0.0076
Constant 9.8244 10.3447 10.3447 -3.0101 -3.0101 -24.5666 202.9984*** 202.9984*** -186.5980 13.5733 11.7018 11.7018
-29.2461 -32.7190 -32.7190 -3.3775 -3.3775 -23.4603 -30.5156 -30.5156 -321.6626 -17.6050 -19.7902 -19.7902

185
Observations 31 31 31 28 28 28 32 32 32 32 32 32
R-squared 0.5330 0.3498 0.7759 0.2861
Adj R-squared 0.3909 0.1222 0.7106 0.1488
F 0.0075 0.2117 0.0000 0.0997
Prob > chi2 0.1658 0.1658 0.1495 0.2038 0.0000 0.0745 0.2067 0.2067
Number of banks 13 13 13 13 13 13 13 13 13 13 13 13
Where the dependent variables are: LC is the Liquidity Creation, LLP is the Loan loss provision, RWA is the Risk-weighted asset, Z-scores is the Z-scores that measured the
risk. The independent variables are: Dep is the liquidity funding risk, CAP is the Capitalization, Asset is the Size, ROA and ROE measured the profitability, Loan is the loan,
NPL is the None performing loans. Note: Standard errors in parentheses, *** p<0.01, ** p<0.05, * p<0.1
Table 7 12Empirical results of GLS, FE, and RE of the Jordanian commercial banks (liquidity creation, loan loss provision, risk weighted assets, and z-score) for
the period 2010-2015. LC LLP RWA Z-score
VARIABLES OLS GLS RE OLS GLS FE OLS GLS RE OLS GLS RE
LDep 0.0095 0.0095 0.0095 0.0087 0.0086 0.0042 0.0845 0.0809 0.0809 -.3024* -0.2583 -0.2583
-0.1982 -0.1982 -0.1982 -0.0107 -0.0111 -0.0130 -0.2948 -0.2024 -0.2024 -0.1783 -0.1793 -0.1793
LLoan .3998*** .3998*** .3998*** 0.0029 0.0003 -0.0082 .5155*** -0.0041 -0.0041 . .0312895 -0.0653 -0.0653
-0.1037 -0.1037 -0.1037 -0.0056 -0.0058 -0.0070 -0.1528 -0.1042 -0.1042 -0.1048 -0.1031 -0.1031
LAsset -2.2590 -2.2590 -2.2590 0.2494 0.2374 -1.3479* -2.6420 -3.6662 -3.6662 2.1020 2.4421 2.4421
-1.9742 -1.9742 -1.9742 -0.1119 -0.1311 -0.7256 -2.8885 -4.5362 -4.5362 -2.0078 -3.5796 -3.5796
LROA -3.5205 -3.5205 -3.5205 -0.2959 -0.3492 -0.3694 3.5013 -3.8042 -3.8042
-5.6255 -5.6255 -5.6255 -0.3038 -0.3124 -0.3586 -8.1480 -5.4190 -5.4190
LROE 0.4479 0.4479 0.4479 -0.0142 -0.0076 -0.0067 -0.6770 0.4961 0.4961 -.5763** -.5492** -.5492**
-0.7696 -0.7696 -0.7696 -0.0415 -0.0429 -0.0484 -1.1138 -0.7446 -0.7446 -0.2307 -0.2601 -0.2601
LCAP -0.6811 -0.6811 -0.6811 0.0152 0.0183 -0.0147 0.3377 1.2787** 1.2787**
-0.5778 -0.5778 -0.5778 -0.0313 -0.0325 -0.0442 -0.8377 -0.6024 -0.6024

186
LNPL -0.0125 -0.0125 -0.0125 0.0001 0.0001 0.0003 -.0231* 0.0010 0.0010 -0.0035 0.0017 0.0017
-0.0086 -0.0086 -0.0086 -0.0005 -0.0005 -0.0005 -0.0124 -0.0078 -0.0078 -0.0088 -0.0080 -0.0080
Constant 42.7662 42.7662 42.7662 -2.2853 -2.0916 13.8115* 61.4762 78.9640* 78.9640* -2.4658 -5.0977 -5.0977
-27.6643 -27.6643 -27.6643 -1.5232 -1.6713 -7.0767 -39.9898 -47.2200 -47.2200 -23.6546 -35.5336 -35.5336
Observations 74 74 74 73 73 73 72 72 72 74 74 74
R-squared 0.2674 0.2546 0.2219 0.1603
Adj R-squared 0.1897 0.1743 0.1368 0.0986
F 0.0034 0.0060 0.0197 0.0330
Prob > chi2 0.0011 0.0011 0.0090 0.0175 0.3554 0.3554 0.1804 0.1804
Number of banks 13 13 13 13 13 13 13 13 13 13 13 13
Where the dependent variables are: LC is the Liquidity Creation, LLP is the Loan loss provision, RWA is the Risk-weighted asset, Z-scores is the Z-scores that measured the
risk. The independent variables are: Dep is the liquidity funding risk, CAP is the Capitalization, Asset is the Size, ROA and ROE measured the profitability, Loan is the loan,
NPL is the None performing loans. Note: Standard errors in parentheses, *** p<0.01, ** p<0.05, * p<0.1
Table 7 13Empirical Results of GLS, RE, and FE of the Jordanian commercial liquidity funding. 2003-2006 2007-2009 2010-2015
VARIABLES OLS GLS RE OLS GLS RE OLS GLS RE
Loan -.3322*** -.1698* -.1698* -.4619*** -.2472 -.2472 0245 .0713 .0713
(.1171) (.0882) (.0882) (.1555) (.1690) (.1690) (.0628) (.0602) (.0602)
Asset 2.4704 -6.8010 -6.8010 .20697 1.4359 1.4359 -.0332 -.1883 -.1883
(4.3749) (1.0444) (1.0444) (1.6413) (2.3082) (2.3082) (1.2154) (2.1694) (2.1694)
ROA -1.0615 -1.1233 -1.1233 .1038 -1.1362 -1.1362 -.9149 -8.0491* -8.0491*
(2.6256) (1.3342) (1.3342) (2.1375) (2.2177) (2.2177) (5.2607) (4.5369) (4.5369)

187
ROE -.0311 .0251 .0251 .0703 -.0368 -.0368 .3917 1.1994* 1.1994*
(.2706) (.1504) (.1504) (.3160) (.3255) (.3255) (.7422) (.6442) (.6442)
CAP -.8316 -.6316** -.6316** -1.1010*** -1.1498 -1.1498*** -.8496* -.3432 -.3432
(.5370) (.3166) (.3166) (.3722) (.4105) (.4105) (.4515) (.4208) (.4208)
NPL .0201 -.0034 -.0034 -.0084 -.0016 -.0016 -.0028 -.0049 -.0049
(.1225) (.1002) * (.1002) * (.0075) (.0078) (.0078) (.0052) (.0045) (.0045)
Constant 77.3627** 151.425*** 151.425*** 108.0863*** 89.9315*** 89.9315*** 83.8535*** 77.9510*** 77.9510***
(35.8412) (38.3463) (38.3463) (17.3922) (23.8700) (23.8700) (13.6695) (21.9078) (21.9078)
Observations 34 34 34 33 33 33 76 76 76
R-squared 0.6367 0.7120 0.2901
Adj R-squared 0.5559 0.6456 0.2283
F 0.0001 0.0000 0.0005
Prob > chi2 0.0000 0.0000 0.0002 0.0002 0.0003 0.0003
Number of banks 13 13 13 13 13 13 13 13 13
Where the dependent variables are: Dep is the Liquidity funding risk. The independent variables are: CAP is the Capitalization, Asset is the Size, ROA and ROE measured
the profitability, Loan is the loan, NPL is the None performing loans. Note: Standard errors in parentheses, *** p<0.01, ** p<0.05, * p<0.1

188
Table 7 14A Empirical results for the impact of the deposit insurance scheme on the Jordanian banking
liquidity creation using DID approach for the period (1995-2015). D.LC D.LC
VARIABLES (Pooled) (FE)
D.Dep 0.420*** 0.416***
(0.121) (0.125)
D.Loan 0.358*** 0.358***
(0.0463) (0.0474)
D.Asset -12.39* -13.79*
(6.823) (7.299)
D.ROA 1.969*** 1.966***
(0.619) (0.633)
D.ROE -0.0888 -0.0884
(0.0690) (0.0706)
D.CAP -0.541*** -0.538***
(0.109) (0.112)
D.NPL 0.0080 0.0079
(0.0068) (0.0069)
D.JDIC -4.441** -4.373**
(2.053) (2.102)
Constant 1.122** 1.183**
(0.549) (0.569)
Observations 254 254
R-squared 0.389 0.389
Number of Bank 13 13
Where the dependent variables is: LC is the Liquidity Creation that measured the risk. The independent
variables are: Dep is the liquidity funding risk, CAP is the Capitalization, Asset is the Size, ROA and ROE
measured the profitability, Loan is the loan, NPL is the None performing loans, JDIC is the Deposit Insurance
Scheme. Note: Standard errors in parentheses, *** p<0.01, ** p<0.05, * p<0.1

189
Table 7 15B Empirical results of the impact of the deposit insurance scheme on the Jordanian banking
liquidity creation using DID approach for the period (1995-2015). (OLS) (FE)
VARIABLES D.LC D.LC
D.Dep 0.508*** 0.510***
(0.0741) (0.0761)
D.Loan 0.553*** 0.549***
(0.0346) (0.0353)
D.Ass -5.352 -9.054
(6.437) (7.476)
D.ROA 1.844** 1.866**
(0.826) (0.842)
D.ROE -0.215** -0.217**
(0.101) (0.103)
D.CAP -0.440*** -0.441***
(0.127) (0.131)
D.NPL 0.00134 0.00138
(0.00326) (0.00331)
Constant 0.380 0.554
(0.420) (0.458)
Observations 130 130
R-squared 0.719 0.733
Number of Bank 13
Where the dependent variables is: LC is the Liquidity Creation that measured the risk. The independent
variables are: Dep is the liquidity funding risk, CAP is the Capitalization, Asset is the Size, ROA and ROE
measured the profitability, Loan is the loan, NPL is the None performing loans, Scheme. Note: Standard errors
in parentheses, *** p<0.01, ** p<0.05, * p<0.1

190
Table 7 16 A The impact of the deposit insurance on the Jordanian Banking Liquidity Creation using
DID approach for the pre and post-period of the scheme. 2000-2015 1995-1999
Pooled OLD FE Pooled OLD FE
VARIABLES D.LC D.LC D.LC D.LC
D.Dep 0.414*** 0.420*** 0.955*** 0.964***
(0.129) (0.133) (0.176) (0.210)
D.Loan 0.345*** 0.344*** 0.805*** 0.772***
(0.0487) (0.0502) (0.116) (0.137)
D.Ass -16.17* -17.62* -25.29*** -33.28***
(9.089) (9.937) (8.124) (10.34)
D.ROA 1.834*** 1.803*** 1.833 1.767
(0.654) (0.675) (2.224) (3.146)
D.ROE -0.0811 -0.0817 -0.129 -0.103
(0.0736) (0.0756) (0.189) (0.248)
D.CAP -0.538*** -0.526*** -0.540*** -0.693***
(0.129) (0.134) (0.180) (0.239)
Constant 1.462** 1.524** 1.350** 1.784**
(0.641) (0.673) (0.591) (0.716)
Observations 193 193 47 47
R-squared 0.400 0.404 0.749 0.758
Number of Bank 13 13
Where the dependent variables is: LC is the Liquidity Creation that measured the risk. The independent
variables are: Dep is the liquidity funding risk, CAP is the Capitalization, Asset is the Size, ROA and ROE
measured the profitability, Loan is the loan, NPL is the None performing loans, JDIC is the Deposit Insurance
Scheme. Note: Standard errors in parentheses, *** p<0.01, ** p<0.05, * p<0.1

191
Table 7 17B: The impact of the deposit insurance on the Jordanian Banking Liquidity Creation using
DID approach for the pre and post-period of the scheme. 2000-2015 1995-1999
Pooled OLD FE Pooled OLD FE
VARIABLES D.LC D.LC D.LC D.LC
D.Dep 0.508*** 0.510*** 0.508*** 0.510***
(0.0741) (0.0761) (0.0741) (0.0761)
D.Loan 0.553*** 0.549*** 0.553*** 0.549***
(0.0346) (0.0353) (0.0346) (0.0353)
D.Ass -5.352 -9.054 -5.352 -9.054
(6.437) (7.476) (6.437) (7.476)
D.ROA 1.844** 1.866** 1.844** 1.866**
(0.826) (0.842) (0.826) (0.842)
D.ROE -0.215** -0.217** -0.215** -0.217**
(0.101) (0.103) (0.101) (0.103)
D.CAP -0.440*** -0.441*** -0.440*** -0.441***
(0.127) (0.131) (0.127) (0.131)
D.JDIC 0.00134 0.00138 0.00134 0.00138
(0.00326) (0.00331) (0.00326) (0.00331)
Constant 0.380 0.554 0.380 0.554
(0.420) (0.458) (0.420) (0.458)
Observations 130 130
R-squared 0.719 0.733 0.719 0.733
Number of Bank 13 13
Where the dependent variables is: LC is the Liquidity Creation that measured the risk. The independent
variables are: Dep is the liquidity funding risk, CAP is the Capitalization, Asset is the Size, ROA and ROE
measured the profitability, Loan is the loan, NPL is the None performing loans, JDIC is the Deposit Insurance
Scheme. Note: Standard errors in parentheses, *** p<0.01, ** p<0.05, * p<0.1
7.5 Results
The analysis employed several econometric approaches to address the study questions and to
ensure the robustness of the results. These methods include Pooled OLS, FE, RE, in addition
to use different measure of risk. The selection between FE and GLS models is based on
Hausman test results. The test confirms that FE model is more appropriate for the first three
models (LC, LLP, and RWA) while GLS model is more appropriate for the last model (Z-
score). Due to a large number of results, as a rule of thumb, we report only the results that are
significant and robust across at least two of the estimations methodologies. The ratio of total

192
equity to total assets (CAP) is significant and positively correlated with RWA (credit risk) with
a coefficient of 0.93 suggesting that Jordanian banks with larger capital engage in more risky
actions than other banks (Table 7.7). Size is positively correlated with risk-weighted assets
with a coefficient of 35.02 indicating that the size of the bank increased its credit risk (Table
7.7). The results are in line with the findings of (Boyd and Runkle, 1993), (Demsetz and
Strahan, 1997), and (De Haan and Poghosyan, 2012). There is a significant robust positive
relationship between loan and liquidity creation as shown in Table 7.5. This result is consistent
with the implications of short-term liquidity for bank risk-taking and bank stability, the
theoretical predictions of (Acharya and Naqvi, 2012) and (Wagner, 2007) suggest that high
levels of asset liquidity can potentially increase bank risk. Deposits shield banks from "run"
risk and banks with higher deposits have less funding liquidity risk, which in turn reduces
market discipline and leads to greater risk-taking by banks and the findings of (Acharya and
Naqvi’s, 2012) who note that increased deposit funding increased both liquidity creation and
risk-weighted assets. NPL negatively affect liquidity creation, where one unit increase in the
rate of NPL, reduces LC by -0.020 in the FE model in Table 7.5. The estimation results show
that MIR has a significant positive relationship with LLP. One unit increase in MIR leads to
0.20 increase in the LLP. The low-interest-rate in the Jordanian banking reduces the volume of
bank deposits that feeds into lower risk levels.
ASS, MIR, and INF are positively correlated with banks’ loan loss prevention, while
ROA and IRB are the negative regressors. Loan is positively correlated with liquidity creation
as shown in Table 7.5. This result suggests that the excessive lending behavior of Jordanian
commercial banks increases the chances of credit and default risks. In line with (Acharya and
Naqvi’s, 2012) who showed that increasing deposit funding increased both liquidity creation
and risk-weighted assets. Both ROA and ROE have a negative relationship with loan loss
provisions and z-score. In Table 7.6, for example, a one-unit increase in ROA decreases LLP
with a coefficient value of 0.247. High capital adequacy ratios and high profits enhance banks’
capacity to increase provisions and mitigate potential losses out of any financial shocks.
Interbank interest rates are shown to reduce bank risk as captured by LLP in Table 7.6. This
finding is in line with (Khan et al., 2017). Unemployment and inflation feed into higher bank
risks as shown in Tables 7.6 and 7.8. Macroeconomic imbalances adversely affect individuals’
credit profile and make them less likely to repay their obligations to the banks which directly
increase banks' risk.
Turning to results for the liquidity funding risk model shown in Table 7.9, the results

193
show that there is a significant negative relationship between loan, ROE, CAP, IRB and
funding liquidity risk with coefficients of 0.10, 0.25, 0.76, and 1.96 respectively. These
findings suggest that an increase in the capital buffer and profit decrease liquidity funding risk
and are in line with previous results that confirm that well-capitalized banks with high-profit
profiles are better protected against shocks (Jeitschko and Jeung, 2005) the results in line with
results of (Tan and Floros, 2013) in the context of the Chinese banking industry and suggested
by the financing theory, high levels of debt and low value of equity to asset ratio results in high
risk.
Theoretically, the relationship between the liquidity of bank assets and banking stability
modelled by (Wagner, 2007) who finds that during financial crises but not during normal times
increased liquidity of bank assets reduces banking stability. In line with our results. Tables 7.10
- 7.12 displays the results for the 3 sub-periods: before, during and after the global financial
crises. The results show that before the 2008 crises, size negatively impacted the Jordanian
banking sector risk-taking (LLP and z-score) with a coefficient of 0.60 and 3.16 respectively
(Table 7.10). The results indicate that the larger Jordanian banks are safer and more stable in
line with (Boyd and Runkle, 1993), (Demsetz and Strahan, 1997), and (De Haan and
Poghosyan, 2012). During the global financial crises, NPL is shown to have a negative and
significant impact on the Jordanian banking sector risk-taking (LC, RWA, and Z-score)
behaviour with a coefficient of 0.02, 0.05, and 0.01 respectively.
Dep, ROE, and CAP are positively correlated with the Jordanian banking sector risk-
taking (LLP) with coefficients of 0.08, 0.09, and 0.16 respectively. The results are explained
by the fact that Jordanian banks with high capital buffers engage in much riskier activities.
These results also correspond with the capital adequacy ratio (CAR) levels in the Jordanian
banking sector, ranging between 18.0 percent and 21.0 percent during the years 2007-2015.
The CAR levels are generally higher by a comfortable margin than the limit set by the CBJ of
12.0 percent and the limit specified by Basel Committee of 8.0 percent. The CAR increased to
19.1 percent at the end of 2015. The results also show that after the global financial crises, the
loan and CAP has positive significant impacts on the Jordanian banking sector risk levels.
In regard to the liquidity funding risk model in Table 7.13, the results show that before
the global financial crises, loan and CAP have a negative significant impact on the funding
liquidity risk with coefficients of 0.16 and 0.63 respectively. While during the global financial
crises, CAP maintains its negative relationship with the liquidity funding risk with a coefficient

194
of 1.14. The results suggest that increasing capital buffer and bank profits decrease the liquidity
funding risk. ROA has a significant negative impact on the funding liquidity risk with a
coefficient of 8.04, in the period that followed the global financial crisis. It is worth mentioning
that the rate of return on assets (ROA) in Jordan’s banking system also witnessed a sharp
decline in the 2006-2010 period that include and also followed the global financial crises. ROA
rates reached 1.7 percent at the end of 2006 and declined to 1.1% at the end of 2009.
Table 7.14 shows the DiD estimation results of the impact of the deposit insurance
scheme on Jordanian commercial bank liquidity creation during the period 1995-2015. While
Table 7.15 reports the estimation results during two sub-periods, before (1995-1999) and after
(2000-2015) the system implementation. The result show that in general banks enrolled in the
deposit insurance scheme have a significant decrease of a value 4.37 on the rates of liquidity
creation. The sign remains negative in describing the relationship between deposit insurance
and the impact of capital on liquidity creation during the 2 sub-periods.
Theoretically, lower funding liquidity risk can induce bank managers to engage in more
aggressive lending practices as shown by (Acharya and Naqvi, 2012) who present this
theoretical evidence. In line with this view, banks with greater access to deposit funding during
the financial crisis were willing to lend more than those that relied more on short-term debt
financing as shown by (Ivashina and Scharfstein, 2010). Similarly, (Wagner, 2007) show that
higher liquidity can increase banking system instability. our results show that liquidity funding,
loan, and ROA have significantly positive relationships with liquidity creation. The results
suggest that in the presence of the deposit insurance scheme, banks with excessive deposits
have less liquidity funding risk which in turn reduces the probability of bank runs. While those
Jordanian banks’ that lend more are typically riskier. Ass and CAP improve liquidity creation
with coefficients of 13.79 and 0.53, respectively, suggesting that Jordanian banks with higher
capital buffers tend to take less risk relative to banks with lower capital buffers. The major
finding is that the “financial fragility/crowding out” hypothesis explains better our findings in
relation to the negative relationship between bank capital and liquidity creation variable. The
analysis provides robust evidence support the negative relationship between capital and
liquidity creation before and during the implementation of the deposit insurance scheme for
the Jordanian banking system. In other words, greater liquidity creation leads to lower levels
of capital. the explanation of this finding that the increased liquidity creation is associated with
increased deposits that crowd out capital in Jordanian banks especially after the huge amount
of refugee deposits during the Arab spring for the (Iraqi and Syrian refugees). The interest rate

195
that paid on the deposit fluctuates between 3 and 5 percent during the study period which is a
safe investment for the individuals. This improvement of the depositor access leads to reduces
the incentives for bank managers to search for external funding, including the capital. We can
interpret this finding because of the improved access to the depositor base would reduce the
incentives for Jordanian commercial banks managers to search for external funding, including
the capital. Our results in line with (Berger and Bouwman, 2009) and F(ungáčová et al., 2010)
who find a negative impact from the capital on liquidity creation. A negative impact of capital
on liquidity creation would the results suggest that greater capital requirements may hamper
liquidity creation noting that the Jordanian banks hold greater than the minimum of the capital
requirement (reach 21% during the study period).
7.6 Summary and Conclusion
The aim of this chapter is to study the impact of banks’ funding liquidity risk on the Jordanian
commercial banks' risk-taking behavior using panel data of 13 commercial banks and covering
the period 2003-2015. We use fixed and random effects estimation methodologies to
empirically define the main determinants of the different risk measures of the Jordanian
commercial banks. The analysis extends to determine also the major factors of the bank’s
liquidity funding. DiD method is used to analyze the impact of implementing the deposit
insurance scheme in 2000 on Jordanian banks' liquidity creation. This chapter attempts to
address the following research questions, 1) does size affect liquidity funding? 2) does
capitalization affect liquidity funding? 3) do crises periods affect liquidity funding? 4) does
size affect liquidity creation? 5) does capitalization affect liquidity creation? and 6) do crises
periods affect liquidity creation?
In this study, we find evidence support (Acharya and Naqvi’s, 2012) theoretical
prediction that decreases in banks’ funding liquidity risk as proxied by deposits leads to an
increase in bank risk. We found a significant inverse relationship between banks’ funding
liquidity risk and bank risk-taking. In theory, a large flow of deposit funding encourages more
aggressive lending at lower interest rates. In support of this, we find that an increase in deposit
funding is consistently followed by an increase in banks’ risk-weighted assets and liquidity
creation. Moreover, an increase in deposit funding increases overall bank risk. The key
empirical findings concern the risk determinants of liquidity financing and indicate that
Jordanian banks with greater resources participate in riskier behavior than other banks.

196
Increased deposit financing also increases both the creation of liquidity and risk-weighted
assets. High capital adequacy ratios, bank size, and high profits are also found to enhance
banks’ capacity to increase provisions and mitigate potential losses out of any financial shocks.
The results show also that capital buffer and profit decrease liquidity funding risk which is
broadly in line with previous results that confirm that well-capitalized banks with high-profit
profiles are better protected against shocks, confirming (Jeitschko and Jeung, 2005).
Macroeconomic instability in terms of high unemployment and inflation rates are also found
to feed into higher bank risks. The DiD results show that banks with excessive deposits tend to
have less liquidity funding risk after implementing the deposit insurance scheme, which in turn
reduces the probability of bank “run". overall, bank size and capital buffers help to minimize
the Jordanian commercial banks’ risk-taking behaviour in response to decreased funding
liquidity risk.
Jordanian commercial banks are more conservative even during the financial crises as
they are monitored and controlled by the CBJ. Since 2000, the implementation of deposit
insurance has not changed the negative relationship between bank capital and the creation of
liquidity. The analysis provides robust evidence to support the negative relationship between
capital and liquidity creation before and during the implementation of the Jordanian banking
deposit insurance scheme. There seems to be a clear tradeoff between imposing bank capital
requirements to maintain the financial system stability, and the process of liquidity creation to
enhance banks’ capital assets. This trade-off needs to be carefully considered when decision-
makers and regulators design new policies or levy new measures on the Jordanian commercial
banks. Our results in line with (Berger and Bouwman, 2009) and (Fungáčová et al., 2010) who
find a negative impact from the capital on liquidity creation. A negative impact of capital on
liquidity creation would the results suggest that greater capital requirements may hamper
liquidity creation.
The ratio of total equity to total assets (CAP) is significant and positively correlated
with RWA (credit risk). Size is also positively correlated with risk-weighted assets, the results
are in line with the findings of (Boyd and Runkle, 1993), (Demsetz and Strahan, 1997), and
(De Haan and Poghosyan, 2012). A significant robust positive relationship between loan and
liquidity creation which is consistent with the findings of (Acharya and Naqvi’s, 2012), NPL
negatively affects liquidity creation. Loan is positively correlated with liquidity creation; thesis
results suggest that the excessive lending behavior of Jordanian commercial banks increases
197
the chances of credit and default risks. In line with (Acharya and Naqvi’s, 2012). Both ROA
and ROE have a negative relationship with loan loss provisions and z-score. The results show
that there is a significant negative relationship between loan, ROE, CAP, IRB and funding
liquidity risk, which suggests that an increase in the capital buffer and profit will decrease the
liquidity funding risk and are in line with previous results that confirm that well-capitalized
banks with high-profit profiles are better protected against shocks (Jeitschko and Jeung, 2005).
The results for the 3 sub-periods: before, during and after the global financial crises show that
before the 2008 crises, size has a negative and significant impact on the Jordanian banking
sector risk-taking (LLP and z-score). The results indicate that the larger Jordanian banks are
safer and more stable in line with (Boyd and Runkle, 1993), (Demsetz and Strahan, 1997), and
(De Haan and Poghosyan, 2012). During the global financial crises, NPL is shown to have a
negative and significant impact on the Jordanian banking sector risk-taking (LC, RWA, and Z-
score) behavior. Dep, ROE, and CAP are positively correlated with the Jordanian banking
sector risk-taking (LLP). The results are explained by the fact that Jordanian banks with high
capital buffers engage in much riskier activities. These results also correspond with the capital
adequacy ratio (CAR) levels in the Jordanian banking sector which range between 18.0 percent
and 21.0 percent during the years 2007-2015.
With regard to the liquidity financing risk model, the results show that, prior to the
global financial crisis, the credit and CAP have had a significant negative impact on the
liquidity risk of financing. While CAP maintains its negative relationship with liquidity
financing risk during the global financial crisis. The results suggest that increasing capital
buffer and bank profits decrease the liquidity funding risk after the global financial crisis.

198
CHAPTER 8
Concluding Remarks
8.1 Introduction
This chapter summarises and concludes this thesis. First a summary of the thesis is provided,
followed by a discussion of the main findings of the three main chapters, the empirical findings
of which fills the gap in the existing literature on the issues examined using Jordanian bank
and other economic data. We then discuss the implications of this thesis with respect to how
the Jordanian Central Bank (CBJ) and other policy makers improve and develop banking in
Jordan. We proceed by briefly discussing the main limitations faced in completing this thesis
and then provide directions for future research by focusing on two possible areas for research.
The chapter concludes by providing a summary conclusion and highlight the main contribution
made by the three chapters.
Commercial banks in Jordan are vital for financing other sectors. The turmoil in the MENA
region and the eruption of the Arab Spring in 2010 and the Global Financial Crisis
exacerbated the challenges that banks in MENA area face, including Jordan.The importance
of the study is to investigate the impact of the reform program, Arab Spring, Global Financial
Crises, and the Basel I, II and III on the Jordanian commercial banks during the 2003 and
2015. The research studied the 13 Jordanian commercial banks that listed in Amman Stock
Exchange which they present 94% of the Jordanian banking system assets, the study covers
the main driver banks in the Jordanian banking system in addition to the availability of the
data that we need to the analysis purposes. The minimum CAR of the CBJ is 12% and the
Jordanian commercial banks CAR reached 21% which give the importance to study the
impact of the high CAR on the bank performance and the risk-taking behavior. One of the
main reasons behind this investigation is the rare of the studies that examined the same topic
in the Middle East in general and especially in Jordan. The study's findings are important as
it give and highlight the impact of the new capital requirement regulations, liquidity risk, and
risk-based capital regulation on the Jordanian commercial banks, which directly may help the
CBJ regulators take the right and logical decision to improve and enhance the sector. It is
helping the banks manager as well to take the right decision to minimize the banks risks.

199
Again, this study only focused on one aspect of banking sector indicators, which is a risk, and
overlooked indicators related to productivity, efficiency, and profitability. Thus, there is a
need for a comprehensive empirical assessment of the impact of the recent CBJ reforms on
performance, risk, and efficiency indicators. This research is the first of its kind to cover an
extended time span from 2003 until 2015 while considering the effects of some major
incidences namely the 2008 global financial crises, Basel II and III accords announcements
and regional political shocks such as the Arab Spring in the Middle East area and especially
Jordan which makes a direct contribution to the existing literature by filling this gap in the
Middle East area.
This thesis contains seven chapters, chapter one presents the introduction, chapter two
provides a survey of the literature, and chapter three provides background on the development
of Jordanian banking sector since 1990. The main empirical chapters that are the core of this
thesis are chapter four, five, six and seven, the findings of which fill the gaps in the existing
literature using Jordanian bank and other economic data. We used a sample of 13 commercial
banks operating in Jordan’s banking sector over the period 2003-2015.
8.2 Summary of the main findings
The main objective of the first empirical chapter, chapter 4 was to assess the effects of
competition, risk, and market interest rate on Jordanian bank profitability. The methods of
Pooled OLS, Fixed Effects (FE), Random Effects (RE), and Generalized Methods of Moments
(GMM) approaches to aid our research strategy. The issues examined throughout this thesis is
motivated by recent studies. Our study builds on the work of (Molyneux and Thornton, 1992
and Bikkera and Vervliet (2018), by extending the investigation to Jordanian commercial banks
by incorporating more variables and in assessing the impact of competition, liquidity risk, and
interest rate on bank profitability and risk-taking behavior. The study also makes use of more
factors to show its effects on Jordanian bank profitability. We start our analysis by
implementing the model of (Panzar and Rosse, 1987) which is based on a test statistic H, to
assess the state of competition in the Jordanian banking sector. Both the FE and RE methods
account for biasness in omitted variables that arise from ignoring the time-invariant
characteristics correlated with the dependent variables and which cannot be accounted for. The
GMM method is a dynamic modelling technique that permits the inclusion of lagged dependent
variable as one of the right-hand side variables while accounting for the endogenous nature of

200
some of the variables by replacing them with their lagged and lagged differenced values. The
findings of this chapter show the improvement of Jordanian commercial banks profitability and
efficiency which is evidence that an increasing number of banks improved their
competitiveness which ultimately impact bank performance, while also minimizing
concentration (wherein the concentration ratio decreased from75 per cent to 53.9 per cent in
2015), decreasing the interest rate which, in turn, encouraged lending that affected investment
activities positively. The findings also indicate a positive impact of competition on bank
profitability, thus supporting the results of (Petria et al., 2015) who found a positive influence
of competition on bank profitability. Liquidity risk was also found to have a significant positive
impact on profitability which support the results of (Bourke, 1989) who found evidence of a
positive relationship between liquidity risk and bank profitability. The results suggest that
short-term interest rate has no significant impact on profitability and risk measures, thus
supporting the findings of (Albertazzi and Gambacorta, 2009) and (Bikker and Hu, 2002).
The main goal of the second empirical chapters, chapter 5, was to examine the
relationship between bank efficiency, capital, and risk of Jordanian commercial. This was
important to understand the impact of capital requirements on the Jordanian bank efficiency
and performance. We build on the contribution of (Tan and Floros, 2013) by examine the
magnitude and direction of the dynamic relationships between bank efficiency/productivity,
capital, risk. The two chapters use the pooled OLS, FE and RE methods previously discussed
in addition to the Three-Stage Least Square (3SLS) method for chapter 5 which we use to
estimate a system of equations that employ different risk indicators. This method has been used
by (Tan and Floros, 2013) and (Rime, 2001). 3SLS is a remedy for the problem of endogeneity
between bank efficiency, risk, and capital. Using 3SLS is that it provides consistent estimates
of the parameters and is also a full information modelling technique that estimates all the
parameters simultaneously and incorporates the cross-equation correlations and produces
parameter estimates that are asymptotically more efficient than Two-Stage Least Square
(2SLS). To calculate bank efficiency (Eff/O), I use the Malmquist Productivity Index (MPI)
which uses distance functions to measure changes in productivity. I measure technical
efficiencies using the non-parametric method, Data envelopment analysis (DEA) technique
which has been used by Paul & (Kourouche, 2008) and (Alkhathlan and Abdul Malik, 2010a)
among others. The empirical evidence suggests that risk harms capital and efficiency which
supports the findings of (Demsetz et al, 1997), (Tan and Floros, 2013) and (Salas and Saurina,
2003), as well as the findings of (Stolz et al., 2004) and (Van Roy, 2005) and (Fungáčová et

201
al., 2014).
The main goal of the third empirical chapters, chapter 6, we examined the relationship
between bank efficiency, competition on the cost of credit using data for 13 Jordanian
commercial banks and 118 firms during the period 2003-2015. In the measurement of
efficiency, we use the Data Envelopment Analysis (DEA) method. Unlike what was expected,
the efficiency of the banking sector has no impact on firms’ cost of credit, other determinants
such as firm size, bank competition, and GDP are found to be the main moderatos of the
borrowing costs. Our results are in line with (Fungáčová et al., 2014). The results show the
favourable impact of the program and liberalization on the bank efficiency which improve the
household and business to accesses credit. The results show no differences in findings
regarding the impact of variables on the cost of credit for both large and small banks. The only
difference found with the Tangibility as the variable shows a positive significant impact on the
cost of credit in the large-sized firms while it is insignificant for small-sized firms. The positive
relation explained as the Tangibility defined as the ratio of tangible fixed assets to total assets.
A greater share of tangible fixed assets that could serve as collateral can contribute to easier
access to credit and may indicate better opportunities for obtaining external financing
The main objective of the fourth empirical chapter, chapter 7, was to examine the
impact of banks’ funding liquidity risk on Jordanian commercial banks' risk-taking behaviour.
This was important in order to understand the factors affecting Jordanian banking sector
liquidity risk and capital. The issues examined throughout this chapter is motivated by recent
studies. And we build on the contribution of (Khan et al., 2017) by investigating the
relationship between funding liquidity and bank risk-taking and extend their study by looking
at the impact of imposed Jordanian deposit insurance scheme. For this empirical exercise, I use
the FE and RE estimation methodologies to empirically define the main determinants of the
different risk measures of Jordanian commercial banks. The analysis undertaken is extended to
determine the major factors of the banks' liquidity funding. I also use the Difference in
Difference (DID) method to analyse the impact of the deposit insurance scheme implemented
in Jordan in 2000 to gauge Jordanian banks' liquidity creation. In this respect, I compare
changes in liquidity creation before and after the implementation of deposit insurance. The DID
approach is usually used to estimate the effect of a specific intervention (deposit insurance
scheme) by comparing the changes in outcomes over time between a group that is enrolled in
a program and a group that is not. The empirical results show that Jordanian banks with larger
capital engage in more risky actions than other banks. The results show that capital buffer and

202
profit decrease liquidity funding risk which is broadly in line with previous results that confirm
that well-capitalized banks with high-profit profiles are better protected against shocks which
is broadly consistent with the findings of (Jeitschko and Jeung, 2005). The results also show
that before the global financial crises, loan and CAP have a negative significant impact on the
funding liquidity risk. While during the global financial crises, CAP maintains its negative
relationship with the liquidity funding risk, the study results show that bank size and capital
buffers help to minimize the Jordanian commercial banks’ risk-taking behaviour in response
to decreased funding liquidity risk which is consistent with the findings of (Berger and
Bouwman, 2009) and (Fungáčová et al., 2010) who find a negative impact from the capital on
liquidity creation.
The findings of this study show liquidity risk to be one of the most significant risks that
Jordanian commercial banks must mitigate against most of these banks rely on central bank
guidelines to manage and set their liquidity and funding liquidity risk limits. The breadth of
commercial banks’ activities in Jordan as regards financing most of the economic sectors in
the country through their role as financial intermediaries marks the importance of shielding
them from liquidity risks. The thesis analyzed the impact of some factors such as profitability,
capital, credit, size, competition. efficiency, risk, and other variables on the Jordanian
banking performance and stability.
8.3 Research Contribution
The research contributes to the existing body of knowledge through providing a fair
assessment of the impact of the reform program, the deregulation, and the new capital
requirements on the Jordanian banking system performance, as to the best of the researcher’s
knowledge; very few studies have yet been concerned with the impact of new capital
requirements framework in the MENA region in general and in Jordan specifically. This
research will cover all Jordan commercial banks to investigating the impact of competition,
risk, and interest rate on Jordanian commercial banks profitability, in addition to the
relationship between Jordanian bank efficiency, capital and risk, and the relationship between
funding liquidity risk and Jordanian bank risk-taking, capital, and size for the period between
2003and 2015. In additions, this research will enrich the existing literature of the techniques
that could applied in other banks environments. The shape of this study could be helpful for
the researchers in field of risk management studies and banking performance.

203
The outcome of the analysis shows that how the political volatility of the region and its
impact on banks operations, commercial banks are using different metrics to set their
exposures although the macroeconomic, regulatory and products are relatively the same,
pointing to the level of risk appetite on which these banks operate and their dependency on
the central bank in setting metrics for risks. Shedding light on the vulnerability of the banking
system in Jordan to the political instability in the region, which impacts both macroeconomic
and financial conditions. This is reflected in banks’ risk appetites as most banks indicated
that they are avoiding high-risk exposures to reduce their overall risk.
Therefore, this study is one of the first studies to present the impact of the capital
requirements and risk-based capital within the population of commercial banks in Jordan and
tests whether the reform program and deregulation is effective in commercial banks through
employing a set of sub-hypotheses related to the main types of risks, such as liquidity and
credit, risks. It also looks at liquidity funding plans that banks adopt based on their
supervisory authorities’ instructions. Furthermore, this thesis assesses the impact of various
variables related to banking operations and the regulatory framework in Jordan, including the
impact of macroeconomic conditions on Jordanian commercial banks’ profitability,
efficiency, and liquidity. The study deducts useful conclusions and recommendations that
would help the banking industry to enhance banks performance and efficiency and help banks
to develop a comprehensive and applicable framework tailored to the Jordanian banking
system by identifying the main factors that impact profitability, efficiency, and liquidity risk.
The results indicate that internal factors have a major impact on the profitability,
efficiency, and liquidity risk as the strategic plan of commercial banks impact the structure of
banks’ balance sheet and their operations, and thereby their liquidity positions and risk
exposures. Therefore, having a consistent strategic plan that is aligned with the bank goals
regarding maximizing profits and risk appetite, while mitigating against risk exposures, is
imperative to control changes in these factors. For example, the results indicated that
profitability had a positive impact on liquidity risk, which in the case of Jordanian banks should
be warranted by the limited resources that banks have, their limited access to wholesale
funding, and their reliance on conventional banking as their primary means of generating
revenues. On the other hand, the importance of having efficient management who are able to
set strategic plans and limits on risk exposures and risk appetite taking the regulatory and
macroeconomic circumstances in Jordan into consideration.

204
To the best of my knowledge, the study found no previous research on Jordanian
banking covers the main objectives of this study. Overall, the empirical work presented in these
chapters fills an important gap in the empirical literature by investigating the impact of
competition, risk and interest rate on Jordanian commercial banks profitability, in addition to
the relationship between Jordanian bank efficiency, capital and risk, and the relationship
between funding liquidity risk and Jordanian bank risk-taking, capital, and size for the period
between 2003and 2015 which should help to inform policy makers on how to move forward,
with respect to policy measures, to improve the environment in which Jordanian banks operate.
8.4 Policy Implications and Recommendations
The results of this study provide some implications for policy-makers, banks shareholders,
academics, as well as, regulatory institutions such as the central bank of Jordan. Central banks
in countries with a similar banking sector may find the results useful for drafting regulations
and policies related to liquidity risk management in commercial banks. This would help to
safeguard the banking sector by encouraging banks to develop guidelines for bank performance
(profitability, efficiency and liquidity risk) that promote transparency in risk management.
Regulators could also use this study to set guidelines built on the recommendations of the Basel
committee. If shared with other research, the general findings in this study will have remarkable
implications in improving the bank's performance and chart up risk’s identifications for
financial institutions.
The main conclusions of the research clearly show that internal factors have the biggest
impact on bank profitability, efficiency, and liquidity risk. As the Jordanian commercial banks
are concerned with meeting the liquidity requirements set by the central bank. This is an
indicator of the comprehensive framework for liquidity management at commercial banks
given the limited resources. This highlights the importance of the regulatory body to help banks
construct a framework for liquidity management that takes a holistic approach to dealing with
transparency in risk management, proper delegation of authorities, adequate reporting, and
funding sources. Such frameworks should be a part of the strategic plans and targets set by
banks. It is hard to set out one best strategy for liquidity management – but multi strategies can
be adopted to achieve banks goals in profit and growth and enhance commercial banks’ abilities
in managing their liquidity positions and risks. It is worth to point out the growth in banks’
balance sheet is crucial, it needs an appropriate framework to support this growth and minimize
the risks. Therefore, banks’ risk-taking behaviour strategies should be organised with other risk

205
plans implemented first followed by banks goals to support and ensuring banks sustainable
growth. Accordingly, the main recommendations from the thesis can be summarized as
follows:
Clear framework for liquidity risk management: The Jordanian commercial banks
should ensure the consistency of their liquidity management frameworks with the strategic
objectives of operational divisions, considering the asset and liability structures, capital
positions and liquidity on different stages. The liquidity risk framework is extremely important
from the viewpoint of ensuring the soundness and suitability of banking system, and the bank
management is responsible for taking the initiative in the chart up a clear liquidity risk
management framework and reviewing occasionally whether the framework is appropriate to
the bank risk profile (such as liquidity, interest rate and credit risk), and the nature of its
business.
Enhancing coordination between banks and supervisory authorities: Supervisory
authorities, represented by the central bank in Jordan, have taken a keen interest in supervising
financial institutions’ liquidity positions as well as liquidity risk levels, especially after the
Global Financial Crisis, which urged the Basel committee to issue the Basel III guidelines that
are mainly concerned with liquidity management. These changes have increased the regulatory
burden on the central bank and increased banks’ reliance on its guidelines with regards to
liquidity, as shown by the study results. Accordingly, banks could still be lacking a
comprehensive framework related to liquidity risk management. Therefore, increased
coordination between banks and central banks is needed through establish systems for
assessing and measure risks. The study results indicated that the new regulations and the
liberalization processes are effective in most Jordanian commercial banks, as supported by the
results of the sub-hypotheses. Still, some actions should be taken to insulate banks from
liquidity risks and improve profitability and efficiency, taking into consideration the political
instability in the region and its impact on the macroeconomic conditions. Therefore, the
supervisory authorities, represented by the central bank, should take into consideration the
results of this study given the emphasis of Basel III on liquidity management.
Besides, this thesis have some important policy implications for the Amman stock
exchange (ASE), Jordanian banking regulatory authorities, the CBJ regulators and bank
managers, as it provides rigorous empirical investigations of profit, efficiency, and risk
exposure determinants of the Jordanian banking sector. Our findings should steer policymakers
towards designing appropriate and fair regulations to enhance bank performance while at the

206
same time ensuring the stability of the Jordanian financial system. The findings of chapter five
and six should encourage bank managers and regulators to enforce tighter restrictions and to
apply effective risk management practices to ensure financial stability and mitigate potential
losses of any internal or external shocks. The CBJ reform phases and the introduction of the
deposit insurance scheme both carried favorable spillovers on the competitiveness,
profitability, and stability of the banking sector, however extra efforts are still required to
enhance the competitiveness of the banking sector and the development of the Amman stock
market.
Chapter four investigates the impact of competition, liquidity risk, and market interest
rate environment on Jordanian banks’ profitability results, suggesting that the structure of the
Jordanian commercial banking industry was characterized by monopolistic competition. This
result may reflect the domination of the Jordanian commercial banking sector by 3 large banks,
which together account for over 75 percent of total banking assets. The large banks tend to
avoid outright competition against each other. The challenge for Jordanian banking sector
authorities is to ensure that the ongoing reforms result in greater competition and welfare gains
for the economy. Therefore, motivating the competitive environment in the market will
eventually lead to more efficiency. The results show that there is still a need to enhance market
competition, the positive change in the competitiveness state of the Jordanian banking sector
corresponds to the entry of six new banks meaning that minimizing the entry of new banks
restrictions to the Jordanian banking sector will improve the competition and reduce the
concentration. Careful management is required for the larger number of deposits and the
acquired capital by Jordanian banks due to the inward migration of Iraqi and Syrian refugees
to Jordan. more restrictions on the liquidity and capital ratio needed as they protect Jordanian
banks against future shocks. As a result, Jordanian banks should start to use a wide range of
products and services to improve banks’ profitability and become less reliant on interest income
as a result of the low-interest-rate environment. The government should, therefore, desist from
controlling prices and allow the functioning of market forces. On the other hand, in the highly
concentrated markets, uncertainty avoidance or risk aversion rather than efficiency become the
objectives of some banks. Market power (lack of competition) can thus lead to reduced
efficiency. The policy implication for this result suggests that mergers between banks could
strengthen the market power. With a high degree of concentration, it is possible that the “quiet
life” hypothesis will come into play in Jordan. That is, as firms enjoy greater market power and
concentration, inefficiency follows not because of non-competitive pricing but more so because

207
of a relaxed environment with no incentives to minimize costs. Thus, if the market
concentration is leading to lower efficiency, the government policy of encouraging the bank
mergers between banks needs to be approached with caution. it supports the favorable
spillovers of the reform policies on the overall profitability and efficiency of the Jordanian
banking sector. However, chapter four empirical results confirm the low competitive nature of
the banking sector and stress the need for enhancing market competition. The results also
suggest that higher total banks’ assets may not necessarily lead to higher profits and that careful
management by bank managers is required due to the unexpected booming in the number of
deposits and capital by Jordanian banks due to the inward migration of Iraqi and Syrian
refugees to Jordan. The unplanned escalation in bank capital may encourage bank managers'
risk-taking behaviour and enhance the chances of bank default.
In Chapter five and six, we analyze the relationship between bank
efficiency/productivity, capital, risk, and cost of credit. DEA results suggest there is improving
bank efficiency in Jordanian commercial banks. The factors that may influence efficiency have
been identified in this study and could aid banks and policymakers in devising suitable
strategies. Inconsistent with the above results, First, large banks are found to be more efficient
than small banks. Therefore, small banks should be encouraged to become larger. Second,
banks’ profitability is positively related to efficiency. Third, market power plays an important
role in inefficiency. Therefore, motivating the competitive environment in the market will
eventually lead to more efficiency. Fourth, the significance of capital adequacy ratio in
explaining efficiency implies that banks with higher capital adequacy ratio are less efficient
since they are risk-averse and prefer safer and lower-earning portfolios. Finally, and more
importantly, the liberalization is positively related to efficiency, suggesting that a further
liberalization in the market will eventually lead to more efficiency in the Jordanian banking
sector. The results show that improving the competitiveness of the banking sector is one
dimension that requires the attention of bank regulators as it was found to be a significant factor
in improving capital and efficiency measures and reducing risks in the Jordanian banking
sector, in addition to contributing significantly to better access to credit by lowering financing
obstacles for firms.
Chapter seven studies the impact of banks’ funding liquidity risk on the Jordanian
commercial banks' risk-taking behavior. It shows that bank size and capital buffers help to
minimize the Jordanian commercial banks’ risk-taking behaviour in response to decreased
funding liquidity risk. Also, the introduced deposit insurance scheme has reduced the need for

208
liquidity funding risk for banks with excessive deposits. Policymakers and bank managers need
to carefully address the tradeoff between imposing bank capital requirements to maintain the
financial system stability, and the process of liquidity creation to enhance banks’ capital assets.
This trade-off needs to be carefully considered when designing new policies or levy new
measures on the Jordanian commercial banks. Jordanian commercial banks are more
conservative even during the financial crises as they are monitored and controlled by the CBJ.
Implementing deposit insurance since 2000 has not changed the negative relationship between
bank capital and liquidity creation. There seems to be a clear tradeoff between imposing bank
capital requirements to maintain the financial system stability, and the process of liquidity
creation to enhance banks’ capital assets. This trade-off needs to be carefully considered when
decision-makers and regulators design new policies or levy new measures on the Jordanian
commercial banks. The results support the view that the Jordanian banks should improve the
quality of their assets and reduce their riskiness. The findings of this study show that capital
buffers and size generally help to curb banks’ risk-taking behavior in response to decreased
funding liquidity risk. The results may help regulators redesign the banking regulatory
framework such as (stress analysis) to better discipline and control the perverse incentives of
bank managers to take too much risk when bank deposits change.
8.5 Research Limitations
Although this thesis conducted a study of commercial banking in Jordan, consisting of three
core chapters, in an in-depth manner, the completion of the thesis was not without its specific
limitations. This research has the following limitations:
1. Limited population: The Jordanian economy is a small open economy with a banking
sector comprised of 21 commercial banks and many of Islamic banks. Therefore, this
is a limited population to study.
2. Data limitations: There are 21 commercial banks in Jordan. Thirteen are domestic banks
and the rest are foreign banks branches. In this part of the study, the analysis only
included the 13 domestic commercial banks as data for the rest of the population could
not be obtained through the used database or through manual data entry. Moreover, the
small-time span of the data is considered another limitation that led to having a
relatively small dataset.
3. Lack of prior research studies: According to the best of the researcher's knowledge,

209
very few studies have investigated the impact of internal factors profitability,
efficiency, and risk at Jordanian commercial banks. And very few studies have yet
studied the impact of new capital requirement and risk-taking behavior.
4. Longitudinal effect: Compared to the long history of literature on bank management in
both a global as well as domestic context, this research was carried out over a fairly
short period of time.
The major limitation was its focus on a limited number of commercial banks in Jordan
covering the period 2003-2015, which means that time does not consider the effects of the
historical financial crisis during the 1980s. Regarding some relevant control variables such as
risk-weighted assets and NPL, we were unable to locate sufficient data for these variables
especially before 2006 to incorporate them in our models. However, despite the limited data,
the three Chapters that form the core of the thesis has produced a significant empirical study
that contributes towards filling the gap in the literature on the behavior of Jordanian banks,
which should be of some help to bank managers, the CBJ, foreign investors, bank regulators
and Jordanian policy makers interested in obtaining better understanding of modern day
developments, including the impact of policy changes, and the changing market environment
on Jordanian commercial banks.
8.6 Directions for future research
Within the confines of this thesis, there are two areas of potential extensions to the issues
studied that have emerged during our study of Jordanian banking. In our earlier discussion in
Chapter 3 on the developments in Jordanian banking, we noted that the CBJ implemented a
series of measures to improve the overall performance of the banking sector, including
measures based on best practices in corporate governance. Therefore, it would be of interest
to investigate the extent to which corporate governance initiatives' performance has affected
the performance of Jordanian banks over the period in which corporate governance measures
began to take effect. According to the corporate governance literature, successful corporate
governance structures can improve not only public accountability, but it can also create value,
enhance operational efficiency, while also minimizing risk exposure. Empirically, this line of
inquiry could be approached by the application of two common approaches – the parametric
stochastic frontier approach and the non-parametric data envelop analysis, using the theory
of agency and a set of governance related data. This line of research would also be of some

210
interest to regulators and policy makers and other MENA countries where corporate
governance reforms are on the increase.
A second important issue for further research which follows from our findings reported
in Chapter 6 concerns the risk preference of Jordanian commercial banks. In regard to this, it
would be of interest to ascertain which categories of risk preferences best categorise Jordanian
commercial banks – conservative, moderate or aggressive, especially given the general
consensus in Jordan which holds that Jordanian commercial banks are conservative in their
banking practices. Thus, it would be of interest to confirm whether such views hold empirically
by examining banking efficiency with risk factors taking the risk preferences of Jordanian
banks into account. Statistically, this could be approached by, in the first instance, a profit
model using common profit-based variables to study the risk preferences of Jordanian banks.
Second, a credit model which could be used to determine whether low risk cost affects the risk
preferences of Jordanian commercial banks.
Bibliography
Abreu, M. & Mendes, V. (2001). Commercial Bank Interest Margins and Profitability :
Evidence for Some Eu. In Pan-European Conference Jointly Organised by the IEFS-UK
& University of Macedonia Economic & Social Science, Thessaloniki, Greece, (May
2001), 17–20.
Abreu, J. F., & Gulamhussen, M. A. (2015). The Effectiveness of Regulatory Capital
Requirements Prior to the Onset of the Financial Crisis. International Review of
Finance, 15(2), 199–221. https://doi.org/10.1111/irfi.12046
Abuzayed, B., Molyneux, P., & Al-Fayoumi, N. (2009). Market value, book value and
earnings: is bank efficiency a missing link? Managerial Finance, 35(2), 156–179.
https://doi.org/10.1108/03074350910923491

211
Acharya, V. V., & Viswanathan, S. (2011). Leverage, Moral Hazard, and Liquidity. Journal
of Finance, 66(1), 99–138. https://doi.org/10.1111/j.1540-6261.2010.01627.x
Acharya, V., & Naqvi, H. (2012). The seeds of a crisis: A theory of bank liquidity and risk
taking over the business cycle. Journal of Financial Economics, 106(2), 349–366.
https://doi.org/10.1016/j.jfineco.2012.05.014
Acosta Smith, J., Grill, M., & Lang, J. H. (2018). The Leverage Ratio, Risk-Taking and Bank
Stability. In SSRN Electronic Journal. https://doi.org/10.2139/ssrn.3284435
Ahid, M., & Augustine, A. (2012). The Impact of Global Financial Crisis on Jordan.
International Journal of Business & Management, 7(16), 80-88
Ahmed, A.M., and Khababa, N. (1999). Performance of Banking Sector in Saudi
Arabia. Journal of Financial Management & Analysis, 12(2), 30.
Akhtar, M., Ali, K., & Sadaqat, S. (2011). Liquidity risk management: a comparative study
between conventional and Islamic banks of Pakistan. Interdisciplinary Journal of …,
1(January), 35–44. Retrieved from
http://core.kmi.open.ac.uk/download/pdf/1138057.pdf
Al-jarrah, I. M. (2010). Competition in the Jordanian ’ s Banking Sector. 37(2), 570–581.
Al-Muharrami, S., Matthews, K., & Khabari, Y. (2006). Market structure and competitive
conditions in the Arab GCC banking system. Journal of Banking and Finance, 30(12),
3487–3501. https://doi.org/10.1016/j.jbankfin.2006.01.006
AL-QAISI, K. M. (2018). A Literature Review on the Competition in the Banking Sector.
International Journal of Academic Research in Accounting, Finance and Management
Sciences, 8(1), 174–184. https://doi.org/10.6007/ijarafms/v8-i1/4043
Al-Smadi, M. O. S. A. A.-W. (1970). The Impact of E- Banking on The Performance of
Jordanian Banks. Journal of Internet Banking and Commerce, (ISSN: 1204-5357).
Retrieved from http://www.icommercecentral.com/open-access/the-impact-of-e-
banking-on-the-performance-of-jordanianbanks.php?aid=38255
Al-Tarawneh, A., Abu Khalaf, B., & Al Assaf, G. (2017). Noninterest income and financial
performance at Jordanian Banks. International Journal of financial research, 8(1), 166-171.
Al-tamimi, H. A. H. (2008). The Determinants of the UAE Commercial Banks ’ Performance
The Determinants of the UAE Commercial Banks ’ Performance : A Comparison of the
National and Foreign Banks. 5778(August 2013), 37–41.
https://doi.org/10.1300/J482v10n04
Albertazzi, U., & Gambacorta, L. (2009). Bank profitability and the business cycle. Journal
of Financial Stability, 5(4), 393–409. https://doi.org/10.1016/j.jfs.2008.10.002
Alessandri, P., & Nelson, B. D. (2015). Simple banking: Profitability and the yield curve.
Journal of Money, Credit and Banking, 47(1), 143–175.
https://doi.org/10.1111/jmcb.12172
Alfon, I., Argimón, I., & Bascuñana-Ambrós, P. (2005). How individual capital requirements
affect capital ratios in UK banks and building societies. Retrieved from
http://ideas.repec.org/p/bde/wpaper/0515.html
Alkadamani, K. (2015). Capital Adequacy, Bank Behavior and Crisis: Evidence from

212
Emergent Economies. European Journal of Sustainable Development, 4(2), 329–338.
https://doi.org/10.14207/ejsd.2015.v4n2p329
Alkhathlan, K. A., & Abdul Malik, S. (2010). Are Saudi Banks Efficient? Evidence using
Data Envelopment Analysis (DEA. International Journal of Economics and Finance,
2(2). https://doi.org/10.5539/ijef.v2n2p53
Allen N . Berger and Gregory F . Udell. (1994). Did Risk-Based Capital Allocate Bank Credit
and Cause a " Credit Crunch " in the United States ? Author ( s ): Allen N . Berger and
Gregory F . Udell Source : Journal of Money , Credit and Banking , Vol . 26 , No . 3 ,
Part 2 : Federal Credit Allocation : 26(3), 585–628.
Allen, F., & Gale, D. (2004). Financial fragility, liquidity, and asset prices. Journal of the European Economic Association, 2(6), 1015-1048.
Alper, D., Anbar, A., 2011. Bank specific and macroeconomic determinants of commercial
bank profitability: empirical evidence from Turkey. Business and Economics Research
Journal 2(2), 139-152.
Alshatti, A. S. (2016). Determinants of banks’ profitability - The case of Jordan. Investment
Management and Financial Innovations, 13(1), 84–91.
https://doi.org/10.21511/imfi.13(1).2016.08
Altunbas, Y., Carbo, S., Gardener, E. P. M., & Molyneux, P. (2007). Examining the
relationships between capital, risk and efficiency in European banking. European
Financial Management, 13(1), 49–70. https://doi.org/10.1111/j.1468-
036X.2006.00285.x
Aly, D., El-Halaby, S., & Hussainey, K. (2018). Tone disclosure and financial performance:
evidence from Egypt. Accounting Research Journal, 31(1), 63–74.
https://doi.org/10.1108/ARJ-09-2016-0123
Alzoubi, T. (2013). The Value of Cash Holding and the Financial Crisis: Evidence from
Jordan. Proceedings of 8th Asian Business Research Conference, 1-2 April 2013,
Bangkok, Thailand
Anderson, R. C., & Fraser, D. R. (2000). Corporate control, bank risk taking, and the health
of the banking industry. Journal of Banking and Finance, 24(8), 1383–1398.
https://doi.org/10.1016/S0378-4266(99)00088-6
Anginer, Deniz, Asli Demirgüç-Kunt, and Min Zhu. 2012. “How Does Bank Competition Affect Systemic Stability?” Policy Research Working Paper 5981, World Bank,
Washington, DC.
Ani, W. U., Ugwunta, D. O., Ezeudu, I. J., & Ugwuanyi, G. O. (2012). An empirical
assessment of the determinants of bank profitability in Nigeria: Bank characteristics
panel evidence. Journal of Accounting and Taxation, 4(3), 38.
Anzoategui, D., Pería, M. S. M., & Melecky, M. (2012). Bank competition in Russia: An
examination at different levels of aggregation. Emerging Markets Review, 13(1), 42–57.
https://doi.org/10.1016/j.ememar.2011.09.004
Arellano, M., & Bond, S. (1991). Some Tests of Specification for Panel Data: Monte Carlo
Evidence and an Application to Employment Equations. The Review of Economic
Studies, 58(2), 277. https://doi.org/10.2307/2297968

213
Arellano, M., & Bover, O. (1995). Another look at the instrumental variable estimation of
error-components models. Journal of Econometrics, 68(1), 29–51.
https://doi.org/10.1016/0304-4076(94)01642-D
Arif, A., & Nauman Anees, A. (2012). Liquidity risk and performance of banking system.
Journal of Financial Regulation and Compliance, 20(2), 182–195.
https://doi.org/10.1108/13581981211218342
Ashraf, B., Arshad, S., & Hu, Y. (2016). Capital Regulation and Bank Risk-Taking Behavior:
Evidence from Pakistan. International Journal of Financial Studies, 4(3), 16.
https://doi.org/10.3390/ijfs4030016
Ashton, J. K., & Pham, K. (2011). Efficiency and Price Effects of Horizontal Bank Mergers.
SSRN Electronic Journal. https://doi.org/10.2139/ssrn.997995
Association of banks in Jordan. (2015). Association of banks in Jordan. Retrieved from
http://www.abj.org.jo/en-us/developmentofthejordanianbankingsector.aspx
Athanasoglou, P., Delis, M., & Staikouras, C. (2006). Determinants of bank profitability in
the South Eastern European region.
Athanasoglou, P. P., Brissimis, S. N., & Delis, M. D. (2008). Bank-specific, industry-specific
and macroeconomic determinants of bank profitability. Journal of International
Financial Markets, Institutions and Money, 18(2), 121–136.
https://doi.org/10.1016/j.intfin.2006.07.001
Athanasoglou, P. P., Daniilidis, I., & Delis, M. D. (2014). Bank procyclicality and output:
Issues and policies. Journal of Economics and Business, 72, 58–83.
https://doi.org/10.1016/j.jeconbus.2013.10.003
Avery, R. B., & Berger, A. N. (1991). Loan commitments and bank risk exposure. Journal of
Banking and Finance, 15(1), 173–192. https://doi.org/10.1016/0378-4266(91)90045-N
Aydemir, R., & Guloglu, B. (2017). How do banks determine their spreads under credit and
liquidity risks during business cycles? Journal of International Financial Markets,
Institutions and Money, 46, 147–157. https://doi.org/10.1016/j.intfin.2016.08.001
Azam, M., & Siddiqui, S. (2012). Domestic and foreign Banks’ profitability: Differences and
their determinants. International Journal of Economics and Financial Issues, 2(1), 33–
40.
Babic, A., Zildzovic, E., & Loncar, D. (2015). Testing for competition in Serbian banking
industry: The Panzar-Rosse approach. Industrija, 43(3), 7–26.
https://doi.org/10.5937/industrija43-7648
Barajas, A., Steiner, R. and Salazar, N. (1999). Interest Spreads in Banking in Colombia 1974
– 96. IMF Staff Papers, 46, 196-224.
Barrios, V. E., & Blanco, J. M. (2003). The effectiveness of bank capital adequacy
regulation: A theoretical and empirical approach. Journal of Banking and Finance,
27(10), 1935–1958. https://doi.org/10.1016/S0378-4266(02)00311-4
Barth, J. R., Nolle, D. E., Phumiwasana, T., & Yago, G. (2003). A Cross-Country Analysis of
the Bank Supervisory Framework and Bank Performance. Financial Markets,
Institutions and Instruments, 12(2), 67–120. https://doi.org/10.1111/1468-0416.t01-2-
00001

214
Bashir, A. (2000), Determinants of Profitability and Rates of Return Margins in Islamic
Banks: Some Evidence from the Middle East, Grambling State University, Mimeo.
Bdour, J. I., & Al-khoury, A. F. (2008). Predicting change in bank efficiency in Jordan: A
data envelopment analysis. Journal of Accounting & Organizational Change, 4(2), 162–
181. https://doi.org/10.1108/18325910810878955
Beatty, A. L., & Gron, A. (2001). Capital, Portfolio, and Growth: Bank Behavior under Risk-
Based Capital Guidelines. Journal of Financial Services Research, 20(1), 5–31.
https://doi.org/10.1023/A:1011146725028
Ben Naceur, S., and Goaied, M. (2001), The determinants of the Tunisian deposit
banks’performance. Applied Financial Economics, 11(3), 317-319.
Bennaceur, S. (2008). The Determinants of Commercial Bank Interest Margin and
Profitability: Evidence from Tunisia Samy Bennaceur 1 Mohamed Goaied 2. Frontiers
in Finance and Economics –, 5(1), 106–130.
Berger, A.N. (1995), The relationship between capital and earnings in banking, Journal of
Money, Credit and Banking, 27 (2), 432-456.
Berger, A. N., & Mester, L. J. (1997). Efficiency and productivity change in the US commercial banking industry: A comparison of the 1980s and 1990s (No. 97-5).
Berger, A. N., & DeYoung, R. (1997b). Problem Loans and Cost Efficiency in commercial
banks. Journal of Banking and Finance, 21, 849–870.
Berger, A. N., S. D. Bonime, D. M. Covitz, and D. Hancock. 2000. “Why are Bank Profits so
Persistent? The Roles of Product Market Competition, Information Opacity and
Regional Macroeconomic Shocks.” Journal of Banking & Finance 24: 1203–1235
Berger, A. N., & Bouwman, C. H. S. (2009). Bank liquidity creation. Review of Financial
Studies, 22(9), 3779–3837. https://doi.org/10.1093/rfs/hhn104
Berger, A. N., Bouwman, C. H. S., Kick, T., & Schaeck, K. (2016). Bank liquidity creation
following regulatory interventions and capital support. Journal of Financial
Intermediation, 26, 115–141. https://doi.org/10.1016/j.jfi.2016.01.001
Berger, A. N., & Sedunov, J. (2017). Bank liquidity creation and real economic output.
Journal of Banking and Finance, 81, 1–19.
https://doi.org/10.1016/j.jbankfin.2017.04.005
Bernanke, B., Gertler, M. and Gilchrist, S. (1999), “The Financial Accelerator in a
Quantitative Business Cycle Framework,” in Handbook of Macroeconomics, Volume
1C, edited by J. Taylor and M. Woodford.
Bertay, A. C., Demirgüç-Kunt, A., & Huizinga, H. (2013). Do we need big banks? Evidence
on performance, strategy and market discipline. Journal of Financial Intermediation,
22(4), 532–558. https://doi.org/10.1016/j.jfi.2013.02.002
Bhattacharya, S., & Thakor, A. V. (1993). Contemporary banking theory. Journal of financial Intermediation, 3(1), 2-50.
Bikker, J. A., & Hu, H. (2002). Cyclical patterns in profits, provisioning and lending of banks
and procyclicality of the new Basel capital requirements. PSL Quarterly Review, 55(221).
Bikker, J. A., & Haaf, K. (2002). Measures of competition and concentration in the banking
215
industry: a review of the literature. Economic & Financial Modelling, 9(2), 53-98.
Bikker, J. A., & Vervliet, T. M. (2018). Bank profitability and risk-taking under low interest
rates. International Journal of Finance and Economics, 23(1), 3–18.
https://doi.org/10.1002/ijfe.1595
Bjorvatn, K., & Farzanegan, M. R. (2013). Demographic Transition in Resource Rich
Countries: A Blessing or a Curse? World Development, 45(211870), 337–351.
https://doi.org/10.1016/j.worlddev.2013.01.026
Blum, J. (1999). Do capital adequacy requirements reduce risks in banking? Journal of
Banking and Finance, 23(5), 755–771. https://doi.org/10.1016/S0378-4266(98)00113-7
Blundell, R., & Bond, S. (1998). Initial conditions and moment restrictions in dynamic panel
data models. Journal of Econometrics, 87(1), 115–143. https://doi.org/10.1016/S0304-
4076(98)00009-8
Bluhm, M., & Krahnen, J. P. (2014). Systemic risk in an interconnected banking system with
endogenous asset markets. Journal of Financial Stability, 13, 75–94.
https://doi.org/10.1016/j.jfs.2014.04.002
Blum, J. (1999). Do capital adequacy requirements reduce risks in banking? Journal of
Banking and Finance, 23(5), 755–771. https://doi.org/10.1016/S0378-4266(98)00113-7
Bolt, W., de Haan, L., Hoeberichts, M., van Oordt, M. R. C., & Swank, J. (2012). Bank
profitability during recessions. Journal of Banking and Finance, 36(9), 2552–2564.
https://doi.org/10.1016/j.jbankfin.2012.05.011
Borio, C., & Zhu, H. (2012). Capital regulation, risk-taking and monetary policy: A missing
link in the transmission mechanism? Journal of Financial Stability, 8(4), 236–251.
https://doi.org/10.1016/j.jfs.2011.12.003
Bourke, P. (1989). Concentration and other determinants of bank profitability in Europe.
Journal of Banking and Finance, 13, 65–80.
Boyd, J. H., & Runkle, D. E. (1993). Size and performance of banking firms. Testing the
predictions of theory. Journal of Monetary Economics, 31(1), 47–67.
https://doi.org/10.1016/0304-3932(93)90016-9
Bridges, J., Gregory, D., Nielsen, M., Pezzini, S., Radia, A., & Spaltro, M. (2014). The
Impact of Capital Requirements on Bank Lending. SSRN Electronic Journal, (486).
https://doi.org/10.2139/ssrn.2388773
Brinkmann, E. J., & Horvitz, P. M. (1995). Risk-Based Capital Standards and the Credit
Crunch. Journal of Money, Credit and Banking, 27(3), 848.
https://doi.org/10.2307/2077755
Brooks, C. (2008). Introductory Econometrics for Finance (2nd ed.). Cambridge, Cambridge
University Press.
Bryant, J. (1980). A model of reserves, bank runs, and deposit insurance. Journal of Banking
and Finance, 4(4), 335–344. https://doi.org/10.1016/0378-4266(80)90012-6
Cai, J., & Thakor, A. V. (2011). Liquidity Risk, Credit Risk and Interbank Competition.
SSRN Electronic Journal. https://doi.org/10.2139/ssrn.1307879
Calem, P, Rob, R. (1999). The impact of capital-based regulation on bank risk-taking.

216
Journal of Financial Intermediation, 8, 317–352. Retrieved from
https://www.sciencedirect.com/science/article/pii/S1042957399902760
Cao, J., Liang, H., & Zhan, X. (2011). Peer effects of corporate social responsibility.
Management Science.
Caporale, G. M., Lodh, S., & Nandy, M. (2017). The performance of banks in the MENA
region during the global financial crisis. Research in International Business and Finance, 42, 583-590.
Casu, B., & Girardone, C. (2009). Testing the relationship between competition and
efficiency in banking: A panel data analysis. Economics Letters, 105(1), 134–137.
https://doi.org/10.1016/j.econlet.2009.06.018
Casu, B., & Girardone, C. (2011). Does Competition Lead to Efficiency? The Case of EU
Commercial Banks. SSRN Electronic Journal, 44(0), 1–31.
https://doi.org/10.2139/ssrn.1200362
Cebenoyan, A. S., & Strahan, P. E. (2004). Risk management, capital structure and lending at
banks. Journal of Banking and Finance, 28(1), 19–43. https://doi.org/10.1016/S0378-
4266(02)00391-6
Cecchetti, S. G., & Li, L. (2008). Do capital adequacy requirements matter for monetary
policy? Economic Inquiry, 46(4), 643–659. https://doi.org/10.1111/j.1465-
7295.2007.00085.x
Central bank of jordan. Stability Annual Report. Retrieved from http://www.cbj.gov.jo/
Chen, Y. K., Shen, C. H., Kao, L., & Yeh, C. Y. (2018). Bank Liquidity Risk and
Performance. Review of Pacific Basin Financial Markets and Policies, 21(1).
https://doi.org/10.1142/S0219091518500078
Cifuentes, R., Ferrucci, G., & Shin, H. S. (2011). Liquidity Risk and Contagion. SSRN
Electronic Journal. https://doi.org/10.2139/ssrn.824166
Chirwa, E. W. (2003). Determinants of commercial banks’ profitability in Malawi: A
cointegration approach. Applied Financial Economics, 13(8), 565–571.
https://doi.org/10.1080/0960310022000020933
Choi, G. (2000). The Macroeconomic Implications of Regulatory Capital Adequacy
Requirements for Korean Banks 1. 29(1).
Christopher Graham, É. B. (2013). The Impact of Liquidity on Bank Profitability.
International Journal of Economics, Commerce and Management United Kingdom,
5(5), 2306–9007.
Clark, J. (1986). Single-equation, multiple-regression methodology: Is it an appropriate
methodology for the estimation of the structure-performance relationship in banking?
Journal of Monetary Economics, 18, pp. 295-312.
Coccorese, P. (2004). Banking competition and macroeconomic conditions: A disaggregate
analysis. Journal of International Financial Markets, Institutions and Money, 14(3),
203–219. https://doi.org/10.1016/j.intfin.2003.07.001
Cooper, K., Kolari, J., & Wagster, J. (1991). A note on the stock market effects of the
adoption of risk-based capital requirements on international banks in different countries.

217
Journal of Banking and Finance, 15(2), 367–381. https://doi.org/10.1016/0378-
4266(91)90073-U
Cornett, M. M., McNutt, J. J., Strahan, P. E., & Tehranian, H. (2011). Liquidity risk
management and credit supply in the financial crisis. Journal of Financial Economics,
101(2), 297–312. https://doi.org/10.1016/j.jfineco.2011.03.001
Cucinelli, D. (2013). The determinants of bank liquidity risk within the context of euro
area. Interdisciplinary Journal of Research in Business, 2(10), 51-64.
De Bandt, O. (2000). Competition, contestability and market structure in European banking
sectors on the eve of EMU 10.1016/S0378-4266(99)00117-X : Journal of Banking &
Finance | ScienceDirect.com. Journal of Banking and Finance, 24. Retrieved from
http://www.sciencedirect.com/science/article/pii/S037842669900117X%5Cnpapers3://p
ublication/uuid/0B0166F3-F927-4103-A88F-41A26F51D83D
De Young, R., and Jang, K.Y., 2016. “Do banks manage their liquidity?”, Journal of Banking
and Finance, Forthcoming.
De Haan, J., & Poghosyan, T. (2012). Bank size, market concentration, and bank earnings
volatility in the US. Journal of International Financial Markets, Institutions and Money,
22(1), 35–54. https://doi.org/10.1016/j.intfin.2011.07.002
DeYoung, R., & Rice, T. (2006). Erratum: Noninterest income and financial performance at
U.S. commercial banks. Financial Review, 41(3), 449–450.
https://doi.org/10.1111/j.1540-6288.2006.00152.x
Delis, M. D., & Kouretas, G. P. (2011). Interest rates and bank risk-taking. Journal of
Banking and Finance, 35(4), 840–855. https://doi.org/10.1016/j.jbankfin.2010.09.032
Demsetz, H., & Lehn, K. (1985). The structure of corporate ownership: Causes and
consequences. Journal of political economy, 93(6), 1155-1177.
Demsetz, R., & Strahan, P. (1997). Diversification , Size , and Risk at Bank Holding
Companies Author ( s ): Rebecca S . Demsetz and Philip E . Strahan Source : Journal of
Money , Credit and Banking , Vol . 29 , No . 3 ( Aug ., 1997 ), pp . 300-313 Published
by : Ohio State University Pres. Journal of Money, Credit, and Banking, 29(3), 300–313.
Demirgüç-Kunt, A., & Huizinga, H. (1999). Determinants of commercial bank interest
margins and profitability: Some international evidence. World Bank Economic Review,
13(2), 379–408. https://doi.org/10.1093/wber/13.2.379
Demirgüç-Kunt, A., & Levine, R. (2000). Bank concentration: cross-country evidence. World
Bank Global Policy, (October). Retrieved from http://www-
wds.worldbank.org/external/default/WDSContentServer/WDSP/IB/2004/02/10/0002655
13_20040210165243/Rendered/PDF/wdr27828.pdf
Demirguc-Kunt, A, & Peria, M. S. M. (2010). A Framework for Analyzing Competition in
the Banking Sector. Policy Research, (Working Paper No. 5499).
https://doi.org/10.1596/1813-9450-5499
Demirguc-Kunt, Asli, Laeven, L. A., & Levine, R. E. (2005). Regulations, Market Structure,
Institutions, and the Cost of Financial Intermediation. SSRN Electronic Journal.
https://doi.org/10.2139/ssrn.427200
Demsetz, R., & Strahan, P. (1997). Diversification , Size , and Risk at Bank Holding

218
Companies Author ( s ): Rebecca S . Demsetz and Philip E . Strahan Source : Journal of
Money , Credit and Banking , Vol . 29 , No . 3 ( Aug ., 1997 ), pp . 300-313 Published
by : Ohio State University Pres. Journal of Money, Credit, and Banking, 29(3), 300–313.
Diamond, D. W., & Dybvig, P. H. (1983). Bank runs, deposit insurance, and liquidity.
Journal of Political Economy, 91(3), 401–419. https://doi.org/10.1086/261155
Diamond, D. W., & Rajan, R. G. (2000). A theory of bank capital. Journal of Finance, 55(6),
2431–2465. https://doi.org/10.1111/0022-1082.00296
Dietrich, A., & Wanzenried, G. (2011). Determinants of bank profitability before and during
the crisis: Evidence from Switzerland. Journal of International Financial Markets,
Institutions and Money, 21(3), 307–327. https://doi.org/10.1016/j.intfin.2010.11.002
Distinguin, I., Roulet, C., & Tarazi, A. (2013). Bank regulatory capital and liquidity:
Evidence from US and European publicly traded banks. Journal of Banking and
Finance, 37(9), 3295–3317. https://doi.org/10.1016/j.jbankfin.2013.04.027
Douglas W . Caves, L. R. . C. and W. . E. D. (1982). The Economic Theory of Index
Numbers and the Measurement of Input , Output , and Productivity Author ( s ):
Published by : The Econometric Society Stable URL : https://www.jstor.org/stable/.
Econometrica, 50(6), 1393–1414.
Dowd, K., Hutchinson, M. O., & Ashby, S. G. (2011). Capital inadequacies: The dismal
failure of the Basel regime of bank capital regulation. Cato Institute Policy Analysis,
(681).
Duncan, D., & Langrin, B. (2002). Testing for competition in the Jamaican banking sector:
evidence from bank level data. Financial Stability Department, Bank of Jamaica.
Duncan, D., & Langrin, B. (2004). Testing for Competition in the Jamaican Banking Sector:
Evidence from Bank Level Data. Southwestern Journal of Economics, VI(1), 1–23.
Ediz, T., Michael, I., & Perraudin, W. (1998). The Impact of Capital Requirements on U.K.
Bank Behaviour. In SSRN. https://doi.org/10.2139/ssrn.1024836
European Economy. (2009). The Impact of the Global Crisis on Neighbouring Countries of
the EUCountries of the EU, Occasional Papers 48, Directorate-General for Economic
and Financial Affairs. Retrieved from
http://ec.europa.eu/economy_finance/publications
European Commission. (2010). Implementation of the European neighborhood policy in 2009
country report: Jordan. Commission Staff Working Document. Retrieved from
http://ec.europa.eu/world/enp/pdf/progress2010/sec10_525_en.pdf I
Eyssell, T., & Arshadi, N. (1990). The wealth effects of the risk-based capital requirement in
banking. The evidence from the capital market. Journal of Banking and Finance, 14(1),
179–197. https://doi.org/10.1016/0378-4266(90)90043-2
Fidrmuc, J., Fungáčová, Z., & Weill, L. (2015). Does Bank Liquidity Creation Contribute to
Economic Growth? Evidence from Russia. Open Economies Review, 26(3), 479–496.
https://doi.org/10.1007/s11079-015-9352-1
Flamini, V., Schumacher, M. L., & McDonald, M. C. A. (2009). The determinants of
commercial bank profitability in Sub-Saharan Africa (No. 9-15). International Monetary
Fund. Retrieved from

219
https://books.google.com.sa/books?hl=en&lr=&id=FAkcFrPE984C&oi=fnd&pg=PA3&
dq=Flamini,+Schumacher,+and+McDonald+(2009)&ots=S8Cs5m4M86&sig=BaqiFh_2
hCIdMyGDCRX14Nb4Bng&redir_esc=y#v=onepage&q=Flamini%2C
Schumacher%2C and McDonald (2009)&f=false
Francis, W. B., & Osborne, M. (2010). On the Behavior and Determinants of Risk-Based
Capital Ratios: Revisiting the Evidence from UK Banking Institutions. International
Review of Finance, 10(4), 485–518. https://doi.org/10.1111/j.1468-2443.2010.01112.x
Fraser, I., & Graham, M. (2005). Efficiency measurement of Australian dairy farms: national
and regional performance. Australasian agribusiness review, 13(1673-2016-136807).
Fu, Y., Lee, S. C., Xu, L., & Zurbruegg, R. (2015). The Effectiveness of Capital Regulation
on Bank Behavior in China. International Review of Finance, 15(3), 321–345.
https://doi.org/10.1111/irfi.12045
Fungáčová, Z., Solanko, L., & Weill, L. (2014). Does competition influence the bank lending
channel in the euro area? Journal of Banking and Finance, 49, 356–366.
https://doi.org/10.1016/j.jbankfin.2014.06.018
Fungáčová, Z., Weill, L., & Zhou, M. (2017). Bank Capital, Liquidity Creation and Deposit
Insurance. Journal of Financial Services Research, 51(1), 97–123.
https://doi.org/10.1007/s10693-016-0240-7
García-Herrero, A., Gavilá, S., & Santabárbara, D. (2009). What explains the low
profitability of Chinese banks? Journal of Banking and Finance, 33(11), 2080–2092.
https://doi.org/10.1016/j.jbankfin.2009.05.005
Gatev, E., Schuermann, T., & Strahan, P. E. (2009). Managing bank liquidity risk: How
deposit-loan synergies vary with market conditions. Review of Financial Studies, 22(3),
995–1020. https://doi.org/10.1093/rfs/hhm060
Gauthier, C., Lehar, A., & Souissi, M. (2012). Macroprudential capital requirements and
systemic risk. Journal of Financial Intermediation, 21(4), 594–618.
https://doi.org/10.1016/j.jfi.2012.01.005
Genay, H., & Podjasek, R. (2014). What is teh impact of law interest rate enviroment on bank
profitability. 324(July).
Gilbert, R. A. (1984). Bank Market Structure and Competition : A Survey Author ( s ): R .
Alton Gilbert Source : Journal of Money , Credit and Banking , Vol . 16 , No . 4 , Part
2 : Bank Market Studies Published by : Ohio State University Press Stable URL :
http://www.jstor.org. Journal of Money,Credit, and Banking, 16(4), 617–645.
Gjerde, Ø., & Semmen, K. (1995). Risk-based capital requirements and bank portfolio risk.
Journal of Banking and Finance, 19(7), 1159–1173. https://doi.org/10.1016/0378-
4266(94)00077-G
Goddard, J., Molyneux, P., & Wilson, J. O. S. (2004). The profitability of European banks: A
cross-sectional and dynamic panel analysis. Manchester School, 72(3), 363–381.
https://doi.org/10.1111/j.1467-9957.2004.00397.x
Goddard, J., & Wilson, J. O. S. (2009). Competition in banking: A disequilibrium approach.
Journal of Banking and Finance, 33(12), 2282–2292.
https://doi.org/10.1016/j.jbankfin.2009.06.003

220
Goddard, J., Liu, H., Molyneux, P., & Wilson, J. O. S. (2013). Do Bank Profits Converge?
European Financial Management, 19(2), 345–365. https://doi.org/10.1111/j.1468-
036X.2010.00578.x
Goderis, B., Marsh, I. W., Vall Castello, J., & Wagner, W. (2011). Bank Behaviour with
Access to Credit Risk Transfer Markets. In SSRN Electronic Journal.
https://doi.org/10.2139/ssrn.1010101
Godlewski, C. J. (2004). Capital Regulation and Credit Risk Taking: Empirical Evidence
from Banks in Emerging Market Economies. Ssrn, 33(August).
https://doi.org/10.2139/ssrn.588163
Goldstein, I., & Pauzner, A. (2005). Demand-deposit contracts and the probability of bank
runs. Journal of Finance, 60(3), 1293–1327. https://doi.org/10.1111/j.1540-
6261.2005.00762.x
González, F. (2005). Bank regulation and risk-taking incentives: An international comparison
of bank risk. Journal of Banking and Finance, 29(5), 1153–1184.
https://doi.org/10.1016/j.jbankfin.2004.05.029
Gorton, G. B., & Winton, A. (2005). Liquidity Provision, Bank Capital, and the
Macroeconomy. SSRN Electronic Journal. https://doi.org/10.2139/ssrn.253849
Greene, D. L. (2012). Rebound 2007: Analysis of US light-duty vehicle travel
statistics. Energy Policy, 41, 14-28.
Gromb, D., & Vayanos, D. (2010). A model of financial market liquidity based on
intermediary capital. Journal of the European Economic Association, 8(2–3), 456–466.
https://doi.org/10.1111/j.1542-4774.2010.tb00516.x
Guidara, A., Soumaré, I., & Tchana, F. T. (2013). Banks’ capital buffer, risk and performance
in the Canadian banking system: Impact of business cycles and regulatory
changes. Journal of Banking & Finance, 37(9), 3373-3387.
Guru, K.G., Staunton, J. and Shanmugam, B. (1999), “Determinants of Commercial Bank
Profitability in Malaysia”. 12th Australasian Finance and Banking Conference, Sydney,
Australia.
Guru B., J. Staunton and B. Balashanmugam (2002), “Determinants of Commercial Bank
Profitability in Malaysia,” University Multimedia Working Papers.
Gutiérrez de Rozas, L. (2011). Testing for Competition in the Spanish Banking Industry: The
Panzar-Rosse Approach Revisited. SSRN Electronic Journal.
https://doi.org/10.2139/ssrn.1005116
Hakenes, H., & Schnabel, I. (2011). Bank size and risk-taking under Basel II. Journal of Banking & Finance, 35(6), 1436-1449.
Hakim, S., & Neaime, S. (2001). Performance and credit risk in banking. (202). Retrieved
from http://www.erf.org.eg/CMS/uploads/pdf/0137.pdf
Hamiltona, R., Qasrawib, W., & Al-Jarrahc, D. M. (2010). Cost and profit efficiency in the
Jordanian banking sector 1993-2006: A parametric approach. International Research
Journal of Finance and Economics, 56(November 2010), 96–110.
Hancock, D., Laing, A. J., & Wilcox, J. A. (1995). Bank capital shocks: Dynamic effects on
221
securities, loans, and capital. Journal of Banking and Finance, 19(3–4), 661–677.
https://doi.org/10.1016/0378-4266(94)00147-U
Hankir, Y., Rauch, C., & Umber, M. P. (2011). Bank M&A: A market power story?. Journal of Banking & Finance, 35(9), 2341-2354.
Hanweck, G. A., & Ryu, L. H. (2011). The Sensitivity of Bank Net Interest Margins and
Profitability to Credit, Interest-Rate, and Term-Structure Shocks Across Bank Product
Specializations. SSRN Electronic Journal. https://doi.org/10.2139/ssrn.886727
Haq, M., & Heaney, R. (2012). Factors determining European bank risk. Journal of
International Financial Markets, Institutions and Money, 22(4), 696–718.
https://doi.org/10.1016/j.intfin.2012.04.003
He, Z., & Xiong, W. (2012). Rollover Risk and Credit Risk. Journal of Finance, 67(2), 391–
430. https://doi.org/10.1111/j.1540-6261.2012.01721.x
Heffernan, S. A., & Fu, M. (2011). How Do Banks Perform in China? SSRN Electronic
Journal, 1–29. https://doi.org/10.2139/ssrn.1337452
Hellmann, T. F., Murdock, K. C., & Stiglitz, J. E. (2000). Liberalization, moral hazard in
banking, and prudential regulation: Are capital requirements enough? American
Economic Review, 90(1), 147–165. https://doi.org/10.1257/aer.90.1.147
Hempell, H. S. (2005). Testing for Competition Among German Banks. SSRN Electronic
Journal, (January). https://doi.org/10.2139/ssrn.304343
Hogan, T. L. (2015). Capital and risk in commercial banking: A comparison of capital and
risk-based capital ratios. Quarterly Review of Economics and Finance, 57, 32–45.
https://doi.org/10.1016/j.qref.2014.11.003
Hong, H., Huang, J. Z., & Wu, D. (2014). The information content of Basel III liquidity risk
measures. Journal of Financial Stability, 15, 91–111.
https://doi.org/10.1016/j.jfs.2014.09.003
Houston, J. F., Lin, C., Lin, P., & Ma, Y. (2010). Creditor rights, information sharing, and
bank risk taking. Journal of Financial Economics, 96(3), 485–512.
https://doi.org/10.1016/j.jfineco.2010.02.008
Hughes, J. P., Lang, W., Mester, L. J., & Moon, C. G. (1995). Recovering technologies that
account for generalized managerial preferences: An application to non-risk-neutral
banks (No. 95-16). Wharton School Center for Financial Institutions, University of
Pennsylvania.
Hussain, M. E., & Hassan, M. K. (2005). Basel capital requirements and bank credit risk
taking In developing countries. In Department of Economics and Finance Working
Papers 1991-2006. Retrieved from
http://scholarworks.uno.edu/econ_wphttp://scholarworks.uno.edu/econ_wp/34
Hussain, H. A., & Al‐Ajmi, J. (2012). Risk management practices of conventional and
Islamic banks in Bahrain. The Journal of Risk Finance.
Imbierowicz, B., & Rauch, C. (2014). The relationship between liquidity risk and credit risk
in banks. Journal of Banking and Finance, 40(1), 242–256.
https://doi.org/10.1016/j.jbankfin.2013.11.030

222
Islam, M. S., & Nishiyama, S. I. (2016). The determinants of bank net interest margins: A
panel evidence from South Asian countries. Research in International Business and Finance, 37, 501-514.
Ivashina, V., & Scharfstein, D. (2010). Bank lending during the financial crisis of 2008.
Journal of Financial Economics, 97(3), 319–338.
https://doi.org/10.1016/j.jfineco.2009.12.001
Iwatsubo, K. (2007). Bank capital shocks and portfolio risk: Evidence from Japan. Japan and
the World Economy, 19(2), 166–186. https://doi.org/10.1016/j.japwor.2005.09.001
Jacques, K., & Nigro, P. (1997a). Risk-based capital, portfolio risk, and bank capital: A
simultaneous equations approach. Journal of Economics and Business, 49(6), 533–547.
https://doi.org/10.1016/s0148-6195(97)00038-6
Jeitschko, T. D., & Jeung, S. D. (2005). Incentives for risk-taking in banking - A unified
approach. Journal of Banking and Finance, 29(3), 759–777.
https://doi.org/10.1016/S0378-4266(04)00057-3
Jenkinson, N. (2009). Containing system-wide liquidity risks: some issues and
challenges. European Business Organization Law Review (EBOR), 10(3), 387-409.
Jensen, M. (1986). American Economic Association Agency Costs of Free Cash Flow ,
Corporate Finance , and Takeovers Author ( s ): Michael C . Jensen Source : The
American Economic Review , Vol . 76 , No . 2 , Papers and Proceedings of the Ninety-
Eighth Annual Meeting of the. American Economic Review, 76(2), 323–329.
Jiang, G., N. Tang, E. Law and A. Sze (2003), “Determinants of Bank Profitability in Hong
Kong,” Hong Kong Monetary Authority Research Memorandum, September.
Jokipii, T., & Milne, A. (2008). The cyclical behaviour of European bank capital buffers.
Journal of Banking and Finance, 32(8), 1440–1451.
https://doi.org/10.1016/j.jbankfin.2007.12.001
Karim, R. Al, & Alam, T. (2013). An Evaluation of Financial Performance of Private
Commercial Banks in Bangladesh: Ratio Analysis. Journal of Business Studies
Quarterly, 5(2), 65–77.
Kashyap, A. K., & Stein, J. C. (2000). What do a million observations on banks say about the
transmission of monetary policy? American Economic Review, 90(3), 407–428.
https://doi.org/10.1257/aer.90.3.407
Kashyap, A. K., Rajan, R., & Stein, J. C. (2002). Banks as liquidity providers: An
explanation for the coexistence of lending and deposit-taking. Journal of Finance, 57(1),
33–73. https://doi.org/10.1111/1540-6261.00415
Keeley, M. C. . (1990). American Economic Association Deposit Insurance , Risk , and
Market Power in Banking Author ( s ): Michael C . Keeley Source : The American
Economic Review , Vol . 80 , No . 5 ( Dec ., 1990 ), pp . 1183-1200 Published by :
American Economic Association St. 80(5), 1183–1200.
Keeley, M. C., & Furlong, F. T. (1990). A reexamination of mean-variance analysis of bank
capital regulation. Journal of Banking and Finance, 14(1), 69–84.
https://doi.org/10.1016/0378-4266(90)90036-2
Khan, M. S., Scheule, H., & Wu, E. (2017). Funding liquidity and bank risk taking. Journal
223
of Banking and Finance, 82, 203–216. https://doi.org/10.1016/j.jbankfin.2016.09.005
Khrawish, H. A., & Al-Sa’di, N. M. (2011). The Impact of E-Banking on Bank Profitability:
Evidence from Jordan. Middle Eastern Finance and Economics, 0(13), 142–158.
Kim, D., & Santomero, A. M. (1988). Risk in Banking and Capital. The Journal of Finance,
XLIII(5), 1219–1233.
Klepczarek, E. (2015). Determinants Of European Banks' Capital Adequacy/Determinanty
Adekwatności Kapitałowej Banków Europejskich. Comparative Economic
Research, 18(4), 81-98.
Koehn, M., & Santomero, A. M. (1980). American Finance Association Regulation of Bank
Capital and Portfolio Risk Author ( s ): Michael Koehn and Anthony M . Santomero
Source : The Journal of Finance , Vol . 35 , No . 5 ( Dec ., 1980 ), pp . 1235-1244
Published by : Wiley for the American Fina. The Journal of Finance, 35(5), 1235–1244.
Kochubey, T., & Kowalczyk, D. (2014). The Relationship between Capital , Liquidity and
Risk in Commercial Banks. Croatian National Bank.
Konishi, M., & Yasuda, Y. (2004). Factors affecting bank risk taking: Evidence from Japan.
Journal of Banking and Finance, 28(1), 215–232. https://doi.org/10.1016/S0378-
4266(02)00405-3
Kosmidou, K., Tanna, S., & Pasiouras, F. (2005, September). Determinants of profitability of
domestic UK commercial banks: panel evidence from the period 1995-2002. In Money
Macro and Finance (MMF) Research Group Conference (Vol. 45, pp. 1-27).
Kosmidou, K., & Zopounidis, C. (2008). Measurement of Bank Performance in Greece.
South-Eastern Europe Journal of Economics, 6(1), 79–95.
Kudinska. M., & Konovalova. N., (2012). The Analysis of Bank Capital Adequacy: the Case
of Latvia, Journal of Business Management, No. 6.
Kwan, S., Eisenbeis, R. A., Kw, S., & Eisenbeis, R. A. (1997). Bank Risk, Capitalization, and
Operating Efficiency. Journal of Financial Services Research.
https://doi.org/10.1023/A:1007970618648
Laeven, L., & Levine, R. (2009). Bank governance, regulation and risk taking. Journal of
Financial Economics, 93(2), 259–275. https://doi.org/10.1016/j.jfineco.2008.09.003
Lang, G., & Welzel, P. (1996). Efficiency and technical progress in banking: Empirical
results for a panel of German cooperative banks. Journal of Banking and Finance, 20(6),
1003–1023. https://doi.org/10.1016/0378-4266(95)00040-2
Le, T. H. (2014). Market Concentration and Competition in Vietnamese Banking Sector.
SSRN Electronic Journal, (57406). https://doi.org/10.2139/ssrn.2514713
Lee, C. C., & Hsieh, M. F. (2013). The impact of bank capital on profitability and risk in
Asian banking. Journal of International Money and Finance, 32(1), 251–281.
https://doi.org/10.1016/j.jimonfin.2012.04.013
Lei, A. C. H., & Song, Z. (2013). Liquidity creation and bank capital structure in China.
Global Finance Journal, 24(3), 188–202. https://doi.org/10.1016/j.gfj.2013.10.004
Maddala, G. S., & Lahiri, K. (2006). Introduction to econometrics (Vol. 67).

224
Maghyereh, A., & Sciences, A. (2008). Journal of Transnational Management Development
The Effect of Financial Liberalization on the Efficiency of Financial Institutions : The
Case of Jordanian Commercial Banks The Effect of Financial Liberalization on the
Efficiency of Financial Institutions . 6061(September 2013), 37–41.
https://doi.org/10.1300/J130v09n02
Malmquist, S. (1953). Index numbers and indifference surfaces. Trabajos de estadística, 4(2), 209-242.
Mamatzakis, E., & Remoundos, P. (2003). Determinants of Greek commercial banks, 1989-
2000. Spoudai, 53(1), 84–94.
Marques-ibanez, D., Altunbas, Y., Leuvensteijn, M. Van, & Marques-ibanez, D. (2014). Wo r
k i n g Pa p e r S e r i e S NO 1678 / M ay 2014 COMPETITION and bank risk the effect
of securitization and BANK CAPITAL NOTE : This Working Paper should not be
reported as representing. (1678).
Matejašák, M., Teplý, P., & Černohorský, J. (2009). The impact of regulation of banks in the
us and the EU-15 countries. E a M: Ekonomie a Management, 12(3), 58–68.
Matthews, K., Murinde, V., & Zhao, T. (2007). Competitive conditions among the major
British banks. Journal of Banking and Finance, 31(7), 2025–2042.
https://doi.org/10.1016/j.jbankfin.2006.11.009
Maudos, J. (1998). Market structure and performance in Spanish banking using a direct
measure of efficiency. Applied Financial Economics, 8(2), 191–200.
https://doi.org/10.1080/096031098333177
Mayer, C. (1992). “Capital requirements and the behaviour of banks”. by Jean-Charles
Rochet. European Economic Review, 36(5), 1171–1174. https://doi.org/10.1016/0014-
2921(92)90052-X
Mercieca, S., Schaeck, K., & Wolfe, S. (2007). Small European banks: Benefits from
diversification? Journal of Banking and Finance, 31(7), 1975–1998.
https://doi.org/10.1016/j.jbankfin.2007.01.004
Miller, S. M., & Noulas, A. G. (1997). Portfolio mix and large-bank profitability in the USA.
Applied Economics, 29(4), 505–512. https://doi.org/10.1080/000368497326994
Mlambo, K., & Ncube, M. (2011). Competition and Efficiency in the Banking Sector in
South Africa. African Development Review, 23(1), 4–15. https://doi.org/10.1111/j.1467-
8268.2010.00268.x
Modigliani, F., & Miller, M. H. (1963). Corporate income taxes and the cost of capital: a
correction. The American economic review, 433-443.
Molyneux, P., & Thornton, J. (1992). Determinants of European bank profitability: A note.
Journal of Banking and Finance, 16(6), 1173–1178. https://doi.org/10.1016/0378-
4266(92)90065-8
Molyneux, P., Thornton, J., & Michael Lloyd-Williams, D. (1996). Competition and market
contestability in Japanese commercial banking. Journal of Economics and Business,
48(1), 33–45. https://doi.org/10.1016/0148-6195(95)00047-x
Morck, R., Shleifer, A., & Vishny, R. W. (1986). Management ownership and corporate performance: An empirical analysis (No. w2055). National Bureau of Economic Research.

225
Muriithi, J. G., Waweru, K. M., & Muturi, W. M. (2016). Effect of credit risk on financial
performance of commercial banks Kenya.
Naceur, Sb. (2003). The Determinants of the Tunisian Banking Industry Profitability: Panel
Evidence. Universite Libre de Tunis Working Papers, 1–17. Retrieved from
http://www.mafhoum.com/press6/174E11.pdf
Naceur, S. B., & Kandil, M. (2008, March). Basel accord and lending behavior: Evidence
from MENA region. In Economic Research Forum.
Naceur, Sami Ben, & Omran, M. (2011). The effects of bank regulations, competition, and
financial reforms on banks’ performance. Emerging Markets Review, 12(1), 1–20.
https://doi.org/10.1016/j.ememar.2010.08.002
Nathan, A., & Neave, E. H. (1989). Competition and contestability in Canada's financial
system: Empirical results. Canadian Journal of economics, 576-594.
Nathan, A., & Neave, E. H. (2016). Competition and Contestability in Canada ’ s Financial
System : Empirical Results Author ( s ): Alli Nathan and Edwin H . Neave Source : The
Canadian Journal of Economics / Revue canadienne d ’ Economique , Vol . 22 , No .
Published by : Wiley on behalf o. 22(3), 576–594.
Naushad, M., & Malik, S. A. (2015). Corporate governance and bank performance: A study
of selected banks in GCC region. Asian Social Science, 11(9), 226–234.
https://doi.org/10.5539/ass.v11n9p226
Nyaundi, D. N. (2015). The effects of capital adequacy requirements on liquidity of
commercial banks in Kenya (Doctoral dissertation, Master’s thesis, University of
Nairobi).
Olalere, O. E., Bin Omar, W. A., & Kamil, S. (2017). Bank Specific and Macroeconomic
Determinants of Commercial Bank Profitability: Empirical Evidence from Nigeria.
International Journal of Finance & Banking Studies (2147-4486), 6(1), 25.
https://doi.org/10.20525/ijfbs.v6i1.627
Olagunju, A., David, A. O., & Samuel, O. O. (2012). Liquidity management and commercial
banks' profitability in Nigeria. Research Journal of Finance and Accounting, 2(7-8), 24-
38
Olson, D., & Zoubi, T. A. (2008). Using accounting ratios to distinguish between Islamic and
conventional banks in the GCC region. The International Journal of Accounting, 43(1), 45-65.
Owusu-Antwi, G., Mensah, Lord, Crabbe, M., & Antwi, J. (2014). Determinants of Bank
Performance in Ghana, the Economic Value Added (EVA) Approach. International
Journal of Economics and Finance, 7(1). https://doi.org/10.5539/ijef.v7n1p203
Panzar, J. C., & Rosse, J. N. (1982). Structure, conduct, and comparative statistics. Bell Telephone Laboratories.
Panzar, J. C., & Rosse, J. N. (1987). Testing for" monopoly" equilibrium. The Journal of
Industrial Economics, 443–456.
Pasiouras, F., & Kosmidou, K. (2007). Factors influencing the profitability of domestic and
foreign commercial banks in the European Union. Research in International Business
and Finance, 21(2), 222–237. https://doi.org/10.1016/j.ribaf.2006.03.007

226
Paul, S., & Kourouche, K. (2008). Regulatory policy and the efficiency of the banking sector
in Australia. Australian Economic Review, 41(3), 260–271.
https://doi.org/10.1111/j.1467-8462.2008.00504.x
Peek, J., & Rosengren, E. (1995). Bank regulation and the credit crunch. Journal of Banking
and Finance, 19(3–4), 679–692. https://doi.org/10.1016/0378-4266(94)00148-V
Perera, S., Skully, M., & Chaudrey, Z. (2013). Determinants of Commercial Bank
Profitability: South Asian Evidence. Asian Journal of Finance & Accounting, 5(1), 365–
380. https://doi.org/10.5296/ajfa.v5i1.3012
Prasad, A., & Ghosh, S. (2007). Competition in Indian banking: An empirical evaluation.
South Asia Economic Journal, 8(2), 265–284.
https://doi.org/10.1177/139156140700800205
RAHMAN, M. M., ZHENG, C., & ASHRAF, B. N. (2015). Bank Size, Risk-taking and
Capital Regulation in Bangladesh. Eurasian Journal of Business and Economics, 8(15),
95–114. https://doi.org/10.17015/ejbe.2015.015.05
Ramayandi, A., Rawat, U., & Tang, H. C. (2014). ADB Working Paper Series on Regional
Economic Integration Can Low Interest Rates be Harmful : An Assessment. (123).
Rengasamy, D. (2014). Impact of loan deposit ratio (LDR) on profitability : Panel evidence
from commercial banks in Malaysia. Proceedings of the Third International Conference
on Global Business, Economics, Finance and Social Sciences (GB14Mumbai
Conference) Mumbai, India, 978-1–9415(19-21 December), : MF498.
Repullo, R. (2004). Capital requirements, market power, and risk-taking in banking. Journal
of Financial Intermediation, 13(2), 156–182. https://doi.org/10.1016/j.jfi.2003.08.005
Repullo, R., 2005, Liquidity, risk-taking and the lender of last resort, Centre for Eco- nomic
Policy Research Discussion Paper, No. 4967 .
Rime, B. (2001). Capital requirements and bank behaviour: Empirical evidence for
Switzerland. Journal of Banking and Finance, 25(4), 789–805.
https://doi.org/10.1016/S0378-4266(00)00105-9
Roman, A., & Sargu, A. C. (2015). The Impact of Bank-specific Factors on the Commercial
Banks Liquidity: Empirical Evidence from CEE Countries. Procedia Economics and
Finance, 20(15), 571–579. https://doi.org/10.1016/s2212-5671(15)00110-0
Rosse, J. N., & Panzar, J. C. (1977). Chamberlin vs. Robinson: an empirical test for monopoly rents. Bell Laboratories.
Said, R. M. (2014). Net Stable Funding Ratio and Commercial Banks
Profitability. International Proceedings of Economics Development and Research, 76, 34.
Salas, V., & Saurina, J. (2003). Deregulation, market power and risk behaviour in Spanish
banks. European Economic Review, 47(6), 1061–1075. https://doi.org/10.1016/S0014-
2921(02)00230-1
Samhan, H. M., & Al-Khitab, A. Y. (2015). Determinants of Financial Performance of Jordan
Islamic Bank. Research Journal of Finance and Accounting, 6(8), 37–48.
Santos, J. A. C. (1999). Bank capital and equity investment regulations. Journal of Banking
and Finance, 23(7), 1095–1120. https://doi.org/10.1016/S0378-4266(98)00132-0

227
Sapienza, P. (2002). The effects of banking mergers on loan contracts. The Journal of finance, 57(1), 329-367.
Schmieder, P., & Schmieder, M. C. (2011). The Impact of Legislationon Credit Risk:
Comparative Evidence From the United States, the United Kingdom and Germany (No.
11-55). International Monetary Fund.
Sealey, C. W., & Lindley, J. T. (1977). INPUTS, OUTPUTS, AND A THEORY OF
PRODUCTION AND COST AT DEPOSITORY FINANCIAL INSTITUTIONS. The
Journal of Finance, 32(4), 1251–1266. https://doi.org/10.1111/j.1540-
6261.1977.tb03324.x
Semih Yildirim, H., & Philippatos, G. C. (2007). Competition and contestability in Central
and Eastern European banking markets. Managerial Finance, 33(3), 195–209.
https://doi.org/10.1108/03074350710718275
Shaffer, S. (1983). Non-structural measures of competition. Toward a synthesis of
alternatives. Economics Letters, 12(3–4), 349–353. https://doi.org/10.1016/0165-
1765(83)90061-7
Shen, Y., Shen, M., Xu, Z., & Bai, Y. (2009). Bank size and small-and medium-sized
enterprise (SME) lending: Evidence from China. World development, 37(4), 800-811.
Shim, J. (2013). Bank capital buffer and portfolio risk: The influence of business cycle and
revenue diversification. Journal of Banking and Finance, 37(3), 761–772.
https://doi.org/10.1016/j.jbankfin.2012.10.002
Short, B. K. (1979). THE RELATION BETWEEN COMMERCIAL BANK PROFIT RATES A
N D BANKING CONCENTRATION IN CANADA , WESTERN EUROPE , AND JAPAN
There have been at least ten published studies of the effect of con- centration on bank
profit rates in various banking markets within the. 3, 209–219.
Shrieves, R. E., & Dahl, D. (1992). The relationship between risk and capital in commercial
banks. Journal of Banking and Finance, 16(2), 439–457. https://doi.org/10.1016/0378-
4266(92)90024-T
Simatele, M. (2015). Market Structure and Competition in the South African Banking Sector.
Procedia Economics and Finance, 30(15), 825–835. https://doi.org/10.1016/s2212-
5671(15)01332-5
Simpasa, A. M. (2013). Increased foreign bank presence, privatisation and competition in the
Zambian banking sector. Managerial Finance, 39(8), 787–808.
https://doi.org/10.1108/MF-May-2010-0076
Sinha, Pankaj and Sharma, Sakshi 2014. Determinants of bank profits and its persistence in
Indian Banks: A study in a dynamic panel data frameworkMPRA Paper No. 61379,.
Smirlock, M. (1985). Evidence on the ( Non ) Relationship between Concentration and
Profitability in Banking Author ( s ): Michael Smirlock Source : J5 ), pp . 69-83
Published by : Ohio State University Pres. Journal of Money , Credit and Banking,
17(1), 69–83.
Staikouras, C. K., & Wood, G. E. (2004). The determinants of European bank
profitability. International Business & Economics Research Journal (IBER), 3(6).
Staikouras, C. K., & Wood, G. E. (2011). The Determinants Of European Bank Profitability.

228
International Business & Economics Research Journal (IBER), 3(6), 57–68.
https://doi.org/10.19030/iber.v3i6.3699
Stiroh, K. J. (2004). Do Community Banks Bene ® t from Diversi ® cation ? Journal of
Financial Services Research, (2001), 135–160.
Stolz, S., Heid, F., & Porath, D. (2004). Does Capital Regulation Matter for Bank Behavior?
Evidence for German Savings Banks. Ssrn, (03). https://doi.org/10.2139/ssrn.493723
Stolz, S., & Wedow, M. (2011). Banks’ regulatory capital buffer and the business cycle:
Evidence for Germany. Journal of Financial Stability, 7(2), 98–110.
https://doi.org/10.1016/j.jfs.2009.09.001
Sufian, F., & Habibullah, M. S. (2009). Determinants of bank profitability in a developing
economy: Empirical evidence from Bangladesh. Journal of Business Economics and
Management, 10(3), 207–217. https://doi.org/10.3846/1611-1699.2009.10.207-217
Suzuki, Y. (2015). The Dynamics of Concentration and Competition in the Banking Sector of
Bangladesh: An Empirical Investigation [Dagger]. South Asian Journal of Management,
22(1), 114.
Tafri, F. H., Hamid, Z., Kameel, A., Meera, M., Omar, M. A., & Banks, A. C. (2009). The
Impact of Financial Risks on Profitability of Malaysian Commercial Banks : 1996-2005.
3(6), 1996–2005.
Tan, Y., & Floros, C. (2012). Bank profitability and inflation: The case of China. Journal of
Economic Studies, 39(6), 675–696. https://doi.org/10.1108/01443581211274610
Tan, Y., & Floros, C. (2013). Risk, capital and efficiency in Chinese banking. Journal of
International Financial Markets, Institutions and Money, 26(1), 378–393.
https://doi.org/10.1016/j.intfin.2013.07.009
Tan, Y. (2016). The impacts of risk and competition on bank profitability in China. Journal
of International Financial Markets, Institutions and Money, 40, 85–110.
https://doi.org/10.1016/j.intfin.2015.09.003
Teixeira, J. C. A., Silva, F. J. F., Fernandes, A. V., & Alves, A. C. G. (2014). Banks’ capital,
regulation and the financial crisis. North American Journal of Economics and Finance,
28, 33–58. https://doi.org/10.1016/j.najef.2014.01.002
Thakor, A. V. (1996). Capital requirements, monetary policy, and aggregate bank lending:
theory and empirical evidence. The Journal of Finance, 51(1), 279-324.
Toby, A. J. (2008). Monetary Policy, Capital Adequacy Regulation and Banking System
Soundness in Nigeria : Empirical Research Findings. Journal of Financial Management
and Analysis, 21(1), 32–46.
Trujillo-Ponce, A. (2013). What determines the profitability of banks? Evidence from Spain.
Accounting and Finance, 53(2), 561–586. https://doi.org/10.1111/j.1467-
629X.2011.00466.x
Uhde, A., & Heimeshoff, U. (2009). Consolidation in banking and financial stability in
Europe: Empirical evidence. Journal of Banking and Finance, 33(7), 1299–1311.
https://doi.org/10.1016/j.jbankfin.2009.01.006
Umoru, D., & Osemwegie, J. O. (2016). Capital Adequacy and Financial Performance of

229
Banks in Nigeria: Empirical Evidence Based on the Fgls Estimator. European Scientific
Journal, ESJ, 12(25), 295. https://doi.org/10.19044/esj.2016.v12n25p295
Van Roy, P. (2005). The Impact of the 1988 Basel Accord on Banks’ Capital Ratios and
Credit Risk-Taking: An International Study. Ssrn, 1–45.
https://doi.org/10.2139/ssrn.497264
Vardar, G. (2015). Bank Competition, Concentration and Risk-Taking in the Turkish
Banking Industry. Pressacademia, 4(3), 536–536.
https://doi.org/10.17261/pressacademia.2015313139
Varesi, L. (2015). Measuring Banking Efficiency during Crisis Period Using Data
Envelopment Analysis: Western Balkan Countries Case. Academic Journal of
Interdisciplinary Studies, 4(1), 261–274. https://doi.org/10.5901/mjss.2015.v4n1p261
Vazquez, F., & Federico, P. (2015). Bank funding structures and risk: Evidence from the
global financial crisis. Journal of Banking and Finance, 61, 1–14.
https://doi.org/10.1016/j.jbankfin.2015.08.023
von Thadden, E. L. (2004). Asymmetric information, bank lending and implicit contracts:
The winner’s curse. Finance Research Letters, 1(1), 11–23.
https://doi.org/10.1016/S1544-6123(03)00006-0
Wagner, W. (2007). The liquidity of bank assets and banking stability. Journal of Banking
and Finance, 31(1), 121–139. https://doi.org/10.1016/j.jbankfin.2005.07.019
William, B. E. (2002). Interest rate risk and Bank Net Interest Margins. BIS Quarterly
Review, (December), 67–82.
Williams, J. (2004). Determining management behaviour in European banking. Journal of
Banking and Finance, 28(10), 2427–2460.
https://doi.org/10.1016/j.jbankfin.2003.09.010
Wilner, B. S. (2000). The exploitation of relationships in financial distress: The case of trade
credit. The journal of finance, 55(1), 153-178.
Yan, M., Hall, M. J., & Turner, P. (2014). Estimating liquidity risk using the exposure‐based
cash‐flow‐at‐risk approach: An application to the UK banking sector. International
Journal of Finance & Economics, 19(3), 225-238.
Ye, N. (2013). Competition in Hong Kong ’ s banking industry Competition in Hong Kong ’ s
Banking Industry. 4(January).
Yehuda Kahane. (1977). CAPITAL ADEQUACY AND THE REGULATION OF
FINANCIAL INTERMEDIARIES. Journal of Banking and Finance, 1, 207–218.
Yildirim, C. (2010). Evolution of banking efficiency within an unstable macroeconomic
environment : the case of Turkish commercial banks Evolution of banking e ciency
within an unstable macroeconomic environment : the case of Turkish commercial banks.
6846(March 2014), 37–41. https://doi.org/10.1080/0003684021014014
Yuan, Y. (2006). The state of competition of the Chinese banking industry. Journal of Asian
Economics, 17(3), 519–534. https://doi.org/10.1016/j.asieco.2006.05.001
Zarein, J., Kashi, F. K., & Mosavi, Y. (2015). Competition in Iran’s banking sector: Panzar-
Rosse approach. Iranian Economic Review, 19(1), 29–39.

230
https://doi.org/10.22059/ier.2015.55158
Zeitun, R., & Benjelloun, H. (2013). The Efficiency of Banks and the Financial Crisis in a
Developing Economy: The Case of Jordan. Journal of Finance, Accounting and
Management, 4(1), 1.
Zhang, Z. Y., Wu, J., & Liu, Q. F. (2008). Impacts of capital adequacy regulation on risk-
taking behaviors of banking. Xitong Gongcheng Lilun Yu Shijian/System Engineering
Theory and Practice, 28(8), 183–189. https://doi.org/10.1016/s1874-8651(09)60035-1
Appendixes
Appendix A: The Commercial Banks Name
Appendix 1: The Commercial Banks Name
Bank Name
ARAB BANK
THE HOUSING BANK FOR TRADE AND FINANCE
JORDAN KUWAIT BANK
JORDAN AHLI BANK
BANK OF JORDAN
CAIRO AMMAN BANK
ARAB BANKING CORPORATION /(JORDAN)
BANK AL ETIHAD
CAPITAL BANK OF JORDAN

231
JORDAN COMMERCIAL BANK
SOCIETE GENERALE DE BANQUE - JORDANIE
ARAB JORDAN INVESTMENT BANK
INVEST BANK
Appendix 2: The Firms Size and Sector.
Firm Name Sector Size (Total Assets) Firm Name Sector Size (Total Assets)
JORDAN CHEMICAL INDUSTRIES
Industrial 6556000 JORDAN TRADE FAC
services 38273000
JORDAN COM Industrial 1482983000
JORDAN VEGETABLE OIL Industrial 6282000
JORDAN DAIRY Industrial 11602000 JORDAN WOOD
INDUSTRIES / JWICO Industrial 13786000
JORDANIAN ELECTRIC
Industrial 898442000 JORDAN WORSTED MILLS
Services 76423000
JORDAN HOTELS Services 34924000
JORDAN INDUSTRIAL Industrial 19292000
JORDAN INTER TIO L Industrial 8915000 JORDAN PETROLEUM
REFINERY services 1270420000
JORDAN INVESTMENT
Services 32902000 JORDAN CEM
Industrial 174190000
JORDAN INTERNATIONAL SHIP
Industrial 35853000 JORDAN EXPRESS TOURIST TRANSPORT
services 21776000
JORDAN PIPES MANUFACTURING
Industrial 7370000 ITTIHAD SCHOOLS
services 25752000
JORDAN POULTRY PROCESSING & MARKETING
Industrial 62713000 INTERNATIONAL POULTRY PLC
Industrial 8571000
JORDAN PROJECTS FOR TOURISM DEVELOPMENT
services 120756000
NUTRI DAR
Industrial 13187000
JORDAN STEEL PLC Industrial 67812000 PHILADELPHIA
PHARMACEEUTICALS Industrial 10351000
JORDAN TELECOM services 573926000
SOUTH ELECTRONICS services 20495000
AL EQBAL INVEST Services 108235000 MASAFAT FOR SPECIALISED
TRANSPORT services 30343000
AL-RAKAEZ INVESTMENT CO.
services 13361000 MIDDLE EAST INSURANC
Services 78022000
ARAB EAST FOR INVEST
Services 73266000 INTERNATIONAL CHLORINE
Industrial 19043000
ARAB INTERNATIONAL
Industrial 75158000 INTERNATIONAL PORTFOLIO
Services 11701000
ARAB PHOENIX HOLDING
Industrial 92822000 INTERNATIONAL STEEL INDUSTREAL
Industrial 6251000
ASSAS FOR CONCRETE PRODUCTS CO. LTD
Industrial 15790000 OFFTECHOLDING GROUP PLC
services 54666000

232
ELZAY READY WEAR
Industrial 20021000 PHILADELPHIA INTERNATIONAL EDUCATIONAL INVESTMENT
services 33246000
HAYAT PHARMACEUTICAL INDUSTRIES CO.
Industrial 18236000 PREMIER BUSINESS AND PROJECTS CO.LTD
Industrial 6815000
INDUSTRIAL COMMERC
Industrial 25912000 REAL ESTATE DEVELOP
Services 60914000
INTERMED PETRO CHEM
Industrial 10802000 SAFWA ISLAMIC BAN
Services 779166000
IRBID DISTRICT ELECTRICITY
services 257004000 SPECIALIZED TRADING & INVESTMENT
services 1616000
JORDANIAN DUTY-FREE SHOPS
services 8400000 SPECIALIZED INV
Services 28225000
THE JORDANIAN PHARMACEUTICAL MANUFACTURING
Industrial 48283000
CONSULTANT AND INV
Services 15679000
AFAQ FOR ENERGY CO. P.L.C
services 302490000 JORDAN VEGETABLE OIL INDUSTRIES
Industrial 3499000
JORDAN PHOSPHATE MINES
Industrial 1167093000 JORDAN MARBLE COMPANY P.L.C.
Industrial 8238000
COMPREHENSIVE LEASING COMPANY PLC
services 32395000 JORDAN PAPER & CARDBOARD FACTORIES
Industrial 13611000
UNITED CABLE INDUSTRIES
Industrial 52068000 JORDAN PRESS FOUNDATION/AL-RA'I
services 11170000
AL BIL Industrial 44184000 JORDAN SULPHO-
CHEMICALS Industrial 11058000
AL QUDS READY MIX Industrial 10005000
COMPREHENSIVE Services 47706000
ARAB ELECTRICAL INDUSTRIES
Industrial 8786000 MODEL RESTAURANTS CO
Services 18203000
INTERNATIONAL CABLE
Industrial 34153000 ALAHLIA FOR PROJECT
Industrial 91009000
ARAB INTER TIO L Industrial 118644000
INTERNATIONAL CERAMIC Industrial 8947000
READY MIX CONCRTE AND CONSTRUCTION SUPPLIES
Industrial 56386000
RUM ALADDIN INDUSTRIES
Industrial 13250000
JORDAN COM Industrial 1482983000 TRUST INTERNATIONAL
TRANSPORT services 544000
RUM GROUP Services 21730000
UNION ADVANCED INDUS Services 14170000
JORDAN CERAMIC INDUSTRIES
Industrial 1948000 UNITED ARAB
Industrial 355151000
TRANSPORT& INVESTMENT BARTER COMPANY
services 20068000 SALAM INTERNATIONL TRANSPORT & TRADING
services 50752000
UNION TOBACCO & CIGARETTE INDUSTRIES
Industrial 74570000 SPECIALIZED JORDANIAN INVESTMENT
services 4106000

233
UNION INVESTMENT
Services 150518000 AKARY FOR INDUSTRIES AND REAL ESTATE INVESTMENTS
Industrial 726000
UNION LAND DEVELOP
Industrial 65395000 AL DAWLIYAH FOR HOTE
Services 61989000
ZARA INVESTEMENT HOLDING
services 220599000 AL TAJAMOUAT FOR
Industrial 9073000
AD DULAYL INDUSTRIAL
Industrial 43491000 RUM GROUP FOR TRANSPORTATION & TOURISM INVESTMENT
services 21730000
AL ISRA FOR EDUCATIO
Services 45797000 UNIVERSAL MODERN INDUSTRIES
Industrial 11146000
AL FARIS TIO L IN Industrial 30118000
ALJANOUB FILTERS Industrial 3825000
AL TAJAMOUAT Industrial 150128000
AMA AGRIC Industrial 6226000
ALIA- THE ROYAL JORDANIAN AIRLINES PLC.
services 433066000 COMPREHENSIVE MULTIPLE PROJECT COMPANY
Industrial 12018000
ARAB FOR INVESTMENT
Services 9521000 INVESTMENTS AND
Services 30103000
ARAB EAST FOR REAL
Services 39961000 MIDDLE EAST SPECIALIZED CABLES COMPANY /MESC_JORDAN PLC
Industrial 29482000
BINDAR TRADING & INVESTMENT CO. P.L.C
services 39433000 ARAB CENTER FOR PHARM.& CHEMICALS
Industrial 7324000
COMPREHENSIVE LAND
Services 10851000 FIRST INTERNATIONAL
Industrial 10088000
DAR AL DAWA DEVELOPMENT & INVESTMENT
Industrial 90523000
INVESTMENT HOUSE
Services 7071000
EMMAR INVESTMENTS
Services 22824000 AL-QARIA FOOD & VEGETABLE OIL INDUSTRIES CO. P.L.C
Industrial 13695000
INTERNATIONAL ARABIA
Industrial 7253000 DARWISH KHALILI
Industrial 52780000
INTERNATIONAL BROKER
Services 22798000 MIDDLE EAST PHARMA. & CHMICAL IND. & MEDICAL APPLIANCES
Industrial 19062000
INTERNATIONAL CO
Industrial 22798000 MIDDLE EAST COMPLEX FOR ENG., ELECTRONICS & HEAVY
Industrial 423031000