Magnetic resonance diagnostics: a new technology for high-throughput clinical diagnostics
Upload
independentCategory
view
3download
0
Novel scanner characterization method for color measurement and diagnostics applications
Bong-Sun Lee*a, Raja Balab, Gaurav Sharmac
aThomson Corporate Research, Indianapolis, IN 46290; bXerox Imaging and Services Technology Center, Webster, NY 14580;
cUniversity of Rochester, Rochester, NY 14627
ABSTRACT
We propose a novel scanner characterization approach for applications requiring color measurement of hardcopy output in printer calibration, characterization, and diagnostic applications. It is assumed that a typical printed medium comprises the three basic colorants C, M, Y. The proposed method is particularly advantageous when additional colorants are used in the print (e.g. black (K)). A family of scanner characterization targets is constructed, each varying in C, M, Y and at a fixed level of K. A corresponding family of 3-D scanner characterizations is derived, one for each level of K. Each characterization maps scanner RGB to a colorimetric representation such as CIELAB, using standard characterization techniques. These are then combined into a single 4-D characterization mapping RGBK to CIELAB. A refinement of the technique improves performance significantly by using a function of the scanned values for K (e.g. the scanner’s green channel response to printed K) instead of the digital K value directly. This makes this new approach more robust with respect to variations in printed K over time. Secondly it enables, with a single scanner characterization, accurate color measurement of prints from different printers within the same family. Results show that the 4-D characterization technique can significantly outperform standard 3-D approaches especially in cases where the image being scanned is a patch target made up of unconstrained CMYK combinations. Thus the algorithm finds particular use in printer characterization and diagnostic applications. The method readily generalizes to printed media containing other (e.g “hi-fi”) colorants, and also to other image capture devices such as digital cameras. Keywords: scanner, characterization, calibration, measurement
1. INTRODUCTION Since color scanners are commonly available in many imaging environments, it would be greatly beneficial if these could be used as color measurement devices for characterizing hardcopy output devices. Furthermore, because of the high spatial resolution available with most scanners today, they can also be very effective in diagnosing problems with hardcopy devices if they can be accurately characterized to physically measurable color. Examples of applications include scanner-based printer calibration and characterization and printer diagnostics. However, with standard color management, typical scanners provide only mediocre colorimetric accuracy limiting their use in these applications. Reasons for this are described below. Standard approaches for scanner color management create a characterization profile by scanning a printed target containing color patches. The target is simultaneously measured with a color measurement device to obtain spectral reflectance or colorimetric measurements such as CIELAB. Scanner characterization is the process of relating the scanned (usually RGB) signals to the spectral or colorimetric representation. Fig. 1 shows a standard scanner characterization. This process must generally be repeated for each input medium (i.e. combination of substrate, colorants, and image path elements). Thus for example different scanner color characterization profiles are required for use with a photograph and a xerographically produced print. The primary reason for this is that color scanners are not colorimetric5-8, so that the relationship between the response of the scanner and that of the human eye depends heavily on the spectral properties of the medium being scanned.
* [email protected]; phone 1 317-587-3977; fax 1 317 587-6898
Computational Imaging IV, edited by Charles A. Bouman, Eric L. Miller, Ilya Pollak, Proc. of SPIE-IS&T Electronic Imaging, SPIE Vol. 6065, 606512, © 2006 SPIE-IS&T · 0277-786X/06/$15
SPIE-IS&T/ Vol. 6065 606512-1
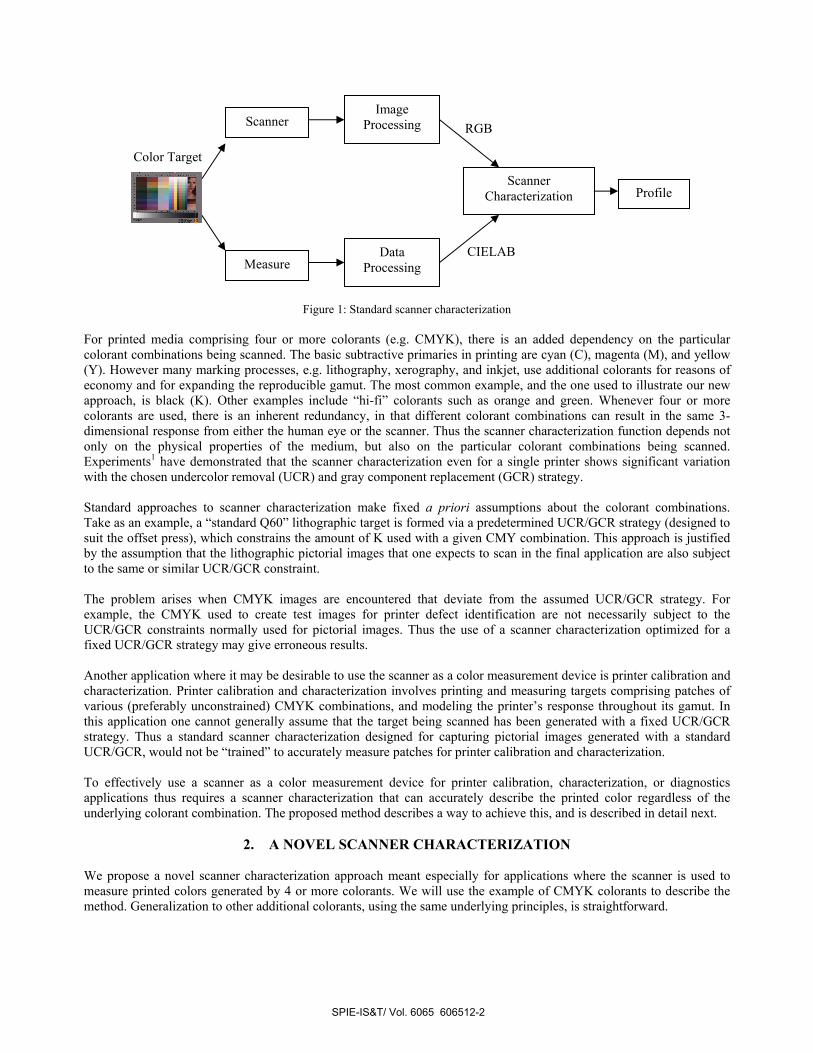
Figure 1: Standard scanner characterization For printed media comprising four or more colorants (e.g. CMYK), there is an added dependency on the particular colorant combinations being scanned. The basic subtractive primaries in printing are cyan (C), magenta (M), and yellow (Y). However many marking processes, e.g. lithography, xerography, and inkjet, use additional colorants for reasons of economy and for expanding the reproducible gamut. The most common example, and the one used to illustrate our new approach, is black (K). Other examples include “hi-fi” colorants such as orange and green. Whenever four or more colorants are used, there is an inherent redundancy, in that different colorant combinations can result in the same 3-dimensional response from either the human eye or the scanner. Thus the scanner characterization function depends not only on the physical properties of the medium, but also on the particular colorant combinations being scanned. Experiments1 have demonstrated that the scanner characterization even for a single printer shows significant variation with the chosen undercolor removal (UCR) and gray component replacement (GCR) strategy. Standard approaches to scanner characterization make fixed a priori assumptions about the colorant combinations. Take as an example, a “standard Q60” lithographic target is formed via a predetermined UCR/GCR strategy (designed to suit the offset press), which constrains the amount of K used with a given CMY combination. This approach is justified by the assumption that the lithographic pictorial images that one expects to scan in the final application are also subject to the same or similar UCR/GCR constraint. The problem arises when CMYK images are encountered that deviate from the assumed UCR/GCR strategy. For example, the CMYK used to create test images for printer defect identification are not necessarily subject to the UCR/GCR constraints normally used for pictorial images. Thus the use of a scanner characterization optimized for a fixed UCR/GCR strategy may give erroneous results. Another application where it may be desirable to use the scanner as a color measurement device is printer calibration and characterization. Printer calibration and characterization involves printing and measuring targets comprising patches of various (preferably unconstrained) CMYK combinations, and modeling the printer’s response throughout its gamut. In this application one cannot generally assume that the target being scanned has been generated with a fixed UCR/GCR strategy. Thus a standard scanner characterization designed for capturing pictorial images generated with a standard UCR/GCR, would not be “trained” to accurately measure patches for printer calibration and characterization. To effectively use a scanner as a color measurement device for printer calibration, characterization, or diagnostics applications thus requires a scanner characterization that can accurately describe the printed color regardless of the underlying colorant combination. The proposed method describes a way to achieve this, and is described in detail next.
2. A NOVEL SCANNER CHARACTERIZATION We propose a novel scanner characterization approach meant especially for applications where the scanner is used to measure printed colors generated by 4 or more colorants. We will use the example of CMYK colorants to describe the method. Generalization to other additional colorants, using the same underlying principles, is straightforward.
Scanner Image Processing
Scanner Characterization Profile
Measure Data Processing
Color Target
RGB
CIELAB
SPIE-IS&T/ Vol. 6065 606512-2

2.1 Derivation of the scanner characterization transform A standard scanner characterization is a mapping from scanner RGB to device-independent color coordinates such as CIELAB. Since the spectral reflectance of a CMYK print depends on four independent parameters, it is logical to expect that the scanner characterization is also a function of four (rather than three) variables. In this approach, we capture this dependence explicitly by introducing a 4th input dimension in addition to the usual dimensions of scanner R, G, B. The additional dimension is related to the amount of K present in the print. It is helpful to think of the 4-dimensional scanner characterization transform as a family of 3-D scanner characterizations,, each derived for a fixed digital level of K using standard methods. This is accomplished by printing, for each level of K, a target comprising a 3-D grid varying in C, M, and Y. The patches are measured in CIELAB as well as scanned in RGB. For each fixed level of K, any of the standard techniques such as neural network or polynomial regression2 can be used to derive a scanner characterization transform that maps scan RGB to CIELAB with high accuracy. In order to afford efficient processing of image data through the characterization transform, the latter is usually implemented as a 3-D lookup table (LUT) mapping scan RGB to CIELAB. The result is therefore a family of 3-D LUTs each corresponding to a fixed level of K, as shown in Fig. 2. The K levels can be selected to optimize the overall characterization accuracy.
Increasing K
LAB stored at nodes
B
G
R
B
G
R
B
G
R
k=k1
k=k2
k=kn
Figure 2: Family of 3-D scanner characterization LUTs mapping scan RGB to CIELAB for different levels of K In a second step, the family of 3-D LUTs are combined into a single 4-D LUT mapping KRGB to CIELAB. This allows determination of the scanner characterization transform for arbitrary levels of K in the image via interpolation among the pre-characterized K levels. Thus far the 4th dimension in the scanner characterization is the digital K value used to generate the printed color. One limitation with this approach is that one has to separately keep track of the digital K values both for the scanner characterization step, as well as for the final prints being scanned. A second more important limitation is that the scanner response depends on the actual printed K, rather than the digital value of K; and the relationship between digital K and actual printed K can vary from device to device and over time. This variation can thus potentially reduce the accuracy of the scanner characterization. To overcome these limitations, it is preferable to use an estimate of the actual printed K rather than the digital K value as the 4th dimension in the scanner characterization. To this end, the new approach uses the scanner’s green response to pure K prints as the 4th dimension in the scanner characterization LUT. The green channel is used since it is a rough approximation of luminance, and exhibits good dynamic range in response to printed K. We will denote this 4th dimension as Gk.
SPIE-IS&T/ Vol. 6065 606512-3
+ t
d gII K
t
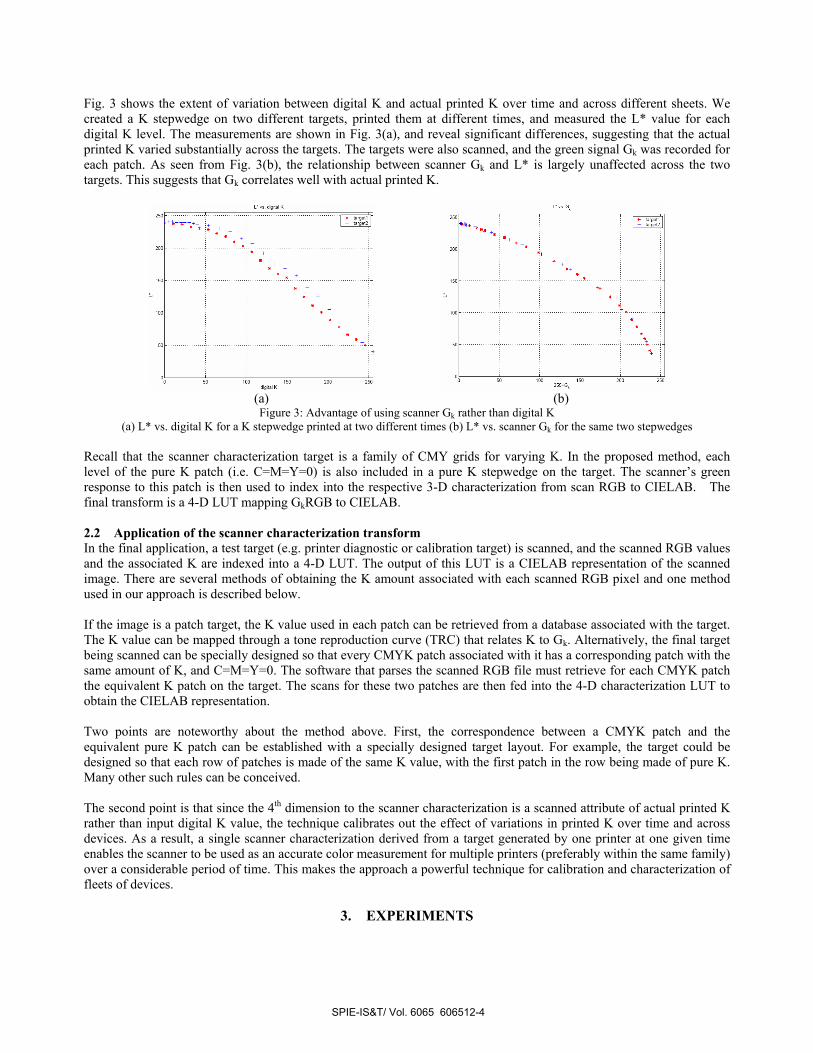
Fig. 3 shows the extent of variation between digital K and actual printed K over time and across different sheets. We created a K stepwedge on two different targets, printed them at different times, and measured the L* value for each digital K level. The measurements are shown in Fig. 3(a), and reveal significant differences, suggesting that the actual printed K varied substantially across the targets. The targets were also scanned, and the green signal Gk was recorded for each patch. As seen from Fig. 3(b), the relationship between scanner Gk and L* is largely unaffected across the two targets. This suggests that Gk correlates well with actual printed K.
(a) (b)
Figure 3: Advantage of using scanner Gk rather than digital K (a) L* vs. digital K for a K stepwedge printed at two different times (b) L* vs. scanner Gk for the same two stepwedges
Recall that the scanner characterization target is a family of CMY grids for varying K. In the proposed method, each level of the pure K patch (i.e. C=M=Y=0) is also included in a pure K stepwedge on the target. The scanner’s green response to this patch is then used to index into the respective 3-D characterization from scan RGB to CIELAB. The final transform is a 4-D LUT mapping GkRGB to CIELAB. 2.2 Application of the scanner characterization transform In the final application, a test target (e.g. printer diagnostic or calibration target) is scanned, and the scanned RGB values and the associated K are indexed into a 4-D LUT. The output of this LUT is a CIELAB representation of the scanned image. There are several methods of obtaining the K amount associated with each scanned RGB pixel and one method used in our approach is described below. If the image is a patch target, the K value used in each patch can be retrieved from a database associated with the target. The K value can be mapped through a tone reproduction curve (TRC) that relates K to Gk. Alternatively, the final target being scanned can be specially designed so that every CMYK patch associated with it has a corresponding patch with the same amount of K, and C=M=Y=0. The software that parses the scanned RGB file must retrieve for each CMYK patch the equivalent K patch on the target. The scans for these two patches are then fed into the 4-D characterization LUT to obtain the CIELAB representation. Two points are noteworthy about the method above. First, the correspondence between a CMYK patch and the equivalent pure K patch can be established with a specially designed target layout. For example, the target could be designed so that each row of patches is made of the same K value, with the first patch in the row being made of pure K. Many other such rules can be conceived. The second point is that since the 4th dimension to the scanner characterization is a scanned attribute of actual printed K rather than input digital K value, the technique calibrates out the effect of variations in printed K over time and across devices. As a result, a single scanner characterization derived from a target generated by one printer at one given time enables the scanner to be used as an accurate color measurement for multiple printers (preferably within the same family) over a considerable period of time. This makes the approach a powerful technique for calibration and characterization of fleets of devices.
3. EXPERIMENTS
SPIE-IS&T/ Vol. 6065 606512-4

A laser printer (Xerox Galaxy DocuColor 12) and two desktop scanners (Umax and Epson) were used for the experiments. CIE colorimetric values required for experiments were measured using a spectrophotometer (Gretag spectrolino). As discussed before, the requirement of using 4th dimension should be considered in designing a target for 4-D scanner characterization. This is described next. 3.1 Scanner target for 4-D characterization In the 4-D characterization target, K,C,M,Y wedges are included to generate a TRC for each colorant. Especially, K wedge gives the information for the transformation from K to Gk. The rest of the target consists of six blocks of patches consisting of a CMY grid at different levels of K. They are in increasing order of K – i.e. K1=0, K6=255. Those six levels of K are included in K wedge to be later used for deriving six 3-D LUTs. The number of different levels of K required were experimentally determined. An initial test with 5 K levels produced large characterization errors especially for pure K patches. This is depicted in Fig. 4(a). The plot shows the characterization (prediction) errors for a step wedge of 25 pure K levels ranging from 0-255 (to account for possible spatial non-uniformity in the printer, two step wedges were used – one in increasing order of K, viz. light to dark, and the other in decreasing order, i.e. dark to light.). Note that in Fig. 4(a) the errors are low when the values of K coincides with one of the five chosen levels for the black K1, …, K5, and high for intermediate levels of K. As shown in Fig. 4(b), adding 5 more levels of K at the intermediate values that gave the large errors reduced the errors significantly. Since all 10 levels cannot be used due to space limitation on the page, we chose the six best combinations of K levels that yielded a minimal ∆E. As a result, we obtained a great improvement as shown in Fig. 4(c). These optimal 6 K levels were used in the 4-D target. The digital values for those six levels are [0, 43, 96, 117, 160, 255].
(a) (b) (c)
Figure 4: ∆E for two pure K wedges in the 4-D target; (a) 5 K levels (b) 10 K levels (c) Optimal 6 K levels As K level increases, the patches obviously get darker, therefore becoming more susceptible to noise in the scanning process. To mitigate this effect, the size of the darker patches is increased, and a larger averaging window is used within the scanned image. Also, patches in the last block at K=K6 are all duplicated. This enabled two spectrophotometric measurements per color, thus further reducing noise. The layout of the target comprises blocks of C×M×Y grids at each level of K, and is graphically illustrated in Fig. 5. The spatial arrangement is such that similar colors are adjacent to each other. This arrangement is intended to minimize the integrating cavity effect (ICE)3,9 frequently encountered in desktop scanners. A border is included in the 4-D target at the edges of each block. It consists of patches having the same color as the adjacent patches on the target. This is also to reduce the effect of ICE which is most pronounced when patches are adjacent to a white background. The indexing notation is such that C1 is the least amount of cyan, C5 is the largest amount of cyan, etc. The levels along each colorant axis, Ci, Mj, Yl can be chosen in a number of ways. In our experiments they were chosen to be approximately visually uniform by processing evenly-spaced digital values through calibration curves derived for the printer at a previous time. 3.2 Derivation of scanner characterization We compared the new 4-D technique with a standard 3-D approach, described next. 3.2.1 3-D characterization A standard IT8.7/2 target comprising 288 patches was printed on a DocuColor 12 printer. This target was measured using the Gretag Spectrolino to obtain CIELAB values. D50 was chosen for a measurement illuminant and all color
SPIE-IS&T/ Vol. 6065 606512-5

calculations were based on media-relative colorimetry (i.e. paper white was set to L*:100, a*:0, b*:0). The target was scanned on the Umax scanner with settings of 300dpi resolution, and γ=1.0. All automatic adjustments in the scanner software were turned off. The same target was also scanned on the Epson scanner at 300 dpi and γ=1.6 (chosen to avoid clipping artifacts). The scanned image was mapped through the inverse gamma to produce an image with γ=1.0. To minimize the effects of scanner non-uniformity, we scanned the same target with two different orientations and used the average scan for the characterization.
Figure 5: Layout of the 4-D target
For each patch in the IT8 target, the average of a window of pixels within each patch was computed. The window size was 70% of the patch size in each dimension (this produced acceptable noise performance). Using the scan RGB and corresponding CIELAB measurements of the IT8 target, a 3-D lookup table (LUT) mapping RGB to CIELAB was derived. For the LUT derivation, we chose a neural network approach using a procedure similar to that described in reference 2. The size of the LUT was 16×16×16. 3.2.2 4-D characterization The 4-D scanner target described in Sec. 3.1 was generated and printed on the DocuColor 12 printer. The target was measured and scanned with the same procedure as with the 3-D case. The next step is to construct a TRC to map digital K to Gk, the scanner’s response to pure K. Fig.6 shows plots of Gk vs. K for the Umax and Epson scanners. Next we must derive the 4-D LUT. We first derived six 3-D LUTs for each of the six blocks B1, …, B6 as shown in Fig. 7. These six LUTs were from scan RGB to CIELAB, each LUT corresponding to a different constant value of K. The scanner’s green response Gk to each of the six pure K patches was extracted from the K wedge in the target to obtain the fourth scanner dimension. These six 3-D LUTs were then combined into a single 4-D LUT which would map scanned GkRGB to CIELAB. The LUT size was 6×16×16×16. Note that six LUTs were concatenated in reverse order so that the LUT for the highest K level positioned first in the 4-D LUT and the LUT for the least K level located last in the 4-D LUT. The 4th dimension Gk was also ordered correspondingly. This was done to optimize the tetrahedral interpolation.
C1 C2 C3 C4 C5 C5 C4 C3 C2 C1
M1 M2 M3 M4 M5 M5 M4 M3 M2 M1
Y1 Y2
K1 K2
SPIE-IS&T/ Vol. 6065 606512-6

*,S
Tfl-KSb4l
200
150 -
100 -
50 100 150 200 250
(a) (b)
Figure 6: Mapping of K to Gk for each scanner; (a) Umax (b) Epson
Figure 7: Procedure for deriving 4-D LUT
3.3 Evaluation of scanner characterization techniques We used an independent CMYK test target (called ‘CMYK336’) to evaluate the performance of each scanner characterization approach. This target consisted of 336 CMYK patches distributed throughout the printer’s gamut. The target was measured, as well as scanned with the same settings described above. The scanned RGB data was processed through the respective scanner characterization transforms to produce CIELAB values. These were then compared with the true measurements using ∆E*76 and ∆E*94 metrics. Fig. 8 depicts the entire test procedure for each characterization method. For the 4-D approach, the Gk function was derived as a spline fit from a stepwedge of pure K patches. 3.4 Application to printer calibration and characterization Each of the scanner characterization techniques effectively turns the scanner onto a colorimetric measurement device. This “device” can now be used to calibrate and characterize a printer. We can therefore test the efficacy of each scanner characterization technique by evaluating the quality of the resulting printer correction, as follows.
Recall from the previous procedure that we have a 336 patch target with known CMYK values and corresponding LAB values obtained from one of the aforementioned scanner characterization techniques. From this we can derive a forward printer transform from CMYK to LAB,2 which in turn can be used to generate the inverse printer transform from LAB to CMYK. Since it is this inverse transform that is used in the actual color management step, we are interested in its accuracy. To this end we generate a CIELAB target comprising 240 CIELAB colors within the printer’s gamut. This target is processed through the inverse transform, printed and measured. The ∆E between the original target CIELAB
RGB to LAB (16x16x16)
RGB to LAB (16x16x16)
RGB to LAB (16x16x16)
RGB to LAB (16x16x16)
RGB to LAB (16x16x16)
RGB to LAB (16x16x16)
B1
B2
B3
B4
B5
B6
B1
B2
B3
B4
B5
B6 Gk6
Gk5
Gk4
Gk3
Gk2
Gk1
+
4-D LUT GkRGB
to CIELAB
(6x16x16x16)
SPIE-IS&T/ Vol. 6065 606512-7

+U..—
and the measured CIELAB indicates the accuracy of the printer characterization. Fig. 9 shows the block diagram of this application procedure. This process is repeated for each scanner characterization technique. In addition, as a baseline, we perform a similar procedure but replacing the scanner characterization step with true measurements of the 336 patch target. We expect this approach to give us an upper bound on accuracy, since it replaces the scanner with spectrophotometric measurements.
4. RESULTS In this section, we first describe scanner characterization results with the ‘CMYK336’ target (described in Sec 3.3). Next, we explain the ‘end-to-end’ performance on printer characterization. Finally, tests with different media and halftones are presented. 4.1 Scanner characterization accuracy on CMYK336 target Fig. 10 shows the results. The first two charts at the top present errors for the entire data set of 336 patches. The errors produced by the standard technique (3-D approach) are unacceptable for many applications (including printer characterization and diagnostics). The proposed technique (4-D) offers a great improvement over the standard 3-D technique, as the fourth dimension (K) is explicitly captured. Note that a fraction of these patches lies along the “upper” surfaces of the gamut for which UCR/GCR has no effect, and K=0. For these patches, we expect all three techniques to perform comparably. Given this fact, one can deduce that the improvement produced by the proposed technique is even greater in those regions where UCR/GCR has a strong effect. To validate this, the two histograms in the middle of Fig. 10 present results for a subset of 25 patches containing K only (C=M=Y=0). We notice a dramatic improvement with the proposed method. The bottom two figures present analogous results for a subset of 12 patches with C=M=Y, K=0. Once again, the proposed approach is noticeably more accurate than the standard method. The results in the middle and bottom also demonstrate the value of the 4-D characterization method in performing printer gray-balance calibration and K linearization using a scanner as a measurement device.
Figure 8: Test procedure for each characterization method
C M Y K
CMYK336
Gk K
Scan
Build TRC
TRC K to Gk
Gk RGB
4-D LUT
Color difference
LABestimate
∆E4D
Measure Scan
3-D LUT
Color difference
LABestimate
∆E3D
RGB
LABmeasured
(K stepwedge)
SPIE-IS&T/ Vol. 6065 606512-8

_!!!!!
Figure 9: Application of scanner characterization to printer calibration / characterization When examining the results in Fig. 10, it is important to keep in mind the other sources of color errors in the system. LUT interpolation errors can typically produce average ∆E*76 ≈ 1. Another important source of error is page-to-page variation in the printing process. In our experience, this can give rise to average ∆E*76 values between 1.0 and 2.5. In light of these underlying system errors, we see in Fig. 10 that the 4-D approach achieves excellent accuracy. We note finally that similar trends were observed when computing the ∆E*94 metric instead of ∆E*76.
Entire 336 data set (Umax)
0.00
2.004.00
6.00
8.0010.00
12.00
14.00
16.0018.00
20.00
4-D 3-D
delta
E Avg.95th %
Entire 336 data set (Epson)
0.00
2.00
4.006.00
8.00
10.00
12.00
14.0016.00
18.00
20.00
4-D 3-D
delta
E Avg.95th %
Pure K (C=M=Y=0) subset (Umax)
0.00
2.00
4.006.00
8.00
10.00
12.00
14.0016.00
18.00
20.00
4-D 3-D
delta
E Avg.95th %
Pure K (C=M=Y=0) subset (Epson)
0.00
2.00
4.00
6.00
8.00
10.0012.00
14.00
16.00
18.00
20.00
4-D 3-D
delta
E Avg.95th %
CMYK
LABestimate measure
Printer model
Scan + scanner characterization Inverse LUT derivation (LABtoCMYK)
LAB test target LUT from
LAB to CMYK
Print & measure
∆E
CMYK336
aim LAB
measured LAB
SPIE-IS&T/ Vol. 6065 606512-9

C=M=Y (K=0) subset (Umax)
0.00
2.00
4.00
6.00
8.00
10.0012.00
14.00
16.00
18.00
20.00
4-D 3-D
delta
E Avg.95th %
C=M=Y (K=0) subset (Epson)
0.00
2.00
4.00
6.00
8.00
10.00
12.00
14.00
16.00
18.00
20.00
4-D 3-D
delta
E Avg.95th %
Figure 10: Performance comparison of different approaches
4.2 Consistency across different scanners We performed a test to evaluate each scanner characterization method in terms of consistency achieved across different scanners. This provides a measure of robustness with respect to variations in the capture device. Again, the CMYK336 target was used for the test. Fig. 11 shows the results. In general, the 4-D approach produces more consistent estimate of CIELAB when different scanners are used.
Entire 336 data set (Umax vs. Epson)
0.00
2.00
4.00
6.00
8.00
10.00
12.00
4-D 3-D
delta
E Avg.95th %
Pure K (C=M=Y=0) subset (Umax vs. Epson)
0.00
2.00
4.00
6.00
8.00
10.00
12.00
4-D 3-D
delta
E Avg.95th %
C=M=Y (K=0) subset (Umax vs. Epson)
0.00
2.00
4.00
6.00
8.00
10.00
12.00
4-D 3-D
delta
E Avg.95th %
Figure 11: Consistency test of each characterization method over two different scanners
4.3 Application to printer characterization (End-to-end test) Fig. 12 compares the performance of 3-D vs. 4-D scanner characterization in the “end to end” printer characterization experiment. The 4-D technique produces a printer model whose accuracy is equivalent to that achieved by colorimetric measurement, and significantly improved over the 3-D method, especially for the Umax scanner.
6x6x6 CMY grid (Umax)
0.00
2.00
4.00
6.00
8.00
10.00
12.00
Measure 4-D 3-D
delta
E Avg.
95th %
6x6x6 CMY grid (Epson)
0.00
2.00
4.00
6.00
8.00
10.00
12.00
Measure 4-D 3-D
delta
E Avg.
95th %
Figure 12: End-to-End test for different characterization methods
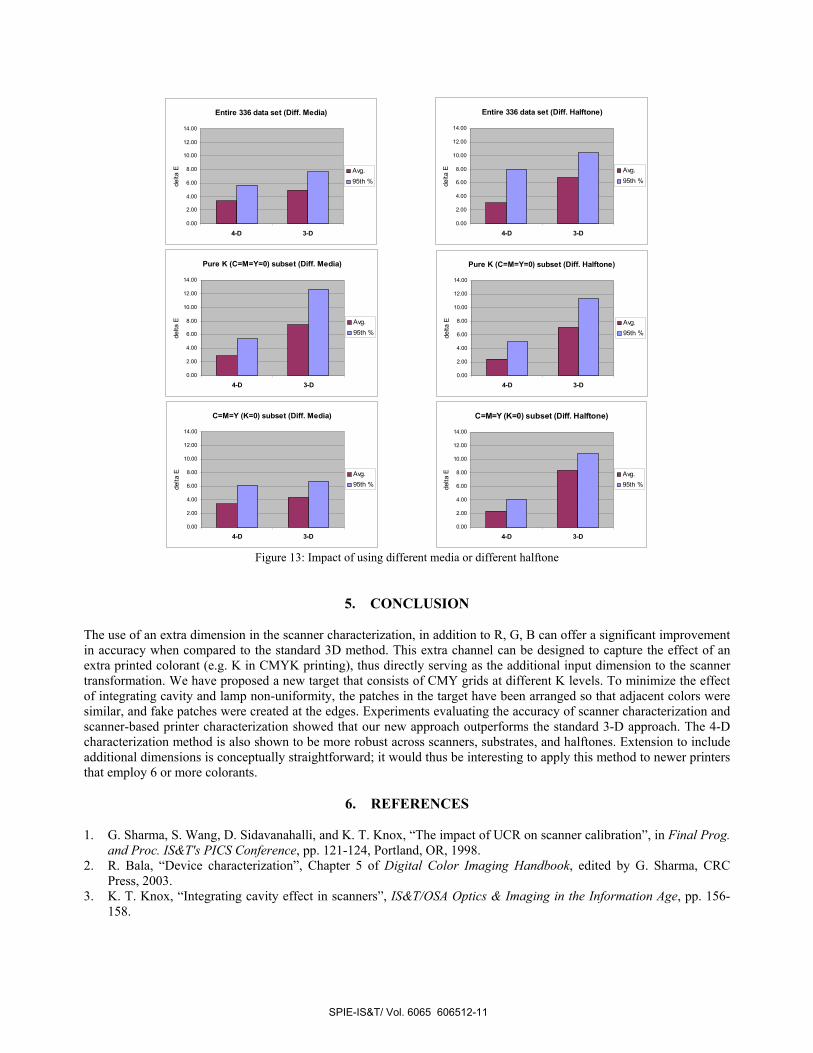
4.4 Tests with different media and different halftone In general, a scanner characterization produces the most accurate colorimetric data when the substrate and colorants used in the final application are the same as those used to derive the characterization. The same is true of the halftoning scheme used to create the prints. In this section, we report on the impact of varying the substrate and halftone on the accuracy of 3D vs. 4D scanner characterization. Fig. 13 shows the results. We observe that, in both cases, the 4-D approach outperforms 3-D. It is also interesting to see that for all characterization methods, the test across different media produced smaller errors than the test across different halftones.
SPIE-IS&T/ Vol. 6065 606512-10
Entire 336 data set (Diff. Media)
0.00
2.00
4.00
6.00
8.00
10.00
12.00
14.00
4-D 3-D
delta
E Avg.95th %
Entire 336 data set (Diff. Halftone)
0.00
2.00
4.00
6.00
8.00
10.00
12.00
14.00
4-D 3-D
delta
E Avg.95th %
Pure K (C=M=Y=0) subset (Diff. Media)
0.00
2.00
4.00
6.00
8.00
10.00
12.00
14.00
4-D 3-D
delta
E Avg.95th %
Pure K (C=M=Y=0) subset (Diff. Halftone)
0.00
2.00
4.00
6.00
8.00
10.00
12.00
14.00
4-D 3-D
delta
E Avg.95th %
C=M=Y (K=0) subset (Diff. Media)
0.00
2.00
4.00
6.00
8.00
10.00
12.00
14.00
4-D 3-D
delta
E Avg.95th %
C=M=Y (K=0) subset (Diff. Halftone)
0.00
2.00
4.00
6.00
8.00
10.00
12.00
14.00
4-D 3-D
delta
E Avg.95th %
Figure 13: Impact of using different media or different halftone
5. CONCLUSION The use of an extra dimension in the scanner characterization, in addition to R, G, B can offer a significant improvement in accuracy when compared to the standard 3D method. This extra channel can be designed to capture the effect of an extra printed colorant (e.g. K in CMYK printing), thus directly serving as the additional input dimension to the scanner transformation. We have proposed a new target that consists of CMY grids at different K levels. To minimize the effect of integrating cavity and lamp non-uniformity, the patches in the target have been arranged so that adjacent colors were similar, and fake patches were created at the edges. Experiments evaluating the accuracy of scanner characterization and scanner-based printer characterization showed that our new approach outperforms the standard 3-D approach. The 4-D characterization method is also shown to be more robust across scanners, substrates, and halftones. Extension to include additional dimensions is conceptually straightforward; it would thus be interesting to apply this method to newer printers that employ 6 or more colorants.
6. REFERENCES 1. G. Sharma, S. Wang, D. Sidavanahalli, and K. T. Knox, “The impact of UCR on scanner calibration”, in Final Prog.
and Proc. IS&T's PICS Conference, pp. 121-124, Portland, OR, 1998. 2. R. Bala, “Device characterization”, Chapter 5 of Digital Color Imaging Handbook, edited by G. Sharma, CRC
Press, 2003. 3. K. T. Knox, “Integrating cavity effect in scanners”, IS&T/OSA Optics & Imaging in the Information Age, pp. 156-
158.
SPIE-IS&T/ Vol. 6065 606512-11
4. G. Sharma and S. Wang, “Spectrum recovery from colorimetric data for color reproductions,'' in Proc. SPIE, Color Imaging: Device-Independent Color, Color Hardcopy, and Applications VII, vol.4663, San Jose, CA, 2002.
5. P. G. Roetling, J. E. Stinehour, and M. S. Maltz, “Color characterization of a scanner”, in Proc. IS&T 7th Intl. Congress on Non-impact Printing, pp. 443-451, 1991.
6. R. E. Burger, “Device independent color scanning”, in Proc. SPIE, Device-independent color imaging and imaging systems integration , vol. 1909, 1993, pp. 70-74.
7. P. G. Engeldrum, “Color scanner design requirements”, in Proc. SPIE, Device-independent color imaging and imaging systems integration , vol. 1909, 1993, pp. 75-83.
8. H. Haneishi, T. Hirao, A. Shimazu, and Y. Miyake, “Colorimetric precision in scanner calibration using matrices”, in Proc. Third IS&T/SID Color Imaging Conference: Color Science, Systems and Applications, pp. 106-108, Nov 1995.
9. V. Ostromoukhov, R.D. Hersch, C. Peraire, P. Emmel, and I. Amidror, “Two approaches in scanner-printer calibration: colorimetric space-based vs. closed-loop”, in Proc. SPIE, Device Independent Color Imaging, vol. 2170, pp. 133-142, San Jose, CA, 1994.
SPIE-IS&T/ Vol. 6065 606512-12
Copyright © 2022 FDOKUMEN