Notice of 2022 Annual Meeting and Proxy Statement - Investor ...
212
Notice of 2022 Annual Meeting and Proxy Statement 2021 Annual Report to Stockholders May 17, 2022 | 10:00 a.m., Eastern Daylight Time Virtual Meeting Site: www.virtualshareholdermeeting.com/HSY2022
-
Upload
khangminh22 -
Category
Documents
-
view
0 -
download
0
Transcript of Notice of 2022 Annual Meeting and Proxy Statement - Investor ...
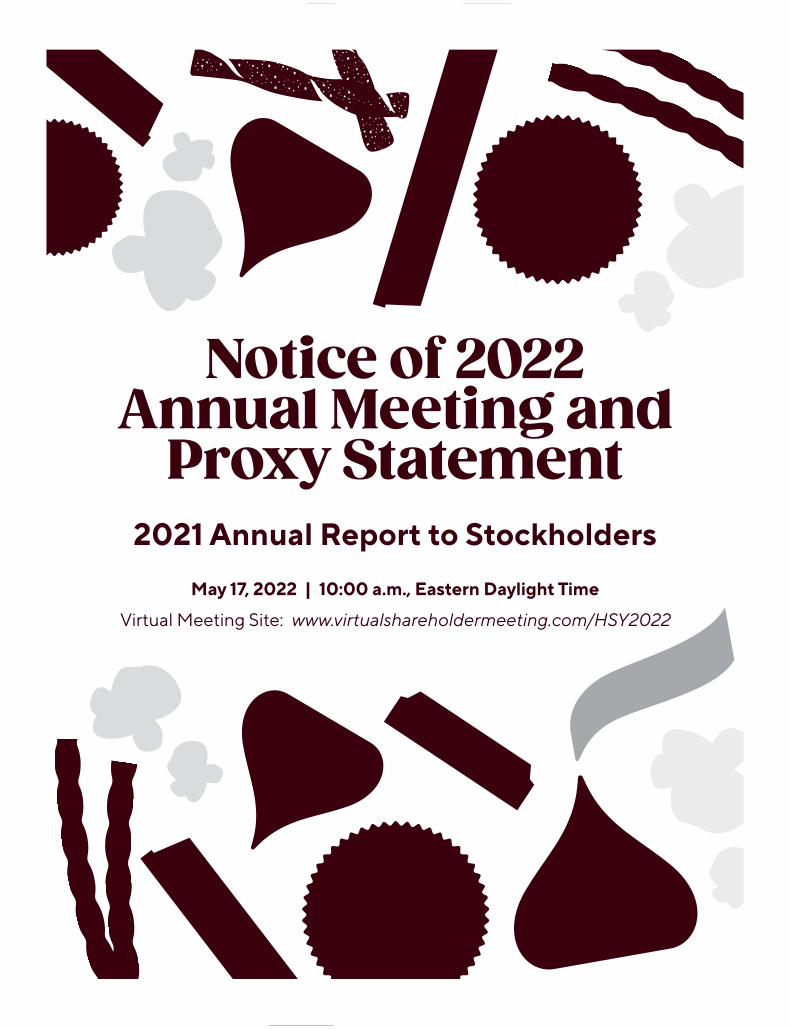
Notice of 2022Annual Meeting and
Proxy Statement2021 Annual Report to Stockholders
May 17, 2022 | 10:00 a.m., Eastern Daylight Time
Virtual Meeting Site: www.virtualshareholdermeeting.com/HSY2022

Michele Buck Chairman, President and Chief Executive Officer
April 7, 2022
Dear Fellow Stockholder:
It is my pleasure to invite you to attend The Hershey Company’s 2022 Annual Meeting of Stockholders, which will be held at 10:00 a.m. Eastern Daylight Time on Tuesday, May 17, 2022. We will conduct the meeting virtually to ensure your health and safety. Following this letter are detailed instructions regarding how to access the virtual meeting and how to vote your Hershey shares. Your vote is extremely important, so I encourage you to review the materials and submit your vote as soon as possible.
In 2021, we delivered a record year of production and double-digit sales and earnings growth. While the world around us remains volatile, we are confident in our ability to continue to respond to rapid changes and deliver another year of strong performance in 2022. I could not be prouder of the entire Hershey organization for the way they continue to unite to overcome obstacles, show courage and adaptability, and persevere to deliver for our consumers, partners, stockholders and each other during a period of unprecedented disruption.
As I reflect on the past several years, we have made tremendous progress against our strategies. Within our confection business, we have accelerated both growth and share gains through enhanced revenue management capabilities, a more balanced approach to innovation, continued strong brand investment and executional excellence.
We have improved our M&A capability and accelerated our portfolio diversification efforts, adding high growth brands like Pirates Booty, SkinnyPop and Dot’s Pretzels to meet different consumer needs and deliver incremental growth. We have also transformed our operating model to drive increased efficiencies and effectiveness across all aspects of our business, while advancing our environmental, social and governance (ESG) efforts to create value over the long-term for our business and a more sustainable ecosystem for our planet and people.
While growth across most food companies and categories accelerated during the pandemic, we believe snacking remains an advantaged category that will continue to outpace broader food growth in the future.
We continue our disciplined investment in capabilities across our business, specifically within our supply chain, with our customers or directly with our consumers. Having the right data, analytics and technology to support these capabilities is critical and we continue to focus on end-to-end connectivity from manufacturing and media to merchandising. We are working towards several ambitious goals designed to help us create positive change across global environmental and social areas, supported by robust governance. This year, we will continue to scale our cocoa programs to meet our enhanced commitments related to responsible sourcing, child labor and deforestation. We are progressing our environmental agenda, as we further reduce our greenhouse gas emissions while developing a deeper understanding of our water footprint and opportunities to reduce our water usage.
We have continued to advance our diversity, equity and inclusion efforts over the past several years. Diversity is a source of energy and innovation. We have focused our efforts to bring in a wider range of talent and perspectives, as well as strengthened our development programs for underrepresented talent. We have made great progress and are proud of the work we’ve accomplished and recognition we’ve received, notably being named the World’s Most Female Friendly Company by Forbes. There is more work to be done, however, and we remain energized by the opportunities ahead of us and the impact we can have as we move forward.
None of this would be possible without the remarkable team of employees we have across the organization. Our employees’ needs continue to change, and we have put more real-time continuous listening in place so that we can evolve with them. Our employees value flexibility, more development and career opportunities, and want programs and benefits that not only take care of them financially, but emotionally as well. Within our manufacturing, sales and corporate teams, we have increased incentives, added headcount to reduce overtime requirements, provided employees with more scheduling flexibility and increased investment in training and development. We’ll continue to listen to employees and make the changes necessary to remain a place where employees want to work every day, are passionate about what they do and can make a difference both in and out of the workplace.
Thank you for your continued trust in The Hershey Company. I am excited about where we are and where we are going. We look forward to sharing more details during the Annual Meeting about the past year and the opportunities that give me great confidence in the future of Hershey.
Michele Buck
_____________________________________________________
Safe Harbor Statement
Please refer to the 2021 Annual Report to Stockholders that accompanies this letter for a discussion of Risk Factors that could cause future results to differ materially from the forward-looking statements, expectations and assumptions expressed or implied in this letter to stockholders or elsewhere. This letter to stockholders is not part of our proxy soliciting material.
TABLE OF CONTENTS PageNOTICE OF 2022 ANNUAL MEETING OF STOCKHOLDERS
PROXY STATEMENT SUMMARY2022 Annual Meeting of Stockholders . . . . . . . . . . . . . . . . . . . . . . . . . . . . . . . . . . . . . . . . . . . . . . . . . . . . . . . . . . . . 1 Voting Matters and Board Recommendations . . . . . . . . . . . . . . . . . . . . . . . . . . . . . . . . . . . . . . . . . . . . . . . . . . . . . . . 1 Our Director Nominees . . . . . . . . . . . . . . . . . . . . . . . . . . . . . . . . . . . . . . . . . . . . . . . . . . . . . . . . . . . . . . . . . . . . . . . . . 2 Governance Highlights . . . . . . . . . . . . . . . . . . . . . . . . . . . . . . . . . . . . . . . . . . . . . . . . . . . . . . . . . . . . . . . . . . . . . . . . . 3 Company Strategy and 2021 Business Highlights . . . . . . . . . . . . . . . . . . . . . . . . . . . . . . . . . . . . . . . . . . . . . . . . . . . . 5 Executive Compensation Highlights . . . . . . . . . . . . . . . . . . . . . . . . . . . . . . . . . . . . . . . . . . . . . . . . . . . . . . . . . . . . . . 6 PROXY STATEMENTQuestions and Answers about the Annual Meeting . . . . . . . . . . . . . . . . . . . . . . . . . . . . . . . . . . . . . . . . . . . . . . . . . . . 7 The Hershey Company Purpose and Values . . . . . . . . . . . . . . . . . . . . . . . . . . . . . . . . . . . . . . . . . . . . . . . . . . . . . . . . . 12
Code of Conduct . . . . . . . . . . . . . . . . . . . . . . . . . . . . . . . . . . . . . . . . . . . . . . . . . . . . . . . . . . . . . . . . . . . . . . . . . . . . 12 Our Shared Goodness Promise . . . . . . . . . . . . . . . . . . . . . . . . . . . . . . . . . . . . . . . . . . . . . . . . . . . . . . . . . . . . . . . . . 12
Corporate Governance . . . . . . . . . . . . . . . . . . . . . . . . . . . . . . . . . . . . . . . . . . . . . . . . . . . . . . . . . . . . . . . . . . . . . . . . . 17 Corporate Governance Guidelines . . . . . . . . . . . . . . . . . . . . . . . . . . . . . . . . . . . . . . . . . . . . . . . . . . . . . . . . . . . . . . 17 Board Composition and Criteria for Board Membership . . . . . . . . . . . . . . . . . . . . . . . . . . . . . . . . . . . . . . . . . . . . . 17 Leadership Structure . . . . . . . . . . . . . . . . . . . . . . . . . . . . . . . . . . . . . . . . . . . . . . . . . . . . . . . . . . . . . . . . . . . . . . . . . 20 Committees of the Board . . . . . . . . . . . . . . . . . . . . . . . . . . . . . . . . . . . . . . . . . . . . . . . . . . . . . . . . . . . . . . . . . . . . . . 21 Enterprise Risk Management . . . . . . . . . . . . . . . . . . . . . . . . . . . . . . . . . . . . . . . . . . . . . . . . . . . . . . . . . . . . . . . . . . 24 Board Meetings and Attendance . . . . . . . . . . . . . . . . . . . . . . . . . . . . . . . . . . . . . . . . . . . . . . . . . . . . . . . . . . . . . . . . 25 Director Independence . . . . . . . . . . . . . . . . . . . . . . . . . . . . . . . . . . . . . . . . . . . . . . . . . . . . . . . . . . . . . . . . . . . . . . . 25 Director Nominations . . . . . . . . . . . . . . . . . . . . . . . . . . . . . . . . . . . . . . . . . . . . . . . . . . . . . . . . . . . . . . . . . . . . . . . . 26 Communications with Directors . . . . . . . . . . . . . . . . . . . . . . . . . . . . . . . . . . . . . . . . . . . . . . . . . . . . . . . . . . . . . . . . 27
Proposal No. 1 – Election of Directors . . . . . . . . . . . . . . . . . . . . . . . . . . . . . . . . . . . . . . . . . . . . . . . . . . . . . . . . . . . 28 Election Procedures . . . . . . . . . . . . . . . . . . . . . . . . . . . . . . . . . . . . . . . . . . . . . . . . . . . . . . . . . . . . . . . . . . . . . . . . . . 28 Nominees for Director . . . . . . . . . . . . . . . . . . . . . . . . . . . . . . . . . . . . . . . . . . . . . . . . . . . . . . . . . . . . . . . . . . . . . . . . 28
Non-Employee Director Compensation . . . . . . . . . . . . . . . . . . . . . . . . . . . . . . . . . . . . . . . . . . . . . . . . . . . . . . . . . . . . 35 The Hershey Company Directors' Compensation Plan . . . . . . . . . . . . . . . . . . . . . . . . . . . . . . . . . . . . . . . . . . . . . . . 35 Payment of Annual Retainer, Lead Independent Director Fee and Committee Chair Fees . . . . . . . . . . . . . . . . . . . 35 Restricted Stock Units ("RSUs") . . . . . . . . . . . . . . . . . . . . . . . . . . . . . . . . . . . . . . . . . . . . . . . . . . . . . . . . . . . . . . . . 36 Other Compensation, Reimbursements and Programs . . . . . . . . . . . . . . . . . . . . . . . . . . . . . . . . . . . . . . . . . . . . . . . 36 Stock Ownership Guidelines . . . . . . . . . . . . . . . . . . . . . . . . . . . . . . . . . . . . . . . . . . . . . . . . . . . . . . . . . . . . . . . . . . . 36 2021 Director Compensation . . . . . . . . . . . . . . . . . . . . . . . . . . . . . . . . . . . . . . . . . . . . . . . . . . . . . . . . . . . . . . . . . . 37
Share Ownership of Directors, Management and Certain Beneficial Owners . . . . . . . . . . . . . . . . . . . . . . . . . . . . . . . 39 Ownership of Other Company Securities . . . . . . . . . . . . . . . . . . . . . . . . . . . . . . . . . . . . . . . . . . . . . . . . . . . . . . . . . 40 Information Regarding Our Controlling Stockholder . . . . . . . . . . . . . . . . . . . . . . . . . . . . . . . . . . . . . . . . . . . . . . . . 41
Audit Committee Report . . . . . . . . . . . . . . . . . . . . . . . . . . . . . . . . . . . . . . . . . . . . . . . . . . . . . . . . . . . . . . . . . . . . . . . . 43 Information about our Independent Auditors . . . . . . . . . . . . . . . . . . . . . . . . . . . . . . . . . . . . . . . . . . . . . . . . . . . . . . . . 45 Proposal No. 2 – Ratification of Appointment of Independent Auditors . . . . . . . . . . . . . . . . . . . . . . . . . . . . . . . 46 Compensation Discussion & Analysis . . . . . . . . . . . . . . . . . . . . . . . . . . . . . . . . . . . . . . . . . . . . . . . . . . . . . . . . . . . 47
Executive Summary . . . . . . . . . . . . . . . . . . . . . . . . . . . . . . . . . . . . . . . . . . . . . . . . . . . . . . . . . . . . . . . . . . . . . . . . . 47 The Role of the Compensation Committee . . . . . . . . . . . . . . . . . . . . . . . . . . . . . . . . . . . . . . . . . . . . . . . . . . . . . . . . 52 Compensation Components . . . . . . . . . . . . . . . . . . . . . . . . . . . . . . . . . . . . . . . . . . . . . . . . . . . . . . . . . . . . . . . . . . . . 53 Setting Compensation . . . . . . . . . . . . . . . . . . . . . . . . . . . . . . . . . . . . . . . . . . . . . . . . . . . . . . . . . . . . . . . . . . . . . . . . 54 Base Salary . . . . . . . . . . . . . . . . . . . . . . . . . . . . . . . . . . . . . . . . . . . . . . . . . . . . . . . . . . . . . . . . . . . . . . . . . . . . . . . . 55 Annual Incentives . . . . . . . . . . . . . . . . . . . . . . . . . . . . . . . . . . . . . . . . . . . . . . . . . . . . . . . . . . . . . . . . . . . . . . . . . . . 55 Long-Term Incentives . . . . . . . . . . . . . . . . . . . . . . . . . . . . . . . . . . . . . . . . . . . . . . . . . . . . . . . . . . . . . . . . . . . . . . . . 57 Perquisites . . . . . . . . . . . . . . . . . . . . . . . . . . . . . . . . . . . . . . . . . . . . . . . . . . . . . . . . . . . . . . . . . . . . . . . . . . . . . . . . . 59 Retirement Plans . . . . . . . . . . . . . . . . . . . . . . . . . . . . . . . . . . . . . . . . . . . . . . . . . . . . . . . . . . . . . . . . . . . . . . . . . . . . 59 Employment Agreements . . . . . . . . . . . . . . . . . . . . . . . . . . . . . . . . . . . . . . . . . . . . . . . . . . . . . . . . . . . . . . . . . . . . . 60
i
Severance and Change in Control Plans . . . . . . . . . . . . . . . . . . . . . . . . . . . . . . . . . . . . . . . . . . . . . . . . . . . . . . . . . . 60 Stock Ownership Guidelines . . . . . . . . . . . . . . . . . . . . . . . . . . . . . . . . . . . . . . . . . . . . . . . . . . . . . . . . . . . . . . . . . . . 60 Other Compensation Policies and Practices . . . . . . . . . . . . . . . . . . . . . . . . . . . . . . . . . . . . . . . . . . . . . . . . . . . . . . . 61
Compensation Committee Report . . . . . . . . . . . . . . . . . . . . . . . . . . . . . . . . . . . . . . . . . . . . . . . . . . . . . . . . . . . . . . . . . 62 2021 Summary Compensation Table . . . . . . . . . . . . . . . . . . . . . . . . . . . . . . . . . . . . . . . . . . . . . . . . . . . . . . . . . . . . 63 2021 Grants of Plan-Based Awards Table . . . . . . . . . . . . . . . . . . . . . . . . . . . . . . . . . . . . . . . . . . . . . . . . . . . . . . . . 65 Outstanding Equity Awards at 2021 Fiscal-Year End Table . . . . . . . . . . . . . . . . . . . . . . . . . . . . . . . . . . . . . . . . . . 67 2021 Option Exercises and Stock Vested Table . . . . . . . . . . . . . . . . . . . . . . . . . . . . . . . . . . . . . . . . . . . . . . . . . . . . 68 2021 Pension Benefits Table . . . . . . . . . . . . . . . . . . . . . . . . . . . . . . . . . . . . . . . . . . . . . . . . . . . . . . . . . . . . . . . . . . . 69 2021 Non-Qualified Deferred Compensation Table . . . . . . . . . . . . . . . . . . . . . . . . . . . . . . . . . . . . . . . . . . . . . . . . . 70 Potential Payments upon Termination or Change in Control . . . . . . . . . . . . . . . . . . . . . . . . . . . . . . . . . . . . . . . . . . 72 CEO Pay Ratio Disclosure . . . . . . . . . . . . . . . . . . . . . . . . . . . . . . . . . . . . . . . . . . . . . . . . . . . . . . . . . . . . . . . . . . . . 79 Equity Compensation Plan Information . . . . . . . . . . . . . . . . . . . . . . . . . . . . . . . . . . . . . . . . . . . . . . . . . . . . . . . . . . 79
Proposal No. 3 – Advise on Named Executive Officer Compensation . . . . . . . . . . . . . . . . . . . . . . . . . . . . . . . . . 80 Proposal No. 4 - Stockholder Proposal . . . . . . . . . . . . . . . . . . . . . . . . . . . . . . . . . . . . . . . . . . . . . . . . . . . . . . . . . . 81 Certain Transactions and Relationships . . . . . . . . . . . . . . . . . . . . . . . . . . . . . . . . . . . . . . . . . . . . . . . . . . . . . . . . . . . . 84
Policies and Procedures Regarding Transactions with Related Persons . . . . . . . . . . . . . . . . . . . . . . . . . . . . . . . . . . 84 Transactions with Hershey Trust Company, Milton Hershey School and the Milton Hershey School Trust . . . . . 84
Compensation Committee Interlocks and Insider Participation . . . . . . . . . . . . . . . . . . . . . . . . . . . . . . . . . . . . . . . . . . 85 Other Matters . . . . . . . . . . . . . . . . . . . . . . . . . . . . . . . . . . . . . . . . . . . . . . . . . . . . . . . . . . . . . . . . . . . . . . . . . . . . . . . . 86
Householding of Proxy Materials . . . . . . . . . . . . . . . . . . . . . . . . . . . . . . . . . . . . . . . . . . . . . . . . . . . . . . . . . . . . . . . 86 Information Regarding the 2023 Annual Meeting of Stockholders . . . . . . . . . . . . . . . . . . . . . . . . . . . . . . . . . . . . . 86
Appendix A - GAAP to Non-GAAP Reconciliation . . . . . . . . . . . . . . . . . . . . . . . . . . . . . . . . . . . . . . . . . . . . . . . . . . 87 Non-GAAP Financial Measures . . . . . . . . . . . . . . . . . . . . . . . . . . . . . . . . . . . . . . . . . . . . . . . . . . . . . . . . . . . . . . . . 87
2021 ANNUAL REPORT TO STOCKHOLDERSItem 1. Business . . . . . . . . . . . . . . . . . . . . . . . . . . . . . . . . . . . . . . . . . . . . . . . . . . . . . . . . . . . . . . . . . . . . . . . . . . . . . . 2 Item 1A. Risk Factors . . . . . . . . . . . . . . . . . . . . . . . . . . . . . . . . . . . . . . . . . . . . . . . . . . . . . . . . . . . . . . . . . . . . . . . . . . 9 Item 1B. Unresolved Staff Comments . . . . . . . . . . . . . . . . . . . . . . . . . . . . . . . . . . . . . . . . . . . . . . . . . . . . . . . . . . . . . 16 Item 2. Properties . . . . . . . . . . . . . . . . . . . . . . . . . . . . . . . . . . . . . . . . . . . . . . . . . . . . . . . . . . . . . . . . . . . . . . . . . . . . . 17 Item 3. Legal Proceedings . . . . . . . . . . . . . . . . . . . . . . . . . . . . . . . . . . . . . . . . . . . . . . . . . . . . . . . . . . . . . . . . . . . . . . 17 Item 4. Mine Safety Disclosures . . . . . . . . . . . . . . . . . . . . . . . . . . . . . . . . . . . . . . . . . . . . . . . . . . . . . . . . . . . . . . . . . . 17 Supplemental Item. Information About Our Executive Officers . . . . . . . . . . . . . . . . . . . . . . . . . . . . . . . . . . . . . . . . . 18 Item 5. Market for the Registrant’s Common Equity, Related Stockholder Matters and Issuer Purchases of Equity
Securities . . . . . . . . . . . . . . . . . . . . . . . . . . . . . . . . . . . . . . . . . . . . . . . . . . . . . . . . . . . . . . . . . . . . . . . . . . . . . . . . . . 19 Item 6. [Reserved] . . . . . . . . . . . . . . . . . . . . . . . . . . . . . . . . . . . . . . . . . . . . . . . . . . . . . . . . . . . . . . . . . . . . . . . . . . . . . 20 Item 7. Management’s Discussion and Analysis of Financial Condition and Results of Operations . . . . . . . . . . . . . 21 Item 7A. Quantitative and Qualitative Disclosures about Market Risk . . . . . . . . . . . . . . . . . . . . . . . . . . . . . . . . . . . . 42 Item 8. Financial Statements and Supplementary Data . . . . . . . . . . . . . . . . . . . . . . . . . . . . . . . . . . . . . . . . . . . . . . . . 47 Item 9. Changes in and Disagreements with Accountants on Accounting and Financial Disclosure . . . . . . . . . . . . . 101 Item 9A. Controls and Procedures . . . . . . . . . . . . . . . . . . . . . . . . . . . . . . . . . . . . . . . . . . . . . . . . . . . . . . . . . . . . . . . . 101 Item 9B. Other Information . . . . . . . . . . . . . . . . . . . . . . . . . . . . . . . . . . . . . . . . . . . . . . . . . . . . . . . . . . . . . . . . . . . . . 102 Item 9C. Disclosure Regarding Foreign Jurisdictions that Prevent Inspections . . . . . . . . . . . . . . . . . . . . . . . . . . . . . . 102 Item 10. Directors, Executive Officers and Corporate Governance . . . . . . . . . . . . . . . . . . . . . . . . . . . . . . . . . . . . . . . 103 Item 11. Executive Compensation . . . . . . . . . . . . . . . . . . . . . . . . . . . . . . . . . . . . . . . . . . . . . . . . . . . . . . . . . . . . . . . . 103 Item 12. Security Ownership of Certain Beneficial Owners and Management and Related Stockholder Matters . . . . . . . . . . . . . . . . . . . . . . . . . . . . . . . . . . . . . . . . . . . . . . . . . . . . . . . . . . . . . . . . . . . 103 Item 13. Certain Relationships and Related Transactions, and Director Independence . . . . . . . . . . . . . . . . . . . . . . . . 104 Item 14. Principal Accountant Fees and Services . . . . . . . . . . . . . . . . . . . . . . . . . . . . . . . . . . . . . . . . . . . . . . . . . . . . . 104 Item 15. Exhibits and Financial Statement Schedules . . . . . . . . . . . . . . . . . . . . . . . . . . . . . . . . . . . . . . . . . . . . . . . . . 105 Item 16. Form 10-K Summary . . . . . . . . . . . . . . . . . . . . . . . . . . . . . . . . . . . . . . . . . . . . . . . . . . . . . . . . . . . . . . . . . . . 108 Signatures . . . . . . . . . . . . . . . . . . . . . . . . . . . . . . . . . . . . . . . . . . . . . . . . . . . . . . . . . . . . . . . . . . . . . . . . . . . . . . . . . . . 109 Schedule II - Valuation and Qualifying Accounts . . . . . . . . . . . . . . . . . . . . . . . . . . . . . . . . . . . . . . . . . . . . . . . . . . . . 110
ii
Notice of 2022 Annual Meeting of StockholdersTuesday, May 17, 2022
10:00 a.m., Eastern Daylight Time
The 2022 Annual Meeting of Stockholders (the “Annual Meeting”) of The Hershey Company (“Hershey” or the “Company”) will be held on Tuesday, May 17, 2022, beginning at 10:00 a.m., Eastern Daylight Time. Due to the ongoing public health impact of the coronavirus pandemic, this year’s Annual Meeting will again be a virtual meeting conducted solely via live webcast. You will be able to attend the Annual Meeting, vote your shares electronically and submit questions during the meeting by visiting www.virtualshareholdermeeting.com/HSY2022. You may also listen to the meeting by calling 1-877-328-2502. You will not be able to attend the Annual Meeting in person. Additional information regarding attending the Annual Meeting, voting your shares and submitting questions can be found in the Proxy Statement.
The purposes of the meeting are as follows:
1 To elect the 12 nominees named in the Proxy Statement to serve as directors of the Company until the 2023 Annual Meeting of Stockholders;
2. To ratify the appointment of Ernst & Young LLP as the Company’s independent auditors for the fiscal year ending December 31, 2022;
3. To conduct an advisory vote regarding the compensation of the Company’s named executive officers; 4. To consider the stockholder proposal set forth in the Proxy Statement, if properly presented at the Annual Meeting; and5. To discuss and take action on any other business that is properly brought before the Annual Meeting.
The Proxy Statement accompanying this Notice of 2022 Annual Meeting of Stockholders describes each of these items in detail. The Proxy Statement contains other important information that you should read and consider before you vote.
The Board of Directors of the Company has established the close of business on March 18, 2022 as the record date for determining the stockholders who are entitled to notice of, and to vote at, the Annual Meeting and any adjournment or postponement thereof.
The Company is furnishing proxy materials to its stockholders through the internet as permitted under the rules of the Securities and Exchange Commission. Under these rules, many of the Company’s stockholders will receive a Notice of Internet Availability of Proxy Materials instead of a paper copy of the Notice of 2022 Annual Meeting of Stockholders and Proxy Statement, our proxy card, and our Annual Report on Form 10-K. We believe this process gives us the opportunity to serve you more efficiently by making the proxy materials available quickly online and reducing costs associated with printing and postage. Stockholders who do not receive a Notice of Internet Availability of Proxy Materials will receive a paper copy of the proxy materials by mail.
By order of the Board of Directors,
James TuroffSenior Vice President, General Counsel and Secretary
April 7, 2022
Your vote is important. Instructions on how to vote are contained in our Proxy Statement and in the Notice of Internet Availability of Proxy Materials. Please cast your vote by telephone or over the internet as described in those materials. Alternatively, if you requested a copy of the proxy/voting instruction card by mail, you may mark, sign, date and return the proxy/voting instruction card in the envelope provided.
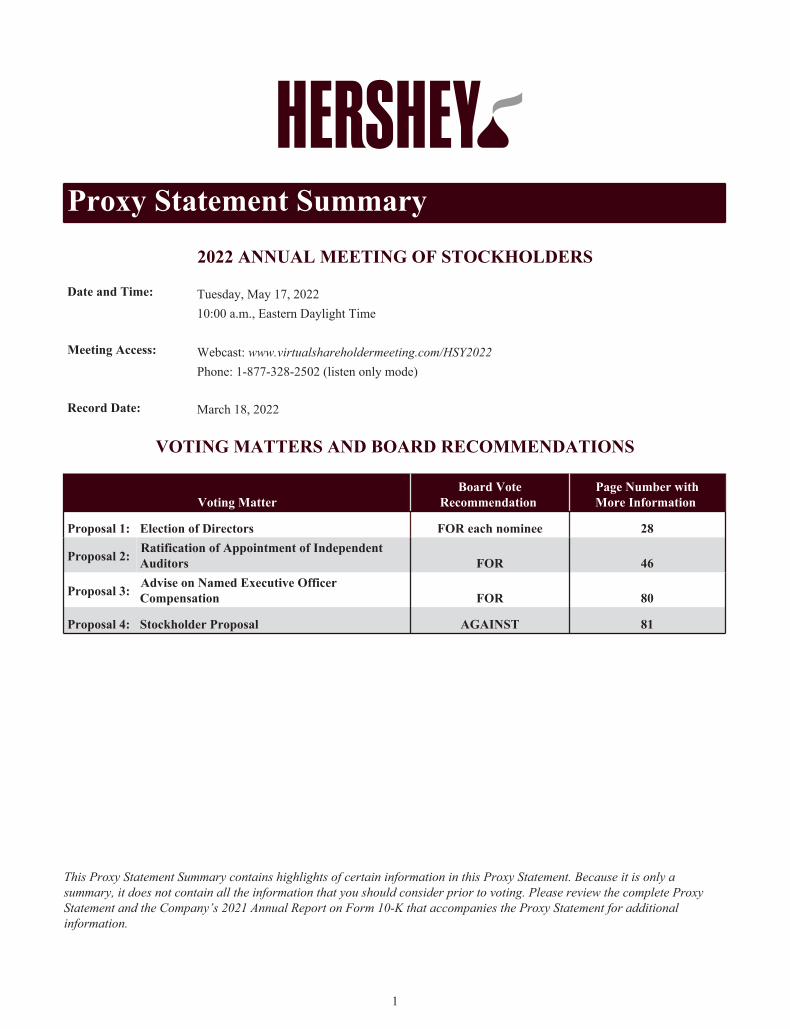
Proxy Statement Summary
2022 ANNUAL MEETING OF STOCKHOLDERS
Date and Time: Tuesday, May 17, 202210:00 a.m., Eastern Daylight Time
Meeting Access: Webcast: www.virtualshareholdermeeting.com/HSY2022Phone: 1-877-328-2502 (listen only mode)
Record Date: March 18, 2022
VOTING MATTERS AND BOARD RECOMMENDATIONS
Voting MatterBoard Vote
Recommendation Page Number with More Information
Proposal 1:
Election of Directors
FOR each nominee 28
Proposal 2: Ratification of Appointment of Independent Auditors
FOR 46
Proposal 3: Advise on Named Executive Officer Compensation
FOR 80
Proposal 4: Stockholder Proposal AGAINST 81
This Proxy Statement Summary contains highlights of certain information in this Proxy Statement. Because it is only a summary, it does not contain all the information that you should consider prior to voting. Please review the complete Proxy Statement and the Company’s 2021 Annual Report on Form 10-K that accompanies the Proxy Statement for additional information.
1
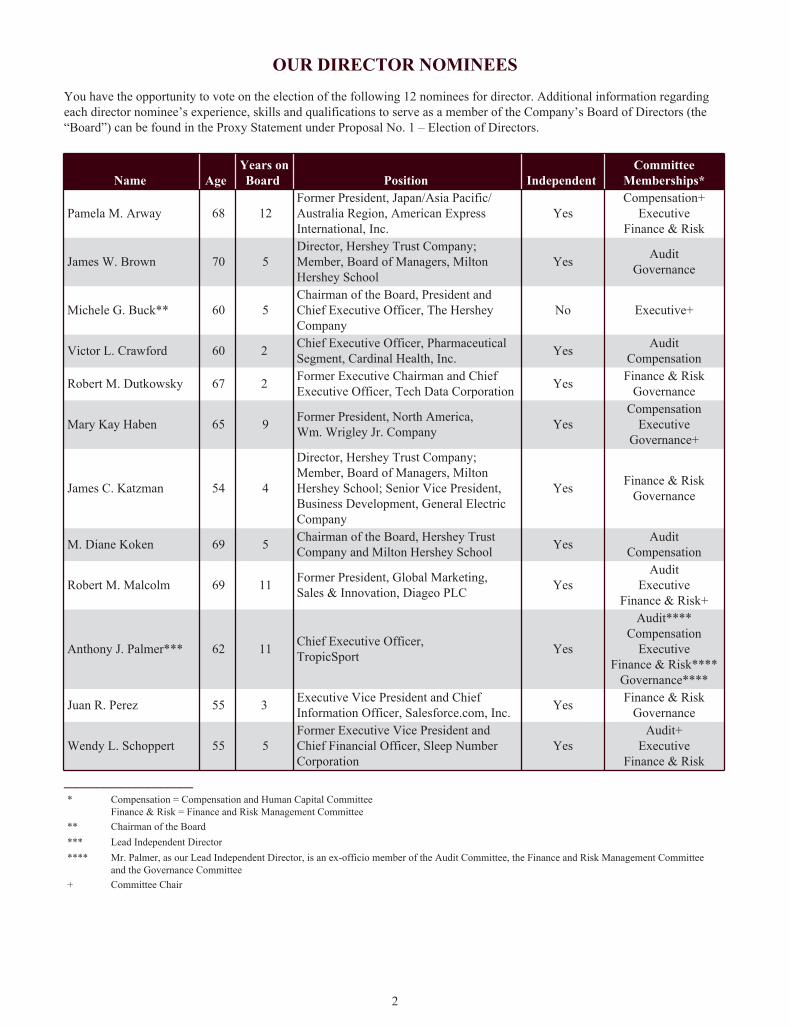
OUR DIRECTOR NOMINEES
You have the opportunity to vote on the election of the following 12 nominees for director. Additional information regarding each director nominee’s experience, skills and qualifications to serve as a member of the Company’s Board of Directors (the “Board”) can be found in the Proxy Statement under Proposal No. 1 – Election of Directors.
Name Age Years onBoard Position Independent
CommitteeMemberships*
Pamela M. Arway 68 12Former President, Japan/Asia Pacific/Australia Region, American Express International, Inc.
YesCompensation+
ExecutiveFinance & Risk
James W. Brown 70 5Director, Hershey Trust Company; Member, Board of Managers, Milton Hershey School
Yes AuditGovernance
Michele G. Buck** 60 5Chairman of the Board, President and Chief Executive Officer, The Hershey Company
No Executive+
Victor L. Crawford 60 2 Chief Executive Officer, Pharmaceutical Segment, Cardinal Health, Inc. Yes Audit
Compensation
Robert M. Dutkowsky 67 2 Former Executive Chairman and Chief Executive Officer, Tech Data Corporation Yes Finance & Risk
Governance
Mary Kay Haben 65 9 Former President, North America, Wm. Wrigley Jr. Company Yes
CompensationExecutive
Governance+
James C. Katzman 54 4
Director, Hershey Trust Company; Member, Board of Managers, Milton Hershey School; Senior Vice President, Business Development, General Electric Company
Yes Finance & RiskGovernance
M. Diane Koken 69 5 Chairman of the Board, Hershey Trust Company and Milton Hershey School Yes Audit
Compensation
Robert M. Malcolm 69 11 Former President, Global Marketing, Sales & Innovation, Diageo PLC Yes
AuditExecutive
Finance & Risk+
Anthony J. Palmer*** 62 11 Chief Executive Officer,TropicSport Yes
Audit****Compensation
ExecutiveFinance & Risk****
Governance****
Juan R. Perez 55 3 Executive Vice President and Chief Information Officer, Salesforce.com, Inc. Yes Finance & Risk
Governance
Wendy L. Schoppert 55 5Former Executive Vice President and Chief Financial Officer, Sleep Number Corporation
YesAudit+
ExecutiveFinance & Risk
____________________* Compensation = Compensation and Human Capital Committee
Finance & Risk = Finance and Risk Management Committee** Chairman of the Board*** Lead Independent Director**** Mr. Palmer, as our Lead Independent Director, is an ex-officio member of the Audit Committee, the Finance and Risk Management Committee
and the Governance Committee+ Committee Chair
2
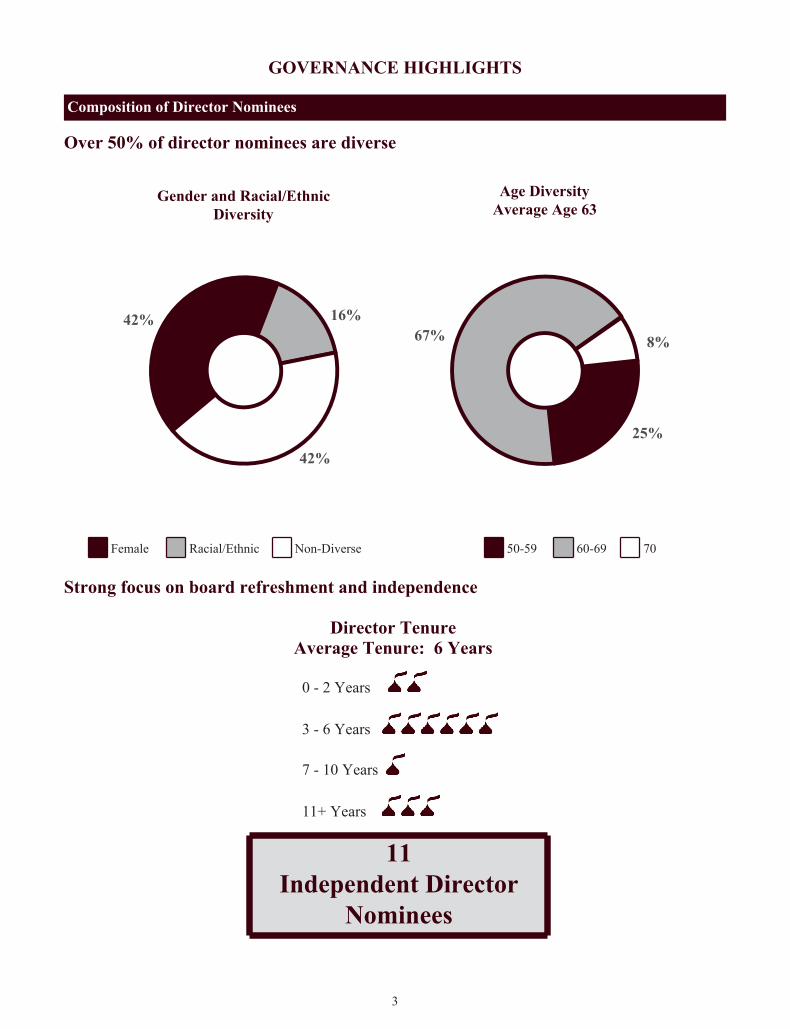
GOVERNANCE HIGHLIGHTS
Composition of Director Nominees
Over 50% of director nominees are diverse
Gender and Racial/EthnicDiversity
42% 16%
42%
Age DiversityAverage Age 63
25%
67% 8%
Female Racial/Ethnic Non-Diverse 50-59 60-69 70
Strong focus on board refreshment and independence
Director TenureAverage Tenure: 6 Years
0 - 2 Years
3 - 6 Years
7 - 10 Years
11+ Years
11 Independent Director
Nominees
3
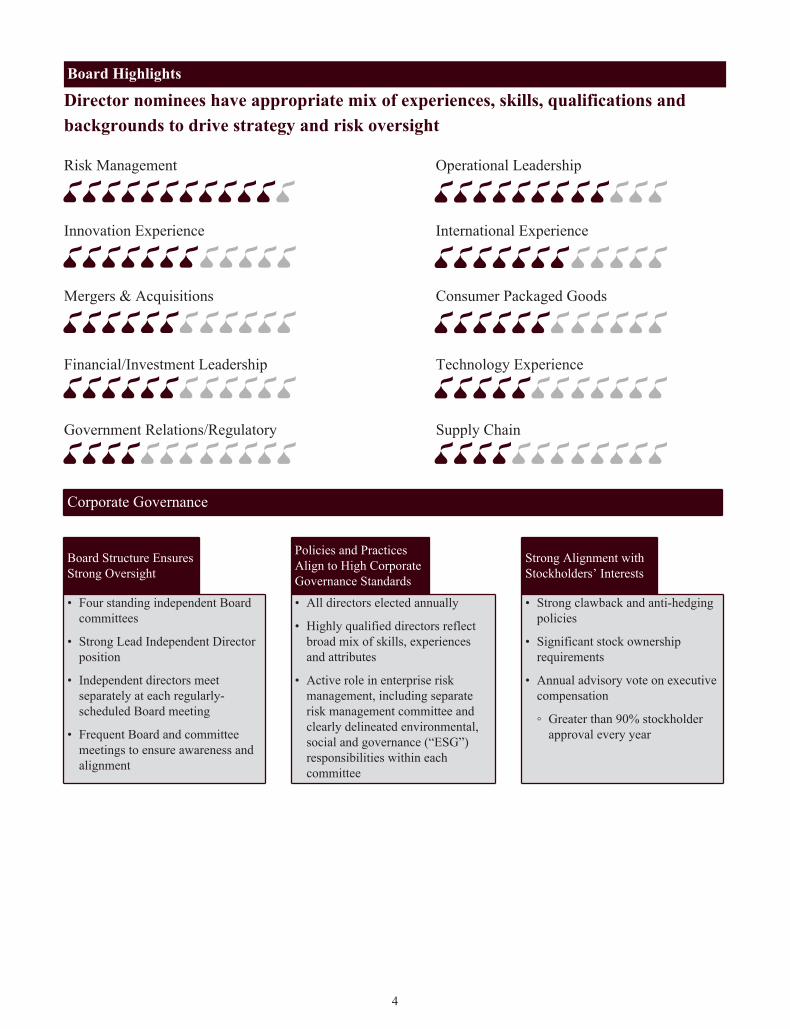
Board Highlights
Director nominees have appropriate mix of experiences, skills, qualifications and backgrounds to drive strategy and risk oversight
Risk Management Operational Leadership
Innovation Experience International Experience
Mergers & Acquisitions Consumer Packaged Goods
Financial/Investment Leadership Technology Experience
Government Relations/Regulatory Supply Chain
Corporate Governance
Board Structure Ensures Strong Oversight
Policies and Practices Align to High Corporate Governance Standards
Strong Alignment with Stockholders’ Interests
• Four standing independent Board committees
• Strong Lead Independent Director position
• Independent directors meet separately at each regularly-scheduled Board meeting
• Frequent Board and committee meetings to ensure awareness and alignment
• All directors elected annually
• Highly qualified directors reflect broad mix of skills, experiences and attributes
• Active role in enterprise risk management, including separate risk management committee and clearly delineated environmental, social and governance (“ESG”) responsibilities within each committee
• Strong clawback and anti-hedging policies
• Significant stock ownership requirements
• Annual advisory vote on executive compensation
◦ Greater than 90% stockholder approval every year
4
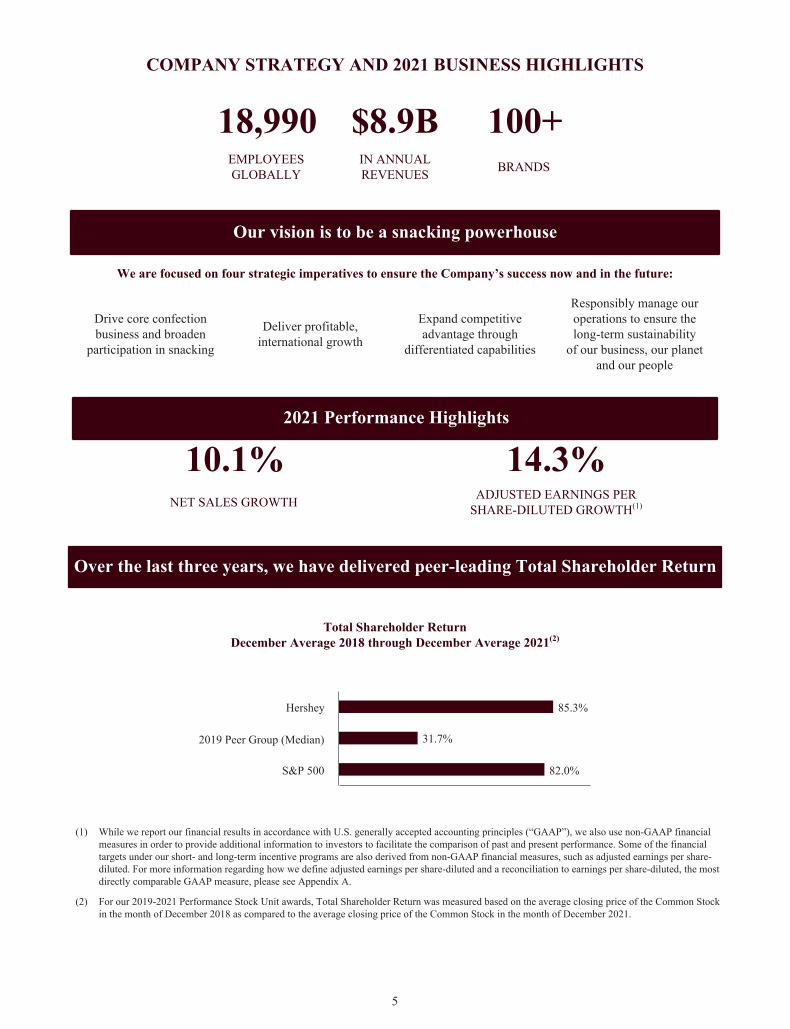
COMPANY STRATEGY AND 2021 BUSINESS HIGHLIGHTS
18,990 $8.9B 100+EMPLOYEES GLOBALLY
IN ANNUAL REVENUES BRANDS
Our vision is to be a snacking powerhouse
We are focused on four strategic imperatives to ensure the Company’s success now and in the future:
Drive core confection business and broaden
participation in snacking
Deliver profitable, international growth
Expand competitive advantage through
differentiated capabilities
Responsibly manage our operations to ensure thelong-term sustainability
of our business, our planetand our people
2021 Performance Highlights
10.1% 14.3%NET SALES GROWTH ADJUSTED EARNINGS PER
SHARE-DILUTED GROWTH(1)
Over the last three years, we have delivered peer-leading Total Shareholder Return
Total Shareholder ReturnDecember Average 2018 through December Average 2021(2)
85.3%
31.7%
82.0%
Hershey
2019 Peer Group (Median)
S&P 500
(1) While we report our financial results in accordance with U.S. generally accepted accounting principles (“GAAP”), we also use non-GAAP financial measures in order to provide additional information to investors to facilitate the comparison of past and present performance. Some of the financial targets under our short- and long-term incentive programs are also derived from non-GAAP financial measures, such as adjusted earnings per share-diluted. For more information regarding how we define adjusted earnings per share-diluted and a reconciliation to earnings per share-diluted, the most directly comparable GAAP measure, please see Appendix A.
(2) For our 2019-2021 Performance Stock Unit awards, Total Shareholder Return was measured based on the average closing price of the Common Stock in the month of December 2018 as compared to the average closing price of the Common Stock in the month of December 2021.
5
EXECUTIVE COMPENSATION HIGHLIGHTS
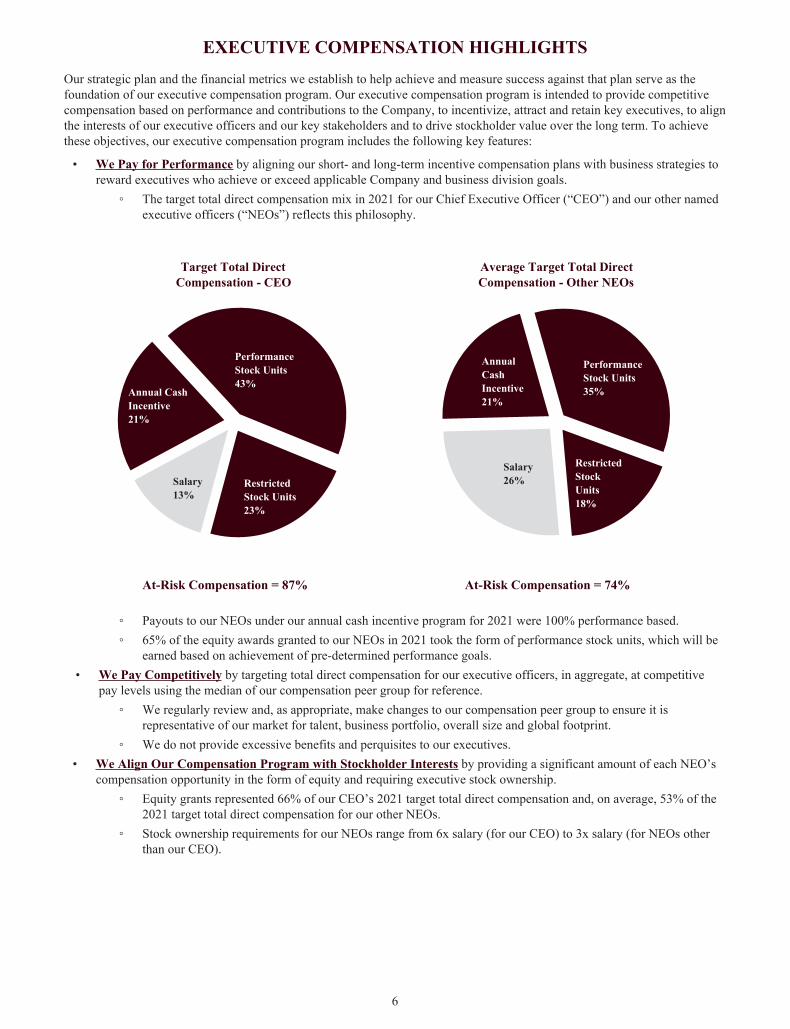
Our strategic plan and the financial metrics we establish to help achieve and measure success against that plan serve as the foundation of our executive compensation program. Our executive compensation program is intended to provide competitive compensation based on performance and contributions to the Company, to incentivize, attract and retain key executives, to align the interests of our executive officers and our key stakeholders and to drive stockholder value over the long term. To achieve these objectives, our executive compensation program includes the following key features:
• We Pay for Performance by aligning our short- and long-term incentive compensation plans with business strategies to reward executives who achieve or exceed applicable Company and business division goals.
◦ The target total direct compensation mix in 2021 for our Chief Executive Officer (“CEO”) and our other named executive officers (“NEOs”) reflects this philosophy.
Target Total DirectCompensation - CEO
Salary13%
Annual CashIncentive21%
PerformanceStock Units43%
RestrictedStock Units23%
Average Target Total DirectCompensation - Other NEOs
Salary26%
AnnualCashIncentive21%
PerformanceStock Units35%
RestrictedStockUnits18%
At-Risk Compensation = 87% At-Risk Compensation = 74%
◦ Payouts to our NEOs under our annual cash incentive program for 2021 were 100% performance based.◦ 65% of the equity awards granted to our NEOs in 2021 took the form of performance stock units, which will be
earned based on achievement of pre-determined performance goals.• We Pay Competitively by targeting total direct compensation for our executive officers, in aggregate, at competitive
pay levels using the median of our compensation peer group for reference.◦ We regularly review and, as appropriate, make changes to our compensation peer group to ensure it is
representative of our market for talent, business portfolio, overall size and global footprint.◦ We do not provide excessive benefits and perquisites to our executives.
• We Align Our Compensation Program with Stockholder Interests by providing a significant amount of each NEO’s compensation opportunity in the form of equity and requiring executive stock ownership.
◦ Equity grants represented 66% of our CEO’s 2021 target total direct compensation and, on average, 53% of the 2021 target total direct compensation for our other NEOs.
◦ Stock ownership requirements for our NEOs range from 6x salary (for our CEO) to 3x salary (for NEOs other than our CEO).
6
Proxy StatementThe Board of Directors (the “Board”) of The Hershey Company (the “Company,” “Hershey,” “we,” or “us”) is furnishing this Proxy Statement and the accompanying form of proxy in connection with the solicitation of proxies for the 2022 Annual Meeting of Stockholders of the Company (the “Annual Meeting”). The Annual Meeting will be held on May 17, 2022, beginning at 10:00 a.m., Eastern Daylight Time (“EDT”). Due to the ongoing public health impact of the coronavirus pandemic (“COVID-19”), this year’s Annual Meeting will again be a virtual meeting conducted solely via live webcast. You will be able to attend the Annual Meeting, vote your shares electronically and submit questions during the meeting by visiting www.virtualshareholdermeeting.com/HSY2022. You may also listen to the Annual Meeting by calling 1-877-328-2502. You will not be able to attend the Annual Meeting in person.
Important Notice Regarding the Availability of Proxy Materials for the2022 Annual Meeting of Stockholders to be held on May 17, 2022
The Notice of 2022 Annual Meeting of Stockholders and Proxy Statement, our proxy card, our Annual Report on Form 10-K and other annual meeting materials are available free of charge on the internet at www.proxyvote.com. We intend to begin mailing our Notice of Internet Availability of Proxy Materials to stockholders on or about April 7, 2022. At that time, we also will begin mailing paper copies of our proxy materials to stockholders who requested them.
QUESTIONS AND ANSWERS ABOUT THE ANNUAL MEETING
Q: Why is this year’s Annual Meeting being held as a virtual-only meeting?This year’s Annual Meeting is again being held as a virtual-only meeting conducted solely via live webcast due to the ongoing public health impact of COVID-19 and to support the health and well-being of our stockholders, employees and community members. Holding the Annual Meeting as a virtual-only meeting allows us to reach the broadest number of stockholders while maintaining our commitment to health and safety.
Q: Who is entitled to attend and vote at the Annual Meeting?You can attend and vote at the Annual Meeting if, as of the close of business on March 18, 2022 (the “Record Date”), you were a stockholder of record of the Company’s common stock (“Common Stock”) or Class B common stock (“Class B Common Stock”). As of the Record Date, there were 145,928,920 shares of our Common Stock and 59,613,777 shares of our Class B Common Stock outstanding.
If you were not a stockholder of record as of the Record Date, you may still attend the Annual Meeting by logging into the webcast as a guest, but you will not be able to vote before or during the meeting.
Q: How do I attend the Annual Meeting?This year’s Annual Meeting will be a virtual-only meeting conducted solely via live webcast.
To participate in the Annual Meeting, visit www.virtualshareholdermeeting.com/HSY2022 and enter the 16-digit control number included on your Notice of Internet Availability of Proxy Materials or your proxy card. The live webcast will begin at 10:00 a.m. EDT on Tuesday, May 17, 2022. We encourage you to access the virtual meeting platform at least 15 minutes prior to the start time. If you do not have a 16-digit control number, you will still be able to access the webcast as a guest, but will not be able to vote your shares or ask a question during the meeting. You may also listen to the Annual Meeting by calling 1-877-328-2502, but you will not be able to vote your shares or ask a question telephonically.
We will have technicians ready to assist you with any technical difficulties you may have accessing the virtual meeting. Technical support will be available on the virtual meeting platform beginning at 9:30 a.m. EDT on the day of the meeting and will remain available until 30 minutes after the meeting has finished.
7

Q: Can I submit questions before or during the Annual Meeting?Stockholders have multiple opportunities to submit questions for the Annual Meeting. If you wish to submit a question prior to the Annual Meeting, you may log into www.proxyvote.com and enter your 16-digit control number. Once past the login screen, click on “Submit Questions,” type in your question, and click “Submit.” Alternatively, if you wish to submit a question during the Annual Meeting, visit www.virtualshareholdermeeting.com/HSY2022, type your question into the “Ask a Question” field, and click “Submit.”
Questions pertinent to meeting matters will be answered during the Annual Meeting, subject to time constraints. Questions regarding personal matters, including those relating to employment, product or service issues or suggestions for product innovations may not be considered pertinent to meeting matters and therefore may not be answered. Any questions pertinent to meeting matters that cannot be answered during the meeting due to time constraints will be posted online and answered on the Investors section of our website at www.thehersheycompany.com. The questions and answers will be available as soon as practical after the Annual Meeting and will remain available for one week after posting.
Q: What is the difference between a registered stockholder and a stockholder who owns stock in street name?If you hold shares of Common Stock or Class B Common Stock directly in your name on the books of the Company’s transfer agent, you are a registered stockholder. If you own your Company shares indirectly through a broker, bank or other holder of record, then you are a beneficial owner and those shares are held in street name.
Q: What are the voting rights of each class of stock?Stockholders are entitled to cast one vote for each share of Common Stock held as of the Record Date and 10 votes for each share of Class B Common Stock held as of the Record Date. There are no cumulative voting rights.
Q: Can I vote my shares before the Annual Meeting?Yes. If you are a registered stockholder, there are three ways to vote your shares before the Annual Meeting:
:By internet (www.proxyvote.com) – Use the internet to transmit your voting instructions until 11:59 p.m. EDT on May 16, 2022. Have your Notice of Internet Availability of Proxy Materials or proxy card available and follow the instructions on the website to vote your shares.
)By telephone (800-690-6903) – Submit your vote by telephone until 11:59 p.m. EDT on May 16, 2022. Have your Notice of Internet Availability of Proxy Materials or proxy card available and follow the instructions provided by the recorded message to vote your shares.
,By mail – If you received a paper copy of the proxy materials, you can vote by mail by filling out the proxy card enclosed with those materials and returning it pursuant to the instructions set forth on the card. To be valid, proxy cards must be received before the start of the Annual Meeting.
If your shares are held in street name, your broker, bank or other holder of record may provide you with a Notice of Internet Availability of Proxy Materials that contains instructions on how to access our proxy materials and vote online or to request a paper or email copy of our proxy materials. If you received these materials in paper form, the materials included a voting instruction card so you can instruct your broker, bank or other holder of record how to vote your shares.
Please see the Notice of Internet Availability of Proxy Materials or the information your bank, broker or other holder of record provided you for more information on these voting options.
Q. Can I vote during the Annual Meeting instead of by proxy? If you are a registered stockholder, you can vote during the Annual Meeting any shares that were registered in your name as the stockholder of record as of the Record Date.
If your shares are held in street name, you can vote those shares during the Annual Meeting only if you have a legal proxy from the holder of record. If you plan to attend and vote your street-name shares during the Annual Meeting, you should request a legal proxy from your broker, bank or other holder of record.
8

To vote your shares during the Annual Meeting, log into www.virtualshareholdermeeting.com/HSY2022 and follow the voting instructions. You will need the 16-digit control number that is shown on your Notice of Internet Availability of Proxy Materials or on your proxy card. Shares may not be voted after the polls close.
Whether or not you plan to attend the Annual Meeting, we strongly encourage you to vote your shares by proxy prior to the Annual Meeting.
Q: Can I revoke my proxy or change my voting instructions once submitted?If you are a registered stockholder, you can revoke your proxy and change your vote prior to the Annual Meeting by:• Sending a written notice of revocation to our Secretary at 19 East Chocolate Avenue, Hershey, Pennsylvania
17033 (the notification must be received by the close of business on May 12, 2022);• Voting again by internet or telephone prior to 11:59 p.m. EDT on May 16, 2022 (only the latest vote you submit
will be counted); or• Submitting a new properly signed and dated paper proxy card with a later date (your proxy card must be received
before the start of the Annual Meeting).
If your shares are held in street name, you should contact your broker, bank or other holder of record about revoking your voting instructions and changing your vote prior to the Annual Meeting.
If you are eligible to vote during the Annual Meeting, you also can revoke your proxy or voting instructions and change your vote during the Annual Meeting by logging into www.virtualshareholdermeeting.com/HSY2022 and following the voting instructions.
Q: What will happen if I submit my proxy but do not vote on a proposal?If you submit a valid proxy but fail to provide instructions on how you want your shares to be voted, your proxy will be voted in the manner recommended by the Board on all matters presented in this Proxy Statement, which is as follows:
• “FOR” the election of all director nominees;
• “FOR” the ratification of the appointment of Ernst & Young LLP as our independent auditors; • “FOR” the approval of the compensation of the Company’s named executive officers; and• “AGAINST” the stockholder proposal set forth in this Proxy Statement (if such stockholder proposal is properly
presented at the Annual Meeting).
If any other item is properly presented for a vote at the Annual Meeting, the shares represented by your properly submitted proxy will be voted at the discretion of the proxies.
Q: What will happen if I neither submit my proxy nor vote my shares during the Annual Meeting?If you are a registered stockholder, your shares will not be voted.
If your shares are held in street name, your broker, bank or other holder of record may vote your shares on certain “routine” matters. The ratification of independent auditors is currently considered to be a routine matter. On this matter, your broker, bank or other holder of record can:
• Vote your street-name shares even though you have not provided voting instructions; or• Choose not to vote your shares.
The other matters you are being asked to vote on are not routine and cannot be voted by your broker, bank or other holder of record without your instructions. When a broker, bank or other holder of record is unable to vote shares for this reason, it is called a “broker non-vote.”
Q: How do I vote my shares in the Company’s Automatic Dividend Reinvestment Service Plan?Computershare, our transfer agent, has arranged for any shares that you hold in the Automatic Dividend Reinvestment Service Plan to be included in the total registered shares of Common Stock shown on the Notice of Internet Availability of Proxy Materials or proxy card we have provided you. By voting these shares, you also will be voting your shares in the Automatic Dividend Reinvestment Service Plan.
9
Q: What does it mean if I received more than one Notice of Internet Availability of Proxy Materials or proxy card?You probably have multiple accounts with us and/or brokers, banks or other holders of record. You should vote all of the shares represented by these Notices/proxy cards. Certain brokers, banks and other holders of record have procedures in place to discontinue duplicate mailings upon a stockholder’s request. You should contact your broker, bank or other holder of record for more information. Additionally, Computershare can assist you if you want to consolidate multiple registered accounts existing in your name. To contact Computershare, visit their website at www.computershare.com/investor; or write to P.O. Box 505000, Louisville, KY 40233-5000; or for overnight delivery, to Computershare, 462 South 4th Street, Suite 1600, Louisville, KY 40202; or call:
• (800) 851-4216 Domestic Holders• (201) 680-6578 Foreign Holders• (800) 952-9245 Domestic TDD line for hearing impaired• (312) 588-4110 Foreign TDD line for hearing impaired
Q: How many shares must be present to conduct business during the Annual Meeting?To carry on the business of the Annual Meeting, a minimum number of shares, constituting a quorum, must be present, either electronically or by proxy.
On most matters, the votes of the holders of the Common Stock and Class B Common Stock are counted together. However, there are some matters that must be voted on only by the holders of one class of stock. We will have a quorum for all matters to be voted on during the Annual Meeting if the following number of votes is present, electronically or by proxy:
• For any matter requiring the vote of the Common Stock voting separately: a majority of the votes of the Common Stock outstanding on the Record Date.
• For any matter requiring the vote of the Class B Common Stock voting separately: a majority of the votes of the Class B Common Stock outstanding on the Record Date.
• For any matter requiring the vote of the Common Stock and Class B Common Stock voting together without regard to class: a majority of the votes of the Common Stock and Class B Common Stock outstanding on the Record Date.
It is possible that we could have a quorum for certain items of business to be voted on during the Annual Meeting and not have a quorum for other matters. If that occurs, we will proceed with a vote only on the matters for which a quorum is present.
Q: What vote is required to approve each proposal?Assuming that a quorum is present:
• Proposal No. 1: Election of Directors – the two nominees to be elected by holders of our Common Stock voting separately as a class who receive the greatest number of votes cast “FOR,” and the 10 nominees to be elected by holders of our Common Stock and Class B Common Stock (voting together as a class) who receive the greatest number of votes cast “FOR,” will be elected as directors.
• Proposal No. 2: Ratification of the Appointment of Ernst & Young LLP as Independent Auditors – the affirmative vote of at least a majority of the votes of the Common Stock and Class B Common Stock (voting together as a class) represented at the Annual Meeting.
• Proposal No. 3: Advise on Named Executive Officer Compensation – the affirmative vote of at least a majority of the votes of the Common Stock and Class B Common Stock (voting together as a class) represented at the Annual Meeting.
• Proposal No. 4: Stockholder Proposal – the affirmative vote of at least a majority of the votes of the Common Stock and Class B Common Stock (voting together as a class) represented at the Annual Meeting.
10
Q: Are abstentions and broker non-votes counted in the vote totals?Abstentions are counted as being present and entitled to vote in determining whether a quorum is present. Shares as to which broker non-votes exist will be counted as present and entitled to vote in determining whether a quorum is present for any matter requiring the vote of the Common Stock and Class B Common Stock voting together as a class, but they will not be counted as present and entitled to vote in determining whether a quorum is present for any matter requiring the vote of the Common Stock or Class B Common Stock voting separately as a class.
If you mark or vote “abstain” on Proposal Nos. 2-4, the abstention will have the effect of being counted as a vote “AGAINST” the proposal. Broker non-votes with respect to Proposal Nos. 1-4 are not included in vote totals and will not affect the outcome of the vote on those proposals.
Q. Who will pay the cost of soliciting votes for the Annual Meeting?We will pay the cost of preparing, assembling and furnishing proxy solicitation and other required Annual Meeting materials. We do not use a third-party solicitor. It is possible that our directors, officers and employees might solicit proxies by mail, telephone, telefax, electronically over the internet or by personal contact, without receiving additional compensation. We will reimburse brokers, banks and other nominees, fiduciaries and custodians who nominally hold shares of our stock as of the Record Date for the reasonable costs they incur furnishing proxy solicitation and other required Annual Meeting materials to street-name holders who beneficially own those shares on the Record Date.
11
THE HERSHEY COMPANY PURPOSE AND VALUES
Milton Hershey founded The Hershey Company over 125 years ago with the intention of making quality chocolate affordable to everyone and to make more moments of goodness in people’s lives. While times have changed and Hershey’s beloved snacking brands continue to thrive and grow, our purpose remains the same: to Make More Moments of Goodness for our consumers today and for many generations to come. Our decisions regarding business strategy, operations and resource allocation are guided by this purpose and are rooted in our values of Togetherness, Integrity, Making a Difference and Excellence, consistent with our focus on creating value for all of our stakeholders over the long term.
Code of Conduct The Board has adopted a Code of Conduct that applies to our directors, officers and employees worldwide. Adherence to this Code of Conduct assures that our directors, officers and employees are held to the highest standards of integrity. The Code of Conduct covers areas such as conflicts of interest, insider trading and compliance with laws and regulations. The Audit Committee oversees the Company’s communication of, and compliance with, the Code of Conduct. The Code of Conduct, including amendments thereto or waivers granted to a director or officer, if any, can be viewed on the Investors section of our website at www.thehersheycompany.com.
Our Shared Goodness Promise Integral to Making More Moments of Goodness is our holistic environmental, social and governance (“ESG”) strategy, our Shared Goodness Promise, which guides how we empower the remarkable people who make and sell our brands; interact with farming communities that grow our ingredients; deliver on our commitments to consumers, customers and external stakeholders; and help protect the environment and support children and youth. We are committed to operating our business with all stakeholders in mind and with a view toward long-term sustainability and value creation, even as our business and society face a variety of existing and emerging challenges. We leverage our expertise, along with external partners, to help address these challenges and opportunities so that we can continue to delight consumers and help make a positive impact in the world today and into the future.
We believe in doing well by doing good and acting with transparency to inform consumers, shareholders, partners and other stakeholders on progress toward our ESG goals. Hershey has published sustainability reports since 2010, and over the past few years, has added several new ESG reporting frameworks to our suite of disclosures for even greater transparency. These reports, along with our various ESG policies, can be found on the Sustainability section of our website at www.thehersheycompany.com.
Board Oversight of ESGManaging ESG and sustainability initiatives at Hershey and operating with integrity are key drivers for how we build trust with our consumers and make a positive impact in our society. Our ESG and sustainability governance model includes a multi-level operating structure to ensure we are aligned on the most important issues facing the Company and allocating the right resources to drive progress within our Shared Goodness Promise.
In 2021, to better reflect our focus on corporate responsibility and sustainability at the Board level, we updated our Corporate Governance Guidelines to clarify the Board’s role in overseeing all ESG matters, including our ESG strategies, priorities, progress, risks and opportunities. In addition, we expanded our Governance Committee charter to include responsibility for overseeing Board governance of our ESG policies and programs, and all of our Board committee charters were enhanced to include oversight of each committee’s relevant ESG responsibilities and reporting requirements. Accountability for managing ESG and sustainability at the management level resides with our Vice President of Global Sustainability and Corporate Communications, who reports to our Chief Supply Chain Officer.
12
Board of Directors
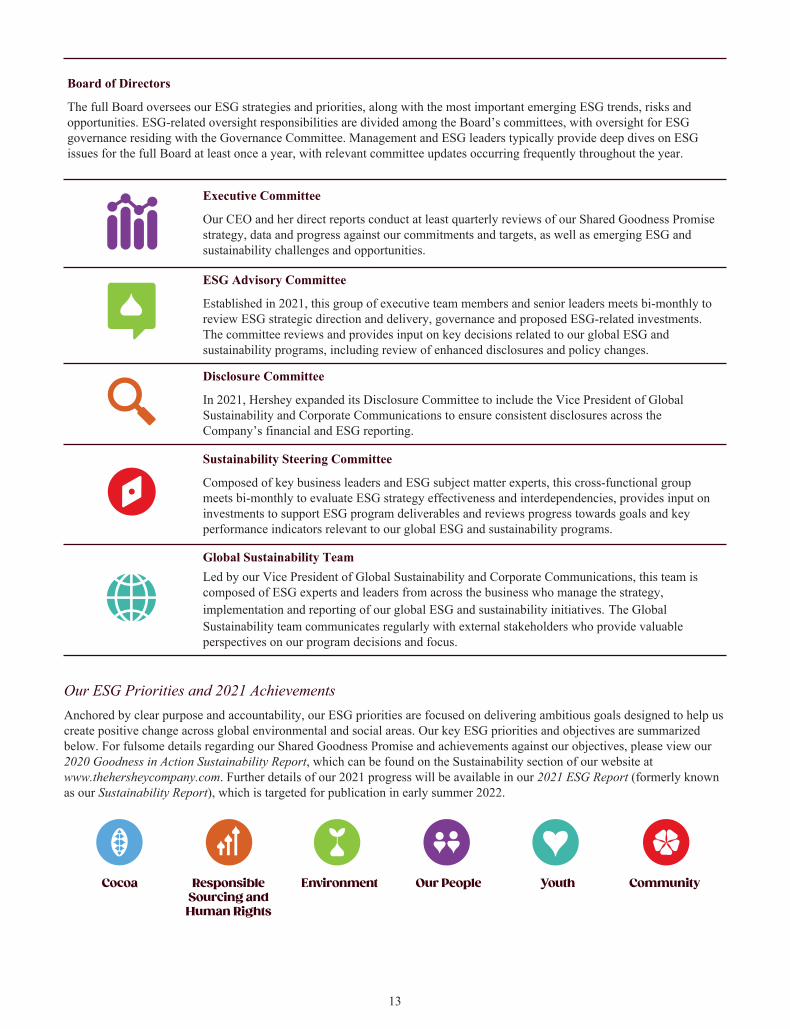
The full Board oversees our ESG strategies and priorities, along with the most important emerging ESG trends, risks and opportunities. ESG-related oversight responsibilities are divided among the Board’s committees, with oversight for ESG governance residing with the Governance Committee. Management and ESG leaders typically provide deep dives on ESG issues for the full Board at least once a year, with relevant committee updates occurring frequently throughout the year.
Executive Committee
Our CEO and her direct reports conduct at least quarterly reviews of our Shared Goodness Promise strategy, data and progress against our commitments and targets, as well as emerging ESG and sustainability challenges and opportunities.
ESG Advisory Committee
Established in 2021, this group of executive team members and senior leaders meets bi-monthly to review ESG strategic direction and delivery, governance and proposed ESG-related investments. The committee reviews and provides input on key decisions related to our global ESG and sustainability programs, including review of enhanced disclosures and policy changes.
Disclosure Committee
In 2021, Hershey expanded its Disclosure Committee to include the Vice President of Global Sustainability and Corporate Communications to ensure consistent disclosures across the Company’s financial and ESG reporting.
Sustainability Steering Committee
Composed of key business leaders and ESG subject matter experts, this cross-functional group meets bi-monthly to evaluate ESG strategy effectiveness and interdependencies, provides input on investments to support ESG program deliverables and reviews progress towards goals and key performance indicators relevant to our global ESG and sustainability programs.
Global Sustainability Team Led by our Vice President of Global Sustainability and Corporate Communications, this team is composed of ESG experts and leaders from across the business who manage the strategy, implementation and reporting of our global ESG and sustainability initiatives. The Global Sustainability team communicates regularly with external stakeholders who provide valuable perspectives on our program decisions and focus.
Our ESG Priorities and 2021 AchievementsAnchored by clear purpose and accountability, our ESG priorities are focused on delivering ambitious goals designed to help us create positive change across global environmental and social areas. Our key ESG priorities and objectives are summarized below. For fulsome details regarding our Shared Goodness Promise and achievements against our objectives, please view our 2020 Goodness in Action Sustainability Report, which can be found on the Sustainability section of our website at www.thehersheycompany.com. Further details of our 2021 progress will be available in our 2021 ESG Report (formerly known as our Sustainability Report), which is targeted for publication in early summer 2022.
13
Cocoa
Our Cocoa For Good strategy, underpinned by a 10-year, $500 million investment, exemplifies Hershey’s commitment to actively drive transformation to a more resilient and sustainable cocoa supply chain. As we deliver on our cocoa commitments, we continue to evolve our ways of working, improve transparency for our key stakeholders, and provide more robust assurances about our products.
Cocoa For Good, our global responsible cocoa strategy, seeks to create the best outcomes for farmers, their families and communities throughout our supply chain. Key objectives include:
• Improving farmer incomes and livelihoods;• Eliminating child labor and improving children’s nutrition; and • Protecting the environment.
By 2025, we aim to achieve 100% sourcing visibility in Côte d’Ivoire and Ghana by requiring that 100% of farmers producing Hershey’s cocoa volume in these countries are:
• Polygon mapped by our suppliers to improve traceability and monitor deforestation; and • Covered by Child Labor Monitoring and Remediation Systems (“CLMRS”) to prevent, monitor and remediate child
labor.
By 2025, Hershey seeks to achieve 100% sourcing visibility of the cocoa purchased from farmer groups and farmers participating in our Cocoa For Good strategy in Côte d’Ivoire and Ghana, which together supply a significant amount of the cocoa we purchase worldwide. Clear visibility into how and under what conditions the cocoa we source is grown and cultivated enables us to implement programs that focus on helping to improve farmer incomes, end child labor and protect the environment. Understanding the origin of cocoa is essential to ensure that it meets our human rights and environmental requirements.
CLMRS is the leading method of detection and remediation of child labor amongst children aged 5-17 and was developed through the International Cocoa Initiative. We expect the expansion of CLMRS to cover 125,000 children by 2025, which would be a 350% increase from 2018 in the number of children being supported by our CLMRS system. As of 2021, Hershey’s CLMRS found no evidence of forced child labor in our programs in Côte d’Ivoire and Ghana. More information on the results of our CLMRS program can be found on the Sustainability section of our website at www.thehersheycompany.com.
Responsible Sourcing and Human Rights
As a snacking powerhouse, we are committed to growing sustainably and acting responsibly at each phase of our value chain. From protecting and respecting human rights in a complex supply chain to upholding high food safety standards and championing consumer choice and transparency, Milton Hershey’s legacy to always do the right thing remains as deeply embedded in our culture now as it was when our Company was founded.
By 2025, we aim to achieve:
• 100% of priority ingredients and materials to be responsibly and sustainably sourced; and• 85% of in scope supplier sites meet Hershey’s Responsible Sourcing Supplier Program requirements.
In 2021, we strengthened our responsible sourcing programs for dairy, sugar and palm oil, including going beyond certification to include industry partnerships, on the ground transformation projects, and new frameworks for monitoring and verification.
We also made significant progress implementing our Responsible Sourcing Supplier Program, which is how we verify suppliers’ compliance with our Supplier Code of Conduct. By the end of 2021, we achieved our goal to enroll 100% of high-risk suppliers in the program. Finally, we piloted new forms of worker-centric due diligence, including on-site and technology-enabled worker voice surveys in our India and Malaysia plants.
Environment
Our products put smiles on our consumers’ faces every day. These products are made with raw ingredients and materials grown all over the world. Climate change, natural resource scarcity and extreme weather all pose risks to the snacks our consumers love as well as to the farmers and local communities we rely on. Specifically, climate change and deforestation often negatively impact the world’s most vulnerable first, making these important environmental issues into human rights issues as well. Given the significance of these risks and opportunities, we have put in place new targets on climate and packaging. These bold steps will help ensure the long-term sustainability of our planet, people and business and are aligned with reduction requirements to keep warming to 1.5°C globally.
14

15
By 2030, we aim to achieve:
• 50% absolute reduction in Scope 1 and 2 greenhouse gas (“GHG”) emissions against a 2018 baseline;• 25% absolute reduction in Scope 3 GHG emissions against a 2018 baseline;• 100% of plastic packaging to be recyclable, reusable or compostable; and• 25 million pounds of packaging to be eliminated.
In March 2021, we announced a new science-based GHG-reduction goal to cut our absolute Scope 1 and 2 emissions by more than 50% and our absolute Scope 3 emissions by 25% by 2030 compared to a 2018 baseline. Our emissions-reduction targets have been approved by the Science Based Targets initiative as consistent with levels required to meet the highest goals of the Paris Climate Agreement. The targets covering emissions from our operations are aligned with reduction requirements to keep warming to 1.5°C globally.
Additionally, in 2021, we made substantial progress towards our Scope 1 and 2 emissions target through signing power purchase agreements, improvements in energy efficiency, and renewable energy credits from our first solar project. In addition, we are continuing efforts to reduce value chain emissions (Scope 3) by advancing sustainable packaging solutions and working to eliminate deforestation from our ingredient supply chains by 2030.
Our previous goal to eliminate 25 million pounds of packaging by 2025 was achieved five years ahead of schedule in 2020. We have since expanded our commitment to eliminate an additional 25 million pounds of packaging by 2030. In addition, we committed to eliminating hard-to-recycle PVC by the end of 2022 and ensuring 100% of our plastic packaging is recyclable, reusable or compostable by 2030.
Our People
The remarkable and diverse people employed by Hershey, and the individuals who work along our value chain, are our most important assets. Without them, we would not be able to fulfill our purpose to Make More Moments of Goodness.
By 2025, we aim to achieve:
• Achieve pay equity for similar job categories across our global salaried employees;
• 47-50% women representation across all employees globally and 30-40% people of color (“POC”) representation across U.S. employees; and
• 50% hazard reduction for job functions with ergonomic risks through process improvements.
In 2021, we intensified our diversity, equity and inclusion (“DEI”) priorities and continued to make progress on The Pathways Project, our five-year plan to make our workplace and communities even more inclusive. The physical, emotional and financial well-being of our employees is paramount and was especially important during 2021. This year, as in 2020, we saw amazing progress and improvements in our culture around resiliency, agility, flexibility and speed of decision-making. We also continued to drive progress on DEI, including being named by Forbes as the World’s Most Female-Friendly Company in 2021. Additionally, in 2021, Hershey was named the #10 Top Company for Diversity by DiversityInc. We still have more work to do to improve and grow, and our employees are co-creating the way forward.
Under our first female Chairman of the Board and CEO, Michele Buck:
• Women today make up 42% of our Board;
• In 2020, we achieved 1:1 aggregate gender pay equity for salaried employees in the United States (excluding recentacquisitions); and
• In 2021, we achieved 1:1 aggregate POC pay equity for salaried employees in the United States (excluding recentacquisitions).
As part of our DEI evolution, we are increasing transparency related to our goals, strategies, and outcomes. Our 2021 ESG Report will feature first time reporting on representative EEO-1 U.S. gender and U.S. POC workforce data, which will include the following information based on employees’ self-identification in the Company’s data system as of December 31, 2021, excluding recent acquisitions:
• Executives and senior leaders: 32.2% female and 17.3% POC;
• Entry-level professional employees: 46.5% female and 18.0% POC;
• Sales employees: 48.1% female and 14.6% POC; and
• Hourly manufacturing employees: 35.0% female and 30.5% POC.
Supporting Children and Youth
From the moment Milton Hershey founded a school for orphans in 1909, Hershey has continued his legacy of helping children succeed and reach their full potential. Today, we support access to education, nutrition and well-being for children around the world by:
• Equipping children with the social and emotional skills they need to build meaningful connections with one another and their communities;
• Using our expertise as a snacking company to provide snacks that offer basic nutrition for children; and• Supporting the mission of Milton Hershey School through our business model and our employee engagement
programs.
By 2025, we aim to achieve:
• 50 million children globally supported through education, nutrition, social and emotional well-being; and • 100,000 children take Heartwarming actions and impact their communities.
We have continued our efforts to support youth well-being through The Heartwarming Project, which supports organizations that advance social emotional learning, connection and inclusion for youth. In 2021, the Heartwarming Project Action Grants program awarded 500 Action Grants to teens leading projects on connection, inclusion and well-being in their schools and communities. We also sponsored 140 “Heartwarming Young Heroes” grants for kids’ service projects during Global Youth Service Day and established a Heartwarming Project Youth Advisory Board comprised of 15 Gen Z youth who advise the Company on its investments supporting children and youth.
Improving Communities
At Hershey, we are all bearers of the legacy of kindness, support and engagement that Milton Hershey has left us, especially in a year as challenging as 2021. Hershey has a long tradition of putting people first—from creating a town where our employees and their families could thrive to our long-standing partnerships that keep families fed and lend a hand during hard times. We provide both philanthropic contributions and product donations to nonprofit organizations in communities where we have a presence.
By 2025, we aim to achieve:
• $105 million donated in cash and products to community partners focused on education, community economic development, inclusive communities and health and human services where we live and work.
In 2021, we continued our COVID relief efforts, maintaining our mask donations through the end of the 2020-2021 school year. In the fall of 2021 during the rise of the Delta variant we provided more than 575,000 masks to school districts and nonprofit organizations. We also provided product donations to boost the morale of health care workers at vaccination clinics in Central Pennsylvania and Memphis, Tennessee, and donated critically needed supplies in areas facing surges, such as oxygen in India, food relief in Brazil and temperature scanners in Puerto Rico.
16
CORPORATE GOVERNANCE
Our Board of Directors believes that the purpose of corporate governance is to facilitate effective oversight and management of the Company to create long-term stockholder value in a manner consistent with our purpose, values, Code of Conduct, stakeholder considerations and all applicable legal requirements. We have a long-standing commitment to good corporate governance practices. Our corporate governance policies and other documents establish the high standards of professional and personal conduct we expect of our Board, members of senior management and all employees, and promote compliance with various financial, ethical, legal and other obligations and responsibilities.
Our Board provides accountability, objectivity, perspective, judgment, and, in many cases, specific industry knowledge or experience. The Board is deeply involved in the Company’s strategic planning process and plays an important oversight role in the Company’s leadership development, succession planning and risk management processes. Although the Board does not have responsibility for day-to-day management of the Company, Board members stay informed about the Company’s business through regular meetings, site visits and other periodic interactions with management.
The business activities of the Company are carried out by our employees under the direction and supervision of our CEO. In overseeing these activities, each director is required to use his or her business judgment in the best interests of the Company. The Board’s responsibilities include:
• Reviewing the Company’s performance, strategies and major decisions;• Overseeing the Company’s compliance with legal and regulatory requirements and the integrity of its financial
statements;• Overseeing the Company’s policies and practices for identifying, managing and mitigating key enterprise risks;• Overseeing ESG matters, including the Company’s ESG strategies, policies, progress, risks and opportunities; • Overseeing management, including reviewing the CEO’s performance and succession planning for key management
roles; and• Overseeing executive and director compensation and our compensation programs and policies.
Corporate Governance Guidelines The Board has adopted Corporate Governance Guidelines that, along with the charters of the Board committees, provide the basic framework for the Board’s operation and role in the governance of the Company. The guidelines include the Board’s policies regarding director independence, qualifications and responsibilities, access to management and outside advisors, compensation, continuing education, oversight of management succession and stockholding requirements. They also provide a process for directors to annually evaluate the performance of the Board.
The Governance Committee is responsible for overseeing and reviewing the Board’s Corporate Governance Guidelines at least annually and recommending any proposed changes to the Board for approval. The Corporate Governance Guidelines are available on the Investors section of our website at www.thehersheycompany.com.
Board Composition and Criteria for Board Membership
Board Composition The Board currently comprises 12 members, each serving a one-year term that expires at the Annual Meeting. Eleven of the 12 director nominees are considered independent under the New York Stock Exchange (“NYSE”) Rules (“NYSE Rules”) and the Board’s Corporate Governance Guidelines.
Criteria for Board Membership – Experiences, Skills and QualificationsThe Governance Committee works with the Board to determine the appropriate skills, experiences and attributes that should be possessed by the Board as a whole as well as its individual members. While the Governance Committee has not established minimum criteria for director candidates, in general, the Board seeks individuals with skills and backgrounds that will complement those of other directors and maximize the diversity and effectiveness of the Board as a whole. The Board also seeks individuals who bring unique and varied perspectives and life experiences to the Board. As such, the Governance Committee assists the Board by recommending prospective director candidates who will enhance the overall diversity of the Board. The Board views diversity broadly, taking into consideration the age, professional experience, race, education, gender and other attributes of its members.
17
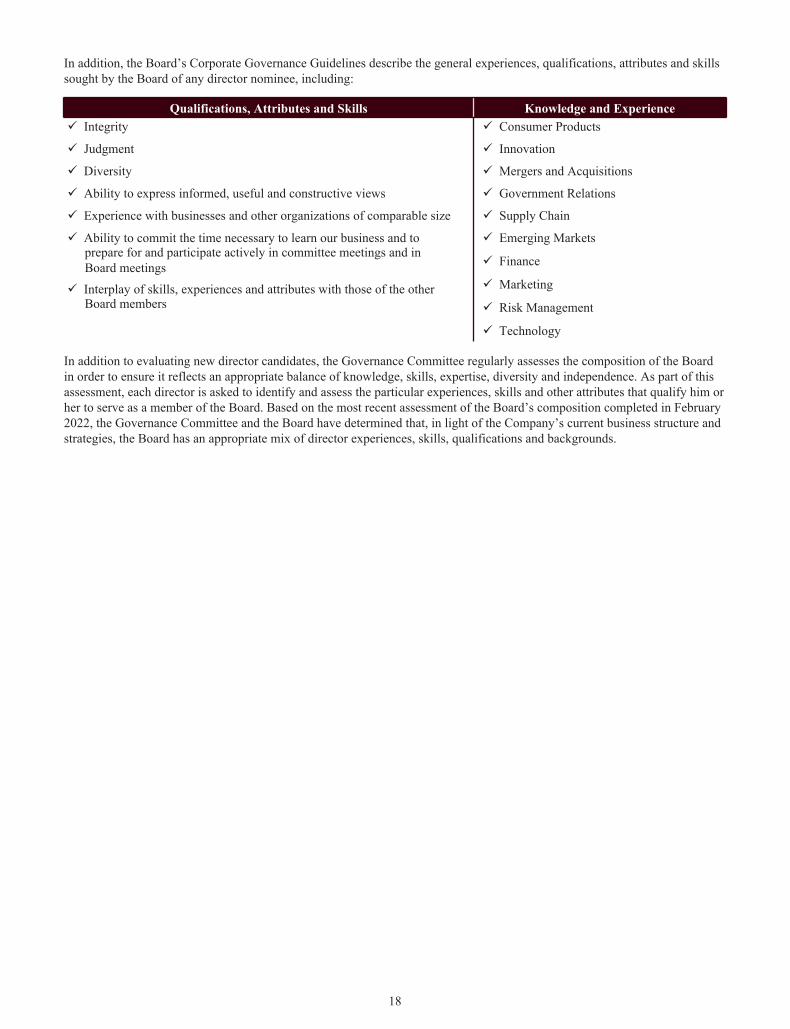
In addition, the Board’s Corporate Governance Guidelines describe the general experiences, qualifications, attributes and skills sought by the Board of any director nominee, including:
Qualifications, Attributes and Skills Knowledge and Experienceü Integrity ü Consumer Products
ü Judgment ü Innovation
ü Diversity ü Mergers and Acquisitions
ü Ability to express informed, useful and constructive views ü Government Relations
ü Experience with businesses and other organizations of comparable size ü Supply Chain
ü Ability to commit the time necessary to learn our business and toprepare for and participate actively in committee meetings and in Board meetings
ü Emerging Markets
ü Finance
ü Marketing
ü Risk Management
ü Technology
ü Interplay of skills, experiences and attributes with those of the other Board members
In addition to evaluating new director candidates, the Governance Committee regularly assesses the composition of the Board in order to ensure it reflects an appropriate balance of knowledge, skills, expertise, diversity and independence. As part of this assessment, each director is asked to identify and assess the particular experiences, skills and other attributes that qualify him or her to serve as a member of the Board. Based on the most recent assessment of the Board’s composition completed in February 2022, the Governance Committee and the Board have determined that, in light of the Company’s current business structure and strategies, the Board has an appropriate mix of director experiences, skills, qualifications and backgrounds.
18
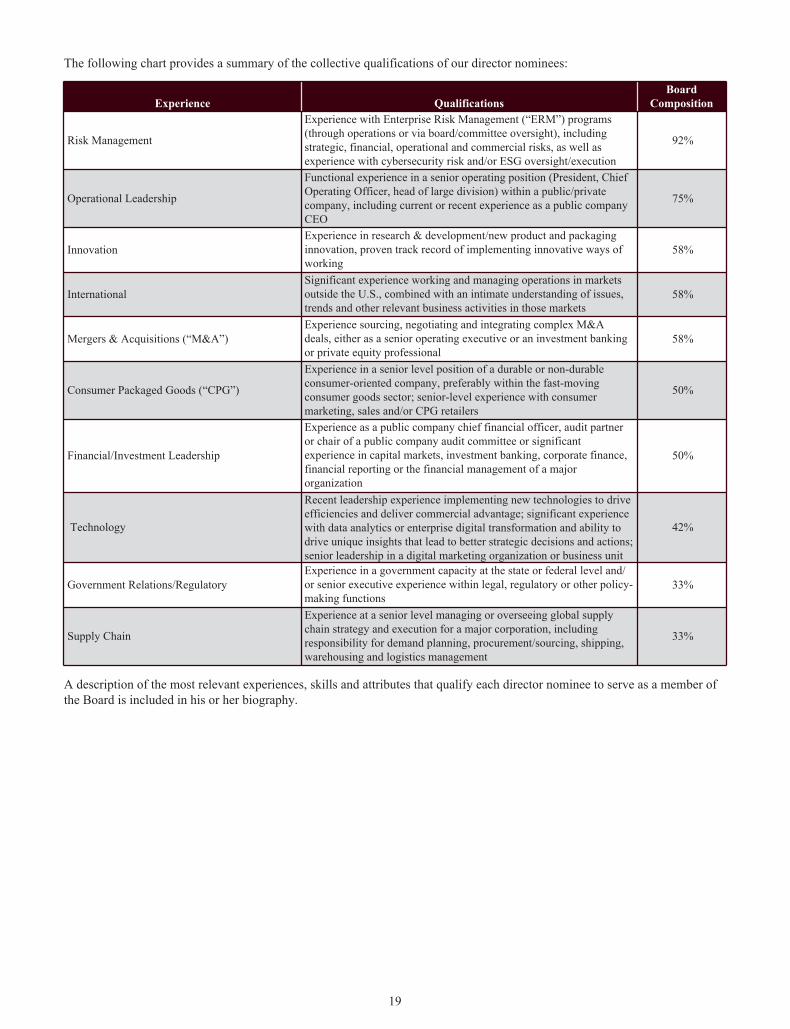
The following chart provides a summary of the collective qualifications of our director nominees:
Experience QualificationsBoard
Composition
Risk Management
Experience with Enterprise Risk Management (“ERM”) programs (through operations or via board/committee oversight), including strategic, financial, operational and commercial risks, as well as experience with cybersecurity risk and/or ESG oversight/execution
92%
Operational Leadership
Functional experience in a senior operating position (President, Chief Operating Officer, head of large division) within a public/private company, including current or recent experience as a public company CEO
75%
Innovation Experience in research & development/new product and packaging innovation, proven track record of implementing innovative ways of working
58%
International Significant experience working and managing operations in markets outside the U.S., combined with an intimate understanding of issues, trends and other relevant business activities in those markets
58%
Mergers & Acquisitions (“M&A”)Experience sourcing, negotiating and integrating complex M&A deals, either as a senior operating executive or an investment banking or private equity professional
58%
Consumer Packaged Goods (“CPG”)
Experience in a senior level position of a durable or non-durable consumer-oriented company, preferably within the fast-moving consumer goods sector; senior-level experience with consumer marketing, sales and/or CPG retailers
50%
Financial/Investment Leadership
Experience as a public company chief financial officer, audit partner or chair of a public company audit committee or significant experience in capital markets, investment banking, corporate finance, financial reporting or the financial management of a major organization
50%
Technology
Recent leadership experience implementing new technologies to drive efficiencies and deliver commercial advantage; significant experience with data analytics or enterprise digital transformation and ability to drive unique insights that lead to better strategic decisions and actions; senior leadership in a digital marketing organization or business unit
42%
Government Relations/RegulatoryExperience in a government capacity at the state or federal level and/or senior executive experience within legal, regulatory or other policy-making functions
33%
Supply Chain
Experience at a senior level managing or overseeing global supply chain strategy and execution for a major corporation, including responsibility for demand planning, procurement/sourcing, shipping, warehousing and logistics management
33%
A description of the most relevant experiences, skills and attributes that qualify each director nominee to serve as a member of the Board is included in his or her biography.
19

Ms. Buck currently serves as our Chairman of the Board, President and CEO. The Board believes that combining the roles of Chairman of the Board and CEO under Ms. Buck’s leadership, paired with a strong Lead Independent Director, is in the best interests of the Company and its stockholders at this time for several reasons:
• Ms. Buck has served as the Company’s CEO and a member of the Board for more than five years. During that time, she has fostered a strong working relationship between the Board and management and has cultivated a high level of trust with the Board. She also has a deep understanding of Board governance and operations through her service as Lead Director of New York Life Insurance Company.
• Having served as an executive in numerous positions with the Company for more than 17 years, Ms. Buck has an unparalleled knowledge of the Company and its products, which the Board believes puts her in the best position to lead the Board through the strategic business issues facing the Company. During her tenure as CEO, Ms. Buck has proven her ability to drive business strategy and operational excellence. The Board believes that having Ms. Buck leverage these skills as Chairman of the Board provides the Company with a significant competitive advantage in the current marketplace.
The Board also recognizes the importance of strong independent Board leadership. For that reason, effective in May 2020, the Board elected Anthony J. Palmer to serve as Lead Independent Director. The Board has determined that Mr. Palmer is an independent member of the Board under the NYSE Rules and the Company’s Corporate Governance Guidelines.
Under the terms of the Board’s Corporate Governance Guidelines, the Lead Independent Director’s responsibilities include the following:
• In the absence of the Chairman of the Board, presiding at all Board and stockholder meetings;• Calling meetings of the independent directors of the Board, in addition to the executive sessions of independent
directors held after each Board meeting;• Presiding at all executive sessions and other meetings of the independent directors of the Board;• Communicating with the independent directors of the Board between meetings as necessary or appropriate;• Serving as a liaison between the Chairman of the Board and the independent directors, ensuring independent director
consensus is communicated to the Chairman of the Board, and communicating the results of meetings of the independent directors to the Chairman of the Board and other members of management, as appropriate;
• In coordination with the CEO, approving Board meeting agendas and schedules to assure there is sufficient time for discussion of all agenda items;
• Approving Board meeting materials and other information sent to the Board;• Evaluating the quality and timeliness of information sent to the Board by the CEO and other members of management;• Assisting the Chairman of the Board and the Chair of the Governance Committee in implementing and overseeing the
Board succession planning process;• Assisting the Chairman of the Board with crisis management matters;• Overseeing the evaluation of the CEO;• Assisting the chair of the Governance Committee with Board and individual director evaluations; and• Being available for consultation and direct communication at the request of major stockholders.
20
Leadership Structure The Company’s governance documents provide the Board with flexibility to select the leadership structure that is most appropriate for the Company and its stockholders. The Board regularly evaluates its governance structure and has concluded that the Company and its stockholders are best served by not having a formal policy regarding whether the same individual should serve as both Chairman of the Board and CEO. This approach allows the Board to exercise its business judgment in determining the most appropriate leadership structure in light of the current facts and circumstances facing the Company, including the composition and tenure of the Board, the tenure of the CEO, the strength of the Company’s management team, the Company’s recent financial performance, the Company’s current strategic plan and the current economic environment, among other factors.
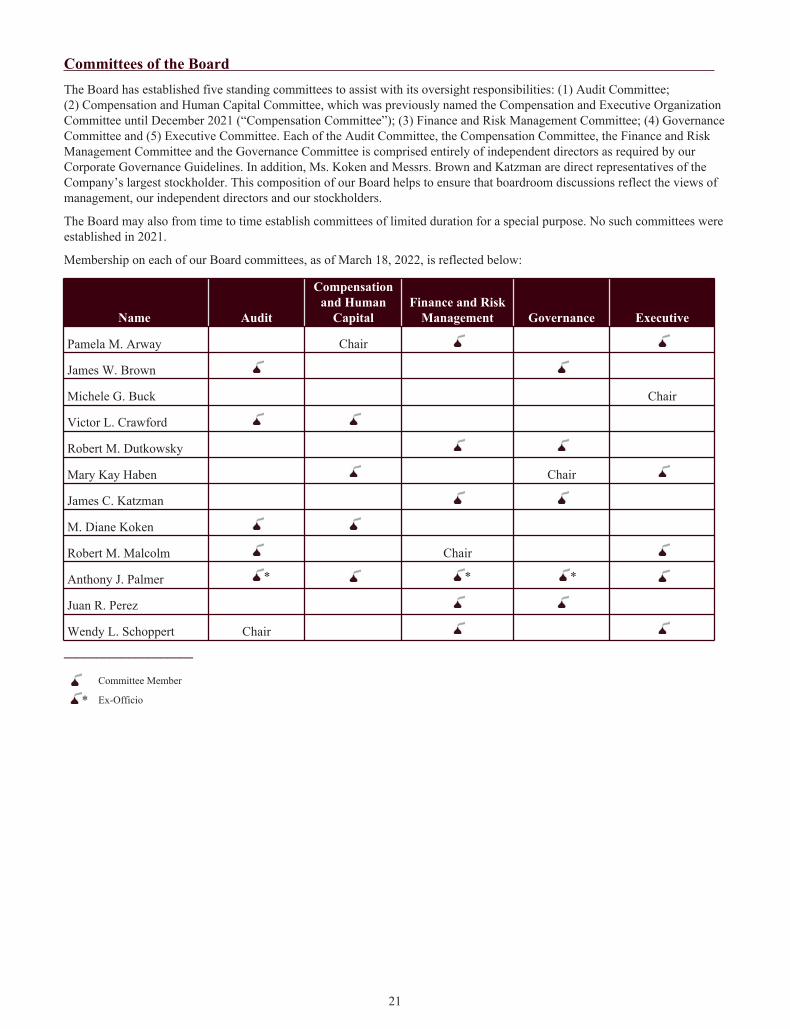
Committees of the Board The Board has established five standing committees to assist with its oversight responsibilities: (1) Audit Committee; (2) Compensation and Human Capital Committee, which was previously named the Compensation and Executive Organization Committee until December 2021 (“Compensation Committee”); (3) Finance and Risk Management Committee; (4) Governance Committee and (5) Executive Committee. Each of the Audit Committee, the Compensation Committee, the Finance and Risk Management Committee and the Governance Committee is comprised entirely of independent directors as required by our Corporate Governance Guidelines. In addition, Ms. Koken and Messrs. Brown and Katzman are direct representatives of the Company’s largest stockholder. This composition of our Board helps to ensure that boardroom discussions reflect the views of management, our independent directors and our stockholders.
The Board may also from time to time establish committees of limited duration for a special purpose. No such committees were established in 2021.
Membership on each of our Board committees, as of March 18, 2022, is reflected below:
Name Audit
Compensation and Human
CapitalFinance and Risk
Management Governance Executive
Pamela M. Arway
Chair
James W. Brown
Michele G. Buck Chair
Victor L. Crawford
Robert M. Dutkowsky
Mary Kay Haben
Chair
James C. Katzman
M. Diane Koken
Robert M. Malcolm
Chair
Anthony J. Palmer
*
* *
Juan R. Perez
Wendy L. Schoppert Chair
____________________
Committee Member
* Ex-Officio
21
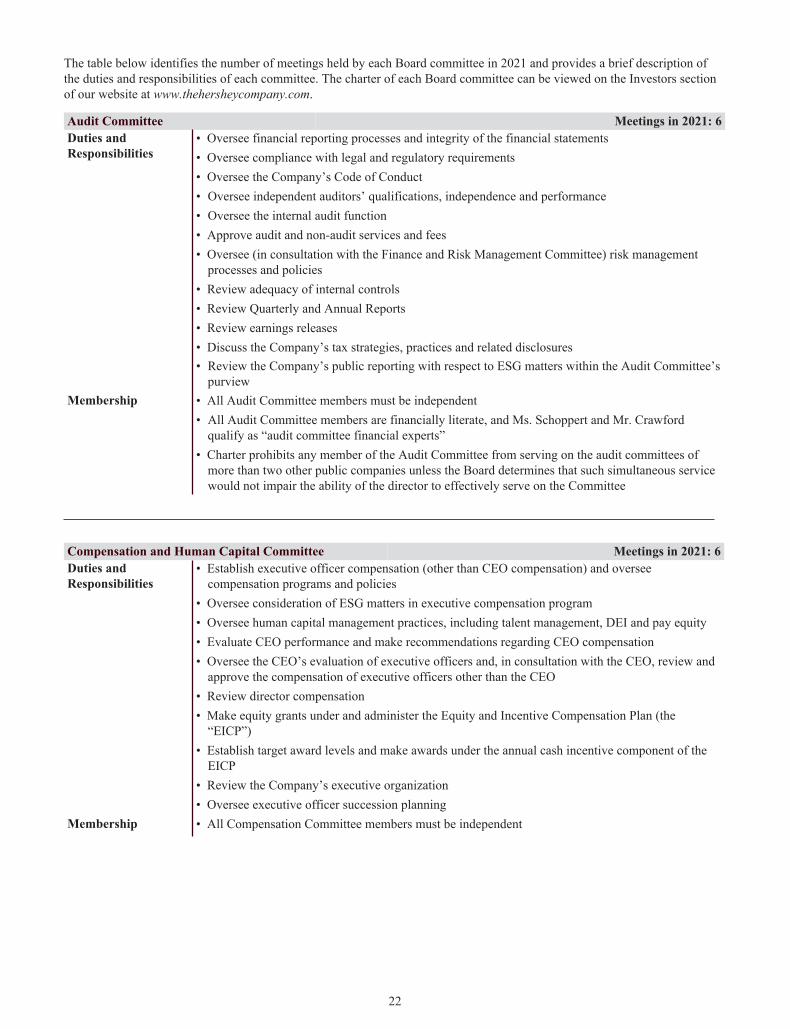
The table below identifies the number of meetings held by each Board committee in 2021 and provides a brief description of the duties and responsibilities of each committee. The charter of each Board committee can be viewed on the Investors section of our website at www.thehersheycompany.com.
Audit Committee Meetings in 2021: 6Duties and Responsibilities
• Oversee financial reporting processes and integrity of the financial statements• Oversee compliance with legal and regulatory requirements• Oversee the Company’s Code of Conduct• Oversee independent auditors’ qualifications, independence and performance• Oversee the internal audit function• Approve audit and non-audit services and fees• Oversee (in consultation with the Finance and Risk Management Committee) risk management
processes and policies• Review adequacy of internal controls• Review Quarterly and Annual Reports• Review earnings releases• Discuss the Company’s tax strategies, practices and related disclosures• Review the Company’s public reporting with respect to ESG matters within the Audit Committee’s
purviewMembership • All Audit Committee members must be independent
• All Audit Committee members are financially literate, and Ms. Schoppert and Mr. Crawford qualify as “audit committee financial experts”
• Charter prohibits any member of the Audit Committee from serving on the audit committees of more than two other public companies unless the Board determines that such simultaneous service would not impair the ability of the director to effectively serve on the Committee
Compensation and Human Capital Committee Meetings in 2021: 6Duties and Responsibilities
• Establish executive officer compensation (other than CEO compensation) and oversee compensation programs and policies
• Oversee consideration of ESG matters in executive compensation program • Oversee human capital management practices, including talent management, DEI and pay equity• Evaluate CEO performance and make recommendations regarding CEO compensation• Oversee the CEO’s evaluation of executive officers and, in consultation with the CEO, review and
approve the compensation of executive officers other than the CEO• Review director compensation• Make equity grants under and administer the Equity and Incentive Compensation Plan (the
“EICP”)• Establish target award levels and make awards under the annual cash incentive component of the
EICP• Review the Company’s executive organization• Oversee executive officer succession planning
Membership • All Compensation Committee members must be independent
22
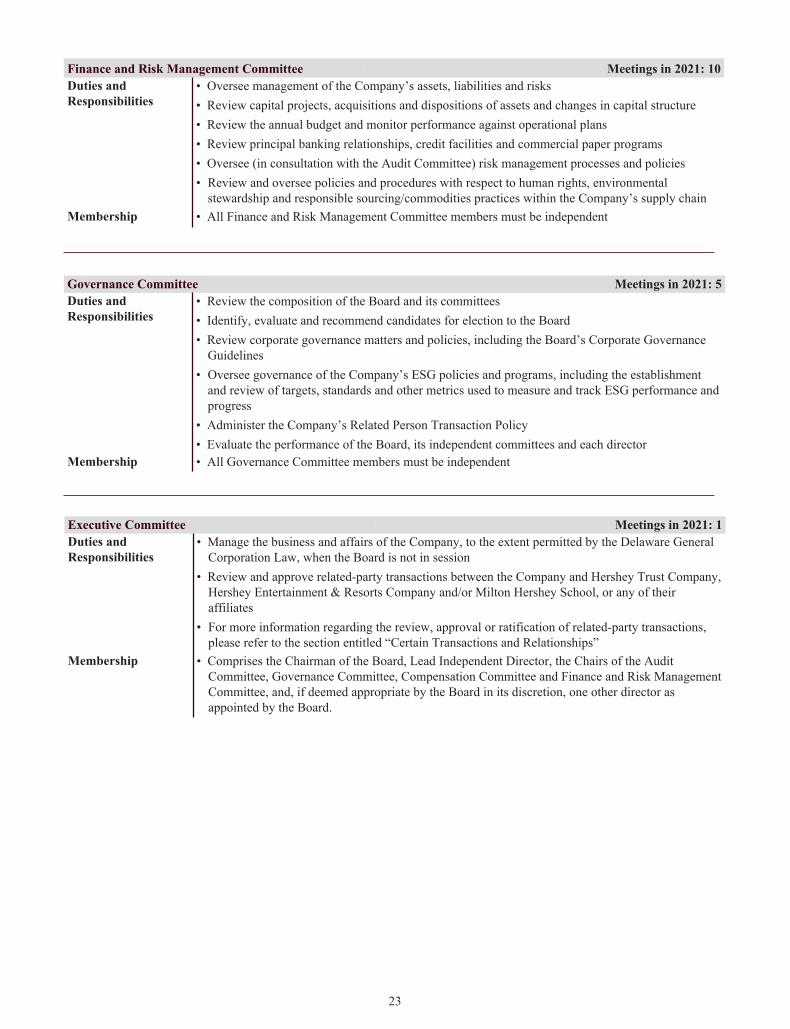
Finance and Risk Management Committee Meetings in 2021: 10Duties and Responsibilities
• Oversee management of the Company’s assets, liabilities and risks• Review capital projects, acquisitions and dispositions of assets and changes in capital structure• Review the annual budget and monitor performance against operational plans• Review principal banking relationships, credit facilities and commercial paper programs• Oversee (in consultation with the Audit Committee) risk management processes and policies• Review and oversee policies and procedures with respect to human rights, environmental
stewardship and responsible sourcing/commodities practices within the Company’s supply chain Membership • All Finance and Risk Management Committee members must be independent
Governance Committee Meetings in 2021: 5Duties and Responsibilities
• Review the composition of the Board and its committees• Identify, evaluate and recommend candidates for election to the Board• Review corporate governance matters and policies, including the Board’s Corporate Governance
Guidelines• Oversee governance of the Company’s ESG policies and programs, including the establishment
and review of targets, standards and other metrics used to measure and track ESG performance and progress
• Administer the Company’s Related Person Transaction Policy• Evaluate the performance of the Board, its independent committees and each director
Membership • All Governance Committee members must be independent
Executive Committee Meetings in 2021: 1Duties and Responsibilities
• Manage the business and affairs of the Company, to the extent permitted by the Delaware General Corporation Law, when the Board is not in session
• Review and approve related-party transactions between the Company and Hershey Trust Company, Hershey Entertainment & Resorts Company and/or Milton Hershey School, or any of their affiliates
• For more information regarding the review, approval or ratification of related-party transactions, please refer to the section entitled “Certain Transactions and Relationships”
Membership • Comprises the Chairman of the Board, Lead Independent Director, the Chairs of the Audit Committee, Governance Committee, Compensation Committee and Finance and Risk Management Committee, and, if deemed appropriate by the Board in its discretion, one other director as appointed by the Board.
23

Enterprise Risk Management Our Board takes an active role in risk oversight. While management is responsible for identifying, evaluating, managing and mitigating the Company’s exposure to risk, it is the Board’s responsibility to oversee the Company’s risk management process and to ensure that management is taking appropriate action to identify, manage and mitigate key risks and keeping the Board appropriately informed. The Board administers its risk oversight responsibilities both through active review and discussion of key risks facing the Company and by delegating certain risk oversight responsibilities to committees for further consideration and evaluation.
Board of Directors
• Review and evaluate strategic plans and associated risks
• Oversee ERM framework and the overall ERM process
• Conduct annual succession plan reviews
• Oversee ESG programs and policies, including sustainability and climate change
Audit Committee
• Oversee legal and regulatory compliance and the Code of Conduct• Oversee risks relating to key accounting policies • Review internal controls with management and internal auditors • Review the Company’s public reporting with respect to ESG matters within
the committee’s purview
Compensation and Human
Capital Committee
• Oversee risks relating to compensation programs and policies• Oversee consideration of ESG matters in executive compensation program • Employ independent compensation consultants to assist in reviewing
compensation programs, including potential risks• Oversee succession planning and talent processes and programs• Oversee human capital management practices, including talent management,
DEI and pay equity
Finance and Risk Management Committee
• Review key enterprise risks identified through the ERM process as well as risk mitigation plans, including information security
• Oversee key financial risks • Oversee and approve M&A activities and related risks• Review and oversee policies and procedures with respect to human rights,
environmental stewardship and responsible sourcing/commodities practices within the Company’s supply chain
Governance Committee
• Oversee governance-related risks • Oversee governance of the Company’s ESG policies and programs,
including the establishment and review of targets, standards and metrics for measuring and tracking ESG performance and progress
• Oversee compliance with key corporate governance documentsExecutive
Committee• Approve related party transactions between the Company and entities
affiliated with the Company and certain of its directors
The decision to administer the Board’s oversight responsibilities in this manner has an important effect on the Board’s leadership and committee structure, described in more detail above. The Board believes that its structure – including a strong Lead Independent Director, 11 of 12 independent directors and key committees comprised entirely of independent directors –helps to ensure that key strategic decisions made by senior management, up to and including the CEO, are reviewed and overseen by independent directors of the Board.
24
Information SecurityAs indicated above, the Finance and Risk Management Committee is responsible for reviewing key enterprise risks identified through the ERM process, which includes information security strategies and risks, as well as data privacy and protection risks and mitigation strategies (“Information Security”). At each regularly scheduled Finance and Risk Management Committee meeting, management, through the Company’s Chief Information Security Officer, reports on Information Security controls, audits, guidelines and developments. The Chief Information Security Officer oversees the dedicated Information Security team, which works in partnership with internal audit to review information technology-related internal controls with our external auditors as part of the overall internal controls process. Annual third-party audits are also conducted on penetration testing and overall program maturity.
Our Company-wide Information Security training program includes:
• Security awareness training, including regular phishing simulations;• Acceptable use training; and• Other targeted trainings throughout the year.
We currently maintain a cyber insurance policy that provides coverage for security breaches. The Company has neither experienced an Information Security breach nor incurred any breach-related expenses over the last three years.
Board Meetings and Attendance The Board held 9 meetings in 2021. Each incumbent director attended at least 98% of all of the meetings of the Board and committees of the Board on which he or she served in 2021. Average director attendance for all meetings equaled 99%.
In addition, the independent directors meet regularly in executive session at every Board meeting and at other times as the independent directors deem necessary. These meetings allow the independent directors to discuss important issues, including the business and affairs of the Company as well as matters concerning management, without any member of management present. Each executive session is chaired by the Lead Independent Director. In the absence of the Lead Independent Director, executive sessions are chaired by an independent director assigned on a rotating basis. Members of the Audit Committee, Compensation Committee, Finance and Risk Management Committee and Governance Committee also meet regularly in executive session.
Directors are expected to attend our annual meetings of stockholders. All directors standing for election at the Annual Meeting attended the 2021 annual meeting.
Director Independence The Board, in consultation with the Governance Committee, determines which of our directors are independent. The Board has adopted categorical standards for independence that it uses in determining which directors are independent. The Board bases its determination of independence for each director on the more stringent independence standards applicable to Audit Committee members regardless of whether such director serves on the Audit Committee. These standards are contained in the Board’s Corporate Governance Guidelines, which are available on the Investors section of our website at www.thehersheycompany.com.
Applying these categorical standards for independence, as well as the independence requirements set forth in the listing standards of the NYSE Rules and the rules and regulations of the Securities and Exchange Commission (“SEC”), the Board determined that all directors recommended for election at the Annual Meeting are independent, except for Ms. Buck, who the Board determined is not independent because she is an executive officer of the Company.
In making its independence determinations, the Board, in consultation with the Governance Committee, reviewed the direct and indirect relationships between each director and the Company and its subsidiaries, as well as the compensation and other payments each director received from or made to the Company and its subsidiaries.
In making its independence determinations with respect to Ms. Koken and Messrs. Brown and Katzman, the Board considered their roles as current members of the board of directors of Hershey Trust Company and the board of managers (governing body) of Milton Hershey School, as well as certain transactions the Company had or may have with these entities.
25
Hershey Trust Company, as trustee for the trust established by Milton S. and Catherine S. Hershey that has as its sole beneficiary Milton Hershey School (such trust, the “Milton Hershey School Trust”), is our controlling stockholder. Hershey Trust Company is in turn owned by the Milton Hershey School Trust. As such, Hershey Trust Company, Milton Hershey School, the Milton Hershey School Trust and companies owned by the Milton Hershey School Trust are considered affiliates of the Company under SEC rules. During 2021, we had a number of transactions with Hershey Trust Company, Milton Hershey School and companies owned by the Milton Hershey School Trust involving the purchase and sale of goods and services in the ordinary course of business. We also entered into a letter of intent with Hershey Trust Company, as trustee for the Milton Hershey School Trust, with respect to the purchase and sale of certain real and personal property we own in Derry Township, Pennsylvania. We have outlined these transactions in greater detail in the section entitled “Certain Transactions and Relationships.” We have provided information about Company stock owned by Hershey Trust Company, as trustee for the Milton Hershey School Trust, and by Hershey Trust Company for its own investment purposes in the section entitled “Information Regarding Our Controlling Stockholder.”
Ms. Koken and Messrs. Brown and Katzman do not receive any compensation from The Hershey Company, from Hershey Trust Company or from Milton Hershey School other than compensation they receive or will receive in the ordinary course as members of the board of directors or board of managers of each of those entities, as applicable. In addition, Ms. Koken and Messrs. Brown and Katzman do not vote on Board decisions in connection with the Company’s transactions with Hershey Trust Company, Milton Hershey School and companies owned by the Milton Hershey School Trust. The Board therefore concluded that the positions Ms. Koken and Messrs. Brown and Katzman have as members of the board of directors of Hershey Trust Company and the board of managers of Milton Hershey School do not impact their independence.
Director Nominations The Governance Committee is responsible for identifying and recommending to the Board candidates for Board membership. As our controlling stockholder, Hershey Trust Company, as trustee for the Milton Hershey School Trust, also may from time to time recommend to the Governance Committee, or elect outright, individuals to serve on our Board.
In administering its responsibilities, the Governance Committee has not adopted formal selection procedures, but instead utilizes general guidelines that allow it to adjust the selection process to best satisfy the objectives established for any director search. The Governance Committee considers director candidates recommended by any reasonable source, including current directors, management, stockholders and other sources. The Governance Committee evaluates all director candidates in the same manner, regardless of the source of the recommendation.
From time to time, the Governance Committee engages a paid third-party consultant to assist in identifying and evaluating director candidates. The Governance Committee has sole authority under its charter to retain, compensate and terminate these consultants.
Stockholders desiring to recommend or nominate a director candidate must comply with certain procedures. If you are a stockholder and desire to nominate a director candidate at the 2023 Annual Meeting of Stockholders of the Company, you must comply with the procedures for nomination set forth in the section entitled “Information Regarding the 2023 Annual Meeting of Stockholders.” Stockholders who do not intend to nominate a director at an annual meeting may recommend a director candidate to the Governance Committee for consideration at any time. Stockholders desiring to do so must submit their recommendation in writing to The Hershey Company, c/o Secretary, 19 East Chocolate Avenue, Hershey, Pennsylvania 17033, and include in the submission all of the information that would be required if the stockholder nominated the candidate at an annual meeting. The Governance Committee may require the nominating stockholder to submit additional information before considering the candidate.
There were no changes to the procedures relating to stockholder nominations during 2021, and there have been no changes to such procedures to date in 2022. These procedural requirements are intended to ensure the Governance Committee has sufficient time and a basis on which to assess potential director candidates and are not intended to discourage or interfere with appropriate stockholder nominations. The Governance Committee does not believe that these procedural requirements subject any stockholder or proposed nominee to unreasonable burdens. The Governance Committee and the Board reserve the right to change the procedural requirements from time to time and/or to waive some or all of the requirements with respect to certain nominees, but any such waiver shall not preclude the Governance Committee from insisting upon compliance with any and all of the above requirements by any other recommending stockholder or proposed nominees.
26

Communications with Directors Stockholders and other interested parties may communicate with our directors in several ways. Communications regarding accounting, internal accounting controls or auditing matters may be emailed to the Audit Committee at [email protected] or sent to the Audit Committee at the following address:
Audit Committeec/o SecretaryThe Hershey Company19 East Chocolate Avenue P.O. Box 819Hershey, PA 17033-0819
Stockholders and other interested parties also can submit comments, confidentially and anonymously if desired, to the Audit Committee by calling the Hershey Concern Line at (800) 871-3659, by accessing the Hershey Concern Line website at www.HersheysConcern.com or emailing [email protected].
Stockholders and other interested parties may contact any of the independent directors, including the Lead Independent Director, as well as the independent directors as a group, by writing to the specified party at the address set forth above or by emailing the independent directors (or a specific independent director, including the Lead Independent Director) at [email protected]. Stockholders and other interested parties may also contact any of the independent directors using the Hershey Concern Line website noted above.
Communications to the Audit Committee, any of the independent directors and the Hershey Concern Line are processed by the Office of General Counsel. The Office of General Counsel reviews and summarizes these communications and provides reports to the applicable party on a periodic basis. Communications regarding any accounting, internal control or auditing matter are reported immediately to the Audit Committee, as are allegations about our officers. The Audit Committee will address communications from any interested party in accordance with our Board-approved Procedures for Submission and Handling of Complaints Regarding Compliance Matters, which are available for viewing on the Investors section of our website at www.thehersheycompany.com. Solicitations, junk mail and obviously frivolous or inappropriate communications are not forwarded to the Audit Committee or the independent directors, but copies are retained and made available to any director who wishes to review them.
27
PROPOSAL NO. 1 – ELECTION OF DIRECTORS
ü The Board of Directors unanimously recommends that stockholders vote FOR each of the nominees for director at the 2022 Annual Meeting
The first proposal to be voted on at the Annual Meeting is the election of 12 directors. If elected, the directors will hold office until the 2023 Annual Meeting of Stockholders of the Company or until their successors are elected and qualified.
Election Procedures We have two classes of common stock outstanding: Common Stock and Class B Common Stock. Under our certificate of incorporation and by-laws:
• One-sixth of the total number of our directors (which equates presently to two directors) will be elected by the holders of our Common Stock voting separately as a class. For the Annual Meeting, the Board has nominated Victor L. Crawford and Robert M. Dutkowsky for election by the holders of our Common Stock voting separately as a class.
• The remaining 10 directors will be elected by the holders of our Common Stock and Class B Common Stock voting together as a class.
With respect to the nominees to be elected by the holders of the Common Stock voting separately as a class, the two nominees receiving the greatest number of votes of the Common Stock will be elected as directors. With respect to the nominees to be elected by the holders of the Common Stock and the Class B Common Stock voting together, the 10 nominees receiving the greatest number of votes of the Common Stock and Class B Common Stock will be elected as directors.
The Board’s Corporate Governance Guidelines provide that directors will generally not be nominated for re-election after their 72nd birthday. All of the directors standing for election at the Annual Meeting satisfy the applicable age guideline.
All director nominees have indicated their willingness to serve if elected. If a nominee becomes unavailable for election for any reason, the proxies will have discretionary authority to vote for a substitute.
Nominees for Director The director nominees listed below were recommended to the Board by the Governance Committee, and the Board unanimously recommends the director nominees for election at the Annual Meeting. In making its recommendation, the Governance Committee considered the experience, qualifications, attributes and skills of each nominee, as well as each director’s past performance on our Board, as reflected in the Governance Committee’s annual evaluation of Board and committee performance. This evaluation considers, among other things, each director’s individual contributions to the Board, the director’s ability to work collaboratively with other directors and the effectiveness of the Board as a whole.
On the following pages, we provide certain biographical information about each nominee for director, as well as information regarding the nominee’s specific experience, qualifications, attributes and skills that qualify him or her to serve as a director and as a member of the committee(s) of the Board on which the nominee serves.
28

Pamela M. ArwayDirector since 2010Age 68Board Committees• Compensation (Chair)• Executive• Finance and Risk Management
QUALIFICATIONS, ATTRIBUTES AND SKILLSMs. Arway is the former President, Japan/Asia Pacific/Australia Region, of American Express International, Inc., a global payments, network and travel company, a position she held from October 2005 until her retirement in January 2008. Ms. Arway held multiple leadership positions during her 21-year career with American Express Company, Inc. and its subsidiaries, including as Chief Executive Officer, American Express Australia Ltd., and as Executive Vice President and General Manager, Corporate Travel North America. Ms. Arway contributes to the Board through the experience in finance, marketing, international business, government affairs, consumer products and human resources she developed throughout her career.
PUBLIC COMPANY AND OTHER KEY DIRECTORSHIPS• Iron Mountain Incorporated (May 2014 to present)• DaVita Inc. (May 2009 to present)• Carlson Inc. (May 2019 to June 2021)
EDUCATION• Bachelor’s degree in languages from Memorial University of Newfoundland• Masters of Business Administration degree from Queen’s University, Kingston, Ontario, Canada
James W. BrownDirector since 2017Age 70Board Committees• Audit• Governance
QUALIFICATIONS, ATTRIBUTES AND SKILLSMr. Brown is a director of Hershey Trust Company and a member of the Board of Managers of Milton Hershey School, positions he has held since February 2016. As one of three representatives of Hershey Trust Company and Milton Hershey School currently serving on the Board. Mr. Brown provides valuable perspectives as a representative of our largest stockholder and the school that is its sole beneficiary. He has significant experience in finance, private equity and venture capital, having previously served as a partner in SCP Private Equity Partners, a diversified, multi-stage venture capital firm. Mr. Brown also has extensive government relations and public policy experience from serving as Chief of Staff in U.S. federal and Pennsylvania state governments. His familiarity with policy and government operations, as well as his experience as an investor in, and director of, both public and private companies, make him an important addition to the Board on matters of finance, government relations, strategy and risk management.
PUBLIC COMPANY AND OTHER KEY DIRECTORSHIPS• FS Credit Real Estate Income Trust (December 2021 to present)• FS Multi-Strategy Alternatives Fund/FS Series Trust (August 2017 to present)• FS Investment Corporation III (February 2016 to December 2018)
EDUCATION• Bachelor’s degree, magna cum laude, from Villanova University• Juris Doctor degree from the University of Virginia Law School
29

Michele G. BuckDirector since 2017Age 60Board Committees• Executive (Chair)
QUALIFICATIONS, ATTRIBUTES AND SKILLSAs Chairman of the Board, President and Chief Executive Officer of the Company, a position she has held since October 2019, Ms. Buck is responsible for all day-to-day global operations and commercial activities of the Company. She previously served the Company in a variety of executive roles, including as President and Chief Executive Officer from March 2017 to October 2019 and as Executive Vice President and Chief Operating Officer from June 2016 to March 2017. Having served at the Company for more than 17 years and as an executive in the consumer-packaged goods industry for more than 30 years, Ms. Buck contributes to the Board in the areas of marketing, consumer products, strategy, supply chain management and mergers and acquisitions. Her presence in the boardroom also ensures efficient communication between the Board and Company management.
PUBLIC COMPANY AND OTHER KEY DIRECTORSHIPS• New York Life Insurance Company (November 2013 to present)
EDUCATION• Bachelor’s degree from Shippensburg University of Pennsylvania• Masters of Business Administration degree from the University of North Carolina
Victor L. CrawfordDirector since 2020Age 60Committees• Audit• Compensation
QUALIFICATIONS, ATTRIBUTES AND SKILLSMr. Crawford is currently the Chief Executive Officer, Pharmaceutical Segment, of Cardinal Health, Inc., a global healthcare services and products company, a position he has held since November 2018. Mr. Crawford has held senior management positions at several companies across the food and beverage, hospitality and healthcare services industries. He held the position of President and Chief Operating Officer, Healthcare, Education and Business Dining, at Aramark Corporation, a global provider of food, facilities and uniform services, from September 2012 to October 2018. Mr. Crawford also held senior management positions at PepsiCo, Inc., a multinational food, snack and beverage company. Mr. Crawford contributes to the Board through his broad range of experience in digital transformation, fast moving consumer goods, logistics and supply chain management, as well as his valuable insights in emerging markets, consumer retail and finance.
PUBLIC COMPANY AND OTHER KEY DIRECTORSHIPS• Pelotonia (September 2020 to present)• Board of Trustees, National Urban League (October 2010 to present)• Dave & Buster’s Entertainment, Inc. (August 2016 to June 2020)
EDUCATION• Bachelor of Science in accounting from Boston College
One of two directors nominated for election by the holders of the Common Stock voting separately as a class
30

Robert M. DutkowskyDirector since 2020Age 67Board Committees• Finance and Risk Management• Governance
QUALIFICATIONS, ATTRIBUTES AND SKILLSMr. Dutkowsky is the former Executive Chairman and Chief Executive Officer of Tech Data Corporation, a wholesale distributor of technology products, a position he held from June 2018 until his retirement in June 2020. He previously served as Chief Executive Officer of Tech Data from October 2006 to June 2018, including as Chairman of the Board from June 2017 until his appointment as Executive Chairman in June 2018. Prior to joining Tech Data, Mr. Dutkowsky served as President, Chief Executive Officer and Chairman of two software companies, Egenera, Inc. and J.D. Edwards & Co., Inc. Having spent most of his career in the technology industry, Mr. Dutkowsky brings to the Board broad operational experience and a deep understanding of the technology industry and how technology and digital capabilities drive growth and resiliency. The experiences and skills he developed as a senior executive at multiple technology and software businesses also allow Mr. Dutkowsky to provide the Board with insights related to finance, management, operations, risk management and governance.
PUBLIC COMPANY AND OTHER KEY DIRECTORSHIPS• Pitney Bowes, Inc. (July 2018 to present)• Raymond James Financial, Inc. (October 2018 to present)• US Foods, Inc. (January 2017 to present)• Tech Data Corporation (October 2006 to June 2020)
EDUCATION• Bachelor of Science in Industrial Labor Relations from Cornell University
One of two directors nominated for election by the holders of the Common Stock voting separately as a class
Mary Kay HabenDirector since 2013Age 65Board Committees• Governance (Chair)• Compensation• Executive
QUALIFICATIONS, ATTRIBUTES AND SKILLSMs. Haben is the former President, North America, of Wm. Wrigley Jr. Company, a leading confectionery company, a position she held from October 2008 until her retirement in February 2011. She served in several other senior management positions during her time at Wm. Wrigley Jr. Company, including as Group Vice President and Managing Director, North America. She also held a succession of leadership positions in her 27-year career at Kraft Foods, Inc., a grocery manufacturing and processing conglomerate. Throughout her career, Ms. Haben gained extensive experience managing businesses in the consumer-packaged goods industry and developed a track record of growing brands and developing new products. Her knowledge of and ability to analyze the overall consumer-packaged goods industry, evolving market dynamics and consumers’ relationships with brands make her a valuable contributor to the Board and the Company.
PUBLIC COMPANY AND OTHER KEY DIRECTORSHIPS• Grocery Outlet Holding Corp. (November 2019 to present)• Trustee of Equity Residential (July 2011 to present)• Bob Evans Farms, Inc. (August 2012 to January 2018)
EDUCATION• Bachelor’s degree, magna cum laude, in business administration from the University of Illinois• Masters of Business Administration degree in marketing from the University of Michigan, Ross School of Business
31

James C. KatzmanDirector since 2018Age 54Board Committees• Finance and Risk Management • Governance
QUALIFICATIONS, ATTRIBUTES AND SKILLSMr. Katzman is a director of Hershey Trust Company and a member of the Board of Managers of Milton Hershey School, a position he has held since April 2017. He is also the Senior Vice President of Business Development for General Electric Company, a global company focused on aviation, healthcare and energy, a position he has held since October 2021. As one of three representatives of Hershey Trust Company and Milton Hershey School currently serving on the Board. Mr. Katzman provides valuable perspectives as a representative of our largest stockholder and the school that is its sole beneficiary. Having previously served as a partner in Goldman Sachs Group, Inc., a multinational investment bank, he also contributes to the Board through his extensive experience in corporate financial matters and merger and acquisition transactions, which assists the Board in overseeing the Company’s financial stewardship and transformation into an innovative snacking powerhouse.
PUBLIC COMPANY AND OTHER KEY DIRECTORSHIPS• Brinker International, Inc. (January 2018 to present)
EDUCATION• Bachelor’s degree, cum laude, from Dartmouth College• Masters of Business Administration degree from Columbia University Graduate School of Business
M. Diane KokenDirector since 2017Age 69Board Committees• Audit• Compensation
QUALIFICATIONS, ATTRIBUTES AND SKILLSMs. Koken is Chairman of the Board of Hershey Trust Company and Milton Hershey School, positions she has held since December 2020. She has also served as director of Hershey Trust Company and a member of the Board of Managers of Milton Hershey School since December 2015. As Chairman of the Boards and one of three representatives of Hershey Trust Company and Milton Hershey School currently serving on the Board, Ms. Koken brings to the Board valuable insights from our largest stockholder and the school that is its sole beneficiary. For more than 15 years, Ms. Koken has also served as a legal/regulatory consultant. She previously served as Insurance Commissioner of Pennsylvania for three governors and in other leadership roles during her 22-year career at Provident Mutual Life Insurance Company, a national life insurer, that culminated in her serving as its Vice President, General Counsel and Corporate Secretary. Ms. Koken served as a previous president of the National Association of Insurance Commissioners. She contributes to the Board through her significant expertise in insurance, risk management and regulatory affairs, as well as her experience in legal operations and corporate governance.
PUBLIC COMPANY AND OTHER KEY DIRECTORSHIPS• Nationwide Mutual Funds and Nationwide Variable Insurance Trust (April 2019 to present)• Capital BlueCross (December 2011 to present)• Nationwide Mutual Insurance Company; Nationwide Mutual Fire Insurance Company; Nationwide Corporation (April
2007 to present)• NORCAL Mutual (January 2009 to May 2021)
EDUCATION• Bachelor’s degree, magna cum laude, from Millersville University• Juris Doctor degree from Villanova University School of Law
32

Robert M. MalcolmDirector since 2011Age 69 Board Committees • Finance and Risk Management
(Chair)• Audit• Executive
QUALIFICATIONS, ATTRIBUTES AND SKILLSMr. Malcolm is the former President, Global Marketing, Sales & Innovation, of Diageo PLC, a leading premium drinks company, a position he held from June 2002 until his retirement in December 2008. Prior to that position, Mr. Malcolm spent 24 years at The Procter & Gamble Company in various leadership positions, including as Vice President – General Manager Beverages, Europe, Middle East and Africa, and Vice President – General Manager, Arabian Peninsula. He is a globally recognized expert in strategic marketing and is currently Executive in Residence, Center for Customer Insight and Marketing Solutions, McCombs School of Business, University of Texas. Mr. Malcolm brings to the Board significant experience in emerging markets and in the marketing and sales of consumer products, including consumer-packaged goods and fast-moving consumer goods.
PUBLIC COMPANY AND OTHER KEY DIRECTORSHIPS• Boston Consulting Group (senior advisor) (December 2012 to present)
EDUCATION• Bachelor’s degree in marketing from the University of Southern California• Masters of Business Administration degree in marketing from the University of Southern California
Anthony J. PalmerLead Independent Director since May 2020
Director since 2011
Age 62Board Committees• Audit (ex-officio)• Compensation• Executive• Finance and Risk Management
(ex-officio)• Governance (ex-officio)
QUALIFICATIONS, ATTRIBUTES AND SKILLSMr. Palmer is the Founder and Chief Executive Officer of TropicSport, a natural and environmentally friendly e-commerce suncare and skincare products company, a position he has held since April 2019. Prior to founding TropicSport, Mr. Palmer held key leadership positions at Kimberly-Clark Corporation, a multinational personal care company, including serving as President, Global Brands and Innovation, from April 2012 to April 2019. Prior to Kimberly-Clark Corporation, Mr. Palmer served in various leadership positions at The Kellogg Company, a multinational food manufacturing company, and the Coca-Cola Company, a multinational beverage company. Having spent most of his career in the consumer-packaged goods industry, Mr. Palmer contributes to the Board through his insight in several key strategic areas for the Company, including fast-moving consumer-packaged goods, emerging markets, marketing and human resources.
PUBLIC COMPANY AND OTHER KEY DIRECTORSHIPS• None
EDUCATION• Bachelor’s degree in business from Monash University in Melbourne, Australia• Masters of Business Administration degree, with distinction, from the International Management Institute, Geneva,
Switzerland
33

Juan R. PerezDirector since 2019Age 55Board Committees• Finance and Risk Management• Governance
QUALIFICATIONS, ATTRIBUTES AND SKILLSMr. Perez is the Executive Vice President and Chief Information Officer of Salesforce.com, Inc., a global leader in customer relationship management technology, a position he has held since April 2022. Prior to joining Salesforce, he spent 32 years at United Parcel Service, Inc. (“UPS”), a multinational package delivery and supply chain management company, where he held a succession of leadership positions, including serving as Chief Information and Engineering Officer from April 2017 to March 2022 and Chief Information Officer from March 2016 to April 2017. Prior to those roles, Mr. Perez served as UPS’ Vice President of Technology and as Vice President, Engineering. Through his varied roles, he has developed a broad range of commercial, human resources, operational planning, logistics and technological expertise. In addition to his overall leadership experience, Mr. Perez brings significant strength in the areas of supply chain management and logistics, digital technology, information security, innovation and data analytics to the Board.
PUBLIC COMPANY AND OTHER KEY DIRECTORSHIPS• None
EDUCATION• Bachelor of Science in industrial and systems engineering from the University of Southern California• Masters of Science in computer and manufacturing from the University of Southern California
Wendy L. SchoppertDirector since 2017 Age 55Board Committees• Audit (Chair)• Executive• Finance and Risk Management
QUALIFICATIONS, ATTRIBUTES AND SKILLSMs. Schoppert is the former Executive Vice President and Chief Financial Officer of Sleep Number Corporation, a bedding manufacturer, marketer and retailer, a position she held from June 2011 until her retirement in February 2014. As Chief Financial Officer for Sleep Number Corporation, Ms. Schoppert gained extensive experience leading all finance functions, including financial planning and analysis, accounting, tax, treasury, investor relations, decision support and IT. Prior to joining Sleep Number in 2005, Ms. Schoppert led U.S. Bank’s Private Asset Management team and served as its Head of Product, Marketing and Corporate Development. She began her career in the airline industry, serving in various financial, strategic and general management leadership positions at American Airlines, Northwest Airlines and America West Airlines. Ms. Schoppert contributes to the Board through her extensive financial leadership experience, public company reporting expertise and retail experience across finance, IT, digital and marketing.
PUBLIC COMPANY AND OTHER KEY DIRECTORSHIPS• ODP Corporation (July 2020 to present)• Bremer Financial Corporation (May 2017 to present)• Big Lots, Inc. (May 2015 to present)• Gaia, Inc. (formerly Gaiam, Inc.) (October 2013 to December 2018)
EDUCATION• Bachelor of Arts in mathematics and operations research from Cornell University• Masters of Business Administration in finance and general management from Cornell University
34
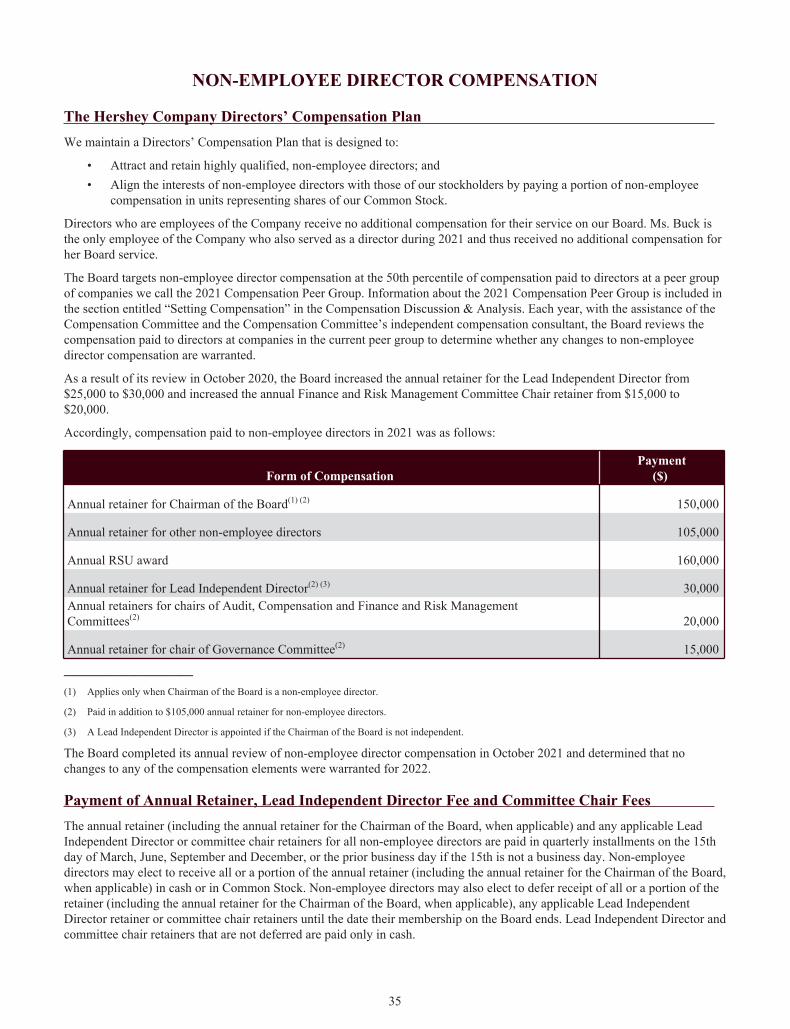
NON-EMPLOYEE DIRECTOR COMPENSATION
The Hershey Company Directors’ Compensation Plan We maintain a Directors’ Compensation Plan that is designed to:
• Attract and retain highly qualified, non-employee directors; and• Align the interests of non-employee directors with those of our stockholders by paying a portion of non-employee
compensation in units representing shares of our Common Stock.
Directors who are employees of the Company receive no additional compensation for their service on our Board. Ms. Buck is the only employee of the Company who also served as a director during 2021 and thus received no additional compensation for her Board service.
The Board targets non-employee director compensation at the 50th percentile of compensation paid to directors at a peer group of companies we call the 2021 Compensation Peer Group. Information about the 2021 Compensation Peer Group is included in the section entitled “Setting Compensation” in the Compensation Discussion & Analysis. Each year, with the assistance of the Compensation Committee and the Compensation Committee’s independent compensation consultant, the Board reviews the compensation paid to directors at companies in the current peer group to determine whether any changes to non-employee director compensation are warranted.
As a result of its review in October 2020, the Board increased the annual retainer for the Lead Independent Director from $25,000 to $30,000 and increased the annual Finance and Risk Management Committee Chair retainer from $15,000 to $20,000.
Accordingly, compensation paid to non-employee directors in 2021 was as follows:
Form of Compensation Payment
($)
Annual retainer for Chairman of the Board(1) (2) 150,000
Annual retainer for other non-employee directors 105,000
Annual RSU award 160,000
Annual retainer for Lead Independent Director(2) (3) 30,000 Annual retainers for chairs of Audit, Compensation and Finance and Risk Management Committees(2) 20,000
Annual retainer for chair of Governance Committee(2) 15,000 ____________________
(1) Applies only when Chairman of the Board is a non-employee director.
(2) Paid in addition to $105,000 annual retainer for non-employee directors.
(3) A Lead Independent Director is appointed if the Chairman of the Board is not independent.
The Board completed its annual review of non-employee director compensation in October 2021 and determined that no changes to any of the compensation elements were warranted for 2022.
Payment of Annual Retainer, Lead Independent Director Fee and Committee Chair Fees The annual retainer (including the annual retainer for the Chairman of the Board, when applicable) and any applicable Lead Independent Director or committee chair retainers for all non-employee directors are paid in quarterly installments on the 15th day of March, June, September and December, or the prior business day if the 15th is not a business day. Non-employee directors may elect to receive all or a portion of the annual retainer (including the annual retainer for the Chairman of the Board, when applicable) in cash or in Common Stock. Non-employee directors may also elect to defer receipt of all or a portion of the retainer (including the annual retainer for the Chairman of the Board, when applicable), any applicable Lead Independent Director retainer or committee chair retainers until the date their membership on the Board ends. Lead Independent Director and committee chair retainers that are not deferred are paid only in cash.
35
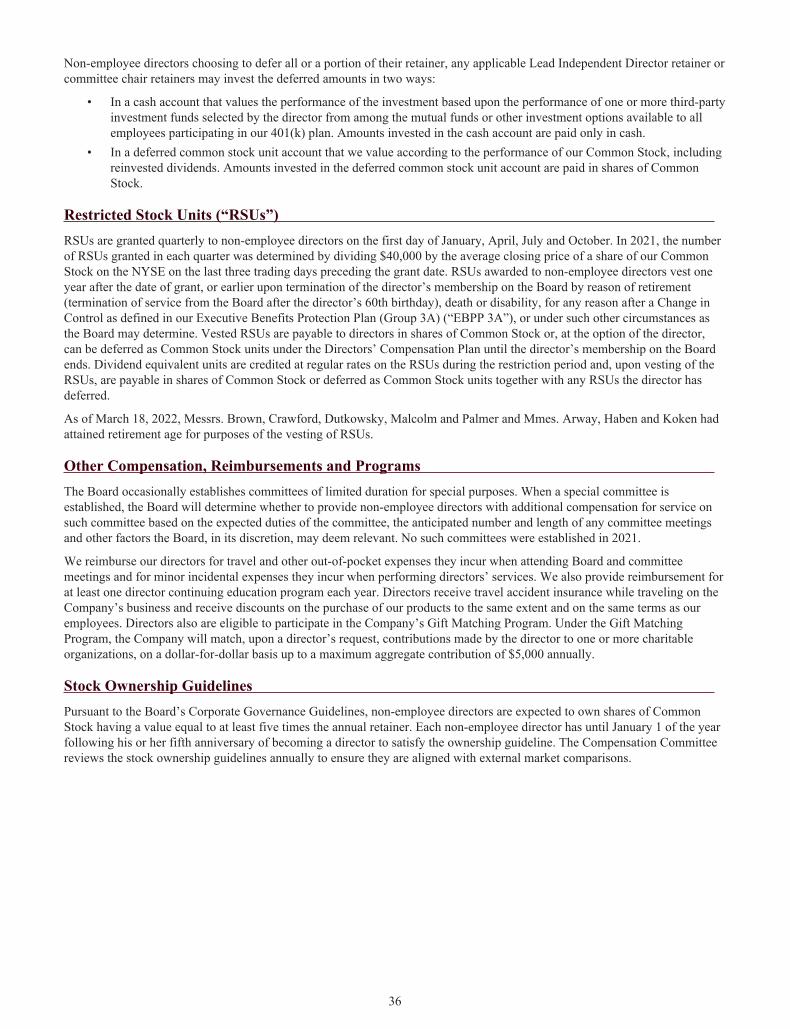
Non-employee directors choosing to defer all or a portion of their retainer, any applicable Lead Independent Director retainer or committee chair retainers may invest the deferred amounts in two ways:
• In a cash account that values the performance of the investment based upon the performance of one or more third-party investment funds selected by the director from among the mutual funds or other investment options available to all employees participating in our 401(k) plan. Amounts invested in the cash account are paid only in cash.
• In a deferred common stock unit account that we value according to the performance of our Common Stock, including reinvested dividends. Amounts invested in the deferred common stock unit account are paid in shares of Common Stock.
Restricted Stock Units (“RSUs”) RSUs are granted quarterly to non-employee directors on the first day of January, April, July and October. In 2021, the number of RSUs granted in each quarter was determined by dividing $40,000 by the average closing price of a share of our Common Stock on the NYSE on the last three trading days preceding the grant date. RSUs awarded to non-employee directors vest one year after the date of grant, or earlier upon termination of the director’s membership on the Board by reason of retirement (termination of service from the Board after the director’s 60th birthday), death or disability, for any reason after a Change in Control as defined in our Executive Benefits Protection Plan (Group 3A) (“EBPP 3A”), or under such other circumstances as the Board may determine. Vested RSUs are payable to directors in shares of Common Stock or, at the option of the director, can be deferred as Common Stock units under the Directors’ Compensation Plan until the director’s membership on the Board ends. Dividend equivalent units are credited at regular rates on the RSUs during the restriction period and, upon vesting of the RSUs, are payable in shares of Common Stock or deferred as Common Stock units together with any RSUs the director has deferred.
As of March 18, 2022, Messrs. Brown, Crawford, Dutkowsky, Malcolm and Palmer and Mmes. Arway, Haben and Koken had attained retirement age for purposes of the vesting of RSUs.
Other Compensation, Reimbursements and Programs The Board occasionally establishes committees of limited duration for special purposes. When a special committee is established, the Board will determine whether to provide non-employee directors with additional compensation for service on such committee based on the expected duties of the committee, the anticipated number and length of any committee meetings and other factors the Board, in its discretion, may deem relevant. No such committees were established in 2021.
We reimburse our directors for travel and other out-of-pocket expenses they incur when attending Board and committee meetings and for minor incidental expenses they incur when performing directors’ services. We also provide reimbursement for at least one director continuing education program each year. Directors receive travel accident insurance while traveling on the Company’s business and receive discounts on the purchase of our products to the same extent and on the same terms as our employees. Directors also are eligible to participate in the Company’s Gift Matching Program. Under the Gift Matching Program, the Company will match, upon a director’s request, contributions made by the director to one or more charitable organizations, on a dollar-for-dollar basis up to a maximum aggregate contribution of $5,000 annually.
Stock Ownership Guidelines Pursuant to the Board’s Corporate Governance Guidelines, non-employee directors are expected to own shares of Common Stock having a value equal to at least five times the annual retainer. Each non-employee director has until January 1 of the year following his or her fifth anniversary of becoming a director to satisfy the ownership guideline. The Compensation Committee reviews the stock ownership guidelines annually to ensure they are aligned with external market comparisons.
36

2021 Director Compensation The following table and explanatory footnotes provide information with respect to the compensation paid or provided to non-employee directors during 2021:
Name(1)
Fees Earnedor Paid in Cash(2)
($)
StockAwards(3)
($)
All OtherCompensation(4)
($) Total
($)Pamela M. Arway 125,000 160,000 5,000 290,000 James W. Brown 105,000 160,000 5,000 270,000 Victor L. Crawford 105,000 160,000 5,000 270,000 Charles A. Davis 39,808 60,660 5,000 105,468 Robert M. Dutkowsky 105,000 160,000 — 265,000 Mary Kay Haben 120,000 160,000 5,000 285,000 James C. Katzman 105,000 160,000 5,000 270,000 M. Diane Koken 105,000 160,000 5,000 270,000 Robert M. Malcolm 125,000 160,000 5,000 290,000 Anthony J. Palmer 135,000 160,000 5,000 300,000 Juan R. Perez 105,000 160,000 — 265,000 Wendy L. Schoppert 117,473 160,000 3,283 280,756 David L. Shedlarz 47,390 60,660 — 108,050
____________________
(1) Messrs. Davis and Shedlarz retired from the Board on May 17, 2021.
(2) Includes amounts earned or paid in cash or shares of Common Stock at the election of the director or deferred by the director under the Directors’ Compensation Plan. Amounts credited as earnings on amounts deferred under the Directors’ Compensation Plan are based on investment options available to all participants in our 401(k) plan or our Common Stock and, accordingly, the earnings credited during 2021 were not considered “above market” or “preferential” earnings.
The following table sets forth the portion of fees earned or paid in cash or Common Stock, and the portion deferred with respect to retainers and fees earned during 2021:
Name
Immediate Payment Deferred and Investment Election
CashPaid($)
Value Paid inShares ofCommon
Stock($)
Numberof Shares
of CommonStock(#)
ValueDeferredto a CashAccount
($)
Value Deferredto a Common
Stock UnitAccount
($)
Number ofDeferred
Common StockUnits(#)
Pamela M. Arway 125,000 — — — — — James W. Brown 105,000 — — — — — Victor L. Crawford — — — 105,000 — — Charles A. Davis 39,808 — — — — — Robert M. Dutkowsky 105,000 — — — — — Mary Kay Haben 120,000 — — — — — James C. Katzman — — — — 105,000 636 M. Diane Koken 105,000 — — — — — Robert M. Malcolm 125,000 — — — — — Anthony J. Palmer — — — — 135,000 817 Juan R. Perez 89,250 15,750 94 — — — Wendy L. Schoppert 117,473 — — — — — David L. Shedlarz 47,390 — — — — —
(3) Represents the dollar amount recognized as expense during 2021 for financial statement reporting purposes with respect to RSUs awarded to the directors during 2021. RSUs awarded to directors are charged to expense in the Company’s financial statements at the grant date fair value on each quarterly grant date. The target annual grant date fair value of the RSUs for each director during 2021 was $160,000.
37
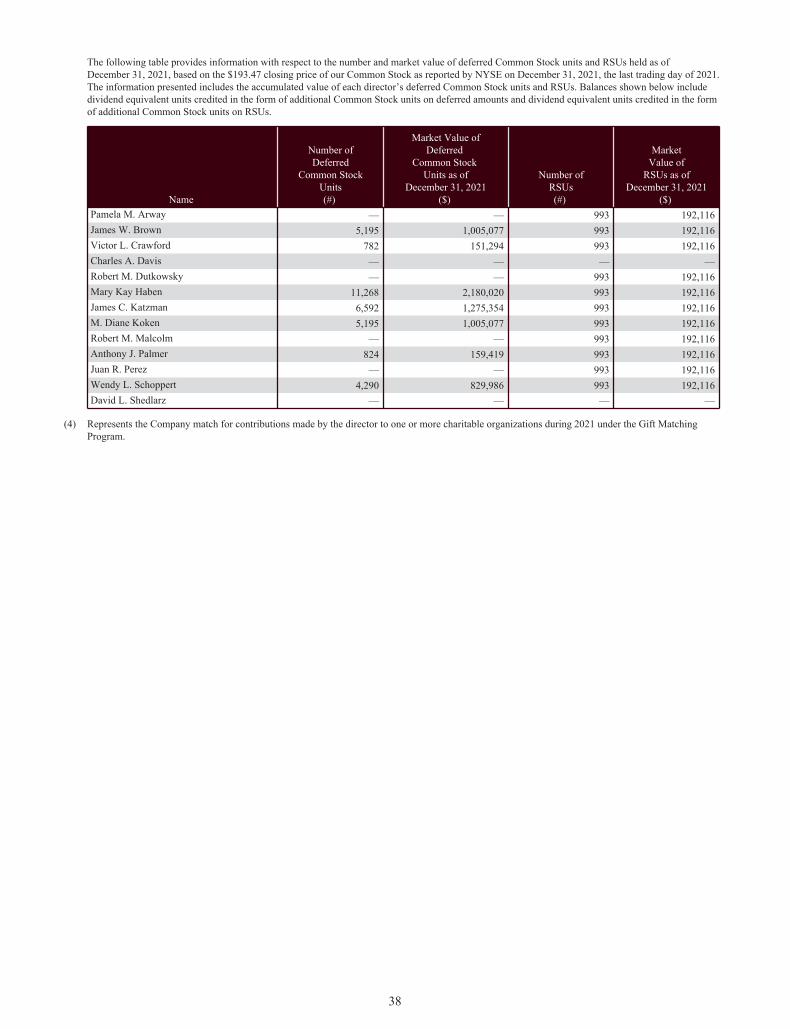
The following table provides information with respect to the number and market value of deferred Common Stock units and RSUs held as of December 31, 2021, based on the $193.47 closing price of our Common Stock as reported by NYSE on December 31, 2021, the last trading day of 2021. The information presented includes the accumulated value of each director’s deferred Common Stock units and RSUs. Balances shown below include dividend equivalent units credited in the form of additional Common Stock units on deferred amounts and dividend equivalent units credited in the form of additional Common Stock units on RSUs.
Name
Number ofDeferred
Common StockUnits(#)
Market Value ofDeferred
Common Stock Units as of
December 31, 2021($)
Number ofRSUs(#)
MarketValue of
RSUs as ofDecember 31, 2021
($) Pamela M. Arway — — 993 192,116 James W. Brown 5,195 1,005,077 993 192,116 Victor L. Crawford 782 151,294 993 192,116 Charles A. Davis — — — — Robert M. Dutkowsky — — 993 192,116 Mary Kay Haben 11,268 2,180,020 993 192,116 James C. Katzman 6,592 1,275,354 993 192,116 M. Diane Koken 5,195 1,005,077 993 192,116 Robert M. Malcolm — — 993 192,116 Anthony J. Palmer 824 159,419 993 192,116 Juan R. Perez — — 993 192,116 Wendy L. Schoppert 4,290 829,986 993 192,116 David L. Shedlarz — — — —
(4) Represents the Company match for contributions made by the director to one or more charitable organizations during 2021 under the Gift Matching Program.
38
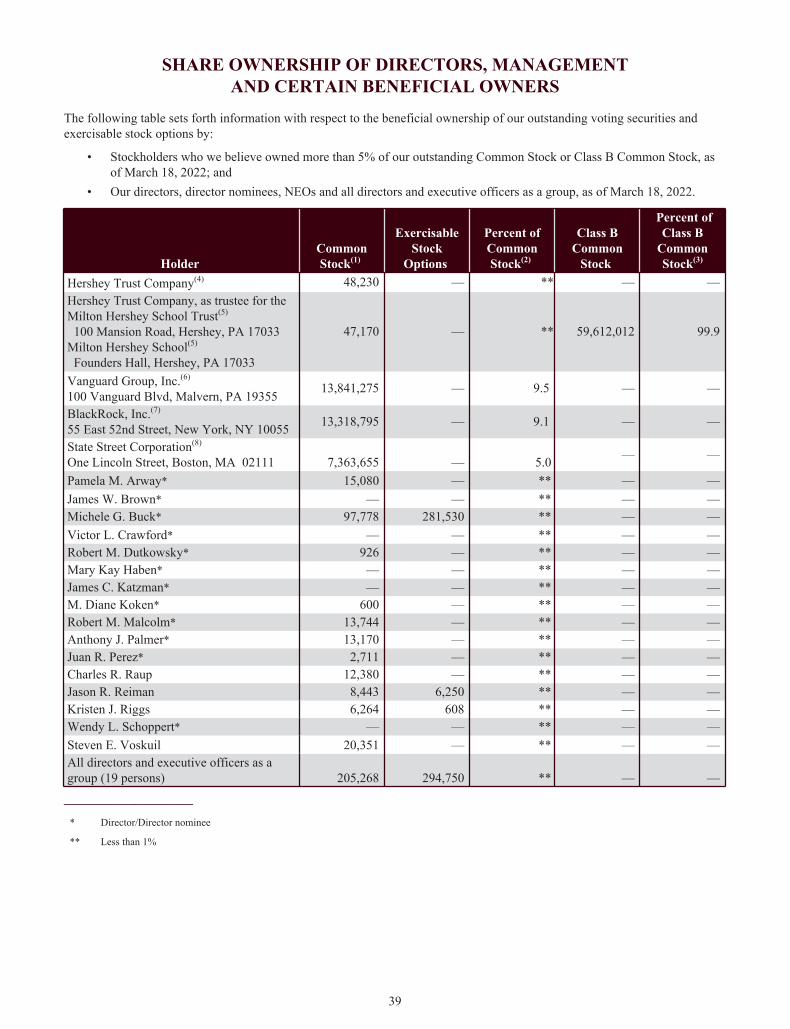
SHARE OWNERSHIP OF DIRECTORS, MANAGEMENTAND CERTAIN BENEFICIAL OWNERS
The following table sets forth information with respect to the beneficial ownership of our outstanding voting securities and exercisable stock options by:
• Stockholders who we believe owned more than 5% of our outstanding Common Stock or Class B Common Stock, as of March 18, 2022; and
• Our directors, director nominees, NEOs and all directors and executive officers as a group, as of March 18, 2022.
Holder CommonStock(1)
ExercisableStock
Options
Percent ofCommonStock(2)
Class BCommon
Stock
Percent ofClass B
CommonStock(3)
Hershey Trust Company(4) 48,230 — ** — — Hershey Trust Company, as trustee for theMilton Hershey School Trust(5)
100 Mansion Road, Hershey, PA 17033Milton Hershey School(5)
Founders Hall, Hershey, PA 17033
47,170 — ** 59,612,012 99.9
Vanguard Group, Inc.(6)
100 Vanguard Blvd, Malvern, PA 19355 13,841,275 — 9.5 — —
BlackRock, Inc.(7)
55 East 52nd Street, New York, NY 10055 13,318,795 — 9.1 — —
State Street Corporation(8)
One Lincoln Street, Boston, MA 02111 7,363,655 — 5.0 — —
Pamela M. Arway* 15,080 — ** — — James W. Brown* — — ** — — Michele G. Buck* 97,778 281,530 ** — — Victor L. Crawford* — — ** — — Robert M. Dutkowsky* 926 — ** — — Mary Kay Haben* — — ** — — James C. Katzman* — — ** — — M. Diane Koken* 600 — ** — — Robert M. Malcolm* 13,744 — ** — — Anthony J. Palmer* 13,170 — ** — — Juan R. Perez* 2,711 — ** — — Charles R. Raup 12,380 — ** — — Jason R. Reiman 8,443 6,250 ** — — Kristen J. Riggs 6,264 608 ** — — Wendy L. Schoppert* — — ** — — Steven E. Voskuil 20,351 — ** — — All directors and executive officers as a group (19 persons) 205,268 294,750 ** — —
____________________
* Director/Director nominee
** Less than 1%
39
(1) Amounts listed also include the following RSUs that will vest and be paid to the following holders within 60 days of March 18, 2022:
Name RSUs(#)
Pamela M. Arway 255 Michele G. Buck 5,380 Robert M. Dutkowsky 255 Robert M. Malcolm 255 Juan R. Perez 255 Charles R. Raup 1,360 Jason R. Reiman 940 Kristen J. Riggs 946 Steven E. Voskuil 1,260
For all directors and executive officers as a group, the amount listed also includes 1,515 RSUs that will vest and be paid within 60 days of March 18, 2022 to executive officers who are not a NEO.
Amounts listed also include shares for which certain of the directors share voting and/or investment power with one or more other persons as follows: Ms. Arway, 14,825 shares owned jointly with her spouse; Ms. Koken, 600 shares held at Glenmede Trust Company; Mr. Malcolm, 13,489 shares owned jointly with his spouse and Mr. Palmer, 13,170 shares owned jointly with his spouse.
(2) Based upon 145,928,920 shares of Common Stock outstanding on March 18, 2022.
(3) Based upon 59,613,777 shares of Class B Common Stock outstanding on March 18, 2022.
(4) Please see the section entitled “Information Regarding Our Controlling Stockholder” for more information about shares of Common Stock held by Hershey Trust Company as investments.
(5) Hershey Trust Company, as trustee for the Milton Hershey School Trust, has the right at any time to convert its Class B Common Stock into Common Stock on a share-for-share basis. If on March 18, 2022, Hershey Trust Company, as trustee for the Milton Hershey School Trust, converted all of its Class B Common Stock into Common Stock, Hershey Trust Company, as trustee for the Milton Hershey School Trust, would own beneficially 59,659,182 shares of our Common Stock (47,170 Common Stock shares plus 59,612,012 converted Class B Common Stock shares), or 29.0% of the 205,540,932 shares of Common Stock outstanding following the conversion (calculated as 145,928,920 Common Stock shares outstanding prior to the conversion plus 59,612,012 converted Class B Common Stock shares). For more information about the Milton Hershey School Trust, Hershey Trust Company, Milton Hershey School and the ownership and voting of these securities, please see the section entitled “Information Regarding Our Controlling Stockholder.”
(6) Information regarding Vanguard Group, Inc. and its beneficial holdings was obtained from a Schedule 13G/A filed with the SEC on February 10, 2022. The filing indicated that, as of December 31, 2021, Vanguard Group, Inc. had sole voting power over no shares, shared voting power over 244,857 shares, sole investment power over 13,238,323 shares and shared investment power over 602,952 shares. The filing indicated that Vanguard Group, Inc. is an investment advisor in accordance with Rule 13d-1(b)(1)(ii)(E).
(7) Information regarding BlackRock, Inc. and its beneficial holdings was obtained from a Schedule 13G/A filed with the SEC on February 1, 2022. The filing indicated that, as of December 31, 2021, BlackRock, Inc. had sole voting power over 11,627,209 shares, shared voting power over no shares, sole investment power over 13,318,795 shares and shared investment power over no shares. The filing indicated that BlackRock, Inc. is a parent holding company or control person in accordance with Rule 13d-1(b)(1)(ii)(G).
(8) Information regarding State Street Corporation and its beneficial holdings was obtained from a Schedule 13G filed with the SEC on February 11, 2022. The filing indicated that, as of December 31, 2021, State Street Corporation had sole voting and investment power over no shares, shared voting power over 6,005,771 shares and shared investment power over 7,315,013 shares. The filing indicated that State Street Corporation is a parent holding company or control person in accordance with Rule 13d-1(b)(1)(ii)(G).
Ownership of Other Company Securities Certain directors and NEOs hold Company securities not reflected in the beneficial ownership table above because they will not convert, or cannot be converted, to shares of Common Stock within 60 days of our Record Date. These securities include:
• Certain unvested RSUs or deferred Common Stock units held by our directors and NEOs; and• Certain unvested stock options held by our NEOs.
40
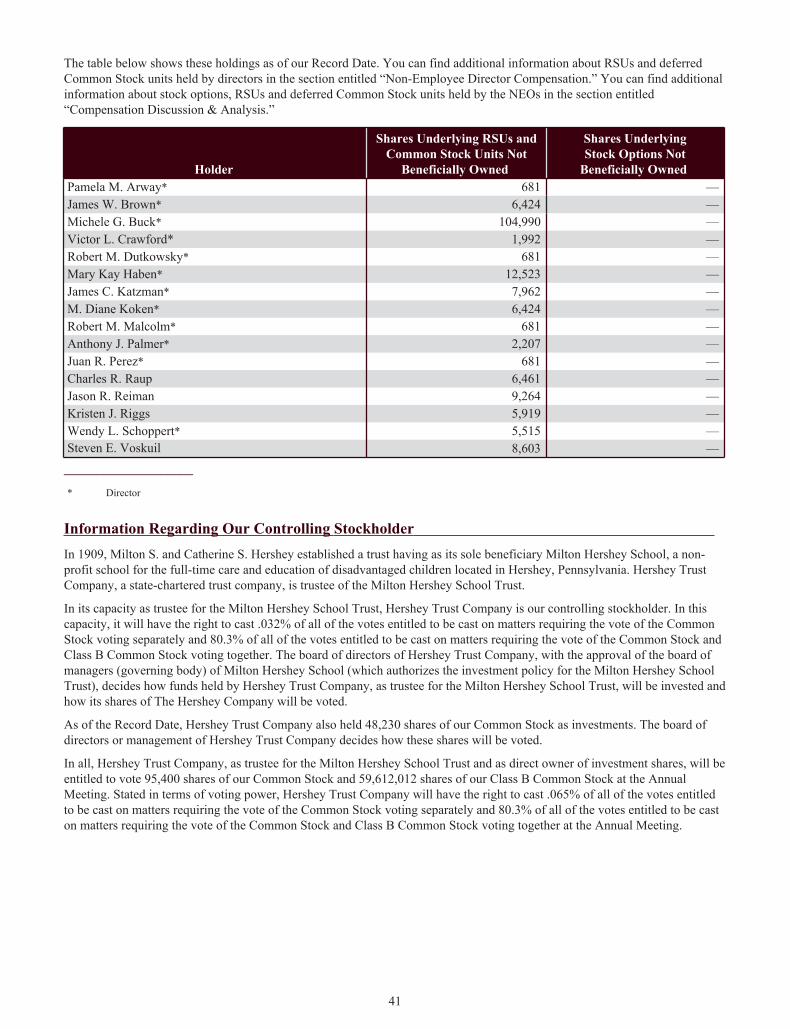
The table below shows these holdings as of our Record Date. You can find additional information about RSUs and deferred Common Stock units held by directors in the section entitled “Non-Employee Director Compensation.” You can find additional information about stock options, RSUs and deferred Common Stock units held by the NEOs in the section entitled “Compensation Discussion & Analysis.”
Holder
Shares Underlying RSUs andCommon Stock Units Not
Beneficially Owned
Shares UnderlyingStock Options Not
Beneficially Owned Pamela M. Arway* 681 — James W. Brown* 6,424 — Michele G. Buck* 104,990 — Victor L. Crawford* 1,992 — Robert M. Dutkowsky* 681 — Mary Kay Haben* 12,523 — James C. Katzman* 7,962 — M. Diane Koken* 6,424 — Robert M. Malcolm* 681 — Anthony J. Palmer* 2,207 — Juan R. Perez* 681 — Charles R. Raup 6,461 — Jason R. Reiman 9,264 — Kristen J. Riggs 5,919 — Wendy L. Schoppert* 5,515 — Steven E. Voskuil 8,603 —
____________________
* Director
Information Regarding Our Controlling Stockholder In 1909, Milton S. and Catherine S. Hershey established a trust having as its sole beneficiary Milton Hershey School, a non-profit school for the full-time care and education of disadvantaged children located in Hershey, Pennsylvania. Hershey Trust Company, a state-chartered trust company, is trustee of the Milton Hershey School Trust.
In its capacity as trustee for the Milton Hershey School Trust, Hershey Trust Company is our controlling stockholder. In this capacity, it will have the right to cast .032% of all of the votes entitled to be cast on matters requiring the vote of the Common Stock voting separately and 80.3% of all of the votes entitled to be cast on matters requiring the vote of the Common Stock and Class B Common Stock voting together. The board of directors of Hershey Trust Company, with the approval of the board of managers (governing body) of Milton Hershey School (which authorizes the investment policy for the Milton Hershey School Trust), decides how funds held by Hershey Trust Company, as trustee for the Milton Hershey School Trust, will be invested and how its shares of The Hershey Company will be voted.
As of the Record Date, Hershey Trust Company also held 48,230 shares of our Common Stock as investments. The board of directors or management of Hershey Trust Company decides how these shares will be voted.
In all, Hershey Trust Company, as trustee for the Milton Hershey School Trust and as direct owner of investment shares, will be entitled to vote 95,400 shares of our Common Stock and 59,612,012 shares of our Class B Common Stock at the Annual Meeting. Stated in terms of voting power, Hershey Trust Company will have the right to cast .065% of all of the votes entitled to be cast on matters requiring the vote of the Common Stock voting separately and 80.3% of all of the votes entitled to be cast on matters requiring the vote of the Common Stock and Class B Common Stock voting together at the Annual Meeting.
41
Our certificate of incorporation contains the following important provisions regarding our Class B Common Stock:
• All holders of Class B Common Stock, including Hershey Trust Company, as trustee for Milton Hershey School Trust, may convert any of their Class B Common Stock shares into shares of our Common Stock at any time on a share-for-share basis.
• All shares of Class B Common Stock will automatically be converted to shares of Common Stock on a share-for-share basis if Hershey Trust Company, as trustee for Milton Hershey School Trust, or any successor trustee, or Milton Hershey School, as appropriate, ceases to hold more than 50% of the total Class B Common Stock shares outstanding and at least 15% of the total Common Stock and Class B Common Stock shares outstanding.
• We must obtain the approval of Hershey Trust Company, as trustee for Milton Hershey School Trust, or any successor trustee, or Milton Hershey School, as appropriate, before we issue any Common Stock or take any other action that would deprive Hershey Trust Company, as trustee for Milton Hershey School Trust, or any successor trustee, or Milton Hershey School, as appropriate, of the ability to cast a majority of the votes on any matter where the Class B Common Stock is entitled to vote, either separately as a class or together with any other class.
42
AUDIT COMMITTEE REPORT
To Our Stockholders:The Audit Committee currently comprises five directors, each of whom is considered independent under the NYSE Rules and the rules and regulations of the SEC. The Board has determined that each member of the Audit Committee is financially literate and that each of Ms. Schoppert and Mr. Crawford qualifies as an “audit committee financial expert,” as that term is defined under the rules promulgated by the SEC.
Our role as the Audit Committee is to assist the Board in its oversight of:
• The integrity of the Company’s financial statements;• The Company’s compliance with legal and regulatory requirements;• The independent auditors’ qualifications and independence; and• The performance of the independent auditors and the Company’s internal audit function.
The Audit Committee operates under a written charter that is reviewed annually.
Our duties as an Audit Committee include overseeing the Company’s management, internal auditors and independent auditors in their performance of the following functions, for which they are responsible:
Management
• Preparing the Company’s financial statements;• Establishing effective financial reporting systems and internal controls and procedures; and• Reporting on the effectiveness of the Company’s internal control over financial reporting.
Internal Audit Department
• Independently assessing management’s system of internal controls and procedures; and• Reporting on the effectiveness of that system.
Independent Auditors
• Auditing the Company’s financial statements;• Expressing an opinion about the financial statements’ conformity with U.S. generally accepted accounting principles;
and• Annually auditing the effectiveness of the Company’s internal control over financial reporting.
We meet periodically with management, the internal auditors and independent auditors, independently and collectively, to discuss the quality of the Company’s financial reporting process and the adequacy and effectiveness of the Company’s internal controls. Prior to the Company filing its Annual Report on Form 10-K for the year ended December 31, 2021 with the SEC, we also:
• Reviewed and discussed the audited financial statements with management and the independent auditors;• Discussed with the independent auditors the matters required to be discussed by applicable requirements of the Public
Company Accounting Oversight Board and the SEC;• Received the written disclosures and the letter from the independent auditors in accordance with applicable
requirements of the Public Company Accounting Oversight Board regarding the independent auditors’ communications with the Audit Committee concerning independence; and
• Discussed with the independent auditors their independence from the Company.
We are not employees of the Company and are not performing the functions of auditors or accountants. We are not responsible as an Audit Committee or individually to conduct “field work” or other types of auditing or accounting reviews or procedures or to set auditor independence standards. In carrying out our duties as Audit Committee members, we have relied on the information provided to us by management and the independent auditors. Consequently, we do not assure that the audit of the Company’s financial statements has been carried out in accordance with generally accepted auditing standards, that the financial statements are presented in accordance with U.S. generally accepted accounting principles or that the Company’s auditors are in fact “independent.”
43

Based on the reports and discussions described in this report, and subject to the limitations on our role and responsibilities as an Audit Committee referred to above and in our charter, we recommended to the Board that the audited financial statements be included in the Company’s Annual Report on Form 10-K for the year ended December 31, 2021, filed with the SEC on February 18, 2022.
Submitted by the Audit Committee:
Wendy L. Schoppert, ChairJames W. BrownVictor L. CrawfordM. Diane KokenRobert M. Malcolm
44
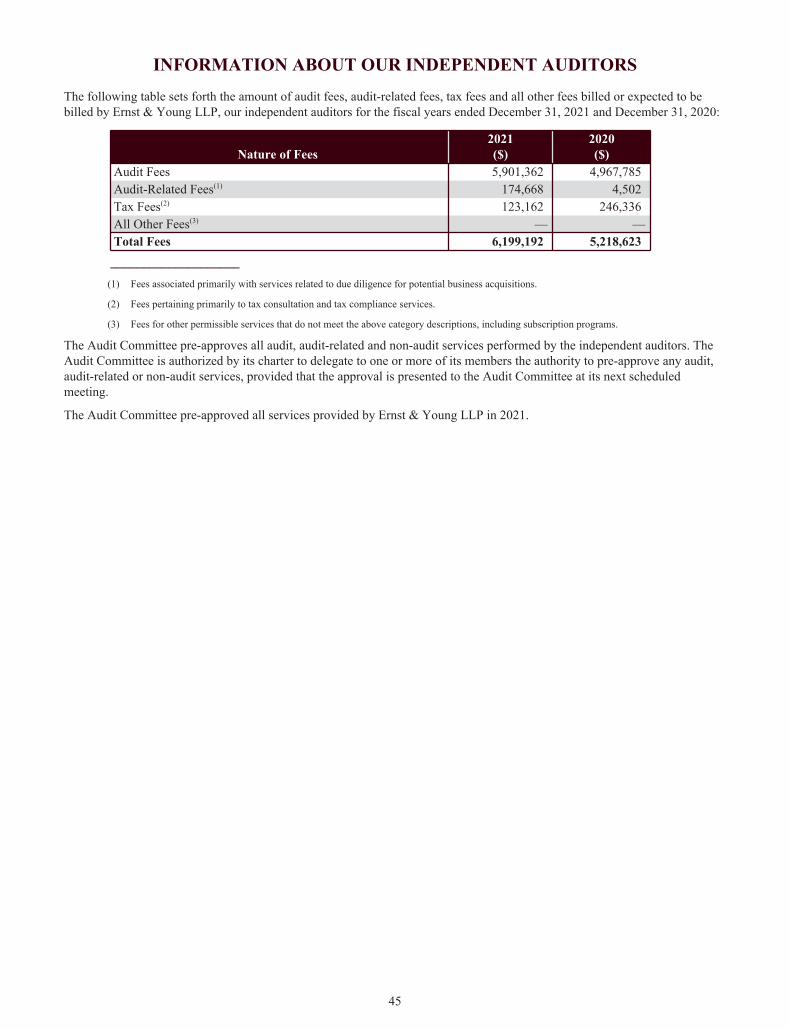
INFORMATION ABOUT OUR INDEPENDENT AUDITORS
The following table sets forth the amount of audit fees, audit-related fees, tax fees and all other fees billed or expected to be billed by Ernst & Young LLP, our independent auditors for the fiscal years ended December 31, 2021 and December 31, 2020:
Nature of Fees 2021($)
2020($)
Audit Fees 5,901,362 4,967,785Audit-Related Fees(1) 174,668 4,502Tax Fees(2) 123,162 246,336All Other Fees(3)
— — Total Fees 6,199,192 5,218,623
____________________
(1) Fees associated primarily with services related to due diligence for potential business acquisitions.
(2) Fees pertaining primarily to tax consultation and tax compliance services.
(3) Fees for other permissible services that do not meet the above category descriptions, including subscription programs.
The Audit Committee pre-approves all audit, audit-related and non-audit services performed by the independent auditors. The Audit Committee is authorized by its charter to delegate to one or more of its members the authority to pre-approve any audit, audit-related or non-audit services, provided that the approval is presented to the Audit Committee at its next scheduled meeting.
The Audit Committee pre-approved all services provided by Ernst & Young LLP in 2021.
45
PROPOSAL NO. 2 – RATIFICATION OF APPOINTMENT OF INDEPENDENT AUDITORS
üThe Board of Directors unanimously recommends that stockholders
vote FOR ratification of the Audit Committee’s appointment of Ernst & Young LLP as the Company’s independent auditors for 2022
The Audit Committee has appointed Ernst & Young LLP as the Company’s independent auditors for 2022. Although not required to do so, the Board, upon the Audit Committee’s recommendation, has determined to submit the Audit Committee’s appointment of Ernst & Young LLP as our independent auditors to stockholders for ratification as a matter of good corporate governance.
The Audit Committee’s appointment of Ernst & Young LLP as the Company’s independent auditors for 2022 will be considered ratified if at least a majority of the votes of the Common Stock and Class B Common Stock (voting together as a class) represented at the Annual Meeting are voted for the proposal. If stockholders do not ratify the appointment of Ernst & Young LLP as the Company’s independent auditors for 2022, the Audit Committee will reconsider its appointment.
Representatives of Ernst & Young LLP will attend the Annual Meeting, will have the opportunity to make a statement, if they so desire, and will be available to respond to questions.
46
COMPENSATION DISCUSSION & ANALYSIS
This section discusses and analyzes the decisions we made concerning the compensation of our named executive officers (“NEOs”) for 2021. It also describes the process for determining executive compensation and the factors considered in determining the amount of compensation awarded to our NEOs. Our NEOs for 2021 are:
Name Title Michele G. Buck Chairman of the Board, President and Chief Executive Officer (“CEO”) Steven E. Voskuil Senior Vice President, Chief Financial Officer (“CFO”) Charles R. Raup President, U.S.Jason R. Reiman Senior Vice President, Chief Supply Chain OfficerKristen J. Riggs Senior Vice President, Chief Growth Officer
Executive Summary
Strategic PlanThe Hershey Company (the “Company”), headquartered in Hershey, Pa., is a global confectionery leader known for making more moments of goodness through its chocolate, sweets, mints, gum and other great-tasting snacks. We have approximately 18,990 employees around the world who work every day to deliver delicious, quality products. We have more than 100 brands that drive approximately $8.9 billion in annual revenues.
Our vision is to be a snacking powerhouse. We are currently the number two snacking manufacturer in the United States. We aspire to be a leader in meeting consumers’ evolving snacking needs while strengthening the capabilities that drive our growth. We are focused on four strategic imperatives to ensure the Company’s success now and in the future:
• Drive core confection business and broaden participation in snacking;• Deliver profitable international growth;• Expand competitive advantage through differentiated capabilities; and• Responsibly manage our operations to ensure the long-term sustainability of our business, our planet and our people.
Our strategic plan, and the financial metrics we establish to help achieve and measure success against our plan, serve as the foundation of our executive compensation program. In February 2021, we announced Company financial expectations for 2021 would be in line with our long-term growth algorithm of 2–4% net sales growth and 6–8% earnings per share growth. For 2021, the Company exceeded these financial expectations.
See the section entitled “Annual Incentives” for more information regarding our 2021 annual incentive targets and related results.
47
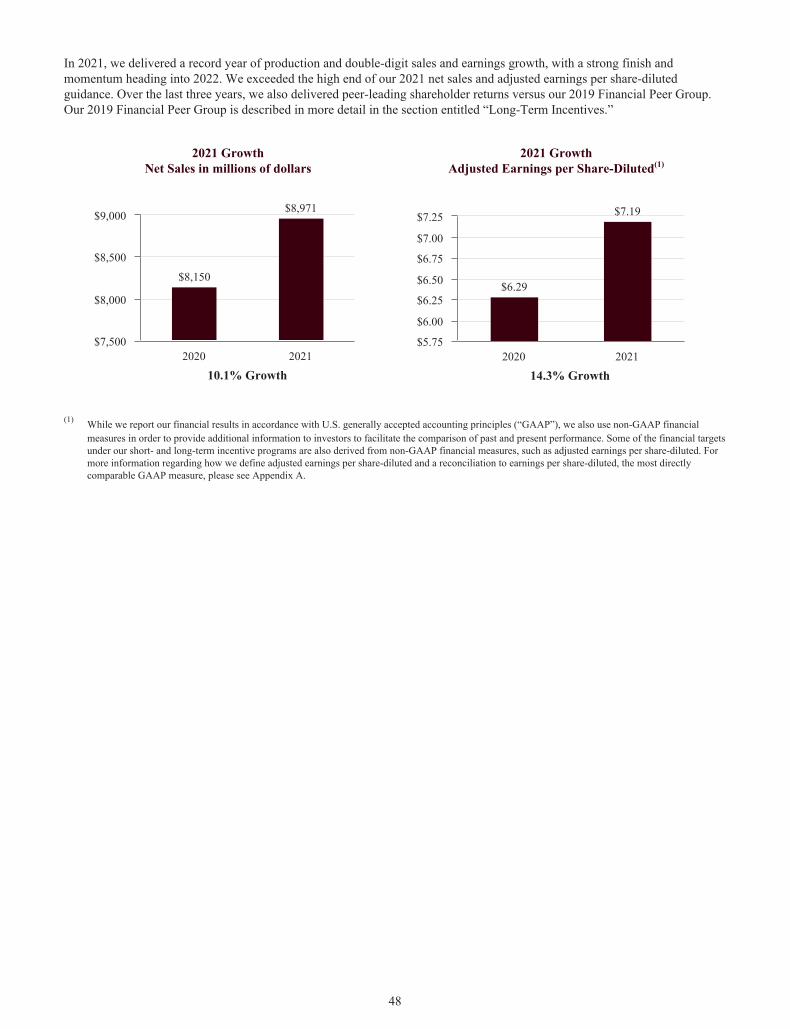
In 2021, we delivered a record year of production and double-digit sales and earnings growth, with a strong finish and momentum heading into 2022. We exceeded the high end of our 2021 net sales and adjusted earnings per share-diluted guidance. Over the last three years, we also delivered peer-leading shareholder returns versus our 2019 Financial Peer Group. Our 2019 Financial Peer Group is described in more detail in the section entitled “Long-Term Incentives.”
2021 GrowthNet Sales in millions of dollars
2021 GrowthAdjusted Earnings per Share-Diluted(1)
10.1% Growth
$8,150
$8,971
2020 2021$7,500
$8,000
$8,500
$9,000
14.3% Growth
$6.29
$7.19
2020 2021$5.75
$6.00
$6.25
$6.50
$6.75
$7.00
$7.25
(1) While we report our financial results in accordance with U.S. generally accepted accounting principles (“GAAP”), we also use non-GAAP financial measures in order to provide additional information to investors to facilitate the comparison of past and present performance. Some of the financial targets under our short- and long-term incentive programs are also derived from non-GAAP financial measures, such as adjusted earnings per share-diluted. For more information regarding how we define adjusted earnings per share-diluted and a reconciliation to earnings per share-diluted, the most directly comparable GAAP measure, please see Appendix A.
48
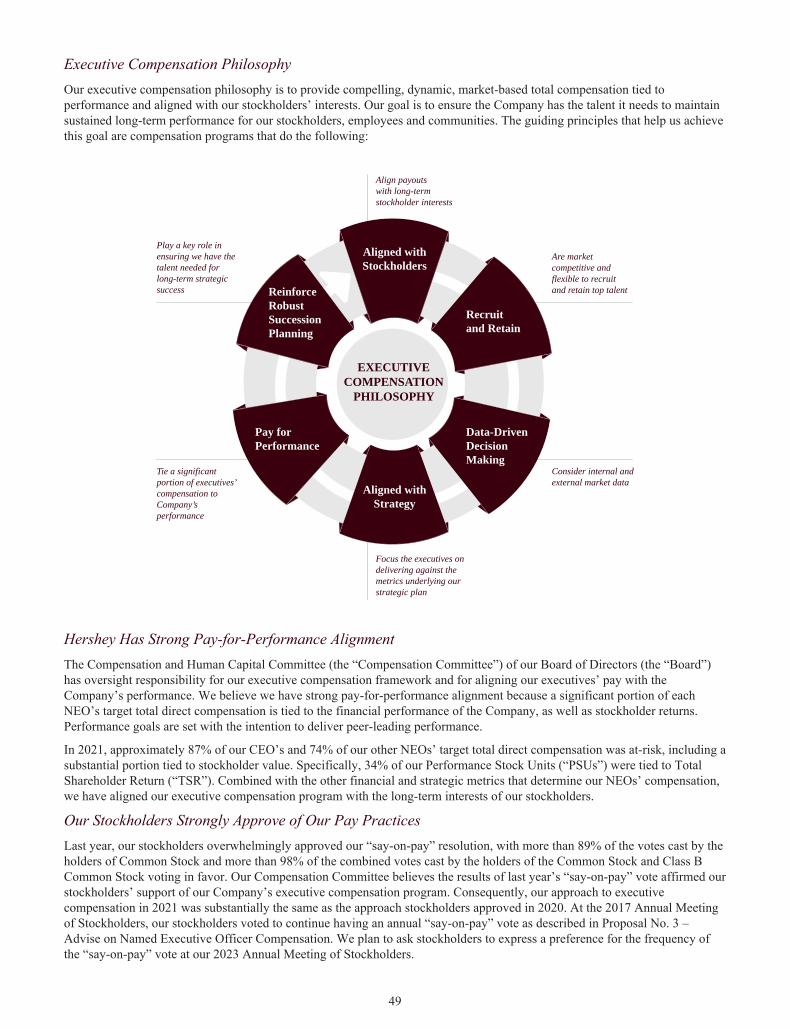
Executive Compensation PhilosophyOur executive compensation philosophy is to provide compelling, dynamic, market-based total compensation tied to performance and aligned with our stockholders’ interests. Our goal is to ensure the Company has the talent it needs to maintain sustained long-term performance for our stockholders, employees and communities. The guiding principles that help us achieve this goal are compensation programs that do the following:
Hershey Has Strong Pay-for-Performance AlignmentThe Compensation and Human Capital Committee (the “Compensation Committee”) of our Board of Directors (the “Board”) has oversight responsibility for our executive compensation framework and for aligning our executives’ pay with the Company’s performance. We believe we have strong pay-for-performance alignment because a significant portion of each NEO’s target total direct compensation is tied to the financial performance of the Company, as well as stockholder returns. Performance goals are set with the intention to deliver peer-leading performance.
In 2021, approximately 87% of our CEO’s and 74% of our other NEOs’ target total direct compensation was at-risk, including a substantial portion tied to stockholder value. Specifically, 34% of our Performance Stock Units (“PSUs”) were tied to Total Shareholder Return (“TSR”). Combined with the other financial and strategic metrics that determine our NEOs’ compensation, we have aligned our executive compensation program with the long-term interests of our stockholders.
Our Stockholders Strongly Approve of Our Pay PracticesLast year, our stockholders overwhelmingly approved our “say-on-pay” resolution, with more than 89% of the votes cast by the holders of Common Stock and more than 98% of the combined votes cast by the holders of the Common Stock and Class B Common Stock voting in favor. Our Compensation Committee believes the results of last year’s “say-on-pay” vote affirmed our stockholders’ support of our Company’s executive compensation program. Consequently, our approach to executive compensation in 2021 was substantially the same as the approach stockholders approved in 2020. At the 2017 Annual Meeting of Stockholders, our stockholders voted to continue having an annual “say-on-pay” vote as described in Proposal No. 3 – Advise on Named Executive Officer Compensation. We plan to ask stockholders to express a preference for the frequency of the “say-on-pay” vote at our 2023 Annual Meeting of Stockholders.
49
Align payoutswith long-term stockholder interests
EXECUTIVE COMPENSATION
PHILOSOPHY
Are market competitive and flexible to recruit and retain top talent
Consider internal and external market data
Play a key role inensuring we have thetalent needed for long-term strategic success
Tie a significantportion of executives’ compensation to Company’s performance
Focus the executives on delivering against the metrics underlying our strategic plan
Data-Driven Decision Making
Recruitand Retain
Pay for Performance
Reinforce Robust Succession Planning
Aligned with Strategy
Aligned with Stockholders

We believe our compensation and governance policies and practices are significant drivers of our stockholder support. These policies and practices include:
WHAT WE DO
Pay for performance: A substantial percentage of each NEO’s target total direct compensation is at-risk.Performance measures support strategic objectives: The performance measures we use in our compensation programs reflect strategic and operating objectives, creating long-term value for our stockholders.Appropriate risk-taking: We set performance goals that consider our publicly-announced financial expectations, which we believe will encourage appropriate risk taking. Our incentive programs are appropriately capped so as not to encourage excessive risk taking. “Double-trigger” benefits in the event of a change in control: In the event of a change in control, the payment of severance benefits and the acceleration of vesting of long-term incentive awards that are replaced with qualifying awards will not occur unless there is also a qualifying termination of employment upon or within two years following the change in control.Clawbacks and other covenants: We require our NEOs to enter into an Employee Confidentiality and Restrictive Covenant Agreement (“ECRCA”) as a condition of receipt of long-term incentive awards. Failure to comply with the ECRCA may subject the employee to cancellation of awards and a requirement to repay amounts received from awards.
Under the Equity and Incentive Compensation Plan (“EICP”), when an individual’s actions result in the filing of financial documents not in compliance with financial reporting requirements, the Company has the right to recoup or require repayment of an award earned or accrued during the 12-month period following the first public issuance or filing with the Securities and Exchange Commission (“SEC”) of the non-compliant document.
Beginning in 2021, the Company updated the clawback language within our One Hershey Incentive Program (“OHIP”) and long-term incentive award agreements to authorize the Compensation Committee to seek repayment in the event of intentional misconduct by a grantee that causes the Company material financial or reputational harm.Significant stock ownership guidelines: Our NEOs and other executives are required to accumulate and hold stock equal to a multiple of base salary. If an executive has not met his or her ownership requirement in a timely manner, the executive is required to retain a portion of shares received under long-term incentive awards until the requirement is met.
WHAT WE DON’T DO
Excessive perquisites: Executive perquisites are kept to a minimal level relative to a NEO’s total compensation and do not play a significant role in our executive compensation program. Tax gross-ups: We generally do not provide tax gross-ups, except for relocation expenses and standard expatriate tax equalization benefits available to all similarly situated employees.Prepayment of dividends on unearned PSUs: Dividends are not paid on PSU awards during the three-year performance cycle.Hedging Company stock: Our NEOs, directors, employees and other insiders are prohibited from entering into hedging transactions related to our stock, including forward sale purchase contracts, equity swaps, collars or exchange funds.Pledging Company stock: Our NEOs, directors, employees and other insiders are prohibited from entering into pledging transactions related to our stock.Re-pricings or exchanges of underwater stock options: Our stockholder-approved EICP prohibits re-pricing or exchange of underwater stock options without stockholder approval.
50
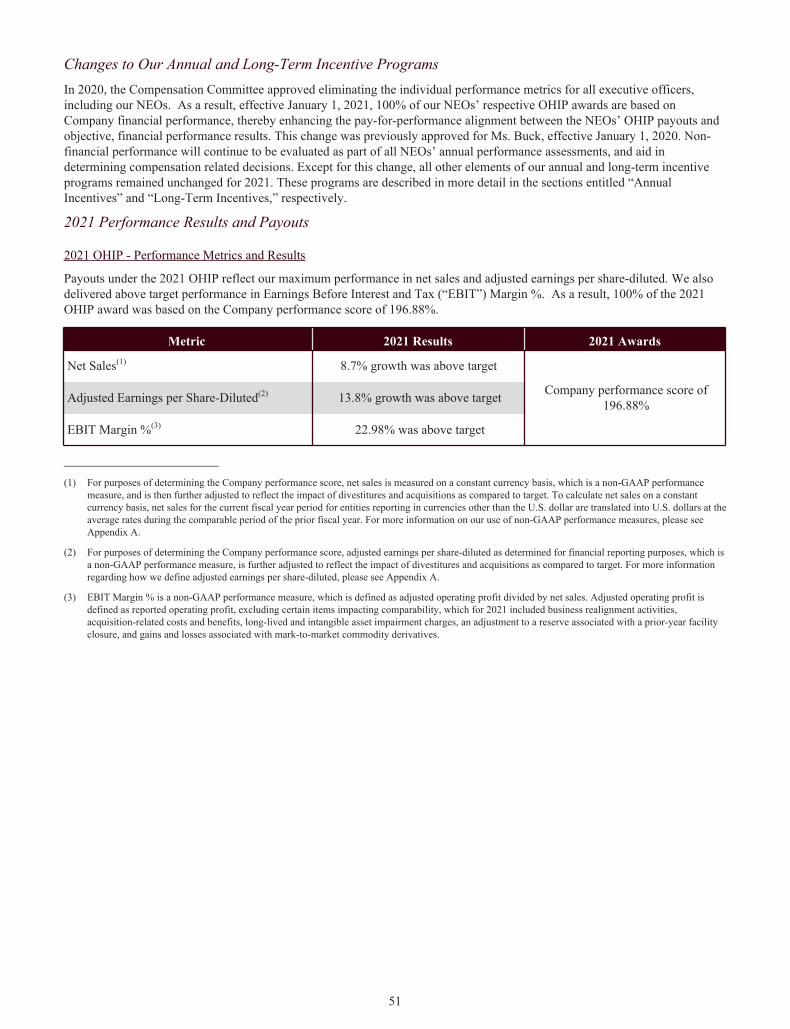
Changes to Our Annual and Long-Term Incentive ProgramsIn 2020, the Compensation Committee approved eliminating the individual performance metrics for all executive officers, including our NEOs. As a result, effective January 1, 2021, 100% of our NEOs’ respective OHIP awards are based on Company financial performance, thereby enhancing the pay-for-performance alignment between the NEOs’ OHIP payouts and objective, financial performance results. This change was previously approved for Ms. Buck, effective January 1, 2020. Non-financial performance will continue to be evaluated as part of all NEOs’ annual performance assessments, and aid in determining compensation related decisions. Except for this change, all other elements of our annual and long-term incentive programs remained unchanged for 2021. These programs are described in more detail in the sections entitled “Annual Incentives” and “Long-Term Incentives,” respectively.
2021 Performance Results and Payouts
2021 OHIP - Performance Metrics and Results
Payouts under the 2021 OHIP reflect our maximum performance in net sales and adjusted earnings per share-diluted. We also delivered above target performance in Earnings Before Interest and Tax (“EBIT”) Margin %. As a result, 100% of the 2021 OHIP award was based on the Company performance score of 196.88%.
Metric 2021 ResultsRe 2021 Awards
Net Sales(1) 8.7% growth was above target
Company performance score of 196.88%Adjusted Earnings per Share-Diluted(2) 13.8% growth was above target
EBIT Margin %(3) 22.98% was above target
____________________(1) For purposes of determining the Company performance score, net sales is measured on a constant currency basis, which is a non-GAAP performance
measure, and is then further adjusted to reflect the impact of divestitures and acquisitions as compared to target. To calculate net sales on a constant currency basis, net sales for the current fiscal year period for entities reporting in currencies other than the U.S. dollar are translated into U.S. dollars at the average rates during the comparable period of the prior fiscal year. For more information on our use of non-GAAP performance measures, please see Appendix A.
(2) For purposes of determining the Company performance score, adjusted earnings per share-diluted as determined for financial reporting purposes, which is a non-GAAP performance measure, is further adjusted to reflect the impact of divestitures and acquisitions as compared to target. For more information regarding how we define adjusted earnings per share-diluted, please see Appendix A.
(3) EBIT Margin % is a non-GAAP performance measure, which is defined as adjusted operating profit divided by net sales. Adjusted operating profit is defined as reported operating profit, excluding certain items impacting comparability, which for 2021 included business realignment activities, acquisition-related costs and benefits, long-lived and intangible asset impairment charges, an adjustment to a reserve associated with a prior-year facility closure, and gains and losses associated with mark-to-market commodity derivatives.
51
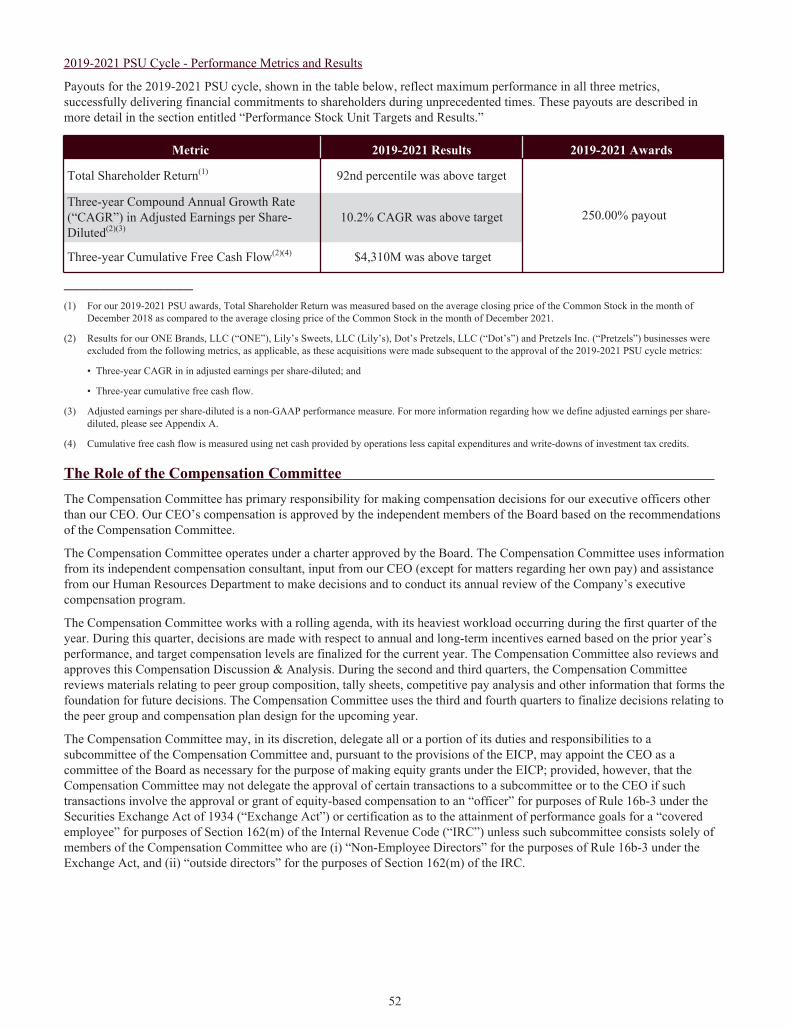
2019-2021 PSU Cycle - Performance Metrics and Results
Payouts for the 2019-2021 PSU cycle, shown in the table below, reflect maximum performance in all three metrics, successfully delivering financial commitments to shareholders during unprecedented times. These payouts are described in more detail in the section entitled “Performance Stock Unit Targets and Results.”
Metric 2019-2021 Results 2019-2021 Awards
Total Shareholder Return(1) 92nd percentile was above target
250.00% payoutThree-year Compound Annual Growth Rate (“CAGR”) in Adjusted Earnings per Share-Diluted(2)(3)
10.2% CAGR was above target
Three-year Cumulative Free Cash Flow(2)(4) $4,310M was above target
____________________
(1) For our 2019-2021 PSU awards, Total Shareholder Return was measured based on the average closing price of the Common Stock in the month of December 2018 as compared to the average closing price of the Common Stock in the month of December 2021.
(2) Results for our ONE Brands, LLC (“ONE”), Lily’s Sweets, LLC (Lily’s), Dot’s Pretzels, LLC (“Dot’s”) and Pretzels Inc. (“Pretzels”) businesses were excluded from the following metrics, as applicable, as these acquisitions were made subsequent to the approval of the 2019-2021 PSU cycle metrics:
• Three-year CAGR in in adjusted earnings per share-diluted; and
• Three-year cumulative free cash flow.
(3) Adjusted earnings per share-diluted is a non-GAAP performance measure. For more information regarding how we define adjusted earnings per share-diluted, please see Appendix A.
(4) Cumulative free cash flow is measured using net cash provided by operations less capital expenditures and write-downs of investment tax credits.
The Role of the Compensation Committee The Compensation Committee has primary responsibility for making compensation decisions for our executive officers other than our CEO. Our CEO’s compensation is approved by the independent members of the Board based on the recommendations of the Compensation Committee.
The Compensation Committee operates under a charter approved by the Board. The Compensation Committee uses information from its independent compensation consultant, input from our CEO (except for matters regarding her own pay) and assistance from our Human Resources Department to make decisions and to conduct its annual review of the Company’s executive compensation program.
The Compensation Committee works with a rolling agenda, with its heaviest workload occurring during the first quarter of the year. During this quarter, decisions are made with respect to annual and long-term incentives earned based on the prior year’s performance, and target compensation levels are finalized for the current year. The Compensation Committee also reviews and approves this Compensation Discussion & Analysis. During the second and third quarters, the Compensation Committee reviews materials relating to peer group composition, tally sheets, competitive pay analysis and other information that forms the foundation for future decisions. The Compensation Committee uses the third and fourth quarters to finalize decisions relating to the peer group and compensation plan design for the upcoming year.
The Compensation Committee may, in its discretion, delegate all or a portion of its duties and responsibilities to a subcommittee of the Compensation Committee and, pursuant to the provisions of the EICP, may appoint the CEO as a committee of the Board as necessary for the purpose of making equity grants under the EICP; provided, however, that the Compensation Committee may not delegate the approval of certain transactions to a subcommittee or to the CEO if such transactions involve the approval or grant of equity-based compensation to an “officer” for purposes of Rule 16b-3 under the Securities Exchange Act of 1934 (“Exchange Act”) or certification as to the attainment of performance goals for a “covered employee” for purposes of Section 162(m) of the Internal Revenue Code (“IRC”) unless such subcommittee consists solely of members of the Compensation Committee who are (i) “Non-Employee Directors” for the purposes of Rule 16b-3 under the Exchange Act, and (ii) “outside directors” for the purposes of Section 162(m) of the IRC.
52
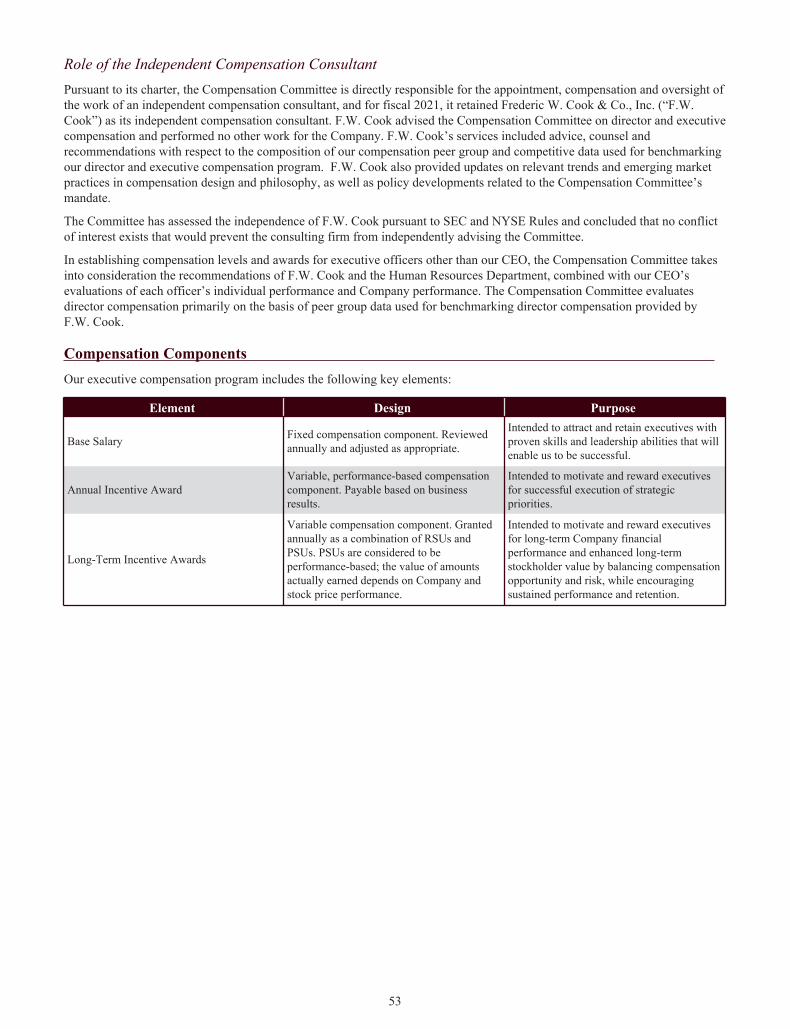
Role of the Independent Compensation ConsultantPursuant to its charter, the Compensation Committee is directly responsible for the appointment, compensation and oversight of the work of an independent compensation consultant, and for fiscal 2021, it retained Frederic W. Cook & Co., Inc. (“F.W. Cook”) as its independent compensation consultant. F.W. Cook advised the Compensation Committee on director and executive compensation and performed no other work for the Company. F.W. Cook’s services included advice, counsel and recommendations with respect to the composition of our compensation peer group and competitive data used for benchmarking our director and executive compensation program. F.W. Cook also provided updates on relevant trends and emerging market practices in compensation design and philosophy, as well as policy developments related to the Compensation Committee’s mandate.
The Committee has assessed the independence of F.W. Cook pursuant to SEC and NYSE Rules and concluded that no conflict of interest exists that would prevent the consulting firm from independently advising the Committee.
In establishing compensation levels and awards for executive officers other than our CEO, the Compensation Committee takes into consideration the recommendations of F.W. Cook and the Human Resources Department, combined with our CEO’s evaluations of each officer’s individual performance and Company performance. The Compensation Committee evaluates director compensation primarily on the basis of peer group data used for benchmarking director compensation provided by F.W. Cook.
Compensation Components Our executive compensation program includes the following key elements:
Element Design Purpose
Base Salary Fixed compensation component. Reviewed annually and adjusted as appropriate.
Intended to attract and retain executives with proven skills and leadership abilities that will enable us to be successful.
Annual Incentive AwardVariable, performance-based compensation component. Payable based on business results.
Intended to motivate and reward executives for successful execution of strategic priorities.
Long-Term Incentive Awards
Variable compensation component. Granted annually as a combination of RSUs and PSUs. PSUs are considered to be performance-based; the value of amounts actually earned depends on Company and stock price performance.
Intended to motivate and reward executives for long-term Company financial performance and enhanced long-term stockholder value by balancing compensation opportunity and risk, while encouraging sustained performance and retention.
53
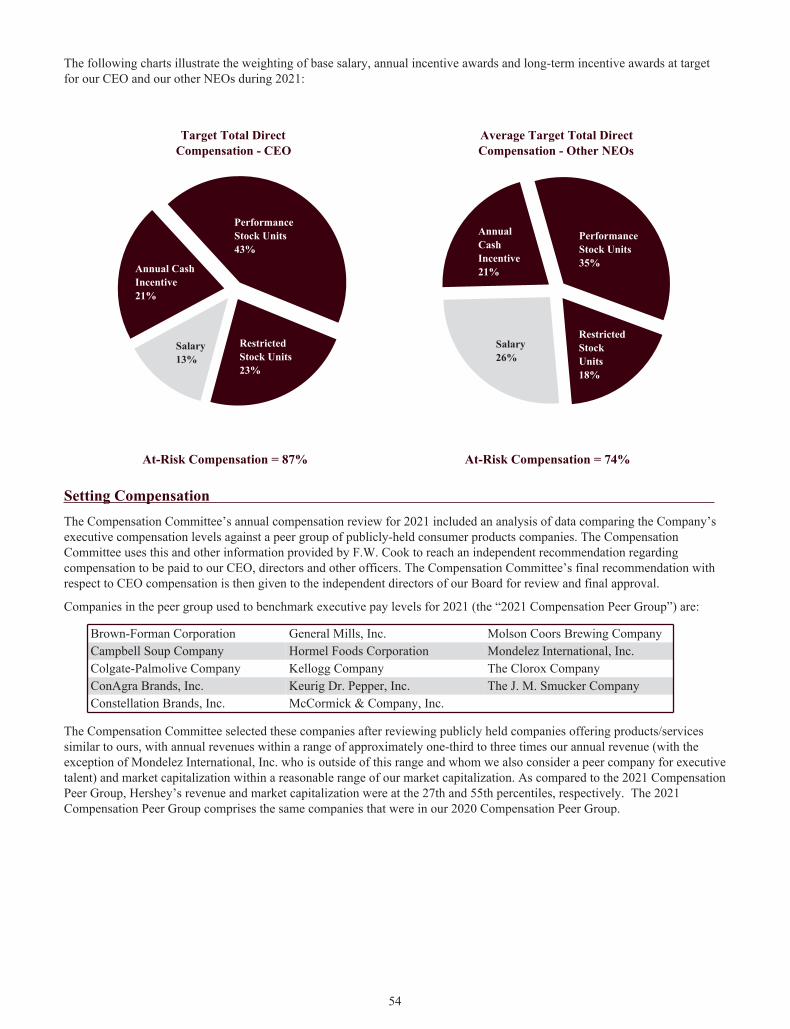
The following charts illustrate the weighting of base salary, annual incentive awards and long-term incentive awards at target for our CEO and our other NEOs during 2021:
Target Total DirectCompensation - CEO
Salary13%
Annual CashIncentive21%
PerformanceStock Units43%
RestrictedStock Units23%
Average Target Total DirectCompensation - Other NEOs
Salary26%
AnnualCashIncentive21%
PerformanceStock Units35%
RestrictedStockUnits18%
At-Risk Compensation = 87% At-Risk Compensation = 74%
Setting Compensation The Compensation Committee’s annual compensation review for 2021 included an analysis of data comparing the Company’s executive compensation levels against a peer group of publicly-held consumer products companies. The Compensation Committee uses this and other information provided by F.W. Cook to reach an independent recommendation regarding compensation to be paid to our CEO, directors and other officers. The Compensation Committee’s final recommendation with respect to CEO compensation is then given to the independent directors of our Board for review and final approval.
Companies in the peer group used to benchmark executive pay levels for 2021 (the “2021 Compensation Peer Group”) are:
Brown-Forman Corporation General Mills, Inc. Molson Coors Brewing Company Campbell Soup Company Hormel Foods Corporation Mondelez International, Inc.Colgate-Palmolive Company Kellogg Company The Clorox Company ConAgra Brands, Inc. Keurig Dr. Pepper, Inc. The J. M. Smucker Company Constellation Brands, Inc. McCormick & Company, Inc.
The Compensation Committee selected these companies after reviewing publicly held companies offering products/services similar to ours, with annual revenues within a range of approximately one-third to three times our annual revenue (with the exception of Mondelez International, Inc. who is outside of this range and whom we also consider a peer company for executive talent) and market capitalization within a reasonable range of our market capitalization. As compared to the 2021 Compensation Peer Group, Hershey’s revenue and market capitalization were at the 27th and 55th percentiles, respectively. The 2021 Compensation Peer Group comprises the same companies that were in our 2020 Compensation Peer Group.
54
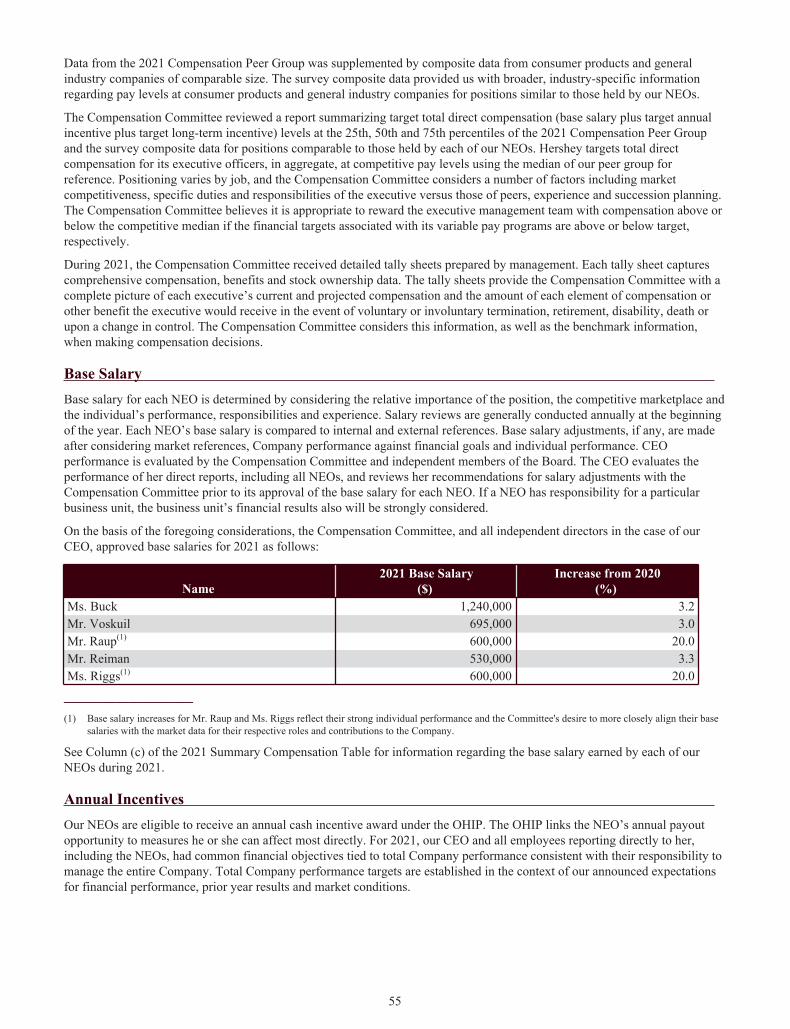
Data from the 2021 Compensation Peer Group was supplemented by composite data from consumer products and general industry companies of comparable size. The survey composite data provided us with broader, industry-specific information regarding pay levels at consumer products and general industry companies for positions similar to those held by our NEOs.
The Compensation Committee reviewed a report summarizing target total direct compensation (base salary plus target annual incentive plus target long-term incentive) levels at the 25th, 50th and 75th percentiles of the 2021 Compensation Peer Group and the survey composite data for positions comparable to those held by each of our NEOs. Hershey targets total direct compensation for its executive officers, in aggregate, at competitive pay levels using the median of our peer group for reference. Positioning varies by job, and the Compensation Committee considers a number of factors including market competitiveness, specific duties and responsibilities of the executive versus those of peers, experience and succession planning. The Compensation Committee believes it is appropriate to reward the executive management team with compensation above or below the competitive median if the financial targets associated with its variable pay programs are above or below target, respectively.
During 2021, the Compensation Committee received detailed tally sheets prepared by management. Each tally sheet captures comprehensive compensation, benefits and stock ownership data. The tally sheets provide the Compensation Committee with a complete picture of each executive’s current and projected compensation and the amount of each element of compensation or other benefit the executive would receive in the event of voluntary or involuntary termination, retirement, disability, death or upon a change in control. The Compensation Committee considers this information, as well as the benchmark information, when making compensation decisions.
Base Salary Base salary for each NEO is determined by considering the relative importance of the position, the competitive marketplace and the individual’s performance, responsibilities and experience. Salary reviews are generally conducted annually at the beginning of the year. Each NEO’s base salary is compared to internal and external references. Base salary adjustments, if any, are made after considering market references, Company performance against financial goals and individual performance. CEO performance is evaluated by the Compensation Committee and independent members of the Board. The CEO evaluates the performance of her direct reports, including all NEOs, and reviews her recommendations for salary adjustments with the Compensation Committee prior to its approval of the base salary for each NEO. If a NEO has responsibility for a particular business unit, the business unit’s financial results also will be strongly considered.
On the basis of the foregoing considerations, the Compensation Committee, and all independent directors in the case of our CEO, approved base salaries for 2021 as follows:
Name 2021 Base Salary
($) Increase from 2020
(%) Ms. Buck 1,240,000 3.2Mr. Voskuil 695,000 3.0Mr. Raup(1) 600,000 20.0Mr. Reiman 530,000 3.3Ms. Riggs(1) 600,000 20.0
____________________
(1) Base salary increases for Mr. Raup and Ms. Riggs reflect their strong individual performance and the Committee's desire to more closely align their base salaries with the market data for their respective roles and contributions to the Company.
See Column (c) of the 2021 Summary Compensation Table for information regarding the base salary earned by each of our NEOs during 2021.
Annual Incentives Our NEOs are eligible to receive an annual cash incentive award under the OHIP. The OHIP links the NEO’s annual payout opportunity to measures he or she can affect most directly. For 2021, our CEO and all employees reporting directly to her, including the NEOs, had common financial objectives tied to total Company performance consistent with their responsibility to manage the entire Company. Total Company performance targets are established in the context of our announced expectations for financial performance, prior year results and market conditions.
55

For 2021, our NEOs were eligible to earn individual OHIP awards as follows:
Name 2021 Target OHIP(% of Base Salary)
Ms. Buck 160Mr. Voskuil 90Mr. Raup 80Mr. Reiman 70Ms. Riggs 80
In determining the target OHIP percentage for each of the NEOs, the Compensation Committee, and the independent directors in the case of our CEO, considered the value of target total cash compensation against market references. Target total cash compensation levels for each of the NEOs fall within an appropriate range relative to the median for comparable positions in the market given each incumbent’s performance, responsibilities and tenure in the role.
In general, the final OHIP award is determined by multiplying the NEO’s base salary, the applicable target percentage and performance scores ranging from 0% to 200% based on Company performance. The Company financial performance goals are established at the beginning of each year by the Compensation Committee. If performance scores exceed the target objectives, a NEO may receive an OHIP payout greater than his or her target award value; however, payouts will not exceed 200% of each NEO’s target opportunity. If performance scores are below the target objectives, the NEO’s OHIP payout will be below his or her target award value, subject to no award if performance is below threshold levels.
2021 OHIP Financial Performance Targets and Results (100% of Total OHIP)Our 2021 OHIP financial performance targets, our financial performance results for 2021 and the resulting financial performance scores for OHIP were as follows:
Metric 2021 Target 2021 Actual
TargetAward
(%)
PerformanceScore(%) ($) (% growth) ($) (% growth)
Net Sales(1) 8.407 billion 3.2 8.859 billion 8.7 50.00 100.00 Adjusted Earnings per Share-Diluted(2) 6.73 7.0 7.16 13.8 25.00 50.00
EBIT Margin %(3) 22.70%27 basis
points 22.98%55 basis
points 25.00 46.88 Total OHIP Company Score 100.00 196.88
____________________
(1) For purposes of determining the Company performance score, net sales is measured on a constant currency basis, which is a non-GAAP performance measure, and is then further adjusted to reflect the impact of divestitures and acquisitions as compared to target. To calculate net sales on a constant currency basis, net sales for the current fiscal year period for entities reporting in currencies other than the U.S. dollar are translated into U.S. dollars at the average rates during the comparable period of the prior fiscal year. For more information on our use of non-GAAP performance measures, please see Appendix A.
(2) For purposes of determining the Company performance score, adjusted earnings per share-diluted as determined for financial reporting purposes, which is a non-GAAP performance measure, is further adjusted to reflect the impact of divestitures and acquisitions as compared to target. For more information regarding how we define adjusted earnings per share-diluted, please see Appendix A.
(3) EBIT Margin % is a non-GAAP performance measure, which is defined as adjusted operating profit divided by net sales. Adjusted operating profit is defined as reported operating profit, excluding certain items impacting comparability, which for 2021 included business realignment activities, acquisition-related costs and benefits, long-lived and intangible asset impairment charges, an adjustment to a reserve associated with a prior-year facility closure, and gains and losses associated with mark-to-market commodity derivatives.
56
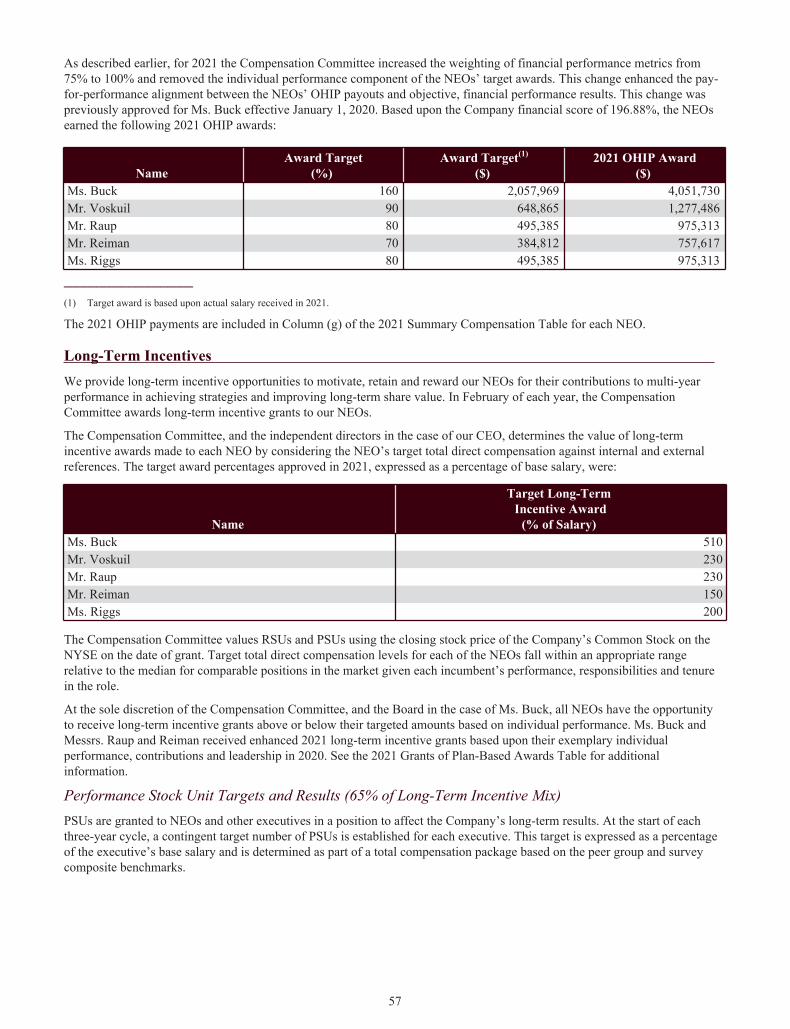
As described earlier, for 2021 the Compensation Committee increased the weighting of financial performance metrics from 75% to 100% and removed the individual performance component of the NEOs’ target awards. This change enhanced the pay-for-performance alignment between the NEOs’ OHIP payouts and objective, financial performance results. This change was previously approved for Ms. Buck effective January 1, 2020. Based upon the Company financial score of 196.88%, the NEOs earned the following 2021 OHIP awards:
Name Award Target
(%) Award Target(1)
($) 2021 OHIP Award
($) Ms. Buck 160 2,057,969 4,051,730 Mr. Voskuil 90 648,865 1,277,486 Mr. Raup 80 495,385 975,313 Mr. Reiman 70 384,812 757,617 Ms. Riggs 80 495,385 975,313
____________________
(1) Target award is based upon actual salary received in 2021.
The 2021 OHIP payments are included in Column (g) of the 2021 Summary Compensation Table for each NEO.
Long-Term Incentives We provide long-term incentive opportunities to motivate, retain and reward our NEOs for their contributions to multi-year performance in achieving strategies and improving long-term share value. In February of each year, the Compensation Committee awards long-term incentive grants to our NEOs.
The Compensation Committee, and the independent directors in the case of our CEO, determines the value of long-term incentive awards made to each NEO by considering the NEO’s target total direct compensation against internal and external references. The target award percentages approved in 2021, expressed as a percentage of base salary, were:
Name
Target Long-Term Incentive Award
(% of Salary) Ms. Buck 510Mr. Voskuil 230Mr. Raup 230Mr. Reiman 150Ms. Riggs 200
The Compensation Committee values RSUs and PSUs using the closing stock price of the Company’s Common Stock on the NYSE on the date of grant. Target total direct compensation levels for each of the NEOs fall within an appropriate range relative to the median for comparable positions in the market given each incumbent’s performance, responsibilities and tenure in the role.
At the sole discretion of the Compensation Committee, and the Board in the case of Ms. Buck, all NEOs have the opportunity to receive long-term incentive grants above or below their targeted amounts based on individual performance. Ms. Buck and Messrs. Raup and Reiman received enhanced 2021 long-term incentive grants based upon their exemplary individual performance, contributions and leadership in 2020. See the 2021 Grants of Plan-Based Awards Table for additional information.
Performance Stock Unit Targets and Results (65% of Long-Term Incentive Mix)PSUs are granted to NEOs and other executives in a position to affect the Company’s long-term results. At the start of each three-year cycle, a contingent target number of PSUs is established for each executive. This target is expressed as a percentage of the executive’s base salary and is determined as part of a total compensation package based on the peer group and survey composite benchmarks.
57
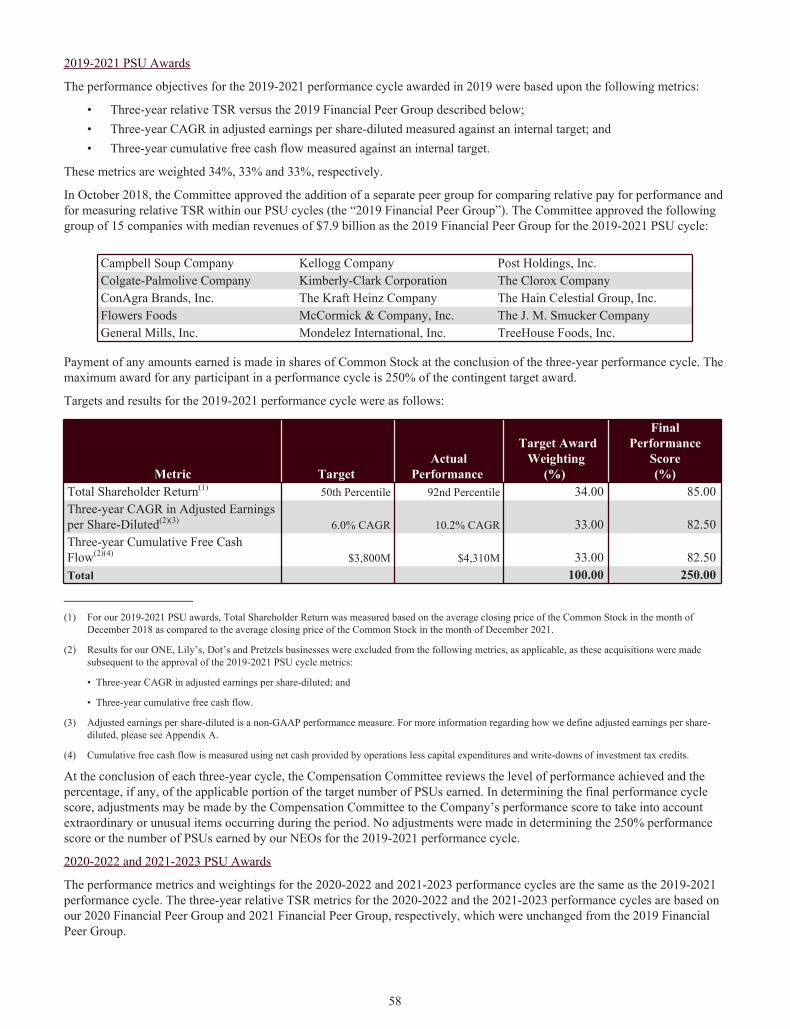
2019-2021 PSU Awards
The performance objectives for the 2019-2021 performance cycle awarded in 2019 were based upon the following metrics:
• Three-year relative TSR versus the 2019 Financial Peer Group described below;• Three-year CAGR in adjusted earnings per share-diluted measured against an internal target; and• Three-year cumulative free cash flow measured against an internal target.
These metrics are weighted 34%, 33% and 33%, respectively.
In October 2018, the Committee approved the addition of a separate peer group for comparing relative pay for performance and for measuring relative TSR within our PSU cycles (the “2019 Financial Peer Group”). The Committee approved the following group of 15 companies with median revenues of $7.9 billion as the 2019 Financial Peer Group for the 2019-2021 PSU cycle:
Campbell Soup Company Kellogg Company Post Holdings, Inc.Colgate-Palmolive Company Kimberly-Clark Corporation The Clorox Company ConAgra Brands, Inc. The Kraft Heinz Company The Hain Celestial Group, Inc.Flowers Foods McCormick & Company, Inc. The J. M. Smucker Company General Mills, Inc. Mondelez International, Inc. TreeHouse Foods, Inc.
Payment of any amounts earned is made in shares of Common Stock at the conclusion of the three-year performance cycle. The maximum award for any participant in a performance cycle is 250% of the contingent target award.
Targets and results for the 2019-2021 performance cycle were as follows:
Metric Target Actual
Performance
Target AwardWeighting
(%)
FinalPerformance
Score(%)
Total Shareholder Return(1) 50th Percentile 92nd Percentile 34.00 85.00 Three-year CAGR in Adjusted Earnings per Share-Diluted(2)(3) 6.0% CAGR 10.2% CAGR 33.00 82.50 Three-year Cumulative Free Cash Flow(2)(4) $3,800M $4,310M 33.00 82.50 Total 100.00 250.00
____________________
(1) For our 2019-2021 PSU awards, Total Shareholder Return was measured based on the average closing price of the Common Stock in the month of December 2018 as compared to the average closing price of the Common Stock in the month of December 2021.
(2) Results for our ONE, Lily’s, Dot’s and Pretzels businesses were excluded from the following metrics, as applicable, as these acquisitions were made subsequent to the approval of the 2019-2021 PSU cycle metrics:
• Three-year CAGR in adjusted earnings per share-diluted; and
• Three-year cumulative free cash flow.
(3) Adjusted earnings per share-diluted is a non-GAAP performance measure. For more information regarding how we define adjusted earnings per share-diluted, please see Appendix A.
(4) Cumulative free cash flow is measured using net cash provided by operations less capital expenditures and write-downs of investment tax credits.
At the conclusion of each three-year cycle, the Compensation Committee reviews the level of performance achieved and the percentage, if any, of the applicable portion of the target number of PSUs earned. In determining the final performance cycle score, adjustments may be made by the Compensation Committee to the Company’s performance score to take into account extraordinary or unusual items occurring during the period. No adjustments were made in determining the 250% performance score or the number of PSUs earned by our NEOs for the 2019-2021 performance cycle.
2020-2022 and 2021-2023 PSU Awards
The performance metrics and weightings for the 2020-2022 and 2021-2023 performance cycles are the same as the 2019-2021 performance cycle. The three-year relative TSR metrics for the 2020-2022 and the 2021-2023 performance cycles are based on our 2020 Financial Peer Group and 2021 Financial Peer Group, respectively, which were unchanged from the 2019 Financial Peer Group.
58
See Column (e) of the 2021 Summary Compensation Table, Columns (f) through (h) of the 2021 Grants of Plan-Based Awards Table, Columns (i) and (j) of the Outstanding Equity Awards at 2021 Fiscal-Year End Table and Columns (d) and (e) of the 2021 Option Exercises and Stock Vested Table for more information about PSUs awarded to the NEOs.
Restricted Stock Units (35% of Long-Term Incentive Mix)The Compensation Committee sets guidelines for the value of the annual RSUs to be awarded based on competitive compensation data. These RSU awards represent approximately 35% of the NEO’s long-term incentive compensation target award. In 2021, the target number of RSUs awarded to each NEO was determined by multiplying the NEO’s base salary by 35% of his or her target long-term incentive award percentage divided by the closing price of the Company’s Common Stock on the NYSE on the grant date. Annual RSUs vest in equal increments over three years.
The Compensation Committee also awards RSUs to NEOs and other executives from time to time as special incentives. RSUs also are awarded by the Compensation Committee to replace compensation forfeited by newly-hired executive officers.
See Column (e) of the 2021 Summary Compensation Table, Column (i) of the 2021 Grants of Plan-Based Awards Table, Columns (g) and (h) of the Outstanding Equity Awards at 2021 Fiscal-Year End Table and Columns (d) and (e) of the 2021 Option Exercises and Stock Vested Table for more information about RSUs awarded to the NEOs.
Perquisites Executive perquisites are kept to a minimal level relative to a NEO’s total compensation and do not play a significant role in our executive compensation program. The perquisites that we provide include financial counseling and tax preparation reimbursement, as well as personal use of Company aircraft for our CEO (and other NEOs in extraordinary circumstances). See the footnotes to Column (i) of the 2021 Summary Compensation Table for information regarding the perquisites received by our NEOs.
Our NEOs are eligible to participate in our Gift Matching Program on the same basis as other employees, retirees or their spouses. Through the Gift Matching Program, we match contributions made to one or more non-profit organizations on a dollar-for-dollar basis up to a maximum aggregate contribution of $5,000 per employee annually. These matching contributions are not considered compensation and are not included in Column (i) of the 2021 Summary Compensation Table.
Retirement Plans NEOs are eligible to participate in our tax-qualified defined benefit pension plan (“pension plan”) and tax-qualified defined contribution 401(k) plan (“401(k) plan”) on the same basis as other salaried employees of the Company. IRC regulations do not permit the Company to use base salary and other compensation paid above certain limits to determine the benefits earned by the NEOs under tax-qualified plans. The Company maintains a defined benefit Supplemental Executive Retirement Plan (“DB SERP”), a defined contribution Supplemental Executive Retirement Plan (“DC SERP”), a defined benefit Compensation Limit Replacement Plan (“CLRP”) and a Deferred Compensation Plan to provide these and additional benefits that are comparable to those offered by our peers. Under the provisions of the Deferred Compensation Plan, our NEOs may elect to defer payments from OHIP, PSU and RSU awards, but not stock options or base salary.
The DB SERP was closed to new participants in 2006. No new participants have been or will be added to the DB SERP. NEOs and other senior executives reporting to the CEO not eligible for the DB SERP are considered by the Compensation Committee for participation in the DC SERP. In comparison, the DC SERP typically yields a lower benefit than the DB SERP upon retirement. Executive officers eligible for the Company’s pension plan who are not eligible for the DB SERP participate in the CLRP. The Company believes that the DB SERP, DC SERP, CLRP and Deferred Compensation Plan help, in the aggregate, to attract and retain executive talent, as similar plans are often components of the executive compensation program within our peer group. The DC SERP was established as part of our Deferred Compensation Plan and is not a separate plan.
See the “2021 Pension Benefits Table” and accompanying narrative and the “2021 Non-Qualified Deferred Compensation Table” and accompanying narrative for more information regarding the DB SERP, DC SERP, CLRP and other retirement benefits.
59
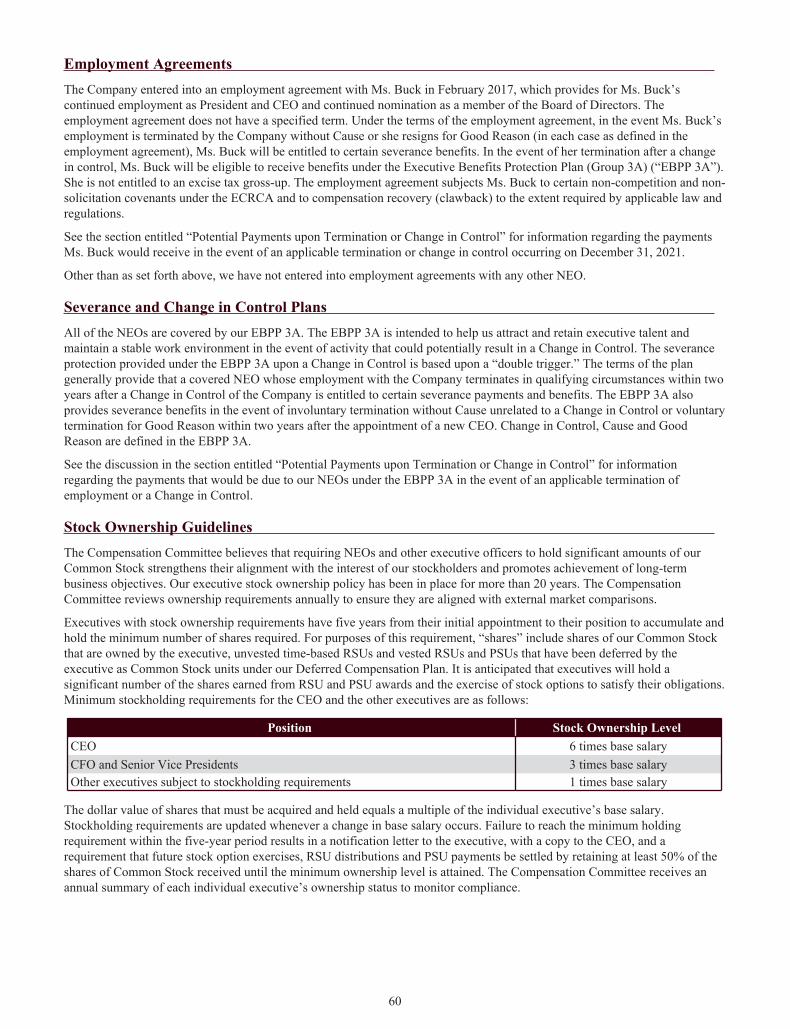
Employment Agreements The Company entered into an employment agreement with Ms. Buck in February 2017, which provides for Ms. Buck’s continued employment as President and CEO and continued nomination as a member of the Board of Directors. The employment agreement does not have a specified term. Under the terms of the employment agreement, in the event Ms. Buck’s employment is terminated by the Company without Cause or she resigns for Good Reason (in each case as defined in the employment agreement), Ms. Buck will be entitled to certain severance benefits. In the event of her termination after a change in control, Ms. Buck will be eligible to receive benefits under the Executive Benefits Protection Plan (Group 3A) (“EBPP 3A”). She is not entitled to an excise tax gross-up. The employment agreement subjects Ms. Buck to certain non-competition and non-solicitation covenants under the ECRCA and to compensation recovery (clawback) to the extent required by applicable law and regulations.
See the section entitled “Potential Payments upon Termination or Change in Control” for information regarding the payments Ms. Buck would receive in the event of an applicable termination or change in control occurring on December 31, 2021.
Other than as set forth above, we have not entered into employment agreements with any other NEO.
Severance and Change in Control Plans All of the NEOs are covered by our EBPP 3A. The EBPP 3A is intended to help us attract and retain executive talent and maintain a stable work environment in the event of activity that could potentially result in a Change in Control. The severance protection provided under the EBPP 3A upon a Change in Control is based upon a “double trigger.” The terms of the plan generally provide that a covered NEO whose employment with the Company terminates in qualifying circumstances within two years after a Change in Control of the Company is entitled to certain severance payments and benefits. The EBPP 3A also provides severance benefits in the event of involuntary termination without Cause unrelated to a Change in Control or voluntary termination for Good Reason within two years after the appointment of a new CEO. Change in Control, Cause and Good Reason are defined in the EBPP 3A.
See the discussion in the section entitled “Potential Payments upon Termination or Change in Control” for information regarding the payments that would be due to our NEOs under the EBPP 3A in the event of an applicable termination of employment or a Change in Control.
Stock Ownership Guidelines The Compensation Committee believes that requiring NEOs and other executive officers to hold significant amounts of our Common Stock strengthens their alignment with the interest of our stockholders and promotes achievement of long-term business objectives. Our executive stock ownership policy has been in place for more than 20 years. The Compensation Committee reviews ownership requirements annually to ensure they are aligned with external market comparisons.
Executives with stock ownership requirements have five years from their initial appointment to their position to accumulate and hold the minimum number of shares required. For purposes of this requirement, “shares” include shares of our Common Stock that are owned by the executive, unvested time-based RSUs and vested RSUs and PSUs that have been deferred by the executive as Common Stock units under our Deferred Compensation Plan. It is anticipated that executives will hold a significant number of the shares earned from RSU and PSU awards and the exercise of stock options to satisfy their obligations. Minimum stockholding requirements for the CEO and the other executives are as follows:
Position Stock Ownership Level CEO 6 times base salary
CFO and Senior Vice Presidents 3 times base salary
Other executives subject to stockholding requirements 1 times base salary
The dollar value of shares that must be acquired and held equals a multiple of the individual executive’s base salary. Stockholding requirements are updated whenever a change in base salary occurs. Failure to reach the minimum holding requirement within the five-year period results in a notification letter to the executive, with a copy to the CEO, and a requirement that future stock option exercises, RSU distributions and PSU payments be settled by retaining at least 50% of the shares of Common Stock received until the minimum ownership level is attained. The Compensation Committee receives an annual summary of each individual executive’s ownership status to monitor compliance.
60
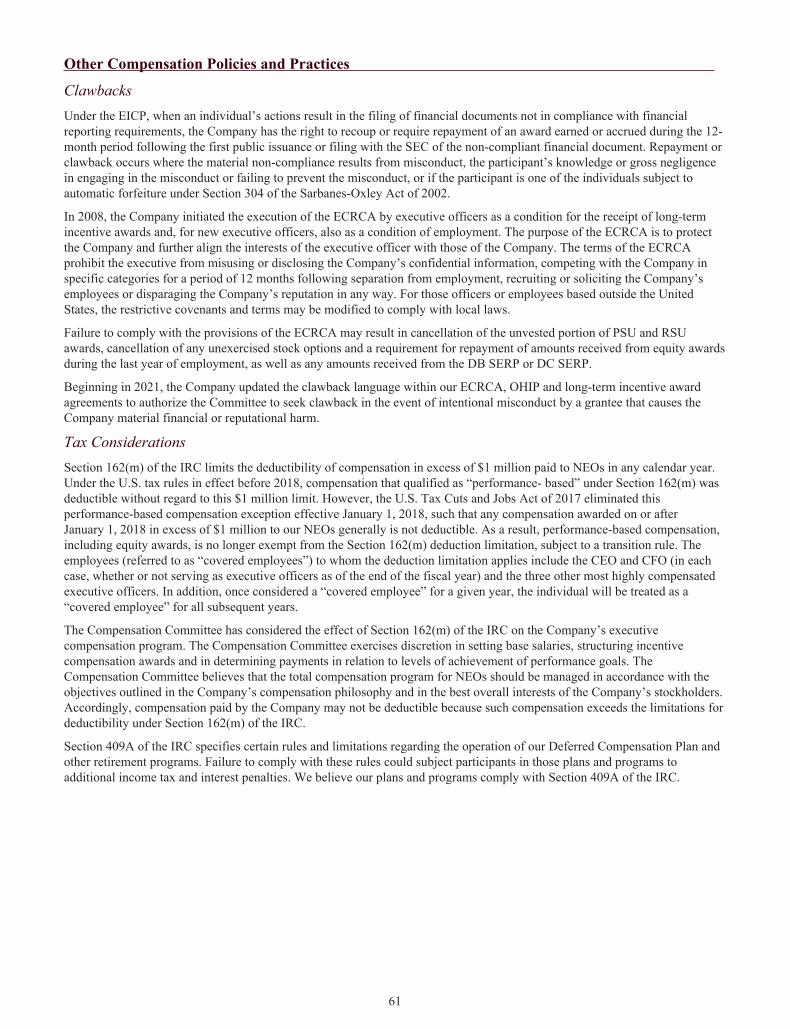
Other Compensation Policies and Practices
ClawbacksUnder the EICP, when an individual’s actions result in the filing of financial documents not in compliance with financial reporting requirements, the Company has the right to recoup or require repayment of an award earned or accrued during the 12-month period following the first public issuance or filing with the SEC of the non-compliant financial document. Repayment or clawback occurs where the material non-compliance results from misconduct, the participant’s knowledge or gross negligence in engaging in the misconduct or failing to prevent the misconduct, or if the participant is one of the individuals subject to automatic forfeiture under Section 304 of the Sarbanes-Oxley Act of 2002.
In 2008, the Company initiated the execution of the ECRCA by executive officers as a condition for the receipt of long-term incentive awards and, for new executive officers, also as a condition of employment. The purpose of the ECRCA is to protect the Company and further align the interests of the executive officer with those of the Company. The terms of the ECRCA prohibit the executive from misusing or disclosing the Company’s confidential information, competing with the Company in specific categories for a period of 12 months following separation from employment, recruiting or soliciting the Company’s employees or disparaging the Company’s reputation in any way. For those officers or employees based outside the United States, the restrictive covenants and terms may be modified to comply with local laws.
Failure to comply with the provisions of the ECRCA may result in cancellation of the unvested portion of PSU and RSU awards, cancellation of any unexercised stock options and a requirement for repayment of amounts received from equity awards during the last year of employment, as well as any amounts received from the DB SERP or DC SERP.
Beginning in 2021, the Company updated the clawback language within our ECRCA, OHIP and long-term incentive award agreements to authorize the Committee to seek clawback in the event of intentional misconduct by a grantee that causes the Company material financial or reputational harm.
Tax ConsiderationsSection 162(m) of the IRC limits the deductibility of compensation in excess of $1 million paid to NEOs in any calendar year. Under the U.S. tax rules in effect before 2018, compensation that qualified as “performance- based” under Section 162(m) was deductible without regard to this $1 million limit. However, the U.S. Tax Cuts and Jobs Act of 2017 eliminated this performance-based compensation exception effective January 1, 2018, such that any compensation awarded on or after January 1, 2018 in excess of $1 million to our NEOs generally is not deductible. As a result, performance-based compensation, including equity awards, is no longer exempt from the Section 162(m) deduction limitation, subject to a transition rule. The employees (referred to as “covered employees”) to whom the deduction limitation applies include the CEO and CFO (in each case, whether or not serving as executive officers as of the end of the fiscal year) and the three other most highly compensated executive officers. In addition, once considered a “covered employee” for a given year, the individual will be treated as a “covered employee” for all subsequent years.
The Compensation Committee has considered the effect of Section 162(m) of the IRC on the Company’s executive compensation program. The Compensation Committee exercises discretion in setting base salaries, structuring incentive compensation awards and in determining payments in relation to levels of achievement of performance goals. The Compensation Committee believes that the total compensation program for NEOs should be managed in accordance with the objectives outlined in the Company’s compensation philosophy and in the best overall interests of the Company’s stockholders. Accordingly, compensation paid by the Company may not be deductible because such compensation exceeds the limitations for deductibility under Section 162(m) of the IRC.
Section 409A of the IRC specifies certain rules and limitations regarding the operation of our Deferred Compensation Plan and other retirement programs. Failure to comply with these rules could subject participants in those plans and programs to additional income tax and interest penalties. We believe our plans and programs comply with Section 409A of the IRC.
61
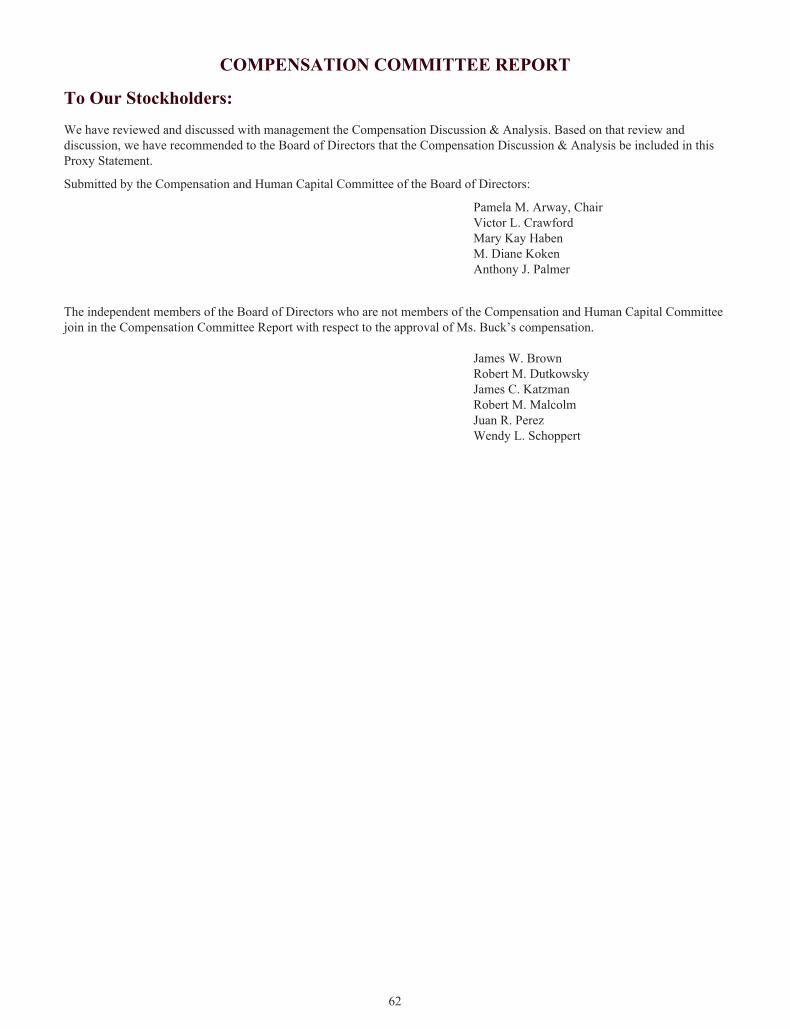
COMPENSATION COMMITTEE REPORT
To Our Stockholders:
We have reviewed and discussed with management the Compensation Discussion & Analysis. Based on that review and discussion, we have recommended to the Board of Directors that the Compensation Discussion & Analysis be included in this Proxy Statement.
Submitted by the Compensation and Human Capital Committee of the Board of Directors:
Pamela M. Arway, ChairVictor L. CrawfordMary Kay HabenM. Diane KokenAnthony J. Palmer
The independent members of the Board of Directors who are not members of the Compensation and Human Capital Committee join in the Compensation Committee Report with respect to the approval of Ms. Buck’s compensation.
James W. BrownRobert M. DutkowskyJames C. KatzmanRobert M. MalcolmJuan R. PerezWendy L. Schoppert
62
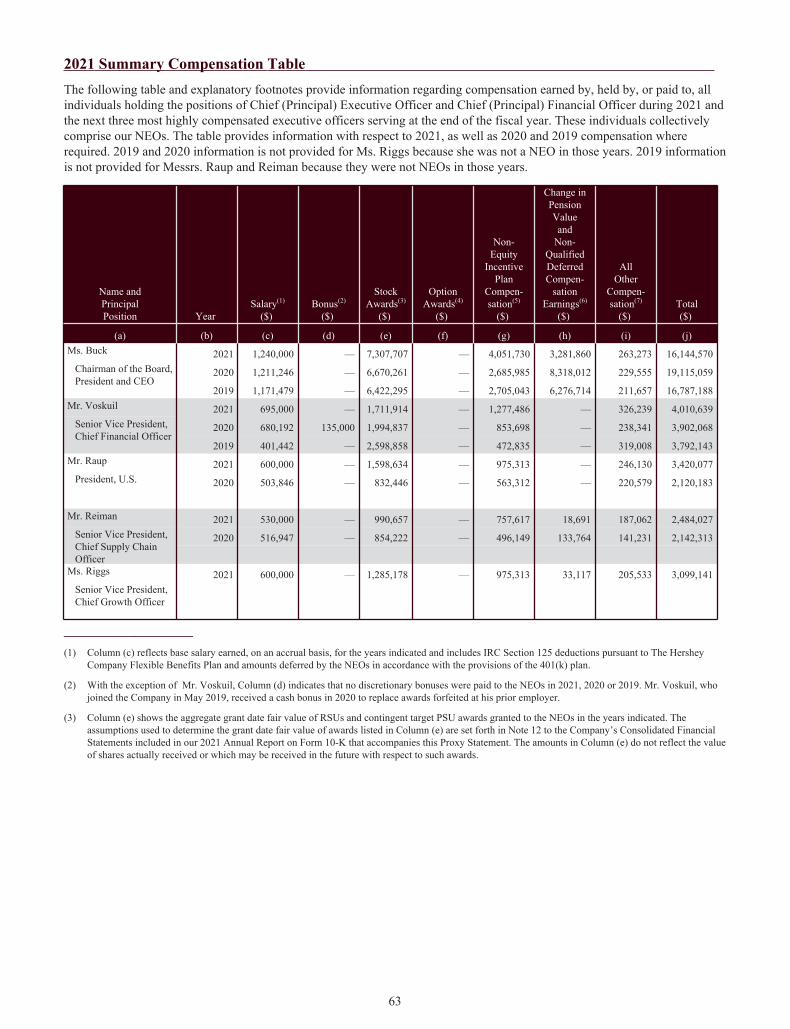
2021 Summary Compensation Table The following table and explanatory footnotes provide information regarding compensation earned by, held by, or paid to, all individuals holding the positions of Chief (Principal) Executive Officer and Chief (Principal) Financial Officer during 2021 and the next three most highly compensated executive officers serving at the end of the fiscal year. These individuals collectively comprise our NEOs. The table provides information with respect to 2021, as well as 2020 and 2019 compensation where required. 2019 and 2020 information is not provided for Ms. Riggs because she was not a NEO in those years. 2019 information is not provided for Messrs. Raup and Reiman because they were not NEOs in those years.
Name andPrincipalPosition Year
Salary(1)
($) Bonus(2)
($)
Stock Awards(3)
($)
Option Awards(4)
($)
Non-Equity
IncentivePlan
Compen-sation(5)
($)
Change inPensionValueand
Non-QualifiedDeferredCompen-
sationEarnings(6)
($)
AllOther
Compen-sation(7)
($) Total($)
(a) (b) (c) (d) (e) (f) (g) (h) (i) (j)Ms. Buck 2021 1,240,000 — 7,307,707 — 4,051,730 3,281,860 263,273 16,144,570
Chairman of the Board, President and CEO
2020 1,211,246 — 6,670,261 — 2,685,985 8,318,012 229,555 19,115,059
2019 1,171,479 — 6,422,295 — 2,705,043 6,276,714 211,657 16,787,188 Mr. Voskuil 2021 695,000 — 1,711,914 — 1,277,486 — 326,239 4,010,639
Senior Vice President, Chief Financial Officer
2020 680,192 135,000 1,994,837 — 853,698 — 238,341 3,902,068
2019 401,442 — 2,598,858 — 472,835 — 319,008 3,792,143 Mr. Raup 2021 600,000 — 1,598,634 — 975,313 — 246,130 3,420,077
President, U.S. 2020 503,846 — 832,446 — 563,312 — 220,579 2,120,183
Mr. Reiman 2021 530,000 — 990,657 — 757,617 18,691 187,062 2,484,027 Senior Vice President, Chief Supply Chain Officer
2020 516,947 — 854,222 — 496,149 133,764 141,231 2,142,313
Ms. Riggs 2021 600,000 — 1,285,178 — 975,313 33,117 205,533 3,099,141 Senior Vice President, Chief Growth Officer
____________________
(1) Column (c) reflects base salary earned, on an accrual basis, for the years indicated and includes IRC Section 125 deductions pursuant to The Hershey Company Flexible Benefits Plan and amounts deferred by the NEOs in accordance with the provisions of the 401(k) plan.
(2) With the exception of Mr. Voskuil, Column (d) indicates that no discretionary bonuses were paid to the NEOs in 2021, 2020 or 2019. Mr. Voskuil, who joined the Company in May 2019, received a cash bonus in 2020 to replace awards forfeited at his prior employer.
(3) Column (e) shows the aggregate grant date fair value of RSUs and contingent target PSU awards granted to the NEOs in the years indicated. The assumptions used to determine the grant date fair value of awards listed in Column (e) are set forth in Note 12 to the Company’s Consolidated Financial Statements included in our 2021 Annual Report on Form 10-K that accompanies this Proxy Statement. The amounts in Column (e) do not reflect the value of shares actually received or which may be received in the future with respect to such awards.
63
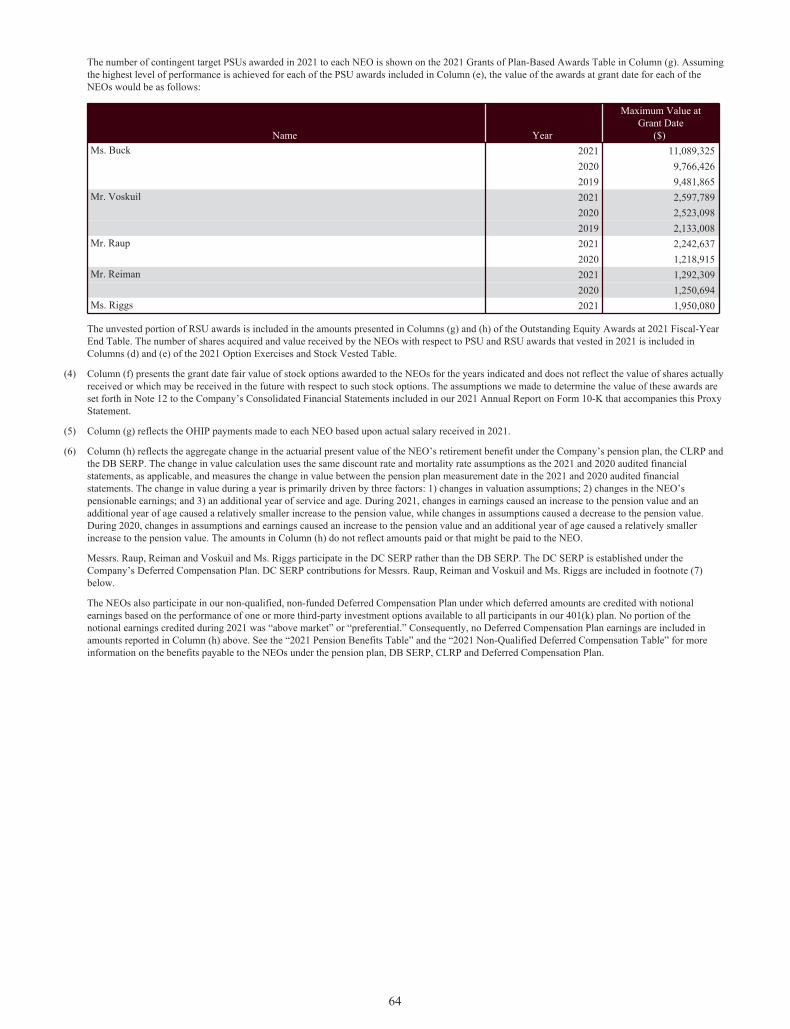
The number of contingent target PSUs awarded in 2021 to each NEO is shown on the 2021 Grants of Plan-Based Awards Table in Column (g). Assuming the highest level of performance is achieved for each of the PSU awards included in Column (e), the value of the awards at grant date for each of the NEOs would be as follows:
Name Year
Maximum Value atGrant Date
($) Ms. Buck 2021 11,089,325
2020 9,766,426 2019 9,481,865
Mr. Voskuil 2021 2,597,789 2020 2,523,098 2019 2,133,008
Mr. Raup 2021 2,242,637 2020 1,218,915
Mr. Reiman 2021 1,292,309 2020 1,250,694
Ms. Riggs 2021 1,950,080
The unvested portion of RSU awards is included in the amounts presented in Columns (g) and (h) of the Outstanding Equity Awards at 2021 Fiscal-Year End Table. The number of shares acquired and value received by the NEOs with respect to PSU and RSU awards that vested in 2021 is included in Columns (d) and (e) of the 2021 Option Exercises and Stock Vested Table.
(4) Column (f) presents the grant date fair value of stock options awarded to the NEOs for the years indicated and does not reflect the value of shares actually received or which may be received in the future with respect to such stock options. The assumptions we made to determine the value of these awards are set forth in Note 12 to the Company’s Consolidated Financial Statements included in our 2021 Annual Report on Form 10-K that accompanies this Proxy Statement.
(5) Column (g) reflects the OHIP payments made to each NEO based upon actual salary received in 2021.
(6) Column (h) reflects the aggregate change in the actuarial present value of the NEO’s retirement benefit under the Company’s pension plan, the CLRP and the DB SERP. The change in value calculation uses the same discount rate and mortality rate assumptions as the 2021 and 2020 audited financial statements, as applicable, and measures the change in value between the pension plan measurement date in the 2021 and 2020 audited financial statements. The change in value during a year is primarily driven by three factors: 1) changes in valuation assumptions; 2) changes in the NEO’s pensionable earnings; and 3) an additional year of service and age. During 2021, changes in earnings caused an increase to the pension value and an additional year of age caused a relatively smaller increase to the pension value, while changes in assumptions caused a decrease to the pension value. During 2020, changes in assumptions and earnings caused an increase to the pension value and an additional year of age caused a relatively smaller increase to the pension value. The amounts in Column (h) do not reflect amounts paid or that might be paid to the NEO.
Messrs. Raup, Reiman and Voskuil and Ms. Riggs participate in the DC SERP rather than the DB SERP. The DC SERP is established under the Company’s Deferred Compensation Plan. DC SERP contributions for Messrs. Raup, Reiman and Voskuil and Ms. Riggs are included in footnote (7) below.
The NEOs also participate in our non-qualified, non-funded Deferred Compensation Plan under which deferred amounts are credited with notional earnings based on the performance of one or more third-party investment options available to all participants in our 401(k) plan. No portion of the notional earnings credited during 2021 was “above market” or “preferential.” Consequently, no Deferred Compensation Plan earnings are included in amounts reported in Column (h) above. See the “2021 Pension Benefits Table” and the “2021 Non-Qualified Deferred Compensation Table” for more information on the benefits payable to the NEOs under the pension plan, DB SERP, CLRP and Deferred Compensation Plan.
64
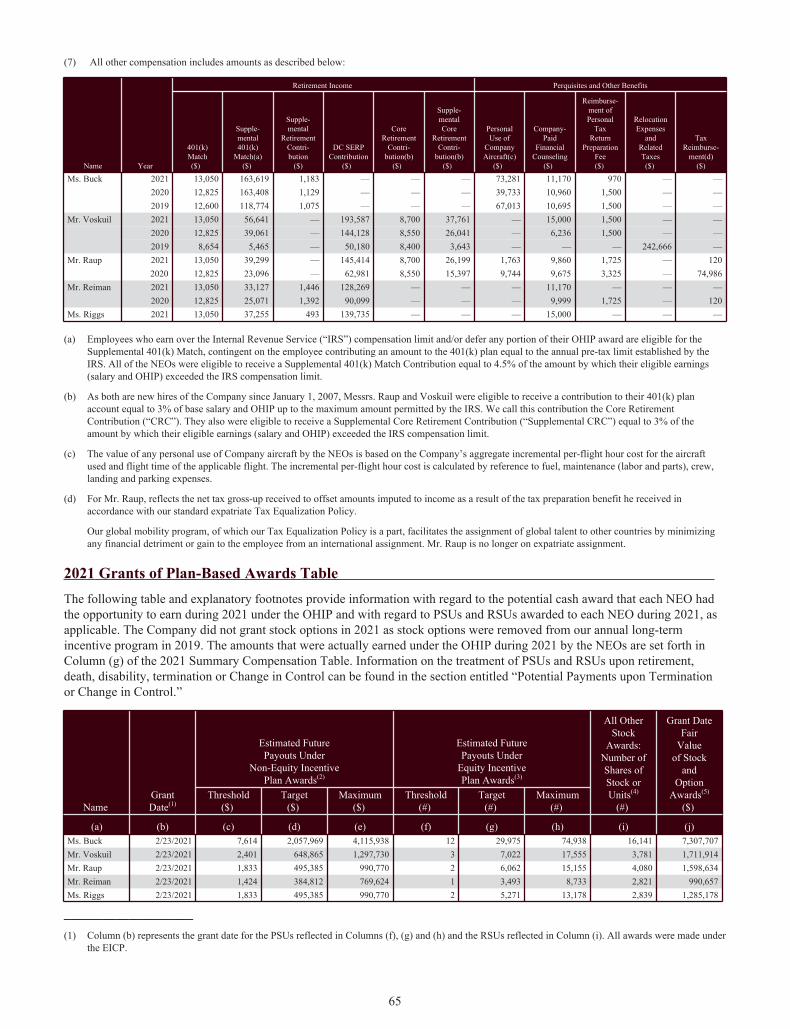
(7) All other compensation includes amounts as described below:
Name Year
Retirement Income Perquisites and Other Benefits
401(k)Match($)
Supple-mental401(k)
Match(a)($)
Supple-mental
RetirementContri-bution
($)
DC SERPContribution
($)
CoreRetirement
Contri-bution(b)
($)
Supple-mentalCore
RetirementContri-
bution(b)($)
PersonalUse of
CompanyAircraft(c)
($)
Company-Paid
FinancialCounseling
($)
Reimburse-ment ofPersonal
TaxReturn
PreparationFee($)
RelocationExpenses
andRelatedTaxes($)
Tax Reimburse-
ment(d)($)
Ms. Buck 2021 13,050 163,619 1,183 — — — 73,281 11,170 970 — — 2020 12,825 163,408 1,129 — — — 39,733 10,960 1,500 — — 2019 12,600 118,774 1,075 — — — 67,013 10,695 1,500 — —
Mr. Voskuil 2021 13,050 56,641 — 193,587 8,700 37,761 — 15,000 1,500 — — 2020 12,825 39,061 — 144,128 8,550 26,041 — 6,236 1,500 — — 2019 8,654 5,465 — 50,180 8,400 3,643 — — — 242,666 —
Mr. Raup 2021 13,050 39,299 — 145,414 8,700 26,199 1,763 9,860 1,725 — 120 2020 12,825 23,096 — 62,981 8,550 15,397 9,744 9,675 3,325 — 74,986
Mr. Reiman 2021 13,050 33,127 1,446 128,269 — — — 11,170 — — — 2020 12,825 25,071 1,392 90,099 — — — 9,999 1,725 — 120
Ms. Riggs 2021 13,050 37,255 493 139,735 — — — 15,000 — — —
(a) Employees who earn over the Internal Revenue Service (“IRS”) compensation limit and/or defer any portion of their OHIP award are eligible for the Supplemental 401(k) Match, contingent on the employee contributing an amount to the 401(k) plan equal to the annual pre-tax limit established by the IRS. All of the NEOs were eligible to receive a Supplemental 401(k) Match Contribution equal to 4.5% of the amount by which their eligible earnings (salary and OHIP) exceeded the IRS compensation limit.
(b) As both are new hires of the Company since January 1, 2007, Messrs. Raup and Voskuil were eligible to receive a contribution to their 401(k) plan account equal to 3% of base salary and OHIP up to the maximum amount permitted by the IRS. We call this contribution the Core Retirement Contribution (“CRC”). They also were eligible to receive a Supplemental Core Retirement Contribution (“Supplemental CRC”) equal to 3% of the amount by which their eligible earnings (salary and OHIP) exceeded the IRS compensation limit.
(c) The value of any personal use of Company aircraft by the NEOs is based on the Company’s aggregate incremental per-flight hour cost for the aircraft used and flight time of the applicable flight. The incremental per-flight hour cost is calculated by reference to fuel, maintenance (labor and parts), crew, landing and parking expenses.
(d) For Mr. Raup, reflects the net tax gross-up received to offset amounts imputed to income as a result of the tax preparation benefit he received in accordance with our standard expatriate Tax Equalization Policy.
Our global mobility program, of which our Tax Equalization Policy is a part, facilitates the assignment of global talent to other countries by minimizing any financial detriment or gain to the employee from an international assignment. Mr. Raup is no longer on expatriate assignment.
2021 Grants of Plan-Based Awards Table The following table and explanatory footnotes provide information with regard to the potential cash award that each NEO had the opportunity to earn during 2021 under the OHIP and with regard to PSUs and RSUs awarded to each NEO during 2021, as applicable. The Company did not grant stock options in 2021 as stock options were removed from our annual long-term incentive program in 2019. The amounts that were actually earned under the OHIP during 2021 by the NEOs are set forth in Column (g) of the 2021 Summary Compensation Table. Information on the treatment of PSUs and RSUs upon retirement, death, disability, termination or Change in Control can be found in the section entitled “Potential Payments upon Termination or Change in Control.”
Name Grant
Date(1)
Estimated FuturePayouts Under
Non-Equity IncentivePlan Awards(2)
Estimated FuturePayouts Under
Equity IncentivePlan Awards(3)
All OtherStock
Awards:Number ofShares ofStock orUnits(4)
(#)
Grant DateFair
Valueof Stock
andOption
Awards(5)
($) Threshold
($) Target
($) Maximum
($) Threshold
(#) Target
(#) Maximum
(#)
(a) (b) (c) (d) (e) (f) (g) (h) (i) (j)Ms. Buck 2/23/2021 7,614 2,057,969 4,115,938 12 29,975 74,938 16,141 7,307,707 Mr. Voskuil 2/23/2021 2,401 648,865 1,297,730 3 7,022 17,555 3,781 1,711,914 Mr. Raup 2/23/2021 1,833 495,385 990,770 2 6,062 15,155 4,080 1,598,634 Mr. Reiman 2/23/2021 1,424 384,812 769,624 1 3,493 8,733 2,821 990,657 Ms. Riggs 2/23/2021 1,833 495,385 990,770 2 5,271 13,178 2,839 1,285,178
____________________
(1) Column (b) represents the grant date for the PSUs reflected in Columns (f), (g) and (h) and the RSUs reflected in Column (i). All awards were made under the EICP.
65

(2) Columns (c), (d) and (e) represent the threshold, target and maximum potential amounts each NEO had the opportunity to earn based on the OHIP targets and performance measures approved for the NEOs in February 2021. All amounts shown in Columns (c), (d) and (e) are based upon actual salary received in 2021.
The threshold amount is the amount that would have been payable had the minimum Company performance score been achieved. The target amount is the amount that would have been payable had the Company score been 100% on all metrics. The maximum amount is the amount that would have been payable had the maximum score been achieved on all metrics. The actual amounts awarded for 2021 are reported in column (g) of the Summary Compensation Table.
(3) Columns (f), (g) and (h) represent the number of threshold, target and maximum potential PSUs that can be earned for the 2021-2023 performance cycle. Target PSU awards were determined by multiplying 65% of the executive’s long-term incentive target percentage times his or her 2021 base salary, divided by the closing price of the Company’s Common Stock on the NYSE on the award date as shown in Column (j). Ms. Buck received an enhanced 2021 PSU grant based upon her exemplary performance, contributions and leadership for the year ended December 31, 2020.
Each PSU represents the value of one share of our Common Stock. The number of PSUs earned for the 2021-2023 performance cycle will depend upon achievement against the metrics explained in the Compensation Discussion & Analysis in the section entitled “Performance Stock Unit Targets and Results.”
Payment, if any, will be made in shares of the Company’s Common Stock at the conclusion of the three-year performance cycle. The minimum award as shown in Column (f) is the number of shares payable for achievement of the threshold level of performance on one of the metrics and the maximum award as shown in Column (h) is the number of shares payable for achievement of the maximum level of performance on all metrics.
More information regarding PSUs and the 2021 awards can be found in the Compensation Discussion & Analysis and the Outstanding Equity Awards at 2021 Fiscal-Year End Table.
(4) Column (i) represents the number of annual RSUs granted on February 23, 2021. Target RSU awards were determined by multiplying 35% of the executive’s long-term incentive target percentage times his or her 2021 base salary, divided by the closing price of the Company’s Common Stock on the NYSE on the award date as shown in Column (j). Ms. Buck and Messrs. Raup and Reiman received enhanced 2021 RSU grants based upon their exemplary performance, contributions and leadership for the year ended December 31, 2020. Annual RSU awards vest in thirds over three years.
(5) Column (j) represents the aggregate grant date fair value of (1) the target number of PSUs reported in Column (g) and (2) the number of RSUs reported in Column (i), in each case as determined in accordance with Financial Accounting Standards Board Accounting Standards Codification Topic 718. The assumptions used in determining these amounts are set forth in Note 12 to the Company’s Consolidated Financial Statements included in our 2021 Annual Report on Form 10-K that accompanies this Proxy Statement.
66
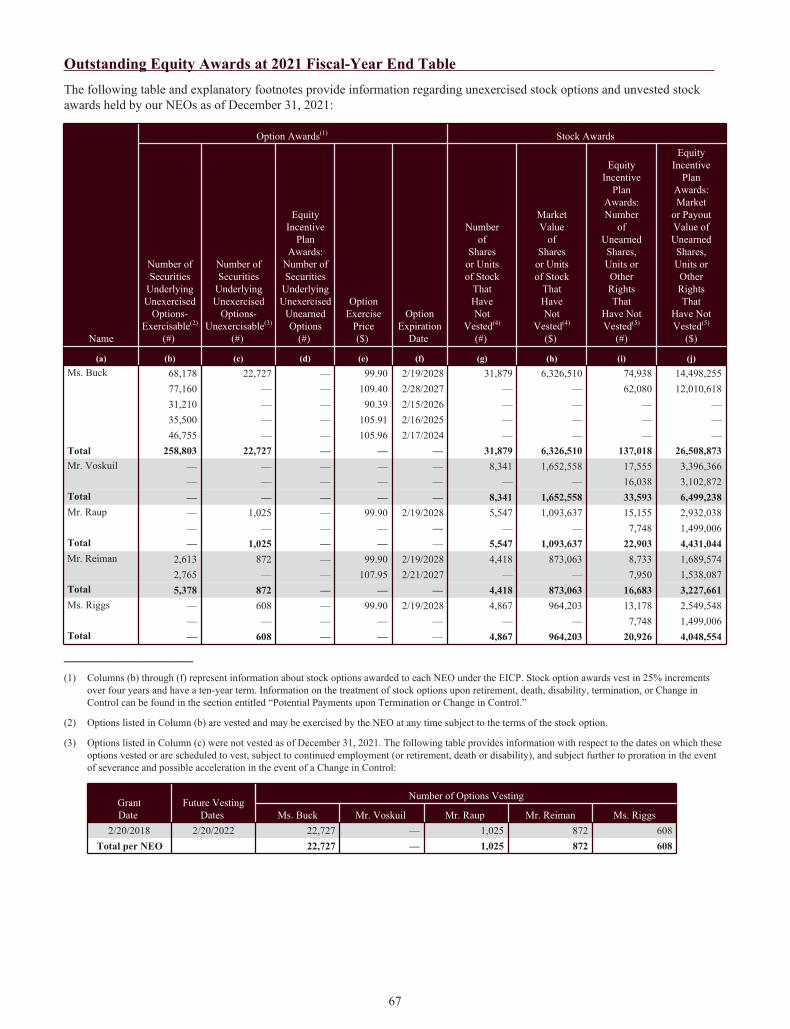
Outstanding Equity Awards at 2021 Fiscal-Year End Table The following table and explanatory footnotes provide information regarding unexercised stock options and unvested stock awards held by our NEOs as of December 31, 2021:
Name
Option Awards(1) Stock Awards
Number ofSecurities
UnderlyingUnexercised
Options-Exercisable(2)
(#)
Number ofSecurities
UnderlyingUnexercised
Options-Unexercisable(3)
(#)
EquityIncentive
PlanAwards:
Number ofSecurities
UnderlyingUnexercised
UnearnedOptions
(#)
OptionExercise
Price($)
OptionExpiration
Date
Numberof
Sharesor Unitsof Stock
ThatHaveNot
Vested(4)
(#)
MarketValue
ofShares
or Unitsof Stock
ThatHaveNot
Vested(4)
($)
EquityIncentive
PlanAwards:Number
ofUnearnedShares,Units orOtherRightsThat
Have NotVested(5)
(#)
EquityIncentive
PlanAwards:Market
or PayoutValue ofUnearnedShares,Units orOtherRightsThat
Have NotVested(5)
($)
(a) (b) (c) (d) (e) (f) (g) (h) (i) (j)Ms. Buck 68,178 22,727 — 99.90 2/19/2028 31,879 6,326,510 74,938 14,498,255
77,160 — — 109.40 2/28/2027 — — 62,080 12,010,618 31,210 — — 90.39 2/15/2026 — — — — 35,500 — — 105.91 2/16/2025 — — — — 46,755 — — 105.96 2/17/2024 — — — —
Total 258,803 22,727 — — — 31,879 6,326,510 137,018 26,508,873 Mr. Voskuil — — — — — 8,341 1,652,558 17,555 3,396,366
— — — — — — — 16,038 3,102,872 Total — — — — — 8,341 1,652,558 33,593 6,499,238 Mr. Raup — 1,025 — 99.90 2/19/2028 5,547 1,093,637 15,155 2,932,038
— — — — — — — 7,748 1,499,006 Total — 1,025 — — — 5,547 1,093,637 22,903 4,431,044 Mr. Reiman 2,613 872 — 99.90 2/19/2028 4,418 873,063 8,733 1,689,574
2,765 — — 107.95 2/21/2027 — — 7,950 1,538,087 Total 5,378 872 — — — 4,418 873,063 16,683 3,227,661 Ms. Riggs — 608 — 99.90 2/19/2028 4,867 964,203 13,178 2,549,548
— — — — — — — 7,748 1,499,006 Total — 608 — — — 4,867 964,203 20,926 4,048,554
____________________
(1) Columns (b) through (f) represent information about stock options awarded to each NEO under the EICP. Stock option awards vest in 25% increments over four years and have a ten-year term. Information on the treatment of stock options upon retirement, death, disability, termination, or Change in Control can be found in the section entitled “Potential Payments upon Termination or Change in Control.”
(2) Options listed in Column (b) are vested and may be exercised by the NEO at any time subject to the terms of the stock option.
(3) Options listed in Column (c) were not vested as of December 31, 2021. The following table provides information with respect to the dates on which these options vested or are scheduled to vest, subject to continued employment (or retirement, death or disability), and subject further to proration in the event of severance and possible acceleration in the event of a Change in Control:
GrantDate
Future VestingDates
Number of Options Vesting
Ms. Buck Mr. Voskuil Mr. Raup Mr. Reiman Ms. Riggs2/20/2018 2/20/2022 22,727 — 1,025 872 608
Total per NEO 22,727 — 1,025 872 608
67
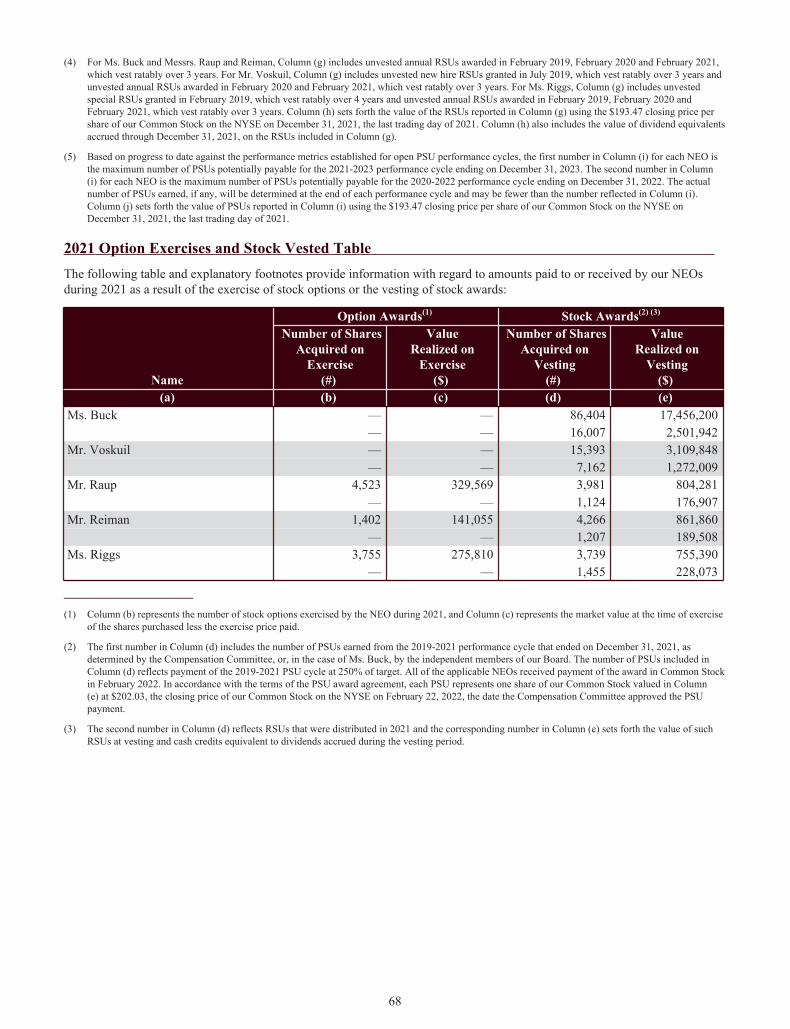
(4) For Ms. Buck and Messrs. Raup and Reiman, Column (g) includes unvested annual RSUs awarded in February 2019, February 2020 and February 2021, which vest ratably over 3 years. For Mr. Voskuil, Column (g) includes unvested new hire RSUs granted in July 2019, which vest ratably over 3 years and unvested annual RSUs awarded in February 2020 and February 2021, which vest ratably over 3 years. For Ms. Riggs, Column (g) includes unvested special RSUs granted in February 2019, which vest ratably over 4 years and unvested annual RSUs awarded in February 2019, February 2020 and February 2021, which vest ratably over 3 years. Column (h) sets forth the value of the RSUs reported in Column (g) using the $193.47 closing price per share of our Common Stock on the NYSE on December 31, 2021, the last trading day of 2021. Column (h) also includes the value of dividend equivalents accrued through December 31, 2021, on the RSUs included in Column (g).
(5) Based on progress to date against the performance metrics established for open PSU performance cycles, the first number in Column (i) for each NEO is the maximum number of PSUs potentially payable for the 2021-2023 performance cycle ending on December 31, 2023. The second number in Column (i) for each NEO is the maximum number of PSUs potentially payable for the 2020-2022 performance cycle ending on December 31, 2022. The actual number of PSUs earned, if any, will be determined at the end of each performance cycle and may be fewer than the number reflected in Column (i). Column (j) sets forth the value of PSUs reported in Column (i) using the $193.47 closing price per share of our Common Stock on the NYSE on December 31, 2021, the last trading day of 2021.
2021 Option Exercises and Stock Vested Table The following table and explanatory footnotes provide information with regard to amounts paid to or received by our NEOs during 2021 as a result of the exercise of stock options or the vesting of stock awards:
Name
Option Awards(1) Stock Awards(2) (3)
Number of SharesAcquired on
Exercise(#)
ValueRealized on
Exercise($)
Number of SharesAcquired on
Vesting(#)
ValueRealized on
Vesting($)
(a) (b) (c) (d) (e) Ms. Buck — — 86,404 17,456,200
— — 16,007 2,501,942 Mr. Voskuil — — 15,393 3,109,848
— — 7,162 1,272,009 Mr. Raup 4,523 329,569 3,981 804,281
— — 1,124 176,907 Mr. Reiman 1,402 141,055 4,266 861,860
— — 1,207 189,508 Ms. Riggs 3,755 275,810 3,739 755,390
— — 1,455 228,073 ____________________
(1) Column (b) represents the number of stock options exercised by the NEO during 2021, and Column (c) represents the market value at the time of exercise of the shares purchased less the exercise price paid.
(2) The first number in Column (d) includes the number of PSUs earned from the 2019-2021 performance cycle that ended on December 31, 2021, as determined by the Compensation Committee, or, in the case of Ms. Buck, by the independent members of our Board. The number of PSUs included in Column (d) reflects payment of the 2019-2021 PSU cycle at 250% of target. All of the applicable NEOs received payment of the award in Common Stock in February 2022. In accordance with the terms of the PSU award agreement, each PSU represents one share of our Common Stock valued in Column (e) at $202.03, the closing price of our Common Stock on the NYSE on February 22, 2022, the date the Compensation Committee approved the PSU payment.
(3) The second number in Column (d) reflects RSUs that were distributed in 2021 and the corresponding number in Column (e) sets forth the value of such RSUs at vesting and cash credits equivalent to dividends accrued during the vesting period.
68
2021 Pension Benefits Table Mmes. Buck and Riggs and Mr. Reiman are participants in our pension plan and are fully vested in benefits under that plan. Ms. Buck is also eligible to participate in our non-qualified DB SERP. No benefit is payable under the DB SERP if the executive officer terminates employment prior to age 55 or if he or she does not have five years of service with the Company. As of December 31, 2021, Ms. Buck had attained age 55 with five years of service and therefore was fully vested in her DB SERP benefit.
The combination of the pension and DB SERP plans was designed to provide a benefit upon retirement at or after reaching age 60 based on a joint and survivor annuity equal to 55% of final average compensation for an executive with 15 or more years of service (reduced pro rata for each year of service under 15). Effective January 1, 2007, the benefit payable under the DB SERP to an executive who was age 50 or over as of January 1, 2007, was reduced by 10%, and the benefit payable to an executive who had not attained age 50 as of January 1, 2007, was reduced by 20%. As a result, the benefit payable to Ms. Buck was reduced by 20% since she had not attained age 50 as of January 1, 2007.
Under the terms of the DB SERP, final average compensation is calculated as the sum of (i) the average of the highest three calendar years of base salary paid over the last five years of employment with the Company and (ii) the average of the highest three OHIP awards, paid or deferred, for the last five years of employment with the Company. The benefit accrued under the DB SERP is payable upon retirement (subject to the provisions of Section 409A of the IRC) as a lump sum or a life annuity with 50% benefit continuation to the participant’s surviving spouse, or payment may be deferred in accordance with the provisions of the Company’s Deferred Compensation Plan. The lump sum is equal to the actuarial present value of the joint and survivor pension earned, reduced by the lump sum value of the benefits to be paid under the pension plan and the value of the executive’s Social Security benefits. If the executive terminates employment after age 55 but before age 60, the benefit is reduced for early retirement at a rate of 5% per year for the period until the executive would have turned 60.
The CLRP provides eligible participants the defined benefit he or she would have earned under our pension plan were it not for the legal limitation on compensation used to determine benefits. An executive who is a participant in the DB SERP is not eligible to participate in the CLRP unless he or she (i) ceases to be designated by the Committee as eligible to participate in the DB SERP prior to his or her termination of employment with the Company or (ii) has his or her employment involuntarily terminated by the Company other than for Cause prior to vesting in the DB SERP. NEOs meeting these criteria become eligible to participate in the CLRP and receive a benefit for all years in which they would have been a participant of the CLRP had they not been designated by the Committee to be eligible for the DB SERP.
For executives who are eligible for both the DC SERP, as described in the section “2021 Non-Qualified Deferred Compensation Table,” and the pension plan, the additional credit under the CLRP is limited to 3% of eligible earnings less the IRS annual limitation on compensation. Mr. Reiman and Ms. Riggs are the only NEOs eligible for the CLRP. Upon separation, benefits under the CLRP are payable in a single lump sum or may be deferred into the Deferred Compensation Plan. A participant is eligible for his or her CLRP benefit upon separation from service (subject to the provisions of Section 409A of the IRC) after five years of service or attaining age 55 (unless the participant is terminated for Cause). Payment is also made to the estate of a participant who dies prior to separation from service. Participants who become disabled are 100% vested in their benefit and continue to accrue additional benefits for up to two additional years.
69
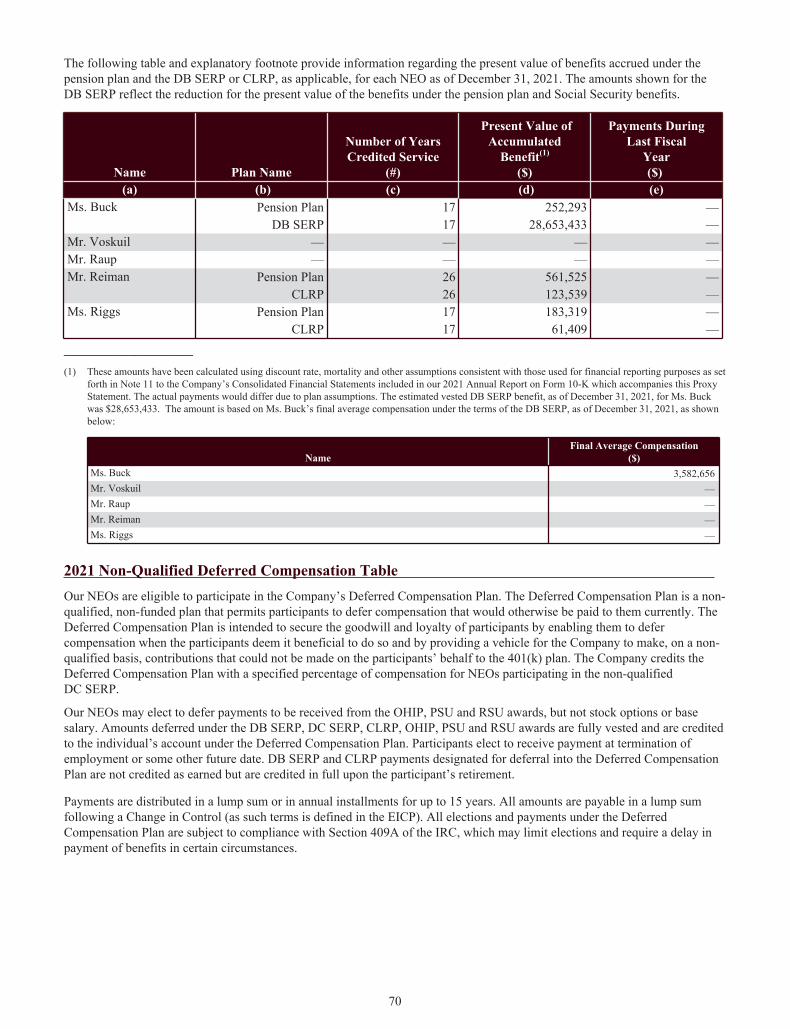
The following table and explanatory footnote provide information regarding the present value of benefits accrued under the pension plan and the DB SERP or CLRP, as applicable, for each NEO as of December 31, 2021. The amounts shown for the DB SERP reflect the reduction for the present value of the benefits under the pension plan and Social Security benefits.
Name Plan Name
Number of Years Credited Service
(#)
Present Value ofAccumulated
Benefit(1)
($)
Payments DuringLast Fiscal
Year($)
(a) (b) (c) (d) (e) Ms. Buck Pension Plan 17 252,293 —
DB SERP 17 28,653,433 —Mr. Voskuil — — — —Mr. Raup — — — —Mr. Reiman Pension Plan 26 561,525 —
CLRP 26 123,539 —Ms. Riggs Pension Plan 17 183,319 —
CLRP 17 61,409 —____________________
(1) These amounts have been calculated using discount rate, mortality and other assumptions consistent with those used for financial reporting purposes as set forth in Note 11 to the Company’s Consolidated Financial Statements included in our 2021 Annual Report on Form 10-K which accompanies this Proxy Statement. The actual payments would differ due to plan assumptions. The estimated vested DB SERP benefit, as of December 31, 2021, for Ms. Buck was $28,653,433. The amount is based on Ms. Buck’s final average compensation under the terms of the DB SERP, as of December 31, 2021, as shown below:
NameFinal Average Compensation
($)Ms. Buck 3,582,656 Mr. Voskuil — Mr. Raup — Mr. Reiman — Ms. Riggs —
2021 Non-Qualified Deferred Compensation Table Our NEOs are eligible to participate in the Company’s Deferred Compensation Plan. The Deferred Compensation Plan is a non-qualified, non-funded plan that permits participants to defer compensation that would otherwise be paid to them currently. The Deferred Compensation Plan is intended to secure the goodwill and loyalty of participants by enabling them to defer compensation when the participants deem it beneficial to do so and by providing a vehicle for the Company to make, on a non-qualified basis, contributions that could not be made on the participants’ behalf to the 401(k) plan. The Company credits the Deferred Compensation Plan with a specified percentage of compensation for NEOs participating in the non-qualified DC SERP.
Our NEOs may elect to defer payments to be received from the OHIP, PSU and RSU awards, but not stock options or base salary. Amounts deferred under the DB SERP, DC SERP, CLRP, OHIP, PSU and RSU awards are fully vested and are credited to the individual’s account under the Deferred Compensation Plan. Participants elect to receive payment at termination of employment or some other future date. DB SERP and CLRP payments designated for deferral into the Deferred Compensation Plan are not credited as earned but are credited in full upon the participant’s retirement.
Payments are distributed in a lump sum or in annual installments for up to 15 years. All amounts are payable in a lump sum following a Change in Control (as such terms is defined in the EICP). All elections and payments under the Deferred Compensation Plan are subject to compliance with Section 409A of the IRC, which may limit elections and require a delay in payment of benefits in certain circumstances.
70
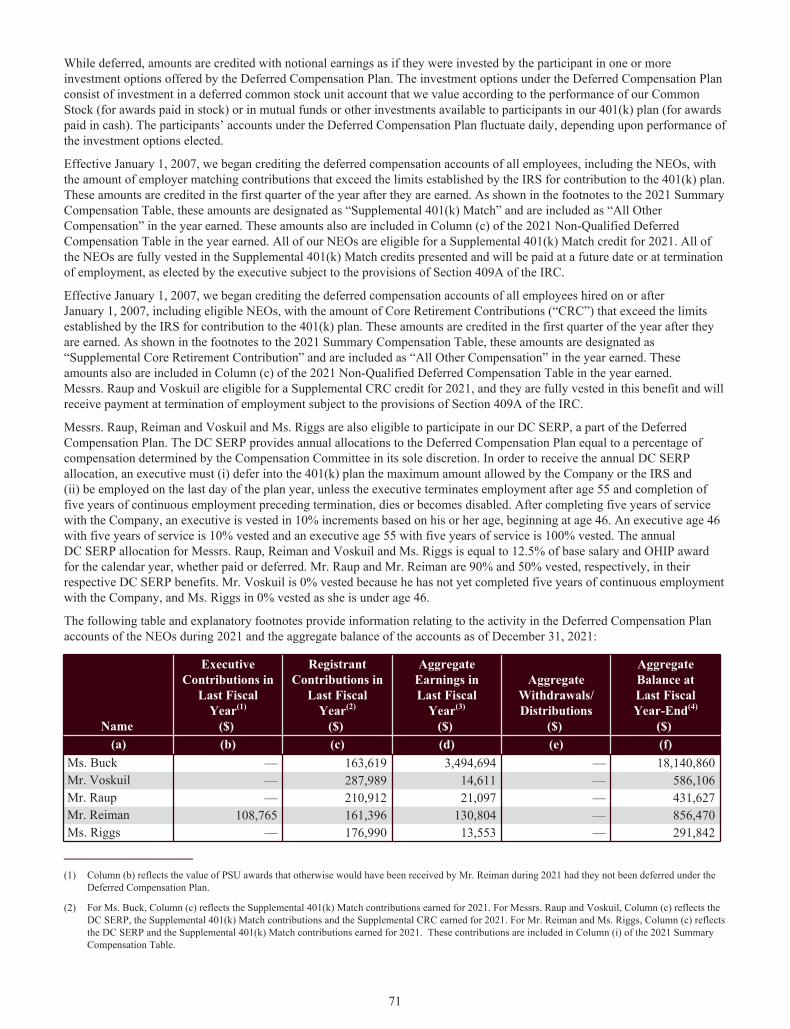
While deferred, amounts are credited with notional earnings as if they were invested by the participant in one or more investment options offered by the Deferred Compensation Plan. The investment options under the Deferred Compensation Plan consist of investment in a deferred common stock unit account that we value according to the performance of our Common Stock (for awards paid in stock) or in mutual funds or other investments available to participants in our 401(k) plan (for awards paid in cash). The participants’ accounts under the Deferred Compensation Plan fluctuate daily, depending upon performance of the investment options elected.
Effective January 1, 2007, we began crediting the deferred compensation accounts of all employees, including the NEOs, with the amount of employer matching contributions that exceed the limits established by the IRS for contribution to the 401(k) plan. These amounts are credited in the first quarter of the year after they are earned. As shown in the footnotes to the 2021 Summary Compensation Table, these amounts are designated as “Supplemental 401(k) Match” and are included as “All Other Compensation” in the year earned. These amounts also are included in Column (c) of the 2021 Non-Qualified Deferred Compensation Table in the year earned. All of our NEOs are eligible for a Supplemental 401(k) Match credit for 2021. All of the NEOs are fully vested in the Supplemental 401(k) Match credits presented and will be paid at a future date or at termination of employment, as elected by the executive subject to the provisions of Section 409A of the IRC.
Effective January 1, 2007, we began crediting the deferred compensation accounts of all employees hired on or after January 1, 2007, including eligible NEOs, with the amount of Core Retirement Contributions (“CRC”) that exceed the limits established by the IRS for contribution to the 401(k) plan. These amounts are credited in the first quarter of the year after they are earned. As shown in the footnotes to the 2021 Summary Compensation Table, these amounts are designated as “Supplemental Core Retirement Contribution” and are included as “All Other Compensation” in the year earned. These amounts also are included in Column (c) of the 2021 Non-Qualified Deferred Compensation Table in the year earned. Messrs. Raup and Voskuil are eligible for a Supplemental CRC credit for 2021, and they are fully vested in this benefit and will receive payment at termination of employment subject to the provisions of Section 409A of the IRC.
Messrs. Raup, Reiman and Voskuil and Ms. Riggs are also eligible to participate in our DC SERP, a part of the Deferred Compensation Plan. The DC SERP provides annual allocations to the Deferred Compensation Plan equal to a percentage of compensation determined by the Compensation Committee in its sole discretion. In order to receive the annual DC SERP allocation, an executive must (i) defer into the 401(k) plan the maximum amount allowed by the Company or the IRS and (ii) be employed on the last day of the plan year, unless the executive terminates employment after age 55 and completion of five years of continuous employment preceding termination, dies or becomes disabled. After completing five years of service with the Company, an executive is vested in 10% increments based on his or her age, beginning at age 46. An executive age 46 with five years of service is 10% vested and an executive age 55 with five years of service is 100% vested. The annual DC SERP allocation for Messrs. Raup, Reiman and Voskuil and Ms. Riggs is equal to 12.5% of base salary and OHIP award for the calendar year, whether paid or deferred. Mr. Raup and Mr. Reiman are 90% and 50% vested, respectively, in their respective DC SERP benefits. Mr. Voskuil is 0% vested because he has not yet completed five years of continuous employment with the Company, and Ms. Riggs in 0% vested as she is under age 46.
The following table and explanatory footnotes provide information relating to the activity in the Deferred Compensation Plan accounts of the NEOs during 2021 and the aggregate balance of the accounts as of December 31, 2021:
Name
ExecutiveContributions in
Last FiscalYear(1)
($)
RegistrantContributions in
Last FiscalYear(2)
($)
AggregateEarnings inLast Fiscal
Year(3)
($)
AggregateWithdrawals/Distributions
($)
AggregateBalance atLast FiscalYear-End(4)
($) (a) (b) (c) (d) (e) (f)
Ms. Buck — 163,619 3,494,694 — 18,140,860 Mr. Voskuil — 287,989 14,611 — 586,106 Mr. Raup — 210,912 21,097 — 431,627 Mr. Reiman 108,765 161,396 130,804 — 856,470 Ms. Riggs — 176,990 13,553 — 291,842
____________________
(1) Column (b) reflects the value of PSU awards that otherwise would have been received by Mr. Reiman during 2021 had they not been deferred under the Deferred Compensation Plan.
(2) For Ms. Buck, Column (c) reflects the Supplemental 401(k) Match contributions earned for 2021. For Messrs. Raup and Voskuil, Column (c) reflects the DC SERP, the Supplemental 401(k) Match contributions and the Supplemental CRC earned for 2021. For Mr. Reiman and Ms. Riggs, Column (c) reflects the DC SERP and the Supplemental 401(k) Match contributions earned for 2021. These contributions are included in Column (i) of the 2021 Summary Compensation Table.
71

(3) Column (d) reflects the adjustment made to each NEO’s account during 2021 to reflect the performance of the investment options chosen by the executive. Amounts reported in Column (d) were not required to be reported as compensation in the 2021 Summary Compensation Table.
(4) Column (f) reflects the aggregate balance credited to each NEO as of December 31, 2021, including the 2021 amounts reflected in Columns (b), (c) and (d). The following table indicates the portion of the Column (f) balance that reflects amounts disclosed in a Summary Compensation Table included in proxy statements for years prior to 2021:
Name
Amounts Reported in Previous Years(a)
($)Ms. Buck 6,179,924Mr. Voskuil 70,391Mr. Raup 114,132Mr. Reiman 132,851Ms. Riggs —
a. This amount reflects the fair market value as of December 31, 2021, of vested PSU, RSU and OHIP awards as well as DC SERP, Supplemental 401(k) Match and Supplemental CRC credits. The amounts disclosed in the Summary Compensation Table included in proxy statements for years prior to 2021 reflect the grant date value of such awards, rather than the fair market value as of December 31, 2021.
Potential Payments upon Termination or Change in Control We maintain plans covering our NEOs that will require us to provide incremental compensation in the event of termination of employment or a Change in Control (as such term is defined in the applicable governing document), provided certain conditions are met. The following narrative takes each hypothetical termination of employment situation – voluntary resignation, termination for Cause, death, disability, retirement, termination without Cause, and resignation for Good Reason – and a Change in Control of the Company, and describes the additional amounts, if any, that the Company would pay or provide to the NEOs, or their beneficiaries, as a result.
The narrative below and the amounts shown reflect certain assumptions we have made in accordance with SEC rules. We have assumed that the termination of employment or Change in Control occurred on December 31, 2021, and that the value of a share of our Common Stock on that day was $193.47, the closing price on the NYSE on December 31, 2021, the last trading day of 2021.
In addition, in keeping with SEC rules, the following narrative and amounts do not include payments and benefits which are not enhanced by a qualifying termination of employment or Change in Control. These payments and benefits are referred to as “vested benefits” and include:
• Vested benefits accrued under the 401(k) and pension plans;• Accrued vacation pay, health plan continuation and other similar amounts payable when employment terminates under
programs generally applicable to the Company’s salaried employees;• Vested Supplemental 401(k) Match and Supplemental CRC provided to the NEOs on the same basis as all other
employees eligible for Supplemental 401(k) Match and Supplemental CRC;• Vested benefits accrued under the DB SERP, CLRP and account balances held under the Deferred Compensation Plan
as previously described in the sections entitled “2021 Pension Benefits Table” and “2021 Non-Qualified Deferred Compensation Table”; and
• Stock options that have vested and become exercisable prior to termination of employment or Change in Control.
Voluntary Resignation (other than a Resignation for Good Reason)We are not obligated to pay amounts over and above vested benefits to a NEO who voluntarily resigns. Vested stock options may not be exercised after the NEO’s resignation date unless the executive meets retirement eligibility requirements (separation after attainment of age 55 with at least five years of continuous service).
Termination for CauseIf we terminate a NEO’s employment for Cause, we are not obligated to pay the executive any amounts over and above vested benefits. The NEO’s right to exercise vested stock options expires upon termination for Cause, and amounts otherwise payable under the DB SERP are subject to forfeiture at the Company’s discretion. In general, a termination will be for Cause if the executive has been convicted of a felony or has engaged in gross negligence or willful misconduct in the performance of duties, material dishonesty or a material violation of Company policies, including our Code of Conduct, or bad faith actions in the performance of duties not in the best interests of the Company.
72
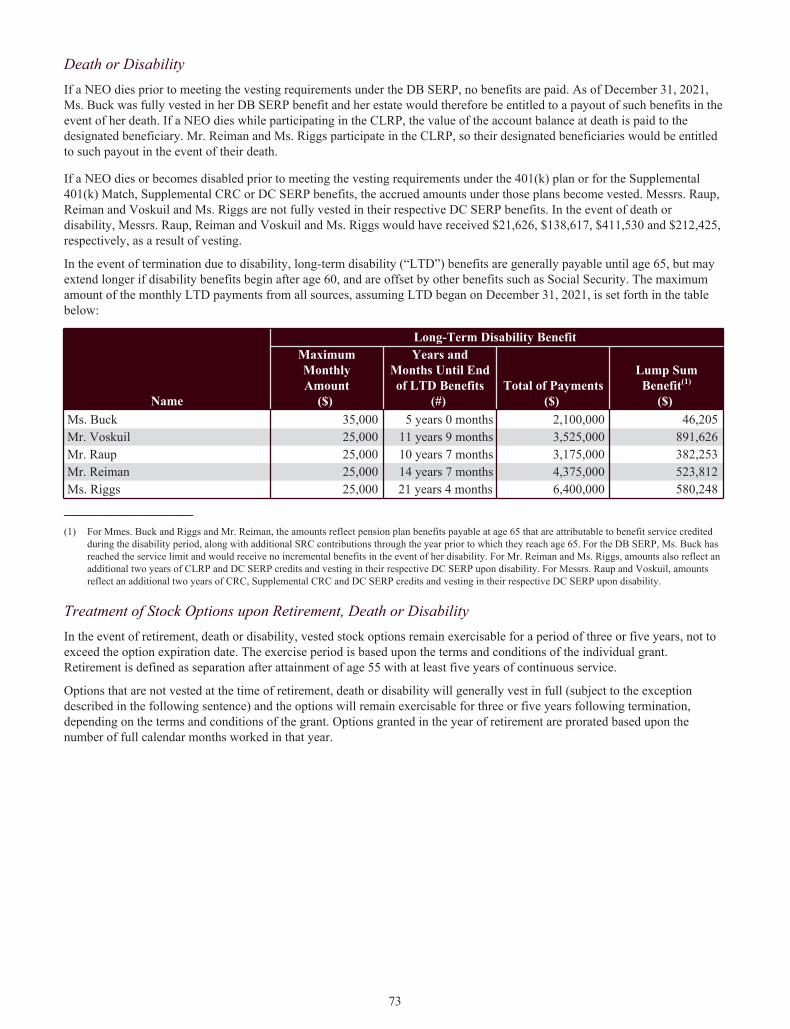
Death or DisabilityIf a NEO dies prior to meeting the vesting requirements under the DB SERP, no benefits are paid. As of December 31, 2021, Ms. Buck was fully vested in her DB SERP benefit and her estate would therefore be entitled to a payout of such benefits in the event of her death. If a NEO dies while participating in the CLRP, the value of the account balance at death is paid to the designated beneficiary. Mr. Reiman and Ms. Riggs participate in the CLRP, so their designated beneficiaries would be entitled to such payout in the event of their death.
If a NEO dies or becomes disabled prior to meeting the vesting requirements under the 401(k) plan or for the Supplemental 401(k) Match, Supplemental CRC or DC SERP benefits, the accrued amounts under those plans become vested. Messrs. Raup, Reiman and Voskuil and Ms. Riggs are not fully vested in their respective DC SERP benefits. In the event of death or disability, Messrs. Raup, Reiman and Voskuil and Ms. Riggs would have received $21,626, $138,617, $411,530 and $212,425, respectively, as a result of vesting.
In the event of termination due to disability, long-term disability (“LTD”) benefits are generally payable until age 65, but may extend longer if disability benefits begin after age 60, and are offset by other benefits such as Social Security. The maximum amount of the monthly LTD payments from all sources, assuming LTD began on December 31, 2021, is set forth in the table below:
Name
Long-Term Disability Benefit MaximumMonthlyAmount
($)
Years andMonths Until Endof LTD Benefits
(#) Total of Payments
($)
Lump SumBenefit(1)
($) Ms. Buck 35,000 5 years 0 months 2,100,000 46,205 Mr. Voskuil 25,000 11 years 9 months 3,525,000 891,626 Mr. Raup 25,000 10 years 7 months 3,175,000 382,253 Mr. Reiman 25,000 14 years 7 months 4,375,000 523,812 Ms. Riggs 25,000 21 years 4 months 6,400,000 580,248
____________________
(1) For Mmes. Buck and Riggs and Mr. Reiman, the amounts reflect pension plan benefits payable at age 65 that are attributable to benefit service credited during the disability period, along with additional SRC contributions through the year prior to which they reach age 65. For the DB SERP, Ms. Buck has reached the service limit and would receive no incremental benefits in the event of her disability. For Mr. Reiman and Ms. Riggs, amounts also reflect an additional two years of CLRP and DC SERP credits and vesting in their respective DC SERP upon disability. For Messrs. Raup and Voskuil, amounts reflect an additional two years of CRC, Supplemental CRC and DC SERP credits and vesting in their respective DC SERP upon disability.
Treatment of Stock Options upon Retirement, Death or DisabilityIn the event of retirement, death or disability, vested stock options remain exercisable for a period of three or five years, not to exceed the option expiration date. The exercise period is based upon the terms and conditions of the individual grant. Retirement is defined as separation after attainment of age 55 with at least five years of continuous service.
Options that are not vested at the time of retirement, death or disability will generally vest in full (subject to the exception described in the following sentence) and the options will remain exercisable for three or five years following termination, depending on the terms and conditions of the grant. Options granted in the year of retirement are prorated based upon the number of full calendar months worked in that year.
73
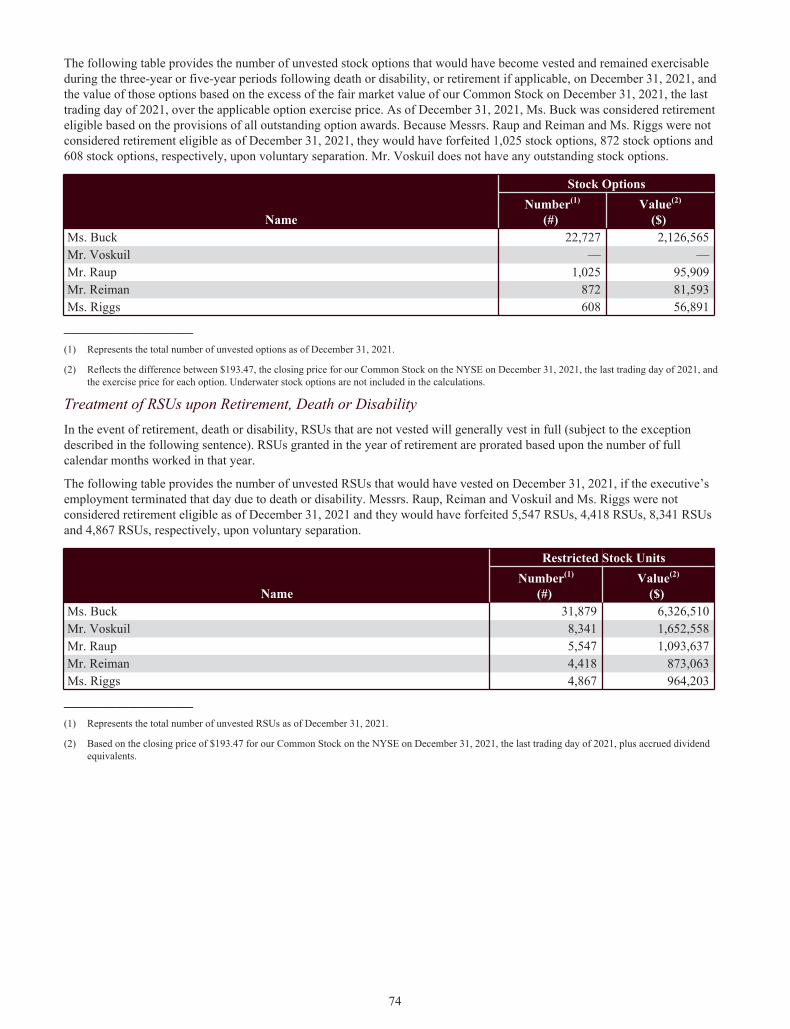
The following table provides the number of unvested stock options that would have become vested and remained exercisable during the three-year or five-year periods following death or disability, or retirement if applicable, on December 31, 2021, and the value of those options based on the excess of the fair market value of our Common Stock on December 31, 2021, the last trading day of 2021, over the applicable option exercise price. As of December 31, 2021, Ms. Buck was considered retirement eligible based on the provisions of all outstanding option awards. Because Messrs. Raup and Reiman and Ms. Riggs were not considered retirement eligible as of December 31, 2021, they would have forfeited 1,025 stock options, 872 stock options and 608 stock options, respectively, upon voluntary separation. Mr. Voskuil does not have any outstanding stock options.
Name
Stock OptionsNumber(1)
(#) Value(2)
($) Ms. Buck 22,727 2,126,565 Mr. Voskuil — — Mr. Raup 1,025 95,909 Mr. Reiman 872 81,593 Ms. Riggs 608 56,891
____________________
(1) Represents the total number of unvested options as of December 31, 2021.
(2) Reflects the difference between $193.47, the closing price for our Common Stock on the NYSE on December 31, 2021, the last trading day of 2021, and the exercise price for each option. Underwater stock options are not included in the calculations.
Treatment of RSUs upon Retirement, Death or DisabilityIn the event of retirement, death or disability, RSUs that are not vested will generally vest in full (subject to the exception described in the following sentence). RSUs granted in the year of retirement are prorated based upon the number of full calendar months worked in that year.
The following table provides the number of unvested RSUs that would have vested on December 31, 2021, if the executive’s employment terminated that day due to death or disability. Messrs. Raup, Reiman and Voskuil and Ms. Riggs were not considered retirement eligible as of December 31, 2021 and they would have forfeited 5,547 RSUs, 4,418 RSUs, 8,341 RSUs and 4,867 RSUs, respectively, upon voluntary separation.
Name
Restricted Stock Units Number(1)
(#) Value(2)
($) Ms. Buck 31,879 6,326,510 Mr. Voskuil 8,341 1,652,558 Mr. Raup 5,547 1,093,637 Mr. Reiman 4,418 873,063 Ms. Riggs 4,867 964,203
____________________
(1) Represents the total number of unvested RSUs as of December 31, 2021.
(2) Based on the closing price of $193.47 for our Common Stock on the NYSE on December 31, 2021, the last trading day of 2021, plus accrued dividend equivalents.
74
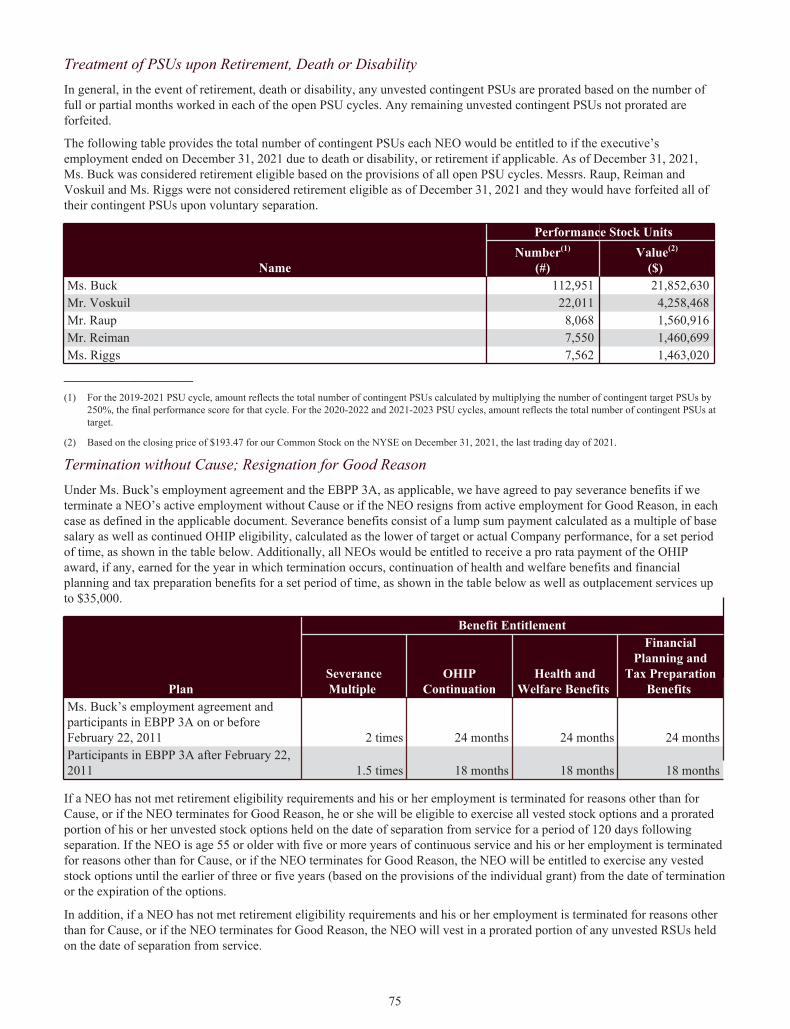
The following table provides the total number of contingent PSUs each NEO would be entitled to if the executive’s employment ended on December 31, 2021 due to death or disability, or retirement if applicable. As of December 31, 2021, Ms. Buck was considered retirement eligible based on the provisions of all open PSU cycles. Messrs. Raup, Reiman and Voskuil and Ms. Riggs were not considered retirement eligible as of December 31, 2021 and they would have forfeited all of their contingent PSUs upon voluntary separation.
Name
Performance Stock UnitsNumber(1)
(#)Value(2)
($) Ms. Buck 112,951 21,852,630 Mr. Voskuil 22,011 4,258,468 Mr. Raup 8,068 1,560,916 Mr. Reiman 7,550 1,460,699 Ms. Riggs 7,562 1,463,020
____________________
(1) For the 2019-2021 PSU cycle, amount reflects the total number of contingent PSUs calculated by multiplying the number of contingent target PSUs by 250%, the final performance score for that cycle. For the 2020-2022 and 2021-2023 PSU cycles, amount reflects the total number of contingent PSUs at target.
(2) Based on the closing price of $193.47 for our Common Stock on the NYSE on December 31, 2021, the last trading day of 2021.
Termination without Cause; Resignation for Good ReasonUnder Ms. Buck’s employment agreement and the EBPP 3A, as applicable, we have agreed to pay severance benefits if we terminate a NEO’s active employment without Cause or if the NEO resigns from active employment for Good Reason, in each case as defined in the applicable document. Severance benefits consist of a lump sum payment calculated as a multiple of base salary as well as continued OHIP eligibility, calculated as the lower of target or actual Company performance, for a set period of time, as shown in the table below. Additionally, all NEOs would be entitled to receive a pro rata payment of the OHIP award, if any, earned for the year in which termination occurs, continuation of health and welfare benefits and financial planning and tax preparation benefits for a set period of time, as shown in the table below as well as outplacement services up to $35,000.
Plan
Benefit Entitlement
SeveranceMultiple
OHIP Continuation
Health andWelfare Benefits
Financial Planning and
Tax Preparation Benefits
Ms. Buck’s employment agreement and participants in EBPP 3A on or before February 22, 2011 2 times 24 months 24 months 24 monthsParticipants in EBPP 3A after February 22, 2011 1.5 times 18 months 18 months 18 months
If a NEO has not met retirement eligibility requirements and his or her employment is terminated for reasons other than for Cause, or if the NEO terminates for Good Reason, he or she will be eligible to exercise all vested stock options and a prorated portion of his or her unvested stock options held on the date of separation from service for a period of 120 days following separation. If the NEO is age 55 or older with five or more years of continuous service and his or her employment is terminated for reasons other than for Cause, or if the NEO terminates for Good Reason, the NEO will be entitled to exercise any vested stock options until the earlier of three or five years (based on the provisions of the individual grant) from the date of termination or the expiration of the options.
In addition, if a NEO has not met retirement eligibility requirements and his or her employment is terminated for reasons other than for Cause, or if the NEO terminates for Good Reason, the NEO will vest in a prorated portion of any unvested RSUs held on the date of separation from service.
75
Treatment of PSUs upon Retirement, Death or DisabilityIn general, in the event of retirement, death or disability, any unvested contingent PSUs are prorated based on the number of full or partial months worked in each of the open PSU cycles. Any remaining unvested contingent PSUs not prorated are forfeited.
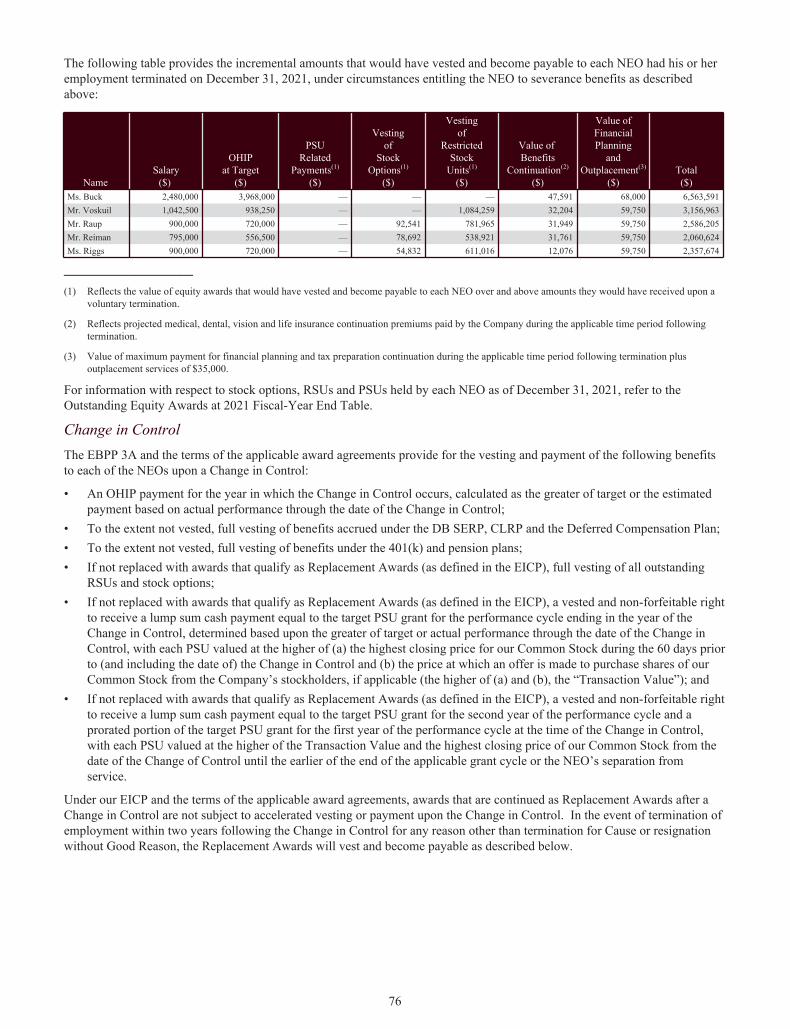
The following table provides the incremental amounts that would have vested and become payable to each NEO had his or her employment terminated on December 31, 2021, under circumstances entitling the NEO to severance benefits as described above:
Name Salary
($)
OHIPat Target
($)
PSURelated
Payments(1)
($)
Vestingof
StockOptions(1)
($)
Vestingof
RestrictedStock
Units(1)
($)
Value of Benefits
Continuation(2)
($)
Value ofFinancialPlanning
andOutplacement(3)
($)Total($)
Ms. Buck 2,480,000 3,968,000 — — — 47,591 68,000 6,563,591 Mr. Voskuil 1,042,500 938,250 — — 1,084,259 32,204 59,750 3,156,963 Mr. Raup 900,000 720,000 — 92,541 781,965 31,949 59,750 2,586,205 Mr. Reiman 795,000 556,500 — 78,692 538,921 31,761 59,750 2,060,624 Ms. Riggs 900,000 720,000 — 54,832 611,016 12,076 59,750 2,357,674
____________________
(1) Reflects the value of equity awards that would have vested and become payable to each NEO over and above amounts they would have received upon a voluntary termination.
(2) Reflects projected medical, dental, vision and life insurance continuation premiums paid by the Company during the applicable time period following termination.
(3) Value of maximum payment for financial planning and tax preparation continuation during the applicable time period following termination plus outplacement services of $35,000.
For information with respect to stock options, RSUs and PSUs held by each NEO as of December 31, 2021, refer to the Outstanding Equity Awards at 2021 Fiscal-Year End Table.
Change in ControlThe EBPP 3A and the terms of the applicable award agreements provide for the vesting and payment of the following benefits to each of the NEOs upon a Change in Control:
• An OHIP payment for the year in which the Change in Control occurs, calculated as the greater of target or the estimated payment based on actual performance through the date of the Change in Control;
• To the extent not vested, full vesting of benefits accrued under the DB SERP, CLRP and the Deferred Compensation Plan;• To the extent not vested, full vesting of benefits under the 401(k) and pension plans;• If not replaced with awards that qualify as Replacement Awards (as defined in the EICP), full vesting of all outstanding
RSUs and stock options;• If not replaced with awards that qualify as Replacement Awards (as defined in the EICP), a vested and non-forfeitable right
to receive a lump sum cash payment equal to the target PSU grant for the performance cycle ending in the year of the Change in Control, determined based upon the greater of target or actual performance through the date of the Change in Control, with each PSU valued at the higher of (a) the highest closing price for our Common Stock during the 60 days prior to (and including the date of) the Change in Control and (b) the price at which an offer is made to purchase shares of our Common Stock from the Company’s stockholders, if applicable (the higher of (a) and (b), the “Transaction Value”); and
• If not replaced with awards that qualify as Replacement Awards (as defined in the EICP), a vested and non-forfeitable right to receive a lump sum cash payment equal to the target PSU grant for the second year of the performance cycle and a prorated portion of the target PSU grant for the first year of the performance cycle at the time of the Change in Control, with each PSU valued at the higher of the Transaction Value and the highest closing price of our Common Stock from the date of the Change of Control until the earlier of the end of the applicable grant cycle or the NEO’s separation from service.
Under our EICP and the terms of the applicable award agreements, awards that are continued as Replacement Awards after a Change in Control are not subject to accelerated vesting or payment upon the Change in Control. In the event of termination of employment within two years following the Change in Control for any reason other than termination for Cause or resignation without Good Reason, the Replacement Awards will vest and become payable as described below.
76
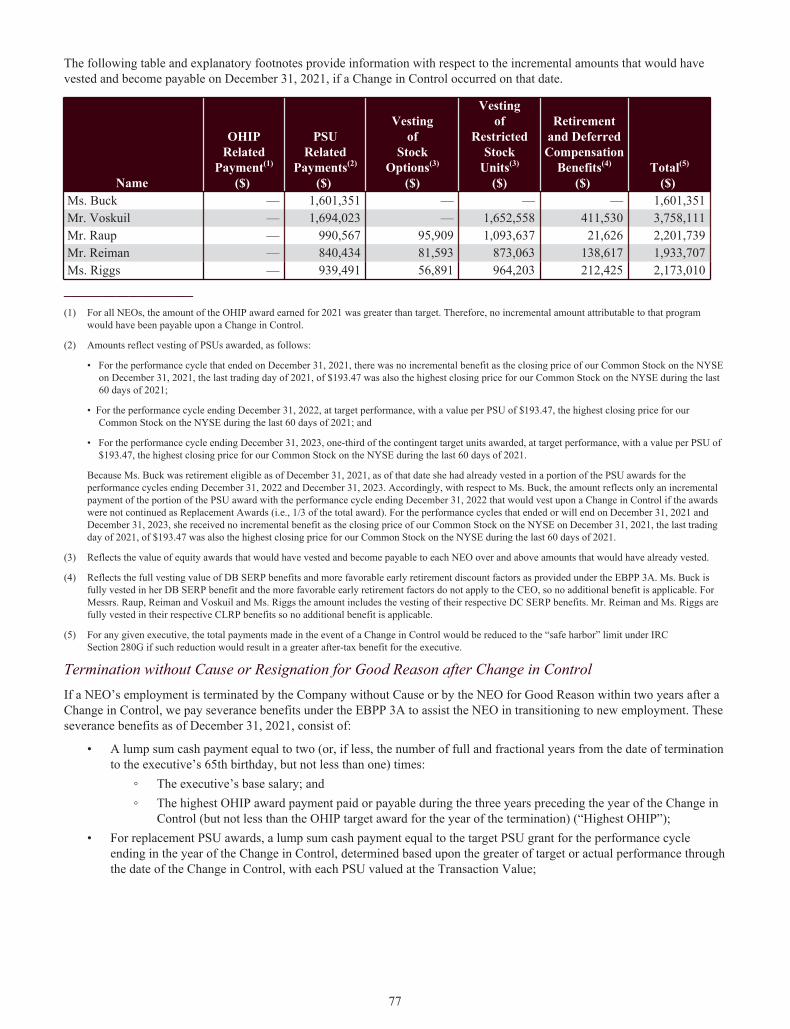
The following table and explanatory footnotes provide information with respect to the incremental amounts that would have vested and become payable on December 31, 2021, if a Change in Control occurred on that date.
Name
OHIPRelated
Payment(1)
($)
PSURelated
Payments(2)
($)
Vestingof
StockOptions(3)
($)
Vestingof
RestrictedStock
Units(3)
($)
Retirementand DeferredCompensation
Benefits(4)
($) Total(5)
($) Ms. Buck — 1,601,351 — — — 1,601,351 Mr. Voskuil — 1,694,023 — 1,652,558 411,530 3,758,111 Mr. Raup — 990,567 95,909 1,093,637 21,626 2,201,739 Mr. Reiman — 840,434 81,593 873,063 138,617 1,933,707 Ms. Riggs — 939,491 56,891 964,203 212,425 2,173,010
____________________
(1) For all NEOs, the amount of the OHIP award earned for 2021 was greater than target. Therefore, no incremental amount attributable to that program would have been payable upon a Change in Control.
(2) Amounts reflect vesting of PSUs awarded, as follows:
• For the performance cycle that ended on December 31, 2021, there was no incremental benefit as the closing price of our Common Stock on the NYSE on December 31, 2021, the last trading day of 2021, of $193.47 was also the highest closing price for our Common Stock on the NYSE during the last 60 days of 2021;
• For the performance cycle ending December 31, 2022, at target performance, with a value per PSU of $193.47, the highest closing price for our Common Stock on the NYSE during the last 60 days of 2021; and
• For the performance cycle ending December 31, 2023, one-third of the contingent target units awarded, at target performance, with a value per PSU of $193.47, the highest closing price for our Common Stock on the NYSE during the last 60 days of 2021.
Because Ms. Buck was retirement eligible as of December 31, 2021, as of that date she had already vested in a portion of the PSU awards for the performance cycles ending December 31, 2022 and December 31, 2023. Accordingly, with respect to Ms. Buck, the amount reflects only an incremental payment of the portion of the PSU award with the performance cycle ending December 31, 2022 that would vest upon a Change in Control if the awards were not continued as Replacement Awards (i.e., 1/3 of the total award). For the performance cycles that ended or will end on December 31, 2021 and December 31, 2023, she received no incremental benefit as the closing price of our Common Stock on the NYSE on December 31, 2021, the last trading day of 2021, of $193.47 was also the highest closing price for our Common Stock on the NYSE during the last 60 days of 2021.
(3) Reflects the value of equity awards that would have vested and become payable to each NEO over and above amounts that would have already vested.
(4) Reflects the full vesting value of DB SERP benefits and more favorable early retirement discount factors as provided under the EBPP 3A. Ms. Buck is fully vested in her DB SERP benefit and the more favorable early retirement factors do not apply to the CEO, so no additional benefit is applicable. For Messrs. Raup, Reiman and Voskuil and Ms. Riggs the amount includes the vesting of their respective DC SERP benefits. Mr. Reiman and Ms. Riggs are fully vested in their respective CLRP benefits so no additional benefit is applicable.
(5) For any given executive, the total payments made in the event of a Change in Control would be reduced to the “safe harbor” limit under IRC Section 280G if such reduction would result in a greater after-tax benefit for the executive.
Termination without Cause or Resignation for Good Reason after Change in ControlIf a NEO’s employment is terminated by the Company without Cause or by the NEO for Good Reason within two years after a Change in Control, we pay severance benefits under the EBPP 3A to assist the NEO in transitioning to new employment. These severance benefits as of December 31, 2021, consist of:
• A lump sum cash payment equal to two (or, if less, the number of full and fractional years from the date of termination to the executive’s 65th birthday, but not less than one) times:
◦ The executive’s base salary; and◦ The highest OHIP award payment paid or payable during the three years preceding the year of the Change in
Control (but not less than the OHIP target award for the year of the termination) (“Highest OHIP”);• For replacement PSU awards, a lump sum cash payment equal to the target PSU grant for the performance cycle
ending in the year of the Change in Control, determined based upon the greater of target or actual performance through the date of the Change in Control, with each PSU valued at the Transaction Value;
77
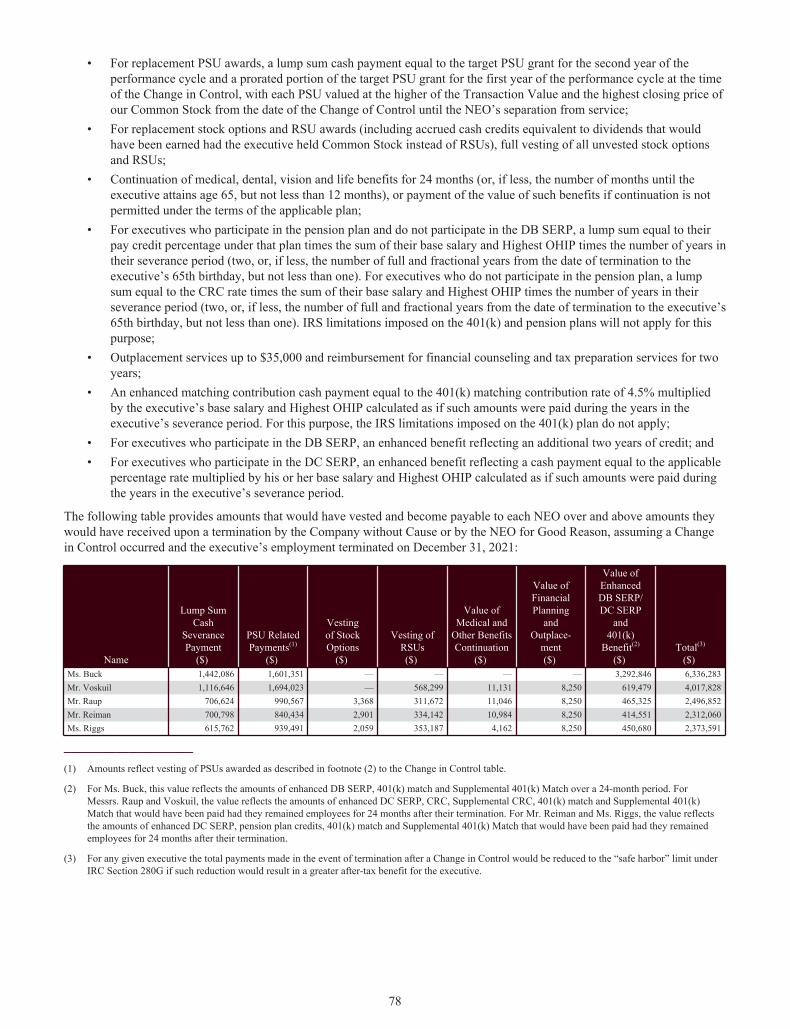
• For replacement PSU awards, a lump sum cash payment equal to the target PSU grant for the second year of the performance cycle and a prorated portion of the target PSU grant for the first year of the performance cycle at the time of the Change in Control, with each PSU valued at the higher of the Transaction Value and the highest closing price of our Common Stock from the date of the Change of Control until the NEO’s separation from service;
• For replacement stock options and RSU awards (including accrued cash credits equivalent to dividends that would have been earned had the executive held Common Stock instead of RSUs), full vesting of all unvested stock options and RSUs;
• Continuation of medical, dental, vision and life benefits for 24 months (or, if less, the number of months until the executive attains age 65, but not less than 12 months), or payment of the value of such benefits if continuation is not permitted under the terms of the applicable plan;
• For executives who participate in the pension plan and do not participate in the DB SERP, a lump sum equal to their pay credit percentage under that plan times the sum of their base salary and Highest OHIP times the number of years in their severance period (two, or, if less, the number of full and fractional years from the date of termination to the executive’s 65th birthday, but not less than one). For executives who do not participate in the pension plan, a lump sum equal to the CRC rate times the sum of their base salary and Highest OHIP times the number of years in their severance period (two, or, if less, the number of full and fractional years from the date of termination to the executive’s 65th birthday, but not less than one). IRS limitations imposed on the 401(k) and pension plans will not apply for this purpose;
• Outplacement services up to $35,000 and reimbursement for financial counseling and tax preparation services for two years;
• An enhanced matching contribution cash payment equal to the 401(k) matching contribution rate of 4.5% multiplied by the executive’s base salary and Highest OHIP calculated as if such amounts were paid during the years in the executive’s severance period. For this purpose, the IRS limitations imposed on the 401(k) plan do not apply;
• For executives who participate in the DB SERP, an enhanced benefit reflecting an additional two years of credit; and• For executives who participate in the DC SERP, an enhanced benefit reflecting a cash payment equal to the applicable
percentage rate multiplied by his or her base salary and Highest OHIP calculated as if such amounts were paid during the years in the executive’s severance period.
The following table provides amounts that would have vested and become payable to each NEO over and above amounts they would have received upon a termination by the Company without Cause or by the NEO for Good Reason, assuming a Change in Control occurred and the executive’s employment terminated on December 31, 2021:
Name
Lump SumCash
SeverancePayment
($)
PSU RelatedPayments(1)
($)
Vestingof StockOptions
($)
Vesting ofRSUs($)
Value ofMedical and
Other BenefitsContinuation
($)
Value ofFinancialPlanning
andOutplace-
ment($)
Value ofEnhancedDB SERP/DC SERP
and401(k)
Benefit(2)
($) Total(3)
($) Ms. Buck 1,442,086 1,601,351 — — — — 3,292,846 6,336,283 Mr. Voskuil 1,116,646 1,694,023 — 568,299 11,131 8,250 619,479 4,017,828 Mr. Raup 706,624 990,567 3,368 311,672 11,046 8,250 465,325 2,496,852 Mr. Reiman 700,798 840,434 2,901 334,142 10,984 8,250 414,551 2,312,060 Ms. Riggs 615,762 939,491 2,059 353,187 4,162 8,250 450,680 2,373,591
____________________
(1) Amounts reflect vesting of PSUs awarded as described in footnote (2) to the Change in Control table.
(2) For Ms. Buck, this value reflects the amounts of enhanced DB SERP, 401(k) match and Supplemental 401(k) Match over a 24-month period. For Messrs. Raup and Voskuil, the value reflects the amounts of enhanced DC SERP, CRC, Supplemental CRC, 401(k) match and Supplemental 401(k) Match that would have been paid had they remained employees for 24 months after their termination. For Mr. Reiman and Ms. Riggs, the value reflects the amounts of enhanced DC SERP, pension plan credits, 401(k) match and Supplemental 401(k) Match that would have been paid had they remained employees for 24 months after their termination.
(3) For any given executive the total payments made in the event of termination after a Change in Control would be reduced to the “safe harbor” limit under IRC Section 280G if such reduction would result in a greater after-tax benefit for the executive.
78
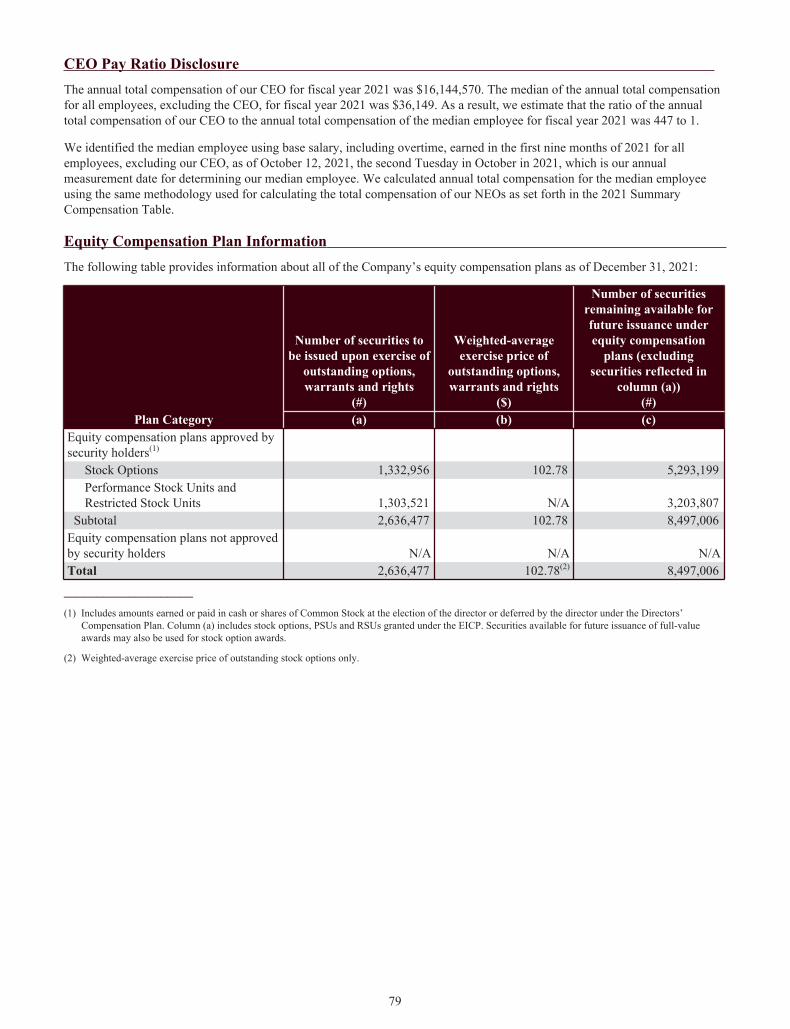
CEO Pay Ratio Disclosure The annual total compensation of our CEO for fiscal year 2021 was $16,144,570. The median of the annual total compensation for all employees, excluding the CEO, for fiscal year 2021 was $36,149. As a result, we estimate that the ratio of the annual total compensation of our CEO to the annual total compensation of the median employee for fiscal year 2021 was 447 to 1.
We identified the median employee using base salary, including overtime, earned in the first nine months of 2021 for all employees, excluding our CEO, as of October 12, 2021, the second Tuesday in October in 2021, which is our annual measurement date for determining our median employee. We calculated annual total compensation for the median employee using the same methodology used for calculating the total compensation of our NEOs as set forth in the 2021 Summary Compensation Table.
Equity Compensation Plan Information The following table provides information about all of the Company’s equity compensation plans as of December 31, 2021:
Plan Category
Number of securities to be issued upon exercise of
outstanding options, warrants and rights
(#)
Weighted-average exercise price of
outstanding options, warrants and rights
($)
Number of securities remaining available for future issuance under equity compensation
plans (excluding securities reflected in
column (a)) (#)
(a) (b) (c)Equity compensation plans approved by security holders(1)
Stock Options 1,332,956 102.78 5,293,199 Performance Stock Units and Restricted Stock Units 1,303,521 N/A 3,203,807
Subtotal 2,636,477 102.78 8,497,006 Equity compensation plans not approved by security holders N/A N/A N/ATotal 2,636,477 102.78(2) 8,497,006
____________________
(1) Includes amounts earned or paid in cash or shares of Common Stock at the election of the director or deferred by the director under the Directors’ Compensation Plan. Column (a) includes stock options, PSUs and RSUs granted under the EICP. Securities available for future issuance of full-value awards may also be used for stock option awards.
(2) Weighted-average exercise price of outstanding stock options only.
79
PROPOSAL NO. 3 – ADVISE ON NAMED EXECUTIVEOFFICER COMPENSATION
üThe Board of Directors unanimously recommends that stockholders
vote FOR approval, on a non-binding advisory basis, of the compensation of the Company’s named executive officers
In accordance with the Dodd-Frank Wall Street Reform and Consumer Protection Act and related SEC rules, and as required under Section 14A of the Exchange Act, we are providing stockholders an opportunity to conduct an advisory vote regarding the compensation of our NEOs as disclosed in this Proxy Statement.
Prior to submitting your vote, we encourage you to read our Compensation Discussion & Analysis and the accompanying executive compensation tables for details about our executive compensation program, including information about the 2021 compensation of our NEOs.
As discussed in more detail in the Compensation Discussion & Analysis, we believe our executive compensation program is competitive and governed by pay-for-performance principles. We emphasize compensation opportunities that reward results. Our stock ownership requirements and use of stock-based incentives reinforce the alignment of the interests of our executives with those of our long-term stockholders. In doing so, our executive compensation program supports our strategic objectives and mission.
Accordingly, we ask you to approve the following resolution at the Annual Meeting:
“RESOLVED, that the stockholders of The Hershey Company approve, on an advisory basis, the compensation paid to the Company’s named executive officers, as disclosed in the Proxy Statement for the 2022 Annual Meeting of Stockholders pursuant to the SEC’s compensation disclosure rules, including the Compensation Discussion & Analysis, the executive compensation tables and the related narrative discussion.”
Because your vote is advisory, it will not be binding upon the Board. However, as noted in the Compensation Discussion & Analysis, the Compensation Committee and the Board will, as deemed appropriate, take into account the outcome of the vote when considering future decisions affecting executive compensation.
The affirmative vote of at least a majority of the votes of the Common Stock and Class B Common Stock (voting together as a class) represented at the Annual Meeting, electronically or by proxy, is required to approve this proposal.
80
PROPOSAL NO. 4 – STOCKHOLDER PROPOSAL END CHILD LABOR IN COCOA PRODUCTION
The following stockholder proposal has been submitted by American Baptist Home Mission Society and six co-filers. The proposal will be voted on at the Annual Meeting only if properly presented by or on behalf of the proponent. In accordance with applicable proxy regulations, the proposed resolution and supporting statement, for which the Board and the Company accept no responsibility, are set forth below.
û The Board of Directors unanimously recommends that stockholders vote AGAINST Proposal No. 4
Stockholder ProposalResolved: Shareholders request that the Board of Directors issue a public report, at reasonable cost and omitting proprietary information, describing if, and how, Hershey’s living wage position statement and planned implementation steps will put the company on course to eradicate child labor in all forms from the company’s West African cocoa supply chain by 2025. Reporting is requested within one year from Hershey’s 2022 annual meeting.
Whereas: Hazardous child labor on cocoa farms, which includes using machetes and harmful pesticides, meets the International Labor Organization’s definition of the “worst forms of child labor.”(1) ILO Convention 182 calls for urgent action to eliminate these forms and Sustainable Development Goal 8.7 calls for the elimination of all child labor by 2025, yet international agreements have repeatedly failed to eradicate hazardous child labor from the cocoa supply chain.(2)
Twenty years ago, Hershey’s CEO signed the Harkin-Engel Protocol, a voluntary public-private commitment to end the worst forms of child labor, including forced labor, in West African cocoa production.(3) After repeatedly amending the Protocol’s timeline and goals, signatory companies continue to profit from child slavery. The Department of Labor estimates that 1.56 million children engage in hazardous work on cocoa farms in Ghana and Côte d’Ivoire, where 60% of cocoa is produced.(4)
While Hershey has a Human Rights Policy and Cocoa For Good strategy, these initiatives have failed to meaningfully address systemic poverty as a root cause of child labor. Adopting a Living Wage and Income Position Statement in 2021 was a positive step; however, an Oxfam report criticizes Hershey for stating support for a living wage without a “concrete, timebound commitment and accompanying action plan to realize it.”(5) Investors lack sufficient information to assess how Hershey’s living wage statement will help eradicate child labor in its cocoa supply chain.
Failure to eradicate child labor exposes Hershey and its investors to financial, legal, and reputational risks. In February 2021, a lawsuit filed on behalf of eight former child slaves alleges Hershey knowingly profited from the illegal and systematic use of child labor.(6) In a motion to dismiss, defendants argued that companies are no more responsible for child labor in their supply chains than retailers and consumers, and claimed they lack sufficient knowledge to be held liable.(7) In October 2021, Hershey and the Rainforest Alliance were sued for false and deceptive marketing of chocolate products labeled as “sustainably” or “responsibly produced.”(8)
____________________(1) https://www.internationalrightsadvocates.org/cases/tevracoubaly(2) http://www.iradvocates.org/sites/iradvocates.org/files/7.30.21%20Defs%20Memo.%20in%20Support%20of%20Motion%20to%20Dismiss.pdf ; https://
stopcocoaslavery.carrd.co/(3) https://static1.squarespace.com/static/5810dda3e3df28ce37b58357/t/6181623e5f967e246dd8c416/1635869247075/
RFA+and+Hershey+Press+Release+FINAL+no+logo.docx.pdf; https://www.norc.org/Research/Projects/Pages/assessing-progress-in-reducing-child-labor-in-cocoa-growing-areas-of-c%C3%B4te-d%E2%80%99ivoire-and-ghana.aspx
(4) https://www.thehersheycompany.com/en_us/home/sustainability/sustainability-focus-areas/cocoa.html(5) https://www.thehersheycompany.com/en_us/home/sustainability/sustainability-focus-areas/cocoa/child-labor-monitoring-and-remediation-system.html
(6) https://www.norc.org/Research/Projects/Pages/assessing-progress-in-reducing-child-labor-in-cocoa-growing-areas-of-c%C3%B4te-d%E2%80%99ivoire-and-ghana.aspx; https://www.washingtonpost.com/graphics/2019/business/hershey-nestle-mars-chocolate-child-labor-west-africa/; https://www.ilo.org/ipec/Campaignandadvocacy/Youthinaction/C182-Youth-orientated/worstforms/lang--en/index.htm
(7) https://www.ilo.org/dyn/normlex/en/f?p=NORMLEXPUB:12100:0::NO::P12100_ILO_CODE:C182; https://unstats.un.org/sdgs/metadata/?Text=&Goal=8&Target=8.7
(8) https://cocoainitiative.org/wp-content/uploads/2016/10/Harkin_Engel_Protocol.pdf
81
While Hershey indicates it met its goal to source 100% “certified and sustainable” cocoa in 2020, this does not guarantee that its cocoa is slavery-free nor that it is fully traceable to the farm level.(9) Hershey also makes misleading and dangerous claims about “appropriate” child work on “family farms,” contradicting international frameworks to end child labor in all forms.(10)
Board Statement in Opposition to Stockholder ProposalThe Board recommends a vote “AGAINST” Proposal 4 because:
• Hershey already produces an annual Sustainability Report regarding the Company’s ESG priorities, which include, among other things, eliminating child labor from occurring within cocoa communities. Another report on this topic would be duplicative.
• Hershey’s 2020 Sustainability Report provides a detailed description of Hershey’s multifaceted approach to addressing child labor that is much broader than simply implementing Hershey’s living wage position statement, which is the focus of the proposal.
• Hershey does not tolerate child labor within its value chain and has formed strategic partnerships with communities, NGOs and governments in seeking to eliminate child labor from cocoa communities with which Hershey has relationships.
In cocoa-growing communities, child labor is a complex issue resulting from a mix of poverty, cultural norms, and a general lack of educational opportunities, all of which can further entrench intergenerational poverty and exacerbate the existence of child labor. Our approach to addressing child labor includes, among other things, multiple efforts to help cocoa farmers to transition out of poverty, improve community and farmer awareness of child labor, invest in preventative, supplier-led approaches that monitor farmers to help ensure child labor is not occurring and provide tools, resources and oversight to help remediate instances of child labor if they are found. In addition, as part of our holistic effort to eliminate child labor, we seek to prevent child labor from occurring by removing barriers to children being able to attend school. This multifaceted approach to addressing child labor is already described in detail in Hershey’s 2020 Sustainability Report.
A critical step in addressing child labor is understanding where and how cocoa is produced. To that end, Hershey is working closely with its suppliers as they strive to achieve 100% sourcing visibility in Cote d’Ivoire and Ghana by requiring that 100% of farmers producing Hershey’s cocoa volume in these countries are polygon mapped by our suppliers to improve traceability and monitor deforestation and are covered by Child Labor Monitoring and Remediation Systems (“CLMRS”) to prevent, monitor and remediate child labor As provided in Hershey’s 2020 Sustainability Report, we now have more than 70% sourcing visibility of farmers producing Hershey’s cocoa volume, representing significant progress toward Hershey’s objective to achieve 100% sourcing visibility of its cocoa from those countries by 2025.
Responsibly sourcing cocoa and prioritizing our human rights and environmental requirements requires collaboration between the public and private sectors including governments, our suppliers, farmers and manufacturers. Our commitment to improve farmer livelihoods and incomes is steadfast, and we will continue to drive our requirements and evolve as we learn to benefit farmers, their families and their communities.
As noted in Hershey’s 2020 Sustainability Report, we use CLMRS to directly detect and remediate child labor. CLMRS is the leading method of child labor detection and remediation among children aged five to 17 years old and was developed through the International Cocoa Initiative. Under CLMRS, members of local farmer groups and Hershey’s suppliers’ staff are trained to become facilitators and build skills in communities to detect and report instances of child labor. We also support the establishment of community-level child protection committees to do the same. Hershey’s 2020 Sustainability Report stated that 97% of farmers in Côte d’Ivoire and Ghana producing Hershey cocoa volume were covered through CLMRS in 2020, and we plan to achieve 100% CLMRS coverage across all farmer groups in our supply chain in those countries as the Company scales up to achieve 100% sourcing visibility.
We also seek to prevent child labor from occurring by, in part, removing barriers to children’s being able to attend school. Hershey makes it easier for children to access and continue their education by improving education infrastructure, training school-parent management committees, providing school kits filled with important school supplies, and helping children and youth obtain birth certificates for school enrollment. In addition, as noted in Hershey’s 2020 Sustainability Report, we have been distributing ViVi—a peanut-based fortified snack—to school children in Ghana daily. ViVi provides children with 30% of their daily nutritional requirements. Hershey’s research has shown that providing ViVi increases school enrollment and regular attendance while also enabling improved academic performance.
____________________(9) https://www.dol.gov/agencies/ilab/our-work/child-forced-labor-trafficking/child-labor-cocoa(10) https://www.thehersheycompany.com/content/dam/corporate-us/documents/sustainability/HSY_Living_Wage_Income_Position_Statement.pdf; https://
webassets.oxfamamerica.org/media/documents/Business-briefing-Issue-1-V3.pdf?_gl=1*1ei0guo*_ga*MTI5NTI4MjAzNi4xNjM4Mzg5OTk3*_ga_R58YETD6XK*MTYzODM4OTk5Ny4xLjEuMTYzODM5MDAwNC41Mw
82
Hershey is also taking multiple steps to support cocoa farmers’ transition out of poverty, because we understand that the cycle of poverty continues to exacerbate the existence of child labor. Hershey has found that farmer groups are essential platforms for farmers to unify their voice and negotiating power to increase their earning potential and economic resilience. Hershey’s support has assisted farmer groups in receiving certification of their cocoa in compliance with credible sustainability standards, which ensures the farmer groups and their farmers are paid a higher premium for their harvests. Farmers receive direct cash payouts from the certification premium. In addition to certification, we support farmers in achieving economic gains by actively exploring how to improve their cocoa yields and enhance the productivity of their lands by creating tailored farm-development plans. Furthermore, to help diversify economic opportunities, we support cocoa community members in developing alternative means of generating income. We also directly support Village Savings and Loan Associations (“VSLAs”) which are a simple, accessible way to help individuals and communities learn about saving, borrowing and investing responsibly. The VSLAs have proven to be an invaluable source of resilience and security during the COVID-19 pandemic.
For the reasons stated above, the Board feels strongly that the requested report would be duplicative of the information included in Hershey’s annual sustainability report, which already provides a thorough assessment of the steps Hershey is taking to eliminate child labor from its West African cocoa supply chain and the results of those steps. As such, the Board believes an additional report would be an unnecessary diversion of the Company’s resources with no corresponding benefit to the Company or our stockholders, customers or consumers. We will continue to update stakeholders on our efforts to eliminate child labor from our West African cocoa supply chain in future sustainability reports.
83
CERTAIN TRANSACTIONS AND RELATIONSHIPS
Item 404 of SEC Regulation S-K requires that we disclose any transaction or series of similar transactions, or any currently proposed transaction(s), in which (i) the Company was or is to be a participant, (ii) the amount involved exceeds $120,000 and (iii) any of the following persons had or will have a direct or indirect material interest:
• Our directors or nominees for director;• Our executive officers;• Persons owning more than 5% of any class of our outstanding voting securities; or• The immediate family members of any of the persons identified in the preceding three bullets.
Policies and Procedures Regarding Transactions with Related Persons The Board has adopted a written Related Person Transaction Policy that governs the review, approval or ratification of related person transactions. The Related Person Transaction Policy may be viewed on the Investors section of our website at www.thehersheycompany.com.
Under the Related Person Transaction Policy, each related person transaction, and any significant amendment or modification to a related person transaction, must be reviewed and approved or ratified by a committee of our Board composed solely of independent directors who have no interest in the transaction. We refer to each such committee as a Reviewing Committee. The Related Person Transaction Policy also permits the disinterested members of the full Board to act as a Reviewing Committee.
The Board has designated the Governance Committee as the Reviewing Committee primarily responsible for the administration of the Related Person Transaction Policy. In addition, the Board has designated a special Reviewing Committee to oversee certain transactions involving the Company and Hershey Trust Company, Milton Hershey School, the Milton Hershey School Trust and companies owned by or affiliated with any of the foregoing. Finally, the Related Person Transaction Policy provides that the Compensation Committee will review and approve, or review and recommend to the Board for approval, any employment relationship or transaction involving an executive officer of the Company and any related compensation.
When reviewing, approving or ratifying a related person transaction, the Reviewing Committee will examine all material facts about the related person’s interest in, or relationship to, the transaction, including the approximate dollar value of the transaction. If the related person transaction involves an outside director or nominee for director, the Reviewing Committee also may consider whether the transaction would compromise the director’s status as an “independent director,” “outside director” or “non-employee director” under the Board’s Corporate Governance Guidelines, the NYSE Rules, the IRC or the Exchange Act.
Transactions with Hershey Trust Company, Milton Hershey School and the Milton Hershey School Trust During 2021, there were no transactions with the Company in which any executive officer, director or nominee for director, or any of their immediate family members, had a direct or indirect material interest that would need to be disclosed pursuant to Item 404 of SEC Regulation S-K, nor were any such transactions planned.
In any given year, we may engage in certain transactions with Hershey Trust Company, Milton Hershey School, the Milton Hershey School Trust and companies owned by or affiliated with any of the foregoing. These transactions are typically immaterial, ordinary-course transactions that do not constitute related person transactions. However, from time to time we may also engage in related person transactions with Hershey Trust Company, Milton Hershey School, the Milton Hershey School Trust and/or their subsidiaries and affiliates. Under the Board’s Corporate Governance Guidelines, a special Reviewing Committee composed of the independent, disinterested members of the Executive Committee must approve these transactions.
On December 13, 2021, we entered into a non-binding letter of intent with Hershey Trust Company, as trustee for the Milton Hershey School Trust, pursuant to which we agreed to negotiate the potential sale of certain real and personal property consisting of approximately six acres of land located in Derry Township, Pennsylvania, together with portions of a building located on the land. Hershey Trust Company, as trustee for the Milton Hershey School Trust, submitted the letter of intent pursuant to an existing right of first refusal with respect to the property, following receipt and negotiation by the Company of a bona fide, arms’ length, third-party offer for the property. The proposed purchase price of $6,500,000 matches the proposed purchase price set forth in the third-party offer and is not material to us or the Milton Hershey School Trust. Consistent with the requirements of the Board’s Corporate Governance Guidelines, the execution of the letter of intent was approved by the independent directors of the Executive Committee having no affiliation with Hershey Trust Company, Milton Hershey School, the Milton Hershey School Trust or their affiliates.
84
On February 14, 2022, the Company entered into a Stock Purchase Agreement with Hershey Trust Company, as trustee for the Milton Hershey School Trust, pursuant to which the Company agreed to purchase 1,000,000 shares of the Company’s common stock from Milton Hershey School Trust at a price equal to $203.35 per share, for a total purchase price of $203,350,000. The transaction was approved by the independent directors of the Executive Committee having no affiliation with Hershey Trust Company, Milton Hershey School, the Milton Hershey School Trust or their affiliates. The transaction closed on February 16, 2022.
The Company was not a participant in any other transactions in 2021, and other than finalizing the potential sale of the property mentioned above, there are no other currently proposed transactions in 2022 with any stockholder owning more than 5% of any class of the Company’s outstanding voting securities that would need to be disclosed pursuant to Item 404 of SEC Regulation S-K.
During 2021, we engaged in transactions in the ordinary course of our business with Hershey Trust Company, Milton Hershey School and companies affiliated with Hershey Trust Company, Milton Hershey School and the Milton Hershey School Trust. These transactions involved the sale and purchase of goods and services at market rates. The transactions were primarily with Hershey Entertainment & Resorts Company, a company that is owned by the Milton Hershey School Trust. All sales and purchases were made on terms and at prices we believe were generally available in the marketplace and were in amounts that were not material to us or to Hershey Entertainment & Resorts Company. Therefore, these transactions did not require approval under our Related Person Transaction Policy.
Although our transactions with Hershey Trust Company, Milton Hershey School and the companies affiliated with each of the foregoing and with the Milton Hershey School Trust (including Hershey Entertainment & Resorts Company) are either immaterial or otherwise not required to be disclosed under Item 404 of SEC Regulation S-K, because of our relationship with these entities, we have elected to disclose the aggregate amounts of our purchase and sale transactions with these entities for your information. In this regard:
• Our total sales to these entities in 2021 were approximately $1.4 million; and• Our total purchases from these entities in 2021 were approximately $480,000.
We do not expect the types of transactions or the amount of payments to change materially in 2022.
COMPENSATION COMMITTEE INTERLOCKSAND INSIDER PARTICIPATION
Mmes. Arway, Haben and Koken and Messrs. Crawford, Davis, Palmer and Perez served as members of our Compensation Committee at various times during 2021. None of the members of our Compensation Committee served as one of our officers or employees during 2021 or at any time in the past, and neither they nor any other director served as an executive officer of any entity for which any of our executive officers served as a director or member of its compensation committee.
None of the members of our Compensation Committee has a relationship with us that is required to be disclosed under Item 404 of SEC Regulation S-K.
85
OTHER MATTERS
Householding of Proxy Materials The SEC has adopted rules that allow us to send in a single envelope our Notice of Internet Availability of Proxy Materials or a single copy of our proxy solicitation and other required annual meeting materials to two or more stockholders sharing the same address. We may do this only if the stockholders at that address share the same last name or if we reasonably believe that the stockholders are members of the same family. If we are sending a Notice of Internet Availability of Proxy Materials, the envelope must contain a separate notice for each stockholder at the shared address. Each Notice of Internet Availability of Proxy Materials must contain a unique control number that each stockholder will use to gain access to our proxy materials and vote online. If we are mailing a paper copy of our proxy materials, the rules require us to send each stockholder at the shared address a separate proxy card.
We believe this procedure provides greater convenience to our stockholders and reinforces the Company’s Shared Goodness Promise of sustainability and protecting the environment by reducing wasteful duplicate mailings, as well as printing and mailing costs and fees. However, stockholders at a shared address may revoke their consent to the householding program and receive their Notice of Internet Availability of Proxy Materials in a separate envelope, or, if they have elected to receive a full copy of our proxy materials in the mail, receive a separate copy of these materials. If you have elected to receive paper copies of our proxy materials and want to receive a separate copy of these materials for our 2022 Annual Meeting, please call our Investor Relations Department, toll free, at (800) 539-0261. If you consented to the householding program and wish to revoke your consent for future years, simply call, toll free, (866) 540-7095, or write to Broadridge, Householding Department, 51 Mercedes Way, Edgewood, New York 11717.
Information Regarding the 2023 Annual Meeting of Stockholders The 2023 Annual Meeting of Stockholders is expected to be held on May 16, 2023. To be eligible for inclusion in the proxy materials for the 2023 Annual Meeting of Stockholders, a stockholder proposal must be received by our Secretary by no later than December 8, 2022, and must comply in all respects with applicable rules of the SEC. Stockholder proposals should be addressed to The Hershey Company, c/o Secretary, 19 East Chocolate Avenue, Hershey, Pennsylvania 17033.
A stockholder may present a proposal not included in our proxy materials from the floor of the 2023 Annual Meeting of Stockholders only if our Secretary receives notice of the proposal, along with additional information required by our by-laws, between January 17, 2023 and February 16, 2023. Notice should be addressed to The Hershey Company, c/o Secretary, 19 East Chocolate Avenue, Hershey, Pennsylvania 17033.
The notice must contain the following additional information:
• The stockholder’s name and address;• The stockholder’s shareholdings;• A brief description of the proposal;• A brief description of any financial or other interest the stockholder has in the proposal; and• Any additional information that the SEC would require if the proposal were presented in a proxy statement.
A stockholder may nominate a director from the floor of the 2023 Annual Meeting of Stockholders only if our Secretary receives notice of the nomination, along with additional information required by our by-laws, between January 17, 2023 and February 16, 2023. The notice must contain the following additional information:
• The stockholder’s name and address;• A representation that the stockholder is a holder of record of any class of our equity securities;• A representation that the stockholder intends to make the nomination in person or by proxy at the meeting;• A description of any arrangement the stockholder has with the individual the stockholder plans to nominate and the
reason for making the nomination;• The nominee’s name, address and biographical information;• The written consent of the nominee to serve as a director if elected;• Any additional information regarding the nominee that the SEC would require if the nomination were included in a
proxy statement regardless of whether the nomination may be included in such proxy statement; and• Any stockholder holding 25% or more of the votes entitled to be cast at the 2023 Annual Meeting of Stockholders is
not required to comply with these pre-notification requirements.
86
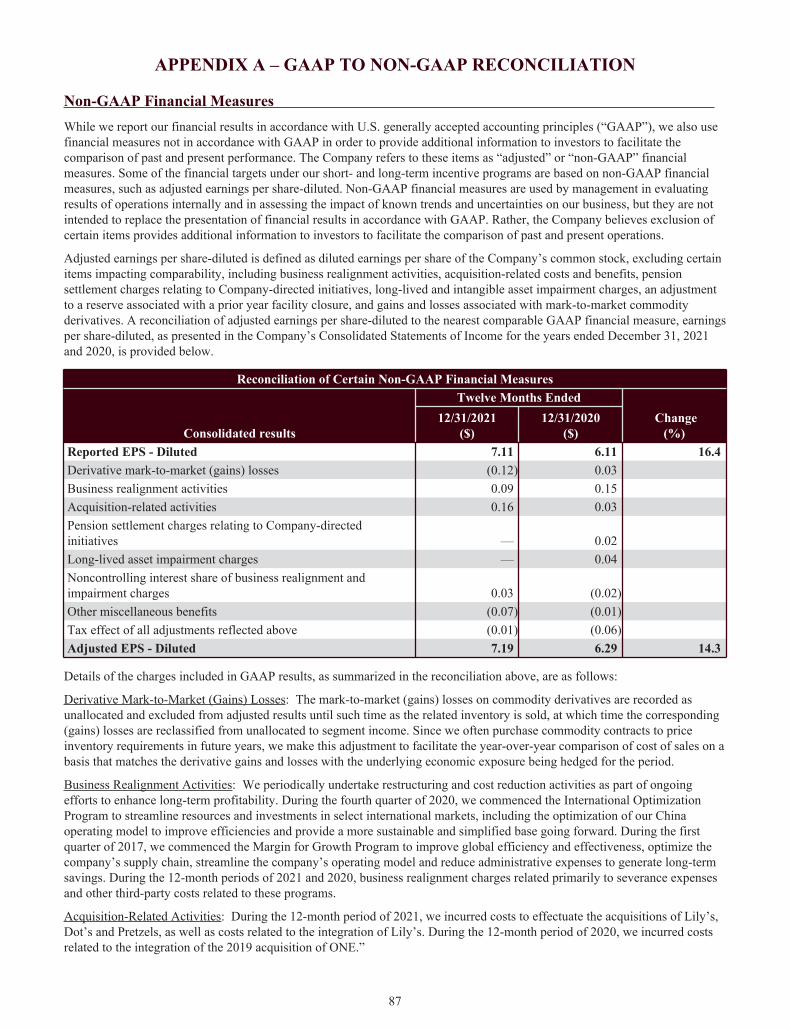
APPENDIX A – GAAP TO NON-GAAP RECONCILIATION
Non-GAAP Financial Measures While we report our financial results in accordance with U.S. generally accepted accounting principles (“GAAP”), we also use financial measures not in accordance with GAAP in order to provide additional information to investors to facilitate the comparison of past and present performance. The Company refers to these items as “adjusted” or “non-GAAP” financial measures. Some of the financial targets under our short- and long-term incentive programs are based on non-GAAP financial measures, such as adjusted earnings per share-diluted. Non-GAAP financial measures are used by management in evaluating results of operations internally and in assessing the impact of known trends and uncertainties on our business, but they are not intended to replace the presentation of financial results in accordance with GAAP. Rather, the Company believes exclusion of certain items provides additional information to investors to facilitate the comparison of past and present operations.
Adjusted earnings per share-diluted is defined as diluted earnings per share of the Company’s common stock, excluding certain items impacting comparability, including business realignment activities, acquisition-related costs and benefits, pension settlement charges relating to Company-directed initiatives, long-lived and intangible asset impairment charges, an adjustment to a reserve associated with a prior year facility closure, and gains and losses associated with mark-to-market commodity derivatives. A reconciliation of adjusted earnings per share-diluted to the nearest comparable GAAP financial measure, earnings per share-diluted, as presented in the Company’s Consolidated Statements of Income for the years ended December 31, 2021 and 2020, is provided below.
Reconciliation of Certain Non-GAAP Financial Measures
Consolidated results
Twelve Months Ended Change
(%)12/31/2021
($)12/31/2020
($)Reported EPS - Diluted 7.11 6.11 16.4 Derivative mark-to-market (gains) losses (0.12) 0.03 Business realignment activities 0.09 0.15 Acquisition-related activities 0.16 0.03 Pension settlement charges relating to Company-directed initiatives — 0.02 Long-lived asset impairment charges — 0.04 Noncontrolling interest share of business realignment and impairment charges 0.03 (0.02) Other miscellaneous benefits (0.07) (0.01) Tax effect of all adjustments reflected above (0.01) (0.06) Adjusted EPS - Diluted 7.19 6.29 14.3
Details of the charges included in GAAP results, as summarized in the reconciliation above, are as follows:
Derivative Mark-to-Market (Gains) Losses: The mark-to-market (gains) losses on commodity derivatives are recorded as unallocated and excluded from adjusted results until such time as the related inventory is sold, at which time the corresponding (gains) losses are reclassified from unallocated to segment income. Since we often purchase commodity contracts to price inventory requirements in future years, we make this adjustment to facilitate the year-over-year comparison of cost of sales on a basis that matches the derivative gains and losses with the underlying economic exposure being hedged for the period.
Business Realignment Activities: We periodically undertake restructuring and cost reduction activities as part of ongoing efforts to enhance long-term profitability. During the fourth quarter of 2020, we commenced the International Optimization Program to streamline resources and investments in select international markets, including the optimization of our China operating model to improve efficiencies and provide a more sustainable and simplified base going forward. During the first quarter of 2017, we commenced the Margin for Growth Program to improve global efficiency and effectiveness, optimize the company’s supply chain, streamline the company’s operating model and reduce administrative expenses to generate long-term savings. During the 12-month periods of 2021 and 2020, business realignment charges related primarily to severance expenses and other third-party costs related to these programs.
Acquisition-Related Activities: During the 12-month period of 2021, we incurred costs to effectuate the acquisitions of Lily’s, Dot’s and Pretzels, as well as costs related to the integration of Lily’s. During the 12-month period of 2020, we incurred costs related to the integration of the 2019 acquisition of ONE.”
87
Pension Settlement Charges Relating to Company-Directed Initiatives: During the 12-month period of 2020, settlement charges in our salary and hourly defined benefit plans were triggered as a result of lump sum withdrawals by employees retiring or leaving the Company under a voluntary separation plan included within our Margin for Growth Program.
Long-Lived Asset Impairment Charges: During the 12-month period of 2020, we recorded impairment charges to adjust long-lived asset values associated with our Lotte Shanghai Foods Co., Ltd. (“LSFC”) disposal group. Additionally, in connection with a previous sale, the company wrote-down certain receivables deemed uncollectible.
Noncontrolling Interest Share of Business Realignment and Impairment Charges: Certain of the business realignment and impairment charges recorded related to the divestiture of LSFC, a joint venture in which we previously owned a 50% controlling interest. Therefore, we have also adjusted for the portion of these charges included within the income (loss) attributed to the noncontrolling interest.
Other Miscellaneous Benefits: In 2021, we recorded a gain on the divestiture of LSFC, as well as a gain on a receivable previously deemed uncollectible. In 2020, we recognized a positive adjustment due to a change in a prior year reserve associated with a facility closure.
Tax Effect of All Adjustments: This line item reflects the aggregate tax effect of all pre-tax adjustments reflected in the preceding line items of the applicable table. The tax effect for each adjustment is determined by calculating the tax impact of the adjustment on the company’s quarterly effective tax rate, unless the nature of the item and/or the tax jurisdiction in which the item has been recorded requires application of a specific tax rate or tax treatment, in which case the tax effect of such item is estimated by applying such specific tax rate or tax treatment.
88
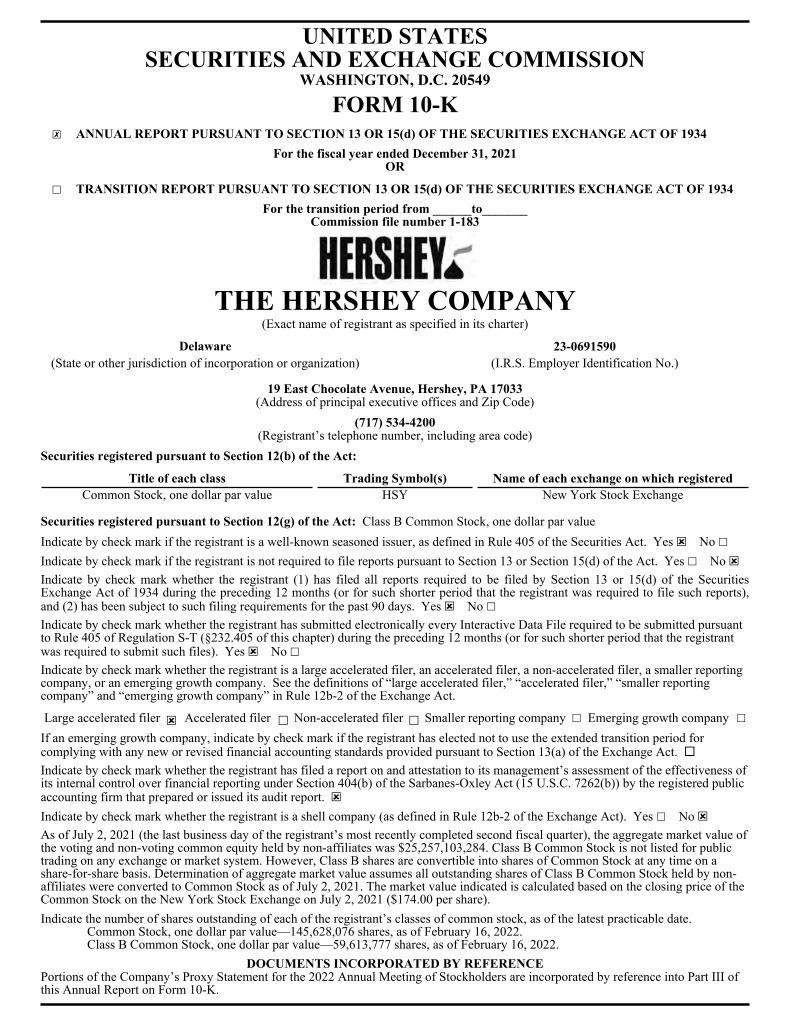
UNITED STATES SECURITIES AND EXCHANGE COMMISSION
WASHINGTON, D.C. 20549
FORM 10-K ☒ ANNUAL REPORT PURSUANT TO SECTION 13 OR 15(d) OF THE SECURITIES EXCHANGE ACT OF 1934
For the fiscal year ended December 31, 2021OR
☐ TRANSITION REPORT PURSUANT TO SECTION 13 OR 15(d) OF THE SECURITIES EXCHANGE ACT OF 1934For the transition period from ______to_______
Commission file number 1-183
THE HERSHEY COMPANY (Exact name of registrant as specified in its charter)
Delaware 23-0691590(State or other jurisdiction of incorporation or organization) (I.R.S. Employer Identification No.)
19 East Chocolate Avenue, Hershey, PA 17033 (Address of principal executive offices and Zip Code)
(717) 534-4200(Registrant’s telephone number, including area code)
Securities registered pursuant to Section 12(b) of the Act:
Title of each class Trading Symbol(s) Name of each exchange on which registeredCommon Stock, one dollar par value HSY New York Stock Exchange
Securities registered pursuant to Section 12(g) of the Act: Class B Common Stock, one dollar par value Indicate by check mark if the registrant is a well-known seasoned issuer, as defined in Rule 405 of the Securities Act. Yes ☒No ☐Indicate by check mark if the registrant is not required to file reports pursuant to Section 13 or Section 15(d) of the Act. Yes ☐No ☒Indicate by check mark whether the registrant (1) has filed all reports required to be filed by Section 13 or 15(d) of the Securities Exchange Act of 1934 during the preceding 12 months (or for such shorter period that the registrant was required to file such reports), and (2) has been subject to such filing requirements for the past 90 days. Yes ☒No ☐
Indicate by check mark whether the registrant has submitted electronically every Interactive Data File required to be submitted pursuant to Rule 405 of Regulation S-T (§232.405 of this chapter) during the preceding 12 months (or for such shorter period that the registrant was required to submit such files). Yes ☒No ☐
Indicate by check mark whether the registrant is a large accelerated filer, an accelerated filer, a non-accelerated filer, a smaller reporting company, or an emerging growth company. See the definitions of “large accelerated filer,” “accelerated filer,” “smaller reporting company” and “emerging growth company” in Rule 12b-2 of the Exchange Act.
Large accelerated filer ☒ Accelerated filer ☐ Non-accelerated filer ☐ Smaller reporting company ☐ Emerging growth company ☐If an emerging growth company, indicate by check mark if the registrant has elected not to use the extended transition period for complying with any new or revised financial accounting standards provided pursuant to Section 13(a) of the Exchange Act. ¨ Indicate by check mark whether the registrant has filed a report on and attestation to its management’s assessment of the effectiveness of its internal control over financial reporting under Section 404(b) of the Sarbanes-Oxley Act (15 U.S.C. 7262(b)) by the registered public accounting firm that prepared or issued its audit report. ☒Indicate by check mark whether the registrant is a shell company (as defined in Rule 12b-2 of the Exchange Act). Yes ☐No ☒ As of July 2, 2021 (the last business day of the registrant’s most recently completed second fiscal quarter), the aggregate market value of the voting and non-voting common equity held by non-affiliates was $25,257,103,284. Class B Common Stock is not listed for public trading on any exchange or market system. However, Class B shares are convertible into shares of Common Stock at any time on a share-for-share basis. Determination of aggregate market value assumes all outstanding shares of Class B Common Stock held by non-affiliates were converted to Common Stock as of July 2, 2021. The market value indicated is calculated based on the closing price of the Common Stock on the New York Stock Exchange on July 2, 2021 ($174.00 per share). Indicate the number of shares outstanding of each of the registrant’s classes of common stock, as of the latest practicable date.
Common Stock, one dollar par value—145,628,076 shares, as of February 16, 2022. Class B Common Stock, one dollar par value—59,613,777 shares, as of February 16, 2022.
DOCUMENTS INCORPORATED BY REFERENCE Portions of the Company’s Proxy Statement for the 2022 Annual Meeting of Stockholders are incorporated by reference into Part III of this Annual Report on Form 10-K.
THE HERSHEY COMPANYAnnual Report on Form 10-K
For the Fiscal Year Ended December 31, 2021
TABLE OF CONTENTS
PART IItem 1. Business 2Item 1A. Risk Factors 9Item 1B. Unresolved Staff Comments 16Item 2. Properties 17Item 3. Legal Proceedings 17Item 4. Mine Safety Disclosures 17Supplemental Item Information About Our Executive Officers 18
PART IIItem 5. Market for Registrant’s Common Equity, Related Stockholder Matters and Issuer
Purchases of Equity Securities19
Item 6. [Reserved] 20Item 7. Management’s Discussion and Analysis of Financial Condition and Results of
Operations21
Item 7A. Quantitative and Qualitative Disclosures About Market Risk 42Item 8. Financial Statements and Supplementary Data 47Item 9. Changes in and Disagreements with Accountants on Accounting and Financial
Disclosure101
Item 9A. Controls and Procedures 101Item 9B. Other Information 102Item 9C. Disclosure Regarding Foreign Jurisdictions that Prevent Inspections 102
PART IIIItem 10. Directors, Executive Officers and Corporate Governance 103Item 11. Executive Compensation 103Item 12. Security Ownership of Certain Beneficial Owners and Management and Related
Stockholder Matters103
Item 13. Certain Relationships and Related Transactions, and Director Independence 104Item 14. Principal Accountant Fees and Services 104
PART IVItem 15. Exhibits and Financial Statement Schedules 105Item 16. Form 10-K Summary 108
Signatures 109Schedule II—Valuation and Qualifying Accounts 110
Cautionary Note Regarding Forward-Looking Statements
This Annual Report on Form 10-K, including the exhibits hereto and the information incorporated by reference herein, contains “forward-looking statements” within the meaning of the Private Securities Litigation Reform Act of 1995. Many of these forward-looking statements can be identified by the use of words such as “anticipate,” “assume,” “believe,” “continue,” “estimate,” “expect,” “forecast,” “future,” “intend,” “plan,” “potential,” “predict,” “project,” “strategy,” “target” and similar terms, and future or conditional tense verbs like “could,” “may,” “might,” “should,” “will” and “would,” among others. Forward-looking statements are predictions only and actual results could differ materially from management’s expectations due to a variety of factors, including those described below in Item 1A. “Risk Factors” and in Item 7. “Management’s Discussion and Analysis of Financial Condition and Results of Operations.” All forward-looking statements attributable to us or persons working on our behalf are expressly qualified in their entirety by such risk factors. Given these risks and uncertainties, you should not rely on forward-looking statements as a prediction of actual results. The forward-looking statements that we make in this Annual Report on Form 10-K are based on management’s current views and assumptions regarding future events and speak only as of their dates. We assume no obligation to update developments of these risk factors or to announce publicly any revisions to any of the forward-looking statements that we make, or to make corrections to reflect future events or developments, except as required by the federal securities laws.
The Hershey Company | 2021 Form 10-K | Page 1

PART I
Item 1. BUSINESS
The Hershey Company was incorporated under the laws of the State of Delaware on October 24, 1927 as a successor to a business founded in 1894 by Milton S. Hershey. In this report, the terms “Hershey,” “Company,” “we,” “us” or “our” mean The Hershey Company and its wholly-owned subsidiaries and entities in which it has a controlling financial interest, unless the context indicates otherwise.
Hershey is a global confectionery leader known for making more moments of goodness through chocolate, sweets, mints and other great tasting snacks. We are the largest producer of quality chocolate in North America, a leading snack maker in the United States and a global leader in chocolate and non-chocolate confectionery. We market, sell and distribute our products under more than 100 brand names in approximately 80 countries worldwide.
Reportable Segments
Since December 31, 2014, the Company has reported its operations through two segments: (i) North America and (ii) International and Other. After the completion of the Company’s acquisitions of Dot’s Pretzels, LLC (“Dot’s”) and Pretzels Inc. (“Pretzels”) in December 2021, as described in Note 2 to the Consolidated Financial Statements, management of the Company has elected to begin reporting its operations through three reportable segments. Therefore, effective in the fourth quarter of 2021, the Company realigned its former two reportable segments into three reportable segments: (i) North America Confectionery, (ii) North America Salty Snacks and (iii) International.
This new organizational structure aligns with how our Chief Operating Decision Maker (“CODM”) manages our business, including resource allocation and performance assessment, and further aligns with our product categories and the key markets we serve. We have retroactively reflected these changes in all historical periods presented.
• North America Confectionery – This segment is responsible for our traditional chocolate and non-chocolateconfectionery market position in the United States and Canada. This includes chocolate and non-chocolateconfectionery, gum and refreshment products, protein bars, spreads, snack bites and mixes, as well as pantryand food service lines. This segment also includes our retail operations, including Hershey’s Chocolate Worldstores in Hershey, Pennsylvania; New York, New York; Las Vegas, Nevada; Niagara Falls (Ontario) andSingapore, as well as operations associated with licensing the use of certain of the Company’s trademarks andproducts to third parties around the world.
• North America Salty Snacks – This segment is responsible for our salty snacking products in the UnitedStates. This includes ready-to-eat popcorn, baked and trans fat free snacks, pretzels and other snacks.
• International – International is a combination of all other operating segments that are not individuallymaterial, including those geographic regions where we operate outside of North America. We currently haveoperations and manufacture product in Mexico, Brazil, India and Malaysia, primarily for consumers in theseregions, and also distribute and sell confectionery products in export markets of Asia, Latin America, MiddleEast, Europe, Africa and other regions.
Financial and other information regarding our reportable segments is provided in our Management’s Discussion and Analysis and Note 13 to the Consolidated Financial Statements.
Business Acquisitions and Divestitures
In December 2021, we completed the acquisition of Pretzels, previously a privately held company that manufactures and sells pretzels and other salty snacks for other branded products and private labels in the United States. Pretzels is an industry leader in the pretzel category with a product portfolio that includes filled, gluten free and seasoned pretzels, as well as extruded snacks that complements Hershey’s snacks portfolio. Based in Bluffton, Indiana, Pretzels operates three manufacturing locations in Indiana and Kansas. Pretzels provides Hershey deep pretzel category and product expertise and the manufacturing capabilities to support brand growth and future pretzel innovation. Additionally, we completed the acquisition of Dot’s, previously a privately held company that produces and sells pretzels and other snack food products to retailers and distributors in the United States, with Dot’s Homestyle Pretzels snacks as its primary product. Dot’s is the fastest-growing scale brand in the pretzel category and complements Hershey’s snacks portfolio. Pretzels and Dot’s are expected to generate aggregate annualized net sales over $300 million.
The Hershey Company | 2021 Form 10-K | Page 2
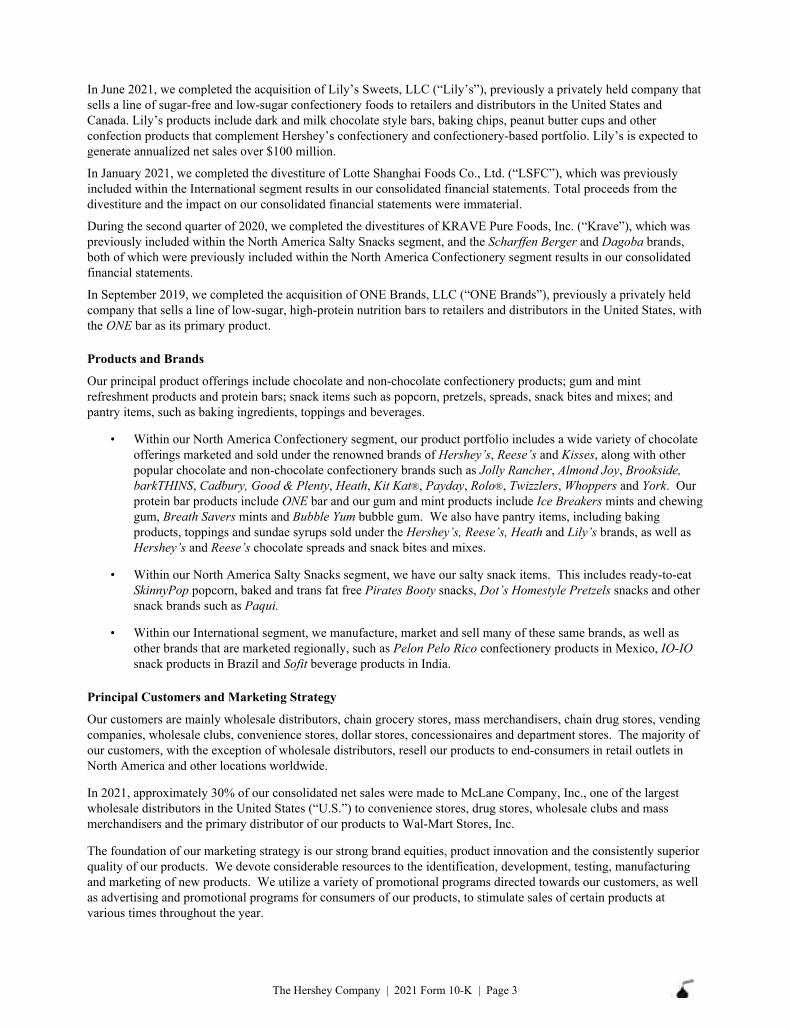
In June 2021, we completed the acquisition of Lily’s Sweets, LLC (“Lily’s”), previously a privately held company that sells a line of sugar-free and low-sugar confectionery foods to retailers and distributors in the United States and Canada. Lily’s products include dark and milk chocolate style bars, baking chips, peanut butter cups and other confection products that complement Hershey’s confectionery and confectionery-based portfolio. Lily’s is expected to generate annualized net sales over $100 million.
In January 2021, we completed the divestiture of Lotte Shanghai Foods Co., Ltd. (“LSFC”), which was previously included within the International segment results in our consolidated financial statements. Total proceeds from the divestiture and the impact on our consolidated financial statements were immaterial.
During the second quarter of 2020, we completed the divestitures of KRAVE Pure Foods, Inc. (“Krave”), which was previously included within the North America Salty Snacks segment, and the Scharffen Berger and Dagoba brands, both of which were previously included within the North America Confectionery segment results in our consolidated financial statements.
In September 2019, we completed the acquisition of ONE Brands, LLC (“ONE Brands”), previously a privately held company that sells a line of low-sugar, high-protein nutrition bars to retailers and distributors in the United States, with the ONE bar as its primary product.
Products and Brands
Our principal product offerings include chocolate and non-chocolate confectionery products; gum and mint refreshment products and protein bars; snack items such as popcorn, pretzels, spreads, snack bites and mixes; and pantry items, such as baking ingredients, toppings and beverages.
• Within our North America Confectionery segment, our product portfolio includes a wide variety of chocolateofferings marketed and sold under the renowned brands of Hershey’s, Reese’s and Kisses, along with otherpopular chocolate and non-chocolate confectionery brands such as Jolly Rancher, Almond Joy, Brookside,barkTHINS, Cadbury, Good & Plenty, Heath, Kit Kat®, Payday, Rolo®, Twizzlers, Whoppers and York. Ourprotein bar products include ONE bar and our gum and mint products include Ice Breakers mints and chewinggum, Breath Savers mints and Bubble Yum bubble gum. We also have pantry items, including bakingproducts, toppings and sundae syrups sold under the Hershey’s, Reese’s, Heath and Lily’s brands, as well asHershey’s and Reese’s chocolate spreads and snack bites and mixes.
• Within our North America Salty Snacks segment, we have our salty snack items. This includes ready-to-eatSkinnyPop popcorn, baked and trans fat free Pirates Booty snacks, Dot’s Homestyle Pretzels snacks and othersnack brands such as Paqui.
• Within our International segment, we manufacture, market and sell many of these same brands, as well asother brands that are marketed regionally, such as Pelon Pelo Rico confectionery products in Mexico, IO-IOsnack products in Brazil and Sofit beverage products in India.
Principal Customers and Marketing Strategy
Our customers are mainly wholesale distributors, chain grocery stores, mass merchandisers, chain drug stores, vending companies, wholesale clubs, convenience stores, dollar stores, concessionaires and department stores. The majority of our customers, with the exception of wholesale distributors, resell our products to end-consumers in retail outlets in North America and other locations worldwide.
In 2021, approximately 30% of our consolidated net sales were made to McLane Company, Inc., one of the largest wholesale distributors in the United States (“U.S.”) to convenience stores, drug stores, wholesale clubs and mass merchandisers and the primary distributor of our products to Wal-Mart Stores, Inc.
The foundation of our marketing strategy is our strong brand equities, product innovation and the consistently superior quality of our products. We devote considerable resources to the identification, development, testing, manufacturing and marketing of new products. We utilize a variety of promotional programs directed towards our customers, as well as advertising and promotional programs for consumers of our products, to stimulate sales of certain products at various times throughout the year.
The Hershey Company | 2021 Form 10-K | Page 3
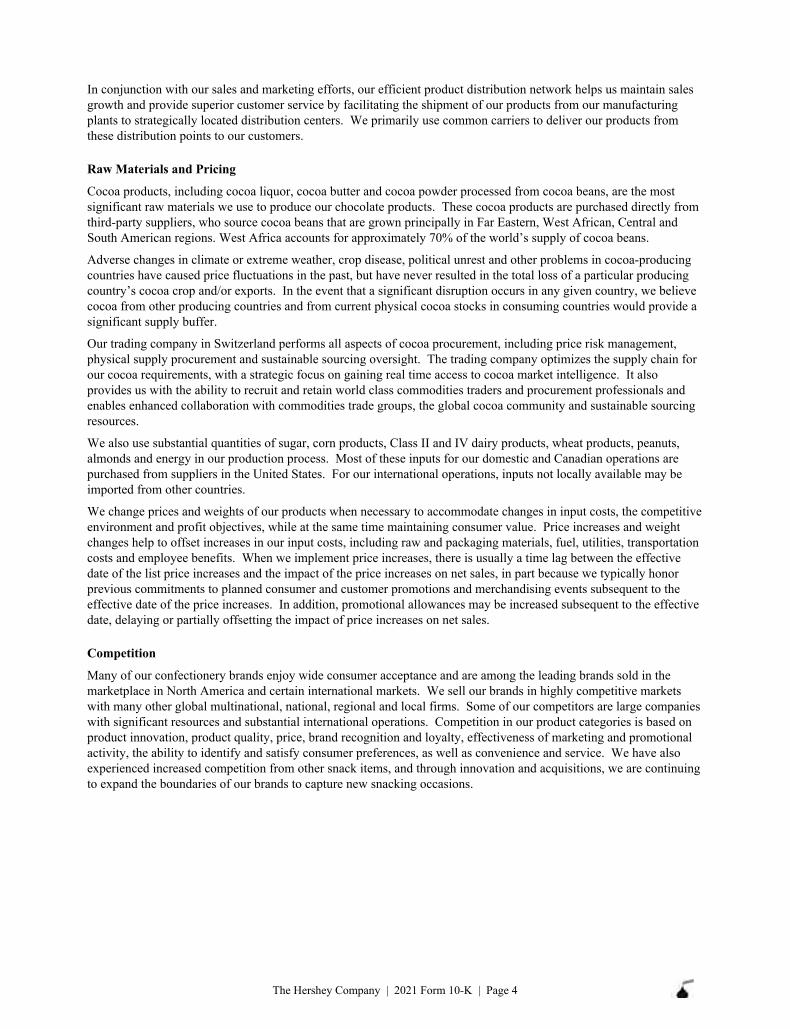
In conjunction with our sales and marketing efforts, our efficient product distribution network helps us maintain sales growth and provide superior customer service by facilitating the shipment of our products from our manufacturing plants to strategically located distribution centers. We primarily use common carriers to deliver our products from these distribution points to our customers.
Raw Materials and Pricing
Cocoa products, including cocoa liquor, cocoa butter and cocoa powder processed from cocoa beans, are the most significant raw materials we use to produce our chocolate products. These cocoa products are purchased directly from third-party suppliers, who source cocoa beans that are grown principally in Far Eastern, West African, Central and South American regions. West Africa accounts for approximately 70% of the world’s supply of cocoa beans.
Adverse changes in climate or extreme weather, crop disease, political unrest and other problems in cocoa-producing countries have caused price fluctuations in the past, but have never resulted in the total loss of a particular producing country’s cocoa crop and/or exports. In the event that a significant disruption occurs in any given country, we believe cocoa from other producing countries and from current physical cocoa stocks in consuming countries would provide a significant supply buffer.
Our trading company in Switzerland performs all aspects of cocoa procurement, including price risk management, physical supply procurement and sustainable sourcing oversight. The trading company optimizes the supply chain for our cocoa requirements, with a strategic focus on gaining real time access to cocoa market intelligence. It also provides us with the ability to recruit and retain world class commodities traders and procurement professionals and enables enhanced collaboration with commodities trade groups, the global cocoa community and sustainable sourcing resources.
We also use substantial quantities of sugar, corn products, Class II and IV dairy products, wheat products, peanuts, almonds and energy in our production process. Most of these inputs for our domestic and Canadian operations are purchased from suppliers in the United States. For our international operations, inputs not locally available may be imported from other countries.
We change prices and weights of our products when necessary to accommodate changes in input costs, the competitive environment and profit objectives, while at the same time maintaining consumer value. Price increases and weight changes help to offset increases in our input costs, including raw and packaging materials, fuel, utilities, transportation costs and employee benefits. When we implement price increases, there is usually a time lag between the effective date of the list price increases and the impact of the price increases on net sales, in part because we typically honor previous commitments to planned consumer and customer promotions and merchandising events subsequent to the effective date of the price increases. In addition, promotional allowances may be increased subsequent to the effective date, delaying or partially offsetting the impact of price increases on net sales.
Competition
Many of our confectionery brands enjoy wide consumer acceptance and are among the leading brands sold in the marketplace in North America and certain international markets. We sell our brands in highly competitive markets with many other global multinational, national, regional and local firms. Some of our competitors are large companies with significant resources and substantial international operations. Competition in our product categories is based on product innovation, product quality, price, brand recognition and loyalty, effectiveness of marketing and promotional activity, the ability to identify and satisfy consumer preferences, as well as convenience and service. We have also experienced increased competition from other snack items, and through innovation and acquisitions, we are continuing to expand the boundaries of our brands to capture new snacking occasions.
The Hershey Company | 2021 Form 10-K | Page 4
Working Capital, Seasonality and Backlog
Our sales are typically higher during the third and fourth quarters of the year, representing seasonal and holiday-related sales patterns. We manufacture primarily for stock and typically fill customer orders within a few days of receipt. Therefore, the backlog of any unfilled orders is not material to our total annual sales. Additional information relating to our cash flows from operations and working capital practices is provided in our Management’s Discussion and Analysis.
Trademarks, Service Marks and License Agreements
We own various registered and unregistered trademarks and service marks. The trademarks covering our key product brands are of material importance to our business. We follow a practice of seeking trademark protection in the United States and other key international markets where our products are sold. We also grant trademark licenses to third parties to produce and sell pantry items, flavored milks and various other products primarily under the Hershey’s and Reese’s brand names.
Furthermore, we have rights under license agreements with several companies to manufacture and/or sell and distribute certain products. Our rights under these agreements are extendible on a long-term basis at our option. Our most significant licensing agreements are as follows:
Kraft Foods Ireland Intellectual Property Limited/Cadbury UK Limited
YorkPeter Paul Almond JoyPeter Paul Mounds
Worldwide None
Cadbury UK Limited CadburyCaramello United States
Minimum sales requirement exceeded in 2021
Société des Produits Nestlé SA Kit Kat®Rolo® United States
Minimum unit volume sales exceeded in 2021
Iconic IP Interests, LLC
Good & PlentyHeathJolly RancherMilk DudsPaydayWhoppers
Worldwide None
Company Brand Location Requirements
Research and Development
We engage in a variety of research and development activities in a number of countries, including the U.S., Mexico, Brazil, India and Malaysia. We develop new products, improve the quality of existing products, improve and modernize production processes and develop and implement new technologies to enhance the quality and value of both current and proposed product lines. Information concerning our research and development expense is contained in Note 1 to the Consolidated Financial Statements.
Food Quality and Safety Regulation
The manufacture and sale of consumer food products is highly regulated. In the United States, our activities are subject to regulation by various government agencies, including the Food and Drug Administration, the Department of Agriculture, the Federal Trade Commission, the Department of Commerce and the Environmental Protection Agency, as well as various state and local agencies. Similar agencies also regulate our businesses outside of the United States.
We believe our Product Excellence Program provides us with an effective product quality and safety program. This program is integral to our global supply chain platform and is intended to ensure that all products we purchase, manufacture and distribute are safe, are of high quality and comply with applicable laws and regulations.
Through our Product Excellence Program, we evaluate our supply chain including ingredients, packaging, processes, products, distribution and the environment to determine where product quality and safety controls are necessary. We
The Hershey Company | 2021 Form 10-K | Page 5
identify risks and establish controls intended to ensure product quality and safety. Various government agencies and third-party firms as well as our quality assurance staff conduct audits of all facilities that manufacture our products to assure effectiveness and compliance with our program and applicable laws and regulations.
Environmental Considerations
Beyond ordinary course operating and capital expenditures we make to comply with government regulations, including environmental laws and regulations, we have made a number of voluntary commitments to protect and reduce our environmental impacts in recent years, including efforts to eliminate deforestation and reduce greenhouse gas (“GHG”) emissions across our supply chain. Our climate change related investments and expenditures primarily focus on achieving a 50% absolute reduction in our Scope 1 and 2 GHG emissions and a 25% absolute reduction in our Scope 3 GHG emissions by 2030 (compared to a 2018 baseline), as well as having 100% of plastic packaging be reusable, recyclable or compostable and 25 million pounds of packaging be eliminated by 2030. The annual operating and capital expenditures associated with these ordinary course payments and additional climate change commitments are not material with respect to our results of operations, capital expenditures or competitive position.
Sustainability
The Company’s commitment to sustainability started with our founder’s belief in responsible citizenship. He was a purpose-driven leader who believed we could use chocolate to Make More Moments of Goodness in the world for our consumers today and for many generations to come. This belief resulted in a strong investment in local communities and the establishment of Milton Hershey School for disadvantaged kids. We continue that legacy today through our holistic environmental, social and governance (“ESG”) strategy: our Shared Goodness Promise, which guides how we empower the remarkable people who make and sell our brands, interact with farming communities that grow our ingredients, deliver on our commitments to consumers, customers, and external stakeholders, protect the environment and support children and youth.
To learn more about our sustainability goals, progress and initiatives, as well as review our annual ESG Report (formerly known as our Sustainability Report) and accompanying suite of ESG reporting frameworks, policies, and disclosures, access the Sustainability section of our website at: https://www.thehersheycompany.com/en_us/sustainability.html.
Financial Information by Geographic Area
Our principal operations and markets are located in the United States. The percentage of total consolidated net sales for our businesses outside of the United States was 13.0% for 2021, 13.6% for 2020 and 15.8% for 2019. The percentage of total long-lived assets outside of the United States was 18.8% as of December 31, 2021 and 19.7% as of December 31, 2020.
Human Capital
As of December 31, 2021, the Company employed approximately 16,620 full-time and 2,370 part-time employees worldwide. Collective bargaining agreements covered approximately 6,235 employees, or approximately 33% of the Company’s employees worldwide. During 2022, agreements are expected to be negotiated for certain employees at four facilities outside of the United States, comprising approximately 62% of total employees under collective bargaining agreements. We believe our efforts in managing our workforce have been effective, as evidenced by a strong culture and a good relationship between the Company and our employees.
We are a purpose-driven company and for more than a century, our iconic brands have been built on a foundation of community investment and connections between people around the world. We could not have achieved this without our remarkable employees who make our purpose a reality. As a result, our human capital strategies are material to our operations and core to the long-term success of the Company.
• Our People, Safety and Employee Engagement. Our employees are among our most important resources andare critical to our continued success. We provide a workplace that develops, supports and motivates ourpeople. The overall well-being and safety of our employees remains one of our top priorities. We continue toinvest in training, workplace resources and leading systems and processes to ensure the responsiblemanagement of all facilities. Additionally, in 2021, we changed our global employee survey from an annualbasis to continuous listening surveys throughout the year. These shorter and faster surveys reach all of our
The Hershey Company | 2021 Form 10-K | Page 6
employees around the world to hear their thoughts on the Company’s direction and their place in it. The change from an annual survey to continuous touchpoints allows for real-time feedback and action from the Company. These surveys are further supplemented with quarterly and informative enterprise and team town halls, which, in conjunction with the continuous listening surveys, generate stronger employee engagement with the Company’s strategy, initiatives and leadership.
• Talent Acquisition, Development and Training. Hiring and developing our employees is critically importantto our operations and we are focused on creating experiences and programs that foster growth andperformance. We provide all employees the chance to learn, grow and own their work. We have partneredwith leading online content experts and increased internal learning development to expand our catalog ofonline and classroom courses. Additionally, we have co-created a culture of development with theenthusiastic support of our employees. Through individual development plans, learning opportunities,feedback and coaching, employees can build careers at The Hershey Company, as evidenced by the fact thatthe majority of our eight executive officers were promoted from within the organization (see Informationabout Our Executive Officers).
• Compensation, Benefits and Wellness. In addition to offering competitive, fair and transparent compensation,we also offer a suite of benefits, including comprehensive health and meaningful retirement benefits toeligible employees, tying incentive compensation to both business and individual performance, offeringparental leave and adoption benefits and maintaining an employee stock purchase plan. We also provide anumber of innovative programs designed to promote physical and emotional well-being, including ergonomicworkspaces, a state-of-the-art fitness center at our Hershey, Pennsylvania campus and private rooms designedfor quiet reflection, prayer or wellness breaks. The Company also offers SmartFlex benefits which is our suiteof policies that allows individuals to create their own balance between work and personal life, includingflexing work time based on work priorities or personal commitments, such as caring for children or familymembers. We believe that this flexibility improves productivity, job satisfaction and increases employeeengagement. Additionally, in 2021, we introduced the “Best of Both” flexible work model for corporate andcommercial employees to balance work and personal well-being. This model allows employees the option towork either remote, in-office, or both, depending on individual needs, personal schedules and work demands.This offers the benefits of flexibility and in-person collaboration, while maintaining productivity and overalljob satisfaction.
• Diversity, Equity and Inclusion. Our diverse and inclusive culture makes the difference across all areas of thebusiness. Our gender representation includes women occupying many of the top positions in the Company,including Chief Executive Officer and Chairman of the Board, Chief Accounting Officer and Chief GrowthOfficer, and approximately 50% representation across the Company. In 2020, we achieved 1:1 aggregategender pay and in 2021, we achieved 1:1 aggregate people of color pay equity for salaried employees in theUnited States. Additionally, five of our 12 Board members are women (42% representation, an increase of 6%compared to 2020). Additionally, we create a welcoming and inclusive work environment for all employeesaround the world. Our eight employee-led Business Resource Groups, which include Abilities First, AfricanAmerican, Asian, GenH (Generations), Latino, Prism (LGBTQ), Veteran’s and Women’s, play a critical rolein attracting diverse talent, providing mentoring and career development opportunities, delivering commercialbusiness insights and connecting people to the Company and the communities where we do business. In 2021,the Company was ranked #10 on DiversityInc’s Top 50 Companies for Diversity and was ranked #1 onForbes Top Female Friendly Companies.
• Community and Social Impact. Our philanthropy and volunteerism efforts reflect how we live out theCompany’s value of making moments of goodness, from supporting causes our employees care about toinvesting in the long-term success of the communities where we live and work. We work closely withcounterparts in each of our plant and office locations across the United States and globally to identify localcommunity needs and craft tailored approaches to provide support. This work includes forging partnershipswith local non-governmental organizations, providing grants and contributions and organizing volunteerservice activities and employee fundraisers.
The Hershey Company | 2021 Form 10-K | Page 7
Available Information
The Company's website address is www.thehersheycompany.com. We file or furnish annual, quarterly and current reports, proxy statements and other information with the United States Securities and Exchange Commission (“SEC”). You may obtain a copy of any of these reports, free of charge, from the Investors section of our website as soon as reasonably practicable after we electronically file such material with, or furnish it to, the SEC. The SEC maintains an Internet site that also contains these reports at www.sec.gov. In addition, copies of the Company’s annual report will be made available, free of charge, on written request to the Company.
We have a Code of Conduct that applies to our Board of Directors (“Board”) and all Company officers and employees, including, without limitation, our Chief Executive Officer and “senior financial officers” (including the Chief Financial Officer, Chief Accounting Officer and persons performing similar functions). You can obtain a copy of our Code of Conduct, as well as our Corporate Governance Guidelines and charters for each of the Board’s standing committees, from the Investors section of our website at: https://www.thehersheycompany.com/en_us/investors.html. If we change or waive any portion of the Code of Conduct that applies to any of our directors, executive officers or senior financial officers, we will post that information on our website. Information found on the Company’s website is not part of this Annual Report on Form 10-K or any other report filed with the SEC.
The Hershey Company | 2021 Form 10-K | Page 8
Item 1A. RISK FACTORS
You should carefully read the following discussion of significant factors, events and uncertainties when evaluating our business and the forward-looking information contained in this Annual Report on Form 10-K. The events and consequences discussed in these risk factors could materially and adversely affect our business, operating results, liquidity and financial condition. While we believe we have identified and discussed below the key risk factors affecting our business, these risk factors do not identify all the risks we face, and there may be additional risks and uncertainties that we do not presently know or that we do not currently believe to be significant that may have a material adverse effect on our business, performance or financial condition in the future.
Risks Related to Macroeconomic Conditions
Our business and financial results may be negatively impacted by the failure to successfully manage a disruption in consumer and trade patterns, as well as operational challenges associated with the actual or perceived effects of a disease outbreak, including epidemics, pandemics or similar widespread public health concerns, such as the current coronavirus disease 2019 (“COVID-19”) global pandemic.
Our operations are impacted by consumer spending levels, impulse purchases, the availability of our products at retail and our ability to manufacture, store and distribute products to our customers and consumers in an effective and efficient manner. The fear of exposure to or actual effects of a disease outbreak, epidemic, pandemic or similar widespread public health concern, such as the COVID-19 pandemic, can negatively impact our overall business and financial results. Specific factors that may impact our operations, some of which have had an unfavorable impact on our operations as a result of COVID-19, include, but are not limited to:
• Significant reductions or volatility in demand for one or more of our products, which may be caused by,among other things: the temporary inability of consumers to purchase our products due to illness, quarantineor other travel restrictions, or financial hardship, shifts in demand away from one or more of our products, orpantry-loading activity; if prolonged, such impacts may further increase the difficulty of planning foroperations and may negatively impact our results;
• Significant reductions in the availability of one or more of our products as a result of retailers, commoncarriers or other shippers modifying restocking, fulfillment and shipping practices;
• The inability to meet our customers’ needs and achieve cost targets due to disruptions in our manufacturingoperations or supply arrangements caused by the loss or disruption of essential manufacturing and supplyelements such as raw materials or finished product components, transportation resources, workforceavailability, or other manufacturing and distribution capability;
• The inability to effectively manage evolving health and welfare strategies, including but not limited toongoing or not yet fully known costs related to operational adjustments to ensure continued employee andconsumer safety and adherence to health guidelines as they are modified and supplemented;
• An inability to effectively modify our trade promotion and advertising activities to reflect changing consumerviewing and shopping habits due to the cancellation or postponement of major sporting and entertainmentevents, reduced in-store visits, travel restrictions and a shift in customer advertising priorities, among otherthings;
• The failure of third parties on which we rely, including those third parties who supply our ingredients,packaging, capital equipment and other necessary operating materials, contract manufacturers, distributors,contractors, commercial banks and external business partners, to meet their obligations to the Company, orsignificant disruptions in their ability to do so, which may be caused by their own financial or operationaldifficulties and may negatively impact our operations; or
• Significant changes in the political conditions in markets in which we manufacture, sell or distribute ourproducts, including quarantines, governmental or regulatory actions, closures or other restrictions that limit orclose our operating and manufacturing facilities, restrict our employees’ ability to travel or perform necessarybusiness functions, or otherwise prevent our third-party partners, suppliers, or customers from sufficiently
The Hershey Company | 2021 Form 10-K | Page 9
staffing operations, including operations necessary for the production, distribution, sale, and support of our products, which could negatively impact our results.
With respect to COVID-19, the situation remains dynamic and subject to rapid and possibly material change. The Company’s efforts to manage and mitigate these factors may ultimately be unsuccessful, and the effectiveness of these efforts depends on factors beyond our control, including the duration and severity of any disease outbreak, as well as third-party actions taken in response.
Risks Related to Our Business and Operations
Our Company’s reputation or brand image might be impacted as a result of issues or concerns relating to the quality and safety of our products, ingredients or packaging, human and workplace rights, and other environmental, social or governance matters, which in turn could result in litigation or otherwise negatively impact our operating results.
In order to sell our iconic, branded products, we need to maintain a good reputation with our customers, consumers, suppliers, vendors and employees, among others. Issues related to the quality and safety of our products, ingredients or packaging could jeopardize our Company’s image and reputation. We have in the past and may in the future need to recall products if any of our products become unfit for consumption. Negative publicity related to these types of concerns, or related to product contamination or product tampering, whether valid or not, could decrease demand for our products or cause production and delivery disruptions. In addition, negative publicity related to our environmental, social or governance practices could also impact our reputation with customers, consumers, suppliers and vendors.
We have in the past and in the future could potentially be subject to litigation or government actions as a result of issues or concerns relating to the quality and safety of our products, ingredients or packaging, human and workplace rights, and other environmental, social or governance matters, which could result in payments of fines or damages. Costs associated with these potential actions, as well as the potential impact on our reputation or ability to sell our products, could negatively affect our operating results.
Disruption to our manufacturing operations or supply chain could impair our ability to produce or deliver finished products, resulting in a negative impact on our operating results.
Approximately 70% of our manufacturing capacity is located in the United States. Disruption to our global manufacturing operations or our supply chain could result from, among other factors, the following:
• Natural disaster;• Pandemic outbreak of disease;• Climate change and severity of extreme weather;• Fire or explosion;• Terrorism or other acts of violence;• Labor strikes or other labor activities;• Unavailability of raw or packaging materials;• Operational and/or financial instability of key suppliers, and other vendors or service providers; and• Suboptimal production planning which could impact our ability to cost-effectively meet product demand.
We believe that we take adequate precautions to mitigate the impact of possible disruptions. We have strategies and plans in place to manage disruptive events if they were to occur, including our global supply chain strategies and our principle-based global labor relations strategy. If we are unable, or find that it is not financially feasible, to effectively plan for, mitigate or manage operational stability and business resiliency, particularly within our international markets and snacks portfolio, due to the potential impacts of such disruptive events on our manufacturing operations or supply chain, our financial condition and results of operations could be negatively impacted if such events were to occur.
The Hershey Company | 2021 Form 10-K | Page 10
We might not be able to hire, engage and retain the talented global human capital we need to drive our growth strategies.
Our future success depends upon our ability to identify, hire, develop, engage and retain talented personnel across the globe. Competition for global talent is intense, and we might not be able to identify and hire the personnel we need to continue to evolve and grow our business. In particular, if we are unable to hire the right individuals to fill new or existing senior management positions as vacancies arise, our business performance may be impacted.
Activities related to identifying, recruiting, hiring and integrating qualified individuals require significant time and attention. We may also need to invest significant amounts of cash and equity to attract talented new employees, and we may never realize returns on these investments.
In addition to hiring new employees, we must continue to focus on retaining and engaging the talented individuals we need to sustain our core business and lead our developing businesses into new markets, channels and categories. This may require significant investments in training, coaching and other career development and retention activities. If we are not able to effectively retain and grow our talent, our ability to achieve our strategic objectives will be adversely affected, which may impact our financial condition and results of operations.
Risks associated with climate change and other environmental impacts, and increased focus and evolving views of our customers, stockholders and other stakeholders on climate change issues, could negatively affect our business and operations.
Climate-related changes can increase variability in, or otherwise impact, natural disasters, including weather patterns, with the potential for increased frequency and severity of significant weather events, natural hazards, rising mean temperature and sea levels, and long-term changes in precipitation patterns. Climate change or weather-related disruptions to our supply chain can impact the availability and cost of materials needed for manufacturing and could increase insurance and other operating costs.
Increased focus on climate change has led to legislative and regulatory efforts to combat both potential causes and adverse impacts of climate change, including regulation of GHG emissions. New or increasing laws and regulations related to GHG emissions and other climate change related concerns may adversely affect us, our suppliers and our customers, and may require additional capital investments. Our value chain faces similar challenges as our products rely on agricultural ingredients and a global supply chain. Climate change poses a significant and increasing risk to global food production systems and to the safety and resilience of the communities where we live, work and source our ingredients. The GHG impacts of land-use change are most pronounced in our cocoa supply chain, where we have already been working for several years to prevent deforestation. Additionally, any non-compliance with legislative and regulatory requirements could negatively impact our reputation and ability to do business.
Investors, customers, advisory services, government regulators and other market participants have increasingly focused on the environmental or sustainability practices of companies, including Hershey. Shareholders and financial institutions have increasingly evaluated a company’s ESG practices, disclosures and performance before making investments or other financial decisions. We believe our practices, disclosures and performance are strong and growing. However, if our environmental goals do not meet investor or other external stakeholder expectations and standards, our access to capital may be negatively impacted. An enforcement action could harm our reputation, financial position and ability to grow. A failure to meet expectations may adversely affect our results of operations, ability to manage our liquidity, or implement our strategies.
The Company publishes its environmental goals, with a particular focus on achieving a 50% absolute reduction in our Scope 1 and 2 GHG emissions and a 25% absolute reduction in our Scope 3 GHG emissions by 2030 (compared to a 2018 baseline), as well as having 100% of plastic packaging be reusable, recyclable or compostable and 25 million pounds of packaging be eliminated by 2030. The costs of these voluntary commitments may be greater than expected, and there can be no assurance the Company will achieve its goals, or meet the evolving sustainability expectations and standards of our investors or other external stakeholders. Any failure to achieve our goals, a perception of our failure to act responsibly with respect to the environment, or failure to respond to new or evolving legal and regulatory requirements or other sustainability concerns could adversely affect our business, reputation and increase risk of litigation.
The Hershey Company | 2021 Form 10-K | Page 11
The effects and costs of climate change, or any failure to meet related requirements and expectations, could have a negative impact on our reputation, financial condition and results of operations.
Risks Related to the Industry in Which We Operate
Increases in raw material and energy costs along with the availability of adequate supplies of raw materials could affect future financial results.
We use many different commodities for our business, including cocoa products, sugar, corn products, dairy products, wheat products, peanuts, almonds, natural gas and diesel fuel.
Commodities are subject to price volatility and changes in supply caused by numerous factors, including:
• Commodity market fluctuations;• Currency exchanges rates;• Imbalances between supply and demand;• Rising levels of inflation related to domestic and global economic conditions or supply chain issues;• The effects of climate change and extreme weather on crop yield and quality;• Speculative influences;• Trade agreements among producing and consuming nations;• Supplier compliance with commitments;• Import/export requirements for raw materials and finished goods;• Political unrest in producing countries;• Introduction of living income premiums or similar requirements; and• Changes in governmental agricultural programs and energy policies.
Although we use forward contracts and commodity futures and options contracts where possible to hedge commodity prices, commodity price increases ultimately result in corresponding increases in our raw material and energy costs. If we are unable to offset cost increases for major raw materials and energy, there could be a negative impact on our financial condition and results of operations.
Price increases may not be sufficient to offset cost increases and maintain profitability or may result in sales volume declines associated with pricing elasticity.
We may be able to pass some or all raw material, energy and other input cost increases to customers by increasing the selling prices of our products or decreasing the size of our products; however, higher product prices or decreased product sizes may also result in a reduction in sales volume and/or consumption. If we are not able to increase our selling prices or reduce product sizes (including if inflation outpaces our pricing elasticity) sufficiently, or in a timely manner, to offset increased raw material, energy or other input costs, including packaging, freight, direct labor, overhead and employee benefits, or if our sales volume decreases significantly, there could be a negative impact on our financial condition and results of operations.
Market demand for new and existing products could decline.
We operate in highly competitive markets and rely on continued demand for our products. To generate revenues and profits, we must sell products that appeal to our customers and to consumers. Our continued success is impacted by many factors, including the following:
• Effective retail execution;• Appropriate advertising campaigns and marketing programs;• Our ability to secure adequate shelf space at retail locations;• Our ability to drive sustainable innovation and maintain a strong pipeline of new products in the
confectionery and broader snacking categories;• Changes in product category consumption;• Our response to consumer demographics and trends, including but not limited to, trends relating to store trips
and the impact of the growing digital commerce channel; and• Consumer health concerns, including obesity and the consumption of certain ingredients.
The Hershey Company | 2021 Form 10-K | Page 12

There continues to be competitive product and pricing pressures in the markets where we operate, as well as challenges in maintaining profit margins. We must maintain mutually beneficial relationships with our key customers, including retailers and distributors, to compete effectively. Our largest customer, McLane Company, Inc., accounted for approximately 30% of our total net sales in 2021. McLane Company, Inc. is one of the largest wholesale distributors in the United States to convenience stores, drug stores, wholesale clubs and mass merchandisers, including Wal-Mart Stores, Inc.
Increased marketplace competition could hurt our business.
The global confectionery and snacks packaged goods industry is intensely competitive and consolidation in this industry continues. Some of our competitors are large companies that have significant resources and substantial international operations. We continue to experience increased levels of in-store activity for other snack items, which has pressured confectionery category growth. In order to protect our existing market share or capture increased market share in this highly competitive retail environment, we may be required to increase expenditures for promotions and advertising, and must continue to introduce and establish new products. Due to inherent risks in the marketplace associated with advertising and new product introductions, including uncertainties about trade and consumer acceptance, increased expenditures may not prove successful in maintaining or enhancing our market share and could result in lower sales and profits. In addition, we may incur increased credit and other business risks because we operate in a highly competitive retail environment.
Risks Related to Strategic Initiatives
Our financial results may be adversely impacted by the failure to successfully execute or integrate acquisitions, divestitures and joint ventures.
From time to time, we may evaluate potential acquisitions, divestitures or joint ventures that align with our strategic objectives. The success of such activity depends, in part, upon our ability to identify suitable buyers, sellers or business partners; perform effective assessments prior to contract execution; negotiate contract terms; and, if applicable, obtain government approval. These activities may present certain financial, managerial, staffing and talent, and operational risks, including diversion of management’s attention from existing core businesses; difficulties integrating or separating businesses from existing operations; and challenges presented by acquisitions or joint ventures which may not achieve sales levels and profitability that justify the investments made. If the acquisitions, divestitures or joint ventures are not successfully implemented or completed, there could be a negative impact on our financial condition, results of operations and cash flows.
In 2021, we successfully completed the divestiture of LSFC as we better prioritize resources against assets and brands that fit our business model and scale capabilities. Additionally, we completed the acquisitions of Lily’s in June 2021 and Dot’s and Pretzels in December 2021. While we believe significant operating synergies can be obtained in connection with these acquisitions, achievement of these synergies will be driven by our ability to successfully leverage Hershey’s resources, expertise, capability-building, distribution locations and customer base. In addition, the acquisitions of Dot’s and Pretzels are important steps in our journey to expand our breadth in snacking, as they should enable us to bring scale and category management capabilities to a key sub-segment of the warehouse snack aisle. If we are unable to successfully couple Hershey’s scale and expertise in brand building with Lily’s, Dot’s and Pretzels’ existing operations, it may impact our ability to expand our snacking footprint at our desired pace.
The Hershey Company | 2021 Form 10-K | Page 13
Our international operations may not achieve projected growth objectives, which could adversely impact our overall business and results of operations.
In 2021, 2020 and 2019, respectively, we derived approximately 13.0%, 13.6% and 15.8% of our net sales from customers located outside of the United States. Additionally, approximately 19% of our total long-lived assets were located outside of the United States as of December 31, 2021. As part of our strategy, we have made investments outside of the United States, particularly in Canada, Malaysia, Mexico, Brazil and India. As a result, we are subject to risks and uncertainties relating to international sales and operations, including:
• The inability to manage operational stability and business resiliency within our international markets due tounforeseen global economic and environmental changes resulting in business interruption, supply constraints,inflation, deflation or decreased demand;
• The inability to establish, develop and achieve market acceptance of our global brands in internationalmarkets;
• Difficulties and costs associated with compliance and enforcement of remedies under a wide variety ofcomplex laws, treaties and regulations;
• Unexpected changes in regulatory environments;• Political and economic instability, including the possibility of civil unrest, terrorism, mass violence or armed
conflict;• Nationalization of our properties by foreign governments;• Tax rates that may exceed those in the United States and earnings that may be subject to withholding
requirements and incremental taxes upon repatriation;• Potentially negative consequences from changes in tax laws;• The imposition of tariffs, quotas, trade barriers, other trade protection measures and import or export
licensing requirements;• Increased costs, disruptions in shipping or reduced availability of freight transportation;• The impact of currency exchange rate fluctuations between the U.S. dollar and foreign currencies;• Failure to gain sufficient profitable scale in certain international markets resulting in an inability to cover
manufacturing fixed costs or resulting in losses from impairment or sale of assets; and• Failure to recruit, retain and build a talented and engaged global workforce.
If we are not able to achieve our projected international growth objectives and mitigate the numerous risks and uncertainties associated with our international operations, there could be a negative impact on our financial condition and results of operations.
We may not fully realize the expected costs savings and/or operating efficiencies associated with our strategic initiatives or restructuring programs, which may have an adverse impact on our business.
We depend on our ability to evolve and grow, and as changes in our business environment occur, we may adjust our business plans by introducing new strategic initiatives or restructuring programs to meet these changes. Recently introduced strategic initiatives include our efforts to continue to expand our presence in digital commerce, to transform our manufacturing, commercial and corporate operations through digital technologies and to enhance our data analytics capabilities to develop new commercial insights. If we are not able to capture our share of the expanding digital commerce market, if we do not adequately leverage technology to improve operating efficiencies or if we are unable to develop the data analytics capabilities needed to generate actionable commercial insights, our business performance may be impacted, which may negatively impact our financial condition and results of operations.
Additionally, from time to time we implement business realignment activities to support key strategic initiatives designed to maintain long-term sustainable growth, such as the International Optimization Program, which we commenced in the fourth quarter of 2020. This program is intended to increase our operating effectiveness and efficiency, to reduce our costs and/or to generate savings that can be reinvested in other areas of our business. We cannot guarantee that we will be able to successfully implement these strategic initiatives and restructuring programs, that we will achieve or sustain the intended benefits under these programs, or that the benefits, even if achieved, will be adequate to meet our long-term growth and profitability expectations, which could in turn adversely affect our business.
The Hershey Company | 2021 Form 10-K | Page 14
Risks Related to Governmental and Regulatory Changes
Changes in governmental laws and regulations could increase our costs and liabilities or impact demand for our products.
Changes in laws and regulations and the manner in which they are interpreted or applied may alter our business environment. These negative impacts could result from changes in food and drug laws, laws related to advertising and marketing practices, accounting standards, taxation compliance and requirements, competition laws, employment laws, import/export requirements and environmental laws, among others. It is possible that we could become subject to additional liabilities in the future resulting from changes in laws and regulations that could result in an adverse effect on our financial condition and results of operations.
Political, economic and/or financial market conditions could negatively impact our financial results.
Our operations are impacted by consumer spending levels and impulse purchases, which are affected by general macroeconomic conditions, consumer confidence, employment levels, the availability of consumer credit and interest rates on that credit, consumer debt levels, energy costs and other factors. Volatility in food and energy costs, sustained global recessions, broad political instability, rising unemployment, pandemic outbreak of disease, climate change, weather, natural and other disasters and declines in personal spending could adversely impact our revenues, profitability and financial condition.
Changes in financial market conditions may make it difficult to access credit markets on commercially acceptable terms, which may reduce liquidity or increase borrowing costs for our Company, our customers and our suppliers. A significant reduction in liquidity could increase counterparty risk associated with certain suppliers and service providers, resulting in disruption to our supply chain and/or higher costs, and could impact our customers, resulting in a reduction in our revenue, or a possible increase in bad debt expense.
Risks Related to Digital Transformation, Cybersecurity and Data Privacy
Disruptions, failures or security breaches of our information technology infrastructure could have a negative impact on our operations.
Information technology is critically important to our business operations. We use information technology to manage all business processes including manufacturing, financial, logistics, sales, marketing and administrative functions. These processes collect, interpret and distribute business data and communicate internally and externally with employees, suppliers, customers and others.
We are regularly the target of cyber and other security threats. Therefore, we continuously monitor and update our information technology networks and infrastructure to prevent, detect, address and mitigate the risk of unauthorized access, misuse, computer viruses and other events that could have a security impact. We invest in industry standard security technology to protect the Company’s data and business processes against risk of data security breach and cyber attack. Our data security management program includes identity, trust, vulnerability and threat management business processes as well as adoption of standard data protection policies. We measure our data security effectiveness through industry-accepted methods and remediate significant findings. Additionally, we certify our major technology suppliers and any outsourced services through accepted security certification standards. We maintain and routinely test backup systems and disaster recovery, along with external network security penetration testing by an independent third party as part of our business resiliency preparedness. We also have processes in place to prevent disruptions resulting from our implementation of new software and systems.
While we have been subject to cyber attacks and other security breaches, these incidents did not have a significant impact on our business operations. We believe our security technology tools and processes provide adequate measures of protection against security breaches and in reducing cybersecurity risks. Nevertheless, despite continued vigilance in these areas, disruptions in or failures of information technology systems are possible and could have a negative impact on our operations or business reputation. Failure of our systems, including failures due to cyber attacks that would prevent the ability of systems to function as intended, could cause transaction errors, loss of customers and sales, and could have negative consequences to our Company, our employees and those with whom we do business. This in turn could have a negative impact on our financial condition and results or operations. In addition, the cost to remediate any damages to our information technology systems suffered as a result of a cyber attack could be significant.
The Hershey Company | 2021 Form 10-K | Page 15
Complications with the design or implementation of our new enterprise resource planning system could adversely impact our business and operations.
We rely extensively on information systems and technology to manage our business and summarize operating results. We are in the process of a multi-year implementation of a new global enterprise resource planning (“ERP”) system. This ERP system will replace our existing operating and financial systems. The ERP system is designed to accurately maintain the Company’s financial records, enhance operational functionality and provide timely information to the Company’s management team related to the operation of the business. The ERP system implementation process has required, and will continue to require, the investment of significant personnel and financial resources. We may not be able to successfully implement the ERP system without experiencing further delays, increased costs and other difficulties. If we are unable to successfully design and implement the new ERP system as planned, our financial positions, results of operations and cash flows could be negatively impacted. Additionally, if we do not effectively implement the ERP system as planned or the ERP system does not operate as intended, the effectiveness of our internal control over financial reporting could be adversely affected or our ability to assess those controls adequately could be further delayed.
Item 1B. UNRESOLVED STAFF COMMENTS
None.
The Hershey Company | 2021 Form 10-K | Page 16

Item 2. PROPERTIES
Our principal properties include the following:
United States Hershey, Pennsylvania (2 principal plants)
Manufacturing—confectionery products and pantry items Own
Lancaster, Pennsylvania Manufacturing—confectionery products OwnHazleton, Pennsylvania Manufacturing—confectionery products OwnRobinson, Illinois Manufacturing—confectionery products and pantry items OwnStuarts Draft, Virginia Manufacturing—confectionery products and pantry items OwnEdgerton, Kansas Manufacturing—salty snack products OwnBluffton, Indiana Manufacturing—salty snack products LeasePlymouth, Indiana Manufacturing—salty snack products LeaseLawrence, Kansas Manufacturing—salty snack products LeaseAnnville, Pennsylvania Distribution OwnPalmyra, Pennsylvania Distribution OwnEdwardsville, Illinois Distribution OwnOgden, Utah Distribution OwnKennesaw, Georgia Distribution LeaseWhitestown, Indiana Distribution LeaseHershey, Pennsylvania Corporate administrative LeaseNew York, New York Retail Lease
Canada Brantford, Ontario Distribution OwnMexico Monterrey, Mexico Manufacturing—confectionery products Own
El Salto, Mexico Manufacturing—confectionery products and pantry items OwnMalaysia Johor, Malaysia Manufacturing—confectionery products Own
Country Location TypeStatus
(Own/Lease)
In addition to the locations indicated above, we also own or lease several other properties and buildings worldwide which we use for manufacturing, sales, distribution and administrative functions. Our facilities are well maintained and generally have adequate capacity to accommodate seasonal demands, changing product mixes and certain additional growth. We regularly improve our facilities to incorporate the latest technologies. The largest facilities are located in Hershey, Lancaster and Hazleton, Pennsylvania; Monterrey and El Salto, Mexico; and Stuarts Draft, Virginia. The U.S., Canada and Mexico facilities in the table above primarily support our North America Confectionery and NorthAmerica Salty Snacks segments, while the Malaysia facility primarily serves our International segment. As discussedin Note 13 to the Consolidated Financial Statements, we do not manage our assets on a segment basis given theintegration of certain manufacturing, warehousing, distribution and other activities in support of our global operations.
Item 3. LEGAL PROCEEDINGS
Information on legal proceedings is included in Note 15 to the Consolidated Financial Statements.
Item 4. MINE SAFETY DISCLOSURES
Not applicable.
The Hershey Company | 2021 Form 10-K | Page 17
SUPPLEMENTAL ITEM. INFORMATION ABOUT OUR EXECUTIVE OFFICERS
The executive officers of the Company, their positions and, as of February 16, 2022, their ages are set forth below.
Michele G. Buck 60 Chairman of the Board, President and Chief Executive Officer (October 2019);President and Chief Executive Officer (March 2017);Executive Vice President, Chief Operating Officer (June 2016)
Jennifer L. McCalman (1) 44 Vice President, Chief Accounting Officer (February 2021);Senior Director, Global Controller (March 2019)
Charles R. Raup 54 President, U.S. (January 2020); Vice President, U.S. CMG (June 2018);Vice President and General Manager, Chocolate (August 2017);Vice President and General Manager, Mexico (October 2015)
Jason R. Reiman 50 Senior Vice President, Chief Supply Chain Officer (June 2019);Vice President, Supply Chain Operations (August 2018);Vice President, US Supply Chain Operations (July 2017);Vice President, International Operations (May 2017);Vice President, AEMA Supply Chain Operations (October 2015)
Kristen J. Riggs 43 Senior Vice President, Chief Growth Officer (January 2020);Vice President, Innovation and Strategic Growth Platforms (September 2019); Vice President, Commercial Planning (June 2018);Vice President, Brand Commercialization (July 2017);Senior Director, Reese’s (October 2015)
Christopher M. Scalia 46 Senior Vice President, Chief Human Resources Officer (January 2020);Vice President, Global Human Resources (March 2018);Vice President, Talent, HR Operations and Analytics (December 2014)
James Turoff 45 Senior Vice President, General Counsel and Secretary (May 2021);Acting General Counsel (December 2020);Vice President, Deputy General Counsel (March 2019);Vice President, SEC, Corporate Governance & Compliance (March 2018);Associate General Counsel, Securities & Governance and Business Transformation (May 2017); Associate General Counsel, AEMEA and Securities & Governance (October 2015)
Steven E. Voskuil (2) 53 Senior Vice President, Chief Financial Officer (February 2021);Senior Vice President, Chief Financial Officer and Chief Accounting Officer (November 2019);Senior Vice President, Chief Financial Officer (May 2019)
Name Age Positions Held During the Last Five Years
There are no family relationships among any of the above-named officers of our Company.
(1) Ms. McCalman was appointed Vice President, Chief Accounting Officer effective February 23, 2021. Prior tojoining our Company she was Senior Director, Assistant Corporate Controller for Keurig Dr. Pepper (formerlyKeurig Green Mountain) (May 2017) and Director, Assistant Corporate Controller (December 2011).
(2) Mr. Voskuil was appointed Senior Vice President, Chief Financial Officer effective May 13, 2019. Prior tojoining our Company he was Senior Vice President and Chief Financial Officer at Avanos Medical, Inc.(November 2014).
Our Executive Officers are generally appointed each year at the organization meeting of the Board in May.
The Hershey Company | 2021 Form 10-K | Page 18

PART II
Item 5. MARKET FOR THE REGISTRANT’S COMMON EQUITY, RELATED STOCKHOLDER MATTERS AND ISSUER PURCHASES OF EQUITY SECURITIES
Our Common Stock is listed and traded principally on the New York Stock Exchange under the ticker symbol “HSY.” The Class B Common Stock (“Class B Stock”) is not publicly traded.
The closing price of our Common Stock on December 31, 2021, was $193.47. There were 24,619 stockholders of record of our Common Stock and 6 stockholders of record of our Class B Stock as of December 31, 2021.
We paid $686.0 million in cash dividends on our Common Stock and Class B Stock in 2021 and $640.7 million in 2020. The annual dividend rate on our Common Stock in 2021 was $3.410 per share.
On February 2, 2022, our Board declared a quarterly dividend of $0.901 per share of Common Stock payable on March 15, 2022, to stockholders of record as of February 18, 2022. It is the Company’s 369th consecutive quarterly Common Stock dividend. A quarterly dividend of $0.819 per share of Class B Stock also was declared.
Unregistered Sales of Equity Securities and Use of Proceeds
None.
Issuer Purchases of Equity Securities
There were no purchases of shares of Common Stock made by or on behalf of Hershey, or any “affiliated purchaser” (as defined in Rule 10b-18(a)(3) under the Securities Exchange Act of 1934, as amended) of Hershey, for each fiscal month in the three months ended December 31, 2021.
In July 2018, our Board of Directors approved a $500 million share repurchase authorization. As of December 31, 2021, approximately $110 million remained available for repurchases of our Common Stock under this program. The share repurchase program does not have an expiration date. In May 2021, our Board of Directors approved an additional $500 million share repurchase authorization. This program is to commence after the existing 2018 authorization is completed and is to be utilized at management’s discretion.
In February 2022, the Company entered into a Stock Purchase Agreement with Hershey Trust Company, as trustee for the Trust, pursuant to which the Company purchased 1,000,000 shares of the Company’s Common Stock from the Trust at a price equal to $203.35 per share, for a total purchase price of $203.4 million.
The Hershey Company | 2021 Form 10-K | Page 19

Stockholder Return Performance Graph
The following graph compares our cumulative total stockholder return (Common Stock price appreciation plus dividends, on a reinvested basis) over the last five fiscal years with the Standard & Poor’s 500 Index and the Standard & Poor’s Packaged Foods Index.
Comparison of 5 Year Cumulative Total Return*Among The Hershey Company, the S&P 500 Index,
and the S&P Packaged Foods Index
The Hershey Company S&P 500 IndexS&P 500 Packaged Foods
2016 2017 2018 2019 2020 2021$50
$100
$150
$200
$250
*$100 invested on December 31, 2016 in stock or index, including reinvestment of dividends.
December 31,
Company/Index 2016 2017 2018 2019 2020 2021The Hershey Company $ 100 $ 112 $ 109 $ 153 $ 162 $ 210 S&P 500 Index $ 100 $ 122 $ 116 $ 153 $ 181 $ 233 S&P 500 Packaged Foods Index $ 100 $ 101 $ 82 $ 108 $ 113 $ 127
The stock price performance included in this graph is not necessarily indicative of future stock price performance.
Item 6. [RESERVED]
The Hershey Company | 2021 Form 10-K | Page 20
Item 7. MANAGEMENT’S DISCUSSION AND ANALYSIS OF FINANCIAL CONDITION AND RESULTS OF OPERATIONS
This Management’s Discussion and Analysis (“MD&A”) is intended to provide an understanding of Hershey’s financial condition, results of operations and cash flows by focusing on changes in certain key measures from year to year. The MD&A should be read in conjunction with our Consolidated Financial Statements and accompanying Notes included in Item 8 of this Annual Report on Form 10-K. This discussion contains forward-looking statements that involve risks and uncertainties. Our actual results could differ materially from those anticipated in these forward-looking statements as a result of various factors, including those discussed elsewhere in this Annual Report on Form 10-K, particularly in Item 1A. “Risk Factors.”
The MD&A is organized in the following sections:• Business Model and Growth Strategy• Overview• Trends Affecting Our Business• Consolidated Results of Operations• Segment Results• Liquidity and Capital Resources• Critical Accounting Policies and Estimates
BUSINESS MODEL AND GROWTH STRATEGY
We are the largest producer of quality chocolate in North America, a leading snack maker in the United States and a global leader in chocolate and non-chocolate confectionery. We report our operations through three segments: (i) North America Confectionery, (ii) North America Salty Snacks and (iii) International, as discussed in Note 13 to the Consolidated Financial Statements.
Our vision is to be a snacking powerhouse. We aspire to be a leader in meeting consumers’ evolving snacking needs while strengthening the capabilities that drive our growth. We are focused on four strategic imperatives to ensure the Company’s success now and in the future:
• Drive Core Confection Business and Broaden Participation in Snacking. We continue to be the undisputed leaderin U.S. confection by taking actions to deepen our consumer connections and utilize our beloved brands to delivermeaningful innovation, while also diversifying our portfolio to capture profitable and incremental growth acrossthe broader snacking continuum.
◦ Our products frequently play an important role in special moments among family and friends. Seasonsare an important part of our business model and for consumers, they are highly anticipated, cherishedtimes, centered around traditions. For us, it’s an opportunity for our brands to be part of manyconnections during the year when family and friends gather.
◦ Innovation is an important lever in this variety-seeking category and we are leveraging work from ourproprietary demand landscape analytical tool to shape our future innovation and make it more impactful.We are becoming more disciplined in our focus on platform innovation, which should enable sustainablegrowth over time and significant extensions to our core.
◦ To expand our breadth in snacking, we are focused on expanding the boundaries of our core confectionbrands to capture new snacking occasions and increasing our exposure into new snack categories throughacquisitions. Our expansion into snacking is being fueled by the recent acquisitions of Dot’s and Pretzelsin December 2021, which is included in our North America Salty Snacks segment.
• Deliver Profitable International Growth. We are focused on ensuring that we efficiently allocate our resources tothe areas with the highest potential for profitable growth. We have reset our international investment strategy,while holding fast to our belief that our targeted emerging market strategy will deliver long-term, profitablegrowth. The uncertain macroeconomic environment in many of these markets is expected to continue and we aimto ensure our investments in these international markets are appropriate relative to the size of the opportunity.
The Hershey Company | 2021 Form 10-K | Page 21
• Expand Competitive Advantage through Differentiated Capabilities. In order to generate actionable insights, wemust acquire, integrate, access and utilize vast sources of the right data in an effective manner. We are working toleverage our advanced data and analytical techniques to gain a deep understanding of our consumers, ourcustomers, our shoppers, our end-to-end supply chain, our retail environment and key economic drivers at both amacro and precision level, including digital transformation and new media models. In addition, we are in theprocess of transforming our supply chain capabilities and enterprise resource planning system, which will enableemployees to work more efficiently and effectively.
• Responsibly Manage Our Operations to Ensure the Long-Term Sustainability of Our Business, Our Planet andOur People. We are a purpose-driven company and for more than a century, our iconic brands have been built ona foundation of community investment and connections between people around the world. We could not haveachieved this without our remarkable employees who make our purpose a reality. We believe our long-standingvalues make our Company a special place to work.
◦ We believe our employees are among our most important resources and are critical to our continuedsuccess. In 2021, we changed our global employee survey from an annual basis to continuous listeningsurveys throughout the year. These shorter and faster surveys reach all of our employees around theworld to hear their thoughts on the Company’s direction and their place in it. The change from an annualsurvey to continuous touchpoints allows for real-time feedback and action from the Company and createsstronger employee engagement with the Company’s strategy, initiatives and leadership.
◦ Our diverse and inclusive culture makes the difference across all areas of the business. Our genderrepresentation includes women occupying many of the top positions in the Company, including ChiefExecutive Officer and Chairman of the Board, Chief Accounting Officer and Chief Growth Officer, andapproximately 50% representation across the Company. In 2020, we achieved 1:1 aggregate gender payand in 2021, we achieved 1:1 aggregate people of color pay equity for salaried employees in the UnitedStates.
◦ We have made strong progress on our ESG priorities and continue to elevate these ESG initiatives for agreater global impact. While we focus on sustainability and social impact across our value chain, wecontinue to improve and focus on the lives of cocoa farmers and cocoa communities, the environmentalpriorities of climate change and the role of packaging in our business, responsibly and sustainablysourcing the inputs to our products and increasing investments in human rights and diversity initiativesand growing diverse representation across the organization.
OVERVIEW
Hershey is a global confectionery leader known for making more moments of goodness through chocolate, sweets, mints and other great tasting snacks. We are the largest producer of quality chocolate in North America, a leading snack maker in the United States and a global leader in chocolate and non-chocolate confectionery. We market, sell and distribute our products under more than 100 brand names in approximately 80 countries worldwide.
Our principal product offerings include chocolate and non-chocolate confectionery products; gum and mint refreshment products and protein bars; pantry items, such as baking ingredients, toppings and beverages; and snack items such as spreads, meat snacks, bars and snack bites and mixes, popcorn and protein bars.
Business Acquisitions and Divestitures
In December 2021, we completed the acquisition of Pretzels, previously a privately held company that manufactures and sells pretzels and other salty snacks for other branded products and private labels in the United States. Pretzels is an industry leader in the pretzel category with a product portfolio that includes filled, gluten free and seasoned pretzels, as well as extruded snacks that complements Hershey’s snacks portfolio. Based in Bluffton, Indiana, Pretzels operates three manufacturing locations in Indiana and Kansas. Pretzels provides Hershey deep pretzel category and product expertise and the manufacturing capabilities to support brand growth and future pretzel innovation. Additionally, we completed the acquisition of Dot’s, previously a privately held company that produces and sells pretzels and other snack food products to retailers and distributors in the United States, with Dot’s Homestyle Pretzels snacks as its primary product. Dot’s is the fastest-growing scale brand in the pretzel category and complements Hershey’s snacks portfolio. Pretzels and Dot’s are expected to generate aggregate annualized net sales over $300 million.
The Hershey Company | 2021 Form 10-K | Page 22
In June 2021, we completed the acquisition of Lily’s Sweets, LLC (“Lily’s”), previously a privately held company that sells a line of sugar-free and low-sugar confectionery foods to retailers and distributors in the United States and Canada. Lily’s products include dark and milk chocolate style bars, baking chips, peanut butter cups and other confection products that complement Hershey’s confectionery and confectionery-based portfolio. Lily’s is expected to generate annualized net sales over $100 million.
In January 2021, we completed the divestiture of Lotte Shanghai Foods Co., Ltd. (“LSFC”), which was previously included within the International segment results in our consolidated financial statements. Total proceeds from the divestiture and the impact on our consolidated financial statements were immaterial.
During the second quarter of 2020, we completed the divestitures of KRAVE Pure Foods, Inc. (“Krave”), which was previously included within the North America Salty Snacks segment, and the Scharffen Berger and Dagoba brands, both of which were previously included within the North America Confectionery segment results in our consolidated financial statements.
In September 2019, we completed the acquisition of ONE Brands, LLC (“ONE Brands”), previously a privately held company that sells a line of low-sugar, high-protein nutrition bars to retailers and distributors in the United States, with the ONE bar as its primary product.
TRENDS AFFECTING OUR BUSINESS
On March 11, 2020, the World Health Organization designated COVID-19 as a global pandemic, which has spread worldwide and impacted various markets around the world, including the U.S. Various policies and initiatives have been implemented to reduce the global transmission of COVID-19.
Since the onset of COVID-19, there has been minimal disruption to our supply chain network. However, during 2021, continued strong demand for consumer goods and the effects of COVID-19 mitigation strategies have led to broad-based supply chain disruptions across the U.S. and globally, including inflation on many consumer products, labor shortages and demand outpacing supply. As a result, we experienced corresponding incremental costs and gross margin pressures during the year ended December 31, 2021 (see Results of Operations included in this MD&A). We are working closely with our business units, contract manufacturers, distributors, contractors and other external business partners to minimize the potential impact on our business.
During 2021, many state governments began easing COVID-19 restrictions, resulting in increased travel during the summer and holiday seasons, full capacity at major sporting and entertainment events, increased occupancy limits for indoor gatherings and the removal of face covering requirements (subject to certain exceptions). This contributed to a resurgence of COVID-19 cases and the spread of COVID-19 variants, which experts believe has peaked in recent weeks in many jurisdictions. The availability of vaccinations (including vaccine boosters) continues to increase around the world, albeit with slower than anticipated rollouts and challenges within certain countries.
We experienced an increase in our net sales and net income during the year ended December 31, 2021, which was primarily driven by strong everyday performance on our core U.S. confection brands and salty snack brands (see Segment Results included in this MD&A), partially offset by the aforementioned supply chain disruptions and gross margin pressures. As of December 31, 2021, we believe we have sufficient liquidity to satisfy our key strategic initiatives and other material cash requirements; however, we continue to evaluate and take action, as necessary, to preserve adequate liquidity and ensure that our business can operate effectively during the current economic environment. We continue to monitor our discretionary spending across the organization (see Liquidity and Capital Resources included in this MD&A).
Based on the length and severity of COVID-19, including broad-based supply chain disruptions, rising levels of inflation, new trends in outbreaks and hotspots, the spread of COVID-19 variants, resurgences and the continued distribution of vaccinations, we may experience continued volatility in retail foot traffic, consumer shopping and consumption behavior and may experience increasing supply chain costs and higher inflation. We will continue to evaluate the nature and extent of these potential and evolving impacts to our business, consolidated results of operations, segment results, liquidity and capital resources.
The Hershey Company | 2021 Form 10-K | Page 23
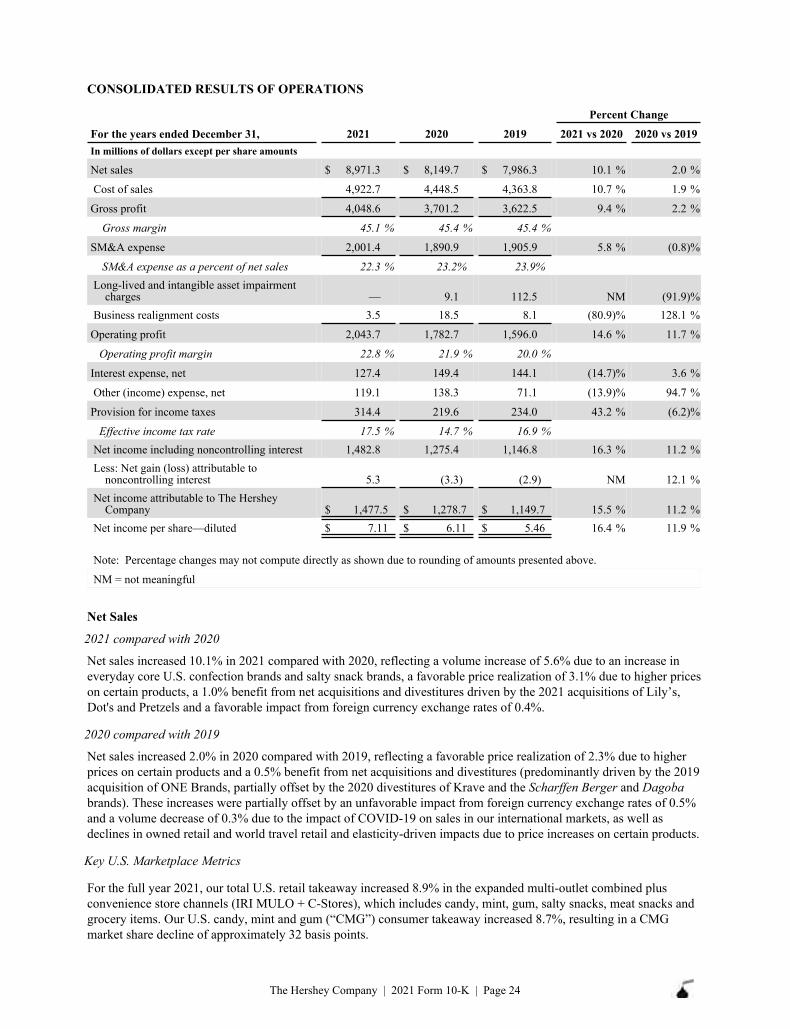
CONSOLIDATED RESULTS OF OPERATIONS
In millions of dollars except per share amounts
Net sales $ 8,971.3 $ 8,149.7 $ 7,986.3 10.1 % 2.0 %
Cost of sales 4,922.7 4,448.5 4,363.8 10.7 % 1.9 %
Gross profit 4,048.6 3,701.2 3,622.5 9.4 % 2.2 %
Gross margin 45.1 % 45.4 % 45.4 %
SM&A expense 2,001.4 1,890.9 1,905.9 5.8 % (0.8) %
SM&A expense as a percent of net sales 22.3 % 23.2 % 23.9 %Long-lived and intangible asset impairment
charges — 9.1 112.5 NM (91.9) %Business realignment costs 3.5 18.5 8.1 (80.9) % 128.1 %
Operating profit 2,043.7 1,782.7 1,596.0 14.6 % 11.7 %
Operating profit margin 22.8 % 21.9 % 20.0 %
Interest expense, net 127.4 149.4 144.1 (14.7) % 3.6 %
Other (income) expense, net 119.1 138.3 71.1 (13.9) % 94.7 %
Provision for income taxes 314.4 219.6 234.0 43.2 % (6.2) %
Effective income tax rate 17.5 % 14.7 % 16.9 %Net income including noncontrolling interest 1,482.8 1,275.4 1,146.8 16.3 % 11.2 %Less: Net gain (loss) attributable to
noncontrolling interest 5.3 (3.3) (2.9) NM 12.1 %Net income attributable to The Hershey
Company $ 1,477.5 $ 1,278.7 $ 1,149.7 15.5 % 11.2 %Net income per share—diluted $ 7.11 $ 6.11 $ 5.46 16.4 % 11.9 %
Note: Percentage changes may not compute directly as shown due to rounding of amounts presented above.
NM = not meaningful
Percent Change
For the years ended December 31, 2021 2020 2019 2021 vs 2020 2020 vs 2019
Net Sales
2021 compared with 2020
Net sales increased 10.1% in 2021 compared with 2020, reflecting a volume increase of 5.6% due to an increase in everyday core U.S. confection brands and salty snack brands, a favorable price realization of 3.1% due to higher prices on certain products, a 1.0% benefit from net acquisitions and divestitures driven by the 2021 acquisitions of Lily’s, Dot's and Pretzels and a favorable impact from foreign currency exchange rates of 0.4%.
2020 compared with 2019
Net sales increased 2.0% in 2020 compared with 2019, reflecting a favorable price realization of 2.3% due to higher prices on certain products and a 0.5% benefit from net acquisitions and divestitures (predominantly driven by the 2019 acquisition of ONE Brands, partially offset by the 2020 divestitures of Krave and the Scharffen Berger and Dagoba brands). These increases were partially offset by an unfavorable impact from foreign currency exchange rates of 0.5% and a volume decrease of 0.3% due to the impact of COVID-19 on sales in our international markets, as well as declines in owned retail and world travel retail and elasticity-driven impacts due to price increases on certain products.
Key U.S. Marketplace Metrics
For the full year 2021, our total U.S. retail takeaway increased 8.9% in the expanded multi-outlet combined plus convenience store channels (IRI MULO + C-Stores), which includes candy, mint, gum, salty snacks, meat snacks and grocery items. Our U.S. candy, mint and gum (“CMG”) consumer takeaway increased 8.7%, resulting in a CMG market share decline of approximately 32 basis points.
The Hershey Company | 2021 Form 10-K | Page 24
The CMG consumer takeaway and market share information reflect measured channels of distribution accounting for approximately 90% of our U.S. confectionery retail business. These channels of distribution primarily include food, drug, mass merchandisers and convenience store channels, plus Wal-Mart Stores, Inc., partial dollar, club and military channels. These metrics are based on measured market scanned purchases as reported by Information Resources, Incorporated (“IRI”), the Company’s market insights and analytics provider, and provide a means to assess our retail takeaway and market position relative to the overall category.
Cost of Sales and Gross Margin
2021 compared with 2020
Cost of sales increased 10.7% in 2021 compared with 2020. The increase was driven by higher sales volume, higher freight and logistics costs and additional plant costs. These drivers were partially offset by the incremental $78.8 million of favorable mark-to-market activity on our commodity derivative instruments intended to economically hedge future years’ commodity purchases; however, our mark-to-market activity was significantly impacted by financial market volatility during March 2020 amid the COVID-19 outbreak. Additionally, the increase was partially offset by favorable price realization and supply chain productivity.
Gross margin decreased by 30 basis points in 2021 compared with 2020. The decrease was driven by higher freight and logistics costs and additional plant costs. These factors were partially offset by favorable price realization, supply chain productivity and the favorable year-over-year mark-to-market impact from commodity derivative instruments.
2020 compared with 2019
Cost of sales increased 1.9% in 2020 compared with 2019. The increase in cost of sales was attributed to higher freight and logistics costs and additional plant costs, specifically, PPE costs, increased sanitation and wage incentives associated with COVID-19. Additionally, the increase was driven by an incremental $28.9 million of unfavorable mark-to-market activity on our commodity derivative instruments. These derivative instruments are intended to economically hedge future years’ commodity purchases; however, they were significantly impacted by financial market volatility during 2020. These drivers were partially offset by favorable price realization and favorable supply chain productivity.
Gross margin remained the same in 2020 compared with 2019. Increases were driven by the higher freight and logistics costs, additional plant costs, and unfavorable year-over-year mark-to-market impact from commodity derivative instruments. These factors were offset by favorable price realization and supply chain productivity.
Selling, Marketing and Administrative
2021 compared with 2020
Selling, marketing and administrative (“SM&A”) expenses increased $110.4 million, or 5.8%, in 2021 driven by increased corporate expenses. Total advertising and related consumer marketing expenses decreased 0.2% driven by lower advertising in our North America Confectionery segment. SM&A expenses, excluding advertising and related consumer marketing, increased approximately 9.2% in 2021 driven by higher compensation costs and investments in capabilities and technology.
2020 compared with 2019
SM&A expenses decreased $15.0 million or 0.8% in 2020. Total advertising and related consumer marketing expenses decreased 2.0% driven by media cost efficiencies and select brand investment optimization related to COVID-19 in our International segment. SM&A expenses, excluding advertising and related consumer marketing, decreased approximately 0.1% in 2020 due to savings in travel and meeting expenses related to COVID-19 travel restrictions and project timing shifts.
The Hershey Company | 2021 Form 10-K | Page 25
Long-Lived and Intangible Asset Impairment Charges
In 2021, we recorded no impairments charges. In 2020 and 2019, we recorded the following impairment charges:
For the year ended December 31, 2020 2019In millions of dollars
Adjustment to disposal group (1) $ 6.2 $ 2.7 Other asset write-down (2) 2.9 — Customer relationship and trademark intangible assets (3) — 100.1 Other long-lived assets not held for sale (4) — 9.7 Long-lived and intangible asset impairment charges $ 9.1 $ 112.5
(1) In connection with our LSFC disposal group, which was previously classified as held for sale during 2020 and2019, we recorded impairment charges to adjust long-lived asset values. The fair value of the disposal groupwas supported by potential sales prices with third-party buyers. The sale of the LSFC joint venture wascompleted in January 2021.
(2) In connection with a previous sale, the Company wrote-down certain receivables deemed uncollectible.(3) During the fourth quarter of 2019, we recorded impairment charges to write down customer relationship and
trademark intangible assets associated with Krave. These charges were determined by comparing the fair valueof the asset group to its carrying value. We used various valuation techniques to determine fair value, with theprimary techniques being discounted cash flow analysis and relief-from-royalty valuation approaches, whichuse significant unobservable inputs, or Level 3 inputs, as defined by the fair value hierarchy.
(4) During 2019, we recorded impairment charges predominantly comprised of select long-lived assets that had notyet met the held for sale criteria. The fair value of these assets was supported by potential sales prices withthird-party buyers and market analysis.
The assessment of the valuation of goodwill and other long-lived assets is based on management estimates and assumptions, as discussed in our critical accounting policies included in Item 7 of this Annual Report on Form 10-K. These estimates and assumptions are subject to change due to changing economic and competitive conditions.
Business Realignment Activities
We periodically undertake business realignment activities designed to increase our efficiency and focus our business in support of our key growth strategies. In 2021, 2020 and 2019 , we recorded business realignment costs of $3.5 million, $18.5 million and $8.1 million, respectively. The 2021 and 2020 costs related primarily to the International Optimization Program, a program focused on optimizing our China operating model to improve our operational efficiency and provide for a strong, sustainable and simplified base going forward. The 2019 costs related primarily to the Margin for Growth Program, a program focused on improving global efficiency and effectiveness, optimizing the Company’s supply chain, streamlining the Company’s operating model and reducing administrative expenses to generate long-term savings. Costs associated with business realignment activities are classified in our Consolidated Statements of Income as described in Note 9 to the Consolidated Financial Statements.
Operating Profit and Operating Profit Margin
2021 compared with 2020
Operating profit increased 14.6% in 2021 compared with 2020 due primarily to higher gross profit, lower business realignment costs and lower impairment charges, partially offset by higher SM&A in the 2021 period, as noted above. Operating profit margin increased to 22.8% in 2021 from 21.9% in 2020 driven by these same factors.
2020 compared with 2019
Operating profit increased 11.7% in 2020 compared with 2019 due primarily to higher gross profit, lower SM&A and lower impairment charges, partially offset by higher business realignment costs in the 2020 period, as noted above. Operating profit margin increased to 21.9% in 2020 from 20.0% in 2019 driven by these same factors.
The Hershey Company | 2021 Form 10-K | Page 26
Interest Expense, Net
2021 compared with 2020
Net interest expense was $22.0 million lower in 2021 than in 2020. The decrease was due to lower average long-term debt balances in 2021 versus 2020, specifically resulting from $435 million of long-term debt repayments with varying maturity dates during 2021.
2020 compared with 2019
Net interest expense was $5.2 million higher in 2020 than in 2019. The increase was due to higher long-term debt balances in 2020 versus 2019, specifically due to $1.0 billion of notes issued in October 2019 and $1.0 billion of notes issued in May 2020.
Other (Income) Expense, Net
2021 compared with 2020
Other (income) expense, net totaled an expense of $119.1 million in 2021 versus an expense of $138.3 million in 2020. The decrease in the net expense was primarily due to lower write-downs on equity investments qualifying for historic and renewable energy tax credits, in addition to lower non-service cost components of net periodic benefit cost relating to pension and other post-retirement benefit plans during 2021 compared to the 2020 period.
2020 compared with 2019
Other (income) expense, net totaled an expense of $138.3 million in 2020 versus an expense of $71.1 million in 2019. The increase in the net expense was primarily due to higher write-downs on equity investments qualifying for federal solar tax credits, partially offset by lower non-service cost components of net periodic benefit cost relating to pension and other post-retirement benefit plans during 2020 compared to the 2019 period.
Income Taxes and Effective Tax Rate
2021 compared with 2020
Our effective income tax rate was 17.5% for 2021 compared with 14.7% for 2020. Relative to the 21% statutory rate, the 2021 effective tax rate benefited from investment tax credits, partially offset by incremental tax reserves incurred as a result of an adverse ruling in connection with a non-U.S. tax litigation matter, as well as state taxes. The 2020 effective rate, relative to the 21% statutory rate, benefited from investment tax credits and the benefit of employee share-based payments, partially offset by state taxes.
2020 compared with 2019
Our effective income tax rate was 14.7% for 2020 compared with 16.9% for 2019. Relative to the 21% statutory rate, the 2020 effective tax rate benefited from investment tax credits and the benefit of employee share-based payments, partially offset by state taxes. The 2019 effective rate, relative to the 21% statutory rate, was impacted by changes to foreign valuation allowances, a favorable foreign rate differential, investment tax credits and the benefit of employee share-based payments, which were partially offset by the impact of state taxes.
The Hershey Company | 2021 Form 10-K | Page 27
Net Income Attributable to The Hershey Company and Earnings Per Share-diluted
2021 compared with 2020
Net income increased $198.8 million, or 15.5%, while EPS-diluted increased $1.00, or 16.4%, in 2021 compared with 2020. The increase in both net income and EPS-diluted was driven primarily by higher gross profit, partially offset by higher SM&A and higher income taxes in 2021. Our 2021 EPS-diluted also benefited from lower weighted-average shares outstanding as a result of share repurchases pursuant to our Board-approved repurchase programs.
2020 compared with 2019
Net income increased $129.0 million, or 11.2%, while EPS-diluted increased $0.65, or 11.9%, in 2020 compared with 2019. The increase in both net income and EPS-diluted was driven primarily by higher gross profit, lower SM&A, lower impairment charges, and lower income taxes in 2020, partially offset by higher other income and expenses, higher business realignment costs, and higher interest expense. Our 2020 EPS-diluted also benefited from lower weighted-average shares outstanding as a result of share repurchases pursuant to our Board-approved repurchase programs.
The Hershey Company | 2021 Form 10-K | Page 28
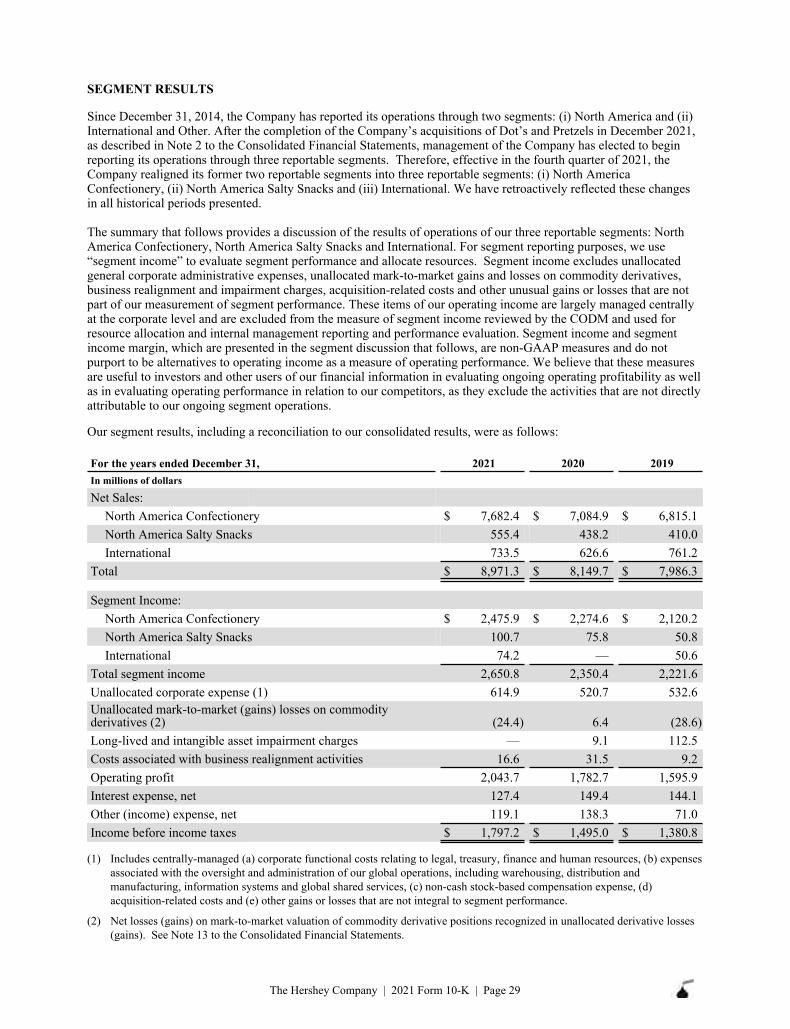
SEGMENT RESULTS
Since December 31, 2014, the Company has reported its operations through two segments: (i) North America and (ii) International and Other. After the completion of the Company’s acquisitions of Dot’s and Pretzels in December 2021, as described in Note 2 to the Consolidated Financial Statements, management of the Company has elected to begin reporting its operations through three reportable segments. Therefore, effective in the fourth quarter of 2021, the Company realigned its former two reportable segments into three reportable segments: (i) North America Confectionery, (ii) North America Salty Snacks and (iii) International. We have retroactively reflected these changes in all historical periods presented.
The summary that follows provides a discussion of the results of operations of our three reportable segments: North America Confectionery, North America Salty Snacks and International. For segment reporting purposes, we use “segment income” to evaluate segment performance and allocate resources. Segment income excludes unallocated general corporate administrative expenses, unallocated mark-to-market gains and losses on commodity derivatives, business realignment and impairment charges, acquisition-related costs and other unusual gains or losses that are not part of our measurement of segment performance. These items of our operating income are largely managed centrally at the corporate level and are excluded from the measure of segment income reviewed by the CODM and used for resource allocation and internal management reporting and performance evaluation. Segment income and segment income margin, which are presented in the segment discussion that follows, are non-GAAP measures and do not purport to be alternatives to operating income as a measure of operating performance. We believe that these measures are useful to investors and other users of our financial information in evaluating ongoing operating profitability as well as in evaluating operating performance in relation to our competitors, as they exclude the activities that are not directly attributable to our ongoing segment operations.
Our segment results, including a reconciliation to our consolidated results, were as follows:
For the years ended December 31, 2021 2020 2019In millions of dollars
Net Sales:North America Confectionery $ 7,682.4 $ 7,084.9 $ 6,815.1 North America Salty Snacks 555.4 438.2 410.0 International 733.5 626.6 761.2
Total $ 8,971.3 $ 8,149.7 $ 7,986.3
Segment Income:North America Confectionery $ 2,475.9 $ 2,274.6 $ 2,120.2 North America Salty Snacks 100.7 75.8 50.8 International 74.2 — 50.6
Total segment income 2,650.8 2,350.4 2,221.6 Unallocated corporate expense (1) 614.9 520.7 532.6 Unallocated mark-to-market (gains) losses on commodity derivatives (2) (24.4) 6.4 (28.6) Long-lived and intangible asset impairment charges — 9.1 112.5 Costs associated with business realignment activities 16.6 31.5 9.2 Operating profit 2,043.7 1,782.7 1,595.9 Interest expense, net 127.4 149.4 144.1 Other (income) expense, net 119.1 138.3 71.0 Income before income taxes $ 1,797.2 $ 1,495.0 $ 1,380.8
(1) Includes centrally-managed (a) corporate functional costs relating to legal, treasury, finance and human resources, (b) expensesassociated with the oversight and administration of our global operations, including warehousing, distribution andmanufacturing, information systems and global shared services, (c) non-cash stock-based compensation expense, (d)acquisition-related costs and (e) other gains or losses that are not integral to segment performance.
(2) Net losses (gains) on mark-to-market valuation of commodity derivative positions recognized in unallocated derivative losses(gains). See Note 13 to the Consolidated Financial Statements.
The Hershey Company | 2021 Form 10-K | Page 29
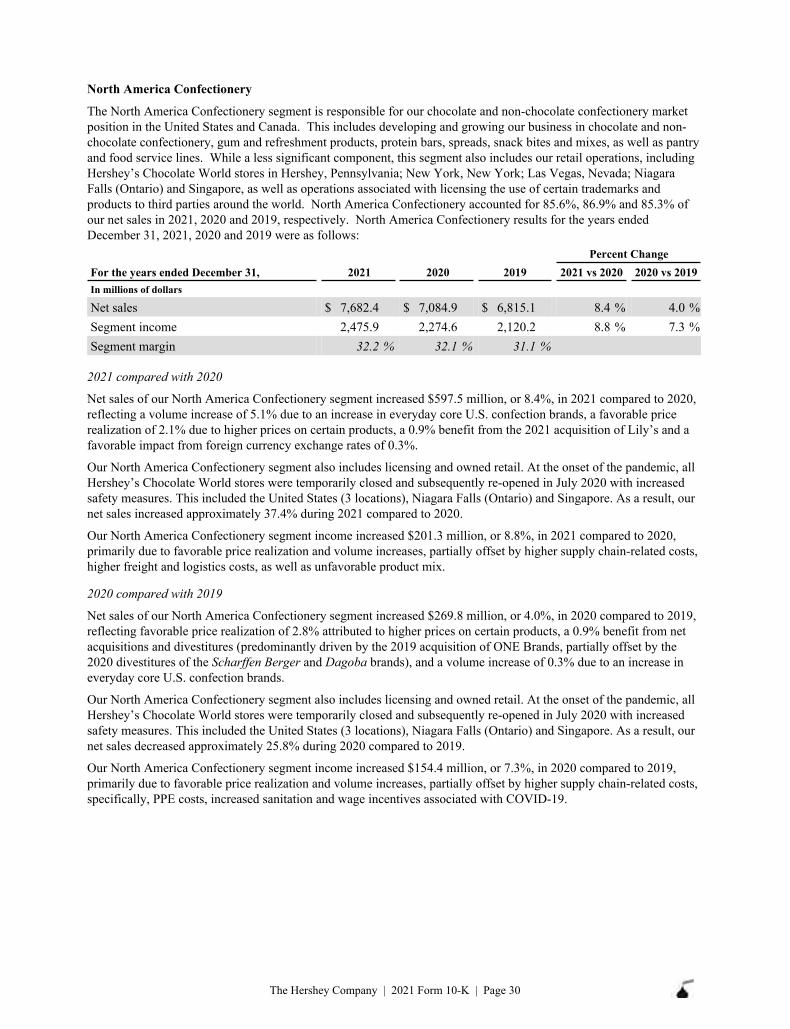
North America Confectionery
The North America Confectionery segment is responsible for our chocolate and non-chocolate confectionery market position in the United States and Canada. This includes developing and growing our business in chocolate and non-chocolate confectionery, gum and refreshment products, protein bars, spreads, snack bites and mixes, as well as pantry and food service lines. While a less significant component, this segment also includes our retail operations, including Hershey’s Chocolate World stores in Hershey, Pennsylvania; New York, New York; Las Vegas, Nevada; Niagara Falls (Ontario) and Singapore, as well as operations associated with licensing the use of certain trademarks and products to third parties around the world. North America Confectionery accounted for 85.6%, 86.9% and 85.3% of our net sales in 2021, 2020 and 2019, respectively. North America Confectionery results for the years ended December 31, 2021, 2020 and 2019 were as follows:
Percent ChangeFor the years ended December 31, 2021 2020 2019 2021 vs 2020 2020 vs 2019In millions of dollars
Net sales $ 7,682.4 $ 7,084.9 $ 6,815.1 8.4 % 4.0 %Segment income 2,475.9 2,274.6 2,120.2 8.8 % 7.3 %Segment margin 32.2 % 32.1 % 31.1 %
2021 compared with 2020
Net sales of our North America Confectionery segment increased $597.5 million, or 8.4%, in 2021 compared to 2020, reflecting a volume increase of 5.1% due to an increase in everyday core U.S. confection brands, a favorable price realization of 2.1% due to higher prices on certain products, a 0.9% benefit from the 2021 acquisition of Lily’s and a favorable impact from foreign currency exchange rates of 0.3%.
Our North America Confectionery segment also includes licensing and owned retail. At the onset of the pandemic, all Hershey’s Chocolate World stores were temporarily closed and subsequently re-opened in July 2020 with increased safety measures. This included the United States (3 locations), Niagara Falls (Ontario) and Singapore. As a result, our net sales increased approximately 37.4% during 2021 compared to 2020.
Our North America Confectionery segment income increased $201.3 million, or 8.8%, in 2021 compared to 2020, primarily due to favorable price realization and volume increases, partially offset by higher supply chain-related costs, higher freight and logistics costs, as well as unfavorable product mix.
2020 compared with 2019
Net sales of our North America Confectionery segment increased $269.8 million, or 4.0%, in 2020 compared to 2019, reflecting favorable price realization of 2.8% attributed to higher prices on certain products, a 0.9% benefit from net acquisitions and divestitures (predominantly driven by the 2019 acquisition of ONE Brands, partially offset by the 2020 divestitures of the Scharffen Berger and Dagoba brands), and a volume increase of 0.3% due to an increase in everyday core U.S. confection brands.
Our North America Confectionery segment also includes licensing and owned retail. At the onset of the pandemic, all Hershey’s Chocolate World stores were temporarily closed and subsequently re-opened in July 2020 with increased safety measures. This included the United States (3 locations), Niagara Falls (Ontario) and Singapore. As a result, our net sales decreased approximately 25.8% during 2020 compared to 2019.
Our North America Confectionery segment income increased $154.4 million, or 7.3%, in 2020 compared to 2019, primarily due to favorable price realization and volume increases, partially offset by higher supply chain-related costs, specifically, PPE costs, increased sanitation and wage incentives associated with COVID-19.
The Hershey Company | 2021 Form 10-K | Page 30
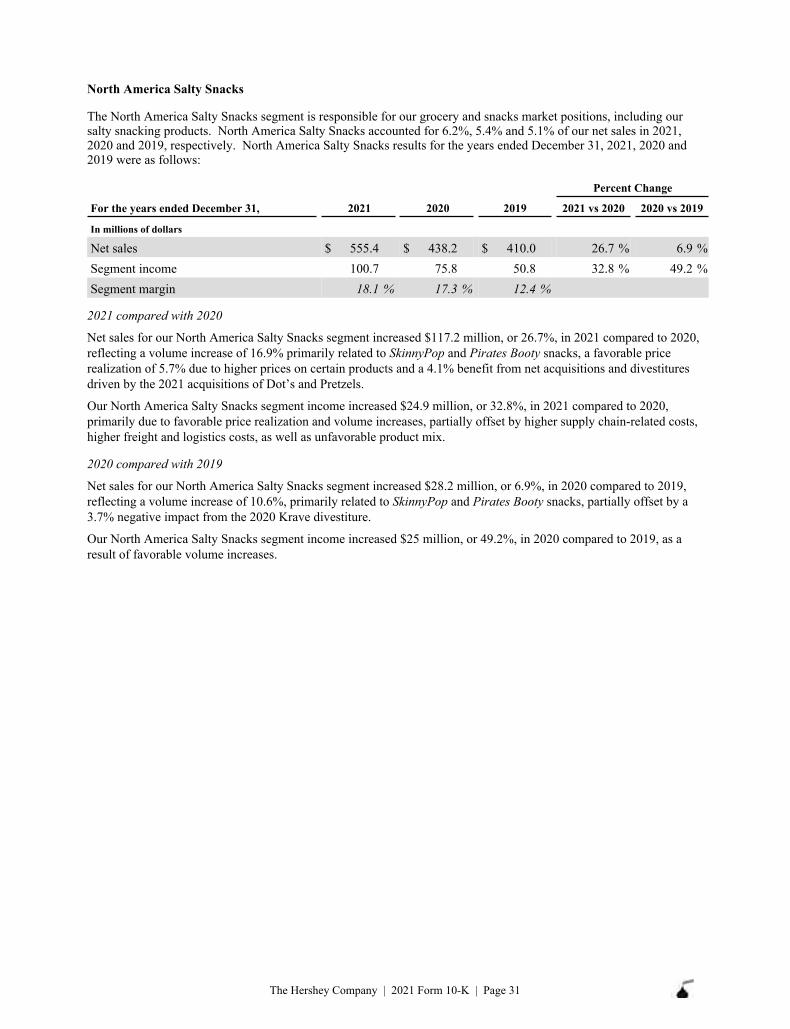
North America Salty Snacks
The North America Salty Snacks segment is responsible for our grocery and snacks market positions, including our salty snacking products. North America Salty Snacks accounted for 6.2%, 5.4% and 5.1% of our net sales in 2021, 2020 and 2019, respectively. North America Salty Snacks results for the years ended December 31, 2021, 2020 and 2019 were as follows:
Percent Change
For the years ended December 31, 2021 2020 2019 2021 vs 2020 2020 vs 2019
In millions of dollars
Net sales $ 555.4 $ 438.2 $ 410.0 26.7 % 6.9 %Segment income 100.7 75.8 50.8 32.8 % 49.2 %Segment margin 18.1 % 17.3 % 12.4 %
2021 compared with 2020
Net sales for our North America Salty Snacks segment increased $117.2 million, or 26.7%, in 2021 compared to 2020, reflecting a volume increase of 16.9% primarily related to SkinnyPop and Pirates Booty snacks, a favorable price realization of 5.7% due to higher prices on certain products and a 4.1% benefit from net acquisitions and divestitures driven by the 2021 acquisitions of Dot’s and Pretzels.
Our North America Salty Snacks segment income increased $24.9 million, or 32.8%, in 2021 compared to 2020, primarily due to favorable price realization and volume increases, partially offset by higher supply chain-related costs, higher freight and logistics costs, as well as unfavorable product mix.
2020 compared with 2019
Net sales for our North America Salty Snacks segment increased $28.2 million, or 6.9%, in 2020 compared to 2019, reflecting a volume increase of 10.6%, primarily related to SkinnyPop and Pirates Booty snacks, partially offset by a 3.7% negative impact from the 2020 Krave divestiture.
Our North America Salty Snacks segment income increased $25 million, or 49.2%, in 2020 compared to 2019, as a result of favorable volume increases.
The Hershey Company | 2021 Form 10-K | Page 31
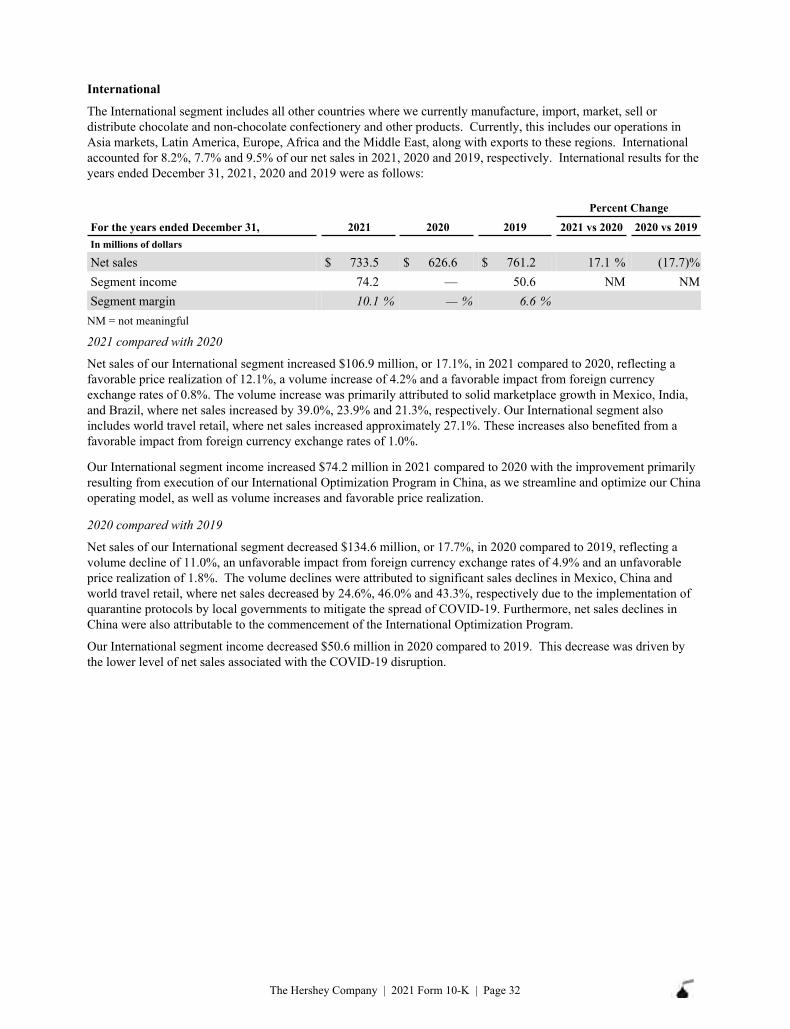
International
The International segment includes all other countries where we currently manufacture, import, market, sell or distribute chocolate and non-chocolate confectionery and other products. Currently, this includes our operations in Asia markets, Latin America, Europe, Africa and the Middle East, along with exports to these regions. International accounted for 8.2%, 7.7% and 9.5% of our net sales in 2021, 2020 and 2019, respectively. International results for the years ended December 31, 2021, 2020 and 2019 were as follows:
Percent Change
For the years ended December 31, 2021 2020 2019 2021 vs 2020 2020 vs 2019In millions of dollars
Net sales $ 733.5 $ 626.6 $ 761.2 17.1 % (17.7) %Segment income 74.2 — 50.6 NM NMSegment margin 10.1 % — % 6.6 %
NM = not meaningful
2021 compared with 2020
Net sales of our International segment increased $106.9 million, or 17.1%, in 2021 compared to 2020, reflecting a favorable price realization of 12.1%, a volume increase of 4.2% and a favorable impact from foreign currency exchange rates of 0.8%. The volume increase was primarily attributed to solid marketplace growth in Mexico, India, and Brazil, where net sales increased by 39.0%, 23.9% and 21.3%, respectively. Our International segment also includes world travel retail, where net sales increased approximately 27.1%. These increases also benefited from a favorable impact from foreign currency exchange rates of 1.0%.
Our International segment income increased $74.2 million in 2021 compared to 2020 with the improvement primarily resulting from execution of our International Optimization Program in China, as we streamline and optimize our China operating model, as well as volume increases and favorable price realization.
2020 compared with 2019
Net sales of our International segment decreased $134.6 million, or 17.7%, in 2020 compared to 2019, reflecting a volume decline of 11.0%, an unfavorable impact from foreign currency exchange rates of 4.9% and an unfavorable price realization of 1.8%. The volume declines were attributed to significant sales declines in Mexico, China and world travel retail, where net sales decreased by 24.6%, 46.0% and 43.3%, respectively due to the implementation of quarantine protocols by local governments to mitigate the spread of COVID-19. Furthermore, net sales declines in China were also attributable to the commencement of the International Optimization Program.
Our International segment income decreased $50.6 million in 2020 compared to 2019. This decrease was driven by the lower level of net sales associated with the COVID-19 disruption.
The Hershey Company | 2021 Form 10-K | Page 32
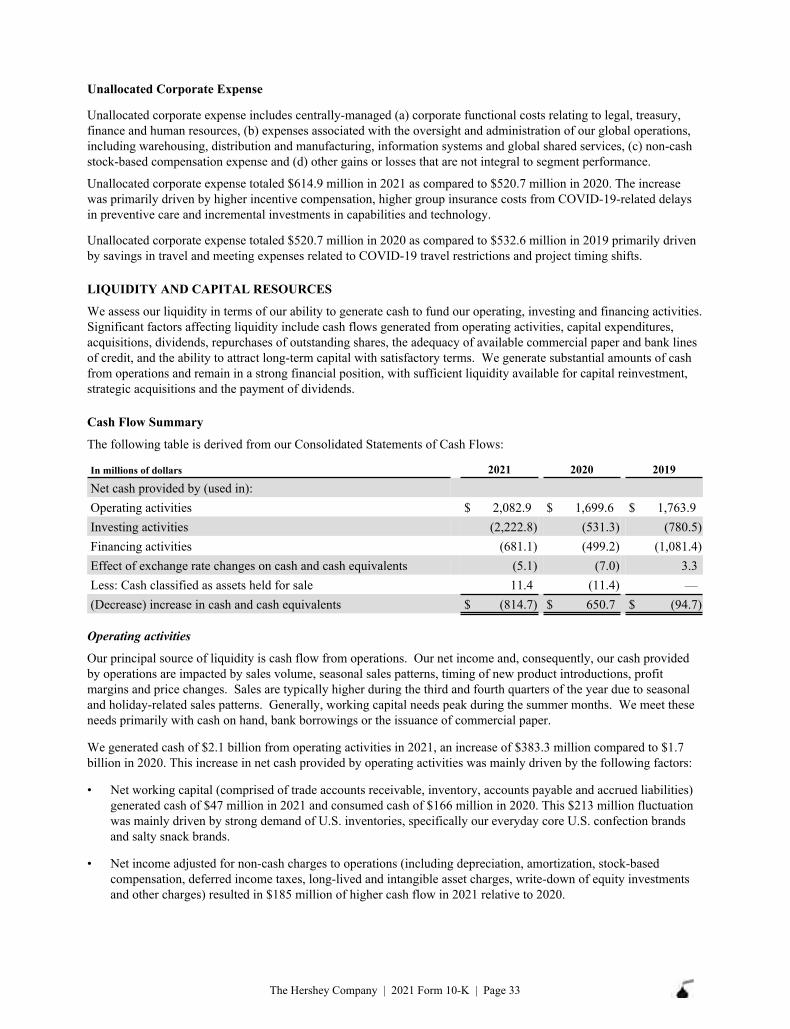
Unallocated Corporate Expense
Unallocated corporate expense includes centrally-managed (a) corporate functional costs relating to legal, treasury, finance and human resources, (b) expenses associated with the oversight and administration of our global operations, including warehousing, distribution and manufacturing, information systems and global shared services, (c) non-cash stock-based compensation expense and (d) other gains or losses that are not integral to segment performance.
Unallocated corporate expense totaled $614.9 million in 2021 as compared to $520.7 million in 2020. The increase was primarily driven by higher incentive compensation, higher group insurance costs from COVID-19-related delays in preventive care and incremental investments in capabilities and technology.
Unallocated corporate expense totaled $520.7 million in 2020 as compared to $532.6 million in 2019 primarily driven by savings in travel and meeting expenses related to COVID-19 travel restrictions and project timing shifts.
LIQUIDITY AND CAPITAL RESOURCES
We assess our liquidity in terms of our ability to generate cash to fund our operating, investing and financing activities. Significant factors affecting liquidity include cash flows generated from operating activities, capital expenditures, acquisitions, dividends, repurchases of outstanding shares, the adequacy of available commercial paper and bank lines of credit, and the ability to attract long-term capital with satisfactory terms. We generate substantial amounts of cash from operations and remain in a strong financial position, with sufficient liquidity available for capital reinvestment, strategic acquisitions and the payment of dividends.
Cash Flow Summary
The following table is derived from our Consolidated Statements of Cash Flows:
Net cash provided by (used in):Operating activities $ 2,082.9 $ 1,699.6 $ 1,763.9 Investing activities (2,222.8) (531.3) (780.5) Financing activities (681.1) (499.2) (1,081.4) Effect of exchange rate changes on cash and cash equivalents (5.1) (7.0) 3.3 Less: Cash classified as assets held for sale 11.4 (11.4) — (Decrease) increase in cash and cash equivalents $ (814.7) $ 650.7 $ (94.7)
In millions of dollars 2021 2020 2019
Operating activities
Our principal source of liquidity is cash flow from operations. Our net income and, consequently, our cash provided by operations are impacted by sales volume, seasonal sales patterns, timing of new product introductions, profit margins and price changes. Sales are typically higher during the third and fourth quarters of the year due to seasonal and holiday-related sales patterns. Generally, working capital needs peak during the summer months. We meet these needs primarily with cash on hand, bank borrowings or the issuance of commercial paper.
We generated cash of $2.1 billion from operating activities in 2021, an increase of $383.3 million compared to $1.7 billion in 2020. This increase in net cash provided by operating activities was mainly driven by the following factors:
• Net working capital (comprised of trade accounts receivable, inventory, accounts payable and accrued liabilities)generated cash of $47 million in 2021 and consumed cash of $166 million in 2020. This $213 million fluctuationwas mainly driven by strong demand of U.S. inventories, specifically our everyday core U.S. confection brandsand salty snack brands.
• Net income adjusted for non-cash charges to operations (including depreciation, amortization, stock-basedcompensation, deferred income taxes, long-lived and intangible asset charges, write-down of equity investmentsand other charges) resulted in $185 million of higher cash flow in 2021 relative to 2020.
The Hershey Company | 2021 Form 10-K | Page 33
Cash provided by operating activities in 2020 decreased $64.3 million relative to 2019. This increase was driven by the following factors:
• Net working capital (comprised of trade accounts receivable, inventory, accounts payable and accrued liabilities)consumed cash of $166 million in 2020 and generated cash of $60 million in 2019. This $226 million fluctuationwas mainly driven by a higher year-over-year build up of U.S. inventories to satisfy product requirements andmaintain sufficient levels to accommodate customer requirements, as well as an increase in cash used by accountsreceivable due to an increase in sales of U.S. seasonal products.
• The decrease in cash provided by operating activities was partially offset by the following net cash inflows:
◦ Net income adjusted for non-cash charges to operations (including depreciation, amortization, stock-based compensation, deferred income taxes, long-lived and intangible asset charges, write-down ofequity investments and other charges) resulted in $207 million of higher cash flow in 2020 relative to2019.
Pension and Post-Retirement Activity. We recorded net periodic benefit costs of $28.4 million, $34.5 million and $41.4 million in 2021, 2020 and 2019, respectively, relating to our benefit plans (including our defined benefit and other post retirement plans). The main drivers of fluctuations in expense from year to year are assumptions in formulating our long-term estimates, including discount rates used to value plan obligations, expected returns on plan assets, the service and interest costs and the amortization of actuarial gains and losses.
The funded status of our qualified defined benefit pension plans is dependent upon many factors, including returns on invested assets, the level of market interest rates and the level of funding. We contribute cash to our plans at our discretion, subject to applicable regulations and minimum contribution requirements. Cash contributions to our pension and post retirement plans totaled $51.1 million, $11.7 million and $20.1 million in 2021, 2020 and 2019, respectively.
Investing activities
Our principal uses of cash for investment purposes relate to purchases of property, plant and equipment and capitalized software, as well as acquisitions of businesses, partially offset by proceeds from sales of property, plant and equipment. We used cash of $2.2 billion for investing activities in 2021 compared to $531.3 million in 2020, with the increase in cash spend driven by higher levels of acquisition activity. We used cash of $780.5 million for investing activities in 2019, and the decrease in 2020 in cash spend was driven by no acquisition activity.
Primary investing activities include the following:
• Capital spending. Capital expenditures, including capitalized software, primarily to support our ERP systemimplementation, capacity expansion, innovation and cost savings, were $495.9 million in 2021, $441.6 million in2020 and $318.2 million in 2019. Our 2021 expenditures increased compared to 2020 due to progress on capacityexpansion projects and our ERP system implementation. Our 2020 expenditures were substantially higher than2019 expenditures due to progress on our key strategic initiatives. We expect 2022 capital expenditures, includingcapitalized software, to approximate $550 million to $600 million. The increase in our 2022 capital expendituresis largely driven by our key strategic initiatives, including expanding the agility and capacity of the Company’ssupply chain and building digital infrastructure across the enterprise. We intend to use our existing cash andinternally generated funds to meet our 2022 capital requirements.
• Investments in partnerships qualifying for tax credits. We make investments in partnership entities that in turnmake equity investments in projects eligible to receive federal historic and energy tax credits. We investedapproximately $128.4 million in 2021, $87.2 million in 2020 and $80.2 million in 2019 in projects qualifying fortax credits.
• Business acquisitions. In 2021, we spent an aggregate $1.6 billion to acquire Lily's (June 2021), as well as Dot’sand Pretzels (December 2021). In 2020, we had no acquisition activity. In 2019, we spent $402.2 million toacquire ONE Brands.
The Hershey Company | 2021 Form 10-K | Page 34
• Other investing activities. In 2021 and 2020, our other investing activities were minimal. In 2019, we generated$20.1 million of proceeds from the sale of property, plant and equipment and other long-lived assets. Thisincluded the sale of select Pennsylvania facilities and land for sales proceeds of approximately $27.6 million,resulting in a gain on the sale of $11.3 million.
Financing activities
Our cash flow from financing activities generally relates to the use of cash for purchases of our Common Stock and payment of dividends, offset by net borrowing activity and proceeds from the exercise of stock options. Financing activities in 2021 used cash of $681.1 million, compared to cash used of $499.2 million in 2020. We used cash of $1.1 billion for financing activities in 2019, primarily to fund acquisition activity.
The majority of our financing activity was attributed to the following:
• Short-term borrowings, net. In addition to utilizing cash on hand, we use short-term borrowings (commercialpaper and bank borrowings) to fund seasonal working capital requirements and ongoing business needs. In 2021,we generated cash flow of $869.0 million predominantly through the issuance of short-term commercial paper. In2020, we generated cash flow of $41.8 million due to an increase in short-term foreign bank borrowings. In 2019,we used $1.2 billion to reduce short-term commercial paper borrowings and short-term foreign bank borrowings.We utilized the proceeds from the issuance of long-term debt in October 2019 to repay outstanding commercialpaper used to fund the ONE Brands acquisition.
• Long-term debt borrowings and repayments. In February 2021 and May 2021, we repaid $84.7 million of8.800% Debentures and $350 million of 3.100% Notes due upon their maturities, respectively. In May 2020, weissued $300 million of 0.900% Notes due in 2025, $350 million of 1.700% Notes due in 2030 and $350 million of2.650% Notes due in 2050 (the “2020 Notes”). Proceeds from the issuance of the 2020 Notes, net of discounts andissuance costs, totaled $989.9 million. Additionally, in May 2020 and December 2020, we repaid $350 million of2.900% Notes and $350 million of 4.125% Notes due upon their maturities, respectively. In October 2019, weissued $300 million of 2.05% Notes due in 2024, $300 million of 2.45% Notes due in 2029 and $400 million of3.125% Notes due in 2049 (the “2019 Notes”). Proceeds from the issuance of the 2019 Notes, net of discounts andissuance costs, totaled $989.6 million.
• Dividend payments. Total dividend payments to holders of our Common Stock and Class B Common Stock were$686.0 million in 2021, $640.7 million in 2020 and $610.3 million in 2019. Dividends per share of CommonStock increased 8.1% to $3.410 per share in 2021 compared to $3.154 per share in 2020, while dividends pershare of Class B Common Stock increased 8.2% in 2021. Details regarding our 2021 cash dividends paid tostockholders are as follows:
Quarter EndedIn millions of dollars except per share amounts April 4, 2021 July 4, 2021 October 3, 2021 December 31, 2021Dividends paid per share – Common stock $ 0.804 $ 0.804 $ 0.901 $ 0.901 Dividends paid per share – Class B common stock $ 0.731 $ 0.731 $ 0.819 $ 0.819 Total cash dividends paid $ 162.7 $ 161.6 $ 180.9 $ 180.8 Declaration date February 2, 2021 April 27, 2021 July 23, 2021 October 27, 2021Record date February 19, 2021 May 21, 2021 August 20, 2021 November 19, 2021Payment date March 15, 2021 June 15, 2021 September 15, 2021 December 15, 2021
• Share repurchases. We repurchase shares of Common Stock to offset the dilutive impact of treasury shares issuedunder our equity compensation plans. The value of these share repurchases in a given period varies based on thevolume of stock options exercised and our market price. In addition, we periodically repurchase shares ofCommon Stock pursuant to Board-authorized programs intended to drive additional stockholder value. Detailsregarding our share repurchases are as follows:
The Hershey Company | 2021 Form 10-K | Page 35
In millions 2021 2020 2019Shares repurchased in the open market under pre-approved share repurchase programs $ 150.0 $ 150.0 $ 150.0 Shares repurchased to replace Treasury Stock issued for stock options and incentive compensation 308.0 61.2 377.2Cash used for total share repurchases $ 458.0 $ 211.2 $ 527.2 Total shares repurchased under pre-approved share repurchase programs 0.9 1.0 1.4
In July 2018, our Board of Directors approved a $500 million share repurchase authorization. As of December 31, 2021, approximately $110 million remained available for repurchases of our Common Stock under this program. The share repurchase program does not have an expiration date. In May 2021, our Board of Directors approved an additional $500 million share repurchase authorization. This program is to commence after the existing 2018 authorization is completed and is to be utilized at management’s discretion. We expect 2022 share repurchases to be in line with our traditional buyback strategy.
• Proceeds from the exercise of stock options, including tax benefits. We received $33.2 million from employeeexercises of stock options, net of employee taxes withheld from share-based awards in 2021. We received $25.5million and $240.8 million in 2020 and 2019, respectively. Variances are driven primarily by the number ofshares exercised and the share price at the date of grant.
Financial Condition
At December 31, 2021, our cash and cash equivalents totaled $329.3 million. At December 31, 2020, our cash and cash equivalents totaled $1.1 billion. Our cash and cash equivalents at the end of 2021 decreased $814.7 million compared to the 2020 year-end balance as a result of the uses of net cash outlined in the previous discussion.
Approximately 60% of the balance of our cash and cash equivalents at December 31, 2021 was held by subsidiaries domiciled outside of the United States. During 2021, previously undistributed earnings of certain international subsidiaries were no longer considered indefinitely reinvested; however, the Company had previously recognized a one-time U.S. repatriation tax due under U.S. tax reform, and as a result, only an immaterial amount of withholding tax was recognized. For the remainder of the Company’s cash held by international subsidiaries, we intend to continue to reinvest the undistributed earnings indefinitely. We believe we have sufficient liquidity to satisfy our cash needs for at least the next 12 months, including our cash needs in the United States.
We maintain debt levels we consider prudent based on our cash flow, interest coverage ratio and percentage of debt to capital. We use debt financing to lower our overall cost of capital which increases our return on stockholders’ equity. Our total short- and long-term debt was $5.0 billion at December 31, 2021 and $4.6 billion at December 31, 2020. Our total debt increased in 2021 mainly due to the issuance of short-term commercial paper used to fund our 2021 acquisitions of Lily’s, Dot’s and Pretzels, partially offset by the repayment of $84.7 million Debentures that matured in February 2021 and $350 million Notes that matured in May 2021.
As a source of short-term financing, we maintain a $1.5 billion unsecured revolving credit facility with the option to increase borrowings by an additional $500 million with the consent of the lenders. As of December 31, 2021, the termination date of this agreement is July 2, 2024, however, we may extend the termination date for up to two additional one-year periods upon notice to the administrative agent under the facility. We may use these funds for general corporate purposes, including commercial paper backstop and business acquisitions. As of December 31, 2021, we had $680 million of available capacity under the agreement. The unsecured revolving credit agreement contains certain financial and other covenants, customary representations, warranties and events of default. We were in compliance with all covenants as of December 31, 2021.
In addition to the revolving credit facility, we maintain lines of credit in various currencies with domestic and international commercial banks. As of December 31, 2021, we had available capacity of $164 million under these lines of credit.
Furthermore, we have a current shelf registration statement filed with the SEC that allows for the issuance of an indeterminate amount of debt securities. Proceeds from the debt issuances and any other offerings under the current registration statement may be used for general corporate requirements, including reducing existing borrowings,
The Hershey Company | 2021 Form 10-K | Page 36
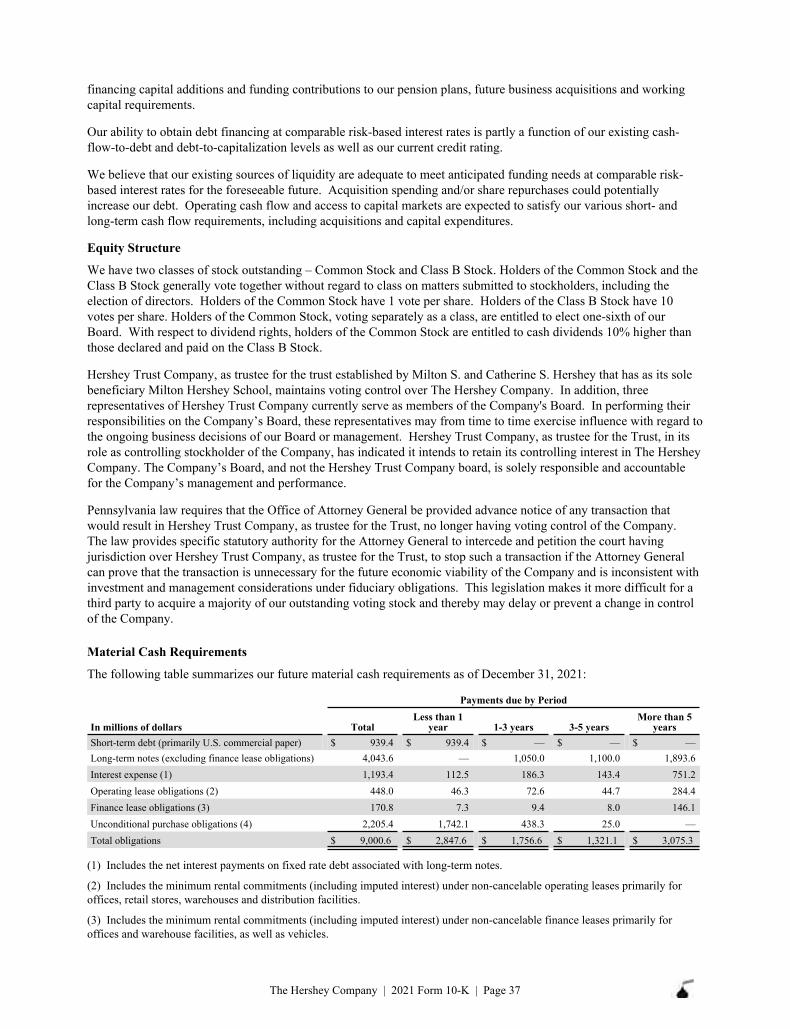
financing capital additions and funding contributions to our pension plans, future business acquisitions and working capital requirements.
Our ability to obtain debt financing at comparable risk-based interest rates is partly a function of our existing cash-flow-to-debt and debt-to-capitalization levels as well as our current credit rating.
We believe that our existing sources of liquidity are adequate to meet anticipated funding needs at comparable risk-based interest rates for the foreseeable future. Acquisition spending and/or share repurchases could potentially increase our debt. Operating cash flow and access to capital markets are expected to satisfy our various short- and long-term cash flow requirements, including acquisitions and capital expenditures.
Equity Structure
We have two classes of stock outstanding – Common Stock and Class B Stock. Holders of the Common Stock and the Class B Stock generally vote together without regard to class on matters submitted to stockholders, including the election of directors. Holders of the Common Stock have 1 vote per share. Holders of the Class B Stock have 10 votes per share. Holders of the Common Stock, voting separately as a class, are entitled to elect one-sixth of our Board. With respect to dividend rights, holders of the Common Stock are entitled to cash dividends 10% higher than those declared and paid on the Class B Stock.
Hershey Trust Company, as trustee for the trust established by Milton S. and Catherine S. Hershey that has as its sole beneficiary Milton Hershey School, maintains voting control over The Hershey Company. In addition, three representatives of Hershey Trust Company currently serve as members of the Company's Board. In performing their responsibilities on the Company’s Board, these representatives may from time to time exercise influence with regard to the ongoing business decisions of our Board or management. Hershey Trust Company, as trustee for the Trust, in its role as controlling stockholder of the Company, has indicated it intends to retain its controlling interest in The Hershey Company. The Company’s Board, and not the Hershey Trust Company board, is solely responsible and accountable for the Company’s management and performance.
Pennsylvania law requires that the Office of Attorney General be provided advance notice of any transaction that would result in Hershey Trust Company, as trustee for the Trust, no longer having voting control of the Company. The law provides specific statutory authority for the Attorney General to intercede and petition the court having jurisdiction over Hershey Trust Company, as trustee for the Trust, to stop such a transaction if the Attorney General can prove that the transaction is unnecessary for the future economic viability of the Company and is inconsistent with investment and management considerations under fiduciary obligations. This legislation makes it more difficult for a third party to acquire a majority of our outstanding voting stock and thereby may delay or prevent a change in control of the Company.
Material Cash Requirements
The following table summarizes our future material cash requirements as of December 31, 2021:
In millions of dollars TotalLess than 1
year 1-3 years 3-5 yearsMore than 5
yearsShort-term debt (primarily U.S. commercial paper) $ 939.4 $ 939.4 $ — $ — $ — Long-term notes (excluding finance lease obligations) 4,043.6 — 1,050.0 1,100.0 1,893.6 Interest expense (1) 1,193.4 112.5 186.3 143.4 751.2 Operating lease obligations (2) 448.0 46.3 72.6 44.7 284.4 Finance lease obligations (3) 170.8 7.3 9.4 8.0 146.1 Unconditional purchase obligations (4) 2,205.4 1,742.1 438.3 25.0 — Total obligations $ 9,000.6 $ 2,847.6 $ 1,756.6 $ 1,321.1 $ 3,075.3
Payments due by Period
(1) Includes the net interest payments on fixed rate debt associated with long-term notes.
(2) Includes the minimum rental commitments (including imputed interest) under non-cancelable operating leases primarily foroffices, retail stores, warehouses and distribution facilities.
(3) Includes the minimum rental commitments (including imputed interest) under non-cancelable finance leases primarily foroffices and warehouse facilities, as well as vehicles.
The Hershey Company | 2021 Form 10-K | Page 37
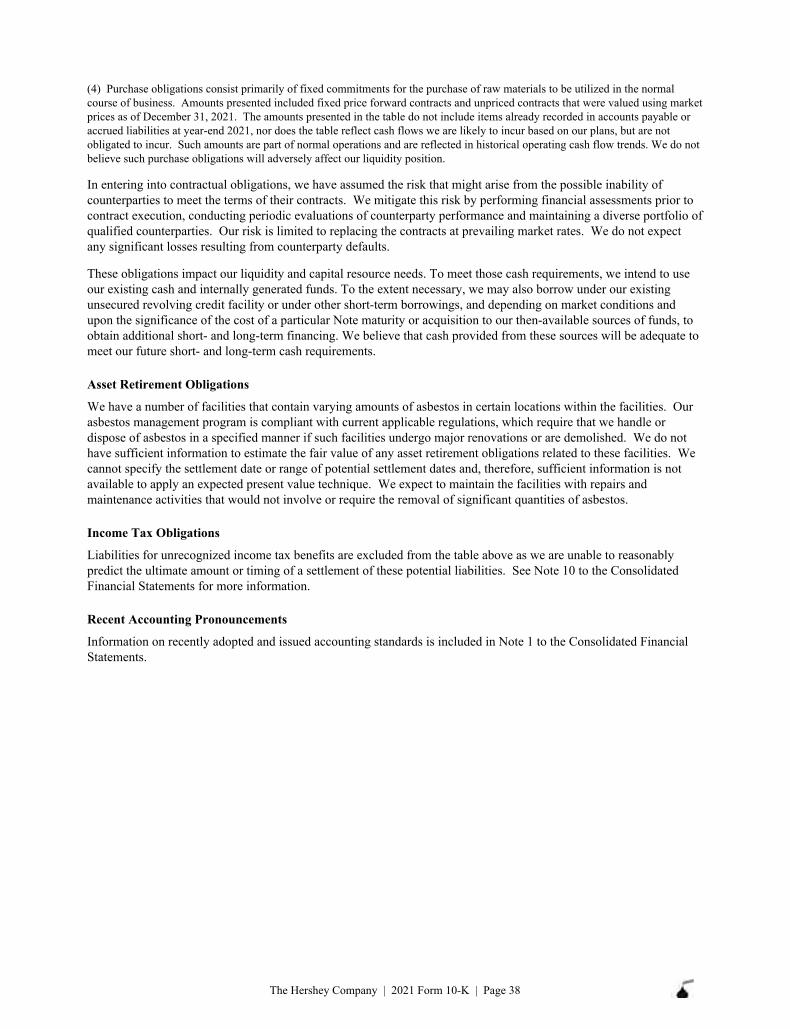
(4) Purchase obligations consist primarily of fixed commitments for the purchase of raw materials to be utilized in the normalcourse of business. Amounts presented included fixed price forward contracts and unpriced contracts that were valued using marketprices as of December 31, 2021. The amounts presented in the table do not include items already recorded in accounts payable oraccrued liabilities at year-end 2021, nor does the table reflect cash flows we are likely to incur based on our plans, but are notobligated to incur. Such amounts are part of normal operations and are reflected in historical operating cash flow trends. We do notbelieve such purchase obligations will adversely affect our liquidity position.
In entering into contractual obligations, we have assumed the risk that might arise from the possible inability of counterparties to meet the terms of their contracts. We mitigate this risk by performing financial assessments prior to contract execution, conducting periodic evaluations of counterparty performance and maintaining a diverse portfolio of qualified counterparties. Our risk is limited to replacing the contracts at prevailing market rates. We do not expect any significant losses resulting from counterparty defaults.
These obligations impact our liquidity and capital resource needs. To meet those cash requirements, we intend to use our existing cash and internally generated funds. To the extent necessary, we may also borrow under our existing unsecured revolving credit facility or under other short-term borrowings, and depending on market conditions and upon the significance of the cost of a particular Note maturity or acquisition to our then-available sources of funds, to obtain additional short- and long-term financing. We believe that cash provided from these sources will be adequate to meet our future short- and long-term cash requirements.
Asset Retirement Obligations
We have a number of facilities that contain varying amounts of asbestos in certain locations within the facilities. Our asbestos management program is compliant with current applicable regulations, which require that we handle or dispose of asbestos in a specified manner if such facilities undergo major renovations or are demolished. We do not have sufficient information to estimate the fair value of any asset retirement obligations related to these facilities. We cannot specify the settlement date or range of potential settlement dates and, therefore, sufficient information is not available to apply an expected present value technique. We expect to maintain the facilities with repairs and maintenance activities that would not involve or require the removal of significant quantities of asbestos.
Income Tax Obligations
Liabilities for unrecognized income tax benefits are excluded from the table above as we are unable to reasonably predict the ultimate amount or timing of a settlement of these potential liabilities. See Note 10 to the Consolidated Financial Statements for more information.
Recent Accounting Pronouncements
Information on recently adopted and issued accounting standards is included in Note 1 to the Consolidated Financial Statements.
The Hershey Company | 2021 Form 10-K | Page 38
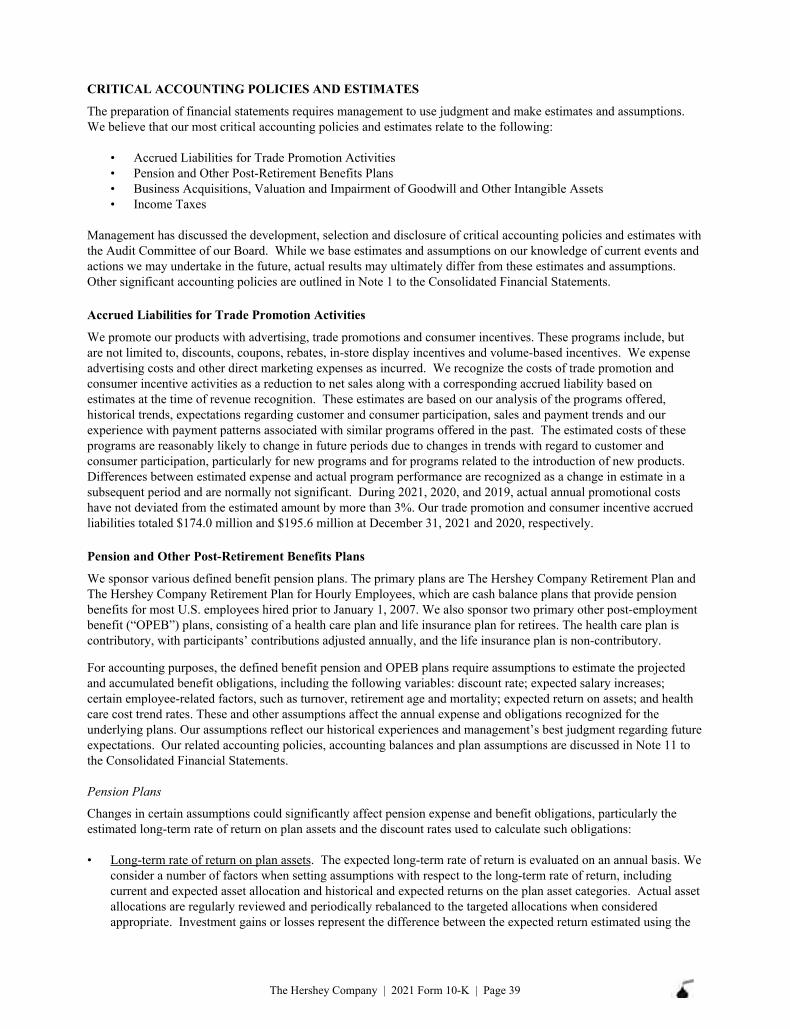
CRITICAL ACCOUNTING POLICIES AND ESTIMATES
The preparation of financial statements requires management to use judgment and make estimates and assumptions. We believe that our most critical accounting policies and estimates relate to the following:
• Accrued Liabilities for Trade Promotion Activities• Pension and Other Post-Retirement Benefits Plans• Business Acquisitions, Valuation and Impairment of Goodwill and Other Intangible Assets• Income Taxes
Management has discussed the development, selection and disclosure of critical accounting policies and estimates with the Audit Committee of our Board. While we base estimates and assumptions on our knowledge of current events and actions we may undertake in the future, actual results may ultimately differ from these estimates and assumptions. Other significant accounting policies are outlined in Note 1 to the Consolidated Financial Statements.
Accrued Liabilities for Trade Promotion Activities
We promote our products with advertising, trade promotions and consumer incentives. These programs include, but are not limited to, discounts, coupons, rebates, in-store display incentives and volume-based incentives. We expense advertising costs and other direct marketing expenses as incurred. We recognize the costs of trade promotion and consumer incentive activities as a reduction to net sales along with a corresponding accrued liability based on estimates at the time of revenue recognition. These estimates are based on our analysis of the programs offered, historical trends, expectations regarding customer and consumer participation, sales and payment trends and our experience with payment patterns associated with similar programs offered in the past. The estimated costs of these programs are reasonably likely to change in future periods due to changes in trends with regard to customer and consumer participation, particularly for new programs and for programs related to the introduction of new products. Differences between estimated expense and actual program performance are recognized as a change in estimate in a subsequent period and are normally not significant. During 2021, 2020, and 2019, actual annual promotional costs have not deviated from the estimated amount by more than 3%. Our trade promotion and consumer incentive accrued liabilities totaled $174.0 million and $195.6 million at December 31, 2021 and 2020, respectively.
Pension and Other Post-Retirement Benefits Plans
We sponsor various defined benefit pension plans. The primary plans are The Hershey Company Retirement Plan and The Hershey Company Retirement Plan for Hourly Employees, which are cash balance plans that provide pension benefits for most U.S. employees hired prior to January 1, 2007. We also sponsor two primary other post-employment benefit (“OPEB”) plans, consisting of a health care plan and life insurance plan for retirees. The health care plan is contributory, with participants’ contributions adjusted annually, and the life insurance plan is non-contributory.
For accounting purposes, the defined benefit pension and OPEB plans require assumptions to estimate the projected and accumulated benefit obligations, including the following variables: discount rate; expected salary increases; certain employee-related factors, such as turnover, retirement age and mortality; expected return on assets; and health care cost trend rates. These and other assumptions affect the annual expense and obligations recognized for the underlying plans. Our assumptions reflect our historical experiences and management’s best judgment regarding future expectations. Our related accounting policies, accounting balances and plan assumptions are discussed in Note 11 to the Consolidated Financial Statements.
Pension Plans
Changes in certain assumptions could significantly affect pension expense and benefit obligations, particularly the estimated long-term rate of return on plan assets and the discount rates used to calculate such obligations:
• Long-term rate of return on plan assets. The expected long-term rate of return is evaluated on an annual basis. Weconsider a number of factors when setting assumptions with respect to the long-term rate of return, includingcurrent and expected asset allocation and historical and expected returns on the plan asset categories. Actual assetallocations are regularly reviewed and periodically rebalanced to the targeted allocations when consideredappropriate. Investment gains or losses represent the difference between the expected return estimated using the
The Hershey Company | 2021 Form 10-K | Page 39
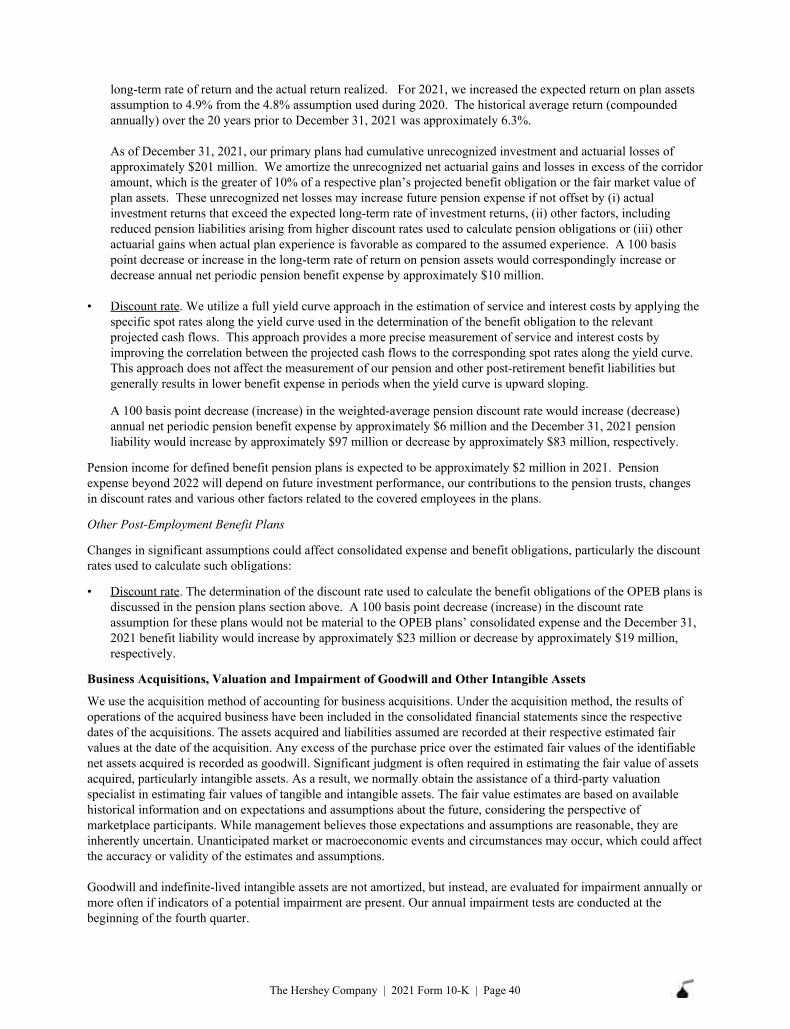
long-term rate of return and the actual return realized. For 2021, we increased the expected return on plan assets assumption to 4.9% from the 4.8% assumption used during 2020. The historical average return (compounded annually) over the 20 years prior to December 31, 2021 was approximately 6.3%.
As of December 31, 2021, our primary plans had cumulative unrecognized investment and actuarial losses of approximately $201 million. We amortize the unrecognized net actuarial gains and losses in excess of the corridor amount, which is the greater of 10% of a respective plan’s projected benefit obligation or the fair market value of plan assets. These unrecognized net losses may increase future pension expense if not offset by (i) actual investment returns that exceed the expected long-term rate of investment returns, (ii) other factors, including reduced pension liabilities arising from higher discount rates used to calculate pension obligations or (iii) other actuarial gains when actual plan experience is favorable as compared to the assumed experience. A 100 basis point decrease or increase in the long-term rate of return on pension assets would correspondingly increase or decrease annual net periodic pension benefit expense by approximately $10 million.
• Discount rate. We utilize a full yield curve approach in the estimation of service and interest costs by applying thespecific spot rates along the yield curve used in the determination of the benefit obligation to the relevantprojected cash flows. This approach provides a more precise measurement of service and interest costs byimproving the correlation between the projected cash flows to the corresponding spot rates along the yield curve.This approach does not affect the measurement of our pension and other post-retirement benefit liabilities butgenerally results in lower benefit expense in periods when the yield curve is upward sloping.
A 100 basis point decrease (increase) in the weighted-average pension discount rate would increase (decrease)annual net periodic pension benefit expense by approximately $6 million and the December 31, 2021 pensionliability would increase by approximately $97 million or decrease by approximately $83 million, respectively.
Pension income for defined benefit pension plans is expected to be approximately $2 million in 2021. Pension expense beyond 2022 will depend on future investment performance, our contributions to the pension trusts, changes in discount rates and various other factors related to the covered employees in the plans.
Other Post-Employment Benefit Plans
Changes in significant assumptions could affect consolidated expense and benefit obligations, particularly the discount rates used to calculate such obligations:
• Discount rate. The determination of the discount rate used to calculate the benefit obligations of the OPEB plans isdiscussed in the pension plans section above. A 100 basis point decrease (increase) in the discount rateassumption for these plans would not be material to the OPEB plans’ consolidated expense and the December 31,2021 benefit liability would increase by approximately $23 million or decrease by approximately $19 million,respectively.
Business Acquisitions, Valuation and Impairment of Goodwill and Other Intangible Assets
We use the acquisition method of accounting for business acquisitions. Under the acquisition method, the results of operations of the acquired business have been included in the consolidated financial statements since the respective dates of the acquisitions. The assets acquired and liabilities assumed are recorded at their respective estimated fair values at the date of the acquisition. Any excess of the purchase price over the estimated fair values of the identifiable net assets acquired is recorded as goodwill. Significant judgment is often required in estimating the fair value of assets acquired, particularly intangible assets. As a result, we normally obtain the assistance of a third-party valuation specialist in estimating fair values of tangible and intangible assets. The fair value estimates are based on available historical information and on expectations and assumptions about the future, considering the perspective of marketplace participants. While management believes those expectations and assumptions are reasonable, they are inherently uncertain. Unanticipated market or macroeconomic events and circumstances may occur, which could affect the accuracy or validity of the estimates and assumptions.
Goodwill and indefinite-lived intangible assets are not amortized, but instead, are evaluated for impairment annually or more often if indicators of a potential impairment are present. Our annual impairment tests are conducted at the beginning of the fourth quarter.
The Hershey Company | 2021 Form 10-K | Page 40
We test goodwill for impairment by performing either a qualitative or quantitative assessment. If we choose to perform a qualitative assessment, we evaluate economic, industry and company-specific factors in assessing the fair value of the related reporting unit. If we determine that it is more likely than not that the fair value of the reporting unit is less than its carrying value, a quantitative test is then performed. Otherwise, no further testing is required. For those reporting units tested using a quantitative approach, we compare the fair value of each reporting unit with the carrying amount of the reporting unit, including goodwill. If the estimated fair value of the reporting unit is less than the carrying amount of the reporting unit, impairment is indicated, requiring recognition of a goodwill impairment charge for the differential (up to the carrying value of goodwill). We test individual indefinite-lived intangible assets by comparing the estimated fair values with the book values of each asset.
We determine the fair value of our reporting units and indefinite-lived intangible assets using an income approach. Under the income approach, we calculate the fair value of our reporting units and indefinite-lived intangible assets based on the present value of estimated future cash flows. Considerable management judgment is necessary to evaluate the impact of operating and macroeconomic changes and to estimate the future cash flows used to measure fair value. Our estimates of future cash flows consider past performance, current and anticipated market conditions and internal projections and operating plans which incorporate estimates for sales growth and profitability, and cash flows associated with taxes and capital spending. Additional assumptions include forecasted growth rates, estimated discount rates, which may be risk-adjusted for the operating market of the reporting unit, and estimated royalty rates that would be charged for comparable branded licenses. We believe such assumptions also reflect current and anticipated market conditions and are consistent with those that would be used by other marketplace participants for similar valuation purposes. Such assumptions are subject to change due to changing economic and competitive conditions.
We also have intangible assets, consisting primarily of certain trademarks, customer-related intangible assets and patents obtained through business acquisitions, that are expected to have determinable useful lives. The costs of finite-lived intangible assets are amortized to expense over their estimated lives. Our estimates of the useful lives of finite-lived intangible assets consider judgments regarding the future effects of obsolescence, demand, competition and other economic factors. We conduct impairment tests when events or changes in circumstances indicate that the carrying value of these finite-lived assets may not be recoverable. Undiscounted cash flow analyses are used to determine if an impairment exists. If an impairment is determined to exist, the loss is calculated based on the estimated fair value of the assets.
Results of Impairment Tests
At December 31, 2021, the net book value of our goodwill totaled $2,633.2 million. As it relates to our 2021 annual testing performed at the beginning of the fourth quarter, we tested all of our reporting units using a qualitative assessment and determined that no quantitative testing was deemed necessary. Based on our testing, all of our reporting units had an excess fair value well over the their respective carrying values. There were no other events or circumstances that would indicate that impairment may exist. We had no goodwill impairment charges in 2021, 2020 or 2019.
In 2019, sales and operating performance associated with our Krave business were below expectations. In the fourth quarter of 2019, as part of a strategic review initiated by our leadership team, we updated our strategic forecast which projected underperformance related to the Krave business primarily due to mainstream brands driving category volume and an increase in the overall competitive landscape. We deemed this to be a triggering event requiring us to test our Krave long-lived asset group for impairment. Based on our assessment, we determined that the carrying value was not recoverable and calculated an impairment loss as the excess of the asset group’s carrying value over its fair value. Therefore, as a result of this testing, during the fourth quarter of 2019, we recorded an impairment charge totaling $100.1 million to write down the long-lived asset group, which predominantly consisted of customer relationship and trademark intangible assets.
The Hershey Company | 2021 Form 10-K | Page 41
Income Taxes
We base our deferred income taxes, accrued income taxes and provision for income taxes upon income, statutory tax rates, the legal structure of our Company, interpretation of tax laws and tax planning opportunities available to us in the various jurisdictions in which we operate. We file income tax returns in the U.S. federal jurisdiction and various state and foreign jurisdictions. We are regularly audited by federal, state and foreign tax authorities; a number of years may elapse before an uncertain tax position, for which we have unrecognized tax benefits, is audited and finally resolved. From time to time, these audits result in assessments of additional tax. We maintain reserves for such assessments.
We apply a more-likely-than-not threshold to the recognition and derecognition of uncertain tax positions. Accordingly, we recognize the amount of tax benefit that has a greater than 50% likelihood of being ultimately realized upon settlement. Future changes in judgments and estimates related to the expected ultimate resolution of uncertain tax positions will affect income in the quarter of such change. While it is often difficult to predict the final outcome or the timing of resolution of any particular uncertain tax position, we believe that our unrecognized tax benefits reflect the most likely outcome. Accrued interest and penalties related to unrecognized tax benefits are included in income tax expense. We adjust these unrecognized tax benefits, as well as the related interest, in light of changing facts and circumstances, such as receiving audit assessments or clearing of an item for which a reserve has been established. Settlement of any particular position could require the use of cash. Favorable resolution would be recognized as a reduction to our effective income tax rate in the period of resolution.
We believe it is more likely than not that the results of future operations will generate sufficient taxable income to realize the deferred tax assets, net of valuation allowances. Our valuation allowances are primarily related to U.S. capital loss carryforwards and various foreign jurisdictions’ net operating loss carryforwards and other deferred tax assets for which we do not expect to realize a benefit.
The Hershey Company | 2021 Form 10-K | Page 42
Item 7A. QUANTITATIVE AND QUALITATIVE DISCLOSURES ABOUT MARKET RISK
We use certain derivative instruments to manage our interest rate, foreign currency exchange rate and commodity price risks. We monitor and manage these exposures as part of our overall risk management program.
We enter into interest rate swap agreements and foreign currency forward exchange contracts for periods consistent with related underlying exposures. We enter into commodities futures and options contracts and other derivative instruments for varying periods. These commodity derivative instruments are intended to be, and are effective as, economic hedges of market price risks associated with anticipated raw material purchases, energy requirements and transportation costs. We do not hold or issue derivative instruments for trading purposes and are not a party to any instruments with leverage or prepayment features.
In entering into these contracts, we have assumed the risk that might arise from the possible inability of counterparties to meet the terms of their contracts. We mitigate this risk by entering into exchange-traded contracts with collateral posting requirements and/or by performing financial assessments prior to contract execution, conducting periodic evaluations of counterparty performance and maintaining a diverse portfolio of qualified counterparties. We do not expect any significant losses from counterparty defaults.
Refer to Note 1 and Note 5 to the Consolidated Financial Statements for further discussion of these derivative instruments and our hedging policies.
Interest Rate Risk
In December 2020, our fixed-to-floating interest rate swap matured in connection with the repayment of certain long-term debt upon its maturity. Therefore, as of December 31, 2021 and December 31, 2020, we had no interest rate swap derivative instruments in a fair value hedging relationship. Prior to maturing in December 2020, the total notional amount of interest rate swaps was $350 million. The notional amount relates to fixed-to-floating interest rate swaps which convert a comparable amount of fixed-rate debt to variable rate debt. A hypothetical 100 basis point increase in interest rates applied to this variable-rate debt through its December 2020 maturity would have increased interest expense by approximately $3.2 million for 2020.
In addition, the total amount of short-term debt, net of cash, amounted to net debt of $610 million and net cash of $1.1 billion, respectively, at December 31, 2021 and 2020. A hypothetical 100 basis point increase in interest rates applied to this variable-rate short-term debt as of December 31, 2021 would have changed interest expense by approximately $2.4 million for 2021 and $8.6 million for 2020.
We consider our current risk related to market fluctuations in interest rates on our remaining debt portfolio, excluding fixed-rate debt converted to variable rates with fixed-to-floating instruments, to be minimal since this debt is largely long-term and fixed-rate in nature. Generally, the fair market value of fixed-rate debt will increase as interest rates fall and decrease as interest rates rise. A 100 basis point increase in market interest rates would decrease the fair value of our fixed-rate long-term debt at December 31, 2021 and December 31, 2020 by approximately $319 million and $357 million, respectively. However, since we currently have no plans to repurchase our outstanding fixed-rate instruments before their maturities, the impact of market interest rate fluctuations on our long-term debt does not affect our results of operations or financial position.
The Hershey Company | 2021 Form 10-K | Page 43
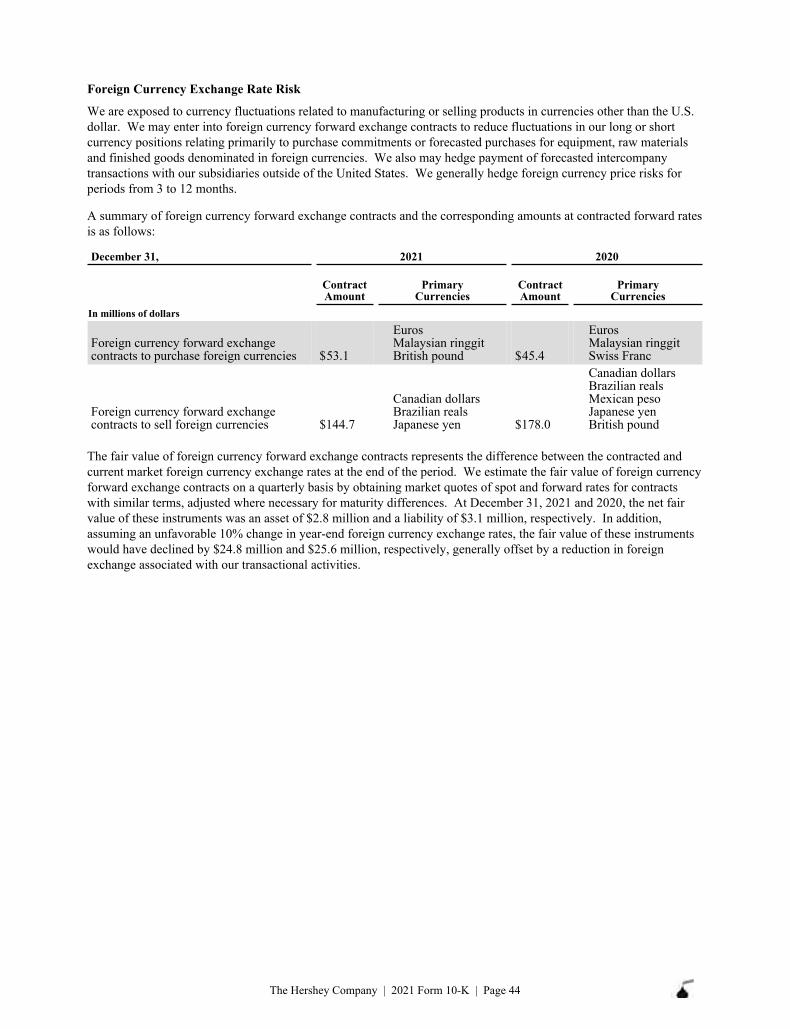
Foreign Currency Exchange Rate Risk
We are exposed to currency fluctuations related to manufacturing or selling products in currencies other than the U.S. dollar. We may enter into foreign currency forward exchange contracts to reduce fluctuations in our long or short currency positions relating primarily to purchase commitments or forecasted purchases for equipment, raw materials and finished goods denominated in foreign currencies. We also may hedge payment of forecasted intercompany transactions with our subsidiaries outside of the United States. We generally hedge foreign currency price risks for periods from 3 to 12 months.
A summary of foreign currency forward exchange contracts and the corresponding amounts at contracted forward rates is as follows:
ContractAmount
PrimaryCurrencies
ContractAmount
PrimaryCurrencies
In millions of dollars
Foreign currency forward exchange contracts to purchase foreign currencies $ 53.1
EurosMalaysian ringgitBritish pound $ 45.4
EurosMalaysian ringgitSwiss Franc
Foreign currency forward exchange contracts to sell foreign currencies $ 144.7
Canadian dollarsBrazilian realsJapanese yen $ 178.0
Canadian dollarsBrazilian realsMexican pesoJapanese yenBritish pound
December 31, 2021 2020
The fair value of foreign currency forward exchange contracts represents the difference between the contracted and current market foreign currency exchange rates at the end of the period. We estimate the fair value of foreign currency forward exchange contracts on a quarterly basis by obtaining market quotes of spot and forward rates for contracts with similar terms, adjusted where necessary for maturity differences. At December 31, 2021 and 2020, the net fair value of these instruments was an asset of $2.8 million and a liability of $3.1 million, respectively. In addition, assuming an unfavorable 10% change in year-end foreign currency exchange rates, the fair value of these instruments would have declined by $24.8 million and $25.6 million, respectively, generally offset by a reduction in foreign exchange associated with our transactional activities.
The Hershey Company | 2021 Form 10-K | Page 44
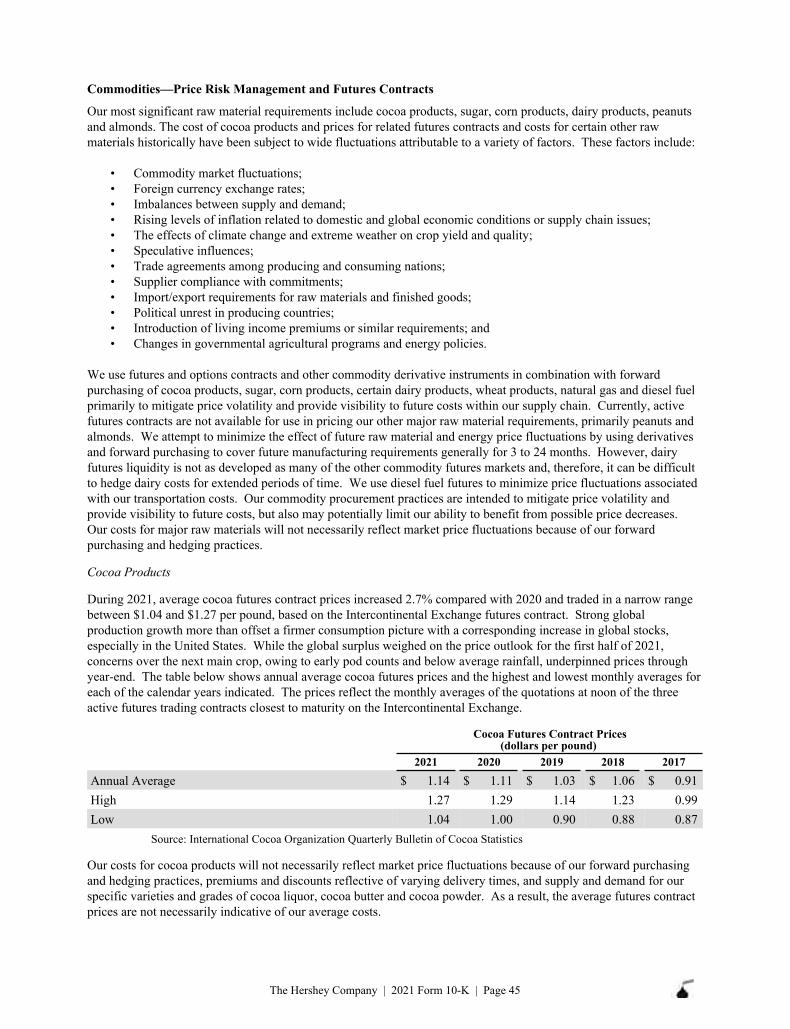
Commodities—Price Risk Management and Futures Contracts
Our most significant raw material requirements include cocoa products, sugar, corn products, dairy products, peanuts and almonds. The cost of cocoa products and prices for related futures contracts and costs for certain other raw materials historically have been subject to wide fluctuations attributable to a variety of factors. These factors include:
• Commodity market fluctuations;• Foreign currency exchange rates;• Imbalances between supply and demand;• Rising levels of inflation related to domestic and global economic conditions or supply chain issues;• The effects of climate change and extreme weather on crop yield and quality;• Speculative influences;• Trade agreements among producing and consuming nations;• Supplier compliance with commitments;• Import/export requirements for raw materials and finished goods;• Political unrest in producing countries;• Introduction of living income premiums or similar requirements; and• Changes in governmental agricultural programs and energy policies.
We use futures and options contracts and other commodity derivative instruments in combination with forward purchasing of cocoa products, sugar, corn products, certain dairy products, wheat products, natural gas and diesel fuel primarily to mitigate price volatility and provide visibility to future costs within our supply chain. Currently, active futures contracts are not available for use in pricing our other major raw material requirements, primarily peanuts and almonds. We attempt to minimize the effect of future raw material and energy price fluctuations by using derivatives and forward purchasing to cover future manufacturing requirements generally for 3 to 24 months. However, dairy futures liquidity is not as developed as many of the other commodity futures markets and, therefore, it can be difficult to hedge dairy costs for extended periods of time. We use diesel fuel futures to minimize price fluctuations associated with our transportation costs. Our commodity procurement practices are intended to mitigate price volatility and provide visibility to future costs, but also may potentially limit our ability to benefit from possible price decreases. Our costs for major raw materials will not necessarily reflect market price fluctuations because of our forward purchasing and hedging practices.
Cocoa Products
During 2021, average cocoa futures contract prices increased 2.7% compared with 2020 and traded in a narrow range between $1.04 and $1.27 per pound, based on the Intercontinental Exchange futures contract. Strong global production growth more than offset a firmer consumption picture with a corresponding increase in global stocks, especially in the United States. While the global surplus weighed on the price outlook for the first half of 2021, concerns over the next main crop, owing to early pod counts and below average rainfall, underpinned prices through year-end. The table below shows annual average cocoa futures prices and the highest and lowest monthly averages for each of the calendar years indicated. The prices reflect the monthly averages of the quotations at noon of the three active futures trading contracts closest to maturity on the Intercontinental Exchange.
Cocoa Futures Contract Prices(dollars per pound)
2021 2020 2019 2018 2017Annual Average $ 1.14 $ 1.11 $ 1.03 $ 1.06 $ 0.91 High 1.27 1.29 1.14 1.23 0.99 Low 1.04 1.00 0.90 0.88 0.87
Source: International Cocoa Organization Quarterly Bulletin of Cocoa Statistics
Our costs for cocoa products will not necessarily reflect market price fluctuations because of our forward purchasing and hedging practices, premiums and discounts reflective of varying delivery times, and supply and demand for our specific varieties and grades of cocoa liquor, cocoa butter and cocoa powder. As a result, the average futures contract prices are not necessarily indicative of our average costs.
The Hershey Company | 2021 Form 10-K | Page 45
Sugar
The price of sugar is subject to price supports under U.S. farm legislation. Such legislation establishes import quotas and duties to support the price of sugar. As a result, sugar prices paid by users in the U.S. are currently higher than prices on the world sugar market. The U.S. delivered east coast refined sugar prices traded in a range from $0.45 to $0.58 per pound during 2021. Prices were historically high throughout 2021 due to lack of imports by the U.S. government resulting in an extremely tight domestic raw sugar market.
Corn Products
We use corn futures to price our corn sweetener product requirements. A strong rebound in ethanol production, along with continued strong exports, drove prices higher in 2021. Corn prices traded in a range from $4.84 to $7.32 per bushel during 2021.
Dairy Products
During 2021 prices for fluid dairy milk ranged from a low of $13.19 per pound to a high of $19.88 per pound, on a Class IV milk basis. Fluid dairy milk prices were higher than 2020, driven by declines in U.S. milk production and higher dairy demand.
Wheat Products
In 2021 we began utilizing soft and hard wheat futures as a risk management tool for our flour purchasing. Poor U.S. weather impacted production and resulted in lower stocks and higher prices compared to 2020. Hard wheat prices traded in the range of $5.62 to $8.84 per bushel during 2021, while soft wheat prices traded in the range of $5.99 to $8.67 per bushel during 2021.
Peanuts and Almonds
Peanut prices in the U.S. ranged from a low of $0.53 per pound to a high of $0.55 per pound during 2021. Prices rose this year due strong demand and tight supply. Almond prices began the year at $2.03 per pound and closed the year at $2.85 per pound during 2021. Persistent drought and concerns over the 2021 almond crop size drove price volatility.
Changes in the Value of Futures Contracts
We make or receive cash transfers to or from commodity futures brokers on a daily basis reflecting changes in the value of futures contracts on the Intercontinental Exchange or various other exchanges. These changes in value represent unrealized gains and losses. The cash transfers offset higher or lower cash requirements for the payment of future invoice prices of raw materials, energy requirements and transportation costs.
Commodity Sensitivity Analysis
Our open commodity derivative contracts had a notional value of $313.2 million as of December 31, 2021 and $279.8 million as of December 31, 2020. At the end of 2021, the potential change in fair value of commodity derivative instruments, assuming a 10% decrease in the underlying commodity price, would have increased our net unrealized losses in 2021 by $34.8 million, generally offset by a reduction in the cost of the underlying commodity purchases.
The Hershey Company | 2021 Form 10-K | Page 46
Item 8. FINANCIAL STATEMENTS AND SUPPLEMENTARY DATA
INDEX TO CONSOLIDATED FINANCIAL STATEMENTS
Report of Independent Registered Public Accounting Firm on Internal Control Over Financial Reporting 51Consolidated Statements of Income for the years ended December 31, 2021, 2020 and 2019 53Consolidated Statements of Comprehensive Income for the years ended December 31, 2021, 2020 and 2019 54Consolidated Balance Sheets as of December 31, 2021 and 2020 55Consolidated Statements of Cash Flows for the years ended December 31, 2021, 2020 and 2019 56Consolidated Statements of Stockholders’ Equity for the years ended December 31, 2021, 2020 and 2019 57Notes to Consolidated Financial Statements 58
Note 1 - Summary of Significant Accounting Policies 58Note 2 - Business Acquisitions and Divestitures 64Note 3 - Goodwill and Intangible Assets 68Note 4 - Short and Long-Term Debt 69Note 5 - Derivative Instruments 71Note 6 - Fair Value Measurements 73Note 7 - Leases 76Note 8 - Investments in Unconsolidated Affiliates 78Note 9 - Business Realignment Activities 78Note 10 - Income Taxes 80Note 11 - Pension and Other Post-Retirement Benefit Plans 83Note 12 - Stock Compensation Plans 89Note 13 - Segment Information 92Note 14 - Equity and Noncontrolling Interest 94Note 15 - Commitments and Contingencies 96Note 16 - Earnings Per Share 97Note 17 - Other (Income) Expense, Net 99Note 18 - Supplemental Balance Sheet Information 100
Report of Independent Registered Public Accounting Firm (PCAOB ID: 42) 48
The Hershey Company | 2021 Form 10-K | Page 47
REPORT OF INDEPENDENT REGISTERED PUBLIC ACCOUNTING FIRM
To the Stockholders and the Board of Directors of The Hershey Company
Opinion on the Financial Statements
We have audited the accompanying consolidated balance sheets of The Hershey Company (the Company) as of December 31, 2021 and 2020, the related consolidated statements of income, comprehensive income, cash flows, and stockholders’ equity for each of the three years in the period ended December 31, 2021, and the related notes and financial statement schedule listed in the Index at Item 15(a)(2) (collectively referred to as the “consolidated financial statements”). In our opinion, the consolidated financial statements present fairly, in all material respects, the financial position of the Company at December 31, 2021 and 2020, and the results of its operations and its cash flows for each of the three years in the period ended December 31, 2021, in conformity with U.S. generally accepted accounting principles.
We also have audited, in accordance with the standards of the Public Company Accounting Oversight Board (United States) (PCAOB), the Company’s internal control over financial reporting as of December 31, 2021, based on criteria established in Internal Control-Integrated Framework issued by the Committee of Sponsoring Organizations of the Treadway Commission (2013 framework), and our report dated February 18, 2022 expressed an unqualified opinion thereon.
Basis for Opinion
These financial statements are the responsibility of the Company’s management. Our responsibility is to express an opinion on the Company’s financial statements based on our audits. We are a public accounting firm registered with the PCAOB and are required to be independent with respect to the Company in accordance with the U.S. federal securities laws and the applicable rules and regulations of the Securities and Exchange Commission and the PCAOB.
We conducted our audits in accordance with the standards of the PCAOB. Those standards require that we plan and perform the audit to obtain reasonable assurance about whether the financial statements are free of material misstatement, whether due to error or fraud. Our audits included performing procedures to assess the risks of material misstatement of the financial statements, whether due to error or fraud, and performing procedures that respond to those risks. Such procedures included examining, on a test basis, evidence regarding the amounts and disclosures in the financial statements. Our audits also included evaluating the accounting principles used and significant estimates made by management, as well as evaluating the overall presentation of the financial statements. We believe that our audits provide a reasonable basis for our opinion.
Critical Audit Matters
The critical audit matters communicated below are matters arising from the current period audit of the financial statements that were communicated or required to be communicated to the audit committee and that: (1) relate to accounts or disclosures that are material to the financial statements and (2) involved our especially challenging, subjective or complex judgments. The communication of critical audit matters does not alter in any way our opinion on the consolidated financial statements, taken as a whole, and we are not, by communicating the critical audit matters below, providing separate opinions on the critical audit matters or on the accounts or disclosures to which they relate.
The Hershey Company | 2021 Form 10-K | Page 48
Valuation of Accrued Liabilities for Trade Promotion Activities
Description of the Matter
The unsettled portion of the Company’s obligation for trade promotion activities at December 31, 2021 was $174.0 million. As discussed in Note 1 of the consolidated financial statements, the Company promotes its products through programs such as, but not limited to, discounts, coupons, rebates, in-store display incentives, and volume-based incentives. The Company recognizes the estimated costs of these trade promotion activities as a component of variable consideration when determining the transaction price. The unsettled portion of the Company’s obligation for trade promotion activities is included in accrued liabilities in the consolidated balance sheet.
Auditing management’s calculation of the unsettled portion of the Company’s obligation for trade promotion activities was highly subjective and required significant judgment as a result of the nature of the required estimates and assumptions. In particular, the estimates required an analysis of the programs offered, expectations regarding customer and consumer participation, historical sales and payment trends, and experience with payment patterns associated with similar programs offered in the past. The estimated cost of these programs is sensitive to changes in trends with regard to customer and consumer participation, particularly for new programs and for programs related to the introduction of new products.
How We Addressed the Matter in Our Audit
We obtained an understanding, evaluated the design, and tested the operating effectiveness of the controls related to the Company’s calculation of the accrued liabilities for trade promotion activities. For example, we tested controls over management’s review of the completeness of the promotional activities as well as the significant assumptions and the data inputs utilized in the calculations.
To test the unsettled portion of the Company’s obligation for trade promotion activities, we performed audit procedures that included, among others, assessing (1) the expected value estimation methodology used by management, (2) whether all material trade promotion activities were properly included in management’s estimate, and (3) the significant assumptions discussed above and the underlying data used in its analyses. Specifically, when evaluating the significant assumptions, we compared them to historical trends, third party data, and assumptions used in prior periods, and inspected management’s retrospective review of actual trade promotion activities compared to previous estimates. We also performed sensitivity analyses of significant assumptions to evaluate the changes in the estimate that would result from changes in the assumptions.
The Hershey Company | 2021 Form 10-K | Page 49

Valuation of Identifiable Intangible Assets in Business Acquisitions
Description of the Matter
As discussed in Note 2 of the consolidated financial statements, the Company completed the acquisitions of Lily’s Sweets, LLC on June 25, 2021 for net consideration of $427.2 million, Dot’s Pretzels, LLC on December 13, 2021 for net consideration of $894.2 million, and Pretzels Inc. on December 14, 2021 for net consideration of $304.5 million in transactions that were accounted for as business combinations (collectively, “the Business Acquisitions”).
Auditing the Company’s accounting for the Business Acquisitions was complex due to the significant estimation uncertainty in the Company’s determination of the fair value of acquired identifiable intangible assets, which principally consisted of trademarks with an estimated fair value of $493.9 million in aggregate and customer relationships with an estimated fair value of $300.3 million in aggregate. The significant estimation uncertainty was primarily due to the sensitivity of the respective fair values to underlying assumptions about the future performance of the Business Acquisitions and due to the limited historical data on which those assumptions were based. The Company used a discounted cash flow model to measure these acquired identifiable intangible assets. The significant assumptions used to estimate the fair value of the trademarks and customer relationships included discount rates, royalty rates, customer attrition rates, and certain significant assumptions that formed the basis of projected cash flows, including forecasted revenue growth rates and operating margins. These significant assumptions are forward-looking and could be affected by future economic and market conditions.
How We Addressed the Matter in Our Audit
We obtained an understanding, evaluated the design, and tested the operating effectiveness of controls over the Company’s valuation of the acquired identifiable intangible assets. For example, we tested controls over the recognition and measurement of these intangible assets, including management’s review of the significant assumptions and methods discussed above.
To test the estimated fair value of the acquired trademarks and customer relationships, we performed audit procedures that included, among others, evaluating the Company’s selection of valuation methods and testing the models and significant assumptions discussed above, including the completeness and accuracy of the underlying data. For example, we compared the significant assumptions to current industry, market, and economic trends and to the historical results of the Business Acquisitions. We also performed sensitivity analyses of these significant assumptions to evaluate the changes in the fair value of the acquired identifiable intangible assets that would result from changes in the assumptions. We involved our valuation specialists to assist in evaluating the significant assumptions and methodologies used by the Company.
/s/ ERNST & YOUNG LLP
We have served as the Company’s auditor since 2016.
Philadelphia, PennsylvaniaFebruary 18, 2022
The Hershey Company | 2021 Form 10-K | Page 50

REPORT OF INDEPENDENT REGISTERED PUBLIC ACCOUNTING FIRM
To the Stockholders and the Board of Directors of The Hershey Company
Opinion on Internal Control over Financial Reporting
We have audited The Hershey Company’s internal control over financial reporting as of December 31, 2021, based on criteria established in Internal Control-Integrated Framework issued by the Committee of Sponsoring Organizations of the Treadway Commission (2013 framework) (the COSO criteria). In our opinion, The Hershey Company (the Company) maintained, in all material respects, effective internal control over financial reporting as of December 31, 2021, based on the COSO criteria.
As indicated in the accompanying Management’s Annual Report on Internal Control Over Financial Reporting, management’s assessment of and conclusion on the effectiveness of internal control over financial reporting did not include the internal controls of Lily’s Sweets, LLC, Dot’s Pretzels, LLC, or Pretzels Inc. (collectively, “the Acquired Companies”) which are included in the 2021 consolidated financial statements of the Company and constituted 17.1% of total assets as of December 31, 2021 and 0.9% of net sales for the year then ended. Our audit of internal control over financial reporting of the Company also did not include an evaluation of the internal control over financial reporting of the Acquired Companies.
We also have audited, in accordance with the standards of the Public Company Accounting Oversight Board (United States) (PCAOB), the consolidated balance sheets of the Company as of December 31, 2021 and 2020, the related consolidated statements of income, comprehensive income, cash flows, and stockholders' equity for each of the three years in the period ended December 31, 2021, and the related notes and financial statement schedule listed in the Index at Item 15(a)(2) and our report dated February 18, 2022 expressed an unqualified opinion thereon.
Basis for Opinion
The Company’s management is responsible for maintaining effective internal control over financial reporting and for its assessment of the effectiveness of internal control over financial reporting included in the accompanying Management’s Annual Report on Internal Control over Financial Reporting. Our responsibility is to express an opinion on the Company’s internal control over financial reporting based on our audit. We are a public accounting firm registered with the PCAOB and are required to be independent with respect to the Company in accordance with the U.S. federal securities laws and the applicable rules and regulations of the Securities and Exchange Commission and the PCAOB.
We conducted our audit in accordance with the standards of the PCAOB. Those standards require that we plan and perform the audit to obtain reasonable assurance about whether effective internal control over financial reporting was maintained in all material respects.
Our audit included obtaining an understanding of internal control over financial reporting, assessing the risk that a material weakness exists, testing and evaluating the design and operating effectiveness of internal control based on the assessed risk, and performing such other procedures as we considered necessary in the circumstances. We believe that our audit provides a reasonable basis for our opinion.
The Hershey Company | 2021 Form 10-K | Page 51
Definition and Limitations of Internal Control Over Financial Reporting
A company’s internal control over financial reporting is a process designed to provide reasonable assurance regarding the reliability of financial reporting and the preparation of financial statements for external purposes in accordance with generally accepted accounting principles. A company’s internal control over financial reporting includes those policies and procedures that (1) pertain to the maintenance of records that, in reasonable detail, accurately and fairly reflect the transactions and dispositions of the assets of the company; (2) provide reasonable assurance that transactions are recorded as necessary to permit preparation of financial statements in accordance with generally accepted accounting principles, and that receipts and expenditures of the company are being made only in accordance with authorizations of management and directors of the company; and (3) provide reasonable assurance regarding prevention or timely detection of unauthorized acquisition, use, or disposition of the company’s assets that could have a material effect on the financial statements.
Because of its inherent limitations, internal control over financial reporting may not prevent or detect misstatements. Also, projections of any evaluation of effectiveness to future periods are subject to the risk that controls may become inadequate because of changes in conditions, or that the degree of compliance with the policies or procedures may deteriorate.
/s/ ERNST & YOUNG LLP
Philadelphia, PennsylvaniaFebruary 18, 2022
The Hershey Company | 2021 Form 10-K | Page 52
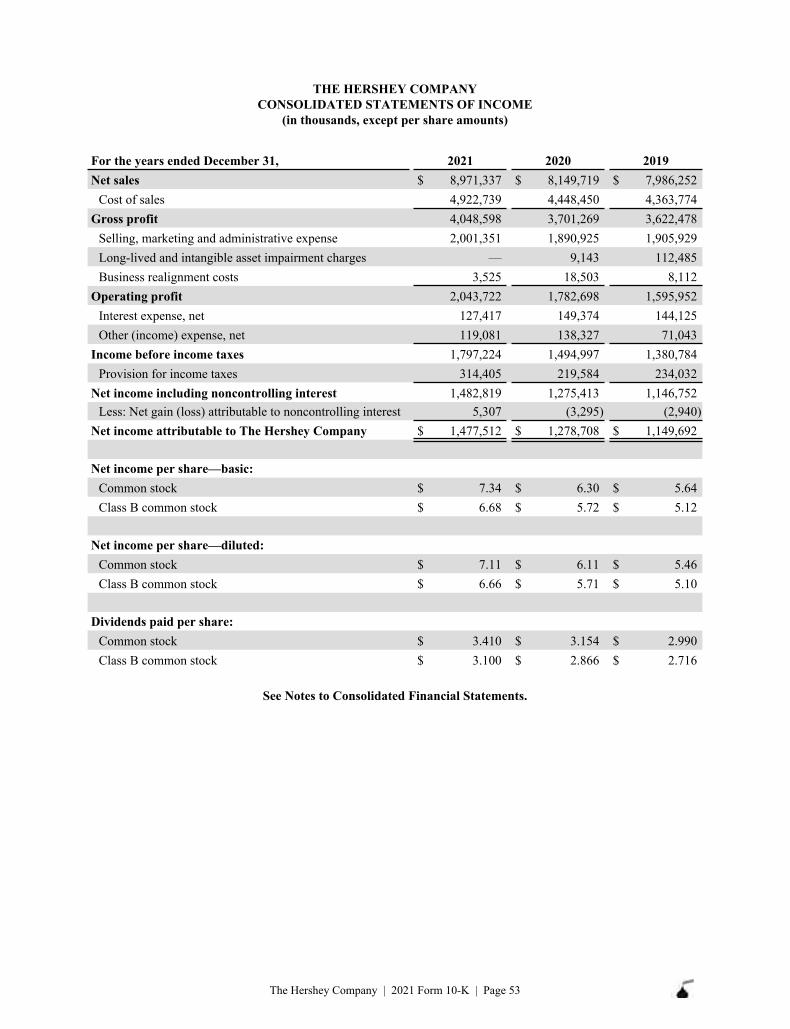
THE HERSHEY COMPANY CONSOLIDATED STATEMENTS OF INCOME
(in thousands, except per share amounts)
Net sales $ 8,971,337 $ 8,149,719 $ 7,986,252 Cost of sales 4,922,739 4,448,450 4,363,774
Gross profit 4,048,598 3,701,269 3,622,478 Selling, marketing and administrative expense 2,001,351 1,890,925 1,905,929 Long-lived and intangible asset impairment charges — 9,143 112,485 Business realignment costs 3,525 18,503 8,112
Operating profit 2,043,722 1,782,698 1,595,952 Interest expense, net 127,417 149,374 144,125 Other (income) expense, net 119,081 138,327 71,043
Income before income taxes 1,797,224 1,494,997 1,380,784 Provision for income taxes 314,405 219,584 234,032
Net income including noncontrolling interest 1,482,819 1,275,413 1,146,752 Less: Net gain (loss) attributable to noncontrolling interest 5,307 (3,295) (2,940)
Net income attributable to The Hershey Company $ 1,477,512 $ 1,278,708 $ 1,149,692
Net income per share—basic:Common stock $ 7.34 $ 6.30 $ 5.64 Class B common stock $ 6.68 $ 5.72 $ 5.12
Net income per share—diluted:Common stock $ 7.11 $ 6.11 $ 5.46 Class B common stock $ 6.66 $ 5.71 $ 5.10
Dividends paid per share:Common stock $ 3.410 $ 3.154 $ 2.990 Class B common stock $ 3.100 $ 2.866 $ 2.716
For the years ended December 31, 2021 2020 2019
See Notes to Consolidated Financial Statements.
The Hershey Company | 2021 Form 10-K | Page 53
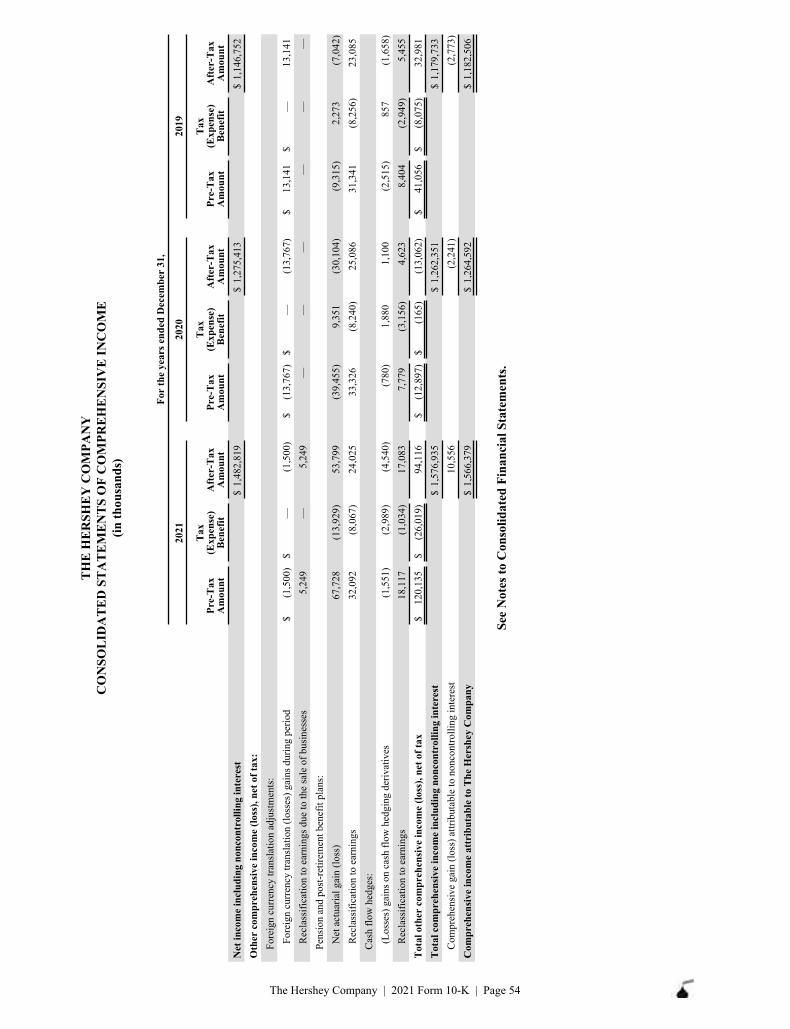
TH
E H
ER
SHE
Y C
OM
PAN
Y
CO
NSO
LID
AT
ED
ST
AT
EM
EN
TS
OF
CO
MPR
EH
EN
SIV
E IN
CO
ME
(in
thou
sand
s)
For
the
year
s end
ed D
ecem
ber
31,
2021
2020
2019
Pre-
Tax
A
mou
nt
Tax
(E
xpen
se)
Ben
efit
Aft
er-T
ax
Am
ount
Pre-
Tax
A
mou
nt
Tax
(E
xpen
se)
Ben
efit
Aft
er-T
ax
Am
ount
Pre-
Tax
A
mou
nt
Tax
(E
xpen
se)
Ben
efit
Aft
er-T
ax
Am
ount
Net
inco
me
incl
udin
g no
ncon
trol
ling
inte
rest
$ 1,
482,
819
$ 1,
275,
413
$ 1,
146,
752
Oth
er c
ompr
ehen
sive
inco
me
(loss
), ne
t of t
ax:
Fore
ign
curr
ency
tran
slat
ion
adju
stm
ents
:Fo
reig
n cu
rren
cy tr
ansl
atio
n (lo
sses
) gai
ns d
urin
g pe
riod
$ (1
,500
) $
—
(1,5
00)
$ (1
3,76
7)
$ —
(1
3,76
7)
$ 13
,141
$
—
13,1
41
Rec
lass
ifica
tion
to e
arni
ngs d
ue to
the
sale
of b
usin
esse
s5,
249
—
5,24
9 —
—
—
—
—
—
Pe
nsio
n an
d po
st-r
etire
men
t ben
efit
plan
s:N
et a
ctua
rial g
ain
(loss
)67
,728
(1
3,92
9)
53,7
99
(39,
455)
9,
351
(30,
104)
(9
,315
) 2,
273
(7,0
42)
Rec
lass
ifica
tion
to e
arni
ngs
32,0
92
(8,0
67)
24,0
25
33,3
26
(8,2
40)
25,0
86
31,3
41
(8,2
56)
23,0
85
Cas
h flo
w h
edge
s:(L
osse
s) g
ains
on
cash
flow
hed
ging
der
ivat
ives
(1,5
51)
(2,9
89)
(4,5
40)
(780
)1,
880
1,10
0 (2
,515
) 85
7 (1
,658
) R
ecla
ssifi
catio
n to
ear
ning
s18
,117
(1
,034
) 17
,083
7,
779
(3,1
56)
4,62
3 8,
404
(2,9
49)
5,45
5 T
otal
oth
er c
ompr
ehen
sive
inco
me
(loss
), ne
t of t
ax$
120,
135
$ (2
6,01
9)
94,1
16
$ (1
2,89
7)
$ (1
65)
(13,
062)
$ 41
,056
$
(8,0
75)
32,9
81
Tot
al c
ompr
ehen
sive
inco
me
incl
udin
g no
ncon
trol
ling
inte
rest
$ 1,
576,
935
$ 1,
262,
351
$ 1,
179,
733
Com
preh
ensi
ve g
ain
(loss
) attr
ibut
able
to n
onco
ntro
lling
inte
rest
10,5
56
(2,2
41)
(2,7
73)
Com
preh
ensi
ve in
com
e at
trib
utab
le to
The
Her
shey
Com
pany
$ 1,
566,
379
$ 1,
264,
592
$ 1,
182,
506
See
Not
es to
Con
solid
ated
Fin
anci
al S
tate
men
ts.
The Hershey Company | 2021 Form 10-K | Page 54
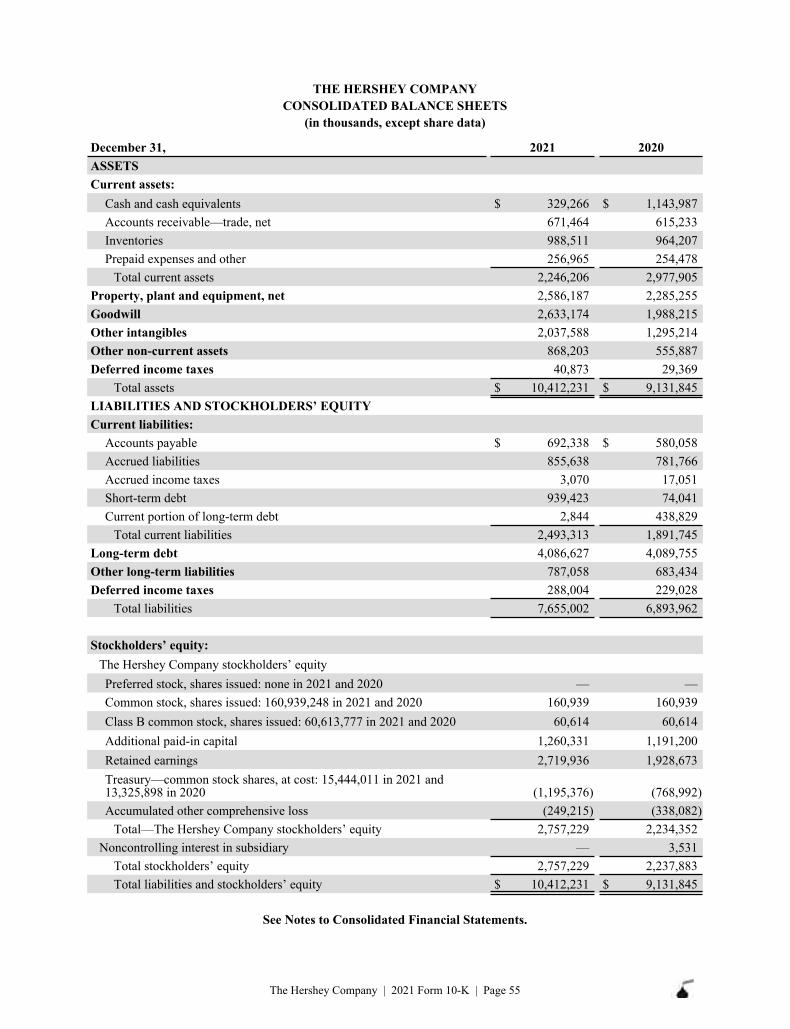
THE HERSHEY COMPANY CONSOLIDATED BALANCE SHEETS
(in thousands, except share data)
ASSETSCurrent assets:
Cash and cash equivalents $ 329,266 $ 1,143,987 Accounts receivable—trade, net 671,464 615,233 Inventories 988,511 964,207 Prepaid expenses and other 256,965 254,478
Total current assets 2,246,206 2,977,905 Property, plant and equipment, net 2,586,187 2,285,255 Goodwill 2,633,174 1,988,215 Other intangibles 2,037,588 1,295,214 Other non-current assets 868,203 555,887 Deferred income taxes 40,873 29,369
Total assets $ 10,412,231 $ 9,131,845 LIABILITIES AND STOCKHOLDERS’ EQUITYCurrent liabilities:
Accounts payable $ 692,338 $ 580,058 Accrued liabilities 855,638 781,766 Accrued income taxes 3,070 17,051 Short-term debt 939,423 74,041 Current portion of long-term debt 2,844 438,829
Total current liabilities 2,493,313 1,891,745 Long-term debt 4,086,627 4,089,755 Other long-term liabilities 787,058 683,434 Deferred income taxes 288,004 229,028
Total liabilities 7,655,002 6,893,962
Stockholders’ equity:The Hershey Company stockholders’ equityPreferred stock, shares issued: none in 2021 and 2020 — — Common stock, shares issued: 160,939,248 in 2021 and 2020 160,939 160,939 Class B common stock, shares issued: 60,613,777 in 2021 and 2020 60,614 60,614 Additional paid-in capital 1,260,331 1,191,200 Retained earnings 2,719,936 1,928,673 Treasury—common stock shares, at cost: 15,444,011 in 2021 and 13,325,898 in 2020 (1,195,376) (768,992) Accumulated other comprehensive loss (249,215) (338,082)
Total—The Hershey Company stockholders’ equity 2,757,229 2,234,352 Noncontrolling interest in subsidiary — 3,531
Total stockholders’ equity 2,757,229 2,237,883 Total liabilities and stockholders’ equity $ 10,412,231 $ 9,131,845
December 31, 2021 2020
See Notes to Consolidated Financial Statements.
The Hershey Company | 2021 Form 10-K | Page 55
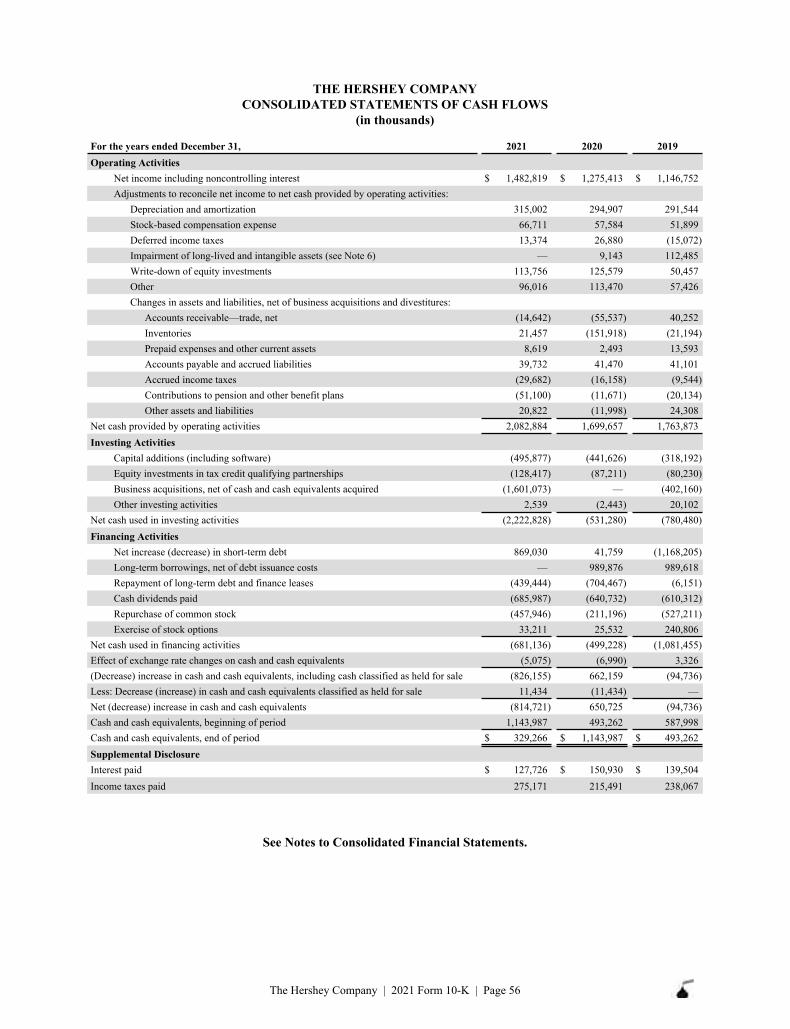
THE HERSHEY COMPANY CONSOLIDATED STATEMENTS OF CASH FLOWS
(in thousands)
Operating ActivitiesNet income including noncontrolling interest $ 1,482,819 $ 1,275,413 $ 1,146,752 Adjustments to reconcile net income to net cash provided by operating activities:
Depreciation and amortization 315,002 294,907 291,544 Stock-based compensation expense 66,711 57,584 51,899 Deferred income taxes 13,374 26,880 (15,072) Impairment of long-lived and intangible assets (see Note 6) — 9,143 112,485 Write-down of equity investments 113,756 125,579 50,457 Other 96,016 113,470 57,426 Changes in assets and liabilities, net of business acquisitions and divestitures:
Accounts receivable—trade, net (14,642) (55,537) 40,252 Inventories 21,457 (151,918) (21,194) Prepaid expenses and other current assets 8,619 2,493 13,593 Accounts payable and accrued liabilities 39,732 41,470 41,101 Accrued income taxes (29,682) (16,158) (9,544) Contributions to pension and other benefit plans (51,100) (11,671) (20,134) Other assets and liabilities 20,822 (11,998) 24,308
Net cash provided by operating activities 2,082,884 1,699,657 1,763,873 Investing Activities
Capital additions (including software) (495,877) (441,626) (318,192) Equity investments in tax credit qualifying partnerships (128,417) (87,211) (80,230) Business acquisitions, net of cash and cash equivalents acquired (1,601,073) — (402,160) Other investing activities 2,539 (2,443) 20,102
Net cash used in investing activities (2,222,828) (531,280) (780,480) Financing Activities
Net increase (decrease) in short-term debt 869,030 41,759 (1,168,205) Long-term borrowings, net of debt issuance costs — 989,876 989,618 Repayment of long-term debt and finance leases (439,444) (704,467) (6,151) Cash dividends paid (685,987) (640,732) (610,312) Repurchase of common stock (457,946) (211,196) (527,211) Exercise of stock options 33,211 25,532 240,806
Net cash used in financing activities (681,136) (499,228) (1,081,455) Effect of exchange rate changes on cash and cash equivalents (5,075) (6,990) 3,326 (Decrease) increase in cash and cash equivalents, including cash classified as held for sale (826,155) 662,159 (94,736) Less: Decrease (increase) in cash and cash equivalents classified as held for sale 11,434 (11,434) — Net (decrease) increase in cash and cash equivalents (814,721) 650,725 (94,736) Cash and cash equivalents, beginning of period 1,143,987 493,262 587,998 Cash and cash equivalents, end of period $ 329,266 $ 1,143,987 $ 493,262 Supplemental DisclosureInterest paid $ 127,726 $ 150,930 $ 139,504 Income taxes paid 275,171 215,491 238,067
For the years ended December 31, 2021 2020 2019
See Notes to Consolidated Financial Statements.
The Hershey Company | 2021 Form 10-K | Page 56
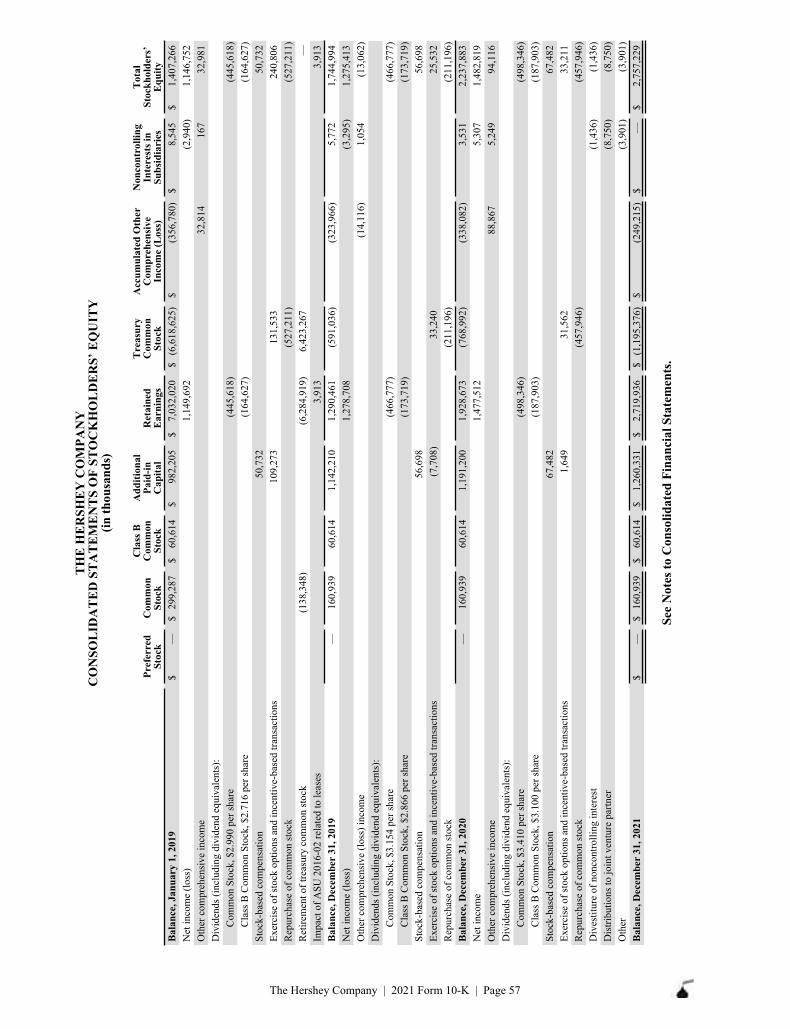
TH
E H
ER
SHE
Y C
OM
PAN
YC
ON
SOL
IDA
TE
D S
TA
TE
ME
NT
S O
F ST
OC
KH
OL
DE
RS’
EQ
UIT
Y(in
thou
sand
s)
Pref
erre
dSt
ock
Com
mon
St
ock
Cla
ss B
C
omm
on
Stoc
k
Add
ition
al
Paid
-in
Cap
ital
Ret
aine
d E
arni
ngs
Tre
asur
y C
omm
on
Stoc
k
Acc
umul
ated
Oth
erC
ompr
ehen
sive
Inco
me
(Los
s)
Non
cont
rolli
ng
Inte
rest
s in
Subs
idia
ries
Tot
al
Stoc
khol
ders
’E
quity
Bal
ance
, Jan
uary
1, 2
019
$ —
$
299,
287
$ 60
,614
$
982,
205
$ 7,
032,
020
$ (6
,618
,625
) $
(356
,780
) $
8,54
5 $
1,40
7,26
6 N
et in
com
e (lo
ss)
1,14
9,69
2 (2
,940
) 1,
146,
752
Oth
er c
ompr
ehen
sive
inco
me
32,8
14
167
32,9
81
Div
iden
ds (i
nclu
ding
div
iden
d eq
uiva
lent
s):
Com
mon
Sto
ck, $
2.99
0 pe
r sha
re(4
45,6
18)
(445
,618
) C
lass
B C
omm
on S
tock
, $2.
716
per s
hare
(164
,627
) (1
64,6
27)
Stoc
k-ba
sed
com
pens
atio
n50
,732
50
,732
Ex
erci
se o
f sto
ck o
ptio
ns a
nd in
cent
ive-
base
d tra
nsac
tions
109,
273
131,
533
240,
806
Rep
urch
ase
of c
omm
on st
ock
(527
,211
) (5
27,2
11)
Ret
irem
ent o
f tre
asur
y co
mm
on st
ock
(138
,348
) (6
,284
,919
) 6,
423,
267
—
Impa
ct o
f ASU
201
6-02
rela
ted
to le
ases
3,91
3 3,
913
Bal
ance
, Dec
embe
r 31
, 201
9—
16
0,93
9 60
,614
1,
142,
210
1,29
0,46
1 (5
91,0
36)
(323
,966
) 5,
772
1,74
4,99
4 N
et in
com
e (lo
ss)
1,27
8,70
8 (3
,295
) 1,
275,
413
Oth
er c
ompr
ehen
sive
(los
s) in
com
e(1
4,11
6)
1,05
4 (1
3,06
2)
Div
iden
ds (i
nclu
ding
div
iden
d eq
uiva
lent
s):
Com
mon
Sto
ck, $
3.15
4 pe
r sha
re(4
66,7
77)
(466
,777
) C
lass
B C
omm
on S
tock
, $2.
866
per s
hare
(173
,719
) (1
73,7
19)
Stoc
k-ba
sed
com
pens
atio
n56
,698
56
,698
Ex
erci
se o
f sto
ck o
ptio
ns a
nd in
cent
ive-
base
d tra
nsac
tions
(7,7
08)
33,2
40
25,5
32
Rep
urch
ase
of c
omm
on st
ock
(211
,196
) (2
11,1
96)
Bal
ance
, Dec
embe
r 31
, 202
0—
16
0,93
9 60
,614
1,
191,
200
1,92
8,67
3 (7
68,9
92)
(338
,082
) 3,
531
2,23
7,88
3 N
et in
com
e1,
477,
512
5,30
7 1,
482,
819
Oth
er c
ompr
ehen
sive
inco
me
88,8
67
5,24
9 94
,116
D
ivid
ends
(inc
ludi
ng d
ivid
end
equi
vale
nts)
:C
omm
on S
tock
, $3.
410
per s
hare
(498
,346
) (4
98,3
46)
Cla
ss B
Com
mon
Sto
ck, $
3.10
0 pe
r sha
re(1
87,9
03)
(187
,903
) St
ock-
base
d co
mpe
nsat
ion
67,4
82
67,4
82
Exer
cise
of s
tock
opt
ions
and
ince
ntiv
e-ba
sed
trans
actio
ns1,
649
31,5
62
33,2
11
Rep
urch
ase
of c
omm
on st
ock
(457
,946
) (4
57,9
46)
Div
estit
ure
of n
onco
ntro
lling
inte
rest
(1,4
36)
(1,4
36)
Dis
tribu
tions
to jo
int v
entu
re p
artn
er(8
,750
) (8
,750
) O
ther
(3,9
01)
(3,9
01)
Bal
ance
, Dec
embe
r 31
, 202
1$
—
$ 16
0,93
9 $
60,6
14
$ 1,
260,
331
$ 2,
719,
936
$ (1
,195
,376
) $
(249
,215
) $
—
$ 2,
757,
229
See
Not
es to
Con
solid
ated
Fin
anci
al S
tate
men
ts.
The Hershey Company | 2021 Form 10-K | Page 57
1. SUMMARY OF SIGNIFICANT ACCOUNTING POLICIES
Description of Business
The Hershey Company together with its wholly-owned subsidiaries and entities in which it has a controlling interest, (the “Company,” “Hershey,” “we” or “us”) is a global confectionery leader known for its branded portfolio of chocolate, sweets, mints and other great tasting snacks. The Company has more than 100 brands worldwide including such iconic brand names as Hershey’s, Reese’s, Kisses, Jolly Rancher and Ice Breakers, which are marketed, sold and distributed in approximately 80 countries worldwide. Hershey’s structure is designed to ensure continued focus on North America, coupled with an emphasis on profitable growth in our focus international markets. Since December 31, 2014, the Company has reported its operations through two segments: (i) North America and (ii) International and Other. After the completion of the Company’s acquisitions of Dot’s Pretzels, LLC (“Dot’s”) and Pretzels Inc.(“Pretzels”) in December 2021, management of the Company has elected to begin reporting its operations through three reportable segments. Therefore, effective in the fourth quarter of 2021, the Company realigned its former two reportable segments into three reportable segments: (i) North America Confectionery, (ii) North America Salty Snacks and (iii) International. For additional information on our segment presentation, see Note 13.
Basis of Presentation
Our consolidated financial statements include the accounts of The Hershey Company and its majority-owned or controlled subsidiaries. Intercompany transactions and balances have been eliminated. We have a controlling financial interest if we own a majority of the outstanding voting common stock and minority shareholders do not have substantive participating rights, we have significant control through contractual or economic interests in which we are the primary beneficiary or we have the power to direct the activities that most significantly impact the entity's economic performance. We use the equity method of accounting when we have a 20% to 50% interest in other companies and exercise significant influence. See Note 14 for information on our noncontrolling interest, which was divested in January 2021. In addition, we use the equity method of accounting for our investments in partnership entities which make equity investments in projects eligible to receive federal historic and energy tax credits. See Note 10 for additional information on our equity investments in partnership entities qualifying for tax credits. Other investments that are not controlled, and over which we do not have the ability to exercise significant influence, are accounted for under the cost method. Both equity and cost method investments are included as Other non-current assets in the Consolidated Balance Sheets. For additional information on our investments in unconsolidated affiliates, see Note 8.
COVID-19
On March 11, 2020, the World Health Organization designated coronavirus disease 2019 (“COVID-19”) as a global pandemic. We continue to actively monitor COVID-19 and its potential impact on our operations and financial results. Employee health and safety remains our first priority while we continue our efforts to support community food supplies. Since the onset of COVID-19, there has been minimal disruption to our supply chain network, and all our manufacturing plants are currently open. However, during 2021, continued strong demand for consumer goods and the effects of COVID-19 mitigation strategies have led to broad-based supply chain disruptions across the U.S. and globally, including inflation on many consumer products, labor shortages and demand outpacing supply. We are working closely with our business units, contract manufacturers, distributors, contractors and other external business partners to minimize the potential impact on our business.
The ultimate impact that COVID-19 will have on our consolidated financial statements remains uncertain and ultimately will be dictated by the length and severity of the pandemic, including broad-based supply chain disruptions, rising levels of inflation, the spread of COVID-19 variants or resurgences, as well as the economic recovery and actions taken in response by local, state and national governments around the world, including the distribution of vaccinations. We will continue to evaluate the nature and extent of these potential and evolving impacts to our business and consolidated financial statements.
THE HERSHEY COMPANYNOTES TO CONSOLIDATED FINANCIAL STATEMENTS(amounts in thousands, except share data or if otherwise indicated)
The Hershey Company | 2021 Form 10-K | Page 58
Use of Estimates
The preparation of financial statements in conformity with accounting principles generally accepted in the United States of America (“GAAP”) requires management to make estimates and assumptions that affect the amounts reported in the consolidated financial statements and accompanying disclosures. Our significant estimates and assumptions include, among others, pension and other post-retirement benefit plan assumptions, valuation assumptions of goodwill and other intangible assets, useful lives of long-lived assets, marketing and trade promotion accruals and income taxes. These estimates and assumptions are based on management’s best judgment. Management evaluates its estimates and assumptions on an ongoing basis using historical experience and other factors, including the current economic environment, and the effects of any revisions are reflected in the consolidated financial statements in the period that they are determined. As future events and their effects cannot be determined with precision, actual results could differ significantly from these estimates.
Revenue Recognition
The majority of our revenue contracts represent a single performance obligation related to the fulfillment of customer orders for the purchase of our products, including chocolate, sweets, mints and other grocery and snack offerings. Net sales reflect the transaction prices for these contracts based on our selling list price which is then reduced by estimated costs for trade promotional programs, consumer incentives, and allowances and discounts associated with aged or potentially unsaleable products. We recognize revenue at the point in time that control of the ordered product(s) is transferred to the customer, which is typically upon delivery to the customer or other customer-designated delivery point. Amounts billed and due from our customers are classified as accounts receivables on the balance sheet and require payment on a short-term basis.
Our trade promotional programs and consumer incentives are used to promote our products and include, but are not limited to, discounts, coupons, rebates, in-store display incentives, and volume-based incentives. The estimated costs associated with these programs and incentives are based upon our analysis of the programs offered, expectations regarding customer and consumer participation, historical sales and payment trends, and our experience with payment patterns associated with similar programs offered in the past. The estimated costs of these programs are reasonably likely to change in future periods due to changes in trends with regard to customer and consumer participation, particularly for new programs and for programs related to the introduction of new products. Differences between estimated expense and actual program performance are recognized as a change in estimate in a subsequent period and are normally not significant. During 2021, 2020 and 2019, actual promotional costs have not deviated from the estimated amount by more than 3%. The Company’s unsettled portion remaining in accrued liabilities at year-end for these activities was $174,046 and $195,563 at December 31, 2021 and 2020, respectively.
We also recognize a minor amount of royalty income (less than 1% of our consolidated net sales) from sales-based licensing arrangements, pursuant to which revenue is recognized as the third-party licensee sales occur. Shipping and handling costs incurred to deliver product to the customer are recorded within cost of sales. Sales, value add and other taxes we collect concurrent with revenue producing activities are excluded from revenue.
The majority of our products are confectionery or confectionery-based and, therefore, exhibit similar economic characteristics, as they are based on similar ingredients and are marketed and sold through the same channels to the same customers. In connection with our recent acquisitions, we have expanded our portfolio of salty snacking products, which also exhibit similar economic characteristics to our confectionery products and are sold through the same channels to the same customers. See Note 13 for revenues reported by geographic segment, which is consistent with how we organize and manage our operations, as well as product line net sales information.
In 2021, 2020 and 2019, approximately 30%, 31% and 30%, respectively, of our consolidated net sales were made to McLane Company, Inc., one of the largest wholesale distributors in the United States to convenience stores, drug stores, wholesale clubs and mass merchandisers and the primary distributor of our products to Wal-Mart Stores, Inc.
THE HERSHEY COMPANYNOTES TO CONSOLIDATED FINANCIAL STATEMENTS—(Continued)
(amounts in thousands, except share data or if otherwise indicated)
The Hershey Company | 2021 Form 10-K | Page 59
Cost of Sales
Cost of sales represents costs directly related to the manufacture and distribution of our products. Primary costs include raw materials, packaging, direct labor, overhead, shipping and handling, warehousing and the depreciation of manufacturing, warehousing and distribution facilities. Manufacturing overhead and related expenses include salaries, wages, employee benefits, utilities, maintenance and property taxes.
Selling, Marketing and Administrative Expense
Selling, marketing and administrative expense (“SM&A”) represents costs incurred in generating revenues and in managing our business. Such costs include advertising and other marketing expenses, selling expenses, research and development costs, administrative and other indirect overhead costs, amortization of capitalized software and intangible assets and depreciation of administrative facilities. Research and development costs, charged to expense as incurred, totaled $40,107 in 2021, $37,577 in 2020 and $37,146 in 2019. Advertising expense is also charged to expense as incurred and totaled $511,798 in 2021, $516,936 in 2020 and $513,302 in 2019. There was no prepaid advertising expense as of December 31, 2021 and $705 as of December 31, 2020.
Cash Equivalents
Cash equivalents consist of highly liquid debt instruments, time deposits and money market funds with original maturities of three months or less. The fair value of cash and cash equivalents approximates the carrying amount.
Accounts Receivable—Trade
In the normal course of business, we extend credit to customers that satisfy pre-defined credit criteria, based upon the results of our recurring financial account reviews and our evaluation of current and projected economic conditions. Our primary concentration of credit risk is associated with McLane Company, Inc., one customer served principally by our North America Confectionery segment. As of December 31, 2021, McLane Company, Inc. accounted for approximately 27% of our total accounts receivable. No other customer accounted for more than 10% of our year-end accounts receivable. We believe that we have little concentration of credit risk associated with the remainder of our customer base. Accounts receivable-trade in the Consolidated Balance Sheets is presented net of allowances for bad debts and anticipated discounts of $28,837 and $24,975 at December 31, 2021 and 2020, respectively.
Inventories
Inventories are valued at the lower of cost or market value, adjusted for the value of inventory that is estimated to be excess, obsolete or otherwise unsaleable. As of December 31, 2021, approximately 60% of our inventories, representing the majority of our United States (“U.S.”) inventories, were valued under the last-in, first-out (“LIFO”) method. The remainder of our inventories in the U.S. and inventories for our international businesses were valued at the lower of first-in, first-out (“FIFO”) cost or net realizable value. LIFO cost of inventories valued using the LIFO method was $589,850 as of December 31, 2021 and $606,282 as of December 31, 2020. The adjustment to LIFO, as shown in Note 18, approximates the excess of replacement cost over the stated LIFO inventory value. The net impact of LIFO acquisitions and liquidations was not material to 2021, 2020 or 2019.
Property, Plant and Equipment
Property, plant and equipment is stated at cost and depreciated on a straight-line basis over the estimated useful lives of the assets, as follows: 3 to 15 years for machinery and equipment; and 25 to 40 years for buildings and related improvements. At December 31, 2021 and December 31, 2020, property, plant and equipment included assets under finance lease arrangements with net book values totaling $72,496 and $88,065, respectively. Total depreciation expense for the years ended December 31, 2021, 2020 and 2019 was $230,638, $219,021 and $218,096, respectively, and included depreciation on assets recorded under finance lease arrangements. Maintenance and repairs are expensed as incurred. We capitalize applicable interest charges incurred during the construction of new facilities and production lines and amortize these costs over the assets’ estimated useful lives.
We review long-lived assets for impairment whenever events or changes in circumstances indicate that the carrying amount of such assets may not be recoverable. We measure the recoverability of assets to be held and used by a comparison of the carrying amount of long-lived assets to future undiscounted net cash flows expected to be generated.
THE HERSHEY COMPANYNOTES TO CONSOLIDATED FINANCIAL STATEMENTS—(Continued)
(amounts in thousands, except share data or if otherwise indicated)
The Hershey Company | 2021 Form 10-K | Page 60
If these assets are considered to be impaired, we measure impairment as the amount by which the carrying amount of the assets exceeds the fair value of the assets. We report assets held for sale or disposal at the lower of the carrying amount or fair value less cost to sell.
We assess asset retirement obligations on a periodic basis and recognize the fair value of a liability for an asset retirement obligation in the period in which it is incurred if a reasonable estimate of fair value can be made. We capitalize associated asset retirement costs as part of the carrying amount of the long-lived asset.
Computer Software
We capitalize costs associated with software developed or obtained for internal use when both the preliminary project stage is completed and it is probable the software being developed will be completed and placed in service. Capitalized costs include only (i) external direct costs of materials and services consumed in developing or obtaining internal-use software, (ii) payroll and other related costs for employees who are directly associated with and who devote time to the internal-use software project and (iii) interest costs incurred, when material, while developing internal-use software. We cease capitalization of such costs no later than the point at which the project is substantially complete and ready for its intended purpose.
The unamortized amount of capitalized software totaled $260,656 and $187,673 at December 31, 2021 and 2020, respectively. We amortize software costs using the straight-line method over the expected life of the software, generally 3 to 7 years. Accumulated amortization of capitalized software was $321,939 and $360,579 as of 2021 and 2020, respectively. Such amounts are recorded within other assets in the Consolidated Balance Sheets.
We review the carrying value of software and development costs for impairment in accordance with our policy pertaining to the impairment of long-lived assets.
Goodwill and Other Intangible Assets
Goodwill and indefinite-lived intangible assets are not amortized, but are evaluated for impairment annually or more often if indicators of a potential impairment are present. Our annual impairment tests are conducted at the beginning of the fourth quarter. We test goodwill for impairment by performing either a qualitative or quantitative assessment. If we choose to perform a qualitative assessment, we evaluate economic, industry and company-specific factors in assessing the fair value of the related reporting unit. If we determine that it is more likely than not that the fair value of the reporting unit is less than its carrying value, a quantitative test is then performed. Otherwise, no further testing is required. For those reporting units tested using a quantitative approach, we compare the fair value of each reporting unit with the carrying amount of the reporting unit, including goodwill. If the estimated fair value of the reporting unit is less than the carrying amount of the reporting unit, impairment is indicated, requiring recognition of a goodwill impairment charge for the differential (up to the carrying value of goodwill). We test individual indefinite-lived intangible assets by comparing the estimated fair values with the book values of each asset.
We determine the fair value of our reporting units and indefinite-lived intangible assets using an income approach. Under the income approach, we calculate the fair value of our reporting units and indefinite-lived intangible assets based on the present value of estimated future cash flows. Considerable management judgment is necessary to evaluate the impact of operating and macroeconomic changes and to estimate the future cash flows used to measure fair value. Our estimates of future cash flows consider past performance, current and anticipated market conditions and internal projections and operating plans which incorporate estimates for sales growth and profitability, and cash flows associated with taxes and capital spending. Additional assumptions include forecasted growth rates, estimated discount rates, which may be risk-adjusted for the operating market of the reporting unit, and estimated royalty rates that would be charged for comparable branded licenses. We believe such assumptions also reflect current and anticipated market conditions and are consistent with those that would be used by other marketplace participants for similar valuation purposes. Such assumptions are subject to change due to changing economic and competitive conditions.
The cost of intangible assets with finite useful lives is amortized on a straight-line basis. Our finite-lived intangible assets consist primarily of certain trademarks, customer-related intangible assets and patents obtained through business acquisitions. The weighted-average amortization period for our finite-lived intangible assets is approximately 30 years, which is primarily driven by recently acquired trademarks. If certain events or changes in operating conditions indicate that the carrying value of these assets, or related asset groups, may not be recoverable, we perform an
THE HERSHEY COMPANYNOTES TO CONSOLIDATED FINANCIAL STATEMENTS—(Continued)
(amounts in thousands, except share data or if otherwise indicated)
The Hershey Company | 2021 Form 10-K | Page 61
impairment assessment and may adjust the remaining useful lives. See Note 3 for additional information regarding the results of impairment tests.
Currency Translation
The financial statements of our foreign entities with functional currencies other than the U.S. dollar are translated into U.S. dollars, with the resulting translation adjustments recorded as a component of other comprehensive income (loss). Assets and liabilities are translated into U.S. dollars using the exchange rates in effect at the balance sheet date, while income and expense items are translated using the average exchange rates during the period.
Derivative Instruments
We use derivative instruments principally to offset exposure to market risks arising from changes in commodity prices, foreign currency exchange rates and interest rates. See Note 5 for additional information on our risk management strategy and the types of instruments we use.
Derivative instruments are recognized on the Consolidated Balance Sheets at their fair values. When we become party to a derivative instrument and intend to apply hedge accounting, we designate the instrument for financial reporting purposes as a cash flow or fair value hedge. The accounting for changes in fair value (gains or losses) of a derivative instrument depends on whether we have designated it and it qualified as part of a hedging relationship, as noted below:
• Changes in the fair value of a derivative that is designated as a cash flow hedge are recorded in accumulatedother comprehensive income (“AOCI”) to the extent effective and reclassified into earnings in the sameperiod or periods during which the transaction hedged by that derivative also affects earnings.
• Changes in the fair value of a derivative that is designated as a fair value hedge, along with the offsetting lossor gain on the hedged asset or liability that is attributable to the risk being hedged, are recorded in earnings,thereby reflecting in earnings the net extent to which the hedge is not effective in achieving offsetting changesin fair value.
• Changes in the fair value of a derivative not designated as a hedging instrument are recognized in earnings incost of sales or SM&A, consistent with the related exposure.
For derivatives designated as hedges, we assess, both at the hedge’s inception and on an ongoing basis, whether they are highly effective in offsetting changes in fair values or cash flows of hedged items. The ineffective portion, if any, is recorded directly in earnings. In addition, if we determine that a derivative is not highly effective as a hedge or that it has ceased to be a highly effective hedge, we discontinue hedge accounting prospectively.
We do not hold or issue derivative instruments for trading or speculative purposes and are not a party to any instruments with leverage or prepayment features.
Cash flows related to the derivative instruments we use to manage interest, commodity or other currency exposures are classified as operating activities.
Recent Accounting Pronouncements
Recently Adopted Accounting Pronouncements
In August 2018, the Financial Accounting Standards Board (“FASB”) issued Accounting Standards Update (“ASU”) No. 2018-14, Compensation—Retirement Benefits—Defined Benefit Plans—General (Topic 715-20): Disclosure Framework—Changes to the Disclosure Requirements for Defined Benefit Plans, which modifies the disclosure requirements for defined benefit pension plans and other post-retirement plans. ASU 2018-14 is effective for annual periods beginning after December 15, 2020, with early adoption permitted. The amendments in this ASU should be applied on a retrospective basis to all periods presented. We elected to early adopt the provisions of this ASU in the fourth quarter of 2019. Adoption of the new standard did not have a material impact on our consolidated financial statements.
In June 2016, the FASB issued ASU No. 2016-13, Financial Instruments – Credit Losses (Topic 326): Measurement of Credit Losses on Financial Instruments. This ASU modifies the measurement of expected credit losses of certain financial instruments. ASU 2016-13 is effective for annual periods beginning after December 15, 2019 and interim
THE HERSHEY COMPANYNOTES TO CONSOLIDATED FINANCIAL STATEMENTS—(Continued)
(amounts in thousands, except share data or if otherwise indicated)
The Hershey Company | 2021 Form 10-K | Page 62
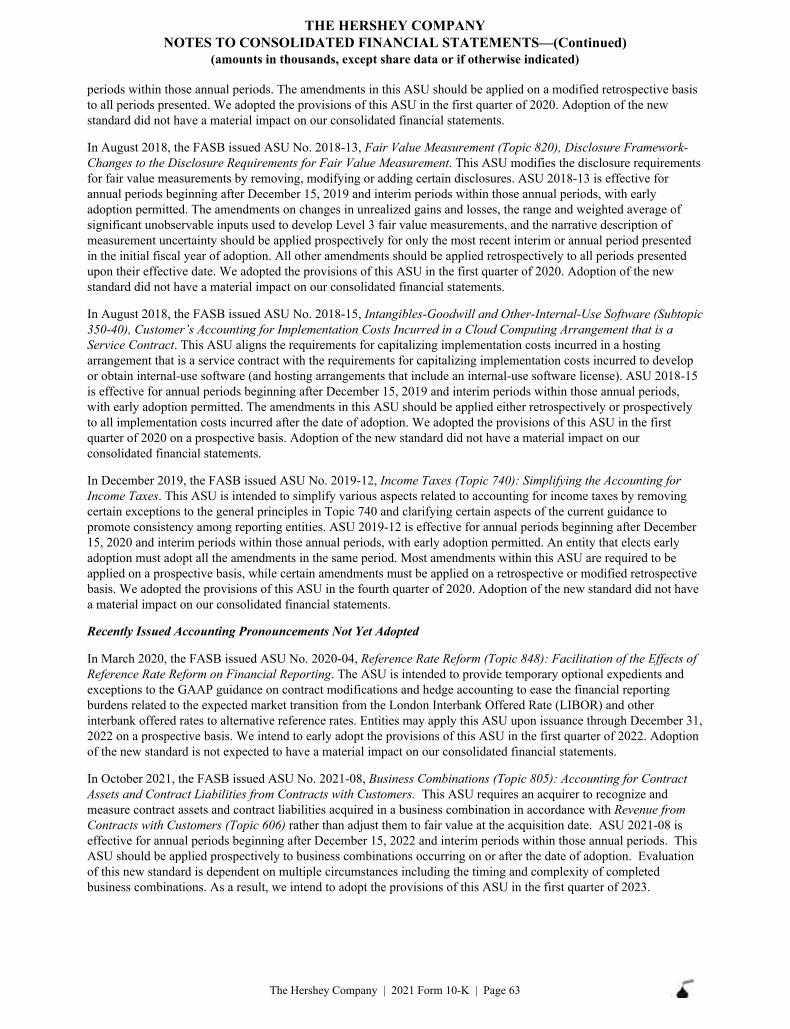
periods within those annual periods. The amendments in this ASU should be applied on a modified retrospective basis to all periods presented. We adopted the provisions of this ASU in the first quarter of 2020. Adoption of the new standard did not have a material impact on our consolidated financial statements.
In August 2018, the FASB issued ASU No. 2018-13, Fair Value Measurement (Topic 820), Disclosure Framework-Changes to the Disclosure Requirements for Fair Value Measurement. This ASU modifies the disclosure requirements for fair value measurements by removing, modifying or adding certain disclosures. ASU 2018-13 is effective for annual periods beginning after December 15, 2019 and interim periods within those annual periods, with early adoption permitted. The amendments on changes in unrealized gains and losses, the range and weighted average of significant unobservable inputs used to develop Level 3 fair value measurements, and the narrative description of measurement uncertainty should be applied prospectively for only the most recent interim or annual period presented in the initial fiscal year of adoption. All other amendments should be applied retrospectively to all periods presented upon their effective date. We adopted the provisions of this ASU in the first quarter of 2020. Adoption of the new standard did not have a material impact on our consolidated financial statements.
In August 2018, the FASB issued ASU No. 2018-15, Intangibles-Goodwill and Other-Internal-Use Software (Subtopic 350-40), Customer’s Accounting for Implementation Costs Incurred in a Cloud Computing Arrangement that is aService Contract. This ASU aligns the requirements for capitalizing implementation costs incurred in a hostingarrangement that is a service contract with the requirements for capitalizing implementation costs incurred to developor obtain internal-use software (and hosting arrangements that include an internal-use software license). ASU 2018-15is effective for annual periods beginning after December 15, 2019 and interim periods within those annual periods,with early adoption permitted. The amendments in this ASU should be applied either retrospectively or prospectivelyto all implementation costs incurred after the date of adoption. We adopted the provisions of this ASU in the firstquarter of 2020 on a prospective basis. Adoption of the new standard did not have a material impact on ourconsolidated financial statements.
In December 2019, the FASB issued ASU No. 2019-12, Income Taxes (Topic 740): Simplifying the Accounting for Income Taxes. This ASU is intended to simplify various aspects related to accounting for income taxes by removing certain exceptions to the general principles in Topic 740 and clarifying certain aspects of the current guidance to promote consistency among reporting entities. ASU 2019-12 is effective for annual periods beginning after December 15, 2020 and interim periods within those annual periods, with early adoption permitted. An entity that elects early adoption must adopt all the amendments in the same period. Most amendments within this ASU are required to be applied on a prospective basis, while certain amendments must be applied on a retrospective or modified retrospective basis. We adopted the provisions of this ASU in the fourth quarter of 2020. Adoption of the new standard did not have a material impact on our consolidated financial statements.
Recently Issued Accounting Pronouncements Not Yet Adopted
In March 2020, the FASB issued ASU No. 2020-04, Reference Rate Reform (Topic 848): Facilitation of the Effects of Reference Rate Reform on Financial Reporting. The ASU is intended to provide temporary optional expedients and exceptions to the GAAP guidance on contract modifications and hedge accounting to ease the financial reporting burdens related to the expected market transition from the London Interbank Offered Rate (LIBOR) and other interbank offered rates to alternative reference rates. Entities may apply this ASU upon issuance through December 31, 2022 on a prospective basis. We intend to early adopt the provisions of this ASU in the first quarter of 2022. Adoption of the new standard is not expected to have a material impact on our consolidated financial statements.
In October 2021, the FASB issued ASU No. 2021-08, Business Combinations (Topic 805): Accounting for Contract Assets and Contract Liabilities from Contracts with Customers. This ASU requires an acquirer to recognize and measure contract assets and contract liabilities acquired in a business combination in accordance with Revenue from Contracts with Customers (Topic 606) rather than adjust them to fair value at the acquisition date. ASU 2021-08 is effective for annual periods beginning after December 15, 2022 and interim periods within those annual periods. This ASU should be applied prospectively to business combinations occurring on or after the date of adoption. Evaluation of this new standard is dependent on multiple circumstances including the timing and complexity of completed business combinations. As a result, we intend to adopt the provisions of this ASU in the first quarter of 2023.
THE HERSHEY COMPANYNOTES TO CONSOLIDATED FINANCIAL STATEMENTS—(Continued)
(amounts in thousands, except share data or if otherwise indicated)
The Hershey Company | 2021 Form 10-K | Page 63
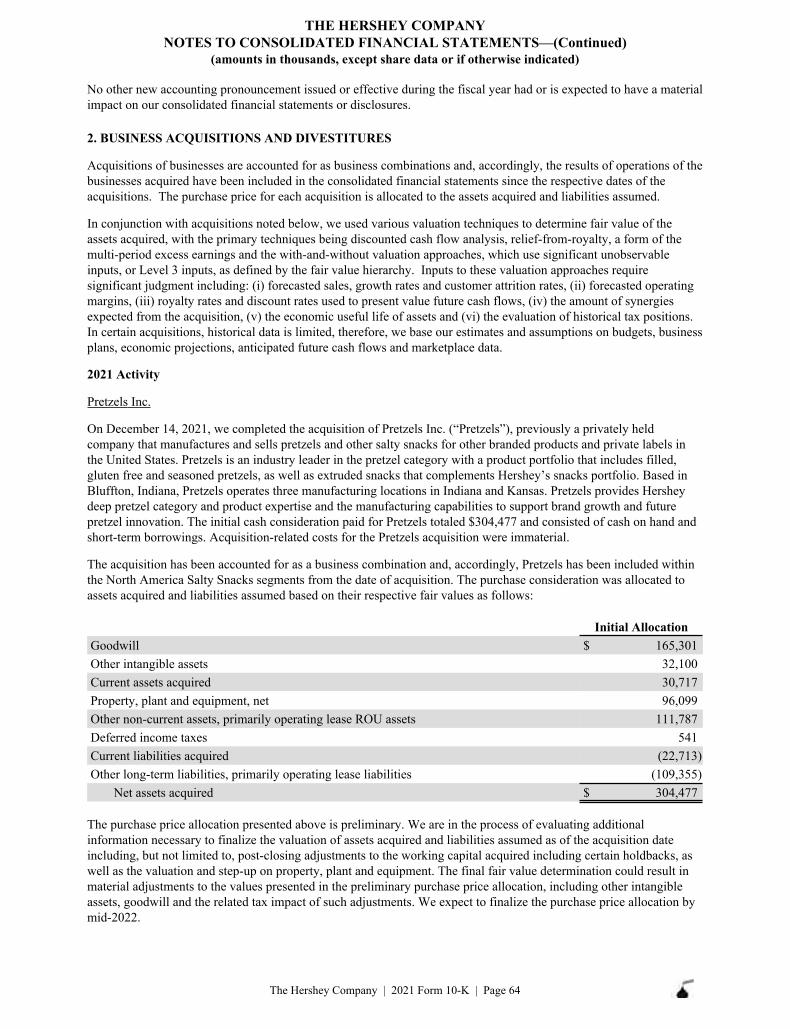
No other new accounting pronouncement issued or effective during the fiscal year had or is expected to have a material impact on our consolidated financial statements or disclosures.
2. BUSINESS ACQUISITIONS AND DIVESTITURES
Acquisitions of businesses are accounted for as business combinations and, accordingly, the results of operations of the businesses acquired have been included in the consolidated financial statements since the respective dates of the acquisitions. The purchase price for each acquisition is allocated to the assets acquired and liabilities assumed.
In conjunction with acquisitions noted below, we used various valuation techniques to determine fair value of the assets acquired, with the primary techniques being discounted cash flow analysis, relief-from-royalty, a form of the multi-period excess earnings and the with-and-without valuation approaches, which use significant unobservable inputs, or Level 3 inputs, as defined by the fair value hierarchy. Inputs to these valuation approaches require significant judgment including: (i) forecasted sales, growth rates and customer attrition rates, (ii) forecasted operating margins, (iii) royalty rates and discount rates used to present value future cash flows, (iv) the amount of synergies expected from the acquisition, (v) the economic useful life of assets and (vi) the evaluation of historical tax positions. In certain acquisitions, historical data is limited, therefore, we base our estimates and assumptions on budgets, business plans, economic projections, anticipated future cash flows and marketplace data.
2021 Activity
Pretzels Inc.
On December 14, 2021, we completed the acquisition of Pretzels Inc. (“Pretzels”), previously a privately held company that manufactures and sells pretzels and other salty snacks for other branded products and private labels in the United States. Pretzels is an industry leader in the pretzel category with a product portfolio that includes filled, gluten free and seasoned pretzels, as well as extruded snacks that complements Hershey’s snacks portfolio. Based in Bluffton, Indiana, Pretzels operates three manufacturing locations in Indiana and Kansas. Pretzels provides Hershey deep pretzel category and product expertise and the manufacturing capabilities to support brand growth and future pretzel innovation. The initial cash consideration paid for Pretzels totaled $304,477 and consisted of cash on hand and short-term borrowings. Acquisition-related costs for the Pretzels acquisition were immaterial.
The acquisition has been accounted for as a business combination and, accordingly, Pretzels has been included within the North America Salty Snacks segments from the date of acquisition. The purchase consideration was allocated to assets acquired and liabilities assumed based on their respective fair values as follows:
Initial AllocationGoodwill $ 165,301 Other intangible assets 32,100 Current assets acquired 30,717 Property, plant and equipment, net 96,099 Other non-current assets, primarily operating lease ROU assets 111,787 Deferred income taxes 541 Current liabilities acquired (22,713) Other long-term liabilities, primarily operating lease liabilities (109,355)
Net assets acquired $ 304,477
The purchase price allocation presented above is preliminary. We are in the process of evaluating additional information necessary to finalize the valuation of assets acquired and liabilities assumed as of the acquisition date including, but not limited to, post-closing adjustments to the working capital acquired including certain holdbacks, as well as the valuation and step-up on property, plant and equipment. The final fair value determination could result in material adjustments to the values presented in the preliminary purchase price allocation, including other intangible assets, goodwill and the related tax impact of such adjustments. We expect to finalize the purchase price allocation by mid-2022.
THE HERSHEY COMPANYNOTES TO CONSOLIDATED FINANCIAL STATEMENTS—(Continued)
(amounts in thousands, except share data or if otherwise indicated)
The Hershey Company | 2021 Form 10-K | Page 64
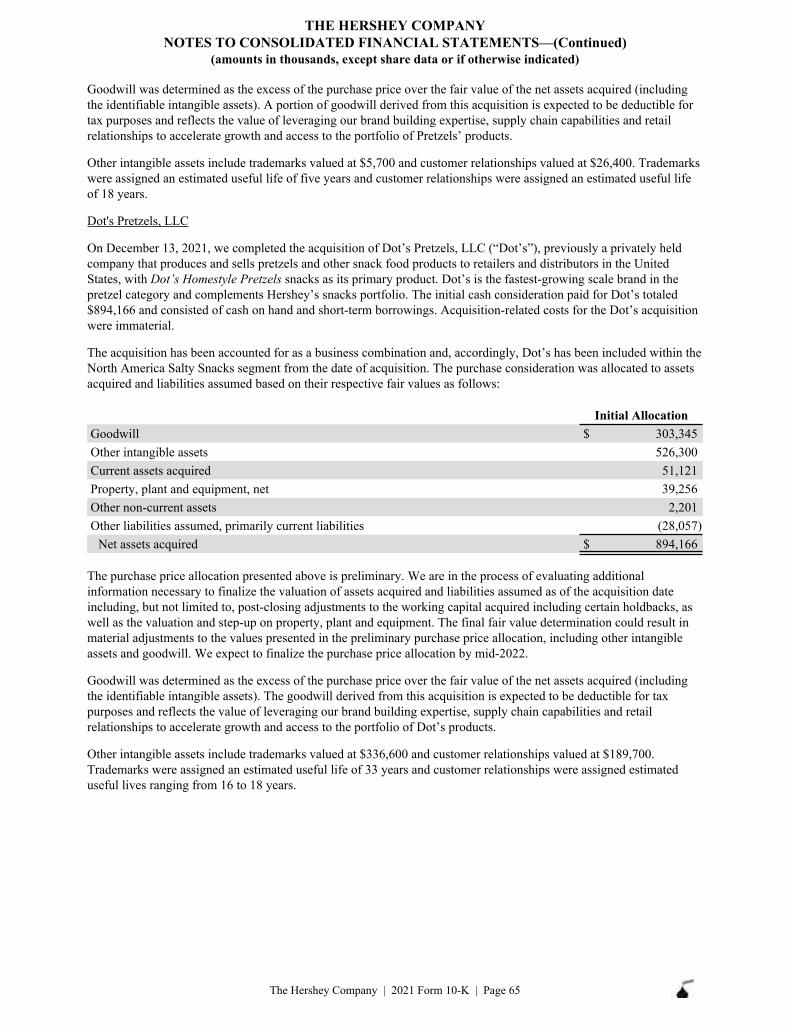
Goodwill was determined as the excess of the purchase price over the fair value of the net assets acquired (including the identifiable intangible assets). A portion of goodwill derived from this acquisition is expected to be deductible for tax purposes and reflects the value of leveraging our brand building expertise, supply chain capabilities and retail relationships to accelerate growth and access to the portfolio of Pretzels’ products.
Other intangible assets include trademarks valued at $5,700 and customer relationships valued at $26,400. Trademarks were assigned an estimated useful life of five years and customer relationships were assigned an estimated useful life of 18 years.
Dot's Pretzels, LLC
On December 13, 2021, we completed the acquisition of Dot’s Pretzels, LLC (“Dot’s”), previously a privately held company that produces and sells pretzels and other snack food products to retailers and distributors in the United States, with Dot’s Homestyle Pretzels snacks as its primary product. Dot’s is the fastest-growing scale brand in the pretzel category and complements Hershey’s snacks portfolio. The initial cash consideration paid for Dot’s totaled $894,166 and consisted of cash on hand and short-term borrowings. Acquisition-related costs for the Dot’s acquisition were immaterial.
The acquisition has been accounted for as a business combination and, accordingly, Dot’s has been included within the North America Salty Snacks segment from the date of acquisition. The purchase consideration was allocated to assets acquired and liabilities assumed based on their respective fair values as follows:
Initial AllocationGoodwill $ 303,345 Other intangible assets 526,300 Current assets acquired 51,121 Property, plant and equipment, net 39,256 Other non-current assets 2,201 Other liabilities assumed, primarily current liabilities (28,057)
Net assets acquired $ 894,166
The purchase price allocation presented above is preliminary. We are in the process of evaluating additional information necessary to finalize the valuation of assets acquired and liabilities assumed as of the acquisition date including, but not limited to, post-closing adjustments to the working capital acquired including certain holdbacks, as well as the valuation and step-up on property, plant and equipment. The final fair value determination could result in material adjustments to the values presented in the preliminary purchase price allocation, including other intangible assets and goodwill. We expect to finalize the purchase price allocation by mid-2022.
Goodwill was determined as the excess of the purchase price over the fair value of the net assets acquired (including the identifiable intangible assets). The goodwill derived from this acquisition is expected to be deductible for tax purposes and reflects the value of leveraging our brand building expertise, supply chain capabilities and retail relationships to accelerate growth and access to the portfolio of Dot’s products.
Other intangible assets include trademarks valued at $336,600 and customer relationships valued at $189,700. Trademarks were assigned an estimated useful life of 33 years and customer relationships were assigned estimated useful lives ranging from 16 to 18 years.
THE HERSHEY COMPANYNOTES TO CONSOLIDATED FINANCIAL STATEMENTS—(Continued)
(amounts in thousands, except share data or if otherwise indicated)
The Hershey Company | 2021 Form 10-K | Page 65
Lily's Sweets, LLC
On June 25, 2021, we completed the acquisition of Lily’s Sweets, LLC (“Lily’s”), previously a privately held company that sells a line of sugar-free and low-sugar confectionery foods to retailers and distributors in the United States and Canada. Lily’s products include dark and milk chocolate style bars, baking chips, peanut butter cups and other confection products that complement Hershey’s confectionery and confectionery-based portfolio. The cash consideration paid for Lily’s totaled $422,210 and the Company may be required to pay additional cash consideration if certain defined targets related to net sales and gross margin are exceeded during the period from the closing date through December 31, 2021. As of the acquisition date, the estimated fair value of the contingent consideration obligation was classified as a liability of $5,000 and was determined using a scenario-based analysis on forecasted future results. Based on financial results through December 31, 2021, the fair value was reduced during the fourth quarter of 2021 to $1,250, with the adjustment to fair value recorded in the selling, marketing and administrative (“SM&A”) expense caption within the Consolidated Statements of Income. Acquisition-related costs for the Lily’s acquisition were immaterial.
The acquisition has been accounted for as a business combination and, accordingly, Lily’s has been included within the North America Confectionery segment from the date of acquisition. The purchase consideration, inclusive of the acquisition date fair value of the contingent consideration, was allocated to assets acquired and liabilities assumed based on their respective fair values as follows:
Goodwill $ 175,826 Other intangible assets 235,800 Other assets acquired, primarily current assets 33,092 Other liabilities assumed, primarily current liabilities (9,620) Deferred income taxes (7,888)
Net assets acquired $ 427,210
The purchase price allocation presented above has been finalized as of the fourth quarter of 2021 and includes an immaterial amount of measurement period adjustments. The measurement period adjustments to the initial allocation were based on more detailed information obtained about the specific assets acquired and liabilities assumed.
Goodwill was determined as the excess of the purchase price over the fair value of the net assets acquired (including the identifiable intangible assets). The majority of goodwill derived from this acquisition is expected to be deductible for tax purposes and reflects the value of leveraging our brand building expertise, supply chain capabilities and retail relationships to accelerate growth and access to the portfolio of Lily’s products.
Other intangible assets include trademarks valued at $151,600 and customer relationships valued at $84,200. Trademarks were assigned an estimated useful life of 33 years and customer relationships were assigned estimated useful lives ranging from 17 to 18 years.
Lotte Shanghai Foods Co., Ltd.
In January 2021, we completed the divestiture of Lotte Shanghai Foods Co., Ltd. (“LSFC”), which was previously included within the International segment results in our consolidated financial statements. Total proceeds from the divestiture and the impact on our consolidated financial statements were immaterial and were recorded in the SM&A expense caption within the Consolidated Statements of Income.
THE HERSHEY COMPANYNOTES TO CONSOLIDATED FINANCIAL STATEMENTS—(Continued)
(amounts in thousands, except share data or if otherwise indicated)
The Hershey Company | 2021 Form 10-K | Page 66
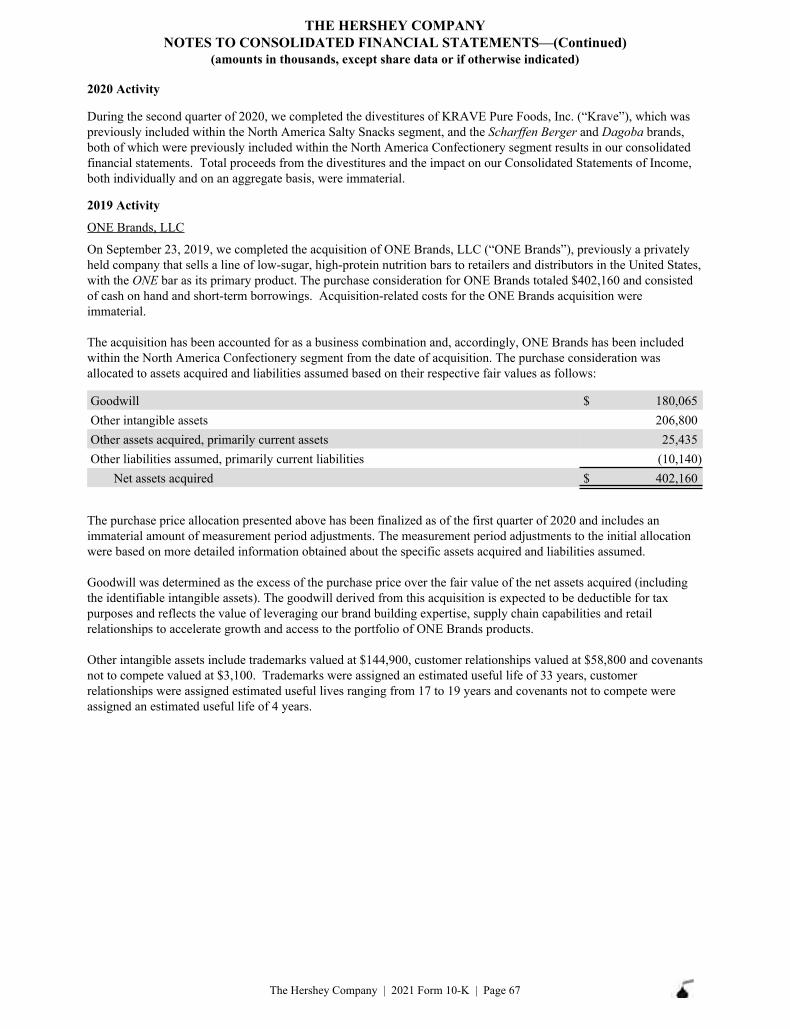
2020 Activity
During the second quarter of 2020, we completed the divestitures of KRAVE Pure Foods, Inc. (“Krave”), which was previously included within the North America Salty Snacks segment, and the Scharffen Berger and Dagoba brands, both of which were previously included within the North America Confectionery segment results in our consolidated financial statements. Total proceeds from the divestitures and the impact on our Consolidated Statements of Income, both individually and on an aggregate basis, were immaterial.
2019 Activity
ONE Brands, LLC
On September 23, 2019, we completed the acquisition of ONE Brands, LLC (“ONE Brands”), previously a privately held company that sells a line of low-sugar, high-protein nutrition bars to retailers and distributors in the United States, with the ONE bar as its primary product. The purchase consideration for ONE Brands totaled $402,160 and consisted of cash on hand and short-term borrowings. Acquisition-related costs for the ONE Brands acquisition were immaterial.
The acquisition has been accounted for as a business combination and, accordingly, ONE Brands has been included within the North America Confectionery segment from the date of acquisition. The purchase consideration was allocated to assets acquired and liabilities assumed based on their respective fair values as follows:
Goodwill $ 180,065 Other intangible assets 206,800 Other assets acquired, primarily current assets 25,435 Other liabilities assumed, primarily current liabilities (10,140)
Net assets acquired $ 402,160
The purchase price allocation presented above has been finalized as of the first quarter of 2020 and includes an immaterial amount of measurement period adjustments. The measurement period adjustments to the initial allocation were based on more detailed information obtained about the specific assets acquired and liabilities assumed.
Goodwill was determined as the excess of the purchase price over the fair value of the net assets acquired (including the identifiable intangible assets). The goodwill derived from this acquisition is expected to be deductible for tax purposes and reflects the value of leveraging our brand building expertise, supply chain capabilities and retail relationships to accelerate growth and access to the portfolio of ONE Brands products.
Other intangible assets include trademarks valued at $144,900, customer relationships valued at $58,800 and covenants not to compete valued at $3,100. Trademarks were assigned an estimated useful life of 33 years, customer relationships were assigned estimated useful lives ranging from 17 to 19 years and covenants not to compete were assigned an estimated useful life of 4 years.
THE HERSHEY COMPANYNOTES TO CONSOLIDATED FINANCIAL STATEMENTS—(Continued)
(amounts in thousands, except share data or if otherwise indicated)
The Hershey Company | 2021 Form 10-K | Page 67
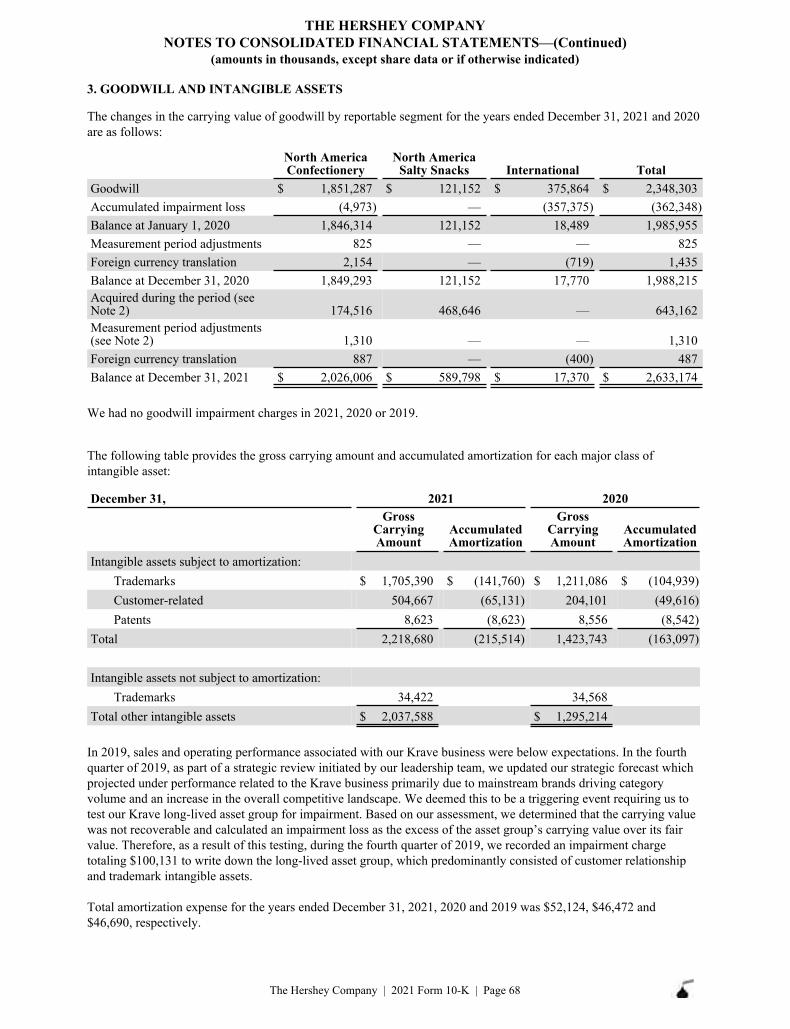
3. GOODWILL AND INTANGIBLE ASSETS
The changes in the carrying value of goodwill by reportable segment for the years ended December 31, 2021 and 2020 are as follows:
Goodwill $ 1,851,287 $ 121,152 $ 375,864 $ 2,348,303 Accumulated impairment loss (4,973) — (357,375) (362,348) Balance at January 1, 2020 1,846,314 121,152 18,489 1,985,955 Measurement period adjustments 825 — — 825 Foreign currency translation 2,154 — (719) 1,435Balance at December 31, 2020 1,849,293 121,152 17,770 1,988,215 Acquired during the period (see Note 2) 174,516 468,646 — 643,162 Measurement period adjustments (see Note 2) 1,310 — — 1,310 Foreign currency translation 887 — (400) 487Balance at December 31, 2021 $ 2,026,006 $ 589,798 $ 17,370 $ 2,633,174
North America Confectionery
North America Salty Snacks International Total
We had no goodwill impairment charges in 2021, 2020 or 2019.
The following table provides the gross carrying amount and accumulated amortization for each major class of intangible asset:
December 31, 2021 2020Gross
Carrying Amount
Accumulated Amortization
Gross Carrying Amount
Accumulated Amortization
Intangible assets subject to amortization:Trademarks $ 1,705,390 $ (141,760) $ 1,211,086 $ (104,939) Customer-related 504,667 (65,131) 204,101 (49,616) Patents 8,623 (8,623) 8,556 (8,542)
Total 2,218,680 (215,514) 1,423,743 (163,097)
Intangible assets not subject to amortization:Trademarks 34,422 34,568
Total other intangible assets $ 2,037,588 $ 1,295,214
In 2019, sales and operating performance associated with our Krave business were below expectations. In the fourth quarter of 2019, as part of a strategic review initiated by our leadership team, we updated our strategic forecast which projected under performance related to the Krave business primarily due to mainstream brands driving category volume and an increase in the overall competitive landscape. We deemed this to be a triggering event requiring us to test our Krave long-lived asset group for impairment. Based on our assessment, we determined that the carrying value was not recoverable and calculated an impairment loss as the excess of the asset group’s carrying value over its fair value. Therefore, as a result of this testing, during the fourth quarter of 2019, we recorded an impairment charge totaling $100,131 to write down the long-lived asset group, which predominantly consisted of customer relationship and trademark intangible assets.
Total amortization expense for the years ended December 31, 2021, 2020 and 2019 was $52,124, $46,472 and $46,690, respectively.
THE HERSHEY COMPANYNOTES TO CONSOLIDATED FINANCIAL STATEMENTS—(Continued)
(amounts in thousands, except share data or if otherwise indicated)
The Hershey Company | 2021 Form 10-K | Page 68
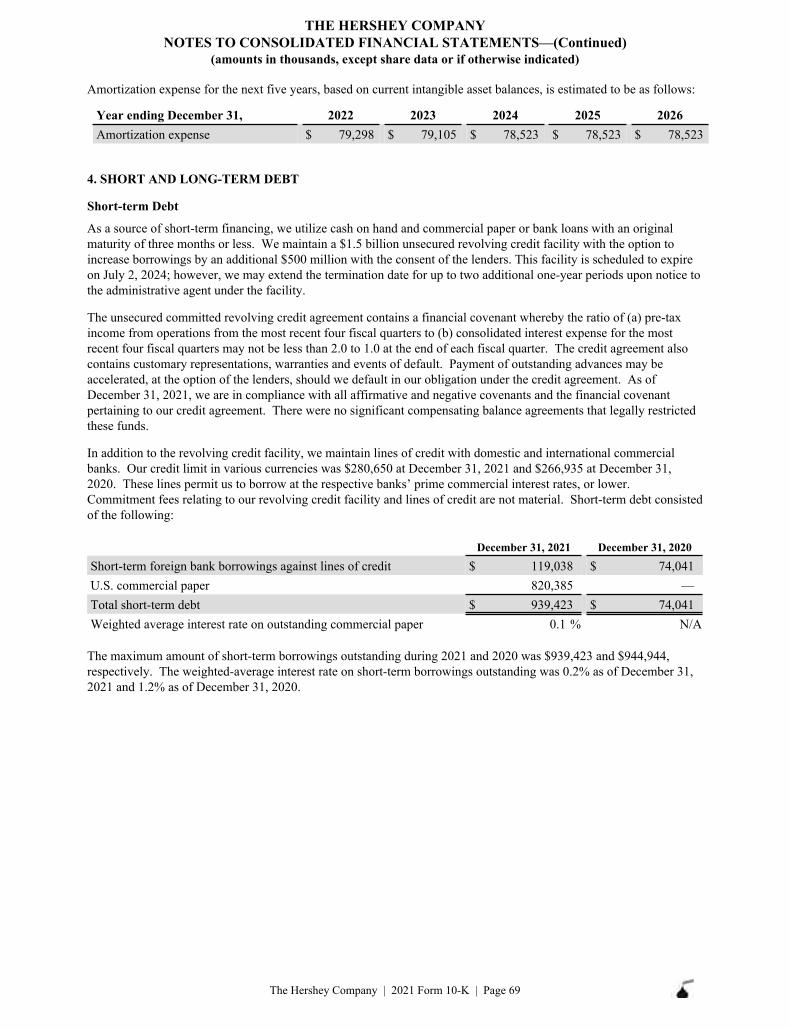
Amortization expense for the next five years, based on current intangible asset balances, is estimated to be as follows:
Year ending December 31, 2022 2023 2024 2025 2026Amortization expense $ 79,298 $ 79,105 $ 78,523 $ 78,523 $ 78,523
4. SHORT AND LONG-TERM DEBT
Short-term Debt
As a source of short-term financing, we utilize cash on hand and commercial paper or bank loans with an original maturity of three months or less. We maintain a $1.5 billion unsecured revolving credit facility with the option to increase borrowings by an additional $500 million with the consent of the lenders. This facility is scheduled to expire on July 2, 2024; however, we may extend the termination date for up to two additional one-year periods upon notice to the administrative agent under the facility.
The unsecured committed revolving credit agreement contains a financial covenant whereby the ratio of (a) pre-tax income from operations from the most recent four fiscal quarters to (b) consolidated interest expense for the most recent four fiscal quarters may not be less than 2.0 to 1.0 at the end of each fiscal quarter. The credit agreement also contains customary representations, warranties and events of default. Payment of outstanding advances may be accelerated, at the option of the lenders, should we default in our obligation under the credit agreement. As of December 31, 2021, we are in compliance with all affirmative and negative covenants and the financial covenant pertaining to our credit agreement. There were no significant compensating balance agreements that legally restricted these funds.
In addition to the revolving credit facility, we maintain lines of credit with domestic and international commercial banks. Our credit limit in various currencies was $280,650 at December 31, 2021 and $266,935 at December 31, 2020. These lines permit us to borrow at the respective banks’ prime commercial interest rates, or lower. Commitment fees relating to our revolving credit facility and lines of credit are not material. Short-term debt consisted of the following:
December 31, 2021 December 31, 2020Short-term foreign bank borrowings against lines of credit $ 119,038 $ 74,041 U.S. commercial paper 820,385 — Total short-term debt $ 939,423 $ 74,041 Weighted average interest rate on outstanding commercial paper 0.1 % N/A
The maximum amount of short-term borrowings outstanding during 2021 and 2020 was $939,423 and $944,944, respectively. The weighted-average interest rate on short-term borrowings outstanding was 0.2% as of December 31, 2021 and 1.2% as of December 31, 2020.
THE HERSHEY COMPANYNOTES TO CONSOLIDATED FINANCIAL STATEMENTS—(Continued)
(amounts in thousands, except share data or if otherwise indicated)
The Hershey Company | 2021 Form 10-K | Page 69
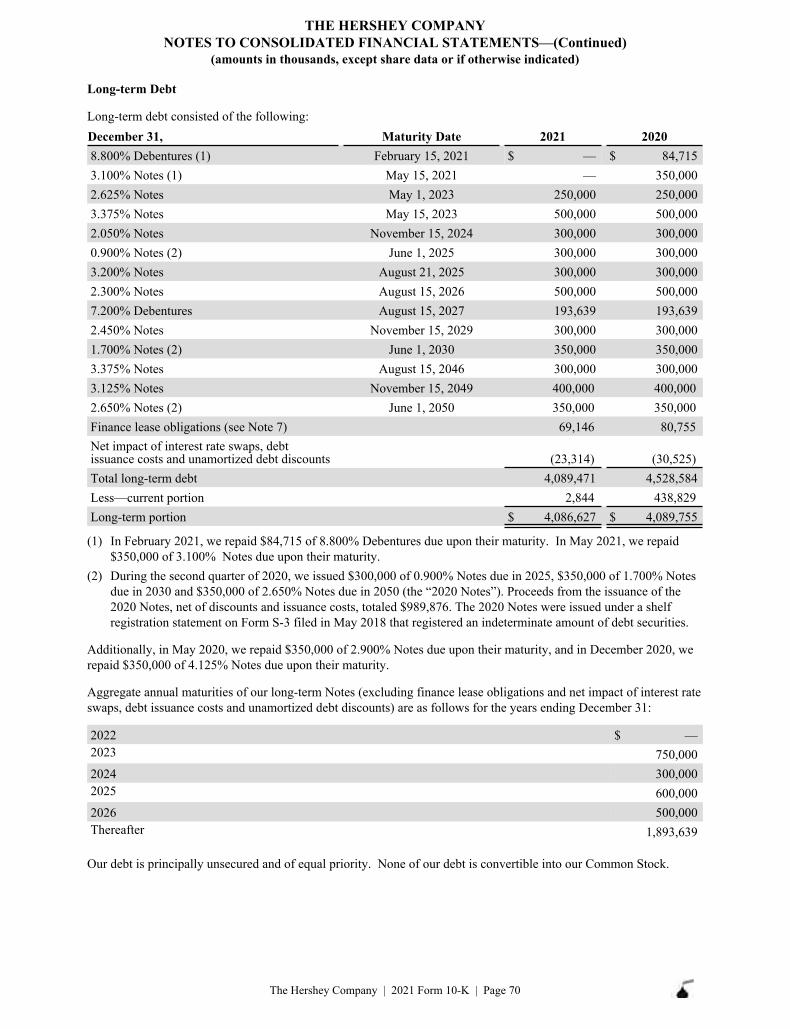
Long-term Debt
Long-term debt consisted of the following:
8.800% Debentures (1) February 15, 2021 $ — $ 84,715 3.100% Notes (1) May 15, 2021 — 350,000 2.625% Notes May 1, 2023 250,000 250,000 3.375% Notes May 15, 2023 500,000 500,000 2.050% Notes November 15, 2024 300,000 300,000 0.900% Notes (2) June 1, 2025 300,000 300,000 3.200% Notes August 21, 2025 300,000 300,000 2.300% Notes August 15, 2026 500,000 500,000 7.200% Debentures August 15, 2027 193,639 193,639 2.450% Notes November 15, 2029 300,000 300,000 1.700% Notes (2) June 1, 2030 350,000 350,000 3.375% Notes August 15, 2046 300,000 300,000 3.125% Notes November 15, 2049 400,000 400,000 2.650% Notes (2) June 1, 2050 350,000 350,000 Finance lease obligations (see Note 7) 69,146 80,755 Net impact of interest rate swaps, debt issuance costs and unamortized debt discounts (23,314) (30,525) Total long-term debt 4,089,471 4,528,584 Less—current portion 2,844 438,829 Long-term portion $ 4,086,627 $ 4,089,755
December 31, Maturity Date 2021 2020
(1) In February 2021, we repaid $84,715 of 8.800% Debentures due upon their maturity. In May 2021, we repaid$350,000 of 3.100% Notes due upon their maturity.
(2) During the second quarter of 2020, we issued $300,000 of 0.900% Notes due in 2025, $350,000 of 1.700% Notesdue in 2030 and $350,000 of 2.650% Notes due in 2050 (the “2020 Notes”). Proceeds from the issuance of the2020 Notes, net of discounts and issuance costs, totaled $989,876. The 2020 Notes were issued under a shelfregistration statement on Form S-3 filed in May 2018 that registered an indeterminate amount of debt securities.
Additionally, in May 2020, we repaid $350,000 of 2.900% Notes due upon their maturity, and in December 2020, we repaid $350,000 of 4.125% Notes due upon their maturity.
Aggregate annual maturities of our long-term Notes (excluding finance lease obligations and net impact of interest rate swaps, debt issuance costs and unamortized debt discounts) are as follows for the years ending December 31:
2022 $ — 2023 750,000 2024 300,000 2025 600,000 2026 500,000 Thereafter 1,893,639
Our debt is principally unsecured and of equal priority. None of our debt is convertible into our Common Stock.
THE HERSHEY COMPANYNOTES TO CONSOLIDATED FINANCIAL STATEMENTS—(Continued)
(amounts in thousands, except share data or if otherwise indicated)
The Hershey Company | 2021 Form 10-K | Page 70
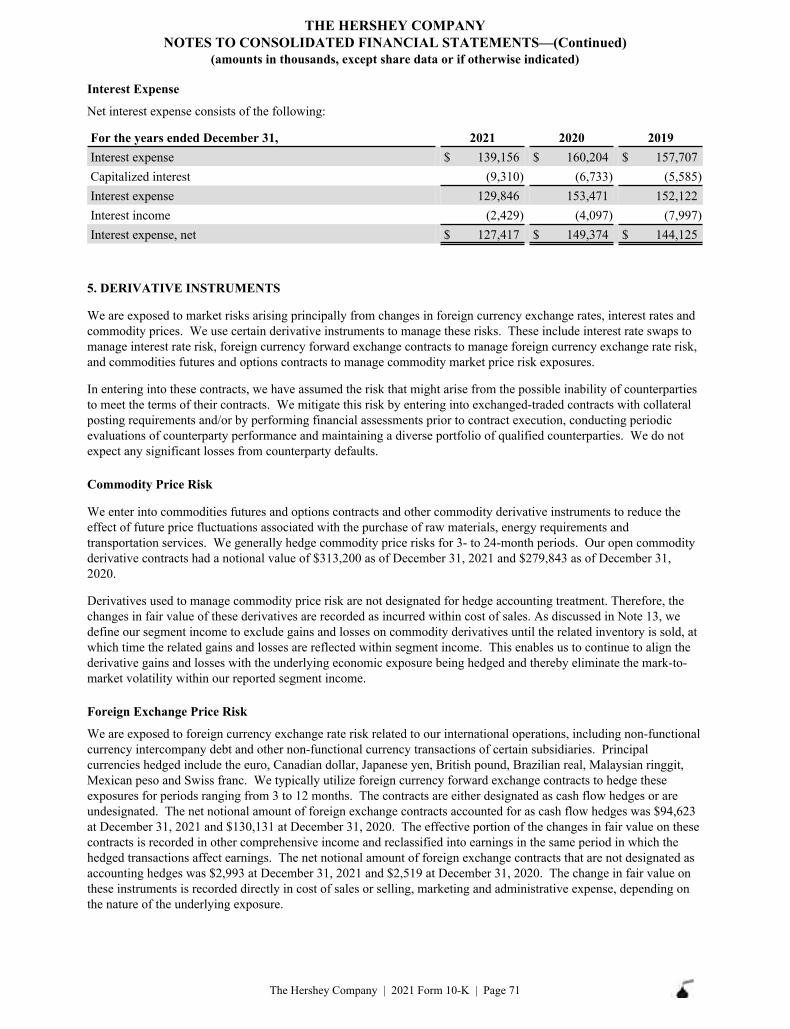
Interest Expense
Net interest expense consists of the following:
Interest expense $ 139,156 $ 160,204 $ 157,707 Capitalized interest (9,310) (6,733) (5,585) Interest expense 129,846 153,471 152,122 Interest income (2,429) (4,097) (7,997) Interest expense, net $ 127,417 $ 149,374 $ 144,125
For the years ended December 31, 2021 2020 2019
5. DERIVATIVE INSTRUMENTS
We are exposed to market risks arising principally from changes in foreign currency exchange rates, interest rates and commodity prices. We use certain derivative instruments to manage these risks. These include interest rate swaps to manage interest rate risk, foreign currency forward exchange contracts to manage foreign currency exchange rate risk, and commodities futures and options contracts to manage commodity market price risk exposures.
In entering into these contracts, we have assumed the risk that might arise from the possible inability of counterparties to meet the terms of their contracts. We mitigate this risk by entering into exchanged-traded contracts with collateral posting requirements and/or by performing financial assessments prior to contract execution, conducting periodic evaluations of counterparty performance and maintaining a diverse portfolio of qualified counterparties. We do not expect any significant losses from counterparty defaults.
Commodity Price Risk
We enter into commodities futures and options contracts and other commodity derivative instruments to reduce the effect of future price fluctuations associated with the purchase of raw materials, energy requirements and transportation services. We generally hedge commodity price risks for 3- to 24-month periods. Our open commodity derivative contracts had a notional value of $313,200 as of December 31, 2021 and $279,843 as of December 31, 2020.
Derivatives used to manage commodity price risk are not designated for hedge accounting treatment. Therefore, the changes in fair value of these derivatives are recorded as incurred within cost of sales. As discussed in Note 13, we define our segment income to exclude gains and losses on commodity derivatives until the related inventory is sold, at which time the related gains and losses are reflected within segment income. This enables us to continue to align the derivative gains and losses with the underlying economic exposure being hedged and thereby eliminate the mark-to-market volatility within our reported segment income.
Foreign Exchange Price Risk
We are exposed to foreign currency exchange rate risk related to our international operations, including non-functional currency intercompany debt and other non-functional currency transactions of certain subsidiaries. Principal currencies hedged include the euro, Canadian dollar, Japanese yen, British pound, Brazilian real, Malaysian ringgit, Mexican peso and Swiss franc. We typically utilize foreign currency forward exchange contracts to hedge these exposures for periods ranging from 3 to 12 months. The contracts are either designated as cash flow hedges or are undesignated. The net notional amount of foreign exchange contracts accounted for as cash flow hedges was $94,623 at December 31, 2021 and $130,131 at December 31, 2020. The effective portion of the changes in fair value on these contracts is recorded in other comprehensive income and reclassified into earnings in the same period in which the hedged transactions affect earnings. The net notional amount of foreign exchange contracts that are not designated as accounting hedges was $2,993 at December 31, 2021 and $2,519 at December 31, 2020. The change in fair value on these instruments is recorded directly in cost of sales or selling, marketing and administrative expense, depending on the nature of the underlying exposure.
THE HERSHEY COMPANYNOTES TO CONSOLIDATED FINANCIAL STATEMENTS—(Continued)
(amounts in thousands, except share data or if otherwise indicated)
The Hershey Company | 2021 Form 10-K | Page 71
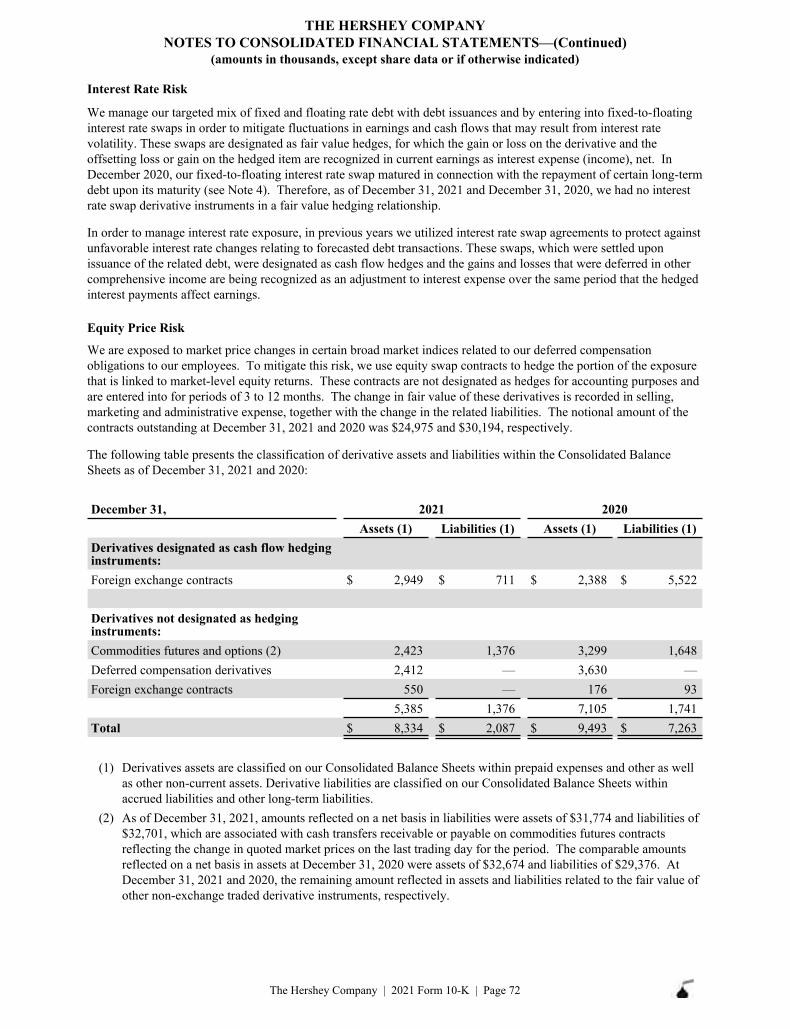
Interest Rate Risk
We manage our targeted mix of fixed and floating rate debt with debt issuances and by entering into fixed-to-floating interest rate swaps in order to mitigate fluctuations in earnings and cash flows that may result from interest rate volatility. These swaps are designated as fair value hedges, for which the gain or loss on the derivative and the offsetting loss or gain on the hedged item are recognized in current earnings as interest expense (income), net. In December 2020, our fixed-to-floating interest rate swap matured in connection with the repayment of certain long-term debt upon its maturity (see Note 4). Therefore, as of December 31, 2021 and December 31, 2020, we had no interest rate swap derivative instruments in a fair value hedging relationship.
In order to manage interest rate exposure, in previous years we utilized interest rate swap agreements to protect against unfavorable interest rate changes relating to forecasted debt transactions. These swaps, which were settled upon issuance of the related debt, were designated as cash flow hedges and the gains and losses that were deferred in other comprehensive income are being recognized as an adjustment to interest expense over the same period that the hedged interest payments affect earnings.
Equity Price Risk
We are exposed to market price changes in certain broad market indices related to our deferred compensation obligations to our employees. To mitigate this risk, we use equity swap contracts to hedge the portion of the exposure that is linked to market-level equity returns. These contracts are not designated as hedges for accounting purposes and are entered into for periods of 3 to 12 months. The change in fair value of these derivatives is recorded in selling, marketing and administrative expense, together with the change in the related liabilities. The notional amount of the contracts outstanding at December 31, 2021 and 2020 was $24,975 and $30,194, respectively.
The following table presents the classification of derivative assets and liabilities within the Consolidated Balance Sheets as of December 31, 2021 and 2020:
December 31, 2021 2020Assets (1) Liabilities (1) Assets (1) Liabilities (1)
Derivatives designated as cash flow hedging instruments:Foreign exchange contracts $ 2,949 $ 711 $ 2,388 $ 5,522
Derivatives not designated as hedging instruments:Commodities futures and options (2) 2,423 1,376 3,299 1,648 Deferred compensation derivatives 2,412 — 3,630 — Foreign exchange contracts 550 — 176 93
5,385 1,376 7,105 1,741 Total $ 8,334 $ 2,087 $ 9,493 $ 7,263
(1) Derivatives assets are classified on our Consolidated Balance Sheets within prepaid expenses and other as wellas other non-current assets. Derivative liabilities are classified on our Consolidated Balance Sheets withinaccrued liabilities and other long-term liabilities.
(2) As of December 31, 2021, amounts reflected on a net basis in liabilities were assets of $31,774 and liabilities of$32,701, which are associated with cash transfers receivable or payable on commodities futures contractsreflecting the change in quoted market prices on the last trading day for the period. The comparable amountsreflected on a net basis in assets at December 31, 2020 were assets of $32,674 and liabilities of $29,376. AtDecember 31, 2021 and 2020, the remaining amount reflected in assets and liabilities related to the fair value ofother non-exchange traded derivative instruments, respectively.
THE HERSHEY COMPANYNOTES TO CONSOLIDATED FINANCIAL STATEMENTS—(Continued)
(amounts in thousands, except share data or if otherwise indicated)
The Hershey Company | 2021 Form 10-K | Page 72
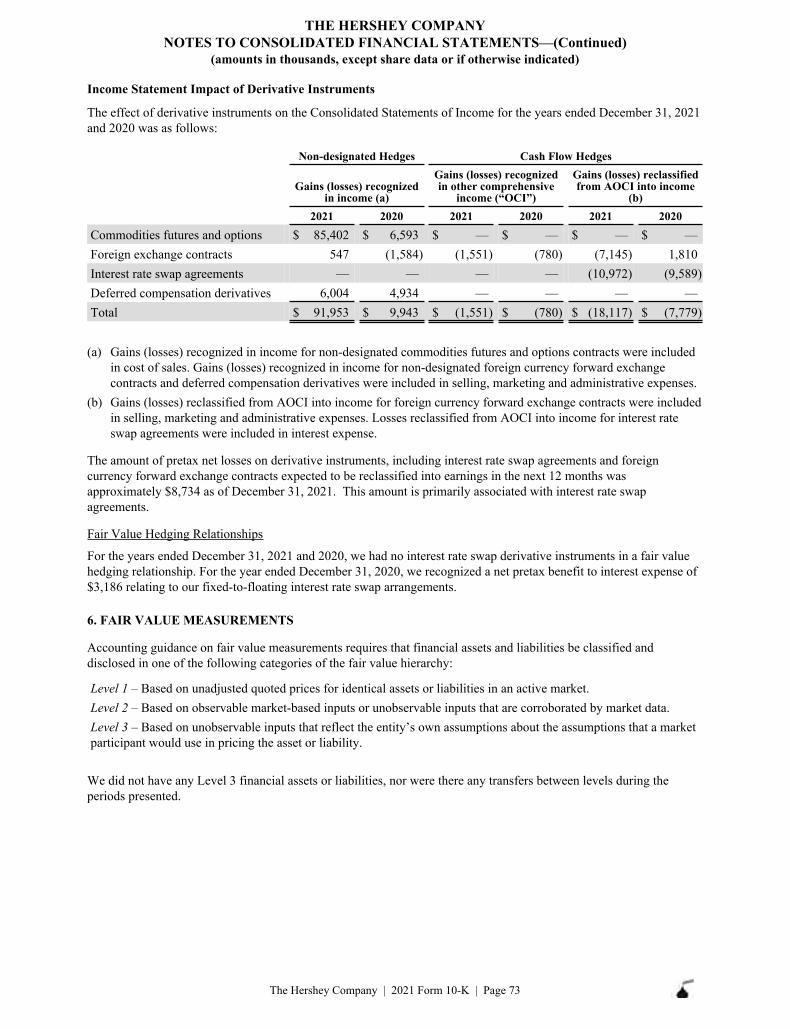
Income Statement Impact of Derivative Instruments
The effect of derivative instruments on the Consolidated Statements of Income for the years ended December 31, 2021 and 2020 was as follows:
Non-designated Hedges Cash Flow Hedges
Gains (losses) recognized in income (a)
Gains (losses) recognized in other comprehensive
income (“OCI”)
Gains (losses) reclassified from AOCI into income
(b)2021 2020 2021 2020 2021 2020
Commodities futures and options $ 85,402 $ 6,593 $ — $ — $ — $ — Foreign exchange contracts 547 (1,584) (1,551) (780) (7,145) 1,810 Interest rate swap agreements — — — — (10,972) (9,589) Deferred compensation derivatives 6,004 4,934 — — — — Total $ 91,953 $ 9,943 $ (1,551) $ (780) $ (18,117) $ (7,779)
(a) Gains (losses) recognized in income for non-designated commodities futures and options contracts were includedin cost of sales. Gains (losses) recognized in income for non-designated foreign currency forward exchangecontracts and deferred compensation derivatives were included in selling, marketing and administrative expenses.
(b) Gains (losses) reclassified from AOCI into income for foreign currency forward exchange contracts were includedin selling, marketing and administrative expenses. Losses reclassified from AOCI into income for interest rateswap agreements were included in interest expense.
The amount of pretax net losses on derivative instruments, including interest rate swap agreements and foreign currency forward exchange contracts expected to be reclassified into earnings in the next 12 months was approximately $8,734 as of December 31, 2021. This amount is primarily associated with interest rate swap agreements.
Fair Value Hedging Relationships
For the years ended December 31, 2021 and 2020, we had no interest rate swap derivative instruments in a fair value hedging relationship. For the year ended December 31, 2020, we recognized a net pretax benefit to interest expense of $3,186 relating to our fixed-to-floating interest rate swap arrangements.
6. FAIR VALUE MEASUREMENTS
Accounting guidance on fair value measurements requires that financial assets and liabilities be classified and disclosed in one of the following categories of the fair value hierarchy:
Level 1 – Based on unadjusted quoted prices for identical assets or liabilities in an active market. Level 2 – Based on observable market-based inputs or unobservable inputs that are corroborated by market data.Level 3 – Based on unobservable inputs that reflect the entity’s own assumptions about the assumptions that a market participant would use in pricing the asset or liability.
We did not have any Level 3 financial assets or liabilities, nor were there any transfers between levels during the periods presented.
THE HERSHEY COMPANYNOTES TO CONSOLIDATED FINANCIAL STATEMENTS—(Continued)
(amounts in thousands, except share data or if otherwise indicated)
The Hershey Company | 2021 Form 10-K | Page 73
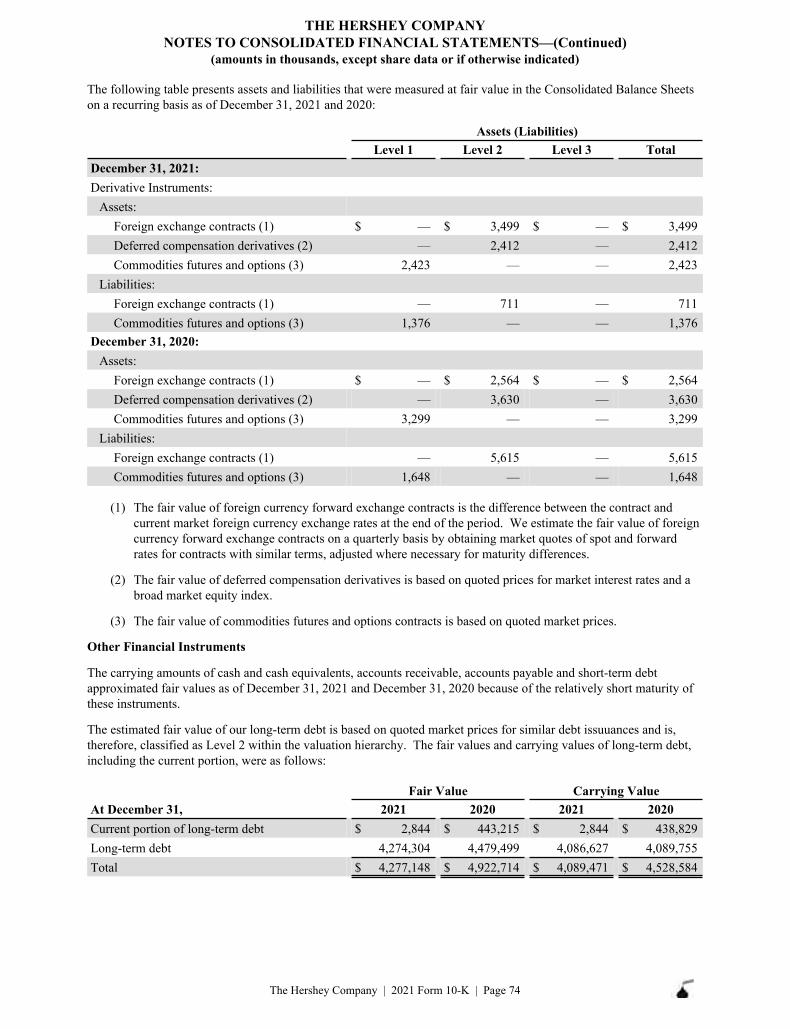
The following table presents assets and liabilities that were measured at fair value in the Consolidated Balance Sheets on a recurring basis as of December 31, 2021 and 2020:
Assets (Liabilities)Level 1 Level 2 Level 3 Total
December 31, 2021:Derivative Instruments:
Assets:Foreign exchange contracts (1) $ — $ 3,499 $ — $ 3,499 Deferred compensation derivatives (2) — 2,412 — 2,412 Commodities futures and options (3) 2,423 — — 2,423
Liabilities:Foreign exchange contracts (1) — 711 — 711 Commodities futures and options (3) 1,376 — — 1,376
December 31, 2020:Assets:
Foreign exchange contracts (1) $ — $ 2,564 $ — $ 2,564 Deferred compensation derivatives (2) — 3,630 — 3,630 Commodities futures and options (3) 3,299 — — 3,299
Liabilities:Foreign exchange contracts (1) — 5,615 — 5,615 Commodities futures and options (3) 1,648 — — 1,648
(1) The fair value of foreign currency forward exchange contracts is the difference between the contract andcurrent market foreign currency exchange rates at the end of the period. We estimate the fair value of foreigncurrency forward exchange contracts on a quarterly basis by obtaining market quotes of spot and forwardrates for contracts with similar terms, adjusted where necessary for maturity differences.
(2) The fair value of deferred compensation derivatives is based on quoted prices for market interest rates and abroad market equity index.
(3) The fair value of commodities futures and options contracts is based on quoted market prices.
Other Financial Instruments
The carrying amounts of cash and cash equivalents, accounts receivable, accounts payable and short-term debt approximated fair values as of December 31, 2021 and December 31, 2020 because of the relatively short maturity of these instruments.
The estimated fair value of our long-term debt is based on quoted market prices for similar debt issuuances and is, therefore, classified as Level 2 within the valuation hierarchy. The fair values and carrying values of long-term debt, including the current portion, were as follows:
Fair Value Carrying ValueAt December 31, 2021 2020 2021 2020Current portion of long-term debt $ 2,844 $ 443,215 $ 2,844 $ 438,829 Long-term debt 4,274,304 4,479,499 4,086,627 4,089,755 Total $ 4,277,148 $ 4,922,714 $ 4,089,471 $ 4,528,584
THE HERSHEY COMPANYNOTES TO CONSOLIDATED FINANCIAL STATEMENTS—(Continued)
(amounts in thousands, except share data or if otherwise indicated)
The Hershey Company | 2021 Form 10-K | Page 74
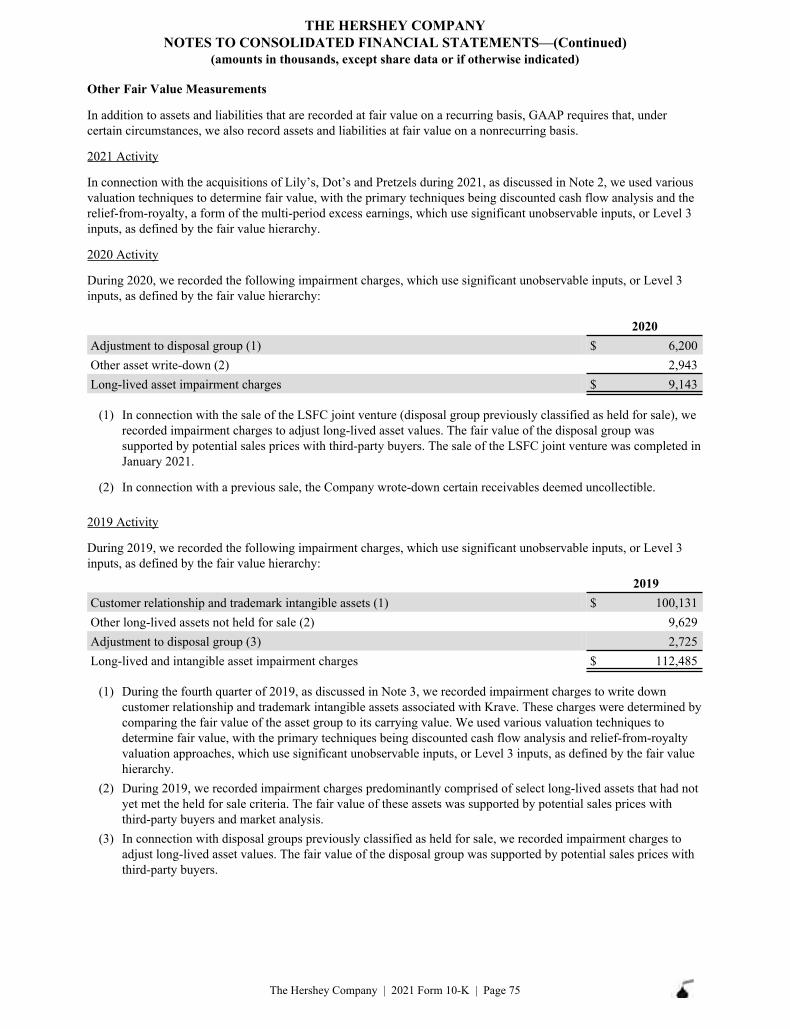
Other Fair Value Measurements
In addition to assets and liabilities that are recorded at fair value on a recurring basis, GAAP requires that, under certain circumstances, we also record assets and liabilities at fair value on a nonrecurring basis.
2021 Activity
In connection with the acquisitions of Lily’s, Dot’s and Pretzels during 2021, as discussed in Note 2, we used various valuation techniques to determine fair value, with the primary techniques being discounted cash flow analysis and the relief-from-royalty, a form of the multi-period excess earnings, which use significant unobservable inputs, or Level 3 inputs, as defined by the fair value hierarchy.
2020 Activity
During 2020, we recorded the following impairment charges, which use significant unobservable inputs, or Level 3 inputs, as defined by the fair value hierarchy:
2020Adjustment to disposal group (1) $ 6,200 Other asset write-down (2) 2,943 Long-lived asset impairment charges $ 9,143
(1) In connection with the sale of the LSFC joint venture (disposal group previously classified as held for sale), werecorded impairment charges to adjust long-lived asset values. The fair value of the disposal group wassupported by potential sales prices with third-party buyers. The sale of the LSFC joint venture was completed inJanuary 2021.
(2) In connection with a previous sale, the Company wrote-down certain receivables deemed uncollectible.
2019 Activity
During 2019, we recorded the following impairment charges, which use significant unobservable inputs, or Level 3 inputs, as defined by the fair value hierarchy:
2019Customer relationship and trademark intangible assets (1) $ 100,131 Other long-lived assets not held for sale (2) 9,629 Adjustment to disposal group (3) 2,725 Long-lived and intangible asset impairment charges $ 112,485
(1) During the fourth quarter of 2019, as discussed in Note 3, we recorded impairment charges to write downcustomer relationship and trademark intangible assets associated with Krave. These charges were determined bycomparing the fair value of the asset group to its carrying value. We used various valuation techniques todetermine fair value, with the primary techniques being discounted cash flow analysis and relief-from-royaltyvaluation approaches, which use significant unobservable inputs, or Level 3 inputs, as defined by the fair valuehierarchy.
(2) During 2019, we recorded impairment charges predominantly comprised of select long-lived assets that had notyet met the held for sale criteria. The fair value of these assets was supported by potential sales prices withthird-party buyers and market analysis.
(3) In connection with disposal groups previously classified as held for sale, we recorded impairment charges toadjust long-lived asset values. The fair value of the disposal group was supported by potential sales prices withthird-party buyers.
THE HERSHEY COMPANYNOTES TO CONSOLIDATED FINANCIAL STATEMENTS—(Continued)
(amounts in thousands, except share data or if otherwise indicated)
The Hershey Company | 2021 Form 10-K | Page 75
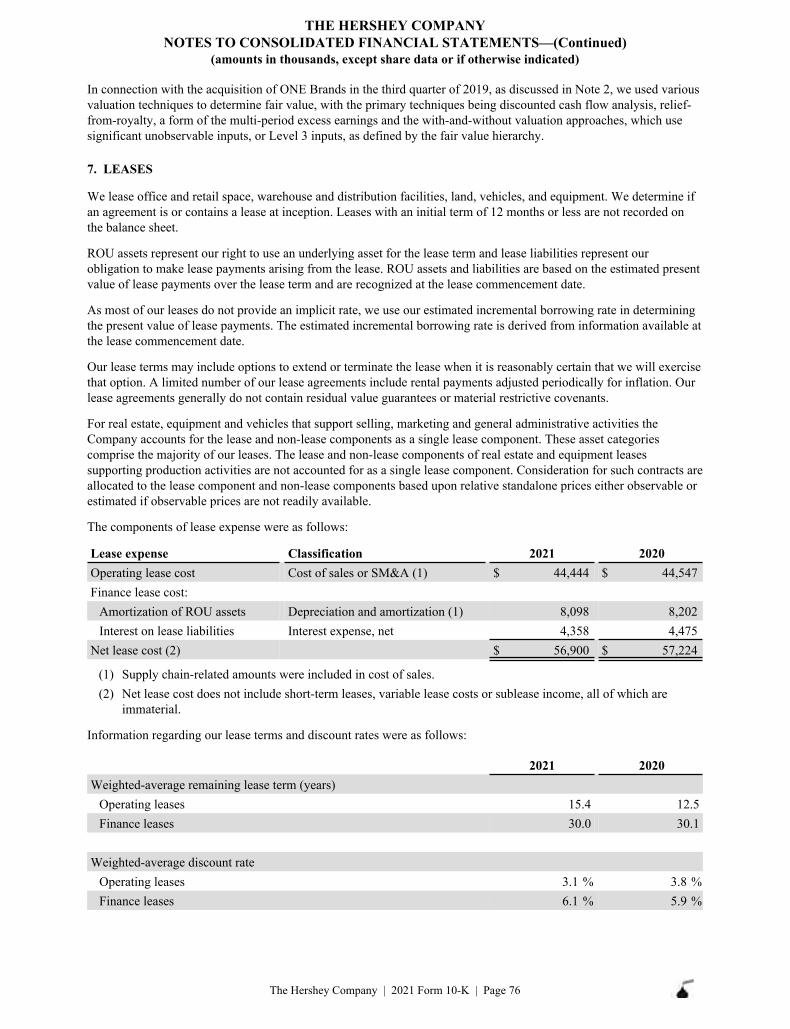
In connection with the acquisition of ONE Brands in the third quarter of 2019, as discussed in Note 2, we used various valuation techniques to determine fair value, with the primary techniques being discounted cash flow analysis, relief-from-royalty, a form of the multi-period excess earnings and the with-and-without valuation approaches, which use significant unobservable inputs, or Level 3 inputs, as defined by the fair value hierarchy.
7. LEASES
We lease office and retail space, warehouse and distribution facilities, land, vehicles, and equipment. We determine if an agreement is or contains a lease at inception. Leases with an initial term of 12 months or less are not recorded on the balance sheet.
ROU assets represent our right to use an underlying asset for the lease term and lease liabilities represent our obligation to make lease payments arising from the lease. ROU assets and liabilities are based on the estimated present value of lease payments over the lease term and are recognized at the lease commencement date.
As most of our leases do not provide an implicit rate, we use our estimated incremental borrowing rate in determining the present value of lease payments. The estimated incremental borrowing rate is derived from information available at the lease commencement date.
Our lease terms may include options to extend or terminate the lease when it is reasonably certain that we will exercise that option. A limited number of our lease agreements include rental payments adjusted periodically for inflation. Our lease agreements generally do not contain residual value guarantees or material restrictive covenants.
For real estate, equipment and vehicles that support selling, marketing and general administrative activities the Company accounts for the lease and non-lease components as a single lease component. These asset categories comprise the majority of our leases. The lease and non-lease components of real estate and equipment leases supporting production activities are not accounted for as a single lease component. Consideration for such contracts are allocated to the lease component and non-lease components based upon relative standalone prices either observable or estimated if observable prices are not readily available.
The components of lease expense were as follows:
Lease expense Classification 2021 2020Operating lease cost Cost of sales or SM&A (1) $ 44,444 $ 44,547 Finance lease cost:
Amortization of ROU assets Depreciation and amortization (1) 8,098 8,202 Interest on lease liabilities Interest expense, net 4,358 4,475
Net lease cost (2) $ 56,900 $ 57,224
(1) Supply chain-related amounts were included in cost of sales.(2) Net lease cost does not include short-term leases, variable lease costs or sublease income, all of which are
immaterial.
Information regarding our lease terms and discount rates were as follows:
2021 2020Weighted-average remaining lease term (years)
Operating leases 15.4 12.5Finance leases 30.0 30.1
Weighted-average discount rateOperating leases 3.1 % 3.8 %Finance leases 6.1 % 5.9 %
THE HERSHEY COMPANYNOTES TO CONSOLIDATED FINANCIAL STATEMENTS—(Continued)
(amounts in thousands, except share data or if otherwise indicated)
The Hershey Company | 2021 Form 10-K | Page 76

Supplemental balance sheet information related to leases were as follows:
Leases Classification 2021 2020Assets
Operating lease ROU assets Other non-current assets $ 351,712 $ 224,268
Finance lease ROU assets, at cost Property, plant and equipment, gross 89,190 101,426 Accumulated amortization Accumulated depreciation (16,694) (13,361) Finance lease ROU assets, net Property, plant and equipment, net 72,496 88,065
Total leased assets $ 424,208 $ 312,333
LiabilitiesCurrentOperating Accrued liabilities $ 36,292 $ 36,578 Finance Current portion of long-term debt 3,564 4,868
Non-currentOperating Other long-term liabilities 310,899 181,871 Finance Long-term debt 65,582 75,887
Total lease liabilities $ 416,337 $ 299,204
In 2021, our operating lease ROU assets and corresponding lease liabilities increased due to lease agreements assumed as a result of our 2021 business combination activity (see Note 2).
The maturity of our lease liabilities as of December 31, 2021 were as follows:
Operating leases Finance leases Total2022 $ 46,282 $ 7,310 $ 53,592 2023 38,709 5,231 43,940 2024 33,884 4,209 38,093 2025 23,021 3,968 26,989 2026 21,710 3,985 25,695 Thereafter 284,367 146,085 430,452
Total lease payments 447,973 170,788 618,761 Less: Imputed interest 100,782 101,642 202,424
Total lease liabilities $ 347,191 $ 69,146 $ 416,337
THE HERSHEY COMPANYNOTES TO CONSOLIDATED FINANCIAL STATEMENTS—(Continued)
(amounts in thousands, except share data or if otherwise indicated)
The Hershey Company | 2021 Form 10-K | Page 77
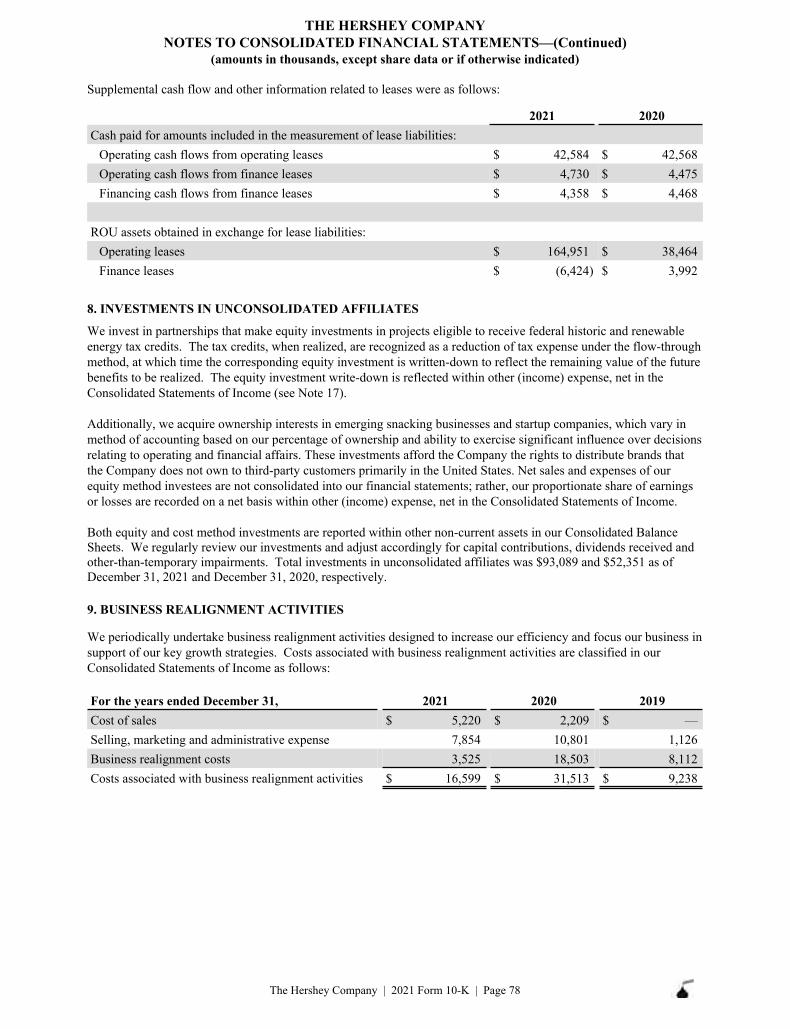
Supplemental cash flow and other information related to leases were as follows:
2021 2020Cash paid for amounts included in the measurement of lease liabilities:
Operating cash flows from operating leases $ 42,584 $ 42,568 Operating cash flows from finance leases $ 4,730 $ 4,475 Financing cash flows from finance leases $ 4,358 $ 4,468
ROU assets obtained in exchange for lease liabilities:Operating leases $ 164,951 $ 38,464 Finance leases $ (6,424) $ 3,992
8. INVESTMENTS IN UNCONSOLIDATED AFFILIATES
We invest in partnerships that make equity investments in projects eligible to receive federal historic and renewable energy tax credits. The tax credits, when realized, are recognized as a reduction of tax expense under the flow-through method, at which time the corresponding equity investment is written-down to reflect the remaining value of the future benefits to be realized. The equity investment write-down is reflected within other (income) expense, net in the Consolidated Statements of Income (see Note 17).
Additionally, we acquire ownership interests in emerging snacking businesses and startup companies, which vary in method of accounting based on our percentage of ownership and ability to exercise significant influence over decisions relating to operating and financial affairs. These investments afford the Company the rights to distribute brands that the Company does not own to third-party customers primarily in the United States. Net sales and expenses of our equity method investees are not consolidated into our financial statements; rather, our proportionate share of earnings or losses are recorded on a net basis within other (income) expense, net in the Consolidated Statements of Income.
Both equity and cost method investments are reported within other non-current assets in our Consolidated Balance Sheets. We regularly review our investments and adjust accordingly for capital contributions, dividends received and other-than-temporary impairments. Total investments in unconsolidated affiliates was $93,089 and $52,351 as of December 31, 2021 and December 31, 2020, respectively.
9. BUSINESS REALIGNMENT ACTIVITIES
We periodically undertake business realignment activities designed to increase our efficiency and focus our business in support of our key growth strategies. Costs associated with business realignment activities are classified in our Consolidated Statements of Income as follows:
For the years ended December 31, 2021 2020 2019Cost of sales $ 5,220 $ 2,209 $ — Selling, marketing and administrative expense 7,854 10,801 1,126 Business realignment costs 3,525 18,503 8,112 Costs associated with business realignment activities $ 16,599 $ 31,513 $ 9,238
THE HERSHEY COMPANYNOTES TO CONSOLIDATED FINANCIAL STATEMENTS—(Continued)
(amounts in thousands, except share data or if otherwise indicated)
The Hershey Company | 2021 Form 10-K | Page 78
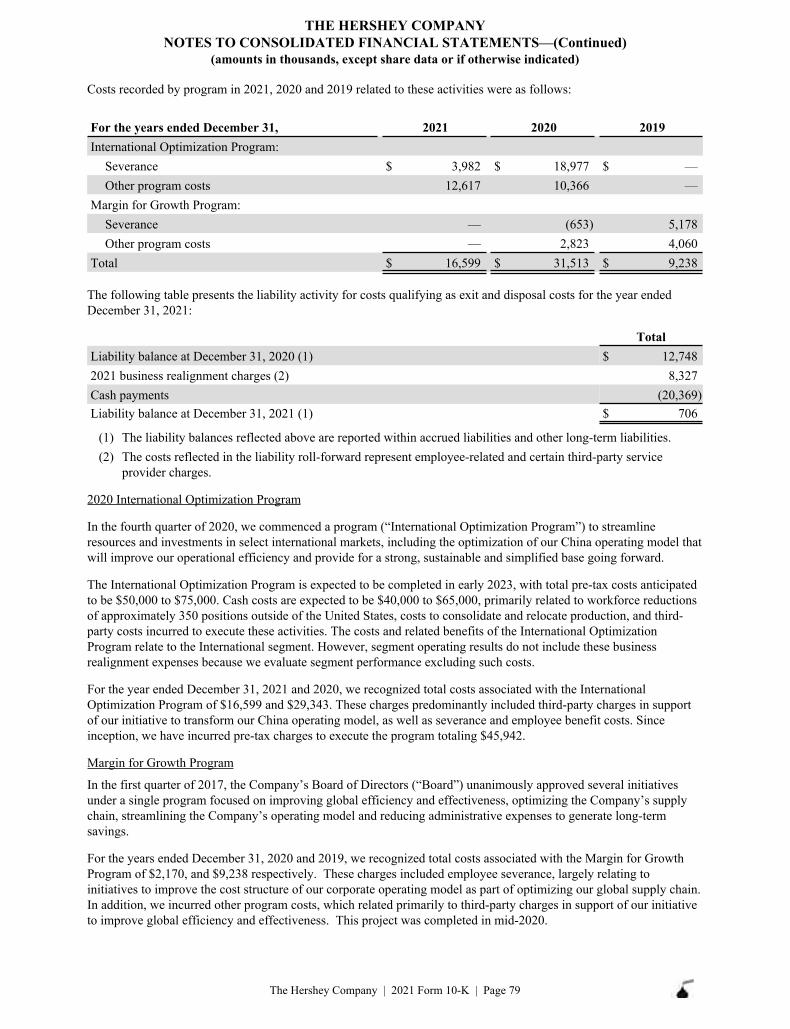
Costs recorded by program in 2021, 2020 and 2019 related to these activities were as follows:
For the years ended December 31, 2021 2020 2019International Optimization Program:
Severance $ 3,982 $ 18,977 $ — Other program costs 12,617 10,366 —
Margin for Growth Program:Severance — (653) 5,178Other program costs — 2,823 4,060
Total $ 16,599 $ 31,513 $ 9,238
The following table presents the liability activity for costs qualifying as exit and disposal costs for the year ended December 31, 2021:
TotalLiability balance at December 31, 2020 (1) $ 12,748 2021 business realignment charges (2) 8,327 Cash payments (20,369) Liability balance at December 31, 2021 (1) $ 706
(1) The liability balances reflected above are reported within accrued liabilities and other long-term liabilities.(2) The costs reflected in the liability roll-forward represent employee-related and certain third-party service
provider charges.
2020 International Optimization Program
In the fourth quarter of 2020, we commenced a program (“International Optimization Program”) to streamline resources and investments in select international markets, including the optimization of our China operating model that will improve our operational efficiency and provide for a strong, sustainable and simplified base going forward.
The International Optimization Program is expected to be completed in early 2023, with total pre-tax costs anticipated to be $50,000 to $75,000. Cash costs are expected to be $40,000 to $65,000, primarily related to workforce reductions of approximately 350 positions outside of the United States, costs to consolidate and relocate production, and third-party costs incurred to execute these activities. The costs and related benefits of the International Optimization Program relate to the International segment. However, segment operating results do not include these business realignment expenses because we evaluate segment performance excluding such costs.
For the year ended December 31, 2021 and 2020, we recognized total costs associated with the International Optimization Program of $16,599 and $29,343. These charges predominantly included third-party charges in support of our initiative to transform our China operating model, as well as severance and employee benefit costs. Since inception, we have incurred pre-tax charges to execute the program totaling $45,942.
Margin for Growth Program
In the first quarter of 2017, the Company’s Board of Directors (“Board”) unanimously approved several initiatives under a single program focused on improving global efficiency and effectiveness, optimizing the Company’s supply chain, streamlining the Company’s operating model and reducing administrative expenses to generate long-term savings.
For the years ended December 31, 2020 and 2019, we recognized total costs associated with the Margin for Growth Program of $2,170, and $9,238 respectively. These charges included employee severance, largely relating to initiatives to improve the cost structure of our corporate operating model as part of optimizing our global supply chain. In addition, we incurred other program costs, which related primarily to third-party charges in support of our initiative to improve global efficiency and effectiveness. This project was completed in mid-2020.
THE HERSHEY COMPANYNOTES TO CONSOLIDATED FINANCIAL STATEMENTS—(Continued)
(amounts in thousands, except share data or if otherwise indicated)
The Hershey Company | 2021 Form 10-K | Page 79
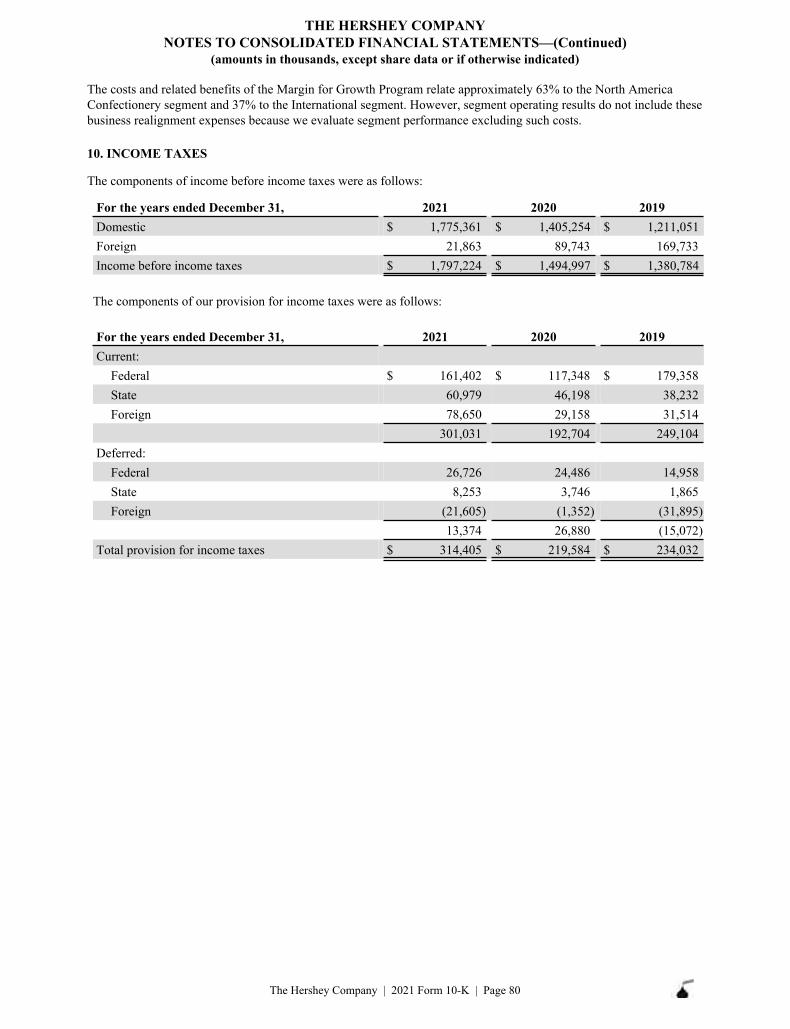
The costs and related benefits of the Margin for Growth Program relate approximately 63% to the North America Confectionery segment and 37% to the International segment. However, segment operating results do not include these business realignment expenses because we evaluate segment performance excluding such costs.
10. INCOME TAXES
The components of income before income taxes were as follows:
Domestic $ 1,775,361 $ 1,405,254 $ 1,211,051 Foreign 21,863 89,743 169,733 Income before income taxes $ 1,797,224 $ 1,494,997 $ 1,380,784
For the years ended December 31, 2021 2020 2019
The components of our provision for income taxes were as follows:
Current:Federal $ 161,402 $ 117,348 $ 179,358 State 60,979 46,198 38,232 Foreign 78,650 29,158 31,514
301,031 192,704 249,104 Deferred:
Federal 26,726 24,486 14,958 State 8,253 3,746 1,865 Foreign (21,605) (1,352) (31,895)
13,374 26,880 (15,072) Total provision for income taxes $ 314,405 $ 219,584 $ 234,032
For the years ended December 31, 2021 2020 2019
THE HERSHEY COMPANYNOTES TO CONSOLIDATED FINANCIAL STATEMENTS—(Continued)
(amounts in thousands, except share data or if otherwise indicated)
The Hershey Company | 2021 Form 10-K | Page 80
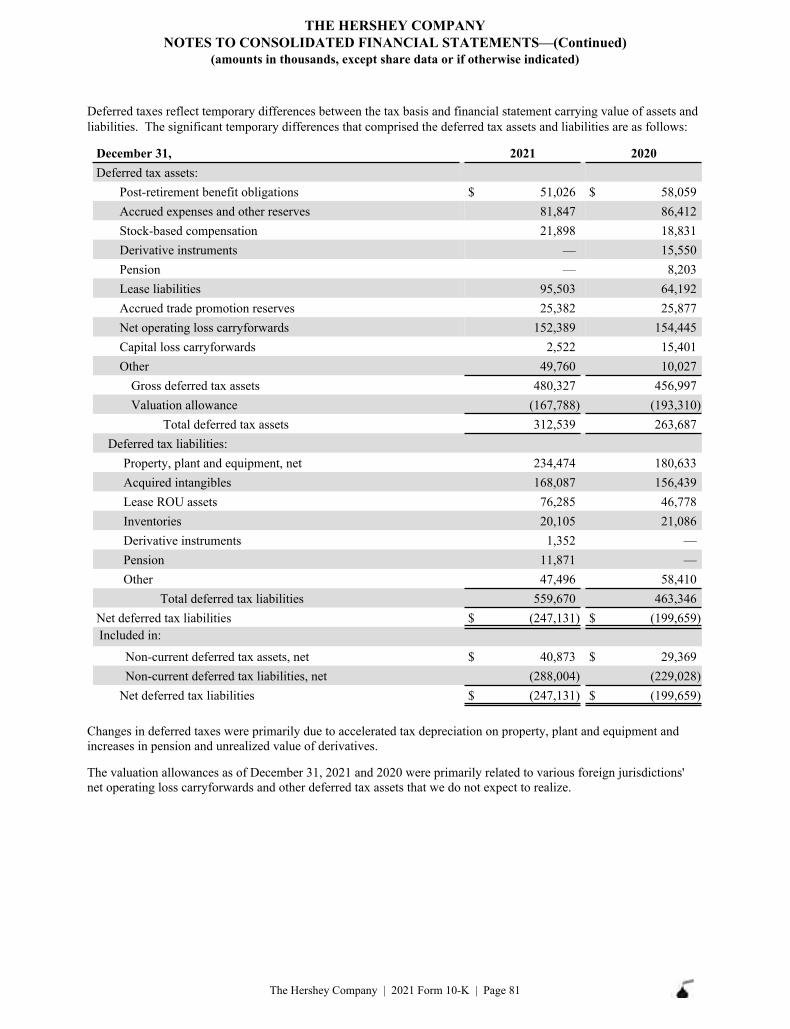
Deferred taxes reflect temporary differences between the tax basis and financial statement carrying value of assets and liabilities. The significant temporary differences that comprised the deferred tax assets and liabilities are as follows:
Deferred tax assets:Post-retirement benefit obligations $ 51,026 $ 58,059 Accrued expenses and other reserves 81,847 86,412 Stock-based compensation 21,898 18,831 Derivative instruments — 15,550 Pension — 8,203 Lease liabilities 95,503 64,192 Accrued trade promotion reserves 25,382 25,877 Net operating loss carryforwards 152,389 154,445 Capital loss carryforwards 2,522 15,401 Other 49,760 10,027
Gross deferred tax assets 480,327 456,997 Valuation allowance (167,788) (193,310)
Total deferred tax assets 312,539 263,687 Deferred tax liabilities:
Property, plant and equipment, net 234,474 180,633 Acquired intangibles 168,087 156,439 Lease ROU assets 76,285 46,778 Inventories 20,105 21,086 Derivative instruments 1,352 — Pension 11,871 — Other 47,496 58,410
Total deferred tax liabilities 559,670 463,346 Net deferred tax liabilities $ (247,131) $ (199,659) Included in:
Non-current deferred tax assets, net $ 40,873 $ 29,369 Non-current deferred tax liabilities, net (288,004) (229,028)
Net deferred tax liabilities $ (247,131) $ (199,659)
December 31, 2021 2020
Changes in deferred taxes were primarily due to accelerated tax depreciation on property, plant and equipment and increases in pension and unrealized value of derivatives.
The valuation allowances as of December 31, 2021 and 2020 were primarily related to various foreign jurisdictions' net operating loss carryforwards and other deferred tax assets that we do not expect to realize.
THE HERSHEY COMPANYNOTES TO CONSOLIDATED FINANCIAL STATEMENTS—(Continued)
(amounts in thousands, except share data or if otherwise indicated)
The Hershey Company | 2021 Form 10-K | Page 81
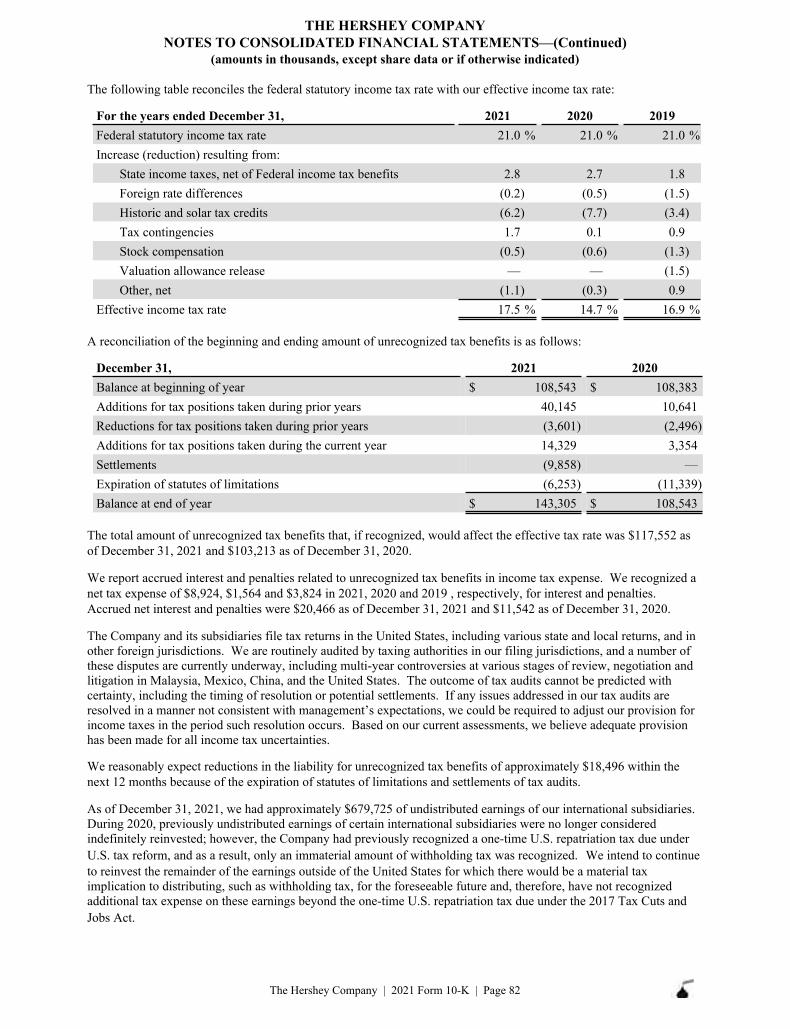
The following table reconciles the federal statutory income tax rate with our effective income tax rate:
Federal statutory income tax rate 21.0 % 21.0 % 21.0 %Increase (reduction) resulting from:
State income taxes, net of Federal income tax benefits 2.8 2.7 1.8 Foreign rate differences (0.2) (0.5) (1.5) Historic and solar tax credits (6.2) (7.7) (3.4) Tax contingencies 1.7 0.1 0.9 Stock compensation (0.5) (0.6) (1.3) Valuation allowance release — — (1.5) Other, net (1.1) (0.3) 0.9
Effective income tax rate 17.5 % 14.7 % 16.9 %
For the years ended December 31, 2021 2020 2019
A reconciliation of the beginning and ending amount of unrecognized tax benefits is as follows:
December 31, 2021 2020Balance at beginning of year $ 108,543 $ 108,383 Additions for tax positions taken during prior years 40,145 10,641 Reductions for tax positions taken during prior years (3,601) (2,496) Additions for tax positions taken during the current year 14,329 3,354 Settlements (9,858) — Expiration of statutes of limitations (6,253) (11,339) Balance at end of year $ 143,305 $ 108,543
The total amount of unrecognized tax benefits that, if recognized, would affect the effective tax rate was $117,552 as of December 31, 2021 and $103,213 as of December 31, 2020.
We report accrued interest and penalties related to unrecognized tax benefits in income tax expense. We recognized a net tax expense of $8,924, $1,564 and $3,824 in 2021, 2020 and 2019 , respectively, for interest and penalties. Accrued net interest and penalties were $20,466 as of December 31, 2021 and $11,542 as of December 31, 2020.
The Company and its subsidiaries file tax returns in the United States, including various state and local returns, and in other foreign jurisdictions. We are routinely audited by taxing authorities in our filing jurisdictions, and a number of these disputes are currently underway, including multi-year controversies at various stages of review, negotiation and litigation in Malaysia, Mexico, China, and the United States. The outcome of tax audits cannot be predicted with certainty, including the timing of resolution or potential settlements. If any issues addressed in our tax audits are resolved in a manner not consistent with management’s expectations, we could be required to adjust our provision for income taxes in the period such resolution occurs. Based on our current assessments, we believe adequate provision has been made for all income tax uncertainties.
We reasonably expect reductions in the liability for unrecognized tax benefits of approximately $18,496 within the next 12 months because of the expiration of statutes of limitations and settlements of tax audits.
As of December 31, 2021, we had approximately $679,725 of undistributed earnings of our international subsidiaries. During 2020, previously undistributed earnings of certain international subsidiaries were no longer considered indefinitely reinvested; however, the Company had previously recognized a one-time U.S. repatriation tax due under U.S. tax reform, and as a result, only an immaterial amount of withholding tax was recognized. We intend to continue to reinvest the remainder of the earnings outside of the United States for which there would be a material tax implication to distributing, such as withholding tax, for the foreseeable future and, therefore, have not recognized additional tax expense on these earnings beyond the one-time U.S. repatriation tax due under the 2017 Tax Cuts and Jobs Act.
THE HERSHEY COMPANYNOTES TO CONSOLIDATED FINANCIAL STATEMENTS—(Continued)
(amounts in thousands, except share data or if otherwise indicated)
The Hershey Company | 2021 Form 10-K | Page 82
Investments in Partnerships Qualifying for Tax Credits
We invest in partnerships which make equity investments in projects eligible to receive federal historic and energy tax credits. The investments are accounted for under the equity method and reported within other non-current assets in our Consolidated Balance Sheets. The tax credits, when realized, are recognized as a reduction of tax expense under the flow-through method, at which time the corresponding equity investment is written-down to reflect the remaining value of the future benefits to be realized. For the years ended December 31, 2021, 2020 and 2019 we recognized investment tax credits and related outside basis difference benefits totaling $136,243, $146,021 and $58,798, respectively, and we wrote-down the equity investment by $113,756, $125,579 and $50,457, respectively, to reflect the realization of these benefits. The equity investment write-down is reflected within other (income) expense, net in the Consolidated Statements of Income (see Note 17).
American Rescue Plan Act
On March 11, 2021, the American Rescue Plan Act (“ARPA”) was signed into law. The ARPA strengthens and extends certain federal programs enacted through the Coronavirus Aid, Relief, and Economic Security Act and other COVID-19 relief measures, and establishes new federal programs, including provisions on taxes, healthcare and unemployment benefits. The ARPA did not have a material impact on our consolidated financial statements for the year ended December 31, 2021
Coronavirus Aid, Relief, and Economic Security Act
On March 27, 2020, the Coronavirus Aid, Relief, and Economic Security (“CARES”) Act was signed into law. The CARES Act provides a substantial stimulus and assistance package intended to address the impact of the COVID-19 pandemic, including tax relief and government loans, grants and investments. The CARES Act did not have a material impact on our consolidated financial statements for the year ended December 31, 2021.
11. PENSION AND OTHER POST-RETIREMENT BENEFIT PLANS
We sponsor a number of defined benefit pension plans. The primary plans are The Hershey Company Retirement Plan and The Hershey Company Retirement Plan for Hourly Employees. These are cash balance plans that provide pension benefits for most domestic employees hired prior to January 1, 2007. We also sponsor two post-retirement benefit plans: health care and life insurance. The health care plan is contributory, with participants’ contributions adjusted annually. The life insurance plan is non-contributory.
THE HERSHEY COMPANYNOTES TO CONSOLIDATED FINANCIAL STATEMENTS—(Continued)
(amounts in thousands, except share data or if otherwise indicated)
The Hershey Company | 2021 Form 10-K | Page 83
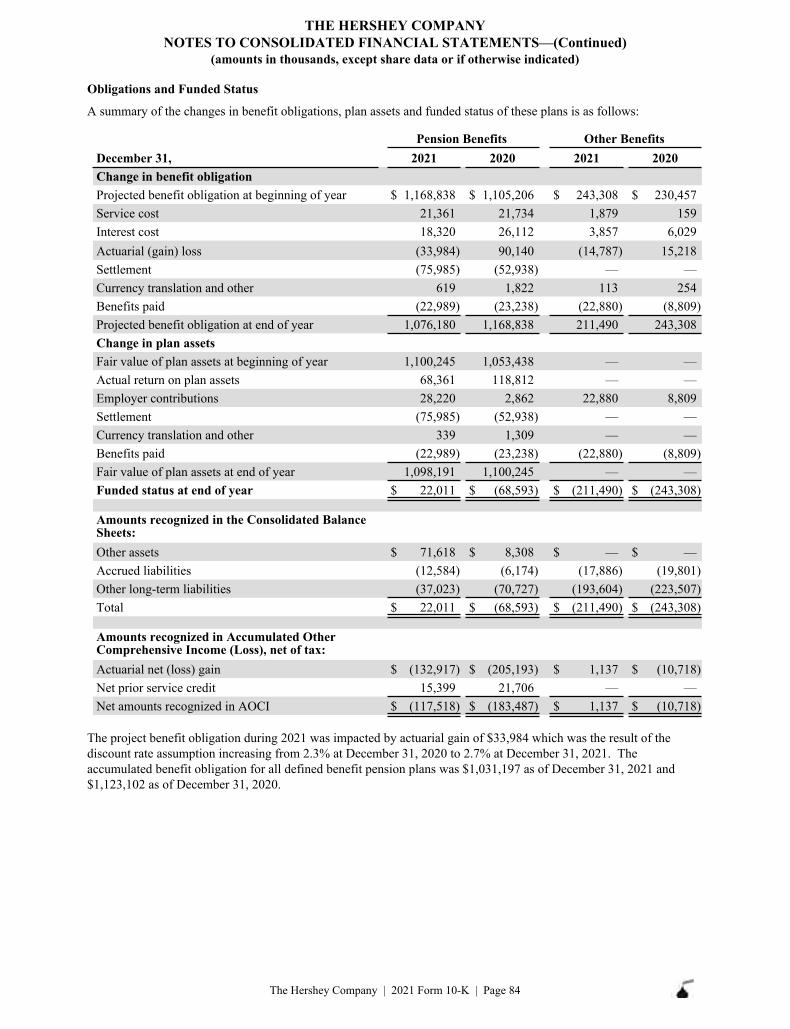
Obligations and Funded Status
A summary of the changes in benefit obligations, plan assets and funded status of these plans is as follows:
December 31, 2021 2020 2021 2020Change in benefit obligationProjected benefit obligation at beginning of year $ 1,168,838 $ 1,105,206 $ 243,308 $ 230,457 Service cost 21,361 21,734 1,879 159 Interest cost 18,320 26,112 3,857 6,029 Actuarial (gain) loss (33,984) 90,140 (14,787) 15,218 Settlement (75,985) (52,938) — — Currency translation and other 619 1,822 113 254 Benefits paid (22,989) (23,238) (22,880) (8,809) Projected benefit obligation at end of year 1,076,180 1,168,838 211,490 243,308 Change in plan assetsFair value of plan assets at beginning of year 1,100,245 1,053,438 — — Actual return on plan assets 68,361 118,812 — — Employer contributions 28,220 2,862 22,880 8,809 Settlement (75,985) (52,938) — — Currency translation and other 339 1,309 — — Benefits paid (22,989) (23,238) (22,880) (8,809) Fair value of plan assets at end of year 1,098,191 1,100,245 — — Funded status at end of year $ 22,011 $ (68,593) $ (211,490) $ (243,308)
Amounts recognized in the Consolidated Balance Sheets:Other assets $ 71,618 $ 8,308 $ — $ — Accrued liabilities (12,584) (6,174) (17,886) (19,801) Other long-term liabilities (37,023) (70,727) (193,604) (223,507) Total $ 22,011 $ (68,593) $ (211,490) $ (243,308)
Amounts recognized in Accumulated Other Comprehensive Income (Loss), net of tax:Actuarial net (loss) gain $ (132,917) $ (205,193) $ 1,137 $ (10,718) Net prior service credit 15,399 21,706 — — Net amounts recognized in AOCI $ (117,518) $ (183,487) $ 1,137 $ (10,718)
Pension Benefits Other Benefits
The project benefit obligation during 2021 was impacted by actuarial gain of $33,984 which was the result of the discount rate assumption increasing from 2.3% at December 31, 2020 to 2.7% at December 31, 2021. The accumulated benefit obligation for all defined benefit pension plans was $1,031,197 as of December 31, 2021 and $1,123,102 as of December 31, 2020.
THE HERSHEY COMPANYNOTES TO CONSOLIDATED FINANCIAL STATEMENTS—(Continued)
(amounts in thousands, except share data or if otherwise indicated)
The Hershey Company | 2021 Form 10-K | Page 84
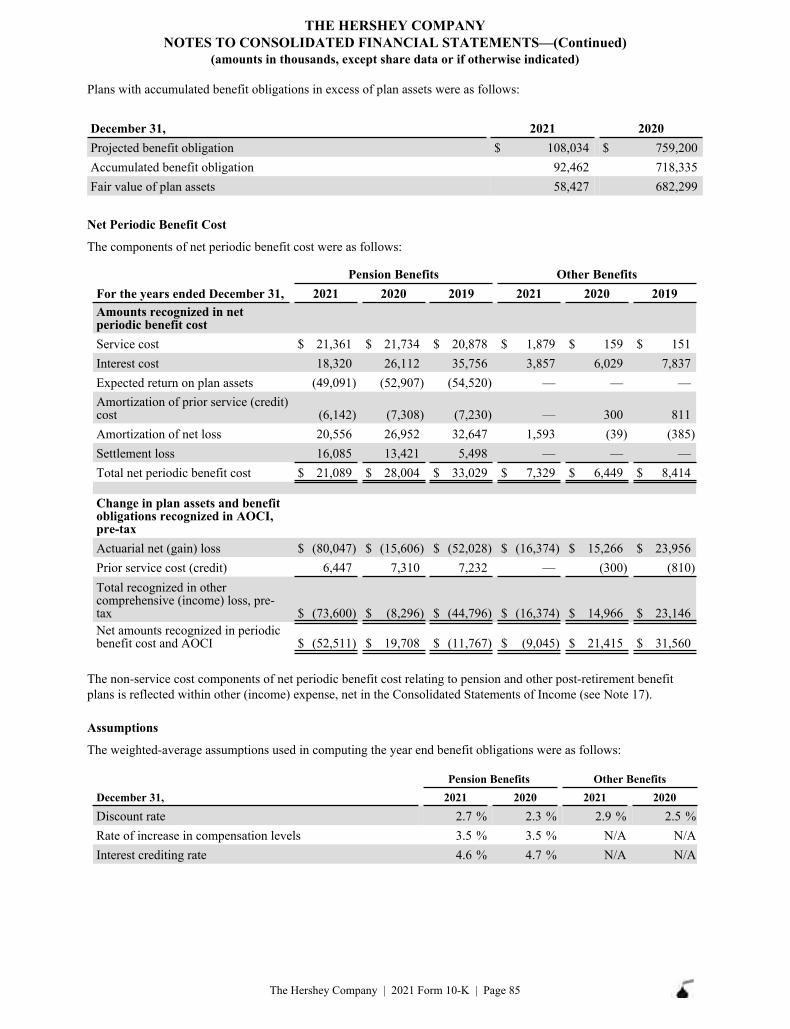
Plans with accumulated benefit obligations in excess of plan assets were as follows:
December 31, 2021 2020Projected benefit obligation $ 108,034 $ 759,200 Accumulated benefit obligation 92,462 718,335 Fair value of plan assets 58,427 682,299
Net Periodic Benefit Cost
The components of net periodic benefit cost were as follows:
For the years ended December 31, 2021 2020 2019 2021 2020 2019Amounts recognized in net periodic benefit costService cost $ 21,361 $ 21,734 $ 20,878 $ 1,879 $ 159 $ 151 Interest cost 18,320 26,112 35,756 3,857 6,029 7,837 Expected return on plan assets (49,091) (52,907) (54,520) — — — Amortization of prior service (credit) cost (6,142) (7,308) (7,230) — 300 811 Amortization of net loss 20,556 26,952 32,647 1,593 (39) (385)Settlement loss 16,085 13,421 5,498 — — — Total net periodic benefit cost $ 21,089 $ 28,004 $ 33,029 $ 7,329 $ 6,449 $ 8,414
Change in plan assets and benefit obligations recognized in AOCI, pre-taxActuarial net (gain) loss $ (80,047) $ (15,606) $ (52,028) $ (16,374) $ 15,266 $ 23,956 Prior service cost (credit) 6,447 7,310 7,232 — (300) (810)Total recognized in other comprehensive (income) loss, pre-tax $ (73,600) $ (8,296) $ (44,796) $ (16,374) $ 14,966 $ 23,146 Net amounts recognized in periodic benefit cost and AOCI $ (52,511) $ 19,708 $ (11,767) $ (9,045) $ 21,415 $ 31,560
Pension Benefits Other Benefits
The non-service cost components of net periodic benefit cost relating to pension and other post-retirement benefit plans is reflected within other (income) expense, net in the Consolidated Statements of Income (see Note 17).
Assumptions
The weighted-average assumptions used in computing the year end benefit obligations were as follows:
December 31, 2021 2020 2021 2020Discount rate 2.7 % 2.3 % 2.9 % 2.5 %Rate of increase in compensation levels 3.5 % 3.5 % N/A N/AInterest crediting rate 4.6 % 4.7 % N/A N/A
Pension Benefits Other Benefits
THE HERSHEY COMPANYNOTES TO CONSOLIDATED FINANCIAL STATEMENTS—(Continued)
(amounts in thousands, except share data or if otherwise indicated)
The Hershey Company | 2021 Form 10-K | Page 85
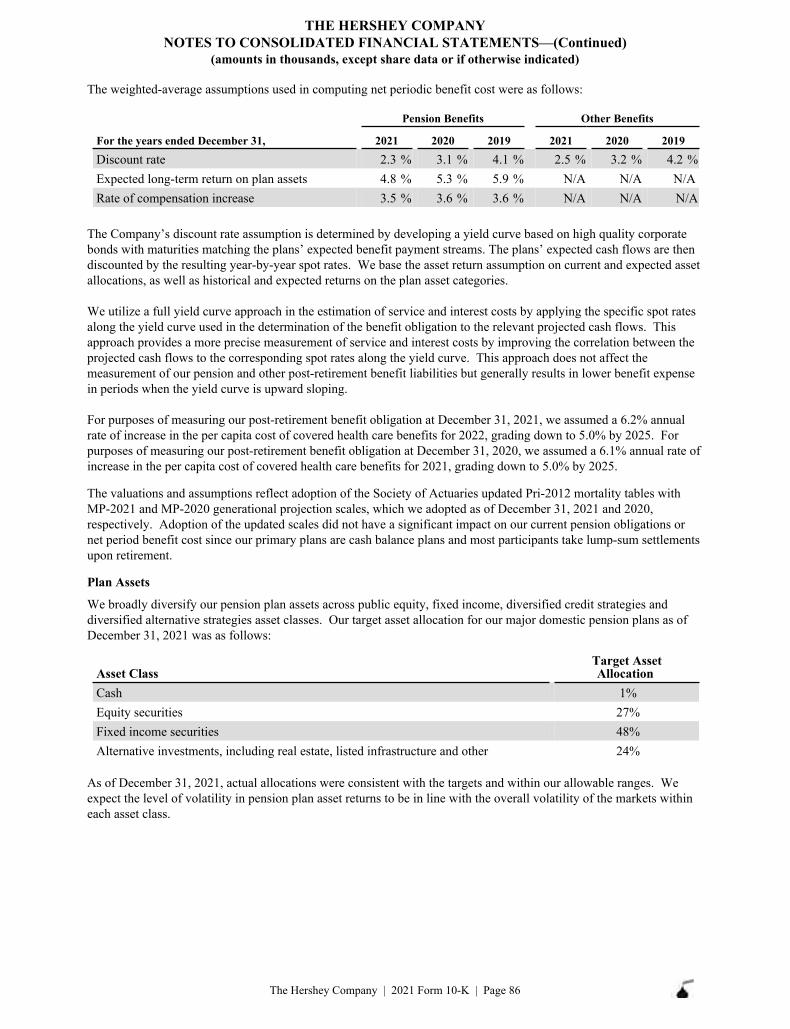
The weighted-average assumptions used in computing net periodic benefit cost were as follows:
For the years ended December 31, 2021 2020 2019 2021 2020 2019Discount rate 2.3 % 3.1 % 4.1 % 2.5 % 3.2 % 4.2 %Expected long-term return on plan assets 4.8 % 5.3 % 5.9 % N/A N/A N/ARate of compensation increase 3.5 % 3.6 % 3.6 % N/A N/A N/A
Pension Benefits Other Benefits
The Company’s discount rate assumption is determined by developing a yield curve based on high quality corporate bonds with maturities matching the plans’ expected benefit payment streams. The plans’ expected cash flows are then discounted by the resulting year-by-year spot rates. We base the asset return assumption on current and expected asset allocations, as well as historical and expected returns on the plan asset categories.
We utilize a full yield curve approach in the estimation of service and interest costs by applying the specific spot rates along the yield curve used in the determination of the benefit obligation to the relevant projected cash flows. This approach provides a more precise measurement of service and interest costs by improving the correlation between the projected cash flows to the corresponding spot rates along the yield curve. This approach does not affect the measurement of our pension and other post-retirement benefit liabilities but generally results in lower benefit expense in periods when the yield curve is upward sloping.
For purposes of measuring our post-retirement benefit obligation at December 31, 2021, we assumed a 6.2% annual rate of increase in the per capita cost of covered health care benefits for 2022, grading down to 5.0% by 2025. For purposes of measuring our post-retirement benefit obligation at December 31, 2020, we assumed a 6.1% annual rate of increase in the per capita cost of covered health care benefits for 2021, grading down to 5.0% by 2025.
The valuations and assumptions reflect adoption of the Society of Actuaries updated Pri-2012 mortality tables with MP-2021 and MP-2020 generational projection scales, which we adopted as of December 31, 2021 and 2020, respectively. Adoption of the updated scales did not have a significant impact on our current pension obligations or net period benefit cost since our primary plans are cash balance plans and most participants take lump-sum settlements upon retirement.
Plan Assets
We broadly diversify our pension plan assets across public equity, fixed income, diversified credit strategies and diversified alternative strategies asset classes. Our target asset allocation for our major domestic pension plans as of December 31, 2021 was as follows:
Cash 1%Equity securities 27%Fixed income securities 48%Alternative investments, including real estate, listed infrastructure and other 24%
Asset ClassTarget Asset Allocation
As of December 31, 2021, actual allocations were consistent with the targets and within our allowable ranges. We expect the level of volatility in pension plan asset returns to be in line with the overall volatility of the markets within each asset class.
THE HERSHEY COMPANYNOTES TO CONSOLIDATED FINANCIAL STATEMENTS—(Continued)
(amounts in thousands, except share data or if otherwise indicated)
The Hershey Company | 2021 Form 10-K | Page 86
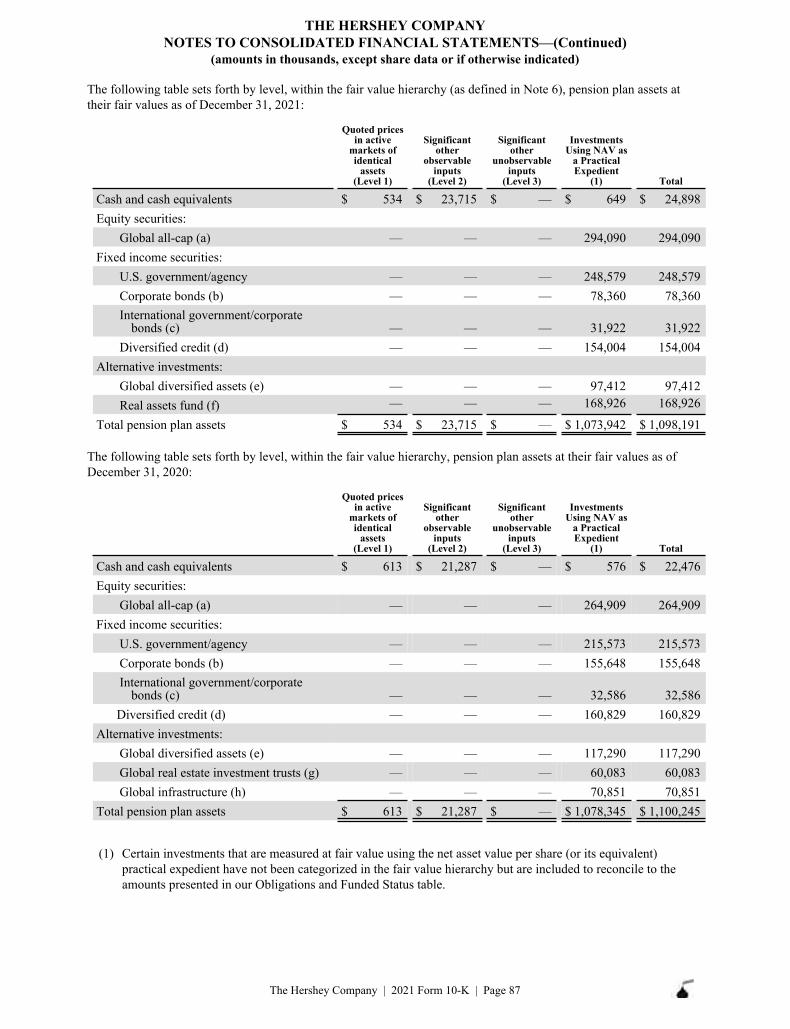
The following table sets forth by level, within the fair value hierarchy (as defined in Note 6), pension plan assets at their fair values as of December 31, 2021:
Quoted prices in active
markets of identical
assets(Level 1)
Significant other
observable inputs
(Level 2)
Significant other
unobservable inputs
(Level 3)
Investments Using NAV as
a Practical Expedient
(1) Total
Cash and cash equivalents $ 534 $ 23,715 $ — $ 649 $ 24,898 Equity securities:
Global all-cap (a) — — — 294,090 294,090 Fixed income securities:
U.S. government/agency — — — 248,579 248,579 Corporate bonds (b) — — — 78,360 78,360 International government/corporate
bonds (c) — — — 31,922 31,922 Diversified credit (d) — — — 154,004 154,004
Alternative investments:Global diversified assets (e) — — — 97,412 97,412 Real assets fund (f) — — — 168,926 168,926
Total pension plan assets $ 534 $ 23,715 $ — $ 1,073,942 $ 1,098,191
The following table sets forth by level, within the fair value hierarchy, pension plan assets at their fair values as of December 31, 2020:
Quoted prices in active
markets of identical
assets(Level 1)
Significant other
observable inputs
(Level 2)
Significant other
unobservable inputs
(Level 3)
Investments Using NAV as
a Practical Expedient
(1) Total
Cash and cash equivalents $ 613 $ 21,287 $ — $ 576 $ 22,476 Equity securities:
Global all-cap (a) — — — 264,909 264,909 Fixed income securities:
U.S. government/agency — — — 215,573 215,573 Corporate bonds (b) — — — 155,648 155,648 International government/corporate
bonds (c) — — — 32,586 32,586 Diversified credit (d) — — — 160,829 160,829
Alternative investments:Global diversified assets (e) — — — 117,290 117,290 Global real estate investment trusts (g) — — — 60,083 60,083 Global infrastructure (h) — — — 70,851 70,851
Total pension plan assets $ 613 $ 21,287 $ — $ 1,078,345 $ 1,100,245
(1) Certain investments that are measured at fair value using the net asset value per share (or its equivalent)practical expedient have not been categorized in the fair value hierarchy but are included to reconcile to theamounts presented in our Obligations and Funded Status table.
THE HERSHEY COMPANYNOTES TO CONSOLIDATED FINANCIAL STATEMENTS—(Continued)
(amounts in thousands, except share data or if otherwise indicated)
The Hershey Company | 2021 Form 10-K | Page 87
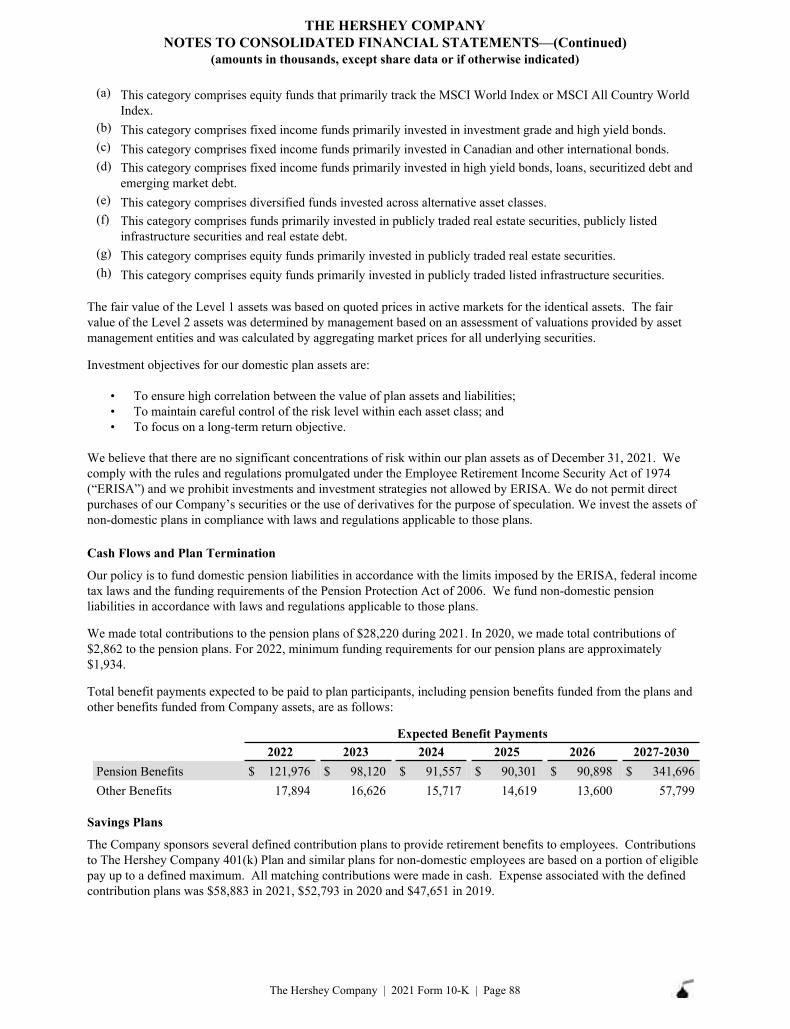
(a) This category comprises equity funds that primarily track the MSCI World Index or MSCI All Country WorldIndex.
(b) This category comprises fixed income funds primarily invested in investment grade and high yield bonds.(c) This category comprises fixed income funds primarily invested in Canadian and other international bonds.(d) This category comprises fixed income funds primarily invested in high yield bonds, loans, securitized debt and
emerging market debt.(e) This category comprises diversified funds invested across alternative asset classes.(f) This category comprises funds primarily invested in publicly traded real estate securities, publicly listed
infrastructure securities and real estate debt.(g) This category comprises equity funds primarily invested in publicly traded real estate securities.(h) This category comprises equity funds primarily invested in publicly traded listed infrastructure securities.
The fair value of the Level 1 assets was based on quoted prices in active markets for the identical assets. The fair value of the Level 2 assets was determined by management based on an assessment of valuations provided by asset management entities and was calculated by aggregating market prices for all underlying securities.
Investment objectives for our domestic plan assets are:
• To ensure high correlation between the value of plan assets and liabilities;• To maintain careful control of the risk level within each asset class; and• To focus on a long-term return objective.
We believe that there are no significant concentrations of risk within our plan assets as of December 31, 2021. We comply with the rules and regulations promulgated under the Employee Retirement Income Security Act of 1974 (“ERISA”) and we prohibit investments and investment strategies not allowed by ERISA. We do not permit direct purchases of our Company’s securities or the use of derivatives for the purpose of speculation. We invest the assets of non-domestic plans in compliance with laws and regulations applicable to those plans.
Cash Flows and Plan Termination
Our policy is to fund domestic pension liabilities in accordance with the limits imposed by the ERISA, federal income tax laws and the funding requirements of the Pension Protection Act of 2006. We fund non-domestic pension liabilities in accordance with laws and regulations applicable to those plans.
We made total contributions to the pension plans of $28,220 during 2021. In 2020, we made total contributions of $2,862 to the pension plans. For 2022, minimum funding requirements for our pension plans are approximately $1,934.
Total benefit payments expected to be paid to plan participants, including pension benefits funded from the plans and other benefits funded from Company assets, are as follows:
2022 2023 2024 2025 2026 2027-2030Pension Benefits $ 121,976 $ 98,120 $ 91,557 $ 90,301 $ 90,898 $ 341,696 Other Benefits 17,894 16,626 15,717 14,619 13,600 57,799
Expected Benefit Payments
Savings Plans
The Company sponsors several defined contribution plans to provide retirement benefits to employees. Contributions to The Hershey Company 401(k) Plan and similar plans for non-domestic employees are based on a portion of eligible pay up to a defined maximum. All matching contributions were made in cash. Expense associated with the defined contribution plans was $58,883 in 2021, $52,793 in 2020 and $47,651 in 2019.
THE HERSHEY COMPANYNOTES TO CONSOLIDATED FINANCIAL STATEMENTS—(Continued)
(amounts in thousands, except share data or if otherwise indicated)
The Hershey Company | 2021 Form 10-K | Page 88

12. STOCK COMPENSATION PLANS
Share-based grants for compensation and incentive purposes are made pursuant to the Equity and Incentive Compensation Plan (“EICP”). The EICP provides for grants of one or more of the following stock-based compensation awards to employees, non-employee directors and certain service providers upon whom the successful conduct of our business is dependent:
• Non-qualified stock options (“stock options”);• Performance stock units (“PSUs”) and performance stock;• Stock appreciation rights;• Restricted stock units (“RSUs”) and restricted stock; and• Other stock-based awards.
As of December 31, 2021, 65.8 million shares were authorized and approved by our stockholders for grants under the EICP. The EICP also provides for the deferral of stock-based compensation awards by participants if approved by the Compensation and Human Capital Committee of our Board and if in accordance with an applicable deferred compensation plan of the Company. Currently, the Compensation and Human Capital Committee has authorized the deferral of PSU and RSU awards by certain eligible employees under the Company’s Deferred Compensation Plan. Our Board has authorized our non-employee directors to defer any portion of their cash retainer, committee chair fees and RSUs awarded that they elect to convert into deferred stock units under our Directors’ Compensation Plan.
At the time stock options are exercised or PSUs and RSUs become payable, Common Stock is issued from our accumulated treasury shares. Dividend equivalents are credited on RSUs on the same date and at the same rate as dividends paid on our Common Stock. Dividend equivalents are charged to retained earnings and included in accrued liabilities until paid.
Awards to employees eligible for retirement prior to the award becoming fully vested are amortized to expense over the period through the date that the employee first becomes eligible to retire and is no longer required to provide service to earn the award. In addition, historical data is used to estimate forfeiture rates and record share-based compensation expense only for those awards that are expected to vest.
For the periods presented, compensation expense for all types of stock-based compensation programs and the related income tax benefit recognized were as follows:
Pre-tax compensation expense $ 66,711 $ 57,584 $ 51,899 Related income tax benefit 11,608 8,580 9,030
For the years ended December 31, 2021 2020 2019
Compensation expenses for stock compensation plans are primarily included in SM&A expense. As of December 31, 2021, total stock-based compensation expense related to non-vested awards not yet recognized was $82,114 and the weighted-average period over which this amount is expected to be recognized was approximately 1.9 years.
Stock Options The exercise price of each stock option awarded under the EICP equals the closing price of our Common Stock on the New York Stock Exchange on the date of grant. Each stock option has a maximum term of 10 years. Grants of stock options provide for pro-rated vesting, typically over a four-year period. Expense for stock options is based on grant date fair value and recognized on a straight-line method over the vesting period, net of estimated forfeitures.
THE HERSHEY COMPANYNOTES TO CONSOLIDATED FINANCIAL STATEMENTS—(Continued)
(amounts in thousands, except share data or if otherwise indicated)
The Hershey Company | 2021 Form 10-K | Page 89
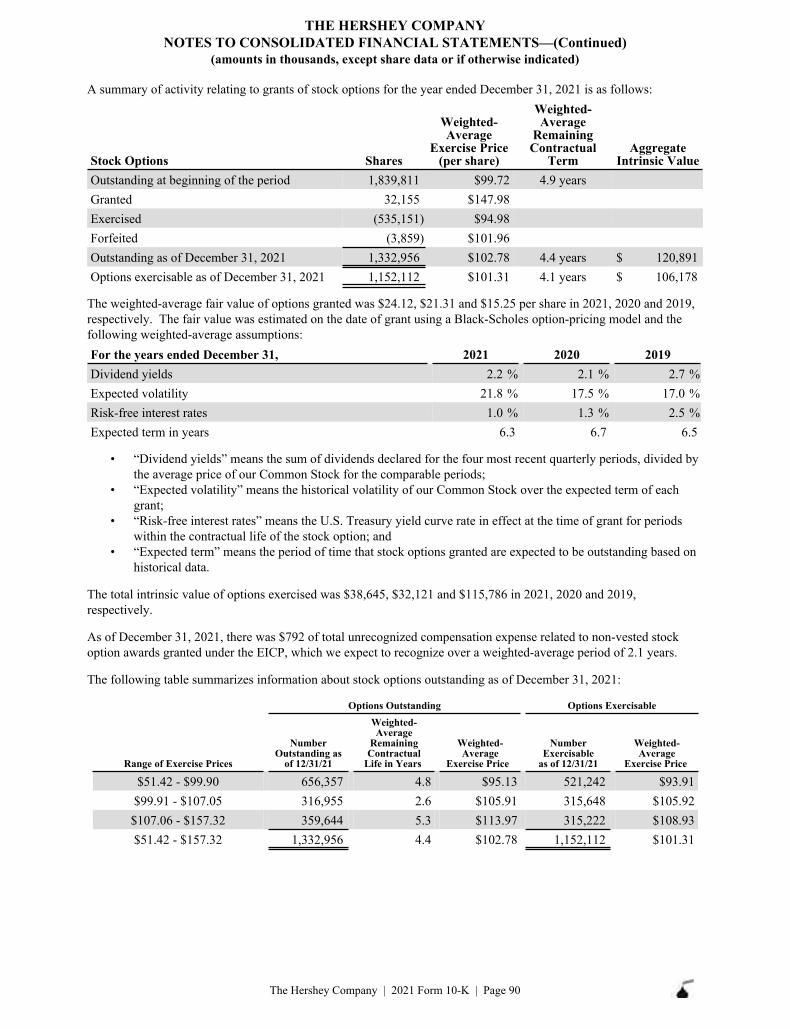
A summary of activity relating to grants of stock options for the year ended December 31, 2021 is as follows:
Stock Options Shares
Weighted-Average
Exercise Price (per share)
Weighted-Average
RemainingContractual
TermAggregate
Intrinsic ValueOutstanding at beginning of the period 1,839,811 $99.72 4.9 yearsGranted 32,155 $147.98Exercised (535,151) $94.98Forfeited (3,859) $101.96Outstanding as of December 31, 2021 1,332,956 $102.78 4.4 years $ 120,891 Options exercisable as of December 31, 2021 1,152,112 $101.31 4.1 years $ 106,178
The weighted-average fair value of options granted was $24.12, $21.31 and $15.25 per share in 2021, 2020 and 2019, respectively. The fair value was estimated on the date of grant using a Black-Scholes option-pricing model and the following weighted-average assumptions:
Dividend yields 2.2 % 2.1 % 2.7 %Expected volatility 21.8 % 17.5 % 17.0 %Risk-free interest rates 1.0 % 1.3 % 2.5 %Expected term in years 6.3 6.7 6.5
For the years ended December 31, 2021 2020 2019
• “Dividend yields” means the sum of dividends declared for the four most recent quarterly periods, divided bythe average price of our Common Stock for the comparable periods;
• “Expected volatility” means the historical volatility of our Common Stock over the expected term of eachgrant;
• “Risk-free interest rates” means the U.S. Treasury yield curve rate in effect at the time of grant for periodswithin the contractual life of the stock option; and
• “Expected term” means the period of time that stock options granted are expected to be outstanding based onhistorical data.
The total intrinsic value of options exercised was $38,645, $32,121 and $115,786 in 2021, 2020 and 2019, respectively.
As of December 31, 2021, there was $792 of total unrecognized compensation expense related to non-vested stock option awards granted under the EICP, which we expect to recognize over a weighted-average period of 2.1 years.
The following table summarizes information about stock options outstanding as of December 31, 2021:
Range of Exercise Prices
Number Outstanding as
of 12/31/21
Weighted-Average
Remaining Contractual
Life in Years
Weighted-Average
Exercise Price
Number Exercisable
as of 12/31/21
Weighted-Average
Exercise Price
$51.42 - $99.90 656,357 4.8 $95.13 521,242 $93.91$99.91 - $107.05 316,955 2.6 $105.91 315,648 $105.92
$107.06 - $157.32 359,644 5.3 $113.97 315,222 $108.93$51.42 - $157.32 1,332,956 4.4 $102.78 1,152,112 $101.31
Options Outstanding Options Exercisable
THE HERSHEY COMPANYNOTES TO CONSOLIDATED FINANCIAL STATEMENTS—(Continued)
(amounts in thousands, except share data or if otherwise indicated)
The Hershey Company | 2021 Form 10-K | Page 90
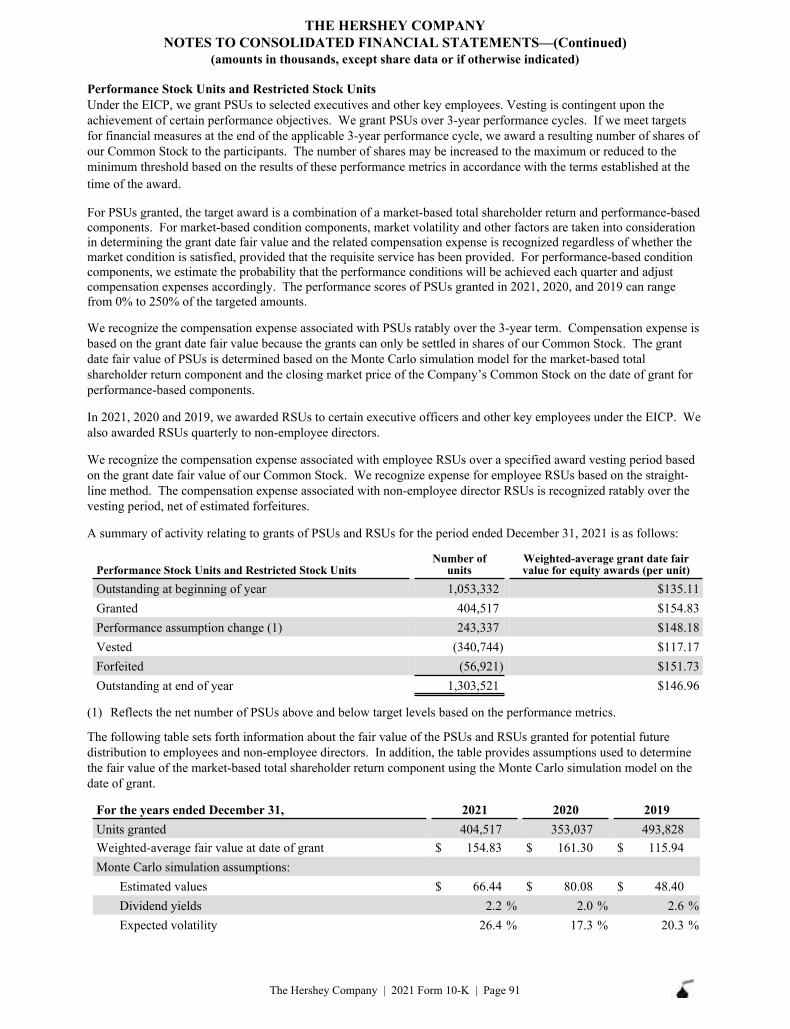
Performance Stock Units and Restricted Stock Units Under the EICP, we grant PSUs to selected executives and other key employees. Vesting is contingent upon the achievement of certain performance objectives. We grant PSUs over 3-year performance cycles. If we meet targets for financial measures at the end of the applicable 3-year performance cycle, we award a resulting number of shares of our Common Stock to the participants. The number of shares may be increased to the maximum or reduced to the minimum threshold based on the results of these performance metrics in accordance with the terms established at the time of the award.
For PSUs granted, the target award is a combination of a market-based total shareholder return and performance-based components. For market-based condition components, market volatility and other factors are taken into consideration in determining the grant date fair value and the related compensation expense is recognized regardless of whether the market condition is satisfied, provided that the requisite service has been provided. For performance-based condition components, we estimate the probability that the performance conditions will be achieved each quarter and adjust compensation expenses accordingly. The performance scores of PSUs granted in 2021, 2020, and 2019 can range from 0% to 250% of the targeted amounts.
We recognize the compensation expense associated with PSUs ratably over the 3-year term. Compensation expense is based on the grant date fair value because the grants can only be settled in shares of our Common Stock. The grant date fair value of PSUs is determined based on the Monte Carlo simulation model for the market-based total shareholder return component and the closing market price of the Company’s Common Stock on the date of grant for performance-based components.
In 2021, 2020 and 2019, we awarded RSUs to certain executive officers and other key employees under the EICP. We also awarded RSUs quarterly to non-employee directors.
We recognize the compensation expense associated with employee RSUs over a specified award vesting period based on the grant date fair value of our Common Stock. We recognize expense for employee RSUs based on the straight-line method. The compensation expense associated with non-employee director RSUs is recognized ratably over the vesting period, net of estimated forfeitures.
A summary of activity relating to grants of PSUs and RSUs for the period ended December 31, 2021 is as follows:
Outstanding at beginning of year 1,053,332 $135.11Granted 404,517 $154.83Performance assumption change (1) 243,337 $148.18Vested (340,744) $117.17Forfeited (56,921) $151.73Outstanding at end of year 1,303,521 $146.96
Performance Stock Units and Restricted Stock UnitsNumber of
unitsWeighted-average grant date fair value for equity awards (per unit)
(1) Reflects the net number of PSUs above and below target levels based on the performance metrics.
The following table sets forth information about the fair value of the PSUs and RSUs granted for potential future distribution to employees and non-employee directors. In addition, the table provides assumptions used to determine the fair value of the market-based total shareholder return component using the Monte Carlo simulation model on the date of grant.
Units granted 404,517 353,037 493,828 Weighted-average fair value at date of grant $ 154.83 $ 161.30 $ 115.94 Monte Carlo simulation assumptions:
Estimated values $ 66.44 $ 80.08 $ 48.40 Dividend yields 2.2 % 2.0 % 2.6 %Expected volatility 26.4 % 17.3 % 20.3 %
For the years ended December 31, 2021 2020 2019
THE HERSHEY COMPANYNOTES TO CONSOLIDATED FINANCIAL STATEMENTS—(Continued)
(amounts in thousands, except share data or if otherwise indicated)
The Hershey Company | 2021 Form 10-K | Page 91
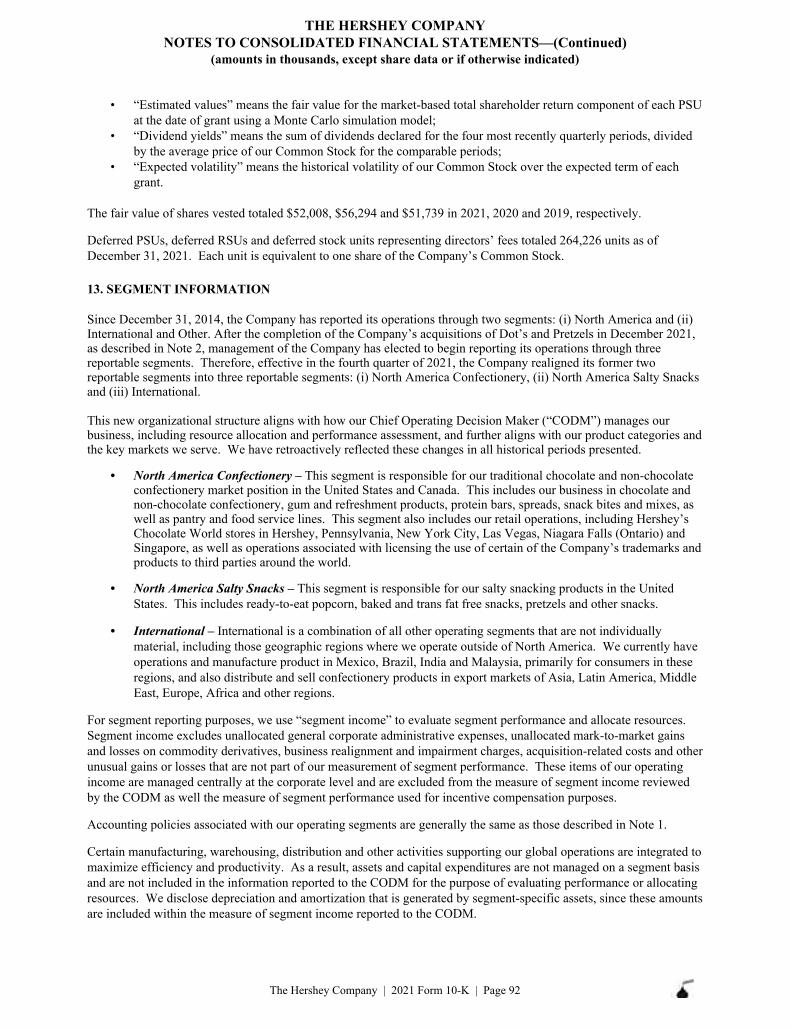
• “Estimated values” means the fair value for the market-based total shareholder return component of each PSUat the date of grant using a Monte Carlo simulation model;
• “Dividend yields” means the sum of dividends declared for the four most recently quarterly periods, dividedby the average price of our Common Stock for the comparable periods;
• “Expected volatility” means the historical volatility of our Common Stock over the expected term of eachgrant.
The fair value of shares vested totaled $52,008, $56,294 and $51,739 in 2021, 2020 and 2019, respectively.
Deferred PSUs, deferred RSUs and deferred stock units representing directors’ fees totaled 264,226 units as of December 31, 2021. Each unit is equivalent to one share of the Company’s Common Stock.
13. SEGMENT INFORMATION
Since December 31, 2014, the Company has reported its operations through two segments: (i) North America and (ii) International and Other. After the completion of the Company’s acquisitions of Dot’s and Pretzels in December 2021, as described in Note 2, management of the Company has elected to begin reporting its operations through three reportable segments. Therefore, effective in the fourth quarter of 2021, the Company realigned its former two reportable segments into three reportable segments: (i) North America Confectionery, (ii) North America Salty Snacks and (iii) International.
This new organizational structure aligns with how our Chief Operating Decision Maker (“CODM”) manages our business, including resource allocation and performance assessment, and further aligns with our product categories and the key markets we serve. We have retroactively reflected these changes in all historical periods presented.
• North America Confectionery – This segment is responsible for our traditional chocolate and non-chocolateconfectionery market position in the United States and Canada. This includes our business in chocolate andnon-chocolate confectionery, gum and refreshment products, protein bars, spreads, snack bites and mixes, aswell as pantry and food service lines. This segment also includes our retail operations, including Hershey’sChocolate World stores in Hershey, Pennsylvania, New York City, Las Vegas, Niagara Falls (Ontario) andSingapore, as well as operations associated with licensing the use of certain of the Company’s trademarks andproducts to third parties around the world.
• North America Salty Snacks – This segment is responsible for our salty snacking products in the UnitedStates. This includes ready-to-eat popcorn, baked and trans fat free snacks, pretzels and other snacks.
• International – International is a combination of all other operating segments that are not individuallymaterial, including those geographic regions where we operate outside of North America. We currently haveoperations and manufacture product in Mexico, Brazil, India and Malaysia, primarily for consumers in theseregions, and also distribute and sell confectionery products in export markets of Asia, Latin America, MiddleEast, Europe, Africa and other regions.
For segment reporting purposes, we use “segment income” to evaluate segment performance and allocate resources. Segment income excludes unallocated general corporate administrative expenses, unallocated mark-to-market gains and losses on commodity derivatives, business realignment and impairment charges, acquisition-related costs and other unusual gains or losses that are not part of our measurement of segment performance. These items of our operating income are managed centrally at the corporate level and are excluded from the measure of segment income reviewed by the CODM as well the measure of segment performance used for incentive compensation purposes.
Accounting policies associated with our operating segments are generally the same as those described in Note 1.
Certain manufacturing, warehousing, distribution and other activities supporting our global operations are integrated to maximize efficiency and productivity. As a result, assets and capital expenditures are not managed on a segment basis and are not included in the information reported to the CODM for the purpose of evaluating performance or allocating resources. We disclose depreciation and amortization that is generated by segment-specific assets, since these amounts are included within the measure of segment income reported to the CODM.
THE HERSHEY COMPANYNOTES TO CONSOLIDATED FINANCIAL STATEMENTS—(Continued)
(amounts in thousands, except share data or if otherwise indicated)
The Hershey Company | 2021 Form 10-K | Page 92
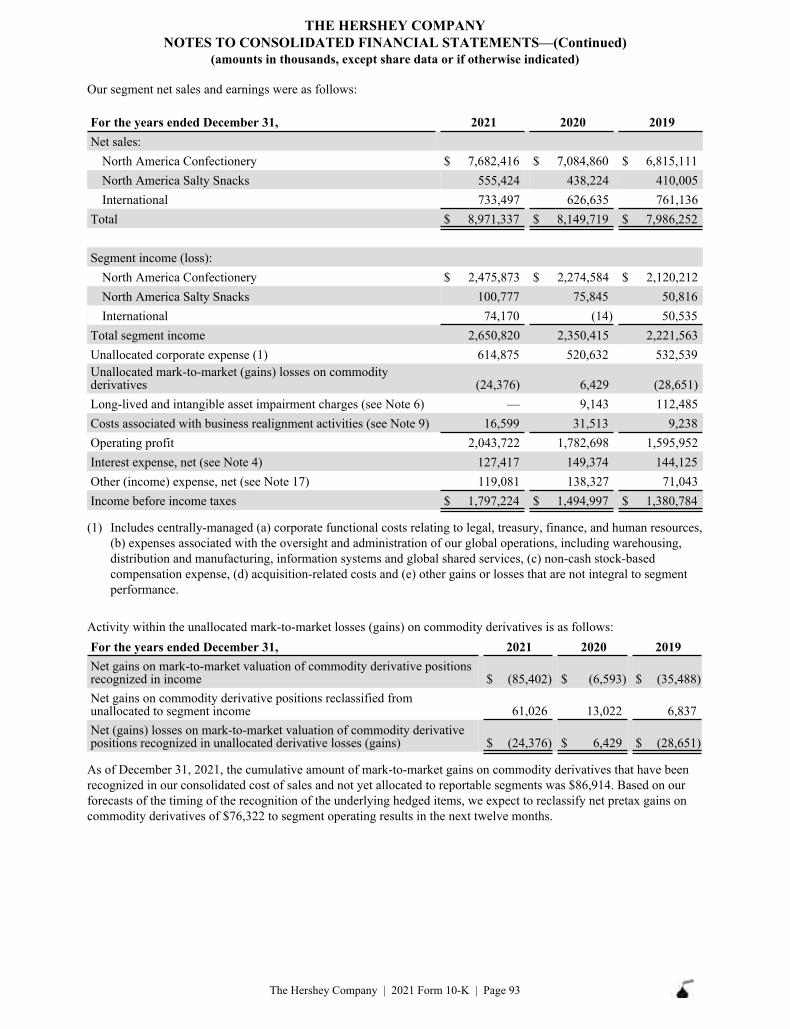
Our segment net sales and earnings were as follows:
For the years ended December 31, 2021 2020 2019Net sales:
North America Confectionery $ 7,682,416 $ 7,084,860 $ 6,815,111 North America Salty Snacks 555,424 438,224 410,005 International 733,497 626,635 761,136
Total $ 8,971,337 $ 8,149,719 $ 7,986,252
Segment income (loss):North America Confectionery $ 2,475,873 $ 2,274,584 $ 2,120,212 North America Salty Snacks 100,777 75,845 50,816 International 74,170 (14) 50,535
Total segment income 2,650,820 2,350,415 2,221,563 Unallocated corporate expense (1) 614,875 520,632 532,539 Unallocated mark-to-market (gains) losses on commodity derivatives (24,376) 6,429 (28,651) Long-lived and intangible asset impairment charges (see Note 6) — 9,143 112,485 Costs associated with business realignment activities (see Note 9) 16,599 31,513 9,238 Operating profit 2,043,722 1,782,698 1,595,952 Interest expense, net (see Note 4) 127,417 149,374 144,125 Other (income) expense, net (see Note 17) 119,081 138,327 71,043 Income before income taxes $ 1,797,224 $ 1,494,997 $ 1,380,784
(1) Includes centrally-managed (a) corporate functional costs relating to legal, treasury, finance, and human resources,(b) expenses associated with the oversight and administration of our global operations, including warehousing,distribution and manufacturing, information systems and global shared services, (c) non-cash stock-basedcompensation expense, (d) acquisition-related costs and (e) other gains or losses that are not integral to segmentperformance.
Activity within the unallocated mark-to-market losses (gains) on commodity derivatives is as follows:For the years ended December 31, 2021 2020 2019Net gains on mark-to-market valuation of commodity derivative positions recognized in income $ (85,402) $ (6,593) $ (35,488) Net gains on commodity derivative positions reclassified from unallocated to segment income 61,026 13,022 6,837 Net (gains) losses on mark-to-market valuation of commodity derivative positions recognized in unallocated derivative losses (gains) $ (24,376) $ 6,429 $ (28,651)
As of December 31, 2021, the cumulative amount of mark-to-market gains on commodity derivatives that have been recognized in our consolidated cost of sales and not yet allocated to reportable segments was $86,914. Based on our forecasts of the timing of the recognition of the underlying hedged items, we expect to reclassify net pretax gains on commodity derivatives of $76,322 to segment operating results in the next twelve months.
THE HERSHEY COMPANYNOTES TO CONSOLIDATED FINANCIAL STATEMENTS—(Continued)
(amounts in thousands, except share data or if otherwise indicated)
The Hershey Company | 2021 Form 10-K | Page 93
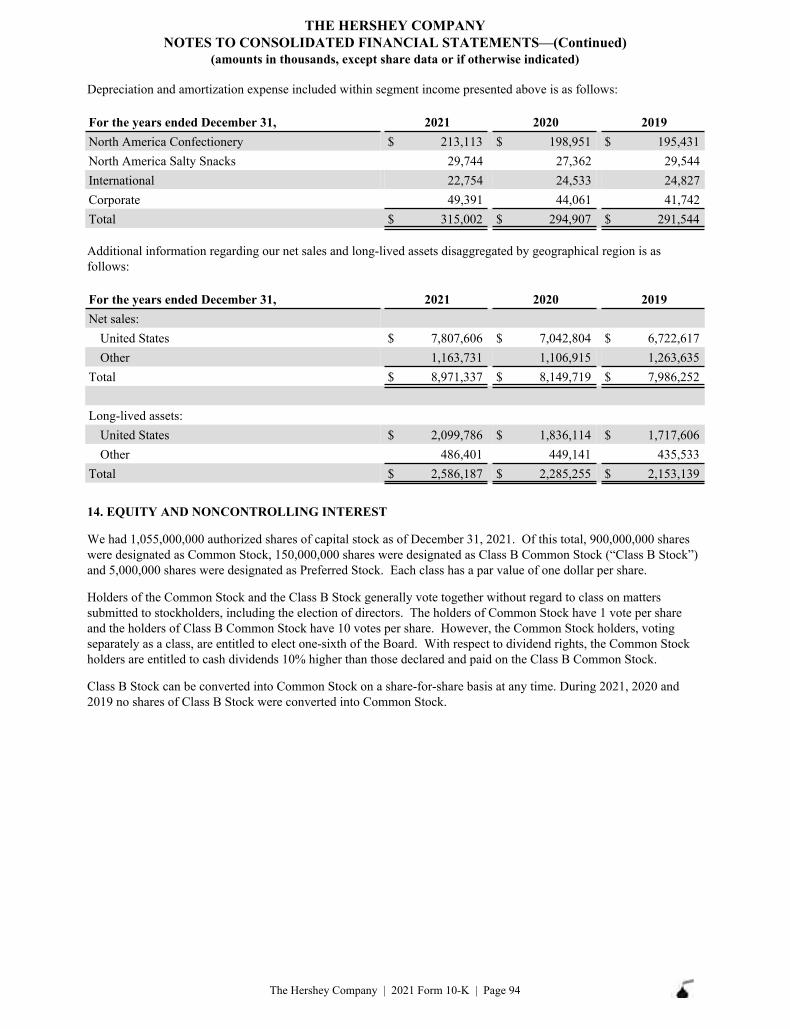
Depreciation and amortization expense included within segment income presented above is as follows:
For the years ended December 31, 2021 2020 2019North America Confectionery $ 213,113 $ 198,951 $ 195,431 North America Salty Snacks 29,744 27,362 29,544 International 22,754 24,533 24,827 Corporate 49,391 44,061 41,742 Total $ 315,002 $ 294,907 $ 291,544
Additional information regarding our net sales and long-lived assets disaggregated by geographical region is as follows:
For the years ended December 31, 2021 2020 2019Net sales:
United States $ 7,807,606 $ 7,042,804 $ 6,722,617 Other 1,163,731 1,106,915 1,263,635
Total $ 8,971,337 $ 8,149,719 $ 7,986,252
Long-lived assets:United States $ 2,099,786 $ 1,836,114 $ 1,717,606 Other 486,401 449,141 435,533
Total $ 2,586,187 $ 2,285,255 $ 2,153,139
14. EQUITY AND NONCONTROLLING INTEREST
We had 1,055,000,000 authorized shares of capital stock as of December 31, 2021. Of this total, 900,000,000 shares were designated as Common Stock, 150,000,000 shares were designated as Class B Common Stock (“Class B Stock”) and 5,000,000 shares were designated as Preferred Stock. Each class has a par value of one dollar per share.
Holders of the Common Stock and the Class B Stock generally vote together without regard to class on matters submitted to stockholders, including the election of directors. The holders of Common Stock have 1 vote per share and the holders of Class B Common Stock have 10 votes per share. However, the Common Stock holders, voting separately as a class, are entitled to elect one-sixth of the Board. With respect to dividend rights, the Common Stock holders are entitled to cash dividends 10% higher than those declared and paid on the Class B Common Stock.
Class B Stock can be converted into Common Stock on a share-for-share basis at any time. During 2021, 2020 and 2019 no shares of Class B Stock were converted into Common Stock.
THE HERSHEY COMPANYNOTES TO CONSOLIDATED FINANCIAL STATEMENTS—(Continued)
(amounts in thousands, except share data or if otherwise indicated)
The Hershey Company | 2021 Form 10-K | Page 94
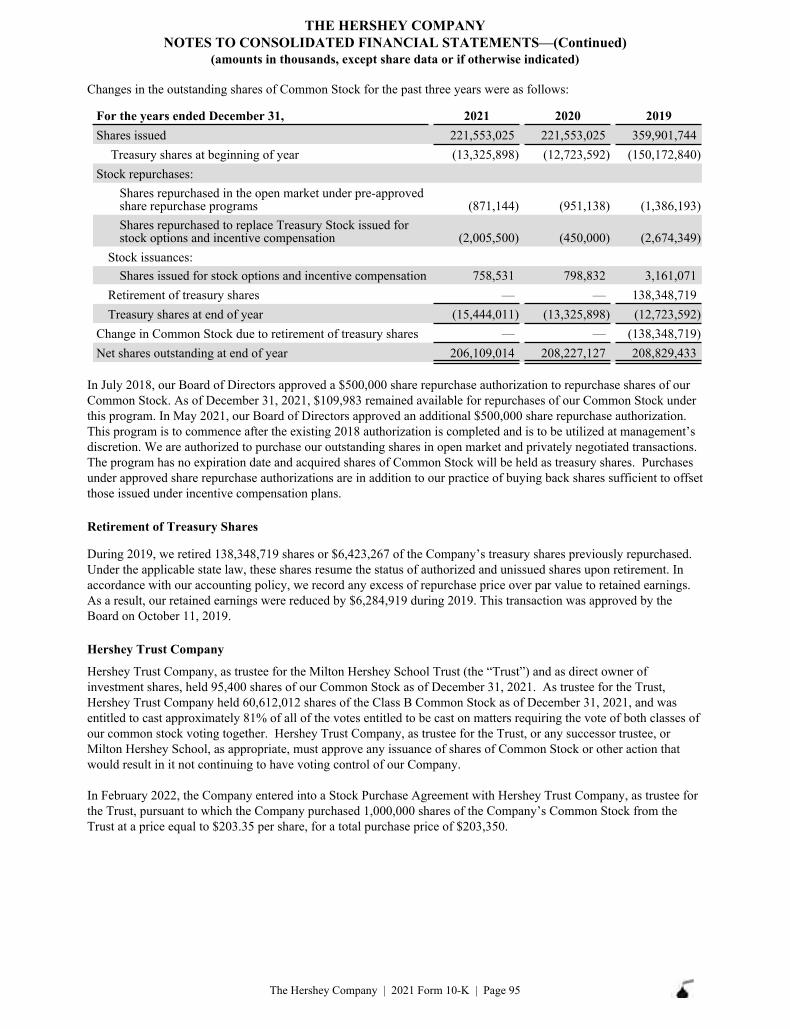
Changes in the outstanding shares of Common Stock for the past three years were as follows:
Shares issued 221,553,025 221,553,025 359,901,744 Treasury shares at beginning of year (13,325,898) (12,723,592) (150,172,840)
Stock repurchases:Shares repurchased in the open market under pre-approved share repurchase programs (871,144) (951,138) (1,386,193) Shares repurchased to replace Treasury Stock issued for stock options and incentive compensation (2,005,500) (450,000) (2,674,349)
Stock issuances:Shares issued for stock options and incentive compensation 758,531 798,832 3,161,071
Retirement of treasury shares — — 138,348,719 Treasury shares at end of year (15,444,011) (13,325,898) (12,723,592)
Change in Common Stock due to retirement of treasury shares — — (138,348,719) Net shares outstanding at end of year 206,109,014 208,227,127 208,829,433
For the years ended December 31, 2021 2020 2019
In July 2018, our Board of Directors approved a $500,000 share repurchase authorization to repurchase shares of our Common Stock. As of December 31, 2021, $109,983 remained available for repurchases of our Common Stock under this program. In May 2021, our Board of Directors approved an additional $500,000 share repurchase authorization. This program is to commence after the existing 2018 authorization is completed and is to be utilized at management’s discretion. We are authorized to purchase our outstanding shares in open market and privately negotiated transactions. The program has no expiration date and acquired shares of Common Stock will be held as treasury shares. Purchases under approved share repurchase authorizations are in addition to our practice of buying back shares sufficient to offset those issued under incentive compensation plans.
Retirement of Treasury Shares
During 2019, we retired 138,348,719 shares or $6,423,267 of the Company’s treasury shares previously repurchased. Under the applicable state law, these shares resume the status of authorized and unissued shares upon retirement. In accordance with our accounting policy, we record any excess of repurchase price over par value to retained earnings. As a result, our retained earnings were reduced by $6,284,919 during 2019. This transaction was approved by the Board on October 11, 2019.
Hershey Trust Company
Hershey Trust Company, as trustee for the Milton Hershey School Trust (the “Trust”) and as direct owner of investment shares, held 95,400 shares of our Common Stock as of December 31, 2021. As trustee for the Trust, Hershey Trust Company held 60,612,012 shares of the Class B Common Stock as of December 31, 2021, and was entitled to cast approximately 81% of all of the votes entitled to be cast on matters requiring the vote of both classes of our common stock voting together. Hershey Trust Company, as trustee for the Trust, or any successor trustee, or Milton Hershey School, as appropriate, must approve any issuance of shares of Common Stock or other action that would result in it not continuing to have voting control of our Company.
In February 2022, the Company entered into a Stock Purchase Agreement with Hershey Trust Company, as trustee for the Trust, pursuant to which the Company purchased 1,000,000 shares of the Company’s Common Stock from the Trust at a price equal to $203.35 per share, for a total purchase price of $203,350.
THE HERSHEY COMPANYNOTES TO CONSOLIDATED FINANCIAL STATEMENTS—(Continued)
(amounts in thousands, except share data or if otherwise indicated)
The Hershey Company | 2021 Form 10-K | Page 95
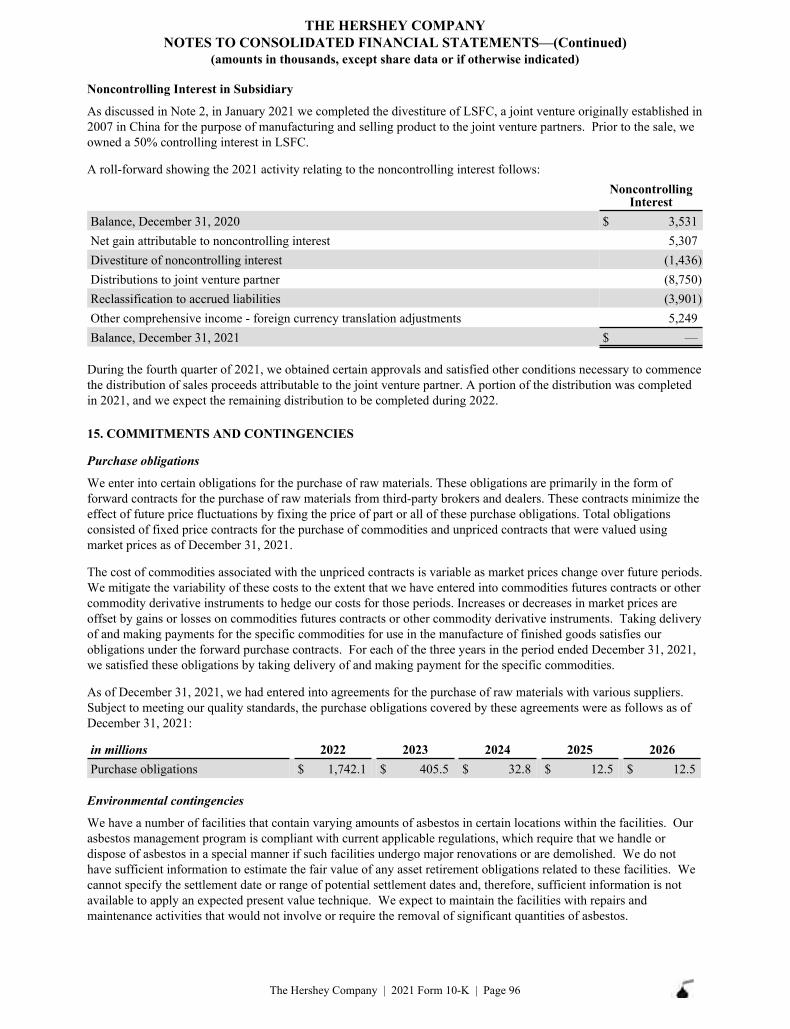
Noncontrolling Interest in Subsidiary
As discussed in Note 2, in January 2021 we completed the divestiture of LSFC, a joint venture originally established in 2007 in China for the purpose of manufacturing and selling product to the joint venture partners. Prior to the sale, we owned a 50% controlling interest in LSFC.
A roll-forward showing the 2021 activity relating to the noncontrolling interest follows:Noncontrolling
InterestBalance, December 31, 2020 $ 3,531 Net gain attributable to noncontrolling interest 5,307 Divestiture of noncontrolling interest (1,436) Distributions to joint venture partner (8,750) Reclassification to accrued liabilities (3,901) Other comprehensive income - foreign currency translation adjustments 5,249 Balance, December 31, 2021 $ —
During the fourth quarter of 2021, we obtained certain approvals and satisfied other conditions necessary to commence the distribution of sales proceeds attributable to the joint venture partner. A portion of the distribution was completed in 2021, and we expect the remaining distribution to be completed during 2022.
15. COMMITMENTS AND CONTINGENCIES
Purchase obligations
We enter into certain obligations for the purchase of raw materials. These obligations are primarily in the form of forward contracts for the purchase of raw materials from third-party brokers and dealers. These contracts minimize the effect of future price fluctuations by fixing the price of part or all of these purchase obligations. Total obligations consisted of fixed price contracts for the purchase of commodities and unpriced contracts that were valued using market prices as of December 31, 2021.
The cost of commodities associated with the unpriced contracts is variable as market prices change over future periods. We mitigate the variability of these costs to the extent that we have entered into commodities futures contracts or other commodity derivative instruments to hedge our costs for those periods. Increases or decreases in market prices are offset by gains or losses on commodities futures contracts or other commodity derivative instruments. Taking delivery of and making payments for the specific commodities for use in the manufacture of finished goods satisfies our obligations under the forward purchase contracts. For each of the three years in the period ended December 31, 2021, we satisfied these obligations by taking delivery of and making payment for the specific commodities.
As of December 31, 2021, we had entered into agreements for the purchase of raw materials with various suppliers. Subject to meeting our quality standards, the purchase obligations covered by these agreements were as follows as of December 31, 2021:
in millions 2022 2023 2024 2025 2026Purchase obligations $ 1,742.1 $ 405.5 $ 32.8 $ 12.5 $ 12.5
Environmental contingencies
We have a number of facilities that contain varying amounts of asbestos in certain locations within the facilities. Our asbestos management program is compliant with current applicable regulations, which require that we handle or dispose of asbestos in a special manner if such facilities undergo major renovations or are demolished. We do not have sufficient information to estimate the fair value of any asset retirement obligations related to these facilities. We cannot specify the settlement date or range of potential settlement dates and, therefore, sufficient information is not available to apply an expected present value technique. We expect to maintain the facilities with repairs and maintenance activities that would not involve or require the removal of significant quantities of asbestos.
THE HERSHEY COMPANYNOTES TO CONSOLIDATED FINANCIAL STATEMENTS—(Continued)
(amounts in thousands, except share data or if otherwise indicated)
The Hershey Company | 2021 Form 10-K | Page 96
Legal contingencies
On February 12, 2021, Issouf Coubaly, individually and on behalf of proposed class members, filed a complaint (Coubaly v. Nestlé U.S.A. et al., 1:21-cv-00386-DLF (D.D.C. Feb. 12, 2021)) in the District Court of the District of Columbia, seeking injunctive relief and unspecified damages for alleged violations of child labor and human trafficking laws under the Trafficking Victims Protection Reauthorization Act. The Company is among several defendants named in the suit. The Company believes that the suit is without merit and is defending vigorously against the suit.
In addition to the above-referenced matter, the Company is subject to certain legal proceedings and claims arising out of the ordinary course of our business, which cover a wide range of matters including trade regulation, product liability, advertising, contracts, environmental issues, patent and trademark matters, labor and employment matters, human and workplace rights matters and tax. While it is not feasible to predict or determine the outcome of such proceedings and claims with certainty, in our opinion these matters, both individually and in the aggregate, are not expected to have a material effect on our financial condition, results of operations or cash flows.
Collective Bargaining
As of December 31, 2021, the Company employed approximately 16,620 full-time and 2,370 part-time employees worldwide. Collective bargaining agreements covered approximately 6,235 employees, or approximately 33% of the Company’s employees worldwide. During 2022, agreements will be negotiated for certain employees at four facilities outside of the United States, comprising approximately 62% of total employees under collective bargaining agreements. We currently expect that we will be able to renegotiate such agreements on satisfactory terms when they expire.
THE HERSHEY COMPANYNOTES TO CONSOLIDATED FINANCIAL STATEMENTS—(Continued)
(amounts in thousands, except share data or if otherwise indicated)
The Hershey Company | 2021 Form 10-K | Page 97
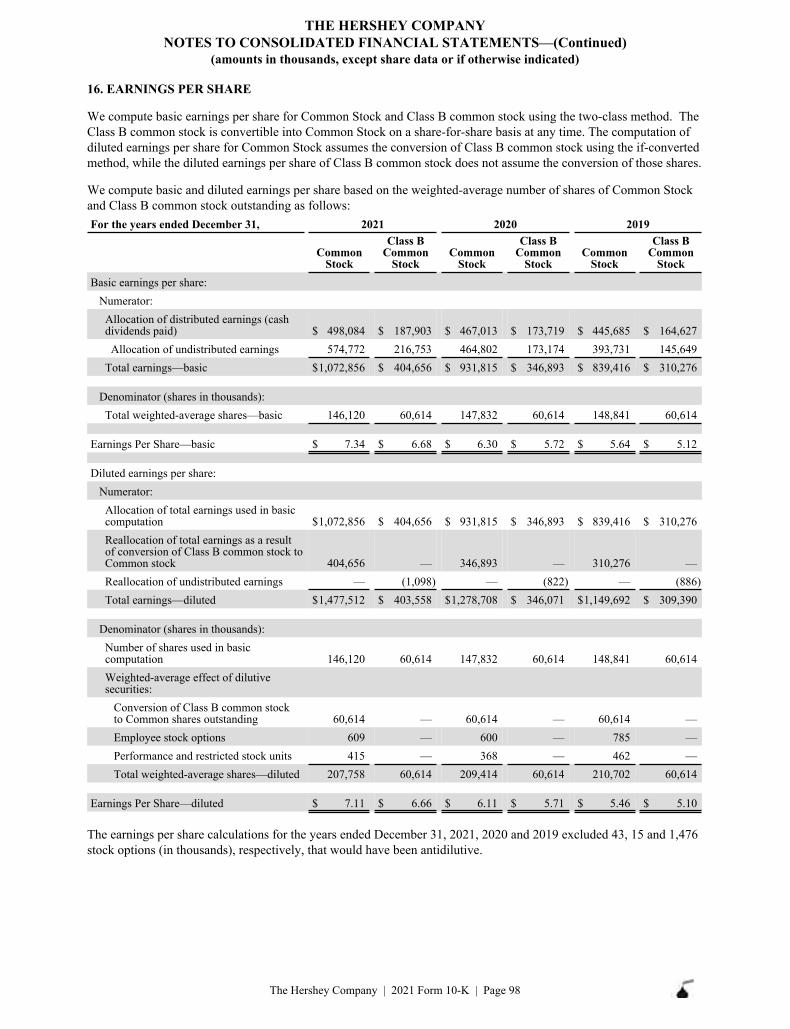
16. EARNINGS PER SHARE
We compute basic earnings per share for Common Stock and Class B common stock using the two-class method. The Class B common stock is convertible into Common Stock on a share-for-share basis at any time. The computation of diluted earnings per share for Common Stock assumes the conversion of Class B common stock using the if-converted method, while the diluted earnings per share of Class B common stock does not assume the conversion of those shares.
We compute basic and diluted earnings per share based on the weighted-average number of shares of Common Stock and Class B common stock outstanding as follows:For the years ended December 31, 2021 2020 2019
Common Stock
Class B Common
StockCommon
Stock
Class B Common
StockCommon
Stock
Class B Common
StockBasic earnings per share:
Numerator:Allocation of distributed earnings (cash dividends paid) $ 498,084 $ 187,903 $ 467,013 $ 173,719 $ 445,685 $ 164,627 Allocation of undistributed earnings 574,772 216,753 464,802 173,174 393,731 145,649
Total earnings—basic $ 1,072,856 $ 404,656 $ 931,815 $ 346,893 $ 839,416 $ 310,276
Denominator (shares in thousands):Total weighted-average shares—basic 146,120 60,614 147,832 60,614 148,841 60,614
Earnings Per Share—basic $ 7.34 $ 6.68 $ 6.30 $ 5.72 $ 5.64 $ 5.12
Diluted earnings per share:Numerator:Allocation of total earnings used in basic computation $ 1,072,856 $ 404,656 $ 931,815 $ 346,893 $ 839,416 $ 310,276 Reallocation of total earnings as a result of conversion of Class B common stock to Common stock 404,656 — 346,893 — 310,276 — Reallocation of undistributed earnings — (1,098) — (822) — (886) Total earnings—diluted $ 1,477,512 $ 403,558 $ 1,278,708 $ 346,071 $ 1,149,692 $ 309,390
Denominator (shares in thousands):Number of shares used in basic computation 146,120 60,614 147,832 60,614 148,841 60,614 Weighted-average effect of dilutive securities:
Conversion of Class B common stock to Common shares outstanding 60,614 — 60,614 — 60,614 — Employee stock options 609 — 600 — 785 — Performance and restricted stock units 415 — 368 — 462 — Total weighted-average shares—diluted 207,758 60,614 209,414 60,614 210,702 60,614
Earnings Per Share—diluted $ 7.11 $ 6.66 $ 6.11 $ 5.71 $ 5.46 $ 5.10
The earnings per share calculations for the years ended December 31, 2021, 2020 and 2019 excluded 43, 15 and 1,476 stock options (in thousands), respectively, that would have been antidilutive.
THE HERSHEY COMPANYNOTES TO CONSOLIDATED FINANCIAL STATEMENTS—(Continued)
(amounts in thousands, except share data or if otherwise indicated)
The Hershey Company | 2021 Form 10-K | Page 98
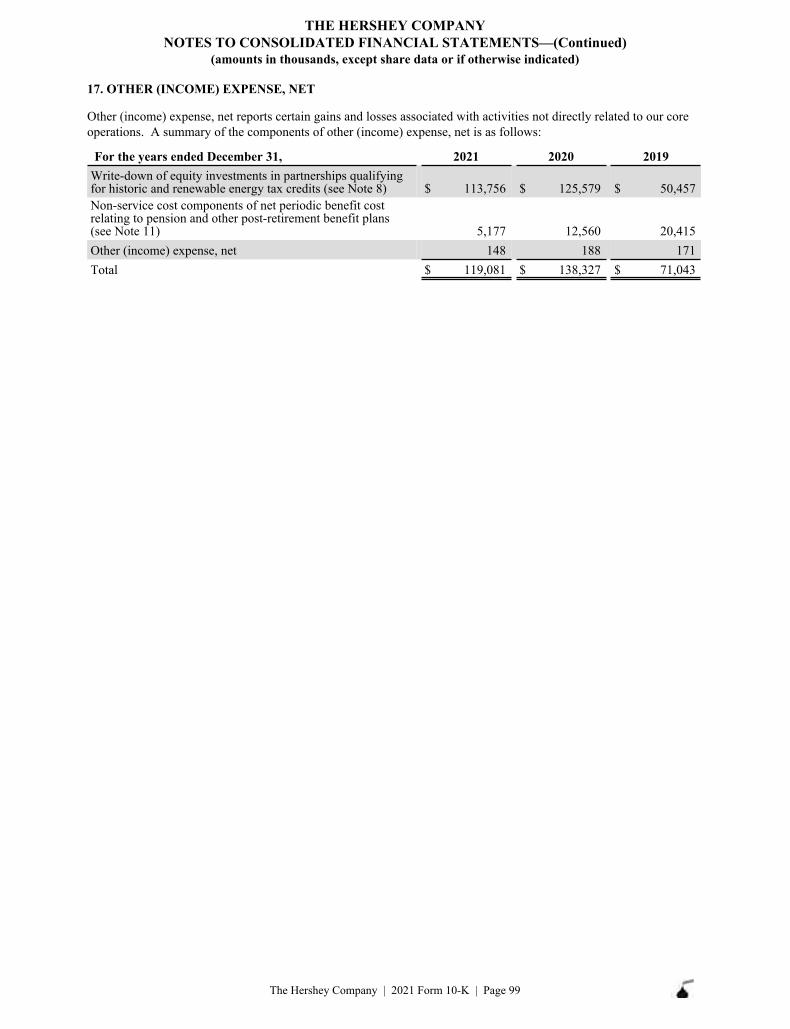
17. OTHER (INCOME) EXPENSE, NET
Other (income) expense, net reports certain gains and losses associated with activities not directly related to our core operations. A summary of the components of other (income) expense, net is as follows:
For the years ended December 31, 2021 2020 2019Write-down of equity investments in partnerships qualifying for historic and renewable energy tax credits (see Note 8) $ 113,756 $ 125,579 $ 50,457 Non-service cost components of net periodic benefit cost relating to pension and other post-retirement benefit plans (see Note 11) 5,177 12,560 20,415 Other (income) expense, net 148 188 171 Total $ 119,081 $ 138,327 $ 71,043
THE HERSHEY COMPANYNOTES TO CONSOLIDATED FINANCIAL STATEMENTS—(Continued)
(amounts in thousands, except share data or if otherwise indicated)
The Hershey Company | 2021 Form 10-K | Page 99
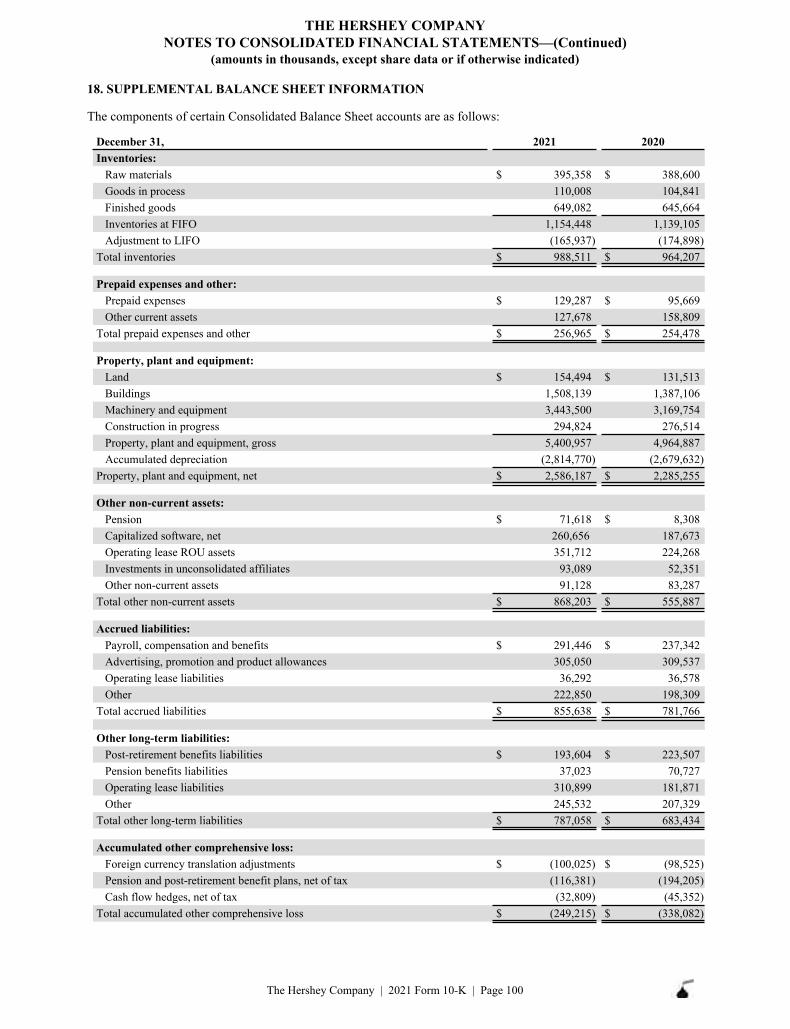
18. SUPPLEMENTAL BALANCE SHEET INFORMATION
The components of certain Consolidated Balance Sheet accounts are as follows:
December 31, 2021 2020Inventories:
Raw materials $ 395,358 $ 388,600 Goods in process 110,008 104,841 Finished goods 649,082 645,664 Inventories at FIFO 1,154,448 1,139,105 Adjustment to LIFO (165,937) (174,898)
Total inventories $ 988,511 $ 964,207
Prepaid expenses and other:Prepaid expenses $ 129,287 $ 95,669 Other current assets 127,678 158,809
Total prepaid expenses and other $ 256,965 $ 254,478
Property, plant and equipment:Land $ 154,494 $ 131,513 Buildings 1,508,139 1,387,106 Machinery and equipment 3,443,500 3,169,754 Construction in progress 294,824 276,514 Property, plant and equipment, gross 5,400,957 4,964,887 Accumulated depreciation (2,814,770) (2,679,632)
Property, plant and equipment, net $ 2,586,187 $ 2,285,255
Other non-current assets:Pension $ 71,618 $ 8,308 Capitalized software, net 260,656 187,673 Operating lease ROU assets 351,712 224,268 Investments in unconsolidated affiliates 93,089 52,351 Other non-current assets 91,128 83,287
Total other non-current assets $ 868,203 $ 555,887
Accrued liabilities:Payroll, compensation and benefits $ 291,446 $ 237,342 Advertising, promotion and product allowances 305,050 309,537 Operating lease liabilities 36,292 36,578 Other 222,850 198,309
Total accrued liabilities $ 855,638 $ 781,766
Other long-term liabilities:Post-retirement benefits liabilities $ 193,604 $ 223,507 Pension benefits liabilities 37,023 70,727 Operating lease liabilities 310,899 181,871 Other 245,532 207,329
Total other long-term liabilities $ 787,058 $ 683,434
Accumulated other comprehensive loss:Foreign currency translation adjustments $ (100,025) $ (98,525) Pension and post-retirement benefit plans, net of tax (116,381) (194,205) Cash flow hedges, net of tax (32,809) (45,352)
Total accumulated other comprehensive loss $ (249,215) $ (338,082)
THE HERSHEY COMPANYNOTES TO CONSOLIDATED FINANCIAL STATEMENTS—(Continued)
(amounts in thousands, except share data or if otherwise indicated)
The Hershey Company | 2021 Form 10-K | Page 100

Item 9. CHANGES IN AND DISAGREEMENTS WITH ACCOUNTANTS ON ACCOUNTING AND FINANCIAL DISCLOSURE
None.
Item 9A. CONTROLS AND PROCEDURES
Evaluation of Disclosure Controls and Procedures
The Company’s management, with the participation of the Company’s Chief Executive Officer and Chief Financial Officer, has evaluated the effectiveness of the Company’s disclosure controls and procedures, as defined in Rules 13a-15(e) and 15d-15(e) of the Securities Exchange Act of 1934 (the “Exchange Act”), as of December 31, 2021. Based on that evaluation, the Company’s Chief Executive Officer and Chief Financial Officer concluded that the Company’s disclosure controls and procedures were effective as of December 31, 2021.
Design and Evaluation of Disclosure Controls and Procedures
Disclosure controls and procedures are controls and other procedures that are designed to ensure that information required to be disclosed in the Company’s reports filed or submitted under the Exchange Act is recorded, processed, summarized and reported within the time periods specified in the Securities and Exchange Commission’s rules and forms. Disclosure controls and procedures include, without limitation, controls and procedures designed to ensure that information required to be disclosed in the Company’s reports filed under the Exchange Act is accumulated and communicated to management, including the Company’s Chief Executive Officer and Chief Financial Officer, as appropriate, to allow timely decisions regarding required disclosure.
Changes in Internal Control Over Financial Reporting
Management’s report on the Company’s internal control over financial reporting appears on the following page. During 2021, the Company acquired Lily’s (June 2021) and Dot’s and Pretzels (December 2021). Other than the ongoing integrations of the aforementioned acquisitions, there were no changes in the Company’s internal control over financial reporting during the fourth quarter of 2021 that have materially affected, or are reasonably likely to materially affect, the Company’s internal control over financial reporting.
We rely extensively on information systems and technology to manage our business and summarize operating results. We are in the process of a multi-year implementation of a new global enterprise resource planning (“ERP”) system, which will replace our existing operating and financial systems. The ERP system is designed to accurately maintain the Company’s financial records, enhance operational functionality and provide timely information to the Company’s management team related to the operation of the business. The implementation is expected to occur in phases over the next several years. When the next phases of the updated processes are rolled out in connection with the ERP implementation, we will give appropriate consideration to whether these process changes necessitate changes in the design of and testing for effectiveness of internal controls over financial reporting.
The Hershey Company | 2021 Form 10-K | Page 101
MANAGEMENT’S ANNUAL REPORT ON INTERNAL CONTROL OVER FINANCIAL REPORTING
The management of The Hershey Company is responsible for establishing and maintaining adequate internal control over financial reporting, as such term is defined in Exchange Act Rule 13a-15(f). The Company’s internal control system was designed to provide reasonable assurance to the Company’s management and Board of Directors regarding the preparation and fair presentation of published financial statements.
All internal control systems, no matter how well designed, have inherent limitations. Therefore, even those systems determined to be effective can provide only reasonable assurance with respect to financial statement preparation and presentation.
The Company’s management, including the Company’s Chief Executive Officer and Chief Financial Officer, assessed the effectiveness of the Company’s internal control over financial reporting as of December 31, 2021. In making this assessment, the Company’s management used the criteria set forth by the Committee of Sponsoring Organizations of the Treadway Commission (COSO) in Internal Control–Integrated Framework (2013 edition). Based on this assessment, management concluded that, as of December 31, 2021, the Company’s internal control over financial reporting was effective based on those criteria.
Management’s assessment of and conclusion on the effectiveness of internal control over financial reporting did not include the internal controls of Lily’s Sweets, LLC, which was acquired on June 25, 2021; Dot’s Pretzels, LLC, which was acquired on December 13, 2021; or Pretzels Inc., which was acquired on December 14, 2021, all of which are included in the 2021 consolidated financial statements of the Company and constituted 17.1% of total assets as of December 31, 2021 and 0.9% of net sales for the year then ended. These exclusions are in accordance with the guidance issued by the U.S. Securities and Exchange Commission that allows companies to exclude acquisitions from management’s report on internal control over financial reporting for the first year after the acquisition.
The Company’s independent auditors have audited, and reported on, the Company’s internal control over financial reporting as of December 31, 2021.
Item 9B. OTHER INFORMATION
None.
Item 9C. DISCLOSURE REGARDING FOREIGN JURISDICTIONS THAT PREVENT INSPECTIONS
None.
The Hershey Company | 2021 Form 10-K | Page 102
PART III
Item 10. DIRECTORS, EXECUTIVE OFFICERS AND CORPORATE GOVERNANCE.
The information regarding executive officers of the Company required by Item 401 of SEC Regulation S-K is incorporated herein by reference from the disclosure included under the caption “Supplemental Item. Information About Out Executive Officers” at the end of Part I of this Annual Report on Form 10-K.
The information required by Item 401 of SEC Regulation S-K concerning the directors and nominees for director of the Company, together with a discussion of the specific experience, qualifications, attributes and skills that led the Board to conclude that the director or nominee should serve as a director at this time, will be located in the Proxy Statement in the section entitled “Proposal No. 1 – Election of Directors,” which information is incorporated herein by reference.
Information regarding the identification of the Audit Committee as a separately-designated standing committee of the Board and information regarding the status of one or more members of the Audit Committee as an “audit committee financial expert” will be located in the Proxy Statement in the section entitled “Corporate Governance – Committees of the Board,” which information is incorporated herein by reference.
There are no inadvertent late filings under Section 16(a) of the Securities Exchange Act of 1934, as amended.
Information regarding our Code of Conduct applicable to our directors, officers and employees is located in Part I of this Annual Report on Form 10-K, under the heading “Available Information.”
Item 11. EXECUTIVE COMPENSATION.
Information regarding the compensation of each of our named executive officers, including our Chief Executive Officer, will be located in the Proxy Statement in the section entitled “Compensation Discussion & Analysis,” which information is incorporated herein by reference. Information regarding the compensation of our directors will be located in the Proxy Statement in the section entitled “Non-Employee Director Compensation,” which information is incorporated herein by reference.
The information required by Item 407(e)(4) of SEC Regulation S-K will be located in the Proxy Statement in the section entitled “Compensation Committee Interlocks and Insider Participation,” which information is incorporated herein by reference.
The information required by Item 407(e)(5) of SEC Regulation S-K will be located in the Proxy Statement in the section entitled “Compensation Committee Report,” which information is incorporated herein by reference.
Item 12. SECURITY OWNERSHIP OF CERTAIN BENEFICIAL OWNERS AND MANAGEMENT AND RELATED STOCKHOLDER MATTERS.
Information concerning ownership of our voting securities by certain beneficial owners, individual nominees for director, the named executive officers, including persons serving as our Chief Executive Officer and Chief Financial Officer, and directors and executive officers as a group, will be located in the Proxy Statement in the section entitled “Share Ownership of Directors, Management and Certain Beneficial Owners,” which information is incorporated herein by reference.
Information regarding all of the Company’s equity compensation plans will be located in the Proxy Statement in the section entitled “Compensation Committee Report – Equity Compensation Plan Information,” which information is incorporated herein by reference.
The Hershey Company | 2021 Form 10-K | Page 103
Item 13. CERTAIN RELATIONSHIPS AND RELATED TRANSACTIONS, AND DIRECTOR INDEPENDENCE.
Information regarding transactions with related persons will be located in the Proxy Statement in the section entitled “Certain Transactions and Relationships,” which information is incorporated herein by reference. Information regarding director independence will be located in the Proxy Statement in the section entitled “Corporate Governance – Director Independence,” which information is incorporated herein by reference.
Item 14. PRINCIPAL ACCOUNTANT FEES AND SERVICES.
Information regarding “Principal Accounting Fees and Services,” including the policy regarding pre-approval of audit and non-audit services performed by our Company’s independent auditors, will be located in the Proxy Statement in the section entitled “Information about Our Independent Auditors,” which information is incorporated herein by reference.
The Hershey Company | 2021 Form 10-K | Page 104
PART IV
Item 15. EXHIBITS AND FINANCIAL STATEMENT SCHEDULES
Item 15(a)(1): Financial Statements
The audited consolidated financial statements of The Hershey Company and its subsidiaries and the Report of Independent Registered Public Accounting Firm thereon, as required to be filed, are located under Item 8 of this Annual Report on Form 10-K.
Item 15(a)(2): Financial Statement Schedule
Schedule II—Valuation and Qualifying Accounts for The Hershey Company and its subsidiaries for the years ended December 31, 2021, 2020 and 2019 is filed as part of this Annual Report on Form 10-K as required by Item 15(c).
We omitted other schedules because they are not applicable or the required information is set forth in the consolidated financial statements or notes thereto.
Item 15(a)(3): Exhibits
The following exhibits are filed as part of, or incorporated by reference into, this Annual Report on Form 10-K.
EXHIBIT INDEX
Exhibit Number Description
3.1 The Company’s Restated Certificate of Incorporation, as amended, is incorporated by reference from Exhibit 3 to the Company’s Quarterly Report on Form 10-Q for the quarter ended April 3, 2005.
3.2 The Company’s By-laws, as amended and restated as of February 21, 2017, are incorporated by reference from Exhibit 3.2 to the Company’s Annual Report on Form 10-K for the fiscal year ended December 31, 2018.
4.1 The Company has issued certain long-term debt instruments, no one class of which creates indebtedness exceeding 10% of the total assets of the Company and its subsidiaries on a consolidated basis. These classes consist of the following:1) 2.625% Notes due 20232) 3.375% Notes due 20233) 2.050% Notes due 20244) 0.900% Notes due 20255) 3.200% Notes due 20256) 2.300% Notes due 20267) 7.200% Debentures due 20278) 2.450% Notes due 20299) 1.700% Notes due 203010) 3.375% Notes due 204611) 3.125% Notes due 204912) 2.650% Notes due 205013) Other ObligationsThe Company undertakes to furnish copies of the agreements governing these debt instruments to the Securities and Exchange Commission upon its request.
4.2 The Company’s Description of Common Stock and Class B Common Stock registered under Section 12 of the Exchange Act.*
10.1(a) Kit Kat® and Rolo® License Agreement (the “License Agreement”) between the Company and Rowntree Mackintosh Confectionery Limited is incorporated by reference from Exhibit 10(a) to the Company’s Annual Report on Form 10-K for the fiscal year ended December 31, 1980.#
The Hershey Company | 2021 Form 10-K | Page 105
10.1(b) Amendment to the License Agreement is incorporated by reference from Exhibit 19 to the Company’s Quarterly Report on Form 10-Q for the quarter ended July 3, 1988.#
10.1(c) Assignment of the License Agreement by Rowntree Mackintosh Confectionery Limited to Société des Produits Nestlé SA as of January 1, 1990 is incorporated by reference from Exhibit 19 to the Company’s Annual Report on Form 10-K for the fiscal year ended December 31, 1990.#
10.2 Peter Paul/York Domestic Trademark & Technology License Agreement between the Company and Cadbury Schweppes Inc. (now Kraft Foods Ireland Intellectual Property Limited) dated August 25, 1988, is incorporated by reference from Exhibit 2(a) to the Company’s Current Report on Form 8-K dated September 8, 1988.#
10.3 Cadbury Trademark & Technology License Agreement between the Company and Cadbury Limited (now Cadbury UK Limited) dated August 25, 1988, is incorporated by reference from Exhibit 2(a) to the Company’s Current Report on Form 8-K dated September 8, 1988.#
10.4(a) Trademark and Technology License Agreement between Huhtamäki (now Iconic IP Interests, LLC) and the Company dated December 30, 1996, is incorporated by reference from Exhibit 10 to the Company’s Current Report on Form 8-K filed February 26, 1997.
10.4(b) Amended and Restated Trademark and Technology License Agreement between Huhtamäki (now Iconic IP Interests, LLC) and the Company is incorporated by reference from Exhibit 10.2 to the Company’s Annual Report on Form 10-K for the fiscal year ended December 31, 1999.
10.5 Five Year Credit Agreement dated as of July 2, 2019, among the Company and the banks, financial institutions and other institutional lenders listed on the respective signature pages thereof (“Lenders”), Bank of America, N.A., as administrative agent for the Lenders, JPMorgan Chase Bank, N.A., Citibank, N.A. and PNC Bank, National Association, as syndication agents, Royal Bank of Canada, as documentation agent, and BofA Securities, Inc., JPMorgan Chase Bank, N.A., Citibank, N.A., PNC Capital Markets LLC and RBC Capital Markets, as joint lead arrangers and joint book managers, is incorporated by reference from Exhibit 10.1 to the Company's Current Report on Form 8-K filed July 2, 2019.
10.6(a) Master Innovation and Supply Agreement between the Company and Barry Callebaut, AG, dated July 13, 2007, is incorporated by reference from Exhibit 10.1 to the Company’s Current Report on Form 8-K filed July 19, 2007.
10.6(b) First Amendment to Master Innovation and Supply Agreement between the Company and Barry Callebaut, AG, dated April 14, 2011, is incorporated by reference from Exhibit 10.4 to the Company’s Quarterly Report on Form 10-Q for the quarter ended July 3, 2011.
10.7 Supply Agreement for Monterrey, Mexico, between the Company and Barry Callebaut, AG, dated July 13, 2007, is incorporated by reference from Exhibit 10.2 to the Company’s Current Report on Form 8-K filed July 19, 2007.
10.8 The Company’s Equity and Incentive Compensation Plan, amended and restated February 22, 2011, and approved by our stockholders on April 28, 2011, is incorporated by reference from Appendix B to the Company’s proxy statement filed March 15, 2011.+
10.9(a) Form of Notice of Award of Restricted Stock Units (February 15, 2016 - February 21, 2017 version) is incorporated by reference from Exhibit 10.10(b) to the Company’s Annual Report on Form 10-K for the fiscal year ended December 31, 2016.+
10.9(b) Form of Notice of Award of Restricted Stock Units (February 22, 2017 - February 25, 2019 version) is incorporated by reference from Exhibit 10.1 to the Company’s Quarterly Report on Form 10-Q for the quarter ended April 2, 2017.+
10.9(c) Form of Notice of Award of Restricted Stock Units (February 26, 2019 - February 22, 2021 version) is incorporated by reference from Exhibit 10.1 to the Company's Quarterly Report on Form 10-Q for the quarter ended March 31, 2019.+
10.9(d) Form of Notice of Award of Restricted Stock Units (effective February 23, 2021) is incorporated by reference from Exhibit 10.1 to the Company's Quarterly Report on Form 10-Q for the quarter ended April 4, 2021.+
10.9(e) Form of Notice of Award of Restricted Stock Units (3-year vest, effective February 23, 2021) is incorporated by reference from Exhibit 10.2 to the Company’s Quarterly Report on Form 10-Q for the quarter ended April 4, 2021.+
10.10(a) Form of Notice of Special Award of Restricted Stock Units (pro-rata vest, February 15, 2016 - February 21, 2017 version) is incorporated by reference from Exhibit 10.1 to the Company’s Current Report on Form 8-K filed June 17, 2016.+
10.10(b) Form of Notice of Special Award of Restricted Stock Units (pro-rata vest, February 22, 2017 - February 25, 2019 version) is incorporated by reference from Exhibit 10.2(a) to the Company’s Quarterly Report on Form 10-Q for the quarter ended April 2, 2017.+
10.10(c) Form of Notice of Special Award of Restricted Stock Units (pro-rata vest, February 26, 2019 - February 22, 2021 version) is incorporated by reference from Exhibit 10.2 to the Company’s Quarterly Report on Form 10-Q for the quarter ended March 31, 2019.+
The Hershey Company | 2021 Form 10-K | Page 106
10.10(d) Form of Notice of Special Award of Restricted Stock Units (pro-rata vest, effective February 23, 2021) is incorporated by reference from Exhibit 10.3 to the Company’s Quarterly Report on Form 10-Q for the quarter ended April 4, 2021.+
10.10(e) Form of Notice of Special Award of Restricted Stock Units (3-year cliff vest, February 22, 2017 - February 25, 2019 version) is incorporated by reference from Exhibit 10.2(b) to the Company’s Quarterly Report on Form 10-Q for the quarter ended April 2, 2017.+
10.10(f) Form of Notice of Special Award of Restricted Stock Units (3-year cliff vest, effective February 26, 2019) is incorporated by reference from Exhibit 10.3 to the Company’s Quarterly Report on Form 10-Q for the quarter ended March 31, 2019.+
10.11(a) Terms and Conditions of Nonqualified Stock Option Awards under the Equity and Incentive Compensation Plan (pre-February 15, 2016 version) is incorporated by reference from Exhibit 10.2 to the Company’s Current Report on Form 8-K filed February 24, 2012.+
10.11(b) Terms and Conditions of Nonqualified Stock Option Awards under the Equity and Incentive Compensation Plan (February 15, 2016 - February 21, 2017 version) is incorporated by reference from Exhibit 10.12(b) to the Company’s Annual Report on Form 10-K for the fiscal year ended December 31, 2016.+
10.11(c) Terms and Conditions of Nonqualified Stock Option Awards under the Equity and Incentive Compensation Plan (February 22, 2017 - February 25, 2019 version) is incorporated by reference from Exhibit 10.3 to the Company’s Quarterly Report on Form 10-Q for the quarter ended April 2, 2017.+
10.11(d) Terms and Conditions of Nonqualified Stock Option Awards under the Equity and Incentive Compensation Plan (February 26, 2019 - February 22, 2021 version) is incorporated by reference from Exhibit 10.4 to the Company’s Quarterly Report on Form 10-Q for the quarter ended March 31, 2019.+
10.11(e) Terms and Conditions of Nonqualified Stock Option Awards under the Equity and Incentive Compensation Plan (effective February 23, 2021) is incorporated by reference from Exhibit 10.4 to the Company’s Quarterly Report on Form 10-Q for the quarter ended April 4, 2021.+
10.12(a) Form of Notice of Award of Performance Stock Units (February 15, 2016 - February 21, 2017 version) is incorporated by reference from Exhibit 10.13(b) to the Company’s Annual Report on Form 10-K for the fiscal year ended December 31, 2016.+
10.12(b) Form of Notice of Award of Performance Stock Units (February 22, 2017 - February 25, 2019 version) is incorporated by reference from Exhibit 10.4 to the Company’s Quarterly Report on Form 10-Q for the quarter ended April 2, 2017.+
10.12(c) Form of Notice of Award of Performance Stock Units (February 26, 2019 - February 22, 2021 version) is incorporated by reference from Exhibit 10.5 to the Company’s Quarterly Report on Form 10-Q for the quarter
10.12(d) Form of Notice of Award of Performance Stock Units (effective February 23, 2021) is incorporated by reference from Exhibit 10.5 to the Company’s Quarterly Report on Form 10-Q for the quarter ended April 4, 2021.+
10.13(a) Form of Notice of Special Award of Performance Stock Units (February 22, 2017 - February 22, 2021 version) is incorporated by reference from Exhibit 10.1 to the Company’s Current Report on Form 8-K filed May 5, 2017.+
10.13(b) Form of Notice of Special Award of Performance Stock Units (effective February 23, 2021) is incorporated by reference from Exhibit 10.6 to the Company’s Quarterly Report on Form 10-Q for the quarter ended April 4, 2021.+
10.14 The Long-Term Incentive Program Participation Agreement is incorporated by reference from Exhibit 10.2 to the Company’s Current Report on Form 8-K filed February 18, 2005.+
10.15 The Company’s Deferred Compensation Plan, Amended and Restated as of June 27, 2012, is incorporated by reference from Exhibit 10.3 to the Company’s Quarterly Report on Form 10-Q for the quarter ended July 1, 2012.+
10.16(a) The Company’s Supplemental Executive Retirement Plan, Amended and Restated as of October 2, 2007, is incorporated by reference from Exhibit 10.6 to the Company’s Annual Report on Form 10-K for the fiscal year ended December 31, 2007.+
10.16(b) First Amendment to the Company’s Supplemental Executive Retirement Plan, Amended and Restated as of October 2, 2007, is incorporated by reference from Exhibit 10.5 to the Company’s Annual Report on Form 10-K for the fiscal year ended December 31, 2008.+
10.17 The Company’s Compensation Limit Replacement Plan, Amended and Restated as of January 1, 2009, is incorporated by reference from Exhibit 10.6 to the Company’s Annual Report on Form 10-K for the fiscal year ended December 31, 2008.+
10.18 The Company’s Executive Benefits Protection Plan (Group 3A), Amended and Restated as of June 27, 2012, is incorporated by reference from Exhibit 10.2 to the Company’s Quarterly Report on Form 10-Q for the quarter ended July 1, 2012.+
The Hershey Company | 2021 Form 10-K | Page 107
10.19 The Company’ s Executive Benefits Protection Plan (Group 3), Amended and Restated as of June 27, 2012, is incorporated by reference from Exhibit 10.18 to the Company’s Annual Report on Form 10-K for the fiscal year ended December 31, 2015.+
10.20(a) Employee Confidentiality and Restrictive Covenant Agreement, amended as of February 18, 2013, is incorporated by reference from Exhibit 10.1 to the Company’s Quarterly Report on Form 10-Q for the quarter ended March 31, 2013.+
10.20(b) Employee Confidentiality and Restrictive Covenant Agreement, amended as of October 10, 2016, is incorporated by reference from Exhibit 10.21(b) to the Company’s Annual Report on Form 10-K for the fiscal year ended December 31, 2016.+
10.20(c) Employee Confidentiality and Restrictive Covenant Agreement, amended as of September 8, 2021, is incorporated
10.21
10.22
21.123.131.1
31.2
32.1
by reference from Exhibit 10.1 to the Company’s Quarterly Report on Form 10-Q for the quarter ended October 4, 2021.+
Executive Employment Agreement, effective as of March 1, 2017, by and between the Company and Michele G. Buck is incorporated by reference from Exhibit 10.1 to the Company’s Current Report on Form 8-K/A filed February 24, 2017.+
The Company’s Directors’ Compensation Plan, Amended and Restated as of December 2, 2008, is incorporated by reference from Exhibit 10.8 to the Company’s Annual Report on Form 10-K for the fiscal year ended December 31, 2008.+
Subsidiaries of the Registrant.*Consent of Ernst & Young LLP.*Certification of Michele G. Buck, Chief Executive Officer, pursuant to Section 302 of the Sarbanes-Oxley Act of 2002.*Certification of Steven E. Voskuil, Chief Financial Officer, pursuant to Section 302 of the Sarbanes-Oxley Act of 2002.*Certification of Michele G. Buck, Chief Executive Officer, and Steven E. Voskuil, Chief Financial Officer, pursuant to Section 906 of the Sarbanes-Oxley Act of 2002.**
101.INS XBRL Instance Document - the instance document does not appear in the Interactive Data File because its XBRLtags are embedded within the Inline XBRL document.
101.SCH XBRL Taxonomy Extension Schema101.CAL XBRL Taxonomy Extension Calculation Linkbase101.LAB XBRL Taxonomy Extension Label Linkbase101.PRE XBRL Taxonomy Extension Presentation Linkbase101.DEF XBRL Taxonomy Extension Definition Linkbase
104 The cover page from the Company’s Annual Report on Form 10-K for the fiscal year ended December 31, 2020, formatted in Inline XBRL and contained in Exhibit 101.
* Filed herewith** Furnished herewith+ Management contract, compensatory plan or arrangement# Pursuant to Instruction 1 to Regulation S-T Rule 105(d), no hyperlink is required for any exhibit incorporated by
reference that has not been filed with the SEC in electronic format
Item 16. FORM 10-K SUMMARY
None.
The Hershey Company | 2021 Form 10-K | Page 108
SIGNATURES
Pursuant to the requirements of Section 13 or 15(d) of the Securities Exchange Act of 1934, the Company has duly caused this report to be signed on its behalf by the undersigned, thereunto duly authorized, this 18th day of February, 2022.
THE HERSHEY COMPANY(Registrant)
By: /s/ STEVEN E. VOSKUILSteven E. Voskuil
Senior Vice President, Chief Financial Officer
Pursuant to the requirements of the Securities Exchange Act of 1934, this report has been signed below by the following persons on behalf of the Company and in the capacities and on the date indicated.
/s/ MICHELE G. BUCK Chairman of the Board, President and Chief Executive Officer February 18, 2022Michele G. Buck (Principal Executive Officer)
/s/ STEVEN E. VOSKUIL Senior Vice President, Chief Financial Officer February 18, 2022Steven E. Voskuil (Principal Financial Officer)
/s/ JENNIFER L. MCCALMAN Vice President, Chief Accounting Officer February 18, 2022Jennifer L. McCalman (Principal Accounting Officer)
/s/ ANTHONY J. PALMER Lead Independent Director February 18, 2022Anthony J. Palmer
/s/ PAMELA M. ARWAY Director February 18, 2022Pamela M. Arway
/s/ JAMES W. BROWN Director February 18, 2022James W. Brown
/s/ VICTOR L. CRAWFORD Director February 18, 2022Victor L. Crawford
/s/ ROBERT M. DUTKOWSKY Director February 18, 2022Robert M. Dutkowsky
/s/ MARY KAY HABEN Director February 18, 2022Mary Kay Haben
/s/ JAMES C. KATZMAN Director February 18, 2022James C. Katzman
/s/ M. DIANE KOKEN Director February 18, 2022M. Diane Koken
/s/ ROBERT M. MALCOLM Director February 18, 2022Robert M. Malcolm
/s/ JUAN R. PEREZ Director February 18, 2022Juan R. Perez
/s/ WENDY L. SCHOPPERT Director February 18, 2022Wendy L. Schoppert
Signature Title Date
The Hershey Company | 2021 Form 10-K | Page 109
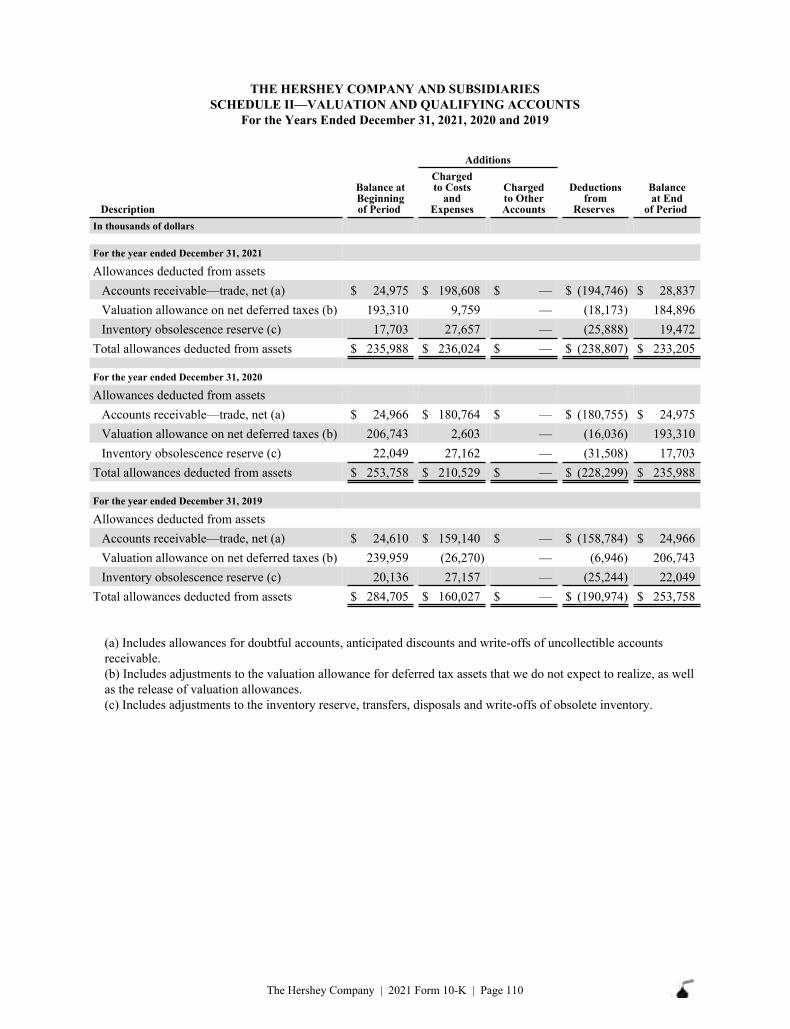
THE HERSHEY COMPANY AND SUBSIDIARIESSCHEDULE II—VALUATION AND QUALIFYING ACCOUNTS
For the Years Ended December 31, 2021, 2020 and 2019
Additions
Description
Balance at Beginning of Period
Charged to Costs
and Expenses
Charged to Other Accounts
Deductions from
Reserves
Balance at End
of Period In thousands of dollars
For the year ended December 31, 2021
Allowances deducted from assetsAccounts receivable—trade, net (a) $ 24,975 $ 198,608 $ — $ (194,746) $ 28,837 Valuation allowance on net deferred taxes (b) 193,310 9,759 — (18,173) 184,896 Inventory obsolescence reserve (c) 17,703 27,657 — (25,888) 19,472
Total allowances deducted from assets $ 235,988 $ 236,024 $ — $ (238,807) $ 233,205
For the year ended December 31, 2020
Allowances deducted from assetsAccounts receivable—trade, net (a) $ 24,966 $ 180,764 $ — $ (180,755) $ 24,975 Valuation allowance on net deferred taxes (b) 206,743 2,603 — (16,036) 193,310 Inventory obsolescence reserve (c) 22,049 27,162 — (31,508) 17,703
Total allowances deducted from assets $ 253,758 $ 210,529 $ — $ (228,299) $ 235,988
For the year ended December 31, 2019
Allowances deducted from assetsAccounts receivable—trade, net (a) $ 24,610 $ 159,140 $ — $ (158,784) $ 24,966 Valuation allowance on net deferred taxes (b) 239,959 (26,270) — (6,946) 206,743 Inventory obsolescence reserve (c) 20,136 27,157 — (25,244) 22,049
Total allowances deducted from assets $ 284,705 $ 160,027 $ — $ (190,974) $ 253,758
(a) Includes allowances for doubtful accounts, anticipated discounts and write-offs of uncollectible accountsreceivable.(b) Includes adjustments to the valuation allowance for deferred tax assets that we do not expect to realize, as wellas the release of valuation allowances.(c) Includes adjustments to the inventory reserve, transfers, disposals and write-offs of obsolete inventory.
The Hershey Company | 2021 Form 10-K | Page 110

Exhibit 31.1
CERTIFICATION
I, Michele G. Buck, certify that:
1. I have reviewed this Annual Report on Form 10-K of The Hershey Company;
2. Based on my knowledge, this report does not contain any untrue statement of a material fact or omit to state a materialfact necessary to make the statements made, in light of the circumstances under which such statements were made, notmisleading with respect to the period covered by this report;
3. Based on my knowledge, the financial statements, and other financial information included in this report, fairly presentin all material respects the financial condition, results of operations and cash flows of the registrant as of, and for, theperiods presented in this report;
4. The registrant’s other certifying officer(s) and I are responsible for establishing and maintaining disclosure controls andprocedures (as defined in Exchange Act Rules 13a-15(e) and 15d-15(e)) and internal control over financial reporting(as defined in Exchange Act Rules 13a-15(f) and 15d-15(f)) for the registrant and have:
(a) Designed such disclosure controls and procedures, or caused such disclosure controls and procedures to bedesigned under our supervision, to ensure that material information relating to the registrant, including itsconsolidated subsidiaries, is made known to us by others within those entities, particularly during the period inwhich this report is being prepared;
(b) Designed such internal control over financial reporting, or caused such internal control over financial reporting tobe designed under our supervision, to provide reasonable assurance regarding the reliability of financial reportingand the preparation of financial statements for external purposes in accordance with generally acceptedaccounting principles;
(c) Evaluated the effectiveness of the registrant’s disclosure controls and procedures and presented in this report ourconclusions about the effectiveness of the disclosure controls and procedures, as of the end of the period coveredby this report based on such evaluation; and
(d) Disclosed in this report any change in the registrant’s internal control over financial reporting that occurredduring the registrant’s most recent fiscal quarter (the registrant’s fourth fiscal quarter in the case of an annualreport) that has materially affected, or is reasonably likely to materially affect, the registrant’s internal controlover financial reporting; and
5. The registrant’s other certifying officer(s) and I have disclosed, based on our most recent evaluation of internal controlover financial reporting, to the registrant’s auditors and the audit committee of the registrant’s board of directors (orpersons performing the equivalent functions):
(a) All significant deficiencies and material weaknesses in the design or operation of internal control over financialreporting which are reasonably likely to adversely affect the registrant’s ability to record, process, summarizeand report financial information; and
(b) Any fraud, whether or not material, that involves management or other employees who have a significant role inthe registrant’s internal control over financial reporting.
/s/ MICHELE G. BUCKMichele G. Buck
Chief Executive OfficerFebruary 18, 2022
The Hershey Company | 2021 Form 10-K | Page 111
Exhibit 31.2
CERTIFICATION
I, Steven E. Voskuil, certify that:
1. I have reviewed this Annual Report on Form 10-K of The Hershey Company;
2. Based on my knowledge, this report does not contain any untrue statement of a material fact or omit to state a materialfact necessary to make the statements made, in light of the circumstances under which such statements were made, notmisleading with respect to the period covered by this report;
3. Based on my knowledge, the financial statements, and other financial information included in this report, fairly presentin all material respects the financial condition, results of operations and cash flows of the registrant as of, and for, theperiods presented in this report;
4. The registrant’s other certifying officer(s) and I are responsible for establishing and maintaining disclosure controls andprocedures (as defined in Exchange Act Rules 13a-15(e) and 15d-15(e)) and internal control over financial reporting(as defined in Exchange Act Rules 13a-15(f) and 15d-15(f)) for the registrant and have:
(a) Designed such disclosure controls and procedures, or caused such disclosure controls and procedures to bedesigned under our supervision, to ensure that material information relating to the registrant, including itsconsolidated subsidiaries, is made known to us by others within those entities, particularly during the period inwhich this report is being prepared;
(b) Designed such internal control over financial reporting, or caused such internal control over financial reporting tobe designed under our supervision, to provide reasonable assurance regarding the reliability of financial reportingand the preparation of financial statements for external purposes in accordance with generally acceptedaccounting principles;
(c) Evaluated the effectiveness of the registrant’s disclosure controls and procedures and presented in this report ourconclusions about the effectiveness of the disclosure controls and procedures, as of the end of the period coveredby this report based on such evaluation; and
(d) Disclosed in this report any change in the registrant’s internal control over financial reporting that occurredduring the registrant’s most recent fiscal quarter (the registrant’s fourth fiscal quarter in the case of an annualreport) that has materially affected, or is reasonably likely to materially affect, the registrant’s internal controlover financial reporting; and
5. The registrant’s other certifying officer(s) and I have disclosed, based on our most recent evaluation of internal controlover financial reporting, to the registrant’s auditors and the audit committee of the registrant’s board of directors (orpersons performing the equivalent functions):
(a) All significant deficiencies and material weaknesses in the design or operation of internal control over financialreporting which are reasonably likely to adversely affect the registrant’s ability to record, process, summarizeand report financial information; and
(b) Any fraud, whether or not material, that involves management or other employees who have a significant role inthe registrant’s internal control over financial reporting.
/S/ STEVEN E. VOSKUILSteven E. Voskuil
Chief Financial OfficerFebruary 18, 2022
The Hershey Company | 2021 Form 10-K | Page 112

Exhibit 32.1
CERTIFICATION
Pursuant to Section 906 of the Sarbanes-Oxley Act of 2002, the undersigned officers of The Hershey Company (the “Company”) hereby certify that the Company’s Annual Report on Form 10-K for the year ended December 31, 2021 (the “Report”) fully complies with the requirements of Section 13(a) or 15(d), as applicable, of the Securities Exchange Act of 1934 and that the information contained in the Report fairly presents, in all material respects, the financial condition and results of operations of the Company.
Date: February 18, 2022 /s/ MICHELE G. BUCK
Michele G. Buck Chief Executive Officer
Date: February 18, 2022 /s/ STEVEN E. VOSKUIL
Steven E. VoskuilChief Financial Officer
A signed original of this written statement required by Section 906, or other document authenticating, acknowledging, or otherwise adopting the signature that appears in typed form within the electronic version of this written statement required by Section 906, has been provided to the Company and will be retained by the Company and furnished to the Securities and Exchange Commission or its staff upon request.
The Hershey Company | 2021 Form 10-K | Page 113
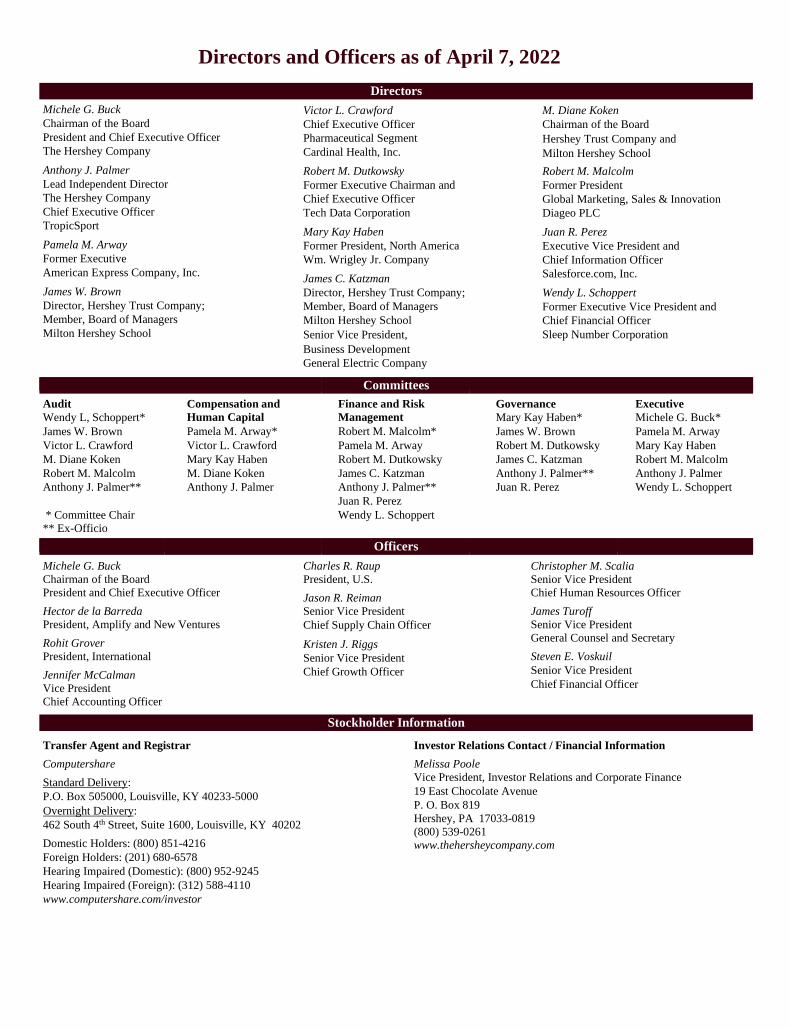
Directors and Officers as of April 7, 2022
Michele G. Buck Chairman of the Board President and Chief Executive Officer The Hershey Company Anthony J. Palmer Lead Independent Director The Hershey Company Chief Executive Officer TropicSport Pamela M. Arway Former Executive American Express Company, Inc. James W. Brown Director, Hershey Trust Company; Member, Board of Managers Milton Hershey School
Victor L. Crawford Chief Executive Officer Pharmaceutical Segment Cardinal Health, Inc. Robert M. Dutkowsky Former Executive Chairman and Chief Executive Officer Tech Data Corporation Mary Kay Haben Former President, North America Wm. Wrigley Jr. Company James C. Katzman Director, Hershey Trust Company; Member, Board of Managers Milton Hershey School Senior Vice President, Business Development General Electric Company
M. Diane Koken Chairman of the Board Hershey Trust Company and Milton Hershey School Robert M. Malcolm Former President Global Marketing, Sales & Innovation Diageo PLC Juan R. Perez Executive Vice President and Chief Information Officer Salesforce.com, Inc. Wendy L. Schoppert Former Executive Vice President and Chief Financial Officer Sleep Number Corporation
Committees
Audit Compensation and Finance and Risk Governance Executive Wendy L, Schoppert* Human Capital Management Mary Kay Haben* Michele G. Buck* James W. Brown Pamela M. Arway* Robert M. Malcolm* James W. Brown Pamela M. Arway Victor L. Crawford Victor L. Crawford Pamela M. Arway Robert M. Dutkowsky Mary Kay Haben M. Diane Koken Mary Kay Haben Robert M. Dutkowsky James C. Katzman Robert M. Malcolm Robert M. Malcolm M. Diane Koken James C. Katzman Anthony J. Palmer** Anthony J. Palmer Anthony J. Palmer** Anthony J. Palmer Anthony J. Palmer** Juan R. Perez Wendy L. Schoppert Juan R. Perez * Committee Chair ** Ex-Officio
Wendy L. Schoppert
Officers
Michele G. Buck Chairman of the Board President and Chief Executive Officer Hector de la Barreda President, Amplify and New Ventures Rohit Grover President, International Jennifer McCalman Vice President Chief Accounting Officer
Charles R. Raup President, U.S. Jason R. Reiman Senior Vice President Chief Supply Chain Officer Kristen J. Riggs Senior Vice President Chief Growth Officer
Christopher M. Scalia Senior Vice President Chief Human Resources Officer James Turoff Senior Vice President General Counsel and Secretary Steven E. Voskuil Senior Vice President Chief Financial Officer
Transfer Agent and Registrar Computershare Standard Delivery: P.O. Box 505000, Louisville, KY 40233-5000 Overnight Delivery: 462 South 4th Street, Suite 1600, Louisville, KY 40202 Domestic Holders: (800) 851-4216 Foreign Holders: (201) 680-6578 Hearing Impaired (Domestic): (800) 952-9245 Hearing Impaired (Foreign): (312) 588-4110 www.computershare.com/investor
Investor Relations Contact / Financial Information Melissa Poole Vice President, Investor Relations and Corporate Finance 19 East Chocolate Avenue P. O. Box 819 Hershey, PA 17033-0819 (800) 539-0261 www.thehersheycompany.com
Directors
Stockholder Information

General InformationRegarding Annual
MeetingMay 17, 2022 | 10:00 a.m., Eastern Daylight Time
Virtual Meeting Site: www.virtualshareholdermeeting.com/HSY2022