Investigating Knowledge Diffusion in a South African Telecoms Organisation

North-South and South-South Trade-related Technology Diffusion: How Important Are They in Improving TFP Growth?
Maurice Schiffa
Yanling Wangb
February 2006
Abstract
This paper examines the impact on total factor productivity (TFP) growth in the South of North-South and South-South trade-related technology diffusion. North-South and South-South trade-related R&D stocks are constructed based on industry-specific R&D in the North, North-South and South-South trade patterns, and input-output relations in the South. We explicitly control for endogeneity problems by using lagged independent variables and also control for effects on TFP growth from foreign direct investment (FDI). The main findings are: i) both North-South and South-South trade-related R&D stocks have a positive impact on TFP growth, ii) FDI also promote international technology diffusion, though the effects are smaller, and weaker; and (iii) the higher a country’s human capital, the larger the effects on TFP from North-South trade-related technology diffusion.
We would like to thank Susan Collins, Caroline Freund, Daniel Lederman, Rodney Ludema, Will Martin, Keith Maskus, seminar participants at the World Bank and two anonymous referees for their useful comments. Special thanks go to Marcelo Olarreaga for his invaluable suggestions and comments. a. International Trade Unit, Research Department, The World Bank. E-mail:
[email protected]. b. The Norman Paterson School of International Affairs, Carleton University. 1125
Colonel By Drive, Ottawa, ON K1S 5B6. E-mail: [email protected].
1

North-South and South-South Trade-related Technology Diffusion: How Important are They in Improving TFP Growth?
1. Introduction
Until about a decade ago, international trade economists obtained gains from trade
that they considered to be disappointingly small. These were obtained on the basis of
existing static analysis and neoclassical growth theory. On the other hand, endogenous
growth theory (see Romer 1986, 1990; Lucas 1988), by enabling government policy to
move the economy to a different growth path, made it possible for policy to generate
large gains from policy reform.1 In the area of trade policy, the basic idea developed by
Grossman and Helpman (1991)--who incorporated trade in an endogenous growth
framework—is that goods embody technological know-how and therefore countries can
acquire foreign knowledge through trade.
Coe and Helpman (1995) provide an empirical implementation of the open
economy endogenous growth model. They construct an index of foreign R&D as the
trade-weighted sum of trading partners’ R&D stocks. They find for OECD countries that
both domestic and ‘foreign R&D’ have a significant impact on TFP, and that the impact
of foreign R&D increases with the general degree of openness of the economy and with
openness towards the larger R&D producing countries.2 The study was then followed by
Engelbrecht (1997), Keller (1998), Lichtenberg et al. (1998), Falvey et al. (2002) and
Lumenga-Neso et al. (2005), all of which tend to confirm the findings in Coe and
1 These papers argue that, though returns to accumulation of human capital and knowledge decline at the individual level, they do not at the aggregate level because of positive spillover effects. An excellent review of the origins of endogenous growth is Romer (1994). 2 Lumenga-Neso et al. (2005) use a trade-weighted index of foreign R&D by incorporating the effect of ‘indirect’ R&D. Simply put, it implies that countries learn not from the produced R&D of their trading partners but from their larger available R&D (which is equal to the produced R&D plus the R&D they obtain through trade). They obtain significantly better results than Coe and Helpman (1995).
2

Helpman (1995) from slightly different methodology with the same sample, with the
exception of Keller (1998) who finds that a country’s trade pattern is not necessarily
related to international technology diffusion.
Coe et al. (1997) extend that approach in the context of North-South trade and
examine the impact on TFP in the South of technology developed in the North diffused
through trade at the aggregate level. This study stimulated a few works such as
Engelbrecht (2002), Falvey et al. (2005), and Savvides and Zachariadis (2005).3 Industry
level studies tend to confirm the findings at the aggregate level using a similar approach
in Coe and Helpman (1995), see Keller (2000, 2002) for OECD countries. In the North-
South context at the industry level, Schiff and Wang (2003) investigate whether North-
South trade-related technology diffusion has a regional dimension, and Schiff and Wang
(forthcoming) examines the impact on TFP from various channels of North-South trade-
related technology diffusion.
The major contribution of the paper to the literature is by examining North-South
trade-related technology diffusion at the industry level, and by constructing an additional
R&D stock which measures the ‘indirect’ technology diffusion arising from trade among
developing countries. This is referred to as the “trade-related South-foreign R&D stock”
and is defined in Section 2. The paper also explicitly takes account of the possible
endogeneity problem of trade at the industry level, and controls for technology diffusion
through foreign direct investment (FDI).
The main findings for TFP growth in the South are: i) the growth rates of TFP rise
with trade-related North-foreign R&D (and thus with openness to the North); ii) the
growth rates of TFP rise with trade-related South-foreign R&D (and thus with openness
3

to the South), but the elasticity is smaller than with respect to trade-related North-foreign
R&D; (iii) a developing country’s human capital has a direct impact in improving its TFP
growth, and also increases its aborption of North-South trade-related technology
diffusion; and (iv) FDI seems to generate a positive effects in TFP growth, though the
effects are smaller than those from North-South, and South-South trade, and tend to be
weaker (not always significant).
The remainder of the paper is organized as follows. Section 2 sets forth the
empirical implementation and Section 3 describes the data. Section 4 presents the
empirical results, and Section 5 concludes.
2. Empirical Implementation
The empirical analysis in Coe and Helpman (1995) builds on Grossman and
Helpman’s (1991) theoretical work on endogenous growth in the open economy. The
estimated equation they derive is:
,0,;logloglog >++++= fdct
fct
fdct
dtcct RDRDTFP ββεββλλ (1)
where )( tc λλ is a country (time) fixed effect, ( ) is the domestic (foreign) R&D
stock, ε is an error term, and subscript c (t) denotes country (year). Due to lack of data for
developing countries--and as in Coe et al. (1997)--the equations estimated in this paper
do not include domestic R&D. Abstracting from domestic R&D is unlikely to be a major
problem because most of the world’s R&D is performed in developed countries.
dctRD f
ctRD
4
3 Savvides and Zachariadis focus on the manufacturing sectors, and also look at the effects from FDI. 4 In 1990, 96% of the world’s R&D expenditures took place in industrial countries (Coe et al. 1997). The share was 94.5% in 1995 (calculated from the World Bank database). Moreover, recent empirical work has shown that much of the technical change in individual OECD countries is based on the international diffusion of technology among the various OECD countries. For instance, Eaton and Kortum (1999) estimate that 87% of French growth is based on foreign R&D. Since developing countries invest much
4

We estimate TFP growth equations by including two types of foreign R&D
stocks, trade-related North-foreign R&D and trade-related South-foreign R&D, and FDI
variable. North-foreign trade-related R&D in industry i of developing country c, ,
is defined as:
ciNRD
⎥⎥⎦
⎤
⎢⎢⎣
⎡⎟⎟⎠
⎞⎜⎜⎝
⎛=≡ ∑∑∑ jk
k cj
cjk
jcij
jcjcijci RD
VAM
RDNRD ωω , (2)
where c (k) indexes developing (OECD) countries, j indexes industries, M (VA) (RD)
denotes imports (value added) (R&D), and cijω is the import input-output coefficient
(which measures for country c the share of industry j’s imports that is used in industry i).
The first equality in equation (2) states that, in developing country c, North-
foreign R&D in industry i, , is the sum, over all industries j, of ciNRD cjRD , the industry-
j foreign R&D obtained through imports, multiplied by cijω , the share of imports of
industry j that is sold to industry i. The second equality in equation (2) says that cjRD is
the sum, over OECD countries k, of cjcjk VAM , the imports of industry-j products from
OECD country k per unit of industry-j value added (i.e., the bilateral openness share), 5
multiplied by , the stock of industry-j R&D in OECD country k. jkRD
fewer resources in R&D than OECD countries, foreign R&D must be even more important for developing countries as a source of growth. 5As weights, there are some debates in the literature. Coe and Helpman (1997), and Savvides and Zachariadis (2005) both used weights as the ratio of imports from each source country over total imports, as first proposed and used by Coe and Helpman (1995). Lichtenberg et al. (1998) argued that weights in Coe and Helpman (1995) have certain problems and proposed weights as the ratio of bilateral imports relative to the source country’s value added. However, this method also has certain problems. One would expect the impact of a given amount of imports with a given R&D content to be inversely related to the size of the importing country’s industry that is using these imports, rather than being related to the size of the industry in the source country: imports are likely to affect TFP more when they amount to 90% of the domestic industry’s value added than when they only amount to 10%. Lumenga-Neso et al. (2005) argued that weights in Coe and Helpman (1995) could not adequately reflect technology brought in through trade.
5

Note that this specification enables us to separate imports of intermediate and
capital goods from imports of final consumer goods. This is important because
productivity is expected to be affected by the R&D embodied in imported inputs but not
by imports of consumer goods. Equation (2) includes the sales of imports to all the
manufacturing sector industries but not sales of imports for final consumption or to non-
manufacturing sectors. In other words, ∑i
cijω < 1 in equation (2).
Since we have no data on domestic R&D in developing countries, and since most
R&D in developing countries is imported from the developed countries, we construct a
measure of ‘indirect’ South-foreign trade-related R&D. This concept is based on the idea
that developing countries obtain knowledge from the North, absorb and assimilate it,
transform it to fit their own needs, and incorporate it into their production process, and
that this transformed knowledge diffuses across the South through trade. South-foreign
trade-related R&D, , captures this ‘indirect’ learning effect. That effect is given by ciSRD
⎥⎥⎦
⎤
⎢⎢⎣
⎡⎟⎟⎠
⎞⎜⎜⎝
⎛≡ ∑∑ jn
n cj
cjn
jcijci NRD
VAM
SRD ω , (3)
where are industry-j imports by developing country c from developing country n.cjnM 6
We also control for the effects on TFP from FDI as well. However, data on FDI
for developing countries at the industry level are not available or not usable. Instead, we
use the country level FDI variable as a control. FDI for each country is defined as the
For example, two countries (Canada and the US) have exact the same weights according to Coe and Helpman (1995), and thus would have the same trade-related foreign technology, however, bilateral imports from each source for Canada is just 10% of that for the US. This method seems to contradict the common wisdom that more trade is associated with more inbedded technology. Thus, Lumenga-Neso (2005) used weights as bilateral imports relative to the importing country’s GDP. This paper follows Lumenga-Neso et al. (2005) by defining weights imports over the importing country’s industry value added.
6

ratio of total foreign direct investment relative to a country’s GDP. Other disembodied
channels such as Internet could be potentially promote North-South technology diffusion
as well, but we could not include it due to data unavailability.7 As in Coe et al. (1997),
we also use a first five-year difference to capture the argument that technology diffusion
occurs in the long-run, and also include an education variable, average total schooling,
and to see its direct impact on TFP, as well as its effects in North-South technology
diffusion (proxy for a country’s absorptive capacity). Finally, unlike Coe et al. (1997),
and Savvides and Zachariadis (2005), we also take consideration that North-South
(South-South) and FDI could be endogenous at the aggregate level because the relations
between TFP and trade (FDI) could possibly be driven by cyclical considerations and by
other factors that might affect both TFP and trade (FDI) in the same manner.8 Due to the
difficulty of finding ideal instruments, we instead use the lags of the independent
variables in the estimation equation. In some specifications, we also included interaction
terms of education with NRD and SRD in some specifications to see whether human
capital (absorptive capacity) increases the effects of trade-related technology.
The baseline estimated equation is:
ctEctFcitScitNcit EFDILSRDlogLNRDlogLTFPlog Δ+Δ+Δ+Δ+=Δ βββββ 1110
,citii
it c
cctt DDD εβββ ++++ ∑∑ ∑ ,0 ,, ESN >βββ (4)
where E denotes education, proxied by the average total school of population over 25 and
plus. Dt, Dc and Di represent time, country and industry dummies, capturing fixed time,
6 On the concept of ‘indirect’ trade-related R&D diffusion, see footnote 3. 7 Freund and Weinhold (2004) find that internet increases international trade. However, Internet started taking off mainly in the early 1990s in the OECD countries. Omitting this channel in our analysis is not likely to cause major biases in our results, as internet usage in developing countries started only in the late 1990s, a period which only overlaps with our sample period marginally.
7

country and industry effects respectively. indicates a one-time lag. To take account of
the possible heterogeneity across countries, we also correct the standard errors by
clustering the error terms for each country.
1L
3. Definition of Variables and Data Sources
Our sample consists of 16 manufacturing industries in 24 developing countries
over the period 1976-98. 9 10 The data series are briefly described here, with data
provided in the appendix for some of the variables in Schiff et al. (2002).
The R&D flow data are taken from the ANBERD 2000 (OECD) database
(DSTI/EAS Division). The database covers 15 OECD countries from 1973 to 1998 at
either the two-, three- or four-digit level.11 From this, we construct R&D flow data for 16
manufacturing industries at the two- or three-digit level (according to the United Nations
International Standard Industrial Classification (ISIC) Revision 2). R&D flows cover all
intramural business enterprise expenditures. R&D flows in domestic currency were
deflated by respective GDP deflators (with 1990 = 100) and were converted in US dollars
using 1990 nominal exchange rates. Cumulative R&D stocks are derived from these
R&D flows using the perpetual inventory method with a 10% depreciation rate.
8 Thanks go to an anonymous referee for pointing out the endogeneity issue. 9 The 16 industries consist of two groups of high and low R&D-intensity industries. The ten low R&D-intensity industries are: 31-Food, Beverage & Tobacco; 32-Textiles, Apparel & Leather; 33-Wood Products & Furniture; 34-Paper, Paper Products & Printing; 355/6-Rubber & Plastic Products; 36-Non-Metallic Mineral Products; 371-Iron & Steel; 372-Non-Ferrous Metals; 381-Metal Products; and 39-Other Manufacturing. The six R&D-intensive industries are: 351/2-Chemicals, Drugs & Medicines; 353/4-Petroleum Refineries & Products; 382-Non-Electrical Machinery, Office & Computing Machinery; 383-Electrical Machinery and Communication Equipment; 384-Transportation Equipment; and 385-Professional Goods. 10 The 24 developing countries are: Bangladesh, Bolivia, Chile, Cameroon, Colombia, Cyprus, Ecuador, Egypt Arab Rep., Guatemala, Hong Kong- China, Indonesia, India, Iran Islamic Rep., Jordan, Korea Rep., Kuwait, Mexico, Malawi, Malaysia, Pakistan, Philippines, Poland, Trinidad and Tobago, Venezuela. 11 The 15 OECD countries are: Australia, Canada, Denmark, Finland, France, Germany, Ireland, Italy, Japan, Netherlands, Norway, Spain, Sweden, the United Kingdom, and the United States.
8

The import input-output matrices for the twenty-four developing countries are not
available. Instead, country-specific input-output matrices are used as a proxy. These are
derived from the three-digit input-output tables provided in Nicita and Olarreaga (2001)
and are time invariant. Bilateral openness shares are derived from the World Bank
database “Trade and Production 1976-1998” (Nicita and Olarreaga, 2001). For each
country, industry and year, the shares are measured as the ratio of imports to the
importing industry’s value added. Trade data were collected at the 4-digit level and input-
output data at the 3-digit level for the period 1976-98, and both were aggregated to 2- and
3-digit levels for consistency with the R&D data (16 industries).
The TFP index is calculated in logs as the difference between value-added and
primary factor use, with the inputs weighted by their income shares, i.e.,
KLYTFP log)1(logloglog αα −−−= , with α equal to the specific year’s labor share.
The capital stocks are derived from investment series using the perpetual inventory model
with a 5% depreciation rate. The labor share is equal to the wage bill divided by value-
added. Value-added, fixed capital formation and labor data are derived from Nicita and
Olarreaga (2001) and are in current dollars. Value-added was deflated by the US GDP
deflator (1990 = 100).
Data on ratios of FDI-to-GDP are taken from the World Development Indicators,
maintained by the World Bank.
The measure of education used is the total average schooling of the population
aged twenty five and above. This is taken from Barro and Lee (2000) which provides
five-year averages for 1960-2000. Table 1 provides with the summary statistics of the
relevant variables.
9

4. Estimation Results
4.1. Main Results
Table 2 reports the estimation results with different specifications. North-South
trade-related technology (NRD) and education are always included in all specifications.
We describe them in turn.
Column (i) is the baseline regression with only NRD and E. It shows an elasticity
of TFP with respect to North-foreign R&D of about .208, significant at the 1% level.
Thus, a 10% increase in openness (defined as imports over value-added)—say, from 20%
to 22%, distributed uniformly across all trading partners in the North, raises TFP by about
2.08%. Thus, simply opening up the economy to the North leads to a higher TFP and a
higher income.
In column (ii), we add SRD as well. The elasticity of TFP with respect to NRD
decreases to .149, and significantly different from zero almost at the 5% level. The
elasticity of TFP with respect to SRD is .071, significantly different from zero at the 5%
level. In Column (iii), we add FDI variable instead, and it shows that increase in FDI
leads to increase in TFP.
Column (iv) is one of the preferred specifications as it includes all relevant
variables. It once again shows that NRD, SRD and FDI are all important in increasing a
country’s TFP, with similar magnitudes from NRD and SRD, and a smaller magnitude
from FDI.
Columns (v) to (viii) present results with specifications with the product of
education with NRD, and SRD. First, column (v) shows that investigating the impact on
10

TFP from NRD alone, a country’s human capital (education) does not only have a direct
impact in increasing a country’s TFP, but also enhances North-South trade-related
technology diffusion (absorptive capacity), though the second effect tends to be
weakened by the inclusion of SRD and FDI (column, vi).
Column (vii) looks at whether a country’s human capital also enhances its
absorptive capacity of SRD, with the presence of NRD, and FDI. The results tend to
suggest that there is no additional impact of SRD through its interaction terms with
education.
Column (viii) is the other preferred specification. It includes all of the relevant
variables, along with the interaction terms of NRD*E, and SRD*E. It shows that FDI has
a direct impact on an industry’s TFP.12 So does SRD. For NRD, it could generate a direct
effect in increasing an industry’s TFP. However, a country’s absorptive capacity (proxied
by its human capital) is very important, as the higher a country’s human capital, the
larger of the impact of NRD on TFP.
Finally, turning to education (human capital), it has a direct impact in increasing
an industry’s TFP (significantly different zero in all specifications), and it also tends to
enhance the effects of North-South trade-related technology diffusion. Its direct impact
Its direct effect on TFP is positive and significant at the 1% level, and the coefficient is
robust across the eight specifications in Table 2. The coefficient implies that, if the
average schooling of the population of age 25 and above by 1 percentage point, TFP will
rise by more than .4 to .6%.
4.2 Comparison with the Literature
11

How do our results compare with those in the literature? On trade-related North-
South technology diffusion, Coe et al. (1997) and Savvides and Zachariadis (2005) are
the closest. Both studies are carried out at the country level with the latter focusing on
only the manufacturing sector. Note that both studies do not include the effect on TFP
through South-South trade (SRD). Coe et al. run ten different regressions, with the
elasticity estimate of TFP with respect to foreign R&D exhibiting a high degree of
variation, from a low of –1.819 in a regression with fixed effects to a high of .728 in a
regression without fixed effects. In their preferred specification, Coe et al. obtain an
elasticity estimate of .058, a significantly smaller value than we obtain. The smaller
impact in their study is probably because their study is at the aggregate level which
includes sectors which are not much influenced by the R&D in the North, such as
agricultural sector. It might be partly due to the weights they used, which we argue not
adequately reflects a country’s trade volume.
Comparing our results with those in Savvides and Zachariadis (2005), our
elasticity from NRD is much smaller than theirs, which is not surprising given the ways
the two papers define North-South trade-related R&D. Savvides and Zachariadis (2005)
measure North-South trade-related R&D (called FRD in their paper) as a weighted sum
of the R&D intensities in G-5 economies (France, Germany, Japan, UK and USA), not
R&D stocks per se, leading to a large measured impact from FRD.
Turning to the effects from FDI, both Savvides and Zachariadis (2005) and
Borensztein et al. (1998) find a positive effect from FDI though Borensztein et al.
conduct the analysis at the country level. The results are confirmed by our study.
12 We do not include the product of FDI with E, as both variables are at the country level.
12

5. Conclusion
Recent theoretical models of economic growth have highlighted the importance of
trade as a channel of technology diffusion. Empirical studies of North-South trade-related
technology diffusion and its impact on total factor productivity (TFP) have been
undertaken at the aggregate level. This paper contributes to the literature by examining
the issue at the industry level and by constructing indirect South-South trade-related
R&D stock with a more sound econometric analysis.
We find that both North-South and South-South trade-related R&D spillovers
have a positive impact on TFP growth and that FDI also has a positive impact, though
with a smaller magnitude, and sometimes not significant. Further, we find that a
country’s human capital generates large positive effects in increasing its TFP growth, and
it also enhances the absorption of North-South trade-related technology diffusion.
13

References Coe, David T., and Elhanan Helpman. 1995. “International R&D Spillovers.” European
Economic Review 39 (5): 859-887.
______, _____ and Alexander W. Hoffmaister. 1997. “North-South R&D Spillovers”, Economic Journal 107, 134-149.
Eaton, Jonathan and Samuel Kortum. 1999. “International Technology Diffusion: Theory and Measurement”, International Economic Review, V40, n3 (August 1999): 537-70.
Engelbrecht, Hans-Jurgen. 1997. “Human Capital and International Knowledge Spillovers in TFP Growth of a Sample of Developing Countries: An Explanation of Alternative Approaches,” Applied Economics, 34, pp831-841, 1997.
Engelbrecht, Hans-Jurgen. 2002. “International R&D Spillovers, Human Capital and Productivity in OECD Countries: An Empirical Investigation,” European Economic Review 41, pp1479-1488.
Falvey, Rod, Neil Foster and David Greenaway. 2002. “Imports, Exports, Knowledge Spillovers and Growth,” Economics Letters 85: 209-213.
Falvey, Rod, Neil Foster and David Greenaway. 2005. “Relative Backwardness or Absorptive Capacity: How Does Knowledge Spill Over Across Borders?” GEP Research Paper 05/07, The Leverhulme Centre for Globalization and Economic Policy.
Freund, Caroline and Diana Weinhold. 2004. “The Effect of the Internet on International Trade”, Journal of International Economics, 62(1): 171-89.
Grossman, M. G., and Elhanan H. 1991. “Innovation and Growth in the Global Economy.” The MIT Press, Cambridge, MA: London.
Keller, Wolfgang. 1998. “Are International R&D Spillovers Trade-related? Analyzing Spillovers among Randomly Matched Trade Partners,” European Economic Review, 42: 1469-1481.
Keller, Wolfgang. 2000. “Do Trade Patterns and Technology Flows Affect Productivity Growth?”, World Bank Economic Review, 14(1): 17-47.
Keller, Wolfgang. 2002. “Trade and the Transmission of Technology”, Journal of Economic Growth 7: 5-24.
Lichtenberg, Frank R. and Bruno van Pottelsberghe de la Potterie. 1998. “International R&D Spillovers: A Comment,” European Economic Review, 42: 1481-1491.
Lucas, R. Jr. 1988. “On the Mechanics of Economic Development.” Journal of Monetary Economics 22 (1): 3-42 (July).
Lumenga-Neso, Oliver, Olarreaga Marcelo. and Schiff M. 2005. “On ‘Indirect’ Trade-Related Research and Development Spillovers.” European Economic Review: 49(7): 1785-1898.
14
Nicita, Alessando and Olarreaga Marcelo. 2001. “Trade and Production, 1976-99.” World Bank Policy Research Working Paper No. 2701. Washington, D.C. (November). www.worldbank.org/research/trade
Romer, P. M. 1986. “Increasing Returns and Long-Run Growth.” Journal of Political Economy 94 (5): 1002-37.
Romer, P. M. 1990. “Endogenous Technical Change.” Journal of Political Economy 98:S71-S102.
Romer, P. M. 1994. “The Origins of Endogenous Growth.” Journal of Economic Perspectives 8 (1): 3-22.
Savvides, Andreas, and Marios Zachariadis. 2005. “International Technology Diffusion and the Growth of TFP in the Manufacturing Sector of Developing Countries,” Review of Development Economics, 9(4): 482-501.
Schiff, Maurice and Yanling Wang. 2003. “NAFTA, Technology Diffusion and Productivity in Mexico,” Latin American Journal of Economics, No. 121: 469-476.
Schiff, Maurice and Yanling Wang. Forthcoming. “North-South and South-South Trade-Related Technology Diffusion: An Industrial Level Analysis of Direct and Indirect Effects,” Canadian Journal of Economics.
Schiff, Maurice, Yanling Wang and Marcelo Ollareaga. 2002. “ Trade-Related Technology Diffusion and the Dynamics of North-South and South-South Integration,” the World Bank Policy Research Working Paper No. 2861. http://www.worldbank.org/research/trade.
15

16
Table 1. Summary Statistics
Mean Median Standard Deviation
logTFP 2.6735 2.6697 1.3744
logNRD 22.4029 22.4556 1.9664
logSRD 19.4345 19.6386 2.4528
FDI 1.8517 1.1668 2.2847
E 5.3662 5.2220 2.1875
ΔlogTFP 0.3785 0.1451 1.6058
ΔlogNRD 0.4296 0.3848 0.2722
ΔlogSRD 0.3642 0.3166 0.3600
ΔFDI 0.3569 0.3142 0.3621
ΔE 0.4296 0.3848 0.2722
Δ(logNRDxE) 12.3983 11.3361 7.2322
Δ(logSRDxE) 13.0692 11.8059 9.8813
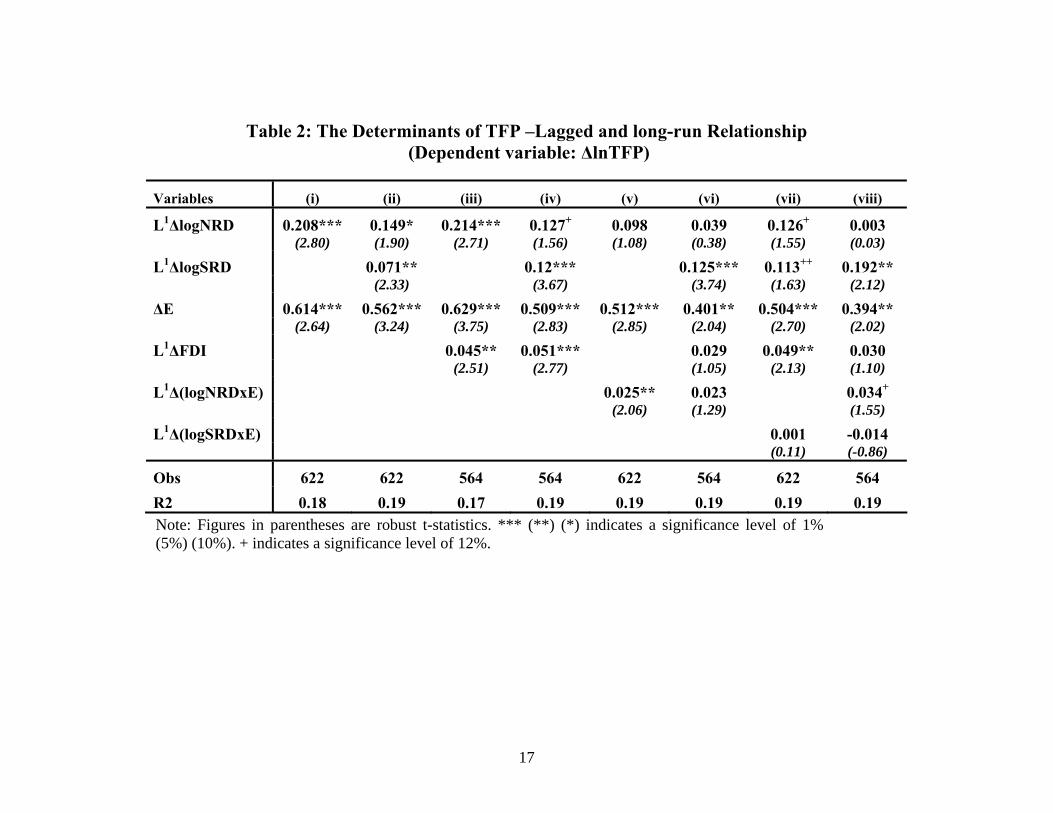
Table 2: The Determinants of TFP –Lagged and long-run Relationship (Dependent variable: ΔlnTFP)
Note: Figures in parentheses are robust t-statistics. *** (**) (*) indicates a significance level of 1% (5%) (10%). + indicates a significance level of 12%.
Variables (i) (ii) (iii) (iv) (v) (vi) (vii) (viii)
L1ΔlogNRD 0.208*** 0.149* 0.214*** 0.127+ 0.098 0.039 0.126+ 0.003 (2.80) (1.90) (2.71) (1.56) (1.08) (0.38) (1.55) (0.03)
L1ΔlogSRD 0.071** 0.12*** 0.125*** 0.113++ 0.192** (2.33) (3.67) (3.74) (1.63) (2.12)
ΔE 0.614*** 0.562*** 0.629*** 0.509*** 0.512*** 0.401** 0.504*** 0.394** (2.64) (3.24) (3.75) (2.83) (2.85) (2.04) (2.70) (2.02)
L1ΔFDI 0.045** 0.051*** 0.029 0.049** 0.030 (2.51) (2.77) (1.05) (2.13) (1.10)
L1Δ(logNRDxE) 0.025** 0.023 0.034+
(2.06) (1.29) (1.55)
L1Δ(logSRDxE) 0.001 -0.014 (0.11) (-0.86)
Obs 622 622 564 564 622 564 622 564 R2 0.18 0.19 0.17 0.19 0.19 0.19 0.19 0.19
17
Copyright © 2022 FDOKUMEN