Altered white matter in early visual pathways of humans with amblyopia
Nonveridical Visual Perception in Human Amblyopia
Brendan T. Barrett,1 Ian E. Pacey,1 Arthur Bradley,2 Larry N. Thibos,2 and Paul Morrill 3
PURPOSE. Amblyopia is a developmental disorder of spatialvision. There is evidence to suggest that some amblyopesmisperceive spatial structure when viewing with the affectedeye. However, there are few examples of these perceptualerrors in the literature. This study was an investigation of theprevalence and nature of misperceptions in human amblyopia.
METHODS. Thirty amblyopes with strabismus and/or anisome-tropia participated in the study. Subjects viewed sinusoidalgratings of various spatial frequencies, orientations, and con-trasts. After interocular comparison, subjects sketched the sub-jective appearance of those stimuli that had nonveridical ap-pearances.
RESULTS. Nonveridical visual perception was revealed in 20amblyopes (�67%). In some subjects, misperceptions werepresent despite the absence of a deficit in contrast sensitivity.The presence of distortions was not simply linked to the depthof amblyopia, and anisometropes were affected as well as thosewith strabismus. In most cases, these spatial distortions arose atspatial frequencies far below the contrast detection acuitycutoff. Errors in perception became more severe at higherspatial frequencies, with low spatial frequencies being mostlyperceived veridically. The prevalence and severity of misper-ceptions were frequently found to depend on the orientationof the grating used in the test, with horizontal orientationstypically less affected than other orientations. Contrast had amuch smaller effect on misperceptions, although there werecases in which severity was greater at higher contrasts.
CONCLUSIONS. Many types of misperceptions documented in thepresent study have appeared in previous investigations. Thissuggests that the wide range of distortions previously reportedreflect genuine intersubject differences. It is proposed thatnonveridical perception in human amblyopia has its origins inerrors in the neural coding of orientation in primary visualcortex. (Invest Ophthalmol Vis Sci. 2003;44:1555–1567) DOI:10.1167/iovs.02-0515
Amblyopia is a developmental disorder of spatial visionresulting in reduced visual function, despite good retinal
image quality and the absence of overt disease in the eye orvisual system. The condition is normally uniocular, affects 2%to 3% of the population, and is almost always associated witha history of strabismus, anisometropia, or form deprivation inearly life.1,2 In addition to reduced visual acuity, most am-blyopes exhibit a diminished sensitivity to contrast at high and
medium spatial frequencies,3–8 paralleling those seen withsimple low-pass filtering.9 It is clear, however, that amblyopiccentral vision is not simply a low-passed version of normalfoveal vision. Instead, several reports have shown significantparallels between the central vision of amblyopes and normalperipheral vision.10 For example, in both cases, positionalsensitivity is significantly degraded.11,12 Furthermore, supra-threshold perceived contrast13 and suprathreshold contrastdiscrimination14,15 are normal in amblyopic central vision andnormal peripheral vision.
Although most of the experimental literature on humanamblyopia has concentrated on defining the threshold for vi-sual stimuli (e.g., smallest letter, lowest contrast, smallest po-sitional offset), striking features of amblyopic vision occur alsoin the suprathreshold domain of clearly visible targets. Dis-torted perception in human amblyopia was first described indetail by Pugh16 who asked amblyopes to describe the appear-ance of high-contrast letters. These typically subtle distortionsare minor compared with the perceptual errors that have beenreported by other investigators when amblyopes have beenasked to draw spatially localized stimuli17 or sinusoidal gratingtargets.18–20
Three distinctly different hypotheses have been developedto explain amblyopic visual deficits. Hess et al.,18 who firstdescribed distorted perception of gratings in amblyopia, devel-oped a neural scrambling model21,22 in which the normallyprecise and accurate retinotopic mapping is somehow dis-turbed in amblyopia. This disturbance leads to both nonveridi-cal perception of location (perceived spatial distortions) anddecreased precision of perceived location (elevated vernierthresholds). The second hypothesis proposes a nonuniformanomalous mapping of visual space, analogous to that seen inanomalous retinal correspondence (ARC).1,23,24 This idea isconsistent with reports of local targets appearing to be mislo-cated,25–27 thus suggesting a localized remapping rather than a“scrambling” of the neural map. Finally, Levi and Klein28 andSharma et al.29 have hypothesized that amblyopes have re-duced neural sampling of the foveal map and that this is theroot cause of misperception of orientation and poor positionalsensitivity.
It is difficult to explain some of the more stable and system-atic perceptual errors reported by amblyopes (e.g., large per-ceived errors in grating orientation18–20,29) with either a neuralscrambling model21 or a systematic shift in the neural map.27
Indeed, after quantifying the point-by-point mapping errorsobserved by amblyopes, Sireteanu et al.17 were unable topredict the perceptual errors that would be seen in gratingtargets. In addition, preliminary attempts to model neuralscrambling by introducing random positional jitter into tar-gets22,30 do not generate the systematic orientation errors seenby some amblyopes. Neural undersampling of high spatialfrequencies in normal fovea31 or peripheral retina20 generatesspatial aliases that typically have different orientations in rela-tion to the stimulus.29,32 However, in a limited comparison,there are some striking differences between amblyopic percep-tions and those seen at high spatial frequencies in normalvision.20,29 Such differences are not surprising, because under-sampling in normal vision is a retinal phenomenon,33 whereasthe retina of human amblyopes appears normal34 (for a recentreview see Hess35). If undersampling is the cause of the per-
From the 1Department of Optometry, University of Bradford,Bradford, United Kingdom; the 2School of Optometry, Indiana Univer-sity, Bloomington, Indiana; and the 3Department of Psychology, Trinityand All Saints, University of Leeds, Leeds, United Kingdom.
Supported by a Research Development Grant from The WellcomeTrust (BTB).
Submitted for publication May 28, 2002; revised October 28 andDecember 12, 2002; accepted December 16, 2002.
Commercial relationships policy: N.The publication costs of this article were defrayed in part by page
charge payment. This article must therefore be marked “advertise-ment” in accordance with 18 U.S.C. §1734 solely to indicate this fact.
Corresponding author: Brendan T. Barrett, Department of Optom-etry, University of Bradford, Richmond Road, Bradford BD7 1DP, UK;[email protected].
Investigative Ophthalmology & Visual Science, April 2003, Vol. 44, No. 4Copyright © Association for Research in Vision and Ophthalmology 1555
ceptual aliases in amblyopes, then it is likely to be cortical inorigin,29 and therefore it should have a different perceptualmanifestation.
Although the distorted, scrambled, or aliased perception ofgratings is central to both mismapping and undersamplingmodels of human amblyopia, there are few examples of theseperceptual errors reported in the literature. The available evi-dence indicates that visual perception is veridical in at leastsome amblyopes,19,29 but limited sample size makes it difficultto estimate the proportion of amblyopes who experience per-ceptual errors. The spatial structure of the perceptual errorsthat have appeared in the literature seems to vary dramaticallybetween individual amblyopes and between studies. Conse-quently, these discrepancies may reflect a true heterogeneity inthe amblyopic population or interstudy differences due tomethodology. Nevertheless, it is clear that any neural model ofhuman amblyopia should account for these striking perceptualerrors.
In this study, we used the same basic experimental para-digm used originally by Hess et al.18 to investigate the preva-lence of nonveridical visual perception in a large sample ofhuman amblyopes. We wanted to document those perceptualerrors that arise when viewing gratings of different spatialfrequencies, orientations, and contrasts. The intention was toobtain a rich database of amblyopic misperceptions that couldserve to direct future modeling efforts.
METHODS
Stimulus Generation
Generation and control of stimuli were performed using the macrocapabilities of the public domain software NIH Image (version 1.59;developed Wayne Rasband at the National Institutes of Health andavailable by anonymous FTP from zippy.nimh.nih.gov or on floppy discfrom the National Technical Information Service, Springfield, VA).Stimuli were presented on a monitor (MultiSync XV 15� Color DisplayMonitor; NEC, London, UK) with a mean luminance of 41 cd/m2 and aframe rate of 66 Hz. The nonlinear luminance response of the displaywas linearized by using the inverse function of the luminance re-sponse, as measured with a photometer (model CS-100; Minolta,Osaka, Japan). Contrast resolution up to 12-bit accuracy was achievedby the video attenuator method.36 (The host computer was a PowerMacintosh 7100/80; Apple Computer, Cupertino, CA.)
The stimuli consisted of circular patches of sinusoidally modulatedluminance gratings. Contrast was at its maximum over a central patch3.2° in diameter. To avoid the presence of sharp edges, the contrast ofthe grating decreased gradually from maximum to zero with a half-Gaussian profile (� � 0.615°). The viewing distance was fixed at 2.5 m,and spatial frequency was altered by varying the number of cycleswithin the patch.
Recording Amblyopic Misperceptions
Gratings of various spatial frequencies (1–16 cyc/deg), orientations(90°, 180°, �45°, and �45°), and contrasts were presented in pseu-dorandom fashion. Display duration was under the control of thesubject. The task of the subject was to view the grating, first with theamblyopic eye and then with the fellow eye. A series of interocularcomparisons then took place with the subject holding an occluder andthus controlling the rate at which amblyopic and fellow eye perceptswere compared. During this time, the examiner instructed the subjectto compare the appearance of the grating in amblyopic and fellow eyeviewing and to indicate whether, besides differences in perceivedcontrast, the percepts differed from one another. Some subjects pre-ferred to exclude light altogether from the nonviewing eye whileinterocular comparisons were being made, although the method usedto occlude the nonviewing eye did not appear to have an effect on thenature or severity of any misperceptions. Subjects were instructed to
maintain fixation on the center of the grating throughout. Specific carewas taken not to bias subjects and to ensure uniform instructions toevery subject. In cases in which the subject indicated that the ambly-opic and fellow eye percepts differed in a way that was not simplyrelated to perceived contrast, subjects were asked to sketch the ap-pearance of the grating to the amblyopic eye. While sketching, sub-jects viewed the grating on the screen with the amblyopic eye, butsketched while viewing with the fellow eye only. This strategy ofviewing stimuli with the amblyopic eye and then rendering them withthe nonamblyopic eye parallels the methods used by Hess et al.,18
Sireteanu et al.,17 and Bradley and Freeman,19 but is different from thatused by Sharma et al.29 who had amblyopes match grating orientationto a line seen with the amblyopic eye.
Sketches were made with a charcoal stick on a large empty circleon white paper. The top of the sheet was clearly marked. Once thesketch had been completed, it was preserved with fixative. To assessrepeatability, subjects were asked to repeat some of the sketches thatthey had made of particular gratings. These repetitions always tookplace in separate sessions, and subjects were not informed that theywere sketching the same grating for a second time or given access tothe sketches they had made on the previous occasion. In addition tosketching the appearance of gratings perceived as nonveridical, sub-jects were also asked to sketch the appearance of a selection ofgratings for which the percept was the same for the two eyes. Thisacted as a form of control, in that sketches of gratings veridicallyperceived could be compared with the sketches of gratings reported asmisperceived. In this way the examiner could assess whether oralreports by the subject of veridical versus nonveridical perception werereflected in the sketches they produced. All drawings of gratingsreported herein have been scanned and imaged without manipulationof either the form or content. Rendered images reported are thusaccurate representations of the drawings in all ways, with the excep-tion of overall size. These renderings also include the nonlinear distor-tions of the printing processes, but these are anticipated to have aminor impact on the largely black-and-white original images.
Amblyopic Subjects
Thirty amblyopes were assessed (14 with strabismic amblyopia, 10with anisometropic amblyopia, and 6 with both strabismus and aniso-metropia). In the context of the present study, amblyopia, in line withCiuffreda et al.2 is defined as visual acuity poorer than 20/20 in theabsence of any obvious structural or pathologic anomalies, but withone or more of the following conditions occurring before the age of 6years: amblyogenic anisometropia, constant unilateral esotropia orexotropia, amblyogenic bilateral isometropia, amblyogenic unilateralor bilateral astigmatism, or image degradation. Anisometropia is de-fined as a difference between corresponding major meridians of thetwo eyes of at least 1 D.37
All subjects underwent full refraction and orthoptic assessmentbefore testing. Clinical details are provided in Table 1. Visual acuitywas measured with logarithm of minimum angle of resolution (log-MAR) charts.38 All subjects were presented with gratings of variousspatial frequencies of at least two orientations (horizontal and vertical).Fifteen subjects (50%) also viewed gratings with oblique orientations(�45° and �45°). The majority (�98%) of the drawings made were forgratings of maximum contrast. However, 15 (50%) of the 30 subjectsviewed gratings of various spatial frequencies at a range of differentcontrast levels. In addition to investigation of misperceptions, contrastsensitivity functions were determined for the amblyopic and felloweyes of each subject, by using a method of adjustment. Each experi-mental session lasted 1 to 1.5 hours and, depending on the extent towhich amblyopic eye misperceptions were reported, up to eight ses-sions were required for each subject. Although experimentally non-quantitative, our approach of having amblyopic subjects draw a seriesof gratings provides a rich database of misperceptions against whichthe outputs from future models of amblyopia can be compared.
1556 Barrett et al. IOVS, April 2003, Vol. 44, No. 4
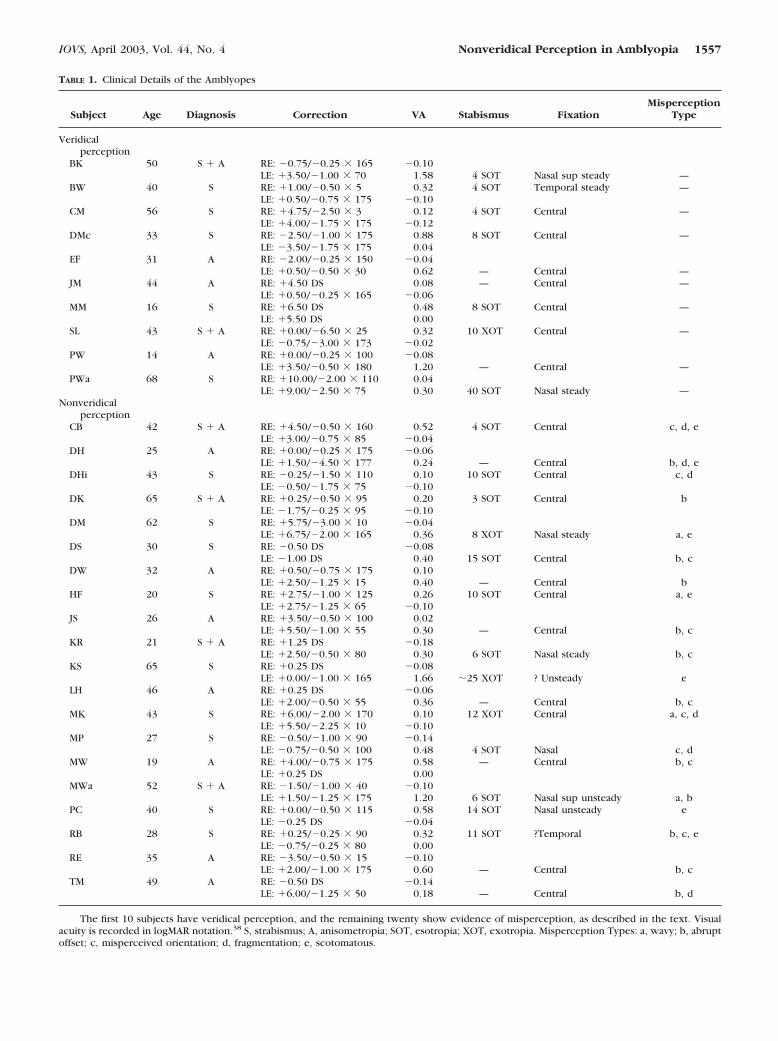
TABLE 1. Clinical Details of the Amblyopes
Subject Age Diagnosis Correction VA Stabismus FixationMisperception
Type
Veridicalperception
BK 50 S � A RE: �0.75/�0.25 � 165 �0.10LE: �3.50/�1.00 � 70 1.58 4 SOT Nasal sup steady —
BW 40 S RE: �1.00/�0.50 � 5 0.32 4 SOT Temporal steady —LE: �0.50/�0.75 � 175 �0.10
CM 56 S RE: �4.75/�2.50 � 3 0.12 4 SOT Central —LE: �4.00/�1.75 � 175 �0.12
DMc 33 S RE: �2.50/�1.00 � 175 0.88 8 SOT Central —LE: �3.50/�1.75 � 175 0.04
EF 31 A RE: �2.00/�0.25 � 150 �0.04LE: �0.50/�0.50 � 30 0.62 — Central —
JM 44 A RE: �4.50 DS 0.08 — Central —LE: �0.50/�0.25 � 165 �0.06
MM 16 S RE: �6.50 DS 0.48 8 SOT Central —LE: �5.50 DS 0.00
SL 43 S � A RE: �0.00/�6.50 � 25 0.32 10 XOT Central —LE: �0.75/�3.00 � 173 �0.02
PW 14 A RE: �0.00/�0.25 � 100 �0.08LE: �3.50/�0.50 � 180 1.20 — Central —
PWa 68 S RE: �10.00/�2.00 � 110 0.04LE: �9.00/�2.50 � 75 0.30 40 SOT Nasal steady —
Nonveridicalperception
CB 42 S � A RE: �4.50/�0.50 � 160 0.52 4 SOT Central c, d, eLE: �3.00/�0.75 � 85 �0.04
DH 25 A RE: �0.00/�0.25 � 175 �0.06LE: �1.50/�4.50 � 177 0.24 — Central b, d, e
DHi 43 S RE: �0.25/�1.50 � 110 0.10 10 SOT Central c, dLE: �0.50/�1.75 � 75 �0.10
DK 65 S � A RE: �0.25/�0.50 � 95 0.20 3 SOT Central bLE: �1.75/�0.25 � 95 �0.10
DM 62 S RE: �5.75/�3.00 � 10 �0.04LE: �6.75/�2.00 � 165 0.36 8 XOT Nasal steady a, e
DS 30 S RE: �0.50 DS �0.08LE: �1.00 DS 0.40 15 SOT Central b, c
DW 32 A RE: �0.50/�0.75 � 175 0.10LE: �2.50/�1.25 � 15 0.40 — Central b
HF 20 S RE: �2.75/�1.00 � 125 0.26 10 SOT Central a, eLE: �2.75/�1.25 � 65 �0.10
JS 26 A RE: �3.50/�0.50 � 100 0.02LE: �5.50/�1.00 � 55 0.30 — Central b, c
KR 21 S � A RE: �1.25 DS �0.18LE: �2.50/�0.50 � 80 0.30 6 SOT Nasal steady b, c
KS 65 S RE: �0.25 DS �0.08LE: �0.00/�1.00 � 165 1.66 �25 XOT ? Unsteady e
LH 46 A RE: �0.25 DS �0.06LE: �2.00/�0.50 � 55 0.36 — Central b, c
MK 43 S RE: �6.00/�2.00 � 170 0.10 12 XOT Central a, c, dLE: �5.50/�2.25 � 10 �0.10
MP 27 S RE: �0.50/�1.00 � 90 �0.14LE: �0.75/�0.50 � 100 0.48 4 SOT Nasal c, d
MW 19 A RE: �4.00/�0.75 � 175 0.58 — Central b, cLE: �0.25 DS 0.00
MWa 52 S � A RE: �1.50/�1.00 � 40 �0.10LE: �1.50/�1.25 � 175 1.20 6 SOT Nasal sup unsteady a, b
PC 40 S RE: �0.00/�0.50 � 115 0.58 14 SOT Nasal unsteady eLE: �0.25 DS �0.04
RB 28 S RE: �0.25/�0.25 � 90 0.32 11 SOT ?Temporal b, c, eLE: �0.75/�0.25 � 80 0.00
RE 35 A RE: �3.50/�0.50 � 15 �0.10LE: �2.00/�1.00 � 175 0.60 — Central b, c
TM 49 A RE: �0.50 DS �0.14LE: �6.00/�1.25 � 50 0.18 — Central b, d
The first 10 subjects have veridical perception, and the remaining twenty show evidence of misperception, as described in the text. Visualacuity is recorded in logMAR notation.38 S, strabismus; A, anisometropia; SOT, esotropia; XOT, exotropia. Misperception Types: a, wavy; b, abruptoffset; c, misperceived orientation; d, fragmentation; e, scotomatous.
IOVS, April 2003, Vol. 44, No. 4 Nonveridical Perception in Amblyopia 1557
Informed consent was obtained from all participating subjects afterthe nature and purpose of the study had been explained, and theresearch adhered to the tenets of the Declaration of Helsinki.
RESULTS
Proportion of Amblyopes ExperiencingMisperceptions
The experimental literature includes examples of amblyopeswho experience profound perceptual errors when viewinggratings (e.g., subject TG in Fig. 1 of Hess et al.18), whereasperception in other amblyopes is seemingly quite normal.18,19
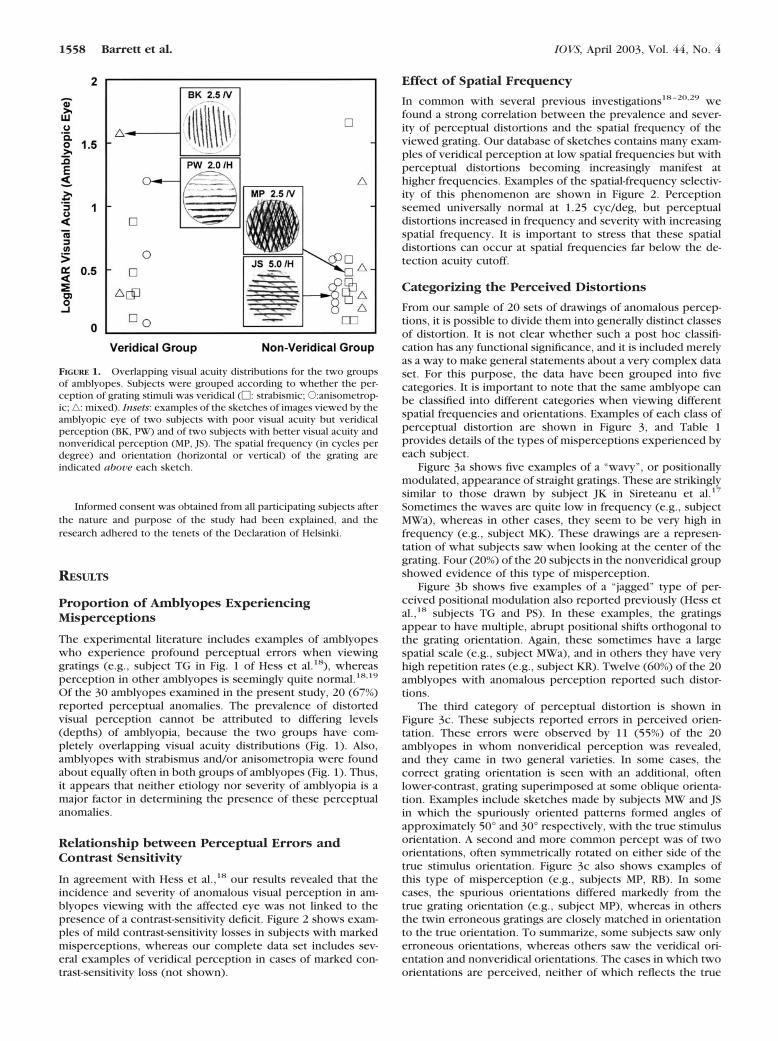
Of the 30 amblyopes examined in the present study, 20 (67%)reported perceptual anomalies. The prevalence of distortedvisual perception cannot be attributed to differing levels(depths) of amblyopia, because the two groups have com-pletely overlapping visual acuity distributions (Fig. 1). Also,amblyopes with strabismus and/or anisometropia were foundabout equally often in both groups of amblyopes (Fig. 1). Thus,it appears that neither etiology nor severity of amblyopia is amajor factor in determining the presence of these perceptualanomalies.
Relationship between Perceptual Errors andContrast Sensitivity
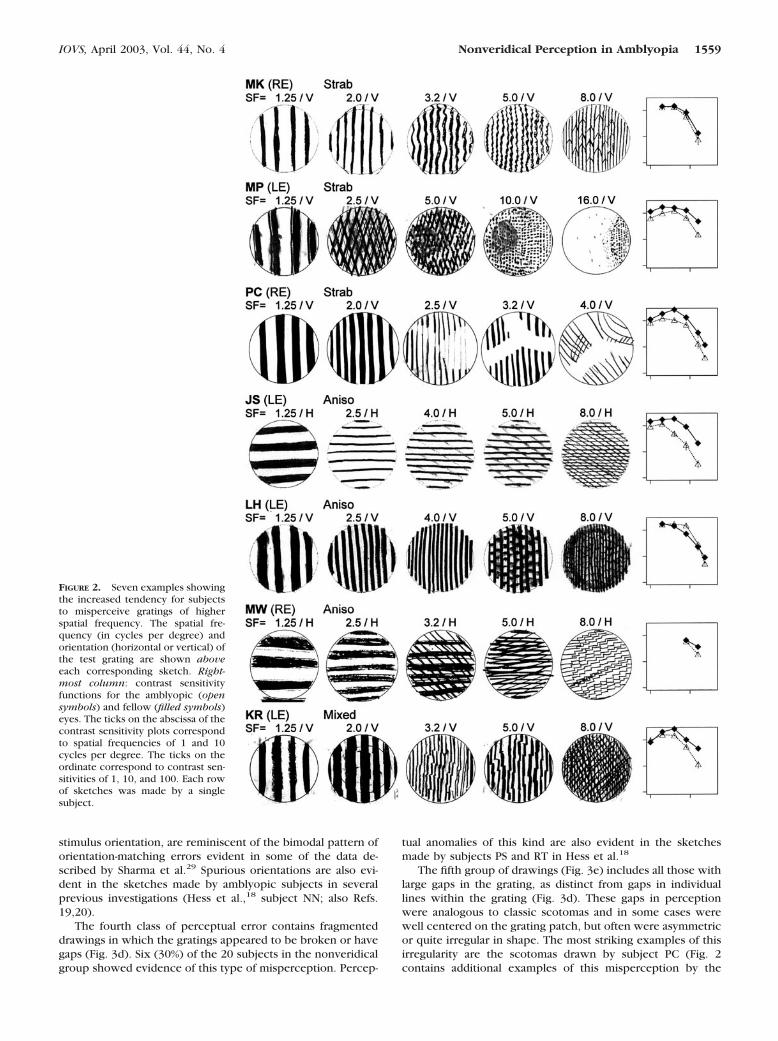
In agreement with Hess et al.,18 our results revealed that theincidence and severity of anomalous visual perception in am-blyopes viewing with the affected eye was not linked to thepresence of a contrast-sensitivity deficit. Figure 2 shows exam-ples of mild contrast-sensitivity losses in subjects with markedmisperceptions, whereas our complete data set includes sev-eral examples of veridical perception in cases of marked con-trast-sensitivity loss (not shown).
Effect of Spatial Frequency
In common with several previous investigations18–20,29 wefound a strong correlation between the prevalence and sever-ity of perceptual distortions and the spatial frequency of theviewed grating. Our database of sketches contains many exam-ples of veridical perception at low spatial frequencies but withperceptual distortions becoming increasingly manifest athigher frequencies. Examples of the spatial-frequency selectiv-ity of this phenomenon are shown in Figure 2. Perceptionseemed universally normal at 1.25 cyc/deg, but perceptualdistortions increased in frequency and severity with increasingspatial frequency. It is important to stress that these spatialdistortions can occur at spatial frequencies far below the de-tection acuity cutoff.
Categorizing the Perceived Distortions
From our sample of 20 sets of drawings of anomalous percep-tions, it is possible to divide them into generally distinct classesof distortion. It is not clear whether such a post hoc classifi-cation has any functional significance, and it is included merelyas a way to make general statements about a very complex dataset. For this purpose, the data have been grouped into fivecategories. It is important to note that the same amblyope canbe classified into different categories when viewing differentspatial frequencies and orientations. Examples of each class ofperceptual distortion are shown in Figure 3, and Table 1provides details of the types of misperceptions experienced byeach subject.
Figure 3a shows five examples of a “wavy”, or positionallymodulated, appearance of straight gratings. These are strikinglysimilar to those drawn by subject JK in Sireteanu et al.17
Sometimes the waves are quite low in frequency (e.g., subjectMWa), whereas in other cases, they seem to be very high infrequency (e.g., subject MK). These drawings are a represen-tation of what subjects saw when looking at the center of thegrating. Four (20%) of the 20 subjects in the nonveridical groupshowed evidence of this type of misperception.
Figure 3b shows five examples of a “jagged” type of per-ceived positional modulation also reported previously (Hess etal.,18 subjects TG and PS). In these examples, the gratingsappear to have multiple, abrupt positional shifts orthogonal tothe grating orientation. Again, these sometimes have a largespatial scale (e.g., subject MWa), and in others they have veryhigh repetition rates (e.g., subject KR). Twelve (60%) of the 20amblyopes with anomalous perception reported such distor-tions.
The third category of perceptual distortion is shown inFigure 3c. These subjects reported errors in perceived orien-tation. These errors were observed by 11 (55%) of the 20amblyopes in whom nonveridical perception was revealed,and they came in two general varieties. In some cases, thecorrect grating orientation is seen with an additional, oftenlower-contrast, grating superimposed at some oblique orienta-tion. Examples include sketches made by subjects MW and JSin which the spuriously oriented patterns formed angles ofapproximately 50° and 30° respectively, with the true stimulusorientation. A second and more common percept was of twoorientations, often symmetrically rotated on either side of thetrue stimulus orientation. Figure 3c also shows examples ofthis type of misperception (e.g., subjects MP, RB). In somecases, the spurious orientations differed markedly from thetrue grating orientation (e.g., subject MP), whereas in othersthe twin erroneous gratings are closely matched in orientationto the true orientation. To summarize, some subjects saw onlyerroneous orientations, whereas others saw the veridical ori-entation and nonveridical orientations. The cases in which twoorientations are perceived, neither of which reflects the true
FIGURE 1. Overlapping visual acuity distributions for the two groupsof amblyopes. Subjects were grouped according to whether the per-ception of grating stimuli was veridical (�: strabismic; E:anisometrop-ic; ‚: mixed). Insets: examples of the sketches of images viewed by theamblyopic eye of two subjects with poor visual acuity but veridicalperception (BK, PW) and of two subjects with better visual acuity andnonveridical perception (MP, JS). The spatial frequency (in cycles perdegree) and orientation (horizontal or vertical) of the grating areindicated above each sketch.
1558 Barrett et al. IOVS, April 2003, Vol. 44, No. 4
stimulus orientation, are reminiscent of the bimodal pattern oforientation-matching errors evident in some of the data de-scribed by Sharma et al.29 Spurious orientations are also evi-dent in the sketches made by amblyopic subjects in severalprevious investigations (Hess et al.,18 subject NN; also Refs.19,20).
The fourth class of perceptual error contains fragmenteddrawings in which the gratings appeared to be broken or havegaps (Fig. 3d). Six (30%) of the 20 subjects in the nonveridicalgroup showed evidence of this type of misperception. Percep-
tual anomalies of this kind are also evident in the sketchesmade by subjects PS and RT in Hess et al.18
The fifth group of drawings (Fig. 3e) includes all those withlarge gaps in the grating, as distinct from gaps in individuallines within the grating (Fig. 3d). These gaps in perceptionwere analogous to classic scotomas and in some cases werewell centered on the grating patch, but often were asymmetricor quite irregular in shape. The most striking examples of thisirregularity are the scotomas drawn by subject PC (Fig. 2contains additional examples of this misperception by the
FIGURE 2. Seven examples showingthe increased tendency for subjectsto misperceive gratings of higherspatial frequency. The spatial fre-quency (in cycles per degree) andorientation (horizontal or vertical) ofthe test grating are shown aboveeach corresponding sketch. Right-most column: contrast sensitivityfunctions for the amblyopic (opensymbols) and fellow (filled symbols)eyes. The ticks on the abscissa of thecontrast sensitivity plots correspondto spatial frequencies of 1 and 10cycles per degree. The ticks on theordinate correspond to contrast sen-sitivities of 1, 10, and 100. Each rowof sketches was made by a singlesubject.
IOVS, April 2003, Vol. 44, No. 4 Nonveridical Perception in Amblyopia 1559
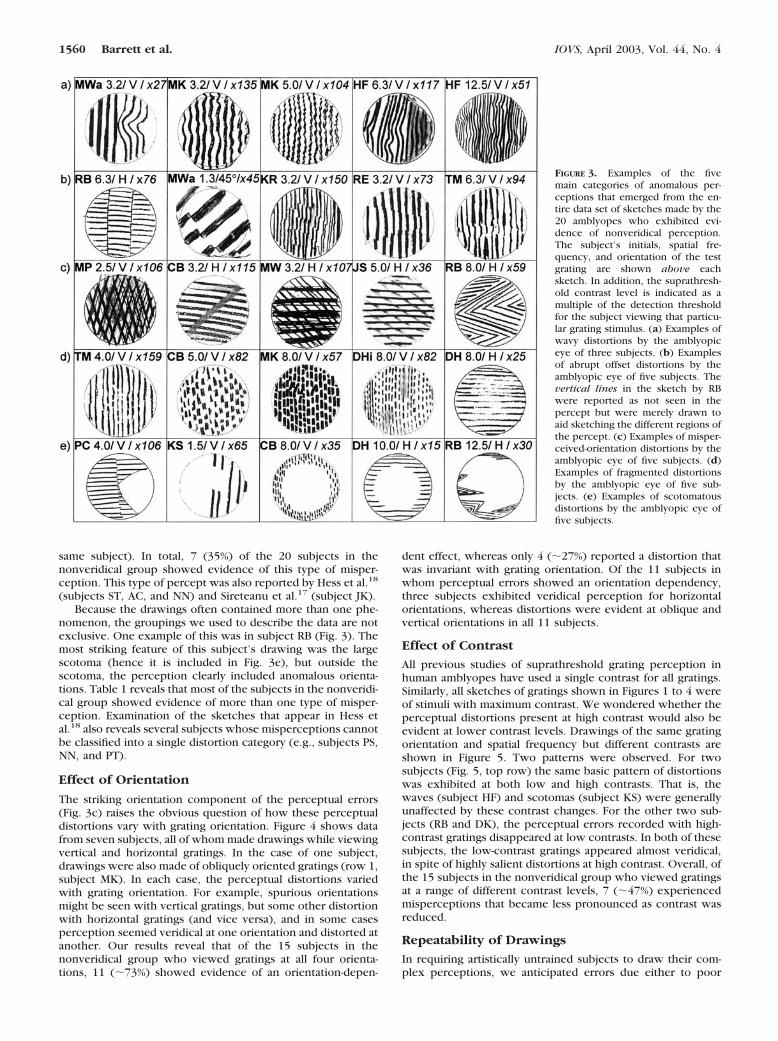
same subject). In total, 7 (35%) of the 20 subjects in thenonveridical group showed evidence of this type of misper-ception. This type of percept was also reported by Hess et al.18
(subjects ST, AC, and NN) and Sireteanu et al.17 (subject JK).Because the drawings often contained more than one phe-
nomenon, the groupings we used to describe the data are notexclusive. One example of this was in subject RB (Fig. 3). Themost striking feature of this subject’s drawing was the largescotoma (hence it is included in Fig. 3e), but outside thescotoma, the perception clearly included anomalous orienta-tions. Table 1 reveals that most of the subjects in the nonveridi-cal group showed evidence of more than one type of misper-ception. Examination of the sketches that appear in Hess etal.18 also reveals several subjects whose misperceptions cannotbe classified into a single distortion category (e.g., subjects PS,NN, and PT).
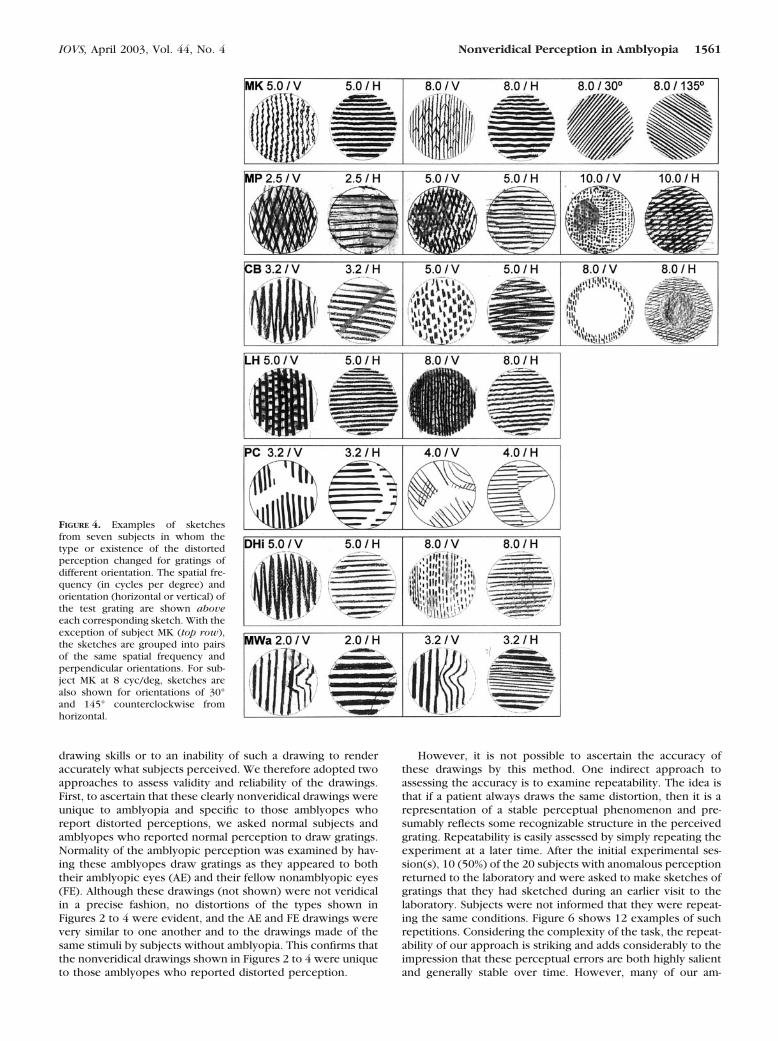
Effect of Orientation
The striking orientation component of the perceptual errors(Fig. 3c) raises the obvious question of how these perceptualdistortions vary with grating orientation. Figure 4 shows datafrom seven subjects, all of whom made drawings while viewingvertical and horizontal gratings. In the case of one subject,drawings were also made of obliquely oriented gratings (row 1,subject MK). In each case, the perceptual distortions variedwith grating orientation. For example, spurious orientationsmight be seen with vertical gratings, but some other distortionwith horizontal gratings (and vice versa), and in some casesperception seemed veridical at one orientation and distorted atanother. Our results reveal that of the 15 subjects in thenonveridical group who viewed gratings at all four orienta-tions, 11 (�73%) showed evidence of an orientation-depen-
dent effect, whereas only 4 (�27%) reported a distortion thatwas invariant with grating orientation. Of the 11 subjects inwhom perceptual errors showed an orientation dependency,three subjects exhibited veridical perception for horizontalorientations, whereas distortions were evident at oblique andvertical orientations in all 11 subjects.
Effect of Contrast
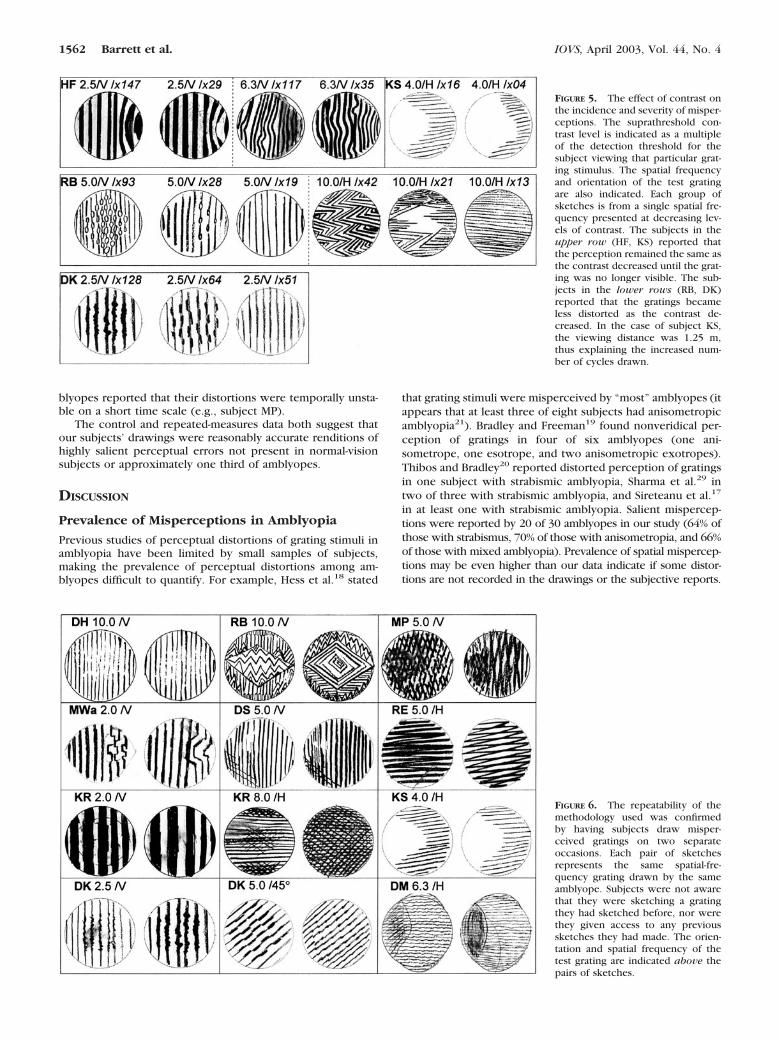
All previous studies of suprathreshold grating perception inhuman amblyopes have used a single contrast for all gratings.Similarly, all sketches of gratings shown in Figures 1 to 4 wereof stimuli with maximum contrast. We wondered whether theperceptual distortions present at high contrast would also beevident at lower contrast levels. Drawings of the same gratingorientation and spatial frequency but different contrasts areshown in Figure 5. Two patterns were observed. For twosubjects (Fig. 5, top row) the same basic pattern of distortionswas exhibited at both low and high contrasts. That is, thewaves (subject HF) and scotomas (subject KS) were generallyunaffected by these contrast changes. For the other two sub-jects (RB and DK), the perceptual errors recorded with high-contrast gratings disappeared at low contrasts. In both of thesesubjects, the low-contrast gratings appeared almost veridical,in spite of highly salient distortions at high contrast. Overall, ofthe 15 subjects in the nonveridical group who viewed gratingsat a range of different contrast levels, 7 (�47%) experiencedmisperceptions that became less pronounced as contrast wasreduced.
Repeatability of Drawings
In requiring artistically untrained subjects to draw their com-plex perceptions, we anticipated errors due either to poor
FIGURE 3. Examples of the fivemain categories of anomalous per-ceptions that emerged from the en-tire data set of sketches made by the20 amblyopes who exhibited evi-dence of nonveridical perception.The subject’s initials, spatial fre-quency, and orientation of the testgrating are shown above eachsketch. In addition, the suprathresh-old contrast level is indicated as amultiple of the detection thresholdfor the subject viewing that particu-lar grating stimulus. (a) Examples ofwavy distortions by the amblyopiceye of three subjects. (b) Examplesof abrupt offset distortions by theamblyopic eye of five subjects. Thevertical lines in the sketch by RBwere reported as not seen in thepercept but were merely drawn toaid sketching the different regions ofthe percept. (c) Examples of misper-ceived-orientation distortions by theamblyopic eye of five subjects. (d)Examples of fragmented distortionsby the amblyopic eye of five sub-jects. (e) Examples of scotomatousdistortions by the amblyopic eye offive subjects.
1560 Barrett et al. IOVS, April 2003, Vol. 44, No. 4
drawing skills or to an inability of such a drawing to renderaccurately what subjects perceived. We therefore adopted twoapproaches to assess validity and reliability of the drawings.First, to ascertain that these clearly nonveridical drawings wereunique to amblyopia and specific to those amblyopes whoreport distorted perceptions, we asked normal subjects andamblyopes who reported normal perception to draw gratings.Normality of the amblyopic perception was examined by hav-ing these amblyopes draw gratings as they appeared to boththeir amblyopic eyes (AE) and their fellow nonamblyopic eyes(FE). Although these drawings (not shown) were not veridicalin a precise fashion, no distortions of the types shown inFigures 2 to 4 were evident, and the AE and FE drawings werevery similar to one another and to the drawings made of thesame stimuli by subjects without amblyopia. This confirms thatthe nonveridical drawings shown in Figures 2 to 4 were uniqueto those amblyopes who reported distorted perception.
However, it is not possible to ascertain the accuracy ofthese drawings by this method. One indirect approach toassessing the accuracy is to examine repeatability. The idea isthat if a patient always draws the same distortion, then it is arepresentation of a stable perceptual phenomenon and pre-sumably reflects some recognizable structure in the perceivedgrating. Repeatability is easily assessed by simply repeating theexperiment at a later time. After the initial experimental ses-sion(s), 10 (50%) of the 20 subjects with anomalous perceptionreturned to the laboratory and were asked to make sketches ofgratings that they had sketched during an earlier visit to thelaboratory. Subjects were not informed that they were repeat-ing the same conditions. Figure 6 shows 12 examples of suchrepetitions. Considering the complexity of the task, the repeat-ability of our approach is striking and adds considerably to theimpression that these perceptual errors are both highly salientand generally stable over time. However, many of our am-
FIGURE 4. Examples of sketchesfrom seven subjects in whom thetype or existence of the distortedperception changed for gratings ofdifferent orientation. The spatial fre-quency (in cycles per degree) andorientation (horizontal or vertical) ofthe test grating are shown aboveeach corresponding sketch. With theexception of subject MK (top row),the sketches are grouped into pairsof the same spatial frequency andperpendicular orientations. For sub-ject MK at 8 cyc/deg, sketches arealso shown for orientations of 30°and 145° counterclockwise fromhorizontal.
IOVS, April 2003, Vol. 44, No. 4 Nonveridical Perception in Amblyopia 1561
blyopes reported that their distortions were temporally unsta-ble on a short time scale (e.g., subject MP).
The control and repeated-measures data both suggest thatour subjects’ drawings were reasonably accurate renditions ofhighly salient perceptual errors not present in normal-visionsubjects or approximately one third of amblyopes.
DISCUSSION
Prevalence of Misperceptions in Amblyopia
Previous studies of perceptual distortions of grating stimuli inamblyopia have been limited by small samples of subjects,making the prevalence of perceptual distortions among am-blyopes difficult to quantify. For example, Hess et al.18 stated
that grating stimuli were misperceived by “most” amblyopes (itappears that at least three of eight subjects had anisometropicamblyopia21). Bradley and Freeman19 found nonveridical per-ception of gratings in four of six amblyopes (one ani-sometrope, one esotrope, and two anisometropic exotropes).Thibos and Bradley20 reported distorted perception of gratingsin one subject with strabismic amblyopia, Sharma et al.29 intwo of three with strabismic amblyopia, and Sireteanu et al.17
in at least one with strabismic amblyopia. Salient mispercep-tions were reported by 20 of 30 amblyopes in our study (64% ofthose with strabismus, 70% of those with anisometropia, and 66%of those with mixed amblyopia). Prevalence of spatial mispercep-tions may be even higher than our data indicate if some distor-tions are not recorded in the drawings or the subjective reports.
FIGURE 5. The effect of contrast onthe incidence and severity of misper-ceptions. The suprathreshold con-trast level is indicated as a multipleof the detection threshold for thesubject viewing that particular grat-ing stimulus. The spatial frequencyand orientation of the test gratingare also indicated. Each group ofsketches is from a single spatial fre-quency presented at decreasing lev-els of contrast. The subjects in theupper row (HF, KS) reported thatthe perception remained the same asthe contrast decreased until the grat-ing was no longer visible. The sub-jects in the lower rows (RB, DK)reported that the gratings becameless distorted as the contrast de-creased. In the case of subject KS,the viewing distance was 1.25 m,thus explaining the increased num-ber of cycles drawn.
FIGURE 6. The repeatability of themethodology used was confirmedby having subjects draw misper-ceived gratings on two separateoccasions. Each pair of sketchesrepresents the same spatial-fre-quency grating drawn by the sameamblyope. Subjects were not awarethat they were sketching a gratingthey had sketched before, nor werethey given access to any previoussketches they had made. The orien-tation and spatial frequency of thetest grating are indicated above thepairs of sketches.
1562 Barrett et al. IOVS, April 2003, Vol. 44, No. 4
Several investigations have revealed that persons with stra-bismic amblyopia exhibit large constant errors in spatial align-ment and partitioning tasks.25,26,39 However, these distortionsof spatial geometry were not found in those with anisome-tropic amblyopia.25,27 It appears therefore, that there may betwo forms of perceptual distortion in human amblyopia: One isrestricted to strabismic amblyopia, which is analogous to alarge-scale but nonuniform change in the retinotopic mapsomewhat similar to ARC, a condition found exclusively instrabismus.1,27 The second, found equally often in most per-sons with anisometropia or strabismus, produces anomalousperceptions of grating stimuli.
Structure of Perceptual Errors
The universal feature of our data and those previously re-ported18–20,29 is the obvious spatial-frequency dependency ofthis effect. Misperceptions were absent at the very lowestspatial frequencies but become increasingly obvious with in-creasing spatial frequency (Fig. 2). Second, these spatial distor-tions can occur at spatial frequencies far below the contrastdetection acuity cutoff. Although reduced contrast sensitivityand spatial distortions may both be observed at spatial frequen-cies far below the high-frequency cutoff, amblyopic misper-ceptions are not necessarily accompanied by contrast sensitiv-ity deficits (Fig. 2, see also Hess et al.18).
The first report to document the perceptual errors experi-enced by amblyopes viewing gratings18 included several qual-itatively distinct phenomena. First, grating lines exhibited po-sitional errors that were either abrupt offsets or wiggles in thelines (see also Sireteanu et al.,17). Bradley and Freeman19 andThibos and Bradley20 reported drawings of anomalous gratingorientations made by amblyopes, but no vernier-like offsets orwiggles were apparent in the lines. Orientation errors werealso evident in sketches made by one subject in Hess et al.,18
and, in a recent investigation, Sharma et al.29 quantified orien-tation misperceptions in a matching study. Furthermore, Hesset al.18 reported spatial-frequency–specific scotomas in somesubjects. That is, gratings appeared to be absent in local, mostlycentral, areas of the display, but only with higher-frequencystimuli. Finally, Hess et al.18 also reported amblyopes who sawfragmented individual stripes in the gratings.
Observing all the different reported distortions described inprevious studies within our single study suggests that theprevious between-study differences may have reflected genu-ine intersubject differences. Most striking in our study was theobservation that the type of perceptual distortion was notconstant across spatial frequency or orientation in an individualsubject. For example, subject CB reported vernier-like offsetsfor vertically oriented gratings at 5 cyc/deg (Fig. 3) but anom-alous orientations at 3 cyc/deg (Fig. 3). Also, the type ofperceptual error for some subjects clearly changed with stim-ulus orientation (Fig. 4). Some subjects (e.g., subject KS, Fig.3), however, reported the same type of perceptual error at allspatial frequencies and orientations tested.
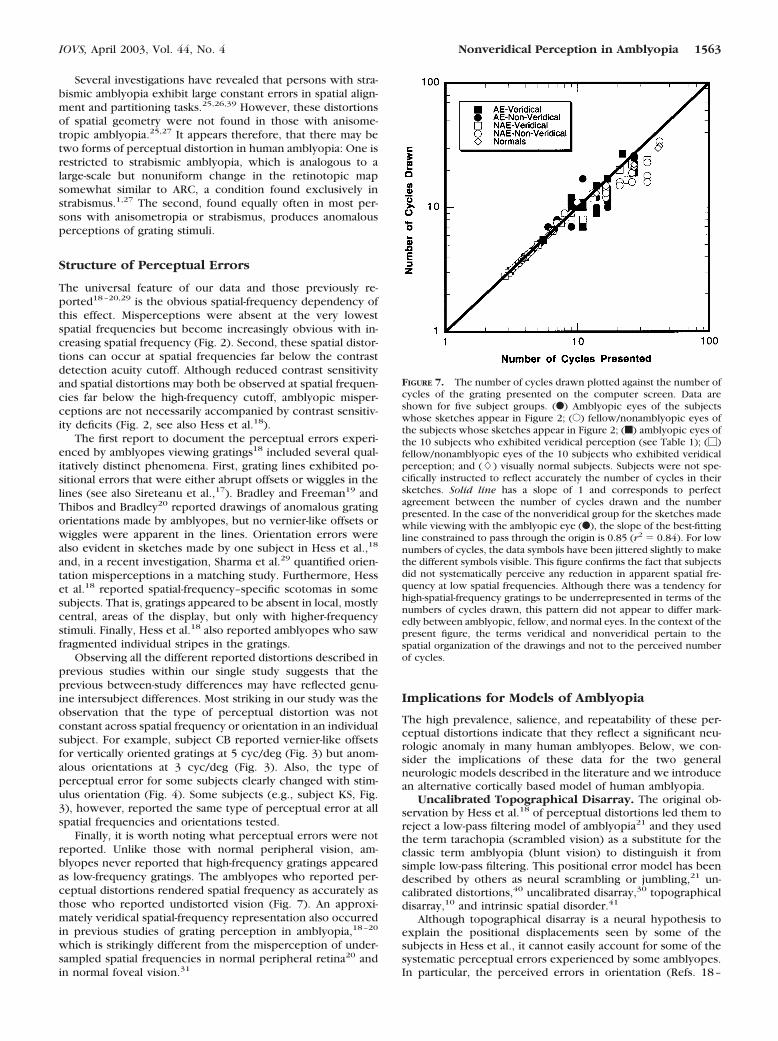
Finally, it is worth noting what perceptual errors were notreported. Unlike those with normal peripheral vision, am-blyopes never reported that high-frequency gratings appearedas low-frequency gratings. The amblyopes who reported per-ceptual distortions rendered spatial frequency as accurately asthose who reported undistorted vision (Fig. 7). An approxi-mately veridical spatial-frequency representation also occurredin previous studies of grating perception in amblyopia,18–20
which is strikingly different from the misperception of under-sampled spatial frequencies in normal peripheral retina20 andin normal foveal vision.31
Implications for Models of Amblyopia
The high prevalence, salience, and repeatability of these per-ceptual distortions indicate that they reflect a significant neu-rologic anomaly in many human amblyopes. Below, we con-sider the implications of these data for the two generalneurologic models described in the literature and we introducean alternative cortically based model of human amblyopia.
Uncalibrated Topographical Disarray. The original ob-servation by Hess et al.18 of perceptual distortions led them toreject a low-pass filtering model of amblyopia21 and they usedthe term tarachopia (scrambled vision) as a substitute for theclassic term amblyopia (blunt vision) to distinguish it fromsimple low-pass filtering. This positional error model has beendescribed by others as neural scrambling or jumbling,21 un-calibrated distortions,40 uncalibrated disarray,30 topographicaldisarray,10 and intrinsic spatial disorder.41
Although topographical disarray is a neural hypothesis toexplain the positional displacements seen by some of thesubjects in Hess et al., it cannot easily account for some of thesystematic perceptual errors experienced by some amblyopes.In particular, the perceived errors in orientation (Refs. 18–
FIGURE 7. The number of cycles drawn plotted against the number ofcycles of the grating presented on the computer screen. Data areshown for five subject groups. (F) Amblyopic eyes of the subjectswhose sketches appear in Figure 2; (E) fellow/nonamblyopic eyes ofthe subjects whose sketches appear in Figure 2; (f) amblyopic eyes ofthe 10 subjects who exhibited veridical perception (see Table 1); (�)fellow/nonamblyopic eyes of the 10 subjects who exhibited veridicalperception; and (�) visually normal subjects. Subjects were not spe-cifically instructed to reflect accurately the number of cycles in theirsketches. Solid line has a slope of 1 and corresponds to perfectagreement between the number of cycles drawn and the numberpresented. In the case of the nonveridical group for the sketches madewhile viewing with the amblyopic eye (F), the slope of the best-fittingline constrained to pass through the origin is 0.85 (r2 � 0.84). For lownumbers of cycles, the data symbols have been jittered slightly to makethe different symbols visible. This figure confirms the fact that subjectsdid not systematically perceive any reduction in apparent spatial fre-quency at low spatial frequencies. Although there was a tendency forhigh-spatial-frequency gratings to be underrepresented in terms of thenumbers of cycles drawn, this pattern did not appear to differ mark-edly between amblyopic, fellow, and normal eyes. In the context of thepresent figure, the terms veridical and nonveridical pertain to thespatial organization of the drawings and not to the perceived numberof cycles.
IOVS, April 2003, Vol. 44, No. 4 Nonveridical Perception in Amblyopia 1563
20,29; Fig. 3 in the current study) are inconsistent with asimple topographical disarray model, as are the examples ofspatial-frequency–specific scotomas (Ref. 18; the current Fig.3), and the orderly gaps frequently seen in grating stripes (Ref.18; the current Fig. 3).
Hess et al.22 simulated two types of positional disarray:simple retinotopic positional jitter and random-phase shiftingof a Gabor-filtered image. Phase-shifting produced perceptualdistortions quite different from simple topographical disarray,but neither type of jitter can create errors in perceived orien-tation of gratings such as those reported by amblyopes.
The evidence in support of topographical disorder in am-blyopia comes mainly from equivalent noise studies.42,43 Thisapproach involves determination of the level of external posi-tional noise (jitter) that raises psychophysical position (e.g.,vernier) thresholds by a criterion amount. The results revealthat amblyopic vision is more resistant to positional disorder ofthe stimulus than is normal vision. This is presumed to reflectincreased equivalent positional noise within the visual system,which, in turn, is interpreted as evidence in support of thetopographical disorder hypothesis of amblyopia. However,these data are difficult to interpret because the effect of stim-ulus jitter is spatial-scale dependent.41 Although the spatialscale of the stimulus may be fixed, subjects are capable ofchoosing the most useful scale within the stimulus to performpositional alignment tasks.44 For example, as the gap betweenthe elements of a vernier stimulus is increased, alignment isdetermined by progressively coarser spatial scales (i.e., lowerspatial frequencies) within the stimulus.44–46 For this reason,the introduction of spatial disorder has less effect on positionalacuity with larger gaps.47 Amblyopes tend to use larger spatialscales on visual tasks than normal-vision subjects.48 Therefore,it is possible that the increased tolerance to stimulus jitterobserved in amblyopes30,42 may reflect the fact that, on sometasks, amblyopes use a larger spatial scale and not that theyhave increased internal disarray.41
Retinotopic Undersampling. Retinotopic undersamplinghas been used to explain visual misperceptions in response tospatial frequencies above the retinal sampling limit.31,32 Couldit also apply to a cortical deficit such as amblyopia? Levi andKlein28 originally proposed undersampling to explain the en-larged distance over which additional samples of a line im-proved vernier acuity in subjects with strabismic amblyopia.However, as with the equivalent noise experiments just de-scribed, their results may reflect the fact that amblyopes uselower-than-normal spatial frequencies (larger spatial scales) toperform the task. Additional experiments using sampled stim-uli have been interpreted as evidence that amblyopic visionundersamples the retinal image.10,11,28,43,49–52 However, ex-perimental studies in which more traditional grating stimuliwere used to examine neural sampling31,53 failed to find anyevidence of retinotopic undersampling in human amblyopia.Sharma et al.29 used an experimental method developed tolook for orientation reversals for spatial frequencies at twicethe Nyquist limit.32 Contrary to predictions, two of three sub-jects with strabismic amblyopia reported striking errors inperceived orientation at spatial frequencies far below the res-olution limit, and, in a third subject, perceived orientation wasquite normal at all spatial frequencies. Also, the two otherprimary predictions of a simple retinotopic undersamplingmodel (motion reversals54 and systematic misperception offrequency18–20) have not been observed. From a neurophysi-ological standpoint, the dramatic remapping of the neuralimage at the cortex from a simple (albeit distorted) point bypoint sampling to a multifeature polymap55 makes it unlikelythat retinotopic-based undersampling explains amblyopic mis-perceptions.
A Cortical Model of Amblyopic Misperceptions. In ad-dition to the large body of experimental literature indicatingthat amblyopia in animals is a cortical phenomenon, humanERG studies (see review in Ref. 35) and recent functionalmagnetic resonance imaging (fMRI) data56 indicate that thedeficit in human amblyopia is not in the retina or lateralgeniculate nucleus (LGN) but in the primary visual cortex(although possibly not in the input layer57–59). This body ofwork suggests that a model of neural undersampling of theretinal image is unlikely to account for amblyopic vision. In-stead, the data suggest that a model of neural undersampling inamblyopia should be formulated in the orientation and spatial-frequency domains native to the primary visual cortex.60–62
Such a model would seek to account for systematic errors inperceived orientation reported by amblyopes and, at the sametime, acknowledge that the appearance of gratings to manyamblyopes cannot be explained by classic undersampling orpositional noise in the retinotopic domain.
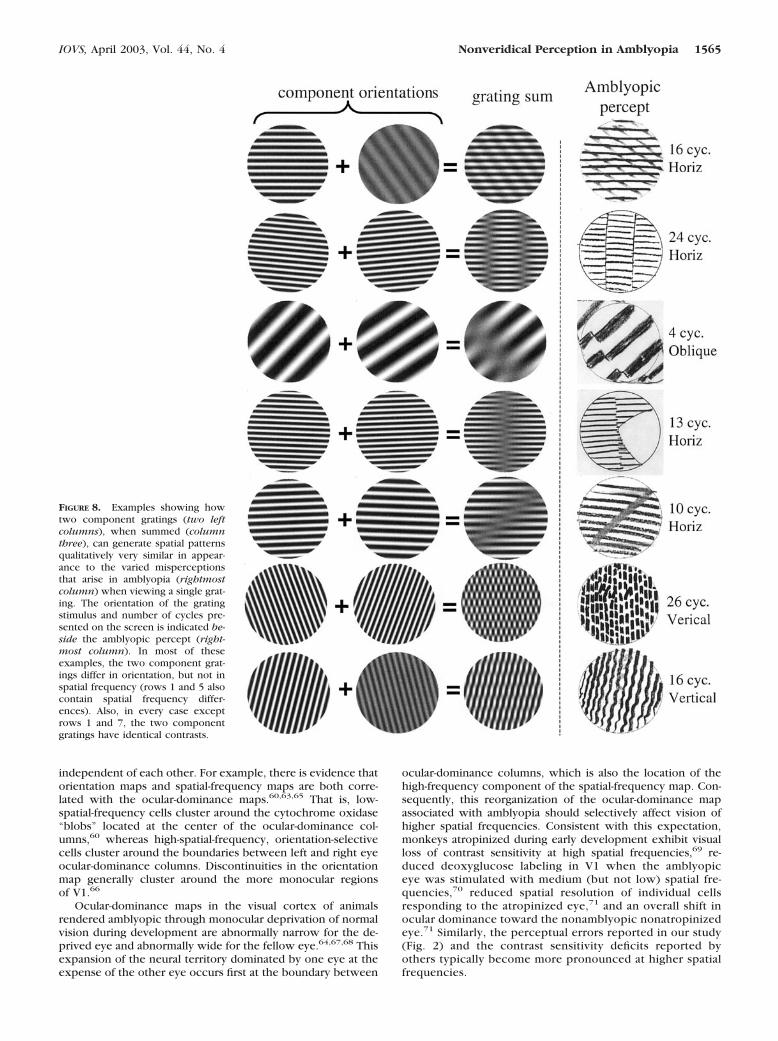
A key observation that motivated the model about to bedescribed is that many amblyopes who reported spurious per-ceptions actually drew two orientations with the nonambly-opic eye (Figs. 3, 4), even though they had viewed a singlegrating with the amblyopic eye. That is, a single grating ob-served with the amblyopic eye appears similar to two gratingsof different orientation and sometimes with different spatialfrequency or contrast as well. We interpret these results tomean that the cortical neural image of a single grating viewedby the amblyopic eye is similar to the cortical neural image oftwo obliquely oriented gratings viewed by the nonamblyopiceye. This suggests that an individual with normal vision cangain insight into the nature of amblyopic perception of singlegratings by viewing pairs of superimposed gratings of differentorientations. Several examples are illustrated in Figure 8. Thisidea of simulating amblyopic vision by distorting the neuralimage of objects is popular in amblyopia research17,22 becauseit permits a direct comparison of simulations to the drawingsmade by amblyopes.
The simulations in Figure 8 reveal the numerous perceptualramifications of a neural system that misrepresents a singleorientation as two different orientations. In addition to thegeneration of the expected dual grating appearance, we arestruck by the ability of these simulations to generate all theperceptual errors (wiggly lines, abrupt offsets, areas of lowcontrast, and segmented lines) observed by our amblyopes andthose in previous studies.
The successful simulation in Figure 8 of most of the featuresof amblyopic vision observed in our study suggests that ambly-opic misperception of gratings could be accounted for if theneural representation of stimulus orientation in the amblyopicvisual cortex misrepresents a single orientation as a pair oforientations. Thus, it is not necessary to postulate neural mech-anisms that scramble the retinotopic mapping of the corticalneural images (Hess et al.18), because positional distortionsmay in fact be manifestations of errors in the orientation code.In discussion that follows, we examine our neural model in thecontext of current neuroanatomical and neurophysiologicalunderstanding of amblyopia.
The functional mapping of area V1 of normal visual cortexhas shown that ocular dominance, orientation, and spatialfrequency are all topographically mapped across the cortex.Ocular dominance is mapped as bands running orthogonal tothe surface and traversing all layers of V1.63,64 Orientation isrepresented in radial patterns, sometimes twisted into a pin-wheel appearance.61,62 Although the details of spatial-fre-quency mapping remain somewhat controversial, it appearsthat in the macaque the high and low frequencies are mappedinto different areas of the ocular-dominance columns.60 Onestriking feature of these various maps is that they are not
1564 Barrett et al. IOVS, April 2003, Vol. 44, No. 4
independent of each other. For example, there is evidence thatorientation maps and spatial-frequency maps are both corre-lated with the ocular-dominance maps.60,63,65 That is, low-spatial-frequency cells cluster around the cytochrome oxidase“blobs” located at the center of the ocular-dominance col-umns,60 whereas high-spatial-frequency, orientation-selectivecells cluster around the boundaries between left and right eyeocular-dominance columns. Discontinuities in the orientationmap generally cluster around the more monocular regionsof V1.66
Ocular-dominance maps in the visual cortex of animalsrendered amblyopic through monocular deprivation of normalvision during development are abnormally narrow for the de-prived eye and abnormally wide for the fellow eye.64,67,68 Thisexpansion of the neural territory dominated by one eye at theexpense of the other eye occurs first at the boundary between
ocular-dominance columns, which is also the location of thehigh-frequency component of the spatial-frequency map. Con-sequently, this reorganization of the ocular-dominance mapassociated with amblyopia should selectively affect vision ofhigher spatial frequencies. Consistent with this expectation,monkeys atropinized during early development exhibit visualloss of contrast sensitivity at high spatial frequencies,69 re-duced deoxyglucose labeling in V1 when the amblyopiceye was stimulated with medium (but not low) spatial fre-quencies,70 reduced spatial resolution of individual cellsresponding to the atropinized eye,71 and an overall shift inocular dominance toward the nonamblyopic nonatropinizedeye.71 Similarly, the perceptual errors reported in our study(Fig. 2) and the contrast sensitivity deficits reported byothers typically become more pronounced at higher spatialfrequencies.
FIGURE 8. Examples showing howtwo component gratings (two leftcolumns), when summed (columnthree), can generate spatial patternsqualitatively very similar in appear-ance to the varied misperceptionsthat arise in amblyopia (rightmostcolumn) when viewing a single grat-ing. The orientation of the gratingstimulus and number of cycles pre-sented on the screen is indicated be-side the amblyopic percept (right-most column). In most of theseexamples, the two component grat-ings differ in orientation, but not inspatial frequency (rows 1 and 5 alsocontain spatial frequency differ-ences). Also, in every case exceptrows 1 and 7, the two componentgratings have identical contrasts.
IOVS, April 2003, Vol. 44, No. 4 Nonveridical Perception in Amblyopia 1565
Furthermore, because orientation is mapped in radial pat-terns centered on ocular-dominance columns, orientations rep-resented by cells located on the border between ocular-domi-nance columns are more at risk of becoming dominated by thenonamblyopic eye. However, cells representing orientationsrotated �45° from those at the ocular-dominance border arelocated near the ocular-dominance column’s center. Thus,shrinkage of ocular-dominance columns should always pro-duce an effect that varies with orientation, which agrees wellwith the perceptual distortions we observed in amblyopes.
A single grating stimulus would be expected to excite apopulation of neurons to varying degree because of the finiteorientation bandwidth of cortical neurons.72,73 Normally, thestrength of this neural response to a single grating would be aunimodal function of orientation, but it is conceivable that thedistribution could become bimodal in the amblyopic ocular-dominance column if neurons in the center of the distributionare lost to the fellow eye. The result would be an amblyopicneural image similar in form to the bimodal neural imagecreated in normal visual cortex by a pair of gratings of differentorientation. Thus the amblyope would report that a pair ofgratings viewed with the normal eye has an appearance similarto that of a single grating viewed with the amblyopic eye,because both stimuli produce bimodal distributions of neuralactivity in the visual cortex.
A small number of studies have addressed the question ofwhether the normal ocular-dominance column arrangement inhumans is affected by amblyopia.57,58 No shrinkage of ambly-opic eye representation was found at autopsy in layer IVc in asingle subject with strabismic amblyopia, and a similar resultwas found in the primary visual cortex of a human ani-sometrope. In spite of the absence of ocular-dominance col-umn shrinkage in layer IVc in human amblyopes, it is notpossible to reject a model of amblyopia based on shrinkage ofamblyopic eye ocular-dominance columns for two reasons.First, it is likely that ocular-dominance patterns in layer IVc areresistant to shrinkage at the age when the amblyogenic factorfirst appears.57,64 Secondly, in animals with late-onset depriva-tion, LeVay et al.64 reported shifts of ocular dominance in thenoninput layers of primary visual cortex, whereas the layer IVccolumnar arrangement had a normal appearance.
Although our model remains somewhat speculative atpresent, we conclude that the misperception of grating stimulireported by amblyopes may be a direct consequence of thereduced neural representation of the amblyopic eye signal inthe primary visual cortex.
Acknowledgments
The authors thank David Whitaker for software support.
References
1. von Noorden GK. Burian-Von Noorden’s Binocular Vision andOcular Motility. St. Louis, MO: Mosby; 1980.
2. Ciuffreda KJ, Levi DM, Selenow A. Amblyopia: Basic and ClinicalAspects. Stoneham, MA: Butterworth-Heinemann; 1991.
3. Gstalder RJ, Green DG. Laser interferometric acuity in amblyopia.J Paediatr Ophthalmol. 1971;8:251–256.
4. Hess R, Howell ER. The threshold contrast sensitivity function instrabismic amblyopia: evidence for a two-type classification. Vi-sion Res. 1977;17:1049–1055.
5. Levi DM, Harwerth RS. Spatiotemporal interaction in anisome-tropic and strabismic amblyopia. Invest Ophthalmol Vis Sci. 1977;16:90–95.
6. Hilz R, Rentschler I, Brettel H. Myopia and strabismic amblyopia:substantial differences in human visual development. Exp BrainRes. 1977;30:445–446.
7. Thomas J. Normal and amblyopic contrast sensitivity functions incentral and peripheral retinae. Invest Ophthalmol Vis Sci. 1978;17:746–753.
8. Bradley A, Freeman RD. Contrast sensitivity in anisometropic am-blyopia. Invest Ophthalmol Vis Sci. 1981;21:467–476.
9. Campbell FW, Green DG. Optical and retinal factors affectingvisual resolution. J Physiol. 1965;181:576–593.
10. Levi DM, Klein SA. Vernier acuity, crowding and amblyopia. Vi-sion Res. 1985;25:979–991.
11. Levi DM, Klein SA, Yap M. Positional uncertainty in peripheral andamblyopic vision. Vision Res. 1987;27:581–597.
12. Hess RF, Holliday I. The spatial localisation deficit in amblyopia.Vision Res. 1992;32:1319–1339.
13. Hess RF, Bradley A. Contrast perception above threshold is onlyminimally impaired in human amblyopia. Nature. 1980;287:463–464.
14. Bradley A, Ozhawa I. A comparison of contrast detection anddiscrimination. Vision Res. 1986;26:991–998.
15. Hess RF, Bradley A, Piotrowski, L. Contrast coding in amblyopia. I:differences in the neural basis of human amblyopia. Proc R SocLond B Biol Sci. 1983;217:309–330.
16. Pugh M. Visual distortion in amblyopia. Br J Ophthalmol. 1958;42:449–460.
17. Sireteanu R, Lagreze WD, Constantinescu DH. Distortions in two-dimensional visual space perception in strabismic observers. Vi-sion Res. 1993;33:677–690.
18. Hess RF, Campbell FW, Greenhalgh T. On the nature of the neuralabnormality in human amblyopia: neural aberrations and neuralsensitivity loss. Pflugers Arch. 1978;377:201–207.
19. Bradley A, Freeman RD. Is reduced vernier acuity in amblyopia dueto position, contrast or fixation deficits? Vision Res. 1985;25:55–66.
20. Thibos LN, Bradley A. New methods for discriminating neural andoptical losses in vision. Optom Vis Sci. 1993;70:279–287.
21. Hess RF. Developmental sensory impairment: amblyopia or tara-chopia. Hum Neurobiol. 1982;1:17–29.
22. Hess RF, Field DJ, Watt RJ. The puzzle of amblyopia. In: BlakemoreC, ed. Vision Coding and Efficiency. Cambridge, UK: CambridgeUniversity Press; 1990:267–280.
23. Sireteanu R, Fronius M. Different patterns of retinal correspon-dence in the central and peripheral visual field of strabismics.Invest Ophthalmol Vis Sci. 1989;30:2023–2033.
24. Lagreze WD, Sireteanu R. Two dimensional spatial distortions inhuman strabismic amblyopia. Vision Res. 1991;31:1271–1288.
25. Bedell HE, Flom MC. Monocular spatial distortion in strabismicamblyopia. Invest Ophthalmol Vis Sci. 1981;20:263–268.
26. Bedell HE, Flom MC. Normal and abnormal space perception. Am JOptom Physiol Opt. 1983;60:426–435.
27. Fronius M, Sireteanu R. Monocular geometry is selectively dis-torted in the central visual field of strabismic amblyopes. InvestOphthalmol Vis Sci. 1989;30:2034–2044.
28. Levi DM, Klein SA. Sampling in spatial vision. Nature. 1986;320:360–362.
29. Sharma V, Levi DM, Coletta NJ. Sparse sampling of gratings in thevisual cortex of strabismic amblyopes. Vision Res. 1999;39:3526–3536.
30. Hess RF, Field DJ. Is the spatial deficit in strabismic amblyopia dueto loss of cells or uncalibrated disarray of cells. Vision Res. 1994;34:3397–3406.
31. Williams DR. Aliasing in human foveal vision. Vision Res. 1985;25:195–205.
32. Coletta NJ, Williams DR. Psychophysical estimate of extrafovealcone spacing. J Opt Soc Am A . 1987;4:1503–1513.
33. Thibos LN, Cheney FE, Walsh DJ. Retinal limits to the detectionand resolution of gratings. J Opt Soc Am A. 1987;4:1524–1529.
34. Hess RF, Baker CL. Assessment of retinal function in severelyamblyopic individuals. Vision Res. 1984;24:1367–1376.
35. Hess RF. Amblyopia: site unseen. Clin Exp Optom. 2001;84:321–336.
36. Pelli DG, Zhang L. Accurate control of contrast on microcomputerdisplays. Vision Res. 1991;31:1337–1350.
37. Schapero M. Amblyopia. Philadelphia: Chilton; 1971.
1566 Barrett et al. IOVS, April 2003, Vol. 44, No. 4
38. Ferris FL, Kassoff A, Bresnick GH, et al. New visual acuity charts forclinical research. Am J Ophthalmol. 1982;94:91–96.
39. Flom MC, Bedell HE. Identifying amblyopia using associated func-tions, acuity and non-acuity features. Am J Optom Physiol Opt.1985;62:153–160.
40. Field DJ, Hess RF. Uncalibrated distortions versus undersampling.Vision Res. 1996;36:2121–2124.
41. Levi DM, Klein SA, Sharma V, et al. Detecting disorder in spatialvision. Vision Res. 2000;40:2307–2327.
42. Watt R, Hess RF. Spatial information and uncertainty in anisome-tropic amblyopia. Vision Res. 1987;27:661–674.
43. Wang H, Levi DM, Klein SA. Spatial uncertainty and samplingefficiency in amblyopic position acuity. Vision Res. 1998;38:1239–1251.
44. Barrett BT, Whitaker D, Bradley A. Vernier acuity with compoundgratings: the whole is equal to the better of its parts. Vision Res.1999;39:3681–3691.
45. Whitaker D, MacVeigh D. Interaction of spatial frequency andseparation in vernier acuity. Vision Res. 1991;31:1205–1212.
46. Whitaker D. What part of a vernier stimulus determines perfor-mance? Vision Res. 1993;33:517–524.
47. Wang H, Levi DM, Klein SA. Intrinsic uncertainty and integrationefficiency in bisection acuity. Vision Res. 1996;36:717–739.
48. Levi DM, Waugh SJ, Beard BL. Spatial scale shifts in amblyopia.Vision Res. 1994;34:3315–3334.
49. Levi DM, Klein SA, Wang H. Discrimination of position and con-trast in amblyopic and peripheral vision. Vision Res. 1994;34:3293–3314.
50. Levi DM, Klein SA, Wang, H. Amblyopic and peripheral vernieracuity: a test-pedestal approach. Vision Res. 1994;34:3265–3292.
51. Levi DM, Klein SA. Limitations on position coding imposed byundersampling and univariance. Vision Res. 1996;36:2111–2120.
52. Wilson HR. Model of peripheral and amblyopic hyperacuity. Vi-sion Res. 1991;31:967–982.
53. Thibos LN, Bradley A. Modelling off-axis vision. II: the effect ofspatial filtering and sampling by retinal neurons. In: Peli E, ed.Vision Models for Target Detection and Recognition. Singapore:World Scientific; 1995:338–379.
54. Hess RF, Anderson SJ. Motion sensitivity and spatial undersamplingin amblyopia. Vision Res. 1993;33:881–896.
55. Swindale NV. Cortical organization: modules, polymaps and mo-saics. Curr Biol. 1998;8:R270–R273.
56. Barnes GR, Hess RF, Dumoulin SO, Achtman RL, Pike GB Thecortical deficit in humans with strabismic amblyopia. J Physiol.2001;533:281–297.
57. Horton JC, Stryker MP. Amblyopia induced by anisometropia with-out shrinkage of ocular dominance columns in human striatecortex. Proc Natl Acad Sci USA. 1993;90:5494–5498.
58. Horton JC, Hocking DR. Pattern of ocular dominance columns inhuman striate cortex in strabismic amblyopia. Vis Neurosci. 1996;13:787–795.
59. Horton JC, Hocking DR, Kiorpes L. Pattern of ocular dominancecolumns and cytochrome oxidase activity in a macaque monkeywith naturally occurring anisometropic amblyopia. Vis Neurosci.1997;14:681–689.
60. Tootell RBH, Silverman MS, Hamilton SL, Switkes E, DeValois RL.Functional anatomy of macaque striate cortex. V: spatial fre-quency. J Neurosci. 1988;8:1610–1624.
61. Obermayer K, Blasdel GG. Geometry of orientation and oculardominance columns in monkey striate cortex. J Neurosci. 1993;13:4114–4129.
62. Bartfield E, Grinvald A. Relationships between orientation-prefer-ence pinwheels, cytochrome-oxidase blobs and ocular dominancecolumns in primate striate cortex. Proc Natl Acad Sci USA. 1992;89:11905–11909.
63. Tootell RB, Hamilton SL, Silverman MS, Switkes E. Functionalanatomy of macaque striate cortex. I: ocular dominance, binocularinteractions, and baseline conditions. J Neurosci. 1988;85:1500–1530.
64. LeVay S, Wiesel TN, Hubel DH. The development of ocular dom-inance columns in normal and visually deprived monkeys. J CompNeurol. 1980;191:1–51.
65. Vnek N, Ramsden BM, Hung CP, Goldman-Rakic PS, Roe AW.Optical imaging of functional domains in the cortex of the awakeand behaving monkey. Proc Natl Acad Sci USA. 1999;96:4057–4060.
66. Crair MC, Ruthazer ES, Gillespie DC, Stryker MP. Ocular domi-nance peaks at pinwheel center singularities of the orientationmap in cat visual cortex. J Neurophysiol. 1997;77:3381–3385.
67. Hubel DH, Wiesel TN, LeVay S. Plasticity of ocular dominancecolumns in monkey striate cortex. Philos Trans R Soc Lond B BiolSci. 1977;278:377–409.
68. Crair MC, Ruthazer ES, Gillespie DC, Stryker MP. Relationshipbetween the ocular dominance and orientation maps in visualcortex of monocularly deprived cats. Neuron. 1997;19:307–318.
69. Kiorpes L, Booth RG, Hendrickson AE, Movshon JA, Eggers HM,Gizzi MS. Effects of early unilateral blur on the macaque’s visualsystem. I. Behavioural observations. J Neurosci. 1987;7:1318–1326.
70. Hendrickson AE, Movshon JA, Eggers HM, Gizzi MS, Booth RG,Kiorpes L. Effects of early unilateral blur on the macaque’s visualsystem. II. Anatomical observations. J Neurosci. 1987;7:1327–1339.
71. Movshon JA, Eggers HM, Gizzi MS, Hendrickson A, Kiorpes L,Booth RG. Effects of early unilateral blur on the macaque’s visualsystem: III. Physiological observations. J Neurosci. 1987;7:1340–1351.
72. Campbell FW, Kulikowski JJ. Orientation selectivity of the humanvisual system. J Physiol. 1966;187:437–445.
73. Hubel DH, Wiesel TN. Receptive fields, binocular interaction andfunctional architecture in the cat’s visual cortex. J Physiol. 1962;160:106–154.
IOVS, April 2003, Vol. 44, No. 4 Nonveridical Perception in Amblyopia 1567
Copyright © 2022 FDOKUMEN