Non-network ICT Overview Paper - Australian Energy Regulator
50
Non-network ICT Overview Paper 2023-28 Revenue Proposal
-
Upload
khangminh22 -
Category
Documents
-
view
0 -
download
0
Transcript of Non-network ICT Overview Paper - Australian Energy Regulator

Non-network ICT Overview Paper
2023-28 Revenue Proposal
1 | Non-network ICT Overview Paper | 2023-28 Revenue Proposal___________________________________________________________
Contents
1. Purpose, structure and scope of this document .....................................................................................4
1.1. Purpose and scope of this document .....................................................................................................4
1.2. Structure of this document .....................................................................................................................4
1.3. Supporting documents and models........................................................................................................4
2. Nature and external drivers........................................................................................................................6
2.1. The nature of ICT ...................................................................................................................................6
2.2. Key external drivers of our ICT capex ....................................................................................................7
2.3. Principles for our ICT expenditure..........................................................................................................7
2.4. Benefits of expenditure...........................................................................................................................8
3. ICT profile .....................................................................................................................................................9
3.1. Accounting treatment changes for SaaS products ................................................................................9
3.2. Previous, current and forthcoming periods ............................................................................................9
3.3. Variance in forecast and actual capex versus AER allowance ........................................................... 10
3.4. Benchmarking...................................................................................................................................... 11
4. 2018-23 ICT capex and outcomes .......................................................................................................... 15
Key messages: ........................................................................................................................................... 15
4.1. Current period capex compared to the AER’s allowance ................................................................... 15
4.2. ICT outcomes over 2018-23 ................................................................................................................ 15
4.2.1. Application maintenance .............................................................................................................. 16
4.2.2. Cyber security ............................................................................................................................... 17
4.2.3. Bespoke applications.................................................................................................................... 17
4.2.4. Infrastructure and network ............................................................................................................ 18
4.2.5. Other ICT packages ..................................................................................................................... 18
5. 2023-28 ICT capex forecast and outcomes ........................................................................................... 19
Key messages: ........................................................................................................................................... 19
5.1. Forecast capex for the 2023-28 regulatory period .............................................................................. 20
5.1.1. Application Maintenance ($18.3M) ............................................................................................... 20
5.1.2. Infrastructure and Network ($17.8M) ........................................................................................... 21
5.1.3. Bespoke Applications ($17.5M).................................................................................................... 21
5.1.4. Employee Enablement ($12.2M) .................................................................................................. 21
5.1.5. Data and Decisioning ($6.3M) ...................................................................................................... 22
5.1.6. Operational Evolution ($1.9M)...................................................................................................... 22
5.1.7. Customer Safety & Support ($1.0M) ............................................................................................ 23

2 | Non-network ICT Overview Paper | 2023-28 Revenue Proposal___________________________________________________________
5.1.8. Cyber Security ($11.9M) .............................................................................................................. 23
5.2. ICT Package interdependencies ......................................................................................................... 24
5.2.1. Supporting our staff with their daily roles ..................................................................................... 24
5.2.2. Enhancing our cyber security capabilities .................................................................................... 25
5.2.3. Enhancing our digital capabilities in key priority areas ................................................................ 25
6. Regulatory obligations and capital governance ................................................................................... 27
6.1. Regulatory obligations or requirements .............................................................................................. 27
6.2. Strategies and framework ................................................................................................................... 27
6.2.1. ICT Strategy.................................................................................................................................. 27
6.2.2. IT and Security Frameworks ........................................................................................................ 28
6.2.3. Option Evaluation Reports ........................................................................................................... 28
6.3. IT Governance Framework.................................................................................................................. 28
6.4. Portfolio optimisation process ............................................................................................................. 29
6.4.1. Delivering technology solutions that optimise the delivery of network investments .................... 30
6.4.2. Ensuring Consistency with Historical Investments ....................................................................... 30
6.4.3. Investment profile smoothing ....................................................................................................... 30
7. Forecasting method, inputs, models and assumptions ...................................................................... 31
7.1. Our ICT forecasting method ................................................................................................................ 31
7.2. Risk types ............................................................................................................................................ 31
7.3. Risk models ......................................................................................................................................... 32
7.4. Key assumptions ................................................................................................................................. 33
7.5. Risk tools and templates ..................................................................................................................... 33
7.6. Unit costs ............................................................................................................................................. 33
7.6.1. Unitised projects ........................................................................................................................... 33
7.6.2. Non-unitised projects .................................................................................................................... 33
7.7. Cost escalation .................................................................................................................................... 34
7.8. Overheads ........................................................................................................................................... 34
7.9. Opex step change ............................................................................................................................... 35
7.10. Validation ........................................................................................................................................... 35
7.10.1. Internal validation ....................................................................................................................... 35
7.10.2. External validation ...................................................................................................................... 35
7.11. Addressing uncertainty in investment requirements ......................................................................... 36
8. Forecast expenditure by RIN category .................................................................................................. 37
8.1. RIN categories ..................................................................................................................................... 37
Attachment 1 – Supporting documentation .............................................................................................. 38
Attachment 2 - High level explanation of ICT forecast capex projects .................................................. 39

3 | Non-network ICT Overview Paper | 2023-28 Revenue Proposal___________________________________________________________
Application Maintenance (recurrent over 2023-28, expected recurrent in subsequent periods) ............... 39
Bespoke Applications (recurrent and non-recurrent over 2023-28, expected recurrent in subsequent
periods) ....................................................................................................................................................... 39
Customer Safety and Support (non-recurrent over 2023-28, expected recurrent in subsequent periods) 40
Data and Decisioning (non-recurrent over 2023-28, expected recurrent in subsequent periods) ............ 41
Employee Enablement (recurrent and non-recurrent over 2023-28, expected recurrent in subsequent
periods) ....................................................................................................................................................... 42
Infrastructure and Network (recurrent over 2023-28, expected recurrent in subsequent periods) ........... 43
Operational Evolution (recurrent and non-recurrent over 2023-28, expected recurrent in subsequent
periods) ....................................................................................................................................................... 44
Cyber Security (Recurrent and non-recurrent over 2023-28, expected recurrent in subsequent periods) 44
Attachment 3 - ICT package interdependencies ....................................................................................... 47
Attachment 4 - High level explanation of ICT capex projects in current regulatory period ................ 48
List of Tables
Table 3-1: Historical and forecast ICT ($Million, Real 2022-23) .................................................................... 10
Table 4-1: Current period ICT ($Million, Real 2022-23) ................................................................................ 15
Table 4-2: Actual / estimated ICT capex over 2018-23 by new ICT category ($Million, Real 2022-23) ....... 16
Table 5-1: ICT by category 2023-28 ($Million, Real 2022-23)....................................................................... 20
Table 7-1: Impact of labour and materials escalation ($Million) .................................................................... 34
Table 7-2: Addition of capitalised overheads ($Million, Real 2022-23) ......................................................... 35
Table 8-1: Total escalated capex forecasts by RIN category ........................................................................ 37
List of Figures
Figure 1-1 Hierarchy of ICT documents and models ....................................................................................... 5
Figure 3-1: Actual and estimated ICT capex for the FY2014 to FY2028 period compared to the AER’s
allowance ($M Real 2022-23) ........................................................................................................................ 10
Figure 3-2 ICT Capex share of Corporate Capex Compared to Peers ......................................................... 11

4 | Non-network ICT Overview Paper | 2023-28 Revenue Proposal___________________________________________________________
1. Purpose, structure and scope of this document
1.1. Purpose and scope of this document
This document explains and justifies at a high level our Non-Network Information and Communications
Technology (ICT) capital expenditure (capex) for our prescribed transmission services. This document
supports our Revenue Proposal and references other supporting documents for further detail.
All capex is presented in real 2022-23 dollars and is expressed in total costs (i.e. direct costs plus
escalations and excluding overheads).
We explain and justify our:
operating expenditure (opex) step change forecast in a separate opex step change overview document,
and
other categories of capex, including replacement capex (Repex), augmentation capex (Augex), and
Non-network Other, in separate capex overview documents.
1.2. Structure of this document
This ICT Overview Paper is structured as follows:
chapter 1 sets out the purpose of this document and hierarchy of documents that support our ICT
capex forecast
chapter 2 discusses the nature of our ICT expenditure, and the key drivers for our ICT forecast
chapter 3 presents our previous and current period ICT capex with our forecast ICT capex, and the
differences between our expected current period expenditure and the AER ICT allowance for the period
chapter 4 discusses the key outcomes that we have delivered from our current period ICT capex
chapter 5 presents our forecast ICT for the 2023-28 regulatory period, and discusses the key outcomes
that we propose to deliver, and the drivers which underpin the projects that comprise our forecast
chapter 6 explains our regulatory obligations and our investment governance framework
chapter 7 explains our forecast method, inputs and assumptions used to develop our forecast ICT
chapter 8 presents our forecast total ICT, including ICT by category, and
attachment 1 lists the documentation, models and justifications that support this ICT Overview Paper
and the ICT forecast.
attachment 2 provides a summary table relating to our major proposed ICT packages for the 2023-28
regulatory period.
attachment 3 shows our assessment of the interdependencies between the ICT packages
attachment 4 describes how we have mapped our proposed ICT packages for 2023-228 to those used
in our 2018-23 submission.
1.3. Supporting documents and models
A number of other documents and models support and form part of our 2023-28 Revenue Proposal. A
summary of these documents and models relevant to ICT is listed in Attachment 1.

5 | Non-network ICT Overview Paper | 2023-28 Revenue Proposal___________________________________________________________
Figure 1-1 illustrates our hierarchy of documents and models that support our Non-Network ICT forecast,
which we have submitted to the AER with our Revenue Proposal. This ICT Overview Paper is supported by
our:
ICT Strategy which details our overarching strategic approach to Information Technology management
and investment, which supports the needs of the business in delivering network services, within a
rapidly evolving energy and digital technology landscape.
IT Governance Framework detailing our governance framework and our approach to portfolio
optimisation.
Options Evaluation Reports (OERs) – Non-Network ICT project and program economic evaluation
business cases for each investment package, which apply cost-benefit analysis utilising cost-estimates
and benefits, to economically assess each credible option against the status quo - to demonstrate
prudency of the proposed investment.
Figure 1-1 Hierarchy of ICT documents and models
Our ICT expenditure considers ways to support the efficient, safe and secure management of our
transmission network, through technology solutions including the assessment of capex to opex trade-offs.
This approach ensures there is no double counting of expenditure, and maximises the benefits for our
customers with a view to maintaining current performance and safety outcomes, and meeting regulatory
obligations.
ICT Strategy
Option Evaluation Reports
IT Governance
Framework
ICT Overview Paper

6 | Non-network ICT Overview Paper | 2023-28 Revenue Proposal___________________________________________________________
2. Nature and external drivers
This chapter explains the nature of our ICT capex, the key external drivers of our ICT forecast capex over
the 2023-28 regulatory period, and the principles that underpin our ICT expenditure.
2.1. The nature of ICT
Our electricity transmission network forms the physical connection between regions in the National
Electricity Market (NEM). It is essential for the connection of new low-cost renewable generation and
stronger interconnection across the NEM to ensure the safety, security and reliability of supply and to
enable customers to access affordable electricity.
ICT is key to ensuring that our staff can undertake their daily roles and supporting the safe, secure and
reliable delivery of electricity. We require investment in our ICT so that we can:
provide our staff with the necessary ICT support to perform their roles – this involves providing
our staff with the necessary ICT services (e.g. access to the corporate network and applications) and
equipment (e.g. laptops and iPads) to continue to work and collaborate with others. Our staff can only
work effectively if we continue to provide these services in a reliable and suitable manner.
Meet our cyber security obligations– changes in the cyber security landscape, including the Critical
Infrastructure Bill 2021 and the draft Critical Infrastructure Protection Bill 20221 by the Federal
government (collectively ‘Critical Infrastructure Bills’) and the NSW Government Energy Legislation
Amendment Bill 2021, has led to the need for us to enhance our cyber security capabilities. As our
applications reach end of life, we are required to update to continue to receive vendor support and
security updates.
Enhance our digital capabilities in key priority areas – we have identified ICT investments that will
provide us with improved capabilities to effectively deliver our forward work program (including the
major ISP projects), improve our engagement with stakeholders and enhance efficient decision-making
going forward.
We expect our ICT investment will help us to be:
Connected – ICT is helping to transform the business by connecting previously separate information
and systems through digital technology to create the capability required for us to transition to the new
energy market.
Secured – ICT maintains appropriate security while increasing exposure to open networks and
integrating more diverse and complex assets into the enterprise. As a Critical Infrastructure Provider of
National Significance, we have regulated security obligations to protect energy provision to our
customers from cyber-attack such as the Critical Infrastructure Act 2018 (CI Act), the Critical
Infrastructure Bills, the NSW Government Energy Legislation Amendment Bill 2021 and AEMO’s
Australian Energy Sector Cyber Security Framework (AESCSF).
Value led – We are modernising the ICT environment by creating agility in our ICT systems to solve a
number of problems, rather than solve a particular business problem as in the past. We are focused on
providing capability in ICT solutions rather than point to point solutions.
1 The original Security Legislation Amendment (Critical Infrastructure) Bill 2020 has been split into two parts, Part 1 referred to as the ‘Critical Infrastructure Bill 2021’ which has passed parliament and a proposed Part 2 (the draft Critical Infrastructure Protection Bill 2022).

7 | Non-network ICT Overview Paper | 2023-28 Revenue Proposal___________________________________________________________
Insights-driven – ICT integrates data to provide decision-makers with timely, consumable and
contextual insights to provide potential innovation and become a thought leader in policy and customer
issues. ICT also removes human error currently experienced from necessary manual intervention in
some processes.
Adaptable – Agile ICT helps the business to adapt rapidly as we address the risks and uncertainties
driven by industry and technology disruptions. ICT provides the network business with the capability to
scale to support our transition to the new energy market.
2.2. Key external drivers of our ICT capex
The key drivers for our ICT investment are as follows:
Adapt to the rapid changes in the energy and digital landscapes to ensure we continue to deliver
safe, affordable and reliable energy and services to our customers and provide the systems and
capabilities necessary to deliver the major ISP projects,
Further embrace the opportunities presented by new technology through prudent, risk-aware
replacement and investment decisions guided by internal business requirements and external trends in
both the energy and technology industries. For example, there is a market trend towards migrating to
cloud based solutions, which we intend to adopt where appropriate,
Refresh and maintain our existing ICT capabilities to ensure that staff can continue to perform their
daily roles. Many of our ICT assets and applications have an average life of between three to seven
years. These assets and applications, such as laptops, become less reliable and suitable as they age
over time and will eventually become obsolete,
Meet our legal obligations under the Critical Infrastructure Bill 2021 and the draft Critical
Infrastructure Protection Bill 2022 by the Federal government and the NSW Government Energy
Legislation Amendment Bill 2021. The proposed bills sets out enhanced cyber security requirements for
critical infrastructure providers. We will need to improve our cyber security capabilities to meet the
requirements set out in the bills,
Improve the mobility of the workforce to allow our workers to work remotely. We have seen a
tremendous shift in the nature of work due to restrictions arising from the COVID-19 pandemic. We
need to ensure that our staff can continue to work and collaborate effectively while working remotely,
and
Improve our engagement with customers to deliver our forward work program, we will need to
interact and consult with multiple stakeholders and landowners during the next regulatory period.
Improvements in our ability to keep stakeholders informed and record interactions with stakeholders will
reduce the likelihood that there is a dispute, thereby improving our ability to deliver projects on time and
on budget.
2.3. Principles for our ICT expenditure
In a period of significant change, our non-network ICT investment approach of incremental transformation
has allowed us to build our capability in a prudent and sustainable manner as the use of technology in our
operations and across our supply and value chains continues to grow in intensity, diversity and criticality.
Our ICT expenditure is underpinned by four principles:

8 | Non-network ICT Overview Paper | 2023-28 Revenue Proposal___________________________________________________________
Protect information and systems – we are an essential services provider with responsibility for
sensitive data and take appropriate steps to protect the confidentiality, integrity, authenticity, availability
and reliability of our information and systems.
Invest in deliverability and compliance – we prioritise and justify every investment by deliverability
and compliance. This ensures that we meet the expectations of our customers, community and security
holders to allocate our resources efficiently and prudently.
Apply an enterprise mindset – we prudently invest in our future performance so we can meet the
needs of the energy market. Our prudent approach reduces the risk profile and provides the business
with capability to adapt to the requirements of the energy market.
Innovate to evolve – we prudently invest in recognising, developing and optimising technology
solutions that advance our organisation and the services it provides.
2.4. Benefits of expenditure
We provide benefits to the business by improving the capability of existing applications through upgrades
or replacements which deliver benefits to our customers. Benefits inform investment decisions and
therefore need to be identified and carefully tracked. Investment in ICT follows a process of identifying,
planning and managing an intended benefit throughout an ICT project. The Benefit Owner is responsible
for ensuring a benefit is realised and improves the service to customers.
The benefits expected for our business are categorised according to our Benefit Management Framework
which is the following:
Cashable benefits are those benefits which directly impact on our opex or revenue which can be
passed onto customers by providing better services, and
Non-cashable benefits are non-financial benefits, such as lowering the operational risk profile which
can result in a better service for our customers, or improve safety.
The benefits delivered to our network business enables us to deliver a safe, reliable and affordable service
to customers. It also enables us to grow and scale to meet the needs of the energy market.

9 | Non-network ICT Overview Paper | 2023-28 Revenue Proposal___________________________________________________________
3. ICT profile
This chapter focuses on the capex spend and ICT trends over the past, current and next regulatory
periods. In the 2014-18 regulatory period we refreshed legacy applications where appropriate. We are
modernising our applications to cloud-based services in the 2018-23 regulatory period, as reflected in our
capex spend in 2021-22 and 2022-23 (where the excluded spend on SaaS products is expensed). In the
2023-28 regulatory period, we plan to finalise the feasible transition to cloud-based services.
This chapter overviews:
changes to our expenditure profile resulting from SaaS accounting changes in 2021-22 and 2022-23 in
the current regulatory period
the profile of our ICT capex over 2014 to 2028
our actual/estimated ICT capex over the 2014-18 and 2018-23 regulatory periods, and compares it to
the AER’s allowances, and
how our ICT capex between 2014 and 2022 compares with our peers.
3.1. Accounting treatment changes for SaaS products
Our 2018-23 regulatory period AER allowance for ICT is $89.8 million. We estimate that we will spend
$67.3 million of capex and an additional $25.0 million of SaaS opex to fulfil our ICT maintenance and
modernisation commitments. Our total estimated ICT expenditure for the 2018-23 regulatory period
(inclusive of capex and SaaS opex) is estimated to be $92.3 million, which is above our ICT capex
allowance. In accordance with the IFRS accounting guidelines as they relate to the implementation of SaaS
products, expenditure on SaaS from 2021-22 onwards has been removed from capex and attributed to
opex. This IFRS accounting treatment change has significantly reduced the capex profile of ICT, however it
has not reduced the total expenditure necessary on ICT services, where we have elected to spend more
than the $89.8 million allowance when including the opex expensed implementation of SaaS products.
3.2. Previous, current and forthcoming periods
Figure 3-1 compares our actual and estimated ICT capex for the current and previous regulatory periods2
compared to the AER’s allowance, and presents our 2023-28 forecast ICT capex. This shows that our
actual ICT was below the AER’s allowance for the 2014-18 regulatory period. Our ICT capex is also below
our allowance in the 2018-23 regulatory period due to a change in accounting standards, which is
explained in Section 3.1.
2 This information is presented in accordance with clause S6A.1.1(6) of the Rules

10 | Non-network ICT Overview Paper | 2023-28 Revenue Proposal__________________________________________________________
Figure 3-1: Actual and estimated ICT capex for the FY2014 to FY2028 period compared to the AER’s allowance ($Million, Real 2022-23)
3.3. Variance in forecast and actual capex versus AER allowance
Table 3-1 shows our ICT capex for each regulatory period compared to the AER allowance and the
variances.
Table 3-1: Historical and forecast ICT ($Million, Real 2022-23)
2014-20183
Actual
2018-2023
Actual & Estimated
2023-2028
Forecast
AER allowance 87.7 89.8
Actual ICT 81.7 67.3 86.9
Variance (Actual minus AER allowance)
$ Million and %
(6.0)
(6.8%)
(22.5)
(25.1%)
We make the following observations about our ICT capex profile:
In the 2014-18 regulatory period we focussed on refreshing legacy applications that had reached their
end of asset life with on-premise solutions.
In the 2018-23 regulatory period we updated our end of life ICT assets, applications and systems and
moved some of our core business applications to cloud based services, which will change our future
capex profile. We have also focused on meeting our compliance obligations and legislative security
requirements which were not reflected in our 2018-23 proposal.
3 Five years presented for comparison purposes, 2013-14 to 2017-18.

11 | Non-network ICT Overview Paper | 2023-28 Revenue Proposal__________________________________________________________
In April 2021, the International Financial Reporting Interpretations Committee (IFRIC) published
guidance which clarifies that costs related to cloud computing arrangements, which are commonly
referred to as Software as a Service (SaaS), should be expensed rather than capitalised. We have
therefore revised our capitalisation policy for SaaS-related costs and expensed (rather than capitalised)
these costs in 2021-22 and 2022-23. This has resulted in an underspend of the ICT allowance in the
current 2018-23 regulatory period.
Our forecast capex for the 2023-28 regulatory period is $5.2 million higher than the previous regulatory
period and $19.6 million higher than the current regulatory period. Over the 2023-28 regulatory period,
the drivers for the increase in capex is due to:
- focus on legislative security requirements which continue to evolve, with more emphasis on risk and
compliance requirements
- advancement in technology and the need to continue to refresh legacy applications and systems
over the years, and
- modernising our ICT landscape, such as continuous improvement to new applications, upgrading
infrastructure and user devices to align with technology trends, and mitigate outage risk due to
aged systems.
3.4. Benchmarking
Our annual ICT capex has remained consistent as a proportion of total corporate capex, showing a flat
trend over the 2014-18 and 2018-23 periods compared with the trend of Powerlink and AusNet
Transmission. In addition, over the 2018-23 regulatory period the trend of our ICT capex as a proportion of
total corporate capex is below that of Powerlink and AusNet. This is forecasted to continue into the next
regulatory period, showing a decrease in ICT spending relative to overall capex.
While not guaranteed, we are expecting that trend to continue into future periods due to our IT strategy of
shifting to cloud based Software as a Service (SaaS) solutions and the changes in the financial treatment
of this shift as an operational expenditure.
Figure 3-2 uses the latest actual data from the Annual Category RINs up to 2020, and the latest actuals
and estimates for 2020-21, 2021-22 and 2022-23 for Transgrid.
Figure 3-2 ICT Capex share of Corporate Capex Compared to Peers
12 | Non-network ICT Overview Paper | 2023-28 Revenue Proposal__________________________________________________________
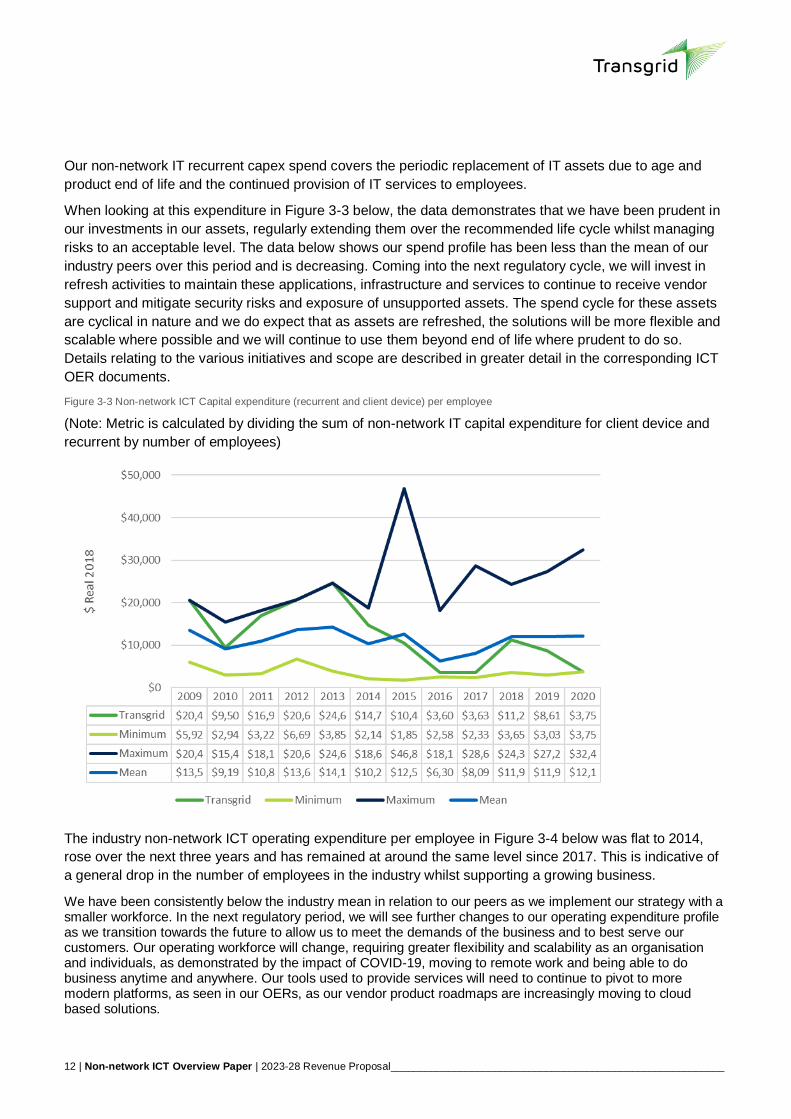
Our non-network IT recurrent capex spend covers the periodic replacement of IT assets due to age and
product end of life and the continued provision of IT services to employees.
When looking at this expenditure in Figure 3-3 below, the data demonstrates that we have been prudent in
our investments in our assets, regularly extending them over the recommended life cycle whilst managing
risks to an acceptable level. The data below shows our spend profile has been less than the mean of our
industry peers over this period and is decreasing. Coming into the next regulatory cycle, we will invest in
refresh activities to maintain these applications, infrastructure and services to continue to receive vendor
support and mitigate security risks and exposure of unsupported assets. The spend cycle for these assets
are cyclical in nature and we do expect that as assets are refreshed, the solutions will be more flexible and
scalable where possible and we will continue to use them beyond end of life where prudent to do so.
Details relating to the various initiatives and scope are described in greater detail in the corresponding ICT
OER documents.
Figure 3-3 Non-network ICT Capital expenditure (recurrent and client device) per employee
(Note: Metric is calculated by dividing the sum of non-network IT capital expenditure for client device and
recurrent by number of employees)
The industry non-network ICT operating expenditure per employee in Figure 3-4 below was flat to 2014,
rose over the next three years and has remained at around the same level since 2017. This is indicative of
a general drop in the number of employees in the industry whilst supporting a growing business.
We have been consistently below the industry mean in relation to our peers as we implement our strategy with a smaller workforce. In the next regulatory period, we will see further changes to our operating expenditure profile as we transition towards the future to allow us to meet the demands of the business and to best serve our customers. Our operating workforce will change, requiring greater flexibility and scalability as an organisation and individuals, as demonstrated by the impact of COVID-19, moving to remote work and being able to do business anytime and anywhere. Our tools used to provide services will need to continue to pivot to more modern platforms, as seen in our OERs, as our vendor product roadmaps are increasingly moving to cloud based solutions.

13 | Non-network ICT Overview Paper | 2023-28 Revenue Proposal__________________________________________________________
The change to the financial treatment of Software as a Service (SaaS) solutions as an operational expense will increase this pivot towards a reduction in capital expenditure for these tools should result in a decrease in the ongoing requirement to refresh applications.
Figure 3-4 Non-network ICT operating expenditure per employee
Metric calculated by dividing non-network IT operating expenditure by number of employees.
The non-recurrent IT total expenditure (capital + operating) as a % of total expenditure is an indication of
the level of technology spend used by the transmission business in Figure 3-5 below. Over the previous
regulatory periods, we have seen an increase in delivering network services through technology. This is
likely to increase in future as the network will look to use technology to perform more with less employees,
look to data to gain insights and efficiencies and support the transition of the energy market to renewable
technology.
In the data below, our IT expenditure has tracked the industry mean with a slight fall over the last two years
after a peak in 2018. Our organisation has announced major network programs leading into the next
regulatory period and ICT will play an important role in supporting the network business achieve the
benefits for consumers and industry. We expect that the overall IT spend will need to increase to support
these initiatives but will decline as an overall percentage of total expenditure due to the size and volume of
the planned network changes.

14 | Non-network ICT Overview Paper | 2023-28 Revenue Proposal__________________________________________________________
Figure 3-5 Non-network ICT expenditure as a % of total expenditure
Note: Metric calculated by dividing the sum of non-network IT expenditure and operating expenditure by the
sum of transmission capital expenditure and operating expenditure.
15 | Non-network ICT Overview Paper | 2023-28 Revenue Proposal__________________________________________________________
4. 2018-23 ICT capex and outcomes
This chapter sets out our actual and estimated capex over the 2018-23 regulatory period compared to the
AER’s allowances, and explains the variations.
For the 2018-23 regulatory period we expect that we will underspend the AER’s allowance due to the
accounting standard change described in Section 3.3.
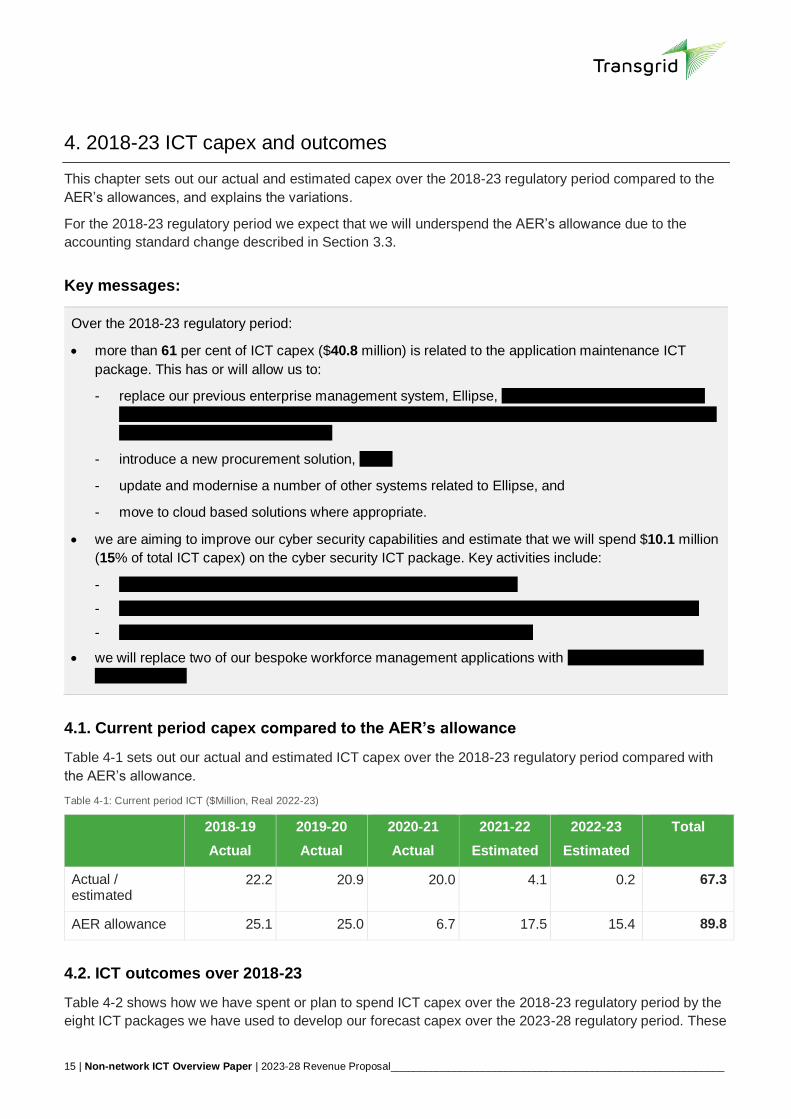
Key messages:
Over the 2018-23 regulatory period:
more than 61 per cent of ICT capex ($40.8 million) is related to the application maintenance ICT
package. This has or will allow us to:
- replace our previous enterprise management system, Ellipse,
- introduce a new procurement solution,
- update and modernise a number of other systems related to Ellipse, and
- move to cloud based solutions where appropriate.
we are aiming to improve our cyber security capabilities and estimate that we will spend $10.1 million
(15% of total ICT capex) on the cyber security ICT package. Key activities include:
-
-
-
we will replace two of our bespoke workforce management applications with
4.1. Current period capex compared to the AER’s allowance
Table 4-1 sets out our actual and estimated ICT capex over the 2018-23 regulatory period compared with
the AER’s allowance.
Table 4-1: Current period ICT ($Million, Real 2022-23)
2018-19
Actual
2019-20
Actual
2020-21
Actual
2021-22
Estimated
2022-23
Estimated
Total
Actual / estimated
22.2 20.9 20.0 4.1 0.2 67.3
AER allowance 25.1 25.0 6.7 17.5 15.4 89.8
4.2. ICT outcomes over 2018-23
Table 4-2 shows how we have spent or plan to spend ICT capex over the 2018-23 regulatory period by the
eight ICT packages we have used to develop our forecast capex over the 2023-28 regulatory period. These

16 | Non-network ICT Overview Paper | 2023-28 Revenue Proposal__________________________________________________________
packages are different to the packages we used in our 2018-23 regulatory submission. Attachment 4
describes the mapping we have done to align the different packages.
Table 4-2: Actual / estimated ICT capex over 2018-23 by new ICT category ($Million, Real 2022-23)
ICT Packages 2018-19
2019-20
2020-21
2021-22
2022-23
Average Annual
Total 2023-28
Application Maintenance 8.1 11.6 16.8 4.1 0.2 8.2 40.8
Bespoke Applications 0.0 0.4 - - - 0.1 0.4
Customer Safety and Support4
- - - - - - -
Data and Decisioning 0.1 0.6 0.6 - - 0.2 1.2
Employee Enablement 1.1 0.8 (0.0) - - 0.4 1.9
Infrastructure and Network 9.2 3.0 0.5 - - 2.5 12.7
Operational Evolution - 0.2 0.1 - - 0.1 0.3
Subtotal 18.5 16.6 17.9 4.1 0.2 11.4 57.2
Cyber Security 3.7 4.3 2.1 - - 2.0 10.1
Total ICT 22.2 20.9 20.0 4.1 0.2 13.5 67.3
4.2.1. Application maintenance
More than 60 per cent of our estimated ICT capex over 2018-23 is related to the application maintenance
package. This involves expenditure to refresh and modernise legacy systems such as Ellipse and other
upgrades. In this regulatory period, we have or expect to deliver the following key items:
- an Procurement solution, that provides both upstream (procure goods/services) and
downstream (receipting goods/services and invoice matching) capabilities to deliver process
automation. We expect will minimise the disruption to our services by reducing the time for
ordering and receiving a piece of network equipment.
HR solution supporting our human
resource operation by refining our processes and optimising the capability for recruitment and learning
management.
solution to replace the core EAM functionality
of Ellipse to enable future business growth. The solution will provide a platform for further integration of
other Asset Performance Management (APM) functionality which will drive future risk management.
Finance Transformation – solution will
replace Ellipse’s financial management capability. The new ERP will re-engineer finance business
processes and enable Finance to better support the network and future business growth.
Workforce Management – solution which will replace Ellipse’s
core workforce management capability and a number of bespoke applications which are no longer fit
4 The application is expected to be fully delivered in 2025-26.

17 | Non-network ICT Overview Paper | 2023-28 Revenue Proposal__________________________________________________________
for purpose. This solution will reform the end-to-end Work and Resource Planning processes, from long
term planning and strategic decisions on sourcing for capital, maintenance and defect works, through to
the capture of cost, and asset information at completion of work.
Data Migration – to resolve our legacy data issues by implementing ongoing capability to maintain data
quality.
IT Pipeline Project – we will automate the corporate long range planning process by investing in
functionality to implement Corporate
Valuation Modelling (CVM) capability. We will also be delivering a reporting and analytics capability
which is an enabler to the Digital Enterprise solutions. The CVM and reporting and analytics solutions
will provide more accurate data processing and reporting to business stakeholders.
Worker Safety Authorisation and Training – solution streamlined worker safety and
training processes to ensure we comply with our obligation to provide workers with a safe workplace
and that they are adequately authorised and trained when working at our sites.
Enterprise Integration Platform – we implemented Platform which is an
integration technology that allows us to connect applications hosted on-premise and in the cloud. This
integration platform will include the set up reusable ‘micro-services’ to provide an efficient service to the
business.
Integration Digital Core – we will develop several integrations to connect and support the Digital
Enterprise and Field Force programs of work.
4.2.2. Cyber security
We estimate that we will spend $10.1 million of capex related to the cyber security ICT package. We have
delivered or are expected to deliver the following key items between 2018-23:
4.2.3. Bespoke applications
We estimate that we will spend $0.4 million of capex related to the bespoke ICT package.

18 | Non-network ICT Overview Paper | 2023-28 Revenue Proposal__________________________________________________________
4.2.4. Infrastructure and network
We estimate that we will spend $12.7 million of capex related to the Infrastructure and network package.
We have delivered or are expected to deliver the following key items between 2018-23:
Information Infrastructure – we replaced our eight physical servers which host our virtual
machines production environment that have been extended beyond their useful asset life and were
unsupported by the vendor. We expanded our current cluster to add compute and storage
capacity which allows for prudent and efficient ongoing support costs and simplifies the deployment of
infrastructure in the future.
– we refreshed two physical servers,
. This solution allows us to run large amounts of
transaction processes in an efficient manner.
Information Infrastructure 18-19 SQL 2008 and Windows 2008 – we refreshed the Windows servers
and Structured Query Language (SQL) databases and instances which have reached the end of their
serviceable life to ensure continued availability of applications, minimise business disruption and
maintain ongoing support.
Corporate Data Network Refresh 2018-19 – we replaced the Wide Area Network (WAN) routers which
have reached their end of asset life and are unsupported by the vendor. This router replacement
improved the performance and reliability of infrastructure ensuring continuous connectivity for our
substations to communicate between each other and the entire data network.
4.2.5. Other ICT packages
We estimate that $3.4 million will be spent on the remaining four ICT packages. Most of this relates to the
employment enablement package, which involves the replacement and maintenance of user devices. The
other three packages (customer safety and support, data and decisioning, and operational evolution)
represent new or improved capabilities, and have minimal capex in the current regulatory period.

19 | Non-network ICT Overview Paper | 2023-28 Revenue Proposal__________________________________________________________
5. 2023-28 ICT capex forecast and outcomes
Our 2023-28 ICT forecast of $86.9 million is $19.6 million, or 29 per cent, above our estimated 2018-23
capex of $67.3 million. Our ICT forecasts is required to continue modernising our ICT landscape for the first
two financial years. A new ruling from the International Financial Reporting Standards (IFRS) Foundation
means that for regulatory years 2021-22 onwards, we will expense costs for configuration or customisation
in cloud computing arrangements, whereas these costs were treated as capex prior to 2021-22. In the
absence of the new IFRS rule, our ICT expenditure would have increased by $23.7 million due to an
additional:
$0.6 million on our cyber security capability to comply with our operating license obligations and meet
new cyber security legislation requirements
$2.8 million on enhancing our customer relationships by providing real-time information about our
planned work.
$15.1 million on modernising our project management solution and expanding on our digital core
capabilities to optimise inventory, asset and workforce management.
$3.2 million on refreshing our work and collaboration applications to cloud solutions.
$2.6 million on modernising our infrastructure and corporate data network assets so we can adopt
technology which provides a flexible workplace.
This chapter sets out our forecast ICT capex for the 2023-28 regulatory period and the key outcomes we
expect to deliver.
Key messages:
Over the 2023-28 regulatory period our proposed ICT capex will involve spending:
$65.7 million5 (76 per cent) to ensure that we continue to provide our staff with the necessary ICT support to perform their roles by:
- providing them with the necessary devices, telephony services and access to the corporate data network
- maintaining and refreshing the COTS and bespoke applications, and
- improving their ability to work from home and collaborate effectively by moving towards Microsoft 365
$11.9 million (14 per cent) on our cyber security package, which will allow us to meet new cyber security obligations under the Federal government’s new Critical Infrastructure Bill 2021 and the draft Critical Infrastructure Protection Bill 2022, and the NSW Government’s Energy Legislation Amendment Bill 2021
$6.3 million (7 per cent) for data and decisioning package, which will refresh our legacy data platform, extending our access to business insights and ensuring compliance obligations are met
$1.9 million (2 per cent) on our operational evolution package, which will provide us with a modern project management solution to deliver our forward work program and improve our ability manage our inventory, workforce and assets
5 This comprises capex for application maintenance, bespoke applications, employee enablement, and infrastructure and network packages.

20 | Non-network ICT Overview Paper | 2023-28 Revenue Proposal__________________________________________________________
$1.0 million (1 per cent) on our customer safety and support package, which would put in place an appropriate customer relationship management system and improve the functionality of our website to provide our stakeholders with real time, interactive information.
5.1. Forecast capex for the 2023-28 regulatory period
Table 5-1 presents our forecast ICT by category.
Our ICT forecasts for the 2023-28 regulatory period have been developed to continue modernising our ICT
landscape for the first two financial years. We expect that our proposed ICT spend in the third and following
years will reflect a normalised pattern of expenditure.
Table 5-1: ICT by category 2023-28 ($Million, Real 2022-23)
ICT Packages 2023-24
2024-25
2025-26
2026-27
2027-28
Average Annual
Total 2023-28
Application Maintenance 6.0 4.1 3.1 0.9 4.2 3.7 18.3
Infrastructure and Network 17.8
Bespoke Applications 4.0 4.3 5.5 2.8 0.9 3.5 17.5
Employee Enablement 5.0 1.6 2.5 1.6 1.6 2.4 12.2
Data and Decisioning 2.8 2.4 1.2 - - 1.3 6.3
Operational Evolution 0.8 0.3 0.2 0.6 - 0.4 1.9
Customer Safety and Support6
0.7 0.3 - - - 0.2 1.0
Subtotal 75.0
Cyber Security 11.9
Total ICT 25.0 19.2 18.3 13.7 10.7 17.4 86.9
Our proposed capex over the 2023-28 regulatory period will deliver the eight packages of work, which we
describe in further detail below.
5.1.1. Application Maintenance ($18.3M)
Efficiently maintaining and refreshing our applications is critical to avoid compliance and security
vulnerabilities, business outages and unnecessary costs. This investment sub-category covers the
maintenance and refresh of 93 Commercial off the Shelf (COTS) and Cloud applications that support our
business, high voltage network and platform. It excludes bespoke applications and applications requiring
enhanced capabilities, which are covered in other sub-categories.
6 The application is expected to be fully delivered in 2025-26.

21 | Non-network ICT Overview Paper | 2023-28 Revenue Proposal__________________________________________________________
Our current approach to maintaining COTS applications is to refresh them when they reach their end of life
(EOL). This is based on the recommendations of the ISO16350 framework, which suggests taking a risk-
based approach for determining an application’s life cycle. It is also consistent with industry standards and
vendor recommendations. Our cloud based applications are maintained by the cloud provider as-a-service.
Given our existing approach to application maintenance is consistent with industry good practice, we have
forecast expenditure based on continuing this approach into the next regulatory period.
5.1.2. Infrastructure and Network ($17.8M)
This sub-category covers expenditure to maintain our corporate data network (CDN), which includes
routers, servers and data storage devices. Our CDN allows our staff across our offices, depots and other
remote sites to access corporate information, our intranet and internet, and internal files, essential digital
tools, such as Microsoft Office and Outlook, and communication and collaboration facilities, such as video
conferencing.
The period 2018 to 2023 saw minimal investment in CDN assets and infrastructure as ICT expenditure was
directed towards more critical areas. The resulting increased risk of business outages needs to be
remediated in the next regulatory period.
. Maintaining this aging technology
is expensive and runs the increasing risk of security threats, non-compliance and hardware failure.
We propose refreshing our CDN infrastructure and assets in the next regulatory period to mitigate this risk.
We would also move certain infrastructure to the cloud, in line with our current transition to a hybrid (mix of
on-premise and cloud) environment.
5.1.3. Bespoke Applications ($17.5M)
We currently have 17 legacy Bespoke applications that have been developed over the last 15 years. These
bespoke applications provide capabilities not offered by Commercial off the Shelf (COTS) applications and
enable key business activities, such as the planning and tracking of outages to High Voltage equipment,
supporting our protection relays, maintaining metering equipment and customer billing, and identifying
safety risks pertaining to work tasks.
However, these bespoke applications are becoming obsolete.
. Further, our current development platforms are inadequate and require
modernisation.
The investment proposed under this sub-category involves refreshing our bespoke applications with a
modern code base and implementing a secure development environment for all applications. Implementing
a secure development environment will help us manage any cyber coding vulnerabilities and refreshing
software with modern code will mean that our bespoke applications will no longer use an unsupported code
that is becoming obsolete.
5.1.4. Employee Enablement ($12.2M)
Our proposed approach to providing “employee enablement” services involve giving our staff the necessary
ICT devices (e.g. laptops and iPads), Microsoft Office software and telephony services to enable them to
do their daily work and collaborate effectively.

22 | Non-network ICT Overview Paper | 2023-28 Revenue Proposal__________________________________________________________
During the current regulatory period, we have seen a tremendous shift in the nature of work due to
restrictions arising from the COVID-19 pandemic requiring remote work. As a result, we have also seen the
rise of new collaboration tools, such as Microsoft Teams and Zoom, which are now in mainstream use
across the industry.
However, our current software restricts the digital tools available to our employees who, for example, are
currently unable to attend Microsoft Teams or Zoom meetings using their Transgrid devices. At the same
time, a number of core applications that support our enterprise are coming to end of life, when they will be
out of vendor support, creating security vulnerabilities, and increasingly obsolete.
We propose adopting the Microsoft 365 subscription model and migrating to Microsoft Exchange Online
and SharePoint Online. We will maintain our existing approach to procuring laptop and other devices, and
replacing the soon to be decommissioned Integrated Services Digital Network (ISDN) telephony solution
with a Session Internet Protocol (SIP) solution.
5.1.5. Data and Decisioning ($6.3M)
Due to a transitioning system landscape, we have gaps in our centralised availability of core data. The
resulting inconsistent data flow affects our business operations and our visibility of compliance. Additionally
revisions to our security posture resulting from the Critical Infrastructure Bills, requires us to invest in
improved data classification and governance.
Over the 2023-28 regulatory period we will implement an enterprise data model and a data governance
framework to lift data quality and integrity to a level that allows us to leverage sophisticated data solutions
such as predictive maintenance and advanced data analytics to support prudent decision making. The
increased data visibility provides a platform for additional insights and will refine and improve the way we
operate. It will allow for more informed decision making and better outcomes for our customers. This work
will provide automated and accurate information to simplify regulatory and financial reporting, unimpeded
by disconnected systems and manual workarounds. It will also improve service to and communication with
our customers.
In summary, the investment proposed under this sub-category involves implementing an enterprise data
model and data governance framework, and replacing our data repository with a modern solution.
5.1.6. Operational Evolution ($1.9M)
Over the next five years, we will be involved in the delivery of several large complex projects and joint
ventures with interstate partners. This represents a substantial shift in our business-as-usual work program,
which has historically comprised of smaller scale projects.
Our current project management system, Microsoft Project and Portfolio Management (PPM), has
significant limitations in managing both major and minor projects. It is a legacy system that will not be
supported by our current vendor after September 2021 and is already experiencing slow performance and
stability issues. It also does not provide many of the functionalities now standard for modern project
management systems. For example, the PPM cannot:
Provide budget and cash flow reports and forecasts
Control costs in major projects by releasing funds progressively over project life
Undertake detailed analysis of projects, including trend analysis, and
Record more than 10,000 tasks for a project, which is essential for major projects.

23 | Non-network ICT Overview Paper | 2023-28 Revenue Proposal__________________________________________________________
We propose replacing our existing PPM with an integrated hybrid cloud solution that incorporates the
industry standards system . We also intend
to expand our digital core capabilities to allow us to better optimise inventory, asset and workforce
management.
5.1.7. Customer Safety & Support ($1.0M)
Our current customer relationship management system (CRM), Consultation Manager, is used by our
Community Engagement team to engage with the thousands of community members, including landowners
and other stakeholders, affected by our expanding pipeline of major projects (including major ISP projects)
and the extensive and ongoing work required to maintain 13,000km of transmission lines. Much of the
information gathered by our CRM, including access permissions and conditions, is required by our field
staff to ensure work is conducted safely and legally.
However, field staff do not currently use Consultation Manager due to limitations in its functionality and
instead rely on information from the spatial system (TSS) instead. TSS is not integrated with Consultation
Manager. This means that our field staff, who interact daily with landowners and customers, may start jobs
or make decisions based on partial or incorrect information. This can create safety risks and precipitate
time consuming access disputes. Furthermore, our current website does not provide customers with
visibility to all our planned and current work. It also does not have modern functionalities, such as chat-bots
or interactive maps.
To address these issued, we intend to upgrade our current CRM system to an already available CRM
. We will also extend the functionalities of our current website to support multi-channel
engagement that will allow stakeholders self-service access to real time, tailored information.
5.1.8. Cyber Security ($11.9M)
The Federal Government has proposed legislation creating an enhanced regulatory framework, via the
Critical Infrastructure Bill 2021 and the proposed part 2 of the Bill (the draft Critical Infrastructure Protection
Bill 2022), that increases the security and resilience requirements of Australia’s critical infrastructure. This
builds on work completed by AEMO to develop the Australian Energy Sector Cyber Security Framework
(AESCSF). There are two measures for cyber security capability and maturity in the AESCSF, with different
timing expectations of when each level is compiled with:
Maturity Indicator Level (MIL) – there are four MILs, MIL-0 through MIL-3;
Security Profile (SP) – there are 3 alternate groupings of SP-1 to SP-3.
the proposed Critical Infrastructure Bills will require us to achieve an AESCSF SP rating of 3 and a MIL
rating of 3.
On 13 October 2021 the NSW State Government introduced the Energy Legislation Amendment Bill 2021
(NSW Bill). This NSW Bill has been legislated and will bring forward the AESCSF compliance timeframe
requirements of the Federal Critical Infrastructure Bills by 12 months.
Relevant compliance timings under the Bill are as follows:
Within 12 months of rule commencement comply with requirements to meet SP-1 of the AESCSF
Framework.
24 | Non-network ICT Overview Paper | 2023-28 Revenue Proposal__________________________________________________________
Within 24 months of rule commencement comply with requirements to meet SP-2 of the AESCSF
Framework (the earliest date for compliance is January 2024, or at the beginning of the 2023-28
regulatory period).
Within 60 months of rule commencement comply with requirements to meet SP-3 of the AESCSF
Framework.
Note that meeting the compliance requirements around data will also be covered under the Data and
Decisioning package.
5.2. ICT Package interdependencies
As mentioned in section 2.1, we require ICT investment to:
provide our staff with the necessary ICT support to perform their roles,
enhance our cyber security capabilities, and
enhance our digital capabilities in key priority areas.
Our ICT investments have been evaluated as a whole with consideration to what would be the most
efficient way to deliver, adjusted for our ability to plan around resources and availability and timing of
dependencies between different ICT packages. For example, our critical infrastructure replacement will be
prioritised to occur first along with security and compliance obligations. Our applications are prioritised
based on End of Life support impacts and risks. If we do not proceed with the proposed investments, then
there may be adverse impacts on our abilities to meet our obligations in the most cost effective manner or
to an acceptable risk level.
We discuss the interdependencies of the different ICT investment packages by theme in further detail
below. We set out our assessment of the interdependencies between individual packages in Attachment 3.
5.2.1. Supporting our staff with their daily roles
Four of our proposed investment packages are related to providing our staff with the necessary ICT support
to undertake their daily roles. These packages are as follows:
the Bespoke applications and application maintenance packages are both related to the refresh and
maintenance of the applications that our staff use to, among other things, manage our business and the
High Voltage Network
the infrastructure and network package involves the maintenance and refresh of our Corporate Data
network, which our staff uses to access applications, corporate documents, applications, the intranet,
Microsoft Office and Outlook etc. and
the employee enablement package sets out our proposed approach to providing ICT devices (e.g.
laptops and iPads), Microsoft office software, and telephony services to our staff.
These investments mainly cover the refresh of our current capabilities due to aging technology and End of
Life support for our existing hardware and software solutions. The refresh of these initiatives will also help
us meet our compliance to security and reliability requirements, as it will ensure that we continue to receive
support from our vendors and mitigate risks associated with failure of equipment and unavailability of
critical applications.
Our proposed ICT investments are designed to minimise rework and consolidate initiatives where possible
to streamline the delivery of initiatives. For example, the proposed Employee Enablement package
refreshes our communication and collaboration applications (Email, SharePoint, Microsoft Office) under a

25 | Non-network ICT Overview Paper | 2023-28 Revenue Proposal__________________________________________________________
single initiative taking advantage of favourable licencing agreements. This in turn will lead to a reduced
infrastructure footprint that will be required to be supported in our infrastructure and network package.
Another example is our proposed investment relating to the Application maintenance and Bespoke
applications packages. We intend to migrate to the cloud where appropriate, which reduces the
infrastructure footprint managed by the Infrastructure and Network package, and refresh applications to
modern versions and solutions, which means we will no longer need to support hard to maintain, outdated
technology.
The Infrastructure and Network package is the foundation on which all our capabilities reside. Though the
other packages will impact the footprint of our infrastructure investment, the maintenance of our Core Data
Network (CDN) is required for all of ICT systems to operate. The regular refresh of this network to maintain
currency is required for entire Transgrid business to operate, irrespective of what applications reside on it.
Similarly, the employee enablement package is also foundational to the other packages, as without laptops
or other devices, our staff cannot access any of our ICT services or capabilities.
5.2.2. Enhancing our cyber security capabilities
The Critical Infrastructure Bills detail a set of requirements that critical infrastructure providers will need to
meet within various timeframes of its passing. Our cyber security package puts forward the initiatives that
we need to be completed in order to comply with the current and proposed bills. It also lays the
foundational framework for how we will secure our network, infrastructure and applications in the future.
Cyber security is not binary concept. As such, the proposed investments in many of other packages have
also been designed to improve our cyber security capabilities. For example, our bespoke application
involves implementing a secure development environment, which will allow us to move away from manual,
ad-hoc testing of the cyber security of all our applications to an automated, systemic approach for testing.
Similarly, our proposed approach to refreshing and maintaining existing applications, Microsoft Office
software, and network and infrastructure assets involve moving away from outdated, unsupported solutions
to modern, supported solutions. This will help reduce the risk of a cyber-attack as supported solutions are
updated and patched by the relevant service provider on an ongoing basis.
5.2.3. Enhancing our digital capabilities in key priority areas
We have identified the need to expand the digital capabilities we have in the next regulatory period. The
relevant investments include:
operational evolution package OER, which involves:
- replacing our project management system with a modern solution – this will help us deliver the
several large complex projects we have on our forward work program, and
- expanding our capabilities to optimise our asset, workforce and inventory management.
the customer and safety package, where we propose to:
- upgrade our CRM to a modern solution to address limitations of the existing CRM, and
- improve the functionality of our website to support real time, multi-channel engagement with
stakeholders.
the data and decisioning package, where we propose to:
- replace our data repository with a modern solution – enabling the availability of data from our
refreshed application and ERP landscape

26 | Non-network ICT Overview Paper | 2023-28 Revenue Proposal__________________________________________________________
- improve the enterprise level availability of data for improved timeliness and accuracy in decision
making, and
- ensure improved data classification and governance for compliance with the Critical infrastructure
Bills.
These proposed investments build upon the capabilities we currently have, and the guidelines and security
frameworks set out in the cyber security package at an enterprise level. For example, our project
management system will need to be integrated with our other applications, and so depends on other
applications being maintained and refreshed. The proposed implementation of a secure development
environment in the bespoke application package will also ensure that the three packages to enhance our
capabilities are built on a secure foundation.
Similarly, the benefits we expected from our data and decisioning and customer and safety packages can
only be realised if they are integrated with data from other applications.

27 | Non-network ICT Overview Paper | 2023-28 Revenue Proposal__________________________________________________________
6. Regulatory obligations and capital governance
We have robust capital governance arrangements in place to ensure that our ICT spend is efficient and
prudent to meet our compliance obligations and to ensure that we support the delivery of our prescribed
transmission services.
This chapter explains our regulatory obligations, the capital governance framework used to develop our ICT
forecast, our investment governance process and portfolio optimisation process.
6.1. Regulatory obligations or requirements
Our key compliance obligations are derived from the National Electricity Rules (NER), our licence and new
cyber-security obligations:
NER – we are required to comply with all regulatory obligations under the NER, including provision of
data to AEMO
Licence – Licence Condition 7 (Data Security) of our Transmission Operator’s Licence requires that
personal, historical and current load data is held and accessible only in Australia, in accordance with
the Privacy Act. We must therefore use an Australian-based provider for any cloud-based products and
services, and
Cyber Security – the CI Act and the Critical Infrastructure Bills, together with AEMO’s AESCSF, the
Energy Legislation Amendment Bill 2021 (NSW) and the Ransomware Payments Bill 2021 imposes
security obligations on us and defines the cyber maturity level to be reached by Transgrid as a Critical
Infrastructure Provider of National Significance.
We apply a consistent compliance-based process across each investment class to determine our current
compliance obligations, identify material changes that require investment and evaluate least cost yet robust
solutions.
6.2. Strategies and framework
The key inputs to our capital program include: board direction through the business’ risk statement,
oversight and guidance; business plans; and ongoing stakeholder views, which are tested and refined as
we develop and manage our capital program.
Our proposal aligns with our corporate policies, frameworks and management systems. The following
support our ICT forecast and methodology:
ICT Strategy
IT and Security Frameworks, and
Options Evaluation Reports (OERs).
Key elements of these frameworks for our ICT capex are described below.
6.2.1. ICT Strategy
Our ICT Strategy document details our overarching strategic approach to ICT management and
investment, describing how we support the business to deliver network services in a rapidly evolving
energy and digital technology landscape. It discusses strategic drivers, sets out the demand and
requirements from the business and articulates a roadmap and program of work.

28 | Non-network ICT Overview Paper | 2023-28 Revenue Proposal__________________________________________________________
6.2.2. IT and Security Frameworks
ICT and Security use the following frameworks:
PRINCE2 - a structured project management methodology where projects are divided into manageable
and controllable stages
Information Technology Infrastructure Library (ITIL) - a set of best practices for transforming the
business and alignment with the ICT Strategy
Open Group Architecture Framework (TOGAF) version 9.2 - an enterprise architecture framework
which provides an approach for designing, planning, implementing and governing an enterprise
information technology architecture
Agile methodology - an iterative approach to managing software development into several phases. It
involves constant collaboration with stakeholders and continuous improvement at each stage
Enterprise Risk Management (ERM) Framework - for identifying and managing risk
AEMO’s AESCSF - which assesses cyber security maturity and uplift to strengthen cyber security in the
energy sector
Information Security Management System (ISMS) ISO27001 - defines and manages controls a
company needs to make information assets more secure, and
Sherwood Applied Business Security Architecture (SABSA) - a framework for enterprise security
architecture and service management.
6.2.3. Option Evaluation Reports
These documents identify the investment need and provide an economic evaluation to justify the
investment and determine its optimum timing. We consider the costs and benefits of various options and
sensitivities around key assumptions to test the robustness of the investment decision. The OERs will also
identify options that were considered but not progressed further, usually due to legislative or security
requirements. As such, there are some OERs where only one option has been put forward.
6.3. IT Governance Framework
Our IT Governance Framework sets out our process used to monitor and control key information
technology capability decisions to ensure the delivery of value to key stakeholders in an organisation. It
sets out the structure of who makes decisions, the process of how IT investment decisions are made, and
how the results of these processes and decisions will be monitored, measured and communicated.
It requires investment decisions to pass through two internal decision gates to ensure delegated financial
approval is applied and investment governance. Decision Gate 1 (DG1) is a requirement for project
commencement approval, and Decision Gate 2 (DG2) is a requirement for project delivery approval.
For our ICT capex we use a tailored implementation of the PRINCE2 project method to ensure ICT projects
are managed in accordance with Transgrid’s policies and procedures and are efficiently delivered to the
team responsible for supporting the ICT service.
We use a consistent, structured approach in the way that ICT projects are initiated, planned, implemented
and finalised. This will improve our ability to adapt to changing circumstances in a timely manner, whilst
ensuring the fiscal responsibility is maintained and quality outcomes are achieved.
All projects managed by ICT use the Project Management lifecycle described below:

29 | Non-network ICT Overview Paper | 2023-28 Revenue Proposal__________________________________________________________
Pre-project: the pre-project stage focuses upon the identification and validation of the project need and
approval of a project mandate
Start-Up Stage: the objective of the start-up stage is to:
- confirm there is business justification for initiating the project
- define and confirm the scope of the project
- analyse the ways a project can be delivered and select a project approach
- that the key roles in the project have been allocated and agreed
- plan the initiation stage
- develop the DG1 (Project Brief) and seek approval according to Transgrid’s financial delegations
Initiation Stage: in this stage the following occurs:
- the requirements are gathered, all stakeholders have with regard to the scope defined in the
business case and defining the work that needs to be done to deliver the project before committing
to significant spend
- the functional and non-functional requirements from the business case are confirmed
- a high design of the solution is prepared and any required procurement activities undertaken
- the DG2 (Project Initiation Document) is developed and approval is sought according to our
financial delegations
Management Stage(s): the section of a project(s) that the project manager is to manage on behalf of
the Steering Committee at any one time, at the end of which the Steering Committee will review
progress to date, the business case, risks and the next stage plan, in order to decide whether to
continue with the project. A management stage consists of the following processes:
- Controlling a Stage (CS)
- Managing Product Delivery (MP), and
- Managing Stage Boundaries (SB)
Close Project Stage: confirm acceptance of the project products, that the objectives set out in the DG2
(or approved changes) or that the project has nothing more to contribute.
6.4. Portfolio optimisation process
We take a whole-of-portfolio view of the information technology risk, ranking the projects in our forecast ICT
program to optimise the portfolio to:
deliver technology solutions that support the optimisation of network investments
ensure consistency with historical investments, and
smooth the investment profile to consider deliverability and financial impacts.
We use the Transgrid’s Risk Management Framework to mitigate risk and to ensure we remain aligned with
corporate risk appetite and help us reconcile our bottom-up build of risks.

30 | Non-network ICT Overview Paper | 2023-28 Revenue Proposal__________________________________________________________
6.4.1. Delivering technology solutions that optimise the delivery of network investments
Changes in the energy market have seen a steady rise in the take up of renewable energy, requiring us to
plan and manage our technologies as the situation demands. To ensure future network investments are
optimal and underpinned by robust analysis, we use technology solutions that support Repex and Augex
modelling.
We also work collaboratively to support the network needs of the business, facilitating, prioritising and
delivering ICT solutions that maximise customer benefits from the investment. The collaborative process
creates an Optimised Investment List. This list allows us to quickly demonstrate projects that would be left
out under various capital constraints, helping stakeholders to understand the impact of different capex
levels on services outcomes.
6.4.2. Ensuring Consistency with Historical Investments
As part of our investment review and governance process, we assess each proposed investment against
the backdrop of historical investment levels for the investment class and the portfolio as a whole. This
ensures we do not overstate future investment requirements by implicitly applying a more stringent risk
criteria for forecast investment than what we have proven that we can manage in the past.
This process ensures future investment requirements are driven by new and emerging needs for
investment, and not by a change in Transgrid’s risk appetite – unless these are clearly driven by changes in
strategic objectives of the business as articulated in the Business Plan.
6.4.3. Investment profile smoothing
Analysis of internal and external resource capacity has informed the timing of projects to ensure that they
fall within the expected resourcing constraints of the industry. In some cases, it may be possible to
supplement the Australian workforce with qualified international resources to increase capacity to deliver
the most critical projects. Otherwise, it may be necessary to defer some work and manage risks in the
interim through opex based solutions and/or less efficient staging of capital work.
In preparing our 2023-28 forecast, we reviewed our resourcing approach against the internal and external
market capacity to ensure that our proposed portfolio can be delivered efficiently. This includes
consideration of products in the market and previous implementations of similar solutions to ensure delivery
timeframes and enable the resource efficient delivery of the portfolio.

31 | Non-network ICT Overview Paper | 2023-28 Revenue Proposal__________________________________________________________
7. Forecasting method, inputs, models and assumptions
This chapter explains our forecasting methodology, the inputs to that methodology and the key
assumptions that are reflected in our ICT forecasts for the 2023-28 regulatory period. We discuss the
application of these forecasting methodologies for each expenditure category in this chapter.
7.1. Our ICT forecasting method
ICT is driven by protecting our information and systems, managing technology obsolescence, and
supporting efficient network asset management and business support functions.
Our forecasting method is aligned with our investment process and follows PRINCE2 methodology and its
principles. In demonstrating this alignment, we seek to ensure we are forecasting according to good ICT
industry practice with a program of works that is based on prudent and efficient expenditure decisions, in a
consistent manner that provides greater levels of transparency for stakeholders.
To forecast our ICT volumes for both unitised programs and the scope-of-work for non-united projects, we
analyse our Fixed Asset Register to identify assets which have reached their end of asset life and need to
be upgraded or replaced. For every investment class we analyse the performance of an application
including meeting the business needs, application performance and support.
The ICT forecasting method includes the following steps:
identifying applications that have reached their end of life according to the Information Technology
Renewal and Maintenance Strategy. The end of useful asset life for software and hardware is based on
the vendor’s asset lifecycle or risk based assessment.
performing an application assessment including performance, support costs, market trends and
analysis, strategic alignment and business need, and
developing a cost model to cost the package of work. The cost model is based on known software
licenses and hardware costs, application support costs, project resources including internal labour,
consultants and vendors, and previous costs to implement a similar solution. Costs are developed from
a bottom up perspective.
The process is repeated for each ICT investment class7 to form the program of works. We adjust scope or
timing of the program to align with other capex projects / programs and constraints from business planning
processes to ensure deliverability and optimised outcomes.
7.2. Risk types
Economic justification of ICT expenditure to address an identified need is supported by risk streams, to
allow the costs of the project or program to be assessed against the value of the avoided risks and costs.
The risk categories for ICT justifications include:
Work, Health and Safety
Reputation, community and media
Compliance and Regulation
7 Bespoke Applications, Application Maintenance, Customer Safety and Support, Data and Decisioning, Employee Enablement, Infrastructure and Network, Operational Evolution and Cyber Security.

32 | Non-network ICT Overview Paper | 2023-28 Revenue Proposal__________________________________________________________
Customer/Reliability
Financial
People/Industrial Relations, and
Environment.
7.3. Risk models
We commence our risk assessment by utilising the Transgrid Risk Management Framework. At a project
level, our ICT teams follow our ICT Project Management Risk process, as outlined in ‘AS/NZS ISO
31000:2009 Risk Management – Principles and Guidelines’.
In our risk modelling, we consider the elements below. This provides moderated, expected risks which are
then used in economic evaluation assessments to justify our ICT forecast.
The process we use for risk involve the following elements:
Establishing the context: identify the background, scope, underlying assumptions and objectives for
conducting the Risk Assessment.
Identifying Risk: identify the risk source which may prevent, delay or enhance the achievement of the
project objectives.
Risk Workshops: If required.
Analyse Risk: to determine the risk rating. The assessment (qualitative and quantitative) is based on
the Residual Risk as defined below:
- Inherent Risk: where controls are excluded in the management of the risk, the risk rating to be
applied is based on the worst case outcome should the risk arise, assuming controls have not been
implemented or have failed.
- Residual Risk: where controls are currently applied to manage the risk, the risk rating to be applied
is based on the current controls and their level of effectiveness.
- Planned Risk: where controls and treatment strategies are planned to be applied to manage the
risk, the risk rating to be applied is based on the planned controls and their level of effectiveness.
- Qualitative Assessment: Qualitative assessment involves the use of predefined scales to assess
the probability and impact of a risk. These scales shall be used during risk identification workshops
to assess the identified risks. All risks shall continue to be assessed using qualitative assessment
throughout their life.
- Qualitative Analysis: This will produce a qualitative rating for each risk based on the likelihood and
impact values selected. When the two values are multiplied they are assigned a rating based on
Transgrid’s probability impact matrix.
- Treat Risks: Develop and implement effective treatment strategies and action plans to mitigate the
risk to a tolerable level.
- Monitor and Review: This phase involves the ongoing monitoring of the process and must include
the following steps:
> adding additional risks as they are identified
> tracking, updating and closing completed treatments

33 | Non-network ICT Overview Paper | 2023-28 Revenue Proposal__________________________________________________________
> reviewing, and if appropriate, amending the risk assessments
> closing risks that are not going to eventuate or, where risks have occurred, and
> identifying risks which need to be brought to senior management’s attention.
- Communicate and Consult: should take place during all stages of the risk management process.
7.4. Key assumptions
Clause SA6.1.1 (4) of the Rules requires us to list the key assumptions that underpin our capex forecast,
which are stated in Chapter 8 of our Revenue Proposal document.
7.5. Risk tools and templates
We utilise a number of different templates and plans that are available to Transgrid employees to evaluate,
qualify and quantify, mitigate and track risks. These are available for use from the internal Transgrid
intranet.
7.6. Unit costs
Our ICT forecast comprises:
Unitised projects– these projects are forecast using standardised unit rates based on recent costs, and
Non-unitised projects – these are individually costed projects, where the costs inputs are similar to
those of recently implemented projects of similar scope.
All our capex for both unitised and non-unitised projects are estimated using a detailed cost model Excel
spreadsheet and the outputs form the basis of our capex forecast for 2023-28.
7.6.1. Unitised projects
ICT forecast the costs of unitised programs by multiplying project activities by unit costs. For unitised
projects, the unit rates are based on:
our historical costs with movement in unit costs determined from most recent costs as recorded in
Transgrid’s Project and Portfolio Management System (PPM)
labour rates, including burdening and on-costs for internal resources, as provided by Finance
software license and maintenance costs, and
contract unit rates from our service providers and consulting companies.
7.6.2. Non-unitised projects
Project costs are developed for work that has a higher level of complexity, which means that it cannot be
costed upfront based purely on unitised rates. Our non-unitised projects require tailored cost estimates. For
non-unitised scoped projects ICT develop costs based on a previous implementation with similar scope.
The cost estimates include project activities which identifies internal and external labour costs.

34 | Non-network ICT Overview Paper | 2023-28 Revenue Proposal__________________________________________________________
7.7. Cost escalation
The costs we incur in delivering ICT services do not always increase in line with the basket of goods and
services used by the Australian Bureau of Statistics (ABS) to calculate the consumer price index (CPI).
Therefore, in order to ensure that we are compensated for appropriate real cost increases that we will incur
in acquiring the inputs necessary to provide services, we have engaged BIS Oxford Economics to forecast
real increases in the cost of labour costs that we expect to incur during the 2023-2028 regulatory period.
Although we consider that real costs increases for materials are likely to grow faster than inflation over the
2023–28 period, we have not presently included any real materials cost escalation.
We have applied the labour cost escalators to our capex forecasts using appropriate weightings based on
an estimated use of internal labour services to deliver work programs. While our ICT capex forecasts
include the impact of cost escalation, our analysis in preparing the forecasts is conducted without the effect
of cost escalation.
For example, the detailed analysis is conducted exclusive of cost escalators for the forthcoming regulatory
period. To assist the AER, however, each of the capex overview papers includes a reconciliation table
showing the escalated forecasts submitted in the Reset RIN template. The table below shows the
aggregate impact of the cost escalators on our ICT Capex forecast for the forthcoming regulatory period.
Table 7-1: Impact of labour and materials escalation ($Million)
2023-24 2024-25 2025-26 2026-27 2027-28 Total
Total un-escalated ICT ($real 2023-23) 25.1 19.1 18.1 13.5 10.5 86.3
Escalation for material and labour (0.0) 0.1 0.2 0.2 0.2 0.6
Total escalated ICT 25.0 19.2 18.3 13.7 10.7 86.9
Further details regarding our cost escalators are provided in the supporting document titled “BIS Oxford
Economics - Labour Cost Escalation Forecast to 2027-28”.
7.8. Overheads
Overhead activities, such as corporate support, are needed to support ICT. The costs of those activities are
capitalised in accordance with our Capitalisation Policy8 and relevant accounting standards, including
AASB 116.
Capitalised overheads are split between network and corporate overheads, consistent with the AER’s RIN
definitions. We have forecast our overhead costs using the AER’s default approach based on:
75 per cent of capitalised overheads are fixed based on the most recent available year of actual capex
(i.e. 2021-22), and
25 per cent of capitalised overheads vary with direct capex.9
The capitalised overhead forecast related to ICT is set out below. As shown in the table, changes to total
escalated ICT from one year to the next affects the level of capitalised overheads allocated to ICT.
8 Expenditure Capitalisation Procedure, Transgrid, 2018. 9 This approach was adopted by the AER in its April 2021 decisions for the Victorian electricity distribution networks.

35 | Non-network ICT Overview Paper | 2023-28 Revenue Proposal__________________________________________________________
Table 7-2: Addition of capitalised overheads ($Million, Real 2022-23)
2023-24 2024-25 2025-26 2026-27 2027-28 Total
Total escalated ICT 25.0 19.2 18.3 13.7 10.7 86.9
Capitalised network overheads - - - - - -
Capitalised corporate overheads
0.5 0.3 0.3 0.3 0.2 1.6
Total escalated ICT with overheads
25.5 19.5 18.6 14.0 10.9 88.5
Capitalised overheads are forecast within our “2023-28 Capital Expenditure Model”.
7.9. Opex step change
Capex to opex step changes are assessed at the project and program justification level, not at the portfolio
level. All opex requests are based on the total five year regulatory period and not annualised.
ICT require opex step changes for the following reasons:
1. Federal legislation has changed our security requirements. The impact of this legislation on ICT’s opex
budget has been captured in the proposed $18.6 million opex step change10.
2. The International Financial Reporting Standards Foundation (IFRS Foundation) has introduced a new
ruling, which would change the accounting treatment of ICT expenditure. Under the new ruling,
clouding computing costs will be expensed as opex rather than treated as capex, which would be
depreciated over a number of years. We have proposed a $20.2 million opex base year adjustment to
normalise the impact of this ruling, noting that it is cost neutral as there is a corresponding drop in
capex.
7.10. Validation
7.10.1. Internal validation
We reconcile our bottom-up build of ICT forecasts with top-down reconciliation methods including:
using market resource rates for Australian labour unit rates and technology service panel offshore rates
based on competitive market tests undertaken in early 2020
using Labour/Material/Expense based on actuals for similar projects in the current regulatory period,
and
broader business review of OERs by the ICT Portfolio Board.
7.10.2. External validation
We engage external independent consultants to verify and validate our processes and forecasts:
recent competitive market pricing from tenders received in 2020 and 2021
10 Cyber Security opex step change

36 | Non-network ICT Overview Paper | 2023-28 Revenue Proposal__________________________________________________________
benchmarking market rates with 3rd party advisors
3rd party advice on market trends and risks, and
Utilities Industry IT benchmarking against other utilities based on data obtained from the AERs
Regulatory Information Notices.
7.11. Addressing uncertainty in investment requirements
Uncertainty is inherent in any forecast and our ICT forecasts are no different. To avoid adding additional
risk-costs to our projected expenditure requirements, our forecasting approach addresses uncertainty
through several mechanisms to ensure that we do not overestimate our expenditure requirements. These
include:
use of industry standard technology asset lifecycles for determining prudent timeframes for investment
benchmarking market rates with 3rd party advisors
3rd party advice on market trends and risks
clear visibility of forecasts containing higher degrees of uncertainty and risk mitigation plan that’s been
applied to minimise the uncertainty in forecast, and
reuse of previous project actuals for comparison and estimates for cyclical initiatives.

37 | Non-network ICT Overview Paper | 2023-28 Revenue Proposal__________________________________________________________
8. Forecast expenditure by RIN category
This chapter provides a high-level explanation of the forecast capex for each ICT category specified in the
RIN template.
8.1. RIN categories
Table 8-1 below lists each RIN category and the forecast capex over the 2023-28 regulatory period.
Attachment 2 provides a high-level explanation of the forecast expenditure for each ICT category.
Table 8-1: Total escalated capex forecasts by RIN category
ICT category Recurrent or non-recurrent
Expenditure forecast
($M, 2023-28)
Percentage of ICT
Application Maintenance Recurrent 18.3 21.0%
Bespoke Applications Recurrent and Non-recurrent 17.5 20.1%
Customer Safety and Support Non-recurrent 1.0 1.1%
Data and Decisioning Non-recurrent 6.3 7.3%
Employee Enablement Recurrent and Non-recurrent 12.2 14.1%
Infrastructure and Network Recurrent 17.8 20.4%
Operational Evolution Recurrent and Non-recurrent 1.9 2.2%
Subtotal 75.0 86.3%
Cyber Security Recurrent and Non-recurrent 11.9 13.7%
Total 86.9 100.0%
38 | Non-network ICT Overview Paper | 2023-28 Revenue Proposal__________________________________________________________
Attachment 1 – Supporting documentation
The following documents support our ICT submission for the 2023-28 regulatory period.
Policies and Governance
IT Governance Framework
Strategies & Plans
ICT Strategy
Business cases, scope of work and cost estimates (justifications supporting forecast ICT)
OER-Data and Decisioning
OER-Application Maintenance
OER-Bespoke Applications
OER-Operational Evolution
OER-Infrastructure and Network
OER-Employee Enablement
OER-Customer Safety and Support
OER-Cyber Security

39 | Non-network ICT Overview Paper | 2023-28 Revenue Proposal__________________________________________________________
Attachment 2 - High level explanation of ICT forecast capex projects
Figures presented in the table below exclude overheads and are in $2022-23.
Application Maintenance (recurrent over 2023-28, expected recurrent in subsequent periods)
Table A2 - 1 Application Maintenance summary
Application Maintenance
Description We rely heavily on commercial off the shelf (COTS) applications and cloud based applications for operational activities to deliver a safe and reliable electricity network. These applications deliver efficiency by lowering our operational cost and help us meet our regulatory requirements. These software applications are in conjunction with applications that allow Transgrid and its employees to operate day to day in providing services internally and to our customers.
Deliverables
Maintaining the security, interoperability and functionality of these applications requires on-going patching (from a functionality and security perspective), refreshing and upgrading of them to meet our obligations to remain as a prudent and efficient operator in the industry. These applications function to support and deliver our existing capability to our customers and provide a foundation to build on our capabilities.
Main drivers of expenditure
To keep our business functioning. This is the minimum amount of work required to keep the ICT applications functioning and allowing staff to perform their work.
Expenditure forecasting methodology
Based on historical work efforts for maintenance activities, patching and upgrades. Guidelines from vendors.
Historic and forecast expenditure
The historical and forecast expenditure for 2018 to 2023 is $40.8M (Real $2022-23, excluding overheads).
Forecast from 2023 to 2028 $18.3M (Real $2022-23, excluding overheads).
Principal reasons for proposed expenditure
To maintain our existing ICT applications and allow it to continually function to support the company and its business.
Benefits
To maintain and provide capabilities in Transgrid’s application suite. Maintenance of the core functionality of Transgrid’s application suite to allow staff to continue to perform day to day activities and service customers.
Bespoke Applications (recurrent and non-recurrent over 2023-28, expected recurrent in subsequent periods)
Table A2 - 2 Bespoke Applications summary
Bespoke Applications
Description It is critical that our bespoke applications are developed, maintained and modernised to avoid inadvertently creating security vulnerabilities or performance issues due to lack of vendor support and/or skilled resources.
Deliverables Maintaining the security, interoperability and functionality of these bespoke applications requires on-going patching (from a functionality and security perspective), refreshing and upgrading of them to meet our obligations to remain

40 | Non-network ICT Overview Paper | 2023-28 Revenue Proposal__________________________________________________________
Bespoke Applications
as a prudent and efficient operator in the industry. These bespoke applications function to support and deliver our existing capability to our customers and provide a foundation to build on our capabilities.
Main drivers of expenditure
To keep our business functioning. This is the minimum amount of work required to keep the ICT bespoke applications functioning and allowing staff to perform their work.
Expenditure forecasting methodology
Based on historical work efforts for maintenance activities, patching and upgrades. Guidelines from vendors.
Historic and forecast expenditure
The historical and forecast expenditure for 2018 to 2023 is $0.4M (Real $2022-23, excluding overheads).
Forecast from 2023 to 2028 $17.5M (Real $2022-23, excluding overheads).
Principal reasons for proposed expenditure
To maintain our existing ICT bespoke applications and allow it to continually function to support the company and its business.
Benefits To maintain and provide capabilities in Transgrid’s bespoke application suite. Maintenance of the core functionality of Transgrid’s application suite to allow staff to continue to perform day to day activities and service customers.
Customer Safety and Support (non-recurrent over 2023-28, expected recurrent in subsequent periods)
Table A2 - 3 Customer Safety and Support summary
Customer Safety and Support
Description Our current CRM system, Consultation Manager, is used by our Community Engagement team and contains information needed by our field staff, such as access permissions and conditions. However, our field staff do not use this CRM system due to limitations in its functionality. This results in inefficient practices in relation to making multiple visits to sites and in increased risk to the safety of our staff and community from a lack of accurate information on a site’s situation. Further, we have identified the need to improve the functionality of our website.
Deliverables
We propose to enhance the customer experience through new digital services and enabling new customer and community communication pathways. This option proposes to implement the following capabilities:
Integrated Property and Consultation Management System: This solution would allow us to manage both information related to property and community in one system. It would leverage our existing property management/geo-spatial tool and implement additional module to provide functionality to manage and track customer engagements, communication and agreements. This will provide users with a holistic view of our interactions with stakeholders and land and property information in one centralised system. Our staff would have a greater view and access to information to assist with planning both operational and

41 | Non-network ICT Overview Paper | 2023-28 Revenue Proposal__________________________________________________________
Customer Safety and Support
maintenance work, property access plans, engaging with customers and ongoing relationship with landowners.
Property Information Aggregation System: Implement a tool that is able to aggregate information from source systems to provide access to all relevant information prior to seeking access to the property, such as geo-tech info, property agreements, heritage information, biosecurity measures, and native title. This solution would have an additional component, whereby it could replicate information captured internally, which could be made publicly available and displayed on our corporate website and other external facing digital channels, for use by customers.
Objectives
The objective of this initiative is to allow us enhance the customer experience through new digital services and enabling new customer and community communication pathways.
Main drivers of expenditure
To consolidate and make accessible accurate information between us and our customers, including land owners.
Historic and forecast expenditure
There is no historical and forecast expenditure for 2018 to 2023 because this OER is delivering new capability for our business.
Forecast from 2023 to 2028 $1.0M (Real $2022-23, excluding overheads).
Principal reasons for proposed expenditure
See Description above.
Benefits
Improving Community and Landowner Management is critical to our ongoing success, business operations and for safely carrying out maintenance works.
Data and Decisioning (non-recurrent over 2023-28, expected recurrent in subsequent periods)
Table A2 - 4 Data and Decisioning summary
Data and Decisioning
Description There are increased compliance requirements stemming from the Critical Infrastructure Bills that require an improved data classification and governance.
Deliverables
Create an enterprise data model enabling an integrated view and understanding of how data is used across the business. Design and implement a holistic data governance framework across the business network to ensure consistency and integrity of the data into the future. It includes the connection of financial and asset information for regulatory reporting purposes, as well as ensuring availability of data to support field operations. It also includes the connection and utilisation of information from IoT to support Asset and Community Safety initiatives, leveraging a centralised reporting intelligence capability in a cloud-based reporting and analytics platform.
Objectives
Using data to enable us to provide timely, quality information to our staff and customers and leverage this to improve our decision making abilities across all areas and meet its obligations in relation to data integrity and security. These changes will enable us to meet our regulatory and compliance obligations under the new Critical Infrastructure Bills.

42 | Non-network ICT Overview Paper | 2023-28 Revenue Proposal__________________________________________________________
Data and Decisioning
Main drivers of expenditure
Meet our regulatory and compliance obligations under the Critical Infrastructure Bills. Improve the data and reporting platform to provide more accurate reporting, better insights and decision making for the network business.
Expenditure forecasting methodology
Expenditure forecast methodology is based on bottom up costs using the previous data and reporting implementation costs as a reference.
Historic and forecast expenditure
The historical and forecast expenditure for 2018 to 2023 is $1.2M (Real $2022-23, excluding overheads).
Forecast from 2023 to 2028 $6.3M (Real $2022-23, excluding overheads).
Principal reasons for proposed expenditure
Regulatory and Compliance Obligations under the Critical Infrastructure Bills by implementing a data framework to improve data classification, governance, compliance and management to both maintain and extent the flow of data between systems and inform business operations. Fix ongoing issues relating to the current state of data in our environment to increase accuracy, availability and efficiency. These benefits will flow onto the performance of our systems and information we provide to our customers and regulators and performance of our staff.
Benefits See above.
Employee Enablement (recurrent and non-recurrent over 2023-28, expected recurrent in subsequent periods)
Table A2 - 5 Employee Enablement summary
Employee Enablement
Description Employee enablement OER involves providing our staff with the necessary ICT devices (e.g. laptops and iPads), Microsoft Office software and telephony services to enable them to do their work and collaborate effectively.
Deliverables Procurement of ICT devices, migration to Microsoft Office 365, Exchange Online and SharePoint Online, and replace soon to be decommissioned telephony solution.
Main drivers of expenditure
Modernising the workplace to enable staff to work from anywhere at any time.
Expenditure forecasting methodology
Estimates based on workload reduction through automation.
The implementation of industry standard tooling that is available through references and knowledge base.
Device management will be a step change from capex to opex, calculated by user base population as a service.
Historic and forecast expenditure
The historical and forecast expenditure for 2018 to 2023 is $1.9M (Real $2022-23, excluding overheads).
Forecast from 2023 to 2028 $12.2M (Real $2022-23, excluding overheads).
Principal reasons for proposed expenditure
Targeted investment in modern end user tools will enable more effective and efficient collaboration between our employees and our partners.
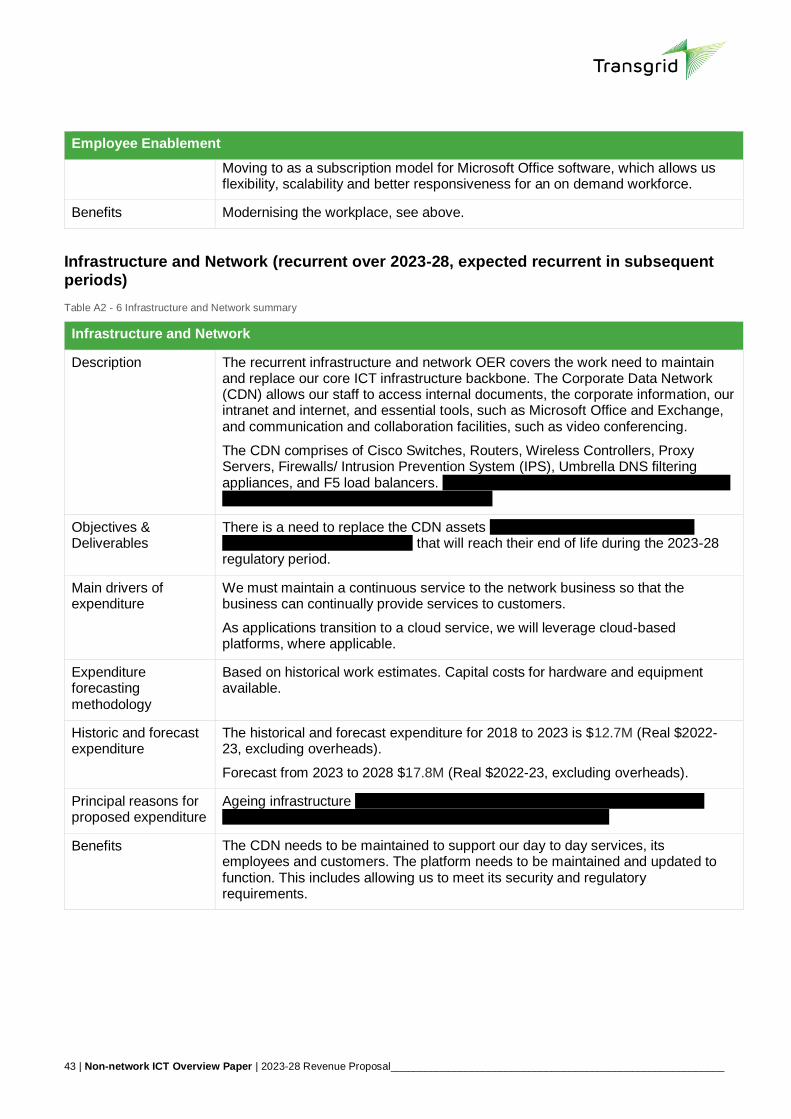
43 | Non-network ICT Overview Paper | 2023-28 Revenue Proposal__________________________________________________________
Employee Enablement
Moving to as a subscription model for Microsoft Office software, which allows us flexibility, scalability and better responsiveness for an on demand workforce.
Benefits Modernising the workplace, see above.
Infrastructure and Network (recurrent over 2023-28, expected recurrent in subsequent periods)
Table A2 - 6 Infrastructure and Network summary
Infrastructure and Network
Description The recurrent infrastructure and network OER covers the work need to maintain and replace our core ICT infrastructure backbone. The Corporate Data Network (CDN) allows our staff to access internal documents, the corporate information, our intranet and internet, and essential tools, such as Microsoft Office and Exchange, and communication and collaboration facilities, such as video conferencing.
The CDN comprises of Cisco Switches, Routers, Wireless Controllers, Proxy Servers, Firewalls/ Intrusion Prevention System (IPS), Umbrella DNS filtering appliances, and F5 load balancers.
Objectives & Deliverables
There is a need to replace the CDN assets that will reach their end of life during the 2023-28
regulatory period.
Main drivers of expenditure
We must maintain a continuous service to the network business so that the business can continually provide services to customers.
As applications transition to a cloud service, we will leverage cloud-based platforms, where applicable.
Expenditure forecasting methodology
Based on historical work estimates. Capital costs for hardware and equipment available.
Historic and forecast expenditure
The historical and forecast expenditure for 2018 to 2023 is $12.7M (Real $2022-23, excluding overheads).
Forecast from 2023 to 2028 $17.8M (Real $2022-23, excluding overheads).
Principal reasons for proposed expenditure
Ageing infrastructure
Benefits
The CDN needs to be maintained to support our day to day services, its employees and customers. The platform needs to be maintained and updated to function. This includes allowing us to meet its security and regulatory requirements.

44 | Non-network ICT Overview Paper | 2023-28 Revenue Proposal__________________________________________________________
Operational Evolution (recurrent and non-recurrent over 2023-28, expected recurrent in subsequent periods)
Table A2 - 7 Operational Evolution summary
Operational Evolution
Description This OER involves replacing our current project management system, Microsoft Project and Portfolio Management (PPM) with a modern project management solution . This will help us deliver our forward work program, which has several large, complex projects, on time and on budget.
This OER will also expand our digital core capabilities to allow us to better optimise inventory, asset and workforce management.
Deliverables
A new project management solution
Improved capability to optimise inventory, asset and workforce.
Objectives
Extensions to Oracle ERP allow us to add on standard capabilities such as EPM and Project Management capabilities, providing industry standard tools to the benefit of our workforce and asset/inventory management.
Main drivers of expenditure
Provide project management capability to enable us to deliver all types projects and scale.
Expenditure forecasting methodology
Based on historical estimates for similar activities.
Historic and forecast expenditure
The historical and forecast expenditure for 2018 to 2023 is $0.3M (Real $2022-23, excluding overheads).
Forecast from 2023 to 2028 is $1.9M (Real $2022-23, excluding overheads).
Principal reasons for proposed expenditure
Improve capabilities and build on the current platform capabilities implemented in the 2018-23 regulatory period.
Benefits
Building on the 2018-23 regulatory period investment to cater to changing processes which will be reflected in implementing new capability.
Cyber Security (Recurrent and non-recurrent over 2023-28, expected recurrent in subsequent periods)
Table A2 - 8 Cyber Security summary
Cyber Security
Description Organisations like Transgrid are becoming more and more reliant on technology, adopting cloud services and including the automation of processes. With this greater adoption of technology, the cyber risks to the organisation increases. Cybersecurity related attacks have not only become more commonplace, complex and diverse, but also more damaging and disruptive.
The Federal Government has new legislation creating an enhanced regulatory framework, via the Critical Infrastructure Bills, that increases the security and resilience requirements of Australia’s critical infrastructure. Transgrid’s security strategy had already resulted in the implementation of controls and capabilities to assist with managing the changing threat landscape.

45 | Non-network ICT Overview Paper | 2023-28 Revenue Proposal__________________________________________________________
Cyber Security
.
the Critical Infrastructure Bills will require us to achieve an AESCSF Security Profile (SP) rating of 3 and a MIL rating of 3.
Deliverables
Our existing systems need to be refreshed or replaced with current technology in the 2023-28 regulatory period to meet new regulatory obligations to mitigate against emerging cyber security threats that have the potential for catastrophic failure of high voltage network assets and/or major loss of supply.
Objectives
We continue with running and maintaining the current investments in security and investigate and enhance a number of security solutions to assist in meeting the proposed legislative changes.
Main drivers of expenditure
The Critical Infrastructure Bills embed preparation, prevention and mitigation activities into the business-as-usual operation of critical infrastructure assets.
The Critical Infrastructure Bills, together with AEMO’s AESCSF, imposes positive security obligations and defines the cyber maturity level to be reached by us as a Critical Infrastructure Provider of National Significance.
The NSW State Government legislated the Energy Legislation Amendment Bill 2021 (NSW Bill). It is anticipated that the NSW Bill will bring forward the AESCSF compliance timeframe requirements of part 2 of the Federal Critical Infrastructure Bill by 12 months.
An overhaul of current cyber capabilities (process and technology) is required to align maturity across our cyber capabilities and to remain compliant with changing regulatory obligations.
Expenditure forecasting methodology
Expenditure forecast methodology is based on bottom up costs using the similar security implementation costs and 3rd party expertise as a reference.
Historic and forecast expenditure
The historical and forecast expenditure for 2018 to 2023 is $10.1M (Real $2022-23, excluding overheads).
Forecast from 2023 to 2028 is $11.9M (Real $2022-23, excluding overheads).
Principal reasons for proposed expenditure
To continue to perform, maintain current security functions while also being able to enhance, upgrade and implement solutions to keep our ICT environment secure, to guard against malicious activities and meet current and future government mandated regulations.
Benefits
Compliance with new regulatory obligations including alignment with proposed levels of maturity (MIL ratings).
Ongoing compliance with licence obligations.
Avoidance of regulatory breaches and associated non-compliance fines and penalties.
Avoidance of penalties associated with breach of licence conditions.
Improved speed in identifying and remediating vulnerabilities, protecting our network and our customers.

46 | Non-network ICT Overview Paper | 2023-28 Revenue Proposal__________________________________________________________
Cyber Security
Reduction in risk of interruption of electricity supply to Eastern Australia due to cyber security incidents.
Enabling more efficient, secure business outcomes by the adoption of cloud-based services and other initiatives.
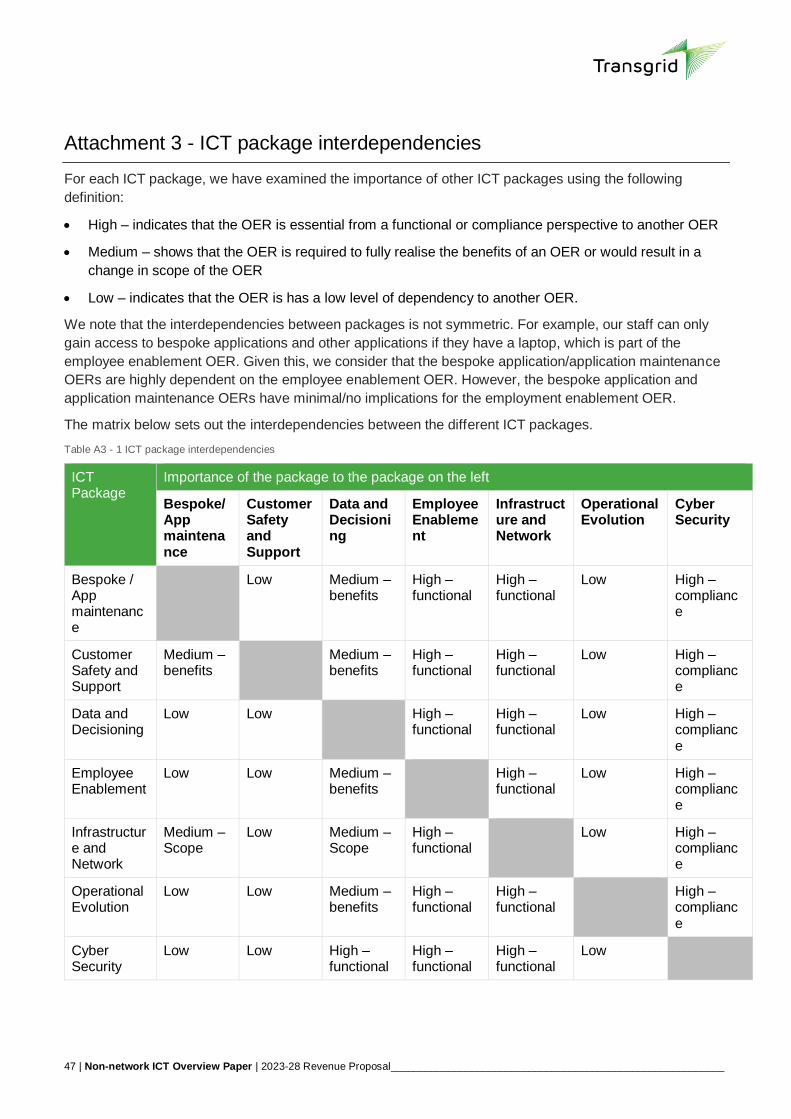
47 | Non-network ICT Overview Paper | 2023-28 Revenue Proposal__________________________________________________________
Attachment 3 - ICT package interdependencies
For each ICT package, we have examined the importance of other ICT packages using the following
definition:
High – indicates that the OER is essential from a functional or compliance perspective to another OER
Medium – shows that the OER is required to fully realise the benefits of an OER or would result in a
change in scope of the OER
Low – indicates that the OER is has a low level of dependency to another OER.
We note that the interdependencies between packages is not symmetric. For example, our staff can only
gain access to bespoke applications and other applications if they have a laptop, which is part of the
employee enablement OER. Given this, we consider that the bespoke application/application maintenance
OERs are highly dependent on the employee enablement OER. However, the bespoke application and
application maintenance OERs have minimal/no implications for the employment enablement OER.
The matrix below sets out the interdependencies between the different ICT packages.
Table A3 - 1 ICT package interdependencies
ICT Package
Importance of the package to the package on the left
Bespoke/ App maintenance
Customer Safety and Support
Data and Decisioning
Employee Enablement
Infrastructure and Network
Operational Evolution
Cyber Security
Bespoke / App maintenance
Low Medium – benefits
High – functional
High – functional
Low High – compliance
Customer Safety and Support
Medium – benefits
Medium – benefits
High – functional
High – functional
Low High – compliance
Data and Decisioning
Low Low High – functional
High – functional
Low High – compliance
Employee Enablement
Low Low Medium – benefits
High – functional
Low High – compliance
Infrastructure and Network
Medium – Scope
Low Medium – Scope
High – functional
Low High – compliance
Operational Evolution
Low Low Medium – benefits
High – functional
High – functional
High – compliance
Cyber Security
Low Low High – functional
High – functional
High – functional
Low

48 | Non-network ICT Overview Paper | 2023-28 Revenue Proposal__________________________________________________________
Attachment 4 - High level explanation of ICT capex projects in current regulatory period
The work packages we used in our 2018-23 submission is different to the work packages
The table below Table A4 - 1 shows how we have spent or plan to spend ICT capex over the 2018-23
regulatory period.
Table A4 - 1 Actual / estimated ICT capex over 2018-23 ($Million, Real 2022-23)
$Million, real 2022-23
2018-19 2019-20 2020-21 2021-22 2022-23 Average Annual
Total 2018-23
ICT
Digital Enterprise 4.3 7.8 10.1 0.4 0.2 4.6 22.8
Digital Field Force 0.2 1.9 5.9 3.6 - 2.3 11.6
Intelligent Operations Centre
3.1 1.3 0.3 - - 1.0 4.8
Intelligent Asset Design
0.5 1.2 0.5 - - 0.5 2.3
Pervasive Security 3.7 4.3 2.5 - - 2.1 10.5
Enterprise Analytics Platform
0.1 0.6 0.6 - - 0.2 1.2
Information Infrastructure Refresh
7.2 2.3 (0.0) - - 1.9 9.5
Corporate Data Network Refresh
3.0 1.5 0.0 - - 0.9 4.6
Total ICT 22.2 20.9 20.0 4.1 0.2 13.5 67.3
In completing Table 4-2, we applied the following assumptions to allocate our actual and estimated ICT
capex over the 2018-23 regulatory period into our new ICT packages of work used to develop our forecast
ICT capex over the 2023-28 regulatory period:
Digital Enterprise and Digital Field Force packages significantly align with the Application Maintenance
package because Digital Core applications are being upgraded and maintained.
Intelligent Asset Design and Intelligent Operations Design packages completely align with the
Application Maintenance package because our integration platform, Transgrid’s Spatial System (TSS)
and Electronic Document Management System (EDMS) applications are being upgraded and
maintained.
The Digital Field Force and Bespoke Application packages align, however there has been minimal
investment in Asset Inspection Manager (AIM) and Public Easement Enquiry Management (PEEM)
applications. The minimal spend from 2019 to 2023 is due to bespoke applications having a 10 year
asset life, hence there will be a significant investment in bespoke applications during 2023 to 2028.

49 | Non-network ICT Overview Paper | 2023-28 Revenue Proposal__________________________________________________________
The Customer Safety and Support package is new in 2023 because we are enhancing our customer
engagement capability.
Enterprise Analytics Platform package completely aligns with the Data and Decisioning package
because they are building and maintaining data solutions. We will be investing in a data warehouse
from 2023 which is reflected in the capital spend.
Information Infrastructure Refresh package partially aligns with the Employee Enablement package as
they are both replacing and maintaining user devices.
Information Infrastructure and Corporate Data Network Refresh packages completely align with the
Information and Network package except for the user device component as previously mentioned.
There is a significant capex spend from 2023 because assets have been extended beyond their useful
asset life during 2018 to 2023.
Digital Enterprise and Digital Field Force packages partly align with the Operational Evolution package
as they are enhancing and maintaining project management, Digital Core and revenue management
capability.
Pervasive Security and Cyber Security packages completely align as they are enhancing and
maintaining security and compliance obligations.