NIGERIA - Food and Agriculture Organization of the United ...
20
Financial support provided by the United States Agency for International Development (USAID) Livestock and environment spotlight Cattle and poultry sectors NIGERIA Federal Republic of Nigeria
-
Upload
khangminh22 -
Category
Documents
-
view
4 -
download
0
Transcript of NIGERIA - Food and Agriculture Organization of the United ...

Financial support provided by the United States Agency for International Development (USAID)
Livestock and environment spotlight
Cattle andpoultry sectors
NIGERIA
Federal Republicof Nigeria


1
Livestock and Environment Spotlight
Cattle and Poultry Sectors in Nigeria
1- Introduction
While the livestock sector provides a variety of goods and services to society, from food to income to
social functions, its complex interactions with the ecosystem have large environmental implications.
The livestock sector is the world’s largest user of agricultural land, considering both grazing and feed-
crop lands, and thus has a major impact on soil, water and air quality as well as biodiversity (Monfreda
et al., 2008; Ramankutty et al., 2008; FAO, 2017a).
Nigeria’s growing population, rising incomes and urbanization are translating into an increased demand
for livestock products. One estimate suggests that, between 2010 and 2050, beef, poultry meat and milk
consumption will increase by 117, 253 and 577 percent, respectively (ASL2050 FAO, 2018). As a
consequence, the livestock sector will grow and transform, resulting in new relationships between
domestic animals, populations, natural resources and wildlife (FAO, 2009). Assessing the current
livestock impact on the environment is thus critical to understand how the growth and transformation of
the sector can impact society in the future, and to identify actions to take to ensure a sustainable
development of the livestock sector in the mid- and long-term basis.
This brief summarises the available evidence of the impact of cattle and poultry production systems on
the environment in Nigeria. It relies upon published research reports and papers, and ad hoc datasets,
when available. It explores the correlations between different cattle and poultry production systems and
greenhouse gas emissions; water usage; land degradation; and biodiversity loss. Livestock production
systems were characterized by national stakeholders - including the Federal Ministry of Agriculture and
Rural Development (FMARD), the Federal Ministry of Environment (FMoE) and the Federal Ministry
of Health (FMoH) – and include free-range, semi-extensive and commercial poultry production systems;
and pastoral, agro-pastoral and intensive cattle (dairy) production systems (Annex 1).
2- Livestock and Greenhouse Gas Emissions
Greenhouse gas (GHG) emissions from human activities are the most significant drivers of observed
climate change, and reached 49 GtCO2eq. in 2010, with agriculture, forestry and other land uses
accounting for 24 percent of these emissions (IPCC, 2014).
Nigeria’s GHG emissions reached 1.72 tCO2eq. per capita in 2014, less than one third of the world
average (6.3 tCO2eq. per capita) (Figure 1) (CAIT, 2015). The government, however, fully recognizes
the importance of mitigating global carbon emissions: it ratified the Paris agreement in 2017 and aims
at ensuring a rapid and climate smart development.

2
Figure 1. Per capita GHG emissions (tCO2eq.) in Nigeria versus world average (2014)
Source: CAIT (2015)
To quantify GHG emissions from the different cattle and poultry systems we used data from the Global
Livestock Environmental Assessment Model (GLEAM). GLEAM is a Geographic Information System
(GIS) framework that simulates bio-physical processes and activities along livestock supply chains
using a life cycle assessment approach. It quantifies production and use of natural resources in the
livestock sector and measures its GHG emissions, which allows assessing the effectiveness of alternative
adaptation and mitigation options. GLEAM identifies three main groups of emissions: upstream
emissions include emissions related to feed production, processing and transportation; animal
production emissions comprise emissions from enteric fermentation, manure management and on-farm
energy use; downstream emissions are caused by the processing and post-farm transport of livestock
commodities. Three gases are considered in GLEAM: carbon dioxide (CO2), methane (CH4) and nitrous
oxide (N2O). All emissions are converted into CO2eq. using the global warming potential from IPCC
(2014) (298 for N2O and 34 for CH4). We run the model using 2010 data for animal numbers and
distribution, herd parameters, feed yields and rations, and manure management systems.
2.1- Poultry production systems and GHG emissions
Poultry production systems emit a total of 1.3 MtCO2eq. per year. Commercial poultry production
systems contribute to about 85 percent of all GHG emissions from the sector, with the backyard
production systems responsible for the remaining 15 percent. Emissions per bird are six times higher in
commercial than in backyard production systems: one bird in a commercial production unit emits 20.86
kg of CO2eq. per year versus 3.63 kg for a bird in a backyard production unit (Table 1).
Besides the overall quantity of CO2eq. emitted, there are also differences between the source of
emissions per head by production systems. In commercial production systems, feed production is the
biggest source of GHG emissions, while in backyard production systems manure management
contributes most to GHG emissions.
1.72
2.79
0.36
6.296.73
0.72
0
1
2
3
4
5
6
7
8
Total GHG Emissions Excluding
Land-Use Change and Forestry
Per Capita (tCO₂e Per Capita)
Total GHG Emissions Including
Land-Use Change and Forestry
Per Capita (tCO₂e Per Capita)
Agriculture Per Capita (tCO₂e
Per Capita)
Total GHG emissions in Nigeria in 2014
Nigeria 2014 World 2014

3
Table 1. Nigeria: GHG emissions in poultry production systems (kg CO2eq./head/year)
Emission Backyard system Commercial system
Fertilizer, N2O 0.14 1.22
Applied manure, N2O 0.08 1.68
Crop residues, N2O 0.49 1.44
Feed, CO2 0.01 13.29
LUC: soy & palm, CO2 0.33 0.10
Manure management, CH4 0.30 1.24
Manure management, N2O 2.30 1.89
Total 3.63 20.86
Source: FAO (ASL2050 FAO, 2017); authors’ calculations based on GLEAM (FAO, 2017b)
However, the picture changes if we look at the quantity of CO2eq. emitted per unit of product (kg meat)
rather than per bird. Figure 2 shows that 1 kg of chicken meat produced in commercial systems generates
2.8 kg of CO2eq. per year versus 4.62 kg of CO2eq. per year in backyard systems. The difference mainly
comes from the fact that chicken reach their slaughter weight much faster in the commercial systems.
Figure 2. Nigeria: GHG emissions (kg CO2eq.) in poultry production systems
Source: FAO (2018); authors’ calculations based on GLEAM (FAO, 2017b)
2.2- Dairy production systems and GHG emissions
The Nigeria dairy sector generates about 34.4 MtCO2eq. of GHG emissions per year. Emissions per
head are higher in intensive systems than in pastoral or agro-pastoral systems: one dairy cow in an
intensive production unit emits 3 569 kg CO2eq. per year versus 1 927 kg CO2eq. and 1 477 kg CO2eq.
in pastoral and agro-pastoral systems, respectively (Table 2).
Table 2. Nigeria: GHG emissions in dairy production systems (kg CO2eq./head/year)
Emission Pastoral system Agro-pastoral system Intensive system
Enteric fermentation, CH4 1 422 1 219 2 694
Manure management, CH4 49 40 661
Manure management, N2O 68 146 182
Feed emission, N2O 379 41 2
Feed emission, CO2 9 31 30
Total 1 927 1 477 3 569
Source: FAO (ASL2050 FAO, 2017); authors’ calculations based on GLEAM (FAO, 2017b)
4.62
3.63
2.80
20.86
- 5.00 10.00 15.00 20.00 25.00
TOTAL emissions per kg meat
TOTAL emissions per head
Total GHG emissions (kg CO2 eq.)
Commercial Backyard

4
Methane from enteric fermentation contributes to between 74 and 82 percent of CO2eq. emissions, in all
dairy production systems (Figure 3). Manure management (emitting CH4 plus N2O) is the second largest
source of GHG emissions in intensive systems (24 percent; 843 kg CO2eq./head/year) and agro-pastoral
systems (13 percent; 186 kg CO2eq./head/year), whereas feed emissions (emitting CO2 plus N2O)
generate 20 percent of GHG emissions in pastoral systems (379 kg CO2eq./head/year).
Figure 3. GHG emissions by source for pastoral, agro-pastoral and intensive production systems
Source: FAO (2018); authors’ calculations based on GLEAM (FAO, 2017b)
Total GHG emissions per unit of milk produced are higher in pastoral systems than in intensive systems,
suggesting that intensification is associated with a reduction in GHG emissions progresses per litre of
milk produced (Table 3). This is due to higher efficiency in resource utilization in intensive than in all
other dairy production systems.
Table 3. Total GHG emissions in dairy production systems by source
Pastoral Agro-pastoral Intensive
Litres per lactation 360 1 440 3 600
Total emissions per head (kg CO2eq.) 1 927 1 477 3 569
Total emissions per one litre of milk produced
(kg CO2eq.) 5.35 1.03 0.99
Source: FAO (2018); authors’ calculations based on GLEAM (FAO, 2017b)

5
3- Livestock and water usage
Livestock is a major user of water. About 500 litres of water are needed to produce 1 kg dry matter while
the amount of drinking water used varies from 5 to 50 litres per Tropical Livestock Unit (TLU) per day,
depending on species, dry matter intake, feed composition and water content, physiological status of the
animal and the broader climatic conditions (Peden et al., 2003; Steinfeld et al., 2006; Lardy et al., 2008).
The impacts of livestock production on local/regional water balances, therefore, vary widely, though
feed production is the predominant source of livestock-related water consumption.
In Nigeria, situated in the tropical zone of West Africa, water deficiency is an issue in the northern part
of the country, which is semi-arid. In the other parts of the country, the time distribution of rainfall is of
concern (FAO, 2005). Agriculture is the sector withdrawing the largest share of water, contributing 44
percent to the total annual water withdrawal (12 475 million m3) in 2010 (FAO, 2016) (Figure 4).
Livestock is responsible for 233 million m3 of water withdrawn, representing over 4 percent of the
agriculture water withdrawal and 2 percent of the total annual water withdrawal (FAO, 2016). It is
important to note that this 2 percent includes only direct consumption (watering and cleaning), while
the water used for feed is included in irrigation.
Figure 4. Water withdrawal by sector for a total of 12 475 million m3 in 2010
Source: FAO (2016)
In this brief, we rely on Mekonnen and Hoekstra (2012) to assess the water footprint of farm animals in
cattle and poultry production systems by source of water, including blue, green and grey water. Blue
water footprint refers to the amount of water consumed from surface and groundwater along the value
chain of a product, which is evaporated after withdrawal. Green water refers to rainwater consumption
and grey water footprint refers to the volume of freshwater needed to assimilate the load of pollutants
emitted. The water footprint of a farm animal consists of direct consumption via drinking and service
water as well as indirect consumption through the water used for feed production (Chapaign and
Hoekstra, 2003; Mekonnen and Hoekstra, 2012).
3.1- Poultry production systems and water usage
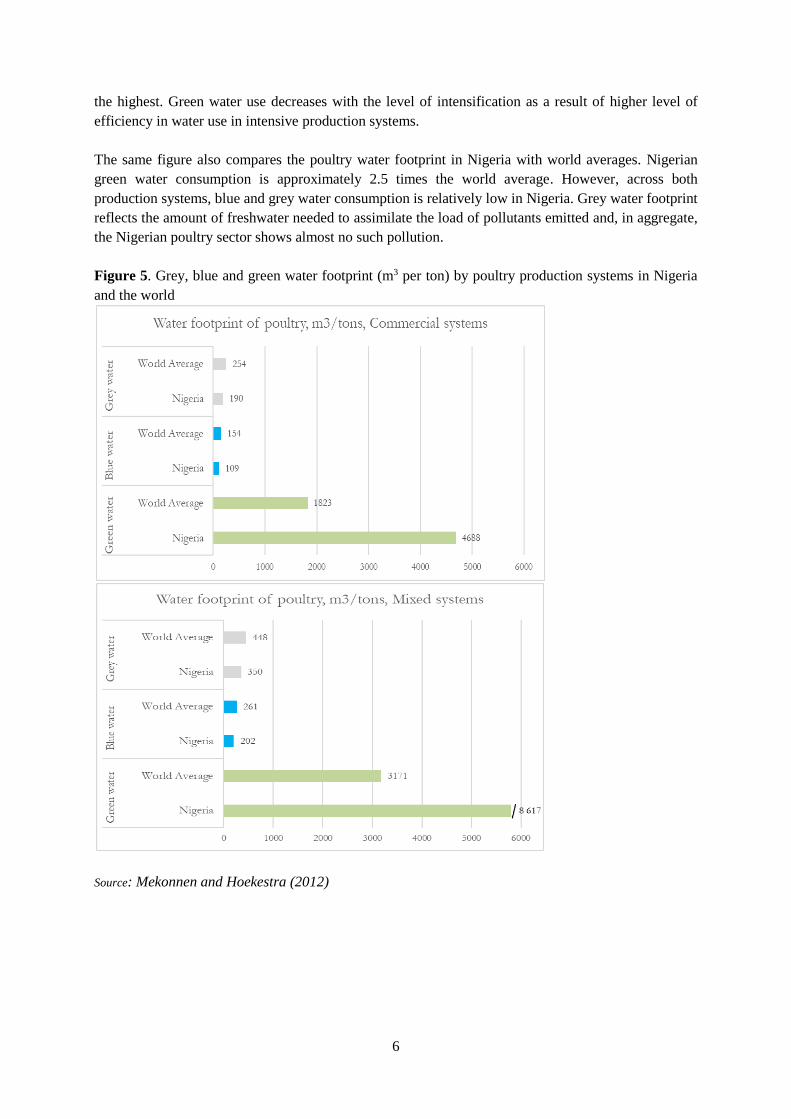
Figure 5 shows the water footprint for poultry by production system, measured in cubic meters (m3) per
ton of live animal. The poultry water footprint is approximately 7 000 m3 per ton of live animal. In
mixed systems, it reaches 9 169 m3 per ton and in commercial systems about 5 000 m3 per ton. In the
two poultry production systems considered here (commercial and mixed), green water consumption is
6
the highest. Green water use decreases with the level of intensification as a result of higher level of
efficiency in water use in intensive production systems.
The same figure also compares the poultry water footprint in Nigeria with world averages. Nigerian
green water consumption is approximately 2.5 times the world average. However, across both
production systems, blue and grey water consumption is relatively low in Nigeria. Grey water footprint
reflects the amount of freshwater needed to assimilate the load of pollutants emitted and, in aggregate,
the Nigerian poultry sector shows almost no such pollution.
Figure 5. Grey, blue and green water footprint (m3 per ton) by poultry production systems in Nigeria
and the world
Source: Mekonnen and Hoekestra (2012)

7
3.2- Cattle (dairy) production systems and water usage
The water footprint for dairy by production system, measured in cubic meters (m3) per ton of live animal,
is represented in Figure 6. The cattle water footprint is approximately 5 100 m3 per ton of live animal.
In agro-pastoral and intensive systems, it reaches 7 202 m3 and 3 091 m3 per ton, respectively. Green
water footprint represents almost all of the cattle water consumption in both agro-pastoral and intensive
production systems. No data are available for pastoral systems.
Nigerian’s cattle water consumption is lower than the world averages for the three types of source of
water and the Nigerian cattle sector reports little consumption of grey water. In particular, in the cattle
intensive systems: consumption of blue and grey water is one fourth to one tenth of the world averages.
Figure 6. Grey, blue and green water footprint (m3 per ton) by dairy production systems in Nigeria and
the world
Source: Mekonnen and Hoekestra (2012)
Figure 7 shows that the water footprint of whole milk production is 2 552 m3 per ton of milk in agro-
pastoral systems, with green water contributing the most to the water footprint. Green and blue water
consumptions are higher than the world average, whereas grey water footprint is lower. Therefore, while

8
agro-pastoral systems consume more water than the world averages, they pollute the environment to a
significantly lower extent. No data on intensive dairy production systems are available.
Figure 7. Grey, blue and green water footprint (m3 per ton) of whole milk in Nigeria and the world
Source: Mekonnen and Hoekestra (2012)
To sum up, total water consumption is generally higher in Nigeria than the world average, though the
bulk of this consumption consists of green water. Green water has the lowest opportunity cost since it is
sourced from rainwater, and especially in the case of pastoral systems, it happens in remote areas where
it would not be used for other purposes. Blue water consumption is higher than the world average, in
the dairy system; this reiterates the importance of productivity increase in the sector. Grey water
consumption is lower than the world average, but as intensification increases, so will the blue and grey
water consumption. It is important to monitor water use by production systems and source and strive for
high water productivity to ensure sustainability as the livestock sector grows.
4- Livestock and land degradation
Land degradation is a major threat at the global level. Stocking (2001) defines land degradation as “the
temporary or permanent decline in the productive capacity of the land, and the diminution of the
productive potential”. Increased cropping and grazing intensity as well as inappropriate pastoralism
production practices are deemed to contribute to land degradation, often resulting in decreased
agricultural production and productivity (Maiangwa et al., 2007; Macaulay, 2014; Taiye et al., 2017).
In Nigeria, a total 92 377 000 hectares (or 923 770 sqkm) of land (FAO, 2014) comprises permanent
meadows and pasture (33%), arable land (37%), permanent crops (7%) and forests (7%) (Figure 8).

9
Figure 8 Land use in Nigeria in 2015.
Source: authors’ calculations based on FAOSTAT (FAOSTAT, 2017)
Free-range grazing by cattle, sheep, goats, donkeys and camels is a common practice in pasture areas,
where the land is not privately owned. Herders, therefore, tend to overexploit available common lands,
for example through overgrazing, which results in the creation of bare soil surfaces subject to wind and
water erosion, soil compaction, decrease of soil organic matter and nutrients, reduction of water
infiltration, and removal of desirable plant species (de Haan et al., 1997; Maiangwa et al., 2007;
Orheruata and Omoyakhi, 2008; Taiye et al., 2017). Northern Nigeria regions are particularly affected
by excessive grazing contributing to desertification (Orheruata and Omoyakhi, 2008).
Olagunju (2015) estimates that 64 percent of Nigerian total land is at risk of desertification, affecting
directly or indirectly about 62 million people, with livestock often considered a major contributing factor
to this trend. Over the last 5 to 10 years, over 70 percent of farmers and pastoralists have reported a
decrease in the density of vegetation, reduction of water levels and reduction in the diversity of tree
species and wildlife (Omotayo, 2003). Olagunju (2015) also estimates that the forage needs for livestock
have exceeded the carrying capacity of the Nigeria grasslands, which is one of the reasons of increased
herder-farmer conflicts. The violent clashes are a major issue in the country, already claiming hundreds
of lives in 2018.
5- Livestock and biodiversity loss
According to the Convention on Biological Diversity (CBD, 1992) signed in Rio de Janeiro, biological
diversity is defined as “the variability among living organisms from all sources; (…) this includes
diversity within species, between species and of ecosystems”. The loss of biodiversity has important
implications on the ecosystem functions and on the goods and services that the ecosystem provides
(Cardinale et al., 2012).
Nigeria is rich in biodiversity and hosts many endemic species, thanks to a complex topography and
various ecosystems, from rainforests to savanna woodlands to coastal mangroves (CBD, 2015). Adler
et al. (2001) report there are 5 303 plant species in Nigeria, 247 mammal species, 831 species of birds,
648 species of fish and 109 species of amphibians. This diversity makes Nigeria as one of the richest
country in Africa in terms of biodiversity (Meduna et al., 2009). However, the 2013 IUCN red list
33%
37%
7%
16%
7%
Permanent
meadows and
pasture
Arable land
Permanent crops
Other lands
Forests

10
identified 309 threatened species in Nigeria including 26 mammals, 19 birds, 8 reptiles, 13 amphibians,
60 fishes and 168 plants (CBD, 2015).
The correlation between livestock sector growth and biodiversity loss is complex, but evidences point
towards a negative link between the two. Increases in the livestock population as well as inappropriate
production practices contribute to the destruction of vegetation and soil damage, leading to biodiversity
loss (CBD, 2015; Taiye et al., 2017). For example, prolonged livestock grazing reduces biomass
accumulation causing a reduction in botanical composition and species diversity: highly edible plants
are replaced with their inedible counterparts, herbaceous plants or bushes (de Haan et al., 1997;
Orheruata and Omoyakhi, 2008; Taiye et al., 2017). At the same time, however, there could be positive
complementarities between livestock grazing and wildlife supporting biodiversity.
Grazing can also contribute to biodiversity through the distribution of seeds and micro- and macro-fauna
(Okaeme et al., 1988; de Haan et al., 1997; Orheruata and Omoyakhi, 2008). Indeed, a total absence of
grazing can reduce biodiversity allowing trees and shrubs development which intercepts moisture and
light resulting in the overprotection of some specific species (de Haan et al., 1997).
6- Conclusions
This brief summarises available evidence on the impacts of cattle and poultry production systems on the
environment in Nigeria, including on air (GHG emissions), water, soil and biodiversity. While available
data does not allow measuring with accuracy the connections between livestock and environment, there
is clear evidence that the livestock sector – while producing valuable food for the population – is also
having negative impact on the environment.
Nigeria is anticipated to dramatically transform in the coming decades as a result of population growth,
rising incomes and urbanization. The livestock sector will transform too in order to satisfy a growing
demand for animal source food, including meat, dairy products and eggs. The growth and transformation
of the livestock sector affect the Nigerian environment, including on soil, water and air quality as well
as on biodiversity (FAO, 2009). Understanding with more accuracy the current impact and future
impacts of livestock production systems on the environment is critical to take actions now that will
ensure a sustainable development of the livestock sector, and of the entire Nigeria more broadly.
October 2018. The production of this document has been coordinated by Lucie Perin1, Emmanuel
Odunze2, Hiver Boussini3, Orsolya Mikecz1 and Alessandra Falcucci1 under the guidance of the
Members of the ASL 2050 Nigeria Steering Committee.
1 Food and Agriculture Organization of the United Nations, Animal Production and Health Department 2 Federal Ministry of Agriculture and Rural Development 3 Food and Agriculture Organization of the United Nations, Nigeria Country Office

11
7- References
Adler, P. B., Raff D.A., & Lauenroth, W. K. 2001. The effect of grazing on the spatial heterogeneity
of vegetation. Oecologia, 128: 465-479.
ASL2050 FAO. 2017. Africa Sustainable Livestock (ASL) 2050 Livestock production systems spotlight
– Poultry and cattle sectors in Nigeria. FAO.
ASL2050 FAO. 2018. Africa Sustainable Livestock (ASL) 2050 Nigeria country brief. FAO.
CAIT. 2015. Washington, DC: World Resources Institute. Available online at: http://cait.wri.org.
Cardinale, B. J., Duffy, J. E., Gonzalez A., Hooper, D. U., Perrings, C., Venail, P., … & Naeem, S.
2012. Biodiversity loss and its impact on humanity. Nature, 486 (7401): 59–67.
Chapagain, A. K., & Hoekstra, A. Y. 2003. Virtual water flows between nations in relation to trade
in livestock and livestock products. Value of Water - Research Report Series No 13. Institute for Water
Education, UNESCO-IHE. Delft, Netherlands.
Convention on Biological Diversity (CBD). 1992. Article 2 – Use of Terms. Available online at:
https://www.cbd.int/convention/articles/default.shtml?a=cbd-02.
Convention on Biological Diversity (CBD). 2015. Nigeria: Fifth National Biodiversity Report.
Available online at: https://www.cbd.int/doc/world/ng/ng-nr-05-en.pdf/.
de Haan, C., Steinfeld, H., & Blackburn, H. 1997. Livestock and the environment: Finding a balance.
FAO/World Bank/USAID. Rome, Italy.
FAO. 2005. Irrigation in Africa in figures – Nigeria. AQUASTAT. Available online at :
http://www.fao.org/nr/water/aquastat/countries_regions/NGA/NGA-CP_eng.pdf.
FAO. 2009. The state of food and agriculture: livestock in the balance. Rome, Italy.
FAO. 2014. Country profile – Nigeria. Available online at:
http://www.fao.org/countryprofiles/index/en/?iso3=NGA.
FAO. 2016. AQUASTAT website. FAO.
FAO. 2017a. Livestock and environment. Available online at:
www.fao.org/ag/againfo/themes/en/Environment.html.
FAO. 2017b. Global Livestock Environmental Assessment Model (GLEAM). Available online at:
www.fao.org/gleam/en/.
FAO. 2018. Global Livestock Environmental Assessment Model. Reference documentation - Version
2.0. Revision 5. Rome, Italy.

12
FAOSTAT. 2017. Land use. Available online at: http://www.fao.org/faostat/en/#data/RL.
Intergovernmental Panel on Climate Change (IPCC). 2014. Climate Change 2014: Mitigation of
Climate Change. Cambridge University Press.
Lardy, G. Stoltenhow, C., & Johnson, R. 2008. Livestock and Water. North Dakota State University,
Fargo.
Macaulay, B. M. 2014. Land degradation in Northern Nigeria: The impacts and implications of human-
related and climatic factors. African Journal of Environmental Science and Technology, 8 (5): 267-273.
Maiangwa, M. G., Ogungbile, A. O., Olukosi, J. O., & Atala, T. K. 2007. Land Degradation : Theory
and Evidence from the North-West Zone of Nigeria. Journal of Applied Science, 7 (6): 785-795.
Meduna, A. J., Ogunjinmi, A. A., & Onadeko, S. A. 2009. Biodiversity Conservation Problems and
Their Implications on Ecotourism In Kainji Lake National Park, Nigeria. Journal of Sustainable
Development in Africa, 10(4): 59-73.
Mekonnen, M. M., & Hoekstra, A. Y. 2012. A global assessment of the water footprint of farm animal
products. Ecosystems, 15(3), 401-415.
Monfreda, C., Ramankutty, N., & Foley, J.A. 2008. Farming the planet: 2. Geo-graphic distribution
of crop areas, yields, physiological types, and net primary production in the year 2000. Global
Biogeochemical Cycles, 22: GB1022.
Okaeme, A. N., Ayeni, J. S. O., Oyatogun, M. O., Wari, M., Haliru, M. M., & Okeyoyin, A. O.
1988. Cattle Movement and Its Ecological Implications in the Middle Niger Valley Area of Nigeria.
Environmental Conservation, 15(4): 311-316.
Olagunju, T. E. 2015. Drought, desertification and the Nigerian Environment: A review. Journal of
Ecology and the Natural Environment, 7(7): 196-209.
Omotayo, A. M. 2003. Ecological Implications of Fulbe Pastoralism in Southwestern Nigeria. Land
Degradation and Development, 14: 445-457.
Orheruata, A. M., & Omoyakhi, J. M. 2008. Livestock-Environment Interaction: Issues and options
in Nigeria. Journal of Applied Sciences and Environmental Management, 12(2): 129-133.
Peden, D., Tadesse, G., & Mammo, M. 2003. Improving the water productivity of livestock: An
opportunity for poverty reduction. International Livestock Research Institute (ILRI), Addis Ababa,
Ethiopia.
Ramankutty, N., Evan, A.T., Monfreda, C., & Foley, J.A. 2008. Farming the planet: 1. Geographic
distribution of global agricultural lands in the year 2000. Global Biogeochemical Cycles, 22, GB1003.
Steinfeld, H., Gerber, P., Wassenaar, T., Castel, V., Rosales, M. & de Haan, C. 2006. Livestock´s
long shadow. Environmental issues and options. FAO. Rome, Italy.

13
Stocking, M. A. 2001. Land degradation. International Encyclopedia of the Social and Behavioral
Sciences, 8242-8247.
Taiye, O. A., Dauda, M. M., & Emmanuel, A. O. 2017. Assessment of the Effects of Emerging Grazing
Policies on Land Degradation in Nigeria. Journal of Applied Sciences and Environmental Management,
21 (6): 1183-1187.

14
Annex 1
Table A. Cattle (dairy) production systems in Nigeria
Nomadic pastoral
systems (extensive)
In pastoral or free grazing systems, farmers move cattle from place to place
in search of pastures and water. They keep indigenous breeds, with herd size
ranging from 100 to 300 heads. Production is subsistence oriented and
animals are kept on uncultivated pastures and rely on grazing without any
feed supplements. Main products include beef, milk, blood, hides, manure
and horns. This system is dominant in Northern Nigeria. Agro-pastoral systems In agro-pastoral systems, farmers are engaged in growing crops and raising
livestock. They keep mainly indigenous breeds, with herd size ranging from
20 to 100 heads. Dairy production’s objective is hereditary or commercial.
Family labour is mainly used and animals rely on grazing on demarcated
rangelands and supplementary feeds. This system is present in the southern
regions.
Commercial systems
(intensive)
In commercial systems, animals are raised for maximum milk output and
they are kept indoors in sheds or paddocks and are well supplied with
necessary nutrition and bio-security. Farmers keep mainly exotic breeds,
with herd size ranging from 50 to 1000 heads. Feed comes from cultivated
pastures and there is no grazing. Eighty percent of the commercial dairy
farms are located in the North Central region.
Source: ASL2050 FAO (2017)
Table B. Poultry production systems in Nigeria
Free-range system
(extensive)
Farmers keep indigenous chickens flocks, which are left to roam around and
scavenge for food and water. Flocks contain birds of different species and
varying ages. There may be rudimentary shelter, though most birds roost
outside in trees or nest in the bushes. Production is subsistence-oriented,
mainly for family consumption. This system is present mainly in the
northern regions of the country.
Semi-intensive system Farmers in semi-intensive poultry systems keep flocks of about 50 to 2000
birds, including both improved and unimproved breeds. It refers as small-
scale family poultry keeping by house-holds using family labor and locally
available feed resources, often complementary to other farming activities.
Housing is not elaborate, sometimes wooden/metal cages are used to
provide the chicken with shelter and some commercial feeds are used. The
small scale poultry producers tend to sell live birds through informal
marketing channels. Semi-intensive poultry farms are mainly located in the
southern regions of the countries.
Commercial systems
(intensive)
In intensive systems, farmers keep more than 2000 birds of exotic birds of
one species, producing either meat or eggs for the market. This system
ranges from medium to large scale commercial enterprises and high
premium is given to stock breed, feeding, housing and health. In the more
advances integrated holdings, there are automated chain feeding and
watering systems. Egg collection is mainly based on manually operated next
boxes with straw or wood shaving floors. This system is dominant in the
southern regions of the country.
Source: ASL2050 FAO (2017)

Note

Note


Some rights reserved. This work is available under a CC BY-NC-SA 3.0 IGO licence ©
FA
O, 2
018
CA
2150
EN
/1/1
0.18