nib holdings limited ABN 51 125 633 856 Preliminary final ...
153
nib holdings limited ABN 51 125 633 856 Preliminary final report for the year ended 30 June 2020 CONTENTS Results for announcement to the market 2 Appendix 4E compliance matrix 3 Annual Report of nib holdings limited 6
-
Upload
khangminh22 -
Category
Documents
-
view
1 -
download
0
Transcript of nib holdings limited ABN 51 125 633 856 Preliminary final ...

nib holdings limited ABN 51 125 633 856 Preliminary final report for the year ended 30 June 2020 CONTENTS Results for announcement to the market 2 Appendix 4E compliance matrix 3 Annual Report of nib holdings limited 6

Appendix 4E For the year ended 30 June 2020 nib holdings limited
Results for announcement to the market
Movement2020 2019 up / (down) Movement
$m $m $m %
Revenue from ordinary activities 2,522.1 2,461.2 60.9 2%
Profit from ordinary activities after tax attributable to members 90.1 149.8 (59.7) -40%
Net profit attributable to members 90.1 149.8 (59.7) -40%
Amount per security (cps)
Franking amount per
security
Interim Dividend Ordinary Dividend 10.00 100% Special Dividend 0.00 100%Total Interim Dividend 10.00 100%
Final Dividend Ordinary Dividend ` 4.00 100% Special Dividend 0.00 100%Total Final Dividend 4.00 100%
Record date for determining entitlements to the dividend
Date the f inal dividend is payable
4 September 2020
6 October 2020 Brief explanation of figures reported above: Net profit for the year ended 30 June 2020 as per the Consolidated Income Statement included as part of this Appendix 4E is $89.2 million. Net profit attributable to members is $90.1 million, with the balance of ($0.9 million) attributable to the Charitable foundation.

Appendix 4E For the year ended 30 June 2020 nib holdings limited
Appendix 4E disclosure requirements nib group Appendix 4E Note Number
1. Details of the reporting period and the previous corresponding period
All financial data headings
2. Key information in relation to the following: This information must be identified as “Results for announcement to the market”. 2.1 The amount and percentage change up or down from the
previous corresponding period of revenue from ordinary activities.
2.2 The amount and percentage change up or down from the previous corresponding period of profit (loss) from ordinary activities after tax attributable to members.
2.3 The amount and percentage change up or down from the previous corresponding period of profit (loss) attributable to members.
2.4 The amount per security and franked amount per security of final and interim dividends or a statement that it is not proposed to pay dividends.
2.5 The record date for determining entitlements to the dividends (if any).
2.6 A brief explanation of any of the figures in 2.1 to 2.4 necessary to enable the figures to be understood.
“Results for announcement to the market” page 2 Appendix 4E
3. A statement of comprehensive income together with note to the statement, prepared in compliance with AASB 101 Presentation of Financial Statements or the equivalent foreign accounting standard.
Annual Report 30 June 2020: • Consolidated Income Statement • Notes to the Consolidated Financial Statements - Summary of significant accounting policies - Revenue and other income - Expenses - Income tax
Note 1 Note 6 Note 7 Note 8a)
4. A statement of financial position together with notes to the statement. The statement of financial position may be condensed but must report as line items each significant class of asset, liability, and equity element with appropriate sub-totals.
Annual Report 30 June 2020: • Consolidated Balance Sheet • Notes to the Consolidated Financial Statements - Deferred tax assets - Deferred tax liabilities - Cash and cash equivalents - Receivables - Financial assets - Deferred acquisition costs - Property, plant and equipment - Intangible assets - Right of use assets and lease liabilities - Payables - Borrowings - Claims liabilities
Unearned premium liability and unexpired risk liability
- Premium payback liability - Provisions for employee entitlements - Other liabilities - Contributed equity - Retained profits - Reserves
Note 8b) Note 8c) Note 9 Note 10 Note 11 Note 12 Note 13 Note 14 Note 15 Note 16 Note 17 Note 18 Note 19 Note 20 Note 21 Note 22 Note 23 Note 24 Note 25
5. A statement of cash flows together with notes to the statement. The statement of cash flows may be condensed but must report as line items each significant form of cash flow and comply with the disclosure requirements of AASB 107 Statement of Cash Flows, or for foreign entities, the equivalent foreign accounting standard.
Annual Report 30 June 2020: • Consolidated Statement of Cash Flows • Notes to the Consolidated Financial Statements - Notes to the statement of cash flows
Note 9c)
6. A statement of retained earnings, or a statement of changes in equity, showing movements
Annual Report 30 June 2020: • Notes to the Consolidated Financial Statements - Retained profits
Note 24
Appendix 4E For the year ended 30 June 2020 nib holdings limited
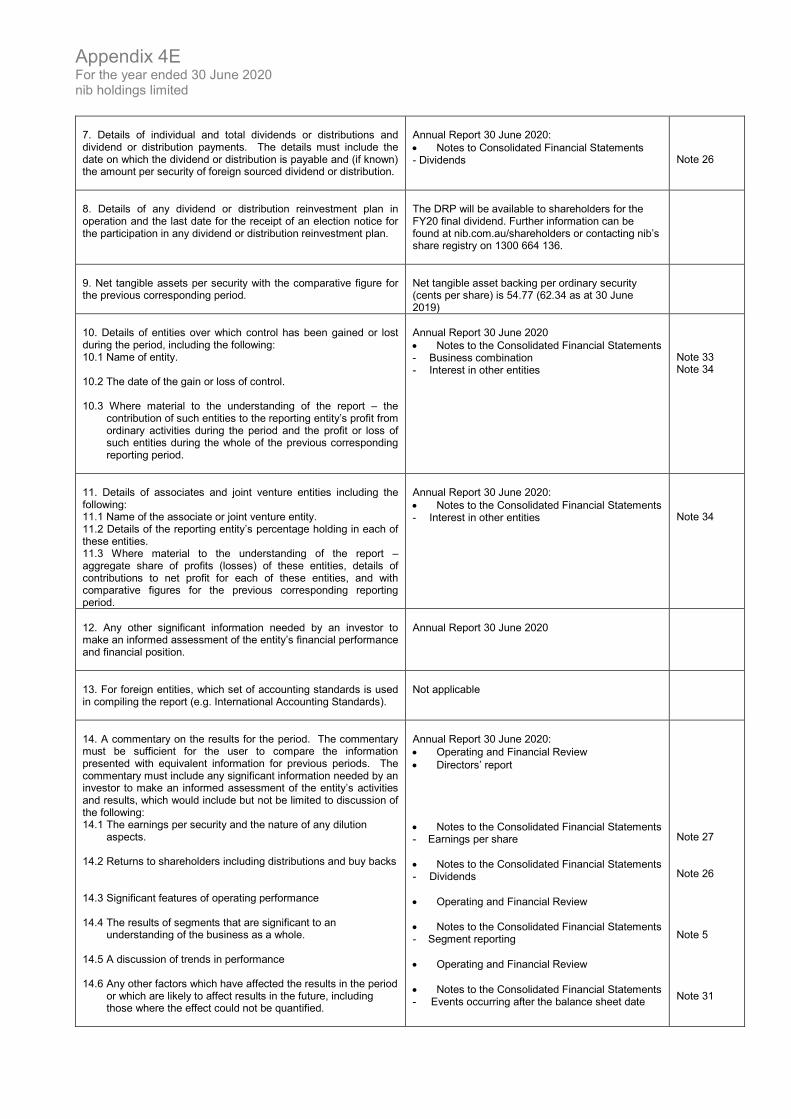
7. Details of individual and total dividends or distributions and dividend or distribution payments. The details must include the date on which the dividend or distribution is payable and (if known) the amount per security of foreign sourced dividend or distribution.
Annual Report 30 June 2020: • Notes to Consolidated Financial Statements - Dividends
Note 26
8. Details of any dividend or distribution reinvestment plan in operation and the last date for the receipt of an election notice for the participation in any dividend or distribution reinvestment plan.
The DRP will be available to shareholders for the FY20 final dividend. Further information can be found at nib.com.au/shareholders or contacting nib’s share registry on 1300 664 136.
9. Net tangible assets per security with the comparative figure for the previous corresponding period.
Net tangible asset backing per ordinary security (cents per share) is 54.77 (62.34 as at 30 June 2019)
10. Details of entities over which control has been gained or lost during the period, including the following: 10.1 Name of entity. 10.2 The date of the gain or loss of control. 10.3 Where material to the understanding of the report – the
contribution of such entities to the reporting entity’s profit from ordinary activities during the period and the profit or loss of such entities during the whole of the previous corresponding reporting period.
Annual Report 30 June 2020 • Notes to the Consolidated Financial Statements - Business combination - Interest in other entities
Note 33 Note 34
11. Details of associates and joint venture entities including the following: 11.1 Name of the associate or joint venture entity. 11.2 Details of the reporting entity’s percentage holding in each of these entities. 11.3 Where material to the understanding of the report – aggregate share of profits (losses) of these entities, details of contributions to net profit for each of these entities, and with comparative figures for the previous corresponding reporting period.
Annual Report 30 June 2020: • Notes to the Consolidated Financial Statements - Interest in other entities
Note 34
12. Any other significant information needed by an investor to make an informed assessment of the entity’s financial performance and financial position.
Annual Report 30 June 2020
13. For foreign entities, which set of accounting standards is used in compiling the report (e.g. International Accounting Standards).
Not applicable
14. A commentary on the results for the period. The commentary must be sufficient for the user to compare the information presented with equivalent information for previous periods. The commentary must include any significant information needed by an investor to make an informed assessment of the entity’s activities and results, which would include but not be limited to discussion of the following: 14.1 The earnings per security and the nature of any dilution
aspects.
14.2 Returns to shareholders including distributions and buy backs 14.3 Significant features of operating performance
14.4 The results of segments that are significant to an
understanding of the business as a whole.
14.5 A discussion of trends in performance 14.6 Any other factors which have affected the results in the period
or which are likely to affect results in the future, including those where the effect could not be quantified.
Annual Report 30 June 2020: • Operating and Financial Review • Directors’ report • Notes to the Consolidated Financial Statements - Earnings per share • Notes to the Consolidated Financial Statements - Dividends • Operating and Financial Review
• Notes to the Consolidated Financial Statements - Segment reporting • Operating and Financial Review
• Notes to the Consolidated Financial Statements - Events occurring after the balance sheet date
Note 27 Note 26 Note 5 Note 31

Appendix 4E For the year ended 30 June 2020 nib holdings limited
15. A statement as to whether the report is based on accounts which have been audited or subject to review, are in the process of being audited or reviewed, or have not yet been audited or reviewed.
The financial report 30 June 2020 has been fully
audited • Independent auditor’s report
16. If the accounts have not yet been audited or subject to review and are likely to be subject to dispute or qualification, a description of the likely dispute or qualification.
Not applicable
R Toms Date 23 August 2020 Company Secretary nib holdings limited

annualreport2020
CONTENTS Page
Group Performance Highlights 1
Operating and Financial Review 4
Directors’ Report 14
Auditor’s Independence Declaration 22
Remuneration Report 23
Corporate Governance Statement 45
Financial Report
Consolidated Income Statement 47
Consolidated Statement of Comprehensive Income 48
Consolidated Balance Sheet 49
Consolidated Statement of Changes in Equity 50
Consolidated Statement of Cash Flows 51
Notes to the Consolidated Financial Statements 52
Directors’ Declaration 136
Independent Auditor’s Report to the Members 137
Shareholder Information 143
Corporate Directory 145
nib holdings limited ABN 51 125 633 856

group performance highlights
1 ROIC calculated using average shareholders' equity including non-controlling interests and average interest-bearing debt over a rolling 12 month period.
Underlying operating profit
$m
Group NPS
Net investment income
$m
Total underlying revenue
$m
Dividends
cps
Return on invested capital1
%
Net profit after tax
$m
Statutory EPS
cps
10
15
20
FY20FY19FY18FY17FY16
14.75
19.020.0
23.0
14.0
FY20FY19FY18FY17FY16
1,873.12,004.5
2,235.12,421.6 2,503.2
FY20FY19FY18FY17FY16
132.0
153.7
184.8201.8
150.1
10
15
20
25
30
FY20FY19FY18FY17FY16
21.2
27.229.4
32.9
19.8
10
15
20
25
30
35
FY20FY19FY18FY17FY16
16.9
28.6 29.6
36.1
16.6
20
40
60
80
100
120
140
FY20FY19FY18FY17FY16
91.8
120.2
133.5
149.3
89.2
10
15
20
FY20FY19FY18FY17FY16
19.0
22.7
19.5 19.1
11.2
10
20
30
FY20FY19FY18FY17FY16
15.8
23.1
29.4
32.534.8

business strategy
our purposeyour better health
personalised healthcareHarness data science and digital technologies to better “personalise” our relationship with members and travellers, the products and services we deliver or connect them with. We especially help them, their doctors and other clinicians make more informed healthcare decisions.
affordability and sustainabilityImprove the affordability of our financial protection through improved operating efficiency, disciplined claims management and better risk management. Focus upon and promote “purpose” and our role in society.
grow the core (arhi)Strive for above “system” organic growth with measured brand and acquisition investment, prudent product design, combatting adverse risk selection, channel diversification and “personalising” the value proposition. Consider and pursue M&A as opportunities present.
economies of scopeLeverage existing Group assets and capabilities to grow adjacent business and with that enterprise value and business risk diversification.
Support Honeysuckle Health as an engine beneath “personalisation” and disease risk management.
racing the red queen (RRQ)Create competitive advantage across the nib Group through constant innovation, our RRQ principles and, recruiting, developing and retaining world class talent.

Supporting our members, employees and the community through COVID-19
A range of financial hardship support and premium relief options
$250 wellness benefit forFRONTLINE HEALTHCARE
WORKERS
Free antenatal and early parenting
ONLINECLASSES
1 April 2020 premium changes postponed until
24/7 medical and non-medical
assistance hotline
1 OCTOBER 2020
Latest COVID-19 health related information provided
to members and the community on nib’s digital
channels, including the
CHECK UP
Expanded cover for COVID-19 related treatment and additional Extras psychology benefits at
NO COST
for a range ofhealth services
ACCESS TOCONSULTATIONSTELEHEALTH
surgical masks donated to healthcare and allied health workers
100,000donated to community and clinical initiatives in
Australia and New Zealand with nib foundation
1.5$MILLION
FOODHAMPERS
and health packs to support international students
Our Members
Our Community Our Employees
Ergonomics package to support
WORKFROMHOME
Up to two weeks
SPECIALPAID LEAVE

Operating and Financial ReviewFor the year ended 30 June 2020 nib holdings limited
4
CHAIRMAN’S REPORT
The devastation of COVID-19 made FY20 as extraordinary as any I’ve ever encountered in my executive and non-executive director corporate career. While secondary to the tragedy of widespread death and suffering, the pandemic has devastated consumer confidence and destroyed or put at risk, so many businesses.
As you would expect, the Board is acutely aware of the challenges COVID-19 presents the nib Group and very focused upon supporting our members, travellers, employees and business sustainability. The commercial challenges are many and include maintaining growth in difficult market conditions, forecasting and managing claims experience in unpredictable circumstances as well as ensuring the nib Group remains well capitalised and ready to meet a range of possible future scenarios.
Despite the disruption of COVID-19, FY20 was another year of good progress in fulfilling our purpose of “Your Better Health”.
We funded over 350,000 hospital admissions and almost 3.6 million dental, optical and other ancillary visits. We took a giant stride in our ambitions to make our value proposition for members and travellers as much about healthcare “prevention” as it is “cure” with the creation of Honeysuckle Health. In partnership with global healthcare company Cigna, Honeysuckle Health will deliver data science led insight and guidance for a more personalised approach to disease prevention, management and treatment.
Complementing nib’s direct efforts, our nib foundation contributed $2.1 million towards various initiatives consistent with its charter of supporting the health and wellbeing of the communities we serve. This included $1 million to help fund programs over the next four years specifically focussed on 'closing the gap' in health outcomes for Aboriginal and Torres Strait Islander peoples. We very much see community health and wellbeing as the centre piece of our sustainability agenda.
Our commercial results for FY20 were somewhat “mixed” with COVID-19 a key factor.
Pleasingly, Group revenue grew 3.4% to $2.5 billion with our flagship Australian Residents Health Insurance (arhi) business increasing policyholders by 1.9% to now cover almost 1.2 million people, in an overall market that grew just 0.4%. Similarly, New Zealand performed well growing its revenue by 11.4% and policyholders 7.4% to cover more than 225,000 people.
Unfortunately, restrictions on foreign entry into Australia severely impacted our international students and workers (iihi) business while the global impacts of COVID-19 caused significant disruption to our nib Travel operations.
We experienced a decline in operating margins compared to the previous financial year across all segments although, other than for travel they remain solid and generated a return on invested capital of 11.2% for the Group.
Our Managing Director expands upon the FY20 results further on. It is worth me observing here, that while acknowledging macroeconomic stress, the Board has every confidence in the Group strategy, outlook and underlying commercial performance. The reduction in statutory earnings per share (EPS) to 19.8 cents per share (down 40.0%) wasn’t welcomed and there are clearly hurdles across the Group, most notably nib Travel which is operating in a very difficult market. Yet FY20 was a year of multiple COVID-19 related distortions and not an accurate reflection of underlying performance of the nib Group.
We especially believe the company has so far navigated the difficulties of COVID-19 well. We’ve taken a wide range of initiatives to protect and support our members, travellers, employees and general community. I encourage shareholders to read our 2020 Sustainability Report available at nib.com.au/shareholders.
While in no way celebrating the misery of COVID-19, we also see opportunity. The pandemic has clearly heightened throughout the community the risk of disease and the need for protection. It has accelerated our plans to better predict disease risk amongst our members and prevent or better manage those risks. It is causing us to move even faster with investment in digital health and how we service members and travellers.
We have decided to make a final dividend of 4.0 cents per share, fully franked bringing the full year dividend to 14.0 cents per share, representing 71% of net profit after tax. In making the final distribution we have been cognisant of the need to balance a return to our shareholders with regulatory guidance and maintaining a strong capital position in a COVID-19 context.
As shareholders expect, succession planning and ensuring we have the right skills mix, diversity and experience on our Board and in our senior management ranks remains a priority for the Board. As part of nib’s succession planning, Non-Executive Director, Christine McLoughlin announced she will retire from the Board in September this year.
Christine is one of Australia’s most respected and astute company Directors, and nib has been fortunate to have her serve on our Board for almost 10 years. She has made a wonderful contribution to nib’s growth and success during this time especially as Chair Risk and Reputation Committee. I would like to thank her for her passion, insights and leadership at nib over almost a decade. In parallel, we welcome David Gordon who joined the Board in May 2020.
I would like to thank my Board colleagues for their leadership and contribution during FY20. And of course, I want to thank our Executive management team and all of our people for what the Board believes was exemplary performance in extremely difficult conditions.
Steve Crane

Operating and Financial Review continued For the year ended 30 June 2020 nib holdings limited
5
MANAGING DIRECTOR’S REPORT
There’s not a lot I can add to Steve’s account of COVID-19 and its implications across the nib Group in FY20. Suffice to note here, the crisis has required extraordinary agility and adaptation. Within weeks we had our entire workforce operating remotely, deferred Government approved premium increases and expanded health insurance coverage at no additional cost to members for COVID-19 related treatment. We also made significant investments in community health and wellbeing such as the supply of surgical masks to frontline healthcare workers and a $500,000 donation to Lifeline (to mention just a few).
So far our total COVID-19 support package is valued at more than $45 million. And of course, there was no respite from the demands of “business as usual” and us meeting the everyday needs and expectations of our members and travellers.
Our full year underlying operating profit (UOP) of $150.1 million was on the surface disappointing. Very importantly, it includes a provision for deferred claims of $98.8 million representing 80% of what we best estimate were COVID-19 related “savings” during the financial year. Without the provision, UOP would have been $248.9 million which is closer to our cash result for the year (net operating cash inflow was $211.6 million).
This provisioning is a sensible step as it is certain there will be a “catch up” in treatment deferred during the peak of COVID-19 in FY20. However, only time will tell the accuracy of the provision, and at the time of writing, the threat of COVID-19 and its impact on treatment levels has by no means passed.
As Steve mentions, COVID-19 factors have blurred what were otherwise some good results across the Group. Worth highlighting here:
• Group premium revenue grew to $2.5 billion up 3.4% on FY19. It was just $901.4 million in FY10.
• arhi premium revenue grew by almost 3% to over $2.1 billion, notwithstanding the six month postponement of the 1 April 2020 premium increase which reduced revenue by approximately $15 million for FY20. And even after the provisioning for deferred claims, arhi’s net profit margin was still a respectable 6.4% consistent with our target. Importantly, we saw some impressive growth in the final quarter which helped contribute to net growth of 1.9% for the full year – about 41% of total industry growth for FY20.
• iihi premium revenue grew to $123.1 million, an increase of 11.8% on FY19 and although UOP of $22.2 million was down 36.4% it still constituted a strong net profit margin of 17.1%.
The COVID-19 downturn meant this business did not contribute as much as we expected to Group earnings in FY20. Nevertheless, we are very confident our international students and workers businesses will bounce back once the pandemic is behind us or we’ve better adapted to live with it. It will remain an important source of business and earnings diversification.
• NZ premium revenue grew 11.4% to $240.1 million and UOP 18.2% to $23.4 million with a strong 9.8% net profit margin. We are New Zealand’s second largest health insurer and increased consumer awareness of the value of private health insurance was experienced due to the pandemic appears to be mirroring the same experience in Australia.
Statutory EPS of 19.8 cps compared unfavorably with 32.9 cps in FY19 due to a combination of lower profit margins and investment income which fell to $16.6 million versus $36.1 million in FY19.
It’s extremely hard to forecast what improvement we might reasonably expect in FY21 and beyond given the ongoing COVID-19 volatility and, on this basis, we continue to suspend earnings guidance.
Nevertheless, we have every confidence in the private health sector and see a future in which nib will play an expanded role in healthcare. The new joint venture we have forged with Cigna, Honeysuckle Health, is a critical piece in this strategy. As Steve mentions, members and travellers can look forward to a future in which we are as much about protecting the health of our members and travellers as we are supporting their treatment. And it’s all based upon individual needs informed by artificial intelligence and data science.
Across the Group we have a genuine belief and philosophy that what’s good for the communities in which we operate is also good for nib. It explains the efforts and investment we’re making around sustainability or as often described ESG (Environmental, Social and Governance). There are five principles underpinning our sustainability efforts, which our set out in our 2020 Sustainability Report. All are important, yet as a healthcare business we especially view population health as the greatest opportunity for nib to a make a difference. Already in New Zealand we are actively supporting a Māori iwi, Ngāti Whātua Ōrākei with some great results and we’re looking to emulate that initiative in other geographies.
My thanks to our Board of Directors, Executive management team and all employees for their efforts and contribution to the nib Group in what have been extraordinary circumstances.
Mark Fitzgibbon

Operating and Financial Review continued For the year ended 30 June 2020 nib holdings limited
6
nib Group
nib Group (nib) achieved a sound operating result in financial year 2020 (FY20), notwithstanding the significant economic and global health impact of COVID-19. While the pandemic has created disruption and challenges for many industries and organisations, nib’s business strategy, member-first focus and operational capability has us in good shape to continue to deliver ongoing value for shareholders.
As both our Chairman and Managing Director have highlighted in their reviews of the latest year, nib’s focus has been supporting our members, travellers, employees and the community through this challenging period. From financial hardship support and postponement of premium increases for our health insurance members, to donating together with nib foundation, $1.5 million to community and clinical initiatives, our response to the pandemic has been driven by our guiding principle of “your better health’. Already our COVID-19 member and community support package across the Group is more than $45 million.
nib’s 2020 Sustainability Report provides further details of our COVID-19 response to meet the ongoing health and financial support needs of key stakeholders across the Group.
In terms of financial performance, FY20 net profit after tax (NPAT) was $89.2 million (down 40.3%), with the result impacted by a decline in Group underlying operating profit (UOP) of 25.6% to $150.1 million and investment income down 54.0% to $16.6 million.
Group UOP includes a provision set aside for an expected claims catch-up as members access the healthcare treatment that was disrupted due to COVID-19. This is in recognition of the fact that the need for these treatments has not disappeared with most simply postponed. We expect members over the course of FY21 will catch-up this treatment with a provision of $98.8 million across the Group provided to meet this return of claims activity.
The Board declared a full year dividend of 14.0 cents per share fully franked (FY19: 23.0 cents per share), representing a payout ratio of 71% of FY20 NPAT. The full year dividend comprises an interim dividend of 10.0 cents per share and a final dividend of 4.0 cents per share.
The final dividend will be paid to shareholders on 6 October 2020 with nib’s Dividend Reinvestment Plan (DRP) available to eligible shareholders.

Operating and Financial Review continuedFor the year ended 30 June 2020 nib holdings limited
7
Australian residents health insurance (arhi)
Our core earnings driver arhi again led the way, accounting for 89.0% of Group UOP. While arhi’s UOP of $133.6 million was down 10.6% on FY19, the result includes a $90.4 million COVID-19 claims provision.
In the face of challenging market conditions arhi grew premium revenue to $2.1 billion. This was an increase of 2.9% and delivered a net profit margin of 6.4%. arhi’s premium revenue growth was impacted by our postponement of the 1 April 2020 price increase for six months to provide financial relief to members during the pandemic. Premium revenue growth would have otherwise been 3.7%.
We continue to realise the benefits of our diversified and multi-channel distribution strategy, with net policyholder growth of 1.9% compared to 0.4% for the industry. Overall arhi accounted for 41.5% of total private health insurance industry growth during FY20.
As the health insurer of choice for almost 1.2 million Australians, we’ve been swift and deliberate in our response to support our members who during the year have endured drought, bushfires and more recently the financial and health uncertainty of COVID-19.
In addition to financial hardship assistance, we’ve also provided broader coverage for COVID-19 related treatment and further psychology benefits at no additional cost to our members. Due to the impact of social distancing and lockdown measures on many health services, we’ve offered new benefits for telehealth consultations across a range of health services and introduced free antenatal and early parenting online classes, helping our members to continue accessing the care they need.
And recognising the efforts of our frontline healthcare workers to prepare our health system during the pandemic, we provided eligible members a $250 rebate to support their health and wellbeing in a way that best suits them.
An ongoing focus on operational efficiencies to not only reduce management expenses (down 5.5%) but also enhance the member experience has continued to deliver mutual benefit during the year. Improving the speed and turnaround times of processing and paying claims through automation initiatives has been one area of attention.
In most cases, of the 4.8 million claims submitted by members for payment in FY20, 78% were processed and ready for payment within 24 hours of receiving a completed claim. Our focus on delivering against member expectations and digital first approach saw our Net Promoter Score1 climb from 32.5 (FY19) to 35.3 (FY20).
1. Excludes GU Health

Operating and Financial Review continued For the year ended 30 June 2020 nib holdings limited
8
International inbound health insurance (iihi)
Our iihi business produced a sound operating performance despite the headwinds faced as a result of COVID-19 related international travel restrictions.
iihi’s track-record of strong top line growth continued with premium revenue up 11.8% to $123.1 million. Net policyholder growth was 6.3% despite slowing student and worker arrivals due to the pandemic, with the business surpassing 200,000 persons covered.
Consistent with the first half 2020 result, claims expense growth for the full year of almost 46% reflects a combination of policyholder growth as well as an increase in members accessing medical services. This margin and earnings compression mirrors a conscious effort to enhance member value, with the business
still delivering a healthy net margin of 17.1% (FY19: 31.1%), in line with expectations with UOP of $22.2 million down 36.4%.
Recognising that our international members are facing unique challenges due to the pandemic and living away from home, we’ve introduced a range of support measures including premium relief, coverage for telehealth services, free health and hygiene packages as well as partnering with OzHarvest to provide 54,000 meals for students struggling to make ends meet.
Despite an uncertain outlook in terms of Australia’s future international student and worker intake, the iihi business remains well positioned to navigate current market conditions and capitalise on growth opportunities when they emerge.
nib New Zealand
nib New Zealand delivered a positive operating performance with the business improving revenue and earnings. UOP increased 18.2% to $23.4 million, and includes an $8.4 million COVID-19 deferred claims provision.
Our organic growth strategy continued to yield results with net policyholder growth of 7.4%, with success in growing our corporate group and whitelabel channel, which includes leading brand, the New Zealand Automobile Association.
Supporting our Kiwi members and communities to stay safe and healthy throughout the COVID-19 pandemic has been a priority. In addition to financial hardship measures and expanded coverage for COVID-19 related treatment, we extended cover for GP and specialist consultations through telehealth consultations, assisting members to continue accessing healthcare during the severe lockdown restrictions. We also extended treatment pre-
approval from three to six months, meaning our members did not need to reapply for surgery approval if they experienced delays in accessing hospital treatment.
Our population health initiative with Māori iwi, Ngāti Whātua Ōrākei, continues to focus on improving population health and wellness as well as helping members access healthcare. The partnership aims to tackle barriers that Māori experience in the public system such as cost, choice, waiting times and accessibility. During the year the program surpassed more than 3,900 lives covered, with COVID-19 Alert Level 4 restrictions limiting the rollout of onsite health management programs.
Operating and Financial Review continued For the year ended 30 June 2020 nib holdings limited
9
nib Travel
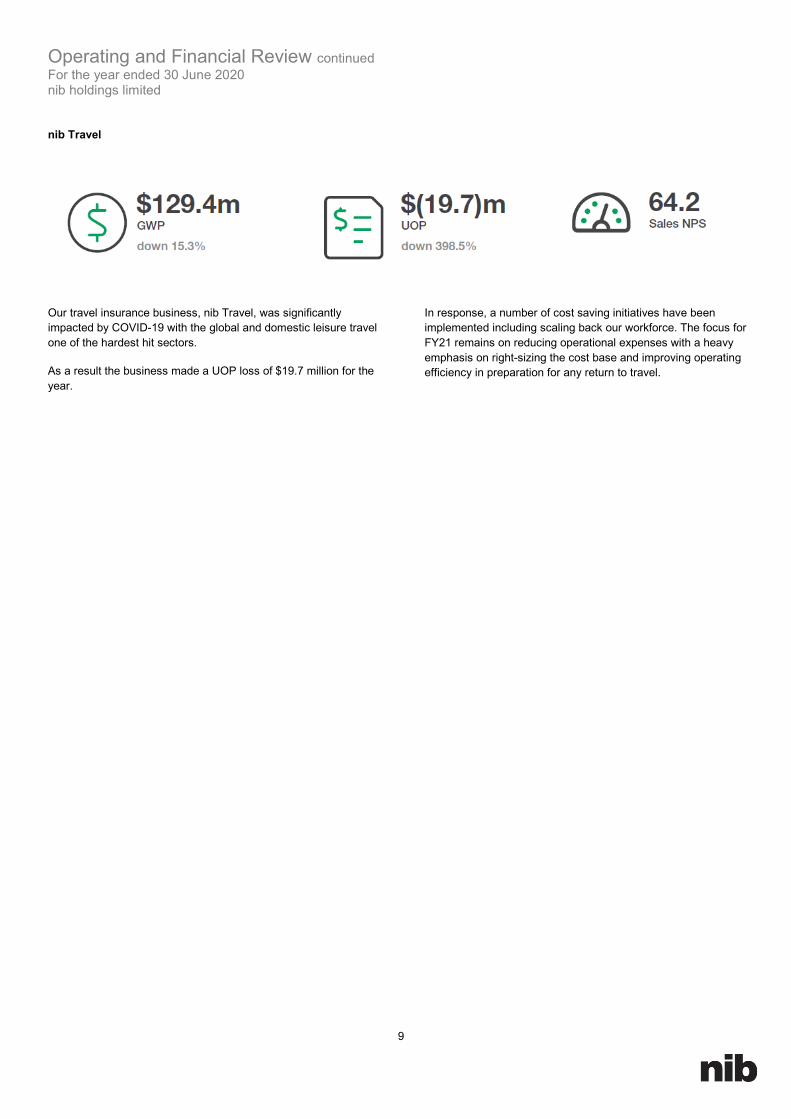
Our travel insurance business, nib Travel, was significantly impacted by COVID-19 with the global and domestic leisure travel one of the hardest hit sectors.
As a result the business made a UOP loss of $19.7 million for the year.
In response, a number of cost saving initiatives have been implemented including scaling back our workforce. The focus for FY21 remains on reducing operational expenses with a heavy emphasis on right-sizing the cost base and improving operating efficiency in preparation for any return to travel.

Operating and Financial Review continued For the year ended 30 June 2020 nib holdings limited
10
PRINCIPAL RISKS AND UNCERTAINTIES nib has established policies for the oversight and management of material business risks. Further information regarding how nib recognises and manages risk is detailed in Principle 7 of our Corporate Governance Statement. The Corporate Governance Statement is available on our website at nib.com.au As for most corporations, the dynamic nature of the COVID-19 pandemic during the final months of the financial year has proven to be a true test of resilience for nib. In terms of the Principle Risks, COVID-19 has thrown up many new scenarios for us to assess, design new responses to and then execute upon – all in real time. Impacts of the pandemic have been apparent across all the different risk types: insurance, financial, strategic and operational. So far, nib has been able to leverage from our solid foundations for managing risk in order to facilitate efficacious outcomes. The maintenance of sound business continuity plans (BCPs) and pandemic plans during this period is one example, whereby nib
has continued to operate effectively during a period of significant stress, based on previous investment into robust control frameworks. Our BCPs have enabled us to rapidly redeploy people, assets and resources in order to maintain service levels for our Members and Travelers. Having strong fundamentals has allowed us to quickly refocus on strategic risks and opportunities. We have subsequently shown agility in providing increased value to our Members via initiatives such as: postponement of premium increases, cover for telehealth services, 24/7 health assistance and financial hardship support. Whilst there is positivity ahead as the health impacts of the pandemic abate, nib will continue to monitor and manage our Principal Risks closely within what is likely to be a challenging macro-economic environment.
Further to the Sustainability risks and approaches detailed on our website at nib.com.au/shareholders, principal risks and uncertainties for nib include:
Insurance risks Claims inflation and affordability
nib is subject to significant claims inflation which may not be adequately covered by premium price increases and/or product design changes. Key sources of claims inflation risk include the renewal of key provider contracts on acceptable terms, service utilisation rates, services related to complex and members with high cost needs (usually with chronic diseases), claims leakage, provider and member fraud, public hospital claiming, as well as general provider behaviour, which results in a weakening of nib’s gross margin and overall profitability. Additionally, members are increasingly facing household affordability pressures. If growth of premiums over time were to be uncontrolled, it could result in a reduced value proposition leading to significant numbers of policy holders reducing their cover. During the COVID-19 pandemic, nib has rapidly deployed a series of initiatives to help improve the value proposition and to partially allay affordability challenges being faced by Members.
Pricing risk
Australian health insurance premium increases for existing products are required to be approved by the Minister for Health. Historically, nib and other health funds have only raised premiums once a year. There is a risk that nib’s application for a change in its premium rates may only receive approval at a level lower than originally requested, or may be rejected by the Minister. Such an amendment or rejection may have a negative impact on nib’s operating and financial performance. Furthermore, there are operational risks associated with pricing and forecasting involving process, people and system. Control failures could negatively impact pricing decisions, financial performance and regulations such ASX Continuous Disclosure obligations. COVID-19 has created additional challenges for our pricing processes in Australia and New Zealand. Our annual pricing increase was postponed until October. Pricing risks relating to economic conditions and government policy continue to be closely monitored.
Government policies and regulations
A number of regulatory policy settings and incentives notably impact the Australian private health insurance market. Examples include Federal or State Governments taxes and duties, risk equalisation arrangements supporting the community rating principle, PHI Rebates and Life Time Health Cover Loading. Unanticipated modifications to regulations in the future may result in an adverse financial impact on nib and the structure of the wider private health insurance industry.

Operating and Financial Review continued For the year ended 30 June 2020 nib holdings limited
11
PRINCIPAL RISKS AND UNCERTAINTIES continued
Financial risks Investment and capital management
A substantial proportion of nib’s profits are generated from its investment portfolio. Consequently, investment performance significantly affects nib’s profits and financial position. Effective management of investments and capital is required in order to meet Return On Investment (ROI) objectives, nib’s prudential requirements and in order to satisfy stakeholder expectations.
General economic conditions
nib’s performance is impacted by the broader Australian economic conditions such as inflation, interest rates, exchange rates, credit markets, consumer and business spending and employment rates which are outside nib’s control. The environment in which nib operates may experience challenging conditions as a result of general uncertainty about future Australian and international economic conditions. The assumption is that nib continue to operate in challenging conditions for the near term based on pandemic-related economic contraction in Australia and global markets.
Strategic risks Performance of adjacent (non-Australian Residents Health Insurance) businesses
In recent years, in addition to focusing on its Australian regulated health insurance business, nib has diversified its business and identified adjacent earnings opportunities, such as International (Inbound) Health Insurance, New Zealand, nib Travel and Grand United Corporate Health. These adjacent businesses now make a meaningful contribution to nib’s operating result and as a result the performance of these businesses could affect nib’s profits. The industry-specific impacts of COVID-19 on nib’s travel and inbound international health insurance are an example of this risk in practice.
Merger or acquisition opportunities
nib has a business strategy of pursuing merger and acquisition opportunities. The pursuit of merger and acquisition opportunities carries with it risks and there is no guarantee that such a strategy will be successful.
Operational risks Business continuity
There is uncertainty surrounding events that have the potential to prevent nib from continuing to operate its businesses and in the effectiveness of the processes nib has established to manage those events. Impacts of events such as natural disasters or a major failure or inadequacy in information technology systems, may have an adverse effect on nib’s earnings, assets and reputation. The COVID-19 pandemic is an example of a significant business continuity event that has required nib to activate its mitigation strategies to ensure effective continuity of service.
Cyber Security
The health insurance industry relies increasingly on technology to conduct an efficient and cost effective business. nib’s approach is also increasingly reliant on the personalisation of our relationship with members using digital and data strategies. nib faces the risk, in common with other participants, that a cyber-attack or major security incident could result in adverse impacts to members, disruption to nib’s business continuity, non-compliance with regulations and data standards and negative reputational effects.
Regulatory compliance and legal risks
nib is subject to a high degree of regulation concerning how private health insurers conduct their health insurance business. If nib does not comply with its regulatory requirements, it may suffer results including financial penalties, cancellation of authorisations and / or negative reputational impacts. In terms of legal risk, nib could be involved in civil proceedings in courts of various jurisdictions. nib may also be exposed to litigation in the future over claims which may affect its business. To the extent that these risks are not covered by nib’s insurance policies, litigation or the costs of responding to these legal actions could have a material adverse impact on nib’s financial position, earnings and share price.

Operating and Financial Review continued For the year ended 30 June 2020 nib holdings limited
12
PRINCIPAL RISKS AND UNCERTAINTIES continued
Operational risks continued Worker Health & Safety
nib is responsible for managing the physical and mental health and safety of employees and the broader range of individuals that visit our premises or undertake work on our behalf. Given the nature of our business and our physical work environment, the likelihood of death or serious injury is rare. However if realised, a threat to the physical and mental/psychological health and safety of employees could have a significant impact in terms of reputation, employee morale, financial cost to the company and legal consequences. During COVID-19, nib has responded to the dynamic WHS challenges by launching a series of targeted initiatives including programs for: ergonomic reimbursements, increased Employee Assistance Program (EAP) sessions for employees and their immediate family members, flu vaccinations as well as information and training modules related to mental health.

Operating and Financial Review continued For the year ended 30 June 2020 nib holdings limited
13
FIVE YEAR SUMMARY
2020 2019 2018 2017 2016
$m $m $m $m $m
Consolidated Income StatementNet premium revenue 2,439.6 2,340.8 2,162.6 1,943.1 1,818.7Net claims incurred (1,933.4) (1,811.4) (1,694.3) (1,545.8) (1,481.0)Gross margin 506.2 529.4 468.3 397.3 337.7Other underwriting revenue 3.5 3.6 3.0 1.0 -Management expenses (329.0) (329.1) (287.1) (242.1) (209.3)Underwriting result 180.7 203.9 184.2 156.2 128.4Other income 60.1 77.2 69.5 60.4 54.4Other expenses (86.7) (78.3) (68.4) (62.6) (50.8)Share of net profit / (loss) of associates and joint ventures (4.0) (1.0) (0.5) (0.3) -Underlying operating profit 150.1 201.8 184.8 153.7 132.0Amortisation of acquired intangibles (10.4) (9.2) (8.4) (7.6) (7.8)Impairment of intangibles (8.0) (1.0) - - -One-off transactions, merger, acquisition and new business implementation costs (13.6) (7.0) (7.4) 4.5 (3.4)Statutory operating profit 118.1 184.6 169.0 150.6 120.8Finance costs (9.7) (7.7) (6.3) (4.8) (5.3)Net investment income 16.6 36.1 29.6 28.6 16.9Profit before tax 125.0 213.0 192.3 174.4 132.4Tax (35.8) (63.7) (58.8) (54.2) (40.6)NPAT 89.2 149.3 133.5 120.2 91.8
Consolidated Balance SheetTotal assets 1,682.5 1,554.1 1,447.5 1,136.1 1,045.6Equity 606.4 632.2 557.8 427.6 386.1Debt 232.9 233.9 230.6 153.2 151.9
Share PerformanceNumber of shares m 456.8 455.6 454.8 439.0 439.0Weighted average number of shares - basic m 456.1 455.4 450.6 439.0 439.0Weighted average number of shares - diluted m 456.1 455.4 450.6 439.0 439.0Basic earnings per share cps 19.8 32.9 29.4 27.2 21.2Diluted earnings per share cps 19.8 32.9 29.4 27.2 21.2Underlying earnings per share 1 cps 24.7 35.4 31.9 27.7 22.9Share price at year end $ 4.61 7.67 5.73 5.75 4.22Dividend per share - ordinary cps 14.00 23.00 20.00 19.00 14.75Dividend payout ratio - ordinary % 71.0 70.0 68.5 70.0 70.0
Other financial dataROIC % 11.2 19.1 19.5 22.7 19.0Group underlying operating revenue $m 2,503.2 2,421.6 2,235.1 2,004.5 1,873.1Operating cash f low $m 211.6 184.5 179.9 171.7 148.4
1 Underlying earnings per share is the Basic earnings per share adjusted for one off transactions

Directors’ Report For the year ended 30 June 2020 nib holdings limited
14
The Directors of nib holdings limited (Company) present their report on the consolidated entity (Group) consisting of nib holdings limited and the entities it controlled at the end of, or during, the year ended 30 June 2020. DIRECTORS The following persons were Directors of nib holdings limited during the whole of the financial year and up to the date of this report: Steve Crane Mark Fitzgibbon Lee Ausburn Jacqueline Chow Anne Loveridge Christine McLoughlin Donal O’Dwyer David Gordon was appointed as a Director on 29 May 2020. PRINCIPAL ACTIVITIES The principal activities of the nib Group during the financial year were as a private health insurer in Australia and New Zealand, whereby it underwrites and distributes private health insurance to Australian and New Zealand residents as well as international students and visitors to Australia. Through its nib Travel business, it also specialises in the sale and distribution of travel insurance policies globally. During the year, the Group commenced specialist health care data science services through its joint venture with Cigna, Honeysuckle Health. REVIEW OF OPERATIONS Information on the operations and financial position of the Group and its business strategies and prospects is set out in the Operating and Financial Review on pages 4 to 13 of this Annual Report. SIGNIFICANT CHANGES IN THE STATE OF AFFAIRS There were no other significant changes in the state of affairs of the Group during the financial year. LIKELY DEVELOPMENTS AND EXPECTED RESULTS FROM OPERATIONS Additional comments on expected results on operations of the Group are included in this Annual Report under Operating and Financial Review on pages 4 to 13. Further information on likely developments in the operations of the Group have not been included in this Annual Report because the Directors believe it would be likely to result in unreasonable prejudice to the Group.
DIVIDENDS Dividends paid to shareholders during the financial year were as follows:
2020 2019$m $m
Final dividend for the year ended 30 June 2019 of 13.0 cents (2018 - 11.0 cents) per fully paid share paid on 30 September 2019 59.2 50.0
Interim dividend for the year ended 30 June 2020 of 10.0 cents (2019 - 10.0 cents) per fully paid share paid on 7 April 2020
45.5 45.5104.7 95.5
In addition to these dividends, since the end of the financial year the Directors have recommended the payment of a fully franked final dividend of $18.3 million (4.0 cents per fully paid ordinary share) to be paid on 6 October 2020 out of retained profits at 30 June 2020. MATTERS SUBSEQUENT TO THE END OF THE FINANCIAL YEAR No matter or circumstance has arisen since 30 June 2020 that has significantly affected, or may significantly affect: a) the Group’s operations in future financial years; or b) the results of those operations in future financial years; or c) the Group’s state of affairs in future financial years. ENVIRONMENTAL REGULATION The Group is not subject to any specific environmental regulation and has not breached any legislation regarding environmental matters.

Directors’ Report continued For the year ended 30 June 2020 nib holdings limited
15
INFORMATION ON DIRECTORS Details of the qualifications, experience, special responsibilities and interests in shares and performance rights of the Directors are as follows:
Steve Crane - Chair BCom (University of Newcastle), FAICD, SF Fin Independent Non-Executive Director Industry experience Steve has more than 40 years’ of financial market experience, as well as a long and successful history of directorships of publicly-listed companies. He began his career at AMP, working in funds management. When ABN AMRO acquired BZW Australia and New Zealand in 1998, Steve became Chief Executive and remained in this role until his retirement. Since then, he has been a member of boards in a variety of different sectors including banking, investment fund management, retail, property, resources and superannuation. Steve has expertise in developing and leading international businesses, reviewing, scrutinising and implementing corporate strategy, people leadership and government interactions at senior levels. Directorships of listed entities Steve is a Non-Executive Director of APA, including APT Pipelines Limited and SCA Property Group. Former directorships of listed entities in the past three years None. Other business and market experience Steve has previously been a Non-Executive Director of Bank of Queensland, Transfield Services Limited, Investa Property Group (Chair), Foodland Associates, Adelaide Bank Limited, Adelaide Managed Funds, Investment Banking and Securities Association (Chair), APA Ethane Limited and a Trustee of ARIA (a Commonwealth employee superannuation fund). Other commitments Steve is Chair of Taronga Conservation Society Australia and Chair of Global Valve Technology Limited. Interests in shares and performance rights Indirect: 250,000 ordinary shares in nib holdings limited held by Depeto Pty Ltd.
Mark Fitzgibbon – Chief Executive Officer and Managing Director MBA (University of Technology Sydney), MA (Macquarie University), ALCA (Charles Sturt University), FAICD Executive Director Mark joined nib in October 2002 as Chief Executive Officer. In 2007 as Managing Director, he led nib through its demutualisation and listing on the Australian Securities Exchange (ASX) being admitted to the S&P/ASX100 in 2019. Mark is a Director of nib health funds limited, as well as many other nib holdings limited’s subsidiaries. He is also a member of nib holding’s Nomination Committee. Industry experience Mark has held executive positions at a number of large Australian organisations, including local government councils and peak bodies. Leading nib for almost 20-years, Mark has transformed the business from a regionally based (Newcastle, NSW) private health insurer into one of Australia’s fastest growing and innovative health funds. As Managing Director, Mark’s strategic focus has been to grow and diversity nib’s business and with that earnings by leveraging nib’s capability, systems and people. This has seen nib grow significantly in recent years organically and inorganically, both in existing and new markets. Directorships of listed entities None. Former directorships of listed entities in the past three years None. Other business and market experience Mark has previously served as CEO of both the national and NSW peak industry bodies for licensed clubs, as well as holding several General Manager positions in local government. Other commitments Mark is currently a Director of Private Healthcare Australia. Interests in shares and performance rights Direct: 1,875,847 ordinary shares in nib holdings limited. Indirect: 724,621 ordinary shares in nib holdings limited held by Fitzy (NSW) Pty Ltd.

Directors’ Report continued For the year ended 30 June 2020 nib holdings limited
16
INFORMATION ON DIRECTORS continued • 225,978 performance rights under FY17-FY20 Long Term Incentive Plan which may vest from 1 September 2020. • 222,298 performance rights under FY18-FY21 Long Term Incentive Plan which may vest from 1 September 2021. • 215,962 performance rights under FY19-FY22 Long Term Incentive Plan which may vest from 1 September 2022. • 200,632 performance rights under FY19-FY22 Long Term Incentive Plan which may vest from 1 September 2022. Lee Ausburn MPharm (University of Sydney), BPharm (University of Sydney), Dip Hosp Pharm (University of Sydney), FAICD Independent Non-Executive Director Lee was appointed to the Board of nib holdings limited in November 2013. She is Chair of the People and Remuneration Committee and a member of the Risk and Reputation Committee and Nomination Committee.
She is also a Director of nib health funds limited.
Industry experience With more than 30 years' experience in the pharmaceuticals industry, Lee has a wealth of knowledge in the global health industry. Lee is a pharmacist with experience in retail and hospital pharmacy, as well as in academia. She had a long career in the pharmaceutical industry with Merck Sharp and Dohme (Australia) Pty Ltd and was previously Vice President - Asia for Merck and Co Inc with responsibility for the company’s operations across nine countries.
At Merck and Co Inc, Lee built high performing organisations with enhanced ethical and compliance frameworks, across the Asia Pacific region. She also has extensive marketing experience with customer centric approaches that had proven results with the region growing strongly under her leadership. Operating in a highly regulated industry, Lee also developed strong regulatory and government relations skills.
She also has experience operating joint ventures, including chairing the Far East Operating Board, overseeing the successful Merck-Schering Plough Asia Pacific Joint Venture from 2003 to 2007.
Directorships of listed entities Lee is currently a Director of pharmaceutical wholesaling and pharmacy retail business, Australian Pharmaceutical Industries Ltd and medical device company, SomnoMed Ltd.
Former directorships of listed entities in the past three years None. Other business and market experience Lee was previously a member (2010-2015) and President (2015-2017) of the Pharmacy Foundation at the University of Sydney.
She’s also been an industry representative on the Australian Government's Pharmaceutical Health and Rational Use of Medicines Committee (1993-1996) and the Drug Utilisation Subcommittee (1995-1997).
In NSW, she was a Board member of NSW Health’s Clinical Excellence Commission and the Agency for Clinical Innovation (2010-2014), established to enhance quality and safety in NSW hospitals.
Lee is currently a Mentor for Women on Boards.
Interests in shares and performance rights Indirect: 20,000 ordinary shares in nib holdings limited held by Leedoc Pty Ltd and 30,885 ordinary shares in nib holdings limited held by MIML Pension Consolidator (Lee Ausburn). Jacqueline Chow B.Sc (Hons) (University of New South Wales), MBA (Northwestern University, Chicago), GAICD Independent Non-Executive Director Jacqueline was appointed to the Board of nib holdings limited in April 2018. She is Chair of the Risk and Reputation Committee and a member of the Nomination Committee, Audit Committee and People and Remuneration Committee.
She is also a Director of nib health funds limited.
Industry experience Jacqueline has more than 20 years’ experience working with global blue-chip consumer product multinationals in a range of executive and non-executive positions in general management, strategy, marketing as well as technology and innovation. Her early career concentrated on business analytics, brand equity and marketing.
With a reputation for driving growth and performance in global businesses, she is passionate about unlocking value through the entire value chain by growing consumer demand through disruptive technologies, innovation and digital platforms.

Directors’ Report continued For the year ended 30 June 2020 nib holdings limited
17
INFORMATION ON DIRECTORS continued Directorships of listed entities Jacqueline is currently a Non-Executive Director of Coles Group Limited. Former directorships of listed entities in the past three years None. Other business and market experience Jacqueline has significant global experience driving strategic growth and innovation across customer and consumer brands for the likes of Fonterra, Campbell Arnott’s and the Kellogg Company. She was previously Deputy Chair of Global Dairy Platform and a Director of Fisher & Paykel Appliances in New Zealand, Dairy Partners Americas, the Riddet Institute (Massey University NZ) and The Arnott’s Foundation. In her role with McKinsey & Company RTS, she advises clients across resources, retail, financial services, telecommunications and consumer sectors on organisational change and high performance culture. Other commitments Jacqueline is a Non-Executive Director of the Australia-Israel Chamber of Commerce and a senior advisor with McKinsey & Company RTS. She is also a member of Chief Executive Women. Interests in shares and performance rights Direct: 50,000 shares in nib holdings limited. David Gordon LLB (University of NSW), BCom (University of NSW) Independent Non-Executive Director David was appointed to the Board of nib holdings limited in May 2020. He is also a member of the Audit Committee, People and Remuneration Committee and Nomination Committee. He is also a Director of nib health funds limited.
Industry experience David has over 20 years’ experience as a director of both public and private companies and has spent more than 30 years working in corporate advisory roles to Australian and international organisations. He brings extensive knowledge of mergers and acquisitions, as well as capital raisings, IPOs and joint ventures.
David also has a proven track record in guiding businesses to harness their digital asset capability to successfully explore and grow new markets.
Directorships of listed entities David is currently Chair of Accent Group Limited.
Former directorships of listed entities in the past three years Non-Executive Director and Chair of Ten Network Holdings Limited.
Other business and market experience David has held a number of senior roles with Freehills (Partner) and boutique investment bank Wentworth Associates (acquired by Investec in 2001). In addition, he founded independent corporate advisory and investment firm, Lexicon Partners in 2001, where he still serves as Founding Principal.
Other commitments David is Chair of Ordermentum Pty Ltd and General Homecare Holdings Pty Ltd. He is also a Non-Executive Director of Genesis Capital Investment Management Pty Ltd, General Medical Holdings Pty Ltd, Stilmark Holdings Pty Ltd and international not-for-profit organisation, High Resolves Pty Ltd. Anne Loveridge - BA (Hons) (University of Reading), FCA, GAICD Independent Non-Executive Director Anne was appointed to the Board of nib holdings limited in February 2017. She is the Chair of the Audit Committee and a member of the Investment Committee, Risk and Reputation Committee and Nomination Committee.
She is also Chair of nib nz holdings limited's Board, Audit, Risk and Compliance Committee.
In addition, Anne is a Director of nib health funds limited and nib nz holdings limited's subsidiaries.
Industry experience Anne has over 35 years’ of experience in banking, wealth management, private equity and property. She has extensive knowledge of financial and regulatory reporting, risk management controls and compliance frameworks. She also has experience as a Committee Chairperson and Non-Executive Director for three other ASX-listed organisations.

Directors’ Report continued For the year ended 30 June 2020 nib holdings limited
18
INFORMATION ON DIRECTORS continued Formally trained as a Chartered Accountant, Anne has a breadth of experience in financial reporting, auditing, risk, ethics and regulatory affairs following her 31 years with PwC Australia, where she retired as Partner and Deputy Chair in 2015. Through senior leadership roles in the firm, Anne also has experience and a focus on leadership, performance and culture. She was specifically involved in the creation of targets, mentoring and development programs for senior executives, as well as evaluating organisational training programs to identify areas of bias. Anne Loveridge is entitled to receive a retirement benefit from PwC as part of her retirement plan. The amount of the payment was determined at the time of retirement, based on role and tenure with the firm. The benefit is not impacted by the revenue, profits or earnings of PwC. Anne has declared her previous relationship with PwC to the nib Board and the Board is satisfied that it does not affect her independence as Non-Executive Director and does not constitute a conflict of interest. The nib Board has in place mechanisms to manage conflicts of interest where they arise. Directorships of listed entities Anne is a Non-Executive Director of Platinum Asset Management (Chair of the Audit, Risk and Compliance Committee) and a Non-Executive Director of National Australia Bank Limited (Chair of the Remuneration Committee). Former directorships of listed entities in the past three years None. Other commitments Anne is Chair of Australian theatre company, Bell Shakespeare Limited. Interests in shares and performance rights Direct: 23,885 shares in nib holdings limited. Christine McLoughlin BA, LLB (Hons) (Australian National University), FAICD Independent Non-Executive Director Christine McLoughlin was appointed to the Board of nib holdings limited in March 2011. She is a member of the Risk and Reputation Committee, Audit Committee and Nomination Committee. Ms McLoughlin is also a Director of nib health funds limited. Industry experience
Christine McLoughlin has more than 25 years’ of experience in business with roles as Chair, Director and executive within multiple listed, private and not-for-profit organisations. Ms McLoughlin is an accomplished company director and business leader, having held senior executive positions in financial services in Australia and internationally. She has also served on the boards of ASX 50 companies in financial services, telecommunications, resources, and infrastructure for the past 12 years. Christine is recognised for achievements in driving continuous improvements in organisational culture and performance, and deep experience in regulatory processes and governance. Directorships of listed entities Ms McLoughlin is Chairman of Suncorp Group Limited including Chairman of the Nomination Committee and an ex-officio member of the Audit, Customer, People and Remuneration, and Risk Committees. Former directorships of listed entities in the past three years Whitehaven Coal Limited and Spark Infrastructure RE Limited. Other business and market experience Christine was formerly Chairman, Venues NSW, Deputy Chair of The Smith Family, inaugural Chair of the Australian Payments Council. She was also a Director of each of Westpac’s insurance businesses, as well as the Australian Nuclear Science & Technology Organisation and Victoria’s Transport Accident Commission. In April 2020, Christine was appointed by the Federal Government as the Private Sector Representative for Australia for the G20 Empowerment and Progression of Women's Economic Representation (EMPOWER). She has also been involved in several significant Government assignments. Other commitments Christine is Chancellor-elect of the University of Wollongong. She is also Chairman and Co-Founder of the Minerva Network and a Director of the McGrath Foundation. She is also a member of the Chief Executive Women, a Fellow of the Australian Institute of Company Directors and a Telstra Business Woman of the Year in 2000. Interests in shares and performance rights Indirect: 110,885 ordinary shares in nib holdings limited held by Dundas Street Investments Pty Ltd

Directors’ Report continued For the year ended 30 June 2020 nib holdings limited
19
INFORMATION ON DIRECTORS continued Donal O'Dwyer MBA (Manchester Business School), BE (University College, Dublin) Independent Non-Executive Director Donal was appointed to the Board of nib holdings limited in March 2016. He is Chair of the Investment Committee, and a member of the Risk and Reputation Committee, People and Remuneration Committee and Nomination Committee. He is also a Director of nib health funds limited. Industry experience Donal has a deep knowledge of the health industry globally, after more than 35 years in senior executive and Non-Executive Director roles within the healthcare products and medical device sectors. Starting his career as a qualified civil engineer, he went on to gain experience in business, science, engineering, manufacturing and management. During his tenure with Baxter Healthcare, he rose through the ranks from plant manager to President of the Cardiovascular Group Europe, gaining a sound understanding of the inner workings of business strategy and fiscal management, from the floor of the factory through to the boardroom. He then worked for Cordis (the cardiovascular device franchise of Johnson & Johnson) – initially as European President and later, when he located to the US, he served as Worldwide President. In his role as member of the nib Risk and Reputation Committee, Donal has a strong interest in environmental, social and governance factors and how these performance indicators can help promote long term financial success. Directorships of listed entities Donal is a Non-Executive Director of Cochlear Ltd, Mesoblast Ltd (Chair of the Nomination and Remuneration Committee) and Fisher & Paykel Healthcare Corporation Ltd. Former directorships of listed entities in the past three years Chair of CardieX Limited (formerly AtCor Medical Holdings Limited). Interests in shares and performance rights Indirect: 41,485 ordinary shares in nib holdings limited held by Dundrum Investments Pty Ltd.

Directors’ Report continued For the year ended 30 June 2020 nib holdings limited
20
COMPANY SECRETARIES Ms Roslyn Toms LLB (UNSW), BA Comms (Hons) (UCAN/UTS), GAICD was appointed Company Secretary on 29 April 2013. Ms Toms is also Group Executive - Legal and Chief Risk Officer and is responsible for managing legal, risk, compliance, governance, community & sustainability across the nib group businesses in Australia and its global operations. Ms Toms has over 15 years' experience in-house and in private practice and is a member of the Law Society of NSW and the Governance Institute. She is also director of the nib foundation and is a graduate of the Australian Institute of Company Directors (AICD). Mr Jordan French (BSc (Hons) LLB (Macquarie)) was appointed Company Secretary on 15 August 2017. Mr French also acts in the role of Senior Corporate Counsel for the nib Group, as well as the Company Secretary for nib foundation Ltd. MEETINGS OF DIRECTORS The number of meetings of nib holdings limited’s Board of Directors and of each Board committee held during the year ended 30 June 2020, and the numbers of meetings attended by each Director are noted below:
Name Held 2 Attended Held Attended Held Attended Held Attended Held Attended Held Attended
S Crane 21 21 6 6* 4 4* 6 6* 4 3* 3 3M Fitzgibbon 21 21 6 6* 4 4* 6 6* 4 4* 3 3L Ausburn 21 21 6 6* 4 4 6 6 4 2* 3 3J Chow 21 21 6 6 4 4 6 6 4 3* 3 3D Gordon 1 2 2 - - - -* - - 1 1* - -A Loveridge 21 20 6 6 4 4 6 6* 4 4 3 3C McLoughlin 21 20 6 6 4 4 6 5* 4 1* 3 3D O'Dw yer 21 20 6 6* 4 4 6 6 4 4 3 3
NominationCommitteeBoard
Audit Committee
Risk and Reputation Committee
People and Remuneration
Committee
Investment Committee
* Director not a member of the stated Committee as at the date of the relevant meeting(s). Attendance by non-members is optional, and any attendance is in an ex-officio capacity. 1. David Gordon was appointed as a Director on 29 May 2020. The stated number of meetings held for Mr Gordon are those that were convened during the term of his appointment. 2. Includes nine unscheduled meetings, seven of which were held in March and April 2020 in response to COVID-19. nib’s Non-Executive Directors participated in a number of site visits, work related functions and staff events during the course of the year including offices in Newcastle, Sydney, Auckland, Manila, San Francisco, Cork and China. REMUNERATION REPORT The Remuneration Report is set out on pages 23 to 44 of the Annual Report and forms part of this Report. SHARES UNDER PERFORMANCE RIGHTS Unissued ordinary shares of nib holdings limited under performance rights at the date of this report are as follows:
Issue priceDate performance rights granted Expiry date of shares5 December 2016 1 September 2020 nil 489,374 27 October 2017 1 September 2020 nil 6,530 15 December 2017 1 September 2021 nil 459,149 23 November 2018 1 September 2022 nil 422,078 11 December 2019 1 September 2023 nil 380,171 28 February 2020 1 September 2023 nil 32,836
Number under performance right
Shares may be issued or acquired on-market at the election of the Company. It is anticipated that the performance rights will be satisfied through on-market share purchases administered by the nib Holdings Ltd Share Ownership Plan Trust. No performance right holder has any right under the performance rights to participate in any other share issue of the Company or any other entity.

Directors’ Report continued For the year ended 30 June 2020 nib holdings limited
21
NON-AUDIT SERVICES The Company may decide to employ the auditor on assignments additional to their statutory audit duties where the auditor’s expertise and experience with the Group are important. Details of the amounts paid or payable to the auditor (PricewaterhouseCoopers) for audit and non-audit services during the year are disclosed in Note 32 - Remuneration of Auditors. The Board of Directors has considered the position and, in accordance with advice received from the Audit Committee, is satisfied that the provision of the non-audit services is compatible with the general standard of independence for auditors imposed by the Corporations Act 2001. The Directors are satisfied that the provision of non-audit services by the auditor, as set out in Note 1, did not compromise the auditor independence requirements of the Corporations Act 2001 for the following reasons: • all non-audit services have been reviewed by the Audit Committee to ensure that they did not impact the impartiality and objectivity of the
auditor • none of the services undermine the general principles relating to auditor independence as set out in APES 110 Code of Ethics for
Professional Accountants. INSURANCE OF OFFICERS During the financial year, the Group paid a premium in respect of a contract insuring the Directors and Officers of the Group against liability incurred as such a Director or Officer, other than conduct involving wilful breach of duty in relation to the Group, to the extent permitted by the Corporations Act 2001. The contract of insurance prohibits disclosure of the nature of the liability and the amount of the premium. AUDITOR’S INDEPENDENCE DECLARATION A copy of the Auditor’s Independence Declaration as required under section 307C of the Corporations Act 2001 is set out on page 22. ROUNDING OF AMOUNTS The Company is of a kind referred to in Instrument 2016/191, issued by the Australian Securities and Investments Commission, relating to the “rounding off” of amounts in the Directors’ Report. Amounts in the Directors’ Report have been rounded off to the nearest hundred thousand dollars in accordance with that Instrument. This report is made in accordance with a resolution of the Directors. On behalf of the Board
Steve Crane Anne Loveridge Director Director Newcastle, NSW 23 August 2020

PricewaterhouseCoopers, ABN 52 780 433 757 Level 3, 45 Watt Street, PO Box 798, NEWCASTLE NSW 2300 T: +61 2 4925 1100, F: +61 2 4925 1199, www.pwc.com.au
Liability limited by a scheme approved under Professional Standards Legislation.
Auditor’s Independence Declaration As lead auditor for the audit of nib holdings limited for the year ended 30 June 2020, I declare that to the best of my knowledge and belief, there have been:
(a) no contraventions of the auditor independence requirements of the Corporations Act 2001 inrelation to the audit; and
(b) no contraventions of any applicable code of professional conduct in relation to the audit.
This declaration is in respect of nib holdings limited and the entities it controlled during the period.
Newcastle SK Fergusson Partner PricewaterhouseCoopers
23 August 2020

Remuneration Report For the year ended 30 June 2020 nib holdings limited
23
MESSAGE FROM THE BOARD
Dear Shareholder nib’s purpose of Your Better Health guides our decision-making to help our members and travellers make more informed healthcare choices, better transact with healthcare systems and generally lead healthier lives. Our purpose also sets the guiding principles in developing our remuneration strategy, ensuring alignment with the interests of our members, travellers, employees, shareholders, and the community’s expectations. Like most industry sectors and organisations around the globe, the unheralded effects of COVID-19 have caused significant business disruption during fiscal year 2020 (FY20). While nib hasn’t been immune to the impacts of the pandemic crisis, our response has been swift, deliberate and considerate of the needs of all our stakeholders. I encourage our shareholders to read this year’s Sustainability Report for further information on what we’ve done in response to COVID-19 to support our employees, members, travellers and the community. We’ve also been cognisant of the significant economic and health impacts of the coronavirus and the flow-on consequences to our remuneration and executive reward strategy for this year and beyond. And while COVID-19 has created challenges for some of our business operations this year, your Board is confident nib’s business strategy and very capable Executive Management team have us well placed to continue to deliver sustainable and strong returns for our shareholders. As a Board we take an active role in understanding the conduct and culture of our organisation to further strengthen the inculcation of the nib values as well as customer focused behaviour. In addition to customer service metrics such as Net Promoter Score, the Board receive regular updates and reporting on employee engagement and risk management insights to track our progress and identify areas for further improvement. And while we acknowledge our business will continue to evolve over time, we’re confident we have the leadership and insights to maintain our long-standing healthy workplace culture. Aligning remuneration with shareholder interests Our executive remuneration and reward strategy hasn’t materially changed in recent years. We continue to regularly consult with a range of industry stakeholders, including major shareholders and shareholder interest groups, to ensure it supports our business objectives, is market competitive, sustainable and aligned to shareholder interests. Pleasingly, at last year’s Annual General Meeting our shareholders again voted overwhelmingly in favour of our Remuneration Report and Managing Director’s Long-Term Incentive Plan. Our approach to remuneration is simple and underpinned by a strong governance framework:
1. our philosophy needs to be fit for purpose and aligned to our organisational strategy; 2. our shareholders need to understand what we pay our people and they need to know how performance is measured and rewarded
- transparency is key; and 3. remuneration must be linked to short and long-term shareholder value creation; the two are inextricably linked.
During the year we have seen the regulatory environment continue to evolve, particularly with regard to governance and remuneration arrangements as outlined in APRA’s draft new prudential standards on remuneration (CPS511). Overall nib is supportive of the intent of CPS511 to strengthen the link between remuneration and accountability. In fact, we think we’ve made sound progress in recent years in aligning our Executive remuneration framework with the changes proposed by APRA, including:
• deferral and escrow arrangements for remuneration relating to nib’s Short-Term Incentive (STI) and Long-Term Incentive (LTI) Plans respectively;
• introducing clawback and malus conditions within our STI and LTI Plans; • applying a 'risk gate' assessment for our STI Plan where our People and Remuneration Committee and Chief Risk Officer evaluate
our risk culture and risk management to confirm Executive performance warrants reward; and • a mix of financial and non-financial performance metrics and hurdles within our STI Plan.
While the draft standard is subject to final adoption and implementation by APRA, nib expects it will have an impact on our overall remuneration and governance frameworks, which we plan to adopt from financial year 2022.
Remuneration Report continued For the year ended 30 June 2020 nib holdings limited
24
MESSAGE FROM THE BOARD continued
Executive reward for FY20 and beyond
As indicated to shareholders in last year’s Remuneration Report, based on our external benchmarks, the Managing Director/Chief Executive Officer's (MD/CEO) total fixed remuneration for FY20 increased by 2.5%, reflecting our intent to position our Executive remuneration at between 50% and 75% of the companies we benchmark. Similar adjustments were made to the rest of the Executive Management team, consistent with this approach. STI and LTI frameworks were unchanged, apart from changes in metrics to reflect 2020 priorities. However, the FY20 STI awards were significantly lower reflecting some commercial targets not being achieved as well as a deliberate moderation to the awards as a COVID-19 related austerity measure.
For FY21 there will be no increase in the MD/CEO's fixed or variable remuneration and generally no increases across the Executive Management and Senior Management teams. Some minor adjustments will be made reflecting significant organisational changes (see below) and increased depth and breadth of responsibility.
Non-Executive Director fees for FY21 will also be held steady. The Board believes that given current market conditions, and particularly the impacts and economic uncertainty created by COVID-19, this is the correct course of action.
Executive changes
We undertook a significant review and realignment of Executive responsibilities in March 2020. Behind the changes were various opportunities to improve business performance and reduce operating costs. A new Executive structure saw the departure of three executives without replacement, the creation of a new executive position and the elevation of two roles to the Executive. There was a material net saving associated with the changes. We thank the three Executives who left the company. Their contribution to our progress has been enormous and we wish them every future success.
We also bid farewell to our long serving Group Chief Financial Officer (CFO) Michelle McPherson who accepted another role in pursuit of her career ambitions. Michelle’s contribution to the company and its growth is incalculable. She played a key role in nib’s success, particularly nib’s 2007 demutualisation and ASX listing. We wish her every success as well. Nick Freeman has since joined nib as Group CFO and has extensive knowledge of the health sector and financial services as well as experience working for large ASX-listed multi-national organisations.
In December 2020 we announced our joint venture with global health services company Cigna to establish Honeysuckle Health, a specialist healthcare data science and services company. Leading Honeysuckle Health as Chief Executive Officer is Rhod McKensey who was Group Executive of our ahri business. Rhod was replaced by Ed Close who was previously a senior manager within arhi.
Each member of the new executive will, from FY21, be regarded as a Key Management Personal (KMP) for reporting purposes. Remuneration for those new Executives is consistent with existing policy and practice.
Renewal and succession planning
Ensuring we have the right skills, diversity and experience both at a Board and senior management level is integral to our continued success.
As the Chairman has touched on in his year in review, Non-Executive Director Christine McLoughlin will retire from the nib Board in September 2020. As the previous Chair of nib’s People and Remuneration Committee, Christine played a pivotal and guiding role in shaping our approach to people and remuneration as well as Board succession planning. Orderly renewal and transition remains a focus for the Board and we were fortunate to welcome David Gordon as a Non-Executive Director. David is a high-calibre, well-credentialed Director, who is already making a meaningful and valuable contribution to the nib Board.
As outlined there has been a number of changes in our Executive team. The Board is of the view the changes strengthen succession planning across the company and is actively assessing future scenarios and possibilities.
The Chairman, in his report, has already noted the extraordinary efforts of our people during the year. Calendar year 2020 has presented numerous challenges for many communities. From supporting our members and travellers through personal and financial hardship as a result of the Australian drought and bushfires, to responding to their needs and great uncertainty as a result of the global pandemic, our employees have been at the frontline of our operations. Through it all they have put the interests and wellbeing of our members and travellers front and centre to deliver on our purpose. This is a tremendous reflection of nib’s workplace culture and values. On behalf of our Directors I thank our employees for their outstanding effort and dedication throughout the year.
As always, we welcome your feedback on our 2020 Remuneration Report.
Yours sincerely Lee Ausburn Chair People and Remuneration Committee

Remuneration Report continued For the year ended 30 June 2020 nib holdings limited
25
CONTENTS Page Key terms used in this Report 25 Who this Report covers 26 Our remuneration governance 27 Executive remuneration structure 28 Executive remuneration mix 28 Executive remuneration mix – fixed remuneration 29 Executive remuneration mix – variable remuneration 30 Executive remuneration for the Financial Year ended 30 June 2020 32 Linking Remuneration with Performance 36 Executive Employment Conditions 36 Non-Executive Director remuneration 37 Detailed disclosure of Executive remuneration 39 Detailed disclosure of Non-Executive remuneration 41 Equity instruments held by key management personnel 42
KEY TERMS USED IN THIS REPORT FY19 Financial year ended 30 June 2019 FY20 Financial year ended 30 June 2020 FY21 Financial year ended 30 June 2021 AGM Annual General Meeting Group nib holdings limited consolidated entity KMP Key Management Personnel (those Directors and Executives who have responsibility for planning, directing and
controlling the activities of nib, either directly or indirectly) KPI Key Performance Indicator LTI Long-Term Incentive LTIP Long-Term Incentive Plan NPAT Net Profit After Tax PARCO People and Remuneration Committee STI Short-Term Incentive TFR Total Fixed Remuneration TSR Total Shareholder Return

Remuneration Report continued For the year ended 30 June 2020 nib holdings limited
26
WHO THIS REPORT COVERS This Report presents the remuneration arrangements for nib’s key management personnel.
Executive Director Mark Fitzgibbon Managing Director/Chief Executive Officer (MD/CEO) Other Executives Edward Close (from 1 January 2020)
Group Executive Australian Residents Health Insurance (GE ARHI)
Nick Freeman (from 22 June 2020) Group Chief Financial Officer (CFO)
Rob Hennin Chief Executive Officer – New Zealand (CEO NZ)
Brendan Mills Chief Information Officer (CIO)
Matt Paterson (from 3 February 2020)
Group Executive Business Services (GE BS)
Roslyn Toms
Group Executive Legal and Chief Risk Officer (GE LCRO)
David Kan (until 31 March 2020)
Group Executive International and New Business (GE INB)
Wendy Lenton (until 31 March 2020)
Group Executive People and Culture (GE PC)
Rhod McKensey (until 31 December 2020)
Group Executive Australian Residents Health Insurance (GE ARHI)
Michelle McPherson (until 20 March 2020)
Deputy Chief Executive Officer/Chief Financial Officer (DCEO/CFO)
Glenn Treadwell (from 23 March 2020 until 22 June 2020)
Acting Chief Financial Officer (Acting CFO)
Justin Vaughan (until 31 March 2020)
Group Executive Benefits and Provider Relations (GEBPR)
Independent Non-Executive Directors Steve Crane Chairman
Chair Nomination Committee
Lee Ausburn Chair People and Remuneration Committee Member Risk and Reputation Committee Member Nomination Committee
Jacqueline Chow Chair Risk and Reputation Committee (from 1 October 2019) Member People and Remuneration Committee Member Audit Committee Member Nomination Committee
David Gordon (from 29 May 2020) Member People and Remuneration Committee Member Audit Committee Member Nomination Committee
Anne Loveridge Chair of Audit Committee Chair Board, Audit, Risk and Compliance Committee New Zealand Director New Zealand subsidiaries Member Risk and Reputation Committee Member Investment Committee Member Nomination Committee
Christine McLoughlin Chair of Risk and Reputation Committee (until 30 September 2019) Member Audit Committee Member Nomination Committee
Donal O’Dwyer Chairman Investment Committee Member People and Remuneration Committee Member Risk and Reputation Committee Member Nomination Committee

Remuneration Report continued For the year ended 30 June 2020 nib holdings limited
27
OUR REMUNERATION GOVERNANCE
The role of our People and Remuneration Committee (Committee) is to ensure alignment of nib’s remuneration framework and executive rewards strategy against the short and long-term performance of the nib Group, assessed through a combination of financial and non-financial measures. The Committee also has an ongoing role to assess remuneration and performance to ensure it is consistent with shareholder and community expectations. As part of this process the Committee seeks advice and feedback from a range of external stakeholders from time-to-time, including remuneration consultants, specialists, major shareholders and shareholder advisory groups. When assessing our remuneration framework strategy, the Committee ensures there is a clear link to nib’s culture and values as well as risk management and business strategy. Guiding this process is an intent to create a workplace and environment that attracts, retains, develops and appropriately rewards our people. External factors such as the operating environment, governance and regulatory expectations also feed into this process. The Committee includes the following independent Non-Executive Directors: Lee Ausburn (Chair) Jacqueline Chow Donal O’Dwyer David Gordon Shareholders can view the Committee Charter on the nib website (nib.com.au/shareholders).
Remuneration Report continued For the year ended 30 June 2020 nib holdings limited
28
OUR REMUNERATION GOVERNANCE continued The structure of our Executive remuneration arrangements are set against a comparator group of listed organisations or peers, which nib determines in consultation with external remuneration advisors. The aim is to position the fixed remuneration of our Executive Management team between the 50th and 75th percentile of benchmarked companies. The Committee also considers shareholder views when setting the remuneration of our MD/CEO and Executive Management team, with feedback shared by the Committee. The Committee typically seeks guidance from external remuneration advisors every two years. This was last undertaken in 2018. Given current macro-economic factors, in particular the impacts of COVID-19 and the decision by the Committee not to increase KMP remuneration for FY21 (including MD/CEO, Executive Management and Senior Management Team), nib has not sought external remuneration data this year. nib will revisit the need for an external review in FY21 as part of the Committee’s annual remuneration appraisal, taking into consideration the performance of the company, the external competitive market, the macro-economic landscape and shareholders' views. The companies that make up our peer group for assessing benchmark remuneration data include the following sectors and industries:
• Australian market capitalisation comparator group (all roles except nib New Zealand Chief Executive Officer): this includes ASX200 companies within 50%-200% of nib’s market capitalisation
• Australian industry-based comparator group (all roles): This includes selected ASX200 financial services and healthcare companies as well as relevant unlisted healthcare companies (where data is available)
• New Zealand industry-based comparator group (nib New Zealand Chief Executive Officer only): both listed and unlisted financial services companies in New Zealand.
In setting remuneration, the Committee strives to align executive reward with shareholders’ interests and returns. We think this balance is appropriate as we’ve seen over time ongoing value creation for our shareholders. EXECUTIVE REMUNERATION STRUCTURE Executive remuneration is based on nib’s performance assessed using a combination of metrics and time frames, ensuring reward is linked to decision-making and performance, aligned to our values and culture, is sustainable, consistent with our long-term business strategy and shareholder value creation. nib’s remuneration framework and executive reward strategy provides a mix of fixed and variable remuneration assessed against short and long-term performance. There are three components to total remuneration:
• fixed remuneration, comprising a base remuneration package, superannuation and insurance cover • short-term incentives based on pre-determined Key Performance Indicator (KPI) financial and non-financial targets established by
the Board as well as individual and leadership assessment; and • longer-term incentives based on pre-determined Total Shareholder Return (TSR) and Statutory Earnings Per Share (EPS)
performance, established by the Board. A significant portion of remuneration for our Executives is performance-based or “at risk” through Short-Term Incentives (STI) and Long-Term Incentives (LTI). All Executives' performance-based incentives (STI and LTI) include claw-back arrangements and a malus condition. If the Board becomes aware of a material misstatement of our financial accounts or statements, and nib has awarded an Executive an incentive payment or award, short or long-term, having regard to misstatement, the Board may (at its absolute discretion), require the Executive to:
• repay the Company any short or long-term incentive received; or • forfeit or cancel any short or long-term award (vested or unvested).
When granting a variable remuneration component for each Executive relating to the performance period, such as STI and LTI Awards, the Board also ensure any governance, adverse risk taking, or audit issues are factored into the quantum of payments to each Executive. To support this, a risk gate assessment is applied for our STI Plan where our People and Remuneration Committee and Chief Risk Officer evaluate the risk culture and risk management to confirm Executive performance warrants award.

Remuneration Report continued For the year ended 30 June 2020 nib holdings limited
29
EXECUTIVE REMUNERATION MIX The remuneration structure for each executive is made up of the following components:
The graph below illustrates the FY20 remuneration mix for our Executives. Any variations in target remuneration mix between executive roles reflect position responsibilities. As can be seen from the graph a large portion of Executive remuneration is “at risk” and subject to meeting performance hurdles as set out through the STI and LTI for each Executive.
28%38% 38% 38% 44% 44% 44%
18%
19% 19% 19%17% 17% 17%18%
19% 19% 19% 17% 17% 17%
36%24% 24% 24% 22% 22% 22%
0%
10%
20%
30%
40%
50%
60%
70%
80%
90%
100%
MD/CEO CFO GE ARHI CEO NZ CIO GE BS GE LCRO
% t
arge
t rem
uner
atio
n op
port
unity
Base remuneration package and benefits Short-term performance incentives opportunity - cash
Short-term performance incentives - deferred into shares Longer-term performance incentives opportunity
EXECUTIVE REMUNERATION MIX – FIXED REMUNERATION Fixed remuneration for Executives reflects their core responsibilities and duties, which is determined with reference to a benchmarking process, external market factors, competition to attract and retain talent, as well as consideration of the expertise of the individual in the role. Fixed Executive remuneration is set between 50% and 75% of our benchmarked companies, with consideration to adjust based on the size and specialty of the role, as well as the skills and experience of the Executive. Adjustments to an Executive's remuneration are generally only made where their remuneration is below benchmarked companies or there is a material change in the Executive’s responsibilities. Once set, there is no adjustment to fixed remuneration for individual or company out-performance. Fixed remuneration includes cash salary, superannuation and insurance cover. The fixed remuneration may be salary packaged at no additional cost to the Group.
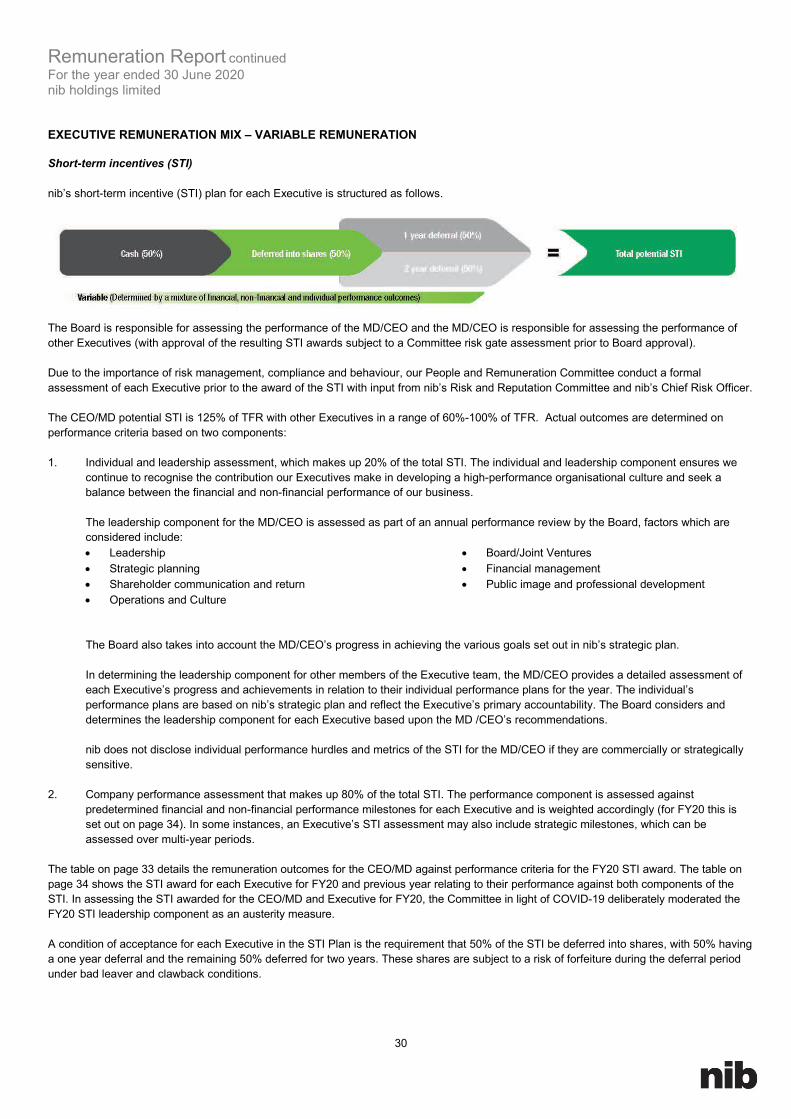
Remuneration Report continuedFor the year ended 30 June 2020 nib holdings limited
30
EXECUTIVE REMUNERATION MIX – VARIABLE REMUNERATION
Short-term incentives (STI)
nib’s short-term incentive (STI) plan for each Executive is structured as follows.
The Board is responsible for assessing the performance of the MD/CEO and the MD/CEO is responsible for assessing the performance of other Executives (with approval of the resulting STI awards subject to a Committee risk gate assessment prior to Board approval).
Due to the importance of risk management, compliance and behaviour, our People and Remuneration Committee conduct a formal assessment of each Executive prior to the award of the STI with input from nib’s Risk and Reputation Committee and nib’s Chief Risk Officer.
The CEO/MD potential STI is 125% of TFR with other Executives in a range of 60%-100% of TFR. Actual outcomes are determined on performance criteria based on two components:
1. Individual and leadership assessment, which makes up 20% of the total STI. The individual and leadership component ensures wecontinue to recognise the contribution our Executives make in developing a high-performance organisational culture and seek abalance between the financial and non-financial performance of our business.
The leadership component for the MD/CEO is assessed as part of an annual performance review by the Board, factors which areconsidered include:• Leadership• Strategic planning• Shareholder communication and return• Operations and Culture
• Board/Joint Ventures• Financial management• Public image and professional development
The Board also takes into account the MD/CEO’s progress in achieving the various goals set out in nib’s strategic plan.
In determining the leadership component for other members of the Executive team, the MD/CEO provides a detailed assessment of each Executive’s progress and achievements in relation to their individual performance plans for the year. The individual’s performance plans are based on nib’s strategic plan and reflect the Executive’s primary accountability. The Board considers and determines the leadership component for each Executive based upon the MD /CEO’s recommendations.
nib does not disclose individual performance hurdles and metrics of the STI for the MD/CEO if they are commercially or strategically sensitive.
2. Company performance assessment that makes up 80% of the total STI. The performance component is assessed againstpredetermined financial and non-financial performance milestones for each Executive and is weighted accordingly (for FY20 this isset out on page 34). In some instances, an Executive’s STI assessment may also include strategic milestones, which can beassessed over multi-year periods.
The table on page 33 details the remuneration outcomes for the CEO/MD against performance criteria for the FY20 STI award. The table on page 34 shows the STI award for each Executive for FY20 and previous year relating to their performance against both components of the STI. In assessing the STI awarded for the CEO/MD and Executive for FY20, the Committee in light of COVID-19 deliberately moderated the FY20 STI leadership component as an austerity measure.
A condition of acceptance for each Executive in the STI Plan is the requirement that 50% of the STI be deferred into shares, with 50% having a one year deferral and the remaining 50% deferred for two years. These shares are subject to a risk of forfeiture during the deferral period under bad leaver and clawback conditions.

Remuneration Report continued For the year ended 30 June 2020 nib holdings limited
31
EXECUTIVE REMUNERATION MIX – VARIABLE REMUNERATION continued Long-term incentives (LTI) nib’s long-term incentive (LTI) plan for each executive is structured as follows.
The purpose of the LTI is to balance short-term performance objectives with the creation of long-term shareholder value by focusing overall Group performance over a multi-year period. The nib LTI is an incentive provided to eligible Executives if specific measures are met over a four-year period. LTI targets are set in the interests of creating long-term shareholder value and to assist nib to attract, reward, motivate and retain executives. LTI participants are granted performance rights that enable the Executive to acquire shares in nib for nil consideration if performance conditions are met and the Executive is still employed by nib at the end of the vesting period. No dividends are received on unvested rights. The vesting date may be accelerated at the Board’s discretion:
• in the event of death of a participant; • on cessation of employment for other reasons (including total and permanent disablement, redundancy and retirement); or • on winding up, delisting, change of control and reconstruction or amalgamation.
Participation in the plan is at the Board’s discretion and no individual has a contractual right to participate in the plan or to receive any guaranteed benefits. The performance hurdles for the nib LTI are Total Shareholder Return (TSR) relative to the S&P/ASX200 over four years and Statutory EPS growth over the performance period. The LTI is allocated in two equal tranches; 50% for TSR and 50% for Statutory EPS. The Board’s view is that our current LTI performance hurdles being EPS and TSR relative to S&P/ASX200 group of companies remain appropriate and aligned to our remuneration philosophy. We will continue to assess the appropriateness of these performance hurdles each year and consult with shareholders, proxy advisors and other shareholder representative groups regarding any future amendments to ensure they are aligned to shareholders' interests. A condition of acceptance for each Executive in the LTI Plan is the requirement for 50% of the LTI to have a two-year escrow period. This escrow period extends beyond employment at nib ceasing, including termination. If vesting conditions are met, the performance rights will vest following the end of the performance period. On the vesting date, Executives who hold vested performance rights will be either issued or transferred shares in nib for each vested performance right. There is no re-testing of performance.

Remuneration Report continued For the year ended 30 June 2020 nib holdings limited
32
EXECUTIVE REMUNERATION FOR THE FINANCIAL YEAR ENDED 30 JUNE 2020 Actual remuneration for each Executive in FY20 included a fixed component, as well as a variable or at risk component, made up of an STI payment and LTI award. A full breakdown of executive remuneration details has been prepared in accordance with statutory requirements and accounting standards. This detailed disclosure (statutory tables) is located on page 39 of this Report. The table below shows the key elements of total reward for each Executive for FY20, including STI and LTI component for prior years’ performance. This includes the STI cash component paid to each Executive in the year, as well as the value of equity held in escrow (not subject to forfeiture conditions), and equity from previous years that vested in FY20 and which was originally reported under accounting standards in the year they were granted.
Total reward
Total fixed remuneration 1
Total termination
payments CashShares held in
escrowLTI vested in
FY20 3(received or
available)
$ $ $ $ $ $
Mark Fitzgibbon 1,143,300 - 616,241 616,241 2,039,598 4,415,380Edw ard Close 361,311 - 54,038 - - 415,349Nick Freeman (from 22/6/20) 17,765 - - - - 17,765Rob Hennin 504,608 - 159,507 158,263 355,036 1,177,414Brendan Mills 432,042 - 128,628 128,628 296,944 986,242Matt Paterson (from 3/2/20) 187,500 - - - - 187,500Roslyn Toms 399,100 - 130,302 130,302 - 659,704David Kan (until 31/3/20) 556,776 374,456 189,804 189,804 404,950 1,715,790Wendy Lenton (until 31/3/20) 329,728 252,203 133,694 133,694 - 849,319Rhod McKensey (until 31/12/19) 628,386 - 270,888 270,888 500,624 1,670,786Michelle McPherson (until 20/3/20) 715,397 - 270,888 270,888 644,326 1,901,499Glenn Treadw ell 391,509 - 77,235 - - 468,744Justin Vaughan (until 31/3/20) 364,086 473,831 131,987 131,987 269,964 1,371,855
6,031,508 1,100,490 2,163,212 2,030,695 4,511,442 15,837,347
STI applicable to the FY19 year paid in Sept 2019 (FY20) 2
1. Total fixed remuneration comprises Cash salaries and fees, superannuation and leave entitlements paid on termination. 2. FY19 STI paid in the FY20 year. 3. Value of shares issued during the year on exercise of performance rights.
Short-term incentives for the financial year ended 30 June 2020 For the FY20 STI, the Board considered a number of financial and non-financial performance measures to be appropriate metrics and hurdles. The performance outcomes against these measures are reflected in the CEO/MD’s FY20 remuneration outcomes. nib Executives were subject to similar performance assessments, reflecting their area of responsibility and function within the nib Group. Short-term performance targets are set for achieving specific financial and non-financial business and individual performance outcomes, with awards made relative to true outperformance. Due to the commercial and strategic nature of some STI targets for Executives, nib does not disclose some specific KPIs for key management personnel, including the MD/CEO. Given the COVID-19 impact, the STI metrics were calculated based on actual FY20 results and also based on February 2020 actuals plus four months forecast. There was little difference between the two methods. The Board then applied discretion downwards to reflect current environment and community and shareholder expectations. Despite our Executives showing strong leadership throughout the COVID-19 crisis, the Board applied downward discretion on the leadership component of STI for all Executives.

Remuneration Report continuedFor the year ended 30 June 2020 nib holdings limited
33
EXECUTIVE REMUNERATION FOR THE FINANCIAL YEAR ENDED 30 JUNE 2020 continued
Short-term incentives for the financial year ended 30 June 2020 continued
The table below summarises performance versus target against each FY20 STI component for the MD/CEO for both financial and non-financial measures based on 30 June 2020 actuals.
Category and Measure WeightingPerformance Assessment Comment
Company Performance Assessment (80% weighting)
Grow th 8.0% 6.1% Group revenue above 2019 andbudget
Profitability 32.0% 0.0% Below budget
Profitability 8.0% 0.0% Below budget
Cost control 16.0% 12.6% Good expense control
Member satisfaction 8.0% 2.7% Good member results
People and safety 4.0% 2.0% Good result
People and safety
Group underlying operating revenue
Group underlying operating profit
Group statutory earnings per share 1
Group operating expenses
Member satisfaction (NPS) 2
Employee engagement
Group lost time injury frequency 4.0% 3.1% Strong result
80.0% 26.5%
Leadership Assessment (20% weighting)
LeadershipStrategic planningShareholder communication and returnOperations and culture 20.0% 12.0%Board/Joint VenturesFinancial managementPublic image and professional developmentTotal Leadership Assessment 20.0% 12.0%
Total Assessment / Outcome 100.0% 38.5%
Total Company Performance Assessment
1 adjusted for M&A costs 2 arhi, iihi, nz, nib travel

Remuneration Report continued For the year ended 30 June 2020 nib holdings limited
34
EXECUTIVE REMUNERATION FOR THE FINANCIAL YEAR ENDED 30 JUNE 2020 continued Short-term incentives for the financial year ended 30 June 2020 continued Actual FY20 STIs awarded and forfeited (as a percentage of total STI) for each Executive are set out below.
Leadership Component
Awarded (20% of
total)
Performance Component
Awarded (80% of
total)Total
Awarded Forfeited
Leadership Component
Awarded (20% of
total)
Performance Component
Awarded (80% of
total)Total
Awarded Forfeited
% % % % % % % %
Mark Fitzgibbon 60.0% 33.2% 38.6% 61.4% 80.0% 90.5% 88.4% 11.6%Edw ard Close 60.0% 34.2% 39.4% 60.6% na na na naNick Freeman 60.0% 17.7% 26.2% 73.8% na na na naRob Hennin 60.0% 57.3% 57.8% 42.2% 90.0% 66.0% 70.8% 29.2%Brendan Mills 60.0% 41.5% 45.3% 54.7% 80.0% 81.3% 81.0% 19.0%Matt Paterson 60.0% 50.0% 52.0% 48.0% na na na naRoslyn Toms 60.0% 46.4% 49.1% 50.9% 80.0% 86.9% 85.5% 14.5%David Kan 0.0% 19.7% 19.7% 80.3% 90.0% 65.3% 70.2% 29.8%Wendy Lenton 0.0% 19.3% 19.3% 80.7% 80.0% 81.4% 81.1% 18.9%Rhod McKensey 60.0% 27.4% 39.4% 60.6% 80.0% 85.2% 84.2% 15.8%Michelle McPherson 50.0% 14.2% 24.2% 75.8% 80.0% 85.2% 84.2% 15.8%Justin Vaughan 0.0% 25.3% 31.6% 68.4% 80.0% 85.9% 84.8% 15.2%Group average 44.2% 32.2% 36.9% 63.1% 82.2% 80.9% 81.1% 18.9%
FY20 STI Bonus FY19 STI Bonus
Long-term incentives for the financial year ended 30 June 2020 nib LTI performance rights vest in accordance with the achievement of the following vesting conditions: Vesting Condition 1 Vesting Condition 2
50% of the performance rights (Tranche 1) 50% of the performance rights (Tranche 2)Total shareholder return targets (TSR Hurdle) for the relevant performance period are met
Earnings per share grow th targets (EPS Hurdle) for the relevant performance period are met
TSR Hurdle (Tranche 1) For the four year performance period ended 30 June 2020, nib’s TSR was ranked at the 57th percentile to our peer group (S&P/ASX 200). As per the TSR vesting conditions for the FY17-FY20 LTI (as set out below) this translates to a 57% vesting of the performance rights for tranche 1. nib's TSR performance compared to the relevant peer group Performance of Tranche 1 performance rights vesting
>= 75th percentile 100%>= 50th percentile to 74th percentile Pro-rata straight line vesting betw een 50% and 74%< 50th percentile 0%

Remuneration Report continued For the year ended 30 June 2020 nib holdings limited
35
EXECUTIVE REMUNERATION FOR THE FINANCIAL YEAR ENDED 30 JUNE 2020 continued Long-term incentives for the financial year ended 30 June 2020 continued
Source: IRESS (as at 30 June 2020)
Statutory EPS Hurdle (Tranche 2) For the 12 months to 30 June 2020 nib’s statutory EPS was 19.8 cps. As per the Statutory EPS vesting conditions for the FY17-FY20 LTI (as set out below) this translates to Statutory EPS CAGR of 0% from the base Statutory EPS of 21.2cps and nil vesting of the performance rights for tranche 2.
Percentage of performance rights vesting FY17-FY20 LTIP
21.2 cps100% 29.9 cps75% 27.8 cps50% 25.8 cps25% 23.9 cps0% nil
For the purpose of the calculation, 25% to 50% will be discrete thresholds, with performance above the 50% entitlement calculated on a pro rata basis to a maximum entitlement of 100%

36
Remuneration Report continuedFor the year ended 30 June 2020 nib holdings limited
LINKING REMUNERATION WITH PERFORMANCE
The components of remuneration that are linked to performance are the STI and LTI plans. Set performance indicators determine 80% of the STI award, while 20% is assessed on the leadership of each Executive. Refer table on page 33 for summary of performance versus target against each FY20 STI component for the MD/CEO. The Five Year Summary on page 13 details the Group’s financial performance and KPI results for the last 5 years.
Commercial and strategic milestone targets were set for some of our Executives, including the MD/CEO, which are dependent and assessed on their segment and area of responsibility. These metrics are not disclosed due to their commercially sensitive nature.
EXECUTIVE EMPLOYMENT CONDITIONS
Executive contracts summarise employment terms and conditions, including remuneration arrangements and compensation.
A significant portion of remuneration for our Executives is performance based through STI and LTI arrangements. Executives have claw-back arrangements and a malus condition in place for performance-based remuneration such as STI and LTI received.
The table below provides a summary of the agreements.
Service agreement effective Term of agreement Termination provision
Mark Fitzgibbon (MD/CEO) 1 July 2010 Open contract w ith notice period Edw ard Close (GE ARHI) 1 January 2020 Open contract w ith notice period Nick Freeman (CFO) 22 June 2020 Open contract w ith notice period Rob Hennin (CEO NZ) 6 May 2013 Open contract w ith notice period Brendan Mills (CIO) 1 June 2012 Open contract w ith notice period Matt Paterson (GE BS) 3 February 2020 Open contract w ith notice period Roslyn Toms (GE LCRO) 1 May 2017 Open contract w ith notice period
The agreement may be terminated early by nib giving notice w ith immediate effect or by the
relevant Executive giving three months notice.
Termination payments
For our Australian Executives with open contracts effective pre-August 2014, the Group may terminate the Executive’s contract with 12 months written notice and may make a payment in lieu of all or part of the notice period. For our Australian Executives with open contracts effective post August 2014, the Group may terminate the Executive’s contract with six months written notice and may make a payment in lieu of all or part of the notice period. In the case of a New Zealand Executive, the Group may terminate the Executive’s contract with nine months written notice and may make a payment in lieu of all or part of the notice period.
The Executive may also receive the following benefits upon termination: • a pro-rata STI payment based on the period of the financial year during which the Executive was employed and the Board’s
assessment of the Executive’s performance against the key performance indicators as at the date of termination; and/or• the Board has discretion to determine that all or a portion of unvested performance rights of a participant of the LTIP are to be vested
upon termination.
At the 2011 Annual General Meeting nib received shareholder approval for the payment of termination benefits that may exceed the 12 month salary limit on termination benefits under the Corporations Act 2001. In response to shareholder feedback, the Board has since determined that this approval will only be undertaken for Executives who held this position at the date of shareholder approval. The only current Executive this approval would be applicable to is Mark Fitzgibbon (MD/CEO).
Minimum shareholding requirements
While nib does not set minimum shareholding requirements on our Executives, the Board’s view is that the deferral arrangements under the STI and LTI means all Executives have an appropriate minimum equity holding.
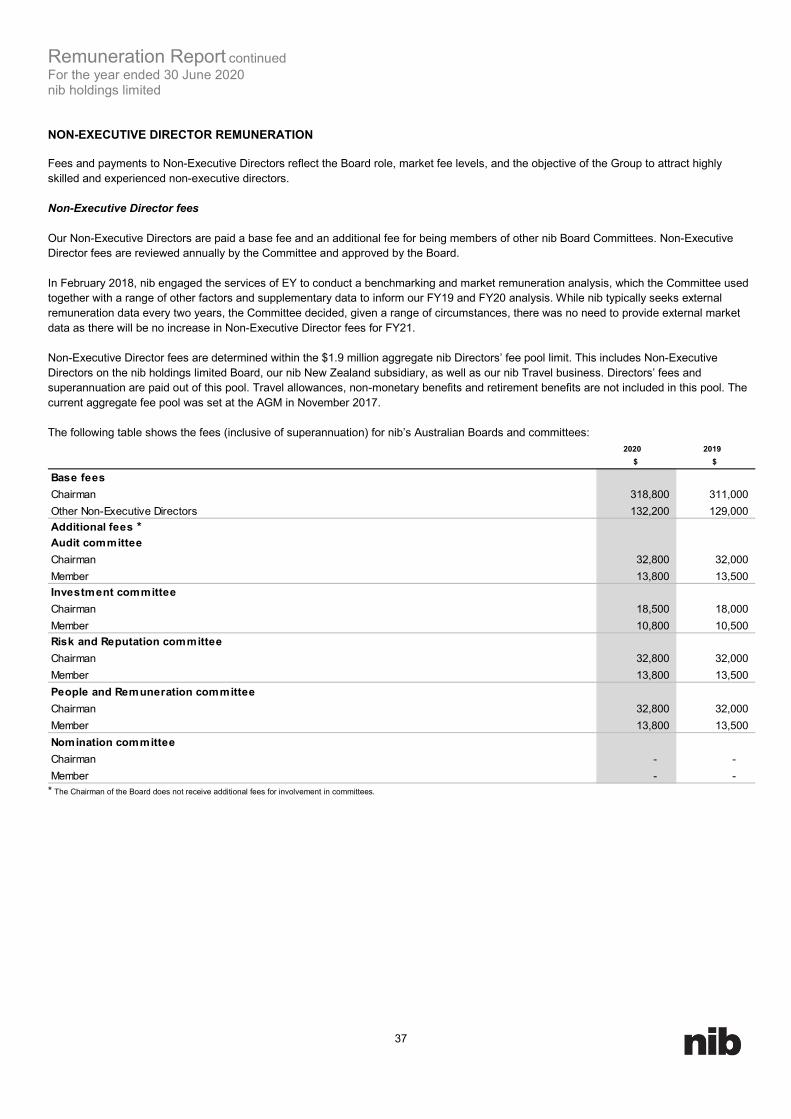
Remuneration Report continued For the year ended 30 June 2020 nib holdings limited
37
NON-EXECUTIVE DIRECTOR REMUNERATION Fees and payments to Non-Executive Directors reflect the Board role, market fee levels, and the objective of the Group to attract highly skilled and experienced non-executive directors. Non-Executive Director fees Our Non-Executive Directors are paid a base fee and an additional fee for being members of other nib Board Committees. Non-Executive Director fees are reviewed annually by the Committee and approved by the Board. In February 2018, nib engaged the services of EY to conduct a benchmarking and market remuneration analysis, which the Committee used together with a range of other factors and supplementary data to inform our FY19 and FY20 analysis. While nib typically seeks external remuneration data every two years, the Committee decided, given a range of circumstances, there was no need to provide external market data as there will be no increase in Non-Executive Director fees for FY21. Non-Executive Director fees are determined within the $1.9 million aggregate nib Directors’ fee pool limit. This includes Non-Executive Directors on the nib holdings limited Board, our nib New Zealand subsidiary, as well as our nib Travel business. Directors’ fees and superannuation are paid out of this pool. Travel allowances, non-monetary benefits and retirement benefits are not included in this pool. The current aggregate fee pool was set at the AGM in November 2017. The following table shows the fees (inclusive of superannuation) for nib’s Australian Boards and committees:
2020 2019$ $
Base feesChairman 318,800 311,000 Other Non-Executive Directors 132,200 129,000 Additional fees *Audit committeeChairman 32,800 32,000 Member 13,800 13,500 Investment committeeChairman 18,500 18,000 Member 10,800 10,500 Risk and Reputation committeeChairman 32,800 32,000 Member 13,800 13,500 People and Remuneration committeeChairman 32,800 32,000 Member 13,800 13,500 Nomination committeeChairman - - Member - -
* The Chairman of the Board does not receive additional fees for involvement in committees.

Remuneration Report continued For the year ended 30 June 2020 nib holdings limited
38
NON-EXECUTIVE DIRECTOR REMUNERATION continued Non-Executive Director fees continued The following fees (inclusive of superannuation) for the New Zealand boards and committees have applied:
2020 2019$ $
NZ Base feesChairman * 79,777 76,900 Member 42,300 41,000
NZ Board, Audit, Risk and Compliance committeeChairman 10,000 10,000 Member - -
* The Chairman of the NZ Board is not a member of the nib holdings Board
Principle 2 of nib’s Corporate Governance Statement (which is available at ww.nib.com.au/shareholders/company-profile/corporate-governance) includes the committee membership of each of nib’s NEDs (Non-Executive Directors). Minimum shareholding requirements nib requires all Non-Executive Directors (nib holdings limited only) to hold a minimum of 50% of their first year’s total annual base director’s fee in shares, which is to be accumulated within three years of appointment (based on the share price at the date of joining the Board). All current Non-Executive Directors (nib holdings limited) comply with this requirement as at 30 June 2020.

Remuneration Report continued For the year ended 30 June 2020 nib holdings limited
39
DETAILED DISCLOSURE OF EXECUTIVE REMUNERATION The following table shows details of the remuneration expense recognised for the Group’s KMP. The remuneration is measured in accordance with the requirements of the accounting standards with additional information provided for performance rights vested during the year.
Post-employment benefits Long-term benefits Termination benefits
Cash salary andfees 1 Cash bonus
Non-monetary benefits 2 Superannuation Long service leave Termination benefits Bonus 3
Performance rights expense
Performance rights additional value at
vesting 4 Total
Executives $ $ $ $ $ $ $ $ $ $
2020Mark Fitzgibbon 1,091,511 275,535 16,809 25,471 19,069 - 275,535 (17,808) 1,394,623 3,080,745Edward Close 5 358,717 63,318 1,428 20,990 - - 46,924 1,382 - 492,759Nick Freeman (from 22/6/2020) 17,765 2,159 - - - - 2,159 - - 22,083Rob Hennin 477,934 147,113 17,121 38,695 - - 145,869 (10,593) 242,764 1,058,903Brendan Mills 400,698 81,450 3,031 21,003 7,509 - 81,450 (6,304) 203,042 791,879Matt Paterson (from 3/2/20) 190,996 38,105 3,123 10,501 - - 38,105 1,173 - 282,003Roslyn Toms 384,266 78,423 6,402 21,003 6,664 - 78,423 9,525 - 584,706David Kan (until 31/3/20) 399,287 41,024 2,976 21,003 46,390 374,456 41,024 (47,022) 276,894 1,156,032Wendy Lenton (until 31/3/20) 292,982 25,590 4,355 21,003 - 252,203 25,590 (12,232) - 609,491Rhod McKensey (until 31/12/19) 328,479 65,316 1,216 12,097 486 - 65,316 (13,360) 342,314 801,864Michelle McPherson (until 20/3/20) 465,048 57,561 10,771 17,625 1,677 - 57,561 (235,447) 440,573 815,369Glenn Treadwell 6 385,610 71,915 5,542 25,000 6,495 - - - - 494,562Justin Vaughan (until 31/3/20) 283,129 37,934 2,683 24,074 2,682 473,831 37,934 (33,185) 184,595 1,013,677
5,076,422 985,443 75,457 258,465 90,972 1,100,490 895,890 (363,871) 3,084,805 11,204,073
6 Glenn Treadwell was appointed acting Chief FInancial Officer on 23 March 2020 until 22 June 2020. Before this appointment he was the company's Chief Financial Officer - Divisional (AU) and Corporate Finance. Amounts shown above include all Mr Treadwell's remuneration during the reporting period, whether as an Executive Officer or Chief Financial Officer - Divisional (AU) and Corporate Finance. Amounts received in his position as acting Chief Financial Officer amounted to $181,749, made up of cash salary of $132,232, cash bonus of $41,195, superannuation of $6,250 and long service leave of $2,072.
4 The Performance rights additional value at vesting represents the difference between fair value at grant date and the value at vesting date which is not included in statutory remuneraton.
Share-based payments
5 Edward Close was appointed Group Executive Australian Residents Health Insurance on 1 January 2020. Before this appointment he was the company's Head of Marketing and Products. Amounts shown above include all Mr Close's remuneration during the reporting period, whether as an Executive Officer or Head of Marketing and Products. Amounts received in his position as Group Executive Australian Residents Health Insurance amounted to $354,479, made up of cash salary of $247,321, cash bonus of $46,924, non-monetary benefits of $1,428, superannuation of $10,501 and share based bonus of $48,305.
Short-term employee benefits
3 Includes bonus share rights. Refer to Share-based payments.
1 Includes cash salary and fees and short-term compensated absences, such as annual leave entitlements accrued but not taken during the year.2 Non-monetary benefits includes insurance cover and cost of benefits and associated Fringe Benefits Tax.

Remuneration Report continued For the year ended 30 June 2020 nib holdings limited
40
DETAILED DISCLOSURE OF EXECUTIVE REMUNERATION continued
Post-employment
benefits
Long-term benefits
Termination benefits
Cash salary andfees 1 Cash bonus
Non-monetary benefits 2 Superannuation
Long service leave
Termination benefits Bonus 3
Performance rights expense
Performance rights additional
value at vesting 4 Total
Executives $ $ $ $ $ $ $ $ $ $
2019Mark Fitzgibbon 1,094,658 616,241 21,451 25,000 18,589 - 616,241 439,813 1,053,674 3,885,667Rob Hennin 446,816 160,243 16,462 36,752 - - 156,423 89,400 181,291 1,087,387David Kan 536,857 189,804 7,889 20,531 - - 189,804 92,906 97,505 1,135,296Wendy Lenton 380,708 133,694 9,603 20,531 - - 133,694 18,678 - 696,908Rhod McKensey 624,663 270,888 5,431 23,723 10,712 - 270,888 125,912 250,245 1,582,462Michelle McPherson 623,718 270,888 12,027 24,630 10,715 - 270,888 139,916 332,564 1,685,346Brendan Mills 362,726 128,628 3,994 20,531 6,615 - 128,628 68,265 162,262 881,649Roslyn Toms 363,134 130,302 7,318 20,531 6,240 - 130,302 26,508 - 684,335Justin Vaughan 356,853 131,987 6,545 25,000 41,649 - 131,987 65,118 147,511 906,650
4,790,133 2,032,675 90,720 217,229 94,520 - 2,028,855 1,066,516 2,225,052 12,545,700
Short-term employee benefits Share-based payments

Remuneration Report continued For the year ended 30 June 2020 nib holdings limited
41
DETAILED DISCLOSURE OF NON-EXECUTIVE REMUNERATION Details of the remuneration of the Directors of the nib holdings group are set out in the following tables.
Cash salary and fees
Non-monetary benefits Superannuation Total
Non-Executive Directors $ $ $ $
2020Steve Crane 297,797 - 21,003 318,800Lee Ausburn 163,288 - 15,512 178,800Jacqueline Chow 169,115 - 16,066 185,181David Gordon (from 29/5/20) 12,740 - 1,210 13,950Anne Loveridge 231,407 - 10,493 241,900Christine McLoughlin 146,442 - 6,977 153,419Donal O'Dyw er 162,831 - 15,469 178,300
1,183,620 - 86,730 1,270,3502019Steve Crane 290,469 - 20,531 311,000Lee Ausburn 159,361 - 15,139 174,500Jacqueline Chow 142,466 - 13,534 156,000Philip Gardner (until 31/8/18) 26,484 - 2,516 29,000Anne Loveridge 215,525 - 20,475 236,000Christine McLoughlin 159,361 - 15,139 174,500Donal O'Dyw er 158,853 - 15,091 173,944
1,152,519 - 102,425 1,254,944

Remuneration Report For the year ended 30 June 2020 nib holdings limited
42
EQUITY INSTRUMENTS HELD BY KEY MANAGEMENT PERSONNEL Reconciliation of performance rights held by KMP The numbers of performance rights over ordinary shares in the Company held during the financial year by each Executive of nib holdings limited are set out below.
Balance at the start of the
year
Name & Grant dates Unvested Number % Number %Other
ChangesVested and exercisable Unvested
Mark Fitzgibbon22 Jan 2016 (FY16 - FY19 LTIP) 284,320 - 284,320 100% - 0% - - -5 Dec 2016 (FY17 - FY20 LTIP) 225,978 - - - - - - - 225,97815 Dec 2017 (FY18 - FY21 LTIP) 222,298 - - - - - - - 222,29823 Nov 2018 (FY19 - FY22 LTIP) 215,962 - - - - - - - 215,96211 Dec 2019 (FY20 - FY23 LTIP) - 200,632 - - - - - - 200,632Edward Close28 Feb 2020 (FY20 - FY23 LTIP) - 20,063 - - - - - - 20,063Rob Hennin22 Jan 2016 (FY16 - FY19 LTIP) 49,492 - 49,492 100% - 0% - - -5 Dec 2016 (FY17 - FY20 LTIP) 56,623 - - - - - - - 56,62315 Dec 2017 (FY18 - FY21 LTIP) 42,252 - - - - - - - 42,25223 Nov 2018 (FY19 - FY22 LTIP) 40,324 - - - - - - - 40,32411 Dec 2019 (FY20 - FY23 LTIP) - 38,648 - - - - - - 38,648Brendan Mills22 Jan 2016 (FY16 - FY19 LTIP) 41,394 - 41,394 100% - 0% - - -5 Dec 2016 (FY17 - FY20 LTIP) 39,858 - - - - - - - 39,85815 Dec 2017 (FY18 - FY21 LTIP) 31,365 - - - - - - - 31,36523 Nov 2018 (FY19 - FY22 LTIP) 30,747 - - - - - - - 30,74711 Dec 2019 (FY20 - FY23 LTIP) - 28,562 - - - - - - 28,562Matt Paterson28 Feb 2020 (FY20 - FY23 LTIP) - 12,773 - - - - - - 12,773Roslyn Toms27 Oct 2017 (FY17 - FY20 LTIP) 6,530 - - - - - - - 6,53015 Dec 2017 (FY18 - FY21 LTIP) 30,751 - - - - - - - 30,75123 Nov 2018 (FY19 - FY22 LTIP) 29,508 - - - - - - - 29,50811 Dec 2019 (FY20 - FY23 LTIP) - 28,014 - - - - - - 28,014David Kan22 Jan 2016 (FY16 - FY19 LTIP) 56,450 - 56,450 100% - 0% - - -5 Dec 2016 (FY17 - FY20 LTIP) 55,824 - - - 3,349 6% - - 52,47515 Dec 2017 (FY18 - FY21 LTIP) 43,930 - - - 13,618 31% - - 30,31223 Nov 2018 (FY19 - FY22 LTIP) 41,880 - - - 23,452 56% - - 18,42811 Dec 2019 (FY20 - FY23 LTIP) - 38,908 - - 31,515 81% - - 7,393Wendy Lenton15 Dec 2017 (FY18 - FY21 LTIP) 28,699 - - - 8,897 31% - - 19,80223 Nov 2018 (FY19 - FY22 LTIP) 31,909 - - - 17,869 56% - - 14,04011 Dec 2019 (FY20 - FY23 LTIP) - 29,642 - - 24,010 81% - - 5,632Rhod McKensey22 Jan 2016 (FY16 - FY19 LTIP) 69,787 - 69,787 100% - 0% - - -5 Dec 2016 (FY17 - FY20 LTIP) 77,708 - - - - - - - 77,70815 Dec 2017 (FY18 - FY21 LTIP) 61,151 - - - - - - - 61,15123 Nov 2018 (FY19 - FY22 LTIP) 59,801 - - - - - - - 59,80111 Dec 2019 (FY20 - FY23 LTIP) - 55,551 - - - - - - 55,551Michelle McPherson22 Jan 2016 (FY16 - FY19 LTIP) 89,819 - 89,819 100% - 0% - - -5 Dec 2016 (FY17 - FY20 LTIP) 79,717 - - - 79,717 100% - - -15 Dec 2017 (FY18 - FY21 LTIP) 62,727 - - - 62,727 100% - - -23 Nov 2018 (FY19 - FY22 LTIP) 59,801 - - - 59,801 100% - - -11 Dec 2019 (FY20 - FY23 LTIP) - 55,551 - - 55,551 100% - - -Justin Vaughan22 Jan 2016 (FY16 - FY19 LTIP) 37,633 - 37,633 100% - 0% - - -5 Dec 2016 (FY17 - FY20 LTIP) 39,077 - - - 2,345 6% - - 36,73215 Dec 2017 (FY18 - FY21 LTIP) 30,751 - - - 9,533 31% - - 21,21823 Nov 2018 (FY19 - FY22 LTIP) 30,154 - - - 16,886 56% - - 13,26811 Dec 2019 (FY20 - FY23 LTIP) - 28,014 - - 22,691 81% - - 5,323
Balance as the end of the yearVested and exercisedGranted as
compensation
Forfeited

Remuneration Report For the year ended 30 June 2020 nib holdings limited
43
EQUITY INSTRUMENTS HELD BY KEY MANAGEMENT PERSONNEL continued To date nib’s practice has been to source equity for remuneration awards from shares purchased on market. Accordingly, there was no dilution from Executive new issue equity awards in 2020. The terms and conditions of each grant of options affecting remuneration in the current or a future reporting period are:
LTIP Grant dateDate vested and exercisable Expiry date Exercise price
Value per performance
right at grant date
Performance achieved % Vested
FY16-FY19 22 January 2016 1 September 2019 1 September 2019 nil $3.0246 100.0% 100.0%FY17-FY20 5 December 2016 1 September 2020 1 September 2020 nil $4.0096 to be determined n/aFY17-FY20 27 October 2017 1 September 2020 1 September 2020 nil $4.0096 to be determined n/aFY18-FY21 15 December 2017 1 September 2021 1 September 2021 nil $6.0813 to be determined n/aFY19-FY22 23 November 2018 1 September 2022 1 September 2022 nil $4.4229 to be determined n/aFY20-FY23 11 December 2019 1 September 2023 1 September 2023 nil $6.0675 to be determined n/aFY20-FY23 28 February 2020 1 September 2023 1 September 2023 nil $4.0758 to be determined n/a
Share holdings The number of shares in the Company held during the financial year by each Director of nib holdings limited and other Key Management Personnel of the Group, including their personally related parties, are set out below.
2020Balance at the start
of the year
Granted during the year as
compensation Shares purchased Shares soldOther changes during the year
Balance at the end of the year
Ordinary sharesDirectors of nib groupSteve Crane 250,000 - - - - 250,000Lee Ausburn 50,885 - - - - 50,885Jacqueline Chow 50,000 - - - - 50,000David Gordon - - - - - -Anne Loveridge 23,885 - - - - 23,885Christine McLoughlin 110,885 - - - - 110,885Donal O'Dwyer 41,485 - - - - 41,485Other key management personnel of the GroupMark Fitzgibbon 2,300,244 370,224 - (67,500) - 2,602,968Edward Close - - - - 702 702Nick Freeman - - - - - -Rob Hennin 202,595 71,554 - (46,000) - 228,149Brendan Mills 158,204 59,325 - (39,367) - 178,162Matt Paterson - - - - - -Roslyn Toms 18,099 18,164 - - - 36,263David Kan 1 41,954 82,909 - - (124,863) -Wendy Lenton 1 13,143 18,637 - - (31,780) -Rhoderic McKensey 1 594,439 107,549 - (195,248) (506,740) -Michelle McPherson 1 832,401 127,581 - (52,071) (907,911) -Justin Vaughan 1 92,028 56,032 - - (148,060) -
1. change in shareholding reflects no longer being a KMP.

Remuneration Report For the year ended 30 June 2020 nib holdings limited
44
EQUITY INSTRUMENTS HELD BY KEY MANAGEMENT PERSONNEL continued Share holdings continued
2019
Balance at the start of the
year
Granted during the year as
compensationShares
purchased Shares soldOther changes
during the yearBalance at the
end of the year
Ordinary sharesDirectors of nib groupSteve Crane 250,000 - - - - 250,000Lee Ausburn 50,885 - - - - 50,885Jacqueline Chow 4,000 - 46,000 - - 50,000Philip Gardner 1 150,000 - - - (150,000) -Anne Loveridge 23,885 - - - - 23,885Christine McLoughlin 110,885 - - - - 110,885Donal O'Dw yer 41,485 - - - - 41,485Other key management personnel of the GroupMark Fitzgibbon 2,113,969 326,275 - (140,000) - 2,300,244Rob Hennin 139,313 63,128 154 - - 202,595David Kan 54,846 41,892 - (54,784) - 41,954Wendy Lenton - 13,143 - - - 13,143Rhoderic McKensey 505,693 88,746 - - - 594,439Michelle McPherson 794,702 102,699 - (65,000) - 832,401Brendan Mills 143,430 48,900 - (34,126) - 158,204Roslyn Toms 10,263 13,554 - (5,718) - 18,099Justin Vaughan 73,159 48,088 - (29,219) - 92,028
1. Philip Gardner retired as a Director on 31 August 2018, with the change in shareholding reflecting Philip no longer being a Director.
Other transactions with key management personnel There were no transactions with other related parties during the year.

Corporate Governance Statement For the year ended 30 June 2020 nib holdings limited
45
The nib Board and management are committed to achieving and demonstrating the highest standards of corporate governance and ensuring compliance with the ASX Corporate Governance Council’s Corporate Governance Principles and Recommendations (3rd edition).
The Board is dedicated to, and responsible for, actively promoting ethical and responsible decision making and practices at nib to ensure that practices are in place to maintain confidence in nib’s integrity.
The 2020 Corporate Governance Statement is dated as at 30 June 2020 and reflects the corporate governance practices in place throughout the 2020 financial year. The Corporate Governance Statement was approved by the Board on 28 July 2020. A description of the Group’s current corporate governance practices is set out in the Group’s Corporate Governance Statement which can be viewed at www.nib.com.au/shareholders/company-profile/corporate-governance

Financial Report For the year ended 30 June 2020 nib holdings limited
46
CONTENTS Page Consolidated Income Statement 47 Consolidated Statement of Comprehensive Income 48 Consolidated Balance Sheet 49 Consolidated Statement of Changes in Equity 50 Consolidated Statement of Cash Flows 51 Notes to the Consolidated Financial Statements: 1. Summary of Significant Accounting Policies 52 2. Critical Accounting Judgements and Estimates 55 3. Risk Management 56 4. Fair Value Measurement 63 5. Segment Reporting 66 6. Revenue and Other Income 69 7. Expenses 71 8. Taxation 72 9. Cash and Cash Equivalents 77 10. Receivables 79 11. Financial Assets 81 12. Deferred Acquisition Costs 84 13. Property, Plant & Equipment 86 14. Intangible Assets 88 15. Right-of-use assets and lease liabilities 94 16. Payables 98 17. Borrowings 99 18. Claims Liabilities 101 19. Unearned Premium Liability and Unexpired Risk Liability 107 20. Premium Payback Liability 108 21. Provision for Employee Entitlements 110 22. Other Liabilities 111 23. Contributed Equity 112 24. Retained Profits 114 25. Reserves 115 26. Dividends 116 27. Earnings Per Share 117 28. Capital Management 118 29. Commitments for Expenditure 121 30. Contingent Liabilities 122 31. Events Occurring after the Balance Sheet Date 123 32. Remuneration of Auditors 124 33. Business Combination 125 34. Interest in Other Entities 126 35. Related Party Transactions 130 36. Share-Based Payments 131 37. Parent Entity Financial Information 134

Consolidated Income Statement For the year ended 30 June 2020 nib holdings limited
The above Consolidated Income Statement should be read in conjunction with the accompanying notes
47
2020 2019
Notes $m $m
Premium revenue 6 2,473.1 2,372.6Outw ards reinsurance premium expense 6 (33.5) (31.8)Net premium revenue 2,439.6 2,340.8
Claims expense (1,678.6) (1,563.2)Reinsurance and other recoveries revenue 16.4 15.6RESA levy (235.0) (229.5)State levies (35.0) (34.0)(Increase) / decrease in premium payback liability (1.2) (0.3)Claims handling expenses 7 (21.9) (18.4)Net claims incurred (1,955.3) (1,829.8)
Other underwriting revenue 6 3.5 3.6
Acquisition costs 7 (168.5) (171.0)Other underw riting expenses 7 (145.3) (146.6)Underwriting expenses (313.8) (317.6)
Underwriting result 174.0 197.0
Other income 6 60.4 78.2Other expenses 7 (112.3) (89.6)Share of net profit / (loss) of associates and joint ventures accounted for using the equity method 34 (4.0) (1.0)Operating profit 118.1 184.6
Finance costs 7 (9.7) (7.7)Investment income 6 18.6 38.6Investment expenses 7 (2.0) (2.5)Profit before income tax 125.0 213.0Income tax expense 8 (35.8) (63.7)Profit for the year 89.2 149.3
Profit for the year is attributable to:Ow ners of nib holdings limited 90.1 149.8Charitable foundation 34 (0.9) (0.5)
89.2 149.3
Cents Cents
Earnings per share for profit from continuing operations attributable to the ordinary equity holders of the companyBasic earnings per share 27 19.8 32.9Diluted earnings per share 27 19.8 32.9
Earnings per share for profit attributable to the ordinary equity holders of the companyBasic earnings per share 27 19.8 32.9Diluted earnings per share 27 19.8 32.9

Consolidated Statement of Comprehensive Income For the year ended 30 June 2020 nib holdings limited
The above Consolidated Statement of Comprehensive Income should be read in conjunction with the accompanying notes
48
2020 2019
Notes $m $m
Profit for the year 89.2 149.3
Other comprehensive incomeItems that may be reclassified to profit or lossExchange differences on translation of foreign operations 25 (2.1) 3.4Income tax related to these items 8 0.4 (0.9)Other comprehensive income for the year, net of tax (1.7) 2.5
Total comprehensive income for the year 87.5 151.8
Total comprehensive income for the year is attributable to:Ow ners of nib holdings limited 88.4 152.3Charitable foundation 34 (0.9) (0.5)
87.5 151.8

Consolidated Balance Sheet As at 30 June 2020 nib holdings limited
The above Consolidated Balance Sheet should be read in conjunction with the accompanying notes 49
2020 2019Notes $m $m
ASSETSCurrent assetsCash and cash equivalents 9 198.0 164.7Receivables 10 86.4 81.3Financial assets at amortised cost 11 8.8 73.9Financial assets at fair value through profit or loss 11 828.6 742.7Deferred acquisition costs 12 50.7 49.7Total current assets 1,172.5 1,112.3
Non-current assetsReceivables 10 - 1.8Financial assets at fair value through profit or loss 11 0.4 1.5Investments accounted for using the equity method 34 17.6 11.7Deferred acquisition costs 12 66.7 65.5Deferred tax assets 8 12.4 -Property, plant and equipment 13 11.4 13.2Intangible assets 14 339.4 348.1Right-of-use assets 15 62.1 -Total non-current assets 510.0 441.8
Total assets 1,682.5 1,554.1
LIABILITIESCurrent liabilitiesPayables 16 191.4 197.7Borrow ings 17 2.0 1.4Claims liabilities 18 245.9 143.3Unearned premium liability 19 223.3 219.3Premium payback liability 20 3.5 3.2Lease liabilities 15 6.3 -Provision for employee entitlements 21 6.8 4.8Current tax liabilities 23.9 10.2Other liabilities 22 - 0.4Total current liabilities 703.1 580.3
Non-current liabilitiesPayables 16 6.5 10.0Borrow ings 17 230.9 232.5Unearned premium liability 19 34.8 38.1Premium payback liability 20 16.6 16.1Lease liabilities 15 76.3 -Provision for employee entitlements 21 3.2 3.4Deferred tax liabilities 8 4.7 37.2Other liabilities 22 - 4.3Total non-current liabilities 373.0 341.6
Total liabilities 1,076.1 921.9
Net assets 606.4 632.2
EQUITYContributed equity 23 121.4 115.2Retained profits 24 473.8 498.9Reserves 25 (5.5) 0.5Capital and reserves attributable to owners of nib holdings limited 589.7 614.6Charitable foundation 34 16.7 17.6Total equity 606.4 632.2

Consolidated Statement of Changes in Equity As at 30 June 2020 nib holdings limited
The above Consolidated Statement of Changes in Equity should be read in conjunction with the accompanying notes 50
Contributedequity
Retainedprofits Reserves Total
Charitable foundation
Totalequity
Notes $m $m $m $m $m $m
Balance at 30 June 2018 as originally presented 112.3 445.5 - 557.8 - 557.8
Adjustment on adoption of AASB 9, net of tax - (0.1) - (0.1) - (0.1)Adjustment on adoption of AASB 15, net of tax - (0.8) - (0.8) - (0.8)Restated balance at 1 July 2018 112.3 444.6 - 556.9 - 556.9
Profit for the year - 149.8 - 149.8 (0.5) 149.3Movement in foreign currency translation, net of tax 25 - - 2.5 2.5 - 2.5Total comprehensive income for the year - 149.8 2.5 152.3 (0.5) 151.8
Consolidation of Charitable foundation - - - - 18.1 18.1 - - - - 18.1 18.1
Transactions with owners in their capacity as owners:Ordinary shares issued 23 4.2 - - 4.2 - 4.2Shares acquired by the nib Holdings Ltd Share Ow nership Plan Trust 23 (6.0) - - (6.0) - (6.0)Issue of shares held by nib Holdings Ltd Share Ow nership Plan Trust to employees 23 4.7 - (3.1) 1.6 - 1.6Employee performance rights - value of employee services - - 1.1 1.1 - 1.1Dividends paid 26 - (95.5) - (95.5) - (95.5)
2.9 (95.5) (2.0) (94.6) - (94.6)
Balance at 30 June 2019 115.2 498.9 0.5 614.6 17.6 632.2
Balance at 30 June 2019 as originally presented 115.2 498.9 0.5 614.6 17.6 632.2
Adjustment on adoption of AASB 16, net of tax 15 - (10.5) - (10.5) - (10.5)Restated balance at 1 July 2019 115.2 488.4 0.5 604.1 17.6 621.7
Profit for the year - 90.1 - 90.1 (0.9) 89.2Movement in foreign currency translation, net of tax 25 - - (1.7) (1.7) - (1.7)Total comprehensive income for the year - 90.1 (1.7) 88.4 (0.9) 87.5
Transactions with owners in their capacity as owners:Ordinary shares issued 23 7.1 - - 7.1 - 7.1Shares acquired by the nib Holdings Ltd Share Ow nership Plan Trust 23 (6.3) - - (6.3) - (6.3)Issue of shares held by nib Holdings Ltd Share Ow nership Plan Trust to employees 23 5.4 - (3.9) 1.5 - 1.5Employee performance rights - value of employee services - - (0.4) (0.4) - (0.4)Dividends paid 26 - (104.7) - (104.7) - (104.7)
6.2 (104.7) (4.3) (102.8) - (102.8)
Balance at 30 June 2020 121.4 473.8 (5.5) 589.7 16.7 606.4
Attributable to owners of nib holdings limited

Consolidated Statement of Cash Flows For the year ended 30 June 2020 nib holdings limited
The above Consolidated Statement of Cash Flows should be read in conjunction with the accompanying notes
51
2020 2019
$m $m
Cash flows from operating activitiesReceipts from policyholders and customers (inclusive of goods and services tax) 2,597.3 2,506.6Payments to policyholders and customers (1,875.2) (1,840.1)Receipts from outw ards reinsurance contracts 15.8 16.1Payments for outw ards reinsurance contracts (32.3) (32.9)Payments to suppliers and employees (inclusive of goods and services tax) (448.5) (418.7)
257.1 231.0Dividends received 0.3 0.3Interest received 6.2 9.2Distributions received 15.5 16.5Transaction costs relating to acquisition of business - (5.3)Interest paid (5.6) (7.2)Income taxes paid (61.9) (60.0)Net cash inflow from operating activities 9 211.6 184.5
Cash flows from investing activitiesProceeds from disposal of f inancial assets at fair value through profit or loss 1,155.2 284.3Payments for f inancial assets at fair value through profit or loss (1,181.7) (349.1)Proceeds from sale of property, plant and equipment and intangibles 0.1 -Payments for property, plant and equipment and intangibles 13,14 (27.0) (28.6)Net cash from consolidation of Charitable foundation - 13.8Payment for acquisition of business combination, net of cash acquired - (24.2)Payments for investments in associates and joint ventures 34 (10.0) (10.6)Net cash (outflow) from investing activities (63.4) (114.4)
Cash flows from financing activitiesProceeds from issue of shares 7.1 4.2Proceeds from borrow ings 67.2 -Repayment of borrow ings (67.2) -Principal elements of lease payments (10.6) -Shares acquired by the nib Holdings Ltd Share Ow nership Plan Trust (6.3) (6.0)Dividends paid to the company's shareholders (104.7) (95.5)Net cash inflow / (outflow) from financing activities (114.5) (97.3)
Net increase / (decrease) in cash and cash equivalents 33.7 (27.2)Cash and cash equivalents at beginning of the year 163.3 191.1Effects of exchange rate changes on cash and cash equivalents (1.0) (0.6)Cash and cash equivalents at the end of the year 196.0 163.3
Reconciliation to Consolidated Balance SheetCash and cash equivalents 9 198.0 164.7Borrow ings - overdraft 17 (2.0) (1.4)
196.0 163.3
-

Notes to the Consolidated Financial Statements For the year ended 30 June 2020 nib holdings limited
52
1. SUMMARY OF SIGNIFICANT ACCOUNTING POLICIES The financial statements are for the consolidated entity consisting of nib holdings limited and its subsidiaries. nib holdings limited is a company limited by shares, incorporated and domiciled in Australia. The Financial Report was authorised for issue by the Directors on 23 August 2020. The company has the power to amend and reissue the Financial Report. The principal accounting policies adopted in the preparation of these consolidated financial statements are set out below. These policies have been consistently applied to all the years presented, unless otherwise stated. Significant and other accounting policies that summarise the measurement basis used and are relevant to the understanding of financial statements are provided throughout the notes to the financial statements. a) Basis of preparation These general purpose financial statements have been prepared in accordance with Australian Accounting Standards (and interpretations issued by the Australian Accounting Standards Board) and the Corporations Act 2001. nib holdings limited is a for-profit entity for the purpose of preparing the financial statements.
Compliance with IFRS The consolidated financial statements of nib holdings limited Group also comply with International Financial Reporting Standards (IFRS) as issued by the International Accounting Standards Board (IASB).
Historical cost convention These financial statements have been prepared under the historical cost convention, as modified by the revaluation of claims liabilities and financial assets and liabilities at fair value through profit or loss
Comparatives Where necessary, comparative information has been reclassified to achieve consistency in disclosure with the current year. b) Principles of consolidation
Subsidiaries The consolidated financial statements incorporate the assets and liabilities of all subsidiaries of nib holdings limited (“parent entity”) as at 30 June 2020 and the results of all subsidiaries for the year then ended. nib holdings limited and its subsidiaries together are referred to in this financial report as the Group.
Subsidiaries are all entities (including structured entities) over which the Group has control. The Group controls an entity when the Group is exposed to, or has rights to, variable returns from its involvement with the entity and has ability to affect those returns through its power to direct the activities of the entity. Subsidiaries are fully consolidated from the date on which control is transferred to the Group. They are deconsolidated from the date that control ceases. The acquisition method of accounting is used to account for the acquisition of subsidiaries by the Group (refer to Note 33(b)). Intercompany transactions, balances and unrealised gains on transactions between Group companies are eliminated. Unrealised losses are also eliminated unless the transaction provides evidence of the impairment of the asset transferred. Accounting policies of subsidiaries are changed where necessary to ensure consistency with the policies adopted by the Group.
Associates
Associates are all entities over which the group has significant influence but not control or joint control. This is generally the case where the group holds between 20% and 50% of the voting rights. Investments in associates are accounted for using the equity method of accounting (see (iii) below), after initially being recognised at cost.
Equity method Under the equity method of accounting, the investments are initially recognised at cost and adjusted thereafter to recognise the Group’s share of the post-acquisition profits or losses of the investee in profit or loss, and the Group’s share of movements in other comprehensive income of the investee in other comprehensive income. Dividends received or receivable from associates and joint ventures are recognised as a reduction in the carrying amount of the investment. When the Group’s share of losses in an equity-accounted investment equals or exceeds its interest in the entity, including any other unsecured long-term receivables, the group does not recognise further losses, unless it has incurred obligations or made payments on behalf of the other entity. Unrealised gains on transactions between the Group and its associates and joint ventures are eliminated to the extent of the Group’s interest in these entities. Unrealised losses are also eliminated unless the transaction provides evidence of an impairment of the asset transferred. Accounting policies of equity accounted investees have been changed where necessary to ensure consistency with the policies adopted by the Group.

Notes to the Consolidated Financial Statements continued For the year ended 30 June 2020 nib holdings limited
53
1. SUMMARY OF SIGNIFICANT ACCOUNTING POLICIES continued b) Principles of consolidation continued
Changes in ownership interests The Group treats transactions with non-controlling interests that do not result in a loss of control as transactions with equity owners of the Group. A change in ownership interest results in an adjustment between the carrying amounts of the controlling and non-controlling interests to reflect their relative interests in the subsidiary. Any difference between the amount of the adjustment to non-controlling interests and any consideration paid or received is recognised in a separate reserve within equity attributable to owners of nib holdings limited. When the Group ceases to have control, joint control or significant influence, any retained interest in the entity is remeasured to its fair value with the change in carrying amount recognised in profit or loss. This fair value becomes the initial carrying amount for the purposes of subsequently accounting for the retained interest as an associate, jointly controlled entity or financial asset. c) Foreign currency translation i) Functional and presentation currency Items included in the financial statements of each of the Group’s entities are measured using the currency of the primary economic environment in which the entity operates (the ‘functional currency’). The consolidated financial statements are presented in Australian dollars, which is nib holdings limited’s functional and presentation currency. ii) Transactions and balances Foreign currency transactions are translated into the functional currency using the exchange rates prevailing at the dates of the transactions. Foreign exchange gains and losses resulting from the settlement of such transactions and from the translation at period end exchange rates of monetary assets and liabilities denominated in foreign currencies are recognised in profit or loss, except when they are deferred in equity as qualifying cash flow hedges and qualifying net investment hedges or are attributable to part of the net investment in a foreign operation. Foreign exchange gains and losses that relate to borrowings are presented in the income statement, within finance costs. All other foreign exchange gains and losses are presented in the income statement on a net basis within other income or other expenses. Non‑monetary items that are measured at fair value in a foreign currency are translated using the exchange rates at the date when the fair value was determined. Translation differences on assets and liabilities carried at fair value are reported as part of the fair value gain or loss. For example, translation differences on non‑monetary assets and liabilities such as equities held at fair value through profit or loss are recognised in profit or loss as part of the fair value gain or loss and translation differences on
non‑monetary assets such as equities classified as available‑for‑sale financial assets are recognised in other comprehensive income. iii) Group companies The results and financial position of foreign operations (none of which has the currency of a hyperinflationary economy) that have a functional currency different from the presentation currency are translated into the presentation currency as follows: • assets and liabilities for each balance sheet presented are
translated at the closing rate at the date of that balance sheet; • income and expenses for each income statement and
statement of comprehensive income are translated at average exchange rates (unless this is not a reasonable approximation of the cumulative effect of the rates prevailing on the transaction dates, in which case income and expenses are translated at the dates of the transactions); and
• all resulting exchange differences are recognised in other comprehensive income.
Goodwill and fair value adjustments arising on the acquisition of a foreign operation are treated as assets and liabilities of the foreign operation and translated at the closing rate. d) Assets backing private health insurance liabilities As part of the investment strategy, the Group actively manages its investment portfolio to ensure that a portion of its investments mature in accordance with the expected pattern of future cash flows arising from private health insurance liabilities. The Group has determined that all financial assets of nib health funds limited, nib nz limited and Grand United Corporate Health Limited are held to back private health insurance liabilities. e) Rounding of amounts The company is of a kind referred to in Instrument 2016/191, issued by the Australian Securities and Investments Commission, relating to the “rounding off” of amounts in the Financial Report. Amounts in the Financial Report have been rounded off in accordance with that Instrument to the nearest hundred thousand dollars, or in certain cases, the nearest dollar.

Notes to the Consolidated Financial Statements continued For the year ended 30 June 2020 nib holdings limited
54
1. SUMMARY OF SIGNIFICANT ACCOUNTING POLICIES continued f) New and amended standards adopted by the Group The Group has adopted all of the new or amended accounting standards and interpretations issued by the AASB that are mandatory for the current reporting period. Any new or amended accounting standards or interpretations that are not yet mandatory have not been early adopted.
AASB 16 Leases The Group has adopted AASB 16 retrospectively from 1 July 2019, but has not restated comparatives for FY19, as permitted under the specific transitional provisions in the standard. The reclassifications and the adjustments arising from the new leasing rules are therefore recognised in the opening balance sheet on 1 July 2019. The impact on the consolidated financial performance and position of the Group from the adoption of AASB 16 is detailed in note 15. g) New accounting standards and interpretations not yet adopted Certain new accounting standards and interpretations have been published that are not mandatory for 30 June 2020 reporting periods. The Group’s assessment of the impact of these new standards and interpretations is set out below.
Title of standard
Nature of change and impact
Mandatory application date
AASB 17 Insurance Contracts
On 19 July 2017, Australian Accounting Standard Board issued AASB 17 Insurance Contracts, incorporating the recently issued IFRS 17 Insurance Contracts. This will replace AASB 4 Insurance Contracts, AASB 1023 General Insurance Contracts and AASB 1038 Life Insurance Contracts. IFRS 17 will change the accounting for insurance contracts by nib. The standard introduces three new measurement approaches for accounting for insurance contracts. These include the Building Block Approach for long term contracts, the Premium Allocation Approach for short term contracts and a Variable Fee Approach for direct participating products. The Group, being the Ultimate Parent nib holdings limited and its subsidiaries, has formed a project team to assess the impact of this change on the operations and financial statements of the business. Initial investigation into the application for the standard indicates it is likely that the Premium Allocation Approach will apply to the majority of the Group’s insurance contracts and will simplify the implementation of the standard.
Mandatory for financial years commencing on or after 1 January 2023. At this stage, the Group does not intend to adopt the standard before its effective date.
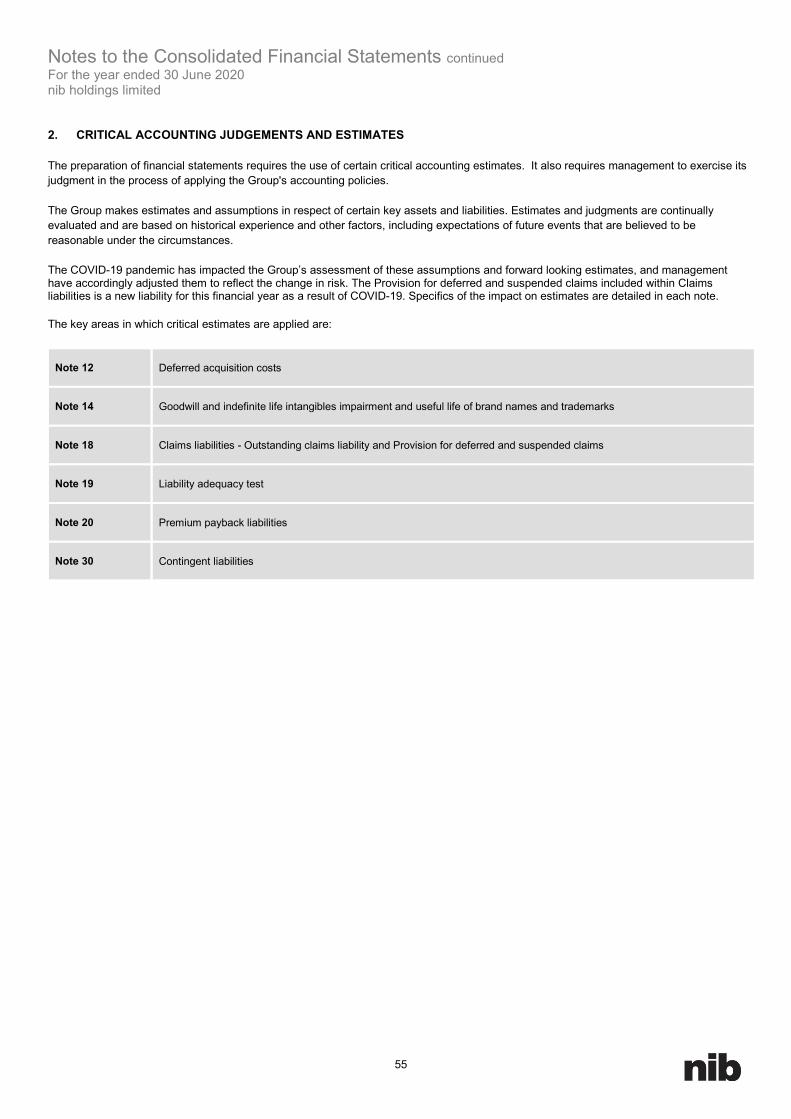
Notes to the Consolidated Financial Statements continued For the year ended 30 June 2020 nib holdings limited
55
2. CRITICAL ACCOUNTING JUDGEMENTS AND ESTIMATES The preparation of financial statements requires the use of certain critical accounting estimates. It also requires management to exercise its judgment in the process of applying the Group's accounting policies. The Group makes estimates and assumptions in respect of certain key assets and liabilities. Estimates and judgments are continually evaluated and are based on historical experience and other factors, including expectations of future events that are believed to be reasonable under the circumstances. The COVID-19 pandemic has impacted the Group’s assessment of these assumptions and forward looking estimates, and management have accordingly adjusted them to reflect the change in risk. The Provision for deferred and suspended claims included within Claims liabilities is a new liability for this financial year as a result of COVID-19. Specifics of the impact on estimates are detailed in each note. The key areas in which critical estimates are applied are:
Note 12
Deferred acquisition costs
Note 14
Goodwill and indefinite life intangibles impairment and useful life of brand names and trademarks
Note 18
Claims liabilities - Outstanding claims liability and Provision for deferred and suspended claims
Note 19
Liability adequacy test
Note 20
Premium payback liabilities
Note 30
Contingent liabilities

Notes to the Consolidated Financial Statements continued For the year ended 30 June 2020 nib holdings limited
56
3. RISK MANAGEMENT The Board of nib is ultimately responsible for the Group’s risk management framework and oversees the Group’s operations by ensuring that management operates within the approved risk appetite statement. The Board approved the Group’s overall risk management strategy, risk appetite and policies and practices to ensure that risks are identified and managed within the context of this appetite. The Board’s sub committees, including the Audit Committee, Investment Committee and the Risk and Reputation Committee assist the Board in the execution of its responsibilities. The responsibilities of these Committees are detailed in their respective Charters. The Group’s risk management framework is based on a three lines of defence model and provides defined risk ownership responsibilities with functionally independent oversight and assurance. The Group manages risks through:
• the governance structure established by the Board, • implementation of the risk management framework by management, • oversight of the risk management framework by the Risk function, • the Group’s internal policies and procedures designed to identify and mitigate risks, • Internal audit which provides independent assurance to the Board regarding the appropriateness, effectiveness and adequacy of
controls over activities where risks are perceived to be high, • Regular risk and compliance reporting to the Board and relevant Board Committees, • Application of solvency and capital adequacy standards for nib health funds limited (regulated by APRA) and nib New Zealand
(regulated RBNZ). The Group’s objective is to manage the Group’s risks in line with the Board approved risk appetite statement. Various procedures are in place to identify, mitigate and monitor the risks faced by the Group. Management are responsible for understanding and managing risks, including financial and non-financial risks. The Group’s exposure to all high and critical risks, and other Key Enterprise Risks, is reported quarterly to the Board via the Risk and Reputation Committee. During the year we continued to invest in and strengthen our risk management systems and practices to reflect our strong commitment to risk and compliance in alignment with APRA Prudential Standard CPS 220 – Risk Management. The financial condition and operations of the Group are affected by a number of Principal Risks and Uncertainties. High level descriptions of these risks are included in the Operating and Financial Review (see pages 4 to 13), including Insurance Risks, Financial Risks, Strategic Risks and Operational Risks as categorised in nib’s Risk Management Strategy. Realisation of these risks can have both financial and / or non-financial impacts. The impact of the COVID-19 pandemic on the global economy has resulted in increased insurance and financial risk to the Group. This heightened level of uncertainty and risk is managed as part of the Group's Risk Management Framework. Further material is contained in the notes below on the exposures and mitigation of specific risks with discrete financial impacts.
Category
Risks
Insurance risks
Pricing Claims inflation Risk equalisation (Australia only)
Financial risks
Fair value interest rate risk Foreign exchange risk Price risk Credit risk Liquidity risk Capital management (see Note 28)

Notes to the Consolidated Financial Statements continued For the year ended 30 June 2020 nib holdings limited
57
3. RISK MANAGEMENT continued a) Insurance risk Insurance risk is the risk that inadequate or inappropriate underwriting, claims management, product design and pricing will expose the Group to financial loss from claims expenditure exceeding the amount implicit in premium income. Insurance risk is seen as a key risk to our PHI focused businesses. There are a number of sources of risk that require nib to closely review and monitor our control strategies. These risks have Board oversight. These sources include:
Description
Exposure
Mitigation
Pricing risk
Forecasting and pricing is a core capability within the Group. Without effective controls there is potential for poor quality forecasting. This could result in a range of negative outcomes, including: pricing decisions that do not align with nib strategic goals, material impact to nib financial performance; and failure to comply with ASX Listing Rule Continuous Disclosure obligations. Control failures could also impact annual pricing approval decisions by the Minister for Health. Amendments or rejections of price applications could have a negative impact on nib’s operating and financial performance.
This risk is managed by establishing product premiums through the use of actuarial models based on historical claims costs and forecast claims inflation. Pricing recommendations are externally reviewed by the Appointed Actuary. The Group works collaboratively with Government, regulators and other stakeholders to improve health insurance premium affordability through industry reforms and health policy setting.
Claims inflation (supply side costs)
The Group is subject to significant claims inflation which may not be adequately covered by premium price increases and/or product design changes. In Australia the principle of community rating prevents private health insurers from improperly discriminating between people who are or wish to be insured, on the basis of their health status, age, race, gender, religious beliefs, sexuality, frequency of need of health care, lifestyle or claims history.
Claims patterns are monitored and premiums calculated accordingly. Governance, contractual and control procedures are in place for key benefits & provider relationships. Maintenance of reserves in excess of minimum solvency and capital requirements allows the Group to withstand increased levels of claims inflation.
Risk equalisation special account arrangements
Risk equalisation arrangements apply to the registered health insurance industry in Australia. Under these arrangements all registered health insurers effectively provide reinsurance support so that the industry as a whole shares the hospital cost of high risk groups irrespective of the policyholder or private health fund related to the claim.
Risk equalisation provides some protection to high cost claims however exposes the Group to claims from other health insurers. Actuarial models are used to monitor past experience and predict future costs, premiums are calculated accordingly.

Notes to the Consolidated Financial Statements continued For the year ended 30 June 2020 nib holdings limited
58
3. RISK MANAGEMENT continued b) Fair value interest rate risk
Description
Exposure
Mitigation
Risk of fluctuations in interest rates impacting the Group’s financial performance or the fair value of its financial instruments.
The Group’s main interest rate risk arises from long-term borrowings. Borrowings issued at variable rates expose the Group to cash flow interest rate risk. Borrowings issued at fixed rates expose the Group to fair value interest rate risk if the borrowings are carried at fair value. The Group’s borrowings at variable rate were denominated in Australian and New Zealand Dollars. The Group’s other interest rate risks arise from:
• receivables; • financial assets at amortised cost • financial assets at fair value through profit
or loss; and • cash and cash equivalents
All other receivables are non-interest bearing. There is an interest-bearing component of financial assets at fair value through profit or loss.
The Group mitigates interest rate risk on long term borrowings by maintaining an appropriate gearing ratio and monitoring and forecasting key indicators such as interest expense coverage. nib receives advice on its investments from its asset consultants.
As at the end of the reporting period, the Group had the following variable rate borrowings outstanding:
Weighted average interest
rate Balance
Weighted average interest
rate Balance
% $m % $m
Bank loans 2.3% 230.9 3.0% 232.5Net exposure to cash flow interest rate risk 230.9 232.5
2020 2019
The bank overdraft comprised of the closing positive balance of the bank account, adjusted for unpresented cheques and outstanding deposits is not included in bank loans. The Group’s sensitivity to interest rate risk has increased with the COVID-19 associated economic impact. The Group has shown the impact of a change in 100 bps to reflect this increased risk. An analysis by maturities is provided at 3(f).The table below summarises the sensitivity of the Group’s financial assets and financial liabilities to interest rate risk.
Interest rate riskCarrying amount Profit Equity Profit Equity
Carrying amount Profit Equity Profit Equity
$m $m $m $m $m $m $m $m $m $m
Financial assetsCash and cash equivalents 198.0 (1.4) (1.4) 1.4 1.4 164.7 (1.1) (1.1) 1.1 1.1Other receivables 22.6 (0.2) (0.2) 0.2 0.2 23.0 (0.1) (0.1) 0.1 0.1Financial assets at amortised cost 8.8 0.1 0.1 (0.1) (0.1) 73.9 0.5 0.5 (0.5) (0.5)Financial assets at fair value through profit or loss 829.0 13.4 13.4 (13.6) (13.6) 744.2 7.7 7.7 (7.6) (7.6)Financial liabilitiesBank loans (230.9) 1.7 1.7 (1.7) (1.7) (232.5) 1.7 1.7 (1.7) (1.7)Premium payback liability (20.1) (0.7) (0.7) 0.7 0.7 (19.3) (0.7) (0.7) 0.7 0.7Total increase / (decrease) 807.4 12.9 12.9 (13.1) (13.1) 754.0 8.0 8.0 (7.9) (7.9)
2020 2019
-100bps +100bps -100bps +100bps

Notes to the Consolidated Financial Statements continued For the year ended 30 June 2020 nib holdings limited
59
3. RISK MANAGEMENT continued c) Foreign exchange risk
Description
Exposure
Mitigation
Risk of fluctuations in foreign exchange rates impacting the Group’s financial performance.
The Group operates internationally and is exposed to foreign exchange risk arising from foreign currency translation risk through its subsidiaries located in overseas jurisdictions. In accordance with the policy set out in Note 1(c), foreign exchange gains or losses arising on translation of the Group’s foreign operations to the Group’s Australian dollar presentation currency are recognised in equity through other comprehensive income. Foreign exchange gains or losses arising on assets and liabilities denominated in foreign currencies are recognised directly in profit and loss.
The Group does not hedge this risk.
The table below summarises the sensitivity of the Group’s equity to a 10% strengthening and weakening of the Australian dollar against the foreign currency, with all other variables held constant.
Foreign exchange riskExposure Profit Equity Profit Equity Exposure Profit Equity Profit Equity
$m $m $m $m $m $m $m $m $m $m
Brazilian real 0.5 (0.1) 0.1 0.1 (0.1) - - - - -Canadian dollar 0.2 - - - - - - - - -Chinese Yuan 8.6 (0.6) - 0.6 - 0.1 - - - -European euro 2.2 (0.1) - 0.1 - - - - - -Great Britain pound 2.2 (0.2) - 0.2 - - - - - -New Zealand dollar 65.6 - (6.5) - 6.5 65.2 - (6.5) - 6.5United States dollar 1.5 (0.2) 0.1 0.2 (0.1) 0.3 - - - -Thai baht 0.3 - - - - 0.3 - - - -Total increase / (decrease) 81.1 (1.2) (6.3) 1.2 6.3 65.9 - (6.5) - 6.5
2020
-10% +10%
2019
-10% +10%

Notes to the Consolidated Financial Statements continued For the year ended 30 June 2020 nib holdings limited
60
3. RISK MANAGEMENT continued d) Price risk
Description
Exposure
Mitigation
Risk of fluctuations in price of equity securities impacting the Group’s fair value of its financial instruments.
The Group is exposed to equity securities price risk. This arises from investments held by the Group and classified on the balance sheet as at fair value through profit or loss. The Group is not exposed to commodity price risk.
To manage its price risk the Group has adopted an investment strategy which delivers a diversified portfolio with a heavier weighting to defensive assets versus growth assets. nib receives advice from its asset consultants.
The Group’s increased risk relating to price of equity securities as a result of COVID-19 is mitigated by the heavier weighting of the Group’s investments to defensive assets versus growth assets. Profit after tax for the year would increase/decrease as a result of gains/losses on equity securities classified as at fair value through profit or loss. The table below summarises the sensitivity of the Group’s financial assets to price risk.
Other price risk Carrying
amount Profit Equity Profit Equity Carrying
amount Profit Equity Profit Equity$m $m $m $m $m $m $m $m $m $m
Financial assetsFinancial assets at fair value through profit or loss 829.0 (11.7) (11.7) 11.7 11.7 744.2 (10.5) (10.5) 10.5 10.5Total increase / (decrease) 829.0 (11.7) (11.7) 11.7 11.7 744.2 (10.5) (10.5) 10.5 10.5
-10% unit price +10% unit price -10% unit price +10% unit price
2020 2019
Methods and assumptions used in preparing sensitivity analysis The after tax effect on profit and equity of movements in foreign exchange, interest rate and price have been calculated using ‘reasonably possible’ changes in the risk variables, based on recent interest rate and market movements. An interest rate change of 100 basis points will directly affect interest received on cash and cash equivalents and other receivables. An interest rate change of 100 basis points will inversely affect the unit price of fixed interest investments; this change has been calculated by multiplying the average duration of underlying investments in each portfolio by the interest rate change. All other investments are not directly affected by interest rate changes but would be revalued through profit or loss as their unit price changes.

Notes to the Consolidated Financial Statements continued For the year ended 30 June 2020 nib holdings limited
61
3. RISK MANAGEMENT continued e) Credit risk
Description
Exposure
Mitigation
Risk that a counterparty will default on its contractual obligations, or from the decline in the credit quality of a financial instrument, resulting in financial loss to the Group.
Credit risk arises from:
• cash and cash equivalents; • financial assets and deposits with banks
and financial institutions; • favourable derivative financial instruments;
and • credit exposures to policyholders and the
Department of Human Services (Private Health Insurance Premiums Reduction Scheme).
The maximum exposure to credit risk, excluding the value of any collateral or other security, at balance date is the carrying amount, net of any provisions for impairment loss, as disclosed in the balance sheet and notes to the financial statements. Apart from the Department of Human Services the Group does not have any material credit risk to any other single debtor or group of debtors under financial instruments entered into.
Directly managed term deposits are held with institutions that have at least an A-2 credit rating. Term deposits held within portfolios managed by investment asset consultants are in accordance with the relevant investment policy statement. nib receives advice from its asset consultants. Credit risk for premium receivables are minimal due to the diversification of policyholders. The Private Health Insurance Premiums Reduction Scheme receivable is due from a government organisation under legislation.
The credit quality of financial assets that are neither past due nor impaired can be assessed by reference to external credit ratings (if available) or to historical information about counterparty default rates. The Group’s credit risk assessments and loss allowances have been updated for the increased risk of default as a result of the COVID-19 pandemic.
2020 2019
Other receivables $m $m
Counterparties w ith external credit rating 4.7 1.0 Group 1 - new debtors (relationship less than 6 months) 0.5 2.3 Group 2 - existing debtors w ith no defaults in the past 17.2 19.6 Group 3 - existing debtors w ith some defaults in the past. All defaults w ere fully recovered. 0.2 0.1
22.6 23.02020 2019
Cash at bank and short-term bank deposits $m $m
A-1+ 183.4 117.5A-1 13.7 14.7A-2 0.9 30.4B - 2.1
198.0 164.7
2020 2019
Financial assets at amortised cost $m $m
Short term depositsA-1+ 8.8 73.9
8.8 73.9

Notes to the Consolidated Financial Statements continued For the year ended 30 June 2020 nib holdings limited
62
3. RISK MANAGEMENT continued
e) Credit risk continued
2020 2019
Financial assets at fair value through profit or loss $m $m
Short term depositsA-1+ - 75.0
Interest-bearing securities1
AAA 158.9 129.2AA 378.6 221.7A 103.6 95.9BBB 19.1 65.9Sub investment grade - 5.2Unclassif ied - 0.4
660.2 593.31.The financial assets at fair value through profit or loss with credit risk are held in unit trusts. The above table summarises the underlying investments of the unit trusts.
f) Liquidity risk
Description
Exposure
Mitigation
Risk that the Group won’t be able to meet its financial obligations as they fall due, because of lack of liquid assets or access to funding on acceptable terms.
Liquidity risk arises from:
• trade creditors; • other payables; • lease liabilities; and • borrowings
The Group manages liquidity risk by continuously monitoring forecast and actual cash flows and holding a high percentage of highly liquid investments. The bank overdraft within borrowings comprises the closing positive balances of the bank account, adjusted for unpresented cheques and outstanding deposits. There are no overdraft facilities.
Maturities of financial liabilities The table below analyses the Group’s financial liabilities into relevant maturity groupings based on the remaining period at the reporting date to the contractual maturity date. The amounts disclosed are the contractual undiscounted cash flows.
< 1 month 1-3 months 3-12 months 1-5 years > 5 years
Total contractual cash flows
Carrying amount
Group at 30 June 2020 $m $m $m $m $m $m $m
Financial LiabilitiesTrade creditors 12.9 0.6 0.3 - - 13.8 13.7Other payables 80.9 17.7 10.9 6.8 1.0 117.3 117.3Lease liabilities 0.9 2.6 6.7 41.0 56.8 108.0 82.6Borrow ings 0.2 0.9 3.0 234.9 - 239.0 232.9
94.9 21.8 20.9 282.7 57.8 478.1 446.5
< 1 month 1-3 months 3-12 months 1-5 years > 5 years
Total contractual cash flows
Carrying amount
Group at 30 June 2019 $m $m $m $m $m $m $m
Financial LiabilitiesTrade creditors 16.4 0.5 0.5 0.1 - 17.5 17.5Other payables 84.0 13.2 3.5 10.1 1.0 111.8 111.8Borrow ings 0.2 1.4 4.8 240.3 - 246.7 233.9
100.6 15.1 8.8 250.5 1.0 376.0 363.2

Notes to the Consolidated Financial Statements continued For the year ended 30 June 2020 nib holdings limited
63
4. FAIR VALUE MEASUREMENT a) Fair value hierarchy This section explains the judgements and estimates made in determining the fair values of the financial instruments that are recognised and measured at fair value in the financial statements. To provide an indication about the reliability of the inputs used in determining fair value, the Group classifies its financial instruments into the three levels prescribed under the accounting standards. An explanation of each level follows below the table. The following tables present the Group’s assets and liabilities measured and recognised at fair value at 30 June 2020 and 30 June 2019:
Level 1 Level 2 Level 3 Total
Group at 30 June 2020 $m $m $m $m
Assets Receivables - 1.9 - 1.9Financial assets at fair value through profit or loss
Equity securities 156.1 - - 156.1Interest-bearing securites 633.8 26.4 - 660.2Mortgage trusts - 0.4 - 0.4Property trusts 1.8 - 10.5 12.3Short term deposits - - - -
Total assets 791.7 28.7 10.5 830.9
Level 1 Level 2 Level 3 Total
Group at 30 June 2019 $m $m $m $m
Assets Receivables - 1.8 - 1.8Financial assets at fair value through profit or loss
Equity securities 133.2 1.2 - 134.4Interest-bearing securites 476.6 41.7 - 518.3Mortgage trusts - 0.4 - 0.4Property trusts 2.4 0.8 12.9 16.1
Short term deposits 75.0 - - 75.0Total assets 687.2 45.9 12.9 746.0 There were no transfers between level 1 and level 2 during the year. The Group’s policy is to recognise transfers into and transfers out of the fair value hierarchy levels as at the end of the reporting period. The fair value of financial instruments traded in active markets (such as financial assets at fair value through profit or loss) is based on quoted market prices at the reporting date. The quoted market price used for financial assets held by the Group is the current bid price. These instruments are included in level 1.

Notes to the Consolidated Financial Statements continued For the year ended 30 June 2020 nib holdings limited
64
4. FAIR VALUE MEASUREMENT continued a) Fair value hierarchy continued
Level 1
The fair value of financial instruments traded in active markets (such as financial assets at fair value through profit or loss) is based on quoted market prices at the reporting date. The quoted market price used for financial assets held by the Group is the current bid price. These instruments are included in level 1.
Level 2
The fair value of financial instruments that are not traded in active markets is determined using valuation techniques. The Group uses a variety of methods and makes assumptions that are based on market conditions existing at each balance date. These instruments are included in level 2.
Level 3
If one or more of the significant inputs is not based on observable market data, the instrument is included in level 3.
b) Valuation techniques used to determine fair values Specific valuation techniques used to value financial instruments include:
• The use of quoted market prices or dealer quotes for similar instruments. • Other techniques, such as discounted cash flow analysis, are used to determine fair value for the remaining financial instruments.
All of the resulting fair value estimates for financial instruments are included in level 2. In the circumstances where a valuation technique for financial instruments is based on significant unobservable inputs, those instruments are included in level 3. For the Group this includes the valuation of certain property trusts. c) Fair value measurements using significant unobservable inputs (level 3) The Group’s level 3 investments comprise units in property trusts which hold illiquid investments in unlisted property. The following table presents the changes in level 3 instruments for the year ended 30 June 2020 and 30 June 2019:
2020 2019
$m $m
Fair value measurement as at 1 July 12.9 13.1Purchased 0.7 0.6Sales (2.2) (1.3)Change in fair value (0.9) 0.5Fair value measurement at end of period 10.5 12.9
The Group’s policy is to recognise transfers into and transfers out of fair value hierarchy level as at the end of the reporting period.
Transfers between
levels 2 and 3
There were no transfers between the levels of the fair value hierarchy during the year. There were also no changes during the year to any of the valuation techniques applied as of 30 June 2019.
Valuation process
The valuation of unlisted property is based on unit prices provided by investment managers.

Notes to the Consolidated Financial Statements continued For the year ended 30 June 2020 nib holdings limited
65
4. FAIR VALUE MEASUREMENT continued c) Fair value measurements using significant unobservable inputs (level 3) continued The following table summarises the quantitative information about the significant unobservable inputs used in level 3 fair value measurements:
DescriptionFair value$m
Unobservable inputs
At 30 June 2020
Unlisted property trusts 10.5 Redemption price
At 30 June 2019
Unlisted property trusts 12.9 Redemption price
Higher/(low er) redemption price (+/- 10%) w ould increase/(decrease) fair value by $1.3m
Relationship of unobservable inputs to fair value
Higher/(low er) redemption price (+/- 10%) w ould increase/(decrease) fair value by $1.1m
d) Fair values of other financial instruments The Group also had another financial instrument which was not measured at fair value in the balance sheet. This had the following fair value as at 30 June 2020 and 30 June 2019:
Carrying amount Fair value
Carrying amount Fair value
Non-current borrowings $m $m $m $m
Bank loans 230.9 230.9 232.5 232.5
2020 2019
The carrying value less impairment provision of other receivables and payables are assumed to approximate their fair values due to their short-term nature.

Notes to the Consolidated Financial Statements continued For the year ended 30 June 2020 nib holdings limited
66
5. SEGMENT REPORTING Operating segments are reported in a manner consistent with the internal reporting provided to Executive management. The chief operating decision maker, who is responsible for allocating resources and assessing performance of the operating segments, has been identified as the Managing Director/Chief Executive Officer (MD/CEO). The MD/CEO assesses the performance of the operating segments based on underlying operating profit. This measurement basis excludes from the operating segments the effects of non-recurring expenditure such as integration costs, merger and acquisition costs, new business implementation costs, amortisation of acquired intangibles and impairment of intangibles. No information regarding assets, liabilities and income tax is provided for individual Australian Residents Health Insurance and International (Inbound) Health Insurance segments to the MD/CEO. Furthermore, investment income and expenditure for Australia is not allocated to individual Australian segments as this type of activity is driven by the central treasury function, which manages the cash position of the Australian companies. Management has determined the operating segments based on the reports reviewed by the MD/CEO that are used to make strategic decisions.
The MD/CEO considers the business from both a geographic and product perspective and has identified four reportable segments: Australian Residents Health Insurance
nib’s core product offering within the Australian private health insurance industry
New Zealand Residents Health Insurance
nib’s core product offering within the New Zealand private health insurance industry
International (Inbound) Health Insurance
nib’s offering of health insurance products for international students and workers
nib Travel
nib’s distribution of travel insurance products
‘Unallocated to segments’ includes life and funeral insurance commission, corporate and share registry, share of profit / (loss) of Honeysuckle Health and China joint ventures and charitable foundation as they do meet the quantitative requirements for reportable segments.

Notes to the Consolidated Financial Statements continued For the year ended 30 June 2020 nib holdings limited
67
5. SEGMENT REPORTING continued
$m $m $m $m $m $m
Premium revenue 2,085.0 139.7 240.5 7.9 - 2,473.1Outw ards reinsurance premium expense (12.7) (16.6) (0.4) (3.8) - (33.5)Net premium revenue 2,072.3 123.1 240.1 4.1 - 2,439.6
Claims expense (1,460.4) (71.2) (144.9) (2.1) - (1,678.6)Reinsurance and other recoveries revenue 4.9 9.4 - 2.1 - 16.4RESA (235.0) - - - - (235.0)State levies (35.0) - - - - (35.0)(Increase) / decrease in premium payback liability - - (1.2) - - (1.2)Claims handling expenses (15.5) (3.4) (2.5) (0.5) - (21.9)Net claims incurred (1,741.0) (65.2) (148.6) (0.5) - (1,955.3)
Other underwriting revenue 2.4 1.2 (0.1) - - 3.5
Acquisition costs (110.0) (16.0) (39.6) (2.9) - (168.5)Other underw riting expenses (89.1) (20.9) (28.4) (0.2) - (138.6)Underwriting expenses (199.1) (36.9) (68.0) (3.1) - (307.1)
Underwriting result 134.6 22.2 23.4 0.5 - 180.7
Other income - - - 54.1 6.0 60.1Other expenses - - - (74.3) (12.4) (86.7)Share of net profit / (loss) of associates and joint ventures (1.0) - - - (3.0) (4.0)Underlying operating profit / (loss) 133.6 22.2 23.4 (19.7) (9.4) 150.1
Items not included in underlying operating profitAmortisation of acquired intangibles (1.9) (1.5) (3.4) (3.6) - (10.4)Impairment of intangibles - - - (8.0) - (8.0)One-off transactions, merger, acquisition and new business implementation costs - - - - (13.6) (13.6)Finance costs (9.7) (9.7)Investment income 18.6 18.6Investment expenses (2.0) (2.0)Profit before income tax from continuing operations 125.0
Inter-segment other income1 3.4 0.2 0.1 - - 3.7Depreciation and amortisation 2.7 1.8 3.5 3.6 16.1 27.7
Total assets 228.0 157.6 115.2 1,682.5Total liabilities 87.5 47.4 263.6 1,076.1
Insurance liabilitiesClaims liabilities 25.1 0.4 - 245.9Unearned premium liability 21.2 0.3 - 258.1Premium payback liability 20.1 - - 20.1
Total 66.4 0.7 - 524.1
Unallocatedto segments Total
For the year ending 30 June 2020
457.0
nib Travel
Australian Residents
Health Insurance
International (Inbound)
Health Insurance
New ZealandHealth
Insurance
220.4 236.6
-
1,181.7677.6
1. Inter-segment other income is eliminated on consolidation and not included in operating profit.

Notes to the Consolidated Financial Statements continued For the year ended 30 June 2020 nib holdings limited
68
5. SEGMENT REPORTING continued
$m $m $m $m $m $m
Premium revenue 2,026.2 125.8 215.6 5.0 - 2,372.6Outw ards reinsurance premium expense (13.0) (15.7) (0.1) (3.0) - (31.8)Net premium revenue 2,013.2 110.1 215.5 2.0 - 2,340.8
Claims expense (1,381.0) (49.6) (129.7) (2.9) - (1,563.2)Reinsurance and other recoveries revenue 5.5 7.2 - 2.9 - 15.6RESA (229.5) - - - - (229.5)State levies (34.0) - - - - (34.0)(Increase) / decrease in premium payback liability - - (0.3) - - (0.3)Claims handling expenses (14.5) (1.8) (1.7) (0.4) - (18.4)Net claims incurred (1,653.5) (44.2) (131.7) (0.4) - (1,829.8)
Other underwriting revenue 2.8 0.7 - 0.1 - 3.6
Acquisition costs (117.4) (14.7) (36.6) (2.3) - (171.0)Other underw riting expenses (95.1) (17.0) (27.4) (0.2) - (139.7)Underwriting expenses (212.5) (31.7) (64.0) (2.5) - (310.7)
Underwriting result 150.0 34.9 19.8 (0.8) - 203.9
Other income - - - 72.4 4.8 77.2Other expenses - - - (65.0) (13.3) (78.3)Share of net profit / (loss) of associates and joint ventures (0.5) - - - (0.5) (1.0)Underlying operating profit / (loss) 149.5 34.9 19.8 6.6 (9.0) 201.8
Items not included in underlying operating profitAmortisation of acquired intangibles (1.9) (1.6) (3.4) (2.3) - (9.2)Impairment of intangibles - - - (1.0) - (1.0)One-off transactions, merger, acquisition and new business implementation costs - - - - (7.0) (7.0)Finance costs (7.7) (7.7)Investment income 38.6 38.6Investment expenses (2.5) (2.5)Profit before income tax from continuing operations 213.0
Inter-segment other income1 1.1 0.5 - - - 1.6Depreciation and amortisation 4.3 1.2 3.4 4.0 11.9 24.8
Total assets 205.4 151.4 118.2 1,554.1Total liabilities 62.5 21.7 284.2 921.9
Insurance liabilitiesClaims liabilities 15.8 1.9 - 143.3Unearned premium liability 20.1 1.0 - 257.4Premium payback liability 19.3 - - 19.3
Total 55.2 2.9 - 420.0
For the year ending 30 June 2019International
(Inbound) Health
Insurance
New ZealandHealth
Insurance
Australian Residents
Health Insurance
Unallocatedto segments Totalnib Travel
125.6 236.3
-361.9
1,079.1553.5
1. Inter-segment other income is eliminated on consolidation and not included in operating profit.

Notes to the Consolidated Financial Statements continued For the year ended 30 June 2020 nib holdings limited
69
6. REVENUE AND OTHER INCOME 2020 2019
$m $m
Premium revenue 2,473.1 2,372.6Outw ards reinsurance premiums (33.5) (31.8)Net premium revenue 2,439.6 2,340.8
Agency fee 0.3 0.4Sundry income 3.2 3.2Other underwriting revenue 3.5 3.6
Other incomeTravel insurance commission 54.1 72.4Life and funeral insurance commission and other commissions 3.1 2.8Insurance recoveries 0.3 1.0Sundry income 2.9 2.0
60.4 78.2
Investment incomeInterest 5.6 9.2Net realised gain (loss) on f inancial assets at fair value through profit or loss 34.2 18.2Net unrealised gain (loss) on f inancial assets at fair value through profit or loss (21.5) 10.9Dividends 0.3 0.3
18.6 38.6 a) Accounting policy
Revenue is measured at the fair value of the consideration received or receivable. Amounts disclosed as revenue are net of amounts collected on behalf of third parties. The Group recognises revenue when the amount of revenue can be reliably measured, it is probable that future economic benefits will flow to the entity and specific criteria have been met for each of the Group’s activities as described below. The Group bases its estimates on historical results, taking into account the type of customer, the type of transaction and the specifics of each arrangement. Revenue is recognised for the major business activities as follows:
Premium revenue
Premium revenue comprises premiums from private health insurance contracts held by policyholders. Premium revenue is recognised when it has been earned. Premium revenue is recognised from the attachment date over the period of the contract. The attachment date is from when the insurer accepts the risk from the insured under the insurance contract. Revenue is recognised in accordance with the pattern of the incidence of risk expected over the term of the contract. The proportion of the premium received or receivable not earned in the income statement at the reporting date is recognised in the balance sheet as an unearned premium liability. Any non-current portion is discounted based on expected settlement dates. Premiums on unclosed business are brought to account using estimates based on payment cycles nominated by the policyholder.

Notes to the Consolidated Financial Statements continued For the year ended 30 June 2020 nib holdings limited
70
6. REVENUE AND OTHER INCOME continued a) Accounting policy continued
Investment income
Net fair value gains or losses on financial assets classified as at fair value through profit or loss are recognised in the period. Interest income is recognised using the effective interest method. Refer to Note 10(a)(iii) for impairment of financial assets.
Outwards reinsurance
Premiums ceded to reinsurers under insurance contracts held by the Group are recognised as an outwards reinsurance expense and are recognised in the income statement from the attachment date over the period of indemnity of the reinsurance contract in accordance with the expected pattern of the incidence of risk ceded.
Income from travel
insurance commission
Income in the form of commissions is recognised when the sale of an insurance policy to a customer occurs. Income is also generated on travel services activities and recognised as the service is performed.

Notes to the Consolidated Financial Statements continued For the year ended 30 June 2020 nib holdings limited
71
7. EXPENSES 2020 2019
Notes $m $m
Expenses by functionClaims handling expenses 21.9 18.4Acquisition costs 168.5 171.0Other underw riting expenses 145.3 146.6Other expenses 112.3 89.6Finance costs 9.7 7.7Investment expenses 2.0 2.5Total expenses (excluding direct claims expenses) 459.7 435.8
Expenses by natureAmortisation of acquired intangibles 10.4 9.2Bank charges 5.1 5.1Communications, postage and telephone expenses 5.6 5.6Depreciation and amortisation 17.3 15.6Depreciation of right-of-use assets 15 7.5 -Employee costs 164.7 155.3Finance costs 5.5 7.7Finance costs - interest on lease liabilities 15 4.2 -Impairment of intangibles 8.0 1.0Information technology expenses 21.8 18.6Investment expenses 2.0 2.5Marketing expenses - excluding commissions 45.3 52.4Marketing expenses - commissions 115.7 106.9Merger, acquisition and new business implementation costs 9.7 8.0Operating lease rental expenses - 12.9Professional fees 18.3 18.1Other expenses 18.6 16.9Total expenses (excluding direct claims expenses) 459.7 435.8

Notes to the Consolidated Financial Statements continued For the year ended 30 June 2020 nib holdings limited
72
8. TAXATION a) Income tax
2020 2019Notes $m $m
i) Income tax expenseRecognised in the income statementCurrent tax expense 77.2 64.5Deferred tax expense (40.0) (0.3)Under (over) provided in prior years (1.4) (0.4)Under (over) provided in prior years - research and development tax credit - (0.1)
35.8 63.7
Income tax expense is attributable to:Profit from continuing operations 35.8 63.7Aggregate income tax expense 35.8 63.7
Deferred income tax expense included in income tax expense comprises:(Increase) / decrease in deferred tax assets 8(b) (33.4) (0.9)Increase / (decrease) in deferred tax liabilities 8(c) (6.6) 0.6
(40.0) (0.3)
i i) Numerical reconciliation of income tax expense to prima facie tax payableProfit from continuing operations before income tax expense 125.0 213.0
Tax at the Australian tax rate of 30% (2019: 30%) 37.5 63.9Tax effect of amounts w hich are not deductible (taxable) in calculating taxable income:
Sundry items 0.5 1.0Net assessable trust distributions 0.2 0.3Imputation credits and foreign tax credits (0.7) (1.1)Adjustment for current tax of prior periods (1.4) (0.4)Adjustment for current tax of prior periods - research and development tax credit - (0.1)Unrecognised tax losses and deferred tax assets 0.1 -Differences in foreign tax rates (0.4) 0.1
Income tax expense 35.8 63.7
i i i) Tax expense relating to items of other comprehensive incomeForeign currency translations (0.4) 0.9
(0.4) 0.9
iv) Tax lossesUnused tax losses for w hich no deferred tax asset has been recognised 0.3 -Potential tax benefit at 30% 0.1 -

Notes to the Consolidated Financial Statements continued For the year ended 30 June 2020 nib holdings limited
73
8. TAXATION continued b) Deferred tax assets
2020 2019
Notes $m $m
The balance comprises temporary differences attributable to:Claims liabilities 30.7 0.3Depreciation and amortisation 0.6 1.2Employee benefits 6.1 5.7Lease liabilities 23.8 -Premium payback liabilities 5.2 5.1Provisions 5.7 6.1Unrealised losses on investments 4.0 -
76.1 18.4OtherDeferred profit on sale and leaseback of head off ice building - 1.4Loss allow ance 0.6 0.5Income receivables 0.4 0.4Investment in associates and joint ventures 1.4 0.2Share issue costs 0.2 0.4Tax losses 0.2 0.5
2.8 3.4
Total deferred tax assets 78.9 21.8
Set-off of deferred tax liabilities pursuant to set-off provisions 8(c) (66.5) (21.8)Net deferred tax assets 12.4 -
Recovery of total deferred tax assets:Deferred tax assets to be recovered w ithin 12 months 41.0 8.5Deferred tax assets to be recovered after more than 12 months 37.9 13.3
78.9 21.8

Notes to the Consolidated Financial Statements continued For the year ended 30 June 2020 nib holdings limited
74
8. TAXATION continued b) Deferred tax assets continued
MovementsClaims
liabilities
Depreciation and
amortisationEmployee
benefitsLease
liabilities
Premium payback
liabilites Provisions
Unrealised losses on
investments Other Total$m $m $m $m $m $m $m $m $m
Balance at 30 June 2018 as originally presented 1.6 - 4.9 - 4.7 5.7 0.4 2.8 20.1Adjustment on adoption of AASB 15 - - - - - - - 0.3 0.3Restated balance at 1 July 2018 1.6 - 4.9 - 4.7 5.7 0.4 3.1 20.4(Charged)/credited to the income statement (1.3) 1.2 0.5 - 0.2 0.4 (0.4) 0.3 0.9(Charged)/credited directly to other comprehensive income - - - - 0.2 - - - 0.2Acquisition of business - - 0.3 - - - - - 0.3Balance at 30 June 2019 as originally presented 0.3 1.2 5.7 - 5.1 6.1 - 3.4 21.8Adjustment on adoption of AASB 16 - - - 25.2 - - - (1.4) 23.8Restated balance at 1 July 2019 0.3 1.2 5.7 25.2 5.1 6.1 - 2.0 45.6(Charged)/credited to the income statement 30.4 (0.7) 0.4 (1.5) 0.4 (0.4) 4.0 0.8 33.4(Charged)/credited directly to other comprehensive income - 0.1 - 0.1 (0.3) - - - (0.1)At 30 June 2020 30.7 0.6 6.1 23.8 5.2 5.7 4.0 2.8 78.9

Notes to the Consolidated Financial Statements continued For the year ended 30 June 2020 nib holdings limited
75
8. TAXATION continued c) Deferred tax liabilities
2020 2019Notes $m $m
The balance comprises temporary differences attributable to:Brands and trademarks and customer contracts and relationships 17.7 22.8Deferred acquisition costs 34.7 32.4Right-of-use assets 17.9 -Unrealised foreign exchange gains 0.8 1.1Unrealised gains on investments - 2.5
71.1 58.8OtherIncome receivables - -Unearned premium liability 0.1 0.2
0.1 0.2
Total deferred tax liabilities 71.2 59.0
Set-off of deferred tax liabilities pursuant to set-off provisions 8(b) (66.5) (21.8)Net deferred tax liabilities 4.7 37.2
Recovery of total deferred tax liabilities:Deferred tax liabilities to be settled w ithin 12 months 15.4 17.4Deferred tax liabilities to be settled after more than 12 months 55.8 41.6
71.2 59.0
Movements
Brands and trademarks
and customer contracts
and relationships
Deferred acquisition
costs
Depreciation and
amortisation Right-of-use assets
Unrealised foreign
exchange losses
Unrealised gains on
investments Other Total$m $m $m $m $m $m $m $m
Balance at 1 July 2018 21.3 31.3 0.1 - 0.6 - 0.4 53.7(Charged)/credited to the income statement (2.4) 0.8 (0.1) - - 2.5 (0.2) 0.6(Charged)/credited directly to other comprehensive income 0.3 0.3 - - 0.5 - - 1.1Acquisition of business 3.6 - - - - - - 3.6Balance as at 30 June 2019 as originally presented 22.8 32.4 - - 1.1 2.5 0.2 59.0Adjustment on adoption of AASB 16 - - - 19.4 - - - 19.4Restated balance at 1 July 2019 22.8 32.4 - 19.4 1.1 2.5 0.2 78.4(Charged)/credited to the income statement (5.0) 2.4 - (1.4) - (2.5) (0.1) (6.6)(Charged)/credited directly to other comprehensive income (0.1) (0.1) - (0.1) (0.3) - - (0.6)At 30 June 2020 17.7 34.7 - 17.9 0.8 - 0.1 71.2

Notes to the Consolidated Financial Statements continued For the year ended 30 June 2020 nib holdings limited
76
8. TAXATION continued d) Accounting policy The income tax expense or revenue for the period is the tax payable on the current period’s taxable income based on the applicable income tax rate for each jurisdiction adjusted by changes in deferred tax assets and liabilities attributable to temporary differences and to unused tax losses. Deferred income tax is provided in full, using the liability method, on temporary differences arising between the tax bases of assets and liabilities and their carrying amount in the consolidated financial statements. However, the deferred income tax is not accounted for if it arises from initial recognition of an asset or liability in a transaction other than a business combination that at the time of the transaction affects neither accounting nor taxable profit or loss. Deferred income tax is determined using tax rates (and laws) that have been enacted or substantially enacted by the reporting date and are expected to apply when the related deferred income tax asset is realised or the deferred income tax liability is settled. Deferred tax assets are recognised for deductible temporary differences and unused tax losses only if it is probable that future taxable amounts will be available to utilise those temporary differences and losses. Deferred tax liabilities and assets are not recognised for temporary differences between the carrying amount and tax bases of investments in controlled entities where the parent entity is able to control the timing of the reversal of the temporary differences and it is probable that the differences will not reverse in the foreseeable future. Deferred tax assets and liabilities are offset when there is a legally enforceable right to offset current tax assets and liabilities and when the deferred tax balances relate to the same taxation authority. Current tax assets and tax liabilities are offset where the entity has a legally enforceable right to offset and intends either to settle on a net basis, or to realise the asset and settle the liability simultaneously. nib holdings limited and its wholly-owned Australian controlled entities are a tax consolidated group. As a consequence, the entities within each group are taxed as a single entity and the deferred tax assets and liabilities of these entities are set-off in the consolidated financial statements. Current and deferred tax is recognised in profit or loss, except to the extent that it relates to items recognised in other comprehensive income or directly in equity. In this case, the tax is also recognised in other comprehensive income or directly in equity, respectively.

Notes to the Consolidated Financial Statements continued For the year ended 30 June 2020 nib holdings limited
77
9. CASH AND CASH EQUIVALENTS
2020 2019
$m $m
Cash at bank and cash on hand 141.6 124.2Short term deposits and deposits at call 56.4 40.5
198.0 164.7 a) Accounting policy Cash and cash equivalents, and bank overdrafts, are carried at face value of the amounts deposited or drawn. For the purpose of the presentation in the Consolidated Statement of Cash Flows, cash and cash equivalents includes cash on hand, deposits held at call with financial institutions, other short-term, highly liquid investments with original maturities of three months or less that are readily convertible to known amounts of cash and which are subject to an insignificant risk of changes in value, and bank overdrafts. Bank overdrafts are shown within borrowings in current liabilities on the balance sheet. b) Risk exposure The Group’s exposure to interest rate risk is discussed in Note 3(b). The maximum exposure to credit risk at the reporting date is the carrying amount of each class of cash and cash equivalents mentioned above. c) Reconciliation of profit after income tax to net cash inflow from operating activities
2020 2019
$m $m
Profit for the year 89.2 149.3Net (gain) / loss on disposal of property, plant and equipment 0.1 0.6Deferred profit on sale and leaseback of head off ice building - (0.4)Fair value (gain)/loss on other f inancial assets through profit or loss 4.6 (10.3)Share of net (profit) / loss of associates and joint ventures 4.0 1.0Non-cash employee benefits expense - share-based payments (0.4) 1.0Depreciation and amortisation 27.7 24.8Depreciation of right-of-use assets and interest on leases 11.7 -Impairment of intangibles 8.0 1.0Net exchange differences 0.9 (1.8)Change in operating assets and liabilities, net of effect from purchase of controlled entity
Decrease (increase) in receivables (3.3) (2.8)Decrease (increase) in deferred acquisition costs (2.2) (4.6)Decrease (increase) in deferred tax assets (8.6) 0.1Increase (decrease) in trade payables (8.3) 10.3Increase (decrease) in unearned premium liability 0.7 19.6Increase (decrease) in premium payback liability 0.8 1.1Increase (decrease) in current tax liabilities 13.7 4.0Increase (decrease) in deferred tax liabilities (31.4) 0.1Increase (decrease) in provisions 104.4 (8.5)
Net cash flow from operating activities 211.6 184.5

Notes to the Consolidated Financial Statements continued For the year ended 30 June 2020 nib holdings limited
78
9. CASH AND CASH EQUIVALENTS continued d) Net debt This section sets out an analysis and movements in net debt:
2020 2019
$m $m
Cash and cash equivalents 198.0 164.7Liquid investments 818.1 731.4Borrow ings – repayable w ithin one year (2.0) (1.4)
(230.9) (232.5)Lease liabilities (82.6) -Net debt 700.6 662.2
Cash and liquid investments 1,016.1 896.1Gross debt – f ixed interest rates - -
(232.9) (233.9)Lease liabilities (82.6) -Net debt 700.6 662.2
Cash and cash equivalents
Liquid-investments Sub-total Borrowings Lease liabilities Total
Note $m $m $m $m $m $m
Net debt as at 1 July 2018 192.2 721.7 913.9 (230.6) - 683.3Cash flow s (40.7) (4.6) (45.3) (0.3) - (45.6)Net cash and liquid investments from consolidation of Charitable foundation 13.8 4.0 17.8 - - 17.8Foreign exchange adjustments (0.6) 1.1 0.5 (3.0) - (2.5)Other non-cash movements - 9.2 9.2 - - 9.2Net debt as at 30 June 2019 164.7 731.4 896.1 (233.9) - 662.2Recognised on adoption of AASB 16 15 - - - - (87.6) (87.6)Restated net debt at 1 July 2019 164.7 731.4 896.1 (233.9) (87.6) 574.6Cash flow s 34.2 66.2 100.4 (0.5) 10.6 110.5Acquisition - leases - - - - (1.8) (1.8)Foreign exchange adjustments (0.9) (2.1) (3.0) 1.5 0.1 (1.4)Other non-cash movements - 22.6 22.6 - (3.9) 18.7Net debt as at 30 June 2020 198.0 818.1 1,016.1 (232.9) (82.6) 700.6
Liabilities from financing activities
Borrow ings – repayable after one year
Gross debt – variable interest rates
Assets
Liquid investments comprise current investments that are traded in an active market, being the Group’s financial assets at amortised cost and financial assets at fair value through profit or loss. e) Off-balance sheet arrangements nib Travel Pty Limited (nib Travel), a wholly owned subsidiary of nib holdings limited, operates bank accounts held in their name on behalf of their underwriters in accordance with contractual terms governing the arrangements. These accounts are not considered part of the cash and cash equivalents of nib Travel as they do not have the control over the cash. At 30 June 2020 this amounted to $23,510,009 (2019: $29,858,140).

Notes to the Consolidated Financial Statements continued For the year ended 30 June 2020 nib holdings limited
79
10. RECEIVABLES 2020 2019
$m $m
CurrentPremium receivable 11.9 11.2Private Health Insurance Premiums Reduction Scheme receivable 38.2 36.9Other receivables 22.6 21.2Provision for loss allow ance (1.9) (1.8)Prepayments 9.4 8.1Expected future reinsurance recoveries undiscounted on claims paid 3.8 3.9 on outstanding claims 2.4 1.8
86.4 81.3
Non-currentOther receivables - 1.8
- 1.8 As at 30 June 2020, current receivables of the Group with a nominal value of $1.928 million (2019: $1.782 million) were impaired.
The loss allowance as at 30 June 2020 and 2019 was determined as follows for both premium receivables and other receivables:
Group at 30 June 2020 CurrentMore than 30 days past due
More than 60 days past due
More than 120 days past due Total
Expected loss rate % 4% 5% 5% 15%Gross carrying amount - premium receivables $m 10.5 0.7 0.4 0.3 11.9Gross carrying amount - other receivables $m 16.1 1.4 1.5 3.6 22.6Loss allowance $m 1.1 0.1 0.1 0.6 1.9
Group at 30 June 2019 CurrentMore than 30 days past due
More than 60 days past due
More than 120 days past due Total
Expected loss rate % 4% 6% 10% 18%Gross carrying amount - premium receivables $m 5.5 2.2 1.3 2.2 11.2Gross carrying amount - other receivables $m 18.6 1.3 0.7 0.6 21.2Loss allowance $m 0.9 0.2 0.2 0.5 1.8 The closing loss allowances for premium receivables and other receivables as at 30 June 2020 and 2019 reconcile to the opening loss allowances as follows:
Premium receivables
Other receivables Total
$m $m $m
1 July - calculated under AASB 139 1.6 0.1 1.7Amounts restated through opening retained earnings 0.1 - 0.1Opening loss allowance as at 1 July 2018 - calculated under AASB 9 1.7 0.1 1.8Increase / (decrease) in loss allow ance recognised in profit or loss during the year (0.1) 0.1 -At 30 June 2019 1.6 0.2 1.8Increase / (decrease) in loss allow ance recognised in profit or loss during the year (0.1) 0.3 0.2Receivables w ritten off during the year as uncollectible - (0.1) (0.1)At 30 June 2020 1.5 0.4 1.9 As of 30 June 2020 and 30 June 2019 no receivables were past due but not impaired.

Notes to the Consolidated Financial Statements continued For the year ended 30 June 2020 nib holdings limited
80
10. RECEIVABLES continued a) Accounting policy
Premium receivables
Amounts due from policyholders are initially recognised at fair value, being the amounts due. They are subsequently measured at amortised cost less allowance for expected credit losses. The Group has applied the simplified approach to measuring expected credit losses, which uses a lifetime expected loss allowance. To measure the expected credit losses, premium receivables have been grouped based on shared risk characteristics. The amount of expected credit losses is recognised in Premium revenue on the Consolidated Income Statement.
Other receivables
Other receivables are initially recognised at fair value and subsequently measured at amortised cost using the effective interest method, less any allowance for expected credit losses. Other receivables are generally due for settlement within 30 days. The Group has applied the simplified approach to measuring expected credit losses, which uses a lifetime expected loss allowance. To measure the expected credit losses, other receivables have been grouped based on shared risk characteristics. The amount of expected credit losses is recognised in the Consolidated Income Statement. When a receivable becomes uncollectible it is written off against the expected credit loss account. Subsequent recoveries of amounts previously written off are credited against other expenses in the Consolidated Income Statement.
Impairment of financial
assets
The Group recognises a loss allowance for expected credit losses on financial assets which are either measured at amortised cost or fair value through other comprehensive income. The measurement of the loss allowance depends upon the Group's assessment at the end of each reporting period as to whether the financial instrument's credit risk has increased significantly since initial recognition, based on reasonable and supportable information that is available, without undue cost or effort to obtain. Where there has not been a significant increase in exposure to credit risk since initial recognition, a 12- month expected credit loss allowance is estimated. This represents a portion of the asset's lifetime expected credit losses that is attributable to a default event that is possible within the next 12 months. Where a financial asset has become credit impaired or where it is determined that credit risk has increased significantly, the loss allowance is based on the asset's lifetime expected credit losses. The amount of expected credit loss recognised is measured on the basis of the probability weighted present value of anticipated cash shortfalls over the life of the instrument discounted at the original effective interest rate. For financial assets measured at fair value through other comprehensive income, the loss allowance is recognised within other comprehensive income. In all other cases, the loss allowance is recognised in profit or loss.
Interest rate risk
Information about the Group’s exposure to interest rate risk in relation to other receivables is provided in Note 3.
Fair value and credit
risk
Due to the short-term nature of current receivables, their carrying amount is assumed to approximate their fair value. The maximum exposure to credit risk at the reporting date is the carrying amount of each class of receivables mentioned above.
Risk exposure
The maximum exposure to credit risk at the reporting date is the carrying amount of each class of receivable mentioned above. Refer to Note 3 for more information on the risk management policy of the Group and the credit quality of the Group’s receivables.
Reinsurance and other recoveries receivable
Reinsurance and other recoveries receivable on paid claims, reported claims not yet paid, incurred but not reported (IBNR), and unexpired risk liabilities are recognised as revenue. Recoveries receivable are assessed in a manner similar to the assessment of outstanding claims. Recoveries are measured as the present value of the expected future receipts, calculated on the same basis as the liability for outstanding claims (see Note 18).

Notes to the Consolidated Financial Statements continued For the year ended 30 June 2020 nib holdings limited
81
11. FINANCIAL ASSETS a) Financial assets at amortised cost
2020 2019
$m $m
8.8 73.98.8 73.9
Short term deposits
Interest income on financial assets at amortised cost are recorded in investment income in profit or loss in Note 6.
b) Financial assets at fair value through profit or loss 2020 2019
$m $m
CurrentEquity securities 156.1 134.4
660.2 518.3Mortgage trusts - 0.4Property trusts 12.3 14.6
- 75.0828.6 742.7
Non-currentMortgage trusts 0.4 -Property trusts - 1.5
0.4 1.5
Interest-bearing securities
Short term deposits
Changes in fair values of financial assets at fair value through profit or loss are recorded in investment income in profit or loss in Note 6. The redemption terms for investments in certain managed trusts can be varied by their responsible entities in response to market conditions. For those investments which cannot be redeemed entirely within one year from reporting date, the amounts have been allocated between current and non-current in accordance with the maximum percentage redeemable within one year as per the most recent advice from the manager at the end of the reporting period. c) Accounting policy
Classification
The Group classifies its financial assets into the following measurement categories:
• those to be measured at fair value (either through other comprehensive income, or through profit or loss), and
• those to be measured at amortised cost.
The classification depends on the Group’s business model for managing the financial assets and the contractual terms of the relevant cash flows. The Group has determined that financial assets held by entities in the Group that are health insurers are classified as fair value through profit or loss as they are held to back insurance liabilities. These assets are managed in accordance with agreed investment mandate agreements on a fair value basis and are reported to the Board on this basis. A financial asset is measured at amortised cost only if both of the following conditions are met:
• it is held within a business model which objective is to hold assets in order to collect contractual cash flows, and
• the contractual terms of the financial asset represent contractual cash flows that are solely payments of principal and interest.

Notes to the Consolidated Financial Statements continued For the year ended 30 June 2020 nib holdings limited
82
11. FINANCIAL ASSETS continued c) Accounting policy continued
Measurement
Financial assets at fair value through profit or loss are recognised initially at fair value. All other financial assets are recognised initially at fair value plus directly attributable transaction costs. Subsequent to the initial recognition, for financial assets measured at fair value, gains and losses will either be recorded in profit or loss or other comprehensive income. For investments in debt instruments, this will depend on the business model in which the investment is held as described below. Reclassification of debt investments is done when and only when its business model for managing those assets changes. For investments in equity instruments, the fair value will be recorded in profit or loss, unless the Group has made an irrevocable election at the time of initial recognition to account for the equity investment at fair value through other comprehensive income (FVOCI). Financial assets with embedded derivatives are considered in their entirety when determining whether their cash flows are solely payment of principal and interest.
Debt instruments
Subsequent measurement of debt instruments depends on the Group's business model for managing the asset and the cash flow characteristics of the asset. There are three measurement categories into which the company classifies its debt instruments: Amortised cost Assets that are held for collection of contractual cash flows where those cash flows represent solely payments of principal and interest are measured at amortised cost. A gain or loss on a debt investment that is subsequently measured at amortised cost and is not part of a hedging relationship is recognised in profit or loss when the asset is derecognised or impaired. Interest income from these financial assets is included in profit or loss using the effective interest rate method. Fair value through other comprehensive income (FVOCI) Assets that are held for collection of contractual cash flows and for selling the financial assets, where the assets' cash flows represent solely payments of principal and interest, are measured at FVOCI. Movements in the carrying amount are taken through OCI, except for the recognition of impairment losses or reversal of impairment losses, interest income and foreign exchange gains and losses which are recognised in profit or loss. When the financial asset is derecognised, the cumulative gain or loss previously recognised in OCI is reclassified from equity to profit or loss. Interest income from these financial assets is included in profit or loss using the effective interest rate method. Fair value through profit or loss (FVPL) Assets that do not meet the criteria for amortised cost or FVOCI are measured at fair value through profit or loss. A gain or loss on a debt investment that is subsequently measured at FVPL and is not part of a hedging relationship is recognised in profit or loss and presented net within investment gains/(losses) in the period in which it arises. Interest income from these financial assets is included in the profit or loss using the effective interest rate method.
Equity instruments
The Group subsequently measures all investments in equity instruments at fair value. Where the Group’s management has elected to present fair value gains and losses on equity investments in other comprehensive income, there is no subsequent reclassification of fair value gains and losses to profit or loss. Changes in the fair value of financial assets at fair value through profit or loss are recognised in investment gains/(losses) in the statement of profit or loss. Impairment losses (and reversal of impairment losses) on equity investments measured at FVOCI are not reported separately from other changes in fair value.
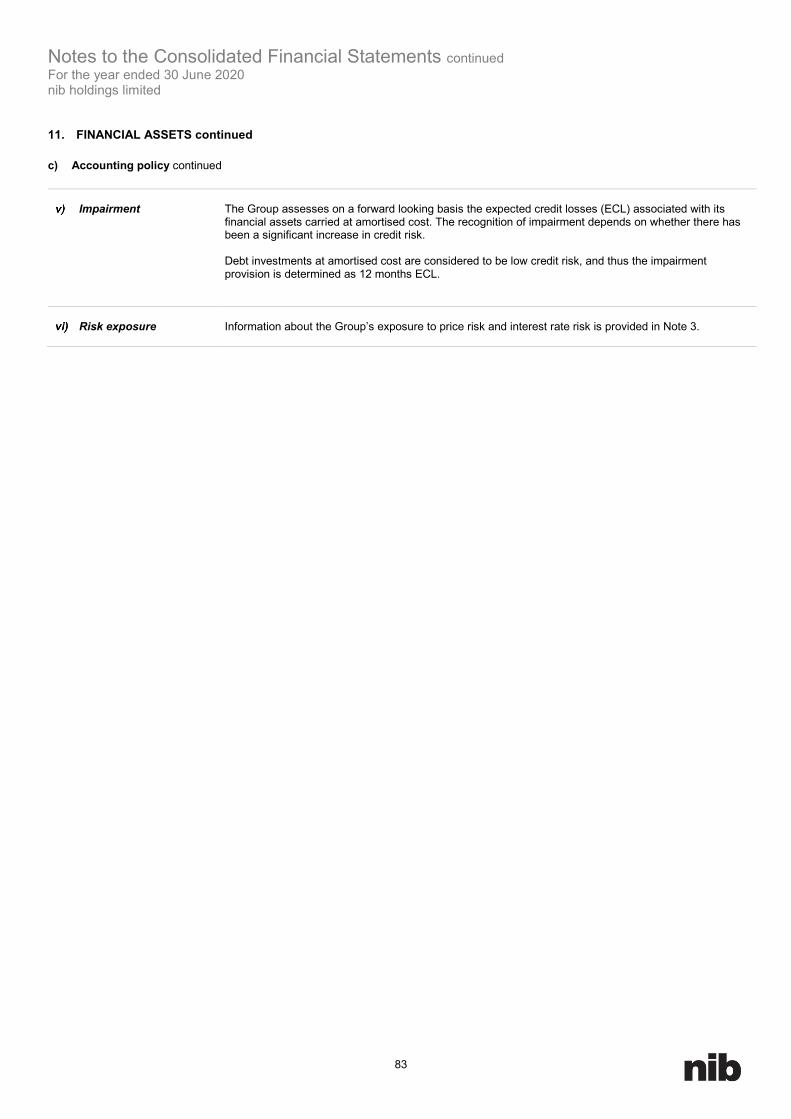
Notes to the Consolidated Financial Statements continued For the year ended 30 June 2020 nib holdings limited
83
11. FINANCIAL ASSETS continued c) Accounting policy continued
Impairment
The Group assesses on a forward looking basis the expected credit losses (ECL) associated with its financial assets carried at amortised cost. The recognition of impairment depends on whether there has been a significant increase in credit risk. Debt investments at amortised cost are considered to be low credit risk, and thus the impairment provision is determined as 12 months ECL.
Risk exposure
Information about the Group’s exposure to price risk and interest rate risk is provided in Note 3.

Notes to the Consolidated Financial Statements continued For the year ended 30 June 2020 nib holdings limited
84
12. DEFERRED ACQUISITION COSTS 2020 2019
$m $m
Current 50.7 49.7
Non-current 66.7 65.5 Movements in the deferred acquisition costs are as follows:
2020 2019
$m $m
Balance at beginning of year 115.2 110.7Acquisition costs deferred during the period 60.9 54.9Amortisation expense (58.2) (51.5)Exchange differences (0.5) 1.1
117.4 115.2 Deferred acquisition costs by segment are as follows:
2020 2019
$m $m
Australian Residents Health Insurance 86.0 84.9New Zealand Residents Health Insurance 27.0 25.5International (Inbound) Health Insurance 4.4 4.8
117.4 115.2 a) Accounting policy Direct acquisition costs incurred in obtaining health insurance contracts, including broker commissions, are deferred and recognised as assets where they can be reliably measured and where it is probable that they will give rise to premium revenue that will be recognised in the consolidated income statement in subsequent reporting periods. This pattern of amortisation reflects the earning pattern of the corresponding premium revenue.
b) Critical accounting judgements and estimates
Australian Residents Health Insurance Deferred acquisition costs are amortised on a straight line basis over a period of 5 years (2019: 5 years), in accordance with the expected pattern of the incidence of risk under the open ended insurance contracts to which they relate, which includes expectations of customers remaining insured. The Group pays an upfront commission to retail brokers on signing up new members to the business. These upfront commissions will give rise to future premium revenue beyond the current period and are able to be measured and directly associated with a particular insurance contract. The Group does not capitalise the indirect administration costs associated with acquiring new members due to the difficulty in measurement. The Group considers the duration of a health insurance contract to be an open ended agreement as the Group stands ready to continue to insure its customers under continuing policies. The Group uses average retention rates to determine the appropriate customer contract life and related amortisation period for customers who purchase insurance through these broker channels. The analysis included extrapolating historical lapse rates for broker acquired customers but truncating the data at 10 years in order to allow for the inherent distortion created by extrapolating historical data. This analysis and management’s expectations of future lapse supports the amortisation period of 5 years. The Group re-performs this analysis at least every six months for reassessment. A decrease in the expected contract periods of one year would increase amortisation expense by $13.8 million for 30 June 2020. The recoverability of the related deferred acquisition costs is also considered as part of the liability adequacy test performed. As described in Note 19, the Group has no deficiency in the unearned premium liability at 30 June 2020.

Notes to the Consolidated Financial Statements continued For the year ended 30 June 2020 nib holdings limited
85
12. DEFERRED ACQUISITION COSTS continued b) Critical accounting judgements and estimates continued Alternative view General insurers amortise deferred acquisition costs usually over one year, as their policies generally have a defined term of one year. With health insurance, if the contract term is considered to be only the term to which the customer has agreed to, or paid to, the deferred acquisition cost would be amortised over a period of between one and two months, which is the period paid in advance by the customer. However, the Group believes that does not reflect the open ended nature of a health insurance contract, the contract periods to which future premium revenue will arise, nor the expected pattern of the incidence of risk under the insurance contracts to which the costs relate. For these reasons the Group believes the current adopted treatment is more appropriate.
nib New Zealand The Group incurs upfront commission costs that will give rise to future premium revenue and are able to be directly associated with a particular insurance contract. These costs are deferred and amortised over the life of the insurance contract. The Group does not capitalise the indirect administration costs associated with acquiring new members due to the difficulty in identifying and associating those indirect costs with acquiring particular insurance contracts. There are two key assumptions required to recognise the acquisition costs over the life of the insurance contract:
• the period of the insurance contract is assumed to be the average length of insurance for nib nz limited policyholders who are the subject of an upfront commission; and
• the average length of insurance for nib nz limited policyholders who are the subject of an upfront commission is calculated by
extrapolating historical lapse rates for that group of policyholders.
The recoverability of the related deferred acquisition costs is also considered through an assessment of the net present value of the future estimated cash flows for policies that are subject to commission, and as part of the liability adequacy test performed. As described in Note 18, the Group has no deficiency in the unearned premium liability at 30 June 2020.

Notes to the Consolidated Financial Statements continued For the year ended 30 June 2020 nib holdings limited
86
13. PROPERTY, PLANT & EQUIPMENT
Plant & Equipment
Leasehold Improvements Total
$m $m $m
At 1 July 2018Cost 18.7 13.5 32.2Accumulated depreciation and impairment (14.6) (7.2) (21.8)Net book amount 4.1 6.3 10.4
Year ended 30 June 2019Opening net book amount 4.1 6.3 10.4Additions 2.8 4.0 6.8Acquisition of subsidiary 0.1 - 0.1Disposals - (0.1) (0.1)Depreciation charge for the year (2.2) (1.8) (4.0)Exchange differences - - -Closing net book amount 4.8 8.4 13.2
At 30 June 2019Cost 20.3 17.3 37.6Accumulated depreciation and impairment (15.5) (8.9) (24.4)Net book amount 4.8 8.4 13.2
Year ended 30 June 2020Opening net book amount 4.8 8.4 13.2Additions 2.1 0.2 2.3Disposals - - -Depreciation charge for the year (2.3) (1.8) (4.1)Exchange differences - - -Closing net book amount 4.6 6.8 11.4
At 30 June 2020Cost 22.2 17.5 39.7Accumulated amortisation and impairment (17.6) (10.7) (28.3)Net book amount 4.6 6.8 11.4 a) Accounting policy All property, plant and equipment are stated at historical cost less depreciation. Historical cost includes expenditure that is directly attributable to the acquisition of the items. Subsequent costs are included in the asset's carrying amount or recognised as a separate asset, as appropriate, only when it is probable that future economic benefits associated with the item will flow to the Group and the cost of the item can be measured reliably. The carrying amount of a replaced part is derecognised. All other repairs and maintenance are charged to profit or loss during the reporting period in which they are incurred.

Notes to the Consolidated Financial Statements continued For the year ended 30 June 2020 nib holdings limited
87
13. PROPERTY, PLANT & EQUIPMENT continued a) Accounting policy continued Depreciation is calculated using the straight-line method to allocate their cost or revalued amounts, net of their residual values, over their estimated useful lives, as follows:
• Plant and equipment 3 to 10 years • Leasehold improvements 3 to 10 years
The assets' residual values and useful lives are reviewed, and adjusted if appropriate at each reporting date. An asset's carrying amount is written down immediately to its recoverable amount if the asset's carrying amount is greater than its estimated recoverable amount (see Note 14(a)(v)). Gains and losses on disposals are determined by comparing proceeds with carrying amount. These are included in profit or loss. When revalued assets are sold, it is Group policy to transfer the amounts included in other reserves in respect of those assets to retained earnings.

Notes to the Consolidated Financial Statements continued For the year ended 30 June 2020 nib holdings limited
88
14. INTANGIBLE ASSETS
Goodwill SoftwareBrands and Trademarks
Customer Contracts and
relationships Total
$m $m $m $m $m
At 1 July 2018Cost 209.1 91.7 33.6 68.0 402.4Accumulated amortisation and impairment - (56.9) (5.9) (22.7) (85.5)Net book amount 209.1 34.8 27.7 45.3 316.9
Year ended 30 June 2019Opening net book amount 209.1 34.8 27.7 45.3 316.9Additions - 21.8 - - 21.8Acquisition of subsidiary 16.4 - - 11.9 28.3Disposals - (0.4) - - (0.4)Amortisation charge for the year - (13.4) (1.3) (6.1) (20.8)Impairment charge - - (1.0) - (1.0)Exchange differences 1.9 0.3 - 1.1 3.3Closing net book amount 227.4 43.1 25.4 52.2 348.1
At 30 June 2019Cost 227.4 112.9 32.6 81.7 454.6Accumulated amortisation and impairment - (69.8) (7.2) (29.5) (106.5)Net book amount 227.4 43.1 25.4 52.2 348.1
Year ended 30 June 2020Opening net book amount 227.4 43.1 25.4 52.2 348.1Additions - 24.7 - - 24.7Disposals - (0.1) - - (0.1)Amortisation charge for the year - (15.0) (1.2) (7.4) (23.6)Impairment charge - - (5.8) (2.2) (8.0)Exchange differences (0.9) (0.3) - (0.5) (1.7)Closing net book amount 226.5 52.4 18.4 42.1 339.4
At 30 June 2020Cost 226.5 135.9 32.6 80.7 475.7Accumulated amortisation and impairment - (83.5) (14.2) (38.6) (136.3)Net book amount 226.5 52.4 18.4 42.1 339.4

Notes to the Consolidated Financial Statements continued For the year ended 30 June 2020 nib holdings limited
89
14. INTANGIBLE ASSETS continued a) Accounting policy
Goodwill
Goodwill represents the excess of the cost of an acquisition over the fair value of the Group’s share of the net identifiable assets of the acquired subsidiary at the date of acquisition. Goodwill on acquisitions of subsidiaries is included in intangible assets. Goodwill is not amortised. Instead, goodwill is tested for impairment annually, and is carried at cost less accumulated impairment losses.
Software
Costs incurred in developing products or systems and costs incurred in acquiring software and licences that will contribute to future period financial benefits through revenue generation and/or cost reduction are capitalised to software. Costs capitalised include external direct costs of materials and service and direct payroll and payroll related costs of employees’ time spent on the project. Amortisation is calculated on a straight-line basis over periods generally ranging from two and a half years to five years.
Brands and trademarks
Brands and trademarks acquired as part of a business combination are carried at fair value at the date of acquisition less accumulated amortisation. Amortisation is calculated on the asset’s estimated useful life which is five years for IMAN Australian Health Plans Pty Ltd and 10 years for Grand United Corporate Health Limited. Brands and trademarks acquired with World Nomads Group in July 2015 have an indefinite useful life and are carried at fair value at the date of acquisition, less impairment losses.
Customer Contracts
and relationships
Customer contracts and relationships acquired as part of a business combination are recognised separately from goodwill. The customer contracts are carried at their fair value at the date of acquisition less accumulated amortisation and impairment losses. Amortisation is calculated based on the timing of projected cash flows of the contracts over their estimated useful lives, which is
• 10 years for both nib nz limited and Grand United Corporate Health Limited; • approximately 2.5 years for World Nomads Group. • 5 to 10 years for QBE Travel
Impairment
Goodwill and intangible assets that have an indefinite useful life and are not subject to amortisation are tested annually for impairment or more frequently if events or changes in circumstances indicate that they might be impaired. Other assets are tested for impairment whenever events or changes in circumstances indicate that the carrying amount may not be recoverable. An impairment loss is recognised for the amount by which the asset's carrying amount exceeds its recoverable amount. The recoverable amount is the higher of an asset's fair value less costs to sell and value in use. For the purposes of assessing impairment, assets are grouped at the lowest levels for which there are separately identifiable cash inflows which are largely independent of the cash inflows from other assets or groups of assets (cash-generating units). Non-financial assets other than goodwill that suffered impairment are reviewed for possible reversal of the impairment at each reporting date.

Notes to the Consolidated Financial Statements continued For the year ended 30 June 2020 nib holdings limited
90
14. INTANGIBLE ASSETS continued b) Allocation of goodwill and intangible assets to CGUs
Australian Residents
Health Insurance
International Workers Health
Insurance
New Zealand Residents Health
Insurance nib travel Group
Grand United Corporate
Health InsuranceUnallocted to
segments TotalAustralia Australia New Zealand Australia Australia
Goodwill $m $m $m $m $m $m $m
At 30 June 2020 80.2 21.1 41.1 84.1 - - 226.5At 30 June 2019 7.1 18.4 42.0 84.1 75.8 - 227.4
Brands and trademarks $m $m $m $m $m $m $m
At 30 June 2020 3.5 - - 14.9 - - 18.4At 30 June 2019 - 0.6 - 20.8 4.0 - 25.4
$m $m $m $m $m $m $m
At 30 June 2020 16.5 - 17.8 7.8 - - 42.1At 30 June 2019 18.7 - 21.9 11.6 - - 52.2
Software 1 $m $m $m $m $m $m $m
At 30 June 2020 - - - - - 52.4 52.4At 30 June 2019 - - - - - 43.1 43.1
Total $m $m $m $m $m $m $m
At 30 June 2020 100.2 21.1 58.9 106.8 - 52.4 339.4At 30 June 2019 25.8 19.0 63.9 116.5 79.8 43.1 348.1
Customer Contracts and relationships
1. Software is shown as unallocated as it is predominately a shared services function.
c) Allocation of definite life and indefinite life assets to CGUs
Australian Residents
Health Insurance
International Workers Health
Insurance
New Zealand Residents Health
Insurance nib travel Group
Grand United Corporate
Health InsuranceUnallocted to
segments TotalAustralia Australia New Zealand Australia Australia
Definite life $m $m $m $m $m $m $m
At 30 June 2020 20.0 - 17.8 7.8 - 52.4 98.0At 30 June 2019 18.7 0.6 21.9 11.6 75.8 43.1 171.7
Indefinite life $m $m $m $m $m $m $m
At 30 June 2020 80.2 21.1 41.1 99.0 - - 241.4At 30 June 2019 7.1 18.4 42.0 104.9 4.0 - 176.4
Total $m $m $m $m $m $m $m
At 30 June 2020 100.2 21.1 58.9 106.8 - 52.4 339.4At 30 June 2019 25.8 19.0 63.9 116.5 79.8 43.1 348.1

Notes to the Consolidated Financial Statements continued For the year ended 30 June 2020 nib holdings limited
91
14. INTANGIBLE ASSETS continued c) Allocation of definite life and indefinite life assets to CGUs continued The indefinite life brand names allocated to nib travel CGU are as follows:
WorldNomads.com
Travel Insurance Direct Suresave Total
Brands and trademarks $m $m $m $m
At 30 June 2020 12.7 2.2 - 14.9At 30 June 2019 12.7 5.2 2.9 20.8 d) Impairment tests for goodwill and intangibles Goodwill and intangibles are allocated to a cash-generating unit (CGU). On 31 December 2019, the ownership of Grand United Corporate Health Limited was transferred from nib holdings limited to nib health funds limited and accounted for as a transaction between entities under common control and the associated Grand United goodwill and brand name intangibles allocated across both arhi and iwhi CGU. The recoverable amount of a CGU is determined based on a value-in-use calculation. The value-in-use calculation uses cash flow projections based on financial budgets and forecast forward projections approved by management covering a four-year period. An asset is considered impaired when its balance sheet carrying amount exceeds its estimated recoverable amount, which is defined as the higher of its fair value less cost of disposal and its value in use. Whilst the recoverability assessment for each of the CGUs has not identified an impairment, certain individual brand name assets and distribution arrangements have been determined as impaired collectively by $8.0m (FY19: $1.0m). The estimates used in calculating value-in-use are highly sensitive, and depend on assumptions specific to the nature of the Group’s activities. Actual cash flows and values could vary significantly from forecasted future cash flows and related values derived from discounting techniques.
e) Key assumptions used for value-in-use calculations The assumptions used for the cash flow projections for the first four years are in line with the current forecast forward projections. Key assumptions include policyholder growth, claims ratio and the discount factor. Policyholder growth is calculated by forecasting the number of sales each month based on budgeted advertising and promotions spend, less the number of expected lapses each month. Claims ratios are targeted that generate price increases that maintain price competitiveness, cover expected increases in claims costs, do not adversely affect the funds capital adequacy position and enable funding of future business growth. Cash flows beyond the four-year period are extrapolated into perpetuity assuming a growth factor of 2.5% with the exception of Travel Insurance Direct Brand as shown below. The Group has applied a post-tax discount rate to discount the forecast future attributable post tax cash flows. These assumptions have been used for analysis of each CGU. Management determined policyholder growth and claims ratios based on past performance and its expectations for the future.

Notes to the Consolidated Financial Statements continued For the year ended 30 June 2020 nib holdings limited
92
14. INTANGIBLE ASSETS continued
e) Key assumptions used for value-in-use calculations continued
nib Travel The assumptions have been updated for the expected economic impact of COVID-19. COVID-19 has particularly impacted the travel industry to which nib is exposed via the nib Travel Group Australia CGU. Based on probability weighted scenario modelling, a key assumption in the nib Travel Group Australia CGU is that the travel industry returns back to pre-COVID-19 levels of activity by FY24. The following process has been utilised in forecasting cashflows for the nib Travel Group Australia CGU:
- FY21 to FY23 utilise nib internal Budgets. A gradual recovery back to pre-COVID-19 levels by FY24 has been forecast, with any recovery not starting until Calendar Year 2021
- In determining what constitutes this CGU returning back to pre-COVID-19 levels of activity in FY24: o 1H20 revenues have been assumed to represent pre-COVID levels of activity which have then been run rated o A 2.5% pa compound annual growth rate (CAGR) has been utilised to forecast expected revenue in FY24, consistent with
the terminal growth rate also applied o Expense ratios have been applied in FY24 with reference to internal budget ratios as well as FY18 and FY19 actual ratios.
- It is assumed that this level of activity is appropriate be included in the calculation of the Terminal Growth Value in the Value in Use calculation. Implied revenue CAGR’s out to FY24 are 8% from the FY19 base (noting this year did not include the full year effect of the QBE acquisition), 19% from the FY20 base (noting that COVID-19 has impacted this year) and 2.5% from the 1H20 base annualised.
f) Significant estimate: Impact of possible changes in key assumptions During the year the Travel Insurance Direct brand name was impaired down to $2.2 million and the Suresave brand name was impaired down to nil, due to a change in the underlying assumptions and brand strategy. A further deterioration in assumptions would result in a future impairment of the Travel Insurance Direct brand name. For the nib Travel Group Australia CGU, using the assumptions in section e), and also those outlined in the tables below, the nib Travel Group Australia CGU was not impaired. Should the travel industry return back to pre-COVID-19 levels of activity be delayed by one year (i.e. from FY24 to FY25) an impairment of approximately $1.0 million would be present. Given the high level of uncertainty around whether the travel industry will return to pre-COVID-19 levels, the nib Travel Group Australia CGU will continually be assessed as more information evolves. Sensitivity to changes in other key assumptions has been outlined in the table below. Other than as noted in the sensitivity table in Note 14(f) on page 93 , there are no reasonably possible changes in key assumptions that would impair the reported CGUs. The following table sets out the key assumptions for those CGUs that have significant goodwill allocated to them.
2020 2019 2020 2019 2020 2019 2020 2019Goodwill % % % % % % % %
Australian Residents Health Insurance 1.7 1.4 83.6 83.5 2.5 2.5 10.4 10.3International Workers Health Insurance 2.1 3.8 43.7 27.0 2.5 2.5 10.4 10.3New Zealand Residents Health Insurance 6.3 5.4 62.6 60.0 2.5 2.5 9.9 11.0Grand United Corporate Health Insurance 1 na 2.4 na 81.3 na 2.5 na 10.3
2020 2019 2020 2019 2020 2019% % % % % %
nib travel 2.5 9.6 2.5 2.5 11.0 10.3
Long term growth ratePolicyholder growth Claims ratio Pre-tax discount rate
1. On 31 December 2019, the Grand United Corporate Health business was acquired by nib health funds limited and the associated goodwill allocated across both arhi and iwhi CGU.
Revenue growth rate (forecast years) Long term growth rate Pre-tax discount rate

Notes to the Consolidated Financial Statements continued For the year ended 30 June 2020 nib holdings limited
93
14. INTANGIBLE ASSETS continued
f) Significant estimate: Impact of possible changes in key assumptions continued The following table outlines the sensitivity to reasonably possible changes in assumptions that would lead to an impairment.
Sensitivity to changes in assumptions Carrying valueRecoverable
value Difference
$m $m $m
nib Travel Group CGU 109.4 119.4 10.0
Change in recoverable valueMovement in
variable
Changerecoverable
value
Adjusted recoverable
value
$m $m
Change in revenue across FY21 - FY24 +10.0% 17.2 136.6-10.0% (17.2) 102.2
Change in pre-tax discount rate +1.0% (15.7) 103.7-1.0% 15.7 135.1
Change in Long Term Grow th Rate +1.0% 16.8 136.2-1.0% (16.8) 102.6
The following table sets out the key assumptions for the indefinite life for the brand names and trademarks for the nib Travel CGUs.
2020 2019 2020 2019 2020 2019 2020 2019
Brandnames and trademarks % % % % % % % %
WorldNomads.com 2.5 19.1 2.5 2.5 2.5 2.5 11.0 10.3Travel Insurance Direct (7.0) 0.0 2.0 2.0 (7.0) 0.0 11.0 10.3
Revenue growth rate (forecast years) Royalty rate Long term growth rate Pre-tax discount rate

Notes to the Consolidated Financial Statements continued For the year ended 30 June 2020 nib holdings limited
94
15. RIGHT-OF-USE ASSETS AND LEASE LIABILITIES a) Right-of-use assets
2020 2019
$m $m
Right-of-use assets - properties 62.1 -62.1 -
Movements in right-of-use assets are as follows:
2020 2019
$m $m
Adoption of AASB16 67.9 -Additions 1.8 -Depreciation charge (7.5) -Leases surrendered (0.3) -Foreign exchange adjustments 0.2 -Right-of-use assets at end of period 62.1 - b) Lease liabilities
2020 2019
$m $m
Current 6.3 -
Non current 76.3 - c) Amounts recognised in the consolidated income statement The consolidated income statement shows the following amounts related to leases.
2020 2019
Notes $m $m
Depreciation charge of right-of-use assets - properties 7 7.5 -Finance costs - interest on lease liabilities 7 4.2 -Expenses relating to short-term leases (included in other expenses) 7 0.2 - The total cash outflow for leases in 2020 was $10.6m d) Adoption of AASB 16 Leases
Adjustments recognised on adoption of AASB16 Prior to the adoption of AASB 16, leases previously classified as operating leases under the principles of AASB 117 Leases were disclosed in the expense note. On adoption of AASB 16, the Group has elected to use the modified retrospective approach and has recognised lease liabilities and corresponding right-of-use asset on the balance sheet. These liabilities were measured at the present value of the remaining lease payments, discounted using the lessee’s incremental borrowing rate as of 1 July 2019. The weighted average lessee’s incremental borrowing rate applied to the lease liabilities on 1 July 2019 was 5.0%.

Notes to the Consolidated Financial Statements continued For the year ended 30 June 2020 nib holdings limited
95
15. RIGHT-OF-USE ASSETS AND LEASE LIABILITIES continued d) Adoption of AASB 16 Leases continued i) Adjustments on recognised on adoption of AASB 16 continued
$m
Operating lease commitments disclosed as at 30 June 2019 92.6Discounted using the lessee’s incremental borrow ing rate of at the date of initial application (32.8)(Less): outgoings recognised on a straight-line basis as expense (7.6)Add/(less): adjustments as a result of a different treatment of extension and termination options 35.4Lease liability recognised as at 1 July 2019 87.6Of w hich are:
Current lease liabilities 10.5Non-current lease liabilities 77.1
87.6 The associated right-of-use assets for property leases were measured on a retrospective basis as if the new rules had always been applied. There were no onerous lease contracts that would have required an adjustment to the right-of-use assets at the date of initial application. The change in accounting policy resulted in the recognition of right-of-use assets and lease liabilities while increasing deferred tax assets and decreasing other liabilities in the balance sheet on 1 July 2019 as below:
$m
Right-of-use assets - properties increased by 67.9Deferred tax assets increased by 4.4Lease liabilities increased by 87.6Other liabilities decreased by 4.8 The net impact on retained earnings on 1 July 2019 was a decrease of $10.5m. The adjustments differ from the amounts disclosed in the FY19 Annual report due to a revision in the incremental borrowing rate performed prior to adoption. Impact on segment disclosures and earnings per share Underlying operating profit, segment assets and segment liabilities for June 2020 all increased as a result of the change in accounting policy. Lease liabilities are now included in segment liabilities, whereas finance lease liabilities were previously excluded from segment liabilities. The following segments were affected by the change in policy:
Underlying operating
profit Segment assetsSegment
liabilities
$m $m $m
Australian Residents Health Insurance 1.3 28.9 (38.5)International (Inbound) Health Insurance 0.3 6.3 (8.4)New Zealand Health Insurance 0.4 9.4 (12.5)nib Travel 1.0 15.4 (20.4)Unallocated to segments 0.1 2.1 (2.8)
3.1 62.1 (82.6) Earnings per share decreased by 0.1c per share for the 12 months to 30 June 2020 as a result of the adoption of AASB 16.

Notes to the Consolidated Financial Statements continued For the year ended 30 June 2020 nib holdings limited
96
15. RIGHT-OF-USE ASSETS AND LEASE LIABILITIES continued d) Adoption of AASB 16 Leases continued i) Adjustments on recognised on adoption of AASB 16 continued Practical expedients applied In applying AASB 16 for the first time, the Group has used the following practical expedients permitted by the standard:
• the use of a single discount rate to a portfolio of leases with reasonably similar characteristics • reliance on previous assessments on whether leases are onerous • the accounting for operating leases with a remaining lease term of less than 12 months as at 1 July 2019 as short-term leases • the exclusion of initial direct costs for the measurement of the right-of-use asset at the date of initial application, and • the use of hindsight in determining the lease term where the contract contains options to extend or terminate the lease.
The Group has also elected not to reassess whether a contract is, or contains a lease at the date of initial application. Instead, for contracts entered into before the transition date the Group relied on its assessment made applying AASB 117 and Interpretation 4 Determining whether an Arrangement contains a Lease.
e) Accounting policy The Group leases various offices and retail stores. Rental contracts are typically made for fixed periods of 3 to 15 years but may have extension options as described in (i) below. Lease terms are negotiated on an individual basis and contain a wide range of different terms and conditions. The lease agreements do not impose any covenants, but leased assets may not be used as security for borrowing purposes. Prior to the 2020 financial year, leases of property were classified as either finance or operating leases. Payments made under operating leases (net of any incentives received from the lessor) were charged to profit or loss on a straight-line basis over the period of the lease. From 1 July 2019, leases are recognised as a right-of-use asset and a corresponding liability at the date at which the leased asset is available for use by the Group. Each lease payment is allocated between the liability and finance cost. The finance cost is charged to profit or loss over the lease period so as to produce a constant periodic rate of interest on the remaining balance of the liability for each period. The right-of-use asset is depreciated over the shorter of the asset's useful life and the lease term on a straight-line basis. Assets and liabilities arising from a lease are initially measured on a present value basis. Lease liabilities include the net present value of the following lease payments:
• fixed payments (including in-substance fixed payments), less any lease incentives receivable • variable lease payment that are based on an index or a rate • amounts expected to be payable by the lessee under residual value guarantees • the exercise price of a purchase option if the lessee is reasonably certain to exercise that option, and • payments of penalties for terminating the lease, if the lease term reflects the lessee exercising that option
The lease payments are discounted using the interest rate implicit in the lease. If that rate cannot be determined, the lessee’s incremental borrowing rate is used, being the rate that the lessee would have to pay to borrow the funds necessary to obtain an asset of similar value in a similar economic environment with similar terms and conditions. To determine the incremental borrowing rate, the Group:
• where possible, uses recent third-party financing received by the individual lessee as a starting point, adjusted to reflect changes in financing conditions since third party financing was received
• uses a build-up approach that starts with a risk-free interest rate adjusted for credit risk for leases held by the Group, which does not have recent third party financing, and
• makes adjustments specific to the lease, eg term, country, currency and security The Group is exposed to potential future increases in variable lease payments based on an index or rate, which are not included in the lease liability until they take effect. When adjustments to lease payments based on an index or rate take effect, the lease liability is reassessed and adjusted against the right-of-use asset.

Notes to the Consolidated Financial Statements continued For the year ended 30 June 2020 nib holdings limited
97
15. RIGHT-OF-USE ASSETS AND LEASE LIABILITIES continued e) Accounting policy continued
Right-of-use assets are measured at cost comprising the following:
• the amount of the initial measurement of lease liability • any lease payments made at or before the commencement date less any lease incentives received • any initial direct costs, and • restoration costs.
Payments associated with short-term leases and leases of low-value assets are recognised on a straight-line basis as an expense in profit or loss. Short-term leases are leases with a lease term of 12 months or less.
Extension and termination options Extension and termination options are included in a number of leases across the Group. These terms are used to maximise operational flexibility in terms of managing contracts.

Notes to the Consolidated Financial Statements continued For the year ended 30 June 2020 nib holdings limited
98
16. PAYABLES 2020 2019
$m $m
CurrentOutw ards reinsurance expense liability - premiums payable to reinsurers 8.1 6.9Trade creditors 13.7 17.5Other payables 110.8 111.8RESA payable 1 48.4 53.1Annual leave payable 10.4 8.4
191.4 197.7
Non-currentOther payables 6.5 10.0
6.5 10.01.Risk Equalisation Special Account (RESA) levy, represents expenses incurred under Risk Equalisation Trust Fund arrangements which are provided for within the legislation to support the principle of community rating. Annual leave payable is accrued annual leave. The entire amount is presented as current, since the Group does not have an unconditional right to defer settlement. However, based on past experience, the Group does not expect all employees to take the full amount of accrued leave or require payment within the next 12 months. The following amounts reflect leave that is not to be expected to be taken within the next 12 months.
2020 2019
$m $m
Annual leave obligation expected to be settled after 12 months 1.1 0.7 a) Accounting policy These amounts represent liabilities for goods and services provided to the Group prior to the end of the financial year which are unpaid. These amounts are unsecured and are usually paid within 30 days of recognition.
Risk Equalisation
Special Account levy
The Risk Equalisation Special Account Levy is accrued based on the industry survey of eligible paid claims to be submitted to APRA. If a private health insurer notifies APRA of a material variation in paid claims which can be quantified, the Group adjusts the risk equalisation expense.

Notes to the Consolidated Financial Statements continued For the year ended 30 June 2020 nib holdings limited
99
17. BORROWINGS 2020 2019
$m $m
CurrentBank overdraft 2.0 1.4
2.0 1.4
Non-currentBank loans 230.9 232.5
230.9 232.5 The bank overdraft comprises the closing positive balance of the bank account, adjusted for unpresented cheques and outstanding deposits. The Group has a line-of-credit facility for corporate credit cards issued to nib employees for a total of $3.2 million. Outstanding amounts as at 30 June 2020 are included in Current Liabilities – Payables under Trade Creditors. Movements in the bank loans (secured) are as follows:
2020 2019
$m $m
Balance at beginning of period 232.5 229.5Proceeds from borrow ings 67.2 -Repayment of borrow ings (67.2) -Exchange differences (1.6) 3.0Balance at end of period 230.9 232.5 a) Accounting policy Borrowings are initially recognised at fair value, net of transaction costs incurred. Borrowings are subsequently measured at amortised cost. Any difference between the proceeds (net of transaction costs) and the redemption amount is recognised in profit or loss over the period of the borrowings using the effective interest method. Fees paid on the establishment of loan facilities are recognised as transaction costs of the loan to the extent that it is probable that some or all of the facility will be drawn down. In this case, the fee is deferred until the draw down occurs. To the extent that there is no evidence that it is probable that some or all of the facility will be drawn down, the fee is capitalised as a prepayment for liquidity services and amortised over the period of the facility to which it relates. Borrowings are removed from the balance sheet when the obligation specified in the contract is discharged, cancelled or expired. The difference between the carrying amount of a financial liability that has been extinguished or transferred to another party and the consideration paid, including any non‑cash assets transferred or liabilities assumed, is recognised in profit or loss as other income or finance costs. Borrowings are classified as non-current liabilities if the Group has an unconditional right to defer settlement of the liability for at least 12 months after the reporting period.

Notes to the Consolidated Financial Statements continued For the year ended 30 June 2020 nib holdings limited
100
17. BORROWINGS continued b) Bank loans During the year the Group refinanced its debt facilities and now has the following loans in place. nib holdings limited has both AUD $80.5 million and AUD $85.0 million variable rate loans with NAB with maturity dates of 9 December 2022 and 16 December 2021 respectively. Both loans are carried at amortised cost. nib nz holdings limited, a wholly owned subsidiary of nib holdings limited, has a NZD $70.0 million variable rate loan with NAB with a maturity date of 9 December 2022. The above loans have the following covenants that must be met by the Group:
Financial Covenant
Ratio as at 30 June 2020
Group Gearing Ratio will not be more than 45%
28.3%
Group Interest Cover Ratio1 will not be less than 3:1.
20:1
1. Following adoption of AASB 16 Leases, interest excludes interest on lease liabilities.
nib holdings limited has provided a guarantee and indemnity to NAB on behalf of nib nz holdings limited in respect of the NZD $70 million term loan facility. nib holdings limited has subordinated any amounts owing to it from nib nz holdings limited and nib nz limited in favour of all other creditors of these companies. c) Risk exposure Information on the sensitivity of the Group’s profit and equity to interest rate risk on borrowings is provided in Note 3.

Notes to the Consolidated Financial Statements continued For the year ended 30 June 2020 nib holdings limited
101
18. CLAIMS LIABILITIES The note name was changed in FY20 from Outstanding Claims Liability to Claims Liabilities to incorporate the Provision for deferred and suspended claims.
2020 2019
Outstanding Claims Liability $m $m
Outstanding claims - central estimate of the expected future payment for claims incurred 1 112.6 112.2Risk margin 9.8 8.4Claims handling costs 2.0 1.8Gross outstanding claims liability 124.4 122.4
Outstanding claims - expected payment to the RESA2 in relation to the central estimate 21.3 19.4Risk margin 1.4 1.5Net outstanding claims liability 147.1 143.3
Provision for deferred and suspended claims
Provision for deferred and suspended claims 98.8 -98.8 -
Total claims liabilities 245.9 143.31. Includes $0.4 million of outstanding claims for nib Travel’s underwriting company Nomadic Insurance Benefits Limited which is 100% reinsured. 2. Risk Equalisation Special Account (RESA) Levy represents expenses incurred under Risk Equalisation Trust Fund arrangements which are provided for within the legislation to support the principle of community rating.
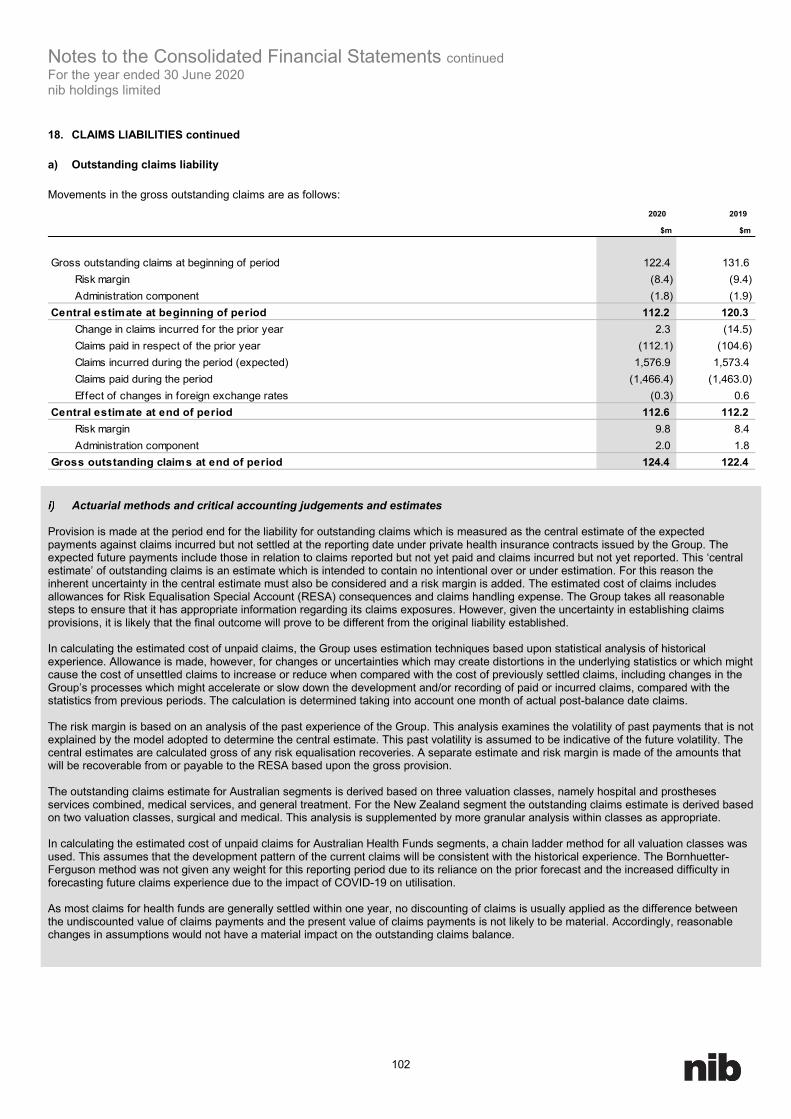
Notes to the Consolidated Financial Statements continued For the year ended 30 June 2020 nib holdings limited
102
18. CLAIMS LIABILITIES continued
a) Outstanding claims liability Movements in the gross outstanding claims are as follows:
2020 2019
$m $m
Gross outstanding claims at beginning of period 122.4 131.6Risk margin (8.4) (9.4)Administration component (1.8) (1.9)
Central estimate at beginning of period 112.2 120.3Change in claims incurred for the prior year 2.3 (14.5)Claims paid in respect of the prior year (112.1) (104.6)Claims incurred during the period (expected) 1,576.9 1,573.4Claims paid during the period (1,466.4) (1,463.0)Effect of changes in foreign exchange rates (0.3) 0.6
Central estimate at end of period 112.6 112.2Risk margin 9.8 8.4Administration component 2.0 1.8
Gross outstanding claims at end of period 124.4 122.4
Actuarial methods and critical accounting judgements and estimates
Provision is made at the period end for the liability for outstanding claims which is measured as the central estimate of the expected payments against claims incurred but not settled at the reporting date under private health insurance contracts issued by the Group. The expected future payments include those in relation to claims reported but not yet paid and claims incurred but not yet reported. This ‘central estimate’ of outstanding claims is an estimate which is intended to contain no intentional over or under estimation. For this reason the inherent uncertainty in the central estimate must also be considered and a risk margin is added. The estimated cost of claims includes allowances for Risk Equalisation Special Account (RESA) consequences and claims handling expense. The Group takes all reasonable steps to ensure that it has appropriate information regarding its claims exposures. However, given the uncertainty in establishing claims provisions, it is likely that the final outcome will prove to be different from the original liability established. In calculating the estimated cost of unpaid claims, the Group uses estimation techniques based upon statistical analysis of historical experience. Allowance is made, however, for changes or uncertainties which may create distortions in the underlying statistics or which might cause the cost of unsettled claims to increase or reduce when compared with the cost of previously settled claims, including changes in the Group’s processes which might accelerate or slow down the development and/or recording of paid or incurred claims, compared with the statistics from previous periods. The calculation is determined taking into account one month of actual post-balance date claims. The risk margin is based on an analysis of the past experience of the Group. This analysis examines the volatility of past payments that is not explained by the model adopted to determine the central estimate. This past volatility is assumed to be indicative of the future volatility. The central estimates are calculated gross of any risk equalisation recoveries. A separate estimate and risk margin is made of the amounts that will be recoverable from or payable to the RESA based upon the gross provision. The outstanding claims estimate for Australian segments is derived based on three valuation classes, namely hospital and prostheses services combined, medical services, and general treatment. For the New Zealand segment the outstanding claims estimate is derived based on two valuation classes, surgical and medical. This analysis is supplemented by more granular analysis within classes as appropriate. In calculating the estimated cost of unpaid claims for Australian Health Funds segments, a chain ladder method for all valuation classes was used. This assumes that the development pattern of the current claims will be consistent with the historical experience. The Bornhuetter-Ferguson method was not given any weight for this reporting period due to its reliance on the prior forecast and the increased difficulty in forecasting future claims experience due to the impact of COVID-19 on utilisation. As most claims for health funds are generally settled within one year, no discounting of claims is usually applied as the difference between the undiscounted value of claims payments and the present value of claims payments is not likely to be material. Accordingly, reasonable changes in assumptions would not have a material impact on the outstanding claims balance.

Notes to the Consolidated Financial Statements continued For the year ended 30 June 2020 nib holdings limited
103
18. CLAIMS LIABILITIES continued a) Outstanding claims liability continued
Actuarial assumptions
The following assumptions have been made in determining the outstanding claims liability for claims incurred 12 months to the following financial years:
Hospital Medical General Hospital Medical General
Australian Residents Health Insurance % % % % % %
Assumed proportion paid to date 92.1% 91.6% 98.6% 92.1% 91.7% 98.2%Expense rate 1.1% 1.1% 1.1% 1.2% 1.2% 1.2%Discount rate 0.0% 0.0% 0.0% 0.0% 0.0% 0.0%Risk margin 5.5% 5.5% 5.5% 6.1% 6.1% 6.1%Risk equalisation rate 27.6% 27.6% 0.0% 25.0% 25.0% 0.0%Risk margin for risk equalisation 6.5% 6.5% 0.0% 7.6% 7.6% 0.0%International Students Health InsuranceAssumed proportion paid to date 72.7% 91.5% 99.3% 75.7% 88.5% 98.5%Expense rate 4.0% 4.0% 4.0% 4.2% 4.2% 4.2%Discount rate 0.0% 0.0% 0.0% 0.0% 0.0% 0.0%Risk margin 29.4% 29.4% 29.4% 24.4% 24.4% 24.4%International Workers Health InsuranceAssumed proportion paid to date 72.1% 86.2% 93.4% 76.4% 85.7% 93.3%Expense rate 4.5% 4.5% 4.5% 4.9% 4.9% 4.9%Discount rate 0.0% 0.0% 0.0% 0.0% 0.0% 0.0%Risk margin 29.4% 29.4% 29.4% 16.7% 16.7% 16.7%
Surgical Medical Surgical Medical
NZ Health Insurance % % % %
Assumed proportion paid to date 89.0% 88.7% 89.9% 85.9%Expense rate 3.0% 3.0% 2.3% 2.3%Discount rate 0.0% 0.0% 0.0% 0.0%Risk margin 7.0% 7.0% 6.9% 6.9%
2020 2019
The risk margin of the underlying liability has been estimated to equate to a probability of adequacy of 95% (June 2019: 95%) for the Group. The risk margin within each territory allows for diversification across the entity. The benefit of diversification across the Group is again allocated to the Australian Residents Health Insurance segment. The risk margin for the International Workers Health Insurance segment was increased to be in line with that of the International Students Health Insurance segment in response to increased variability in payment experience increasing the uncertainty of outstanding claims estimation.
Notes to the Consolidated Financial Statements continued For the year ended 30 June 2020 nib holdings limited
104
18. CLAIMS LIABILITIES continued a) Outstanding claims liability continued
Process used to determine assumptions The Group conducts sensitivity analysis to quantify the exposure to risk of changes in the key underlying variables. The valuations included in the reported results are calculated using certain assumptions about these variables as disclosed above. The movement in any key variable will impact the performance and equity of the Group. The table below describes how a change in each assumption will affect the insurance liabilities.
Key variable
Description
Impact of movement in variable
Chain ladder development factors
Chain ladder development factors were selected based on observations of historical claim payment experience. Particular attention was given to the development of the most recent 12 months.
An increase or decrease in the chain ladder factors would lead to a higher or lower projection of the ultimate liability and a corresponding increase or decrease in claims expense respectively.
Expense rate
Claims handling expenses were calculated by reference to past experience of total claims handling costs as a percentage of total past payments.
An estimate for the internal costs of handling claims is included in the outstanding claims liability. An increase or decrease in the expense rate assumption would have a corresponding impact on claims expense.
Discount rate
As most claims for health funds are generally settled within one year, no discounting of claims is applied as the difference between the undiscounted value of claims payments and the present value of claims payments is not likely to be material.
N/A
Risk equalisation allowance
In simplified terms, each organisation is required to contribute to the risk equalisation pool or is paid from the pool to equalise their hospital claims exposure to policyholders aged over 55 years of age and in respect of high cost claims. This is the allowance made in respect of the claims incurred but not yet paid.
An estimate for the risk equalisation cost is included in the outstanding claims liability. An increase or decrease in the risk equalisation allowance would have a corresponding impact on RESA Levy.
Risk margin
The risk margin has been based on an analysis of the past experience of the Group. This analysis examined the volatility of past payments that has not been explained by the model adopted to determine the central estimate. This past volatility has been assumed to be indicative of the future volatility and has been set at a level estimated to equate to a probability of adequacy of 95% at a consolidated level (June 2019: 95%).
An estimate of the amount of uncertainty in the determination of the central estimate. An increase or decrease in the risk margin would have a corresponding impact on claims expense.

Notes to the Consolidated Financial Statements continued For the year ended 30 June 2020 nib holdings limited
105
18. CLAIMS LIABILITIES continued
a) Outstanding claims liability continued
Sensitivity analysis – impact of key variables Profit after tax Equity
2020 2020
$m $m
90.1 589.7
VariableMovement in
variable AdjustmentsAdjusted amounts Adjustments
Adjusted amounts
$m $m $m $m
Chain ladder development factors +0.5% (12.0) 78.1 (12.0) 577.7-0.5% 12.0 102.1 12.0 601.7
Expense rate +1.0% (0.9) 89.2 (0.9) 588.8-1.0% 0.9 91.0 0.9 590.6
Risk equalisation allow ance +2.5% (1.4) 88.7 (1.4) 588.3-2.5% 1.4 91.5 1.4 591.1
Risk margin +1.0% (1.0) 89.1 (1.0) 588.7-1.0% 1.0 91.1 1.0 590.7
Recognised amounts in the f inancial statements attributable to ow ners of nib holdings limited

Notes to the Consolidated Financial Statements continued For the year ended 30 June 2020 nib holdings limited
106
18. CLAIMS LIABILITIES continued b) Provision for deferred and suspended claims
Critical accounting judgements and estimates
On 12 March 2020, the World Health Organisation declared the outbreak of coronavirus (COVID-19) a global pandemic. Due to the temporary closure of elective surgery and reduced access to ancillary benefits, Private Health Insurers (PHIs) in both Australia and New Zealand experienced unusually low claims volumes in March, April and May 2020. Given the lower claims activity, the Group believes it has an obligation to recognise a provision for deferred claims based on a present constructive obligation resulting from a past event under relevant accounting standards. In nib’s case, the event (COVID-19) which occurred in March 2020 has triggered the deferral of claims activity and benefits that would have otherwise been provided to members. If cover remains in place, a responsibility exists to provide for these claims that would have ordinarily been incurred under normal circumstances. nib members with continuing cover would have had an expectation to use and therefore claim on hospital, surgical and ancillary services had the pandemic not arisen, notwithstanding the backlog of activity. The provision is therefore management’s estimate of the percentage of claims which did not occur in FY20 that are anticipated to be deferred to FY21. In estimating the provision, three key steps were undertaken:
1. Estimating the gross reduction in claims due to temporary closure of elective surgery and reduced access to ancillary benefits. Incurred claims estimates produced at 30 June 2020 as part of the year end outstanding claims provisioning process were compared to the forecast produced leading up to March 2020 when COVID-19 impacted claims activity. The difference between forecast and actual incurred was calculated by modality (claim type) to estimate the financial impact of COVID-19 across the March to June 2020 period.
2. Estimating risk equalisation levy impact (Australian claims only). The risk equalisation impact of COVID-19 was estimated by applying consistent ratios used for the risk equalisation amounts in outstanding claims.
3. Applying a deferral rate. Certain factors need to be considered when assessing that not all estimated savings translate to a claims payment backlog at balance date. For example:
a. there has continued to be lapses of memberships in the normal course of business; b. some types of private health benefits, particularly in the ancillary category, are less likely to have been deferred; c. catch up of benefits between ancillary and hospital categories differs due to capacity in facilities, lead time to arrange
procedures etc. nib’s deferral rates have been estimated as follows:
• 80% of Australian claims reduction in 2020 (representing 85% hospital and 70% ancillary estimated claims reduction); and • 90% of New Zealand (estimated hospital and ancillary claims savings)
to be deferred on the basis that this represents the 2021 financial year claims which are expected to be inflated above normal trends due to COVID-19.
Risks and uncertainties have been taken into account in the measurement of the liability and are reflected in the key inputs and judgements. The key risks associated in estimating the components of the provision is the under/over estimation of the claims deferral rate and to a lesser extent, the under/over estimation of the claims savings (net of risk equalisation impact). This provision is expected to fully unwind over the next twelve months based on expected claims activity and payment patterns.
Sensitivity analysis - Impact of key variables Profit after tax Equity
2020 2020
$m $m
90.1 589.7
VariableMovement in
variable AdjustmentsAdjusted amounts Adjustments
Adjusted amounts
$m $m $m $m
Reduction in claims activity +2.0% (1.3) 88.8 (1.3) 588.4-2.0% 1.3 91.4 1.3 591.0
Claims deferral rate +10.0% (7.8) 82.3 (7.8) 581.9-10.0% 7.8 97.9 7.8 597.5
Recognised amounts in the f inancial statements attributable to ow ners of nib holdings limited

Notes to the Consolidated Financial Statements continued For the year ended 30 June 2020 nib holdings limited
107
19. UNEARNED PREMIUM LIABILITY AND UNEXPIRED RISK LIABILITY a) Unearned premium liability
2020 2019
$m $m
Current 223.3 219.3223.3 219.3
Non-current 34.8 38.134.8 38.1
The unearned premium liability reflects premiums paid in advance by customers. Movements in the unearned premium liability are as follows:
2020 2019
$m $m
Unearned premium liability as at 1 July 257.4 237.8Deferral of premiums on contracts w ritten in the period 220.0 224.7Earning of premiums w ritten in previous periods (219.3) (205.1)Unearned premium liability as at 30 June 258.1 257.4 b) Unexpired risk liability No deficiency was identified as at 30 June 2020 and 2019 that resulted in an unexpired risk liability needing to be recognised.
c) Critical accounting judgements and estimates A liability adequacy test is required to be performed for the period over which the insurer is “on risk” in respect of premiums paid in advance. At each reporting date, the adequacy of the unearned premium liability is assessed by considering current estimates of all expected future cash flows relating to future claims arising from the rights and obligations created. If the sum of the present value of the expected future cash flows relating to future claims plus the additional risk margin to reflect the inherent uncertainty in the central estimate exceeds the unearned premium liability, less related intangible assets and related deferred acquisition costs, then the unearned premium is deemed to be deficient, with the deficiency being recorded in the income statement and an unexpired risk liability created. The Group applies a risk margin to achieve a 75% (June 2019: 75%) probability of adequacy for future claims which is lower than the 95% achieved in the estimate of the outstanding claims liability, refer to Note 17(b) as the former is in effect an impairment test used to test the sufficiency of the unearned premium liability whereas the latter is a measurement accounting policy used in determining the carrying value of the outstanding claims liability. No deficiency was identified as at 30 June 2020 and 2019 that resulted in an unexpired risk liability needing to be recognised. This test is also extended beyond recognised unearned premium liability to include premiums renewable until the next repricing review, usually 1 April each year.

Notes to the Consolidated Financial Statements continued For the year ended 30 June 2020 nib holdings limited
108
20. PREMIUM PAYBACK LIABILITY 2020 2019
$m $m
Current 3.5 3.2
Non current 16.6 16.1 Movements in the premium payback liability are as follows:
2020 2019
$m $m
Gross premium payback liability at beginning of period 19.3 18.1Value of payments currently being processed (0.7) (0.6)Risk margin (0.5) (0.5)
Central estimate at beginning of period 18.1 17.0Funding/new accrued 2.3 2.5Unw ind discount rate 0.3 0.3Interest rate movement impact 0.8 0.8Premium payback payments (2.2) (3.3)Others (0.5) (0.1)Effect of changes in foreign exchange rates (0.4) 0.9
Central estimate at end of the period 18.4 18.1Value of payments currently being processed 1.1 0.7Risk margin 0.6 0.5
Total premium payback liability as at end of period 20.1 19.3 Risk exposure Information about the Group’s exposure to interest rate risk in relation to premium payback liability is provided in Note 3(b).
a) Actuarial methods and critical accounting judgements and estimates The premium payback liability represents the accrued amount of premium expected to be repaid to certain New Zealand health insurance policyholders. A number of nib nz limited’s health insurance policies have a benefit whereby policyholders receive a proportion of premiums paid less claims received over the life of their policy, “premium payback”, if certain conditions are met. This liability represents a long term health insurance contract liability. The liability was determined based on the discounted value of accumulated excess of premiums over claims at an individual policy level, adjusted for GST recoveries and expected future lapses. A risk margin at 95% probability of sufficiency was estimated by assuming there are no future lapses. Most of the premium payback reserve is held in respect of a group of customers where the historical lapse rate is already very low. The following assumptions have been made in determining the premium payback liability:
2020 2019
Lapse rate until 3 years from premium payback date 2.0% - 10.0% 2.0% - 10.0%Lapse rate w ithin 3 years of premium payback date 0.0% - 1.0% 0.0% - 1.0%Expense rate 0.0% 0.0%Discount rate for succeeding and follow ing year 0.3% - 0.4% 1.2% - 1.3%Risk margin 3.1% 2.8% The risk margin has been estimated to equate to a 95% probability of adequacy (2019: 95%).

Notes to the Consolidated Financial Statements continued For the year ended 30 June 2020 nib holdings limited
109
20. PREMIUM PAYBACK LIABILITY continued b) Sensitivity analysis
Summary The Group conducts sensitivity analysis to quantify the exposure to risk of changes in the key underlying actuarial assumptions. The movement in any key variable will impact the performance and equity of the Group. The table below provides a description of the processes used to determine these assumptions, as well as how a change in each assumption will affect the insurance liabilities.
Key variable
Description Impact of movement in variable
Lapse rate
Rate used in calculating the discounted provision to allow for expected lapses, based on historical experience.
An increase or decrease in the lapse assumption would have an inverse impact on the premium payback liability and risk margin.
Discount rate
Rate used in calculating the discounted provision to allow for expected investment income, based on current yields on New Zealand government debt (risk free rates).
An increase or decrease in the discount rate assumption would have an inverse impact on the premium payback liability.
Risk margin
An estimate of the amount of uncertainty in the determination of the central estimate.
An increase or decrease in the risk margin would have a corresponding impact on the premium payback liability.
Impact of key variables
Profit after tax Equity
2020 2020
$m $m
90.1 589.7
VariableMovement in
variable AdjustmentsAdjusted amounts Adjustments
Adjusted amounts
$m $m $m $m
Lapse rate +1.0% 0.4 90.5 0.4 590.1-1.0% (0.4) 89.7 (0.4) 589.3
Discount rate +1.0% 0.7 90.8 0.7 590.4-1.0% (0.7) 89.4 (0.7) 589.0
Risk margin +1.0% (0.1) 90.0 (0.1) 589.6-1.0% 0.1 90.2 0.1 589.8
Recognised amounts in the f inancial statements attributable to ow ners of nib holdings limited
c) Unexpired risk liability A liability adequacy test was performed allowing for the expected cash flows of each policy over the entire product life. The future cash flows include
• Reserves held at 30 June 2020 including the risk margin; • Expected future payments for claims, policy paybacks and management expenses; and • Expected future revenue from premiums and investment income.
No deficiency was identified at 30 June 2020 (2019: nil) that resulted in an unexpired risk liability needing to be recognised.

Notes to the Consolidated Financial Statements continued For the year ended 30 June 2020 nib holdings limited
110
21. PROVISION FOR EMPLOYEE ENTITLEMENTS 2020 2019
$m $m
CurrentLong service leave 4.8 4.4Termination benefits 2.0 0.4
6.8 4.8
Non-currentLong service leave 3.2 3.4
3.2 3.4 Amounts not expected to be settled within the next 12 months The current provision for long service leave includes all unconditional entitlements where employees have completed the required period of service and also those where employees are entitled to pro-rata payments in certain circumstances. The entire amount is presented as current, since the Group does not have an unconditional right to defer settlement. However, based on past experience, the Group does not expect all employees to take the full amount of the provision or require payment within the next 12 months. The following amounts reflect leave that is not to be expected to be taken or paid within the next 12 months.
2020 2019
$m $m
Long service leave obligation expected to be settled after 12 months 4.2 3.74.2 3.7
a) Accounting policy
Short-term obligations
Liabilities for wages and salaries, including non-monetary benefits and annual leave are recognised in payables in respect of employees' services up to the reporting date and are measured at the amounts expected to be paid when the liabilities are settled. The portion not expected to be settled within 12 months is discounted based on expected settlement dates. Liabilities for non-accumulating sick leave are recognised when the leave is taken and measured at the rate paid or payable.
Other long-term
employee benefit obligations
The liability for long service leave is the amount of the future benefit that employees have earned in return for their service in the current and prior periods. The liability is calculated using expected future increases in wage and salary rates and expected settlement dates, and is discounted using G100 treasury discount rates at the balance sheet date which have the maturity dates approximating to the terms of nib’s obligations.
Bonus plans
A liability for employee benefits in the form of bonus plans is recognised in other creditors when at least one of the following conditions is met: • there are formal terms in the plan for determining the amount of the benefit, or • the amounts to be paid are determined before the time of completion of the financial report, or • past practice gives clear evidence of the amount of the obligation. Liabilities for bonus plans are expected to be settled within 12 months and are measured at the amounts expected to be paid when they are settled.
Termination benefits
Liabilities for termination benefits, not in connection with the acquisition of an entity or operation, are recognised when a detailed plan for the terminations has been developed and a valid expectation has been raised with those employees affected that the terminations will be carried out without possibility of withdrawal. The liabilities for termination benefits are recognised as current provisions, as liabilities for termination benefits are expected to be settled within 12 months of reporting date.

Notes to the Consolidated Financial Statements continued For the year ended 30 June 2020 nib holdings limited
111
22. OTHER LIABILITIES
2020 2019
$m $m
CurrentDeferred profit on sale and leaseback of head off ice building - 0.4
- 0.4
Non-currentDeferred profit on sale and leaseback of head off ice building - 4.3
- 4.3 On 1 July 2019, the balance of the deferred profit on sale and leaseback of head office building was recognised against right-of-use assets on adoption of AASB 16 Leases, refer to note 15.

Notes to the Consolidated Financial Statements continued For the year ended 30 June 2020 nib holdings limited
112
23. CONTRIBUTED EQUITY a) Share capital
2020 2019
$m $m
Ordinary sharesFully paid 127.4 120.3
Other equity securitiesTreasury shares (6.0) (5.1)
Total contributed equity 121.4 115.2 b) Movements in share capital
Date Details No. of shares Price $ $m
30 Jun 2018 Balance 454,848,869 116.11 Jul 2018 Opening balance 454,848,869 - 116.1
5 Oct 2018 Shares issued - Dividend reinvestment plan 702,509 5.99 4.230 Jun 2019 Balance 455,551,378 120.3
1 Jul 2019 Opening balance 455,551,378 - 120.330 Sep 2019 Shares issued - Dividend reinvestment plan 533,454 7.32 3.9
7 Apr 2020 Shares issued - Dividend reinvestment plan 734,694 4.30 3.230 Jun 2020 Balance 456,819,526 127.4
c) Treasury shares Treasury shares are shares in nib holdings limited that are held by the nib Holdings Ltd Share Ownership Plan Trust (trust) for the purpose of issuing shares under the Group’s Executive management Short-Term Incentive and Long-Term Incentive share plans. See Note 36 for more information.
Date Details No. of shares $m
30 Jun 2018 Balance 614,232 3.8Acquisition of shares by the Trust 1,052,953 6.0Employee share issue - LTIP (496,883) (3.1)Employee share issue - STI (249,542) (1.6)
30 Jun 2019 Balance 920,760 5.1Acquisition of shares by the Trust 1,062,658 6.3Employee share issue - LTIP (628,895) (3.9)Employee share issue - STI (283,080) (1.5)
30 Jun 2020 Balance 1,071,443 6.0

Notes to the Consolidated Financial Statements continued For the year ended 30 June 2020 nib holdings limited
113
23. CONTRIBUTED EQUITY continued d) Accounting policy
Ordinary shares
Ordinary shares are classified as equity. Incremental costs directly attributable to the issue of new shares are shown in equity as a deduction, net of tax, from the proceeds. If the entity reacquires its own equity instruments, for example as the result of a share buy-back, those instruments are deducted from equity and the associated shares are cancelled. No gain or loss is recognised in the profit or loss and the consideration paid including any directly attributable incremental cost (net of income taxes) is recognised directly in equity. Ordinary shares entitle the holder to participate in dividends and the proceeds on winding up of the company in proportion to the number of and amounts paid on the shares held. On a show of hands every holder of ordinary shares present at a meeting in person or by proxy, is entitled to one vote, and upon a poll each share is entitled to one vote.
Employee share trust
The Group has formed a trust to administer the Group’s executive management Short-Term Incentive and Long Term-Incentive share plans. This trust is consolidated, as the substance of the relationship is that the trust is controlled by the Group. Shares held by the nib Holdings Ltd Share Ownership Plan Trust are disclosed as treasury shares and deducted from contributed equity.

Notes to the Consolidated Financial Statements continued For the year ended 30 June 2020 nib holdings limited
114
24. RETAINED PROFITS 2020 2019
$m $m
Balance at the beginning of the year 498.9 445.5Net profit 90.1 149.8Adjustment on adoption of AASB 9 - (0.1)Adjustment on adoption of AASB 15 - (0.8)Adjustment on adoption of AASB 16 (10.5) -Dividends (104.7) (95.5)Balance at the end of the year 473.8 498.9

Notes to the Consolidated Financial Statements continued For the year ended 30 June 2020 nib holdings limited
115
25. RESERVES 2020 2019
$m $m
Share-based payments 1.5 3.3Share-based payments exercised (10.2) (7.7)Foreign currency translation 3.2 4.9
(5.5) 0.5 Movements in reserves
2020 2019
Notes $m $m
Share-based payments Balance at the beginning of the year 3.3 3.2Performance right expense (0.4) 1.1Transfer to share-based payments exercised reserve on exercise of performance rights (1.4) (1.0)Balance at the end of the financial year 1.5 3.3
Share-based payments exercisedBalance at the beginning of the year (7.7) (5.6)Transfer from share-based payments reserve on exercise of performance rights 1.4 1.0Issue of shares held by nib Holdings Ltd Share Ow nership Plan Trust to employees (3.9) (3.1)Balance at the end of the financial year (10.2) (7.7)
Foreign currency translationBalance at the beginning of the year 4.9 2.4Currency translation differences arising during the year - gross (2.1) 3.4Deferred tax 8(a)(iii) 0.4 (0.9)Balance at the end of the financial year 3.2 4.9 Nature and purpose of reserves
Share-based payments
The share-based payments reserve is used to recognise the fair value of performance rights and bonus share rights issued to employees but not exercised.
Share-based payments exercised
The share-based payments exercised reserve is used to recognise the difference between fair value of performance rights and bonus share rights accumulated in the share based payments reserve and cost of exercising the rights.
Foreign currency translation
Exchange rate differences arising on translation of foreign controlled entities are recognised in other comprehensive income as described in Note 1(c) and accumulated in a separate reserve within equity. The cumulative amount is reclassified to profit or loss when the net investment is disposed of.

Notes to the Consolidated Financial Statements continued For the year ended 30 June 2020 nib holdings limited
116
26. DIVIDENDS a) Ordinary shares
2020 2019
$m $m
Final dividend for the year ended 30 June 2019 of 13.0 cents (2018 - 11.0 cents) per fully paid share paid on 30 September 2019 Fully franked based on tax paid at 30% 59.2 50.0Total dividends provided for or paid 59.2 50.0Interim dividend for the year ended 30 June 2020 of 10.0 cents (2019 - 10.0 cents) per fully paid share paid on 7 April 2020 Fully franked based on tax paid at 30% 45.5 45.5Total dividends provided for or paid 104.7 95.5 b) Dividends not recognised at year end
2020 2019
$m $m
In addition to the above dividends, since the end of the year the Directors have recommended the payment of a f inal dividend of 4.0 cents (2019 - 13.0 cents) per fully paid ordinary share, fully franked based on tax paid at 30%. The aggregate amount of the proposed dividend expected to be paid on 6 October 2020 out of retained profits at 30 June 2020, but not recognised as a liability at the end of the year, is: 18.3 59.2
c) Franked dividends The franked portion of the final dividends recommended after 30 June 2020 will be franked out of existing franking credits or out of franking credits arising from the payment of income tax in the year ending 30 June 2020.
2020 2019
$m $m
Franking credits available for subsequent f inancial years to equity holders of parent entity based on a tax rate of 30% 105.4 80.6 The above amounts represent the balance of the franking account as at the end of the financial year, adjusted for:
• Franking credits that will arise from the payment of the amount of the provision for income tax; • Franking debits that will arise from the payment of dividends recognised as a liability at the reporting date; and • Franking credits that will arise from the receipt of dividends recognised as receivables at the reporting date.
d) Accounting policy Provision is made for the amount of any dividend declared, being appropriately authorised and no longer at the discretion of the entity, on or before the end of the financial year but not distributed at balance date.

Notes to the Consolidated Financial Statements continued For the year ended 30 June 2020 nib holdings limited
117
27. EARNINGS PER SHARE
2020 2019
Profit from continuing operations attributable to the ordinary equity holders of the company used in calculating basic/diluted EPS $m 90.1 149.8Weighted average number of ordinary shares #m 456.1 455.4Basic / Diluted EPS cents 19.8 32.9 a) Accounting policy
Basic earnings per
share
Basic earnings per share is calculated by dividing: • the profit attributable to equity holders of the company, excluding any costs of servicing equity other
than ordinary shares • by the weighted average number of ordinary shares outstanding during the financial year.
Diluted earnings per
share
Diluted earnings per share adjusts the figures used in the determination of basic earnings per share to take into account: • the after income tax effect of interest and other financing costs associated with dilutive potential
ordinary shares; and • the weighted average number of additional ordinary shares that would have been outstanding
assuming the conversion of all dilutive potential ordinary shares.
b) Information concerning the classification of shares
Performance rights
Performance rights granted to employees under the nib holdings Long-Term Incentive Plan are considered to be potential ordinary shares and are only included in the determination of diluted earnings per share to the extent to which they are dilutive. The performance rights have not been included in the determination of basic earnings per share. Details relating to the performance rights are set out in the Remuneration Report on page 42. The total 1,790,138 performance rights granted (2019 - 2,390,899) are not included in the calculation of diluted earnings per share because they are contingently issuable ordinary shares and conditions were not satisfied at 30 June 2020. These performance rights could potentially dilute basic earnings per share in the future.

Notes to the Consolidated Financial Statements continued For the year ended 30 June 2020 nib holdings limited
118
28. CAPITAL MANAGEMENT The Group’s objectives when managing capital are to safeguard their ability to continue as a going concern, so that they can continue to provide returns for shareholders and benefits for other stakeholders and to maintain an optimal capital structure to reduce the cost of capital. In order to maintain or adjust the capital structure, the Group has a number of levers, including adjusting the amount of dividends paid to shareholders, returning capital to shareholders, issuing new shares, selling assets, raising or reducing debt or buying back shares.
nib holdings limited At 30 June 2020 the Group had available capital of $57.0 million above our internal benchmark (after allowing for the payment of a fully franked final ordinary dividend of 4.0 cents per share, totalling $18.3 million, in October 2020).
Below is a reconciliation of net assets to available capital as at 30 June 2020 (after allowing for payment of a final dividend): 2020
$m
Net assets 606.4Less: nib health fund capital required (444.5)
nib nz capital required (94.9)Investment in associates (17.5)Capital required looking forw ard 12 months (24.7)nib nz intangibles (32.9)iihi intangibles (21.4)nib travel intangibles (113.5)Charitable foundation (16.7)Borrow ings 230.9Other assets and liabilities 4.1Final dividend (18.3)
Available capital (after allow ing for payment of f inal dividend) 57.0 nib health funds limited and Grand United Corporate Health Limited nib health funds limited and Grand United Corporate Health Limited, controlled entities, are required to comply with the Solvency and Capital Adequacy Standards under Schedule 2 and 3 of the Private Health Insurance (Health Benefits Fund Administration) Rules 2007, the Rules are made for the purposes of Part 4-4 of the Private Health Insurance Act 2007.
To comply with the Solvency Standard, nib health funds limited and Grand United Corporate Health Limited:
(i) must ensure that, at all times, the value of cash must be equal to or greater than a specified
cash management amount, plus any solvency supervisory adjustment (Section 4.2 of the Solvency Standard);
(ii) must have, and comply with, a board endorsed, liquidity management plan designed to
ensure compliance with the solvency requirements described above, and set minimum liquidity requirements and management action triggers (Section 4.3 of the Solvency Standard).
To comply with the Capital Adequacy Standard, nib health funds limited and Grand United Corporate Health Limited:
(i) must ensure that at all times the value of its assets is not less than the amounts calculated
under Section 4.2 (a) and (b) of the Capital Adequacy Standard (Capital Adequacy Requirement);
(ii) must have, and comply with, a written, board endorsed capital management policy.

Notes to the Consolidated Financial Statements continued For the year ended 30 June 2020 nib holdings limited
119
28. CAPITAL MANAGEMENT continued nib health funds limited and Grand United Corporate Health Limited continued
nib health funds limited has a capital management plan which establishes a target for capital held in excess of the regulatory requirement; the aim is to keep a sufficient buffer in line with the Board’s attitude to and tolerance for risk. The internal capital target ensures nib has a minimum level of capital given certain stressed capital scenarios. This currently approximates to 19.8% of total projected premiums for the next 12 months. Any capital in excess of the benchmark, taking a 12-month forward looking view, will be reduced by way of dividend to nib holdings limited. nib health funds limited paid dividends of $58.8 million in August 2019 and $32.2 million in February 2020 to nib holdings limited. At 31 December 2019 nib health funds limited acquired the net assets of Grand United Corporate Health Limited. The surplus assets over benchmark at 30 June 2020 and 2019 were as follows:
2020 2019
$m $m
Total assets nib health funds limited (excluding unclosed business contributions - unearned) 1,193.7 842.5Capital adequacy requirement 769.4 540.9Surplus assets for Capital Adequacy 424.3 301.6
Net assets nib health funds limited 464.7 332.0Internal capital target 444.5 290.1Surplus assets over internal capital target 20.2 41.8 Grand United Corporate Health Limited has a capital management plan which establishes a target for capital held in excess of the regulatory requirement; the aim is to maintain a sufficient buffer in line with the Board’s risk appetite and risk tolerances. The internal capital target ensures Grand United maintain the preferred range of capital adequacy ratio (CAR) given certain stressed capital scenarios. Grand United targets the lower end of this CAR range currently approximating to 1.35x the Capital Adequacy Requirement. Any capital in excess of the benchmark, taking a 12-month forward looking view, will be reduced by way of dividend to nib holdings limited. The surplus assets over benchmark at 30 June 2019 was:
2019
$m
Total assets Grand United Corporate Health Limited (per Capital Adequacy Standard) 121.8Capital adequacy requirement 80.7Surplus assets for Capital Adequacy 41.1
Net assets Grand United Corporate Health Limited 53.0Internal capital target 40.1Surplus assets over internal capital target 12.9

Notes to the Consolidated Financial Statements continued For the year ended 30 June 2020 nib holdings limited
120
28. CAPITAL MANAGEMENT continued nib nz limited nib nz limited, a controlled entity, is required to comply with the Solvency Standard for Non-Life Insurance Business (2014) published by the Reserve Bank of New Zealand (RBNZ). The Solvency Standards determine the Minimum Solvency Capital (MSC) required. A requirement of nib nz limited’s insurance licence is that it maintains capital above the MSC. The overriding objective underpinning nib nz limited’s capital management approach is to operate with a level of capital judged to be commercially prudent and within the bounds of the Board’s risk appetite which achieves a balance between:
Maintaining a buffer above the RBNZ MSC for nib nz limited;
Maintaining a level of capital that ensures an appropriate financial strength rating; and Avoiding holding an excessive level of capital, which would otherwise act to reduce returns on capital for the Group.
Any capital in excess of the benchmark, taking a 12-month forward looking view, will be reduced by way of dividend to nib nz holdings limited, unless management decide to retain funds for strategic purposes. nib nz limited paid dividends of NZD $6.8 million in August 2019 and NZD $6.7 million in February 2020 to nib nz holdings limited. Given the economic uncertainty partly as a result of COVID-19, the RBNZ issued a letter on 22 July 2020 asking licensed insurers to refrain from the payment of dividends or other unnecessary reductions in insurer capital amounts, until the RBNZ advises a change in this position. In accordance with the RBNZ instructions, nib nz limited is not proposing a dividend at this time. Ordinarily, unless funds are retained for strategic purposes, a dividend would be declared in August. The surplus assets over benchmark at 30 June 2020 and 2019 are as follows:
2020 2019$m $m
30.4 31.712.6 11.217.8 20.5
Net assets nib nz limited 97.1 97.62.42 2.83
2.25xMSC 2.00xMSC28.3 22.3
Surplus/(deficit) assets over internal benchmark 2.1 9.4Internal benchmark requirement
Actual Solvency CapitalMinimum Solvency CapitalSolvency Margin
Capital Adequacy Coverage RatioInternal benchmark
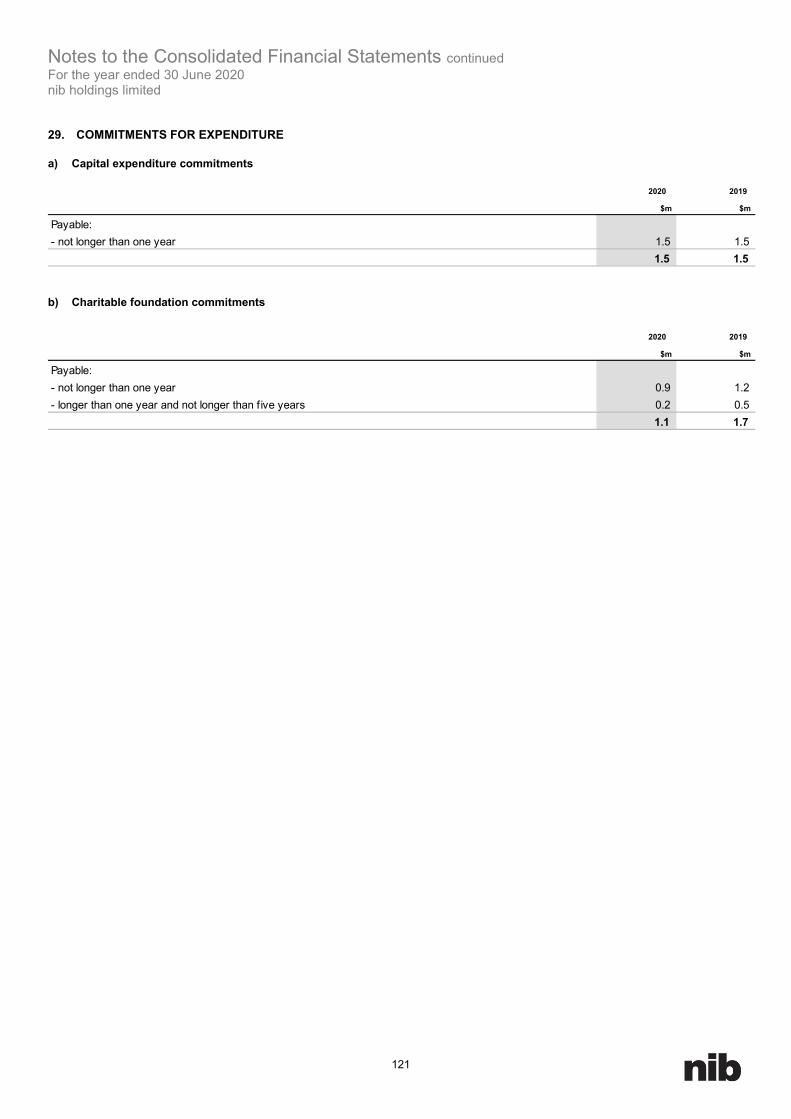
Notes to the Consolidated Financial Statements continued For the year ended 30 June 2020 nib holdings limited
121
29. COMMITMENTS FOR EXPENDITURE a) Capital expenditure commitments
2020 2019
$m $m
Payable:- not longer than one year 1.5 1.5
1.5 1.5
b) Charitable foundation commitments
2020 2019
$m $m
Payable:- not longer than one year 0.9 1.2- longer than one year and not longer than f ive years 0.2 0.5
1.1 1.7

Notes to the Consolidated Financial Statements continued For the year ended 30 June 2020 nib holdings limited
122
30. CONTINGENT LIABILITIES a) Australian Competition and Consumer Commission (ACCC) allegations On 30 May 2017, the Australian Competition and Consumer Commission (ACCC) instituted proceedings in the Federal Court against nib health funds limited (nib). The ACCC alleges that nib engaged in misleading and deceptive conduct, unconscionable conduct and made false or misleading representations by failing to notify certain customers in relation to changes made to its Medigap Scheme. nib denies the ACCC’s allegations and intends to defend the claims. In the event that the Court finds in favour of the ACCC, nib may have potential liabilities, including pecuniary penalties. The matter was unsuccessfully mediated in October 2017 and was set down for hearing in June 2018. The hearing date was vacated by the Court in June 2018, as a result of a then-outstanding Full Federal Court decision in similar proceedings brought by the ACCC against Medibank Private Limited (MPL), which had been resolved by the Federal Court at first instance against the ACCC. In December 2018, the Full Federal Court dismissed the ACCC’s appeal of the first instance judgment against it in favour of the MPL. The ACCC has since indicated that it intended to press its proceedings against nib. The matter has been set down for hearing on 6 December 2020. Due to the nature of the matter, the outcome is uncertain. b) Guarantees and financial support nib holdings limited has provided a guarantee and indemnity to NAB on behalf of nib nz holdings limited in respect of the NZD $70 million term loan facility. nib holdings limited has in place a commitment to fund advances up to NZD $10 million to nib nz holdings limited upon written request. Any advances would be on the same terms as contained in current intercompany loans between nib holdings limited and nib nz holdings limited. nib holdings limited has given an undertaking to extend financial support to a number of other subsidiaries within the Group, and Footprints Fundraising Inc. (Footprints) by subordinating repayment of debts owed by the entities to nib holdings limited, in favour of all other creditors. The amount owed from Footprints at balance date is $24,135. This undertaking has been provided as a result of each of these subsidiaries experiencing deficiencies of capital and reserves, and is intended to enable the entities to continue their operations and fulfil all financial obligations now and in the future. The undertaking for Footprints is provided for a minimum period of twelve months from 28 November 2019.

Notes to the Consolidated Financial Statements continued For the year ended 30 June 2020 nib holdings limited
123
31. EVENTS OCCURRING AFTER THE BALANCE SHEET DATE There have not been any matters or circumstances that have arisen since the end of the financial year that has significantly affected, or may significantly affect the operations of the Group, the results of those operations, or the state of affairs of the Group in future financial years.

Notes to the Consolidated Financial Statements continued For the year ended 30 June 2020 nib holdings limited
124
32. REMUNERATION OF AUDITORS 2020 2019
$ $
a) PricewaterhouseCoopers AustraliaAudit and review of financial reports 837,697 763,542Other statutory assurance services 180,400 108,246Other services
Tax compliance services - 4,080International tax consulting and tax advice on mergers and acquisitions 1,416 44,011Accounting advice and support including one off transactions 47,940 72,914Consulting services 24,480 26,418
Total remuneration of PricewaterhouseCoopers Australia 1,091,933 1,019,211
b) Network firms of PricewaterhouseCoopers AustraliaAudit and review of f inancial reports 289,521 277,727Other statutory assurance services 12,996 12,353
Total remuneration of network firms of PricewaterhouseCoopers 302,517 290,080
Total auditors' remuneration 1,394,450 1,309,291

Notes to the Consolidated Financial Statements continued For the year ended 30 June 2020 nib holdings limited
125
33. BUSINESS COMBINATION a) Prior year As disclosed in the annual report for the year ended 30 June 2019, the acquisition of QBE’s travel insurance business was provisionally determined as the fair values of assets and liabilities may change upon finalisation of the purchase price allocation and alignment with Group accounting policies. The acquisition has now been finalised and there were no changes from the provisional amounts disclosed in the Annual Report ended 30 June 2019.
b) Accounting policy The acquisition method of accounting is used to account for all business combinations, including business combinations involving entities or businesses under common control, regardless of whether equity instruments or other assets are acquired. The consideration transferred for the acquisition of a subsidiary comprises the fair values of the assets transferred, the liabilities incurred and the equity interests issued by the Group. The consideration transferred also includes the fair value of any contingent consideration arrangement and the fair value of any pre-existing equity interest in the subsidiary. Acquisition-related costs are expensed as incurred. Identifiable assets acquired and liabilities and contingent liabilities assumed in a business combination, are with limited exceptions, measured initially at their fair values at the acquisition date. On an acquisition-by-acquisition basis, the Group recognises any non-controlling interest in the acquiree either at fair value or at the non-controlling interest’s proportionate share of the acquiree’s net identifiable assets. The excess of the consideration transferred, the amount of any non-controlling interest in the acquiree and the acquisition-date fair value of any previous equity interest in the acquiree over the fair value of the Group’s share of the net identifiable assets acquired is recorded as goodwill. If those amounts are less than the fair value of the net identifiable assets of the subsidiary acquired and the measurement of all amounts has been reviewed, the difference is recognised directly in profit or loss as a bargain purchase. Where settlement of any part of cash consideration is deferred, the amounts payable in the future are discounted to their present value as at the date of exchange. The discount rate used is the entity’s incremental borrowing rate, being the rate at which a similar borrowing could be obtained from an independent financier under comparable terms and conditions. Contingent consideration is classified either as equity or a financial liability. Amounts classified as a financial liability are subsequently remeasured to fair value with changes in fair value recognised in profit or loss.

Notes to the Consolidated Financial Statements continued For the year ended 30 June 2020 nib holdings limited
126
34. INTEREST IN OTHER ENTITIES a) Subsidiaries and trusts The consolidated financial statements incorporate the assets, liabilities and results of the following controlled entities in accordance with the accounting policy described in Note 1(b):
Place of Incorporation 2020 2019% %
nib holdings limited Australianib health funds limited Australia 100 100
nib servicing facilities pty limited Australia 100 100nib Life pty limited Australia 100 100
nib Transico Pty Ltd Australia 100 N/AGrand United Corporate Health Limited Australia 100 100
nib Global Pty Limited Australia 100 100IMAN Australian Health Plans Pty Limited Australia 100 100nib nz holdings limited New Zealand 100 100
nib nz limited New Zealand 100 100nib Options Pty Limited Australia 100 100
Realsurgeons Pty Limited Australia 100 100Realself Pty Limited Australia 100 100nib Options Holdings (Thailand) Co Limited Thailand 100 100
nib Options (Thailand) Co Limited Thailand 100 100Digital Health Ventures Pty Limited Australia 50 50nib Philippines Pty Limited Australia 100 100nib Asia Pty Limited Australia 100 100
Nuo Ban Business Information Consulting (Shanghai) Co. Ltd China 100 100nib International Student Services Pty Ltd Australia 100 100nib Travel Pty Limited (formerly World Nomads Group Pty Limited) Australia 100 100
WNG Services Pty Limited Australia 100 100nib International Assistance Pty Limited (formerly World Experiences Assist Pty Limited) Australia 100 100Suresave Pty Limited Australia 100 100SureSave Net Limited New Zealand 100 100Sure-Save.net Pty Ltd Australia 100 100Travel Insurance Direct Holdings Pty Limited Australia 100 100
Travel Insurance Direct Pty Ltd Australia 100 100Travel Insurance Direct (New Zealand) Ltd New Zealand 100 100Cheap Travel Insurance Pty Limited Australia 100 100
nib Travel Insurance Distribution Pty Limited (formerly Holiday Travel Insurance Pty Limited) Australia 100 100Surecan Technology Pty Ltd Australia 100 100The World Nomads Group Holdings Pty Ltd Australia 100 100
World Nomads Pty Ltd Australia 100 100World Nomads Inc United States of America 100 100World Nomads Limited United Kingdom 100 100World Nomads (Canada) Ltd Canada 100 100WorldNomads.com Pty Ltd Australia 100 100
nib Travel Services (Australia) Pty Limited (formerly Cerberus Special Risks Pty Limited) Australia 100 100Get Insurance Group Pty Limited Australia 100 100World Experiences International Holdings Pty Ltd Australia 100 100
World Experiences Seguros De Viagrem Brasil LTDA Brazil 100 100nib Travel Services Limited Cayman Islands 100 100Nomadic Insurance Benefits Holdings Limited Ireland 100 100
nib Travel Services Europe Limited Ireland 100 100World Nomads Travel Lifestyle (Europe) Ltd Ireland 100 100nib Travel Services Ireland Limited Ireland 100 100
Travellr Pty Limited Australia 100 100Travel Insurance Compared Pty Limited Australia 100 100TravelClear Pty Limited Australia 100 100Hello Travel Insurance Pty Limited Australia 100 100World Experiences Pty Limited Australia 100 100World Experiences Group Pty Limited Australia 100 100World Experiences Travel Pty Limited Australia 100 100
Beneficial ownership byConsolidated entity

Notes to the Consolidated Financial Statements continued For the year ended 30 June 2020 nib holdings limited
127
34. INTEREST IN OTHER ENTITIES continued a) Subsidiaries and trusts continued nib holdings limited also controls the following trusts:
• nib Holdings Ltd Share Ownership Plan Trust • nib salary sacrifice plan and matching plan trust • nib Salary Sacrifice (NZ) and Matching Plan (NZ) Trust • nib holdings – nib nz Employee Share Purchase Scheme Trust
b) Consolidation of nib foundation trust and nib foundation limited
The constitution of nib foundation limited (as trustee for the nib foundation trust) was changed in FY19 in to enable receipt of unclaimed dividends of the parent entity (nib holdings limited) to fund charitable donations to the community. Due to this change, the parent is required to consolidate the nib foundation trust. The assets of the nib foundation trust are shown as restricted in use and the retained earnings are shown as a restricted reserve of the Group given they can only be distributed for charitable purposes under the constitution of nib foundation trust and are not available to owners of nib holdings limited.
c) Interest in associates and joint ventures During the year, nib holdings limited (parent entity) entered into a joint venture with Cigna Holdings Overseas, Inc. (Cigna) to incorporate Honeysuckle Health Pty Limited, a specialist healthcare data science and services company. nib and Cigna invested $10.0m each in start-up funding. Set out below are the associates and joint ventures of the Group as at 30 June 2020 which, in the opinion of the Directors, are material to the Group. The entities listed below have share capital consisting solely of ordinary shares, which are held directly by the Group. The country of incorporation or registration is also their principal place of business, and the proportion of ownership interest is the same as the proportion of voting rights held.
Name of entity
Place of business / country of
incorporation
Natureof
relationshipMeasurement
method2020 2019 2020 2019
Honeysuckle Health Pty Ltd Australia 50.0% N/A Joint venture Equity 8.4 -Sino-Australia Insurance Consulting Co., Ltd China 75.1% 75% Joint venture Equity 6.4 7.6Kangaroo Insurance Broker Co., Ltd. China 24.9% 25% Joint venture Equity 2.1 2.4Total equity accounting investments 16.9 10.0
Carrying amount $m
% of ownership interest
1. Honeysuckle Health Pty Ltd is a specialist healthcare data science and services company. It is a strategic investment complementing the Group’s health insurance business. 2. Sino-Australia Insurance Consulting Co., Ltd and Kangaroo Insurance Broker Co.Ltd currently offers health checks and will offer lump-sum critical illness products across China. It is a strategic investment which utilises the Group’s knowledge and expertise in health insurance but will limit the Group’s exposure to underwriting risk through a reduced equity holding.

Notes to the Consolidated Financial Statements continued For the year ended 30 June 2020 nib holdings limited
128
34. INTEREST IN OTHER ENTITIES continued c) Interest in associates and joint ventures continued
Summarised financial information for associates and joint ventures The tables below provide summarised financial information for those joint ventures and associates that are material to the Group. The information disclosed reflects the amounts presented in the financial statements of the relevant associates and joint ventures and not the Group’s share of those amounts. They have been amended to reflect adjustments made by the entity when using the equity method, including fair value adjustments and modifications for differences in accounting policy.
2020 2019 2020 2019 2020 2019
Summarised balance sheet $m $m $m $m $m $m
Current assetsCash and cash equivalents 17.8 - 4.8 7.5 2.6 2.7Other current assets 0.2 - 3.4 2.6 8.1 8.2
Total current assets 18.0 - 8.2 10.1 10.7 10.9Non-current assets 0.8 - 0.7 0.2 0.1 0.1Current liabilities
Financial liabilities (excluding trade payables) 1.4 - 0.3 0.1 2.5 1.2Other current liabilities 0.1 - - - - 0.1
Total current liabilities 1.5 - 0.3 0.1 2.5 1.3Total non-current liabilities 0.4 - - - - -Net assets 16.9 - 8.6 10.2 8.3 9.7
Reconciliation to carrying amounts:Opening net assets - - 10.2 - 9.7 -Initial investment 20.0 - - 10.6 - 10.8Profit / (loss) for the period (3.1) - (1.6) (0.4) (1.4) (1.1)Other comprehensive income - - - - - -Dividends paid - - - - - -Closing net assets 16.9 - 8.6 10.2 8.3 9.7
Group's share in % 50.0% - 75.1% 75.1% 24.9% 24.9%Group's share in $ 8.4 - 6.4 7.6 2.1 2.4Goodw ill - - - - - -Carrying amount 8.4 - 6.4 7.6 2.1 2.4
Summarised statement of comprehensive income
Revenue - - 1.2 - - -Interest income - - 0.1 0.1 - -Depreciation and amortisation (0.1) - (0.1) - - -Interest expense - - - - - -Income tax expense - - - - - -
Profit / (loss) from continuing operations (3.1) - (1.6) (0.4) (1.4) (1.1)Profit / (loss) from discontinued operations - - - - - -
Profit / (loss) for the period (3.1) - (1.6) (0.4) (1.4) (1.1)Other comprehensive income / (loss) - - - - - -Total comprehensive income / (loss) (3.1) - (1.6) (0.4) (1.4) (1.1)
Dividends received from associates and joint venture entities - - - - - -
Honeysuckle Health Pty Ltd
Sino-Australia Insurance Consulting Co., Ltd
Kangaroo Insurance Broker Co., Ltd.

Notes to the Consolidated Financial Statements continued For the year ended 30 June 2020 nib holdings limited
129
34. INTEREST IN OTHER ENTITIES continued c) Interest in associates and joint ventures continued
Individually immaterial associates In addition to the interests in associates disclosed above, the Group also has interests in an individually immaterial associate that is accounted for using the equity method.
2020 2019
$m $m
Aggregate carrying amount of individually immaterial associates and joint ventures 0.7 1.6
Aggregate amounts of the Group's share of:Profit/(loss) from continuing operations (1.0) (0.5)Total comprehensive income (1.0) (0.5)

Notes to the Consolidated Financial Statements continued For the year ended 30 June 2020 nib holdings limited
130
35. RELATED PARTY TRANSACTIONS a) Related party transactions with key management personnel Key management personnel are entitled to insurance policies provided at a discount dependant on length of service. These are provided under normal terms and conditions. There were no other related party transactions during the year, as there were no transactions where either party had the presence of control, joint or significant influence to affect the financial and operating policies of the other entity. b) Key management personnel compensation
2020 2019
$ $
Short-term employee benefits 7,305,584 8,066,047 Post-employment benefits 345,195 319,656 Other long-term benefits 90,972 94,521 Termination benefits 1,100,490 - Share-based payments 3,632,184 5,320,420
12,474,425 13,800,644 Detailed remuneration disclosures are provided in the Remuneration Report on pages 23 to 44. c) Transactions with other related parties There were no transactions with other related parties during the year.

Notes to the Consolidated Financial Statements continued For the year ended 30 June 2020 nib holdings limited
131
36. SHARE-BASED PAYMENTS a) Long-term incentive plan (LTIP) Performance rights to acquire shares in nib holdings limited are granted to Executives under the Long Term Incentive Plan (LTIP). Information relating to the LTIP is included in the Remuneration Report on page 42. The nib Holdings Ltd Share Ownership Plan Trust administers the Group’s Executive management Short-Term Incentive and Long-Term Incentive Share Plans. This Trust has been consolidated in accordance with Note 1(b). Set out below is a summary of performance rights granted under the plan:
2020 2019
Number of rights Number of rights
Balance at the start of the year 2,304,220 2,261,017 Granted as compensation 546,774 540,086 Exercised (628,895) (496,883)Other forfeitures (431,961) -Balance at the end of the year 1,790,138 2,304,220 Vested and exercisable at the end of the year - - The valuation methodology inputs for performance rights granted during the year ended 30 June 2020 included:
a) Performance rights are granted for no consideration and vest subject to nib holdings limited EPS and TSR hurdle. b) Exercise price: $nil (2019: $nil) c) Grant date: 11 December 2019 and 28 February 2020 (2019: 23 November 2018) d) Expiry date: 1 September 2023 (2019: 1 September 2022) e) Share price at grant date: $6.0675 (2019: $4.4194) f) Expected dividend yield: Dividends are assumed based on the expected dividend payout ratio is 60% to 70% of normalised net
profit after tax (with the potential for special dividends above this range) b) Employee Share Acquisition (tax exempt) Plan (ESAP) Eligible Australian employees were offered the opportunity to receive part of their salary in the form of shares. All permanent employees who were an employee at the date the offer was made were eligible to participate in the scheme. Employees may elect not to participate in the scheme. ESAP is administered by the Board. Shares granted to the employees by the Board were acquired on-market via a third party trustee plan company. Under the plan, participating employees were allocated an aggregate market value up to $1,000 worth of fully paid ordinary shares in nib holdings limited. Subsequent offers under ESAP are at the Board’s discretion. Shares issued under the scheme may not be sold until the earlier of three years after issue or cessation of employment. In all other respects shares rank equally with other fully-paid ordinary shares on issue.
2020 2019
Number of shares purchased on market under the plan to participating employees 69,440 67,199 The shares were allocated in two tranches. The first tranche of shares were for allocated on 21 August 2019 following nib’s FY19 full year results presentation at a volume weighted average price of $7.07. The remaining tranche of shares were allocated on 26 February 2020 following nib’s FY19 half year results presentation at a volume weighted average price of $4.75.

Notes to the Consolidated Financial Statements continued For the year ended 30 June 2020 nib holdings limited
132
36. SHARE-BASED PAYMENTS continued c) nib NZ Employee Share Purchase Scheme (ESPS) The scheme rules were adopted on 7 November 2013. On 9 December 2013 eligible employees were offered the opportunity to receive part of their salary in the form of shares. All full-time and permanent part-time employees who were an employee as at 9 December 2013 and the date shares were allocated to employees were eligible to participate in the scheme. Employees may elect not to participate in the scheme. ESPS is administered by the Board. Shares granted to the employees by the Board were acquired on-market via a third party trustee plan company. Under the scheme, participating employees were allocated an aggregate market value up to NZD $1,000 worth of fully paid ordinary shares in nib holdings limited. Subsequent offers under ESPS are at the Board’s discretion. Shares issued under the scheme may not be sold until the earlier of three years after issue or cessation of employment. In all other respects shares rank equally with other fully-paid ordinary shares on issue.
2020 2019
Number of shares purchased on market under the plan to participating employees 4,780 4,503 The shares were allocated in two tranches. The first tranche of shares were allocated on 21 August 2019 following nib’s FY19 full year results presentation at a volume weighted average price of $7.07. The remaining tranche of shares were allocated on 26 February 2020 following nib’s FY20 half year results presentation at a volume weighted average price of $4.75. d) nib Salary Sacrifice Plan and Matching Plan Business unit managers were offered the opportunity to receive part of their salary in the form of shares, with an additional amount of shares contributed by the Company. Employees may elect not to participate in the plan. The plan is administered by the Board. Shares granted to the employees by the Board were acquired on-market via a third party trustee plan company. Under the plan, participating employees were allocated an aggregate market value up to $10,000 worth of fully paid ordinary shares in nib holdings limited, made up of $5,000 salary sacrifice and $5,000 matching company component. Subsequent offers under the plan are at the Board’s discretion. Shares issued under the plan may not be sold until the earlier of three or seven years after issue, or cessation of employment. In all other respects shares rank equally with other fully paid ordinary shares on issue.
2020 2019
Number of shares purchased on market under the plan to participating employees 56,712 46,214 e) Salary Sacrifice Plan (NZ) and Matching Plan (NZ) The plan rules were adopted on 28 October 2013. On 9 December 2013 New Zealand business unit managers were offered the opportunity to receive part of their salary in the form of shares, with an additional amount of shares contributed by the Company. Employees may elect not to participate in the plan. The plan is administered by the Board. Shares granted to the employees by the Board were acquired on-market via a third party trustee plan company. Under the plan, participating employees were allocated an aggregate market value up to NZD $10,000 worth of fully paid ordinary shares in nib holdings limited, made up of NZD $5,000 salary sacrifice and NZD $5,000 matching company component. Subsequent offers under the plan are at the Board’s discretion. Shares issued under the scheme may not be sold until the earlier of three or seven years after issue, or cessation of employment. In all other respects shares rank equally with other fully paid ordinary shares on issue.
2020 2019
Number of shares purchased on market under the plan to participating employees 3,386 4,097

Notes to the Consolidated Financial Statements continued For the year ended 30 June 2020 nib holdings limited
133
36. SHARE-BASED PAYMENTS continued f) Short-Term Performance Incentive (STI) All eligible employees have a STI opportunity. For the MD/CEO the maximum target bonus opportunity is 125% of the base remuneration package with 50% of the calculated entitlement to be deferred into shares. For the CFO, GEARHI, GEINB and CEO NZ the maximum target bonus opportunity is 100% of the remuneration package with 50% of the calculated entitlement deferred into shares. For other executives the maximum entitlement is 80% of the remuneration package with 50% of the calculated entitlement deferred into shares. The nib Holdings Ltd Share Ownership Plan Trust administers the Group’s Executive management Short-Term Incentive and Long-Term Incentive Share Plans. This Trust has been consolidated in accordance with Note1(b). Shares issued by the Trust to the employees are acquired on-market prior to the issue. Shares held by the Trust and not yet issued to employees at the end of the reporting period are shown as treasury shares in financial statements; see Note 23(c). Shares were purchased on market and brokerage fees are borne by nib health funds limited.
g) Expenses arising from share-based payments transactions
2020 2019
$m $m
Shares purchased on market under ESAP and ESPS 0.4 0.4
0.4 0.3Performance rights granted under LTIP (0.4) 1.1Shares purchased on market under STI 2.0 1.6
2.4 3.4
Shares purchased on market under nib salary sacrif ice plan and matching plan and salary sacrif ice (NZ) rules and matching plan (NZ)
h) Accounting policy The fair value of performance rights granted under the nib holdings Long-Term Incentive Plan is recognised as an employee benefit expense with a corresponding increase in equity. The total amount to be expensed is determined by reference to the fair value of the performance rights granted, which includes any market performance conditions but excludes the impact of any service and non-market performance vesting conditions and the impact of any non-vesting conditions. Non-market vesting conditions are included in assumptions about the number of performance rights that are expected to vest. The total expense is recognised over the vesting period, which is the period over which all of the specified vesting conditions are to be satisfied. At the end of each period, the Group revises its estimate of the number of performance rights that are expected to vest based on the non-marketing vesting conditions. It recognises the impact of the revision to original estimates, if any, in profit or loss, with a corresponding adjustment to equity. The nib holdings Long-Term Incentive Plan is administered by the nib Holdings Ltd Share Ownership Plan Trust; see Note 23(d)(i). When the performance rights are exercised, the trust transfers the appropriate amount of shares to the employee. Under the Employee Share Acquisition (tax exempt) Plan, the nib Salary Sacrifice Plan and Matching Plan and the Short-Term Performance Incentive, shares are acquired on-market and expensed.

Notes to the Consolidated Financial Statements continued For the year ended 30 June 2020 nib holdings limited
134
37. PARENT ENTITY FINANCIAL INFORMATION The individual financial statements for the parent entity show the following aggregate amounts:
2020 2019
$m $m
Balance SheetASSETSCurrent assets 120.9 94.8Non-current assets 739.7 734.6Total assets 860.6 829.4
Current liabilities 29.0 10.7Non-current liabilities 165.5 165.7Total liabilities 194.5 176.4
NET ASSETS 666.1 653.0
EQUITYShare capital 396.5 389.4Share-based payments (8.7) (4.4)Retained profits 278.3 268.0Total Equity 666.1 653.0
2020 2019
$m $m
Profit for the year 115.1 160.3
Total comprehensive income for the year 115.1 160.3 Refer to Note 30 for contingent liabilities of parent entity. a) Accounting policy The financial information for the parent entity, nib holdings limited, has been prepared on the same basis as the consolidated financial statements, except as set out below.
Investments in
subsidiaries, associates and joint venture entities
Investments in subsidiaries, associates and joint venture entities are accounted for at cost in the financial statements of nib holdings limited. Dividends received from associates are recognised in the parent entity’s profit or loss, rather than being deducted from the carrying amount of these investments.

Notes to the Consolidated Financial Statements continued For the year ended 30 June 2020 nib holdings limited
135
37. PARENT ENTITY FINANCIAL INFORMATION continued a) Accounting policy continued
Tax consolidation
legislation
nib holdings limited and its wholly-owned Australian controlled entities have implemented the tax consolidated legislation. The head entity, nib holdings limited, and the controlled entities in the tax consolidated group account for their own current and deferred tax amounts. These tax amounts are measured as if each entity in the tax consolidated group continues to be a standalone taxpayer in its own right. In addition to its own current and deferred tax amounts, nib holdings limited also recognises the current tax liabilities (or assets) and the deferred tax assets arising from unused tax losses and unused tax credits assumed from controlled entities in the tax consolidated group. The entities have also entered into a tax funding agreement under which the wholly-owned entities fully compensate nib holdings limited for any current tax payable assumed and are compensated by nib holdings limited for any current tax receivable and deferred tax assets relating to unused tax losses or unused tax credits that are transferred to nib holdings limited under the tax consolidation legislation. The funding amounts are determined by reference to the amounts recognised in the wholly-owned entities’ financial statements. The amounts receivable/payable under the tax funding agreement is due upon receipt of the funding advice from the head entity, which is issued as soon as practicable after the end of each financial year. The head entity may also require payment of interim funding amounts to assist with its obligations to pay tax instalments. Assets or liabilities arising under tax funding agreements with the tax consolidated entities are recognised as current amounts receivable from or payable to other entities in the Group. Any difference between the amounts assumed and amounts receivable or payable under the tax funding agreement are recognised as a contribution to (or distribution from) wholly-owned tax consolidated entities.

Directors’ Declaration For the year ended 30 June 2020 nib holdings limited
136
In the Directors’ opinion: a) the financial statements and notes set out on pages 46 to 135 are in accordance with the Corporations Act 2001, including:
i. complying with Accounting Standards, the Corporations Regulations 2001 and other mandatory professional reporting requirements; and
ii. giving a true and fair view of the consolidated entity’s financial position as at 30 June 2020 and of its performance for the financial
year ended on that date; and
b) there are reasonable grounds to believe that nib holdings limited will be able to pay its debts as and when they become due and
payable.
Note 1(a) confirms that the financial statements also comply with International Financial Reporting Standards as issued by the International Accounting Standards Board. The Directors have been given declarations by the Chief Executive Officer and Chief Financial Officer required by section 295A of the Corporations Act 2001. This declaration is made in accordance with a resolution of the Directors. On behalf of the Board
Steve Crane Anne Loveridge Director Director Newcastle, NSW 23 August 2020
PricewaterhouseCoopers, ABN 52 780 433 757 Level 3, 45 Watt Street, PO Box 798, NEWCASTLE NSW 2300 T: +61 2 4925 1100, F: +61 2 4925 1199, www.pwc.com.au Liability limited by a scheme approved under Professional Standards Legislation.
Independent auditor’s report To the members of nib holdings limited
Report on the audit of the financial report
Our opinion
In our opinion:
The accompanying financial report of nib holdings limited (the Company) and its controlled entities (together the Group) is in accordance with the Corporations Act 2001, including:
(a) giving a true and fair view of the Group's financial position as at 30 June 2020 and of its financial performance for the year then ended
(b) complying with Australian Accounting Standards and the Corporations Regulations 2001.
What we have audited
The Group financial report comprises:
● the Consolidated Balance Sheet as at 30 June 2020
● the Consolidated Income Statement for the year then ended
● the Consolidated Statement of Comprehensive Income for the year then ended
● the Consolidated Statement of Changes in Equity for the year then ended
● the Consolidated Statement of Cash Flows for the year then ended
● the notes to the consolidated financial statements, which include a summary of significant accounting policies
● the directors’ declaration.
Basis for opinion
We conducted our audit in accordance with Australian Auditing Standards. Our responsibilities under those standards are further described in the Auditor’s responsibilities for the audit of the financial report section of our report.
We believe that the audit evidence we have obtained is sufficient and appropriate to provide a basis for our opinion.
Independence
We are independent of the Group in accordance with the auditor independence requirements of the Corporations Act 2001 and the ethical requirements of the Accounting Professional and Ethical Standards Board’s APES 110 Code of Ethics for Professional Accountants (including Independence Standards) (the Code) that are relevant to our audit of the financial report in Australia. We have also fulfilled our other ethical responsibilities in accordance with the Code.
Our audit approach
An audit is designed to provide reasonable assurance about whether the financial report is free from material misstatement. Misstatements may arise due to fraud or error. They are considered material if

individually or in aggregate, they could reasonably be expected to influence the economic decisions of users taken on the basis of the financial report.
We tailored the scope of our audit to ensure that we performed enough work to be able to give an opinion on the financial report as a whole, taking into account the geographic and management structure of the Group, its accounting processes and controls and the industry in which it operates.
Materiality
● For the purpose of our audit we used overall Group materiality of $6.2 million, which representsapproximately 5% of the Group's profit before tax.
● We applied this threshold, together with qualitative considerations, to determine the scope of our auditand the nature, timing and extent of our audit procedures and to evaluate the effect of misstatements onthe financial report as a whole.
● We chose Group profit before tax because, in our view, it is the benchmark against which theperformance of the Group is most commonly measured.
● We utilised a 5% threshold based on our professional judgement, noting it is within the range ofcommonly acceptable thresholds.
Audit Scope
● The nib holdings limited Group provides health and medical insurance to Australian and New Zealandresidents, medical insurance to international inbound workers and students, as well as distributing travelinsurance products both in Australia and internationally.
● Our audit focused on where the Group made subjective judgements, for example, significant accountingestimates involving assumptions and inherently uncertain future events.
● PwC specialists in taxation and information technology, along with PwC valuations and actuarial experts
have assisted during the audit.● We decided the nature, timing and extent of work that needed to be performed by us and the component
auditor operating under our instruction. We then structured our audit approach as follows:○ We audited the financial information of the Group and focused on entities within the Group that are
financially significant to the Group.
○ For the procedures carried out by the component auditor, we decided on the level of involvement
required from us to be able to conclude whether sufficient appropriate audit evidence had been
obtained. Our involvement included issuing written instructions, holding discussions, review of key
workpapers, and review of reporting to us by the component auditor.
○ We performed further audit procedures at a Group level, including over the consolidation of the
Group’s reporting units and the preparation of the financial report.

Key audit matters
Key audit matters are those matters that, in our professional judgement, were of most significance in our audit of the financial report for the current period. The key audit matters were addressed in the context of our audit of the financial report as a whole, and in forming our opinion thereon, and we do not provide a separate opinion on these matters. Further, any commentary on the outcomes of a particular audit procedure is made in that context. We communicated the key audit matters to the Audit and Risk Committee.
Key audit matter How our audit addressed the key audit matter
Estimation of claims liabilities
(Refer to note 18) [$245.9 million]
a) Outstanding claims liability [$147.1 million]
We focused on this balance because of the size of
the liability and the complexity and judgements
involved in the estimation process.
The liability is an estimate of expected payments to
customers for incurred but not settled insurance
claims. This includes an estimate for known and
reported claims as well as incurred but not yet
reported claims.
Determining a central estimate involves significant
judgement and is based on a number of factors
including historical claims rates, timeliness of
reporting of claims and evidence around any
changes in the cost of claims. The Group used July
2020 claims payment data to assist in determining
the liability at 30 June 2020.
The estimation of outstanding claims relied on the
quality of the underlying data. It involved complex
and subjective judgements about future events,
both internal and external to the business, for which
small changes in assumptions can result in material
impacts to the estimate.
Our audit procedures over the outstanding claims liability
included, amongst others:
● Evaluating the design effectiveness and
implementation of relevant controls over claims
payments, including key data reconciliations and the
Group’s review of the estimates.
● We were assisted by PwC actuarial experts to evaluate
the Group's actuarial practices and the provisions
established. Our audit procedures included, amongst
others:
o Testing on a sample basis of the claims data
underpinning the outstanding claims liability
valuation
o Testing the mathematical accuracy of the Group's
actuarial model and evaluating whether the
Group’s actuarial methodologies were consistent
with accepted industry practice.
o Assessing the selection of the actuarial method
used to measure outstanding claims this year and
the justification for changes in methods and
assumptions.
o Assessing the appropriateness of key actuarial
assumptions. We challenged these assumptions
by comparing them with our expectations based
on the Group's historical experience, audit of
subsequent payment patterns, and our own
industry knowledge.
o Assessing the approach to setting the risk margin
in accordance with the requirements of Australian
Accounting Standards, including an assessment
of the reasonableness of the actuarial calculation
of the probability of adequacy.
o Reconciling the results of the outstanding claims
liability valuation to the financial statements and
considering the adequacy of the disclosures in
relation to the outstanding claims liability.

Key audit matter How our audit addressed the key audit matter
b) Provision for deferred and suspended claims
[$98.8m]
We focused on this balance because of its size, the unusual circumstances that have given rise to this provision, and the complexity and judgements involved in the estimation process.
As described in Note 18, this provision has been recognised to reflect the constructive obligation that the Group has to pay claims after 30 June 2020 that would ordinarily have been paid prior to 30 June 2020 if it were not for the temporary closure of elective surgery and reduced access to ancillary benefits as a result of the COVID-19 pandemic.
The estimation of the provision required estimating the savings due to the gross reduction in claims due to temporary closure of elective surgery and reduced access to ancillary benefits, netted by the impact on the risk equalisation adjustment and quantifying the percentage of these savings to be deferred to the next financial year: the deferral is on the basis that this amount is what 2021 financial year claims will be inflated by above normal trends due to COVID-19. The Group used July 2020 claims payment data to assist in determining the provision at 30 June 2020.
This is a key audit matter due to the complexities in
estimating the proportion of the deferred claims
that are expected to be paid post balance date.
Our audit procedures over the provision for deferred and
suspended claims included, among others:
• Evaluating the appropriateness of the Group’saccounting policy to recognise deferred claims as aresult of the COVID-19 pandemic against applicableAustralian Accounting Standard requirements.
• Gained an understanding of the impacts of COVID-19 on claims payment patterns
• Evaluating the adequacy of the process fordetermining the provision, including audit overrelevant data inputs into the provisioning model andreview processes over the model's outputs.
• Together with PwC actuarial experts, we:
○ Considered the appropriateness of the Group’smethodologies used to determine claimsdeferred to future periods includingconsideration of reasonable alternatives.
○ Assessed for reasonableness the keyassumptions applied by the Group indetermining the impact COVID-19 has had indeferring claims to future periods.
• Assessed the adequacy of disclosure of the provisionin the financial report against the requirements ofthe applicable Australian Accounting Standards.
Impairment testing of goodwill and indefinite lived
intangibles
(Refer to note 14) [$244.9 million]
The Group’s goodwill relates to the Australian
Residents Health Insurance, International Workers
Health Insurance, New Zealand Residents Health
Insurance & nib Travel Cash Generating Units
(CGUs) ($226.5m) and indefinite lived intangible
assets relating to brands ($18.4m).
Impairment testing of goodwill and indefinite lived
intangibles was a key audit matter because of the
judgement involved in the determination and
application of assumptions and cash flow forecasts
within the ‘value in use’ modelling. The subjectivity
of the assessment has heightened in 2020 due to
the effects of the COVID-19 pandemic increasing
uncertainty in respect of estimating future cash
We performed the following procedures, amongst others:
● Assessed whether the division of the Group into Cash
Generating Units (CGUs) was consistent with our
knowledge of the Group’s operations and internal
Group reporting.
● With the assistance of valuation experts, we
considered the appropriateness of the value in use
calculation methodology and tested the model for
mathematical accuracy.
● Considered whether the cash flows for the forecast
period, the forecast nib Travel expense to income
ratio, and the terminal value were reasonable and
based on supportable assumptions. We assessed the
reasonableness of key assumptions by comparing
actual cash flows to previous forecasts, and
comparing assumptions underpinning the cash flows
to corroborative evidence including industry data.

Key audit matter How our audit addressed the key audit matter
flows, particularly in relation to the travel insurance
business.
The outcome of the nib Travel impairment
assessment in particular is sensitive to the values
attributed to a number of key assumptions. Note 14
details these key assumptions and the impact they
have on this impairment assessment.
● Considered the reasonableness of management’s
assessment of COVID-19 risks in the cash flow
forecasts by reference to publicly available
information regarding possible implications of the
pandemic on the travel industry.
● We tested the reasonableness of the relevant
assumptions used in management’s determination of
the impairment of the Travel Insurance Direct and
SureSave Brands.
● With the assistance of PwC valuations experts, we
considered whether the discount rates adopted by
management, including components calculated by
management’s expert, reflected the risks of the CGUs
by comparing the discount rate to external market
data. We also tested the sensitivity of the impairment
assessment to increases in the discount rates.
● Considered the reasonableness of the terminal
growth rate assumptions by reference to external
market data.
● Assessed the adequacy of the related disclosures in
Note 14 in light of the requirements of Australian
Accounting Standards.
Other information
The directors are responsible for the other information. The other information comprises the information included in the annual report for the year ended 30 June 2020, but does not include the financial report and our auditor’s report thereon.
Our opinion on the financial report does not cover the other information and accordingly we do not express any form of assurance conclusion thereon.
In connection with our audit of the financial report, our responsibility is to read the other information and, in doing so, consider whether the other information is materially inconsistent with the financial report or our knowledge obtained in the audit, or otherwise appears to be materially misstated.
If, based on the work we have performed on the other information that we obtained prior to the date of this auditor’s report, we conclude that there is a material misstatement of this other information, we are required to report that fact. We have nothing to report in this regard.
Responsibilities of the directors for the financial report
The directors of the Company are responsible for the preparation of the financial report that gives a true and fair view in accordance with Australian Accounting Standards and the Corporations Act 2001 and for such internal control as the directors determine is necessary to enable the preparation of the financial report that gives a true and fair view and is free from material misstatement, whether due to fraud or error.

In preparing the financial report, the directors are responsible for assessing the ability of the Group to continue as a going concern, disclosing, as applicable, matters related to going concern and using the going concern basis of accounting unless the directors either intend to liquidate the Group or to cease operations, or have no realistic alternative but to do so.
Auditor’s responsibilities for the audit of the financial report
Our objectives are to obtain reasonable assurance about whether the financial report as a whole is free from material misstatement, whether due to fraud or error, and to issue an auditor’s report that includes our opinion. Reasonable assurance is a high level of assurance, but is not a guarantee that an audit conducted in accordance with the Australian Auditing Standards will always detect a material misstatement when it exists. Misstatements can arise from fraud or error and are considered material if, individually or in the aggregate, they could reasonably be expected to influence the economic decisions of users taken on the basis of the financial report.
A further description of our responsibilities for the audit of the financial report is located at the Auditing and Assurance Standards Board website at: https://www.auasb.gov.au/admin/file/content102/c3/ar1_2020.pdf. This description forms part of our auditor's report.
Report on the remuneration report
Our opinion on the remuneration report
We have audited the remuneration report included in pages 23 to 44 of the directors’ report for the year ended 30 June 2020.
In our opinion, the remuneration report of nib holdings limited for the year ended 30 June 2020 complies with section 300A of the Corporations Act 2001.
Responsibilities
The directors of the Company are responsible for the preparation and presentation of the remuneration report in accordance with section 300A of the Corporations Act 2001. Our responsibility is to express an opinion on the remuneration report, based on our audit conducted in accordance with Australian Auditing Standards.
PricewaterhouseCoopers
SK Fergusson Newcastle Partner 23 August 2020

Shareholder Information As at 31 July 2020 nib holdings limited
143
The shareholder information set out below was applicable as at 31 July 2020.
A. DISTRIBUTION OF EQUITY SECURITIES
Analysis of numbers of equity security holders by size of holding: Class of equity security
1 - 1,000 58,330 1,001 - 5,000 68,452 5,001 - 10,000 9,287 10,001 - 100,000 816 100,001 and over 60
136,945
There were 3,916 holders of less than a marketable parcel of ordinary shares.
B. EQUITY SECURITY HOLDERS
The 20 largest quoted equity security holders
The names of the 20 largest holders of quoted equity securities are listed below:
Number heldPercentage of
issued shares %
HSBC Custody Nominees (Australia) Limited 69,293,663 15.17J P Morgan Nominees Australia Pty Limited 42,956,374 9.40Citicorp Nominees Pty Limited 29,979,426 6.56National Nominees Limited 13,955,982 3.06BNP Paribas Noms Pty Ltd 8,172,370 1.79BNP Paribas Nominees Pty Ltd 5,071,609 1.11Citicorp Nominees Pty Limited 3,731,400 0.82Mr Mark Anthony Fitzgibbon 1,438,864 0.31Brispot Nominees Pty Ltd 1,214,066 0.27CPU Share Plans Pty Ltd 1,181,897 0.26Mrs Michelle McPherson 907,911 0.20HSBC Custody Nominees (Australia) Limited 868,906 0.19HSBC Custody Nominees (Australia) Limited-GSCO ECA 758,641 0.17Fitzy (NSW) Pty Ltd 724,621 0.16Pow erw rap Limited 702,329 0.15BNP Paribas Nominees Pty Ltd 640,536 0.14AMP Life Limited 628,243 0.14Warbont Nominees Pty Ltd 430,226 0.09Mr John Arthur Foyle Turner 430,000 0.09UBS Nominees Pty Ltd 427,690 0.09
183,514,754 40.17
Ordinary Shares
Unquoted equity securities
Number on issueNumber of
holders
Performance rights issued under the nib holdings Long-term Incentive Plan 1,790,138 11

Shareholder Information continuedAs at 31 July 2020 nib holdings limited
144
C. SUBSTANTIAL HOLDERS
There were no substantial holders.
D. VOTING RIGHTS
The voting rights attaching to each class of equity securities are set out below:
Ordinary shares
On a show of hands every member present at a meeting in person or by proxy shall have one vote and upon a poll each share shall have one vote.
Performance rights
No voting rights.

Corporate DirectoryFor the year ended 30 June 2020 nib holdings limited
145
DIRECTORS
Chairman Steve Crane
Managing Director/Chief Executive Officer Mark Fitzgibbon
Lee Ausburn Jacqueline Chow David Gordon Anne Loveridge Christine McLoughlin Donal O’Dwyer
COMPANY SECRETARIES Roslyn Toms Jordan French
EXECUTIVE MANAGEMENT
Managing Director/Chief Executive Officer Mark Fitzgibbon
Group Chief Financial Officer Nick Freeman
Group Executive - Australian Residents Health Insurance Edward Close
Group Executive– nib New Zealand Rob Hennin
Group Executive – Legal and Chief Risk Officer Roslyn Toms
Group Chief Information Officer Brendan Mills
Group Executive – Business Services Matt Paterson
NOTICE OF ANNUAL GENERAL MEETING
The Annual General Meeting of nib holdings limited will be held as a virtual meeting on Thursday, 5 November 2020 at 1pm (AEDT). Shareholders will be able to participate in the AGM in a number of ways with details to be provided in the Notice of Meeting.
A formal Notice of the Meeting is being distributed with the Annual Report.
SHARE REGISTER
Computershare Investor Services Pty Limited Level 3 60 Carrington Street Sydney NSW 2000 1300 664 316
STOCK EXCHANGE LISTING
nib holdings limited shares (nhf) are listed on the Australian Securities Exchange.
PRINCIPAL REGISTERED OFFICE IN AUSTRALIA
22 Honeysuckle Drive Newcastle NSW 2300 13 14 63
AUDITOR
PricewaterhouseCoopers PricewaterhouseCoopers Centre Level 3, 45 Watt Street Newcastle NSW 2300
LEGAL ADVISERS
King & Wood Mallesons Level 61, Governor Philip Tower 1 Farrer Place Sydney NSW 2000
BANKERS
National Australia Bank Limited 1 Old Castle Hill Road Castle Hill NSW 2154
WEBSITE
nib.com.au

nib.com.au