
Neutron scattering studies of the structure and lattice dynamics of a solid solution of hydrogen in...
12
J. Phys.: Condens. Matter 10 (1998) 5255–5266. Printed in the UK PII: S0953-8984(98)91037-2 Neutron scattering studies of the structure and lattice dynamics of a solid solution of hydrogen in α-manganese V K Fedotov†, V E Antonov†, K Cornell‡, G Grosse§, A I Kolesnikov†, V V Sikolenkok, V V Sumink, F E Wagner§ and H Wipf‡ † Institute of Solid State Physics, Russian Academy of Sciences, 142432 Chernogolovka, Moscow District, Russia ‡ Institut f¨ ur Festk¨ orperphysik, Technische Hochschule Darmstadt, Hochschulstraße 6, D-64289 Darmstadt, Germany § Physik-Department E 15, Technische Universit¨ at M¨ unchen, D-85747 Garching, Germany k Frank Laboratory of Neutron Physics, Joint Institute for Nuclear Research, 141980 Dubna, Moscow District, Russia Received 26 January 1998 Abstract. A solid solution of hydrogen in α-Mn, α-MnH x with x = 0.073, was prepared at 623 K and a hydrogen pressure of 0.85 GPa. A profile analysis of the neutron diffraction patterns measured at 225 K and at 300 K showed that hydrogen in α-MnH 0.073 randomly occupies the interstitial positions 12e (0, 0, 0.538) of the α-Mn host lattice. An inelastic neutron scattering study of α-MnH 0.073 at 90 K revealed a pronounced peak at 6.4 meV and a rather broad optical hydrogen band with peaks at 73, 105 and 123 meV. The splitting of the optical band into three different modes agrees with the low symmetry, 2, of the 12e hydrogen sites. A tentative interpretation is given for the peak at 6.4 meV. 1. Introduction At atmospheric pressure, the equilibrium hydrogen solubility in any of the α, β , γ (FCC) and δ (BCC) allotropic modifications of manganese does not exceed a H/Mn atomic ratio of x = 0.003 [1]. Under high hydrogen pressures, manganese forms non-stoichiometric HCP [2, 3] and FCC [4, 5] hydrides with wide ranges of composition. The crystal and magnetic structures of the antiferromagnetic HCP hydrides were studied by means of neutron diffraction [6] and M¨ ossbauer spectroscopy [7, 8], their lattice dynamics by means of inelastic neutron scattering [9]. The FCC manganese hydrides were also found to be antiferromagnets and the dependence of their N´ eel temperature on the hydrogen concentration was studied by means of neutron diffraction and magnetization measurements [4]. A recent high-pressure investigation of the T –P phase diagram of the Mn–H system has shown [10] that besides the HCP and FCC hydrides, rather concentrated primary solid solutions of hydrogen in the α and β modifications of manganese exist, which contain up to a few atomic per cent of hydrogen. The α solutions were studied by M¨ ossbauer spectroscopy using 0.2 at.% 119 Sn as a probe [11]. These experiments showed that the N´ eel temperature of antiferromagnetic α-Mn increases by about 6 K per atomic per cent of dissolved hydrogen. This paper presents the results of neutron diffraction (ND) and inelastic neutron scattering (INS) investigations of an α-MnH x solution with x = 0.073. In order to reveal 0953-8984/98/245255+12$19.50 c 1998 IOP Publishing Ltd 5255
-
Upload
independent -
Category
Documents
-
view
1 -
download
0
Transcript of Neutron scattering studies of the structure and lattice dynamics of a solid solution of hydrogen in...

J. Phys.: Condens. Matter10 (1998) 5255–5266. Printed in the UK PII: S0953-8984(98)91037-2
Neutron scattering studies of the structure and latticedynamics of a solid solution of hydrogen inα-manganese
V K Fedotov†, V E Antonov†, K Cornell‡, G Grosse§, A I Kolesnikov†,V V Sikolenko‖, V V Sumin‖, F E Wagner§ and H Wipf‡† Institute of Solid State Physics, Russian Academy of Sciences, 142432 Chernogolovka,Moscow District, Russia‡ Institut fur Festkorperphysik, Technische Hochschule Darmstadt, Hochschulstraße 6, D-64289Darmstadt, Germany§ Physik-Department E 15, Technische Universitat Munchen, D-85747 Garching, Germany‖ Frank Laboratory of Neutron Physics, Joint Institute for Nuclear Research, 141980 Dubna,Moscow District, Russia
Received 26 January 1998
Abstract. A solid solution of hydrogen inα-Mn, α-MnHx with x = 0.073, was prepared at623 K and a hydrogen pressure of 0.85 GPa. A profile analysis of the neutron diffraction patternsmeasured at 225 K and at 300 K showed that hydrogen inα-MnH0.073 randomly occupies theinterstitial positions 12e (0, 0, 0.538) of theα-Mn host lattice. An inelastic neutron scatteringstudy ofα-MnH0.073 at 90 K revealed a pronounced peak at 6.4 meV and a rather broad opticalhydrogen band with peaks at 73, 105 and 123 meV. The splitting of the optical band intothree different modes agrees with the low symmetry, 2, of the 12e hydrogen sites. A tentativeinterpretation is given for the peak at 6.4 meV.
1. Introduction
At atmospheric pressure, the equilibrium hydrogen solubility in any of theα, β, γ (FCC)and δ (BCC) allotropic modifications of manganese does not exceed a H/Mn atomic ratioof x = 0.003 [1]. Under high hydrogen pressures, manganese forms non-stoichiometricHCP [2, 3] and FCC [4, 5] hydrides with wide ranges of composition. The crystaland magnetic structures of the antiferromagnetic HCP hydrides were studied by meansof neutron diffraction [6] and Mossbauer spectroscopy [7, 8], their lattice dynamicsby means of inelastic neutron scattering [9]. The FCC manganese hydrides were alsofound to be antiferromagnets and the dependence of their Neel temperature on thehydrogen concentration was studied by means of neutron diffraction and magnetizationmeasurements [4].
A recent high-pressure investigation of theT –P phase diagram of the Mn–H systemhas shown [10] that besides the HCP and FCC hydrides, rather concentrated primary solidsolutions of hydrogen in theα and β modifications of manganese exist, which containup to a few atomic per cent of hydrogen. Theα solutions were studied by Mossbauerspectroscopy using 0.2 at.%119Sn as a probe [11]. These experiments showed that theNeel temperature of antiferromagneticα-Mn increases by about 6 K per atomic per cent ofdissolved hydrogen.
This paper presents the results of neutron diffraction (ND) and inelastic neutronscattering (INS) investigations of anα-MnHx solution withx = 0.073. In order to reveal
0953-8984/98/245255+12$19.50c© 1998 IOP Publishing Ltd 5255

5256 V K Fedotov et al
the effects of hydrogen dissolution inα-Mn more accurately and reliably, the spectra of theα-MnH0.073 sample were compared with those of a sample of pureα-Mn measured underthe same conditions.
2. Experimental details
Samples of 8.45 g ofα-Mn andα-MnH0.073 were made of powdered manganese metal of99.99 wt% purity and a grain size of 0.05 to 0.1 mm. To produce the powder, the initialplates of electrolytic manganese of about 1 mm thickness were machined to remove theoxidized surface layer and then crushed in an agate mortar and screened. Theα-MnH0.073
solid solution was prepared by exposing the powder to a hydrogen pressure of 0.85 GPa at623 K for 4 h with subsequent rapid cooling to ambient temperature; the method is describedelsewhere [12]. In order to achieve the maximum hydrogen concentration in theα solidsolution, the conditions of hydrogenation were chosen close to those of the transformationof the α solid solution to the HCP hydride [13]. The hydrogen contentx = 0.073(1) oftheα-MnHx sample obtained was determined by hot extraction into a calibrated volume attemperatures up to 800 K using a sample of about 20 mg. No release of hydrogen from theα-MnH0.073 sample was observed at room temperature in the course of a month.
The ND experiments were performed with the D1B diffractometer at the ILL inGrenoble, with a PG(002) monochromator and neutrons of wavelengthλ = 2.5235A, andwith the high-resolution Fourier diffractometer HRFD at the pulsed reactor IBR-2 at theJINR in Dubna. The measurements with the D1B diffractometer were carried out at 225 K,those with the HRFD at 300 K. For each instrument, the background was determined in aseparate empty-can measurement and subtracted from the measured diffraction spectra oftheα-Mn andα-MnH0.073 samples. The resulting spectra were analysed using the Rietveldprofile refinement technique implemented in the computer programs for the D1B [14] andthe HRFD diffractometer [15].
The INS measurements were carried out at 90 K with the inverted-geometry time-of-flight spectrometer KDSOG-M at the JINR in Dubna [16] with a Be filter and a Zn analyserand an energy of recorded neutrons of 4.8 meV. The INS spectrum of hydrogen inα-MnH0.073 was obtained as the difference between the experimental spectra ofα-MnH0.073
and ofα-Mn measured under identical conditions.An extrapolation of the Mossbauer data of reference [11] to the hydrogen content of
the sample studied in this work shows thatα-MnH0.073 should be antiferromagneticallyordered below a Neel temperature of about 140 K. The Neel temperature of pureα-Mn isabout 95 K. Bothα-MnH0.073 andα-Mn samples were thus studied by means of ND in theparamagnetic state and by means of INS in the antiferromagnetic state.
3. Neutron diffraction
The body-centred cubic unit cell of theα-Mn structure, space groupI 43m, contains 58atoms [17]. The( 1
2,12,
12) translation in this structure links two identical sub-units of 29
atoms positioned on the four crystallographically inequivalent sites 2a, 8c, 24g1 and 24g2.The latter three have positional parameters which might vary on hydrogen uptake. In thecase ofα-MnH0.073 the positional parameters of Mn at these sites were therefore determinedtogether with the parameters for the hydrogen sites.
The type of the position, its occupancy and the thermal factor of hydrogen in theα-MnH0.073 solid solution were first roughly estimated from a ND spectrum in the range
Lattice dynamics of a solid solution of hydrogen inα-Mn 5257
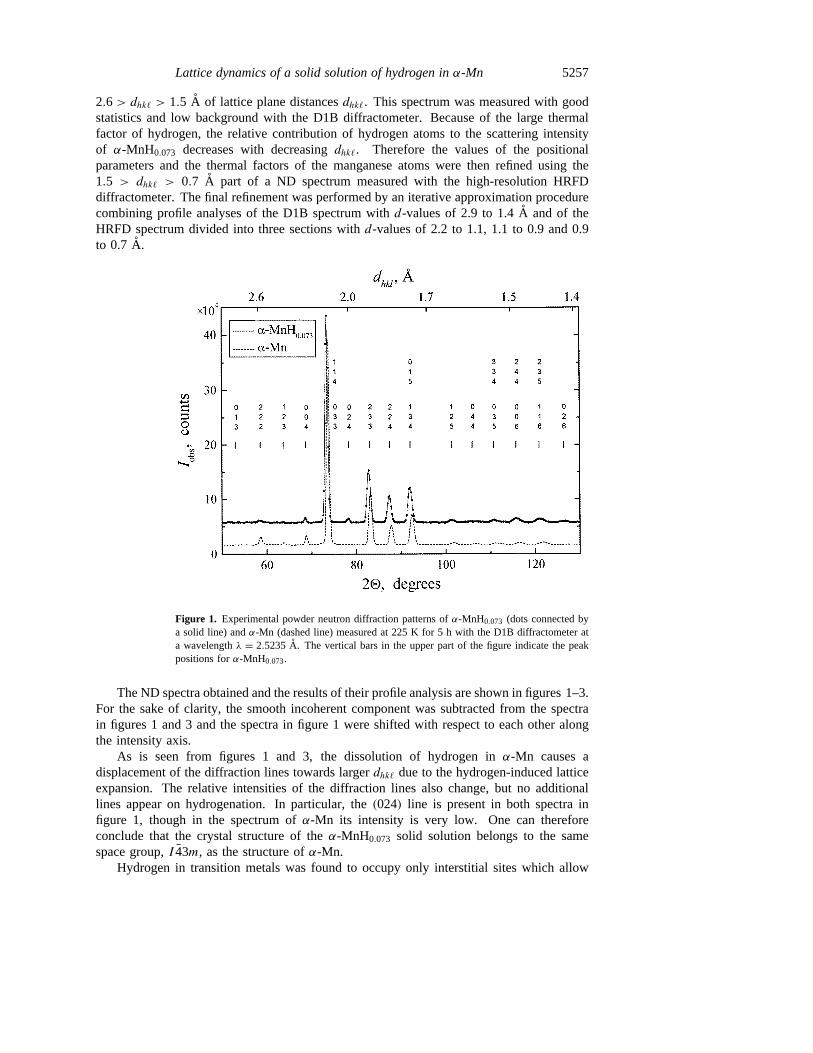
2.6> dhk` > 1.5 A of lattice plane distancesdhk`. This spectrum was measured with goodstatistics and low background with the D1B diffractometer. Because of the large thermalfactor of hydrogen, the relative contribution of hydrogen atoms to the scattering intensityof α-MnH0.073 decreases with decreasingdhk`. Therefore the values of the positionalparameters and the thermal factors of the manganese atoms were then refined using the1.5 > dhk` > 0.7 A part of a ND spectrum measured with the high-resolution HRFDdiffractometer. The final refinement was performed by an iterative approximation procedurecombining profile analyses of the D1B spectrum withd-values of 2.9 to 1.4A and of theHRFD spectrum divided into three sections withd-values of 2.2 to 1.1, 1.1 to 0.9 and 0.9to 0.7 A.
Figure 1. Experimental powder neutron diffraction patterns ofα-MnH0.073 (dots connected bya solid line) andα-Mn (dashed line) measured at 225 K for 5 h with the D1B diffractometer ata wavelengthλ = 2.5235A. The vertical bars in the upper part of the figure indicate the peakpositions forα-MnH0.073.
The ND spectra obtained and the results of their profile analysis are shown in figures 1–3.For the sake of clarity, the smooth incoherent component was subtracted from the spectrain figures 1 and 3 and the spectra in figure 1 were shifted with respect to each other alongthe intensity axis.
As is seen from figures 1 and 3, the dissolution of hydrogen inα-Mn causes adisplacement of the diffraction lines towards largerdhk` due to the hydrogen-induced latticeexpansion. The relative intensities of the diffraction lines also change, but no additionallines appear on hydrogenation. In particular, the(024) line is present in both spectra infigure 1, though in the spectrum ofα-Mn its intensity is very low. One can thereforeconclude that the crystal structure of theα-MnH0.073 solid solution belongs to the samespace group,I 43m, as the structure ofα-Mn.
Hydrogen in transition metals was found to occupy only interstitial sites which allow

5258 V K Fedotov et al
Figure 2. Differences between the experimental neutron diffraction spectrum ofα-MnH0.073
shown in figure 1 and the profiles calculated for different conceivableα-MnHx struct-ures. The results of profile calculations without hydrogen (the difference spectrum labelled‘no H’) and with x = 0.07 of hydrogen randomly distributed over the interstitial positions8c1 (0.109, 0.109, 0.109), 8c2 (0.206, 0.206, 0.206), 6b (0, 0, 0.5) and 12e(0, 0, 0.538), resp-ectively, are shown. All of the profiles were calculated with the parameters of the Mn atomsgiven in table 1 forα-MnH0.073.
Table 1. Positional parameters (x, y, z), thermal factors (B) and site occupancies (ω) for α-Mnand for the solid hydrogen solutionα-MnH0.073 according to a Rietveld profile refinement ofthe neutron diffraction data collected with the HRFD (JINR) diffractometer.Rp andRex are theobtained and expected profile factors. Cubic structure, space groupI 43m (No 217),T = 300 K.
SitePhase Atom Site symmetry x y z B (A2) ω
α-Mn Mn 2a 43m 0 0 0 0.72 1.00a = 8.9138(3) A Mn 8c 3m 0.315(2) 0.315(2) 0.315(2) 0.45 1.00Rp/Rex = 5.0/3.1 Mn 24g1 m 0.354(2) 0.354(2) 0.033(2) 0.48 1.00
Mn 24g2 m 0.090(2) 0.090(2) 0.280(2) 0.44 1.00
α-MnH0.073 Mn 2a 43m 0 0 0 0.74 1.00a = 8.9403(3) A Mn 8c 3m 0.319(2) 0.319(2) 0.319(2) 0.45 1.00Rp/Rex = 5.2/4.0 Mn 24g1 m 0.355(1) 0.355(1) 0.034(1) 0.61 1.00
Mn 24g2 m 0.091(1) 0.091(1) 0.281(1) 0.45 1.00H 12e 2 0 0 0.538(2) 1.57 0.34
the accommodation of atoms with an effective radius of 0.56–0.60A [18], correspondingto a distance ofR(H–Me) ≈ 1.8–2.0A between the hydrogen atom and the nearest metalatoms. In HCP hydrides of manganese, for instance,R(H–Mn) ≈ 1.9 A is observed [6].

Lattice dynamics of a solid solution of hydrogen inα-Mn 5259
Thus, in the case ofα-MnH0.073 only positions of the space groupI 43m located insideinterstices of the proper size had to be analysed for hydrogen occupancy.
In the crystal structure ofα-Mn, there are only two types of interstice with volumes largeenough to satisfy the restrictions given in [18]. These are interstices around 8c(x, x, x)
positions withx = 0.109 andx = 0.206, which are the centres of tetrahedra of manganeseatoms at 24g2 and 2a sites and at 24g1 and 8c sites, respectively, and have distancesR(8c–Mn) of about 1.7A. The second type is an interstice around the 6b(0, 0, 0.5)position, which is the common centre of two tetrahedra of Mn atoms at 24g1 sites withR(6b–Mn) = 1.858 A and at 24g2 sites withR(6b–Mn) = 2.272 A.
At the beginning of the structure refinement procedure, the hydrogen atoms weretentatively placed at the above positions of the space groupI 43m at the centres of theinterstices. The differences between the measured spectrum and spectra calculated underthese assumptions are shown in figure 2.
Figure 2 also shows a difference spectrum calculated on the assumption that none ofthe interstitial sites is occupied by hydrogen. This curve, labelled ‘no H’, shows the effectof dissolved hydrogen on the line intensities in the ND spectrum ofα-MnH0.073. The onlyexception is a broad peak near the(222) line which is observed also in the differencespectrum of the initialα-Mn sample. We attribute these peaks in theα-Mn andα-MnH0.073
spectra to a fine-grain surface impurity and excluded them from the calculation scheme. Allother peaks in the ‘no H’ difference spectrum are due to neutron scattering by hydrogenand have to be described by the profile modelling.
A comparison with the ‘no H’ curve shows that the models with hydrogen atoms at the8c1 (0.109, 0.109, 0.109) and the 8c2 (0.206, 0.206, 0.206) sites are inadmissible. Up to22 = 100◦, corresponding todhk` > 1.65 A, the model with hydrogen at the 6b(0, 0, 0.5)site agrees with experiment rather well. Atdhk` < 1.65A, however, the calculated intensitiesdiffer noticeably from the observed ones in the spectra ofα-MnH0.073 measured with boththe D1B and HRFD diffractometers, and this difference cannot be eliminated by varyingthe positional parameters of the Mn atoms. In addition, the profile refinement gave a valueof x ≈ 0.05 for the hydrogen content of the sample, instead ofx = 0.073 as determined byhot extraction. These discrepancies lead to the conclusion that the actual hydrogen positionin α-MnH0.073 is close to but is not exactly a 6b position.
A model with hydrogen displaced from the 6b(0, 0, 0.5) site to a 12e(0, 0, z) sitewith a variable parameterz close to 0.5 gave a significantly better agreement between thecalculation and experiment. Withz = 0.538 the ratioRp/Rex of obtained and expectedprofile factors fell by approximately 20% and the refined value of the hydrogen contentincreased tox ≈ 0.07, which agrees with the result of the hot extraction. The quality ofthe profile fitting is illustrated in figure 2 by the difference spectrum labelled ‘H on 12e’and in figure 3 by the agreement between the calculated profile shown as a solid curve andthe experimental points.
The final refined values of the structure parameters ofα-MnH0.073 are presented in table 1together with those ofα-Mn determined in a similar manner. In the course of refinementof the α-MnH0.073 and α-Mn structures, the parametersω of the site occupancy for Mnatoms were fixed to unity, and the other structure parameters listed in table 1 were subjectto fitting. Within the experimental error the coordinates obtained for the Mn atoms in theunit cell of α-Mn coincide with the values given in [19] and do not change on hydrogenuptake. The increase in the atomic volume,Va, of α-Mn caused by the dissolved hydrogencorresponds to a value of∂Va/∂x = 1.50(4) A3/H atom which lies near the lower limit ofthe interval 1.5–3A3/H atom characteristic of hydrides of transition metals [12, 20].
It is worth noting that on physical grounds the suggested displacement of hydrogen from

5260 V K Fedotov et al
Figure 3. Experimental intensities forα-MnH0.073 (dots) and profiles resulting from the Rietveldanalysis of the powder neutron diffraction patterns ofα-Mn (dashed line) andα-MnH0.073 (solidline) measured at 300 K for 10 h with the time-of-flight diffractometer HRFD. The vertical barsin the upper part of the figure indicate the peak positions forα-MnH0.073. Three different rangesof lattice plane distances,dhk`, are shown in separate plots.
the 6b to a 12e position is the most likely one. As is shown in figure 4(a), the 6b site lieson a 4 axis and the interstice around it is formed by two tetrahedra of Mn atoms rotatedwith respect to each other by an angle of 90◦ about this axis. The4 axis is an essentialelement of the 6b site symmetry42m, so one could expect the displacement of hydrogen

Lattice dynamics of a solid solution of hydrogen inα-Mn 5261
Figure 3. (Continued)
Figure 4. The position 6b (the cross, (a)), and the two adjacent positions 12e partly occupiedone at a time by hydrogen (open circles 9 and 10, (b)) and their nearest neighbourhood of twotetrahedra formed by manganese atoms at positions 24g1 (shaded circles 1 to 4) and at positions24g2 (solid circles 5 to 8) in the crystal structure ofα-MnH0.073. The vertical chain lines showthe 4 axis which is a symmetry element of the space groupI 43m of α-Mn andα-MnH0.073 andalso one of the 6b site symmetry42m.
to occur along this very axis. Any position on this axis different from the 6b position iscalled a 12e position.
A displacement of hydrogen from the 6b position along the4 axis appears preferablebecause it leads to a decrease in the distanceR(6b–Mn) = 2.272A to the nearest Mn atomson the 24g2 sites, which is beyond the range ofR(H–Me) ≈ 1.8–2.0A characteristic ofmost Me–H phases [18]. The distanceR(6b–Mn) = 1.858 A to the nearest Mn atoms at24g1 sites, which is close to the lower limit of this range, is decreased only slightly. Any

5262 V K Fedotov et al
Figure 5. The arrangement of dumb-bells of 12e positions partly filled with hydrogen in theunit cell of α-MnH0.073. Each dumb-bell can accommodate only one hydrogen atom because ofthe ‘blocking effect’ [18]. The dumb-bells on edges and at face centres are crystallographicallyequivalent and are linked by the BCC translation( 1
2 ,12 ,
12).
Table 2. Positional parameters (x, y, z) of the atoms inα-MnH0.073 shown in figure 4(b) andthe distancesR(9–i) between the H(9) atom and other atoms. The listed values ofR(9–i) arefor 12e positions lying on thez-axis.
Atom(i) x(i) y(i) z(i) R(9–i) (A)
Mn(1) −0.145 −0.145 0.534 1.943Mn(2) 0.145 0.145 0.534 1.943Mn(3) −0.145 0.145 0.466 1.834Mn(4) 0.145 −0.145 0.466 1.834Mn(5) −0.091 −0.091 0.281 1.986Mn(6) 0.091 0.091 0.281 1.986Mn(7) −0.091 0.091 0.719 2.570Mn(8) 0.091 −0.091 0.719 2.570H(9) 0 0 0.462 0H(10) 0 0 0.538 0.679
displacement off the4 axis would effectively decrease the latter distances.In the cubic unit cell ofα-MnH0.073, the 6b positions are located at the mid-points of
the edges and at the centres of the faces. The 12e positions form dumb-bells centred on the6b positions and aligned along the edges and perpendicular to the faces, respectively. Thisis illustrated in figure 5. As is shown in figure 4(b), the displacement of the 12e positions(9 and 10) with respect to the 6b positions is such that they are shifted from the centre ofthe volume close to the mid-points of the edges of tetrahedra formed by manganese atoms(1 to 4) at positions 24g1. As is seen from the interatomic distances given in table 2, thenearest neighbours of the position 12e (9) are four Mn atoms (1 to 4) at positions 24g1 andtwo Mn atoms (5, 6) at positions 24g2. These Mn atoms form a distorted octahedron (1to 6) around the position 12e (9). The more distant Mn atoms (7, 8) together with the Mn

Lattice dynamics of a solid solution of hydrogen inα-Mn 5263
atoms (1 to 4) form a similar octahedron around the other 12e position (10).The 12e(0, 0, 0.538) position of hydrogen satisfies the empirical rule of reference [18]
better than the 6b(0, 0, 0.5) position. As is seen from table 2, the values of theR(12e–Mn)distances between a hydrogen atom and the six nearest Mn atoms inα-MnH0.073 lie wellwithin the limits ofR(H–Me) ≈ 1.8–2.0A characteristic of the phases formed by hydrogenwith transition metals [18]. Moreover, theR(12e–Mn) distances differ from each othermuch less than theR(6b–Mn) distances. Thus, despite its lower symmetry, the intersticeenclosing the 12e site is more ‘spherical’ than that enclosing the 6b site.
As also indicated in table 2, the distanceR(9–10) between the two 12e positions withina dumb-bell is about 0.68A. Because of this small distance, these positions cannot beoccupied by hydrogen at the same time due to the ‘blocking effect’ [18] requiring that thedistance between hydrogen atoms in a metal should not be much less than 2A. Occupancyof half of the 12e sites corresponds to a H/Mn atomic ratio ofx = 6/58≈ 0.103. In theα-MnHx sample studied, withx = 0.073, therefore about 70% of the accessible intersticesare occupied.
Figure 6. The experimental INS spectrum ofα-Mn (solid circles) and the difference betweenthe INS spectra ofα-MnH0.073 andα-Mn representing the spectrum of hydrogen dissolved inα-MnH0.073 (open circles). The spectra of bothα-Mn andα-MnH0.073 were measured with thetime-of-flight spectrometer KDSOG-M at 90 K for 30 h each.
4. Inelastic neutron scattering
The KDSOG-M time-of-flight spectrometer used in this work has a high neutron flux atthe sample position and provides a medium resolution1E/E = 4–6% for energy transfersbetween 1 and 60 meV and1E/E = 6–10% at higher energy transfers between 60 and200 meV. To reduce the contribution from multi-phonon scattering, the INS spectra ofα-Mnandα-MnH0.073 were measured at a temperature of 90 K. The samples weighed 8.45 g each,and the data were collected for 30 h simultaneously at four scattering angles of 22 = 80,

5264 V K Fedotov et al
100, 120 and 140◦. The four spectra obtained were then added to ensure the validity of theincoherent approximation used in the evaluation.
To illustrate the magnitude of the effect of hydrogen on the INS spectrum ofα-Mn, theexperimental spectrum of theα-Mn sample and the difference between the spectra of theα-MnH0.073 andα-Mn samples are shown in figure 6. The huge dome around channel 160in theα-Mn spectrum originates from neutron scattering by the sample and its environment,including the aluminium sample holder, cryostat, etc, and reflects the spectral density of theincident neutron flux. The difference spectrum is expected to be close to the INS spectrumof hydrogen inα-MnH0.073, because the small amount of hydrogen dissolved inα-Mn canhardly change the vibrational spectrum of the host-lattice metal atoms significantly. Thiscan be inferred, for example, from a comparison with the changes in the spectrum of metalvibrations due to formation of hydrides in the Ni–H and Pd–H systems [21], where thehydrides have the same structure type as the pure metals.
As is seen from figure 6, the INS spectrum of hydrogen inα-MnH0.073 exhibits peaksin the region of energy transfer from 50 to 150 meV characteristic of optical vibrations ofhydrogen in metal–hydrogen systems, and also a pronounced peak at 6.4 meV.
Figure 7. The generalized vibrational density of states,GH(E), of hydrogen inα-MnH0.073 at90 K obtained from the difference between the experimental INS spectra ofα-MnH0.073 and ofα-Mn shown in figure 6.
Figure 7 shows this spectrum transformed to the generalized vibrational density ofstatesGH(E), the standard data representation at the KDSOG-M spectrometer. TheGH(E)spectrum can be divided into three regions: the region of the lattice band modes atE < 50 meV with a sharp peak at 6.4 meV, the region of the optical band of hydrogen withthree rather well resolved peaks at 73, 105 and 123 meV, and a region at higher energies,in which multi-phonon processes become dominant.
The splitting of the optical band of hydrogen inα-MnH0.073 into three different modesagrees with the low site symmetry, 2, of the 12e position. The peak at 73 meV presumably

Lattice dynamics of a solid solution of hydrogen inα-Mn 5265
corresponds to a low-energy mode of hydrogen vibrations along the4 axis, because thenearest-neighbour Mn atoms are most distant and symmetrically positioned relative to thisline (figure 4 and table 2). The peaks at 105 and 123 meV can be attributed to vibrationsperpendicular to this line. Note that for hydrogen occupying the 6b position with a highersite symmetry,42m, the high-energy local mode of hydrogen vibrations perpendicular tothe 4 axis would be degenerate.
The peak at 6.4 meV may tentatively be explained by hydrogen tunnelling betweenadjacent 12e positions. With an energyE0 = 73 meV of the local vibrations of hydrogenatoms along the line connecting two sites at a distance of 0.68A from each other, a simplemodel [22] allows a rough estimate of the splitting10 of the hydrogen vibrational groundstate due to tunnelling and gives
10 = 1
2E0 exp(−MHE0l
2/h2) ≈ 5 meV
whereMH is the mass of hydrogen atom and 2l is the distance between the two sites. Theestimated value of10 ≈ 5 meV agrees quite well with the energy of 6.4 meV of the peakin the INS spectrum ofα-MnH0.073.
Further investigations of the temperature, neutron momentum transfer and isotopedependencies of the peak position and intensity are necessary, however, for an unambiguousinterpretation. Such work is in progress.
5. Summary
Under high hydrogen pressures, the equilibrium solubility of hydrogen in the low-temperatureα modification of manganese increases to up to a few atomic per cent. Inthe present work, anα-MnH0.073 sample synthesized at 623 K and at a hydrogen pressureof 0.85 GPa was studied at ambient pressure by means of neutron diffraction and inelasticneutron scattering.
The profile analysis of the neutron diffraction patterns ofα-MnH0.073 measured at 225 Kand at 300 K showed that hydrogen randomly occupies interstitial positions of the 12e typeinside distorted octahedra of manganese atoms. The dissolution of hydrogen results in anincrease in the lattice parameter ofα-Mn, but the coordinates of the Mn atoms in the unitcell remain unchanged. The 12e sites occupied by hydrogen form dumb-bells positioned atthe centres of the edges and faces of the unit cell ofα-Mn. Because of the small distanceof about 0.68A between the 12e sites in a dumb-bell, these sites cannot be occupied byhydrogen simultaneously. Occupancy of half of the 12e sites corresponds to an H/Mnatomic ratio ofx = 6/58≈ 0.103. In theα-MnH0.073 sample studied, hydrogen thereforefilled about 70% of the accessible interstices.
The inelastic neutron scattering study ofα-MnH0.073 at 90 K revealed a strong peak at6.4 meV in the region of the lattice band modes and three peaks at 73, 105 and 123 meVin the range of the optical vibrations of hydrogen. The splitting of the band of opticalhydrogen vibrations into three different modes agrees with the low site symmetry, 2, ofthe 12e position. The peak at 73 meV corresponds to a low-energy mode of hydrogenvibrations along the4 axis of the dumb-bells of the 12e positions, while the peaks at 105and 123 meV are due to the vibrations perpendicular to this axis. The peak at 6.4 meVis tentatively attributed to the splitting of the vibrational ground state of hydrogen due totunnelling between the two 12e sites forming a dumb-bell.

5266 V K Fedotov et al
Acknowledgments
The assistance of Dr A W Hewat and Dr B Ouladdiaf, ILL, in conducting the neutrondiffraction experiments is gratefully acknowledged. The work was supported by the GrantsNo 96-02-17522 and No 96-15-96806 from the Russian Foundation for Basic Research andby the NATO Linkage Grant No 921403.
References
[1] Hansen M and Anderko K 1958Constitution of Binary Alloys(New York: McGraw-Hill) pp 784–5[2] Krukowski M and Baranowski B 1975Rocz. Chem.49 1183–6[3] Ponyatovskii E G and Belash I T 1975Dokl. Akad. Nauk224 607–8[4] Fukai Y, Ishikawa H, Goto T, Susaki J, Yagi T, Soubeyroux J L and Fruchart D 1989Z. Phys. Chem., NF
163 479–82[5] Filipek S M, Majchrzak S, Sawaoka A B and Cernansky M 1991High Pressure Res.7 271–3[6] Irodova A V, Glazkov V P, Somenkov V A, Shil’shtein S Sh, Antonov V E and Ponyatovskii E G 1987Fiz.
Tverd. Tela29 2714–20 (Engl. Transl. 1987Sov. Phys.–Solid State29 1562–5)[7] Schneider G, Baier M, Wagner F E, Antonov V E, Antonova T E, Kopilovskii Yu and Makarov E 1991
Hyperfine Interact.69 467–70[8] Grosse G, Baier M, Schneider G F, Antonov V E and Antonova T E 1996Int. Conf. on the Applications of
the Mossbauer Effect 1995 (Conf. Proc. 50)ed I Ortalli (Boulogne: SIF) pp 215–8[9] Antonov V E, Belash I T, Kolesnikov A I, Mayer J, Natkaniec I, Ponyatovskii E G and Fedotov V K 1991
Fiz. Tverd. Tela33 152–7 (Engl. Transl. 1991Sov. Phys.–Solid State33 87–90)[10] Antonov V E, Antonova T E, Chirin N A, Ponyatovsky E G, Baier M and Wagner F E 1996Scr. Mater.34
1331–6[11] Grosse G, Wagner F E, Antonov V E and Antonova T E 1998Hyperfine Interact.C at press[12] Ponyatovsky E G, Antonov V E and Belash I T 1984 Problems in Solid-State Physicsed A M Prokhorov
and A S Prokhorov (Moscow: Mir) pp 109–72[13] Krukowski M and Baranowski B 1976J. Less-Common Met.49 385–8[14] Yang R A, Sakthivel A, Moss T S and Paiva-Santos C O 1995DBWS 9411 User’s Guide(Atlanta, GA:
Georgia Institute of Technology)[15] Zlokazov V B and Chernyshev V V 1992 J. Appl. Crystallogr.25 447–51[16] Belushkin A V (ed) 1991User Guide, Neutron Experimental Facilities at JINR(Dubna: JINR) 72 pp[17] Pearson W B 1964A Handbook of Lattice Spacings and Structures of Metals and Alloys(Oxford: Pergamon)
pp 734–5[18] Somenkov V A and Shil’stein S Sh 1979Z. Phys. Chem., NF117 125–44[19] Gazzara C P, Middleton R M, Weiss R J and Hall E O 1967Acta Crystallogr.22 859–62[20] Peisl H 1978Hydrogen in Metals Ied G Alefeld and J Volkl (Berlin: Springer) pp 53–74[21] Kolesnikov A I, Natkaniec I, Antonov V E, Belash I T, Fedotov V K, Krawczyk J, Mayer J and
Ponyatovsky E G 1991PhysicaB 174 257–61[22] Drechsler S L, Vujicic G M and Plakida N M 1984J. Phys. F: Met. Phys.14 L243–6