NBER WORKING PAPER SERIES MORE TRUSTING, LESS TRUST? AN INVESTIGATION OF EARLY E-COMMERCE IN CHINA...
46
NBER WORKING PAPER SERIES MORE TRUSTING, LESS TRUST? AN INVESTIGATION OF EARLY E-COMMERCE IN CHINA Hongbin Cai Ginger Z. Jin Chong Liu Li-An Zhou Working Paper 18961 http://www.nber.org/papers/w18961 NATIONAL BUREAU OF ECONOMIC RESEARCH 1050 Massachusetts Avenue Cambridge, MA 02138 April 2013 We are grateful for the generous provision of data from Eachnet.com. Comments from Larry Ausubel, Xiaohong Chen, John Rust, Phillip Leslie, attendees at the 2009 Conference of Industrial Organization and Management Strategy at Tsinghua University and attendees of seminars at Fudan University, Peking University, University of Maryland, the State University of New York, Stony Brook, Georgetown University and UCLA are deeply appreciated. All errors are ours. The views expressed herein are those of the authors and do not necessarily reflect the views of the National Bureau of Economic Research. NBER working papers are circulated for discussion and comment purposes. They have not been peer- reviewed or been subject to the review by the NBER Board of Directors that accompanies official NBER publications. © 2013 by Hongbin Cai, Ginger Z. Jin, Chong Liu, and Li-An Zhou. All rights reserved. Short sections of text, not to exceed two paragraphs, may be quoted without explicit permission provided that full credit, including © notice, is given to the source.
Transcript of NBER WORKING PAPER SERIES MORE TRUSTING, LESS TRUST? AN INVESTIGATION OF EARLY E-COMMERCE IN CHINA...
NBER WORKING PAPER SERIES
MORE TRUSTING, LESS TRUST? AN INVESTIGATION OF EARLY E-COMMERCEIN CHINA
Hongbin CaiGinger Z. JinChong LiuLi-An Zhou
Working Paper 18961http://www.nber.org/papers/w18961
NATIONAL BUREAU OF ECONOMIC RESEARCH1050 Massachusetts Avenue
Cambridge, MA 02138April 2013
We are grateful for the generous provision of data from Eachnet.com. Comments from Larry Ausubel,Xiaohong Chen, John Rust, Phillip Leslie, attendees at the 2009 Conference of Industrial Organizationand Management Strategy at Tsinghua University and attendees of seminars at Fudan University, PekingUniversity, University of Maryland, the State University of New York, Stony Brook, GeorgetownUniversity and UCLA are deeply appreciated. All errors are ours. The views expressed herein are thoseof the authors and do not necessarily reflect the views of the National Bureau of Economic Research.
NBER working papers are circulated for discussion and comment purposes. They have not been peer-reviewed or been subject to the review by the NBER Board of Directors that accompanies officialNBER publications.
© 2013 by Hongbin Cai, Ginger Z. Jin, Chong Liu, and Li-An Zhou. All rights reserved. Short sectionsof text, not to exceed two paragraphs, may be quoted without explicit permission provided that fullcredit, including © notice, is given to the source.
More Trusting, Less Trust? An Investigation of Early E-Commerce in ChinaHongbin Cai, Ginger Z. Jin, Chong Liu, and Li-An ZhouNBER Working Paper No. 18961April 2013JEL No. D8,L15,L81
ABSTRACT
Trust is vital for market development, but how can trust be enhanced in a marketplace? A commonview is that more trusting may help to build trust, especially in less developed economies. In this paper,we argue that more trusting may lead to less trust. We set up a rational expectation model in whicha marketplace uses buyer protection to promote buyer trusting. Our results show that buyer protectionmay reduce trust in equilibrium and even hinder market expansion because it triggers differential entrybetween honest and strategic sellers and may induce more cheating from strategic sellers. Using alarge transaction-level data set from the early years of Eachnet.com (an eBay equivalent in China),we find evidence that is consistent with the model predictions. Stronger buyer protection leads to lessfavorable evaluation of seller behavior and is associated with slower market expansion. These findingssuggest that a trust-promoting policy aiming at buyer trusting may not be effective if it is not accompaniedby additional incentives to improve seller trustworthiness.
Hongbin CaiGuanghua School of ManagementPeking UniversityBeijing 100871Chinaand [email protected]
Ginger Z. JinUniversity of MarylandDepartment of Economics3115F Tydings HallCollege Park, MD 20742-7211and [email protected]
Chong LiuGuanghua School of ManagementPeking UniversityBeijing 100871Chinaand [email protected]
Li-An ZhouGuanghua School of Management Peking UniversityBeijing 100871CHINAand [email protected]
1 Introduction
Economists have long recognized the importance of trust. Researchers have argued or demon-
strated that trust is associated with better economic performance, higher judicial efficiency, less
government corruption, and more effective contractual enforcement (Arrow, 1972; Greif, 1993;
Putnam, 1993; Fukuyama, 1995; Knack and Keefer, 1997; Guiso et al., 2004; Karlan, 2005;
Aghion et al., 2010; Algan and Cahuc, 2010; Tabellini, 2010). If trust is so important, a natural
question is what can be done to enhance trust.
It is often suggested that more trusting may help promote economic prosperity, especially
in less developed economies. The existing literature typically measures trust as how trusting
people are in response to opinion surveys, and relates trusting level to economic performance
measures.1 In this paper, we argue that a policy that encourages buyer trusting may lead to
less trust in equilibrium because it attracts more strategic sellers to enter and may induce more
cheating behavior from strategic sellers after entry. Intuitively, blind trusting by unsophisticated
buyers invites dishonest sellers, which certainly does not increase the trust level. However, we
show both theoretically and empirically that even under rational expectation, more trusting can
be associated with less trust and slower market expansion.
We define “trusting” as a buyer’s belief that a seller will deliver a high quality product,
and "trustworthiness" as the likelihood that a seller will keep her promise to deliver a high
quality product. In a rational expectation equilibrium, trusting is equal to trustworthiness and
therefore the equilibrium “trust” is the probability that a transaction randomly sampled in a
market involves a high quality product. To put it differently, trusting is about demand (affecting
willingness to pay), trustworthiness is about supply (affecting willingness to deliver high-quality
products), and trust is the equilibrium level where demand meets supply (rational expectation).
To organize our thoughts, we build a simple rational expectation model to understand
how trusting-promoting policies trigger the reactions of buyers and sellers and thus affect the
equilibrium trust and market size. In particular, we consider a widely-used trusting-promoting
policy: buyer protection, whereby a market maker can promise buyers a “money back guaran-
tee” should they be cheated by sellers. In our model, buyers and sellers meet in a marketplace
(e.g., an on-line trading platform). There are two types of sellers: honest sellers always deliver
high-quality products, whereas strategic sellers choose between delivering high- or low-quality
products. Buyers are heterogeneous in the valuation of high-quality products; sellers are het-1For example, the World Values Survey used in Knack and Keefer (1997) gauges trust by the question “Generally
speaking, would you say that most people can be trusted, or that you can’t be too careful in dealing with people?”
The same attitudinal question is used in the National Opinion Research Center’s General Social Survey (GSS).
These types of opinion surveys are widely used to analyze the effects of trust on economic performance.
1

erogeneous in entry cost and production cost. If a seller delivers a low-quality product and the
buyer reports it to the platform, the platform can reimburse the buyer and penalize the seller.
Under certain assumptions, we show that buyer protection can reduce equilibrium trust.
The idea is as follows. More generous buyer protection increases buyers’ willingness to buy, and in
response sellers raise prices. The resulting increase in expected profit motivates differential entry
between honest and strategic sellers. Disproportionally more strategic sellers will be attracted
to the market because their returns from entry increase more than those of honest sellers. Fur-
thermore, as prices increase, returns from cheating are larger so strategic sellers may be induced
to engage in more cheating. Consequently, buyer protection can reduce the equilibrium level of
trust. As more generous buyer protection leads to lower trust, the probability of completing a
transaction may be lower because rational buyers expect the negative effects of buyer protection
on seller trustworthiness. If the effect on the completion rate is sufficiently strong, the market
size may even decrease as more buyer protection is offered.
With these predictions in mind, we investigate the effects of buyer protection in early
e-commerce in China. As a developing country with a legacy of a planning economy, China
has long suffered from weak laws and frequent fraud in the market. When Eachnet (an eBay
equivalent in China) introduced e-commerce into China in 1999, it encountered an even worse
trading environment than offline markets due to the anonymity of online transactions. In its
early days, Eachnet experimented with multiple tools to boost trust, including buyer protection,
seller feedback scores, and a warning system, which offers us an excellent opportunity to link
these policies to transaction outcomes and market development. China’s weak legal environment
also forces buyers to rely on market mechanisms to develop and enforce trust. Because reputation
building is gradual and dependent on market size, buyer protection is often considered a powerful
tool to encourage buyers to trust an early market and therefore promote market development.2
We examine a large transaction dataset from Eachnet.com. While feedback scores had been
in place since the beginning of our sample (June 2001), Eachnet did not adopt buyer protection
until October 2001. Its first protection policy offered buyers up to 3000 RMB per transaction,
a coverage close to universal, as 98% of completed transactions were under 3000 RMB at that
time. Eleven months later, Eachnet lowered the upper limit of reimbursement to 1000 RMB2A well-accepted view is that reputation building is an important factor for trust. Trust level in a society will
be higher if individuals, firms, and organizations are motivated to build reputation over time. Reputable sellers are
more reluctant to cut corners because a damaged reputation implies less business and profit in the future (Klein
and Leffler, 1981; Shapiro, 1982). But reputation building takes time and requires repeated interactions and other
institutional supports (e.g., good monitoring). In the model, we focus on the effect of trusting-promoting policies,
instead of reputation building, on the equilibrium level of trust. In the empirical analysis, we will examine how
buyer protection affects the role of seller reputation in market performance.
2

and introduced a deductible of 100 RMB per transaction. These variations allow us to identify
the effect of buyer protection policies from the overall growth of Eachnet. Between the two
buyer protection regimes, Eachnet started to issue warnings to traders who were found guilty
upon their trading partner’s complaint to Eachnet. Warnings could result in a complete ban
on trading on Eachnet, effectively the only online trading platform in China at that time. We
observe seller feedback and seller warning outcomes on the same transaction and will use both
to infer seller trustworthiness.
Data analysis yields two findings: First, when buyer protection is more generous, sellers
are less likely to receive positive feedback and more likely to receive an Eachnet warning about
a completed transaction. The negative effect of buyer protection on seller’s positive feedback is
found to be greater for high-value goods than for low-value goods, and more buyer protection
is linked to lower completion rate and higher price for completed listings. These results provide
supporting evidence for our theoretical model. The second finding relates buyer protection to
market size, which is measured by the number of listings and sellers in each product category.
A greater coverage of buyer protection is found to be correlated with a reduction in market
size, suggesting that the negative effect of buyer protection on completion rate (due to buyer
anticipation of lower trust) dominates its original encouragement of buyer trusting.
Our paper contributes to the literature on the determinants of trust, which defines trust
as beliefs or attitudes shaped by personal experience, community characteristics, and cultural
environment (e.g. La Porta et al., 1997; Alesina and La Ferrara, 2002; Algan and Cahuc, 2010).
In comparison, we consider trust an equilibrium interaction of trusting and trustworthiness.
With rational expectation, our definition of trust can be directly measured by trade outcomes
instead of opinion surveys or experiments (e.g., Glasaer et al., 2000; Resnick and Zeckhauser,
2002; Buchan and Croson, 2004; and Guiso et al., 2004). Our results highlight the importance of
distinguishing trusting and trustworthiness, and suggest that a trust-promoting policy aimed at
buyer trusting may not be effective if it is not accompanied by additional incentives to improve
seller trustworthiness.
Our paper is also related to a growing literature on e-commerce. Most empirical papers in
this literature focus on online reputation, for example the effect of seller reputation on completion
rate and transaction price on eBay (as reviewed in Bajari and Hortascu, 2004 and Dellarocus,
2003), the dynamics of seller reputation in eBay (Cabral and Hortacsu, 2010), the experimental
studies on reputation building (Bohnet and Huck, 2004), and ways to improve the feedback sys-
tem (Bolton, Katok and Ockenfels, 2004). We are aware of only one paper on buyer protection
(Roberts, 2011), which uses transaction data from a US website for tractors and farm machinery
to study whether buyer protection affects the influence of seller reputation on price and prob-
3
ability of sale. Roberts concludes that buyer protection does not substitute for reputation and
attributes this ineffectiveness to either buyer insensitivity to small reputation differences or buyer
skepticism of the protection program. In contrast, we investigate the effect of buyer protection
on seller behavior and market size, both of which are not readily measured in Roberts (2011).
Our theoretical and empirical results help us understand why a policy that targets buyer trusting
can reduce trust and why trust is difficult to build in emerging markets.
The rest of the paper is organized as follows. The next section describes the institutional
background of Eachnet. Section 3 presents our model, and Section 4 describes the Eachnet data.
The empirical results are reported in Section 5. A conclusion is offered in Section 6.
2 Institutional Background
2.1 Eachnet
Eachnet.com was founded in August 1999 and has been one of the largest consumer-to-consumer
(C2C) and business-to-consumer (B2C) online trading platforms in China. As of April 2003
when our data ended, Eachnet had over 4 million registered users from all over China, and
the annual market transactions amounted to 2 billion RMB. To a large extent, Eachnet was a
Chinese version of eBay since it copied a host of chief features from eBay, including the feedback
system, online auction, and fee charges on listing products and trading. Before the major rival
of Eachnet, Taobao.com, emerged in 2004, Eachnet had a nearly 90 percent market share of C2C
online transactions in China during 1999-2003. In June 2003, Eachnet was taken over by eBay
and later on resold to TOM.com.
The biggest difference between Eachnet and eBay is that Eachnet lacks a secured online
payment system due to the limited use of credit cards and the high cost of banking services in
China. As a result, when a transaction is closed online, it constitutes an agreement between
a seller and a buyer only on the product and price to be traded. To execute the transaction,
individual traders have to go off-line to exchange money and the product. The standard procedure
goes as follows: after a transaction is completed on Eachnet, Eachnet sends email messages to
both the seller and the buyer, describing transaction details and contact information. Then the
two parties contact each other through emails or phone calls and settle on how to pay and deliver.
If both live in the same city, they may agree to meet and complete the exchange in person. If
they are in different cities, typically the buyer sends the payment first and the seller mails the
product after receiving the payment. Given China’s weak legal enforcement of contracts, Eachnet
transactions rely heavily on the trust-building institutions within the platform.
Eachnet’s feedback score system was introduced in May 2001. Like eBay, the Eachnet
4

feedback score is based on the feedback reported by trading partners. Feedback, which is solicited
by Eachnet 3-30 days after the completion of an online transaction, has three potential forms:
positive, neutral, or negative. If an individual receives a positive (negative) feedback, he or she
will get one positive (negative) score. If the feedback is neutral, a trader’s feedback score is
unchanged. Just as on eBay, the accumulation of feedback score is linear: there is no distinction
between a score earned from buying or selling and there is no weighting for the volume or product
type involved in the transaction.
Eachnet’s feedback score system is different from eBay’s in two aspects: first, a registered
user on Eachnet must pass a real identity check before trading and accumulating feedback scores.
A government-issued ID card ensures genuine demographic information such as gender and region
of residence. An ID check also makes it more difficult for an Eachnet trader to abandon an existing
account and open a new one with a pseudonym. The second difference between Eachnet and eBay
is how feedback scores are updated. Unlike eBay, which posts feedback whenever it is available,
Eachnet publicizes buyer and seller feedback simultaneously one month after the closing date
of a transaction. If one side does not provide feedback before the one-month deadline, Eachnet
treats it as a voluntary omission and does not allow any subsequent change. This rule is designed
to minimize concern over retaliation when reporting a negative experience.
2.2 Buyer Protection and Seller Warning
Eachnet implemented a buyer protection program in October 2001. Upon a buyer’s complaint of
seller cheating, Eachnet offered reimbursement up to 3000 RMB per transaction. This coverage
was close to universal, as 98% of completed transactions were under 3000 RMB at that time.
In September 2002, probably due to the sharply increasing burden of paying reimbursement
claims, Eachnet lowered the reimbursement limit to 1000 RMB and imposed a deductible of 100
RMB per transaction. This system generated different degrees of buyer protection depending on
the transaction price. Compared with the generous protection before September 2002, a buyer
paying 1500 RMB for an item could be reimbursed only up to 1000 after September 2002, a
buyer paying 500 RMB could be reimbursed 400, and a buyer paying 100 RMB or less got no
protection at all.
In our subsequent analysis, we will focus on three regimes of buyer protection: 1) regime
0: zero coverage prior to October 2001; 2) regime 1: generous coverage from October 2001 to
August 2002; and 3) regime 2: partial coverage in and after September 2002. Table 1 describes
the two buyer protection policies by transaction price. The second policy, especially the variation
in coverage of different values, is essential for us to identify the effect of buyer protection. In
comparison, the first policy is close to full protection for almost all transactions; thus, its effect
5
is not easily identifiable from the rapid market growth of Eachnet in the sample period.
Eachnet’s warning system was introduced in February 2002 to punish bad behavior. For
any completed transaction, if one side feels mistreated by the trading partner, he or she can
file a complaint with Eachnet. Upon receiving the complaint, Eachnet conducts an independent
investigation. If there is clear evidence in support of the complaint, the trading partner receives a
formal warning from Eachnet which is kept as a part of the trust history and visible to the whole
market. However, if it is confirmed that the filed complaint is a serious misreporting or an ill-
intended accusation, the complaining individual is punished by receiving a warning. An Eachnet
warning carries no monetary fines, but a trader with three warnings must leave Eachnet. In this
sense, an Eachnet warning is a threat to future activities and hence an implicit punishment for
those who care about future access to Eachnet.
Eachnet’s warning system was introduced for all transactions at the same time; thus, its
impact is not identifiable from the overall growth of Eachnet. Instead of using Eachnet warning
as a major policy treatment, we view seller recipient of an Eachnet warning as an indicator of
seller behavior, which may differ from online feedback in two ways: first, the warning focuses
on bad behavior but feedback can be positive or negative. Second, the warning involves a final
judgment from Eachnet staff and can be linked to a reimbursement claim, while feedback reflects
only one side’s view and is independent of the official processing of the claim.
3 Theoretical Model
3.1 Basic Model
Consider a market (a trading platform such as Eachnet) where there are two types of sellers:
honest and strategic. Only a seller knows his own type. In the population, the proportion of
honest sellers is α in (0, 1). An honest seller always honors his promise by delivering a high
quality product. Cheating means delivering a poor quality product. Producing poor quality
costs c0 to any seller. The cost of producing a high quality product is also c0 for an honest seller,
so he never cheats.3
A strategic seller honors his promise only when it is in his interest. We assume that the
cost of a strategic seller to produce a high quality product, denoted by c, is uniformly distributed
on (c0, C+ c0). This implies that, if cheating bears no consequence, strategic sellers will produce
poor quality. When a buyer receives a poor quality product, she will report to Eachnet with3We can relax this assumption by supposing that an honest seller incurs a cost of c̄ > c0 from producing a
high quality, and c̄ < c+ n where n is the expected penalty from producing a low quality product. Then honest
sellers will always produce high quality products.
6
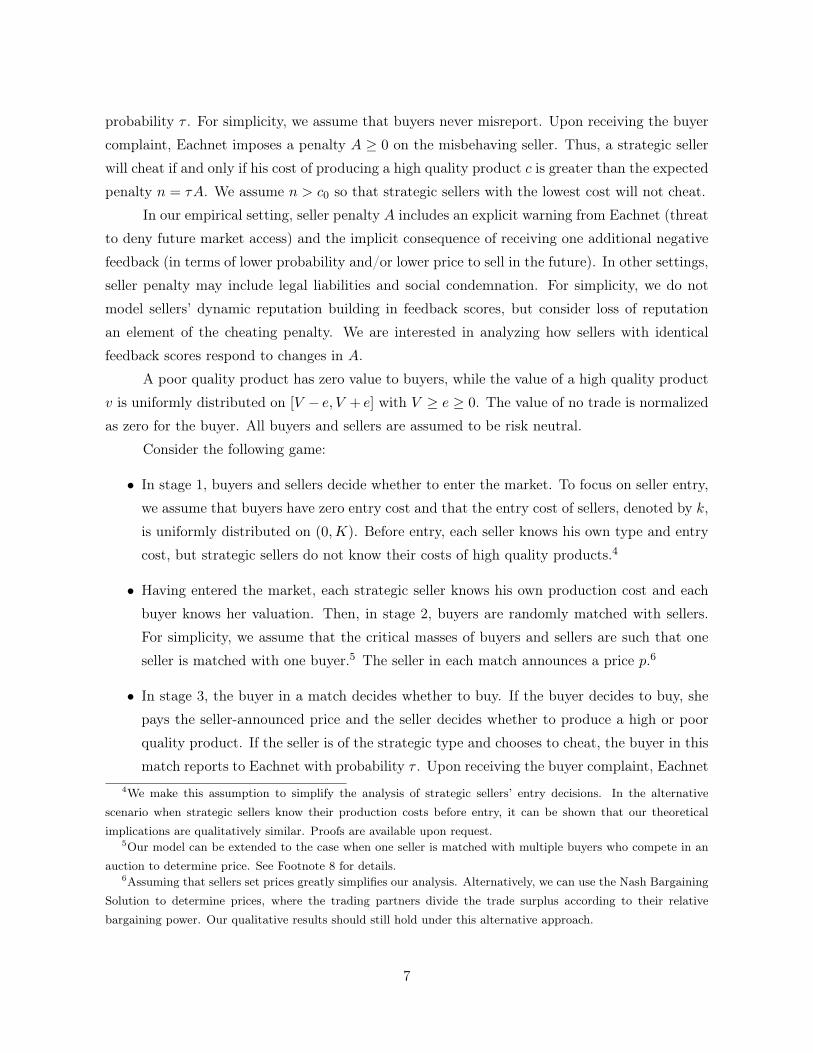
probability τ . For simplicity, we assume that buyers never misreport. Upon receiving the buyer
complaint, Eachnet imposes a penalty A ≥ 0 on the misbehaving seller. Thus, a strategic seller
will cheat if and only if his cost of producing a high quality product c is greater than the expected
penalty n = τA. We assume n > c0 so that strategic sellers with the lowest cost will not cheat.
In our empirical setting, seller penalty A includes an explicit warning from Eachnet (threat
to deny future market access) and the implicit consequence of receiving one additional negative
feedback (in terms of lower probability and/or lower price to sell in the future). In other settings,
seller penalty may include legal liabilities and social condemnation. For simplicity, we do not
model sellers’ dynamic reputation building in feedback scores, but consider loss of reputation
an element of the cheating penalty. We are interested in analyzing how sellers with identical
feedback scores respond to changes in A.
A poor quality product has zero value to buyers, while the value of a high quality product
v is uniformly distributed on [V − e, V + e] with V ≥ e ≥ 0. The value of no trade is normalized
as zero for the buyer. All buyers and sellers are assumed to be risk neutral.
Consider the following game:
• In stage 1, buyers and sellers decide whether to enter the market. To focus on seller entry,
we assume that buyers have zero entry cost and that the entry cost of sellers, denoted by k,
is uniformly distributed on (0,K). Before entry, each seller knows his own type and entry
cost, but strategic sellers do not know their costs of high quality products.4
• Having entered the market, each strategic seller knows his own production cost and each
buyer knows her valuation. Then, in stage 2, buyers are randomly matched with sellers.
For simplicity, we assume that the critical masses of buyers and sellers are such that one
seller is matched with one buyer.5 The seller in each match announces a price p.6
• In stage 3, the buyer in a match decides whether to buy. If the buyer decides to buy, she
pays the seller-announced price and the seller decides whether to produce a high or poor
quality product. If the seller is of the strategic type and chooses to cheat, the buyer in this
match reports to Eachnet with probability τ . Upon receiving the buyer complaint, Eachnet4We make this assumption to simplify the analysis of strategic sellers’ entry decisions. In the alternative
scenario when strategic sellers know their production costs before entry, it can be shown that our theoretical
implications are qualitatively similar. Proofs are available upon request.5Our model can be extended to the case when one seller is matched with multiple buyers who compete in an
auction to determine price. See Footnote 8 for details.6Assuming that sellers set prices greatly simplifies our analysis. Alternatively, we can use the Nash Bargaining
Solution to determine prices, where the trading partners divide the trade surplus according to their relative
bargaining power. Our qualitative results should still hold under this alternative approach.
7

imposes a punishment A on the cheating seller and compensates the buyer’s reimbursement
claim equal to a fixed fraction w of the transaction price p, so that the total compensation
is I = wp.
An equilibrium must satisfy three conditions: each seller makes optimal entry, pricing and quality
decisions in order to maximize his (expected) net profit; each buyer makes an optimal purchasing
decision; and each buyer’s belief in the probability of receiving a low quality product reflects
the actual probability of cheating in the marketplace. The model can be solved by backward
induction, and the derivation is contained in the Appendix.
Let γ be the buyer’s rational belief in the probability that the seller she is matched with
will deliver a high quality product. Because of rational expectation, γ is also the proportion of
high quality products in the market, thus a measure of actual trustworthiness. As shown in the
Appendix, the equilibrium level of trust and the equilibrium price are jointly determined by the
following two equations:
p(γ, V, e, τ, w, c0) =c0
2+
γ(V + e)
2(1− (1− γ)τw), (1)
1
1− γ=
α[(n− c0)− (n−c0)2
2C ]
(1− α)(1− n−c0C )(p− n+ (n−c0)2
2C )+
1
(1− α)(1− n−c0C )
. (2)
Equation (1) is derived from sellers’ optimal pricing decision, given buyers’ trusting level
γ. We focus on a pooling equilibrium, where strategic sellers mimic honest sellers in pricing;
otherwise, price alone will reveal the strategic type.7 In such a pooling equilibrium, honest
sellers set an optimal monopoly price, and strategic sellers fellow suit.8 Plotting Equation (1) in
a graph of p against γ, Figure 1 shows p as an increasing function of γ. This is because the more7If strategic sellers price differently from honest sellers, they must set a lower price as buyers expect more
cheating from them. However, setting a lower price implies less profit and therefore cannot be an optimal strategy
for strategic sellers.8We mentioned earlier that our model could be extended to the case in which a seller is matched with multiple
buyers. In such a case, buyers will compete in an ascending English auction. With identical and independent
private valuation, this is equivalent to the second price auction in which buyers will bid their true valuation (as in a
proxy bid). Let b be a bid for a buyer with a valuation of v for a high quality product. Then her expected valuation
of a unknown quality product is γv + (1 − γ)τwb. Equalizing this with b gives b = γv/[1 − (1 − γ)τw]. Note that
by standard auction theory, the buyer will set an optimal reserve price precisely as given by Equation (1), which is
independent of the number of buyers. Thus, with multiple buyers, the realized price for a completed transaction is
either the price given by Equation (1) (when only one bid is above the reserve price), or γv(2)[1−(1−γ)τw] (when
two or more bids are above the reserve price), where v(2) is the second highest valuation. Taking the conditional
expectation over v(2), we can see that the expected price in the latter case has the same properties as the price
equation given by Equation (1), in particular, the monotonic relationship with regard to w.
8
a buyer believes in high quality delivery (higher γ), the more she is willing to pay for the item,
which motivates the seller to charge a higher price. Moreover, the more buyer protection there
is (higher w), the greater the buyer’s willingness to pay (conditional on γ), which encourages
higher prices.
Equation (2) is derived from the equilibrium condition of rational expectation that, upon
taking into account sellers’ entry decisions, buyer belief in receiving a high quality product must
be equal to the overall probability of sellers delivering high quality products. Plotting Equation
(2) in Figure 1, we can see that p is a downward sloping curve of γ. This is because in rational
expectation buyer belief in the probability of getting high quality depends on the ratio of honest
and strategic sellers entering the market, and on the probability of strategic sellers honoring their
promises (which is independent of price). Higher prices motivate both types of sellers to enter
the market, but the effect is greater on strategic sellers. This can be seen from the following
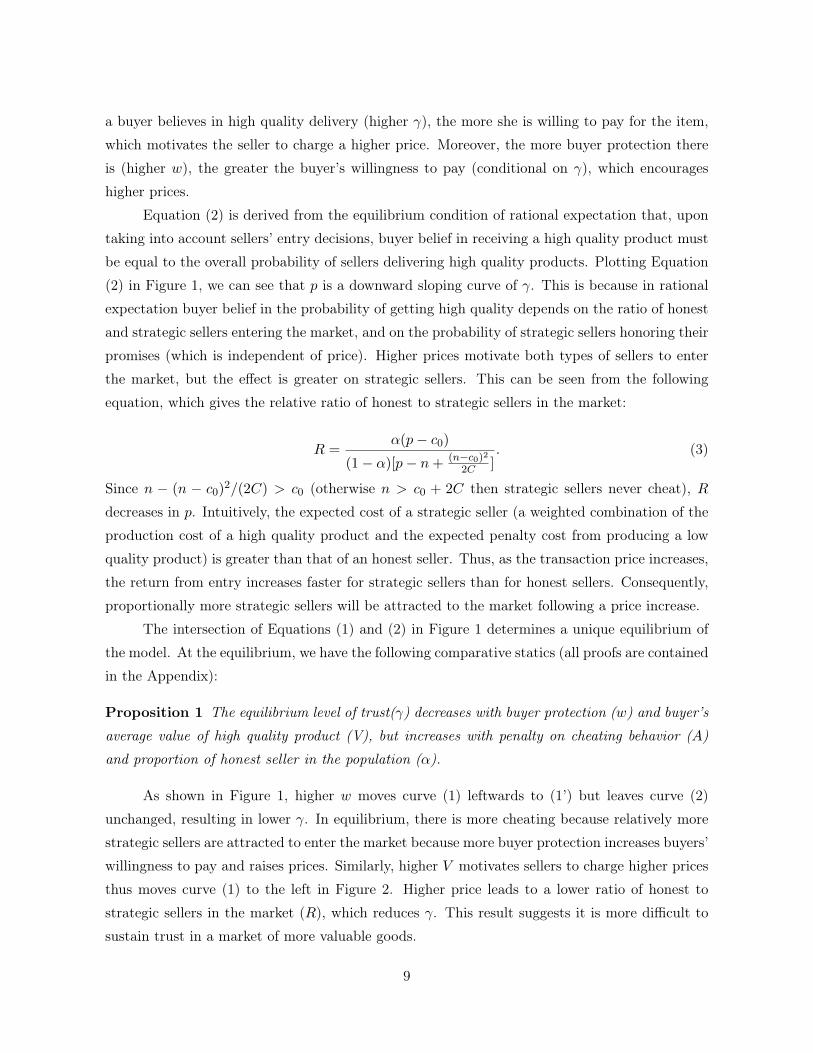
equation, which gives the relative ratio of honest to strategic sellers in the market:
R =α(p− c0)
(1− α)[p− n+ (n−c0)2
2C ]. (3)
Since n − (n − c0)2/(2C) > c0 (otherwise n > c0 + 2C then strategic sellers never cheat), R
decreases in p. Intuitively, the expected cost of a strategic seller (a weighted combination of the
production cost of a high quality product and the expected penalty cost from producing a low
quality product) is greater than that of an honest seller. Thus, as the transaction price increases,
the return from entry increases faster for strategic sellers than for honest sellers. Consequently,
proportionally more strategic sellers will be attracted to the market following a price increase.
The intersection of Equations (1) and (2) in Figure 1 determines a unique equilibrium of
the model. At the equilibrium, we have the following comparative statics (all proofs are contained
in the Appendix):
Proposition 1 The equilibrium level of trust(γ) decreases with buyer protection (w) and buyer’s
average value of high quality product (V), but increases with penalty on cheating behavior (A)
and proportion of honest seller in the population (α).
As shown in Figure 1, higher w moves curve (1) leftwards to (1’) but leaves curve (2)
unchanged, resulting in lower γ. In equilibrium, there is more cheating because relatively more
strategic sellers are attracted to enter the market because more buyer protection increases buyers’
willingness to pay and raises prices. Similarly, higher V motivates sellers to charge higher prices
thus moves curve (1) to the left in Figure 2. Higher price leads to a lower ratio of honest to
strategic sellers in the market (R), which reduces γ. This result suggests it is more difficult to
sustain trust in a market of more valuable goods.
9

In contrast, greater penalty on cheating sellers (A) has a positive effect on equilibrium
trust. In Figure 1, greater A shifts curve (2) rightwards to (2’) but leaves curve (1) unchanged,
leading to a higher p and a higher γ in equilibrium. Intuitively, the enhanced trust may come
from two sources: first, stiffer penalty for cheating discourages strategic sellers from cheating;
second, stronger punishment decreases the expected profit of strategic sellers, thus increasing
the ratio of honest to strategic sellers (R) in the market. Lastly, higher α moves the belief curve
from (2) to (2’) in Figure 1, and thus increases γ in equilibrium. This is obvious. If a market has
a higher proportion of honest sellers in the population, buyer’s belief in getting a high quality
product will increase, and so does the equilibrium level of trust.
Proposition 2 The negative effect of buyer protection (w) on the equilibrium level of trust is
more prominent for high-value products.
From Equation (1), it is easy to see that the marginal effect of w on price increases in
V . As w increases, the increase in price will be greater for more valuable goods, pushing curve
(1) in Figure 1 further leftwards, resulting in even smaller γ. Intuitively, as compensation ratio
increases, prices of more valuable goods will be raised higher, thus attracting proportionally more
strategic sellers.
Proposition 3 Equilibrium price (p) increases with buyer protection(w), cheating punishment(A),
buyer’s average value of high quality products (V ) and the proportion of honest sellers in the pop-
ulation (α).
In Figure 1, greater w or V moves curve (1) leftwards and thus pushes up price; greater A
or higher α shifts curve (2) rightwards and also leads to higher prices. These results are intuitive.
As shown in the Appendix, we can calculate the completion rate (the probability of a
match resulting in a completed transaction) as follows:
CR =V + e
4e− c0(1− (1− γ)τw)
4eγ(4)
Proposition 4 The completion rate (CR) increases with cheating penalty (A) and the proportion
of honest sellers in the population (α).
According to the above expression, everything else equal, greater γ leads to a higher com-
pletion rate. Since both A and α have a positive effect on γ, they have a positive effect on CR as
well. Since w and V affect γ negatively, they also affect the completion rate negatively. However,
conditional on γ, both w and V have direct, positive effects on the completion rate, thus their
10

overall effects on CR are ambiguous. Nevertheless, as shown in the Appendix, it is not difficult
to find parameter values such that the overall effect of w on the completion rate is negative.
Normalizing the total mass of potential sellers to one, we can define the market size (the
proportion of honest sellers multiplies their entry probability plus the proportion of strategic
sellers multiplies their entry probability):
MS =CR
K{p− c0 − (1− α)[(n− c0)− (n− c0)2
2C)]} (5)
The expression of MS has two parts: the first part is the completion rate CR; the second
part is the average profit to be expected per transaction.
Proposition 5 Under certain conditions, the market size is decreasing in the degree of buyer
protection (w).
As mentioned above, w can have a negative effect on the completion rate by lowering the
trust level in the market but a positive effect on equilibrium prices. In the Appendix, we show
that there are a non-trivial set of parameter values such that the negative effect can dominate
the positive effect and thus the overall effect of w on the market size is negative. Thus, stronger
buyer protection can lead to less market expansion! In our empirical analysis, we show that this
indeed happened as Eachent introduced buyer protection schemes.
3.2 Extensions
To make the model as simple as possible, we assume that strategic sellers all face the same
expected penalty n. This implies that the probability of a strategic seller cheating is constant at
1 − n−c0C as long as the price is above n (otherwise strategic sellers would never cheat). Thus,
the effects of buyer protection are driven solely from the differential entry between honest and
strategic sellers.
The model can be easily extended to allow changes in cheating behavior of strategic sellers.
Suppose the expected penalty n a strategic seller faces if she cheats is uniformly distributed on
[n1, n2] where c0 < n1 < n2 < c0 +C, where the randomness of n comes from either uncertainty
about buyer reporting τ (different buyers may have different propensities of reporting cheating
behavior) or randomness in reputation loss from the penalty A imposed by the marketplace (the
same penalty may impose different costs to different sellers). For simplicity, suppose strategic
sellers know about their expected penalty n at the same time when they know their production
cost of producing high quality products. Then a strategic seller will cheat if n < c and n < p.
It is easy to show that the probability of a strategic seller cheating is (1 − n1+n2−2c02C ) ∗ p−n1
n2−n1
11

when n1 < p < n2. It can be shown that all the main results of the basic model still hold in this
extension.
In this extension, buyer protection does not only trigger differential entry between honest
and strategic sellers, but also affect the cheating probability of strategic sellers after entry. In-
tuitively, as prices increase with stronger buyer protection, some strategic sellers who would not
cheat at lower prices (when their expected penalty is higher than the price) will be attempted
to cheat at higher prices (when the price exceeds their expected penalty). Simply put, higher
prices mean greater returns from cheating, thus stronger incentives to cheat. Therefore, with
stronger buyer protection, the proportion of strategic sellers engaging in cheating is larger. This
additional effect reinforces our result that stronger buyer protection leads to less trust. And with
more reduction in the equilibrium level of trust, stronger buyer protection is more likely to lead
to slower market expansion.9
The basic model can be further extended in other directions. For example, suppose a
proportion of buyers are naive in that they blindly trust all sellers. This will increase the overall
willingness to buy in the market, and thus induce higher prices. As we have demonstrated, this
leads to lower equilibrium trust by attracting more strategic sellers to enter (and encouraging
more cheating after entry), and possibly less market expansion. For another example, suppose
there is another type of sellers who always cheat (producing high quality products is too costly for
them). Then when prices increase as buyer protection increases, disproportionally more cheating
sellers will be attracted to the market. This will have an additional effect on equilibrium trust,
further strengthening our results.
A few words are also needed to understand our model in a market with seller reputation.
As a static model without seller reputation dynamics, our model can be viewed as describing
how sellers with the same reputation (who thus appear identical in the eyes of buyers) behave
in a market with imperfect institutions. To the extent that a bad transaction can penalize a
seller via reputation loss, we may interpret penalty A as harm to seller reputation. However, in
reality, seller reputation (e.g., feedback scores) can also signal to buyers the probability of the
seller being an honest type. If so, higher seller reputation can imply a higher α. Fortunately, no
matter how we interpret seller reputation in the real data, A and α tend to have similar effects
on price (p), trust (γ) and completion rate (CR), although their effects on market size (MS)
differ (positive for α but ambiguous for A).9The solution to this extended model is available from the authors upon request.
12

4 Data
Our Eachnet data contain a random sample of roughly 100,000 sellers and track each seller’s
complete selling history from the seller’s first listing on Eachnet (which dates back to as early
as the start of Eachnet in September 1999) to the eve of eBay acquisition (April 2003). This
sampling method allows a representative view of listings on Eachnet but we may miss a seller’s
buying history when he buys from sellers outside our sample.
For each product listing, we know whether it resulted in a completed transaction, where
online completion means a buyer either agreed to pay the buy-it-now price or won the auction by
offering a final price above the minimum price or the secret reservation price if such reservation
existed. For each completed transaction, we observe four categories of information: 1) seller
demographics including gender, age, income, occupation and region (if reported);10 2) seller
history such as registration date, cumulative feedback score before the transaction, plus seller
feedback and the Eachnet warning on this transaction if there is any; 3) buyer demographics
(same as that of the seller)11; and 4) information on the listed product, pricing method (auction
vs. fixed price), auction format, the transaction price and transaction closing time. Eachnet did
not give us data on the exact text/picture description of an item or its bidding history.
For incomplete listings, we observe seller demographics and product information, but not
buyer or transaction information.12 One data challenge is that our raw data do not report the
seller’s cumulative feedback score before a listing if that listing was incomplete. However, since
we know the seller’s complete listing history, we first sort the data by seller id and listing time
(detailed to second), and then impute the seller’s feedback score as the same from his most recent
completed transaction. Because we lack the seller’s buying history, which could also contribute
to seller feedback score, this imputation may introduce an upward or downward bias, especially
if the seller’s last completed transaction happened long time ago. We create a dummy equal to
one if the time lag from the last completed transaction to the studied listing is more than 30
days, and control for this variable in all transaction-specific regressions. That being said, most of
our key regressions are either conditional on completed transactions or based on a simple count
of unique listings, and therefore do not need imputed seller scores.10For sellers, gender is the most frequently reported demographic (reporting rate 98.3%), as compared to age
(10%), income (24.7%), education (49.5%) and occupation (19.5%).11Buyer information is not available until a transaction is completed. If a listing does not result in a transaction,
we know the highest bidding price and the highest bidder’s information. Conditional on completed transactions,
the reporting rate on buyer demographics is 99.6% for gender, 25.8% for occupation, 45.1% for education, 29.3%
for income, and 16.6% for age.12An incomplete listing could contain buyer information about the highest bidder, if his/her bid does not meet
the seller’s secret reservation.
13

Despite the lack of detailed item description, Eachnet classified each item into four levels
of categories. The first level of category is the crudest; the second, third and fourth levels are
more detailed progressively. For example, in the level-one category of cameras and camcorders,
a level-two category is digital cameras, and a level-three category can be digital cameras that
carry the brand Cannon. In total, our Eachnet data contain 20 level-one categories (including a
residual category of “unknown classification”), 180 level-two categories, 669 level-three categories,
and 692 level-four categories. Like “Cannon Digital Cameras”, most level-three categories are not
broken down further into more detailed level-four categories. Throughout the paper, we define
market by level-two categories.
We focus on the sample period from June 1, 2001 to March 31, 2003 because the feedback
score system was formally introduced in May 2001 and there is little information about trader
behavior before the score system. We then rule out duplicates13 as well as outliers that have
transaction price, reserve price or listing price over 100,000 RMB. If a listing sells multiple units of
a product and that listing leads to multiple transactions (with either different buyers or the same
buyer at different close times), they appear as multiple records in the raw data. We keep them
as separate transactions, but our count of unique listings only uses seller and listing information.
This is why the number of records could exceed the number of listings in our summary statistics.
The final sample has 76,607 unique sellers, 1,291,902 unique listings, and 1,570,334 records,
where a record is defined by the combination of seller id, product id, listing time, and if completed,
buyer id and transaction closing time. On average, 53.48% of unique listings were completed
with at least one transaction. Conditional on completion, 59.95% have final price at or under
100 RMB, 32.91% between 100 and 1000 RMB, 5.43% between 1000 and 3000 RMB, and only
1.72% above 3000 RMB.
Dividing the sample by three regimes of buyer protection, Table 2 presents regime-specific
summary on market volume, listing attributes, completion rate, seller reputation at the time of
listing, and feedback/warning outcomes. Over time, the number of listings grew rapidly. This
trend is likely driven by faster growth in relatively low value items, as all prices used in listings
– minimum, buy-it-now, or reservation price when it is available – tend to drop from regime 0 to
regime 2. The big difference in various price measures between means and medians suggests that13In rare cases (less than 0.5% of the data), we observe multiple records that contain the same buyer id,
same seller id, same product id, same listing time, and same closing time. One possibility is that the buyer
purchased multiple units from the same listing but Eachnet counted it as multiple transactions. We collapse such
duplicate records into one. In very few cases, these duplicate records report different feedback on the seller. When
we collapse them, we define the seller feedback as positive/negative/neutral for this transaction if the average
feedback across the duplicate records is positive/negative/zero. Including duplicated records in the final sample
does not affect our regression results.
14

price distribution is positively skewed. Over time, sellers became more likely to sell newer items,
list multiple items under the same listing, post pictures, quote buy-it-now prices, and become
less likely to use bold fonts or auction.14 As expected, seller scores increased over time, partly
due to organic growth of reputation, partly due to the fact that reputable sellers are more likely
to stay active in the market. Throughout the paper, we group missing, zero, and negative score
as “fishy” scores. Completion rate increases significantly from 35.44% in regime 0 to 55.22% in
regime 1 and then remains stable at 54.42% in regime 2.
Eachnet also expanded its categories over time: as of June 2001, active listings were ob-
served in 133 of the 180 level-two categories and 300 of the 669 level-three categories. In March
2003, listings appeared in 172 level-two categories and 650 level-three categories. Given the fact
that the number of level-three categories has increased more rapidly over time, most of our em-
pirical analysis uses the level-two category to define specific markets and uses level-two category
fixed effects to control for market-to-market variations. In special cases where we aim to predict
an item’s value as precisely as possible, we examine similar items that were listed before in the
same and finest category.
The bottom panel of Table 2 focuses on completed transactions. Average final price dropped
steadily from regime 0 to regime 2, probably because lower-value items enjoyed faster growth.
Thanks to the dramatic change in the buyer protection program, the extent of buyer protection
– measured by the percent of final price covered by buyer protection – jumped from 0% in regime
0 to 99.04% in regime 1 and then dropped to 19.58% in regime 2.
In terms of seller feedback, sellers were more likely to receive any feedback in regimes 1
and 2 than in regime 0. Of all completed transactions, fewer and fewer sellers received negative
feedback over time. The percentage of sellers receiving positive feedback increased sharply from
32.68% in regime 0 to 56.95% in regime 1, and then dropped slightly to 53.32% in regime 2.
Figure 3 plots the monthly percentage of sellers receiving positive feedback throughout the 22
months of our analysis sample. A similar graph for the percentage of negative seller feedback is
provided in Figure 4. These two percentages do not add up to one, because we count missing
and neutral feedback as the residual group. Both figures show a strong and non-linear trend
throughout the whole market, which highlights the importance of controlling for overall market
growth (and other factors such as seller reputation and listing attributes). In both figures, we
plot the data for four ranges of final price: below 100, between 100 and 1100, between 1100
and 3000, and over 3000. As the theory predicts, higher-value items are more likely to receive
negative feedback and less likely to receive positive feedback.14In our data, 80.88% of listings offer buy-it-now prices, and the percentage of auction-completed listing declines
from 62.7% in regime 0 to 38.8% in regime 2. In our empirical analysis, we control for whether a listing has offered
auction and/or buy-it-now, and whether it is completed by auction or buy-it-now.
15

Figure 5 plots the percentage of sellers receiving Eachnet warnings by month. Consistent
with seller feedback, seller warning rate is higher for higher-value items. Its difference across price
ranges increased to some extent after Eachnet revised its buyer protection policy in September
2002.
The last row of Table 2 shows that the likelihood of inter-region trading increases steadily
over time, likely reflecting the geographic expansion of Eachnet and a greater willingness to
trust long-distance trading partners. Our empirical analysis controls for the geographic region
of sellers, and the geographic region of buyers if a listing is completed.
5 Empirical Tests
This section first correlates buyer protection with transaction-specific outcomes such as seller
feedback, seller warning, completion rate, and final price if the listing was completed. We then
continue to examine whether buyer protection has affected market size. In the last subsection, we
investigate whether the identified effects of buyer protection are driven by within- or across-seller
variations.
5.1 Seller Feedback and Seller Warning
We are mostly interested in the role of buyer protection in promoting trust. As stated in Propo-
sition 1, buyer protection (w) reduces equilibrium trust (γ) in our theoretical model.
In testing this prediction, the biggest challenge is that we do not directly observe whether a
seller has cheated in a transaction. What we observe are feedback and the Eachnet warning that a
seller receives on a specific transaction. Assuming a buyer report is authentic, the probability of a
seller receiving positive feedback is a product of the seller not cheating15 and the buyer submitting
positive feedback conditional on being treated well. Similarly, the probability of a seller receiving
negative feedback is a product of the seller cheating and the buyer submitting negative feedback
conditional on being cheated, and the probability of a seller receiving Eachnet warning is a
product of seller cheating and buyer complaining to Eachnet conditional on being cheated. All
four factors – seller behavior and the three buyer reporting probabilities – could change in
response to buyer protection. Although we observe four outcomes for the same transaction,15In the model, we assume that every buyer pays because payment is embedded in buyer acceptance of seller
offer. In reality, payment occurs after accepting the item online, which introduces the possibility that the buyer
may be reluctant to complete the offline transaction if she spots any problem when she communicates with the
seller. Because we do not observe buyer payment and seller delivery separately, under the assumption of truthful
reporting, we refer to seller behavior as whether the seller fulfills his part of the transaction by communicating
with the buyer and delivering the item as promised after receiving payment from the buyer.
16
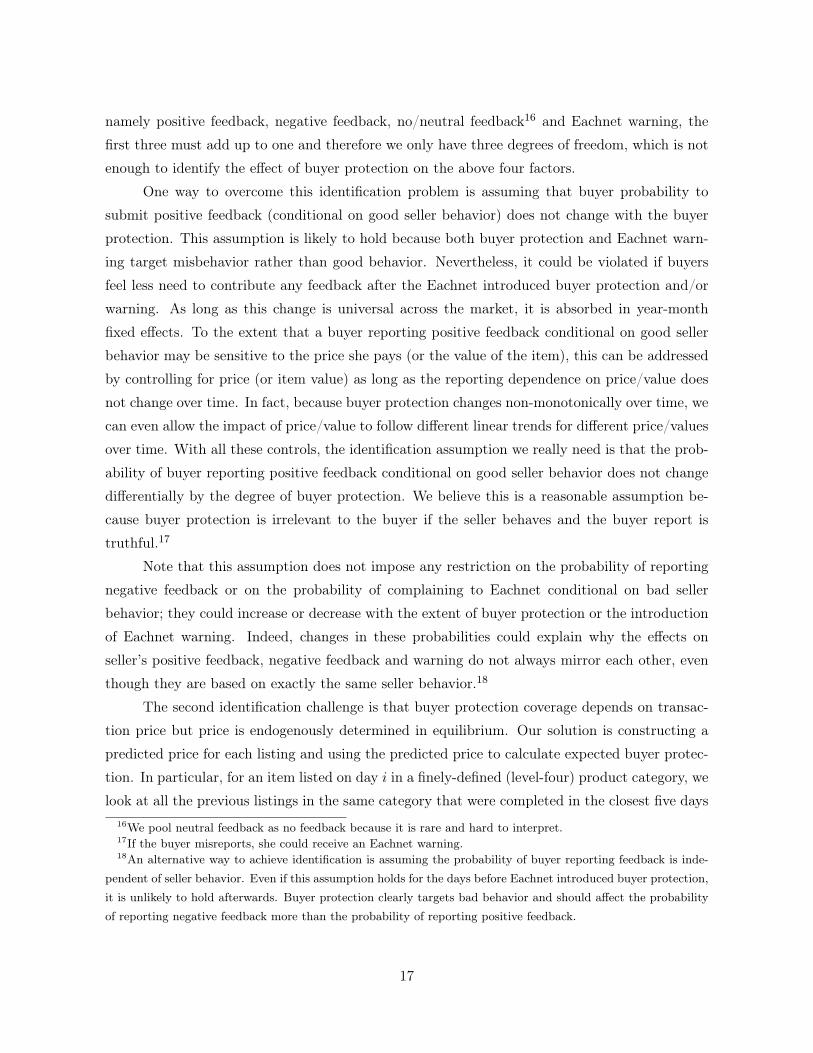
namely positive feedback, negative feedback, no/neutral feedback16 and Eachnet warning, the
first three must add up to one and therefore we only have three degrees of freedom, which is not
enough to identify the effect of buyer protection on the above four factors.
One way to overcome this identification problem is assuming that buyer probability to
submit positive feedback (conditional on good seller behavior) does not change with the buyer
protection. This assumption is likely to hold because both buyer protection and Eachnet warn-
ing target misbehavior rather than good behavior. Nevertheless, it could be violated if buyers
feel less need to contribute any feedback after the Eachnet introduced buyer protection and/or
warning. As long as this change is universal across the market, it is absorbed in year-month
fixed effects. To the extent that a buyer reporting positive feedback conditional on good seller
behavior may be sensitive to the price she pays (or the value of the item), this can be addressed
by controlling for price (or item value) as long as the reporting dependence on price/value does
not change over time. In fact, because buyer protection changes non-monotonically over time, we
can even allow the impact of price/value to follow different linear trends for different price/values
over time. With all these controls, the identification assumption we really need is that the prob-
ability of buyer reporting positive feedback conditional on good seller behavior does not change
differentially by the degree of buyer protection. We believe this is a reasonable assumption be-
cause buyer protection is irrelevant to the buyer if the seller behaves and the buyer report is
truthful.17
Note that this assumption does not impose any restriction on the probability of reporting
negative feedback or on the probability of complaining to Eachnet conditional on bad seller
behavior; they could increase or decrease with the extent of buyer protection or the introduction
of Eachnet warning. Indeed, changes in these probabilities could explain why the effects on
seller’s positive feedback, negative feedback and warning do not always mirror each other, even
though they are based on exactly the same seller behavior.18
The second identification challenge is that buyer protection coverage depends on transac-
tion price but price is endogenously determined in equilibrium. Our solution is constructing a
predicted price for each listing and using the predicted price to calculate expected buyer protec-
tion. In particular, for an item listed on day i in a finely-defined (level-four) product category, we
look at all the previous listings in the same category that were completed in the closest five days16We pool neutral feedback as no feedback because it is rare and hard to interpret.17If the buyer misreports, she could receive an Eachnet warning.18An alternative way to achieve identification is assuming the probability of buyer reporting feedback is inde-
pendent of seller behavior. Even if this assumption holds for the days before Eachnet introduced buyer protection,
it is unlikely to hold afterwards. Buyer protection clearly targets bad behavior and should affect the probability
of reporting negative feedback more than the probability of reporting positive feedback.
17

before day i. The average transaction price of these previous listings is defined as the predicted
price for this listing. Of all the 1,570,334 records in our sample, we are able to define valid
predicted price for 1,223,991 of them (77.9%). Appendix Table reproduces Table 2 conditional
on having a valid predicted price. By definition, regime 0 has less history to calculate predicted
price and therefore is less likely to have valid predicted price. Otherwise, most patterns in the
sub-sample with predicted price are similar to the full sample.
5.1.1 Econometric Specification
With the above-stated assumptions, we estimate the following equation:
Yistk=θwwi+θpp̂i+θsSi+Ciθc+Xiθx+θbBi+θt·t·p̂i+αt+αk+εit. (6)
where i denotes a listing, t denotes year-month, s denotes seller identity, k denotes market as
defined by level-two category code.
Conditional on completion, we use three dependent variables to measure seller behavior:
whether a seller receives positive feedback, negative feedback, or an Eachnet warning on a par-
ticular transaction. Positive and negative feedback are mutually exclusive but do not add up to
one because the seller may receive no or neutral feedback. Eachnet warning is independent of
either positive or negative feedback.19
The extent of buyer protection is denoted by w and calculated according to the price of the
listing p̂ and Eachnet buyer protection policy. In reality, Eachnet uses final price to determine
w but final price is an equilibrium outcome. Since we do not observe the exact text, pictures, or
format used in the listing, these unobserved product attributes could drive both final price and
the outcome of seller feedback or Eachnet warning. To address this potential omitted variable
bias, we calculate three versions of w by setting p̂ equal to final price, buy-it-now price, and
predicted price respectively.
We also control for p̂ directly because our model predicts that seller trustworthiness should
depend on item value in the eyes of buyers. To the extent that buyer reporting probability differs
by product value, it is also captured in the coefficient of p̂. To test whether w has a bigger impact
on higher-valued items, one version of the specification reports coefficients of w for p̂ below and
above 500 RMB separately.20
19We do not take “any feedback” as a dependent variable because prob (any feedback) = prob (good seller be-
havior) * prob (positive feedback | good seller behavior) + (1-prob(good seller behavior))* prob(negative feedback
| bad seller behavior). Given its dependence on seller behavior and two reporting rates, it is difficult to interpret
the effect of a right hand side variable.20In another specification, we estimate different coefficients of w for p̂ below 100, between 100 and 1100, and
above 1100 RMB. Results are qualitatively similar.
18

S denotes seller attributes such as the seller’s Eachnet score at the time of listing, gender,
region, and Eachnet age since registration.21 Following the existing literature, we treat seller
score as an indicator of seller reputation. Loss of reputation is one form of penalty for cheating
sellers (A in the model), but it is difficult to judge whether the penalty is greater when a seller
score drops from 100 to 99 than from 10 to 9. One can also interpret seller score as a proxy that
signals (to buyers) the probability of the seller being an honest type, which corresponds to the
population share of honest sellers (α) in the model. Because of this ambiguity, we refer to the
coefficient of seller score as reputation effects. In some specifications, we include an interaction
of seller score and a dummy of after-buyer-protection, to examine whether the reputation effect
varies with the introduction of buyer protection. Similarly, we sometimes include an interaction
of seller score and a dummy of after-Eachnet-warning.
C denotes competition from similar items on the Eachnet. To construct C, we first calculate
the number of listings in the same finest category (up to four-level category code) in seven days
before the listing date of the studied listing, and then divide it by the total number of view count
on these listings (measured in thousands).22 View count attempts to measure market demand
for that fine category. In the model, we normalize buyer’s outside option as zero. Empirically,
C is a proxy for buyer’s outside option.
X denotes a set of listing attributes such as whether the listing allows auction and/or buy-
it-now, whether the listing has a reservation price, whether the listing posts a picture, whether
the listing uses bold font, the seller-reported item condition, and other listing features.
B controls for buyer gender, buyer region, buyer’s Eachnet score, buyer’s Eachnet age,
and whether the buyer and sellers are from the same region. Although these buyer attributes
are transaction outcomes, they attempt to control for variations in buyer reporting rate. Many
of them turn out to be highly significant, as female and experienced buyers are more likely to
report and same-region buyers can better communicate with sellers and monitor them in the
off-line part of the transaction. We tried the same specification without B, and the coefficients
on key variables are qualitatively similar.
Lastly, we control for t · p̂ to allow items of different values to follow different trends in
feedback and warning outcomes. We aslo control for year-month fixed effects, αt, and product
category fixed effects, αk.21We calculated seller’s cumulative number of completed listings before i, but its correlation with the seller’s
Eachnet score is higher than 0.95, so we do not control for it in the regression.22We count the seven days conditional on having at least one completed transaction in that category. So these
seven days could extend beyond one week before the listing. Since our listing time is detailed to days instead of
hours/minutes/seconds, this calculation does not include listings that were listed on the same day as the studied
listing in order to avoid contamination.
19

5.1.2 Regression Results
Table 3 presents regression results regarding whether a seller receives positive feedback on a
single transaction. Columns 1-3 use final price to calculate degree of buyer protection, Columns
4-6 use buy-it-now price, and Columns 7-9 use predicted price. Under each measure of buyer
protection, we report three specifications: the first reports a single coefficient of w; the second
reports one coefficient of w for p̂ ≤ 500 and one for p̂ > 500; the third specification allows seller
score variables to interact with one dummy of after-buyer-protection and one dummy of after-
Eachnet-warning. We report all results from a linear probability model, controlling for product
category fixed effects (~180), seller region fixed effects (at the city level, ~24 as we consolidate
small regions as one default group), buyer region fixed effects (~24), and year-month fixed effects
(~22). Every specification also controls for p̂ and t · p̂, where t is the number of calendar months
since the start of our analysis sample (June 2001). Results are robust if we do not include t · p̂or if we add a quadratic term of p̂.
In all specifications, we find that buyer protection has a significant, negative effect on the
likelihood of a seller receiving positive feedback. Under the assumption that buyer reporting is
authentic and the probability of reporting positive feedback conditional on good seller behavior
does not change with buyer protection, this result confirms Proposition 1 that sellers are less
trustworthy when Eachnet offers greater buyer protection. In particular, the coefficient of w in
Column 7 indicates that a change from no protection to full protection reduces the likelihood
of seller positive feedback by 4.7 percentage points. This is a large effect as compared with the
sample average of seller positive feedback (54%). Consistent with Proposition 2, we also find a
greater, negative effect of buyer protection on higher-value items. According to Column 8, the
coefficient of w for p̂ > 500 is -0.079, nearly 80% higher than that for p̂ ≤ 500 (-0.044).
It is somewhat surprising that seller reputation – as measured by log(seller score if seller
score >0) and a dummy of seller score being missing, negative, or zero (so called “fishy” score)
– does not always have the expected effects. For example, Columns 1,4 and 7 show that a fishy
score relates to less positive feedback but log (positive seller score) also has an negative effect on
seller positive feedback. Further examination shows that this is driven by differential effects of
seller reputation before and after the introduction of buyer protection. Before the introduction
of buyer protection (and Eachnet warning), higher (and positive) seller score did predict more
positive feedback. However, both buyer protection and the Eachnet warning system weaken the
incentive for reputable sellers to behave well. If we interpret seller reputation as A or α, this is
consistent with the model prediction that buyer protection (w) and {A,α} could be substitutes
or complements in their effect on trust.
Table 4 reports regression results of equation (8) on seller negative feedback and seller
20

warning. Recall that buyer protection may generate changes in both seller trustworthiness and
buyer reporting; thus, the prediction on seller negative feedback and seller warning are more
uncertain. As we did for seller positive feedback, we report three sets of results for seller negative
feedback, with buyer protection calculated by final price, buy-it-now price and predicted price
respectively. For each measure of buyer protection, the second specification interacts seller score
variables with a dummy of after-buyer-protection and a dummy of after-Eachnet-warning. These
interactions cannot be identified for seller warning outcome, as Eachnet adopted a warning system
after buyer protection. Hence we only report three columns of seller warning results.
Most of Table 4 is consistent with seller behavior inferred from Table 3: greater buyer
protection is related to more seller negative feedback and more seller warning; higher log (seller
score) is related to less negative feedback and less warning; having a missing/negative/zero seller
score is related to more negative feedback and more warning. The only exception is the negative
coefficient of w on seller negative feedback, where w is calculated by predicted price.23 One
possible explanation is that mistreated buyers tend to complain to the Eachnet warning system
instead of reporting negative feedback.
5.2 Completion Rate and Final Price
Completion rate and transaction price are intermediate steps when the model analyzes the effect
of buyer protection on trust. In particular, buyer protection is predicted to have a positive effect
on price (Proposition 3) and an ambiguous effect on completion rate (Proposition 4). To test
these predictions, we estimate:
1completed,istk = (α2s) + θ2wwi + θ2pp̂i + θ2sSi +Ciθ2c +Xiθ2x + θ2t · t · p̂i + α2t + α2k + ε2it, (7)
log(pistk) = θ3wwi + θ3sSi + Ciθ3c +Xiθ3x + α3t + α3k + ε3it. (8)
Right hand side variables follow Equation (8) with three exceptions: first, we use only
predicted price to calculate buyer protection, because either final or buy-it-now price can be
interpreted as transaction outcomes;24 second, we do not include buyer attributes as they are not
available for incomplete transactions and are jointly determined with price if they are available;
third, we do not control for predicted price in the price regression because predicted price by
definition aims to predict transaction price for that listing.23Further examination suggests that this coefficient is particularly driven by items with smaller values (p̂ ≤ 500).24While not reporting, we have rerun completion rate regressions by adding a quadratic term of predicted price
on the right hand side. This specification does not change the sign (or magnitude) of the coefficient of w but
increases its standard errors. This coefficient is no longer significant in Columns 1 and 3, but remains significant
with p-value less than 0.05 in Columns 2 and 4, if we reproduce Table 5 under this alternative specification.
21

Table 5 presents linear regressions results for both completion rate and log final price.
Because one listing may list multiple units of the same item and lead to multiple transactions,
our unit of analysis is per unique listing for completion rate and per transaction for log price.
We count a listing as completed if it leads to at least one complete transaction.25 The price
regression clusters error by listing id. In the even-numbered columns, we interact seller score
variables with the after-buyer-protection and after-Eachnet-warning dummies.
Throughout the columns, we find that buyer protection always has a negative effect on
completion rate and a positive effect on log price, both of which are consistent with our model. If
the model is correct, a negative effect of buyer protection on completion rate implies a negative
effect on market size, because buyer anticipation of worse seller behavior hurts the probability
of sales and therefore discourages sellers from listing in the market. We will test this prediction
in the next subsection.
Consistent with the previous e-commerce literature, the log of positive seller score increases
completion rate and log price, while having a negative, zero or missing score reduces probability
of sale. Surprisingly, sellers with a negative, zero or missing score also enjoy a price premium,
compared to those with a reputation score of one. A possible interpretation is that sellers with
inferior records target high-price items even though the chance of completing the transaction is
small. As shown in Tables 3 and 4, “fishy” sellers do get more negative feedback, less positive
feedback, and more warnings if their listings are completed.
The effects of “fishy” seller scores on completion rate and price become more conspicuous
after the introduction of buyer protection and Eachnet warning. One explanation is that, over
time, fewer and fewer sellers have “fishy” scores, which makes “fishy” scores more alarming to
buyers and forces “fishy” sellers to charge high prices to a few gullible buyers. The effects of log
positive seller score also change after the introduction of buyer protection and Eachnet warning.
In particular, the positive effect of log seller score on completion rate is weakened after buyer
protection and Eachnet warning, but its effect on price is positive only after the two program
changes. Combined with Tables 3 and 4, this suggests that the role of seller reputation has
changed from indicating reliable and trade-worthy sellers in regime 0, to facilitating higher price
in regimes 1 and 2.
5.3 Market Size
Within the Eachnet data, we define each two-level category code (k) as a separate market.
Among a total of 180 categories, 116 have at least one listing completed by the first month of our25In an alternative specification, we redefine completion as one if all records related to the listing are coded as
completed transactions in our raw data. This alternative definition produces similar results.
22
analysis sample (June 2001). In light of this, our study of market size focuses on the development
of these 116 markets since July 2001, while taking each market as of June 2001 as the initial
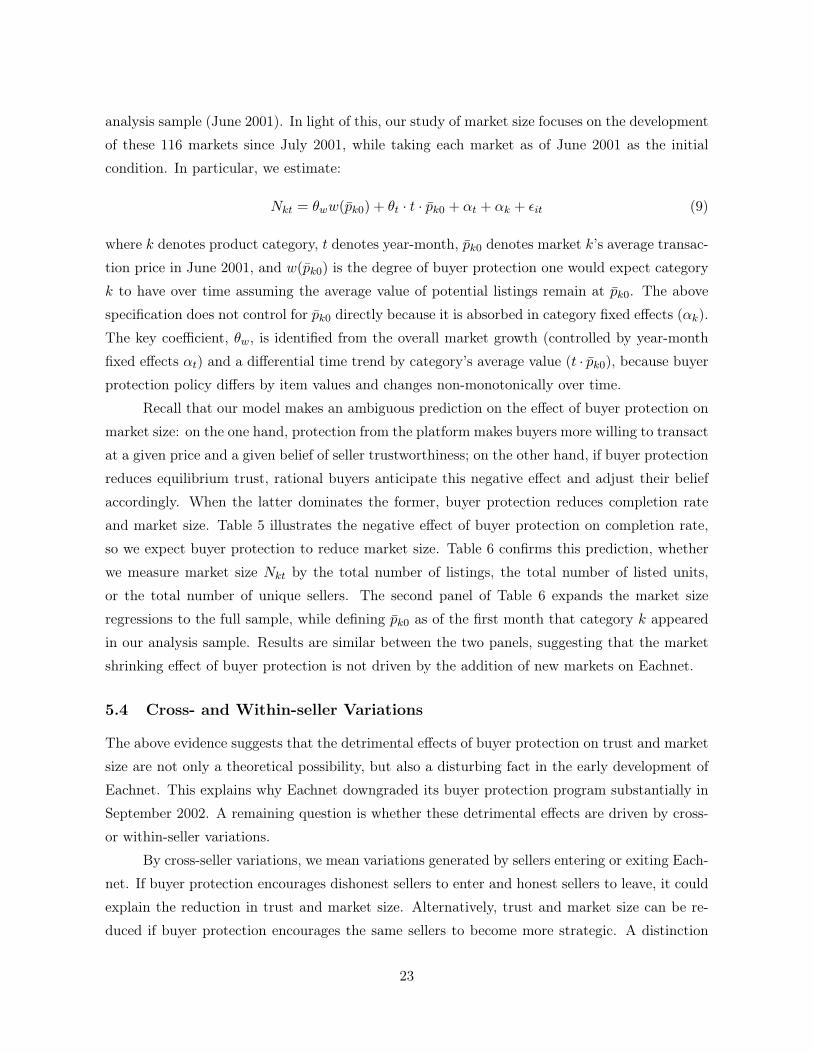
condition. In particular, we estimate:
Nkt = θww(p̄k0) + θt · t · p̄k0 + αt + αk + εit (9)
where k denotes product category, t denotes year-month, p̄k0 denotes market k’s average transac-
tion price in June 2001, and w(p̄k0) is the degree of buyer protection one would expect category
k to have over time assuming the average value of potential listings remain at p̄k0. The above
specification does not control for p̄k0 directly because it is absorbed in category fixed effects (αk).
The key coefficient, θw, is identified from the overall market growth (controlled by year-month
fixed effects αt) and a differential time trend by category’s average value (t · p̄k0), because buyer
protection policy differs by item values and changes non-monotonically over time.
Recall that our model makes an ambiguous prediction on the effect of buyer protection on
market size: on the one hand, protection from the platform makes buyers more willing to transact
at a given price and a given belief of seller trustworthiness; on the other hand, if buyer protection
reduces equilibrium trust, rational buyers anticipate this negative effect and adjust their belief
accordingly. When the latter dominates the former, buyer protection reduces completion rate
and market size. Table 5 illustrates the negative effect of buyer protection on completion rate,
so we expect buyer protection to reduce market size. Table 6 confirms this prediction, whether
we measure market size Nkt by the total number of listings, the total number of listed units,
or the total number of unique sellers. The second panel of Table 6 expands the market size
regressions to the full sample, while defining p̄k0 as of the first month that category k appeared
in our analysis sample. Results are similar between the two panels, suggesting that the market
shrinking effect of buyer protection is not driven by the addition of new markets on Eachnet.
5.4 Cross- and Within-seller Variations
The above evidence suggests that the detrimental effects of buyer protection on trust and market
size are not only a theoretical possibility, but also a disturbing fact in the early development of
Eachnet. This explains why Eachnet downgraded its buyer protection program substantially in
September 2002. A remaining question is whether these detrimental effects are driven by cross-
or within-seller variations.
By cross-seller variations, we mean variations generated by sellers entering or exiting Each-
net. If buyer protection encourages dishonest sellers to enter and honest sellers to leave, it could
explain the reduction in trust and market size. Alternatively, trust and market size can be re-
duced if buyer protection encourages the same sellers to become more strategic. A distinction
23

between cross- and within-seller variations can help us understand the mechanism underlying
the observed effects of buyer protection, but we are reluctant to label within-seller variations
as moral hazard and cross-seller variations as adverse selection because a seller may intend to
behave differently in two listings even before any buyer comes by.
As shown in Section 3, theory suggests that the negative effect of buyer protection on trust
could be driven by relatively more entry of strategic sellers and a greater likelihood to cheat
after entry. These two mechanisms correspond to across- and within-seller variations, but with
a caveat: our theory focuses on one market and all predictions are derived from comparative
statics; in the real data, after a seller enters Eachnet, he can choose which category to list in
and therefore there could be category-specific entry and exit within a seller. Statistically, these
category-specific entry and exit contribute to within-seller variations rather than cross-seller
variations.
To empirically examine cross- or within-seller variations, we rerun the positive feedback
regression with seller fixed effects, and report the new results in the first two columns of Table 7.
To save space, we only report the regression where buyer protection is calculated by predicted
price.26 Comparing Table 7 with Table 3, we find that the coefficients of buyer protection are
of the same sign and similar significance after we control for seller fixed effects, but their mag-
nitudes drop roughly 25% for both high- and low-value items. This suggests that the worsened
seller trustworthiness in response to buyer protection is driven by both cross- and within-seller
variations, but the within-seller variations are of greater importance.27
The last four columns of Table 7 report completion rate and price regressions with seller
fixed effects. Within the same seller, greater buyer protection is still found to be associated with a
significantly lower probability of sale and higher final price. This suggests that buyers anticipate
the same seller to become more strategic in face of greater buyer protection, and therefore are
more reluctant to complete the transaction.
Results with and without seller fixed effects reveal some interesting patterns regarding seller
reputation. Without seller fixed effects, Tables 3, 4 and 5 show that seller reputation predicted
better seller feedback and higher probability of sale in regime 0, but these indicative effects
were weakened after Eachnet introduced buyer protection and warning. When we add seller
fixed effects (Table 7), the coefficient of log seller score is no longer positive for seller positive
feedback, and its interactions with after-buyer-protection dummy and after-warning dummy
remain negative. Similarly, the coefficient of log seller score in the completion regression, though26Defining buyer protection by final or buy-it-now price yields similar results.27We can re-examine seller negative feedback and seller warning with seller fixed effects as well, but seller
warnings have few within-seller variations by definition (Eachnet blocks a user’s access if he/she has more than
three Eachnet warnings), and seller negative feedback is a rare event thus not many within-seller variations either.
24

still positive, is much smaller and sometimes even insignificant if the regression includes seller
fixed effects. These coefficient estimates suggest that the positive correlations between better
seller reputation, better seller behavior, and higher completion rate are mostly driven by cross-
seller variations. While reputation may help distinguish good and bad sellers cross-sectionally,
having a better reputation does not necessarily motivate the same seller to behave better. More
puzzling is the effect of reputation variables on final price. Regardless of whether or not we control
for seller fixed effects, log seller score does not link with higher price until Eachnet introduced
buyer protection or warning. One possible explanation is that buyer protection motivates the
same seller to behave more strategically in terms of pushing for higher transaction price but not
to behave as well as before in delivery and other services.
So far we have demonstrated some distinctions between cross- and within-seller variations.
How do they contribute to market-wide changes in response to buyer protection?
At the market-month level, we rerun equation (9), but instead of using market size as the
dependent variable, we focus on seller composition as measured by (1) fraction of new sellers in
category k at month t where new is defined as appearing in our whole analysis sample of Eachnet
for less than 30 days as of the time of listing, (2) fraction of sellers that are new to category k
at month t but have existed on Eachnet for more than 30 days, (3) log of average seller score for
all unique listings that appeared in category k at month t, (4) fraction of sellers with missing
seller scores at the time of listing, and (5) fraction of sellers with missing, negative, and zero
seller scores at the time of listing. The results reported in Table 8 suggest that greater buyer
protection in a category does not change the fraction of new sellers in that category but attracts
more existing sellers to enter that category. The log of average seller score is found to increase
with buyer protection, while the fraction of sellers with missing, negative and zero seller scores
decreases with buyer protection. These findings are consistent with each other, because existing
sellers typically have better reputation than new sellers.
The last three columns of Table 8 associate buyer protection of a category with the average
seller feedback and warning outcomes from that category. It turns out that greater buyer pro-
tection is associated with no significant improvement in seller positive feedback, no significant
change in Eachnet warnings, and somewhat less negative feedback.
These market-wide changes can be explained by a combination of cross- and within-seller
variations. On one hand, greater buyer protection in a category attracts existing sellers to enter
this category, which increases the average seller reputation in that category. Cross-sectionally,
better seller reputation should imply better seller behavior. On the other hand, buyer protection
has motivated the same sellers to behave more strategically and therefore counteract the former
effect.
25

Above all, empirical results suggest that, although the negative effects of buyer protection
on seller trustworthiness are related to both cross- and within-seller variations, they are more
likely driven by within-seller variations. Market-wide, greater buyer protection leads to more
existing sellers entering into a category and on average better seller reputation in that category.
However, buyer protection still hinders market expansion because the same sellers become more
strategic in response to buyer protection and buyers expect less seller trustworthiness accordingly.
6 Conclusion
A growing body of literature has emphasized the importance of trust. It is equally, if not more,
important to ask how to enhance trust. In rational expectation models, trusting is always equal to
trustworthiness. However, a policy that targets buyer trusting can have unintended consequences
and eventually hurt equilibrium trust and market development. We demonstrate this possibility
in a simple model and find confirming evidence from the early age of Eachnet.com. Our results
imply that promoting market size in under-developed economies requires more than trying to
increase the trusting level in the society. Building institutions (especially a well functioning legal
system) to ensure seller trustworthiness is fundamental.
If buyer protection alone does not boost trust, can buyer protection help build trust if it
is used in combination with greater penalties on cheating sellers? One example along this line
is lemon law: a cheating seller is required to reimburse the buyer under the lemon law, which
implies that the seller faces a penalty equal to the transaction price if he cheats, while the buyer
enjoys full protection. When the legal cost of enforcing the law is small relative to product value
(e.g., for automobiles), this law can be effective in restoring trust in the marketplace. Eachnet’s
buyer protection program is different from lemon law because it is the market platform, not
the seller, that reimburses the buyer. At first glance, platform reimbursement may ensure fast
reimbursement and therefore encourage buyers to trust the market. However, our analysis shows
that it does not work well in trust building because it does not punish cheating sellers directly.
In fact, it attracts strategic sellers to take advantage of buyer protection, which eventually hurts
trust and market development. How to design an optimal combination of buyer protection and
cheating penalty by incorporating enforcement costs deserves future research.
References
[1] Aghion, Philippe, Yann Algan, Pierre Cahuc, and Andrei Shleifer, 2010, “Regulation and
Distrust.” Quarterly Journal of Economics 125(3): 1015-1049.
26

[2] A’Hearn, Brian, 2000, “Could Southern Italians Cooperate? Banche Popolari in the Mezzo-
giorno,” Journal of Economic History 60(1): 67-93.
[3] Alesina, Alberto, and Eliana La Ferrara, 2002, “Who Trusts Others?” Journal of Public
Economics 85(2):207-34.
[4] Algan, Yann, and Pierre Cahuc, 2010, “Inherited Trust and Growth.” American Economic
Review 100(5):2060-2092.
[5] Arrow, Kenneth, 1972, “Gifts and Exchanges,” Philosophy and Public Affairs 1: 343-362.
[6] Barr, Abigail, 2003, “Trust and Expected Trustworthiness: Experimental Evidence from
Zimbabwean Villages, ” Economic Journal 113(489): 614-630.
[7] Bajari, Patrick, and Ali Hortacsu, 2004, “Economic Insights from Internet Auctions,” Jour-
nal of Economic Literature 42(2): 457-486.
[8] Bolton, Gary E., Elena Katok and Axel Ockenfels, 2004, “How effective are online reputation
mechanisms? An experimental study, ” Management Science 50(11): 1587-1602.
[9] Bohnet, Iris, and Steffen Huck, 2004, “Repetition and Reputation: Implications for Trust
and Trustworthiness When Institutions Change,” American Economic Review 94(2): 362-
366.
[10] Buchan, Nancy and Rachel Croson, 2004, “The Boundaries of Trust: Own and Others
Actions in the US and China,” Journal of Economic Behavior and Organization 55: 485-
504.
[11] Cabral, Luis and Ali Hortacsu, 2010, “Dynamics of Seller Reputation: Theory and Evidence
from eBay,” Journal of Industrial Economics, 58(1), March 2010.
[12] Dellarocus, Chrysanthos, 2003, “The Digitization of Word-of-Mouth: Promise and Chal-
lenges of Online Feedback Mechanisms,” Management Science 49(10): 1407-1424.
[13] Fukuyama, Francis, 1995, Trust. New York: Free Press.
[14] Glaeser, Edward L., David I. Laibson, Jose A. Scheinkman and Christine L. Soutter, 2000,
“Measuring Trust,” Quarterly Journal of Economics 115 (3): 811-846.
[15] Greif, Avner, 1993, “Contract Enforceability and Economic Institutions in Early Trade: The
Maghribi Traders,” American Economic Review 83(3): 525-548.
27
[16] Guiso, Luigi, Paola Sapienza and Luigi Zingales, 2004, “The Role of Social Capital in Fi-
nancial Development,” American Economic Review 94(3): 526-556.
[17] ——, 2006, “Dose Culture Affect Economic Outcomes” Journal of Economic Perspectives
20(2):23-48.
[18] ——, 2008, “Alfred Marshall Lecture: Social Capital as Good Culture.” Journal of the
European Economic Association 6(2-3):295-320.
[19] Jin, Ginger Z. and Andrew Kato, 2006, “Price, Quality and Reputation: Evidence From An
Online Field Experiment,” RAND Journal of Economics 37(4): 983-1005.
[20] Karlan, Dean, 2005, “Using Experimental Economics to Measure Social Capital and Predict
Financial Decisions,” American Economic Review 95(5): 1688-1699.
[21] Klein, Benjamin and Keith Leffler, 1981, “The Role of Market Forces in Assuring Contractual
Performance” Journal of Political Economy, 89(4), 615-641.
[22] Knack, Stephen, and Philip Keefer, 1997, “Does Social Capital Have an Economic Payoff?
A Cross-Country Investigation,” Quarterly Journal of Economics 112(4): 1251-1288.
[23] La Porta, Rafael, Florencio Lopez-de-Silanes, Andrei Shleifer, and Robert Vishny, 1997,
“Trust in Large Organizations.”” American Economic Literature 46(2): 285-332.
[24] Putnam, Robert, 1993, Making Democracy Work: Civic Traditions in Modern Italy. Prince-
ton, NJ: Princeton University Press.
[25] Resnick, Paul and Richard Zeckhauser, 2002, “Trust Among Strangers in Internet Transac-
tions: Empirical Analysis of eBay’s Reputation System,” In the Economics of the Internet
and e-Commerce, M.R. Baye, Ed. Advances in Applied Microeconomics, vol. 11. Elsevier
Science, Amsterdam, 127-157.
[26] Roberts, James, 2011, “Can Warranties Substitute for Reputations? ” American Economic
Journal:Microeconomics, 3(3): 69-85.
[27] Shapiro, Carl, 1982, “Consumer Information, Product Quality and Seller Reputation,” Bell
Journal of Economics, XIII (1982), 20-35.
[28] Tabellini, Guido, 2010, “Culture and Institutions: Economic Development in the Regions of
Europe.” Journal of the European Economic Association 8(4): 677-716.
[29] Zak, Paul J., and Stephen Knack, 2001, “Trust and Growth.” Economic Journal 111(470):
295-321.
28
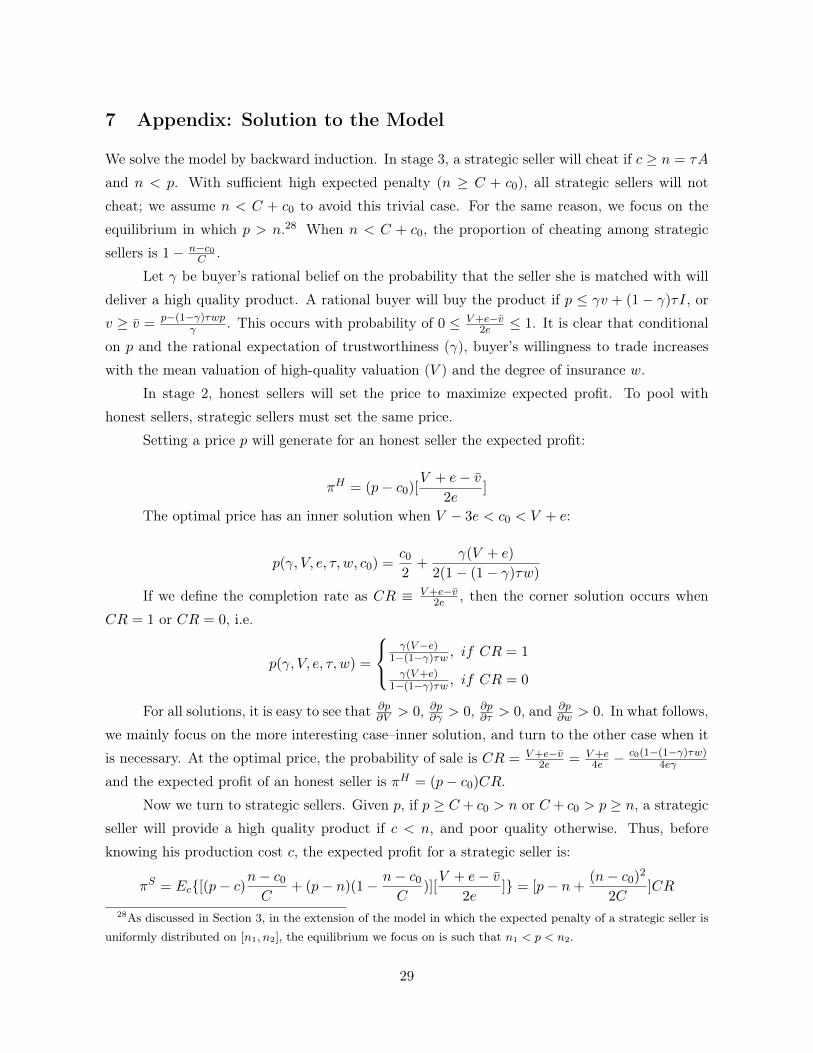
7 Appendix: Solution to the Model
We solve the model by backward induction. In stage 3, a strategic seller will cheat if c ≥ n = τA
and n < p. With sufficient high expected penalty (n ≥ C + c0), all strategic sellers will not
cheat; we assume n < C + c0 to avoid this trivial case. For the same reason, we focus on the
equilibrium in which p > n.28 When n < C + c0, the proportion of cheating among strategic
sellers is 1− n−c0C .
Let γ be buyer’s rational belief on the probability that the seller she is matched with will
deliver a high quality product. A rational buyer will buy the product if p ≤ γv + (1− γ)τI, or
v ≥ v̄ = p−(1−γ)τwpγ . This occurs with probability of 0 ≤ V+e−v̄
2e ≤ 1. It is clear that conditional
on p and the rational expectation of trustworthiness (γ), buyer’s willingness to trade increases
with the mean valuation of high-quality valuation (V ) and the degree of insurance w.
In stage 2, honest sellers will set the price to maximize expected profit. To pool with
honest sellers, strategic sellers must set the same price.
Setting a price p will generate for an honest seller the expected profit:
πH = (p− c0)[V + e− v̄
2e]
The optimal price has an inner solution when V − 3e < c0 < V + e:
p(γ, V, e, τ, w, c0) =c0
2+
γ(V + e)
2(1− (1− γ)τw)
If we define the completion rate as CR ≡ V+e−v̄2e , then the corner solution occurs when
CR = 1 or CR = 0, i.e.
p(γ, V, e, τ, w) =
γ(V−e)
1−(1−γ)τw , if CR = 1
γ(V+e)1−(1−γ)τw , if CR = 0
For all solutions, it is easy to see that ∂p∂V > 0, ∂p∂γ > 0, ∂p∂τ > 0, and ∂p
∂w > 0. In what follows,
we mainly focus on the more interesting case–inner solution, and turn to the other case when it
is necessary. At the optimal price, the probability of sale is CR = V+e−v̄2e = V+e
4e −c0(1−(1−γ)τw)
4eγ
and the expected profit of an honest seller is πH = (p− c0)CR.
Now we turn to strategic sellers. Given p, if p ≥ C + c0 > n or C + c0 > p ≥ n, a strategic
seller will provide a high quality product if c < n, and poor quality otherwise. Thus, before
knowing his production cost c, the expected profit for a strategic seller is:
πS = Ec{[(p− c)n− c0
C+ (p− n)(1− n− c0
C)][V + e− v̄
2e]} = [p− n+
(n− c0)2
2C]CR
28As discussed in Section 3, in the extension of the model in which the expected penalty of a strategic seller is
uniformly distributed on [n1, n2], the equilibrium we focus on is such that n1 < p < n2.
29

If C + c0 > n ≥ p, a strategic seller will not provide low quality because the expected
penalty n is greater than the price; he will provide high quality as long as his production cost c
is below p. Thus, before knowing c, his expected profit will be
πSH = Ec{(p− c)[V + e− v̄
2e]} =
(p− c0)CR
2
and the strategic seller will not enter unless πSH ≥ k. In other words, when C + c0 > n ≥ p, allthe strategic traders who choose to enter the market provide high quality products. Consistently,
buyers hold the belief of γ = 1 which leads to p = (V + e + c0)/2. This case is less interesting,
so we rule it out by assuming V + e+ c0 > 2n.
In stage 1, a seller makes his entry decision by comparing the expected profit πS(or πH)
and his entry cost k. Strategic sellers will enter the market with probability ρ = πS
K . The
entry probability of honest sellers is φ = πH
K . To ensure ρ ≤ 1 and φ ≤ 1, we assume that
K ≥ (V+e−c0)2
8e . Accordingly, rational buyers should believe that the probability of getting a
high quality product is γ =αφ+(1−α)ρ
n−c0C
αφ+(1−α)ρ . Rearranging terms, we get
1
1− γ=
α[(n− c0)− (n−c0)2
2C ]
(1− α)(1− n−c0C )[p− n+ (n−c0)2
2C ]+
1
(1− α)(1− n−c0C )
Equations (1) and (2) jointly define p and γ. These two curves determine a unique equi-
librium because at γ = 1, the endpoint of curve (1) at p = (V + e + c0)/2 is greater than the
endpoint of curve (2) at p = n− (n−c0)2
2C by our assumption V + e+ c0 > 2n.
The comparative statics results of Propositions 1 and 3 follow easily from examining
changes in the two curves.
Proof of Proposition 2:
we aim to prove ∂2γ∂V ∂w > 0. We first define the relative ratio of honest seller to strategic
seller: R = α(p−c0)
(1−α)[p−n− (n−c0)2
2C]. It can be easily shown that R is decreasing with p and increasing
with n. Then buyers’ belief curve (2) can be written as a function of R:
γ =αφ+ (1− α)ρn−c0C
αφ+ (1− α)ρ= 1−
1− n̂C
1 +R(10)
where n̂ = n− c0. From the above equation (10), we may get ∂γ∂V = (1− n̂
C ) 1(1+R)2
∂R∂p
∂p∂V . Then,
∂2γ
∂V ∂w= (1− n̂
C){ −2
(1 +R)3(∂R
∂p)2 ∂p
∂V+
−2
(1 +R)2
α
(1− α)
(n− c0 − n̂2
2C )
[p− n− n̂2
2C ]3∂p
∂w
∂p
∂V+
1
(1 +R)2
∂R
∂p
∂2p
∂V ∂w}
Given ∂R∂p < 0, ∂p∂V > 0, ∂p∂w > 0 and ∂2p
∂V ∂w > 0, then we could get ∂2γ∂V ∂w > 0
Simulation of Proposition 5:
30

Simulation results help us find some possible parameters29 with which buyer protection(w)
may negatively affect completion rate as well as market size. The below two figures prove our
arguments.
29We set up parameters as follows: α = 0.55, V = 2, e = 1.6, c0 = 0.1, τ = 0.4, C = 4,K = 5, A = 6.8.
31

32
Figure 1: Equilibrium and Comparative Statics: Baseline Model
Figure 2: Comparative Statics for the Mean of Buyer Valuation (V)
p
γ 0 1
(2) (1')
(1)
p
γ
0 1
(2') (2) (1')
(1)

33
Figure 3: Seller Positive Feedback by Buyer Protection Regime
Note: The two vertical lines correspond to the first month of Regime 1 (October 2001) and the first
month of Regime 2 (September 2002).
Figure 4: Seller Negative Feedback by Buyer Protection Regime
Note: The two vertical lines correspond to the first month of Regime 1 (October 2001) and the first
month of Regime 2 (September 2002).

34
Figure 5: Seller Warning by Buyer Protection Regime
Note: The vertical line corresponds to the first month of Regime 2 (September 2002).
Table 1: Percentage of the Price Covered by Buyer Protection
Transaction Price (RMB) Regime 0
05/2001-09/2001
Regime 1
10/2001-08/2002
Regime 2
09/2002-03/2003
(0,100] 0% 100% 0%
(100,1100] 0% 100%
(1100,3000] 0% 100%
above 3000 0%

35
Table 2: Summary Statistics
Regime 0 Regime 1 Regime 2
6/01-9/01 10/01-8/02 9/02-3/03
mean(median) mean(median) mean(median)
# of calendar months 4 11 7
# of records 78116 574804 917414
# of unique listings 76253 490153 725496
# of unique listings per month 19063 44559 103642
# of unique sellers 11259 38432 47558
Summary per unique listing
% with fixed p 51.48% 74.01% 85.67%
fixed p | have fixed p 951.52 (150) 581.32 (128) 404.70 (100)
% with reservation price 49.56% 36.80% 25.61%
reservation price | have reservation p 1143.78 (250) 791.70 (185) 661.84 (180)
% allow auction 100% 95.56% 88.93%
starting price of auction | allow auction 756.28 (100) 335.27(68) 243.47 (50)
% have picture 39.99% 77.70% 86.31%
% have bold font 35.28% 12.46% 10.54%
condition of item - new1 0.00% 0.00% 0.00%
condition of item - new2 60.44% 76.46% 82.82%
condition of item - new3 31.34% 18.93% 13.32%
condition of item - new4 5.45% 2.60% 1.78%
condition of item - new5 2.56% 1.82% 1.88%
condition of item - new6 0.22% 0.18% 0.20%
# of items listed in the same listing 1.89 3.29 2.67
with>=2 items listed in the same listing? 7.19% 21.95% 30.83%
With >=100 items listed in the same listing? 0.49% 1.69% 0.66%
seller age(days since registration) 111.40 218.82 274.88
# of completed listings by t 35.43 159.15 243.67
% seller score missing 58.98% 27.45% 25.48%
% seller score = 0 2.68% 1.24% 0.33%
% seller score < 0 4.07% 0.98% 0.19%
seller score | have score 7.94 72.15 125.62
seller score is fishy (i.e. missing, negative or zero) 65.73% 29.66% 26.00%
Seller’s last listing is more than 1 month ago 13.63% 5.31% 4.20%
Competition per 1000 view count 19.78 5.18 4.18
=1 if Competition>=50 10.08% 0.32% 0.12%
% of listings with at least one completion 35.44% 55.22% 54.42%

36
Table 2 Continued: Summary Statistics
Regime 0 Regime 1 Regime 2
6/01-9/01 10/01-8/02 9/02-3/03
mean(median) mean(median) mean(median)
Conditional on completion, summary per transaction
# of completed transactions 27363 355317 586659
% completion by auction 62.03% 47.94% 38.12%
final price 673.33 (150) 424.35 (90) 270.77 (60)
% of final price protected by Eachnet 0% 99.04% 19.58%
buyer age(days since registration)|completion 85.57 155.95 170.66
% with any seller feedback 45.08% 64.85% 57.35%
% seller receiving positive feedback 32.68% 56.95% 53.32%
% seller receiving negative feedback 4.84% 3.13% 1.51%
% with seller warning(after 2/02 only)
0.88% 1.53%
same region 59.73% 44.66% 35.43%
Note: Competition is defined as the number of listings (in the most detailed product category) in the past
7 days per 1000 view count.
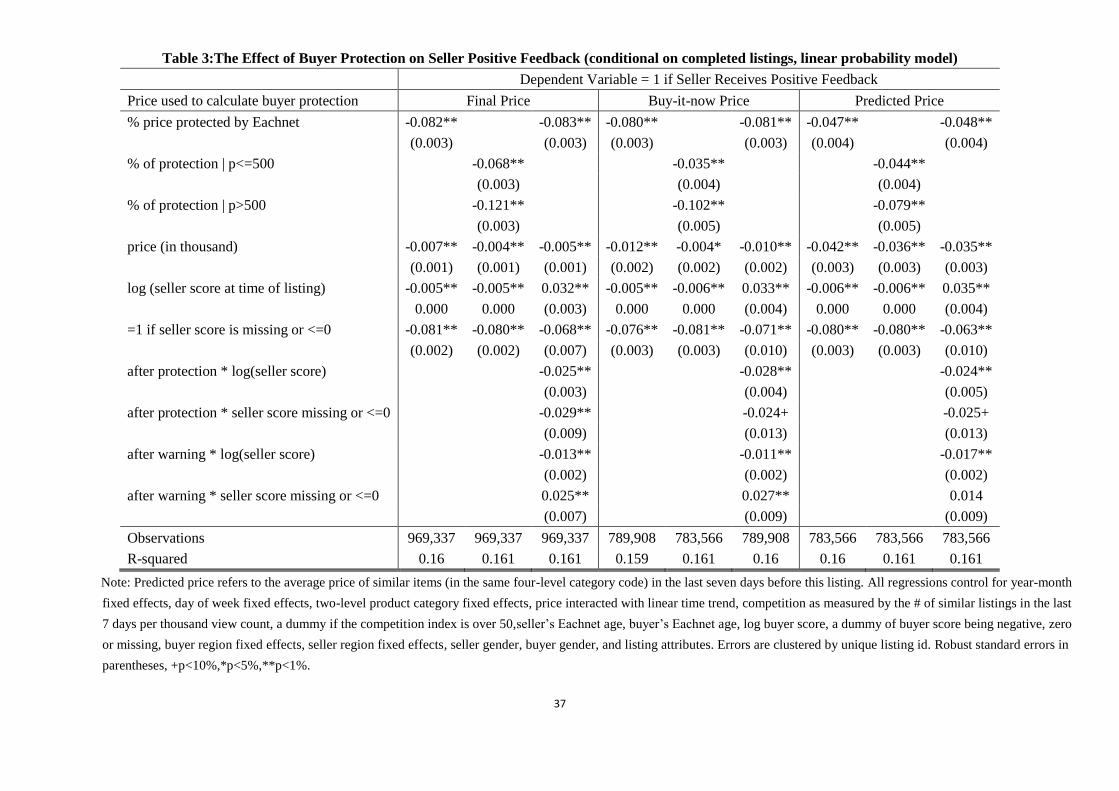
37
Table 3:The Effect of Buyer Protection on Seller Positive Feedback (conditional on completed listings, linear probability model)
Dependent Variable = 1 if Seller Receives Positive Feedback
Price used to calculate buyer protection Final Price Buy-it-now Price Predicted Price
% price protected by Eachnet -0.082**
-0.083** -0.080**
-0.081** -0.047**
-0.048**
(0.003)
(0.003) (0.003)
(0.003) (0.004)
(0.004)
% of protection | p<=500 -0.068**
-0.035**
-0.044**
(0.003)
(0.004)
(0.004)
% of protection | p>500 -0.121**
-0.102**
-0.079**
(0.003)
(0.005)
(0.005)
price (in thousand) -0.007** -0.004** -0.005** -0.012** -0.004* -0.010** -0.042** -0.036** -0.035**
(0.001) (0.001) (0.001) (0.002) (0.002) (0.002) (0.003) (0.003) (0.003)
log (seller score at time of listing) -0.005** -0.005** 0.032** -0.005** -0.006** 0.033** -0.006** -0.006** 0.035**
0.000 0.000 (0.003) 0.000 0.000 (0.004) 0.000 0.000 (0.004)
=1 if seller score is missing or <=0 -0.081** -0.080** -0.068** -0.076** -0.081** -0.071** -0.080** -0.080** -0.063**
(0.002) (0.002) (0.007) (0.003) (0.003) (0.010) (0.003) (0.003) (0.010)
after protection * log(seller score)
-0.025**
-0.028**
-0.024**
(0.003)
(0.004)
(0.005)
after protection * seller score missing or <=0
-0.029**
-0.024+
-0.025+
(0.009)
(0.013)
(0.013)
after warning * log(seller score)
-0.013**
-0.011**
-0.017**
(0.002)
(0.002)
(0.002)
after warning * seller score missing or <=0
0.025**
0.027**
0.014
(0.007)
(0.009)
(0.009)
Observations 969,337 969,337 969,337 789,908 783,566 789,908 783,566 783,566 783,566
R-squared 0.16 0.161 0.161 0.159 0.161 0.16 0.16 0.161 0.161
Note: Predicted price refers to the average price of similar items (in the same four-level category code) in the last seven days before this listing. All regressions control for year-month
fixed effects, day of week fixed effects, two-level product category fixed effects, price interacted with linear time trend, competition as measured by the # of similar listings in the last
7 days per thousand view count, a dummy if the competition index is over 50,seller’s Eachnet age, buyer’s Eachnet age, log buyer score, a dummy of buyer score being negative, zero
or missing, buyer region fixed effects, seller region fixed effects, seller gender, buyer gender, and listing attributes. Errors are clustered by unique listing id. Robust standard errors in
parentheses, +p<10%,*p<5%,**p<1%.

38
Table 4: The Effect of Buyer Protection on Seller Negative Feedback and Warning (conditional on completed listings, linear probability model)
Seller Receives Negative Feedback Seller Receives Eachnet Warning
Price used to calculate buyer protection Final price Buy-it-now price predicted price Final price Buy-it-now price predicted price
% price protected by Eachnet 0.003** 0.003** 0.004** 0.005** -0.004** -0.004** 0.002** 0.005** 0.005**
(0.001) (0.001) (0.001) (0.001) (0.001) (0.001) (0.001) (0.001) (0.001)
price (in thousand) 0.001* 0.001 0.003** 0.003** 0.011** 0.011** -0.002** -0.002** -0.004**
0.000 0.000 (0.001) (0.001) (0.001) (0.001) (0.001) (0.001) (0.001)
log (seller score at time of listing) -0.003** -0.007** -0.002** -0.005** -0.003** -0.007** -0.002** -0.002** -0.002**
0.000 (0.001) 0.000 (0.001) 0.000 (0.002) 0.000 0.000 0.000
=1 if seller score is missing or <=0 0.011** 0.007* 0.010** 0.012* 0.010** 0.001 0.011** 0.010** 0.012**
(0.001) (0.004) (0.001) (0.005) (0.001) (0.006) (0.001) (0.001) (0.001)
after protection * log(seller score)
0.000
-0.001
0.001
(0.001)
(0.002)
(0.002)
after protection * seller score missing or <=0
0.008+
0.004
0.015*
(0.005)
(0.006)
(0.007)
after warning * log(seller score)
0.005**
0.004**
0.003**
(0.001)
(0.001)
(0.001)
after warning * seller score missing or <=0
-0.006+
-0.006
-0.006
(0.003)
(0.004)
(0.005)
Observations 969,337 969,337 789,908 789,908 783,566 783,566 890,288 741,868 739,398
R-squared 0.015 0.015 0.014 0.014 0.015 0.015 0.011 0.01 0.011
Note: Predicted price refers to the average price of similar items (in the same four-level category code) in the last seven days before this listing. All regressions control for
year-month fixed effects, day of week fixed effects, two-level product category fixed effects, price interacted with linear time trend, competition as measured by the # of similar
listings in the last 7 days per thousand view count, a dummy if the competition index is over 50,seller’s Eachnet age, buyer’s Eachnet age, log buyer score, a dummy of buyer
score being negative, zero or missing, buyer region fixed effects, seller region fixed effects, seller gender, buyer gender, and listing attributes. Errors are clustered by unique
listing id. Robust standard errors in parentheses, +p<10%,*p<5%,**p<1%.

39
Table 5: The Effect of Buyer Protection on Completion Rate and Price
Completed log (final price)
% predicted price protected by Eachnet -0.004+ -0.006* 0.561** 0.574**
(0.003) (0.003) (0.026) (0.026)
Predicted price (in thousand) 0.442** 0.058
(0.070) (0.071)
log (seller score at time of listing) 0.019** 0.046** 0.075** -0.130**
(0.000) (0.003) (0.003) (0.017)
=1 if seller score is missing or <=0 -0.422** -0.195** 0.304** -0.085+
(0.001) (0.008) (0.018) (0.049)
after protection * log(seller score) -0.013**
0.095**
(0.004)
(0.018)
after protection * seller score missing or <=0 -0.085**
0.298**
(0.010)
(0.057)
after warning * log(seller score) -0.017**
0.114**
(0.002)
(0.007)
after warning * seller score missing or <=0 -0.166**
0.089*
(0.006)
(0.036)
Observations 985,265 985,265 783,566 783,566
R-squared 0.28 0.282 0.44 0.44
Note: A listing is defined completed if the listing leads to at least one completed transaction. Predicted price
refers to the average final price of similar items (in the same level-four category) completed in the last seven
days before the study listing. All regressions control for year-month fixed effects, day of week fixed effects,
product category fixed effects, seller’s Eachnet age,, seller region fixed effects, seller gender, listing attributes,
predicted price, # of months since June 2001*predicted price, competition measured by # of similar listings in
last 7 days per thousand view count, and a dummy =1 if the competition measure is over 50. Robust standard
errors in parentheses. In price regressions, errors are clustered by unique listing id. +p<10%,*p<5%,**p<1%.

40
Table 6: The Effect of Buyer Protection on Market Size
log (total # of
listings)
log (total # of
listed items)
log (total # of
unique sellers)
(1) (2) (3)
Panel A: Conditional on 116 categories that existed at the start of sample (June 2001)
% protected (calculated by ) -0.699** -0.855** -0.705**
(0.184) (0.222) (0.155)
Observations 2,416 2,416 2,416
R-squared 0.887 0.821 0.907
Panel B: Full Sample
% protected (calculated by ) -0.602** -0.812** -0.617**
(0.179) (0.220) (0.151)
Observations 2,797 2,797 2,797
R-squared 0.89 0.821 0.91
Note: Robust standard errors in parentheses, errors clustered by two-level product category, **
p<0.01, * p<0.05, + p<0.1. stands for the average transaction price of category k in the first
month that k appeared in our analysis sample. All regressions control for product category
fixed effects, year-month fixed effects, Aftwarning* , and t* , where t is defined as
number of calendar months since June 2001.

41
Table 7: Results with Seller Fixed Effects (Linear Probability Model)
Dependent Variable Seller Positive Feedback Completed log (final price)
% predicted price protected by Eachnet -0.040**
-0.039** -0.010** -0.011**
(0.003)
0.546** 0.548**
(0.022)
(0.004)
(0.004) (0.003) (0.022)
% of protection | predicted p<=500
-0.038**
(0.004)
% of protection | predicted p>500
-0.058**
(0.005)
Predicted price (in thousand) -0.022** -0.018** -0.017** -0.011 -0.019
(0.085)
0.004
(0.004)
-0.113**
(0.009)
0.007+
(0.004)
-0.011
(0.011)
-0.011**
(0.002)
-0.049**
(0.007)
(0.004) (0.004) (0.004) (0.085)
log (seller score at time of listing) -0.047** -0.047** -0.015** 0.001+ 0.093** -0.023
(0.015)
-0.132**
(0.046)
0.047**
(0.015)
0.184**
(0.053)
0.073**
(0.007)
0.060+
(0.032)
(0.001) (0.001) (0.005) (0.001) (0.005)
=1 if seller score is missing or <=0 0.024** 0.024** 0.009 -0.164** 0.114**
(0.004) (0.004) (0.014) (0.003) (0.014)
after protection * log(seller score)
-0.009+
(0.005)
after protection * seller score missing or <=0
-0.004
(0.017)
after warning * log(seller score)
-0.024**
(0.002)
after warning * seller score missing or <=0
0.033**
(0.011)
Observations 783,566 783,566 783,566 985,265 985,265
0.548
783,566 783,566
0.657 R-squared 0.269 0.269 0.27 0.548 0.657
Note: A listing is defined completed if the listing leads to at least one completed transaction. Predicted price refers to the average price of similar items (in the same four-level
category code) in the last seven days before this listing. All regressions control for seller fixed effects, year-month fixed effects, day of week fixed effects, two-level product
category fixed effects, competition as measured by the # of similar listings in the last 7 days per thousand view count, a dummy if the competition index is over 50,seller’s Eachnet
age,and listing attributes. Feedback and completion regressions control for price interacted with linear time trend. Feedback regressions control for buyer’s Eachnet age, log buyer
score, a dummy of buyer score being negative, zero or missing, buyer region fixed effects, and buyer gender. In feedback and price regressions, errors are clustered by unique
listing id. Robust standard errors in parentheses, +p<10%,*p<5%,**p<1%.

42
Table 8: The Effect of Buyer Protection on Market Composition
Fraction
of new
sellers
Fraction
of
sellers
old in
Eachnet
but new
to this
category
log
(average
seller
score)
Fraction
of seller
score
being
missing
Fraction
of seller
score
being
negative,
missing or
zero
Fraction of
transactions
with
positive
seller
feedback
Fraction of
transactions
with
negative
seller
feedback
Fraction of
transactions
with seller
warning
(4) (6) (10) (12) (11) (7) (8) (9)
%protected (calculated by ) 0.006 0.041* 0.394** -0.073** -0.091** 0.012 -0.010** 0.004
(0.018) (0.016) (0.133) (0.023) (0.023) (0.017) (0.002) (0.004)
Observations 2,416 2,416 2,343 2,416 2,416 2,416 2,416 1,594
R-squared 0.462 0.295 0.806 0.588 0.617 0.510 0.208 0.174
%protected (calculated by ) 0.001 0.038* 0.361** -0.067** -0.084** 0.021 -0.013** 0.002
(0.017) (0.016) (0.126) (0.022) (0.022) (0.017) (0.005) (0.004)
Observations 2,797 2,797 2,716 2,797 2,797 2,797 2,797 1,940
R-squared 0.462 0.326 0.799 0.577 0.604 0.502 0.183 0.167
Note: Robust standard errors in parentheses, errors clustered by two-level product category, ** p<0.01, * p<0.05, + p<0.1. stands for the average
transaction price of category k in the first month that k appeared in our analysis sample. All regressions control for product category fixed effects, year-month
fixed effects, Aftwarning* , and t* , where t is defined as number of calendar months since June 2001.

43
Appendix Table: Summary Statistics (conditional on predicted price is not missing)
Regime 0 Regime 1 Regime 2
6/01-9/01 10/01-8/02 9/02-3/03
mean(median) mean(median) mean(median)
# of calendar months 4 11 7
# of records 31523 429561 762907
# of unique listings 30759 361152 593354
# of unique listings per month 4394 32832 84765
# of unique sellers 5905 31142 42286
Summary per unique listing
% with fixed p 51.37% 75.51% 86.04%
fixed p | have fixed p 1104.35 (220) 561.58 (130) 363.97 (100)
% with reservation price 49.92% 37.02% 25.46%
reservation price | have reservation p 1278.77 (360) 765.28 (200) 593.91 (180)
% allow auction 100% 95.89% 88.92%
starting price of auction | allow auction 822.02 (100) 303.49 (68) 212.61 (53)
% have picture 41.37% 79.41% 86.62%
% have bold font 39.06% 12.76% 10.66%
condition of item - new1 0.00% 0.00% 0.00%
condition of item - new2 55.03% 77.08% 83.48%
condition of item - new3 36.32% 18.93% 13.10%
condition of item - new4 6.35% 2.51% 1.65%
condition of item - new5 2.13% 1.30% 1.59%
condition of item - new6 0.18% 0.17% 0.19%
# of items listed in the same listing 1.56 3.02 2.67
with>=2 items listed in the same listing? 5.47% 22.39% 32.07%
With >=100 items listed in the same listing? 0.24% 1.43% 0.62%
seller age(days since registration) 115.36 223.67 273.49
# of completed listings by t 49.76 179.25 259.14
% seller score missing 49.29% 24.97% 24.51%
% seller score = 0 3.22% 1.13% 0.32%
% seller score < 0 6.13% 0.91% 0.20%
seller score | have score 9.63 78.23 131.10
seller score is fishy (i.e. missing, negative or zero) 58.64% 27.01% 25.04%
Seller’s last listing is more than 1 month ago 12.14% 4.77% 4.03%
Competition per 1000 view count 12.69 4.36 3.77
=1 if Competition>=50 4.11% 0.15% 0.00%
% of listings with at least one completion 39.14% 56.95% 55.14%

44
Appendix Table continued: Summary Statistics (conditional on predicted price is not missing)
Regime 0 Regime 1 Regime 2
6/01-9/01 10/01-8/02 9/02-3/03
mean(median) mean(median) mean(median)
Conditional on completion, summary per transaction
# of completed transactions 12802 274099 496665
% completion by auction 60.90% 47.15% 37.53%
final price 806.65 (200) 431.18 (96) 251.89 (63)
% of final price protected by Eachnet 0% 99.02% 19.90%
buyer age(days since registration)|completion 88.52 155.95 169.24
% with any seller feedback 44.91% 64.96% 57.01%
% seller receiving positive feedback 33.33% 57.20% 52.90%
% seller receiving negative feedback 5.07% 3.10% 1.53%
% with seller warning(after 2/02 only)
0.89% 1.54%
same region 57.89% 43.76% 35.11%
Note: Competition is defined as the number of listings (in the most detailed product category) in the past 7 days per 1000 view
count.