Navigating middle grades: role of social contexts in middle grade school climate
18
ORIGINAL ARTICLE Navigating Middle Grades: Role of Social Contexts in Middle Grade School Climate Ha Yeon Kim • Kate Schwartz • Elise Cappella • Edward Seidman Published online: 16 May 2014 Ó Society for Community Research and Action 2014 Abstract During early adolescence, most public school students undergo school transitions, and many students experience declines in academic performance and social- emotional well-being. Theories and empirical research have highlighted the importance of supportive school environments in promoting positive youth development during this period of transition. Despite this, little is known about the proximal social and developmental contexts of the range of middle grade public schools US students attend. Using a cross-sectional dataset from the eighth grade wave of the Early Childhood Longitudinal Study— Kindergarten Cohort 1998–1999, the current study exam- ines the middle grade school social context from the per- spectives of administrators and teachers in public schools with typical grade configurations (k–8 schools, middle schools, and junior high schools) and how it relates to students’ perceptions of school climate. We find that administrators and teachers in k–8 schools perceive a more positive school social context, controlling for school structural and demographic characteristics. This school social context, in turn, is associated with students’ per- ceptions of their schools’ social and academic climate. Implications for educational policy and practice are discussed. Keywords Middle grade schools Á School climate Á School transitions Á Adolescent development Á School reform Á Educational policy Introduction Early adolescence is a vulnerable period for both academic and social-emotional development (Eccles and Midgley 1989; Simmons and Blyth 1987). Many early adolescents experience declines in their academic performance (Barber and Olsen 2004), motivation (Maehr and Midgley 1996), and engagement (Archambault et al. 2009). Social-emo- tional struggles ensue during this period, including decreases in students’ sense of belonging in school (Maehr and Midgley 1996; Wang and Eccles 2012) and self-esteem (Archambault et al. 2010), as well as increases in anxiety, depression, and behavioral difficulties (Grills-Taquechel et al. 2010; Way et al. 2007). These struggles may be magnified when students are undergoing a transition to a new school during the early adolescent period (Eccles 2004; Eccles and Midgley 1989; Seidman et al. 2004). Ecological theories and empirical research have high- lighted the importance of supportive developmental social settings, such as family, classrooms, schools, and neigh- borhood community contexts, during early adolescence (Bronfenbrenner and Morris 2006; Cappella et al. 2013; Delany-Brumsey et al. 2014; Eccles and Midgley 1989; McCoy et al. 2013; Smith et al. 2013). In particular, researchers have focused on the central role of school social contexts in promoting positive youth adjustment and development (Centers for Disease Control and Prevention 2009; National Research Council 2004; Simmons and Blyth 1987; Trickett and Rowe 2012). Increasingly, evi- dence suggests that the middle grade school climate plays a significant role in young adolescents’ academic and social- emotional adjustment (Brand et al. 2003; Jia et al. 2009; Way et al. 2007). Despite growing interest in the social context of middle grade schools, and evidence for its influence on student adjustment, current understanding of H. Y. Kim (&) Á K. Schwartz Á E. Cappella Á E. Seidman Department of Applied Psychology, New York University, 246 Greene Street, New York, NY 10003, USA e-mail: [email protected] 123 Am J Community Psychol (2014) 54:28–45 DOI 10.1007/s10464-014-9659-x
Transcript of Navigating middle grades: role of social contexts in middle grade school climate

ORIGINAL ARTICLE
Navigating Middle Grades: Role of Social Contexts in MiddleGrade School Climate
Ha Yeon Kim • Kate Schwartz • Elise Cappella •
Edward Seidman
Published online: 16 May 2014
� Society for Community Research and Action 2014
Abstract During early adolescence, most public school
students undergo school transitions, and many students
experience declines in academic performance and social-
emotional well-being. Theories and empirical research
have highlighted the importance of supportive school
environments in promoting positive youth development
during this period of transition. Despite this, little is known
about the proximal social and developmental contexts of
the range of middle grade public schools US students
attend. Using a cross-sectional dataset from the eighth
grade wave of the Early Childhood Longitudinal Study—
Kindergarten Cohort 1998–1999, the current study exam-
ines the middle grade school social context from the per-
spectives of administrators and teachers in public schools
with typical grade configurations (k–8 schools, middle
schools, and junior high schools) and how it relates to
students’ perceptions of school climate. We find that
administrators and teachers in k–8 schools perceive a more
positive school social context, controlling for school
structural and demographic characteristics. This school
social context, in turn, is associated with students’ per-
ceptions of their schools’ social and academic climate.
Implications for educational policy and practice are
discussed.
Keywords Middle grade schools � School climate �School transitions � Adolescent development � School
reform � Educational policy
Introduction
Early adolescence is a vulnerable period for both academic
and social-emotional development (Eccles and Midgley
1989; Simmons and Blyth 1987). Many early adolescents
experience declines in their academic performance (Barber
and Olsen 2004), motivation (Maehr and Midgley 1996),
and engagement (Archambault et al. 2009). Social-emo-
tional struggles ensue during this period, including
decreases in students’ sense of belonging in school (Maehr
and Midgley 1996; Wang and Eccles 2012) and self-esteem
(Archambault et al. 2010), as well as increases in anxiety,
depression, and behavioral difficulties (Grills-Taquechel
et al. 2010; Way et al. 2007). These struggles may be
magnified when students are undergoing a transition to a
new school during the early adolescent period (Eccles
2004; Eccles and Midgley 1989; Seidman et al. 2004).
Ecological theories and empirical research have high-
lighted the importance of supportive developmental social
settings, such as family, classrooms, schools, and neigh-
borhood community contexts, during early adolescence
(Bronfenbrenner and Morris 2006; Cappella et al. 2013;
Delany-Brumsey et al. 2014; Eccles and Midgley 1989;
McCoy et al. 2013; Smith et al. 2013). In particular,
researchers have focused on the central role of school
social contexts in promoting positive youth adjustment and
development (Centers for Disease Control and Prevention
2009; National Research Council 2004; Simmons and
Blyth 1987; Trickett and Rowe 2012). Increasingly, evi-
dence suggests that the middle grade school climate plays a
significant role in young adolescents’ academic and social-
emotional adjustment (Brand et al. 2003; Jia et al. 2009;
Way et al. 2007). Despite growing interest in the social
context of middle grade schools, and evidence for its
influence on student adjustment, current understanding of
H. Y. Kim (&) � K. Schwartz � E. Cappella � E. Seidman
Department of Applied Psychology, New York University, 246
Greene Street, New York, NY 10003, USA
e-mail: [email protected]
123
Am J Community Psychol (2014) 54:28–45
DOI 10.1007/s10464-014-9659-x
middle grade school social context is limited in scope.
Most studies focus on students’ perception of school cli-
mate (e.g., Brand et al. 2003; Way et al. 2007) or the
structural characteristics of middle grade schools, particu-
larly around grade span configuration (e.g., Benner and
Graham 2009; Kieffer 2013). Far less consideration has
been given to other perspectives or dimensions of the
school social setting, such as administrators’ perception of
student conduct and teachers’ reports of stress and pro-
fessional climate. In addition, to our knowledge, no
empirical literature has examined school social context
across a national sample with grade spans typical of US
public middle grade schools (e.g., k–8 schools, middle
schools, junior high schools).1
In this article, we aim to develop a multi-reporter
understanding of the middle grade social context across
these typical school grade spans. In addition, we examine
the potential role of middle grade social context as a link
between school grade span and students’ perceptions of
their schools. Our ultimate goal is to provide theoretically-
and empirically-based evidence for structural and contex-
tual school reform and policy change toward best sup-
porting public middle grade school students’ academic and
social-emotional well-being.
School Climate and Grade Configurations in the Middle
Grades
Middle grade school context has been of increasing interest
among developmental and educational researchers. Envi-
ronment-stage fit theory (Eccles and Midgley 1989) sug-
gests certain types of middle grade schools may not be
supportive of early adolescents’ development. Testing such
assumptions, researchers have directly and indirectly
examined middle grade school social contexts, with the
majority of the literature examining students’ perceptions
of the school social climate (e.g., Eccles et al. 1993;
Seidman et al. 1994). Researchers have also examined a
broader range of school climate dimensions, including
interpersonal (e.g., teacher support, peer support), organi-
zational (e.g., safety, chaos), and instructional/academic
(e.g., student commitment to achievement, instructional
innovation) aspects that influence students’ adjustment in
multiple domains (Brand et al. 2003; Jia et al. 2009; Ku-
perminc et al. 2001; Rutter and Maughan 2002; Skinner
and Wellborn 1994). Across these studies, school climate is
often conceptualized and measured using different dimen-
sions, reflecting the difficulties of defining school climate
(Anderson 1982). Interpersonal and academic dimensions
of student-perceived school climate seem to be the most
common and consistent predictors of multiple domains of
student outcomes (Brand et al. 2003; Jia et al. 2009; Way
et al. 2007).
The current literature on school climate is incomplete.
First, with a few exceptions (e.g., Brand et al. 2003), most
studies using student perceptions involve a small number
of schools. Replication of these studies with a large
national sample of schools is necessary to generalize the
findings across the diversity of schools in the United States.
Second, these studies conduct analyses on the individual-
level, focusing on how individual student perceptions are
linked to student outcomes. Given that individual charac-
teristics influence perceptions of social phenomena
(Mitchell et al. 2010), school-level analyses of social
context are needed to adequately assess school social
context. Third, most studies rely on students’ reports of
school social climate, and do not include other participants
in these settings, such as teachers and administrators. This
is despite findings suggesting that teachers may be better
raters of school climate than students when comparing
social climate between (as opposed to within) schools
(Bryk et al. 2010; Nathanson et al. 2013). Lastly, despite
calls to improve school climate (National School Climate
Council 2007), we know relatively little about how the
broader school context relates to students’ perceptions of
school climate. Given evidence linking student perceptions
to outcomes, a better understanding of how school level
factors influence student perceptions could be used to aid
policy makers and educators in strategically improving
school climate in the middle grades.
Another major focus of research on middle grade school
contexts has been on structural aspects of middle grade
schools, with a particular focus on grade span configura-
tions. This line of research suggests that the transition to
middle grade schools, compared to continuing attendance
in k–8 schools, is negatively associated with student aca-
demic and social-emotional outcomes in both correlational
(e.g., Byrnes and Ruby 2007; Rockoff and Lockwood
2010; Weiss and Kipnes 2006) and causal examinations
(e.g., Kieffer 2013; Schwerdt and West 2013). For exam-
ple, Schwerdt and West (2013) find that students moving
from elementary to middle grade schools suffer a sharp
drop in academic achievement, experience an increase in
school absences, and are less likely to still be enrolled in
school by grade 10 as compared with students who do not
transition. There is no clear consensus on whether there are
differences in student outcomes between transitioning to
middle schools versus junior high schools. Some studies
1 These are the terms that are typically used in the middle grade
school literature. Generally, k–8 schools include schools that serve
pre-kindergarten or kindergarten to 8th grade; middle schools include
schools that primarily serve 6th, 7th, and 8th graders; and junior high
schools serve 7th, 8th, or 7th, 8th, and 9th graders. Some of these
schools may serve higher grade levels as well (e.g., schools serving
7th–12th grade). This study uses the term k–8, middle, and junior high
schools liberally, including those schools serving higher grades.
Am J Community Psychol (2014) 54:28–45 29
123
demonstrate that, for students who experience a school
transition in the middle years, a transition in 6th grade (to
middle schools) may be more detrimental than a transition
in 7th grade (to junior high schools: e.g., Cook et al. 2008;
Rockoff and Lockwood 2010). Others find transitions in
6th or 7th grade equally detrimental to student achievement
(e.g., Schwartz et al. 2011; Seidman et al. 1994). Thus far,
this research has been conducted with a relatively small
number of schools or schools in specific states or cities
(e.g., Rockoff and Lockwood 2010; Schwerdt and West
2013), precluding generalizations across districts and
regions.
Taken together, little, if any, research has directly
compared the social contexts of schools with different
grade configurations. Although studies seem to suggest k–8
schools may better support students’ needs than middle
grade schools (for a review, see Seidman et al. 2004), it is
unclear whether there are systematic differences in social
context between middle grade schools with varying grade
span configurations.
Social Contexts of Middle Grade Schools
The school setting, like other social settings, has a set of
psychological and institutional attributes that give it a
distinctive interpersonal context (Kuperminc et al. 1997).
Within a school building, each individual—including stu-
dents, administrators, and teachers—are participants in
social interactions, both dyadic and school-wide, with
students and adults in different roles with different inter-
ests. Each individual contributes to the overall school
social context as a member of the school community, and
also has a unique perspective on the school context. For
example, teachers’ perceptions of teaching burdens are
significantly associated with the overall school climate and
student outcomes (Jones et al. 2011; Thijs et al. 2008).
Despite this, the school climate literature has focused
predominantly on students’ perspectives, overlooking the
views and processes of other participants of school social
settings, such as teachers and administrators. Educational
and organizational health research suggests social pro-
cesses that do not directly involve students, for example
teacher–teacher and teacher–administrator relationships, as
well as teacher and administrator perceptions and attitudes,
contribute to overall school health or climate (Hoy and
Hannum 1997; Marks and Printy 2003; Sweetland and Hoy
2000). In addition, students’ perceptions of school climate
are influenced by individual experiences and relationships
(Baker 1999; Goldstein et al. 2008). Examining the rela-
tions between administrators’ and teachers’ perspectives
and student perceptions will provide a more complete
picture of middle grade school social contexts.
Key dimensions of school-wide social contexts that have
not been fully integrated in the school climate literature
include school disorder and stress. Specifically, chaotic
school environments with frequent and uncontrollable
interruptions and disturbances due to high levels of vio-
lence, teacher mobility, and racial tensions may be highly
stressful for students (Bellmore et al. 2012; Birnbaum et al.
2003; Grannis 1992; Wang and Gordon 2012). In addition,
school culture in which noncompliance and disruptive
behavior is prevalent not only contributes to negative
school climate but also affects students’ academic
achievement (Flannery et al. 2009; Mitchell et al. 2010;
Warren et al. 2003). Successful interventions focused on
positive management of school-wide student behaviors
have a positive influence on overall school climate (e.g.,
Bradshaw et al. 2009; Mitchell et al. 2010).
Teacher perceptions and experiences—such as staff
professional climate, agency, and teaching burdens—are
also important dimensions of school social context.
Teachers engage in social and professional interactions
with other staff in their unique school settings. There is
growing recognition that a positive professional climate
among staff is critical to positive school-wide climate and
successful school reforms (Edgerson et al. 2006; Rhodes
et al. 2009). Teachers’ feelings of satisfaction and control
have been positively associated with teaching and
instructional behaviors (Skaalvik and Skaalvik 2007;
Tschannen-Moran and Hoy 2001). Additionally, some
evidence suggests middle grade school teachers feel less
efficacious than elementary or high school teachers (Eccles
et al. 1993; Midgley et al. 1995). Moreover, few training
programs or certification requirements are geared toward
specializing in the learning style and needs of middle grade
children. Lastly, teachers’ perception of the barriers to or
burdens of teaching may play an important role in teachers’
daily interactions with students and other members of the
school community (Raver et al. 2009; Wasik et al. 2006).
In sum, school-level disorder and stress, as well as
teacher experiences, perceptions, and training contribute to
the social context of middle grade schools and should be
considered in combination as potential influences on stu-
dents’ middle grade school experiences. By comparing the
overall social context of middle grade schools and exam-
ining its association with students’ perception of school
climate, we may better determine which types of middle
school grade configurations are most supportive of early
adolescent students’ development.
Current Study
Informed by the current literature, this study examines
social contexts across middle grade schools with different
grade span configurations and the associations between
30 Am J Community Psychol (2014) 54:28–45
123

school-level social context and students’ perceptions of
school climate. By doing so, we aim to bridge the gap
between the school climate literature focused on students’
individual perspectives and the middle school transition
literature testing impacts of varying grade span configura-
tions. Incorporating the perspectives and experiences of
administrators and teachers, we focus on understanding
school-wide social contexts and processes as an overarch-
ing construct that collectively influences students’ percep-
tions of their schools. Specifically, utilizing the eighth
grade cross-sectional data from a large national dataset—
the Early Childhood Longitudinal Study, Kindergarten
Class of 1998–1999 (ECLS-K)—we (1) describe the factor
structure of middle grade school social context as reported
by administrators and teachers; (2) examine variation in
social context among middle grade schools with different
grade span configurations (k–8 schools; 6–8 middle
schools; 7–9 junior high schools), controlling for school
demographic and structural characteristics; and (3) test
middle grade school social context as a potential link
between school grade span configuration and students’
perceptions of school climate. Using a multiple indicator
multiple causes (MIMIC) approach with multi-level
structural equation models (MSEM), this study aims to
enhance understanding of school-level differences in social
contexts between different types of middle grade schools
and how these differences may influence the experiences
and development of students within those schools. By
doing so, this study seeks to inform the development of
more supportive, positive school environments for all
public school students.
Method
Sample
The data used in this study are drawn from the Early
Childhood Longitudinal Study, Kindergarten Class
1998–1999 (ECLS-K). The ECLS-K followed a nationally
representative sample of 21,260 kindergarteners from the
1998–1999 school year through the 2006–2007 school
year, at which time the majority of participants were
enrolled in eighth grade. It is a multi-method and multi-
source study that includes: interviews with parents, prin-
cipal and teacher surveys, student records, direct student
assessments, and student self-reports. For this study, the
sample consists of the 5,754 students from 1,712 schools
who participated in the 2007 spring (Wave 7) data col-
lection; and were: (1) in eighth grade; (2) attending a k–8
school, middle school, or junior high school; and (3)
attending a regular public school.
The data used in the present analysis were provided by
students, teachers, and school administrators. Students
were evenly split by gender (51 % female) with an average
eighth grade student age of 14 years. They are predomi-
nately white (62 %), followed by Hispanic (18 %), African
American (9 %), Asian (6 %), and other (5 %). Students
represent an even distribution of the range of socioeco-
nomic statuses (SES) with the exception of an underrep-
resentation of the lowest quintile (22 % are in the top
quintile followed by 20, 21, 20, and 15 %). Teacher par-
ticipants include 5,085 unique English (n = 2,778) and
math or science teachers (n = 3,307). The average teacher
completed a bachelor’s degree, had 14 years of teaching
(SD = 10.40), and was 44 years old (SD = 11.76) at this
wave of data collection. School administrator surveys were
reported by the principal (N = 1,712). On average, the
principals reported 12 years teaching (SD = 6.28), eight
years as a principal (SD = 6.54), and five years as a
principal at their current school (SD = 4.55). The majority
had a master’s degree or higher.
Measures
School Social Context: Administrator- and Teacher-
Reports
To examine the factor structures of middle school social
contexts, we identified 25 social context items from the
administrator-report (8 items) and teacher-report (17 items)
questionnaires (Table 2). These items were chosen from
within the constraints of the ECLS-K data with a focus on
capturing school-wide stressors as well as teachers’ expe-
riences in, and perceptions about, the school context.
In order to measure school-wide stressors, administra-
tors were asked the degree to which teacher turnover; gang
activities; and racial tensions are problems in their schools
(five-point scale: 1 = strongly disagree and 5 = strongly
agree). They also reported on the frequency of student
conduct problems in school, including class cutting, theft,
vandalism, and bullying on a (five-point Likert scale:
1 = happens daily and 5 = never happens).
Teachers’ experiences and perceptions were captured
using questions from the eighth grade teacher question-
naire. The first three questions asked teachers about their
own teaching experience (e.g., ‘‘I really enjoy my present
teaching job.’’). The second set of questions included 14
items asking teachers about their perceptions of the various
aspects of the school social context, including staff climate,
difficulties in teaching, and their own attitude toward
teaching (e.g., ‘‘Staff members in this school generally
have school spirit’’; ‘‘The level of misbehavior in this
school interferes with my teaching’’; ‘‘I feel that it’s part of
my responsibility to keep students from dropping out of
Am J Community Psychol (2014) 54:28–45 31
123
school’’). For all items, teachers responded on a five-point
Likert scale ranging from 1 = strongly disagree to
5 = strongly agree (see Table 2 for all items).
For this study, we calculated and used the mean teacher
response for each school. We also ran intra-class correla-
tions (ICCs) for all of the teacher items, in order to assess
how well items distinguish between schools as opposed to
between teachers within the same school. ICCs were suf-
ficiently large to confidently support interpreting teacher
responses as school level context variables for all but four
items where the ICC B 0.032 (see Table 2 notes for items).
Student Perceptions of School Climate
Thirteen items from the 8th grade student survey were used
to measure student perceptions of school climate, including
school attachment, peer academic values, and peer support.
Specifically, the five items on school attachment included:
how often students feel like they fit in; feel close to
classmates; feel close to teachers; enjoy being at school;
and feel safe at school. Responses were on a four-point
scale from 1 (never) to 4 (always). Students’ perception of
peers’ academic values were measured using three items:
how important is it to their close friends that they attend
classes regularly; get good grades; continue their education
past high school. The responses ranged from 1 (not
important) to 3 (very important). A questionnaire on stu-
dents’ perception of peer support among their classmates
consisted of five items that asked whether their classmates
think it is important to be their friend; like them the way
they are; care about their feelings; like them as much as
they like others; and really care about them (five-point
Likert scale: 1 = never to 5 = always).
Both exploratory and confirmatory factor models of
these 12 items revealed and confirmed the three construct
model—school attachment, peer academic values, peer
support—as the best fitting model (for details on factor
analysis procedure and results, see ‘‘Appendix 1’’).
School Structure
Based on our literature review, we hypothesized that the
grade span configurations of a school as well as key
demographics would influence the school context. In order
to both test and control for this, we included the following
variables in our analyses.
Grade Span Schools included in the ECLS-K dataset
have various school grade span configurations. For mean-
ingful comparison, school grade span was coded in three
categories based on transition timing: k–8, middle, and
junior high schools. Specifically, schools that started in
either pre-kindergarten or kindergarten and extended
through 8th or 12th grade were coded as k–8 schools
(11 %); schools beginning in 6th grade and extending
through 8th or 12th grade were coded as middle schools
(64 %); and lastly, schools beginning in 7th grade and
extending through 8th, 9th, or 12th grade were coded as
junior high schools (25 %).
Structure and Demographics Past work suggests that
school urbanicity, school size, student composition, and
facility quality may contribute to school social context
(Anderson 1982; Buckley et al. 2005; Hannaway and
Talbert 1993; Opdenakker and Damme 2007). We selected
one variable—whether the school is in an urban, suburban,
or rural location—as an indicator of school location urba-
nicity. For student composition, four variables were
selected: number of students enrolled, % Hispanic students,
% black students, and % students eligible for free lunch.
Facility quality was measured using a composite score of
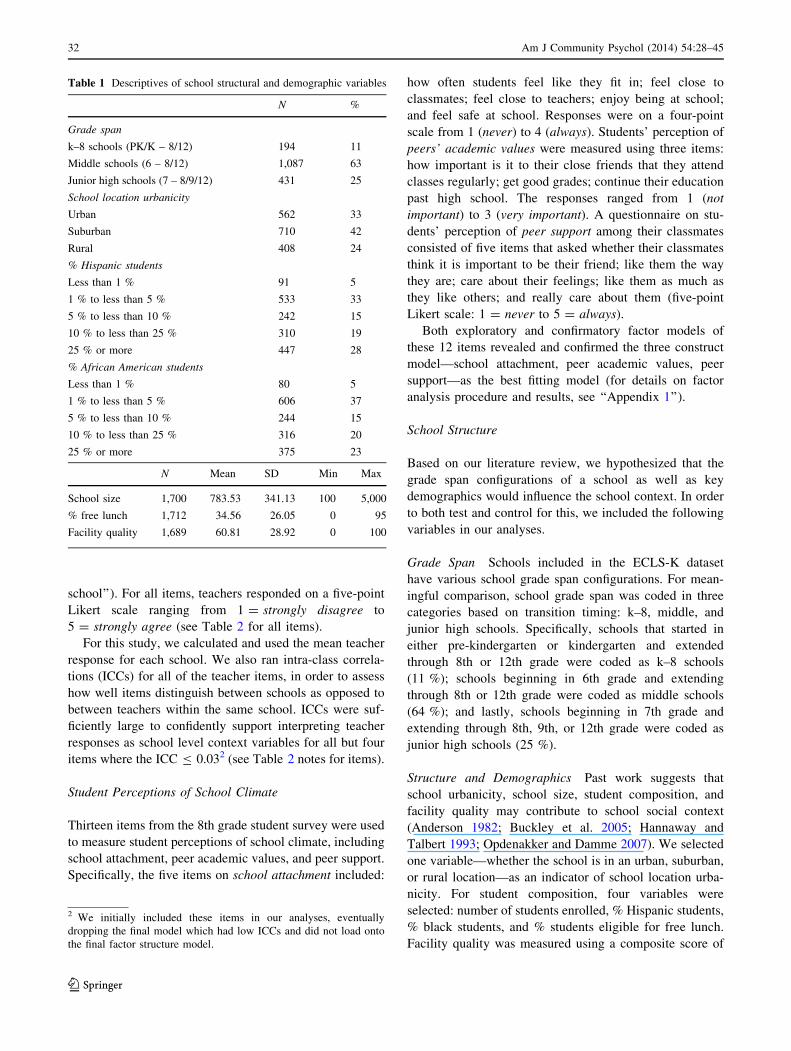
Table 1 Descriptives of school structural and demographic variables
N %
Grade span
k–8 schools (PK/K – 8/12) 194 11
Middle schools (6 – 8/12) 1,087 63
Junior high schools (7 – 8/9/12) 431 25
School location urbanicity
Urban 562 33
Suburban 710 42
Rural 408 24
% Hispanic students
Less than 1 % 91 5
1 % to less than 5 % 533 33
5 % to less than 10 % 242 15
10 % to less than 25 % 310 19
25 % or more 447 28
% African American students
Less than 1 % 80 5
1 % to less than 5 % 606 37
5 % to less than 10 % 244 15
10 % to less than 25 % 316 20
25 % or more 375 23
N Mean SD Min Max
School size 1,700 783.53 341.13 100 5,000
% free lunch 1,712 34.56 26.05 0 95
Facility quality 1,689 60.81 28.92 0 100
2 We initially included these items in our analyses, eventually
dropping the final model which had low ICCs and did not load onto
the final factor structure model.
32 Am J Community Psychol (2014) 54:28–45
123
nine items reported by the administrator on the adequacy of
the following facilities: cafeteria, computer lab, library/
media center, art room, gymnasium, music room, play-
ground/school yard, classrooms, auditorium/multi-purpose
room. Responses were originally coded on a five-point
scale. However, due to the skewed distribution of the data
with the majority of respondents answering always ade-
quate for each question, the responses were dichotomized
at the item level (0 = do not have, never adequate, often
not adequate, and sometimes not adequate and 1 = always
adequate) Descriptive statistics for school structure and
demographic variables are listed in Table 1.
Student Covariates
We hypothesized that a number of student level demo-
graphics would influence students’ perceptions of school
social processes. Therefore, we included the following
covariates at the student level: gender; race/ethnicity;
socioeconomic status (SES); seventh grade self-perception
of math and reading ability; internalizing problems, and
locus of control.
Results
Prior to data analysis, we assessed missing information. For
the majority of variables included in the analysis, no more
than 3 % of schools had missing data. The exceptions were
% Hispanic (5 %), % African-American (5 %), % free
lunch status (9 %), and school urbanicity (10 %). Our
analysis, nevertheless, included data for all 1,712 schools.
School-level weights are not available for the schools
included in Wave 7 (8th grade) of the ECLS-K. In addition,
schools in this 7th wave are not representative of the initial
national school sample.
To address the research aims, we utilized a series of
single- and multi-level exploratory and confirmatory factor
analyses as well as multi-level structural equation models
(MSEM). All models were estimated using maximum
likelihood estimation with robust standard errors and a
mean-adjusted chi square statistic test (Asparouhov and
Muthen 2006) on Mplus 7.0 software (Muthen and Muthen
2012). In all SEM models, factor variance was fixed at 1
and all item factor loadings were freely estimated. As
suggested by Kline (2011), we evaluated the fit of all multi-
level confirmatory analysis and MSEM using multiple
indices of model fit, including both level-specific indices
such as standardized root mean square residuals for within-
model (SRMR-W) and between-level (SRMR-B); and
overall model fit indices such as the model chi square
statistic, the root mean square error of approximation
(RMSEA), and comparative fit index (CFI). There are no
clear guidelines for model fit evaluation of multilevel
models (Marsh et al. 2012). Following suggestions of
recent studies, we used a strict cut-off value for SRMR-
B B 0.06 to evaluate school-level models (Hsu 2009), and
liberal criteria for RMSEA (B0.08) and CFI (C0.80) given
the large ECLS-K sample size (Marsh et al. 2004a, b).
Question 1: Factor Structure of School Social Contexts
To examine the factor structure of school social contexts,
the first stage of analysis was to determine the best-fitting
measurement model. A series of preliminary exploratory
and confirmatory factor analyses were run. First, we used
40 % of the randomly-split school sample to conduct
exploratory factor analyses with administrator- and tea-
cher-report items, using a geomin rotation solution. We
extracted two factors for administrator-report items (school
chaos and student conduct problems) and four factors for
teacher-report items (teacher professional climate, agency,
teacher burden, commitment), considering the model fits
and related theories and prior studies on school social
context. Second, we confirmed these within-reporter factor
structures using the remaining 60 % of the sample. In the
next step, we combined teacher-report and administer-
report items and performed a confirmatory factor analysis
at the school level using the whole school sample. The
findings confirmed the six social context factors with a
reasonable fit (v2(237) = 1314.85, p \ .001; RMSEA =
0.03; CFI = 0.88; SRMR-B = 0.06). The six social con-
text factors were strongly correlated with each other in the
expected directions. Interestingly, the teacher commitment
factor was not correlated with these factors: administrators’
reports of school chaos and student conduct (see Fig. 1 for
details).
Although school social context comprises six different
factors, we expected the various dimensions to be related
and collectively influence student perceptions of school
social climate. Thus, we subjected the six factors to a
second-order factor analysis to see if these factors reflected
an overarching construct. The residual variances between
school chaos and student conduct problems were allowed
to correlate because these measures were completed by the
same source (administrator), and allowing the errors to
correlate significantly improved the model fit (Bentler
2000). The initial second order model with six first-order
factors had a significantly better fit than the first-order
factor model, as indicated by the Satorra-Bentler scaled chi
square difference test results (Dv2(8) = 255.82, p \ .001)
but was not fully satisfactory with SRMR-B = 0.07. In
addition, we found only a modest factor loading of teacher
commitment (0.32) on the overarching secondary factor.
To improve the model fit, we omitted the teacher com-
mitment factor and its items from the analysis. The
Am J Community Psychol (2014) 54:28–45 33
123

modified model fit the data well with 5 latent factors of
social context: school chaos, student conduct problems,
staff professional climate, teacher agency, and teaching
burden (v2(164) = 950.10, p \ .001; RMSEA = 0.03;
CFI = 0.90; SRMR-B = 0.06). Factor loadings of each
item are presented in Table 2. School chaos, student con-
duct problems, and teaching burden factors negatively
loaded on the overarching social context factor; and staff
professional climate and teacher agency factors had posi-
tive loadings on the overarching social context factor.
Question 2: Difference in School Social Context
by Grade Spans
To determine the extent to which the social context factor
varied among k–8 schools, middle schools, and junior high
schools we used a multiple indicators and multiple causes
(MIMIC) model. MIMIC models allow for simultaneous
factor analysis and regression of factor scores on covariates
in order to test for heterogeneity in factor means and mea-
surement invariance across groups (Joreskog and Goldber-
ger 1975; Muthen 1989). In order to compare three different
grade span configurations, we created two binary variables
that indicated school membership for k–8 schools and
middle schools with junior high schools as the reference
group. Then, we regressed the second-order school context
factor on these two binary variables. In addition, we inclu-
ded a host of school level covariates to control for school
demographic and structural characteristics such as urba-
nicity, school size, free lunch %, Hispanic and black student
%, and school facility quality. The results of this MIMIC
model are presented in Fig. 2. The best-fitting MIMIC
model provided a good fit to the data, v2(202) = 1,884.02,
p \ .001; CFI = 0.82; RMSEA = 0.03; SRMR-B = 0.06.
Further modifications did not improve the overall fit.
When school covariates were entered into the model, the
direction of loadings of the social context factors reversed.
School chaos, student conduct problems, and teaching
burdens had positive loadings on overall school context;
and staff professional climate and teacher satisfaction had
negative loadings. Thus, a higher score of overall school
social context indicates a more negative social context.
The SEM results (see Fig. 2) suggest that school social
context varies by school grade span configurations. Spe-
cifically, k–8 schools have a more positive social context
compared to middle schools and junior high schools con-
trolling for school demographic and structural character-
istics. There was no significant difference between middle
and junior high schools.
Question 3: Predicting Student Perceptions of School
Climate
To account for the nested structure of the data (students
nested in schools), we conducted two-level structural
equation modeling, which accounts for the dependency
among student reports within schools and allows school-
and student-level variables to be modeled distinctly. The
use of different reporters and methods to measure school
social context and student perceptions of school social
climate constructs reduces potential bias due to shared
reporters (Bank et al. 1990).
Prior to testing the hypothesized model, we examined an
unconditional model to decompose the amount of variance
that existed between student- and school-levels. In this
model, student reports of climate were allowed to be cor-
related at both student (r = 0.33–0.76, p \ .001) and
school levels (r = 0.20–0.23, p \ .001), with random
intercepts to consider mean level differences between
schools. Student reports of school climate in the uncondi-
tional model had low intraclass correlations (school
attachment = 0.03; peer support = 0.03; and peer aca-
demic values = 0.05), suggesting most of the variance in
student reports could be explained by individual differ-
ences within schools rather than between schools. Typi-
cally such low ICCs are considered indicators of
independency of individual scores from the cluster, and
used for a rationale for ignoring the nested structure.
However, given our research focus on between-school
differences in student outcomes, it remains important to
consider the nested structure of the data. In addition, given
the highly significant correlations and shared respondents,
error variance of the student-report of school climate
variables was allowed to covary for further analyses.
The next step was to include student-level covariates in
the student-level models to examine within-school associ-
ations. Students’ individual characteristics significantly
explained the within-school individual variations in per-
ceptions of school climate—33 % of school attachment
(p \ .001, 95 % CI [0.31, 0.35]), 29 % of peer support
(p \ .001, 95 % CI [0.13, 0.17]), and 15 % of peer aca-
demic values (p \ .001, 95 % CI [0.13, 0.17]).
Lastly, the hypothesized model was specified as shown in
Fig. 3. The bolded arrows indicate the hypothesized path
between school grade span configurations, school social con-
text, and student-report of school climate. School and student
covariates were included to control for differences between
schools and students. The hypothesized model provided a good
fit to the data, v2(413) = 1,906.26, p\ .001, CFI = 0.92,
RMSEA = 0.03, SRMR-W = 0.001, SRMR-B = 0.06. To
34 Am J Community Psychol (2014) 54:28–45
123

Ta
ble
2S
tan
dar
diz
edfa
cto
rlo
adin
gs
of
sch
oo
lso
cial
con
tex
tv
aria
ble
sfo
rth
ese
con
d-o
rder
con
firm
ato
ryfa
cto
ran
aly
sis
mo
del
Sec
on
dO
rder
Fac
tor:
Sch
oo
lS
oci
alC
on
tex
t
Fac
tor
1:
Fac
tor
2:
Fac
tor
3:
Fac
tor
4:
Fac
tor
5:
Sch
oo
lch
aos
Stu
den
tco
nd
uct
pro
ble
ms
Sta
ffp
rofe
ssio
nal
clim
ate
Tea
cher
agen
cyT
each
ing
bu
rden
sa
Fac
tor
load
ing
[95
%C
I]
-0
.46
[-0
.49
,-
0.4
3]
-0
.41
[-0
.44
,-
0.3
8]
0.6
8[0
.65
,0
.71
]0
.73
[0.7
0,
0.7
6]
-0
.92
[-0
.95
,-
0.8
9]
Mea
n(S
D)
Fac
tor
load
ing
(SE
)
Mea
n(S
D)
Fac
tor
load
ing
(SE
)
Mea
n(S
D)
Fac
tor
load
ing
(SE
)
Mea
n(S
D)
Fac
tor
load
ing
(SE
)
Mea
n(S
D)
Fac
tor
load
ing
(SE
)
Tea
cher
turn
ov
er4
.28
(0.9
0)
0.4
7(0
.03
)
Gan
gac
tiv
ity
3.5
7(1
.09
)0
.80
(0.0
2)
Rac
ial
ten
sio
n1
.79
(0.9
7)
0.6
7(0
.02
)
Cla
sscu
ttin
g3
.51
(1.1
0)
0.7
0(0
.02
)
Ph
ysi
cal
con
flic
t3
.36
(0.8
9)
0.7
6(0
.02
)
Th
eft
3.6
5(0
.69
)0
.67
(0.0
2)
Van
dal
ism
3.8
1(0
.65
)0
.64
(0.0
2)
Stu
den
tb
ull
yin
g2
.85
(0.9
9)
0.5
5(0
.02
)
Tea
cher
sin
this
sch
oo
lar
eco
nti
nu
ally
lear
nin
gan
dse
ekin
gn
ewid
eas
4.0
4(0
.53
)0
.68
(0.0
3)
Sta
ffm
emb
ers
inth
issc
ho
ol
gen
eral
lyh
ave
sch
oo
lsp
irit
3.8
0(0
.61
)0
.70
(0.0
3)
Ife
elac
cep
ted
and
resp
ecte
das
aco
llea
gu
eb
ym
ost
staf
fm
emb
ers
4.3
6(0
.46
)0
.61
(0.0
3)
Ire
ally
enjo
ym
yp
rese
nt
teac
hin
gjo
b4
.38
(0.5
4)
0.8
7(0
.02
)
Iam
cert
ain
Iam
mak
ing
ad
iffe
ren
cein
the
liv
eso
fth
est
ud
ents
Ite
ach
4.3
6(0
.43
)0
.61
(0.0
3)
IfI
cou
ldst
art
ov
er,
Iw
ou
ldch
oo
sete
ach
ing
agai
nas
my
care
er4
.12
(0.6
5)
0.6
1(0
.02
)
Th
ele
vel
of
mis
beh
avio
rin
this
sch
oo
lin
terf
eres
wit
hm
yte
ach
ing
2.6
7(0
.90
)0
.70
(0.0
2)
Man
yo
fth
est
ud
ents
Ite
ach
are
no
tca
pab
leo
fle
arn
ing
the
mat
eria
lI
amsu
pp
ose
dto
teac
hth
em2
.23
(0.7
1)
0.5
4(0
.02
)
Par
ents
are
sup
po
rtiv
eo
fsc
ho
ol
staf
f3
.50
(0.6
6)
-0
.61
(0.0
2)
Th
eat
titu
des
and
hab
its
stu
den
tsb
rin
gto
my
clas
sg
reat
lyre
du
ceth
eir
chan
ces
for
acad
emic
succ
ess
3.3
0(0
.71
)0
.65
(0.0
2)
My
succ
ess
or
fail
ure
inte
ach
ing
isd
ue
pri
mar
ily
tofa
cto
rsb
eyo
nd
my
con
tro
lra
ther
than
my
ow
nef
fort
or
abil
ity
2.5
4(0
.71
)0
.51
(0.0
3)
Ife
elso
met
imes
itis
aw
aste
of
my
tim
eto
try
tod
om
yb
est
aste
ach
er1
.72
(0.6
1)
0.4
9(0
.03
)
All
fact
or
load
ing
sw
ere
sig
nifi
can
tat
p\
.00
1
Fo
ur
item
s,in
clu
din
g‘‘
Ife
elth
atit
’sp
art
of
my
resp
on
sib
ilit
yto
kee
pst
ud
ents
fro
md
rop
pin
go
ut
of
sch
oo
l,’’
‘‘If
som
est
ud
ents
inm
ycl
ass
no
td
oin
gw
ell,
Ife
elth
atI
sho
uld
chan
ge
my
app
roac
hto
the
sub
ject
,’’
‘‘B
ytr
yin
gd
iffe
ren
tm
eth
od
,I
can
sig
nifi
can
tly
affe
cta
stu
den
t’s
ach
iev
emen
t,’’
and
‘‘I
wo
rkto
crea
tele
sso
ns
som
yst
ud
ents
wil
len
joy
lear
nin
gan
db
eco
me
ind
epen
den
tth
ink
ers’
’w
ere
fact
ore
din
to‘‘
teac
her
com
mit
men
t’’
fact
or—
this
fact
or
and
the
item
sw
ere
dro
pp
edd
ue
tolo
wfa
cto
rlo
adin
g(\
0.4
0)
on
the
seco
nd
-ord
ersc
ho
ol
soci
alco
nte
xt
fact
or.
Th
ese
item
sh
adv
ery
low
ICC
s(B
0.0
3),
sug
ges
tin
gth
atth
ese
item
sar
eb
ette
rm
easu
res
of
ind
ivid
ual
dif
fere
nce
san
dn
ot
of
sch
oo
lle
vel
dif
fere
nce
sa
On
eit
em,
‘‘R
ou
tin
ead
min
istr
ativ
ed
uti
esan
dp
aper
wo
rkin
terf
ere
wit
hm
yjo
bo
fte
ach
ing
,’’
was
dro
pp
edfr
om
the
fin
alC
FA
du
eto
the
low
fact
or
load
ing
(\0
.40
)o
nth
ete
ach
ing
bu
rden
s
fact
or
Am J Community Psychol (2014) 54:28–45 35
123
avoid possible model misidentification due to the low ICC, we
ran the model with twenty different starting values. Each
yielded the same converged model. A full model with the
standardized estimates of school level path coefficients is
illustrated in Fig. 3 and the total indirect and total effects of the
main variables, along with standardized coefficients of covar-
iates, are reported in Table 3. Coefficients of school- and stu-
dent-level covariates are reported in ‘‘Appendix 2’’.
There was no direct association between school grade
span and any of the student perceptions of school climate
variables, with social context in the model. However, the
quality of the school social context varied by school grade
configuration and negative school social context was itself
directly associated with lower levels of students’ school
attachment, peer support, and peer academic values. Spe-
cifically, k–8 schools had a more positive school climate
compared to junior high schools; and as well as to middle
schools (k–8 vs. middle school: Wald v2(1) = 5.91,
p \ .05). There was no significant difference between
middle school and junior high school.
We further investigated the significance of the simple
indirect effects of grade span on students’ perceptions of
school climate using a 2-2-1 multi-level mediation
approach (Bauer et al. 2006). Testing indirect effects with
clustered data using the MSEM method provides more
efficient and unbiased estimates compared to tests using
multi-level modeling (Preacher et al. 2011). Simple indirect
effects by social context of the effect of k–8 schools on
student school attachment (unstandardized estimate = 0.02;
standardized = 0.05, p \ .05, 95 % CI [0.003, 0.100]) and
peer academic values (unstandardized estimate = 0.01;
standardized = 0.03, p = .05, 95 % CI [-0.001, 0.068])
were marginally significant after controlling for school- and
child-level covariates. The indirect effect on peer support
was not significant (unstandardized estimate = 0.01; stan-
dardized = 0.04, p = .08, 95 % CI [-0.008, 0.084]).
However, peer support was highly correlated with school
attachment and peer academic values, and was linked to
more complex indirect paths (e.g., k–8 schools ? school
social context ? school attachment ? peer academic
values). The significance of these complex indirect effects
through two mediators cannot be tested. However, if all
paths are significant for a given a level, such complex
indirect effects can be accepted to be significant (Kline
2011). Total indirect effects by school social context of the
effect of k–8 schools on student-report school climate
variables are presented in Table 3. The school-level pre-
dictors included in the final model explained 30 % of the
variance in school attachment, 15 % in peer supports, 10 %
in peer academic values at the school level. The student-
level model explained 33 % of the variance in school
attachment; 30 % in peer support; and 15 % in peer aca-
demic values.
Discussion
Early adolescence is a time of significant developmental
change. Despite an increasing focus on supportive school
environments during these years as a means to foster
positive development, little is known about the school
context of middle grade schools. Similarly, there is little
research on whether school social context varies by grade
span configuration or relates to student perceptions and
experiences. In this study, we developed a measurement
model for school social context that incorporated teacher
and administrator perspectives in a large national sample.
We found that administrators and teachers in k–8 schools
reported a more positive school social context than their
colleagues in middle and junior high schools, controlling
for school demographic and structural characteristics. This
positive school social context, in turn, explained the asso-
ciation between grade span configuration and students’
perceptions of their schools’ social and academic climates.
These findings are consistent with research literature and
policy recommendations suggesting k–8 schools best serve
the academic and socio-emotional needs of middle grade
students (Seidman et al. 2004). Furthermore, these findings
suggest school social context is likely of critical impor-
tance to students’ perceptions of school climate, which in
turn play a central role in academic and social-emotional
development following the middle grade school transition
(Brand et al. 2003; Jia et al. 2009; Way et al. 2007).
Our measurement model of school social context identi-
fied five interrelated factors. Two of these factors—admin-
istrator reports of school chaos and conduct problems—
indicate the levels of disorder, such as racial tension, turn-
over, and student behavior problems, present in the school.
The remaining three factors—staff professional climate,
teacher agency, and teacher burden—reflect a range of
teachers’ perceptions, from teaching challenges and teaching
efficacy to social and professional interactions among school
staff. Collectively, these five factors form a single over-
arching factor that encompasses school social context, to
which increased chaos, conduct problems, and teacher bur-
den negatively contribute, while feelings of a supportive
professional climate and agency positively contribute.
Incorporating teacher and administrator perspectives in
the measurement of school social context provides a more
nuanced, multidimensional view than in prior work, which
has frequently relied on student perceptions. While student
perceptions are significant predictors of student achieve-
ment (Brand et al. 2003; Jia et al. 2009; Way et al. 2007),
they show greater differences between individuals than
they do differences between schools (Bryk et al. 2010;
Nathanson et al. 2013). Such individual-level variation
provides little information on overall school contexts and
makes it difficult to identify efficient targets of educational
36 Am J Community Psychol (2014) 54:28–45
123

interventions and policies. For example, students’ percep-
tions of low peer academic values are likely to be more
greatly influenced by their direct interactions with their
specific friend groups than their experience in the school as
a whole. Targeting individual-level social experience
requires identifying the primary contributor of individual
variance for each child and tailoring interventions
accordingly, which may be labor- and time-intensive as
well as difficult to implement on a large scale. In contrast,
if it were found that decreasing chaos in the school as a
whole has an average effect of raising everyone’s peer
academic values, this would present a more efficient, set-
ting-level, primary prevention solution. In this way, iden-
tifying more global measures of school context, may allow
us to identify better targets of policies and strategies to
improve middle grade school climate.
Using this measurement model, our findings suggest k–8
schools have a more positive school social context than
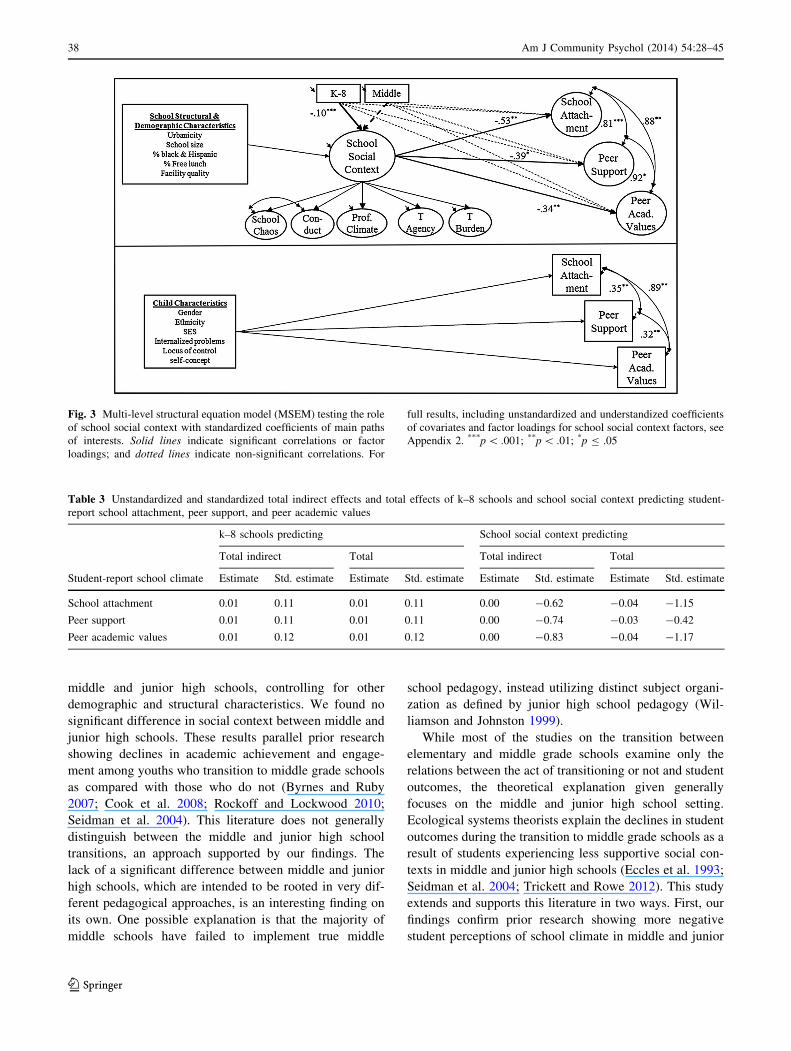
Fig. 1 School social context factor structure, standardized factor
loadings, and correlations between factors. School chaos and student
conduct (Conduct) factors were driven from school administrators’
reports; and professional climate (Prof. Climate), teacher agency (T
Agency), teacher burden (T Burden), and teacher commitment (T
Commit) factors were identified from teacher reports of school
context. Solid lines indicate significant correlations or factor loadings;
and dotted lines indicate non-significant correlations. ***p \ .001
Fig. 2 MIMIC model testing school social context varying by grade
configurations with standardized coefficients and factor loadings.
School structural and demographic characteristics were controlled for.
Solid lines indicate significant correlations or factor loadings; and
dotted lines indicate non-significant correlations. ***p \ .001;**p \ .01
Am J Community Psychol (2014) 54:28–45 37
123
middle and junior high schools, controlling for other
demographic and structural characteristics. We found no
significant difference in social context between middle and
junior high schools. These results parallel prior research
showing declines in academic achievement and engage-
ment among youths who transition to middle grade schools
as compared with those who do not (Byrnes and Ruby
2007; Cook et al. 2008; Rockoff and Lockwood 2010;
Seidman et al. 2004). This literature does not generally
distinguish between the middle and junior high school
transitions, an approach supported by our findings. The
lack of a significant difference between middle and junior
high schools, which are intended to be rooted in very dif-
ferent pedagogical approaches, is an interesting finding on
its own. One possible explanation is that the majority of
middle schools have failed to implement true middle
school pedagogy, instead utilizing distinct subject organi-
zation as defined by junior high school pedagogy (Wil-
liamson and Johnston 1999).
While most of the studies on the transition between
elementary and middle grade schools examine only the
relations between the act of transitioning or not and student
outcomes, the theoretical explanation given generally
focuses on the middle and junior high school setting.
Ecological systems theorists explain the declines in student
outcomes during the transition to middle grade schools as a
result of students experiencing less supportive social con-
texts in middle and junior high schools (Eccles et al. 1993;
Seidman et al. 2004; Trickett and Rowe 2012). This study
extends and supports this literature in two ways. First, our
findings confirm prior research showing more negative
student perceptions of school climate in middle and junior
Fig. 3 Multi-level structural equation model (MSEM) testing the role
of school social context with standardized coefficients of main paths
of interests. Solid lines indicate significant correlations or factor
loadings; and dotted lines indicate non-significant correlations. For
full results, including unstandardized and understandized coefficients
of covariates and factor loadings for school social context factors, see
Appendix 2. ***p \ .001; **p \ .01; *p B .05
Table 3 Unstandardized and standardized total indirect effects and total effects of k–8 schools and school social context predicting student-
report school attachment, peer support, and peer academic values
k–8 schools predicting School social context predicting
Total indirect Total Total indirect Total
Student-report school climate Estimate Std. estimate Estimate Std. estimate Estimate Std. estimate Estimate Std. estimate
School attachment 0.01 0.11 0.01 0.11 0.00 -0.62 -0.04 -1.15
Peer support 0.01 0.11 0.01 0.11 0.00 -0.74 -0.03 -0.42
Peer academic values 0.01 0.12 0.01 0.12 0.00 -0.83 -0.04 -1.17
38 Am J Community Psychol (2014) 54:28–45
123
high schools compared to elementary schools (Seidman
et al. 2004) through teacher- and administrator-reports of
school-level social context. Second, this study provides
empirical evidence in support of the theoretical explanation
that school social context may be a central mechanism
through which to explain differences in student experiences
by grade span configuration (Eccles et al. 1993; Seidman
et al. 2004). Indeed, once school social context was taken
into account, we found no independent association between
school grade span configuration and school attachment,
peer support, or peer academic values.
Overall, the findings from this study suggest a central role
for school social context in explaining the relations between
the middle grade schools’ grade span configuration and
student level experience and suggest support for existing
theories surrounding the mechanisms at work across this
transition (Eccles and Midgley 1989; Seidman et al. 2004).
Specifically, they indicate that it may not be the timing of the
middle grade transition or even the act of the transitioning
that leads to declines in performance and well-being, but
rather the environment into which youth transition. Struc-
tural changes may influence the resulting social context—for
example, through the presence/absence of younger students,
many versus one or two teachers, or the same/different
constellations of classmates. However, structural change
alone may not be sufficient in reversing the declining pat-
terns of student academic and social-emotional develop-
ment. Recent findings that older k–8 schools perform better
than newly-converted k–8 schools (Byrnes and Ruby 2007)
support this in suggesting schools may need additional
resources and strategies in order to best support adolescents’
needs and that the restructuring of grade configuration alone
may be insufficient. While further research is warranted as to
the factors underlying the relations between school grade
span configuration and school social context, our findings
suggest that targeting social context directly, with or without
shifts in grade span, may be an efficient way to support
positive student development during these years.
Study Strengths, Limitations, and Future Directions
This study has methodological and conceptual strengths.
First, it used a large national dataset with a range of public
schools represented, enabling between-school analyses on
social context and climate in the middle years. Second, it
included child, teacher, and administrator reports for a
nuanced conceptualization of school social context and an
examination of the association between school-level social
context and individual student perceptions. Third, it includes
an array of covariates at school and child levels to increase
our ability to draw valid conclusions from these findings.
Lastly, this study separated school context from students’
perceptions. This adds to our understanding of the processes
by which student perceptions of school climate might be
decreasing across the transition to middle or junior high
school.
The study is also limited in a few ways. First, the use of
secondary data, albeit from a rich national dataset, restricts
the variables at our disposal. We were unable to examine all
aspects of school social context identified in the literature,
such as principal leadership and principal–teacher relation-
ships (Rhodes et al. 2009). In addition, we were unable to
capture classroom (Cappella et al. 2013), afterschool pro-
grams (Smith et al. 2013), and neighborhood setting social
contexts (Delany-Brumsey et al. 2014; Duke et al. 2011;
McCoy et al. 2013) that may be critical to youths’ school
experiences and adjustment. Additional work with different
dimensions of school social context, and examination of
associations with other developmental settings, should be
undertaken to affirm and extend the findings. Second, due to
the unique data structure of the ECLS-K, we were unable to
consider teachers nested within schools. Replicating our
measurement model with multiple teachers and administra-
tors per school in a two-level model would help isolate
school social context from individual teachers’ or principals’
experiences. Third, due to the limited data points in the
ECLS-K during the middle grade years, this study examined
cross-sectional relations between school social contexts and
students’ perceptions of school climate for the middle grade
schools (6th, 7th, and 8th grade). While our findings suggest
a model in which school social context mediates the relation
between grade span configuration and student outcomes, the
directionality of such a model cannot be evaluated using this
cross-sectional and correlational study. Intervention
research that targets school social context and assesses the
impact on student perceptions would lend support and clarity
to the directionality of this association. Lastly, consistent
with past research indicating students vary more within
school than between schools (Bryk et al. 2010; Nathanson
et al. 2013), and given our low average number of students
per school, we found low intraclass correlations (ICCs) for
student responses. This may relate to the wording of items,
which asked about individual experiences rather than school
perceptions. Further research should draw from data with
more students per school in order to increase the between-
level association of student responses with questionnaires
designed to measure school-level processes.
Conclusion and Implications
This study identified school social context as a potentially
critical avenue of intervention toward supporting students’
social and academic development in the middle grades.
Our findings suggest that researchers and practitioners
should target school social context during these years and
Am J Community Psychol (2014) 54:28–45 39
123

point to avenues through which this might be accom-
plished. One avenue is structural change. Consistent with
past work, this study identified k–8 schools as more sup-
portive contexts for youth. A second avenue, not incom-
patible with the first, is implementation of policies directly
targeting key aspects of social context. This could take the
form of increasing relational support among teachers,
administrators, and parents (Jia et al. 2009); implementing
interventions to reduce conduct problems (Bradshaw et al.
2009); reducing teacher burden through streamlined
administrative demands; or otherwise improving profes-
sional climate. Further research as to the characteristics of
k–8 schools most critical to their positive social context
would greatly aid this intervention work through informing
which areas of social context to target and how to target
these areas. Whether targeting social context along with, or
in the absence of, structural change, our findings indicate
that in order to improve student perceptions of social and
academic climate and, through those, student outcomes,
educators may need to focus on improving teacher and
administrative social processes as well as supporting indi-
vidual students.
School social context is critical to student learning and
well-being. It may also help to explain why many youth
experience declines in achievement and adjustment across
the transition to middle or junior high school. Targeting
school social context may be a particularly effective way of
addressing these declines while, preventatively, benefiting
a large number of youth.
Acknowledgments This research was conducted with support
from Spencer Foundation (#201300077, PI: Elise Cappella, Co-PI:
Edward Seidman), the NYU Institute of Human Development and
Social Change, and the NYU Predoctoral Interdisciplinary Research
Training fellowship. All procedures and restricted data use were
approved by the IES Data Security Office (#12040005) and the
New York University Committee on Activities Involving Human
Subjects.
Appendix 1: Student Perceptions of Social
and Academic Climate Exploratory and Confirmatory
Factor Model Testing
Procedures
Student perceptions of school climate were examined using
13 items from the Wave 7 ECLS-K student questionnaires.
First, we used student reports from 40 % of the randomly
selected schools to conduct an exploratory factor analysis
using a geomin extraction approach with varimax rotation.
We found a three-factor model to be the most reasonable
solution considering the eigen value ([1), scree plot, and
model fit (v2(42) = 0.422, p \ .001, RMSEA = 0.06:
further details available from primary author). Second, we
confirmed the factor structure using the rest of the student
sample from the remaining 60 % of the schools. In these
analyses, we fixed the factor loadings to 1 and allowed the
factor loadings to be freely estimated. Using a combination
of theory, face validity, and modification indices, we then
Fig. 4 Student perceptions of school social and academic climate. v2(59) = 293.87, p \ .001 RMSEA = 0.03; CFI = 0.97; TLI = 0.97;
SRMR = 0.03
40 Am J Community Psychol (2014) 54:28–45
123
modified the measurement model until the best fitting
measurement model was obtained. In this process, we
allowed the residual variances of some of the items within
factors to correlate. These measures are completed by the
same source (student), and allowing the errors to correlate
significantly improved the model fit (Bentler 2000). Lastly,
we applied the same factor model to the whole student
sample. Factor loadings and fit statistics for the final
measurement model are presented in Fig. 4, below.
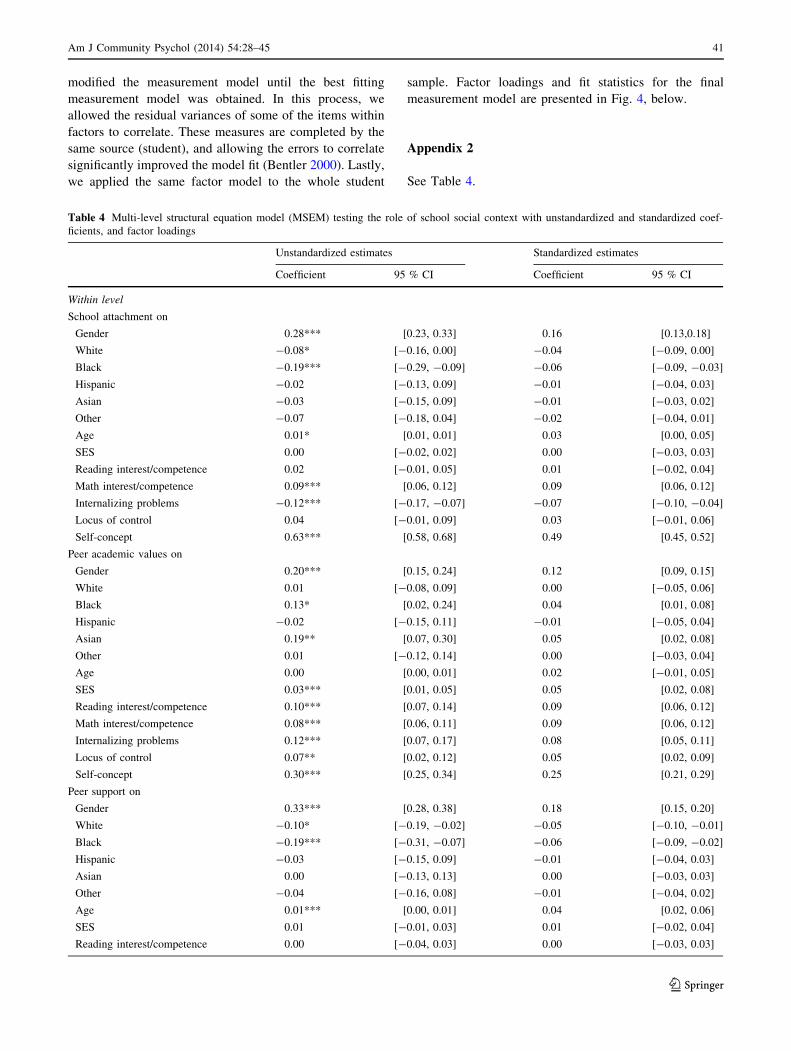
Appendix 2
See Table 4.
Table 4 Multi-level structural equation model (MSEM) testing the role of school social context with unstandardized and standardized coef-
ficients, and factor loadings
Unstandardized estimates Standardized estimates
Coefficient 95 % CI Coefficient 95 % CI
Within level
School attachment on
Gender 0.28*** [0.23, 0.33] 0.16 [0.13,0.18]
White -0.08* [-0.16, 0.00] -0.04 [-0.09, 0.00]
Black -0.19*** [-0.29, -0.09] -0.06 [-0.09, -0.03]
Hispanic -0.02 [-0.13, 0.09] -0.01 [-0.04, 0.03]
Asian -0.03 [-0.15, 0.09] -0.01 [-0.03, 0.02]
Other -0.07 [-0.18, 0.04] -0.02 [-0.04, 0.01]
Age 0.01* [0.01, 0.01] 0.03 [0.00, 0.05]
SES 0.00 [-0.02, 0.02] 0.00 [-0.03, 0.03]
Reading interest/competence 0.02 [-0.01, 0.05] 0.01 [-0.02, 0.04]
Math interest/competence 0.09*** [0.06, 0.12] 0.09 [0.06, 0.12]
Internalizing problems -0.12*** [-0.17, -0.07] -0.07 [-0.10, -0.04]
Locus of control 0.04 [-0.01, 0.09] 0.03 [-0.01, 0.06]
Self-concept 0.63*** [0.58, 0.68] 0.49 [0.45, 0.52]
Peer academic values on
Gender 0.20*** [0.15, 0.24] 0.12 [0.09, 0.15]
White 0.01 [-0.08, 0.09] 0.00 [-0.05, 0.06]
Black 0.13* [0.02, 0.24] 0.04 [0.01, 0.08]
Hispanic -0.02 [-0.15, 0.11] -0.01 [-0.05, 0.04]
Asian 0.19** [0.07, 0.30] 0.05 [0.02, 0.08]
Other 0.01 [-0.12, 0.14] 0.00 [-0.03, 0.04]
Age 0.00 [0.00, 0.01] 0.02 [-0.01, 0.05]
SES 0.03*** [0.01, 0.05] 0.05 [0.02, 0.08]
Reading interest/competence 0.10*** [0.07, 0.14] 0.09 [0.06, 0.12]
Math interest/competence 0.08*** [0.06, 0.11] 0.09 [0.06, 0.12]
Internalizing problems 0.12*** [0.07, 0.17] 0.08 [0.05, 0.11]
Locus of control 0.07** [0.02, 0.12] 0.05 [0.02, 0.09]
Self-concept 0.30*** [0.25, 0.34] 0.25 [0.21, 0.29]
Peer support on
Gender 0.33*** [0.28, 0.38] 0.18 [0.15, 0.20]
White -0.10* [-0.19, -0.02] -0.05 [-0.10, -0.01]
Black -0.19*** [-0.31, -0.07] -0.06 [-0.09, -0.02]
Hispanic -0.03 [-0.15, 0.09] -0.01 [-0.04, 0.03]
Asian 0.00 [-0.13, 0.13] 0.00 [-0.03, 0.03]
Other -0.04 [-0.16, 0.08] -0.01 [-0.04, 0.02]
Age 0.01*** [0.00, 0.01] 0.04 [0.02, 0.06]
SES 0.01 [-0.01, 0.03] 0.01 [-0.02, 0.04]
Reading interest/competence 0.00 [-0.04, 0.03] 0.00 [-0.03, 0.03]
Am J Community Psychol (2014) 54:28–45 41
123

Table 4 continued
Unstandardized estimates Standardized estimates
Coefficient 95 % CI Coefficient 95 % CI
Math interest/competence 0.07*** [0.04, 0.10] 0.07 [0.04, 0.09]
Internalizing problems -0.08** [-0.13, -0.02] -0.04 [-0.08, -0.01]
Locus of control 0.04 [-0.01, 0.09] 0.03 [-0.01, 0.06]
Self-concept 0.64*** [0.59, 0.69] 0.47 [0.44, 0.51]
School attachment with
Peer academic values 0.19*** [0.17, 0.21] 0.35 [0.32, 0.38]
Peer support 0.51*** [0.48, 0.53] 0.89 [0.88, 0.90]
Peer academic values with
Peer support 0.19*** [0.17, 0.21] 0.33 [0.30, 0.36]
Between level
School chaos by
Racial tension 0.49*** [0.43, 0.55] 0.66 [0.61, 0.71]
Gang activity 0.67*** [0.60, 0.73] 0.80 [0.76, 0.85]
Teacher turnover 0.40*** [0.34, 0.45] 0.48 [0.42, 0.54]
Student conduct by
Theft 0.41*** [0.37, 0.45] 0.67 [0.62, 0.71]
Class cutting 0.68*** [0.63, 0.73] 0.70 [0.66, 0.74]
Physical conflict 0.59*** [0.54, 0.63] 0.75 [0.71, 0.78]
Vandalism 0.36*** [0.31, 0.40] 0.63 [0.58, 0.68]
Student bullying 0.47*** [0.42, 0.52] 0.53 [0.49, 0.58]
Teaching burden by
Misbehavior interferes -0.20*** [-0.30, -0.11] -0.72 [-0.75, -0.68]
Students not capable -0.12*** [-0.18, -0.06] -0.54 [-0.59, -0.49]
Parents support 0.13*** [0.07, 0.19] 0.64 [0.59, 0.68]
Student attitudes -0.14*** [-0.21, -0.07] -0.62 [-0.67, -0.58]
Factors beyond control -0.11*** [-0.17, -0.06] -0.50 [-0.55, -0.44]
Waste of time -0.09*** [-0.14, -0.05] -0.48 [-0.54, -0.41]
Teacher agency by
I am making difference -0.20*** [-0.23, -0.16] -0.61 [-0.67, -0.55]
Choose teaching again -0.30*** [-0.35, -0.26] -0.62 [-0.67, -0.56]
Enjoy teaching -0.35*** [-0.40, -0.31] -0.87 [-0.92, -0.82]
Professional climate by
Teachers continue to learn -0.27*** [-0.31, -0.22] -0.67 [-0.73, -0.60]
School spirit -0.34*** [-0.37, -0.30] -0.72 [-0.79, -0.65]
Accept me -0.20*** [-0.24, -0.17] -0.59 [-0.66, -0.52]
School social context by
Teaching burden -2.56*** [-3.94, -1.17] -0.95 [-1.00, -0.90]
School chaos 0.55*** [0.45, 0.66] 0.54 [0.47, 0.62]
Student conduct 0.44*** [0.36, 0.51] 0.45 [0.38, 0.52]
Teacher agency 0.73*** [0.59, 0.87] 0.65 [0.58, 0.72]
Professional climate 0.72*** [0.58, 0.85] 0.64 [0.58, 0.71]
School social context on
k–8 -0.36** [-0.62, -0.10] -0.10 [-0.17, -0.03]
Middle -0.07 [-0.22, 0.08] -0.03 [-0.09, 0.03]
Urban 0.13 [-0.04, 0.29] 0.05 [-0.01, 0.11]
Rural 0.37*** [0.17, 0.56] 0.11 [0.05, 0.17]
Enrollment 0.10** [0.02, 0.18] 0.09 [0.02, 0.15]
42 Am J Community Psychol (2014) 54:28–45
123

References
Anderson, C. S. (1982). The search for school climate: A review of
the research. Review of Educational Research, 52, 368–420.
doi:10.3102/00346543052003368.
Archambault, I., Eccles, J. S., & Vida, M. N. (2010). Ability self-
concepts and subjective value in literacy: Joint trajectories from
grades 1 through 12. Journal of Educational Psychology, 102,
804–816. doi:10.1037/a0021075.
Archambault, I., Janosz, M., Morizot, J., & Pagani, L. (2009).
Adolescent behavioral, affective, and cognitive engagement in
school: Relationship to dropout. Journal of School Health, 79,
408–415. doi:10.1111/j.1746-1561.2009.00428.x.
Asparouhov, T., & Muthen, B. (2006). Robust Chi square difference
testing with mean and variance adjusted test statistics. Retrieved
October 23, 2013, from http://statmodel2.com/download/web
notes/webnote10.pdf.
Baker, J. A. (1999). Teacher–student interaction in urban at-risk
classrooms: Differential behavior, relationship quality, and
student satisfaction with school. The Elementary School Journal,
100, 57–70. doi:10.1086/461943.
Bank, L., Dishion, T. J., Skinner, M., & Patterson, G. R. (1990).
Method variance in structural equation modeling: Living with
‘‘glop.’’ In G. R. Patterson (Ed.), Depression and aggression in
family interaction (pp. 247–279). Hillsdale, NJ: Lawrence
Erlbaum Associates, Inc.
Barber, B. K., & Olsen, J. A. (2004). Assessing the transitions to
middle and high school. Journal of Adolescent Research, 19,
3–30. doi:10.1177/0743558403258113.
Bauer, D. J., Preacher, K. J., & Gil, K. M. (2006). Conceptualizing and
testing random indirect effects and moderated mediation in multi-
level models: New procedures and recommendations. Psychological
Methods, 11, 142–163. doi:10.1037/1082-989X.11.2.142.
Bellmore, A., Nishina, A., You, J., & Ma, T.-L. (2012). School
context protective factors against peer ethnic discrimination
across the high school years. American Journal of Community
Psychology, 49, 98–111. doi:10.1007/s10464-011-9443-0.
Benner, A. D., & Graham, S. (2009). The transition to high school as a
developmental process among multiethnic urban youth. Child
Development, 80, 356–376. doi:10.1111/j.1467-8624.2009.01265.x.
Bentler, P. M. (2000). Rites, wrongs, and gold in model testing.
Structural Equation Modeling: A Multidisciplinary Journal, 7,
82–91. doi:10.1207/S15328007SEM0701_04.
Birnbaum, A. S., Lytle, L. A., Hannan, P. J., Murray, D. M., Perry, C.
L., & Forster, J. L. (2003). School functioning and violent
behavior among young adolescents: A contextual analysis.
Health Education Research, 18, 389–403. doi:10.1093/her/
cyf036.
Table 4 continued
Unstandardized estimates Standardized estimates
Coefficient 95 % CI Coefficient 95 % CI
Free lunch % 0.02*** [0.01, 0.02] 0.40 [0.33, 0.47]
Hispanic % 0.05 [-0.02, 0.11] 0.05 [-0.02, 0.12]
Black % 0.16*** [0.10, 0.22] 0.18 [0.11, 0.24]
Facility quality 0.00 [0.00, 0.00] -0.05 [-0.10, 0.01]
School attachment on
School social context -0.04*** [-0.07, -0.02] -0.53 [-0.88, -0.17]
Peer academic values on
School social context -0.04** [-0.07, -0.01] -0.34 [-0.59, -0.08]
Peer support on
School social context -0.03* [-0.06, 0.00] -0.39 [-0.79, 0.01]
School attachment on
k–8 0.01 [-0.07, 0.09] 0.04 [-0.23, 0.31]
Middle 0.00 [-0.05, 0.06] 0.02 [-0.24, 0.28]
Peer academic values on
k–8 -0.05 [-0.14, 0.04] -0.12 [-0.34, 0.10]
Middle 0.02 [-0.03, 0.08] 0.09 [-0.12, 0.29]
Peer support on
k–8 -0.05 [-0.14, 0.04] -0.18 [-0.52, 0.16]
Middle -0.01 [-0.07, 0.04] -0.07 [-0.37, 0.22]
Student conduct with
School chaos 0.53*** [0.44, 0.61] 0.53 [0.44, 0.61]
Peer academic values with
School attachment 0.01* [0.00, 0.02] 0.88 [0.19, 1.57]
Peer support with
School attachment 0.01 [0.00, 0.01] 0.81 [0.53, 1.09]
Peer academic values 0.01* [0.00, 0.02] 0.92 [0.08, 1.76]
* p \ .05; **p \ .01; ***p \ .001
Am J Community Psychol (2014) 54:28–45 43
123

Bradshaw, C., Koth, C., Thornton, L., & Leaf, P. (2009). Altering
school climate through school-wide positive behavioral inter-
ventions and supports: Findings from a group-randomized
effectiveness trial. Prevention Science, 10, 100–115. doi:10.
1007/s11121-008-0114-9.
Brand, S., Felner, R., Shim, M., Seitsinger, A., & Dumas, T. (2003).
Middle school improvement and reform: Development and
validation of a school-level assessment of climate, cultural
pluralism, and school safety. Journal of Educational Psychology,
95, 570–588. doi:10.1037/0022-0663.95.3.570.
Bronfenbrenner, U., & Morris, P. A. (2006). The bioecological model of
human development. In R. M. Lerner & W. Damon (Eds.), Handbook
of child psychology (Vol. 1, pp. 793–828). Hoboken, NJ: Wiley.
Bryk, A., Sebring, P., Allensworth, E., Luppescu, S., & Easton, J.
(2010). Organizing schools for improvement: Lessons from
Chicago. Chicago: University of Chicago Press.
Buckley, J., Schneider, M., & Shang, Y. (2005). Fix it and they might
stay: School facility quality and teacher retention in Washington,
DC. Teachers College Record, 107, 1107–1123.
Byrnes, V., & Ruby, A. (2007). Comparing achievement between K-8
and middle Schools: A large-scale empirical study. American
Journal of Education, 114, 101–135.
Cappella, E., Kim, H. Y., Neal, J. W., & Jackson, D. R. (2013).
Classroom peer relationships and behavioral engagement in
elementary school: The role of social network equity. American
Journal of Community Psychology, 52, 367–379. doi:10.1007/
s10464-013-9603-5.
Centers for Disease Control and Prevention. (2009). School connect-
edness: Strategies for increasing protective factors among youth.
Atlanta, GA: US Department of Health and Human Services.
Cook, P. J., MacCoun, R., Muschkin, C., & Vigdor, J. (2008). The
negative impacts of starting middle school in sixth grade.
Journal of Policy Analysis and Management, 27, 104–121.
doi:10.1002/pam.20309.
Delany-Brumsey, A., Mays, V., & Cochran, S. (2014). Does
neighborhood social capital buffer the effects of maternal
depression on adolescent behavior problems? Journal of Com-
munity Psychology,. doi:10.1007/s10464-014-9640-8.
Duke, N. N., Borowsky, I. W., & Pettingell, S. L. (2011). Adult
perceptions of neighborhood: Links to youth engagement. Youth
& Society, 44, 408–430. doi:10.1177/0044118X11402852.
Eccles, J. S. (2004). Schools, academic motivation, and stage-
environment fit. In R. M. Lerner & L. D. Steinberg (Eds.),
Handbook of adolescent psychology (2nd ed., pp. 125–153).
Hoboken, NJ: Wiley.
Eccles, J. S., & Midgley, C. (1989). Stage-environment fit: Devel-
opmentally appropriate classrooms for young adolescents.
Research on Motivation in Education, 3, 139–186.
Eccles, J. S., Wigfield, A., Midgley, C., Reuman, D., Iver, D. M., &
Feldlaufer, H. (1993). Negative effects of traditional middle
schools on students’ motivation. The Elementary School Journal,
93, 553–574. doi:10.1086/461740.
Edgerson, D. E., Kritsonis, W. A., & Herrington, D. (2006). Analysis
of the influence of principal–teacher relationships on student
academic achievement: A national focus. National Journal for
Publishing and Mentoring Doctoral Student Research, 1, 1–5.
Flannery, K., Sugai, G., & Anderson, C. (2009). School-wide positive
behavior support in high school. Journal of Positive Behavior
Interventions, 11, 177.
Goldstein, S. E., Young, A., & Boyd, C. (2008). Relational aggression
at school: Associations with school safety and social climate.
Journal of Youth and Adolescence, 37(6), 641–654. doi:10.1007/
s10964-007-9192-4.
Grannis, J. C. (1992). Students’ stress, distress, and achievement in an
urban intermediate school. The Journal of Early Adolescence,
12, 4–27. doi:10.1177/0272431692012001001.
Grills-Taquechel, A. E., Norton, P., & Ollendick, T. H. (2010). A
longitudinal examination of factors predicting anxiety during the
transition to middle school. Anxiety, Stress & Coping, 23,
493–513. doi:10.1080/10615800903494127.
Hannaway, J., & Talbert, J. E. (1993). Bringing context into effective
schools research: Urban-suburban differences. Educational
Administration Quarterly, 29, 164–186. doi:10.1177/
0013161X93029002004.
Hoy, W. K., & Hannum, J. W. (1997). Middle school climate: An
empirical assessment of organizational health and student
achievement. Educational Administration Quarterly, 33,
290–311. doi:10.1177/0013161X97033003003.
Hsu, H.-Y. (2009). Testing the effectiveness of various commonly
used fit indices for detecting misspecifications in multilevel
structure equation models (Doctoral dissertation). Retrieved
from http://hdl.handle.net/1969.1/ETD-TAMU-2009-12-7411.
Jia, Y., Way, N., Ling, G., Yoshikawa, H., Chen, X., Hughes, D.,
et al. (2009). The influence of student perceptions of school
climate on socioemotional and academic adjustment: A com-
parison of Chinese and American adolescents. Child Develop-
ment, 80, 1514–1530. doi:10.1111/j.1467-8624.2009.01348.x.
Jones, S. M., Brown, J. L., & Aber, J. L. (2011). Two-year impacts of a
universal school-based social-emotional and literacy intervention:
An experiment in translational developmental research. Child
Development, 82, 533–554. doi:10.1111/j.1467-8624.2010.01560.x.
Joreskog, K. G., & Goldberger, A. S. (1975). Estimation of a model
with multiple indicators and multiple causes of a single latent
variable. Journal of the American Statistical Association, 70,
631–639. doi:10.1080/01621459.1975.10482485.
Kieffer, M. J. (2013). Development of reading and mathematics skills
in early adolescence: Do K-8 public schools make a difference?
Journal of Research on Educational Effectiveness, 6, 361–379.
doi:10.1080/19345747.2013.822954.
Kline, R. B. (2011). Principles and practice of structural equation
modeling. New York: Guilford press.
Kuperminc, G., Leadbeater, B., & Blatt, S. (2001). School social
climate and individual differences in vulnerability to psychopa-
thology among middle school students. Journal of School
Psychology, 39, 141–159. doi:10.1016/S0022-4405(01)00059-0.
Kuperminc, G. P., Leadbeater, B. J., Emmons, C., & Blatt, S. J.
(1997). Perceived school climate and difficulties in the social
adjustment of middle school students. Applied Developmental
Science, 1, 76–88. doi:10.1207/s1532480xads0102_2.
Maehr, M. L., & Midgley, C. (1996). Transforming school cultures.
Boulder, CO: Westview Press.
Marks, H. M., & Printy, S. M. (2003). Principal leadership and school
performance: An integration of transformational and instruc-
tional leadership. Educational Administration Quarterly, 39,
370–397. doi:10.1177/0013161X03253412.
Marsh, H. W., Hau, K.-T., & Wen, Z. (2004a). In search of golden
rules: Comment on hypothesis-testing approaches to setting
cutoff values for fit indexes and dangers in overgeneralizing Hu
and Bentler’s (1999) findings. Structural Equation Modeling: AMultidisciplinary Journal, 11, 320–341. doi:10.1207/
s15328007sem1103_2.
Marsh, H. W., Ludtke, O., Nagengast, B., Trautwein, U., Morin, A.
J. S., Abduljabbar, A. S., et al. (2012). Classroom climate and
contextual effects: Conceptual and methodological issues in the
evaluation of group-level effects. Educational Psychologist, 47,
106–124. doi:10.1080/00461520.2012.670488.
Marsh, H. W., Wen, Z., & Hau, K.-T. (2004b). Structural equation
models of latent interactions: Evaluation of alternative estima-
tion strategies and indicator construction. Psychological Meth-
ods, 9, 275–300. doi:10.1037/1082-989X.9.3.275.
McCoy, D. C., Roy, A. L., & Sirkman, G. M. (2013). Neighborhood
crime and school climate as predictors of elementary school
44 Am J Community Psychol (2014) 54:28–45
123
academic quality: A cross-lagged panel analysis. American
Journal of Community Psychology, 52, 128–140. doi:10.1007/
s10464-013-9583-5.
Midgley, C., Anderman, E., & Hicks, L. (1995). Differences between
elementary and middle school teachers and students: A goal
theory approach. The Journal of Early Adolescence, 15, 90–113.
doi:10.1177/0272431695015001006.
Mitchell, M. M., Bradshaw, C. P., & Leaf, P. J. (2010). Student and
teacher perceptions of school climate: A multilevel exploration
of patterns of discrepancy. Journal of School Health, 80,
271–279. doi:10.1111/j.1746-1561.2010.00501.x.
Muthen, B. O. (1989). Latent variable modeling in heterogeneous
populations. Psychometrika, 54, 557–585. doi:10.1007/
BF02296397.
Muthen, L. K., & Muthen, B. O. (1998–2012). Mplus user’s guide
(7th ed.). Los Angeles, CA: Muthen & Muthen.
Nathanson, L., McCormick, M., & Kemple, J. (2013). Strengthening
assessments of school climate: Lessons from the NYC school survey.
New York: The Research Alliance for New York City Schools.
Retrieved from http://files.eric.ed.gov/fulltext/ED543180.pdf.
National Research Council. (2004). Engaging schools: Fostering high
school students’ motivation to learn. Washington, DC: National
Academies Press. Retrieved from http://www.loc.gov/catdir/toc/
ecip047/2003017626.html.
National School Climate Council. (2007). The school climate
challenge: Narrowing the gap between school climate research
and school climate policy, practice guidelines and teacher
education policy. Retrieved from http://nscc.csee.net/.
Opdenakker, M., & Damme, J. V. (2007). Do school context, student
composition and school leadership affect school practice and
outcomes in secondary education? British Educational Research
Journal, 33, 179–206. doi:10.1080/01411920701208233.
Preacher, K. J., Zhang, Z., & Zyphur, M. J. (2011). Alternative
methods for assessing mediation in multilevel data: The
advantages of multilevel SEM. Structural Equation Modeling:
A Multidisciplinary Journal, 18, 161–182. doi:10.1080/
10705511.2011.557329.
Raver, C. C., Jones, S. M., Li-Grining, C., Zhai, F., Metzger, M. W.,
& Solomon, B. (2009). Targeting children’s behavior problems
in preschool classrooms: A cluster-randomized controlled trial.
Journal of Consulting and Clinical Psychology, 77, 302–316.
doi:10.1037/a0015302.
Rhodes, J. E., Camic, P. M., Milburn, M., & Lowe, S. R. (2009).
Improving middle school climate through teacher-centered
change. Journal of Community Psychology, 37, 711–724.
doi:10.1002/jcop.20326.
Rockoff, J. E., & Lockwood, B. B. (2010). Stuck in the middle:
Impacts of grade configuration in public schools. Journal of
Public Economics, 94, 1051–1061. doi:10.1016/j.jpubeco.2010.
06.017.
Rutter, M., & Maughan, B. (2002). School effectiveness findings
1979–2002. Journal of School Psychology, 40, 451–475. doi:10.
1016/S0022-4405(02)00124-3.
Schwartz, A. E., Stiefel, L., Rubenstein, R., & Zabel, J. (2011). The
path not taken: How does school organization affect eighth-
grade achievement? Educational Evaluation and Policy Ana-
lysis, 33, 293–317. doi:10.3102/0162373711407062.
Schwerdt, G., & West, M. R. (2013). The impact of alternative grade
configurations on student outcomes through middle and high
school. Journal of Public Economics, 97, 308–326. doi:10.1016/
j.jpubeco.2012.10.002.
Seidman, E., Aber, J. L., & French, S. E. (2004). The organization of
schooling and adolescent development. In K. I. Maton, C.
J. Schellenbach, B. J. Leadbeater, & A. L. Solarz (Eds.),
Investing in children, youth, families, and communities:
Strengths-based research and policy (pp. 233–250). Washington,
DC: American Psychological Association.
Seidman, E., Allen, L., Aber, J. L., Mitchell, C., & Feinman, J.
(1994). The impact of school transitions in early adolescence on
the self-system and perceived social context of poor urban youth.
Child Development, 65, 507–522. doi:10.2307/1131399.
Simmons, R. G., & Blyth, D. A. (1987). Moving into adolescence:
The impact of pubertal chance and school context. New York:
Aldine Transaction.
Skaalvik, E. M., & Skaalvik, S. (2007). Dimensions of teacher self-
efficacy and relations with strain factors, perceived collective
teacher efficacy, and teacher burnout. Journal of Educational
Psychology, 99, 611–625. doi:10.1037/0022-0663.99.3.611.
Skinner, E. A., & Wellborn, J. G. (1994). Coping during childhood
and adolescence: A motivational perspective. In D. L. Feather-
man, R. M. Lerner, & M. Perlmutter (Eds.), Life-span develop-
ment and behavior (Vol. 12, pp. 91–133). Hillsdale, NJ:
Lawrence Erlbaum.
Smith, E., Osgood, D., Caldwell, L., Hynes, K., & Perkins, D. (2013).
Measuring collective efficacy among children in community-based
afterschool programs: Exploring pathways toward prevention and
positive youth development. American Journal of Community
Psychology, 52, 27–40. doi:10.1007/s10464-013-9574-6.
Sweetland, S. R., & Hoy, W. K. (2000). School characteristics and
educational outcomes: Toward an organizational model of student
achievement in middle schools. Educational Administration
Quarterly, 36, 703–729. doi:10.1177/00131610021969173.
Thijs, J. T., Koomen, H. M. Y., & van der Leij, A. (2008). Teacher–
child relationships and pedagogical practices: Considering the
teacher’s perspective. School Psychology Review, 37, 244–260.
Trickett, E. J., & Rowe, H. L. (2012). Emerging ecological
approaches to prevention, health promotion, and public health
in the school context: Next steps from a community psychology
perspective. Journal of Educational and Psychological Consul-
tation, 22, 125–140. doi:10.1080/10474412.2011.649651.
Tschannen-Moran, M., & Hoy, A. W. (2001). Teacher efficacy:
Capturing an elusive construct. Teaching and Teacher Educa-
tion, 17, 783–805. doi:10.1016/S0742-051X(01)00036-1.
Wang, M.-T., & Eccles, J. S. (2012). Adolescent behavioral, emotional,
and cognitive engagement trajectories in school and their differ-
ential relations to educational success. Journal of Research on
Adolescence, 22, 31–39. doi:10.1111/j.1532-7795.2011.00753.x.
Wang, M. C., & Gordon, E. W. (2012). Educational resilience in
inner-city America: Challenges and prospects. Mahwah, NJ:
Routledge.
Warren, J. S., Edmonson, H. M., Griggs, P., Lassen, S. R., McCart,
A., Turnbull, A., et al. (2003). Urban applications of school-wide
positive behavior support critical issues and lessons learned.
Journal of Positive Behavior Interventions, 5, 80–91. doi:10.
1177/10983007030050020301.
Wasik, B. A., Bond, M. A., & Hindman, A. (2006). The effects of a
language and literacy intervention on Head Start children and
teachers. Journal of Educational Psychology, 98, 63–74. doi:10.
1037/0022-0663.98.1.63.
Way, N., Reddy, R., & Rhodes, J. (2007). Students’ perceptions of
school climate during the middle school years: Associations with
trajectories of psychological and behavioral adjustment. Amer-
ican Journal of Community Psychology, 40, 194–213. doi:10.
1007/s10464-007-9143-y.
Weiss, C. C., & Kipnes, L. (2006). Reexamining middle school effects:
A comparison of middle grades students in middle schools and k-8
schools. American Journal of Education, 112, 239–272.
Williamson, R., & Johnston, J. H. (1999). Challenging orthodoxy: An
emerging agenda for middle level reform. Middle School
Journal, 30, 10–17.
Am J Community Psychol (2014) 54:28–45 45
123