National Strategy for Financial Inclusion - BSP
43
0
-
Upload
khangminh22 -
Category
Documents
-
view
4 -
download
0
Transcript of National Strategy for Financial Inclusion - BSP

0

i
Contents
I. About financial inclusion ......................................................................................................................................................1
What is financial inclusion and why does it matter, especially now? ...................................................1
What does being financially included look like? ............................................................................................... 2
Who are the financially excluded? .............................................................................................................................. 3
What drives or impedes financial inclusion? ....................................................................................................... 6
II. About the strategy ................................................................................................................................................................... 11
Why we need a strategy ................................................................................................................................................... 11
Refreshing the National Strategy for Financial Inclusion ........................................................................... 12
III. The National Strategy for Financial Inclusion 2022-2028 ............................................................................. 14
The NSFI 2022-2028 at a glance ................................................................................................................................. 14
The vision .................................................................................................................................................................................. 15
Desired outcomes ................................................................................................................................................................ 15
Strategic objectives ............................................................................................................................................................ 17
Priority initiatives ................................................................................................................................................................. 19
Key performance indicators (KPIs) and targets ............................................................................................... 22
IV. The strategy governance framework ....................................................................................................................... 26
The Financial Inclusion Steering Committee (FISC) ..................................................................................... 26
The working groups .......................................................................................................................................................... 27
Regional and local development councils ......................................................................................................... 28
The FISC Secretariat .......................................................................................................................................................... 29
Annex A. NSFI 2015-2021 .......................................................................................................................................................... 30
Annex B. FISC members ............................................................................................................................................................ 31
Annex C. Description of KPIs ................................................................................................................................................. 33
References ......................................................................................................................................................................................... 39

ii
List of abbreviations BDA basic deposit account Coop financial cooperative E-Money electronic money EMI e-money issuer DFS digital financial services FinLit financial literacy FIS Financial Inclusion Survey FISC Financial Inclusion Steering Committee GDP gross domestic product KPI key performance indicator LDP Local Development Plan LGU local government unit MFI microfinance institution MFI NGO microfinance nongovernment organization MSME micro, small, and medium enterprise NSFI National Strategy for Financial Inclusion PDP Philippine Development Plan PhilSys Philippine Identification System RDP Regional Development Plan WG working group

1
I. About financial inclusion What is financial inclusion and why does it matter, especially now?
Financial inclusion is a state in which everyone, especially the vulnerable sectors, has effective access to a wide range of financial services. Effective access means not only the availability of financial products and services, but that these products and services are appropriately designed, of good quality, and responsive to the varied needs of individuals and businesses—whether for saving, payments, financing, investing, or getting insured. Rather than being an end in itself, financial inclusion is a means to achieve broader aspirations. Its goal is not merely providing universal access to financial services, but ensuring that these services truly enhance the financial health of their users. Financial health is the ability of an individual to meet financial obligations, absorb and recover from financial shocks, reach long-term goals, and develop a sense of control of their finances.1 For enterprises, access to appropriate financing and financial services can facilitate business growth and livelihood opportunities for many Filipinos.2 Financial inclusion, therefore, helps lay the groundwork for sustainable and equitable national development.3 As such, it is an objective pursued not only by the Philippines but by many countries around the world. International bodies and multilaterals have established dedicated advocacies, workstreams, and committees for promoting financial inclusion globally—all of which speak to its urgency and importance.4 As the world reels from the unprecedented effects of the COVID-19 pandemic, the pursuit of financial inclusion has become even more urgent and crucial. The Philippines has been working toward greater inclusion in the last few years,5 launching an NSFI in 2015 and establishing the high-level Financial Inclusion Steering Committee or FISC in 2016 to drive the strategy. The pandemic, coupled with fast-paced developments in the digital financial landscape, have brought to fore a need for a recalibrated financial inclusion strategy. The launch of this new six-year strategy aims to facilitate a coherent, well-coordinated, whole-of-nation undertaking toward the achievement of its vision of inclusive growth and financial resilience for every Filipino.
1 UNSGSA, 2021 2 The empirical literature on financial deepening indicates that its pro-growth effect comes mostly through enterprise credit while its pro-poor nature is linked to the changing of the structure of the economy and allowing more entry into the labor market. According to (Beck, 2016), the effects of financial deepening on employment and poverty alleviation do not necessarily come through the democratization of credit but rather a more effective credit allocation within the economy. 3 The supporting role of financial inclusion is explicitly recognized in seven (7) of the 17 Sustainable Development Goals. 4 United Nations Secretary-General’s Special Advocate for Inclusive Finance for Development (UNSGSA), Consultative Group to Assist the Poor (CGAP), G20 Global Partnership for Financial Inclusion, ASEAN Working Committee on Financial Inclusion (WC-FINC), Alliance for Financial Inclusion (AFI) 5 The Philippines through the National Credit Council (NCC) also launched the National Strategy for Microfinance in 1997 and National Strategy for Microinsurance in 2009. The NCC is a policy council composed of representatives from both the government and the private sector. It is currently lodged with the Department of Finance and chaired by the Finance Secretary.
2
What does being financially included look like? While often equated with having an account, financial inclusion goes beyond account ownership. Being financially included enables one to access and use an appropriate financial product for a particular need, such as for building a buffer for emergencies; sending money to family in the province; starting a business; buying a house; protecting the family’s cashflow in times of disaster, health crisis, retirement, and death; or building wealth. Being financially included therefore means having access to a wide range of fit-for-purpose financial services in line with one’s capabilities and needs. It does not mean that one will never have to worry about money again, but that one will have more and better options to save, borrow, transfer funds, invest, and get protection for one’s life and assets. Interest-bearing bank accounts, e-wallets, pooled funds, housing loan products, credit cards, and life insurance are just some of the financial products that help consumers and MSMEs smooth consumption, manage risk, and confidently pursue long-term financial goals. Among these tools, owning an account is deemed a core financial inclusion indicator as it facilitates basic financial transactions, i.e., store, send, and receive money. With appropriate use of these tools bolstered by financial literacy, consumers and businesses can become more financially resilient.

3
That said, while financial inclusion and literacy are significant contributors to a person’s financial resilience, it is important to also recognize the crucial role of access to public welfare programs such as those for healthcare, education, housing, and old-age pension in financial resilience. Cash transfers and pensions are two such public programs that more directly interact with financial inclusion as an efficiency mechanism and an ancillary objective. Who are the financially excluded?
Financial exclusion disproportionately affects millions of Filipinos in the lower income classes and those who are unemployed, less educated, and belonging to the younger generation. Other underserved and unserved segments include senior citizens, migrant workers and their families, persons with disabilities, indigenous peoples, forcibly displaced persons, those who are excluded due to their religious beliefs, and other marginalized segments. Financial exclusion is also prevalent in the agriculture, MSME, and startup sectors as well as among informal workers. About 7 in 10 adult Filipinos are financially excluded, according to the 2019 FIS of the Bangko Sentral ng Pilipinas (BSP). This is based on the part of the adult population who own a transaction account that can be used to store, send, and receive funds. A significant gap in account penetration is seen especially in terms of socioeconomic class and employment status. Only 27% of those in the lower class (E) have an account, compared to 72% among the upper class (ABC1).6 Employed individuals are twice as likely (39%) to own an account than those who are unemployed (19%).
Note: All figures refer to account ownership. 2019 Financial Inclusion Survey (BSP, 2020)
6 Socioeconomic classifications: AB - upper class; C1 - upper middle class; C2 - upper lower class; D – middle class; and E – lower class.

4
Interestingly, the rural population has a slightly higher account penetration rate (30%) compared to the urban population (27%), a reverse of the 2017 gap in favor of the latter. This coincides with the increase in the number of accounts in MFIs, which have a strong presence in the countryside. Nearly 6 in 10 adults who have a college degree have an account, compared to only 3 in 10 among those who did not reach college level. Only 8% of young adults (aged 15–19) have an account, which is significantly lower than in other age groups. Unlike in most countries, women in the Philippines are more financially included than men based on indicators such as account ownership, savings, credit, insurance, remittance, and making payments. Disaggregation of account ownership data by type of account in 2019, however, showed that for bank accounts, men have a higher ownership level (13.8%) compared to women (10.7%). In financial investment, the gender gap favored men: only 18.9% of women had investments, which is lower than the 30.3% for the men. There was also a wide gap in 2019 in receiving payments: more than half of the men (51%) compared to 35% of the women. This gap coincides with employment status, as most of the payments received are in the form of wages and salaries. This is also reflective of the gender gap in the labor force participation rate, which was higher among men at 76.1% compared to women at 52.3% as of November 2021.7
7 PSA, 2022

5
More than half (53%) of adult Filipinos had savings in 2019, an increase from 48% in 2017. Informal ways of saving remain prevalent among adults who save money, with nearly half (51%) of them keeping their savings at home. In credit, more than half of borrowers sourced their loans from informal sources, specifically family and friends (44%) and informal lenders (10%). Formal borrowing decreased by 7 percentage points from 63% in 2017 to 56% in 2019, while informal borrowing grew significantly by 15 percentage points, from 39% to 54%, during the same period. While the share of adults with insurance grew to 23% in 2019 from 18% in 2017, insurance premiums account only for around 2% of the GDP in 2021.8 Investment ownership likewise increased to 25% of adults in 2019 from 22.5% in 2017; however, most of these investments are mandatory contributions to the Social Security System (88%) and the Pag-IBIG Fund (52%). Other financially excluded sectors of the economy include informal workers, MSMEs, and smallholder farmers and fisherfolk. Poverty incidences for farmers and fisherfolk stood at 31.6% and 26.2%, respectively—the highest among the basic sectors—in 2018.9 These segments continue to have difficulty accessing and using financial products and services, citing hindrances such as the lack of required documents to open a personal or business account, associated costs in opening and maintaining accounts, lack of financial data that will allow them access to formal credit, and limited awareness and knowledge about financial products and services. Among MSMEs, for instance, lack of financing and capital was cited as the top barrier for microenterprises and the second largest barrier for small enterprises in the Asian Development Bank’s (ADB) 2021 Survey of MSMEs. In contrast, in this same survey medium enterprises ranked lack of financing as the sixth largest barrier, indicating that financing is especially problematic for the smallest firms. Inclusion of these productive segments into the financial system is crucial as the country tries to recover from the crisis and regain its momentum in economic growth. The agriculture and MSME sectors are the primary sources of livelihood for many Filipinos. In 2020, MSMEs accounted for 99.5% of total enterprises in the country and generated 63% of total employment,10 but recent trends show that the total amount of bank loans to MSMEs as a percentage of their total loan portfolio has been declining.11 On the other hand, the agriculture sector showed a steady share in the country’s GDP at around 10%.12 Since 2018, however, the share of loans to this sector have been declining as well.
8 IC, 2021 9 PSA, 2021 10 DTI, 2020 11 Based on BSP’s historical data from 2015 to 2021 12 Statista, 2021

6
What drives or impedes financial inclusion? With over 109 million Filipinos,13 the Philippines is the thirteenth largest country in the world by population size. A large, growing market attracts investments and creates
more jobs. Millennials make up one-third of the country’s total population. The country’s median age, 25.7 years old, reflects a youthful profile and an abundance of productive talent. A demographic dividend, marked by accelerated economic growth resulting from the productivity of an expanding work force, can lead to steadily rising savings and investment rates.14 The financial landscape is rapidly evolving, especially with the digitalization of financial services which brings more opportunities to the unserved and underserved areas. The rise of digital banks, open finance, and other financial technology (fintech) innovations are revolutionizing the design, delivery, and consumption of financial products and services. BigTech (the biggest technology companies) and TechFin (financial service provided by large technological companies) are creating super platforms that have the potential to transform the digital finance ecosystem. The adoption of DFS has increased considerably, largely driven by the COVID-19 pandemic during which individuals and businesses opted for more online transactions.
13 PSA, 2021 14 The Philippines is expected to benefit from the demographic dividend between the years 2025-2070 (NEDA, 2018)

7
The share of digital payments against the total volume of retail payment transactions doubled to 20% in 2020 from 10% in 2018. More Filipinos have mobile phones than financial accounts; more than half of Filipinos use the internet and stay online for an average of four (4) hours every day. The pandemic offers lessons on the growing popularity of tech-driven services and businesses for both basic and non-basic needs such as food, health, finance, and shopping. While the younger population is already open to online shopping and e-commerce, the need for social distancing has pushed the cash centric and face-to-face shopping culture toward a more digital one, and this is expected to continue.15 The pivot of both consumers and businesses to online platforms will continue to increase uptake of digital payments and provide a stronger business case for financial institutions to go digital and embrace digital transformation.
The inclusive digital finance infrastructure has been greatly enhanced with the implementation of PhilSys, the national digital identity system. PhilSys will not only address the lack of identity documents as an oft-cited barrier to account opening, but can also facilitate greater innovation in DFS. As of end-2021, 7.2 million PhilSys registrants have applied for an account with the Land Bank of the Philippines under a co-location arrangement with the Philippine Statistics Authority. While these trends look promising, financial inclusion in the country is still impeded by economic, physical, and behavioral issues that need addressing.
15 Investment Trade Administration (ITA, 2021)

8
Lack of access to financial institutions hampers financial inclusion. Factors such as population and income level of the region influence the presence of financial institutions. In 2020, the top three regions with the highest population and income 16— the National Capital Region (NCR), Region IV-A (CALABARZON), and Region III (Central Luzon) —also enjoyed the highest presence of financial institutions. On the other hand, financial institutions were sparse in regions with lower population size and aggregate regional output—the Bangsamoro Autonomous Region in Muslim Mindanao (BARMM), Cordillera Administrative Region (CAR), and Region IX (Zamboanga Peninsula). Furthermore, at least one of the poorest provinces in the country, or those with the highest poverty incidences, belong to the lagging regions.17 This suggests that the lack of economic activity in these areas due to security concerns, vulnerability to disasters, or lack of physical access limits demand or hinders the expansion of financial institutions.
The Philippines has a high rural population and many infrastructure gaps. Financial inclusion requires the basic infrastructure and support systems to be present. These include physical infrastructure such as roads, water and power supply, and mobile and internet connectivity as well as support systems such as health, education, and employment. The pandemic’s disproportionate impact on the poorest and most vulnerable will exacerbate already high and rising income and wealth inequality. The Philippines has also been named as one of the countries most vulnerable to climate change and disaster risks due to its geographic location. The agriculture sector and other vulnerable communities have been affected for a long time and need to build resilience to mitigate losses.
16 Based on Gross Regional Domestic Product (GRDP) (PSA, 2021) 17 PSA, various years

9
Challenges in financing agriculture workers and MSMEs are further exacerbated by inadequate support structures that could reduce the risks and costs of lending to these sectors. Such support structures would include, among others, a robust credit information system, a credible warehouse receipt system, credit and agriculture insurance, and guarantee programs. On the demand-side, the 2019 FIS showed that lack of money was cited by 45% of adult Filipinos as a reason for not having an account, related to the perceived high cost of opening and maintaining an account. World Bank Findex data (2017) showed that the percentage of unbanked Filipinos citing cost concerns as barrier is significantly higher than the country’s Southeast Asian peers. Other reasons noted were lack of documentary requirements (26%) and distance to financial institution (8%). In addition, 31% of those who do not transact with financial access points cite being intimidated by the formal setup in bank branches and other financial institutions. For the agriculture and MSME sectors, lack of formalization and productivity issues, including low financial and business management capabilities, constrain bankability of these borrowers. In DFS, further gains can be achieved if the country’s internet connectivity improves. While mobile internet speeds in the Philippines have gradually improved over the

10
years, the country ranked fifth among 10 Southeast Asian countries and seventy-second out of 139 countries globally in a July 2021 speedtest report.18 With increasing digitalization, there is also increasing pressure on consumer protection capabilities and resources. The pandemic has brought wide public concerns on the prevalence of online scams and lack of cybersecurity, which could reverse gains from promoting trust and confidence in the use of DFS. Apart from industry efforts toward cyber-resilience, improving financial and digital literacy can address the lack of awareness and lack of trust, which 48% and 39% of Filipino adults, respectively, cited in the 2019 FIS as reasons for not using the internet for financial transactions.
18 DICT, 2021

11
II. About the strategy
Why we need a strategy Financial inclusion is a national development agenda that demands deliberate and coordinated efforts of the government, private sector, and civil society. A national strategy serves as the guiding framework for all stakeholders working together to accelerate financial inclusion in the country. It facilitates a comprehensive and coherent approach to identifying, implementing, and evaluating financial inclusion efforts. As such, it aids in the alignment, prioritization, and delivery of high-impact initiatives across the government and private sectors. Finally, the national strategy serves as a communication tool to the wider public to generate and sustain broad-based support for financial inclusion. While the national financial inclusion strategy is designed as a stand-alone document, it is developed to align with and support the broader national aspirations of the PDP and the AmBisyon Natin 2040 vision. The PDP seeks to lay down a “solid foundation for more inclusive growth, a high-trust and resilient society, and a globally competitive knowledge economy.” The country’s shared vision in AmBisyon Natin 2040 is that “all Filipinos will enjoy a stable and comfortable lifestyle, secure in the knowledge that we have enough for our daily needs and unexpected expenses, that we can plan and prepare for our own and our children’s futures. Our families live together in a place of our own, yet we have the freedom to go where we desire, protected and enabled by a clean, efficient, and fair government.” 19 Both documents clearly recognize financial resilience as a goal. Financial inclusion, i.e., access to wider and better options of welfare-enhancing financial services, is an important step for individuals, households, and enterprises in the path toward financial resilience.
19 AmBisyon Natin 2040 (NEDA, 2016); PDP 2017-2022 (NEDA, 2017) updated PDP released in 2021
12
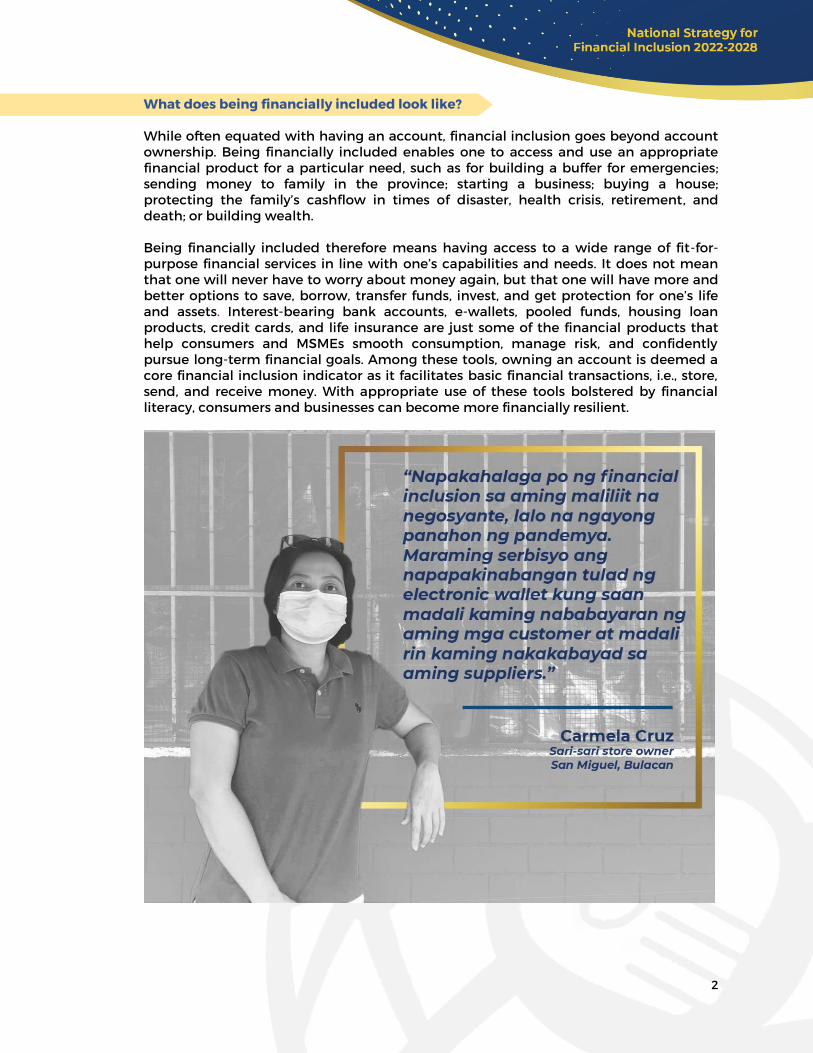
Refreshing the National Strategy for Financial Inclusion The Philippines launched its first NSFI in 2015 which outlined the vision, strategic objectives, and the guiding principles for promoting financial inclusion (Annex A). The launching of the NSFI led to the mainstreaming of financial inclusion as a policy objective and brought together champions from the public and private sectors to work toward its achievement. In 2016, the interagency Financial Inclusion Steering Committee (FISC) was officially established under Executive Order No. 208 to drive the implementation of the NSFI. Chaired by the BSP, the FISC is now composed of 21 government agencies, up from just 13 when it was created (Annex B). In November 2021, the FISC decided to launch an updated strategy to sharpen its focus, targets, and priorities given the significant developments since its launch six years before. The financial services landscape is rapidly evolving along with consumer needs and preferences, driven not least by the COVID-19 pandemic. MSME financing has never been more crucial as the government steers the country’s economic recovery to regain pre-pandemic momentum toward poverty alleviation. Updating the NSFI aims to ensure that it remains a responsive and relevant blueprint for mobilizing the nation to accelerate financial inclusion and enable more Filipinos to build financial resilience and inclusive growth. Following the FISC’s decision, the BSP as FISC Secretariat conducted consultation sessions with representatives of 125 organizations from various sectors including, among others, consumer groups, basic sectors, MSMEs, social development agencies, LGUs, the financial services industry, and the academe. Nearly 300 people participated

13
in a series of 13 stakeholder meetings held from November to December 2021 to elicit inputs on financial inclusion aspirations, opportunities, challenges, and ways forward. In line with its Inclusive Finance Development Program, the ADB provided support in the updating of the NSFI. ADB consultants facilitated stakeholder consultations and provided inputs to the drafting of the strategy as well as to the design of the monitoring and evaluation framework.

14
III. The National Strategy for Financial Inclusion 2022-2028
The NSFI 2022-2028 at a glance
The new NSFI will serve as a six-year blueprint to achieve the vision of driving financial inclusion toward broad-based growth and financial resilience. It defines four desired outcomes as pathways to the vision and upon which performance of the strategy should be measured. To achieve the desired outcomes, four strategic objectives will be pursued, with priority initiatives identified, taking into account the key enablers of financial inclusion.
The strategy reflects certain key beliefs and assumptions about financial inclusion: 1. Financial inclusion is not an end goal but a means to an end. It aids individuals and
households to increase financial health and resilience and enables enterprises to grow and provide livelihood opportunities for more Filipinos.
2. Financial exclusion disproportionately affects certain segments and demographics. As we promote market-based solutions for financial inclusion toward resilience, we also recognize the importance of financial safety nets facilitated by government programs targeting the most vulnerable segments.

15
3. Financial inclusion involves multi-dimensional factors and therefore should not be
the exclusive province of financial sector regulators. A conducive regulatory environment is a crucial but insufficient condition for improving financial inclusion, given the myriad issues that surround it including on digital infrastructure and financial literacy.
The importance of creating a shared understanding among stakeholders of the priorities, timelines, and assigned responsibilities is well recognized. Thus, building on the principles-based approach of the original strategy, the NSFI 2022-2028 adopts a six-year timeframe with specific interventions, outcome measures, and targets. Through these new elements, the NSFI 2022-2028 can also become not just a roadmap but also a communication tool for the country’s financial inclusion goals and stakeholder commitment.
The vision
Financial inclusion toward inclusive growth and financial resilience
The pursuit of financial inclusion is motivated by our collective aspiration of shared prosperity in the country. We aim for all Filipinos and their families to be financially included so they can build financial resilience and maximize opportunities. These will, in turn, enable them to benefit from and contribute to the country’s economic growth. Empirical evidence shows that financial inclusion can aid self-employment, improve household consumption, support greater local economic activity, and reduce inequality.20
The vision has been shaped by the valuable lessons of the COVID-19 pandemic and the many calamities we have experienced as a country. These crises have laid bare the vulnerabilities of the people who have no tools and capabilities to develop resilience. Resilience is defined as “the ability of individuals and households to reduce and mitigate risks, as well as to cope with and recover from various shocks, stresses, and life cycle events, so as to minimize any reduction in short-term consumption or long-term well-being.”21 Desired outcomes The NSFI is focused on delivering four key outcomes:
1. Reduced disparities in financial inclusion. The strategy should not only improve the overall national financial inclusion level but also reduce, if not eliminate, disparities in levels of financial inclusion based on certain demographic attributes such as income, sector, geographical location, age, and gender. The increasing digitalization of financial services, generally a boon for financial inclusion, may inadvertently exacerbate or create new forms of exclusion in some segments. Such vulnerabilities should be recognized and deliberately addressed. Gender inclusion has become an urgent concern in global development communities. The Philippines boasts gender inclusion generally in favor of women based on most indicators.
20 WB, 2014 21 CGAP, 2021
16
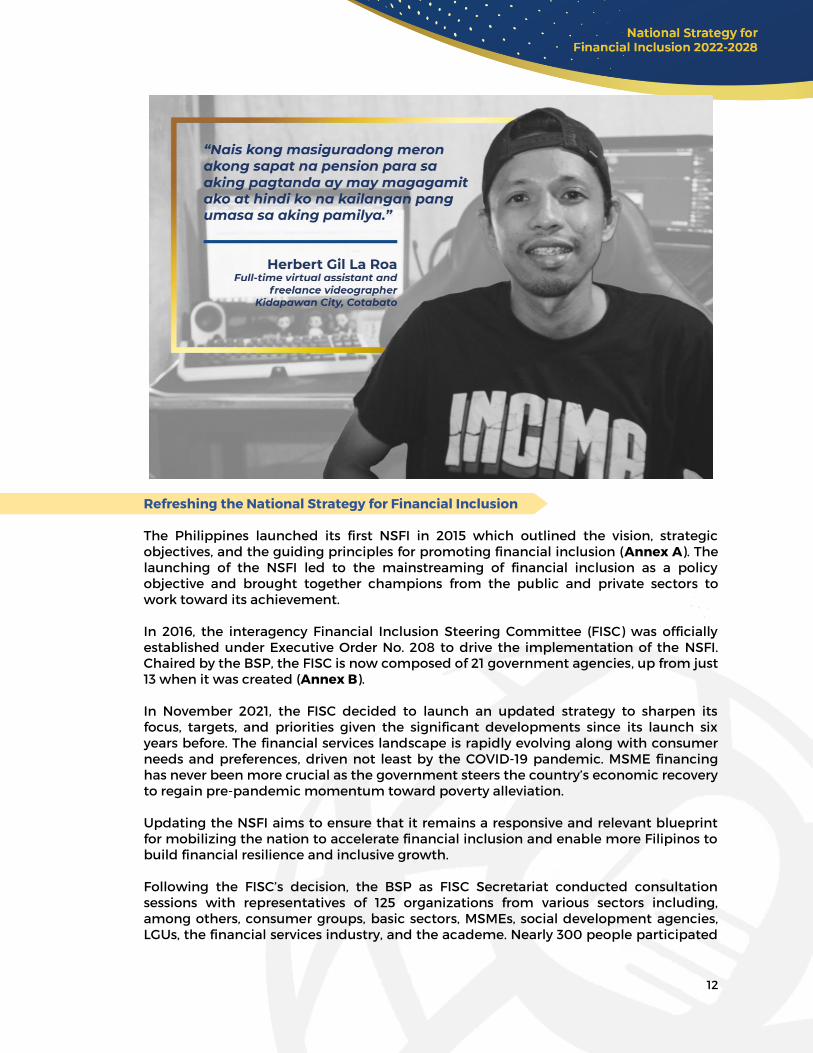
2. Improved financial health and resilience. The strategy should increase access to financial services and tools that best help individuals and households, especially the most vulnerable, improve their financial health and resilience. Initiatives should ensure more Filipinos are able to safely save, get insured, and build financial assets to protect their ability to meet their family’s basic needs and long-term goals. For many poor and informal workers, market solutions alone may be insufficient in addressing their resilience-building needs; government programs providing cash assistance, social insurance, and pension are crucial. While not traditionally considered a financial inclusion intervention, the successful implementation of these programs toward broad-based financial resilience can enhance and, at the same time, be strengthened by financial inclusion.
3. More financially capable and empowered consumers. Improving access to and availability of a wider range of financial services alone will not ensure that financial inclusion will lead to enhanced consumer well-being. Consumers need to be capable of making informed and good financial decisions; confident in using appropriate financial services to best meet their needs; and empowered to seek resolution if wronged. An empowered and capable base of financial consumers can also help promote good market conduct and improve financial services, resulting in a virtuous cycle for financial inclusion.
4. Increased access to finance for MSMEs, including startups, and the agriculture sector. MSMEs generated a total of 5,380,815 jobs, or 63% of the country’s total employment, in 2020.22 There are 11.2 million Filipinos employed in the agriculture sector, comprising 24.5% of the total workforce as of November 2021.23 Indeed a significant number of Filipinos rely on these sectors for livelihood and income, which
22 DTI, 2020 23 PSA, 2022

17
make them an effective pathway for financial inclusion to drive inclusive economic growth.24 Improving access to appropriate financing of agriculture workers and MSMEs, including startups, can help them grow and become more productive toward generating formal employment and livelihood for more Filipinos. Lack of access to finance is a top challenge cited by MSMEs, particularly micro and small businesses, in surveys.25 Addressing this challenge aims to unlock the full transformative potential of the sector in the country.
Strategic objectives These four strategic objectives are identified as the major areas of intervention to achieve desired outcomes and, thus, the financial inclusion vision of inclusive growth and financial resilience for all.
1. Promote inclusive digital finance. Digital technologies can facilitate significant cost-
efficiencies and innovation that enable the viable delivery of financial services to the low-income mass market and small enterprises. To fully harness the inclusion and welfare-enhancing potential of digital innovations, we need to put in place a conducive regulatory environment with the necessary digital infrastructure that enable, if not compel, diverse market players to deliver innovative financial services that meet the varying needs and capabilities of the broader population and MSMEs. Digital innovations should improve the customer experience, affordability, and availability of welfare-enhancing financial services beyond accounts and payments.
24 Monsod, 2017 25 WB, 2015 and ADB, on-going

18
2. Strengthen financial education and consumer protection. An empowered and capable financial consumer needs to develop the right financial knowledge, skills, and behavior. Well-designed, comprehensive, and sustainable digital financial literacy programs are crucial interventions which can be delivered by various stakeholders, guided by a common framework. However, equally important for consumer empowerment is having an appropriate regulatory environment to strengthen the market conduct of all types of providers.
3. Enhance access to risk protection and social safety nets. Well-designed public and private mechanisms such as cash assistance, health and unemployment insurance, disaster risk insurance, and pension can promote financial inclusion and resilience especially in the vulnerable sector. Strategic interventions should support the development and enhancement of these mechanisms toward optimizing the financial inclusion and resilience impact on the target beneficiaries. Financial inclusion can also enhance the efficiency and coverage of the program through digital finance.
4. Enhance agriculture and MSME financing ecosystem. A sustainable financing ecosystem is one that enables and attracts diverse players to serve the agriculture and MSME clients, including startups, as a strategic market segment. This necessitates having in place the financial infrastructure (e.g., credit guarantees, credit information registry) and legal frameworks (e.g., secured transactions framework) aimed at reducing the risks and associated costs of serving these sectors, whether in the form of credit or equity. Government assistance programs, financial or nonfinancial, can be designed in a way that increases the income potential and bankability of their beneficiaries. As the agriculture and MSME sectors are increasingly recognized as a

19
strategic market, more financial institutions would invest in developing the specialized skills, tools, and approaches to effectively compete for this market.
Priority initiatives Guided by the strategic objectives, priority initiatives were identified along with the primary responsible entity(ies) and indicative timelines. The priority initiatives aim to inform what needs to be implemented within an agreed timeframe to promote greater focus and accountability under the strategy.
Initiative Responsible entity* Timeline
Promote inclusive digital finance
Promote adoption of PhilSys in the financial sector
PSA, BSP, SEC, IC 2022-2023
Expand digital payment use cases: interoperable bills payment government collections and
disbursements cross-border remittances
BSP, PPMI DBM, DOF, DILG, BTr, COA, PLLO
2022-2023
Enable digital payments for all community BSP, DILG, DOTr, financial 2022-2023

20
Initiative Responsible entity* Timeline
markets and local transportation institutions
Develop and implement a regulatory framework for the participation of qualified MFI NGO and cooperatives in the Philippine Payments Management, Inc. (PPMI) or another payment system management body
BSP, CDA, SEC, MNRC 2022-2023
Promote the implementation of an industry sandbox26 for digital finance innovations
Financial Sector Forum (FSF)27
2022-2024
Promote the adoption of insurtech28 IC 2022-2024
Support the digital transformation of rural financial institutions and other last-mile providers, including MFIs
BSP, SEC, IC, CDA, MNRC 2022-2024
Push for reforms to fast-track digital connectivity as enabler of inclusive digital finance
DICT, NTC 2022-2024
Promote shared agent network framework to increase ubiquity and affordability of cash agent services
BSP, financial institutions 2023-2026
Promote use of alternative data for credit evaluation
BSP, SEC, IC, NPC, financial institutions
2022-2026
Promote development of interoperable ‘offline’ digital payment solutions
BSP, PPMI, financial institutions
2022-2026
Expand open finance29 use cases for mass market implementation
BSP, SEC, IC, CDA, FSF, NPC, PCC, financial institutions
2022-2028
Strengthen financial education and consumer protection
Develop and implement a common framework for effective, consistent, and sustainable delivery, monitoring, and evaluation of financial literacy programs focusing on:
foundations of financial health effective and safe use of DFS investor protection and education on
traditional assets (e.g., bonds, equities) and emerging digital finance products (e.g., virtual assets)
financial consumer rights and consumer assistance mechanisms
managing finances and financing options for MSMEs
BSP, FinLit partners 2022-2023
26 Based on (CGAP, 2018) definition, a sandbox is a framework set up by regulator(s) that allows fintech startups and other innovators to conduct live experiments in a controlled environment under the supervision of regulator(s). 27 The FSF is composed of the BSP, Securities and Exchange Commission (SEC), Insurance Commission (IC), and Philippine Deposit Insurance Corporation (PDIC). 28 Insurtech is a combination of the words “insurance” and “technology”. It refers to the use of technological innovations in the conduct of insurance business (IC, 2020) 29 Open finance will facilitate the development of innovative, customer-centric financial products and services through permissioned data-sharing and third-party access.

21
Initiative Responsible entity* Timeline
insurance for agriculture and MSME sectors
Institutionalize an annual financial education stakeholder conference to sustain consistent adoption of the common framework
BSP, FinLit partners 2022-2023
Support the immediate passage of the Financial Consumer Protection Act as a comprehensive legal framework for promoting financial consumer protection by all financial service providers
BSP, CDA, SEC, IC 2022-2023
Strengthen prudential regulation and supervision and market conduct capabilities of financial regulators, including for cybersecurity
BSP, CDA, SEC, IC, MNRC 2022-2024
Develop innovative platforms for financial literacy training, including online and alternative modes of delivery
BSP, DILG, FinLit partners 2023-2026
Explore the expansion of deposit insurance for nonbank financial institutions
PDIC, BSP, SEC, CDA 2023-2026
Enhance access to risk protection and social safety nets
Convert limited-purpose cash card accounts used for government cash transfer programs into full-service transaction accounts
DSWD, DOLE, DILG, LBP, DBP
2022
Leverage PhilSys to improve registration and payment of social welfare and cash assistance beneficiaries
DSWD, PSA, LBP, DBP 2022-2024
Adopt digital solutions for social safety net programs to streamline enrollment, contribution payment, and claims and records processing
NGAs, GOCCs, LGUs, SSS, GSIS, Pag-IBIG, PhilHealth, PCIC
2022-2023
Strengthen social safety net programs and explore establishment of a special government pension program or provident fund for informal sector to incentivize enrollment and consistent premium contribution (e.g., low and flexible premium payments)
DSWD, DOLE, SSS, NAPC 2023-2024
Promote the development of microinsurance products that cover disaster risk
IC, DOF, DA, PCIC 2022-2025
Scale up delivery of social housing finance to meet demand for pro-poor and resilient housing
Pag-IBIG, SHFC 2023-2028
Develop the pension market and establish suitable regulatory framework if needed
DOF, BSP, IC, SEC, GSIS, SSS
2023-2028
Enhance agriculture and MSME financing ecosystem
Expand PhilGuarantee’s MSME Credit Guarantee Program targeting priority MSME and agriculture segments, including women-owned and women-led enterprises
PhilGuarantee, DOF
2022-2023
Fast track implementation of RA 11337 (Innovative Startup Act)
DICT, DOST, DTI 2022-2023

22
Initiative Responsible entity* Timeline
Expand agriculture insurance through private sector participation
PCIC, IC, DA, DAR, DOF 2022-2023
Develop, enhance, and promote the use of credit risk information support (e.g., Credit Information System, Credit Risk Database) for all financial institutions
BSP, CIC, SEC, CDA, MNRC, financial institutions
2022-2023
Strengthen the Credit Surety Fund (CSF) as an LGU-based credit enhancement scheme for rural and small and microenterprises
CDA, BSP, DTI, DILG
2022-2023
Ensure effective implementation of the Personal Property Security Act and support passage of law promoting credible warehouse receipts system
DOF, LRA, SEC, BSP 2022-2024
Strengthen capabilities of rural financial institutions for sustainable and innovative agriculture and MSME lending
BSP, CDA, ACPC, RBAP, MCPI
2022-2024
Revisit and develop appropriate regulatory framework for development financial institutions and rural financial institutions
BSP, CDA, MNRC, DOF 2022-2026
Promote agriculture value chain and supply chain financing for MSMEs
BSP, DTI, DOF, SEC, DA
2022-2026
Promote Islamic financing BSP, SEC, IC, BARMM 2022-2026
Increase SME access to capital markets through the SME Board
DTI, DOF, SEC, PSE 2022-2028
Promote green and sustainable finance that benefits smallholder farmers and MSMEs
BSP, Green Force30 2023-2028
Develop framework and tools for collecting and sharing agriculture and MSME data for credit evaluation
DA, DAR, DTI, BSP 2024-2028
*Please refer to Annex B for the list of acronyms
Key performance indicators (KPIs) and targets The NSFI 2022-2028 shall be evaluated based on core indicators and targets for the four desired outcomes. The core KPIs and targets shall form part of the monitoring and evaluation (M&E) framework of the NSFI 2022-2028, together with the indicators to be defined for intermediate outcomes and program outputs. A more detailed description of the KPIs is presented in Annex C.
30 Co-chaired by the DOF and the BSP and members are the Securities and Exchange Commission, Insurance Commission (IC), Climate Change Commission (CCC), Department of Energy (DOE), Department of Environment and Natural Resources (DENR), National Economic and Development Authority (NEDA), Bases Conversion and Development Authority (BCDA), Department of Agriculture (DA), Department of Budget and Management (DBM), Department of Interior and Local Government (DILG), Department of Public Works and Highways (DPWH), Department of Science and Technology (DOST), Department of Transportation (DOTr), Department of Trade and Industry (DTI), Mindanao Development Authority (MinDA) and the Public-Private Partnership Center (PPPC)

23
Desired outcome and KPI Baseline
(2019, except when
indicated otherwise)
Target (2028)
Data source
1. Reduced disparities in financial inclusion31 Percentage of adults with transaction accounts 29%
90% Demand-side
survey (BSP)
*Lead indicator: number of BDAs (in millions) 7.4 (2021)
20 Supply-side data (BSP)
Gap in account ownership Income class: ABC vs. E
0.38
(72% ABC 27% E)
>0.75
Demand-side survey (BSP)
Percentage of borrowers who obtained their loan from formal sources
56%
75% Demand-side survey (BSP)
Gap in access to formal credit Men- vs. women-owned/led SMEs
Not yet available
TBD ADB MSME Finance Survey*
Gap in ownership of insurance policies Income class: ABC vs. E
0.61
(38% ABC 23% E)
>0.75
Demand-side survey (BSP)
Gap in ownership of investment products Men vs. women Urban vs. rural
0.63
(30% men 19% women)
0.47
(34% urban 16% rural)
>0.75
>0.75
Demand-side survey (BSP)
Gap in use of DFS Income class: ABC vs. E
0.42
(12% ABC 5% E)
>0.75
Demand-side survey (BSP)
2. Improved financial health and resilience Financial health index Not yet
available TBD Demand-side
survey (BSP)
*Lead indicator: number of accounts (banks, NSSLAs, cooperatives, MF NGOs, EMIs) with at least PHP 10,000
Not yet available
TBD Supply-side data (BSP,
CDA) Percentage of adults with savings in formal
financial institutions 22% 50% Demand-side
survey (BSP) Percentage of adults (aged 18-59) contributing
to a pension scheme 16% TBD Demand-side
survey (BSP)
31 Gaps in selected inclusion indicators (e.g., account ownership) are measured in terms of disparity ratio which is calculated by dividing the level of inclusion (expressed in percentage) of market segment A by that of market segment B where market segment B has the better (i.e., higher) level of inclusion. A disparity ratio close to 1 implies that there is a narrow gap between two market segments. While gaps exist across many demographic segments, the KPIs reflect the most pronounced gaps.

24
Desired outcome and KPI Baseline (2019, except
when indicated otherwise)
Target (2028)
Data source
*Lead indicators: percentage share of Social Security
System (SSS) members to total adult population (aged 18-59)
number of Personal Equity & Retirement Account (PERA) contributors
74%
(2021)
4,237 (2021)
TBD
5 million (2025)
SSS
Supply-side data (BSP)
Number of microinsurance policy owners including dependents (in millions)
50 (2020)
TBD
Supply-side data (IC)
Number of lives covered (in millions) 45 (2019)
TBD Supply-side data (IC)
Percentage of adults with investment in financial assets
25% 50% Demand-side survey (BSP)
*Lead indicator: number of Mutual Funds and Unit Investment Trust Fund (UITF) accounts
Not yet available
TBD
3. More financially capable and empowered consumers Percentage of internet/mobile phone users
who use DFS
11.5% 50% Demand-side data (BSP)
*Lead indicator: number of registered online or mobile banking users
Not yet available
TBD Supply-side data (BSP)
Percentage of adults with acceptable level of financial literacy
35% TBD Demand-side survey (BSP)
*Lead indicator: percentage of adults who have attended a financial literacy seminar or webinar
Not yet available
TBD Demand-side survey (BSP)
Percentage of financial consumers with complaints who reported the issue or problem to the concerned financial institution
0.6% TBD Demand-side survey (BSP)
Average turnaround time (in number of working days) of financial institutions on the resolution of complaints
24 (for BSP-
supervised financial
institutions)
7 Supply-side data
(BSP, IC, SEC)
4. Increased access to finance for MSMEs, including startups, and the agriculture sector Percentage of i) MSMEs and ii) smallholder
farmers with outstanding loan or line of credit in a formal financial institution
MSMEs 24%
(2021)
Farmers 65%
(2021)
TBD
ADB MSME Finance Survey*
DA, DAR,
ACPC
Percentage of women-owned MSMEs with outstanding loan or line of credit in a formal financial institution
28% (2021)
ADB MSME Finance

25
Desired outcome and KPI Baseline (2019, except
when indicated otherwise)
Target (2028)
Data source
Survey* Percentage of i) MSMEs and ii) smallholder
farmers and their cooperatives with insurance
MSMEs 15%
Farmers
26.7% (2021)
40% ADB MSME Finance Survey*
DA, DAR, PCIC
Percentage share of i) MSME loans and ii) agriculture loans with loan guarantee/surety to total MSME/agriculture loans
MSME 1%
(2021)
Agriculture 1%
(2021)
10%
PhilGuarantee
Percentage share of secured SME bank loans to total SME bank loans outstanding
Not yet available
TBD Supply-side data (BSP)
Percentage of MSMEs with digital payment capabilities
46% (2021)
TBD
ADB MSME Finance Survey*
*Lead indicator: number of merchant accounts (EMI and bank)
Not yet available
TBD Supply-side data (BSP)
Venture capital investment as a percentage of GDP
Not yet available
TBD TBD (possible: OECD,
Statista, DTI, SEC)
*ADB MSME Finance Survey Results – Preliminary as of December 2021 TBD – To Be Determined

26
IV. The strategy governance framework The NSFI 2022-2028 was developed for the benefit of all Filipinos, particularly the vulnerable segment, in consultation with various stakeholder groups representing consumers and MSMEs, policymakers, the financial service industry, and the development community, among others. As a national strategy, the implementation of the NSFI 2022-2028 involves a wide range of players from the government with the support of the private sector. To ensure that the strategies are carried out as planned and adjusted as necessary to achieve the desired outcomes, a strategy governance framework is hereby defined outlining the key roles and responsibilities for the monitoring, review and evaluation, and communication of the implementation of the NSFI 2022-2028. The Financial Inclusion Steering Committee (FISC) The FISC is the interagency governing body that shall lead the coordinated and collaborative approach in implementing the NSFI. Pursuant to Executive Order No. 208 series of 2016, the FISC shall perform the following functions:
Provide overall policy and strategic direction and oversee the implementation of the NSFI;
Align various financial inclusion-related policies, regulations, supervisory frameworks, programs, and initiatives;
Ensure effective progress monitoring of financial inclusion activities that will facilitate evidence-based policymaking;
Collaborate with public and private organizations for data collection and research to facilitate informed policy recommendations, and for provision of financial education and consumer protection programs as well as training and opportunities for the agriculture and MSME sectors;
Communicate the NSFI to the public and private sectors, including other stakeholders of financial inclusion; and
Formulate and adopt its governance and operational guidelines and rules of procedure, as may be necessary to carry out its functions and duties.
Within its mandate, the FISC shall:
Review, approve, and update as necessary the NSFI 2022-2028, including the M&E framework;
Approve the WG deliverables; and Approve the NSFI 2022-2028 Annual Report and other related publications.

27
Photo credit: (Philippine Star, 2021) The working groups Working groups (WGs) shall be organized to drive the implementation of priority initiatives. WG members shall come from four (4) main groups, with representation at the appropriate level:
Government (regulators; policymakers; and LGU associations) Providers (banks and nonbank financial institutions, telcos, internet service providers,
and similar sectors; and their industry associations) Consumers (consumer groups, civil society organizations, representatives of basic
sectors, and the transacting public) Supporting institutions (donors, development partners, academe, and think tanks)
The WGs shall perform the following:
Identify and drive implementation of programs and action plans supporting the priority initiatives;
Develop, review, and update additional intermediate and output indicators which shall form part of the M&E system of the NSFI 2022-2028; and
Present updates to the FISC. Each WG shall have its own leadership and terms of reference (ToR) that specifies key tasks and deliverables. The WG chair shall be a full member of the FISC. Members of the WG can be subject to change based on the needs. WGs may consider having a system that formally recognizes members’ contributions, which provides an incentive to sustain their level of effort and engagement.

28
WG Focus Indicative list of members from the government32
Other WG members
Digital finance Digital infrastructure; DFS innovations; digital payment use cases
BSP, SEC, IC, CDA, DICT, PSA, DILG, DOF, DBM, DOTr, DOLE
Providers (financial institutions, telcos, internet service providers, and similar sectors; and their industry associations) Consumers (consumer groups, civil society organizations, representatives of basic sectors, and the transacting public) Supporting institutions (donors, development partners, academe, and think tanks)
Financial literacy and consumer protection
Financial and digital literacy programs for individuals and MSMEs; consumer protection and market conduct regulations and programs
BSP, SEC, IC, CDA, PDIC, DepEd, DTI, OWWA, CFO, DA, DSWD
Agriculture, MSME, and startup finance
Financial infrastructure development; guarantee and credit enhancement programs; agriculture value chain and supply chain finance
DA, DAR, ACPC, DTI, SBC, DOST, PhilGuarantee, CIC, NEDA, BSP, SEC, DBP, LBP
Risk protection and safety nets
Insurance, pension, and cash assistance government programs for the informal and vulnerable sectors
DSWD, DOF, DOLE, NEDA, GSIS, SSS, PhilHealth, PCW, CFO, PCIC
Communication Public awareness campaigns and stakeholder communication programs for the NSFI 2022-2028
BSP, DILG, DTI, PIA/PCOO, DepEd
Data and monitoring
NSFI monitoring and evaluation framework data requirements
PSA, BSP, SEC, IC, CDA, NEDA, PCW
Regional and local development councils To localize the national strategy, the NSFI shall be adopted and monitored at the subnational level. Regional Development Councils (RDCs) and Local Development Councils (LDCs) shall be tapped to endorse national financial inclusion plans, programs, and projects proposed for granular implementation in the regions, provinces, cities, and municipalities. Accordingly, financial inclusion shall be incorporated in the Regional Development Plans (RDPs) and Local Development Plans (LDPs), which serve as the blueprint of regional and local development consistent with national development planning. The appropriate issuance from the Office of the President shall be proposed to officially endorse the integration of financial inclusion initiatives in the RDPs and LDPs.
32 Please see Annex B for the list of FISC and non-FISC stakeholders from the government sector

29
Photo credit: (Philippine Star, 2021)
The FISC Secretariat The FISC Secretariat shall be based at the BSP and its composition determined by the BSP governor. The secretariat shall:
Develop and maintain a robust M&E framework for the NSFI 2022-2028, in coordination with the WG on data and monitoring;
Coordinate and provide secretariat support for the FISC and WG meetings; Facilitate monitoring of deliverables of the FISC members and WGs; Facilitate coordination of the FISC with other interagency committees, including RDCs
and LDCs, to ensure complementarity of the NSFI with other roadmaps, plans, and related initiatives;33
Prepare and publish annual NSFI reports and other reports; and Create and maintain a website that will feature activities and accomplishments under
the NSFI.
33 These Interagency committees include: Economic Development Cluster, MSME Development Council, Export Development Council, Agricultural Credit and Policy Council, Financial Sector Forum, Financial Stability Coordination Council, Capital Market Development Council, PhilSys Policy and Coordination Council. Relevant Plans and Roadmaps include: AmBisyon Natin 2040, Philippine Development Plan, MSME Development Plan, Philippine Export Development Plan, eCommerce Philippines Roadmap, Philippine ICT Roadmap, Digital Payments Transformation Roadmap.

30
Annex A. NSFI 2015-2021
The original NSFI was launched more than six years ago, on 1 July 2015, as a public document setting out the country’s financial inclusion vision, strategic objectives, and the 4 key areas for intervention: policy, regulation and supervision; financial education and consumer protection; advocacy programs; and data and measurement.34 Guiding principles were articulated for each of these strategic areas to inform the supporting action plans of the government agencies and other stakeholders. These elements are depicted in a house with the vision on the roof, 3 key areas as pillars and data and measurement as the foundation. The original NSFI did not have a set timeframe, KPIs, or targets. It was designed as a principles-based document toward harmonizing policies and programs for financial inclusion in the Philippines.
34 BSP, 2015

31
Annex B. FISC members Chair: 1. Bangko Sentral ng Pilipinas (BSP) Members: 2. Commission on Filipinos Overseas (CFO)
3. Cooperative Development Authority (CDA) 4. Department of Budget and Management (DBM) 5. Department of Education (DepEd) 6. Department of Finance (DOF) 7. Department of Social Welfare and Development (DSWD) 8. Department of Trade and Industry (DTI) 9. Insurance Commission (IC) 10. National Economic Development Authority (NEDA) 11. Philippine Deposit Insurance Corporation (PDIC) 12. Philippine Statistics Authority (PSA) 13. Securities and Exchange Commission (SEC) 14. Department of Agrarian Reform (DAR) a 15. Department of Science and Technology (DOST) a 16. Department of Agriculture (DA) b 17. Department of Information and Communications Technology (DICT) b 18. Department of Transportation (DOTr) c 19. Department of Labor and Employment (DOLE) c 20. Philippine Commission on Women (PCW) d 21. Department of Interior and Local Government (DILG) e
a Onboarded in Q4 2016 b Onboarded in Q3 2018 c Onboarded in Q3 2019 d Onboarded in Q3 2020 e Onboarded in Q3 2021
Non-FISC working group members: ACPC Agricultural Credit Policy Council BARMM Bangsamoro Autonomous Region in Muslim Mindanao CIC Credit Information Corporation COA Commission on Audit DBP Development Bank of the Philippines GFIs government financial institutions GOCCs government-owned and controlled corporations GSIS Government Service Insurance System HDMF Home Development Mutual Fund or Pag-IBIG Fund LBP Land Bank of the Philippines LGUs local government units LRA Land Registration Authority MNRC Microfinance NGO Regulatory Council NAPC National Anti-Poverty Commission NGAs national government agencies NPC National Privacy Commission PCC Philippine Competition Commission PCIC Philippine Crop Insurance Corporation PCOO Presidential Communications Operations Office PhilGuarantee Philippine Guarantee Corporation PhilHealth Philippine Health Insurance Corporation PIA Philippine Information Agency

32
PLLO Presidential Legislative Liaison Office SBC Small Business Corporation SHFC Social Housing Finance Corporation SSS Social Security System

33
Annex C. Description of KPIs
Desired outcome and KPI KPI description and formula (if applicable)
1. Reduced disparities in financial inclusion Percentage of adults35 with
transaction accounts Percentage of Filipino adults who own a transaction account in a formal financial institution such as banks, EMIs, coops, and MFIs. This transaction account can be used to save money; send or receive remittance, income, assistance (ayuda), and benefits; and make day-to-day payments.
𝑁𝑢𝑚𝑏𝑒𝑟 𝑜𝑓 𝑎𝑑𝑢𝑙𝑡𝑠 𝑤ℎ𝑜 𝑜𝑤𝑛 𝑎 𝑡𝑟𝑎𝑛𝑠𝑎𝑐𝑡𝑖𝑜𝑛 𝑎𝑐𝑐𝑜𝑢𝑛𝑡𝑇𝑜𝑡𝑎𝑙 𝑎𝑑𝑢𝑙𝑡 𝑝𝑜𝑝𝑢𝑙𝑎𝑡𝑖𝑜𝑛
*Lead indicator: number of BDAs (in millions)
Number of Filipinos with BDA, a bank deposit product with features (opening amount of PHP 100 or less, no maintaining balance, no dormancy charges, simplified KYC) designed for the unbanked population.
Gap in account ownership Income class: ABC vs. E
The extent of disparity of the percentage of adults with accounts between two segments, i.e., income class ABC (which has the highest account ownership level) and class E (which has the lowest account ownership level). A disparity ratio closer to 1 means lower disparity between the two segments being compared.
% 𝑜𝑓 𝑎𝑑𝑢𝑙𝑡𝑠 𝑖𝑛 𝑐𝑙𝑎𝑠𝑠 𝐸 𝑤𝑖𝑡ℎ 𝑎𝑐𝑐𝑜𝑢𝑛𝑡
% 𝑜𝑓 𝑎𝑑𝑢𝑙𝑡𝑠 𝑖𝑛 𝑐𝑙𝑎𝑠𝑠 𝐴𝐵𝐶 𝑤𝑖𝑡ℎ 𝑎𝑐𝑐𝑜𝑢𝑛𝑡
Percentage of borrowers who obtained their loan from formal sources
Percentage of borrowers who obtained their loan from formal/regulated financial institutions such as banks, coops, MFIs, pawnshops, lending/financing companies, online lending platforms, and others.
𝑁𝑢𝑚𝑏𝑒𝑟 𝑜𝑓 𝑏𝑜𝑟𝑟𝑜𝑤𝑒𝑟𝑠𝑤ℎ𝑜 𝑜𝑏𝑡𝑎𝑖𝑛𝑒𝑑 𝑡ℎ𝑒𝑖𝑟 𝑙𝑜𝑎𝑛
𝑓𝑟𝑜𝑚 𝑓𝑜𝑟𝑚𝑎𝑙 𝑠𝑜𝑢𝑟𝑐𝑒𝑠
𝑇𝑜𝑡𝑎𝑙 𝑛𝑢𝑚𝑏𝑒𝑟 𝑜𝑓 𝑏𝑜𝑟𝑟𝑜𝑤𝑒𝑟𝑠
Gap in access to formal credit Men- vs. women-
owned/led SMEs
The extent of disparity among SME respondents between two segments, i.e., men- and women-owned/led SMEs which applied for a business loan in the last 2 years from a formal financial institution. A disparity ratio closer to 1 means lower disparity between the two segments being compared.
35 Adults refer to individuals aged 15 years old and above, unless otherwise indicated.

34
Desired outcome and KPI KPI description and formula (if applicable)
% 𝑜𝑓 𝑤𝑜𝑚𝑒𝑛-𝑜𝑤𝑛𝑒𝑑 𝑆𝑀𝐸𝑠 𝑤ℎ𝑖𝑐ℎ 𝑎𝑝𝑝𝑙𝑖𝑒𝑑 𝑓𝑜𝑟 𝑎 𝑏𝑢𝑠𝑖𝑛𝑒𝑠𝑠 𝑙𝑜𝑎𝑛
𝑖𝑛 𝑡ℎ𝑒 𝑙𝑎𝑠𝑡 2 𝑦𝑒𝑎𝑟𝑠 𝑓𝑟𝑜𝑚 𝑎 𝑓𝑜𝑟𝑚𝑎𝑙 𝑓𝑖𝑛𝑎𝑛𝑐𝑖𝑎𝑙 𝑖𝑛𝑠𝑡𝑖𝑡𝑢𝑡𝑖𝑜𝑛
% 𝑜𝑓 𝑚𝑒𝑛-𝑜𝑤𝑛𝑒𝑑 𝑆𝑀𝐸𝑠 𝑤ℎ𝑖𝑐ℎ 𝑎𝑝𝑝𝑙𝑖𝑒𝑑 𝑓𝑜𝑟 𝑎 𝑏𝑢𝑠𝑖𝑛𝑒𝑠𝑠 𝑙𝑜𝑎𝑛
𝑖𝑛 𝑡ℎ𝑒 𝑙𝑎𝑠𝑡 2 𝑦𝑒𝑎𝑟𝑠 𝑓𝑟𝑜𝑚 𝑎 𝑓𝑜𝑟𝑚𝑎𝑙 𝑓𝑖𝑛𝑎𝑛𝑐𝑖𝑎𝑙 𝑖𝑛𝑠𝑡𝑖𝑡𝑢𝑡𝑖𝑜𝑛
Gap in ownership of
insurance policies Income class: ABC vs. E
The extent of disparity in the percentage of adults who own an insurance policy between two segments, i.e., income class ABC (which has the highest insurance policy ownership level) and class E (which has the lowest insurance policy ownership level). A disparity ratio closer to 1 means lower disparity between the two segments being compared.
% 𝑜𝑓 𝑎𝑑𝑢𝑙𝑡𝑠 𝑖𝑛 𝑐𝑙𝑎𝑠𝑠 𝐸 𝑤𝑖𝑡ℎ 𝑖𝑛𝑠𝑢𝑟𝑎𝑛𝑐𝑒
% 𝑜𝑓 𝑎𝑑𝑢𝑙𝑡𝑠 𝑖𝑛 𝑐𝑙𝑎𝑠𝑠 𝐴𝐵𝐶 𝑤𝑖𝑡ℎ 𝑖𝑛𝑠𝑢𝑟𝑎𝑛𝑐𝑒
Gap in ownership of
investment products
Men vs. women Urban vs. rural
The extent of disparity of the percentage of adults who own an investment product (stocks, bonds, UITF, mutual fund) between two segments. A disparity ratio closer to 1 means lower disparity between the two segments being compared. By sex, men (who have the higher investment ownership level) and women (who have the lower investment ownership level).
% 𝑜𝑓 𝑤𝑜𝑚𝑒𝑛 𝑤𝑖𝑡ℎ 𝑖𝑛𝑣𝑒𝑠𝑡𝑚𝑒𝑛𝑡
% 𝑜𝑓 𝑚𝑒𝑛 𝑤𝑖𝑡ℎ 𝑖𝑛𝑣𝑒𝑠𝑡𝑚𝑒𝑛𝑡
By location, urban (which has the higher investment ownership level) and rural (which has the lower investment ownership level).
% 𝑜𝑓 𝑎𝑑𝑢𝑙𝑡𝑠 𝑖𝑛
𝑟𝑢𝑟𝑎𝑙 𝑎𝑟𝑒𝑎𝑠 𝑤𝑖𝑡ℎ 𝑖𝑛𝑣𝑒𝑠𝑡𝑚𝑒𝑛𝑡% 𝑜𝑓 𝑎𝑑𝑢𝑙𝑡𝑠 𝑖𝑛
𝑢𝑟𝑏𝑎𝑛 𝑎𝑟𝑒𝑎𝑠 𝑤𝑖𝑡ℎ 𝑖𝑛𝑣𝑒𝑠𝑡𝑚𝑒𝑛𝑡
Gap in use of DFS Income class: ABC vs. E
The extent of disparity in the percentage of internet or mobile phone users who use the internet and their

35
Desired outcome and KPI KPI description and formula (if applicable)
phones for financial transactions between two segments. i.e., income class ABC (which has the highest DFS use) and class E (which has the lowest DFS use). A disparity ratio closer to 1 means lower disparity between the two segments being compared.
% 𝑜𝑓 𝑖𝑛𝑡𝑒𝑟𝑛𝑒𝑡 𝑜𝑟 𝑚𝑜𝑏𝑖𝑙𝑒 𝑝ℎ𝑜𝑛𝑒 𝑢𝑠𝑒𝑟𝑠
𝑖𝑛 𝑐𝑙𝑎𝑠𝑠 𝐸 𝑤ℎ𝑜 𝑢𝑠𝑒 𝐷𝐹𝑆 % 𝑜𝑓 𝑖𝑛𝑡𝑒𝑟𝑛𝑒𝑡 𝑜𝑟
𝑚𝑜𝑏𝑖𝑙𝑒 𝑝ℎ𝑜𝑛𝑒 𝑢𝑠𝑒𝑟𝑠𝑖𝑛 𝑐𝑙𝑎𝑠𝑠 𝐴𝐵𝐶 𝑤ℎ𝑜 𝑢𝑠𝑒 𝐷𝐹𝑆
2. Improved financial health and resilience Financial health index A composite score based on the respondents’ degree of
agreement or disagreement to statements describing the following financial health dimensions:
- able to meet cost of living expenses such as house rental, electricity, water, and food
- able to fully meet current financial obligations - able to handle an emergency that will require a
big amount of money - on track to meet financial goals - feeling of security about financial future
*Lead indicator: number of accounts (banks, NSSLAs, cooperatives, EMIs) with at least PHP 10,000
PHP 10,000 was based on the World Bank Global Findex (WB, 2017) and PSA (2021) data: 1.) Global Findex: 5% of gross national income (GNI) per capita in local currency within the next month = PHP 8,614 2.) First Semester 2021 poverty threshold estimate = PHP 12,082, on the average, for a family of five
Percentage of adults with savings in formal financial institutions
Percentage of adults who save in formal financial institutions such as banks, NSSLAs, cooperatives, MFIs, and EMIs
𝑁𝑢𝑚𝑏𝑒𝑟 𝑜𝑓 𝑎𝑑𝑢𝑙𝑡𝑠 𝑤ℎ𝑜 𝑠𝑎𝑣𝑒𝑖𝑛 𝑓𝑜𝑟𝑚𝑎𝑙 𝑓𝑖𝑛𝑎𝑛𝑐𝑖𝑎𝑙 𝑖𝑛𝑠𝑡𝑖𝑡𝑢𝑡𝑖𝑜𝑛𝑠
𝑇𝑜𝑡𝑎𝑙 𝑎𝑑𝑢𝑙𝑡 𝑝𝑜𝑝𝑢𝑙𝑎𝑡𝑖𝑜𝑛
Percentage of adults (aged
18-59) contributing to a pension scheme
Percentage of adults who regularly and actively pay their contributions to a pension scheme (e.g., SSS, GSIS) that provides financial support and assistance (whether in the form of cash allowances, pensions, or loans) in times of emergencies or life contingencies.

36
Desired outcome and KPI KPI description and formula (if applicable)
𝑁𝑢𝑚𝑏𝑒𝑟 𝑜𝑓 𝑎𝑑𝑢𝑙𝑡𝑠 𝑤ℎ𝑜 𝑐𝑜𝑛𝑡𝑟𝑖𝑏𝑢𝑡𝑒 𝑟𝑒𝑔𝑢𝑙𝑎𝑟𝑙𝑦 𝑡𝑜 𝑎 𝑝𝑒𝑛𝑠𝑖𝑜𝑛 𝑠𝑐ℎ𝑒𝑚𝑒
𝑇𝑜𝑡𝑎𝑙 𝑎𝑑𝑢𝑙𝑡 𝑝𝑜𝑝𝑢𝑙𝑎𝑡𝑖𝑜𝑛 𝑎𝑔𝑒𝑑 18-59
*Lead indicator: percentage share of SSS embers to total adult population (aged 18-59)
While the number of GSIS members will be tracked as part of sub-indicators, SSS members will be monitored as part of KPIs since its coverage (e.g., informal economy workers) is more relevant to financial inclusion.36
𝑁𝑢𝑚𝑏𝑒𝑟 𝑜𝑓 𝑆𝑆𝑆 𝑚𝑒𝑚𝑏𝑒𝑟𝑠
𝑇𝑜𝑡𝑎𝑙 𝑎𝑑𝑢𝑙𝑡 𝑝𝑜𝑝𝑢𝑙𝑎𝑡𝑖𝑜𝑛 𝑎𝑔𝑒𝑑 18-59
Number of Personal Equity &
Retirement Account (PERA) contributors
PERA is a voluntary retirement savings program that supplements the existing retirement benefits from SSS, GSIS, and employers.
Number of microinsurance policy owners including dependents (in millions)
Microinsurance is a financial product or service that meets the risk protection needs of the poor where: The amount of contributions, premiums, fees or
charges, computed on a daily basis, does not exceed 7.5% of the current daily minimum wage rate for nonagricultural workers in Metro Manila; and
The maximum sum of guaranteed benefits is not more than one thousand (1,000) times the current daily minimum wage rate for nonagricultural workers in Metro Manila.
Number of lives covered (in millions)
Number (in millions) of insured lives under in-force policies at the end of the year for traditional and variable life products.
Percentage of adults with investment
Percentage of adults who own an investment product (stocks, bonds, UITF, mutual fund)
𝑁𝑢𝑚𝑏𝑒𝑟 𝑜𝑓 𝑎𝑑𝑢𝑙𝑡𝑠 𝑤𝑖𝑡ℎ 𝑓𝑖𝑛𝑎𝑛𝑐𝑖𝑎𝑙 𝑖𝑛𝑣𝑒𝑠𝑡𝑚𝑒𝑛𝑡
𝑇𝑜𝑡𝑎𝑙 𝑎𝑑𝑢𝑙𝑡 𝑝𝑜𝑝𝑢𝑙𝑎𝑡𝑖𝑜𝑛
*Lead indicator: number of Mutual Funds and Unit Investment Trust Fund (UITF) accounts
Total number of retail investors with Mutual Funds and UITF37
3. More financially capable and empowered consumers Percentage of
internet/mobile phone users who use DFS
Percentage of internet or mobile phone users who use the internet and their phones for financial transactions
𝑁𝑢𝑚𝑏𝑒𝑟 𝑜𝑓 𝑖𝑛𝑡𝑒𝑟𝑛𝑒𝑡 𝑜𝑟 𝑚𝑜𝑏𝑖𝑙𝑒 𝑝ℎ𝑜𝑛𝑒 𝑢𝑠𝑒𝑟𝑠 𝑤ℎ𝑜 𝑢𝑠𝑒 𝑡ℎ𝑒 𝑖𝑛𝑡𝑒𝑟𝑛𝑒𝑡 𝑎𝑛𝑑 𝑡ℎ𝑒𝑖𝑟 𝑚𝑜𝑏𝑖𝑙𝑒 𝑝ℎ𝑜𝑛𝑒𝑠
𝑓𝑜𝑟 𝑓𝑖𝑛𝑎𝑛𝑐𝑖𝑎𝑙 𝑡𝑟𝑎𝑛𝑠𝑎𝑐𝑡𝑖𝑜𝑛𝑠
𝑇𝑜𝑡𝑎𝑙 𝑛𝑢𝑚𝑏𝑒𝑟 𝑜𝑓 𝑖𝑛𝑡𝑒𝑟𝑛𝑒𝑡 𝑜𝑟 𝑚𝑜𝑏𝑖𝑙𝑒 𝑝ℎ𝑜𝑛𝑒 𝑢𝑠𝑒𝑟𝑠
36 SSS, 2021; PSA, 2022 37 BSP, 2018; SEC, 2018

37
Desired outcome and KPI KPI description and formula (if applicable)
*Lead indicator: number of registered online or mobile banking users
Number of Filipinos who use internet banking or mobile banking (apps in mobile phones)
Percentage of adults with acceptable level of financial literacy
Percentage of adults who received a passing score in a financial literacy quiz covering basic topics such as division, simple and compound interest rate, inflation, and asset diversification
𝑁𝑢𝑚𝑏𝑒𝑟 𝑜𝑓 𝑎𝑑𝑢𝑙𝑡𝑠 𝑤𝑖𝑡ℎ 𝑝𝑎𝑠𝑠𝑖𝑛𝑔 𝑠𝑐𝑜𝑟𝑒𝑖𝑛 𝑎 𝑓𝑖𝑛𝑙𝑖𝑡 𝑞𝑢𝑖𝑧
𝑇𝑜𝑡𝑎𝑙 𝑎𝑑𝑢𝑙𝑡 𝑝𝑜𝑝𝑢𝑙𝑎𝑡𝑖𝑜𝑛
*Lead indicator: percentage of adults who have attended a financial literacy seminar or webinar
Percentage of adults who have attended a training event or information session (whether in-person or virtual) on financial literacy to increase their knowledge on saving, budgeting, debt management, investing, and other personal finance management topics
𝑁𝑢𝑚𝑏𝑒𝑟 𝑜𝑓 𝑎𝑑𝑢𝑙𝑡𝑠 𝑤ℎ𝑜 ℎ𝑎𝑣𝑒 𝑎𝑡𝑡𝑒𝑛𝑑𝑒𝑑 𝑎 𝑓𝑖𝑛𝑙𝑖𝑡 𝑠𝑒𝑚𝑖𝑛𝑎𝑟
𝑜𝑟 𝑤𝑒𝑏𝑖𝑛𝑎𝑟𝑇𝑜𝑡𝑎𝑙 𝑎𝑑𝑢𝑙𝑡 𝑝𝑜𝑝𝑢𝑙𝑎𝑡𝑖𝑜𝑛
Percentage of financial
consumers with complaints who reported the issue or problem to the concerned financial institution
Percentage of financial consumers who encountered a problem or issue on their financial transactions and contacted the financial institution for the resolution of their complaints
𝑁𝑢𝑚𝑏𝑒𝑟 𝑜𝑓 𝑎𝑑𝑢𝑙𝑡𝑠 𝑤ℎ𝑜 𝑐𝑜𝑛𝑡𝑎𝑐𝑡𝑒𝑑 𝑡ℎ𝑒 𝐹𝑆𝑃 𝑟𝑒𝑔𝑎𝑟𝑑𝑖𝑛𝑔 𝑎𝑛 𝑖𝑠𝑠𝑢𝑒 𝑜𝑟 𝑝𝑟𝑜𝑏𝑙𝑒𝑚
𝑤𝑖𝑡ℎ 𝑓𝑖𝑛𝑎𝑛𝑐𝑖𝑎𝑙 𝑡𝑟𝑎𝑛𝑠𝑎𝑐𝑡𝑖𝑜𝑛𝑠
𝑇𝑜𝑡𝑎𝑙 𝑛𝑢𝑚𝑏𝑒𝑟 𝑜𝑓 𝑎𝑑𝑢𝑙𝑡𝑠 𝑤ℎ𝑜 𝑒𝑛𝑐𝑜𝑢𝑛𝑡𝑒𝑟𝑒𝑑 𝑎𝑛 𝑖𝑠𝑠𝑢𝑒 𝑜𝑟 𝑝𝑟𝑜𝑏𝑙𝑒𝑚
𝑤𝑖𝑡ℎ 𝑓𝑖𝑛𝑎𝑛𝑐𝑖𝑎𝑙 𝑡𝑟𝑎𝑛𝑠𝑎𝑐𝑡𝑖𝑜𝑛𝑠
Average turnaround time (in number of working days) of financial institutions on the resolution of complaints
Turnaround time (TAT) is the total number of working days from when the BSP/SEC/IC refers a complaint to a financial institution until the financial institution communicates with the complainant on the action taken or to be taken on the complaint. (Average taken for all types of financial institutions.)
4. Increased access to finance for MSMEs, including startups, and the agriculture sector Percentage of i) MSMEs and
ii) smallholder farmers with outstanding loan or line of credit in a formal financial institution
MSMEs: Number of MSME respondents who applied for a business loan from formal financial institutions in the last 2 years over total number of MSME respondents Farmers: Number of smallholder farmers who borrowed from formal credit sources over total number of smallholder farmers who availed of credit

38
Desired outcome and KPI KPI description and formula (if applicable)
Percentage of women-owned MSMEs with outstanding loan or line of credit in a formal financial institution
Number of women-owned MSME respondents that applied for a business loan in the last 2 years over total number of women-owned MSME respondents
Percentage of i) MSMEs and ii) smallholder farmers and fisherfolk with insurance
Number of MSME respondents who reported using insurance for their business over total number of MSME respondents
Number of unique smallholder farmers and fisherfolk enrolled over the total number of farmers and fisherfolk listed in the Registry System for Basic Sector in Agriculture (RSBSA)
Percentage share of i) MSME loans and ii) agriculture loans with loan guarantee/surety to total MSME/agriculture loans
Value of outstanding guarantee for MSME over total MSME loans
Value of outstanding guarantee for agriculture over total agriculture, forestry, and fishing (AFF) loans
Percentage share of secured SME bank loans to total SME bank loans outstanding
Ratio of the total amount of bank loans accessed by SMEs that are covered by collaterals such as real estate mortgage (REM), contracts to sell (CTS), nonrisk assets, and other assets including guarantee cover from public and private institutions, against the total amount of SME bank loans outstanding
𝑇𝑜𝑡𝑎𝑙 𝑎𝑚𝑜𝑢𝑛𝑡 𝑜𝑓 𝑠𝑒𝑐𝑢𝑟𝑒𝑑 𝑆𝑀𝐸 𝑙𝑜𝑎𝑛𝑠𝑖𝑛 𝑡ℎ𝑒 𝑏𝑎𝑛𝑘𝑖𝑛𝑔 𝑠𝑦𝑠𝑡𝑒𝑚
𝑇𝑜𝑡𝑎𝑙 𝑜𝑢𝑡𝑠𝑡𝑎𝑛𝑑𝑖𝑛𝑔 𝑆𝑀𝐸 𝑙𝑜𝑎𝑛𝑠𝑖𝑛 𝑡ℎ𝑒 𝑏𝑎𝑛𝑘𝑖𝑛𝑔 𝑠𝑦𝑠𝑡𝑒𝑚
Percentage of MSMEs with
digital payment capabilities
Number of MSME respondents who used mobile account/e-wallet/digital payment for their business over total number of MSME respondents
*Lead indicator: number of merchant accounts (EMI and bank)
A merchant account is a type of account that allows a business to accept and process digital payments.
Venture capital investment as a percentage of GDP
Total amount (in million PHP) of venture capital fund for startups (covering funding from both government and private sector), expressed as a percentage of GDP

39
References ADB. (on-going). 2021 ADB MSME Survey (Preliminary). Manila: ADB. Beck, T. (2016, November 21). Financial Inclusion – measuring progress and progress in
measuring. Retrieved from https://www.imf.org/external/np/seminars/eng/2016/statsforum/pdf/beck_paper.pdf
BSP. (2015, July). National Strategy for Financial Inclusion. Retrieved from https://www.bsp.gov.ph/Inclusive%20Finance/PhilippinesNSFIBooklet.pdf
BSP. (2018, December 31). Manual of Regulations for Banks Sec 403. Retrieved from https://morb.bsp.gov.ph/403-definitions/
BSP. (2020). 2019 Financial Inclusion Survey. Retrieved from https://www.bsp.gov.ph/Inclusive%20Finance/Financial%20Inclusion%20Reports%20and%20Publications/2019/2019FISToplineReport.pdf
CGAP. (2018). Regulatory Sandboxes: What Have We Learned So Far? Retrieved from https://www.cgap.org/blog/series/regulatory-sandboxes-what-have-we-learned-so-far
CGAP. (2021, December 7). Let’s Talk About Resilience. Retrieved from https://www.cgap.org/blog/lets-talk-about-resilience
DICT. (2021, August 18). PH internet speeds continue to show steady improvements in July. Retrieved from https://dict.gov.ph/ph-internet-speeds-continue-to-show-steady-improvements-in-july/
DTI. (2020). 2020 MSME Stattistics. Retrieved from https://www.dti.gov.ph/resources/msme-statistics/
IC. (2020, June 14). Insurance Commission Circular Letter No. 2020-73. Retrieved from https://www.insurance.gov.ph/wp-content/uploads/2020/06/CL2020_73.pdf
IC. (2021, 2nd Quarter). Insurance Industry Performance. Retrieved from https://www.insurance.gov.ph/wp-content/uploads/2021/11/Annex-A-Q2-2021-Insurance-Industry-Performance-Report-v1.pdf
ITA. (2021, September 11). Philippines - Country Commercial Guide. Retrieved from https://www.trade.gov/country-commercial-guides/philippines-ecommerce
Monsod, T. C. (2017, October 19). From ‘Touchpoints’ to Inclusive Growth: An Evidence-Based Theory of Change for the National Strategy for Financial Inclusion. Retrieved from https://www.bsp.gov.ph/Pages/ABOUT%20THE%20BANK/Events/By%20Year/2017/BSP-UP%20Professorial%20Chair%20Lecture%20Series/BSP_5b_monsod_presentation.pdf
NEDA. (2016). AmBisyon Natin 2040. Retrieved from https://2040.neda.gov.ph/about-ambisyon-natin-2040/
NEDA. (2017). Philippine Development Plan 2017-2022. Retrieved from https://pdp.neda.gov.ph/
NEDA. (2018, December 19). NEDA Explainer: Reaping Demographic Dividend . Retrieved from https://neda.gov.ph/neda-explainer-reaping-demographic-dividend/
Philippine Star. (2021, August 5). Two entrepreneurs face the challenge of running their business during the pandemic, but still find it in their hearts to help others. Retrieved from https://www.philstar.com/other-sections/supplements/2021/08/05/2117315/two-entrepreneurs-face-challenge-running-their-business-during-pandemic-still-find-it-their-hearts-help-others
PSA. (2021, December 17). 2021 First Semester Poverty Statistics. Retrieved from https://psa.gov.ph/content/proportion-poor-filipinos-registered-237-percent-first-semester-2021
PSA. (2021, August). Census of Population and Housing. Retrieved from https://psa.gov.ph/population-and-housing
PSA. (2021). Philippine Poverty Statistics - Tables and Thematic Maps. Retrieved from https://psa.gov.ph/poverty-press-releases/data

40
PSA. (2021, April 29). Regional Accounts of the Philippines. Retrieved from https://psa.gov.ph/regional-accounts
PSA. (2022, January). National Quickstat for 2022 (as of December 2021). Retrieved from https://psa.gov.ph/statistics/quickstat/national-quickstat/all/*
PSA. (2022, January 7). Unemployment Rate in November 2021 is Estimated at 6.5 Percent. Retrieved from https://psa.gov.ph/content/unemployment-rate-november-2021-estimated-65-percent
PSA. (various years). Poverty Statistics. Retrieved from https://psa.gov.ph/content/poverty-statistics
SEC. (2018, January 11). Implementing Rules and Regulations of the Investment Company Act. Retrieved from https://www.sec.gov.ph/wp-content/uploads/2019/11/2018IRRofInvestmentCompanyAct.pdf
SSS. (2021, September). 64th SSS Anniversary. Retrieved from https://www.sss.gov.ph/sss/DownloadContent?fileName=Sep10SSS64thAnniv6x17bw.pdf
Statista. (2021, July). Philippines: Share of economic sectors in the gross domestic product (GDP) from 2010 to 2020 (Source data: World Bank). Retrieved from https://www.statista.com/statistics/578787/share-of-economic-sectors-in-the-gdp-in-philippines/
UNSGSA. (2021, September). Financial Health: An Introduction for Financial Sector Policymakers. Retrieved from https://www.unsgsa.org/publications/financial-health-introduction-financial-sector-policymakers
WB. (2014). Global Financial Development Report 2014 : Financial Inclusion. Retrieved from https://openknowledge.worldbank.org/handle/10986/16238
WB. (2015). Enterprise Surveys : Philippines Country Pofile 2015. Retrieved from https://openknowledge.worldbank.org/handle/10986/25915
WB. (2017). The 2017 Global Findex Database. Retrieved from https://globalfindex.worldbank.org/


![The Anjung Singgah Strategy: Simultaneous Inclusion and Exclusion of Homelessness in Malaysia’s Policy Agenda [Conference paper]](https://static.fdokumen.com/doc/165x107/632234e261d7e169b00c84fd/the-anjung-singgah-strategy-simultaneous-inclusion-and-exclusion-of-homelessness.jpg)