National Strategy and Action Plan for Low Carbon ...
110
National Strategy and Action Plan for Low Carbon Development, 2012
-
Upload
khangminh22 -
Category
Documents
-
view
0 -
download
0
Transcript of National Strategy and Action Plan for Low Carbon ...

National Strategy and Action Plan
for Low Carbon Development, 2012
�������������� ����� ����������������� �����������

������������� ������������������������������������������
����������� ������������������������������������������������
������������ ����������������������������������������������������
�� ��� �������!�!�"����#���������� ��������������������������������������� ��������������
�$%& �������!�"������#����������$%��&%����� �������'����'�
������������������ ��(����%�)� �%�������*�������)+�,��� �����%�� ��"�'��-���������),�������)+�,��� �$������.�������)+�(������(���������)+�
���������������������*�������/!��������0���1
�����������. &.��.�����)+�(������(����)+�
.&�����&%�)�/�����+�!���� ������ �����2�%���3�!��� �����*�4.��� �5��4�6�)�����7(����89:;��������#�<��������6��89:;�������#;
=,4)��9:#�999�7�#7;�����
(� �.���4.�����>.�������
?�)�/�����+�!���� ������ ����
(���.&��'�/��� �%�&��������.'�����������������������%�*�� �*�����.'�/��������������@��.������.����� �����*�� ����'��%���������������!������'��������� �����*�����.�'���� ����

������������� ������������������������������������������
������������������������������������������������������������������������������������������������������������������������������������������������������������������������������������������������� �
������������������������������������������������������������������������������������������������������������������������������������������������������������������������������������ ��
���������� ������������������������������������������������������������������������������������������������������������������������������������������������������������� ���
������������ ����������!�����������"��!������������������������������������������������������������������������������������������������������� #
Brief Situational Background .......................................................................................................................................................................2
UNFCCC GHG inventory .......................................................................................................................................................................10
Methodological approach ..........................................................................................................................................................................12
����������������������������������������������������������������������������������������������������������������������������������������������������������������������������$#
Energy intensive industries ........................................................................................................................................................................22
Other industries ..............................................................................................................................................................................................27
Domestic aviation and international aviation bunkers ..............................................................................................................30
Road transport ................................................................................................................................................................................................31
Tertiary sector .................................................................................................................................................................................................34
Residential sector ...........................................................................................................................................................................................36
Agriculture and forestry .............................................................................................................................................................................41
Municipal solid waste ...................................................................................................................................................................................43
Comparison of model results and GHG inventory ...................................................................................................................45
Baseline scenario results summarised.................................................................................................................................................47
%��������������!��������������������������������������������������������������������������������������������������������������������������������������������������&'
Increased energy efficiency .......................................................................................................................................................................54
High share of renewable energy ...........................................................................................................................................................56
Energy efficiency and renewable energy ..........................................................................................................................................58
%�����"��(������! ������� ������������������������������������������������������������������������������������������������������������������������������������)*
Clean Development Mechanism ...........................................................................................................................................................68
Nationally Appropriate Mitigation Actions (NAMA) ................................................................................................................69
REDD+ ................................................................................................................................................................................................................70
+�����"��������!����������,����������������������������������������������������������������������������������������������������������������������������*#
Assumptions ......................................................................................................................................................................................................73
Interventions identified in existing documents .............................................................................................................................73
Selection criteria .............................................................................................................................................................................................75
Interventions in the low carbon strategy and action plan ......................................................................................................76
Recommended next steps ........................................................................................................................................................................88
��������������������������������������������������������������������������������������������������������������������������������������������������������������������������������-#
%""�����������������������������������������������������������������������������������������������������������������������������������������������������������������������������-$
%����# .��/��������������������������������������������������������������������������������������������������������������������������������������������-'
%����$ .������� �����������!����������������������������������������������������������������������������������������������������������������������������-)
%����' +������������������������������������������������������������������������������������������������������������������������������������������������������-*

������������� �������������������������������������������
© C
entr
e fo
r C
reat
ive
Des
ign
������������� ������������������������������������������ �
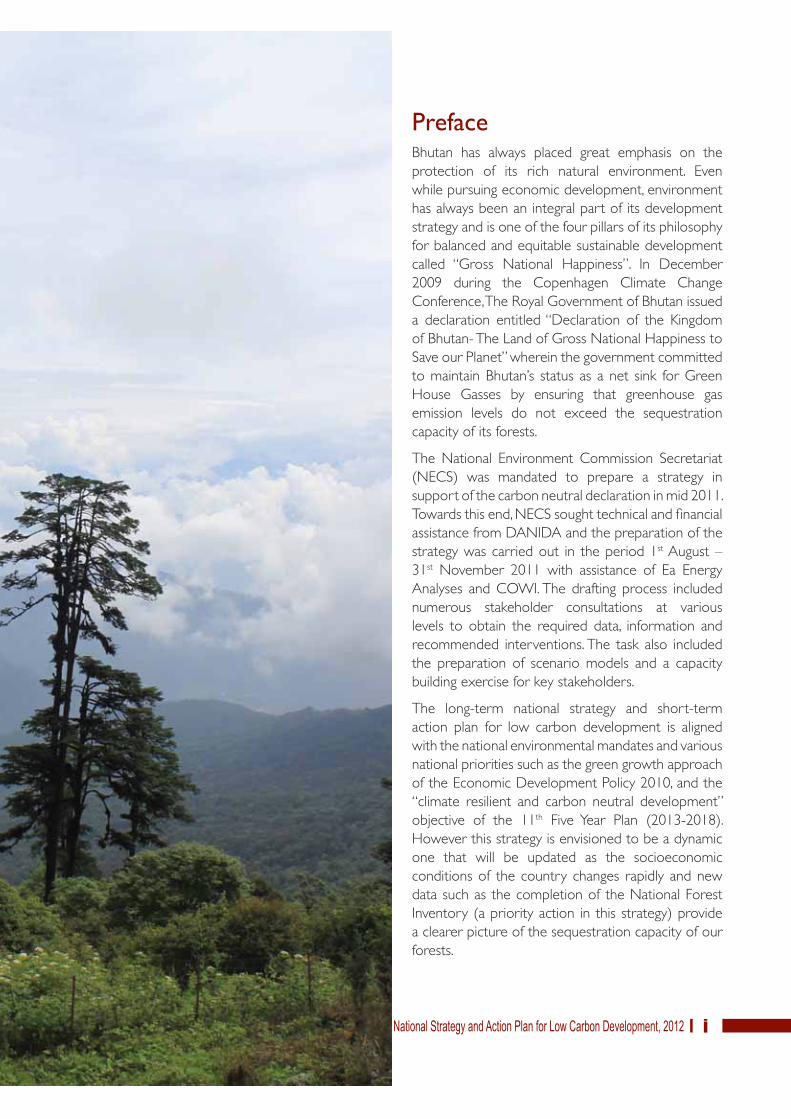
�������Bhutan has always placed great emphasis on the
protection of its rich natural environment. Even
while pursuing economic development, environment
has always been an integral part of its development
strategy and is one of the four pillars of its philosophy
for balanced and equitable sustainable development
called “Gross National Happiness”. In December
2009 during the Copenhagen Climate Change
Conference, The Royal Government of Bhutan issued
a declaration entitled “Declaration of the Kingdom
of Bhutan- The Land of Gross National Happiness to
Save our Planet” wherein the government committed
to maintain Bhutan’s status as a net sink for Green
House Gasses by ensuring that greenhouse gas
emission levels do not exceed the sequestration
capacity of its forests.
The National Environment Commission Secretariat
(NECS) was mandated to prepare a strategy in
support of the carbon neutral declaration in mid 2011.
Towards this end, NECS sought technical and financial
assistance from DANIDA and the preparation of the
strategy was carried out in the period 1st August –
31st November 2011 with assistance of Ea Energy
Analyses and COWI. The drafting process included
numerous stakeholder consultations at various
levels to obtain the required data, information and
recommended interventions. The task also included
the preparation of scenario models and a capacity
building exercise for key stakeholders.
The long-term national strategy and short-term
action plan for low carbon development is aligned
with the national environmental mandates and various
national priorities such as the green growth approach
of the Economic Development Policy 2010, and the
“climate resilient and carbon neutral development”
objective of the 11th Five Year Plan (2013-2018).
However this strategy is envisioned to be a dynamic
one that will be updated as the socioeconomic
conditions of the country changes rapidly and new
data such as the completion of the National Forest
Inventory (a priority action in this strategy) provide
a clearer picture of the sequestration capacity of our
forests.

������������� ��������������������������������������������
��������
Bhutan has always given high priority to conservation
and protection of our natural heritage, ensuring
sustainable socio-economic development. Our
constitutional mandate to maintain 60% of the land
area under forest cover for all times also has a global
benefit of carbon sequestration. Further, a policy
decision to pursue green growth has also been made
through the Economic Development Policy, 2010.
Most recently we have committed to ensure that our
GHG emissions do not exceed our sequestration
capacity as a demonstration of our will to address
climate change as a responsible member of the global
community despite not having contributed to global
warming.
Presently our emissions are about one third of the
total sequestration capacity of our forests resulting
in negative emissions. Due to the higher share of
hydropower based electricity in the energy mix,
Bhutan currently has low carbon intensity of 0.15
kg CO2e/USD of GDP purchasing power-parity
compared to an average of 0.46 kg CO2e/USD
among other developing countries. As per our Second
National Communication to the UNFCCC, emissions
are highest from the agriculture sector which is more
or less constant and dominated by livestock related
activities under subsistence farming. Emission from the
agriculture sector is highest at the moment primarily
due to lower level of industrialisation and high share
of electricity as energy source in the industries.
However, with rapid socio-economic development,
emissions from the energy and industrial sectors are
fast increasing with greater use of petrol and diesel
for transportation and increasing use of fossils fuels
such as coal products in industries and an overall
increase in manufacturing industries.
Assessment of future emissions under different
scenarios show increased emissions compared to
present levels but there is still a good chance that
emission will not exceed the sequestration capacity
of our forests. This is encouraging, but we should not
be complacent since socio-economic conditions are
constantly changing and we risk losing our carbon
neutral status if we do not take care of our forests or
make appropriate decisions about our development
pathway. The kind of development strategy that we
adopt today will make a huge difference tomorrow and
we need to make choices that promote sustainable
socio-economic development while achieving carbon
neutrality. Improvements in energy efficiency and
increasing the share of renewable energy would
provide environmental benefits and also enhance the
energy security. Some of the recommended actions
in this strategy will increase socio-economic benefits
through better employment, improved human health,
reduced dependence on imported energy (fossil
fuels) and lower pollution in our cities and country
side.
The carbon neutral commitment is not only aligned
with the green growth principle of our Economic
Development Policy but also with the global goal of
preventing dangerous anthropogenic interference
with the climate system. Such a commitment is
however a challenging pathway and we will require
the support of the international community through
technological, financial and capacity building support.
�� ���� ����0��12�������3��3����!��������������� ����� ������

������������� ������������������������������������������ ���
���������� ���
The National Strategy and Action Plan for Low
Carbon Development was prepared to enable
Bhutan to fulfill its commitment of remaining carbon
neutral. In other words, it will help in ensuring that
national emissions of greenhouse gasses (GHG)
remain less than the national sequestration capacity.
The strategy comprises of various scenarios analysing
development paths from 2005 till 2040. As a
supplement to the scenarios the action plan presents
a number of short- and medium-term interventions
to achieve sustainable economic development
through green growth.
The analysis starts by defining a baseline, i.e.
development path under a business-as-usual regime.
The data for the baseline is based on data from
the National Environment Commission (NEC)
and National Statistics Bureau supplemented by
information from various other stakeholders. One of
the core elements for analysis is the Bhutan Energy
Data Directory 2005. Bhutan’s sequestration capacity
in the analyses is assumed constant over the period
until 2040 while emissions are analysed in more detail.
In line with the methodology applied for the National
Greenhouse Gas (GHG) Inventory, prepared as
per Inter-governmental Panel on Climate Change
(IPCC) guidelines, projections are made on a sectoral
basis. Emissions are broadly categorised as energy
related (residential, commercial, and industrial energy
consumption as well as transport) and non-energy
related (industrial processes, agriculture, land use and
forestry, and municipal waste) emissions.
Today Bhutan has low carbon intensity of 0.15
kg CO2e/USD of GDP purchasing power -parity
compared to an average of 0.46 kg CO2e/USD
among other developing countries. However, the low
intensity reflects the higher share of energy demand
met by hydro power in Bhutan. Other hydropower
based country like Nepal has lesser carbon intensity
of 0.12 kg CO2e/USD but also a lower GDP/capita.
Bangladesh, which has no hydropower and a low
GDP/capita, has an intensity of 0.22 kg CO2e/USD.
For projection of the energy related carbon
emissions it is assumed that an increase in economic
growth (GDP or GDP/capita) leads to an increased
demand for energy services (light, heat, transport,
etc.) and consumption of final energy (fuel wood,
Today Bhutan has low
carbon intensity of 0.15
kg CO2e/USD of GDP
purchasing power -parity
compared to an average of
0.46 kg CO2e/USD among
other developing countries.
�
�
© Centre for C
reative Design
������������� ��������������������������������������������
kerosene, diesel, etc.) resulting in increasing carbon
emissions. Reduction in the energy related emissions
can be achieved by improving the energy efficiency
of appliances producing energy services and/or by
changing the source of final energy from fossil fuels to
renewable energy sources. Three different scenarios
of energy related emissions have been analysed to
show the possible impact of energy efficiency and
renewable energy on the emission levels.
Scenarios were not developed for non-energy related
carbon emissions due to lack of sufficient data and
time. However it is assumed that an increase in GDP
leads to an increase in demand for final products
resulting in increasing carbon emissions from non-
energy sectors. Non-energy related emissions can
be reduced by improving carbon intensity in the
production process and/or reducing the production
of for example municipal waste.
������������� ������������
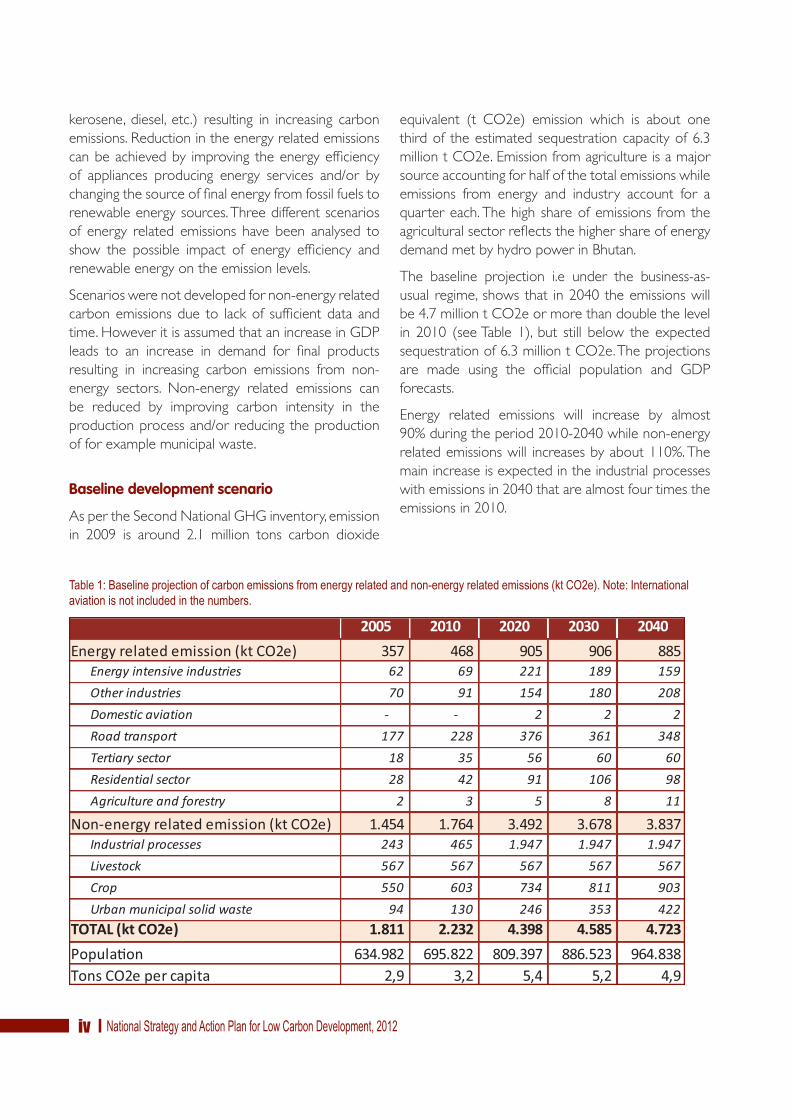
As per the Second National GHG inventory, emission
in 2009 is around 2.1 million tons carbon dioxide
equivalent (t CO2e) emission which is about one
third of the estimated sequestration capacity of 6.3
million t CO2e. Emission from agriculture is a major
source accounting for half of the total emissions while
emissions from energy and industry account for a
quarter each. The high share of emissions from the
agricultural sector reflects the higher share of energy
demand met by hydro power in Bhutan.
The baseline projection i.e under the business-as-
usual regime, shows that in 2040 the emissions will
be 4.7 million t CO2e or more than double the level
in 2010 (see Table 1), but still below the expected
sequestration of 6.3 million t CO2e. The projections
are made using the official population and GDP
forecasts.
Energy related emissions will increase by almost
90% during the period 2010-2040 while non-energy
related emissions will increases by about 110%. The
main increase is expected in the industrial processes
with emissions in 2040 that are almost four times the
emissions in 2010.
�����!"�#��������$�����������������##���#�������� ��������������%���� �����������##���#&'��(��)*����!+���������������������#�������,������-��,����#*
2005 2010 2020 2030 2040
357 468 905 906 88562 69 221 189 159
70 91 154 180 208
2 2 2
177 228 376 361 348
18 35 56 60 60
28 42 91 106 98
2 3 5 8 11
1.454 1.764 3.492 3.678 3.837243 465 1.947 1.947 1.947
Livestock 567 567 567 567 567
Crop 550 603 734 811 903
94 130 246 353 422
1.811 2.232 4.398 4.585 4.723
Popula/on 634.982 695.822 809.397 886.523 964.8382,9 3,2 5,4 5,2 4,9

������������� ������������������������������������������ �
��������������������������
An overview of the results of the three modelled
scenarios for energy related carbon emissions is
presented in Figure 1 above.
In the baseline projection energy related carbon
emission increases by a factor 2.5 from 2005 to 2040.
A focused effort to improve energy efficiency in all
sectors could bring about a 10% reduction in 2040
compared to the baseline. A focused effort to increase
the share of renewable energy has a much more
significant impact and could result in a 42% reduction
in 2040 compared to the baseline development. A
combined pursuit of energy efficiency and renewable
energy will have a slightly larger impact, about 49%
reduction in 2040 emission levels relative to the
baseline level.
Bhutan has a large hydro power potential and
exploitation of this resource is gradually increasing
with the construction of new large scale hydro power
plants. In 2009, the total hydro power production was
6,925 GWh with an installed capacity of 1,480 MW.
About 78% of the production was exported to India.
The carbon emission level of the marginal production
in the Indian electricity system is 1.0 tCO2e/MWh. In
other words, the electricity exported to India in 2009
.� ,�� �! ����������� �� /������� � ���#,������ &'���) ������� �����������������##���#&'��(��)���-���,������������� �#�������#���0%��1�*223���� ���/������4523������������� �*����!���%���� �����������##���#����������,���*
represents about 5.4 million t CO2e avoided emission
due to electricity generation in India. Bhutanese hydro
power production thus not only benefits Bhutan but
also the regional carbon balance. The 2009 amount
of avoided carbon emissions in India due to import
of electricity from Bhutan exceeds the total expected
2040 amount of carbon emissions in Bhutan.
�������������
A number of potential interventions/mitigation actions
have been identified based on reviews of existing
documents and consultations with stakeholders. An
overview is presented in Table 2. Assessments of
abatement costs and benefits are merely qualitative.
Further, specific and detailed studies are required in
order to quantify the abatement costs.
The criteria applied for selection of interventions
include volume, costs, non-economic barriers
(i.e. conflict of interest between sector policies),
sustainability benefits (such as improved employment,
reduced traffic and health improvements), and the
specific ‘window of opportunities’ of using state of
the art technology in an expanding economy. There
2005 2010 2020 2030 2040
Baseline
2005 2010 2020 2030 2040
2005 2010 2020 2030 2040 2005 2010 2020 2030 2040

������������� ��������������������������������������������
are many opportunities for implementing interventions with low economic and non-economic costs. However,
the large emitters of carbon also represent the largest economic and non-economic barriers.
�����!5����������#-���%�������,�%����������#*
����������������������
�������������������
����������������������
�������� ���� ����� �� ���� ��������� ��������� ������ ������� ��� ������ ��� ������� ������� ��� �������������������������
������ ���� � ���� ��� ����� ����� ���� ������ ����������������������������� ������������������������������������������� ��� �� ��� ������ ���������� ��� ������ ����� ���������� ��������
��� ��������
���!�����"���������������������������������������������������������� ���������� ����#����������������������������� ����������������������#��������� ������#����������������������������������� �������� �
�������!�������
�������������� ����������$�������������� ������������� �����$�������������������������������������������������%��������& ����������� ���������������������������������������� ������#����������������������������������� �������� �
������ ������"����
'�������� ������� ��� ������� � ��� ������� ������ ���� � ������������������������������������������������
��������� ������ ��� �� ��� ���������� � ���� ��� ���� ����� ��� ��������������������
#������� ���
(��� �����������#�����������������������#��#����������������������������������� ���������������������������������������������������������
)����������������������������������
(�������������� ��������� � ���� ������ *�������� �������� ��� ������������������������� ������
(�������� ��������������������
#���������������
'�� �� �������� ��+�������� � ���� ���� � �� ��������� ���������� ��� ���� �� ������� (������ ��� ��� � ���������������������������������
����������������������������������� �������������������� �������� ������������������������������������������������ �������������������������������� ������������� ���
'�������������� ��������������������������������������������� ���������
)������������� ������������������������������������������ �������������������������
$�������%����������
���������������������������������������������,������������� )������� ��� ������ ���� ���������� ��� ������� ���������� ��+��������� �������������������� ��� ������� �����'������������� ������������� ������
)�������� ����� � ��� �������� ��� ���� ��� �� � ���� ��������������� ��� ������ ��������� � ���� � ���������� ��� �����������������
$��������&��'��� ����
-����� ���� � ������� ��� ������� ����� ����� ��� ���������������������������
�������������������������������������������.�������������� ��� � ������ ���� ���� ��� ��� �������� ������ ������������������� ����
'������������������������������������������������������������������������������ ���� ����

������������� ������������������������������������������ ���
The Cement, Ferro-silicon and Calcium carbide
industries emit a huge amount of carbon due to the
use of fossil fuels in the manufacturing process. These
industries in the baseline projection are expected to
increase significantly resulting in a more than 400%
increase in carbon emissions in 2040 relative to
2010 emissions. Though there is a huge potential for
reduction in these industries, the cost of reduction
would be enormous. There is very little information
or no information on the costs of improving the
efficiency and reduction of emissions in these
industries. The industries are located in Bhutan, mainly
because of the availability of raw materials and cheap
hydropower energy. It is likely that conflict of interest
among environmental policies and economic policies
would arise and this would mean additional barrier in
reducing emissions from this sector.
The proposed actions recommend a controlled
development allowing further investigations on how to
ensure employment opportunities and development
of local capacity to exploit a larger share of the value
chain and to reduce environmental impacts from
mining and processing etc. The recommendations
include a long list of probable/possible interventions
in all the sectors discussed in the strategy. The actions
are mostly with regard to improving energy efficiency
and switching to higher share of renewable energy
sources in the energy mix. It is recommended to
further investigate how international standards can be
applied to Bhutan to reduce emissions and increase
sustainability benefits.
There is a huge potential for emission reduction in
transport sector with multiple cumulative benefits.
Lesser number of cars and switch towards renewable
energy would ease local traffic congestion; improve
local air quality while reducing threats to human
health from pollution. Highest emission reduction
can be achieved by promoting electric and hybrid
cars and by improving the efficiency and frequency
of mass transport services. Promotion of alternative
modes of travel like bicycles, walking etc would have
health as well as emission reduction benefits. These
must be encouraged through proper city designs with
options for safe and convenient trails for bicycling
and walking and shortening the walking distances.
Ropeways as an environment friendly option must be
explored as it has potential to reduce the number of
conventional heavy duty trucks for goods transport,
thus the expenditure on import of fuel and ease of
traffic and also as alternative to roads in ecologically
sensitive areas.
Another important area of intervention will be to
enhance the carbon sequestration capacity and
detailed assessment of the existing carbon stock
(sequestration capacity). The Department of Forest&
Park Services has already initiated the National
Forest Inventory process. Since the forest inventory
process would estimate the carbon stocks for Bhutan
in detail, it needs to be given more priority in terms
of resource allocation and funding support.
(����
There exist a number of financing mechanisms
under the international climate regime. Nationally
Appropriate Mitigation Actions (NAMA) is a new
mechanism under the UN Framework Convention on
Climate Change (UNFCCC). NAMAs can be policies,
programs or projects implemented at national,
regional or local levels. However, UNFCCC secretariat
is still in the process of gathering information related
to methodology, sectors and gases to be covered, the
support required for implementation of NAMAs and
the expected mitigation outcomes from the NAMA
process. LDCs and SIDs have the flexibility to submit
the NAMAs at our own discretion. On 5th February
2010, the Royal Government of Bhutan registered
in the NAMA pipeline1. NAMA with a nationwide
approach and carbon emission target to remain
carbon neutral as emission reduction goal.
One of the requirements to the NAMAs is that the
actions must be embedded in the broader national
sustainable development strategy and must be
measurable, reportable and verifiable. With this study
and the previous work and legislation prepared by
the Royal Government of Bhutan mitigation actions
have been embedded in a broader context. What
remains is to gradually improve the basis for informed
decision-making i.e. the data on various statistical
topics including energy consumption and carbon foot
print information.
1 UNEP Risoe NAMA pipeline

������������� ����������������������������������������������
����������
There is a room for increasing emissions within the
present level of sequestration if the assessment
is reliable. Should the sequestration be less than
anticipated, the present rate of consumption of
fuel wood and industrialization would put the
commitment of remaining carbon neutral at stake.
Therefore it must be a high priority to support
the National Forest Inventory process initiated by
Department of Forest and park Services.
The mineral based and energy intensive industries
are the main emitters of carbon and the proposed
investigation of how international standards can be
applied in Bhutan must have high priority.
There is a huge potential for reducing the energy
related emissions. A combination of both energy
efficiency and renewable energy efforts constitutes
a sound strategy to limiting emissions and therefore
development opportunities should be further
investigated. Transport is one of the key sectors
wherein there is a huge potential of emission
reductions. Improvement in the mix of car fleet, mass
transport and limiting the number of cars therefore
must be a key area of focus in order to achieve the
commitments.
Finally, the agriculture sector comprises opportunities
for increasing yield and thus rural welfare without
increasing carbon emissions.
The current drive for economic development and
purchase of energy consuming goods together with
the building boom, provide a ‘window of opportunity’
to mitigate carbon emission cost-effectively seen
from a long-term societal perspective – in particular
within building construction, transport, and intensive
industries. However, resolute and immediate action is
required and is not a small task for anyone.
© K
arm
a C
. Ney
drup
, NEC

������������� ������������������������������������������ �
����� ���������� �����������
����������������

������������� �������������������������������������������
During the 15th Session of Conference of Parties (COP15) of the United
Nations Framework Convention on Climate Change (UNFCCC) in
Copenhagen, the Royal Government of Bhutan committed to remain
carbon neutral, ensuring that the country’s greenhouse gas (GHG)
emissions will remain less than the sequestration capacity of its forests
for all times. The term “carbon” here refers to the green house gasses
Carbon dioxide (CO2); Methane(CH
4)and Nitrous Oxide (N
2O) and is
measured in unit of CO2 equivalents (CO
2e).
The Economic Development Policy, 2010 states that sustainable
economic development will be achieved by encouraging and promoting
green growth in industrial & private sector. However, at present,
emissions are continuously growing with increase in number of industries
proportionate to the economic development of the country.
This document presents a long-term national strategy and an action
plan for low carbon development including interventions and actions
recommended for fulfilment of the commitment through promotion of
green growth.
The function of the long-term national strategy for low carbon
development is to underpin the realisation of balanced and equitable
socio-economic development sustainably. The main principles upon
which the long-term national strategy for low carbon development
is formulated are consistent with the values guiding the economic
development vision. The long-term national strategy sets a target for the
period until 2040 and describes a strategy for how this target may be
achieved, with intermediate targets for 2020 and 2030.
The stepwise implementation of the long-term strategy will be coined in
a number of action plans of which the first part of this report is a short-
term action plan for the near term period.
BRIEF SITUATIONAL BACKGROUND
Bhutan is unique in terms of the mix of natural resources and emphasis
on Gross National Happiness and sustainable development. Bhutan
is explicitly striving to uphold Buddhist belief while balancing the
development vision of a green and self-reliant economy sustained by
an IT enabled knowledge society (Economic Development Policy of the
Kingdom of Bhutan, 2010).
The guiding philosophy of “Gross National Happiness (GNH)”
emphasises on:
�� Sustainable economic development;
�� Preservation and promotion of culture and tradition;
�� Conservation of environment;
�� Good governance.
Action plans
A long-term national strategy
GNH
Carbon neutrality
������������� ������������������������������������������ �
Currently 70.46% of the total land area of 38,394km2 are under forest
cover. There is also a constitutional mandate to maintain a minimum
of 60% of the country under forest cover for all times to come. Parks
and protected areas make up half of the area of Bhutan. Forests thus
constitute a major green house gas sink while at the same time providing
biomass for energy and an important income potential from tourism
industry (eco-tourism).
As of 2005, about 69% of the total population resides in the rural area.
The accelerated rural electrification program aims to achieve 100%
electrification (“Electricity for All”) by 2013. Electricity is provided
almost entirely by hydro power, while biomass is dominant for cooking
and heating. Remote location and scattered settings coupled with
rugged terrain of the country makes connection of all to the main grid
difficult and expensive. Therefore, off-grid requirement is met by mini
hydropower systems and solar systems as alternatives.
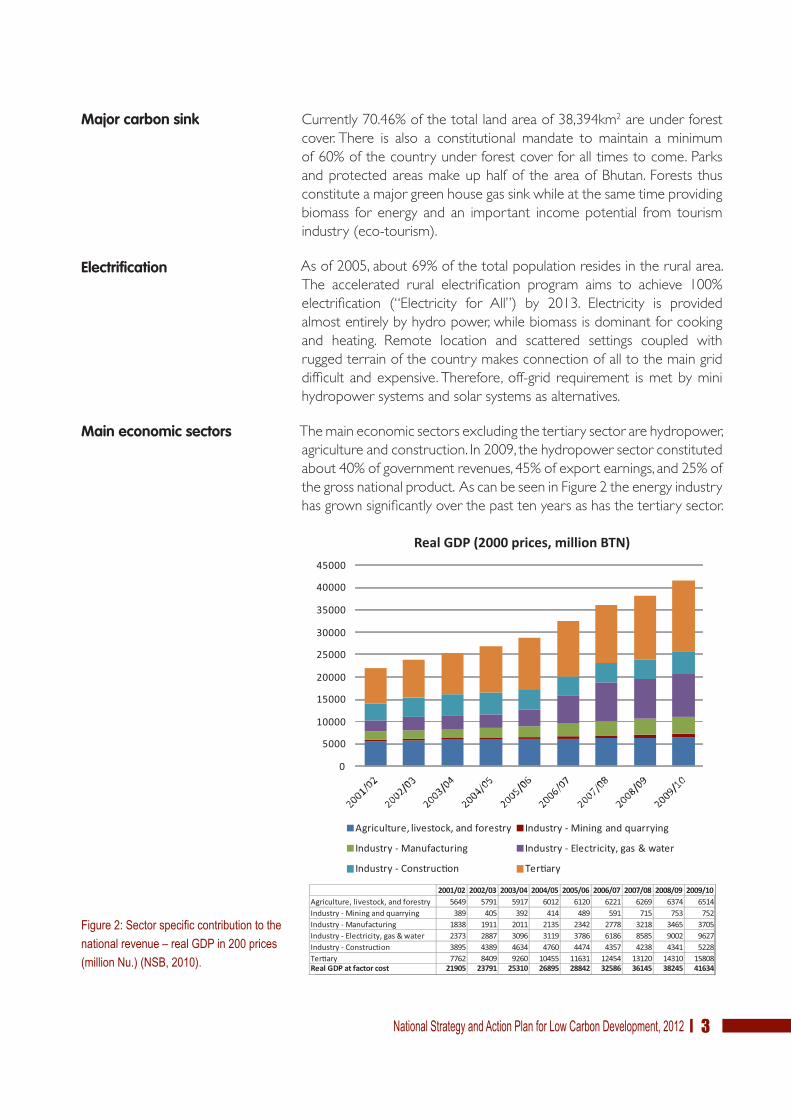
The main economic sectors excluding the tertiary sector are hydropower,
agriculture and construction. In 2009, the hydropower sector constituted
about 40% of government revenues, 45% of export earnings, and 25% of
the gross national product. As can be seen in Figure 2 the energy industry
has grown significantly over the past ten years as has the tertiary sector.
Electrification
Main economic sectors
Major carbon sink
.� ,���!�����#����/��������,�������-��������������,�6����7������������#&��������,*)&�"�����)*
0
5000
10000
15000
20000
25000
30000
35000
40000
45000
Manufacturing
Construc/on Ter/ary
2001/02 2002/03 2003/04 2004/05 2005/06 2006/07 2007/08 2008/09 2009/105649 5791 5917 6012 6120 6221 6269 6374 6514
389 405 392 414 489 591 715 753 7521838 1911 2011 2135 2342 2778 3218 3465 37052373 2887 3096 3119 3786 6186 8585 9002 96273895 4389 4634 4760 4474 4357 4238 4341 5228
Ter/ary 7762 8409 9260 10455 11631 12454 13120 14310 1580821905 23791 25310 26895 28842 32586 36145 38245 41634
Real GDP (2000 prices, million BTN)
������������� �������������������������������������������
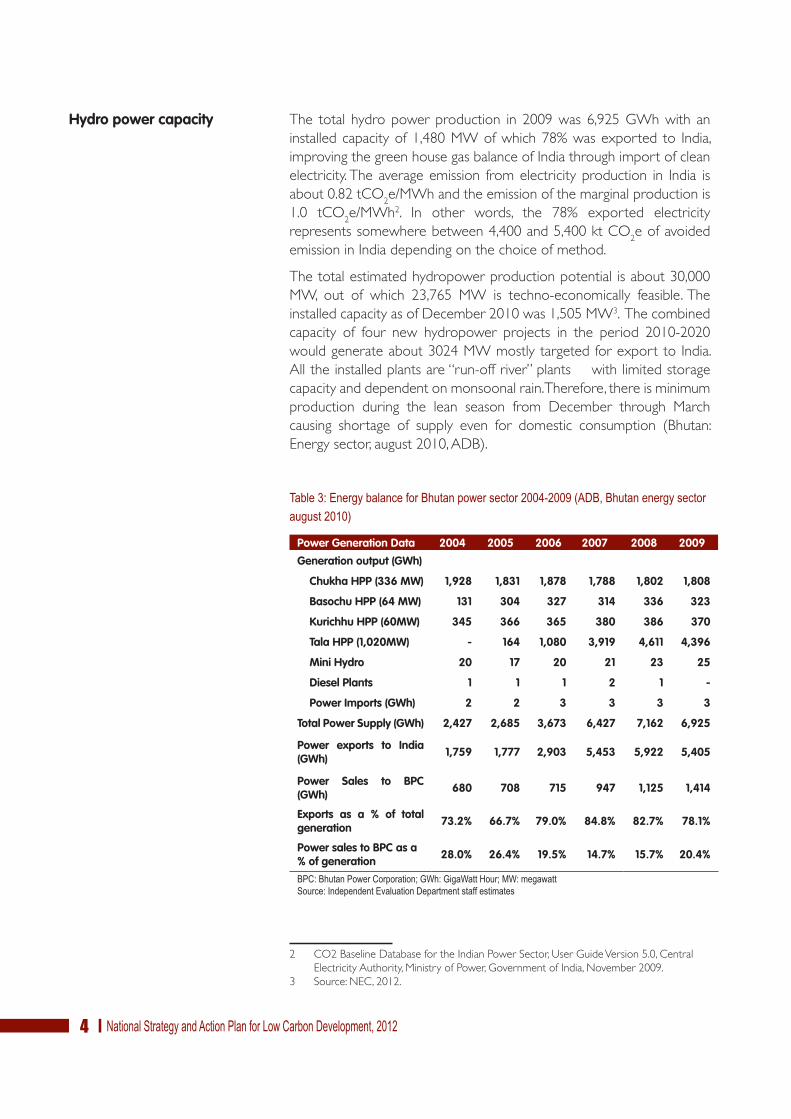
The total hydro power production in 2009 was 6,925 GWh with an
installed capacity of 1,480 MW of which 78% was exported to India,
improving the green house gas balance of India through import of clean
electricity. The average emission from electricity production in India is
about 0.82 tCO2e/MWh and the emission of the marginal production is
1.0 tCO2e/MWh2. In other words, the 78% exported electricity
represents somewhere between 4,400 and 5,400 kt CO2e of avoided
emission in India depending on the choice of method.
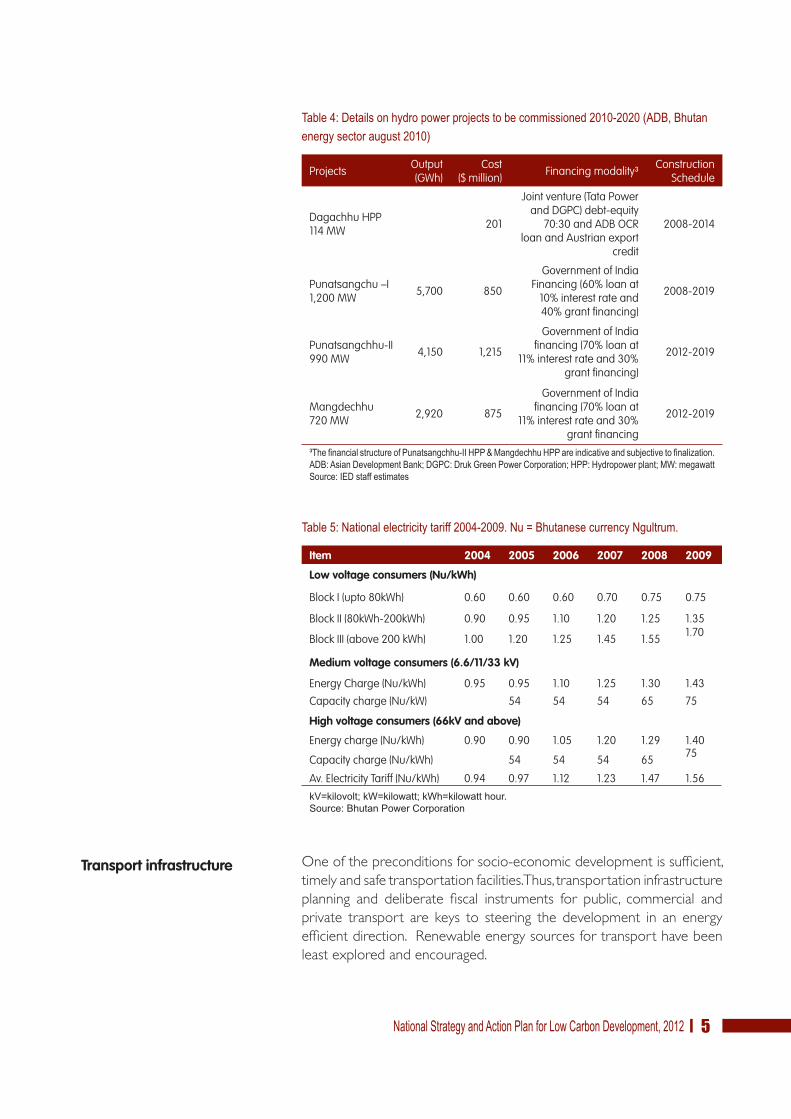
The total estimated hydropower production potential is about 30,000
MW, out of which 23,765 MW is techno-economically feasible. The
installed capacity as of December 2010 was 1,505 MW3. The combined
capacity of four new hydropower projects in the period 2010-2020
would generate about 3024 MW mostly targeted for export to India.
All the installed plants are “run-off river” plants with limited storage
capacity and dependent on monsoonal rain. Therefore, there is minimum
production during the lean season from December through March
causing shortage of supply even for domestic consumption (Bhutan:
Energy sector, august 2010, ADB).
����8!2��� �����������"-,��������#��������1%���9&��"�"-,������� �#������, ,#�����)
Power Generation Data 2004 2005 2006 2007 2008 2009
Generation output (GWh)
Chukha HPP (336 MW) 1,928 1,831 1,878 1,788 1,802 1,808
Basochu HPP (64 MW) 131 304 327 314 336 323
Kurichhu HPP (60MW) 345 366 365 380 386 370
Tala HPP (1,020MW) - 164 1,080 3,919 4,611 4,396
Mini Hydro 20 17 20 21 23 25
Diesel Plants 1 1 1 2 1 -
Power Imports (GWh) 2 2 3 3 3 3
Total Power Supply (GWh) 2,427 2,685 3,673 6,427 7,162 6,925
Power exports to India (GWh) 1,759 1,777 2,903 5,453 5,922 5,405
Power Sales to BPC (GWh) 680 708 715 947 1,125 1,414
Exports as a % of total generation 73.2% 66.7% 79.0% 84.8% 82.7% 78.1%
Power sales to BPC as a % of generation 28.0% 26.4% 19.5% 14.7% 15.7% 20.4%
"��!"-,�������������������47:-!7� �:���;�,�4<:!�� ������,���!+����������2���,���������������#�����#������#
2 CO2 Baseline Database for the Indian Power Sector, User Guide Version 5.0, Central
Electricity Authority, Ministry of Power, Government of India, November 2009.
3 Source: NEC, 2012.
Hydro power capacity
������������� ������������������������������������������ �
����1!������#��-������������$���#���������##���������%����&��"�"-,������� �#������, ,#�����)
Projects Output(GWh)
Cost($ million) Financing modality³ Construction
Schedule
Dagachhu HPP114 MW 201
Joint venture (Tata Power and DGPC) debt-equity
70:30 and ADB OCR loan and Austrian export
credit
2008-2014
Punatsangchu –I1,200 MW 5,700 850
Government of India Financing (60% loan at
10% interest rate and 40% grant financing)
2008-2019
Punatsangchhu-II990 MW 4,150 1,215
Government of India financing (70% loan at
11% interest rate and 30% grant financing)
2012-2019
Mangdechhu720 MW 2,920 875
Government of India financing (70% loan at
11% interest rate and 30% grant financing
2012-2019
= -�/�������#��,��,�����,���#�� �--,%++;��><�� ���--,;������������������#,�$��������/����?�����*��"!�#��������������"��'4�7��!��,'7��������������������4;��!;��������������4<:!�� ������,���!+2�#�����#������#
����0!����������������������������1%���9*�,3"-,����#��,������� ,���,�*
Item 2004 2005 2006 2007 2008 2009
Low voltage consumers (Nu/kWh)
Block I (upto 80kWh) 0.60 0.60 0.60 0.70 0.75 0.75
Block II (80kWh-200kWh) 0.90 0.95 1.10 1.20 1.25 1.35
Block III (above 200 kWh) 1.00 1.20 1.25 1.45 1.55 1.70
Medium voltage consumers (6.6/11/33 kV)
Energy Charge (Nu/kWh) 0.95 0.95 1.10 1.25 1.30 1.43
Capacity charge (Nu/kW) 54 54 54 65 75
High voltage consumers (66kV and above)
Energy charge (Nu/kWh) 0.90 0.90 1.05 1.20 1.29 1.40
Capacity charge (Nu/kWh) 54 54 54 65 75
Av. Electricity Tariff (Nu/kWh) 0.94 0.97 1.12 1.23 1.47 1.56
������������������ ���������� ����������������������� �������������
One of the preconditions for socio-economic development is sufficient,
timely and safe transportation facilities. Thus, transportation infrastructure
planning and deliberate fiscal instruments for public, commercial and
private transport are keys to steering the development in an energy
efficient direction. Renewable energy sources for transport have been
least explored and encouraged.
Transport infrastructure

������������� �������������������������������������������
The potential for improvement of local farming techniques to further
organic farming is significant as is the potential to increase energy
efficiency in the use of biomass (SHARE International Conference,
May 2009). “Brand Bhutan” is intended to help further local business
development based on natural resources. Brand Bhutan is an umbrella
brand for a strategy to position Bhutan’s special qualities and products as
leverage for economic development in line with the philosophy of GNH.
The objectives of the Economic Development Policy of Bhutan are to
achieve economic self-reliance by 2020 and achieve full employment.
The strategies outlined to achieve these objectives are as presented
below.
RGoB aims to achieve a minimum economic growth rate of 9% annually
and become a middle-income nation4 by 2020 (RGoB, EDP, 2010, p. 2).
Compared to the immediate neighbours Bangladesh, Nepal and
India, Bhutan has a relatively high purchasing-power-parity (see Figure
3). Bhutan’s purchasing-power-parity is also higher than the overall
development of “Developing Asia”.
4 World Bank definition of middle income nation using the Atlas method: Lower middle
income nation has a gross national income of 1,006-3,975 USD/capita and a higher middle
income nation 3,976-12,275 USD/capita. Bhutan’s 2010 gross national income =1,920
USD/capita.
Economic development policy
Local farming and Brand Bhutan
Economic development policy 2010:
• Development objectives
– Achieve economic self-reliance by 2020
– Full employment (97.5%)
• Strategies
– Diversify economic base with minimal ecological footprint
– Harness and add value to natural resources in a sustainable
manner
– Increase and diversify exports
– Promote Bhutan as an organic brand
– Promote industries that build the Brand Bhutan image
– Reduce dependency on fossil fuel especially in respect to
transportation
• Policy objective
– Create an enabling environment for investment

������������� ������������������������������������������ �
.� ,��8!7����#���,��-�#�� %�����%���������������&2@���������+<.:2(������#�)* -� ���� ��� A��������� �#��B �# �����#�� �� �C ��,�����#! 5��,���� ���� -���#����"�� ����#-�"-,����"�,������,##���������������-����.�$��+�����+�����#���D�����������������E#����������5��,�����<����#���<������#�<���������������'�#�������,���� 7,����� �-��������#� ����� ������ +#����#� �� ���'�� -������� ����������5��,������ ����%��#��� �� ��F��,��,����F������*
At present, the Bhutanese economy has relatively low carbon intensity.
According to U.S. Energy Information Administration, Bhutan’s CO2
intensity5 per unit of GDP in 2009, valued at purchasing-power-parity,
constituted 0.108 tons of CO2 per thousand 2005-USD of GDP which
is well below the world average of 0.464 t of CO2 per thousand 2005-
USD of GDP. This places Bhutan on the 29th place out of 48 least-
developed countries and close to Nepal (see Figure 4).
.� ,��1!�������#���������������#���,#�� �,��-�#�� %�����%������&��(�����-�,#������0%G�)&���*���* ��)*
5 According to IEA’s list of countries by ratio of GDP to carbon dioxide emissions, Octo-
ber 2010, Bhutan’s CO2 intensity per unit of GDP in 2006, valued at purchasing-power-
parity, constituted 0.146 tonnes of CO2 per 1,000 USD of GDP which is well below the
world average of around 0.4 tonnes of CO2 per 1,000 USD of GDP.
1994
1996
1998
2000
2002
2004
2006
2008
2010
2012
2014
power
Bangladesh
Bhutan
India
Nepal
0,050
0,070
0,090
0,110
0,130
0,150
0,170
0,190
0,210
USD
power parity
Bangladesh
Bhutan
Cambodia
Laos
Nepal

������������� �������������������������������������������
The intended economic growth will among others inevitably bring
about a larger demand for energy. Targeted energy efficiency efforts and
low-carbon solutions can limit the extent of the increase in demand
for non-renewable energy. Hydro power is highly sought after on the
international market as it can supplant fossil fuel based production as
well as compensate for fluctuations in other types of renewable energy
production such as wind provided that there is sufficient water at the
time in question. (It should, however, be noted that in general there are
some cases where exploitation of hydro power potentials may cause
local environmental problem.)
There are economic trends in Bhutan which will drive the economic
development over the next decades:
�� The promotion of Gross National Happiness is expected to
comprise economic growth in rural as well as urban areas.
�� During the last decade there has been increasing migration from
rural to urban areas. In 2005 around 30% of the population
were living in urban areas and in 2015 this share is expected to
be close to 50%.
�� Increasing unemployment among young men and women while
the number of youth finishing higher education is increasing.
Such unemployment is estimated to have risen from 4% to 15%
during the last six years. At the same time labour is imported
on a large scale for tasks particularly in the construction sector.
�� There is a strong focus on greening the economic development
by supporting sustainable tourism and eco-farming.
�� Bhutan as mentioned earlier has a large potential for hydro
power generation and a large international market for export
of electricity. During recent years the investment in hydro
power plants and the generation of electricity from these plants
have formed a major share of the increasing GDP.
Of the ten government ministries the following are particularly relevant
to the development of a low carbon strategy
�� MoAF – Ministry of Agriculture and Forests
�� MoEA – Ministry of Economic Affairs
�� Departments of Energy, Geology and Mines, Industry,
and Trade
�� MoF – Ministry of Finance
�� MoIC – Ministry of Information & Communication
�� Road Safety and Transport Authority
�� MoLH – Ministry of Labour and Human Resources
�� MoWHS – Ministry of Works and Human Settlement
�� DUDES – Department of Urban Development &
Engineering Services
Economic trends
Organization

������������� ������������������������������������������ �
Also the Tourism Council of Bhutan can play an important role.
The Gross National Happiness Commission (GNHC) is charged with
ensuring that GNH is mainstreamed into the planning, policy making and
implementation process by evaluating their relevance to the GNH
framework of 1) developing a dynamic economy as the foundation for a
vibrant democracy; 2) Harmonious Living – in harmony with tradition
and nature; 3) Effective and good governance; and 4) The people:
investing in the nation’s greatest asset.
The National Environment Commission (NEC) is the highest decision
making and coordinating body on all the matters relating to the
protection, conservation and improvement of the natural environment.
The mandate of the NEC includes among other to:
�� Develop, review and revise environmental policies, plans and
programmes
�� Formulate, review and revise environment related Laws/Acts
and monitor enforcement of the same.
�� Mainstream environment into the country’s developmental
policies, plans and programmes
The National Environment Commission is the national focal agency for
climate change in Bhutan and also the National Focal Agency for the UN
Framework Convention on Climate Change. The NEC is the also the
Designated National Authority under the Kyoto Protocol for the Clean
Development Mechanism.
.� ,��0!(� ���?��������2�
GNHC
NEC
U
�

������������� �������������������������������������������
UNFCCC GHG INVENTORY
Bhutan is a UNFCCC Non-Annex I Party6. All Parties to the UNFCCC
must submit national reports on the implementation of the Convention
to the Conference of the Parties based on the principle of “common but
differentiated responsibilities”. Annex I Parties must biannually submit an
inventory of their GHG emissions, which is subsequently reviewed by
international review teams. Non-Annex I Parties such as Bhutan must
report in more general terms on their actions to address climate change
and to adapt to its effect.
Bhutan submitted the first GHG inventory to the UNFCCC in 2000
presenting an inventory for 1994. The second inventory with 2000 as
the base/inventory year was submitted in November 2011 as part of the
Second National Communication.
The GHG inventories operate with two main categories of emissions
namely energy related emissions and non-energy related emissions,
as shown below in Table 6.The categories marked in grey – railways,
national navigation, pipeline transport, and international marine bunkers
– are not relevant in Bhutan’s case. However railway connection to a few
border towns are being considered according to the Policy & Planning
Division of MoIC, January 2012 – a fact that was not available at the time
of the preparation of the analyses presented in this report.
����C!7;7���##���#���� ����#&G�.���)*7������� ����#����������������"-,���E#��#�*����#������ �-�� ����������������� ��� ��������� ����#������� ���#�������������� ���-�������>������� ����#�����<�+��H��,�������6������-����#���������������-��������-���������������-�#������*
Categories Subcategories
Energy related fuel combustion
Energy industriesManufacturing industries and construction
Transport
Domestic aviationRoadRailwaysNational navigationPipeline transport
Other sectorsCommercial / institutionalResidentialAgriculture / forestry / fishing
OtherEnergy related fugitive emissions from fuel
Solid fuelOil and natural gas
Memo itemsInternational marine bunkersInternational aviation bunkersCO2 emissions from biomass
Non-energy related
Industrial processesSolvent and other product useAgricultureLand use change and forestryWasteOther
6 Parties to UNFCCC are classified as: Annex I countries) Industrialized countries and
economies in transition; Annex II countries) A sub-group of developed countries which
pay for costs of developing countries; and Non Annex I countries) Developing countries.

������������� ������������������������������������������ ��
As per the trend analysis of GHG emissions from 1995-2009, it is evident
that the GHG emissions from the energy sector and the industrial sector
are growing significantly although agriculture still constitutes the largest
emitter of the sectors (primarily due to CH4 emissions from enteric
fermentation and manure).
.� ,��C!�������������7;7�990%���9������-����#�����&���!���7;7���������)*
.� ,�� I! ����������� �� ���� �%������� 7;7 �990%���9 ��� ���- ���� #����� &���!��� 7;7 ���������)* ���#���� ���##���# ��� �����#����� �� �-� ��� -� ��� ���� ������,����,��� ���,#����#���-�����������*
��������� ��������
����������
������
�������������
��������������
����
�
����
���
!���
"���
#�����
#�����
#$$% #$$! #$$& #$$" #$$$ ���� ���# ���� ���' ��� ���% ���! ���& ���" ���$
������������
� ����
U
�!"#$%&�'()*&+,-$$-$
./&�,#(%#&-
0!-&/1
23+$$�()3#-($�
0!-&/1)4)�!"#$
�'$%-
(
)**�
+**�
,**�
-**�
.�***�
.�)**�
.//0 .//, .//1 .//- ./// )*** )**. )**) )**2 )**+ )**0 )**, )**1 )**- )**/
5/)+6)7�8)09
#�:'(-!%

������������� ��������������������������������������������
A low net level of CO2e can be achieved by expanding the capacity
for uptake (so-called sequestration) or/and limiting the emissions. The
emissions sequestration in 2009 is estimated by NEC to be approximately
6,300 kt CO2e while the emissions constitute 2,100 kt CO
2e, leaving a
margin of two thirds of the sequestration.
In conclusion, the challenge facing Bhutan is to achieve the right balance
between economic development and carbon neutrality whilst increasing
the degree of economic self-sufficiency but retaining an open exchange
with the international world both in terms of services and goods but
also cooperation to mutual climate benefits.
.� ,��J!��-����� �-��� -���������������������������������������������,�������*
Economic development requires energy and will be restrained by
insufficient energy supply. Access to cost-effective renewable energy is
thus imperative to sustainable development of the economy. Waste
generation and management also posses challenges to sustainability and
emissions reductions.
The most significant growth in carbon emissions is within the energy
and industry sector and it is a serious challenge to decouple economic
growth from excessive energy consumption and carbon emissions.
METHODOLOGICAL APPROACH
Scenario analysis is a useful tool to visualize and test robustness of
various strategies and identify projects that are of critical importance
to achieving long-term development objectives. A scenario approach
was therefore used to explore potential carbon emission futures 2020,
2030 and 2040 under different assumptions – scenarios – building on
stakeholder consultation and work already carried out in relation to
historical carbon inventories and recent sector specific strategic plans and
studies on intervention options. The scenario analyses allow pinpointing
areas which contribute significantly to the future carbon emissions and
Economic development
Achieving the right balance
U
�*+-+:;*<=>?>@+A:>-C
$ ����������� �����U��������
EF�H+-<->IC�F@;CJ
����������U����������������U��������
K>�LA>*C;?>�+*F@�<-FC;+-F@�<;-C>��>M;+-F@�<M@+HF@
����������������U��U����U�������
������������� ������������������������������������������ ��
may need intervention if targets are to be upheld in the long-term.
Sequestration capacity has not been analysed but instead taken as given.
Part of the reason for this choice is that sequestration in forestry and
agriculture is a complex matter that requires more detail. The National
Forest Inventory initiated by the Department of Forestry Services will
estimate carbon stocks for Bhutan in much greater detail.
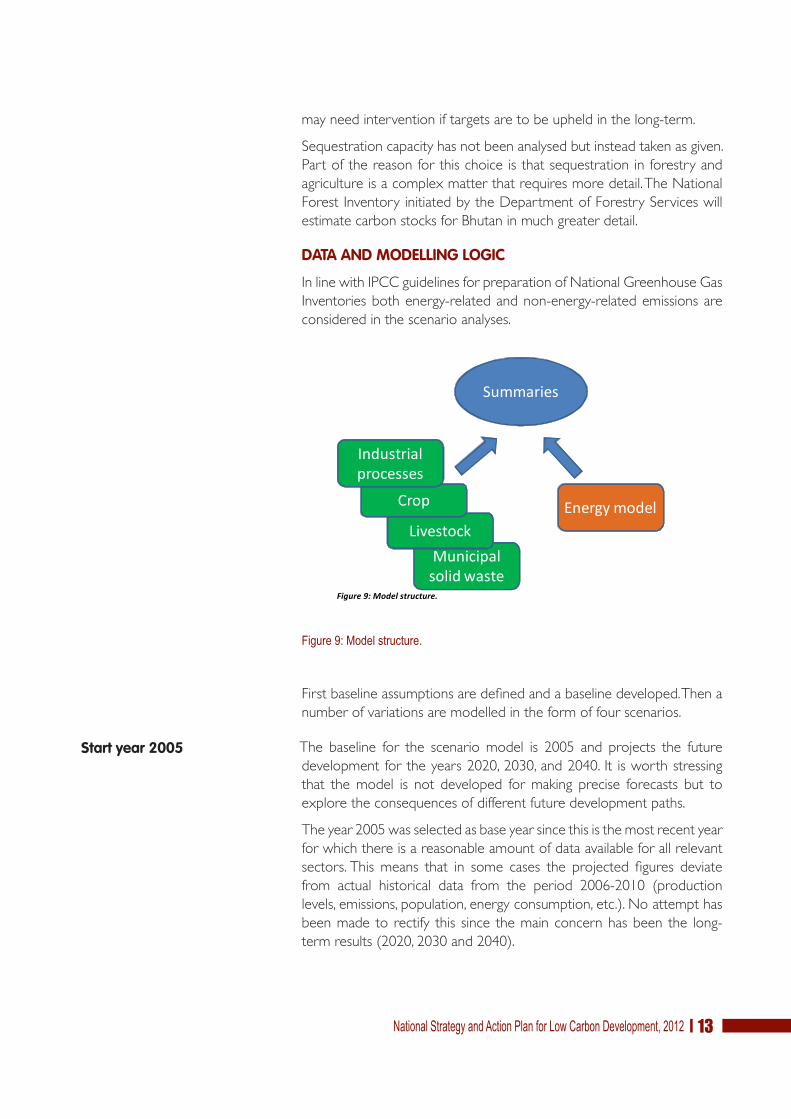
DATA AND MODELLING LOGIC
In line with IPCC guidelines for preparation of National Greenhouse Gas
Inventories both energy-related and non-energy-related emissions are
considered in the scenario analyses.
.� ,��9!<����#��,��,��*
First baseline assumptions are defined and a baseline developed. Then a
number of variations are modelled in the form of four scenarios.
The baseline for the scenario model is 2005 and projects the future
development for the years 2020, 2030, and 2040. It is worth stressing
that the model is not developed for making precise forecasts but to
explore the consequences of different future development paths.
The year 2005 was selected as base year since this is the most recent year
for which there is a reasonable amount of data available for all relevant
sectors. This means that in some cases the projected figures deviate
from actual historical data from the period 2006-2010 (production
levels, emissions, population, energy consumption, etc.). No attempt has
been made to rectify this since the main concern has been the long-
term results (2020, 2030 and 2040).
Start year 2005
U
U�����������������������
�����'U�����
�(� � ���U�����U���
�� �����
���������
����
���������U���������

������������� ��������������������������������������������
Please note that projections made in other contexts – as for example
the ‘Bhutan Transport 2040 Integrated Strategic Vision’ – may differ in
assumptions and thus ultimately also in results.
Where possible, data from the National Bureau of Statistics (NSB) is
used so as to ensure highest possible consistency in the data. The NSB is
the central agency for the collection, production and dissemination of
official statistics while the respective line ministries and agencies are
responsible for primary and secondary data collection on areas directly
related to their areas of authority. There are other sources that use
different data and thus comparison of results across reports may be
difficult.
The main data sets used are:
�� GHG Inventories and explanatory notes prepared for the
secong GHG inventory.
�� Historical and forecast population figures from ‘Population
Projections Bhutan 2005-2030’, NSB, July 2007.
�� Historical and forecast GDP figures 2001-2020, Ministry of
Finance, originally produced by NSB.
�� Final energy consumption figures from the ‘Energy Data
Directory 2005’ and the ‘Integrated Energy Management Master
Plan’, prepared by TERI for the Department of Energy, Ministry
of Economic Affairs, 2005.
MODELLING ENERGY RELATED CARBON EMISSIONS
The applied approach for projection differs for energy-related and non
energy-related emissions.
For projection of the energy-related carbon emissions the core
assumption of the model is that changes in GDP or GDP/capita (current
2000 prices) leads to changes in energy service demand (e.g. the need
for space heating, light, cooked food, transport services, etc). Energy
service demand is provided through conversion of an energy carrier
like firewood, gasoline, electricity etc. to the energy service in question.
Often statistical information is connected to the energy carrier and not
the basic energy service demand, making it necessary to make best
estimates of the conversion efficiencies.
In some cases there are special restrictions on the development of a
sub-sector of the economy (e.g. availability of mineral resources) and
these then overrule the link between GDP and energy service demand.
The link between GDP (and GDP/capita) and energy service demand is
described using an elasticity factor. The elasticity factor expresses to
which extent a change in GDP results in a change in energy service
NSB core reference
Elasticity
Main data sets

������������� ������������������������������������������ ��
demand. The elasticity is 1 when the demand for energy is growing with
the same rate as the economy (GDP or GDP/capita). The aim is to
reduce the elasticity which means that the economy is growing faster
than energy consumption.
.� ,����!����������� ������#������� ���*"-,����#��,������K(�-���#��E&���!2��� ���/������!����������������4:����2��� ���,����>������H,�����1)*
Ideally, this elasticity factor would be derived using historical energy
consumption data for Bhutan but it has not been possible to establish
a clear trend due to limited data and the special structure of the
Bhutanese economy. Instead the elasticity factor has been decided based
on international findings.
����I!����������#������������#*
The development in the energy service demand is projected using
GDP (and GDP/capita) projections and the above mentioned elasticity.
Thereafter the energy service demand is multiplied by the efficiency of
the technology involved to arrive at the final energy consumption.
2010 2020 2030 20400,4 0,4 0,4 0,4
Industries 0,8 0,8 0,8 0,8Industries 0,8 0,8 0,8 0,8Ter/ary 0,8 0,8 0,8 0,8Residen/al Rural 0,8 0,8 0,8 0,8Residen/al Urban 0,8 0,8 0,8 0,8Transport Avia/on 0,8 0,8 0,8 0,8Transport 0,8 0,8 0,8 0,8

������������� ��������������������������������������������
U
U
�����U����
� ����U����U� !!"#U������U����U��U���$%��U���U������U��)�� ���U)��������� ���� ����U���������
����U� �� ����
�� ������� ����������U���������� ������U��� ���������U� ������
�����
������U�������U��� ��U��U������U���U�� �!����!��"�U ��U��#� $�� �U������U����������U��U������U���U�� �!����!��"�U ��U��#� %&%U���������U��U������U���U�� �!����!��"�U ��U��#�
+'��� �'��'��!��%
+����%���!�'��
�� ���
�����������%�'��. �����
�5���� ����
.� ,�� ��! '���- �� �������� ������� �������� ��������� ���� � #������ ������� /������� � ���#,������� ��� �(�� ���##���#* K2��� � #������ ������E �# ��#� �� #��������������#K,#��,����� �E*
The technological conversion efficiencies of for example pumps and
cars do not remain constant over time. Neither does the mix of energy
chosen to meet an energy service demand – if for example a household
gains access to electricity then it becomes possible to use electric lighting
and cookers. These changes are addressed explicitly in the model for
each end-use.
.� ,����!�� �����-����� ����,��*
MODELLING NON-ENERGY RELATED CARBON EMISSIONS
�� ��� ���� �� ���3����!� ������� ���"�� � ������� ��� ����!� ���1�or GDP/capita (current 2000 prices) is linked to a development in
production. e.g. clinker or amounts of waste.
POPULATION AND GDP PROJECTIONS
The population and GDP projections made for the long-term national
low-carbon strategy are presented below in Figure 13. The projections
have been developed using an approximation of historical trends and
forecasts prepared by NSB.

������������� ������������������������������������������ ��
The average annual national GDP growth over the period 2010-2040 is
5.7% per year relative to the previous year while the average population
growth is 1.1%. This leads to an average annual growth in GDP/capita of
4.5%.
The GDP of the industrial sector is greatly influenced by the large hydro
power projects and the energy intensive industries (cement, ferro-alloy
and carbide). The consequence of this is that in some cases the sector
specific GDP rather than the national GDP should be used as driver
for the energy development of the sector in question. However, due to
data uncertainties sector specific GDP developments are not applied,
although the model permits doing so.
.� ,���8!���$��������,���������7��*
It is worth noticing that GDP and GDP/capita are expected to grow
with a factor 8 from 2005 to 2040 which indicates major increases in
carbon over the period.
SELECTED SECTORS
The level of detail in the modelling varies across the various sectors.
Emphasis has been placed on areas with a high volume or emissions and/
or a significantly increasing volume of emissions. The modelled sectors
are shown in the figure below. Little information for example exists
about the consumption pattern in industries and tertiary sector while
�
������
������
������
������
;�����
7�����
:�����
#�����
����
����
���7
���#
����
����
����
���7
���#
����
����
����
���7
���#
����
����
����
���7
���#
����
(� �.����.��/��
��&������.��/��
2.�������.��/��
�
;����
������
�;����
������
�;����
����
���;
���#
����
����
���:
����
����
���7
���9
����
���;
���#
�
;����
������
�;����
������
�;����
��.��/�����&��������.���
3� ����*�'����'���0-4()1
3� <'������04()<'�����1
����
���;
���#
����
����
���:
����
����
���7
���9
����
���;
���#
2����3� ����*�'����'���0-4()1

������������� ��������������������������������������������
more information is available for road transport and households. This
difference is reflected in the degree of detailing in the model for each
sector.
.� ,���1!<�������#�����#*
THE MODELLING TOOL
The function of the model is to portray the energy related and non-
energy related carbon emissions by main sectors of economy in
accordance with UNFCCC practice.
The performance of the model can be improved in the future as needs
arise and more detailed data becomes available.
The model work has been based on existing data and documents as well
as dialogue with all relevant stakeholders. It has not been within the
scope of the present Technical Assistance to collect new empirical data
and no new detailed studies were undertaken. New and improved data
can be applied as and when it becomes available.
The model is Excel based to ensure flexibility for future enhancements.
Furthermore, user friendliness, transparency, and consistency with the
national GHG inventory were important in choice of model base.
The details of the scenario analyses carried out can be found in chapter
2. A separate document describes the developed model and functions
as a user guide.
LIMITATIONS AND OMISSIONS
The most comprehensive data set for energy consumption by sector and
sub-sectors is from 2005, namely the ‘Energy Data Directory 2005’ and
the ‘Integrated Energy Management Master Plan’. The values are however
flawed by uncertainty – Lack of access to certain energy types at certain
times of the year or all year round and lack of affordability of energy
colours the historic consumption patterns. When making projections
No new empirical data
Excel based
Data limitations
+����%�-��.��� '���'.��.�������*�����%� =��.��%�� +����%�������!��������������.����� (��������� '!������������������������� �� ��'�������������.�������0�������%1� 2����������� ��&��������.���
)���+����%�-��.��� =��.���������'��� � �� �����'��'�. �'��&�����*���������%� '���'.��.���� $�!���'������'���� ������ ��&��� .��'���������

������������� ������������������������������������������ ��
based on historical data, there is a risk that these limitations are not fully
corrected for.
Fuel prices are not explicitly included in the model. Changes in relative
prices may affect real choices and priorities made by the local actors and
hence the energy mix in sectors and in the country as a whole.
The scenario model does not include an economic module that allows
assessments of costs and benefits related to the interventions. There is
limited access to detailed data and therefore assessments of costs and
benefits are qualitative statements based on available studies.
The long-term national strategy for low carbon development presented
in chapter 6 is primarily concerned with limiting the emissions (rather
than increasing sequestration) and focuses on areas with a high volume
of emissions and/or a significantly increasing volume of emissions. The
latter not only hints towards a potential future problem but also indicates
a ‘window of opportunity’ to leverage the natural drivers for achieving
sustainability and carbon goals. Other sectors are given a more cursory
review. The threats and opportunities to sequestration capacity are,
however, equally relevant.
Omissions
Limiting emissions

������������� �������������������������������������������
© S
onam
Dag
ay, N
EC

������������� ������������������������������������������ ��
!��������� �����

������������� ��������������������������������������������
ENERGY INTENSIVE INDUSTRIES
The overall development targets for industrial development are outlined
in Vision 20207 and substantiated in the Industrial Development Plan.
Supporting legislation:
�� Industries and Investment Act
�� Foreign Investment Promotion Act.
Production from the natural resource based processing industries has
increased during the last years and captured large markets in India.
Although Bhutan is known to possess deposits of lead, zinc, copper,
tungsten, graphite, iron, phosphate, pyrite and gold, the commercial value
of these deposits has not yet been explored and/or assessed. According
to U.S. Geological Survey July 2011 the main industrial mineral products
include cement, dolomite, granite, marble and sandstone.
The new industries are mainly energy-intensive industries that take
advantage of the cheap hydro power and the presence of mineral
resources. Dungsam Cement is expected to start operation in the
beginning of 2012 with a production capacity of one million tonnes
per year. Several applications (18) for licenses for ferro-alloy plants are
currently under consideration. If these are granted operating license and
each have an average emission from production processes equivalent to
the existing ferro-alloy plants, then they will have a significant impact on
the national emission level and thus the carbon balance.
ENERGY RELATED BASELINE
The analysis distinguishes between energy intensive industries and other
industries. Only cement, ferro-alloy and carbide industries are counted
in the category ‘Energy intensive industries’. Any other possibly energy
intensive industries are counted under ‘Other industries’.
For the energy intensive industries the energy service demand is linked
directly to assumptions about production levels and establishment of
new production units.
For both energy intensive and other industries a fuel switch gradually
takes place from fuel wood to electricity so that so that in 2040 about
80% of energy service demand in energy intensive industries is satisfied
by electricity, 10% by coal, and the remainder by other energy.
No detailed information on the composition of the various technologies
applied in the industries and their conversion efficiencies exists. It is
therefore assumed that the conversion efficiency is 75% for electricity,
25% for fuel wood and 50% for all other fuel types. Efficiency gains
as result of replacing existing equipment with equipment of higher
efficiency are assumed to be 10% over the period until 2040.
7 Vision 2020 – Bhutan 2020: A Vision for Peace, Prosperity and Happiness, Part I and II,
Planning Commission, RGoB, May 1999.
Governing regulation
������������� ������������������������������������������ ��
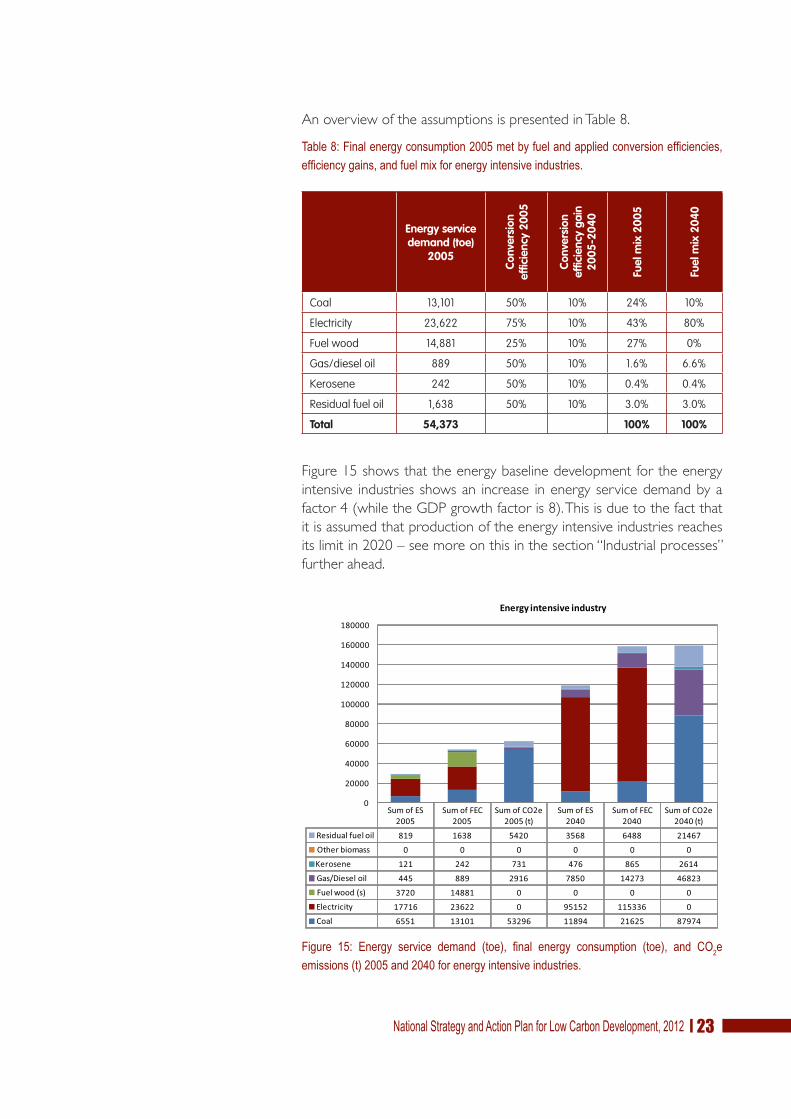
An overview of the assumptions is presented in Table 8.
����J!.�������� ����#,���������0������,������������������#�����/�������#���/������ ���#�����,����@������� ������#������,#����#*
Energy service demand (toe)
2005
Conv
ersi
on
effic
ienc
y 20
05
Conv
ersi
on
effic
ienc
y ga
in
2005
-204
0
Fuel
mix
200
5
Fuel
mix
204
0
Coal 13,101 50% 10% 24% 10%
Electricity 23,622 75% 10% 43% 80%
Fuel wood 14,881 25% 10% 27% 0%
Gas/diesel oil 889 50% 10% 1.6% 6.6%
Kerosene 242 50% 10% 0.4% 0.4%
Residual fuel oil 1,638 50% 10% 3.0% 3.0%
Total 54,373 100% 100%
Figure 15 shows that the energy baseline development for the energy
intensive industries shows an increase in energy service demand by a
factor 4 (while the GDP growth factor is 8). This is due to the fact that
it is assumed that production of the energy intensive industries reaches
its limit in 2020 – see more on this in the section “Industrial processes”
further ahead.
.� ,�� �0! 2��� � #������ ������ &���)� /��� ���� � ���#,������ &���)� ��� �(�����##���#&�)���0�����1�������� ������#������,#����#*
Sum of ES 2005
Sum of FEC 2005
Sum of CO2e 2005 (t)
Sum of ES 2040
Sum of FEC 2040
Sum of CO2e 2040 (t)
Residual fuel oil 819 1638 5420 3568 6488 21467Other biomass 0 0 0 0 0 0Kerosene 121 242 731 476 865 2614Gas/Diesel oil 445 889 2916 7850 14273 46823Fuel wood (s) 3720 14881 0 0 0 0Electricity 17716 23622 0 95152 115336 0Coal 6551 13101 53296 11894 21625 87974
0
20000
40000
60000
80000
100000
120000
140000
160000
180000
Energy intensive industry

������������� ��������������������������������������������
The assumed phase out of fossil fuels and greater electrification of
the energy intensive industries increase the total energy efficiency and
impacts the emission level significantly (see Figure 16).
.� ,�� �C! ����������� �� /��� ���� � ���#,������ &'���) ��� ���� � ������� �(�����##���#&'�)���0%��1�������� ������#������,#����#*
INDUSTRIAL PROCESSES
Emissions from physical and chemical processes that transform industrial
materials are considered by IPCC as process emissions under the
industrial processes sector. These processes produce greenhouse gases
such as carbon dioxide (CO2), methane (CH
4) and nitrous oxide (N
2O).
Globally, cement production is the most important source of process
CO2 emissions in the industrial processes sector (IPCC 1996). Calcium
carbonate (CaCO3) from limestone is transformed into clinker (the
major raw material in cement) by applying high-temperature heat in
kilns. The end-product is lime or calcium oxide (CaO) and carbon
dioxide (CO2). This lime is then mixed with other materials to form
cement. The default emission factor is 0.507 t CO2e/t cement not
including possible energy related emissions from producing the high-
temperature heat.
Since 2000 economic growth and large infrastructure projects have
been the major driver for the growth in cement production in Bhutan.
While there is still expectations of more infrastructure projects the
future demand for cement production is expected to depend more on
demand from the export market.
Cement
-
50
100
150
200
250
2005 2010 2020 2030 2040
Energy intensive industries - Final energy consump�on (ktoe)
Electricity Other RE Fossil energy
62 69
221
189
159
2005 2010 2020 2030 2040
Energy related emission (t CO2e)
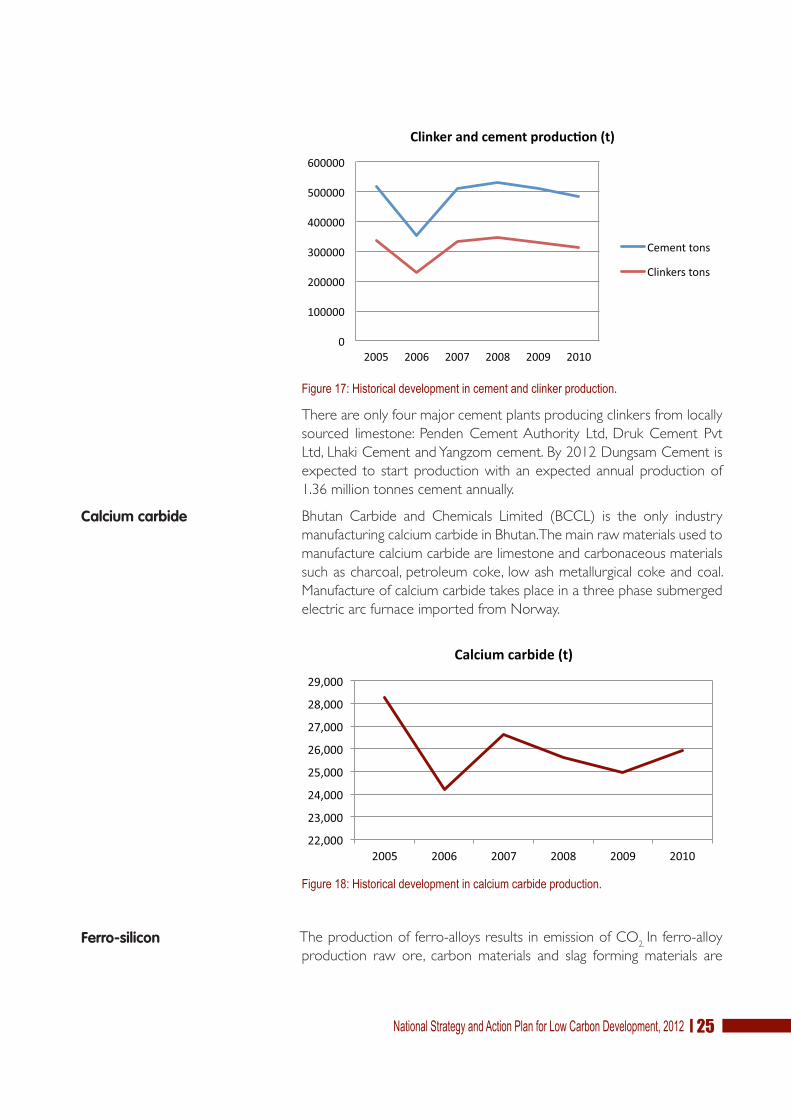
������������� ������������������������������������������ ��
.� ,���I!;�#���������������������������������'������,�����*
There are only four major cement plants producing clinkers from locally
sourced limestone: Penden Cement Authority Ltd, Druk Cement Pvt
Ltd, Lhaki Cement and Yangzom cement. By 2012 Dungsam Cement is
expected to start production with an expected annual production of
1.36 million tonnes cement annually.
Bhutan Carbide and Chemicals Limited (BCCL) is the only industry
manufacturing calcium carbide in Bhutan.The main raw materials used to
manufacture calcium carbide are limestone and carbonaceous materials
such as charcoal, petroleum coke, low ash metallurgical coke and coal.
Manufacture of calcium carbide takes place in a three phase submerged
electric arc furnace imported from Norway.
.� ,���J!;�#�������������������������,������������,�����*
The production of ferro-alloys results in emission of CO2. In ferro-alloy
production raw ore, carbon materials and slag forming materials are
Calcium carbide
Ferro-silicon

������������� ��������������������������������������������
mixed and heated to carbon sources. Since charcoal and wood are
based on renewable sources, they are not accounted for as an emission
source. Ferro-alloys are most commonly produced by electric submerged
arc furnaces. Typical reducing agents are coal and coke. Primary emissions
in covered arc furnaces consist almost entirely of carbon-monoxide
(CO)8. Data available for the national GHG inventory are national ferro-
alloy production statistics and default emission factors.
Besides quartzite, most of the raw materials required for ferro alloy
industries are imported from India. Almost 90% of the ferro-alloys
produced in the country are exported to Indian companies like TATA
Steel and Mittal Steel, while the remaining is exported to Japan.
.� ,���9!;�#�������������������������%#����������,�����*
However, there are different types of ferro-alloy production based on
different compositions of reducing agents resulting in different amounts
of emissions.
BASELINE FOR NON-ENERGY RELATED EMISSIONS
Calculation of baseline carbon emissions is based on the projected
demand for the final products multiplied by a default emission factor.
Final products are export oriented.
The baseline demand is partly demand driven and partly driven by
environmental regulation. The availability of natural resources and the
access to cheap electricity attracts energy intensive industries. Although
industrial development is critical for employment generation and
economic development, exploitation and processing of many natural
resources puts pressure on the local and regional environment resulting
8 Greenhouse gas emissions from ferro-alloy production. Lindstad, Olsen, Tranell, Færden
and Lubetsky, 2006 IPCC Guidelines for National Greenhouse Gas Inventory, Volume 3.
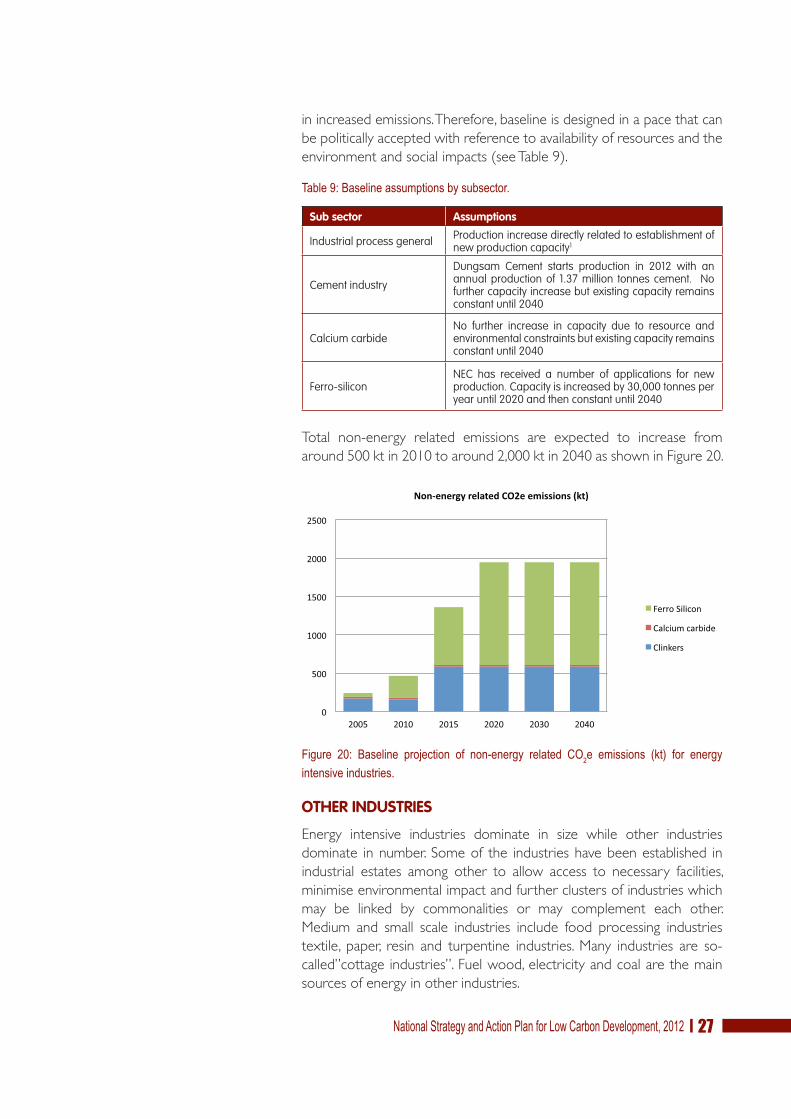
������������� ������������������������������������������ ��
in increased emissions. Therefore, baseline is designed in a pace that can
be politically accepted with reference to availability of resources and the
environment and social impacts (see Table 9).
����9!"�#������##,������#��#,�#�����*
Sub sector Assumptions
Industrial process general Production increase directly related to establishment of new production capacity1
Cement industry
Dungsam Cement starts production in 2012 with an annual production of 1.37 million tonnes cement. No further capacity increase but existing capacity remains constant until 2040
Calcium carbideNo further increase in capacity due to resource and environmental constraints but existing capacity remains constant until 2040
Ferro-siliconNEC has received a number of applications for new production. Capacity is increased by 30,000 tonnes per year until 2020 and then constant until 2040
Total non-energy related emissions are expected to increase from
around 500 kt in 2010 to around 2,000 kt in 2040 as shown in Figure 20.
.� ,�� ��! "�#����� ���$������ �� ���%���� � ������� �(�� ���##���# &'�) ��� ���� ������#������,#����#*
OTHER INDUSTRIES
Energy intensive industries dominate in size while other industries
dominate in number. Some of the industries have been established in
industrial estates among other to allow access to necessary facilities,
minimise environmental impact and further clusters of industries which
may be linked by commonalities or may complement each other.
Medium and small scale industries include food processing industries
textile, paper, resin and turpentine industries. Many industries are so-
called”cottage industries”. Fuel wood, electricity and coal are the main
sources of energy in other industries.

������������� ��������������������������������������������
ENERGY RELATED BASELINE
The energy service demand of other industries is assumed to follow
GDP development with an elasticity of 0.8.
It is assumed that a fuel switch gradually takes place from fuel wood to
electricity so that in 2040 the energy service demand is satisfied by 50%
electricity, 25% fuel wood, 20% coal, and 5% other energy.
No detailed information on the composition of the various technologies
applied in the industries and their conversion efficiencies exists. It is
therefore assumed that the conversion efficiency is 75% for electricity,
25% for fuel wood and 50% for all other fuel types. However, it must
be stressed that conversion efficiencies only have an effect for the
end-results in sectors where fuel switching take place. Where little fuel
switch takes place over the years, energy efficiency gains are likely to
have a higher impact on the development. Efficiency gains are results of
replacing existing equipment with equipment of higher efficiencies and
are in the other industries sector assumed to be 10% over the period
until 2040.
An overview of the assumptions is presented below (Table 10).
���� ��! .���� ���� � ���#,������ ���0 �� �,�� ��� ������� ������#��� ��/�������#���/������ ���#�����,����@�����-�����,#����#
Ener
gy s
ervi
ce d
eman
d (to
e)20
05
Conv
ersi
on e
ffici
ency
200
5
Conv
ersi
on e
ffici
ency
gai
n 20
05-2
040
Fuel
mix
200
5
Fuel
mix
204
0
Coal 14,397 50% 10% 31.2% 20%
Electricity 12,783 75% 10% 27.7% 50%
Fuel wood 15,437 25% 10% 33.4% 25%
Gas/diesel oil 3,550 50% 10% 7.7% 5%
Total 42,617 100% 100%
The bar diagram in Figure 21 shows the change from 2005 to 2040
for three indicators, namely the energy service demand (ESD), the final
energy consumption (FEC), and the CO2e emission (CO
2e). The first
three bars show the situation in 2005, the final three bars the situation
in 2040. The difference between energy service demand and the final
energy consumption expresses the efficiency of the conversion of
energy. The difference between the final energy consumption and the
CO2e emission reflects the choice of energy type and the associated
emission. If the final energy consumption is fully based on renewable

������������� ������������������������������������������ ��
energy sources, then the CO2e emission is zero.
As shown in Figure 21, the baseline development for other industries
experiences an increase in both energy service demand and the final
energy consumption by a factor 5. The fuel shift trend is assumed to be
less strong in other industries than in energy intensive industries and
fuel wood is not completely phased out in the baseline scenario. The
development in CO2e emissions is a factor 3 from 2005 to 2040. Reason
for the lower factor relative to energy service demand and final energy
consumption is that fuel wood is assumed to have zero CO2e emissions.
Total emissions thus increase from around 70 kt in 2005 to 208 kt in
2040 as can be seen in Figure 22.
.� ,�� ��! 2��� � #������ ������ &���)� /��� ���� � ���#,������ &���)� ��� �(�����##���#&�)���0�����1������-�����,#����#*
.� ,����! ����������� �� /��� ���� � ���#,������ &'���) ��� ���� � ������� �(�����##���#&'�)���0%��1������-�����,#����#*
Sum of ES 2005
Sum of FEC 2005
Sum of CO2e 2005 (t)
Sum of ES 2040
Sum of FEC 2040
Sum of CO2e 2040 (t)
Other biomass 0 0 0 0 0 0Gas/Diesel oil 1775 3550 11646 5837 10613 34817Fuel wood (s) 3859 15437 0 29186 106131 0
Electricity 9587 12783 0 58372 70754 0
Coal 7199 14397 58568 23349 42452 172700
0
50000
100000
150000
200000
250000
Other industries
-
50
100
150
200
250
2005 2010 2020 2030 2040
Other industries - Final energy consump�on (ktoe)
Electricity Other RE Fossil energy
70 91
154 180
208
2005 2010 2020 2030 2040
Energy related emission (kt CO2e)

������������� �������������������������������������������
DOMESTIC AVIATION AND INTERNATIONAL AVIATION BUNKERS
Until recently Bhutan has only had one international airport and limited
flights. With the launch of domestic airports and services the fleet of
domestic and international helicopters and airplanes will increase. The
domestic airports are intended for both passenger and cargo transport.
Domestic air travel is counted in the GHG inventory while international
aviation (“bunkers”) are merely a memo item based on IPCC guidelines.
ENERGY RELATED BASELINE
The energy service demand for international air traffic is assumed to
follow GDP development with an elasticity of 0.8 until 2020 where
after the demand remains unchanged. A fuel shift towards 5% biofuel in
international air traffic is expected to take place.
Domestic aviation is assumed to stabilise in 2020 at a level equal to half
the 2005 level for international air traffic, which was 957 toe9.
The conversion efficiency of the various air planes and helicopters are
as a whole assumed to be 30% and the energy conversion efficiency
gains 10% over the period until 204010. In this sector only the efficiency
gains have influence on the end results because no major fuel switching
is taking place.
International aviation is not counted towards the national CO2e emissions
balance and is mentioned here only for the sake of completion.
The resulting development in energy service demand, final energy
consumption and CO2e emission is shown in Figure 23.
9 toe = tonne oil equivalents.
10 The IEA has carried out a study of scenarios and strategies for technology develop-
ment. In their baseline development scenario for the development from 2008-2025
and 2025-2050 the IEA assumes a 0.8% and 7% per year improvement, respectively,
in technological energy efficiency due to the inherent competitiveness of the aviation
industry (Energy Technology Perspectives 2008: Scenarios and Strategies to 2050, IEA,
p457-458). An estimate of the gains due to improved operational efficiency and load
factor is also made but this is judged irrelevant to the situation of Bhutan where there is
climate, terrain, and modal-shifting constraints that limit the options available.

������������� ������������������������������������������ ��
.� ,�� �8! 2��� � #������ ������ &���)� /��� ���� � ���#,������ &���)� ��� �(�����##���#&�)���0�����1����,�������������*
Figure 24 shows that the total emission relating to aviation rise from
about 3 kt CO2e in 2005 to about 8 kt CO
2e in 2040.
It is worth noting, that aviation related CO2e emissions are generally into
the high atmosphere, and this is thought to have a larger greenhouse
effect than CO2e released at sea level.
.� ,�� �1! ����������� �� /��� ���� � ���#,������ &'���) ��� ���� � ������� �(�����##���#&'�)���0%��1������������*
ROAD TRANSPORT
There has been a significant increase in the number of private vehicles
in Bhutan, especially in Thimphu. Between 2001 and 2009 the number of
light vehicles increased at an average rate of around 15% per year. This
increase is a result of growth in both urban population and income levels
(and taxation schemes).
According to RSTA there are approximately 37,000 light vehicles and
taxis (81% of the stock of vehicles per end of April 2011) of which 74%
use petrol.
Sum of ES 2005
Sum of FEC 2005
Sum of CO2e 2005
(t)
Sum of ES 2040
Sum of FEC 2040
Sum of CO2e 2040
(t)
Jet kerosene - Interna/onal avia/on 287 957 2905 643 1949 5917Jet kerosene - Domes/c avia/on 0 0 0 164 498 1512
Biofuel (diesel) - Interna/onal avia/on 0 0 0 14 43 255
Biofuel (diesel) - Domes/c avia/on 0 0 0 0 0 0
0
1000
2000
3000
4000
5000
6000
7000
8000
9000
Avia�on
-
0,5
1,0
1,5
2,0
2,5
3,0
2005 2010 2020 2030 2040
- Final energy consump�on (ktoe)
Other RE Fossil energy
2,9 3,8
8,1 7,8 7,7
2005 2010 2020 2030 2040
Energy related emission (kt CO2e)Avia�on
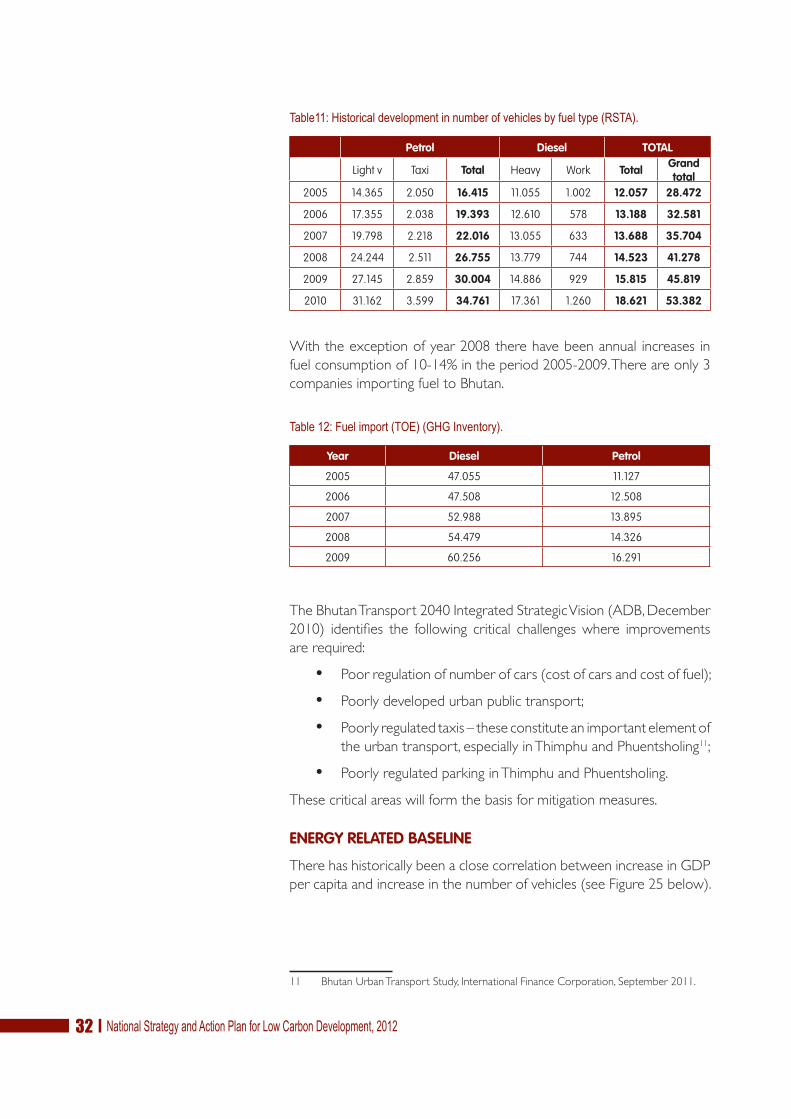
������������� ��������������������������������������������
������!;�#���������������������,��������-����#���,������&5 �)*
Petrol Diesel TOTAL
Light v Taxi Total Heavy Work Total Grand total
2005 14.365 2.050 16.415 11.055 1.002 12.057 28.472
2006 17.355 2.038 19.393 12.610 578 13.188 32.581
2007 19.798 2.218 22.016 13.055 633 13.688 35.704
2008 24.244 2.511 26.755 13.779 744 14.523 41.278
2009 27.145 2.859 30.004 14.886 929 15.815 45.819
2010 31.162 3.599 34.761 17.361 1.260 18.621 53.382
With the exception of year 2008 there have been annual increases in
fuel consumption of 10-14% in the period 2005-2009. There are only 3
companies importing fuel to Bhutan.
������!.,��������& (2)&7;7+��������)*
Year Diesel Petrol
2005 47.055 11.127
2006 47.508 12.508
2007 52.988 13.895
2008 54.479 14.326
2009 60.256 16.291
The Bhutan Transport 2040 Integrated Strategic Vision (ADB, December
2010) identifies the following critical challenges where improvements
are required:
�� Poor regulation of number of cars (cost of cars and cost of fuel);
�� Poorly developed urban public transport;
�� Poorly regulated taxis – these constitute an important element of
the urban transport, especially in Thimphu and Phuentsholing11;
�� Poorly regulated parking in Thimphu and Phuentsholing.
These critical areas will form the basis for mitigation measures.
ENERGY RELATED BASELINE
There has historically been a close correlation between increase in GDP
per capita and increase in the number of vehicles (see Figure 25 below).
11 Bhutan Urban Transport Study, International Finance Corporation, September 2011.
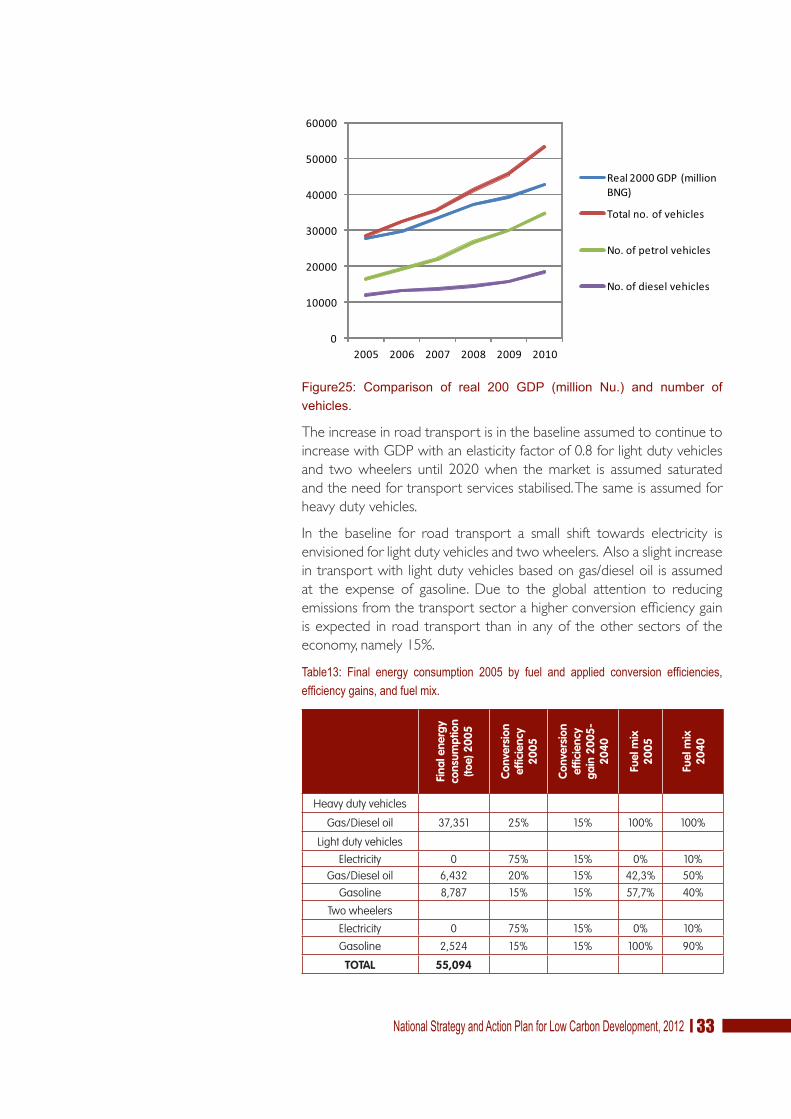
������������� ������������������������������������������ ��
3�4����%�� ��5����6��� �7� ����� ���� 89�� �5������� :���� ��;� ��5<��� �7��������6�
The increase in road transport is in the baseline assumed to continue to
increase with GDP with an elasticity factor of 0.8 for light duty vehicles
and two wheelers until 2020 when the market is assumed saturated
and the need for transport services stabilised. The same is assumed for
heavy duty vehicles.
In the baseline for road transport a small shift towards electricity is
envisioned for light duty vehicles and two wheelers. Also a slight increase
in transport with light duty vehicles based on gas/diesel oil is assumed
at the expense of gasoline. Due to the global attention to reducing
emissions from the transport sector a higher conversion efficiency gain
is expected in road transport than in any of the other sectors of the
economy, namely 15%.
�����8! .���� ���� � ���#,������ ���0 �� �,�� ��� ������� ������#��� ��/�������#���/������ ���#�����,����@*
Fina
l ene
rgy
cons
umpt
ion
(toe)
200
5
Conv
ersi
on
effic
ienc
y 20
05
Conv
ersi
on
effic
ienc
y ga
in 2
005-
2040
Fuel
mix
20
05
Fuel
mix
20
40
Heavy duty vehicles
Gas/Diesel oil 37,351 25% 15% 100% 100%
Light duty vehicles
Electricity 0 75% 15% 0% 10%Gas/Diesel oil 6,432 20% 15% 42,3% 50%
Gasoline 8,787 15% 15% 57,7% 40%
Two wheelers
Electricity 0 75% 15% 0% 10%
Gasoline 2,524 15% 15% 100% 90%
TOTAL 55,094

������������� ��������������������������������������������
Road transport more than doubles over the period 2005-2020 where
after it remains more or less constant and the CO2e emissions follow
suit.
In the course of the 35 year period 2005-2040, the emission increases
from 178 kt CO2e to 347 kt CO
2e (see Figure 26 and Figure 27).
.� ,���C! 2��� � #������ ������ &���)� /��� ���� � ���#,������ &���)� ��� �(�����##���#&�)���0�����1������������#����*
.� ,���I! ����������� �� /��� ���� � ���#,������ &'���) ��� ���� � ������� �(�����##���#&'�)���0%��1������������#����*
TERTIARY SECTOR
The tertiary sector is also often referred to as the commercial/
institutional sector. The tertiary sector includes both public and private
enterprises. Examples are state and local government institutions,
religious institutions, health & education sector, tourism sector including
hotels and restaurants, and commerce. Within some there is already
a noticeable awareness of environmental and climate issues and for
example the tourist trade and the monasteries sectors are taking steps
to increase sustainability of their activities – something which is very
much in line with the idea of ”Brand Bhutan”.
Sum of ES 2005
Sum of FEC 2005
Sum of CO2e 2005
(t)
Sum of ES 2040
Sum of FEC 2040
Sum of CO2e 2040
(t)
Gasoline 1697 11311 33325 3819 22140 65230Gas/Diesel oil 10624 43783 143634 24097 86179 282717
Electricity 0 0 0 293 339 0
Biofuel (diesel) 0 0 0 0 0 0
0
50000
100000
150000
200000
250000
300000
350000
400000
Road transport
-
20,0
40,0
60,0
80,0
100,0
120,0
140,0
2005 2010 2020 2030 2040
Road transport - Final energy consump�on (ktoe)
Electricity Other RE Fossil energy
177
228
376 361 348
2005 2010 2020 2030 2040
Energy related emission (kt CO2e)

������������� ������������������������������������������ ��
ENERGY RELATED BASELINE
The development in energy service demand of the tertiary sector
excluding cremation is assumed to follow the GDP development with an
elasticity of 0.8 and to mimic the development of the urban households
in terms of fuel mix and conversion efficiency gains.
The demand for cremation is assumed to follow the population growth.
Cremation will continue to rely on fuel wood but an efficiency gain of
10% over the period 2005-2040 is assumed.
An overview of the baseline assumptions for the tertiary sector
(excluding cremation) is presented below in Table14). A significant shift
away from fuel wood and kerosene is assumed. Gradual automatic
efficiency gains reduce energy service demand by 10% in 2040 for all
end-uses and fuels.
���� �1! .,�� ��@ ���0 ��� �##,��� �,�� ��@ ��1� �� �-� �������� #����� &�@��,��� ���������)* -��,�������#�##,�������,������#,#��������������*
During the period 2005-2040 the demand for energy services in the
tertiary sector increases with more than a factor 5. The final energy
consumption increases by less than a factor 4 mainly due to a shift
towards electricity. The use of briquettes for space heating and LPG for
cooking increases significantly. However, since briquettes are assumed to
have zero CO2e emission, the total increase in CO
2e emissions is only
by a factor 3.
In absolute terms the CO2e emission increases from 18 kt CO
2e in
2005, as shown below in Figure28, to 60 kt CO2e in 2040.
���Z ��[� ���Z ��[� ���Z ��[� ���Z ��[� ���Z ��[�4���� ���¦ ��¦+��'���'��% ��¦ :�¦ ��¦ 99¦ ;:¦ 9#¦ ���¦ ���¦ :�¦�.��������01 �7¦ �7¦ 99�7¦ �;¦������� �7¦ �7¦ ��¦ �¦ ;¦$ 3 :¦ ��¦ :¦ �¦
\��]������^]�
_�������`��]�
�] `]� ���������]����!
���������]�
�����`��]�
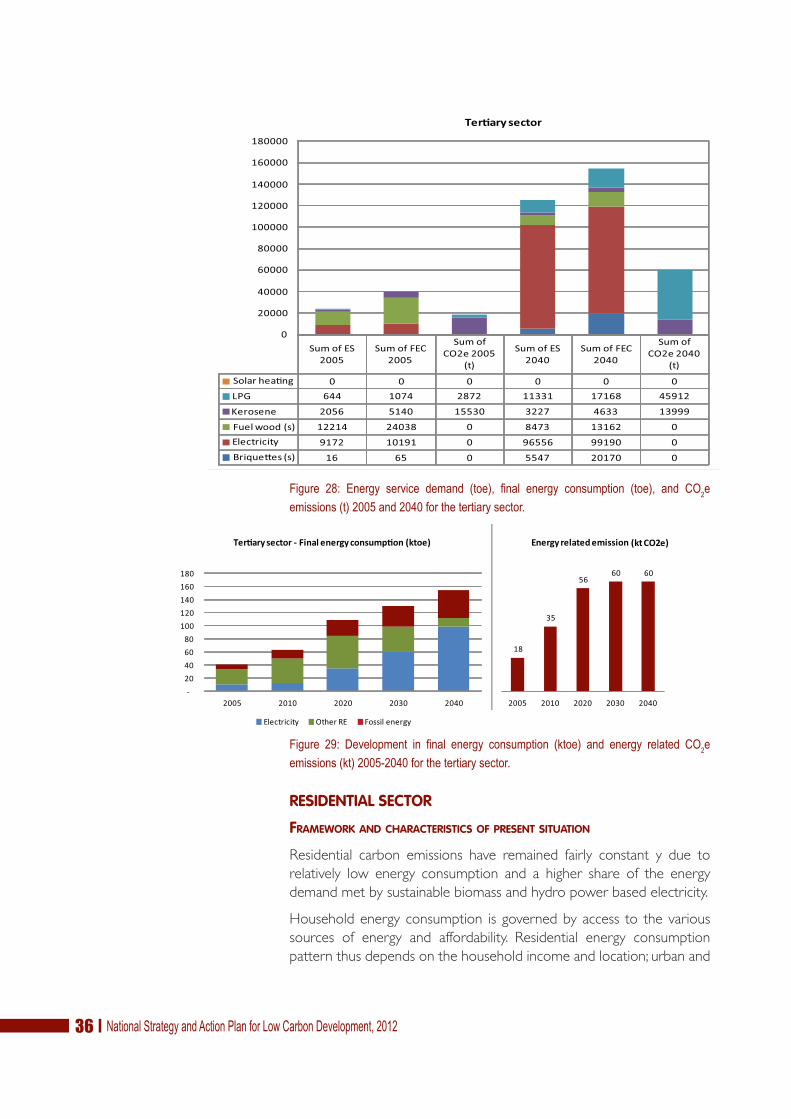
������������� ��������������������������������������������
.� ,�� �J! 2��� � #������ ������ &���)� /��� ���� � ���#,������ &���)� ��� �(�����##���#&�)���0�����1�����-���������#�����*
.� ,�� �9! ����������� �� /��� ���� � ���#,������ &'���) ��� ���� � ������� �(�����##���#&'�)���0%��1�����-���������#�����*
RESIDENTIAL SECTOR
FRAMEWORK AND CHARACTERISTICS OF PRESENT SITUATION
Residential carbon emissions have remained fairly constant y due to
relatively low energy consumption and a higher share of the energy
demand met by sustainable biomass and hydro power based electricity.
Household energy consumption is governed by access to the various
sources of energy and affordability. Residential energy consumption
pattern thus depends on the household income and location; urban and
Sum of ES 2005
Sum of FEC 2005
Sum of CO2e 2005
(t)
Sum of ES 2040
Sum of FEC 2040
Sum of CO2e 2040
(t)
Solar hea/ng 0 0 0 0 0 0LPG 644 1074 2872 11331 17168 45912
Kerosene 2056 5140 15530 3227 4633 13999
Fuel wood (s) 12214 24038 0 8473 13162 0Electricity 9172 10191 0 96556 99190 0Brique¨es (s) 16 65 0 5547 20170 0
0
20000
40000
60000
80000
100000
120000
140000
160000
180000
Ter�ary sector
-20 40 60 80
100 120 140 160 180
2005 2010 2020 2030 2040
Ter�ary sector - Final energy consump�on (ktoe)
Electricity Other RE Fossil energy
18
35
56 60 60
2005 2010 2020 2030 2040
Energy related emission (kt CO2e)

������������� ������������������������������������������ ��
rural. In this report a distinction is therefore made between urban and
rural households.
As of 2005, more than 96% of urban households were electrified
while only 40% of rural household were electrified. For an average
urban household more than 60% of energy consumption in energy
units is commercial energy like electricity, LPG and kerosene, while
the consumption of commercial energy for an average rural electrified
household is 13% and for a non-electrified household it’s less than
6%. This indicates that the non-electrified households are low income
households living in remote areas whereby commercial energy is
unaffordable even if it’s available.
As a result of the development strategy and increasing welfare among
households in Bhutan it can be expected that:
�� Non-electrified rural households will be electrified and their
consumption of commercial energy would increase either
because they migrate to urban centres or because they gain
inexpensive access to these energy types;
�� Electrified rural households will increase their consumption of
commercial energy towards a pattern known from the urban
centres today.
�� Urban households will increase their consumption of
commercial fuels especially electricity due to increasing number
of electricity consuming appliances.
�����0!�,������-�,#�-���#������##������������������I&"-,�������� �������,�������I��"������������I��*JC)*
Bhutan living standard survey 2007 with a sample of 125,500 households
(NSB, December 2007, p. 80) shows the difference in energy consumption
between urban and rural households (see Table 16). Worth noting is the
fact that in 2007 a little more that 40% of the total number of surveyed
households did not have dedicated space heating. This illustrates the
challenge of interpretation of energy statistics. Apart from the fact that
many households truly do not heat their living space, the technologies
used for cooking and hot water heating in many of the households
contributes to heating of the living space. Fodder cooking is prevalent in
many rural households and equally contributes to space heating.
Urban households Rural households Total householdsGrid electricity 98,2% 56,6% 69,1%Other electricity 0,6% 3,6% 2,7%No electricity 1,3% 39,8% 28,2%
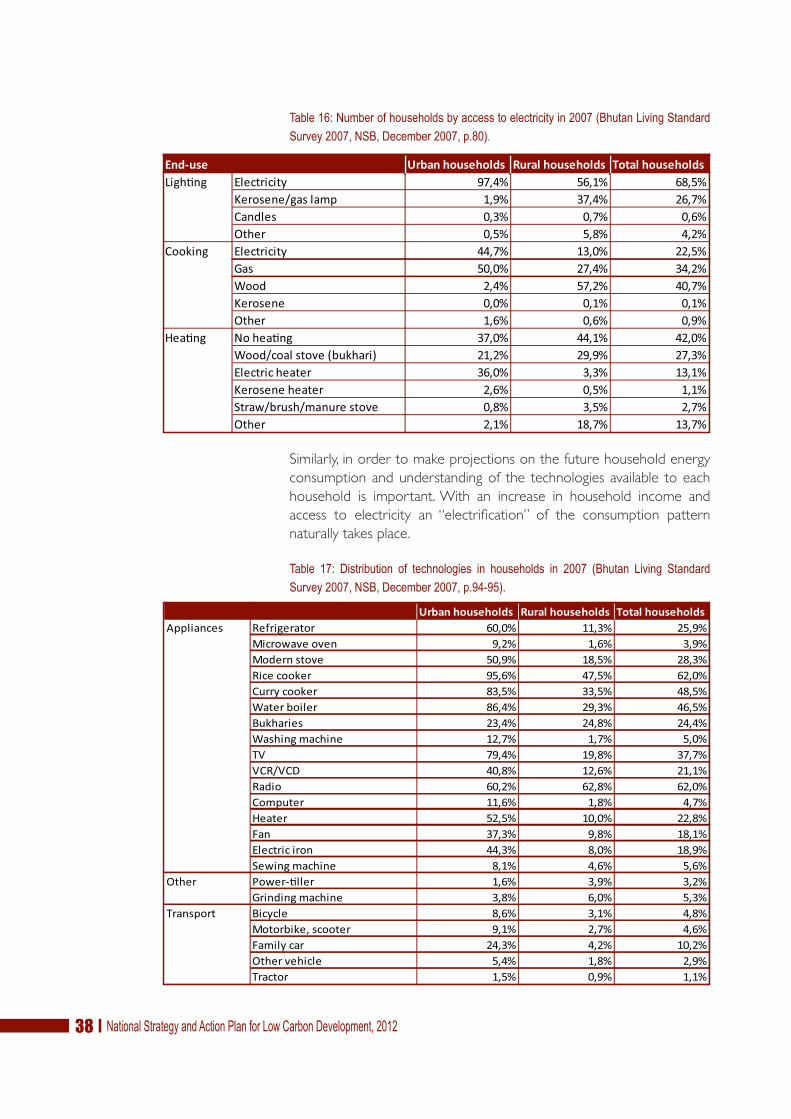
������������� ��������������������������������������������
�����C!�,������-�,#�-���#������##������������������I&"-,�������� �������,�������I��"������������I��*J�)*
Similarly, in order to make projections on the future household energy
consumption and understanding of the technologies available to each
household is important. With an increase in household income and
access to electricity an “electrification” of the consumption pattern
naturally takes place.
���� �I! ��#����,���� �� ���-���� ��# �� -�,#�-���# �� ���I &"-,��� ����� �������,�������I��"������������I��*91%90)*
Urban households Rural households Total householdsLigh/ng Electricity 97,4% 56,1% 68,5%
Kerosene/gas lamp 1,9% 37,4% 26,7%Candles 0,3% 0,7% 0,6%Other 0,5% 5,8% 4,2%
Cooking Electricity 44,7% 13,0% 22,5%Gas 50,0% 27,4% 34,2%Wood 2,4% 57,2% 40,7%Kerosene 0,0% 0,1% 0,1%Other 1,6% 0,6% 0,9%
Hea/ng No hea/ng 37,0% 44,1% 42,0%Wood/coal stove (bukhari) 21,2% 29,9% 27,3%Electric heater 36,0% 3,3% 13,1%Kerosene heater 2,6% 0,5% 1,1%Straw/brush/manure stove 0,8% 3,5% 2,7%Other 2,1% 18,7% 13,7%
End-use
Urban households Rural households Total householdsAppliances Refrigerator 60,0% 11,3% 25,9%
Microwave oven 9,2% 1,6% 3,9%Modern stove 50,9% 18,5% 28,3%Rice cooker 95,6% 47,5% 62,0%Curry cooker 83,5% 33,5% 48,5%Water boiler 86,4% 29,3% 46,5%Bukharies 23,4% 24,8% 24,4%Washing machine 12,7% 1,7% 5,0%TV 79,4% 19,8% 37,7%VCR/VCD 40,8% 12,6% 21,1%Radio 60,2% 62,8% 62,0%Computer 11,6% 1,8% 4,7%Heater 52,5% 10,0% 22,8%Fan 37,3% 9,8% 18,1%Electric iron 44,3% 8,0% 18,9%Sewing machine 8,1% 4,6% 5,6%
Other Power-/ller 1,6% 3,9% 3,2%Grinding machine 3,8% 6,0% 5,3%
Transport Bicycle 8,6% 3,1% 4,8%Motorbike, scooter 9,1% 2,7% 4,6%Family car 24,3% 4,2% 10,2%Other vehicle 5,4% 1,8% 2,9%Tractor 1,5% 0,9% 1,1%

������������� ������������������������������������������ ��
The Energy Data Directory 2005 lists the specific household electricity
consumption at 324 kWh/year for urban households and 341 kWh/year
for rural households with access to electricity – a very low number (see
Table 18 below).
�����J!2�������������#,��������������0���������/��-�,#�-���#&2�����0��*C�LJJ)*
Although fuel wood and other biomass consumed in households do not
contribute towards the national carbon emissions (assuming sustainable
exploitation) there are other reasons that justify limiting the use of these
such as health concerns and increasing pressure on possibly limited
biomass resources.
Furthermore, the social status associated with fossil fuels and electricity
should not be underestimated as a driver for a development away from
fuel wood and other biomass when opportunity arises.
ENERGY RELATED BASELINE
Table 19 (below) lists the baseline assumptions made for calculation of
the future energy service demand of the residential sector. The migration
from rural to urban areas is expected to reduce the share of the rural
population from 69% in 2005 to 23% in 2040. The demand for energy
services is assumed to increase with GDP/capita with an elasticity of 0.8.
Gradual automatic efficiency gains reduce energy service demand by
10% in 2040 for all end-uses and fuels.
�����9!.,����@���0����#��������,����@��1����-���#��������#�����*
���Z ��[� ���Z ��[� ���Z ��[� ���Z ��[� ���Z ��[�2.���
4���� �¦4��.���� �¦ ;¦+��'���'��% �¦ ��¦ �¦ 77¦ ��¦ ���¦ ���¦ ���¦ ;�¦�.��������01 9:¦ �#¦ 9:¦ ��¦ :�¦ ���¦ ��¦������� �¦ �¦ �¦ �¦ ;¦$ 3 �¦ �;¦ �¦ �¦,����������� �¦
��&��4��.���� �;¦+��'���'��% ;¦ :�¦ ��¦ 99¦ 97¦ ���¦ ���¦ ���¦ ���¦ :�¦�.��������01 ��¦ �;¦ 9¦������� ��¦ �#¦ �¦ ;¦$ 3 ��¦ ��¦ ��¦,����������� �¦
�����`��]�
f�!]���]�����^]�
_�������`��]�
�] `]� ���������]����!
���������]�
Households Electrified hh Electricity consump�on (kWh) kWh/householdUrban 36923 11949649 324Rural 35140 11998407 341Total 72063 23948056 332

������������� �������������������������������������������
The results of the baseline projection of the residential sector are
presented in the following Figure 30 and Figure 31. The energy service
demand in 2040 is more than 4 times larger than in 2005. Due to
efficiency gains but mainly due to fuel shift from fuel wood the final
energy consumption in 2040 is only twice the size of the consumption
in 2005. The CO2e emissions increase by less than a factor 4 over the
period in question and main contributors are briquettes and LPG.
The specific final energy consumption increases from 0.22 toe/capita in
2005 to 0.28 toe/capita in 2040 while the CO2e emissions grow from
0.04 t/capita to 0.20 t/capita. In absolute terms the emissions rise from
28 kt CO2e to 98 kt CO
2e in the period 2005-2040.
.� ,�� 8�! 2��� � #������ ������ &���)� /��� ���� � ���#,������ &���)� ��� �(�����##���#&�)���0�����1�����-���#��������#�����*
.� ,�� 8�! ����������� �� /��� ���� � ���#,������ &'���) ��� ���� � ������� �(�����##���#&'�)���0%��1�����-���#��������#�����*
Sum of ES 2005
Sum of FEC 2005
Sum of CO2e 2005
(t)
Sum of ES 2040
Sum of FEC 2040
Sum of CO2e 2040
(t)
Solar hea/ng 0 0 0 311 311 0LPG 2388 3980 10643 20543 31126 83238Kerosene 2236 5591 16893 2928 4344 13125
Fuel wood (s) 35071 123676 0 27019 83876 0
Electricity 3397 3807 0 119851 125520 0Brique¨es (s) 0 0 0 6417 23336 0Biogas 0 0 0 890 1471 1813
0
50000
100000
150000
200000
250000
300000
Residen�al sector
-
50
100
150
200
250
300
2005 2010 2020 2030 2040
Residen�al sector - Final energy consump�on (ktoe)
Electricity Other RE Fossil energy
28
42
91
106 98
2005 2010 2020 2030 2040
Energy related emission (kt CO2e)

������������� ������������������������������������������ ��
AGRICULTURE AND FORESTRY
Although the agriculture share of GDP is decreasing to just below 20%
in 2008, around 70% of the population are still dependent on agriculture
for livelihood.
Carbon emission from agricultural activity stems from husbandry, crop
production, and energy consumption for tools and machinery. The non-
energy related emissions within agriculture are significant, primarily due
to CH4 emissions from enteric fermentation and manure management.
Agricultural soils and their cultivation are, however, also important
contributors, namely below 450 kt CO2e in 2000 whereas enteric
fermentation and manure contributed about 570 kt CO2e. Decisions on
choice of crop and cultivation methods have a significant impact on the
level of emissions. The natural conditions and climate change place a limit
on the expansion of crop areas but overall cultivation strategy (organic
– not organic), refinement of cultivation methods (including use of
fertilisers), and deliberate selection of crops can increase the yield while
curbing emissions. The non-energy related emission from agriculture and
its future development paths are not included in the present analysis.
Also, the non-energy related emissions from forestry or rather
sequestration is not analysed in this project. Due to lack of data and
time for analysis, the sequestration capacity calculated for year 2000 is
assumed constant throughout the analysis period.
Emissions from use of tools and machinery (small tractors, threshers,
pumps etc.) are addressed in the following section on energy related
baseline emissions. If agriculture increases in intensity, energy use for
tools and machinery is likely to increase as is emission if no preventive
actions are taken. The machinery is considered “off-road” and thus not
part of the “on-road” transport addressed in section 3.4.
Details on agricultural machinery and their energy consumption were
not available for the present analysis. The analysis is therefore to be
considered very preliminary. It is worth noting that such emissions in
the GHG Inventory are lumped under total transport emissions as
segregated data on consumption of diesel or petrol for agricultural
purposes and for road transport were not available.
ENERGY RELATED BASELINE
With regard to the energy services needed within the agriculture and
forestry sector, a distinction is made between fodder cooking and other
production processes. Fodder cooking is assumed to be phased out
while the energy service demand for other production processes is
assumed to follow GDP development with an elasticity of 0.4.
Fodder cooking is entirely based on fuel wood with a conversion
efficiency of only 10% in 2005.

������������� ��������������������������������������������
Other production processes see a fuel shift from near 90% fuel wood to
in particular biogas but also electricity and gas/diesel oil.
An overview of the assumptions is presented below.
T���� ��! .���� ���� � ���#,������ ���0 �� �,�� ��� ������� ������#��� ��/�������#���/������ ���#�����,����@���� ���,��,���������#���*
Ener
gy s
ervi
ce
dem
and
(toe)
2005
Conv
ersi
on
effic
ienc
y 20
05
Conv
ersi
on
effic
ienc
y ga
in
2005
-204
0
Fuel
mix
200
5
Fuel
mix
204
0
Production processes 4,554Biogas 0 20% 10% 0% 40%Electricity 68 75% 10% 1.5% 20%Fuel wood 3,997 20% 10% 87.8% 20%Gas/diesel oil 489 20% 10% 10.7% 20%
Fodder cooking 49,843Fuel wood 49,843 10% 10% 100% 100%
Total 108,794
The total energy service demand as well as the final energy consumption
is reduced significantly in the baseline assuming that fodder cooking is
phased out. Presently, fodder cooking is assumed to be solely based
on fuel wood with very low efficiency. The energy service demand
for production processes alone increases with a factor 11 over the
considered period.
On the other hand, assuming fuel wood is produced sustainably, there
net zero impact on emission levels. Electricity is assumed to be produced
by renewable energy and thus only biogas and gas/diesel oil consumption
contribute to CO2e emissions in 2040. The emission level is less than 2
kt in 2005 (please see Figure 32) but increases by a factor 7 over the
period and reaches 11 kt in 2040.
.� ,�� 8�! 2��� � #������ ������ &���)�/������� ����#,������ &���)�����(�����##���#&�)���0�����1����� ���,��,���������#���*
Sum of ES 2005
Sum of FEC 2005
Sum of CO2e 2005
(t)
Sum of ES 2040
Sum of FEC 2040
Sum of CO2e 2040
(t)
Gas/Diesel oil 98 489 1604 433 1967 6453
Fuel wood (s) 5784 53840 0 433 1967 0
Electricity 51 68 0 433 525 0Biogas 0 0 0 865 3934 4850Biofuel (diesel) 0 0 0 0 0 0
0
10000
20000
30000
40000
50000
60000
Agriculture and forestry

������������� ������������������������������������������ ��
.� ,�� 88! ����������� �� /��� ���� � ���#,������ &'���) ��� ���� � ������� �(�����##���#&'�)���0%��1����� ���,��,���������#���*
MUNICIPAL SOLID WASTE
The lead institutions in charge of implementation of the Waste Prevention
and Management Act, 2009 are:
�� The National Environment Commission as the overall
coordinating agency;
�� The Ministry for Works and Human Settlements in
collaboration with the Thromdes – Ensuring waste prevention
and management in the Thromdes;
�� The Dzongkhag Tshongdu and Gewog Tshongde supported by
the Dzongkhag, Dungkhag and Gewog administration – Ensuring
waste prevention and management at Dzongkhag, Dungkhag,
Gewog and Chiwog12 level not covered by the above including
rural human waste with guidance from the Ministry of Health.
Amongst the various collaborating agencies, the most pertinent in
relation to future carbon emissions development and energy production
are the Department of Industry under the Ministry of Economic
Affairs responsible for industrial waste and Tourism Council of Bhutan
responsible for waste from hotels, restaurants, camp sites and trekking
routes.
The ‘Waste Prevention and Management Act of Bhutan 2009’ is based
on three guiding principles:
�� Precautionary actions;
�� Polluters pay principle and
�� Principle of reduce, reuse and recycle.
The waste sector accounted for about 3% of the total carbon emissions
in 2000. The dominant category in 2000 was by far solid waste disposal.
12 The administrative levels are: Thromde – urban area, Dzongkhag – district, Dungkhag,
Gewog – block.
Government body
Government regulation
-
10,0
20,0
30,0
40,0
50,0
60,0
2005 2010 2020 2030 2040
Agriculture and forestry - Final energy consump�on (ktoe)
Electricity Other RE Fossil energy
1,6 2,6
5,3
8,0
11,3
2005 2010 2020 2030 2040
Energy related emission(kt CO2e)
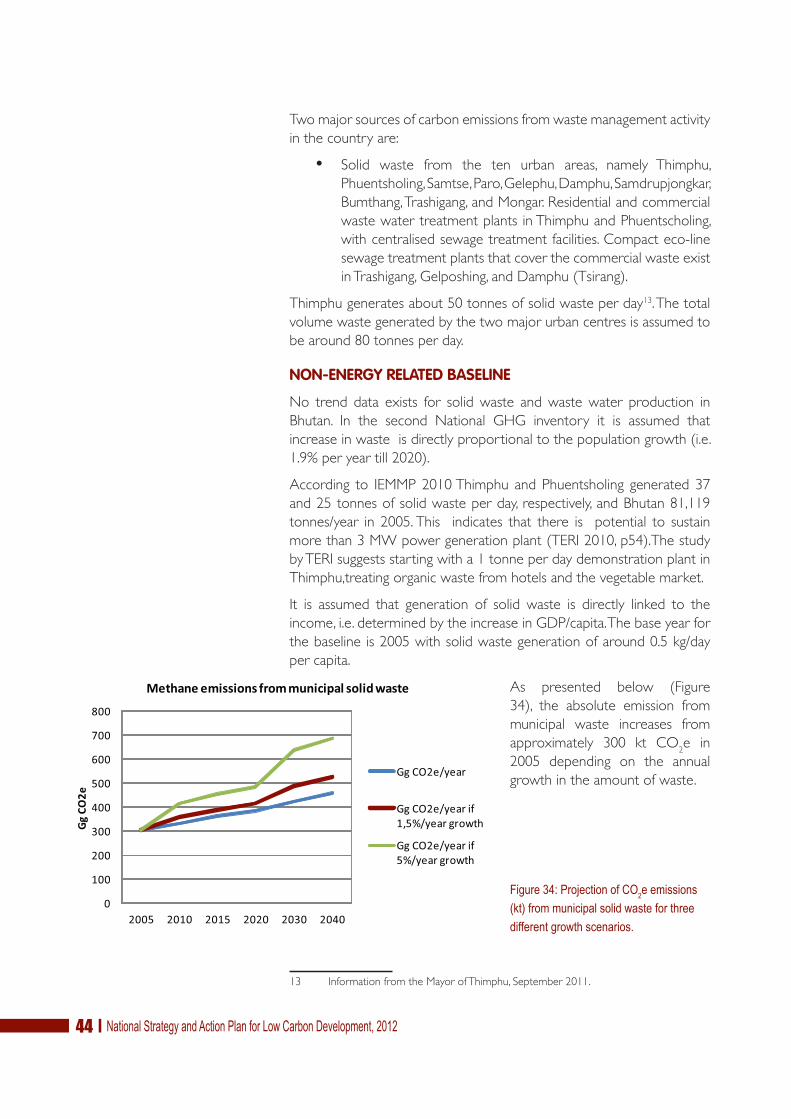
������������� ��������������������������������������������
Two major sources of carbon emissions from waste management activity
in the country are:
�� Solid waste from the ten urban areas, namely Thimphu,
Phuentsholing, Samtse, Paro, Gelephu, Damphu, Samdrupjongkar,
Bumthang, Trashigang, and Mongar. Residential and commercial
waste water treatment plants in Thimphu and Phuentscholing,
with centralised sewage treatment facilities. Compact eco-line
sewage treatment plants that cover the commercial waste exist
in Trashigang, Gelposhing, and Damphu (Tsirang).
Thimphu generates about 50 tonnes of solid waste per day13. The total
volume waste generated by the two major urban centres is assumed to
be around 80 tonnes per day.
NON-ENERGY RELATED BASELINE
No trend data exists for solid waste and waste water production in
Bhutan. In the second National GHG inventory it is assumed that
increase in waste is directly proportional to the population growth (i.e.
1.9% per year till 2020).
According to IEMMP 2010 Thimphu and Phuentsholing generated 37
and 25 tonnes of solid waste per day, respectively, and Bhutan 81,119
tonnes/year in 2005. This indicates that there is potential to sustain
more than 3 MW power generation plant (TERI 2010, p54).The study
by TERI suggests starting with a 1 tonne per day demonstration plant in
Thimphu,treating organic waste from hotels and the vegetable market.
It is assumed that generation of solid waste is directly linked to the
income, i.e. determined by the increase in GDP/capita. The base year for
the baseline is 2005 with solid waste generation of around 0.5 kg/day
per capita.
As presented below (Figure
34), the absolute emission from
municipal waste increases from
approximately 300 kt CO2e in
2005 depending on the annual
growth in the amount of waste.
.� ,��81!���$���������(�����##���#&'�)�����,�������#������#������-������������ ����-#�������#*
13 Information from the Mayor of Thimphu, September 2011.
0
100
200
300
400
500
600
700
800
2005 2010 2015 2020 2030 2040
Gg
CO2e
Methane emissions from municipal solid waste
Gg CO2e/year
Gg CO2e/year if 1,5%/year growth
Gg CO2e/year if 5%/year growth

������������� ������������������������������������������ ��
However, in the GHG inventories rural municipal waste is not counted.
An estimate of the baseline development of the urban municipal
waste related emission is presented in Figure 35 below. The underlying
assumption is that waste generation is assumed to have an elasticity of
0.10 to GDP/capita.
The CO2e emission starts at less than 100 kt CO
2e in 2005 and increases
to 422 in 2040. Contributions from municipal waste from Thimphu alone
are expected to increase from 38 to about 170 kt CO2e.
.� ,��80!���$���������(�����##���#&'�)����,�����,���������#��*
COMPARISON OF MODEL RESULTS AND GHG INVENTORY
ENERGY RELATED EMISSIONS
The approach applied for the baseline calculation of energy-related
CO2e emissions does not strictly follow the approach applied in the
GHG inventory. Instead the starting point is the energy service demand
and the CO2e emission level is linked to the type of fuel consumed. A
cross check is therefore carried out to verify that the modelled CO2e
emissions 2005 (and 2010) do not differ significantly from the values
derived from the GHG inventory approach.
A comparison between the carbon emissions calculated in the applied
energy model and the figures from the 2nd National GHG inventory
shows a reasonable consistency (see Table 21). The main difference
deviation occurs for industry in 2009/2010 where the model arrives at
160 kt while the inventory estimate is 228 kt.
The explanation is that excluding fuel wood and electricity ,the 2005 fuel
consumption is 33,817 toe in the energy model and 42,380 toe in the
GHG inventory. Also the emissions factors applied in the energy model
are slightly higher. In 2010 the final energy consumption calculated by the
energy model is 40,838 toe excluding fuel wood and electricity while the
0
50
100
150
200
250
300
350
400
450
2005 2010 2015 2020 2025 2030 2035 2040
kt C
O2e
Urban municipal waste
All urban
Thimphu

������������� ��������������������������������������������
2009 figure of the GHG inventory is 58,461 toe.
The main reason for the difference is that the model assumes a larger
share of electricity in the final energy consumption.
No attempt has been made to rectify this difference in the model since
the primary concern is to portray the possible situation in 2020, 2030
and 2040.
The energy related emissions increase from 360 kt in 2005 to 1,072
kt in 2040 which equals 0.57 t/capita and 1.1 t/capita, respectively. In
comparison, the figures reported for 2008 for Bangladesh, India, and
USA are 0.36 t/capita, 1.3 t/capita, and 19.7 t/capita (www.cdiac.ornl.
gov) respectively.
������!2��� ���������(�����##���#&'�)����,����� ������ ����������#�����������7;7���������*
NON-ENERGY RELATED EMISSIONS
A similar comparison is made concerning non-energy related emissions
in Table 22. While agricultural emissions increase slightly in the model
there is a small reduction in the GHG inventory. The difference can be
ascribed to the fact that the model simulates a long-term trend while the
GHG inventory shows that actual development from year to year and
therefore the GHG inventory shows greater variation from year to year.
The figures for emissions from industrial processes are quire consistent
between the model and the GHG inventory.
The growth in the waste related emissions is the same for the model and
the GHG inventory, but the model starts at a lower level and continues
to be lower than the GHG inventory figures.
������!���%���� ���������(�����##���#&'�)����,����������������#�����������7;7���������*
���Z ���� ���Z ���{'������ ��%��'��� ����������������������� ����������������������� ����������������� ��������������'������.��% ��������������������� �7������������������� �7����������������� ��#������������(������%��������������� �7�������������������� :#�������������������� �������������������� �����������������2������������ �::������������������ ��#������������������ �:7���������������� ���������������'!������ ����������������������� ����������������������� ��������������������� ������������������\$\��� |}������������������� [~������������������� |�Z���������������� Z�|������������
�_��]��������������� �����������!!]��!�"^#
��� �������
���Z ���� ���Z ���{'���'.��.�� ����:�������������� ���79�������������� ���#���������� 9:�������������=��.���������'�� �������������������� �7;����������������� �:������������� ;�;���������������� 9��������������������� �������������������� :���������������� ��;������������\$\��� ��[Z[�������������� ��~}[�������������� ��[�[��������� ��Z�[���������
�������� �����������!!]��!�"^#
��� ������� �_��]�������

������������� ������������������������������������������ ��
BASELINE SCENARIO RESULTS SUMMARISED
The total specific final energy consumption increases from 0.61 toe/
capita in 2005 to 0.97 toe/capita in 2040 while CO2e emissions grow
from 0.57 t/capita to 1.1 t/capita. If the non-energy related emissions are
considered then the CO2e emissions increase from 2.9 t/capita in 2005
to 5.1 t/capita in 2040.
Fuel wood is the main source of energy in 2005 constituting about 60%
of the total final energy consumption (see Table 23). In 2040 the fuel
wood share is reduced to 22% and electricity takes the lead with 44%. A
large share of the fuel wood consumption in 2005 is assumed to be
gradually replaced by briquettes and briquettes grow to represent 5% of
the total final energy consumption. Other purposes of fuel wood
consumption are assumed to be completely phased out, namely fodder
cooking.
�����8!.�������� ����#,������&���)���0�����1������� �����&�����)*
In total, fossil fuel based energy consumption constitutes 27% in 2005
and it only increases slightly in share by 2040 as depicted in the pie
charts in Figure 36. However, measured in absolute terms fossil fuel
consumption increases from 106 ktoe to 266 ktoe.
Specific emissions
Energy mix
���Z ��[� ���Z ��[�4��*.���0�����1 � �� �¦ �¦4���� � ;��; �¦ �¦4��.�����01 7; ��;�: �¦ ;¦���� �:�9# 7��:# :¦ :¦+��'���'��% ;��:� ���77� ��¦ [[��.��������01 ���#:� ��;��7 }�� ��¦3�<��������� �#:�� ������ ��¦ ��¦3������ ����� ����� �¦ �¦>���������� 9;: ���: �¦ �¦������� ��9:� 9#�� �¦ �¦$ 3 ;�;� �#�9; �¦ ;¦5����&�� � � � �¦ �¦2���.���*.������ �7�# 7�## �¦ �¦,����������� � ��� �¦ �¦\$\�� |��ZZ� {|�|�Z ���� ����
"��# "�#�]�������� �����!���]��
����!����!

������������� ��������������������������������������������
.� ,��8C!.�������� ����#,������&���)���0�����1������� �����&�������-���#)*
Looking at the development in the energy service demand, different
sectors behave quite differently from one another (Figure 37). Industries
and road transport reach a plateau after 2020. The migration from rural
to urban areas results in a break in the rural curve. The aviation and
primary sector show a gradual reduction which is due to the assumed
efficiency gains being the main driver for the development. The energy
efficiency gain is assumed 19% for all sectors except road transport
where it is 15%.
Please note, that the graph below is “distorted” – the lapse of time is
not same for each of the five measuring points and the development
from 2005 to 2010 to 2020 therefore appears more abrupt than really
is the case.
.� ,��8I!,���������#�����#�������6���$��������� �#������������&���)*
Energy service demand
Electricity13%
Fossil energy
27%
Fuel wood (s)
60%
Other RE0%
Final energy consump�on 2005 (toe)
Electricity44%
Fossil energy
29%
Fuel wood (s)
22%
Other RE5%
Final energy consump�on 2040 (toe)
Sum af ES 2005
Sum af ES 2010
Sum af ES 2020
Sum af ES 2030
Sum af ES 2040
All primary sector 5933 5283 4350 3234 2164
All ter/ary subsectors 24103 34156 66857 91463 125134Avia/on 287 378 822 822 822Energy intensive industries 29372 32209 118940 118940 118940
Other industries 22420 31802 62331 85304 116744
Road transport 12321 16243 28209 28209 28209Rural 35152 45850 63775 56455 65522Urban 7940 13965 42794 76034 112436
0
20000
40000
60000
80000
100000
120000
140000
Energy service demand (toe)

������������� ������������������������������������������ ��
The most marked difference between energy demand development and
final energy consumption occurs for the primary sector i.e. agriculture
– energy demand decreases to 36% of 2005 demand while consumption
decreases to only 15%. This is caused by a significant fuel shift from fuel
wood to biogas, electricity and gas/diesel oil (Please see Figure 38).
All other sectors grow in terms of final energy consumption. Due to
migration, rural consumption only increase to double the 2005 level
while urban consumption increases by a factor 14. Tertiary sector and
other industries increase by a factor 5. Due to the restrictions placed on
energy-intensive industries and road transport, in 2020 their increase is
lower, namely by a factor 4 and 2, respectively.
Final energy consumption
Sum of FEC 2005
Sum of FEC 2010
Sum of FEC 2020
Sum of FEC 2030
Sum of FEC 2040
Urban 14680 26739 72067 111445 141530
Rural 122374 153243 182168 135294 128455
Road transport 55094 71154 117409 112864 108658Other industries 46167 76467 140343 179725 229951Energy intensive industries 54373 68107 218833 187906 158587Avia/on 957 1244 2626 2556 2490
All ter/ary subsectors 40508 63185 109102 130539 154323All primary sector 54397 46349 33609 20622 8393
0
100000
200000
300000
400000
500000
600000
700000
800000
900000
1000000
Final energy consump�on (toe)
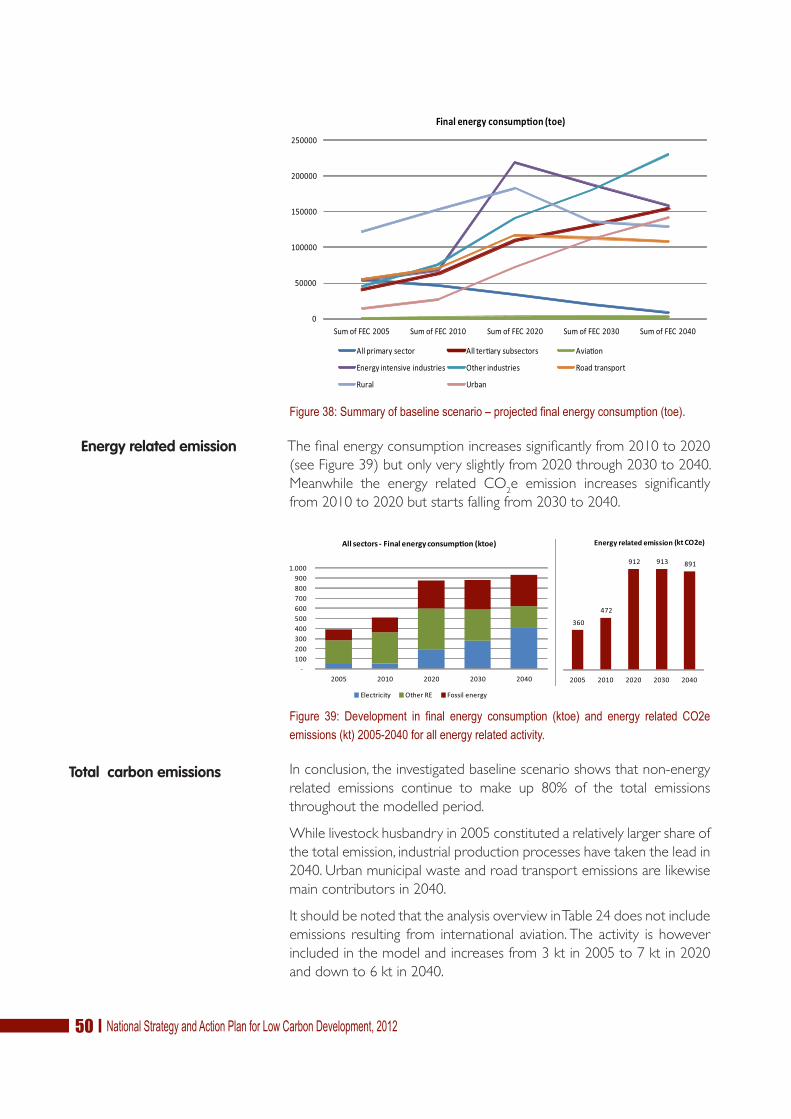
������������� �������������������������������������������
.� ,��8J!,���������#�����#�������6���$�����/������� ����#,������&���)*
The final energy consumption increases significantly from 2010 to 2020
(see Figure 39) but only very slightly from 2020 through 2030 to 2040.
Meanwhile the energy related CO2e emission increases significantly
from 2010 to 2020 but starts falling from 2030 to 2040.
.� ,�� 89! ����������� �� /��� ���� � ���#,������ &'���) ��� ���� � ������� �(�����##���#&'�)���0%��1����������� ����������������*
In conclusion, the investigated baseline scenario shows that non-energy
related emissions continue to make up 80% of the total emissions
throughout the modelled period.
While livestock husbandry in 2005 constituted a relatively larger share of
the total emission, industrial production processes have taken the lead in
2040. Urban municipal waste and road transport emissions are likewise
main contributors in 2040.
It should be noted that the analysis overview in Table 24 does not include
emissions resulting from international aviation. The activity is however
included in the model and increases from 3 kt in 2005 to 7 kt in 2020
and down to 6 kt in 2040.
Energy related emission
Total carbon emissions
0
50000
100000
150000
200000
250000
Sum of FEC 2005 Sum of FEC 2010 Sum of FEC 2020 Sum of FEC 2030 Sum of FEC 2040
Final energy consump�on (toe)
All primary sector All ter/ary subsectors Avia/on
Energy intensive industries Other industries Road transport
Rural Urban
-100 200 300 400 500 600 700 800 900
1.000
2005 2010 2020 2030 2040
All sectors - Final energy consump�on (ktoe)
Electricity Other RE Fossil energy
360
472
912 913 891
2005 2010 2020 2030 2040
Energy related emission (kt CO2e)

������������� ������������������������������������������ ��
Without the emissions from international aviation the total emissions
arrive at 4,723 kt CO2e in 2040. Given a sequestration level of
approximately 6,300 kt CO2e the margin of emissions is more than
1,500 kt CO2e in 2040.
Figure 40 illustrates that the energy related carbon emission continues
to constitute a modest share in 2040, namely 19% of the total carbon
emissions.
�����1!,���������#�����#�������&�����)6���$��������������##���#�������� �������� ��� ���%���� � ������� ���##���# &'��(��)*����! +������������ �������� �# �������,������-��,����#*
.� ,�� 1�! ,����� �� ��#����� #������� & ���-) 6 ����������� �� ���$����� ���������##���# ���� ���� � ������� ��� ���%���� � ������� ���##���# &'� �(��)* ����!+���������������������#�������,������-��,����#*
���Z ���� ���� ��|� ��[�+����%���������� �����0����5��1 �;:����������� �7#����������� 9�;����������� 9�7����������� ##;�������������������������������� '(������������� ')������������� ((*����������� *+)����������� *,)�����������
-����������� /:������������� )*������������� *,;����������� *+:����������� (:+�����������
��<��=�������� >������������ >������������ (��������������� (��������������� (���������������
?��������@�� *//����������� ((+����������� A/'����������� A'*����������� A;+�����������
B�������=�� *+������������� A,������������� ,'������������� ':������������� ':�������������
?������D��=�� (+������������� ;(������������� )*������������� *:'����������� )+�������������
����=�D�������E����� (��������������� A��������������� ,��������������� +��������������� **�������������
)��������%���������� �����0����5��1 ���;��������� ��:7��������� ���9��������� ��7:#�������� ��#�:��������F�������D�@��=��� (;A����������� ;',����������� *G);/������� *G);/������� *G);/�������
�����=H ,'/����������� ,'/����������� ,'/����������� ,'/����������� ,'/�����������
���@ ,,:����������� ':A����������� /A;����������� +**����������� ):A�����������
I� ���<���=�@�D���D���J�� );������������� *A:����������� (;'����������� A,A����������� ;((�����������
������������� ���|��������� [�|{��������� [�Z�Z�������� [�~�|�������� ��.������ 7���9#���� 79;�#����� #�9��9:��� ##7�;����� 97��#�#���(����5�������'����� ��9������������ ��������������� ;�������������� ;�������������� ��9������������
\$\���"^��$��#
-500
1.000 1.500 2.000 2.500 3.000 3.500 4.000 4.500 5.000
2005 2010 2020 2030 2040
Total GHG emission (kt CO2e)
Energy related Non-energy related

������������� ��������������������������������������������
Developing the hydropower industry for both domestic consumption
and for export to India would substantially reduce the regional CO2e
emission compared to a scenario without such a development. The
regional electricity system is not described in any detail in this report, but
it should be noted that the CO2e emission factor of electricity produced
in India from new coal plants will be app. 1 t CO2e/MWh electricity14.
14 CO2 Baseline Database for the Indian Power Sector, User Guide Version 5.0, Central
Electricity Authority, Ministry of Power, Government of India, November 2009.
Electricity and CO2e

������������� ������������������������������������������ ��
"��������������#�
� �����
© la
chen
illep
ekin
oiz.
devi
anta
rt.c
om
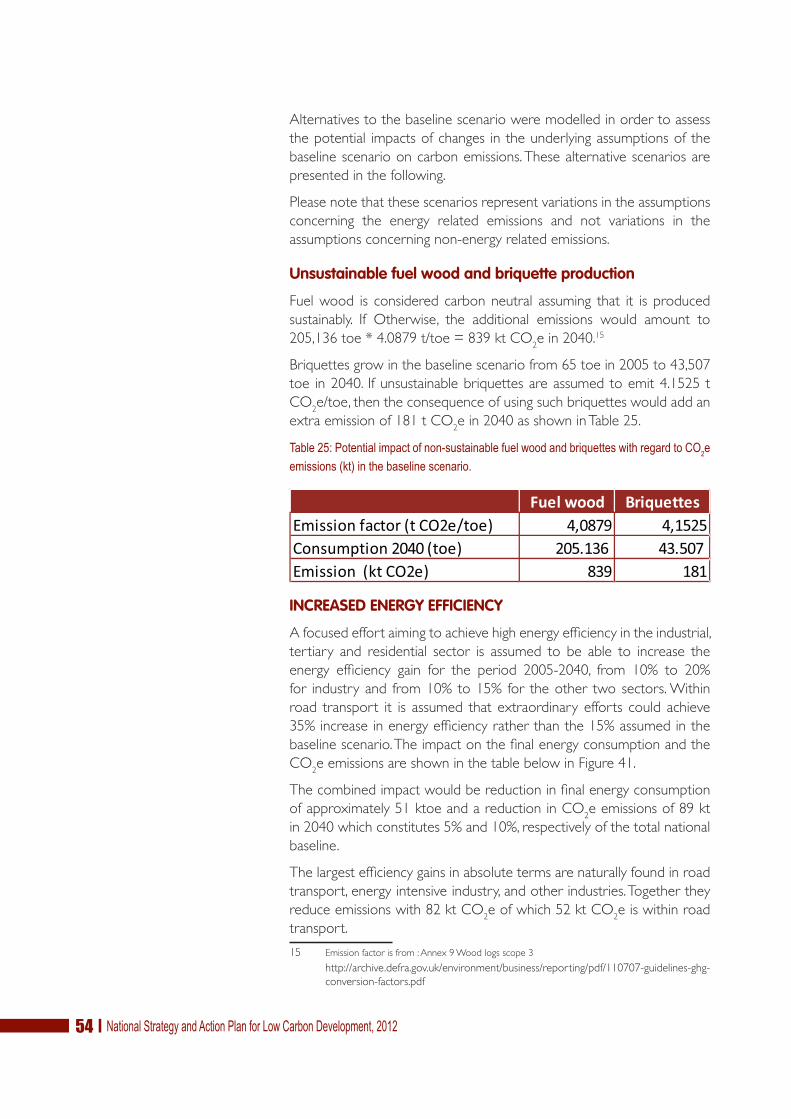
������������� ��������������������������������������������
Alternatives to the baseline scenario were modelled in order to assess
the potential impacts of changes in the underlying assumptions of the
baseline scenario on carbon emissions. These alternative scenarios are
presented in the following.
Please note that these scenarios represent variations in the assumptions
concerning the energy related emissions and not variations in the
assumptions concerning non-energy related emissions.
Unsustainable fuel wood and briquette production
Fuel wood is considered carbon neutral assuming that it is produced
sustainably. If Otherwise, the additional emissions would amount to
205,136 toe * 4.0879 t/toe = 839 kt CO2e in 2040.15
Briquettes grow in the baseline scenario from 65 toe in 2005 to 43,507
toe in 2040. If unsustainable briquettes are assumed to emit 4.1525 t
CO2e/toe, then the consequence of using such briquettes would add an
extra emission of 181 t CO2e in 2040 as shown in Table 25.
�����0!��������������������%#,#���������,������������M,����#���-�� ������(�����##���#&'�)���-���#�����#�������*
��������� ��]����!+ �����*�'����0���5��<���1 ���#:9 ���;�;���. �����������0���1 ��;���7��������� ���;�:������������+ ������0����5��1 #�9 �#�
INCREASED ENERGY EFFICIENCY
A focused effort aiming to achieve high energy efficiency in the industrial,
tertiary and residential sector is assumed to be able to increase the
energy efficiency gain for the period 2005-2040, from 10% to 20%
for industry and from 10% to 15% for the other two sectors. Within
road transport it is assumed that extraordinary efforts could achieve
35% increase in energy efficiency rather than the 15% assumed in the
baseline scenario. The impact on the final energy consumption and the
CO2e emissions are shown in the table below in Figure 41.
The combined impact would be reduction in final energy consumption
of approximately 51 ktoe and a reduction in CO2e emissions of 89 kt
in 2040 which constitutes 5% and 10%, respectively of the total national
baseline.
The largest efficiency gains in absolute terms are naturally found in road
transport, energy intensive industry, and other industries. Together they
reduce emissions with 82 kt CO2e of which 52 kt CO
2e is within road
transport.
15 Emission factor is from : Annex 9 Wood logs scope 3
http://archive.defra.gov.uk/environment/business/reporting/pdf/110707-guidelines-ghg-
conversion-factors.pdf

������������� ������������������������������������������ ��
.� ,��1�!.�������� ����#,������&���)������� � ��������(�����##���# &�)��#����� �� �� ���� � ��/������ #��������������� �� ��#�����* 22 3 ���� ���/������*
.� ,��1�!.�������� ����#,������&���)��� ���� � ������� �(�� ���##���# &�)�� �,�� �� �� ���� � ��/������ #��������������� �� ��#�����* 22 3 ���� ���/������*
FEC 2005 FEC 2040 baseline
FEC 2040 EE
CO2e 2005
CO2e 2040
baseline
CO2e 2040 EE
Urban 14680 141530 135385 18493 63467 60708Rural 122374 128455 122816 9043 34709 33127Road transport 55094 108658 92561 176959 347946 296399
Other industries 46167 229951 210788 70214 207518 190225
Energy intensive industries 54373 158587 145371 62364 158878 145638Interna/onal avia/on 957 1992 1992 2905 6172 6172Domes/c avia/on 957 498 498 0 1512 1512Ter/ary 40508 154323 147614 18402 59911 57306
Agriculture and forestry 54397 8393 8393 1604 11303 11303
0
100000
200000
300000
400000
500000
600000
700000
800000
900000
1000000
EE scenario
FEC 2005 FEC 2040 baseline
FEC 2040 EE CO2e 2005 CO2e 2040
baselineCO2e 2040
EE
Solar hea/ng 0 311 311 0 0 0Residual fuel oil 1638 6488 5947 5420 21467 19678Other biomass 0 0 0 0 0 0LPG 5054 48295 46195 13515 129149 123534
Kerosene 10973 9842 9380 33155 29738 28341
Jet kerosene 957 2447 2447 2905 7428 7428Gasoline 11311 22140 18860 33325 65230 55566Gas/Diesel oil 48711 113031 98190 159801 370810 322123
Fuel wood (s) 231872 205136 192073 0 0 0
Electricity 50471 411663 386336 0 0 0Coal 27498 64078 58738 111865 260675 238952Brique¨es (s) 65 43507 41615 0 0 0Biogas 0 5405 5282 0 6663 6512
Biofuel (diesel) 0 43 43 0 255 255
0
100000
200000
300000
400000
500000
600000
700000
800000
900000
1000000
EE scenario

������������� ��������������������������������������������
One way to assess the international value of forced increases in energy
efficiency is to consider any energy efficiency gains as a means to allow
for larger export of hydropower to India (or other neighbouring
countries) and thus displacing electricity generated from fossil fuels.
If hydropower based electricity replaces electricity produced on modern
coal fired plants in India with a carbon emission of 1 ton/MWh (11.64
t CO2e /toe), then 25.3 ktoe electricity saving equals a displacement of
300 kt CO2e emission. This is in the same order of magnitude as the
2040 energy related baseline emissions from the industrial segments.
HIGH SHARE OF RENEWABLE ENERGY
A high degree of electrification exploiting large scale and small scale
hydro power in combination with other renewable energy resources –
in particular solar energy – can pave the way for replacement of fossil
fuels. This in turn would help in reducing reliance on imported fuels
and limiting CO2e emissions while allowing for the envisioned economic
development of the country.
In the renewable energy scenario the following assumptions have been
made regarding the mix of fuels in 2040:
Road transport:
�� Heavy duty – 5% electricity, 10% biodiesel, (85% diesel );
�� Light duty – 50% electricity, 10% biodiesel, (30% diesel, 10%
gasoline);
�� Motorised two wheelers – 50% electricity, (50% gasoline).
Energy intensive industry – 90% electricity, 4% coal, 3% diesel, 3%
residual fuel oil (assuming that a certain amount of coal and residual fuel
oil cannot be replaced);
Other industry – 80% electricity, 10% coal, 10% fuel wood (assuming
that a certain amount of coal cannot be replaced).
Rural households:
�� Cooking – 73% electricity, 10% solar, 10% wood, 5% briquettes,
2% biogas;
�� Hot water heating – 53% electricity, 30% solar, 10% wood, 5%
briquettes, 2% biogas;
�� Space heating – 73% electricity, 12% solar, 10% wood, 5%
briquettes.
Urban households and tertiary sector:
�� Cooking – 100% electricity;
�� Hot water heating – 50% electricity, 50% solar ;
�� Space heating – 80% electricity, 20% solar.
Global value of energy efficiency
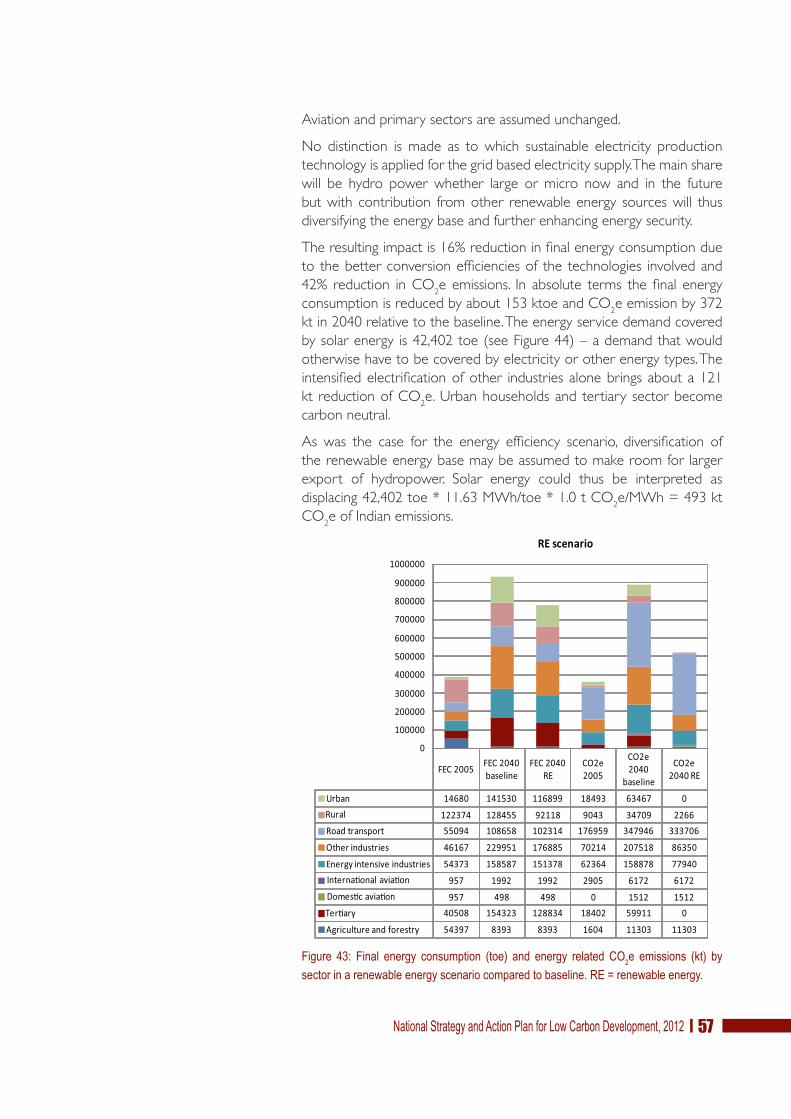
������������� ������������������������������������������ ��
Aviation and primary sectors are assumed unchanged.
No distinction is made as to which sustainable electricity production
technology is applied for the grid based electricity supply. The main share
will be hydro power whether large or micro now and in the future
but with contribution from other renewable energy sources will thus
diversifying the energy base and further enhancing energy security.
The resulting impact is 16% reduction in final energy consumption due
to the better conversion efficiencies of the technologies involved and
42% reduction in CO2e emissions. In absolute terms the final energy
consumption is reduced by about 153 ktoe and CO2e emission by 372
kt in 2040 relative to the baseline. The energy service demand covered
by solar energy is 42,402 toe (see Figure 44) – a demand that would
otherwise have to be covered by electricity or other energy types. The
intensified electrification of other industries alone brings about a 121
kt reduction of CO2e. Urban households and tertiary sector become
carbon neutral.
As was the case for the energy efficiency scenario, diversification of
the renewable energy base may be assumed to make room for larger
export of hydropower. Solar energy could thus be interpreted as
displacing 42,402 toe * 11.63 MWh/toe * 1.0 t CO2e/MWh = 493 kt
CO2e of Indian emissions.
.� ,�� 18! .���� ���� � ���#,������ &���) ��� ���� � ������� �(�� ���##���# &'�) ��#��������������������� �#�������������������#�����*523������������� �*
FEC 2005 FEC 2040 baseline
FEC 2040 RE
CO2e 2005
CO2e 2040
baseline
CO2e 2040 RE
Urban 14680 141530 116899 18493 63467 0Rural 122374 128455 92118 9043 34709 2266Road transport 55094 108658 102314 176959 347946 333706
Other industries 46167 229951 176885 70214 207518 86350
Energy intensive industries 54373 158587 151378 62364 158878 77940Interna/onal avia/on 957 1992 1992 2905 6172 6172Domes/c avia/on 957 498 498 0 1512 1512Ter/ary 40508 154323 128834 18402 59911 0
Agriculture and forestry 54397 8393 8393 1604 11303 11303
0
100000
200000
300000
400000
500000
600000
700000
800000
900000
1000000
RE scenario

������������� ��������������������������������������������
.� ,��11!.�������� ����#,������&���)������� ���������(�����##���#&'�)���,������������������ �#�������������������#�����*523������������� �*
ENERGY EFFICIENCY AND RENEWABLE ENERGY
Combining the assumption of the energy efficiency scenario and the
renewable energy scenario the result is as follows (see Figure 45): The
final energy consumption is reduced by 22% reaching about 724 ktoe
in 2040 and the CO2e emissions is reduced by 49% reaching 456 kt
in 2040. The absolute difference between baseline and the combined
energy efficiency and renewable energy scenario is 208 ktoe and 435 kt
CO2e emissions. The largest emitter is the category “Other industries”
with 128 kt CO2e.
FEC 2005 FEC 2040 baseline
FEC 2040 RE CO2e 2005 CO2e 2040
baselineCO2e 2040
RE
Solar hea/ng 0 311 42402 0 0 0Residual fuel oil 1638 6488 6488 5420 21467 21467Other biomass 0 0 0 0 0 0LPG 5054 48295 0 13515 129149 0
Kerosene 10973 9842 0 33155 29738 0
Jet kerosene 957 2447 2447 2905 7428 7428Gasoline 11311 22140 16834 33325 65230 49598Gas/Diesel oil 48711 113031 87631 159801 370810 287480
Fuel wood (s) 231872 205136 66422 0 0 0
Electricity 50471 411663 505738 0 0 0Coal 27498 64078 29876 111865 260675 121540Brique¨es (s) 65 43507 11582 0 0 0Biogas 0 5405 5772 0 6663 7116
Biofuel (diesel) 0 43 4119 0 255 24620
0
100000
200000
300000
400000
500000
600000
700000
800000
900000
1000000
RE scenario
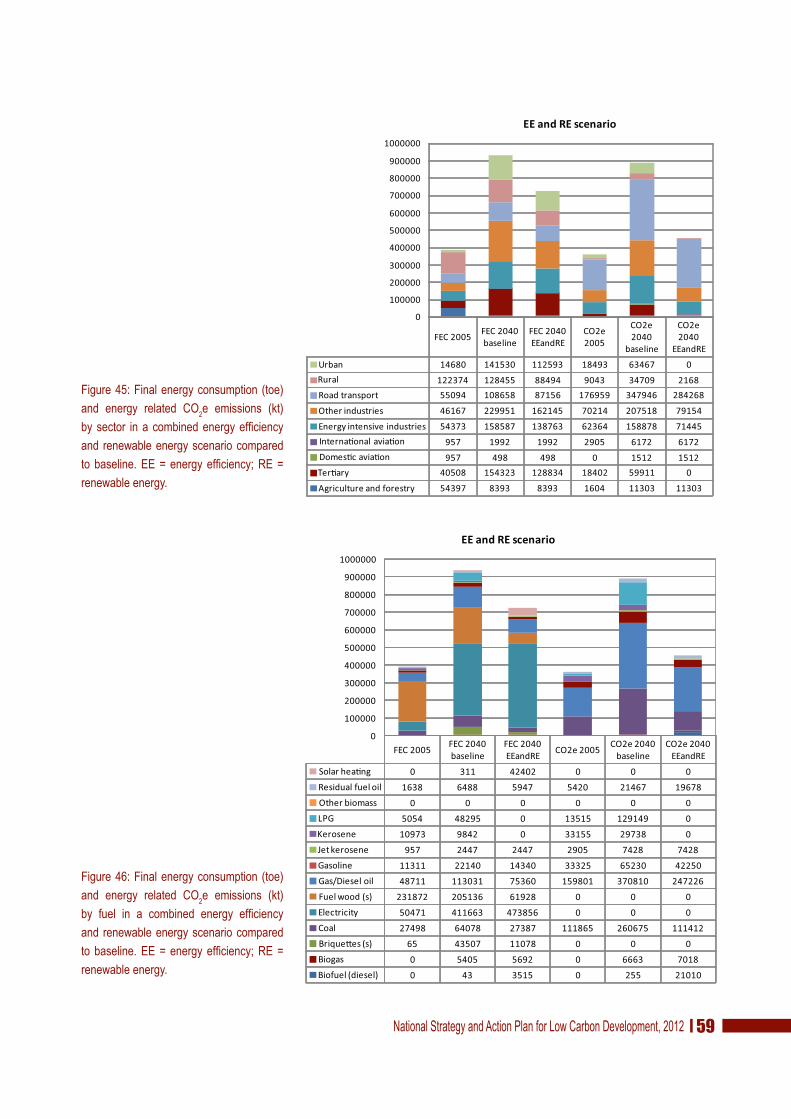
������������� ������������������������������������������ ��
.� ,��10!.�������� ����#,������ &���)��� ���� � ������� �(�� ���##���# &'�)�� #����� ��� ������������ ���/��������� ������������� �#�������������������#�����*223���� ���/������4523������������� �*
.� ,��1C!.�������� ����#,������ &���)��� ���� � ������� �(�� ���##���# &'�)�� �,�� �� � �������� ���� � ��/��������� ������������� �#�������������������#�����*223���� ���/������4523������������� �*
FEC 2005 FEC 2040 baseline
FEC 2040 EEandRE
CO2e 2005
CO2e 2040
baseline
CO2e 2040
EEandRE
Urban 14680 141530 112593 18493 63467 0Rural 122374 128455 88494 9043 34709 2168Road transport 55094 108658 87156 176959 347946 284268
Other industries 46167 229951 162145 70214 207518 79154
Energy intensive industries 54373 158587 138763 62364 158878 71445Interna/onal avia/on 957 1992 1992 2905 6172 6172Domes/c avia/on 957 498 498 0 1512 1512Ter/ary 40508 154323 128834 18402 59911 0
Agriculture and forestry 54397 8393 8393 1604 11303 11303
0
100000
200000
300000
400000
500000
600000
700000
800000
900000
1000000
EE and RE scenario
FEC 2005 FEC 2040 baseline
FEC 2040 EEandRE CO2e 2005 CO2e 2040
baselineCO2e 2040
EEandRE
Solar hea/ng 0 311 42402 0 0 0Residual fuel oil 1638 6488 5947 5420 21467 19678Other biomass 0 0 0 0 0 0LPG 5054 48295 0 13515 129149 0Kerosene 10973 9842 0 33155 29738 0Jet kerosene 957 2447 2447 2905 7428 7428Gasoline 11311 22140 14340 33325 65230 42250Gas/Diesel oil 48711 113031 75360 159801 370810 247226Fuel wood (s) 231872 205136 61928 0 0 0Electricity 50471 411663 473856 0 0 0Coal 27498 64078 27387 111865 260675 111412Brique¨es (s) 65 43507 11078 0 0 0Biogas 0 5405 5692 0 6663 7018Biofuel (diesel) 0 43 3515 0 255 21010
0
100000
200000
300000
400000
500000
600000
700000
800000
900000
1000000
EE and RE scenario
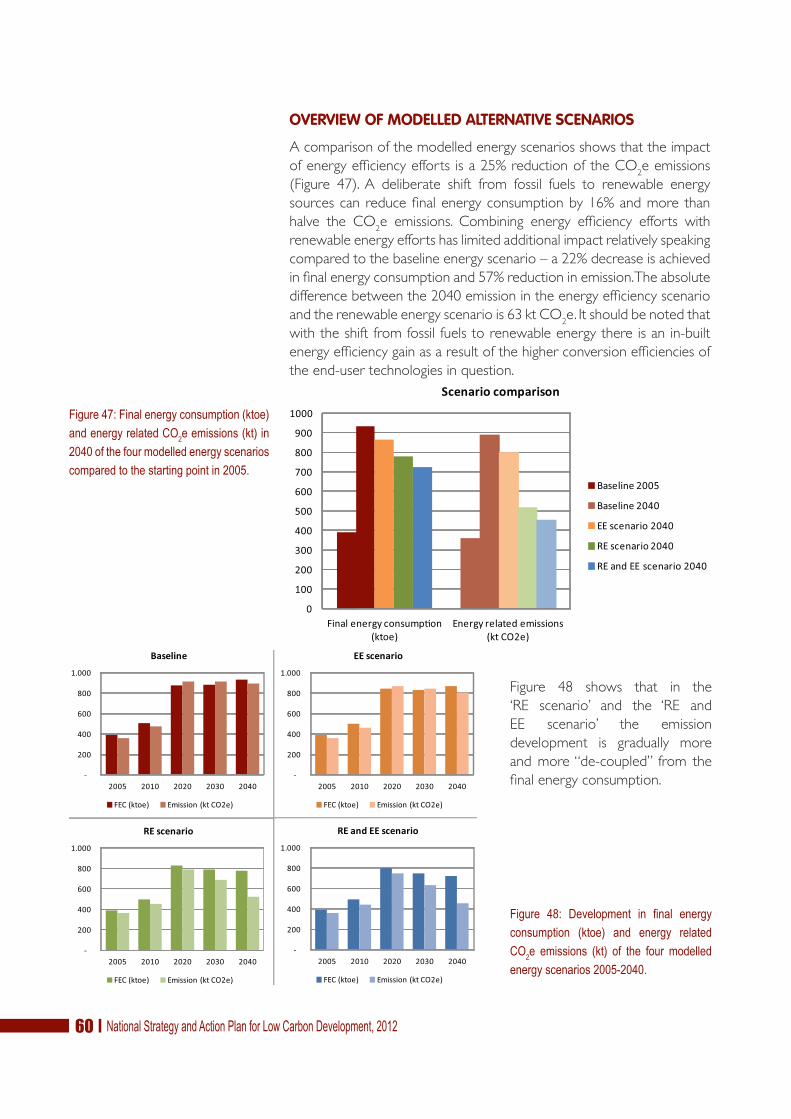
������������� �������������������������������������������
OVERVIEW OF MODELLED ALTERNATIVE SCENARIOS
A comparison of the modelled energy scenarios shows that the impact
of energy efficiency efforts is a 25% reduction of the CO2e emissions
(Figure 47). A deliberate shift from fossil fuels to renewable energy
sources can reduce final energy consumption by 16% and more than
halve the CO2e emissions. Combining energy efficiency efforts with
renewable energy efforts has limited additional impact relatively speaking
compared to the baseline energy scenario – a 22% decrease is achieved
in final energy consumption and 57% reduction in emission. The absolute
difference between the 2040 emission in the energy efficiency scenario
and the renewable energy scenario is 63 kt CO2e. It should be noted that
with the shift from fossil fuels to renewable energy there is an in-built
energy efficiency gain as a result of the higher conversion efficiencies of
the end-user technologies in question.
0
100
200
300
400
500
600
700
800
900
1000
Final energy consump/on (ktoe)
Energy related emissions (kt CO2e)
Scenario comparison
Baseline 2005
Baseline 2040
EE scenario 2040
RE scenario 2040
RE and EE scenario 2040
-
200
400
600
800
1.000
2005 2010 2020 2030 2040
Baseline
FEC (ktoe) Emission (kt CO2e)
-
200
400
600
800
1.000
2005 2010 2020 2030 2040
EE scenario
FEC (ktoe) Emission (kt CO2e)
-
200
400
600
800
1.000
2005 2010 2020 2030 2040
RE scenario
FEC (ktoe) Emission (kt CO2e)
-
200
400
600
800
1.000
2005 2010 2020 2030 2040
RE and EE scenario
FEC (ktoe) Emission (kt CO2e)
.� ,��1I!.�������� ����#,������&'���)������� ���������(�����##���#&'�)����1����-���,������������� �#�������#�����������-�#������ ����������0*
Figure 48 shows that in the
‘RE scenario’ and the ‘RE and
EE scenario’ the emission
development is gradually more
and more “de-coupled” from the
final energy consumption.
.� ,�� 1J! ����������� �� /��� ���� ����#,������ &'���) ��� ���� � ��������(�� ���##���# &'�) �� �-� ��,� ������������ �#�������#���0%��1�*

������������� ������������������������������������������ ��
From 2005 to 2040 fodder cooking is phased out and thus the final
energy consumption of the primary sector falls drastically in the baseline
(see Table 26). Some of the largest savings are achieved in the residential
sector, tertiary sector and other industries – the key driver being a shift
towards electricity. A strategy to provide access to sustainable electricity
supply is thus consistent with a low carbon strategy.
.� ,�� 19! .���� ���� � ���#,������ &���) �� �-� ��,��������� ���� � #�������# 6 ��#�����*
�����C!.�������� ����#,������&���)���-���,������������� �#�������#6��#�����6��1���#�����3����@���N* -��� -��������,���������#�-�����-�� ���#�������-��##,������#����-�#�#�����#*
2005 2040 baseline 2040 EE 2040 RE 2040 EEandRE
Urban 14680 141530 135385 116899 112593Rural 122374 128455 122816 92118 88494Road transport 55094 108658 92561 102314 87156Other industries 46167 229951 210788 176885 162145
Energy intensive industries 54373 158587 145371 151378 138763
Interna/onal avia/on 957 1992 1992 1992 1992Domes/c avia/on 957 498 498 498 498Ter/ary 40508 154323 147614 128834 123918
Agriculture and forestry 54397 8393 8393 8393 8393
0
100000
200000
300000
400000
500000
600000
700000
800000
900000
1000000
Final energy consump�on (toe)
2005 2040 baseline 2040 EE 2040 RE 2040 EEandREAgriculture and forestry 648% 100% 100% 100% 100%Ter/ary 26% 100% 96% 83% 80%Domes/c avia/on 192% 100% 100% 100% 100%Interna/onal avia/on 48% 100% 100% 100% 100%Energy intensive industries 34% 100% 92% 95% 88%Other industries 20% 100% 92% 77% 71%Road transport 51% 100% 85% 94% 80%Rural 95% 100% 96% 72% 69%Urban 10% 100% 96% 83% 80%TOTAL 42% 100% 93% 84% 78%
Final energy consump�on (toe)

������������� ��������������������������������������������
Looking at the mix of fuels consumed, LPG and kerosene are completely
phased out in the renewable energy scenario16. Electricity, fuel wood and
gas/diesel oil remain dominant in all scenarios.
.� ,��0�!.�������� ����#,������&���)���-���,������������� �#�������#6���,��*
16 Currently LPG and kerosene are heavily subsidised by India. If a phase out were to be
the target then the subsidies would have to be removed.
2005 2040 baseline 2040 EE 2040 RE 2040
EEandRESolar hea/ng 0 311 311 42402 42402Residual fuel oil 1638 6488 5947 6488 5947Other biomass 0 0 0 0 0
LPG 5054 48295 46195 0 0Kerosene 10973 9842 9380 0 0Jet kerosene 957 2447 2447 2447 2447Gasoline 11311 22140 18860 16834 14340
Gas/Diesel oil 48711 113031 98190 87631 75360
Fuel wood (s) 231872 205136 192073 66422 61928Electricity 50471 411663 386336 505738 473856Coal 27498 64078 58738 29876 27387
Brique¨es (s) 65 43507 41615 11582 11078
Biogas 0 5405 5282 5772 5692Biofuel (diesel) 0 43 43 4119 3515
0
100000
200000
300000
400000
500000
600000
700000
800000
900000
1000000
Final energy consump�on (toe)

������������� ������������������������������������������ ��
As can be seen in Figure 50 above there are several substantial
differences between the baseline development and a development
with focus on energy efficiency and renewable energy. In all scenarios
the electrification of the country is considered to be almost 100%. In
the EE and RE scenarios the fuel switching towards electricity is radical.
In addition to this, the focus on local small-scale energy production in
the form of solar heating, biogas, firewood etc. is intensified in those
scenarios.
Electrification based on large renewable electricity production will
increase the overall energy efficiency and reduce CO2e emission. As
has been mentioned earlier the CO2e impact from saving electricity in
a national perspective is quite small due to the fact that almost 100% of
the electricity production is based on renewable energy (hydro power).
However, in a regional context every saved kWh will have an impact
in India since India imports hydropower based electricity from Bhutan.
Increasing the efficiency of electricity consumption will in other words
“make room” for more export to India which in turn supplants coal
based electricity production in India. The marginal emission of Indian
electricity production is 1.0 t CO2e/MWh17. So limiting the growth in
electricity consumption in Bhutan can be claimed to increase export
to India and thus to reduce the CO2e emission in India. The difference
between the electricity consumption in the hypothetical RE scenario and
the hypothetical combined EE and RE scenario is 32 ktoe (equivalent
to 372 GWh). Such electricity savings would in the Indian system equal
372 kt CO2e emission savings. And the 25 ktoe electricity savings in the
hypothetical EE scenario relative to the baseline scenario would spare
the regional environment of 290 kt CO2e emissions.
17 CO2 Baseline Database for the Indian Power Sector, User Guide Version 5.0, Central
Electricity Authority, Ministry of Power, Government of India, November 2009. The
value (1.0 t CO2e/MWh) used in the calculation shown in the text above is the emis-
sion value of the operating margin. The operating margin describes the average CO2
intensity of the existing stations in the grid which are most likely to reduce their output
if another project supplies electricity to the grid (or reduces consumption of grid elec-
tricity).
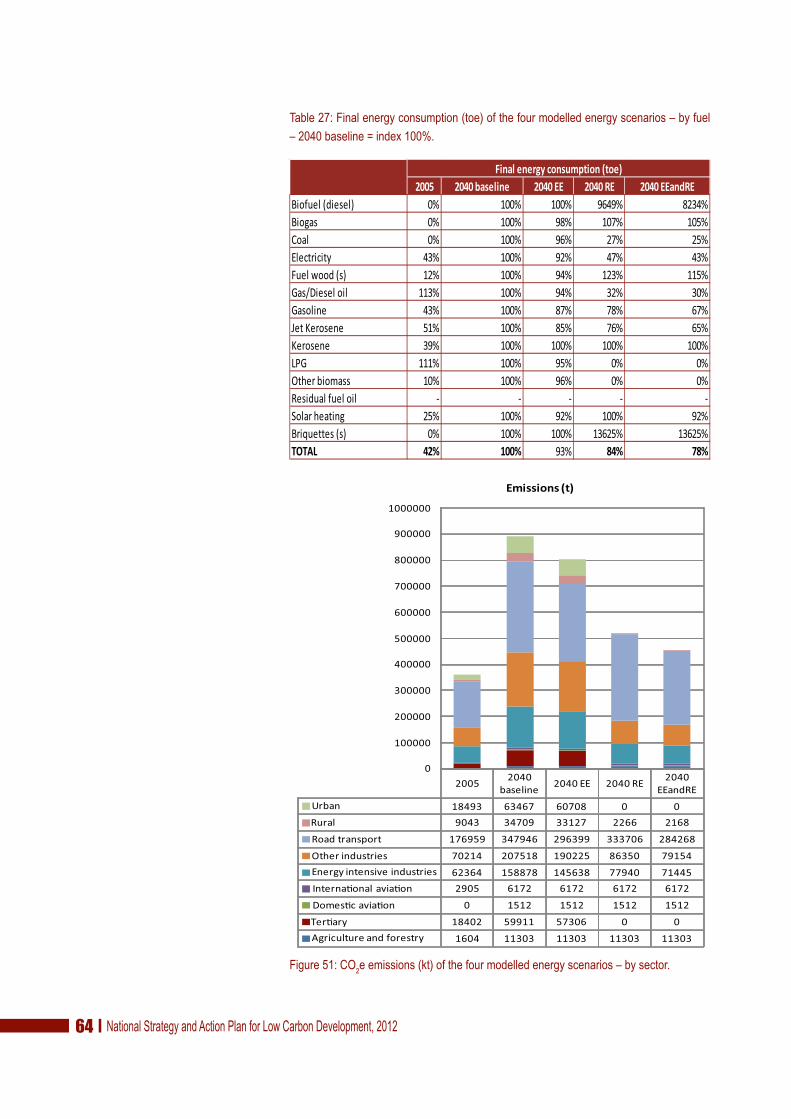
������������� ��������������������������������������������
�����I!.�������� ����#,������&���)���-���,������������� �#�������#6���,��6��1���#�����3����@���N*
.� ,��0�!�(�����##���#&'�)���-���,������������� �#�������#6��#�����*
���Z ��[����!��]�� ��[�� ��[��f ��[�� ���f 4��*.���0�����1 �¦ ���¦ ���¦ 97�9¦ #���¦4���� �¦ ���¦ 9#¦ ��:¦ ��;¦���� �¦ ���¦ 97¦ �:¦ �;¦+��'���'��% ��¦ ���¦ 9�¦ �:¦ ��¦�.��������01 ��¦ ���¦ 9�¦ ���¦ ��;¦3�<��������� ���¦ ���¦ 9�¦ ��¦ ��¦3������ ��¦ ���¦ #:¦ :#¦ 7:¦>���������� ;�¦ ���¦ #;¦ :7¦ 7;¦������� �9¦ ���¦ ���¦ ���¦ ���¦$ 3 ���¦ ���¦ 9;¦ �¦ �¦5����&�� � ��¦ ���¦ 97¦ �¦ �¦2���.���*.������ � � � � �,����������� �;¦ ���¦ 9�¦ ���¦ 9�¦4��.�����01 �¦ ���¦ ���¦ ��7�;¦ ��7�;¦\$\�� [�� ���� 9�¦ �[� ~��
�]�������� �����!���]���"��#
2005 2040 baseline 2040 EE 2040 RE 2040
EEandREUrban 18493 63467 60708 0 0Rural 9043 34709 33127 2266 2168
Road transport 176959 347946 296399 333706 284268
Other industries 70214 207518 190225 86350 79154Energy intensive industries 62364 158878 145638 77940 71445Interna/onal avia/on 2905 6172 6172 6172 6172
Domes/c avia/on 0 1512 1512 1512 1512
Ter/ary 18402 59911 57306 0 0Agriculture and forestry 1604 11303 11303 11303 11303
0
100000
200000
300000
400000
500000
600000
700000
800000
900000
1000000
Emissions (t)

������������� ������������������������������������������ ��
With regard to carbon emissions the baseline development leads to an
increase in emissions by a factor 2.5 over the investigated period. Energy
efficiency may limit the increase with 10% of 2040 baseline emissions.
Renewable energy offers a 42% reduction and renewable energy
combined with energy efficiency can achieve almost a 50% reduction. In
the energy efficiency and renewable energy scenarios the 2040 emission
is only 27% higher than the 2005 emission level.
In the energy efficiency and renewable energy scenarios road transport
makes up 62% of total emissions simply due to the fact that the possibility
for a shift to renewable energy is difficult.
.� ,��0�!�(�����##���#&'�)���-���,������������� �#�������#6���,��*
2005 2040 baseline 2040 EE 2040 RE 2040
EEandRE
Solar hea/ng 0 0 0 0 0Residual fuel oil 5420 21467 19678 21467 19678Other biomass 0 0 0 0 0
LPG 13515 129149 123534 0 0
Kerosene 33155 29738 28341 0 0Jet kerosene 2905 7428 7428 7428 7428Gasoline 33325 65230 55566 49598 42250Gas/Diesel oil 159801 370810 322123 287480 247226
Fuel wood (s) 0 0 0 0 0
Electricity 0 0 0 0 0Coal 111865 260675 238952 121540 111412Brique¨es (s) 0 0 0 0 0
Biogas 0 6663 6512 7116 7018
Biofuel (diesel) 0 255 255 24620 21010
0
100000
200000
300000
400000
500000
600000
700000
800000
900000
1000000
Emissions (t)

������������� ��������������������������������������������
© C
entr
e fo
r C
reat
ive
Des
ign
������������� ������������������������������������������ ��
"���������$��� ����%� �����%�
������������� ��������������������������������������������
Climate change is of global concern and international measures
to mitigate and adapt to the climate change includes among others,
financing mechanisms.
The Green Climate Fund was agreed in principle at COP15 in
Copenhagen in 2009 and an agreement on the broader design was
reached at COP17 in Durban in December 2011. The Green Climate
Fund will start operating from 2013 with a fund of 100 billion USD that
rich countries have promised to make available to poor countries by
2020 to help mitigate emissions and adapt to climate change. However,
the final document from COP17 does not clarify where the money will
come from or how much cash, if any, is already there.
At present there exists a number of financing options under the
international climate regime such as the project based Clean
Development Mechanism (CDM), the sector approach like CDM’s
Programme of Activities (PoAs) and broader approach like Nationally
Appropriate Mitigation Actions (NAMAs). In addition there is the special
programme for Reducing Emissions from Deforestation and Forest
Degradation (REDD+). While CDM and PoA are part of the Kyoto
Protocol the NAMA and REDD+ are mechanisms under the Climate
Convention.
CLEAN DEVELOPMENT MECHANISM
The Clean Development Mechanism (CDM) is a flexible mechanism
under the Kyoto Protocol18. The CDM allows emission reduction projects
in developing countries to earn Certified Emission Reductions (CERs)
which can be sold and used by industrialised countries to meet part of
their emission reduction target under the Kyoto Protocol.
Although there have been several initiatives to register CDM projects
in Bhutan so far only two projects has been registered. It seems to be
a serious problem that the baseline for the energy sector in Bhutan is
electricity generated from hydro power which has no CO2 emissions.
Most of the electricity generated at the hydro power plants in Bhutan
is exported to India and here replacing fossil fuels, but it has been very
difficult to have an Indian baseline approved for a CDM project in Bhutan.
With few opportunities to have larger hydro power projects approved
under the CDM scheme there should be opportunities for minor
industrial or household based renewable energy and energy efficiency
project. However, experience has shown that approval of methodologies
requires a rather large effort and high transaction costs which cannot
18 Under the Kyoto Protocol, 37 industrialised countries – the so-called Annex I Parties –
must meet their GHG emissions targets primarily through national measures. However,
the Protocol offers them an additional means of meeting their targets by way of three
market-based mechanisms: International Emissions Trading (IET), Joint Implementation
(JI), and Clean Development Mechanism (CDM). CDM is defined in Protocol’s Article
12.

������������� ������������������������������������������ ��
be made up for by the value of CERs. That is one of the reasons why
the CDM is geographic and sector biased towards the larger developing
countries and sectors with emissions of either very aggressive GHGs
like landfill projects or large power plants in a coal baseline environment.
CDM PROGRAMME OF ACTIVITIES
The Programme of Activities (PoA) started in 2005. Worldwide there
are almost 100 PoAs being developed with about half of it involving
emission reductions at the household and community level. PoA
requires less administrative effort to be registered which results in lower
transaction costs and shorter time for implementation. The PoA can be
seen as a stepping stone towards the sector approach.
POST-2012 CARBON MARKET
So far the carbon markets have been politically driven mainly under the
framework of the Kyoto Protocol. The current commitment period of
the Kyoto Protocol will end in 2012 and the post-2012 demand for CERs
will depend on the outcome of negotiations to extend the commitment
period and/or the development of existing carbon markets.
There are many uncertainties related to the future demand for CERs.
The biggest demand for carbon emission allowances and carbon credits
on the global carbon market is from the European Emission Trading
Scheme (EU ETS). The price of carbon credits, i.e. CERs, on the carbon
market is closely linked to the prices of European carbon emission
allowances (EUA) as long as CERs are in compliance with the unit for
EU ETS participants. The EU ETS has already been extended with third
phase from 2013 to 2020 but it is highly unclear which types of CERs
will be accepted into the EU ETS. It is certain that CERs from least
developed countries will be accepted into the post 2012 EU ETS. While
investors so far have been focusing on projects in China and India, there
has been an increasing interest in projects in South East Asia. This shift
could reflect that CERs from the region are more likely to be accepted
in the post 2012 phase of EU ETS.
At the regional level there are emerging carbon markets in the United
States and countries like Japan, Australia and New Zealand are developing
carbon markets.
NATIONALLY APPROPRIATE MITIGATION ACTIONS (NAMA)
The rationale behind the Kyoto Protocol is that the developed countries
are responsible for past emission. However, developing countries are
increasing their contribution to the level of GHG and the main emitters
today. Therefore developing countries will be integrated in a post-
2012 climate agreement with involvement at a lower level compared
to developed countries. This is because they are in developing process
where mitigation actions have to be integrated with general development

������������� �������������������������������������������
targets such as poverty eradication, health care and education. There
are major differences between developing countries with respect to
natural resources, population density, emitting sectors and demographic
development. The Nationally Appropriate Mitigation Actions is an
instrument that is foreseen to take these differences into consideration.
NAMA is a new mechanism and the modalities and procedures for
NAMAs are still evolving. NAMAs are often held at the level of aggregate
targets and do not include much detail.
NAMAs are part of the Bali Action Plan (BAP) but the BAP does not
provide a specific definition of NAMAs. The provisions in the BAP can
be broken down into the following elements19:
�� Developing countries are to undertake nationally tailored
mitigation actions;
�� These actions shall be embedded in the broader national
sustainable development strategy;
�� They are to be measurable, reportable and verifiable (MRV);
�� They are to be supported by developed countries.
NAMAs can be in the form of projects, programmes or policies.
Specific actions can consist of only one measure, a set of measures or
implementation of a holistic action plan.
On 5th February 2010, the Royal Government of Bhutan registered in
the NAMA pipeline20a NAMA with a nationwide approach and carbon
emission target to remain carbon neutral as emission reduction goal.
REDD+
Although estimates showed that carbon emissions from deforestation and
forest degradation accounted for 15-20% of global carbon emissions, an
agreement to take actions against further deforestation and degradation
was not reached until Bali Action Plan in 2007. At COP15 in 2009 a
consensus was reached about collective commitment by developed
countries for new and additional resources. It is predicted that financial
flows for greenhouse gas emission reductions from REDD+ could reach
up to 30 billion USD/year. This significant North-South flow of funds
could reward a meaningful reduction of carbon emissions and could
also support new, pro-poor development, help conserve biodiversity,
and secure vital ecosystem services.
19 JIKO Policy Paper 01/2011, Wuppertal Institute, August 2011
20 UNEP Risoe NAMA pipeline

������������� ������������������������������������������ ��
&�� ����������#������ ����'���
© K
arma C
. Neydrup, N
EC

������������� ��������������������������������������������
The task of the long-term national strategy for low carbon development
is to strike the difficult balance of economic growth and sufficient energy
at reasonable cost while preserving the local environment and
contributing to climate protection. More specifically the strategy shall
enable Bhutan to fulfil the commitment to remain carbon neutral. In
addition, the strategy will align with the Green Economy theme in the
UN Conference on Sustainable Development (RIO+20) taking place in
June 2012. The concept of Green Economy focuses on the intersection
between environment and economy.
With regard to portfolio of policy instruments, the government has
three policy instruments, namely informative, normative and economic
instruments, as illustrated in Figure 53.
The informative instruments aim to inform the target group or influence
the target group. The target group has a large degree of freedom
regarding whether or not to act in accordance with the information.
The economic instruments i.e. market based instruments give the target
group an economic incentive to act as the regulator wishes and can be
in form of a reward (“carrot”) or a punishment (“stick”). The normative
instruments oblige the target group to do the wanted and often include
sanctions in case of lack of adherence.
.� ,��08! ���#����������#��,����#*
Typically, a mix of instruments is the best choice – either used at the same
time or consecutively. The most effective mix of instruments will depend
on the case in question. Is it important that the entire target group
acts as wanted or is a section sufficient? How much freedom of choice
is politically necessary? To what extent do personal/business interests
coincide with societal interests? Is it possible to verify compliance? How
soon are results required?
Long-term strategy
Policy instruments
&��$f��\&�
�$f��\&� �$�$�&�
������������� ������������������������������������������ ��
In addition to these three instruments, the government and local
authorities may also choose to use their position to facilitate dialogue
and public-private partnerships to further the intended socio-economic
development.
ASSUMPTIONS
There are several studies on potential mitigation measures for various
sectors in Bhutan. All relevant information for scenario analysis is based
on information available as of November 2011 and consultations with
stakeholders.
Empirical studies were not undertaken to verify or add information.
Assessments of costs and benefits from the selected interventions are
mainly qualitative as quantification will require specific and detailed
studies. However, in order to be able to proceed with project proposals
for the NAMA, detailed studies will be required to substantiate costs
and benefits.
INTERVENTIONS IDENTIFIED IN EXISTING DOCUMENTS
The review of existing documents concerning intervention possibilities
for reducing carbon emissions in Bhutan revealed the interventions
listed below.
The encountered studies on carbon reduction potential and intervention
opportunities relevant to Bhutan are:
�� Integrated Energy Management Master Plan for Bhutan. TERI/
DoE 2010 (IEMMP);
�� ADB Capacity building of NEC. May 2011 (ADB/NEC);
�� Energy Intensive Sectors of the Indian Economy. Path to low
carbon development. ESMAP 2010 (ESMAP-I);
�� CO2 Reductions in Transport Sector in Thailand: Some Insights,
2008 (THAI);
�� Capacity development for scaling up decentralised energy
access programmes. Lessons from Nepal. UNDP 2010 (NEPAL);
�� Analysis of Energy-Efficient Opportunities for Cement Industry
in Shandung Province, China. Lawrence Berkley National
Laboratory. October 2009 (Cement-China);
�� Bhutan: Economic Analysis of Cleaner Technologies and Options
in the Non-Energy Sector. ADB. December 2010 (Non-energy);
�� Pathway to a Low-Carbon Economy. Version 2. McKinsey &
Company. 2009 (McKinsey);
Available documents

������������� ��������������������������������������������
�� Second National Communication from Bhutan to UNFCCC,
2011.
The study ‘Bhutan: Economic Analysis of Cleaner Technologies and
Options in the Non-Energy Sector’ comprises calculations of carbon
reduction potentials and marginal abatement costs for a number
of interventions in the non-energy sectors of Bhutan. Other reports
present rough estimates of reduction potentials and rough estimates of
costs.
Table 28 shows a schematic overview of identified interventions and
related reduction potential and costs.
�����J!�����������������������,����,����������������������������#�#��"-,���*
Sector Opportunity
Emission reduction potential 2010-2020/30
Cost Source
Energy consumption in industry
General21-25% coal reduction (in cement industry)
30 mill Nu. IEMMP
Energy consumption in transport
General 14% petrol and 10% diesel No information IEMMP
Tax/elimination of tax exemption or parking fees
16.4% with CO2 tax of100USD/t CO2e
No information THAI
Fuel shift (bio fuels)
1% reduction 0.8% No information ESMAP-I
THAI
Technical standards 16% reduction No information ESMAP-I
Modal shift 3% reduction 2.2% No information ESMAP-I
THAI
Energy consumption in residential
Improved cook stoves
1.75 tCO2e per ICS per year Target: 40,000 ICS
290 mill Nu. NepalIEMMP
Efficient fodder cooking Target: 1,000 150 mill Nu. IEMMP
LPG stoves Target: ? 30 mill Nu. IEMMP
Solar PV
0.8 tCO2e per household per year Target:?
400 mill Nu. IEMMP
Energy efficient buildings
Target: 5,000 by 2020 1,000 mill Nu. IEMMP
Industrial processes
Limitation of production of ferro- alloys
No information
Value of increased electricity sales minus value of lost ferro-alloys sales

������������� ������������������������������������������ ��
Cement industry
Clinkers substitution by fly ash
8% McKinsey
CCS cement 260 kt CO2e / year
137 USD/tCO2e
Non-Energy
Mineral No information No information
Metal
There are alternative reducing agents but no estimates
No information No information
AgricultureLivestock 1.6 kt CO2e / year 13.5 USD/
tCO2eNon-
Energy
Rice 3.9 kt CO2e / year
4.2 USD/tCO2e
Non-Energy
Waste
Recycling 11.1 kt CO2e / year 1.2 USD/tCO2e Non-
Energy
Composting 16.2 kt CO2e / year
0.4 USD/tCO2e
Non-Energy
SELECTION CRITERIA
The criteria applied for selecting the interventions included in the low
carbon strategy and the first action plan presented in this report are as
follows:
�� The sector represents a large carbon reduction potential and/
or rapidly increasing carbon emissions in the baseline that holds
potential for mitigation;
�� Potential interventions with relatively low economic barriers, i.e.
abatement costs, exist;
�� There are few non-economic barriers i.e. conflicts with other
policies;
�� There are significant sustainability benefits such as employment,
reduced traffic congestion, or health improvements;
�� There is a ‘window of opportunity’ such as an energy efficiency
element in the building code regulating the boom in construction
of new buildings.
The baseline projection shows that the key emitting sectors in 2040 are
likely to be the following five in order of carbon emissions:
�� Industrial processes and the related energy consumption;
�� Crop production and the related energy consumption;
�� Livestock raising and the related energy consumption;
�� Urban municipal waste; and
�� Road transport related energy consumption.

������������� ��������������������������������������������
While livestock related emissions in the baseline remain relatively
constant in the period 2005-2040, the emissions of the other four
sectors grow significantly.
In addition to the abovementioned sectors the energy consumption
of the residential sector represents a ‘window of opportunity’ and high
sustainability benefits for households replacing fuel wood with hydro
power based electricity.
The recommended low carbon strategy is focused on these six areas
and the realisation of the opportunities for carbon reduction that also
provides additional benefits such as increased economic self-reliance,
employment, improved health, etc.
Finally, a critical component for all decision-making is sufficient and
reliable data and analysis of these data. At present the information
necessary to make an informed decision on an appropriate carbon
strategy is hampered by insufficient detail and lack of up-to-date
information. Amending this is an important step towards steering the
development of the nation as well as monitoring progress and efficiency
of implemented policies.
In other words the selected intervention areas included in the low
carbon strategy and action plan are as follows:
�� Energy intensive industries’ non-energy related emissions
�� Crop production
�� Livestock raising
�� Municipal solid waste
�� Road transport
�� Residential sector
�� Data improvement
�� Sequestration capacity
�� Carbon footprint.
Each individual area is described in more detail in the following section.
INTERVENTIONS IN THE LOW CARBON STRATEGY AND ACTION PLAN
The descriptions of the interventions of the low carbon strategy and
short-term action plan address where relevant the following topics:
�� Mitigation measures
�� Reduction potential
�� Abatement costs
�� Non-economic barriers
�� Sustainability benefits

������������� ������������������������������������������ ��
�� Actions
�� Suggested responsible entities
�� Time schedule.
Energy intensive industries
Industries are a major source of carbon emissions. Various fossil fuels
are used for heating and mechanical functions in the industries but the
emissions from the reducing agents (coke and coal) are even more.
The major mitigation option relating to use of fossil fuels is a requirement
for new industries to apply the best available technology with respect to
fuel type and energy efficiency.
Two major options to limit emissions from use of reducing agents in
industrial processes in the three major industries are to:
�� Limit the number of licences to exploit and process natural
resources.
�� As limitations in the number of licenses may not be in accordance
with Bhutan’s industry policy to attract new industries. Clear
and transparent requirements to use best available technology
could be an efficient way to reduce the use of coal and coke as
reducing agents in the production process.
The industrial sector is a major source of emissions in Bhutan with a
steep increase expected from 2010 to 2020. It is difficult to find valid
figures about the potential for efficiency improvements but reductions in
the size of 10-15% should not be unrealistic for the cement industry
based on figures from China21.
The abatement costs of limiting the number of licenses will be the lost
opportunities for export and employment. Industries employ a large
number of both national and non-national workers and villagers may
benefit economically from industries through employment22. These costs
will be considerable but has to balance against alternative use of
electricity and raw materials.
The abatement costs of placing strict carbon reduction requirements on
the applied technology will be considerable as new technology requires
major investments. Investments are often a barrier to introducing
new efficient technology although lifetime calculations can justify the
investment. Increased requirements to technical standards will be seen
by investors as a barrier compared to other countries that also have low
electricity prices and lower standards of requirements.
21 Analysis of Energy-Efficient Opportunities for Cement Industry in Shandung Province,
China. Lawrence Berkely National Laboratory. October 2009.
22 Audit of Industries on environmental compliance. Royal Audit Authority, October 2009
Mitigation measures
Reduction potential�
Abatement cost
������������� ��������������������������������������������
The development will depend on a political decision on what is an
acceptable level of exploitation of the national resources. There are
already instances whereby local population and local authorities have
opposed/rejected mining activities.
Today Bhutan exports natural resources such as electricity and raw
material for chemical and ferro-alloy industries. The export generates
income to the country. However, the main value addition takes place
later in the value chain outside Bhutan. A moderate exploitation of the
resources would create an opportunity for Bhutan to build up the
capacity that makes it possible to exploit a larger share of the value
chain. A slower exploitation would also be gentler towards the
environmental and social impacts.
Controlled development of energy intensive industries so as to gain
optimal societal benefits from this economic activity.
Outcomes in addition to carbon reduction:
�� The carbon emission of the energy-intensive industries
naturally depends on the number of future licenses issued.
Restricting the number of licenses may not be consistent with
the strategies to diversify the economic base and to increase
exports. A controlled development should therefore aim to
ensure employment opportunities, to develop local capacity to
exploit a larger share of value chain, to consider the available
mineral resource base of the industrial production in a long
term perspective, to limit local environmental impacts from
mining and processing, and to off-set the carbon emission
through sequestration efforts.
Suggested responsible entity in cooperation with NEC:
�� Ministry of Economic Affairs
Time schedule:
�� Immediate term (1-2 years): Further investigations on how
international standards can be applied to Bhutan to reduce
emissions and increase sustainability benefits.
�� Medium term (2-5 years): Combine licensing with various
obligations that limits carbon emissions and increases benefits;
for example obligation to provide data for assessing the carbon
footprint more accurately, to implement energy management, to
employ and train local work force etc. Investigate the possibility
for the government to demand that the licensed factories are of
a certain technological standard with highly qualified operation
(e.g. through reward schemes and education programs for
attracting and maintaining skilled labour).
Non-economic barriers
Sustainability benefits
Main action

������������� ������������������������������������������ ��
Crop production
The assessment made by UN23 identifies three main sources of carbon
emissions from crop production. The largest emitter is rice cultivation
followed by field burning of residues and use of synthetic fertilizers.
The key mitigation option is regulation of flood through multiple aeration
of areas previously under a single aeration regime.
Regulating flood in rice production is expected to have a total abatement
potential of around 90 kt CO2e from 2006 to 2030.
There are no detailed cost estimates for rice production in Bhutan but
the UN report estimates the marginal abatement costs to be around 4
USD/t CO2e.
The major non-economic barrier is a strong tradition combined with
lack of information about these options.
New rice farming system would increase the yield while reducing
emissions.
The Royal University of Bhutan has already undertaken studies of new
rice farming systems. The experience from this research is being tested
and should be expanded during the next years in combination with
awareness campaigns.
Livestock raising
Energy-related mitigation measures such as a phase-out of fodder
cooking and a fuel switch to biogas are included in the baseline projection.
According to the Second National Communication to UNFCCC the
main non-energy related emissions from livestock are mainly methane
(CH4) emissions from enteric fermentation and nitrous oxide (NO
X)
emissions from manure.
The stock of dairy and non-dairy cattle has almost been constant in
the period 1994-2009 and it is in the baseline projection assumed that
the stock will remain constant during the period 2010-2040. Emissions
of CH4 and NO
X are calculated per head of livestock per year as an
average for the years 1994-2009 and then converted to emissions of
CO2e/head/year. The annual emissions are determined by the number of
livestock and the emission factors for enteric fermentation and manure
management. The result is a constant emission of 567 kt CO2e per year
for the period 2010-2040.
23 Bhutan: Economic Analysis of Cleaner Technologies and Options in the Non-Energy Sec-
tor, Asian Development Bank, December 2010.
Mitigation options
Reduction potential
Abatement costs
Non-economic barriers
Sustainability benefits
Actions
Mitigation options

������������� �������������������������������������������
Second National Communication to UNFCCC presents a number of
options for mitigating carbon emissions from enteric fermentation and
manure management. Two key mitigation options are:
�� Enteric fermentation: Reduce livestock population by improving
yak and cattle breed. The Department of Livestock has already
initiated a program to reduce the number of cattle head and
improvement of breed.
�� Manure management: Keeping livestock in pens or stalls
(encouraging and promotion of stall feeding).
ADB24 assesses that providing urea-molasses multi-nutrient block
supplementation and urea-treatment of straw prior to feeding it to local
dairy cattle in Bhutan has a potential of major reductions in emissions
from livestock.
ADB estimates that cost of using urea-molasses multi-nutrient block
supplementation and urea-treatment of straw prior to feeding to local
dairy will be around 6-7 USD/t CO2e which is rather a low cost. There
are no estimates of the potential reduction impact available for the two
other mitigation options.
The major non-economic barrier is a strong tradition combined with
lack of information about the options.
Through manure management farmers can utilise manure from the
livestock for biogas production that could be used for cooking and
lighting. The Ministry of Agriculture is currently managing a programme
for promoting manure management and use of biogas.
Both identified mitigation options, reducing the number while improving
the breed and manure management, are option already under
preparation and implementation by Ministry of Agriculture. The efforts
should be further pursued so as to obtain the benefits from improved
household income and reduced emissions.
Municipal solid waste
Methane emissions from landfills must be captured and utilised and/or
the volume of waste must be reduced either by recycling or composting.
Till date no studies have been undertaken to assess the potential of
utilising methane in Bhutan but ADB25 has studied two options of
reducing volumes of solid waste: Recycling and composting.
24 Bhutan: Economic Analysis of Cleaner Technologies and Options in the Non-Energy
Sector, Asian Development Bank, December 2010.
25 Bhutan: Economic Analysis of Cleaner Technologies and Options in the Non-Energy
Sector, Asian Development Bank, December 2010
Mitigation options
Abatement cost
Non-economic barriers
Sustainability benefits
Actions
������������� ������������������������������������������ ��
ADB calculates the reduction potential from recycling at around 18%
per year and around 25% from composting. The government has taken
some initiatives by building composting plants.
The ADB study calculates abatement costs for recycling at 1.18 USD/t
CO2e and 0.42 USD/t CO
2e for composting. These are rather low
abatement costs.
No non-economic barriers have been identified.
There will always be a potential risk of pollution from a landfill so
reduction of volumes at the landfill will provide environmental and
health benefits.
Limiting the production of municipal solid waste and exploiting the
waste efficiently through composting and capture of emissions for
energy. Awareness and information campaigns should aim to limit waste
production but also to further collection of waste for exploitation.
Outcomes in addition to carbon reduction:
�� Reduced need for land fill space for depositing waste
�� Compost for agricultural production
�� Reduced waste in the surroundings.
�� Additional energy source
Suggested responsible entities in cooperation with NEC:
�� Ministry of Works and Human Settlement
�� Local authorities of the urban areas.
Time schedule:
�� Immediate term (1-2 years): Establish system of composting of
market waste (as in Thimphu) and municipal waste collection in
all urban areas.
�� Subsequent term (3-5 years): Feasibility study of biogas
possibilities in the largest cities.
Road transport
The emissions from the road transport are also expected to increase
from 2010 to 2040 with the increasing demand for transport services
following the economic development.
The following mitigation measures have been suggested in the 2040
Transport Strategy by ADB:
�� Decreasing the number of vehicles as a result of increasing
prices of cars (elimination of tax exemption for public servants)
and increasing fuel prices (CO2 tax).
Actions
Mitigation measures

������������� ��������������������������������������������
�� Time limitation and fee for parking in urban areas.
�� Regulation of taxis (highly efficient and electric cars).
�� Improved efficiency in the stock of vehicles.
�� Upgrading pedestrian and cycling facilities.
�� Increased share of electrical cars in the stock of vehicles.
�� Improved public transport (safe, affordable and responsive to
demand).
�� Improved traffic engineering and management techniques
Some of the measures could be implemented and enforced within a
short time perspective while implementation of others will require longer
time. The 2040 Transport Strategy also recommends strengthening the
organisational structure and role distribution among the institutions of
the transport sector.
Given the mountainous terrain, transport of goods through ropeways
must be explored. Especially in ecologically sensitive areas, ropeways
should be considered for transport of both goods and people.
According to the 2040 Transport Strategy it can be expected that a
further reduction in carbon emissions of around 15% should be feasible
up to 2040.
Interventions such as taxes/fees and technical standards have relatively
low abatement costs while fuel shift and modal shift have higher
abatement costs.
Non-economic barriers are relatively high including potential conflicts
with the “access to quality transport service by all” policy and a general
reluctance against taxes.
The sustainability benefits are relatively high including reduced congestion
and need for parking space in urban areas, reduced number of injuries
and improved air quality.
Curbing the increase in driving short distances to the benefit of walking
and bicycling is an important component of a transport solution that
will also bring about health and social benefits. Ropeways would besides
reducing the number of heavy duty trucks also reduce the threats to loss
of habitat and species especially in the ecologically sensitive areas. Other
environmental damage associated with road construction can also be
avoided.
A well functioning transport sector is vital to social cohesion and
economic development of any nation. Transport system in the country
has been expanding and with increased income levels the number of
Reduction potential
Abatement costs
Non-economic barriers
Sustainability benefits
Actions

������������� ������������������������������������������ ��
vehicles too is increasing. . A wide portfolio of interventions is required
in order to steer development in a sustainable direction: Minimum
efficiency standards on imported vehicles, regular vehicle inspection,
taxation on purchase of vehicles and fuel consistent with sustainability
strategies, facilities for charging of electric vehicles, intelligent transport
logistics, parking restrictions, safe and easy opportunities for walking and
bicycling, and well-functioning, convenient and comfortable public
transport. A pilot trial of electric vehicles for example in urban areas may
pave the way for a wider dissemination. Feasibility studies on introduction
of ropeways must also be initiated. Modal shift interventions may be
combined with promotion campaigns to encourage a change in habit
and prestige. Sustainability aims should be aligned with the overall aim of
providing “access to quality transport services for all”.
The demand for transport services can also be restrained through
careful holistic urban planning that places transport of people and goods
in focus instead of vehicle access and incentivises people to drive less
and at the same time provides attractive alternatives.
Furthermore, it should be kept in mind that a significant amount of
transport in rural areas today is non-motorised. Good access for people
and goods to public transport or other affordable transport solutions
in rural areas should also be given high priority in order to ensure rural
development.
Outcomes in addition to carbon reduction:
�� Improved air quality and health
�� Limitation of congestion
�� Improved live-ability.
Suggested responsible entity in cooperation with NEC:
�� Ministry of Information and Communication
�� Municipalities of major urban areas
�� Ministry of works and Human Settlement (for environmentally
friendly road construction)
Time schedule:
�� Immediate term (1-2 years): Parking fees, tax revision with
elimination of tax exemption on import of cars, and/or parking
fees could increase government revenue which could be
earmarked for a modal shift. Improvement of public transport
offer. Promotion of walking and bicycling for short journeys.
Fully integrating transport issues in urban planning work.
�� Subsequent term (3-5 years): Pilot test of electric vehicles –
both cars and busses.

������������� ��������������������������������������������
Residential sector
Existing reports list the following mitigation measures:
�� Promotion of efficient/improved cook stoves
�� Promotion of efficient LPG stoves
�� Promotion of solar PV
�� Promotion of solar water heating systems
�� Targeting building energy efficiency.
Regarding energy demand for the residential sector IEMMP focuses on
reducing fuel wood share in the residential sector by introducing high
efficient cook stoves and switching to modern fuels like LPG, electricity,
solar and biogas. These are highly efficient measures to reduce the fuel
wood share of residential energy consumption but the impact on net
CO2e emissions will depend on the changes in forest and other woody
biomass stocks as recorded in the national communications. There are,
however, other reasons that justify limiting the use of these such as health
concerns and increasing pressure on possibly limited biomass resources.
In 2005, the total consumption of fuel wood in the residential sector
was 490 kt. In the Business as Usual regime, the study assessed that fuel
switch will result in a reduction of 200 kt in 2020 or a reduction by almost
40%. This reduction in fuel switch is mainly due to rural electrification
programme and a switch towards LPG. Improved cooking stoves would
result in additional reduction of 100 kt fuel wood by 2020 or a further
reduction of 20% in an energy efficiency scenario.
� ,��������/��!������
A very good example of the benefits derived from improved cooking
stove is as follows. Centre for Rural Technology, Nepal (CRT/N) is
implementing an improved cooking stove programme in Nepal funded
by DANIDA and Government of Nepal. The programme started more
than 10 years ago and has resulted in more than 100,000 improved
cooking stoves introduced in Nepal. Recently CRT/N has participated in
a registered carbon offsets programme. Under this programme CRT/N
has worked with local partners to install 1,500 improved cooking stoves.
The total project grant was about 18,100 USD and estimated carbon
reductions are 1.75 t CO2e per year per improved cooking stove.
��� �������+��������
Use of LPG as cooking fuel is common in urban areas. The main barriers
to dissemination into rural areas are poor infrastructure and high cost
of transportation. A rural household with an LPG cooking stove uses
around 50 kg LPG per year which corresponds to 0.16 t CO2e.
Mitigation measures
������������� ������������������������������������������ ��
��� �������������4
Solar PV will mainly replace kerosene as a source of lighting. Today
about 3,000 households have solar PV systems. A rural household uses
around 300 litres of kerosene per year for lighting which corresponds
to 0.8 t CO2e per year. If this consumption replaced by electricity
from hydropower/solar PV the carbon reductions are 0.8 t CO2e per
household connection per year.
��� ������������������������
Solar water heating systems save electricity and fuel wood used for
heating water and space heating. While solar water heating for hot water
is quite widely used in many countries, solar water heated space heating
is relatively low or non-existent in Bhutan. Data on existing systems can
together with pilot tests of various models form the basis for greater
application. The possibilities for further expansion of use and organising
local production of the technologies would provide new business and
employment opportunities.
���!���(�����"������!�
Bhutan has a design code of buildings to secure and maintain a cultural
building tradition but codes are lacking in terms of energy efficiency.
All of the listed mitigation opportunities (see Table 29) have an added
benefit in the form of improved living conditions and health. Higher
energy efficiencies and electrification saves time for fuel collection and
transportation. Solar PVs can provide access to electric end-uses for
households otherwise without reach of the electric grid and further an
informed and politically active population.
Building regulations already exist that address e.g. the cultural heritage
aspects of building construction. It would be a logic step to include
energy efficiency as well as safety aspects in the building regulations.
However, to create the necessary legislation is the easiest element
– upgrading the skills of the building entrepreneurs and the building
workers as well as equipping the inspectors with the necessary know-
how to verify whether or not building regulations are met is quite a
different and significant task. Increased costs of energy efficient measures
also act as barriers to adopting the necessary measures. The challenge is
augmented by the fact that urban areas at present experience a building
boom which gives certain urgency if the ‘window of opportunity’ is to
be exploited at lowest possible cost to society. A building will remain in
function for many decades.
Non-energy benefits

������������� ��������������������������������������������
�����9!(���������������,�����#����-������������/�#������%���������������#*
Opportunity Added benefit Non-economic barriers
Improved stoves HealthLess time consuming
PVHealthLess time consumingAccess to electric end-uses
Outlets and transportMaintenance
Solar water heatersHealthLess time consumingNo fuel expenses
Outlets and transport
Building regulation addressing energy efficiency
HealthLess time consuming
Lack of skillsLack of materialsEnforcement (especially during building boom)
Promote fuel shift from fossil fuels to hydro-power based electricity and
other renewable energy sources; limit future need for energy; and
facilitate energy efficient choices within the tertiary and residential
sector.
A fuel shift is greatly helped by access to electricity whether from
the national grid or smaller systems. Solar heating will in combination
with sustainable fuel wood, sustainable briquettes and biogas be main
contributors to a diversified supply. Minimum standards, labelling,
information campaigns and access to best-available-technologies
contribute to minimising future energy need. Here an important area is
building regulations and enforcement of these. National or local authorities
may for example require that certain building types be equipped with
solar heating for hot water and/or space heating and that the structure
be designed so as to minimise the need for space cooling. Studies on
energy characteristics of buildings adhering to traditional elements in
building design whilst accommodating a modern life style are needed
to ensure a high quality building stock. Such studies could be linked to
research on how to secure the buildings against earth quakes. Another
important aspect is training and upgrading of the qualifications of the
construction sector as well as those enforcing the building regulations.
The efforts of the tourist industry could be used as a front runner.
Outcomes in addition to carbon reduction:
�� Reduced vulnerability to changes in fossil fuel prices.
�� Limit dependence on import of energy (through higher share
of local energy resources).
�� Contribute to minimising rural-urban migration. Improved living
standards and business opportunities through affordable access
to clean energy.
�� Improved health (reduced smoke).
�� Skilled construction workers.
Actions

������������� ������������������������������������������ ��
�� A modern Bhutanese building tradition.
�� Visibility of Brand Bhutan to both guests and local inhabitants.
Suggested responsible entities in cooperation with NEC:
�� Ministry of Works and Human Settlement
�� Municipalities of major urban cities
�� Division of Renewable Energy and Division of Energy Efficiency
and Conservation under the Department of Energy, Ministry of
Economic Affairs.
Time schedule:
�� Immediate term (1-2 years): Intervention in particular in
the building sector is urgent in order to use the window of
opportunity that the building boom provides. Testing of solar
hot water heating and solar space heating technologies in
order to adapt these to the Bhutanese needs and prepare
local production, installation and maintenance capacity of these
technologies.
�� Subsequent term (3-5 years): Enforce minimum energy
efficiency standards on electric appliances and cooking stoves.
Information campaign to sensitise the population and businesses
to energy efficient purchase and use.
Data on sequestration capacity
Detailed mapping of sequestration capacity and development including
both agriculture and forestry aspects is an important tool in managing
the resources sustainably while contributing to economic development
within these sectors. Such mapping is closely linked to the development
possibilities of the agricultural and forestry productions.
Outcomes in addition to carbon reduction:
�� Improved validity of the “upper limit” for carbon emission if
carbon neutrality is to be maintained.
�� Identification of possibilities for sustainable fuel wood
exploitation.
�� Identification of the need and possibilities for developing carbon
efficient crop production.
Systemised monitoring at regular intervals
Suggested responsible entity in cooperation with NEC:
�� Ministry of Agriculture and Forests
Time schedule:
�� Immediate term (1-2 years): Complete the already planned
and partially initiated National forest Inventory to enable the
assessment of current and future sequestration capacity and
������������� ��������������������������������������������
measures to realise this. Establish monitoring system and
organisation.
�� Subsequent term (3-5 years): Information campaign and
targeted education program targeting the rural population and
those employed in the agricultural and forestry sectors.
Data on carbon footprint
Carbon emission must remain below the sequestration capacity as
committed by the RGoB at COP15.In order to assess whether this is
the case it is necessary to expand and improve the data on the carbon
footprint of the various economic sectors, in particular the industrial
sector and the tertiary sector. Inspiration can be found within the
tourism industry. Of special interest to Bhutan would be the carbon
footprint from import-export activities which could be given increased
focus. This is due to the fact that the regional carbon impact from the
planned increase in electricity exports by far outbalances the carbon
footprint from the planned increase in industrial output.
The carbon mapping can be devised in steps starting with a certain
segment of the economy and then gradually expanding to include more.
This will allow development of a method that can provide the necessary
information with a minimum of bureaucracy. Important for the general
acceptance of the need to provide data to the authorities is to use the
collated data to analyse aspects of relevance to the contributors.
Outcomes in addition to carbon reduction:
�� Sound foundation for informed decision-making and policy
design.
�� Possibility for branding of sectors as “green”.
Suggested responsible entity in cooperation with NEC:
�� National Statistics Bureau
Time schedule:
�� Immediate term (1-2 years): Devise mapping system and
conduct pilot test of the system. Further analysis of the
interventions of the short term action plan among other with
the aim to determine costs and specific impact targets.
�� Subsequent term (3-5 years): Establish sample data collection
routines and for selected sectors data reporting obligation.
Recommended next steps
An overview of the recommended interventions of the short-term
action plan can be found in Table 30.
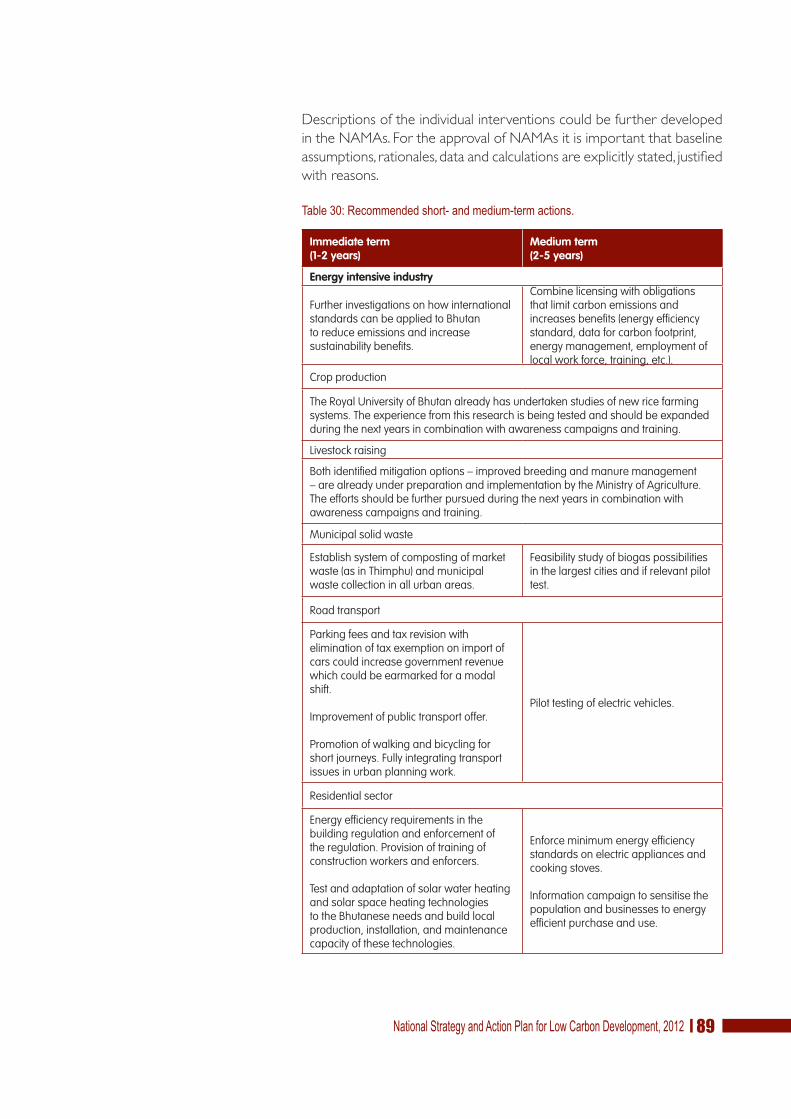
������������� ������������������������������������������ ��
Descriptions of the individual interventions could be further developed
in the NAMAs. For the approval of NAMAs it is important that baseline
assumptions, rationales, data and calculations are explicitly stated, justified
with reasons.
����8�!5����������#-���%�������,�%����������#*
Immediate term (1-2 years)
Medium term (2-5 years)
Energy intensive industry
Further investigations on how international standards can be applied to Bhutan to reduce emissions and increase sustainability benefits.
Combine licensing with obligations that limit carbon emissions and increases benefits (energy efficiency standard, data for carbon footprint, energy management, employment of local work force, training, etc.).
Crop production
The Royal University of Bhutan already has undertaken studies of new rice farming systems. The experience from this research is being tested and should be expanded during the next years in combination with awareness campaigns and training.
Livestock raising
Both identified mitigation options – improved breeding and manure management – are already under preparation and implementation by the Ministry of Agriculture. The efforts should be further pursued during the next years in combination with awareness campaigns and training.
Municipal solid waste
Establish system of composting of market waste (as in Thimphu) and municipal waste collection in all urban areas.
Feasibility study of biogas possibilities in the largest cities and if relevant pilot test.
Road transport
Parking fees and tax revision with elimination of tax exemption on import of cars could increase government revenue which could be earmarked for a modal shift.
Improvement of public transport offer.
Promotion of walking and bicycling for short journeys. Fully integrating transport issues in urban planning work.
Pilot testing of electric vehicles.
Residential sector
Energy efficiency requirements in the building regulation and enforcement of the regulation. Provision of training of construction workers and enforcers.
Test and adaptation of solar water heating and solar space heating technologies to the Bhutanese needs and build local production, installation, and maintenance capacity of these technologies.
Enforce minimum energy efficiency standards on electric appliances and cooking stoves.
Information campaign to sensitise the population and businesses to energy efficient purchase and use.

������������� �������������������������������������������
Data on sequestration
Complete the already planned and partially initiated National Forest Inventory to enable the assessment of current and future sequestration capacity and measures to realise this. Establish monitoring system and organisation.
Information campaign and education program targeting the rural population and those employed in the agricultural and forestry sectors.
Data on carbon footprint
Devise mapping system and conduct pilot test of carbon footprint data system.
Further analysis of the interventions of the short-term action plan among other with the aim to determine costs and specific impact targets.
Establish sample data collection routines and test for selected sectors a data reporting obligation.
Much of the required initiatives to drive the development of the country
down a low carbon path are already in place or being discussed and
negotiated. Substantial work in terms of creating the necessary legislative
and organisational framework has been carried out.
The greatest challenge that remains is probably the implementation of
agreed legislation and projects while upholding strict enforcement of
legislation and coordination of initiatives.
Access to reliable, detailed and up-to-date information is critical for
monitoring progress and cost-efficiency of policies and for underpinning
NAMAs. A coordinated development of the data collection systems is
required to avoid unnecessary bureaucracy and ensure a uniform quality.
Such a task is best handled by a national institution such as NSB.

������������� ������������������������������������������ ��
Reference list1��� ����
�� Eleventh round table meeting – turning vision into reality: The development challenges confronting
Bhutan, 1-2 September 2011, Gross National Happiness Commission, 2011.
�� Bhutan Urban Transport Study, International Finance Corporation, September 2011.
�� Bhutan Transport 2040: Integrated Strategic Vision, Asian Development Bank, August 2011.
�� Draft 2nd GHG emissions inventory and explanatory notes, NEC, July 2011.
�� Bhutan renewable energy policy 2011, draft, RGoB, 2011.
�� Bhutan: Energy sector, Asian Development Bank, August 2010.
�� National forest policy of Bhutan 2010, Ministry of Agriculture and Forests, March 2010.
�� Various data sets from the National Statistics Bureau of Bhutan, 2010.
�� Economic development policy of the Kingdom of Bhutan, 2010, RGoB, 2010.
�� Historical and forecast GDP figures 2001-2020, Ministry of Finance, originally produced by National
Statistics Bureau of Bhutan, 2010.
�� The Waste Prevention and Management Act of Bhutan 2009
�� Bhutan Millennium Development Goals – Needs assessment and costing report (2006-2015), Planning
Commission, RGoB, and November 2007.
�� Population Projections Bhutan 2005-2030, National Statistics Bureau of Bhutan, July 2007.
�� Energy Data Directory 2005, prepared by TERI for the Department of Energy, Ministry of Economic
Affairs, 2005.
�� Integrated Energy Management Master Plan, prepared by TERI for the Department of Energy, Ministry
of Economic Affairs, 2005.
�� Vision 2020 – Bhutan 2020: A Vision for Peace, Prosperity and Happiness, Part I and II, Planning
Commission, RGoB, May 1999.
�� CO2 Baseline Database for the Indian Power Sector, User Guide Version 5.0, Central Electricity
Authority, Ministry of Power, Government of India, November 2009.
5�"�����
�� The UNFCCC CDM Website, http://cdm.unfccc.int/
�� UNFCCC (2010), The Kyoto Protocol Mechanisms. Available at, http://cdm.unfccc.int/about/cdm_
kpm.pdf
�� The CDM/JI Pipeline Analysis and Database, http://cdmpipeline.org/
�� UNFCCC, Report of the Conference of the Parties, on its thirteenth Session, Bali, 3-15 December
2007. Available at, http://unfccc.int/resource/docs/2007/cop13/eng/06a01.pdf#page=3
�� The Conference of Parties. Copenhagen Accord. Available at, http://www.denmark.dk/NR/rdonlyres/
C41B62AB-4688-4ACE-BB7B-F6D2C8AAEC20/0/copenhagen_accord.pdf
�� Intergovernmental Panel on Climate Change, http://www.ipcc.ch/publications_and_data/ar4/wg1/en/
ch2s2-10-2.html
�� UN programme for Reducing Emissions from Deforestation and Forest Degradation (REDD) http://
un-redd.com/AboutREDD/tabid/582/Default.html
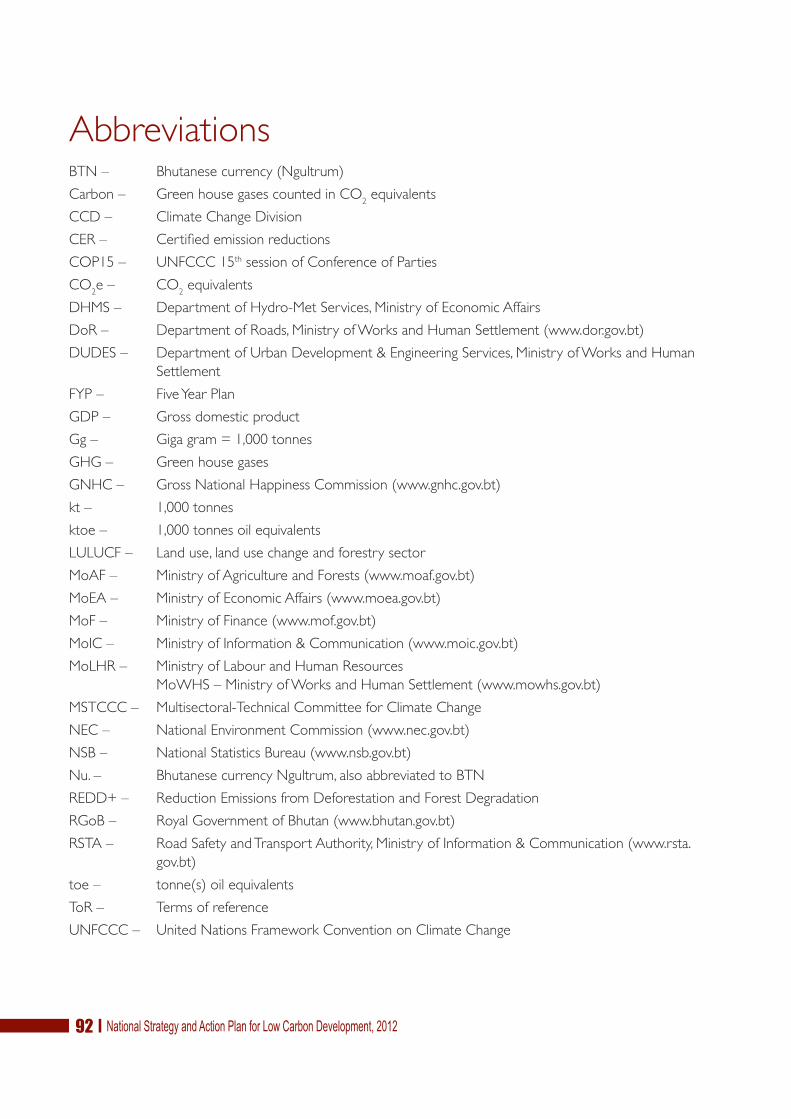
������������� ��������������������������������������������
AbbreviationsBTN – Bhutanese currency (Ngultrum)
Carbon – Green house gases counted in CO2 equivalents
CCD – Climate Change Division
CER – Certified emission reductions
COP15 – UNFCCC 15th session of Conference of Parties
CO2e – CO
2 equivalents
DHMS – Department of Hydro-Met Services, Ministry of Economic Affairs
DoR – Department of Roads, Ministry of Works and Human Settlement (www.dor.gov.bt)
DUDES – Department of Urban Development & Engineering Services, Ministry of Works and Human
Settlement
FYP – Five Year Plan
GDP – Gross domestic product
Gg – Giga gram = 1,000 tonnes
GHG – Green house gases
GNHC – Gross National Happiness Commission (www.gnhc.gov.bt)
kt – 1,000 tonnes
ktoe – 1,000 tonnes oil equivalents
LULUCF – Land use, land use change and forestry sector
MoAF – Ministry of Agriculture and Forests (www.moaf.gov.bt)
MoEA – Ministry of Economic Affairs (www.moea.gov.bt)
MoF – Ministry of Finance (www.mof.gov.bt)
MoIC – Ministry of Information & Communication (www.moic.gov.bt)
MoLHR – Ministry of Labour and Human Resources
MoWHS – Ministry of Works and Human Settlement (www.mowhs.gov.bt)
MSTCCC – Multisectoral-Technical Committee for Climate Change
NEC – National Environment Commission (www.nec.gov.bt)
NSB – National Statistics Bureau (www.nsb.gov.bt)
Nu. – Bhutanese currency Ngultrum, also abbreviated to BTN
REDD+ – Reduction Emissions from Deforestation and Forest Degradation
RGoB – Royal Government of Bhutan (www.bhutan.gov.bt)
RSTA – Road Safety and Transport Authority, Ministry of Information & Communication (www.rsta.
gov.bt)
toe – tonne(s) oil equivalents
ToR – Terms of reference
UNFCCC – United Nations Framework Convention on Climate Change

������������� ������������������������������������������ ��
Annex 1 – Stakeholder Consultation
Early consultation – and active involvement where relevant – in strategy development is critical to stakeholder
acceptance of the vision outlined in the national strategy and for the realisation of the ensuing projects. In
accordance with the ToR two rounds of stakeholder consultations was carried out during the project with the
aim to
�� identify possible data sources,
�� identify key concerns and interests of the stakeholders,
�� solicit ideas for short-term actions,
�� confirm relevance of the chosen scenarios,
�� discuss modelling results, and
�� discuss recommendations.
��������/�������������������
Monday 5th September 2011
Dasho Dr. Ugyen Tshewang, Secretary, National Environment Commission (NEC)
Ms. Peldon Tshering, Chief, PPS, NEC
Mr. Wangchuk Namgay, Senior Planning Officer, Gross National Happiness Commission (GNHC)
Mr. Tashi Dorji, Chief Livestock Officer, Department of Livestock
Mr. Kinley Tshering, Chief Forestry Officer, Forest Resources Development Division (FRDD), Department of
Forest & Park Services, MoAF
Mr. Chencho Norbu, Director, Department of Agriculture, MoAF
Mr. Henrik A. Nielsen, Head of Representation Office, Thimphu, Representation Office of Denmark
Tuesday 6th September 2011
H.E. Khandu Wangchuk, Minister, Ministry of Economic Affairs (MoEA)
Dasho Sonam Tshering, Secretary, Ministry of Economic Affairs (MoEA)
Mr. Mewang Gyeltshen, Offtg. Drector, Department of Energy, MoEA
Mr. Tandin Tshering, Director, Department of Industry, MoEA
Mr. Loknath Chhetri, Industry Specialist, MoEA
Mr. Wangchuk Loday, Planning Officer, MoEA
Dasho Kinley Dorji, Secretary, Ministry of Information & Communication (MoIC)
Mr. Bhimlal Subedi, Chief Planning Officer, Ministry of Information & Communication (MoIC)
Mr. Karma Pemba, Chief Transport Officer, Road Safety & Transport Authority (RSTA)
Mr. Namgay Wangchuk, Chief Engineer, Road Safety & Transport Authority (RSTA)
Mr. Phub Tshering, Secretary General, Bhutan Chamber of Commerce & Industry

������������� ��������������������������������������������
Wednesday 7th September 2011
Dasho Sonam Tenzin, Secretary, Ministry of Works & Human Settlement
Mr. Ichharam Dulal, Department of Urban Development & Engineering Services
Mr. Tandin, Department of Urban Development & Engineering Services
Dasho Kinlay Dorjee, Thrompon (Mayor), Thimphu Municipality
Visit to DSB shop (solar appliances)
Mr. Lekzang, Chief Planning Officer, Policy & Planning Division, Ministry of Finance.
Multisectoral Technical Committee on Climate Change:
�� Mr. Sonam Dendup, Sr. Planning Officer, MOIC
�� Mr. Jamyang Phuntshok, Head, Climate & Water Section, Watershed Management Division, Dept. of
Forest and Park Services
�� Mr. Karma P Dorji, Executive Engineer, Dept. of Energy
�� Ms. Peldon Tshering, Head, Policy & Planning Services, NEC
�� Mr. Thinley Namgyel, Head, Environment Monitoring Division, NEC
�� Mr. Phuntsho Pelgay, Geologist, Department of Geology & Mines (DGM) (On behalf of Ms. Pem Deki,
Geologist, DGM)
�� Mr. Phuntsho Namgyal, Hydro-met Services Division (HMSD), Dept. of Energy (On behalf of Mr.
Karma Dupchu, Head, HMSD)
�� Mr. Tandin, Ministry of Works & Human Settlement (MOWHS) (On behalf of Ms. Daw Zam, Dy. Chief
Environment Officer, PPD, MOWHS)
UNDP, Bhutan
Mr. Karma L. Rapten, Head of Unit, Energy, Environment and Disaster Cluster
Ms. Anne Erica Larsen, Programme Analyst, Energy, Environment and Disaster Cluster
Mr. Yeshey Penjor, Climate Change Policy Specialist
Thursday 8th September 2011
Mr. Kuenga Tshering, Director, National Statistics Bureau (NSB)
Mr. Dago Tshering, Environment Education Officer, Royal Society for Protection of Nature (RSPN)
Ms. Rinchen Wangmo, Program Manager, Royal Society for Protection of Nature (RSPN)
Officiating Managing Director (Head of Civil Division), Construction Development Corporation Ltd
Mr. H.P. Phuyel, Sr. Manager, Construction Development Corporation Ltd
Mr. Cheku Drukpa, General Secretary, Construction Association of Bhutan
Mr. Karma Lotey, Managing director, Yangphel Adventure Travel, on behalf of the Hotel Association of Bhutan
Mr. Sonam Dorji, General Secretary, Association of Bhutanese Tour Operators (ABTO)

������������� ������������������������������������������ ��
Monday 12th September 2011
H.E. Dr. Pema Gyamtsho, Minister-In-Charge, NECS & Minister, Ministry of Agriculture & Forest
Sonam Tashi, Senior Planning Officer, Policy & Planning Division, Ministry of Economic Affairs
.��������/�������������������
Thursday 3rd November 2011
Dasho Dr. Ugyen Tshewang, Secretary, NEC
Mr. Tandin Tshering, Director, Dept of Industry (DoI)
Mr. Chencho Norbu, Director, Dept of Agriculture (DoA)
Mr. Yonten Phuntsho, Forestry Officer, Dept of Forest & Park Services (DoFPS)
Mr. Phuntsho Namgyal, Deputy Executive Engineer, HMSD, Dept of Energy (DoE)
Mr. Dago Tshering, RO, RSPN
Mr. HP Phuyel, Sr. Manager, Construction Development Corporation Limited (CDCL)
Mr. Phuntsho Pelgay, Geologist, Dept of Geology & Mines (DGM)
Ms. Dechen Yangden, Executive Engineer, Dept of Urban Development & Engineering Services (DUDES)
Mr. G.K Chhopel, Chief, Water Resources Coordination Division, NEC
Ms. Peldon Tshering, Chief, PPS, NEC
Mr. Sonam Dorji, General Secretary, Association of Bhutanese Tour Operator
Mr. Sonam Tenzin, National Statistical Bureau
Mr. Karma L Rapten, ARR (P), UNDP, Bhutan
Mr. Chhimi Rinzin, Chief Agriculture Officer, DoA
Mr. Wangchuk Namgay, Sr. Planning Officer, GNHC
Mr. Karma Tshering, Planning Officer, NEC
Mr. Tshering Tashi, Communication Officer, NEC
Ms. Tshewang Zangmo, Planning Officer, NEC
Ms. Jigme Zangmo, Technician, NEC
Ms. Sonam Lhaden Khandu, Climate Change Unit, NEC
Mr. Sonam Dagay, Climate Change Unit, NEC

������������� ��������������������������������������������
Annex 2 – Scenario model training
It has been important that the experiences gained through the strategic planning process of the task outlined
in the ToR is retained within NEC and that selected stakeholders so that relevant staff possess the capacity to
operate and modify the economic and emissions model applied for the strategic planning.
The aim of the scenario model training carried out in relation to the scenario modelling for the long-term
national strategy and short-term action plan has thus been to enable Bhutanese experts to use, maintain, and
expand the model.
The topics covered during the training as part of the capacity building were:
�� Input data and assumptions;
�� Operation and maintenance of the model;
�� Scenario analysis construction and interpretation of output.
The training took place Wednesday 2nd November 2011 and the persons that received training in the model were:
�� Mr. Naitan Wang Chek, Deputy Chief, Livestock Officer, Ministry of Agriculture
�� Mr. Birkha B. Chheti, General Secretary, Association of Bhutan Industries
�� Ms. Sonam Pem, Project Director, Tarayana Foundation
�� Ms. Roseleen Gurung, Project Officer, Tarayana Foundation
�� Mr. Dawa Chhoedron, Deputy Executive Engineer, Renewable Energy Division, Department of Energy,
Ministry of Economic Affairs
�� Mr. Chhimi Dorji, Deputy Executive Engineer, Hydro Meteorological Service Division, Department of
Energy, Ministry of Economic Affairs
�� Ms. Jigme Zangmo, NEC
�� Mr. Tshering Tashi, CCD, NEC
�� Mr. Karma Tshering, NEC
�� Ms. Sonam Lhaden Khandu, CCD, NEC
�� Mr. Sonam Dagay, CCD, NEC.

������������� ������������������������������������������ ��
Annex 3 – List of reviewers
�� Mr. Wangchuk Namgay, Sr. Planning officer, GNHC
�� Mr. Thinley Namgyel. Head, EMD, NECS
�� Mr. Sonam Dendup, Sr. Planning officer, PPD, MoIC
�� Mr. Kinzang, Chief, International organizations Division, MFA
�� Mr. Birkha B Chhetri, General Secretary, Association of Bhutanese industries, P/ling
�� Mr. Jamyang Phuntshok, Sr. Meteorology Officer, WMD, DoFPS, MoAF
�� Mr. Karchen Dorji, Environmental unit, DoI, MoEA
�� Mr. Chhimi Rinzin, Chief Agriculture Officer, DoA, MoAF
�� Mr. Peldon Tshering, Head, PPS, NECS
�� Ms. Daw Zam, Dy. Chief Environment Officer, PPD, MoWHS
�� Mr. Karma P Dorji, Offtg. Head, PCD, Dept. of Hydropower & Power Systems, MoEA
�� Mr. Dago Tshering, Research Officer, RSPN
�� Mr. Karma Toeb, Glaciologist, DGM, MoEA
�� Ms. Chime Paden Wangdi, General Secretary, Tarayana Foundation
�� Mr. Tshering Wangchuk, Asst. Program Officer, DDM, MoHCA
�� Mr. Karma Dupchu, Department of Hydro-meteorological Services, MoEA
�� Dr. Tashi Dorji, Chief, Diary Development Division, DoL, MoAF
�� Mr. Kado Zangpo, Chief Planning Officer, PPD, MoH
�� Mr. Tandin Tshering, Director, Dept of Industry (DoI)
�� Mr. Chencho Norbu, Director, Dept of Agriculture (DoA)
�� Mr. Yonten Phuntsho, Forestry Officer, Dept of Forest & Park Services (DoFPS)
�� Mr. Chhimi Dorji, Deputy Executive Engineer, Hydro Meteorological Service Division, Department of
Energy, Ministry of Economic Affairs
�� Mr. Phuntsho Namgyal, Deputy Executive Engineer, HMSD, Dept of Energy (DoE)
�� Mr. Dago Tshering, RO, RSPN
�� Mr. HP Phuyel, Sr. Manager, Construction Development Corporation Limited (CDCL)
�� Mr. Phuntsho Pelgay, Geologist, Dept of Geology & Mines (DGM)
�� Mr. Ichharam Dulal, Department of Urban Development & Engineering Services
�� Ms. Dechen Yangden, Executive Engineer, Dept of Urban Development & Engineering Services
(DUDES)
�� Mr. G.K Chhopel, Chief, Water Resources Coordination Division, NEC
�� Mr. Sonam Dorji, General Secretary, Association of Bhutanese Tour Operator

������������� ��������������������������������������������
�� Mr. Sonam Tenzin, National Statistical Bureau
�� Mr. Karma L Rapten, ARR (P), UNDP, Bhutan
�� Mr. Yeshey Penjor, Climate Change Policy Specialist, UNDP
�� Ms. Sonam Lhaden Khandu, CCD, NEC
�� Mr. Sonam Dagay, CCD, NEC
�� Mr. Tshering Tashi, CCD, NEC