National Report Discovering the archaeologists of Italy 2012-2014
179
1 Discovering the Archaeologists of Italy 2012-14 Eds. Alessandro Pintucci and Elisa Cella, translation by Domenica Pate Confederazione Italiana Archeologi Published by Confederazione Italiana Archeologi 2014
Transcript of National Report Discovering the archaeologists of Italy 2012-2014
1
Discovering the Archaeologists of Italy 2012-14
Eds. Alessandro Pintucci and Elisa Cella, translation by Domenica Pate Confederazione Italiana Archeologi
Published by Confederazione Italiana Archeologi 2014
2

3
This work is licensed under the Creative Commons Attribution 3.0 Unported License. To view a copy of this license, visit http://creativecommons.org/licenses/by/3.0/ or send a letter to Creative
Commons, 444 Castro Street, Suite 900, Mountain View, California, 94041, USA.
Under the terms of this licence, you are free:
• to Share - to copy, distribute and transmit the work • to Remix – to adapt the work • to make commercial use of the work
Under the following conditions:
• Attribution — You must attribute the work in the manner specified by the author or licensor (but not in any way that suggests that they endorse you or your use of the work).
With the understanding that:
• Waiver — Any of the above conditions can be waived if you get permission from the copyright holders.
• Public Domain — Where the work or any of its elements is in the public domain under applicable law, that status is in no way affected by the licence.
• Other Rights — In no way are any of the following rights affected by the licence: • Your fair dealing or fair use rights, or other applicable copyright exceptions
and limitations; • The authors’ moral rights; • Rights other persons may have either in the work itself or in how the work is
used, such as publicity or privacy rights.
Notice — For any reuse or distribution, you must make clear to others the licence terms of this work.
The publisher has used its best efforts in preparing this book, and the information provided herein is provided "as is." Confederazione Italiana Archeologi makes no representation or warranties with
respect to the accuracy or completeness of the contents of this book and specifically disclaims any implied warranties of merchantability or fitness for any particular purpose and shall in no event be liable for any loss of profit or any other commercial damage, including but not limited to special,
incidental, consequential, or other damages.
ISBN 978-88-903189-3-2
This project acted as the Italian component of the transnational Discovering the Archaeologists of Europe 2012-14 project, which was administered by York Archaeological Trust with financial support from the Lifelong Learning Programme of the European Commission. This report reflects the views only of the authors, and the Commission cannot be held responsible for any use which may be made of the information contained therein.
4
Contents Figures 6Tables 9Bibliography 10
Dossier and studies 10Papers 10Legal references 11Webography 12
About the authors 13Summary of results 15
Estimated number of archaeologists working in Italy 15Age, gender, disability status and country of origin 15Estimated numbers working in each job type 16Geographical distributions of the answers 18Average salaries 19Staff qualifications 22Skill gaps 23Employers’ commitment to training and qualifications 25
Introduction 28Project team 28Structure of the report 29
Chapter 1 Archaeology in Italy 30Brief guide to archaeological practice in Italy 30Previous works 31
La Laurea non fa l’archeologo (The degree does not make the archaeologist) (1992) 31First ANA Census (2004-2005) 31OSAL (2007-2008) 32Second ANA Census (2008-2011) 32ACE (2011-2012) 32General States of Archaeology of Paestum (2011) 33Anonymous survey on archaeological work (Emilia-Romagna 2012) 33
Chapter 2: Methodology 34Introduction 34Survey methodology 34Mailing list 34Data Collection 35Calculating workforce estimated size 36
Chapter 3: Organisations 38Public organisations 38MiBACT 38
Salaries 40Gender 40
MIUR 41Universities 41Gender 43
CNR (National Council of Research) 44

5
Museums and archaeological areas 45Museums staff – range of jobs and types of contracts 47
Private organisations 48Chosen Sample 49Companies’ business name 50
Employers’ Associations 52Legacoop 52CNA 52Archeoimprese 52
Size of organisations 52Salaries, contracts and payments 53Staff turnover and hiring standards 57Quality systems 59OS25 60Activities and offered services 64Post-excavation activities 65Annual Turnover 66Business confidence 69
Chapter 4: Archaeologists 73Growth of the profession 73New entrants to the profession 73Distribution 80Geographical Distribution 84Diversity 91
Gender balance 91Age 92Disability status 94Countries of origin 95
Staff Qualifications 95Unpaid volunteer archaeologists 99Market confidence 100
Chapter 5: Jobs 103Places and fields of jobs 103Salaries and earnings 105Earnings distribution 109Earnings by gender 111VAT Numbers and rates 112Entrance in the labour market 114Maternity/paternity leave 116Workplace accidents 119Full-time and part-time work 120Unemployment 122Years of activity as an archaeologists to date and desertion of the profession 123Unions and professional associations 124Workplace lawsuits 126
Chapter 6: Training 128Introduction 128

6
Continuous professional training 129University courses 129Non university courses 130Skill Gaps 131
Appendix 1 Professional associations 133Appendix 2 Spouses and cohabitees 132Appendix 3 Social campaign 134Appendix 4 Questionnaires 136
Figures Figure 1 Comparison between men and women in archaeology based on data from four different surveys. 15Figure 2 Organisations by which archaeologists were employed within the last year: it was possible to
indicate more than one item. ................................................................................................................ 17Figure 3 Main working places: for convenience’s sake some items have been joined together. .................... 18Figure 4 Geographical distributions of the responses. ................................................................................... 19Figure 5 2011 salaries earned by archaeologists according to the data collected by the second ANA Census
(from ACE 2013). ................................................................................................................................... 20Figure 6 Types of contracts signed by Italian archaeologists in 2013. ............................................................ 20Figure 7 Types of contracts according on the second ANA Census (from ACE 2013). ...................................... 21Figure 8 Level of qualifications held by Italian archaeologists. Although equivalent according to the EQF
levels, post-graduate School of Specialisation and PhD were separated, and PhD has been considered more important. .................................................................................................................................... 23
Figure 9 Levels of qualifications held by Italian archaeologists in 2011 according to the second ANA census (from ACE 2013). ................................................................................................................................... 23
Figure 10 Self evaluation of their education according to archaeologists. ...................................................... 24Figure 11 Gaps identified in their university education by professional archaeologists. ................................ 24Figure 12 Relation between skill gaps and job-seeking. ................................................................................. 25Figure 13 Subject on which archaeologist received formation from the private organisation they worked for.
.............................................................................................................................................................. 26Figure 14 Percentage of private organisations that answered to the question whether they have a training
program for their staff. .......................................................................................................................... 26Figure 15 Willingness to attend educational courses at their expense. .......................................................... 27Figure 16 MiBACT employees (from MiBACT official website). ...................................................................... 39Figure 17 MiBACT employees by percentage (from MiBACT official website). ............................................... 39Figure 18 MiBACT, managers gender balance. ............................................................................................... 41Figure 19 MiBACT, officers gender balance. ................................................................................................... 41Figure 20 University, permanent contract archaeologists’ rank ..................................................................... 42Figure 21 University, permanent contract archaeologists’ percentages by rank. ........................................... 42Figure 22 University, gender balance of permanent contracts archaeologists according to their rank. .......... 43Figure 23 University, gender balance of Research Fellows. ............................................................................ 44Figure 24 CNR, employees’ roles. ................................................................................................................... 45Figure 25 Museums, archaeologists’ types of contracts. ................................................................................ 46Figure 26 Archaeologists’ jobs in museums. ................................................................................................... 47Figure 27 Museums, archaeologists’ types of contracts. ................................................................................ 48Figure 28 Comparison between approached and respondent organisations. ................................................. 49Figure 31 Business name of the respondent private companies. .................................................................... 50Figure 29 Companies working in the archaeological market. ......................................................................... 50Figure 30 OS25 qualification held by contacted companies. .......................................................................... 50Figure 32 Business name of the companies working with archaeologists. ..................................................... 51Figure 33 private companies, structure and business name. .......................................................................... 52Figure 34 private companies, employees’ type of contracts. .......................................................................... 53Figure 35 average waiting time for payments according to freelance archaeologists. .................................... 55

7
Figure 36 average waiting time for payments according to companies. ......................................................... 55Figure 37 average waiting time for payments by private and public clients according to companies. ............ 56Figure 38 private companies, archaeologists’ role within the organization (2012). ........................................ 57Figure 39 private companies, archaeologists’ role within the organisation (2013). ........................................ 58Figure 40 how private companies choose and use their collaborators. ......................................................... 59Figure 43 private companies, geographical distribution of companies holding an OS25 Certificate. .............. 60Figure 41 Identification of workers’ training needs ....................................................................................... 60Figure 42 private companies and employees’ training, presence of dedicated training plan. ......................... 60Figure 44 private companies, geographical distribution and classification. .................................................... 61Figure 45 private companies, regional distribution of companies holding an OS25 Certificate. ..................... 62Figure 46 private companies, regional distribution of companies holding an OS25 Certificate ...................... 63Figure 47 private companies, offered services. .............................................................................................. 64Figure 48 private companies, 2012 turnover. ................................................................................................. 66Figure 49 private companies, estimate percentage of turnover brought by each job. .................................... 67Figure 50 private companies, clients. ............................................................................................................. 68Figure 51 excavations, average duration. ....................................................................................................... 68Figure 52 delay in due payments from public and private clients according to companies. ........................... 69Figure 53 private companies, decrease in the market volume. ...................................................................... 70Figure 54 private companies, prevision on their hiring new people next year. .............................................. 71Figure 55 private companies, prevision on the number of archaeologists in 1 and 3 years. ........................... 71Figure 56 Major obstacles encountered by Italian companies. ....................................................................... 72Figure 57 University enrolment for education fields (Almalaurea dataset 2013, from VANZETTI, to be
printed). ................................................................................................................................................ 76Figure 58 First and second level degrees awarded in Archaeology. ................................................................ 77Figure 59 Type of archaeologists’ employers/clients. ..................................................................................... 80Figure 60 Employers (multiple-choices question). .......................................................................................... 82Figure 61 Employers/clients in 2012-2013. .................................................................................................... 83Figure 62 Geographical distributions of respondent archaeologists. .............................................................. 85Figure 63 Geographical distribution of Italian protected sites and monuments (from “MINICIFRE 2013”, p. 8).
.............................................................................................................................................................. 86Figure 64 gender of the respondents employed by public and private organisations. .................................... 92Figure 65 Age and gender of respondents. ..................................................................................................... 93Figure 66: Highest level of achieved qualifications. ........................................................................................ 96Figure 67 Annual earnings by highest level of qualification achieved ............................................................. 98Figure 68 Unpaid work proposals received by archaeologists. ...................................................................... 99Figure 69 Prevision of number of archaeologists in a three years period. .................................................... 100Figure 70 Prevision to change job in the next future. ................................................................................... 100Figure 71 Attitude of archaeologists to change job. ..................................................................................... 101Figure 72 Professional satisfaction. .............................................................................................................. 102Figure 73 Opinion about own future in archaeology. ................................................................................... 102Figure 74 Archaeologists’ distribution by field of work. ............................................................................... 103Figure 75 organisations for which archaeologists worked during the year: it was possible to indicate more
than one. ............................................................................................................................................. 104Figure 76 2012 earnings by types of contract. .............................................................................................. 107Figure 77 Full-time workers’ earnings from different employers/clients. .................................................... 109Figure 78 Part-time workers’ earnings from different employers/clients. .................................................... 110Figure 79 Average earnings (in Euros) by gender and types of contract. ...................................................... 111Figure 80 possibilities of proposing their own rates to the clients/employers. ............................................ 113Figure 81 way in which they first entered the archaeological labour market. .............................................. 114Figure 82 how private organisations hire their staff. ................................................................................... 115Figure 83 Total percentage of archaeologists with dependent children who accessed parental benefits. .... 117Figure 84 Total number of archaeologists with children who accessed parental benefits. ........................... 117Figure 85 workplace accidents. .................................................................................................................... 119Figure 86 Workplace safety training. ........................................................................................................... 120Figure 87 Full-time and part-time work, all staff. ......................................................................................... 120Figure 88 Fulltime and part‐time work by type of contract. ......................................................................... 121

8
Figure 89 Working conditions at the time of the survey (November 2012-March 2013) with unemployment rate. .................................................................................................................................................... 122
Figure 90 Membership to professional associations of archaeologists. ........................................................ 125Figure 91 Reasons why 74,58% of the respondents did not join any professional association. ..................... 125Figure 92 work-related legal actions brought by archaeologists. ................................................................. 126Figure 93 Place of attending. ....................................................................................................................... 129Figure 94 Attending of Master courses. ....................................................................................................... 129Figure 95 Presence of a formal training budget. .......................................................................................... 130Figure 96 Presence of a formal training plan. ............................................................................................... 130Figure 97 how staff training is provided. ...................................................................................................... 130Figure 98 Identification of workers’ training needs ...................................................................................... 130Figure 99 Subjects of training provided by employers to archaeologists. ..................................................... 131Figure 100 Gaps identified in their university education by professional archaeologists. ............................ 132Figure 101 Reasons why they did not join an association (74,58% of the respondents). .............................. 133

9
Tables Table 1 Types of contracts for non-employed archaeologists: data presented for regions. ............................ 21Table 2 Types of contracts for non-employed archaeologists: data presented for macro-areas. .................... 22Table 3 Open institutions in 2011(from “Culture in Italy 2013 - Basic figures”). ............................................. 45Table 4 salaries agreed on in the CCNL for employees of the construction sector and salaries of professional
firms. ..................................................................................................................................................... 54Table 5 private companies, archaeologists’ type of contracts. ....................................................................... 57Table 6 post-excavation documentation, comparison between what clients pay to private companies and
what private companies pay to archaeologists. ..................................................................................... 65Table 7 clients and companies’ post-excavation activity. ............................................................................... 65Table 8 Geographical distribution of universities offering courses referring to the Field of Study 10/A1,
Archaeology. ......................................................................................................................................... 75Table 9 First and second level degrees awarded in Archaeology. ................................................................... 77Table 11 Students admitted into Schools of Specialisation in Archaeology and available places in academic
year 2013/2014. .................................................................................................................................... 78Table 10 Schools of Specialisation in Archaeology in Italy in academic year 2013/2014 (source: MIUR). ....... 78Table 12 Working archaeologists for type of employer/clients. ..................................................................... 81Table 13 Geographical distribution of the sample. ......................................................................................... 84Table 14 Geographical distribution of respondents archaeologists and location of Universities offering an
archaeology Degree (dataset MIUR). ..................................................................................................... 86Table 15 Geographical distribution of respondent archaeologists and number of protected sites and
monuments. .......................................................................................................................................... 87Table 16 Geographical distribution of archaeologists working in archaeological companies. ......................... 88Table 17 Geographical distributions of archaeologists employed by universities. .......................................... 89Table 18 Regional distribution of archaeologists working for private companies included in the survey
sample. .................................................................................................................................................. 90Table 20 Gender balance, comparison between respondents archaeologists and Italian workforce. ............. 91Table 19 Gender balance of the respondents. ................................................................................................ 91Table 21 Average age by gender. ................................................................................................................... 93Table 22 Age and gender of respondents. ...................................................................................................... 93Table 23 Disability status of the respondent archaeologists. ......................................................................... 94Table 24 Disability percentage of the disabled archaeologists respondent and their difficulties in job-
seeking. ................................................................................................................................................. 94Table 25 Countries of origin of the respondent archaeologists. ..................................................................... 95Table 26 Highest level of achieved qualifications. .......................................................................................... 96Table 27 Qualifications and average age. ....................................................................................................... 97Table 28 Annual earnings by highest level of qualification achieved. ............................................................. 98Table 29 2012 earnings of the workers employed whose samples were considered most reliable. ............. 105Table 30 Professional archaeologists whose earnings come mainly from other organisations/clients (2012).
............................................................................................................................................................ 106Table 31 2012 earnings by types of contract. ............................................................................................... 106Table 32 2008 earnings by types of contract. ............................................................................................... 107Table 33 2010 earnings by types of contract. ............................................................................................... 108Table 34 compared salaries of 2008, 2010, 2012. ......................................................................................... 108Table 35 Archaeologists’ earning in 2008 and 2010. ..................................................................................... 110Table 36 2012 salaries (in Euros, only fulltime workers) distribution by gender and type of contract. ......... 112Table 37 Comparison between daily and monthly wages on tax regime basis. ............................................ 113Table 38 Workplace accidents severity. ....................................................................................................... 119Table 39 Unemployed by years (2008-2013). ............................................................................................... 122Table 40 Years of activity as an archaeologists to date. ............................................................................... 123Table 41 outcome of the lawsuits had and archaeologists willingness to suit again. ................................... 126

10
Bibliography
Dossier, studies and conference proceedings
ACE 2013: M. P. Guermandi, K. Salas Rossenbach (eds.), Twenty years after Malta: preventive archaeology in Europe and in Italy, Bologna 2013. link
ANA 2006: Associazione Nazionale Archeologi, Dossier 1° censimento nazionale archeologi. 2004-2006, s.l., 2006. link
BRADYPUS 2012: BRADYPUS, Risultati del sondaggio anonimo sul lavoro in archeologia, dati presentati in occasione della tavola rotonda “Diritto del lavoro, forme contrattuali, pensione, sicurezza in cantiere, precarietà, per i lavoratori dell’archeologia e dei beni culturali”, Bologna 14 marzo 2012. LINK
GROSSI-GIORGIO 2012: W. Grossi, M. Giorgio, La condizione degli archeologi italiani. I dati del II Censimento Nazionale dell’Associazione Nazionale Archeologi, poster presentato in occasione del I Convegno di Archeologia Pubblica, Firenze 2012. link
GENTILI-LEOTTA 2010: M. D. Gentili, M. C. Leotta (eds.), Professione Archeologo: la formazione universitaria, Tavola rotonda, Facoltà di lettere e Filosofia dell’Università degli Studi di Roma “Tor Vergata”, 4 novembre 2008, Roma 2010.
LA LAUREA 1993: P. Battistelli, M. Bettelli, M. Di Pillo, F. R. Farina, S. T. Levi, C. Moffa, A. Reggi, F. Squadrone e A. Vanzetti, La laurea non fa l’archeologo, Tavola rotonda, Roma, 8 maggio 1992, Mantova 1993.
LAVORO 2013: Ministero del Lavoro e delle Politiche Sociali - Direzione Generale Immigrazione e Politiche di Integrazione, Il mercato del lavoro dei lavoratori stranieri in Italia nel secondo trimestre, 2013.
MARESU 2011: G. Maresu, Archeologia: “Risorsa antica” e “nuova vision” per il turismo italiano, Turistica. Economia – Management – Marketing, 2011.
MIBAC 1982: Ministero per i Beni Culturali e Ambientali - Ufficio Studi, Specialisti e tecnici per la conservazione dei Beni Culturali. Scuole ed Istituti di formazione in Italia, Quaderni, 5, 1982.
OSAL 2014: A. Schiappelli, Ricerca sulle attività degli archeologi nei Comuni della Provincia e nel Municipio V di Roma, Roma 2014.
PAROLINI 2007: C. Parolini (ed.), La laurea deve fare l’archeologo, Atti del convegno, Università degli Studi di Roma “La Sapienza”, 25 maggio 2006, Roma 2007.
PAROLINI 2007b: C. Parolini (ed.), Beni culturali e lavoro: problematiche e prospettive, Atti del convegno, Università degli Studi di Roma “La Sapienza”, 23 marzo 2005, Roma 2007.

11
STATI GENERALI 2011: Ministero per i Beni e le Attività Culturali - Direzione Generale per la Valorizzazione del Patrimonio Culturale, Valorizzazione e gestione integrata del patrimonio archeologico, XIV Borsa Mediterranea del Turismo Archeologico, Paestum 17-20 novembre 2011, s.l. 2011. link
Papers
ANA 2011: S. Barrano, T. Cevoli, Il ruolo delle Associazioni Professionisti nel settore dell’archeologia: l’Associazione Nazionale Archeologi, in STATI GENERALI 2011, 14-20. link
BERLINGÒ 2005: I. Berlingò, La nuova disciplina, Notiziario Ufficio Studi MiBACT, 77-79, gennaio-dicembre 2005, 119-122.
BORDON 1997: W. Bordon, Le risorse umane e le professionalità impegnate nella tutela, in Notiziario Ufficio Studi MiBAC, 54-55, maggio-dicembre 1997, 5.
CABASINO 1997: E. Cabasino, I collaboratori “esterni” delle Soprintendenze, Notiziario Ufficio Studi MiBAC, 54-55, maggio-dicembre 1997, 77-80.
COTONE 1997: M. Cotone, Concorsi e assunzioni nel decennio 1986-1995, Notiziario Ufficio Studi MiBAC, 54-55, maggio-dicembre 1997, 11-29.
COTONE 2000: M. Cotone, Concorsi e assunzioni nel quinquennio 1996-2000, Notiziario Ufficio Studi MiBAC, 62-64, gennaio-dicembre 2000, 100-110.
COTONE 2006: M. Cotone, Concorsi e assunzioni nel quinquennio 2001-2005, Notiziario Ufficio Studi MiBAC, 80-82, gennaio-dicembre 2006, 33-38.
GAY-RUSSO 2013: G. Gay, F. Russo, I prospetti informativi: una nuova fonte di dati sull’occupazione dei disabili e delle categorie protette, 2013. link
HARDY 2014: S. Hardy, Unpaid labour in public archaeology, The Forum Dispatch, Jan 14, 2014. link
LEONI-MAGLIARO 2011: G. Leoni, T. Magliaro, Confederazione Italiana Archeologi: lo stato della professione a tre anni dalla crisi, in STATI GENERALI 2011, 20-25.
MILITELLO-PORTALE CDS: P. M. Militello, E. C. Portale, L'archeologia tra formazione e pratica: il ruolo dell'università in Sicilia, in Archeologia Pubblica al tempo della crisi, Atti del Convegno VII Giornate Gregoriane, Agrigento, 29-30 Novembre 2013, in corso di stampa. link
REGGIANI 2005: A. M. Reggiani, Monitoraggio archeologico e archeologia preventiva, in Notiziario Ufficio Studi MiBAC, 77-79, gennaio-dicembre 2005, 117-118.
SPECIALE-ZIRONE 2012: C. Speciale, D. Zirone, Archeologia pubblica e pubblicità dell’archeologia. Il caso siciliano, in I Convegno di Archeologia Pubblica, Atti del convegno, Firenze 2012. link

12
VANZETTI CDS: A. Vanzetti, Alcuni dati su formazione universitaria e lavoro in Italia, in Discovering the Archaeologists of Europe. Digging in the Crisis, Roma, 14 marzo 2013, in corso di stampa.
ZIRONE 2011: D. ZIRONE, Fra la trowel e il biberon: storia di un’archeomamma, in AIBlog, ottobre 2011. link
Legal references
D.lgs. 163/2006 “Codice dei contratti Pubblici di lavori, servizi, e forniture in attuazione delle direttive 2004/17/CE e 2004/18/CE”. Link
D.lgs. 26 marzo 2001, n. 151, "Testo unico delle disposizioni legislative in materia di tutela e sostegno della maternità e della paternità, a norma dell'articolo 15 della legge 8 marzo 2000, n. 53" link
D.lgs. 81/2008 “Testo unico in materia di tutela della salute e della sicurezza nei luoghi di lavoro”. link
D.M. 20 marzo 2009, n. 60, “Regolamento concernente la disciplina dei criteri per la tenuta e il funzionamento dell’elenco previsto dall’articolo 95, comma 2, del decreto legislativo 12 aplrile 2006, n. 163” (G. U. 15 giugno 2009). link
TUIR “Testo Unico delle Imposte sui Redditi D.P.R. 22.12.1986 n° 917 e successive modifiche” (G.U. 31 dicembre 1986).
link
Webography
Blog Professione Archeologo link
Facebook group Archeomamme e Archeopapà link
Facebook group Confederazione Italiana Archeologi link
Website of Confederazione Italiana Archeologi link
Website of European project DISCO2014 link
Website of Italian research DISCO2014 link

13
About the authors Post doc Dr. Elisa Cella was born in Roma in 1978. She is member of the professional association Confederazione Italiana Archeologi since 2005, and is part of its National Board. She studied pre-roman and roman archaeology at ‘Sapienza’ University of Rome, where she was awarded her Magister Degree in Topography of ancient Italy in 2003, with a thesis on the settlement dynamics of central Abruzzo. In 2009 she completed her PhD in Archaeology of transformation processes, at Università Cattolica del Sacro Cuore in Milan, defending a research on the Capestrano necropolis. In 2011 she was awarded of a Specialization degree in Archaeological heritage at Salento University, in Etruscology, after studying Giacomo Boni researches at the Aedes Vestae in the Roman Forum. The same year she held a Post-Doc fellowship at “Sapienza” University in Roma, as member of the Veio Project for the Ancient Topography sector. She is today Scientific Director of the Etruscan and Roman Museum of Trevignano Romano. On behalf of CIA she deals with management of Cultural Heritage and archaeological labour market since 2005, and has been a researcher of Progetto OsAL – Osservatorio archeologi al Lavoro. She is vice-coordinator of ‘Discovering the Archaeologists of Europe’ project, and co-edited DISCO 2014 National Report. She is the author of the chapter 4.
Tommaso Magliaro, born in Rome in 1978. He studied Etruscology and Italic Antiquities at University of Rome “La Sapienza” and took his degree in 2008, with a thesis about the necropolis of Macchia della Comunità in Veii. During university courses has been responsible on many didactic excavations and responsible for many workshops and surveys for University of Rome and Soprintendenza per l’Etruria Meridionale. He founded CIA in 2004 and now is member of the National Board. He works as freelance in many archeological excavations, especially in Rome and Latium. He published some scientific papers and attended to various national and international conferences. He’s one of Italian DISCO project managers and author of Chapter 3 of this report. Alessandro Pintucci, born in Rome in 1976. His interests are in ancient Italy topography, archeological graphical documentation and Roman Architecture. He completed his degree in 2001 and took the Specialization degree in 2005 at University of Rome “La Sapienza”. In this moment he’s Phd candidate in Ancient Topography at University of Rome with a research about the territory of ancient Praeneste. He works as freelance in Italy, in many excavations and projects especially in Rome and Latium, plus some experiences in Greece and Turkey. He published papers about ancient Praeneste and Tibur and about archaeological labour market and profession in Italy. He’s now the president of CIA, after founding it in 2004. He’s national coordinator of DISCO project and co-editor of this report, writing Chapters 1-2-6 and the Summary of results.

14
Donata Zirone, born in Pordenone in 1974. She studied at Pisa University and took her Specialization degree at University of Padova.
Classical archaeologist, she collaborates with Sicilian superintendences and with Scuola Normale Superiore of Pisa. She’s author of scientific papers about Sicily sites. In this moment she’s president of Sicily organization of CIA and member of National Board. For CIA she deals with labour contracts and social rights, in particular parental rights of freelance. She’s one of the national manager of Italian DISCO project and author of Chapter 5.

15
Summary of results Estimated number of archaeologists working in Italy
The estimated number of archaeologists working in Italy in 2012-2013 is 4,383, based on the analysis of the data collected from the current research, which will be described herein.
It’s important to point out that this does not equate the total number of graduates in archaeology, but only represents the number of people directly earning all or part of their livings from the archaeological sector in 2012-2013.
Age, gender, disability status and country of origin
The average age of working archaeologists is 37; 36 is the average age for women, 38 for men.
The survey found that the majority of archaeologists are female, 70,79%, while a 29,21% are male: these data are perfectly comparable with the results of the ANA Censuses of 2006 and 2011, and with the Almalaurea dataset for the number of students who, in the same period of time, received a Master’s degree in archaeology.
Figure 1 Comparison between men and women in archaeology based on data from four different surveys.
The proportion of people with disability is very low, only 1% (7 people) of the respondents.
99% of archaeologists working in Italy are from Italy; 0,5% are from elsewhere in the European Union and only 2 people (0,28%) are from non EU countries, as contrasted with the entire Italy workforce of whom 5,07% are from EU and 10,2% from non EU countries.
0
10
20
30
40
50
60
70
80
Males Females
DISCO2014
ANA2006
ANA2011
Almalaurea2012

16
Estimated numbers working in each job type
To the question “what organisation did you work for within the last year?” the respondents, who could provide more than one answer, replied as shown in Figure 2 (the total number of replies, including multiple-choice ones, was 795). The majority of archaeologists work for universities, followed by those who work for the Ministry of Cultural Heritage, Activities and Tourism (MiBACT), and by those employed by private sector organisations.
We also asked in which places they are more likely to work (Figure 3).
It turns out archaeologists’ main activities are excavations, and conservation and research in all its forms and shapes. Almost ¼ of the respondents indicated the museum as their main place of work, in which they provide educational and visitor services to the public.
4% declare they left the job for the moment. It stands out immediately the wide variance between the number of people who stated they work for private archaeological organisations (17,1%), and the number of those, twice as much, who replied they mainly work on excavations, which is the typical activity of Italian private archaeological organisations. That’s a very strong feature of Italian archaeological working force: 15,53% of workers without a contract as an employee state they have never worked for a private organisation.

17
Figure 2 Organisations by which archaeologists were employed within the last year: it was possible to indicate more than one item.
This data represents the percentage of people, most of them provided with VAT registration numbers, who usually work as freelance archaeologists, without an organisation to refer to, which equals to 700 people.
121
22
4
19
16
62
20
159
12
18
5
20
3
137
47
30
18
41
3
1
3
14
0 50 100 150 200
Organisation where archaeologists are employed (2013)
Unemployed
Indipendent customers
Publishing house
Ecclesiastical organisation (including museums) Other companies
Engineering company
Biulding companies
Tourism company (guides)
Private archaeological companies
Mixed foundation
Private foundation
Public foundation
Foreign Research Insitute
Nat. Centre for Research
University
Other public organisation
Municipality (including museums)2
Provincia
Regione
Altro ministero
MIUR
MIBACT

18
Figure 3 Main working places: for convenience’s sake some items have been joined together.
Geographical distributions of the answers
The geographical distribution of the answers shows that there are areas with a stronger presence of archaeologists: that is the case for Rome, the capital, which represents alone 20% of the whole archaeological labour market, while the percentage for Lazio, the Italian region including Rome, is 26,7%.
These data are only partly explicable considering the higher number of people living in Rome than in the rest of the country. Another reason for this situation is the presence in Rome of three universities, each of them offering Bachelor and Master degrees in archaeology (of the total of 779 graduates in archaeology in Italy in 2012, 164, that is 21,5%, graduated in one of the Roman universities). To have a better idea, we can compare these last data these offered by the city of Naples, which has three universities, like Rome: only 11,03% of all graduates in archaeology in Italy in the same period time come from this city. The prevalence of archaeologists within the territory of Rome is also partly explainable with the presence there of the main branch of the Italian Ministry of Cultural Heritage, Activities and Tourism (MiBACT) and its national agencies.
But what makes Rome such an important market place in relation to other areas all over the country, is certainly the presence, within the local Town Planning law since 1983, of a paragraph which demands clearance for protection for every construction work requiring excavations in the city territory, thus calling for the presence of an archaeologist to supervise said activities. Lastly, it must be taken into account how rich of archaeological remains the whole city territory obviously is.
222; 35%
244; 38%
151; 23%
26; 4%
Working places
Office (office, university, superintendence, research organisation, library) Excavations
Museums (including teaching and giuded tours)
Other

19
The Italian government never ratified the 1992 Convention of Malta, which is why Italian laws only provide the MiBACT with the possibility of imposing a supervising archaeologist on construction sites that are either public or included into a restricted area, while for private construction sites this can only be decided if archaeological remains are found during the works and the local authority is alerted.
Figure 4 Geographical distributions of the responses.
Over the past few months, thanks to the involvement and commitment of different professional associations of archaeologists, things have moved along and the government is finally going to ratify the Convention of Malta, which should lead to a substantial change of protection laws and to a desirable growth of the archaeological sector.
Average salaries
On average, archaeologists earned 10,687 € per annum, slightly more than the average salary of 2010, 10,389 €, and of 2008, 10,318 €.
The estimated median is 10,400 €, while the majority of those who answered the question (93 out of 351) stated they earned less than 5000 €.
18 5
14 51
33 5
186 18
43 14
8 20
46 29
85 66
6 18
22 0
0 20 40 60 80 100 120 140 160 180 200
Abruzzo Basilicata
Calabria Campania
Emilia-Romagna Friuli-Venezia Giulia
Lazio Liguria
Lombardia Marche Molise
Piemonte Puglia
Sardegna Sicilia
Toscana Trentino-Alto Adige
Umbria Veneto
Valle d'Aosta
Geographical distribution of the responses

20
Figure 5 2011 salaries earned by archaeologists according to the data collected by the second ANA Census (from ACE 2013).
On average, freelancer archaeologists earned 10,823 €, while archaeologists employed with a permanent contract earned 19,834 €.
By comparison, up to the end of 2013, the average salary for Italian workforce was around 18,000 € per annum, lower in the South, 13,400 €, but still higher than the median archaeological salary.
On this, the data regarding the different types of contracts signed by archaeologists in 2013 are very telling:
Figure 6 Types of contracts signed by Italian archaeologists in 2013.
91; 14%
102; 15%
182; 28%
281; 43%
Types of contracts in archaeology in 2013
Temporary contracts
Permanent contracts
Unemployed
Short term contracts/freelance

21
Figure 7 Types of contracts according on the second ANA Census (from ACE 2013).
16% out of the whole active archaeological workforce in Italy have a permanent contract. Freelancers, often provided with VAT registration numbers (VAT holders), represent the majority of archaeologists, at 43%.
It’s not very easy to comment on the data regarding unemployed archaeologists, who represent 28% of the respondents: those who had not been working declared themselves unemployed, even the VAT holders, who, according to Italian laws, cannot be considered as such.
Table 1 Types of contracts for non-employed archaeologists: data presented for regions.

22
14% of all respondents are employed with a fixed-term contract, which is second best in Italy in relation to social protection and security.
Finally, we asked freelancers which kind of contract they are usually hired for:
Organising the data for geographical macro-areas these are the results:
Free lancer archaeologists are also, mainly, VAT holders, with different percentages all over the country: in Central Italy (especially in Lazio) this form of hired work is twice as present as the Withholding Tax system contracts and work on project basis contracts, which are the two other most common forms. In Northern Italy VAT holders and archaeologists hired for work on project basis, which is a form of temporary collaboration, are both as present. It must be noted that the Withholding Tax system requires that the worker’s earnings are lower than 5,000 € per annum, since otherwise Italian law demands the worker must be hired as an employee or with a different type of contract.
Lastly, it must be taken into account that holding a VAT (Value Added Tax) registration number, especially the ones ruled by the ordinary rate, which requires every three months VAT holders deduct the VAT they themselves have paid to the preceding stage, and pay in the difference to the State, can be very complicated to handle when it comes to tax payments and refunds, and it requires professional help in the form of an accountant, whose bills usually vary between 600 and 1,200 € per annum.
Staff qualifications
Archaeologists are highly educated: 31% of the respondents (210 out of 677) attended a Post-graduate School of Specialisation in Archaeology (Level 8 of the European Qualifications Framework, EQF,); 15,6% (108) have a Doctorate qualification; 25,55% (173) have a Master’s degree; 14% (100) hold a Master’s Degree according to the old university system (total of four years, EQF level 7). Only 6,35% (43 people) ended their education at a Bachelor’s degree, and the same amount (6,5%, 43 people as well) have a Post-Doctoral title.
On top of that, one in three archaeologists attended to a I or II level Post-Graduate Master Course (respectively, EQF levels 7 and 8): they represent 30,7% of the respondents, while 69,3% of them state they never attended one.
Table 2 Types of contracts for non-employed archaeologists: data presented for macro-areas.

23
Overall Italian archaeologists who hold a Post-Graduate qualification are about 52% of the respondents (361 of 677), which compared to the estimated number of archaeologists in Italy should be a total of 2,336 people.
In 2008, 5,551 people with either a Post-Graduate School of Specialisation or a PhD in archaeology took part in a public competition for filling 100 posts as MiBACT employees: the variance between this figure and the number of working archaeologists with a Post-Graduate qualification as uncovered by the current survey, represents the number of people who abandoned the profession.
This means 60% of the highest qualified archaeologists in Italy dropped out of the profession in the last 5 years.
Figure 8 Level of qualifications held by Italian archaeologists. Although equivalent according to the EQF levels, post-graduate School of Specialisation and PhD were separated, and PhD has been considered more important. Figure 9 Levels of qualifications held by Italian archaeologists in 2011 according to the second ANA census (from ACE 2013). Skill gaps
All the respondents have a pretty good grasp of their own education: 41% consider it to have been good; 22,6% even think it was very good; 23,5% considers it sufficient.
43; 6%
100; 15%
173; 26% 210; 31%
108; 16%
43; 6%
Level of qualification reached
First degree
Old 4 years degree
Master degree
School of specialization
Phd (Doctorate)
Post doctorate

24
Figure 10 Self evaluation of their education according to archaeologists. Even so, respondents who actually gave an answer to this question could pinpoint some gaps in their university education. These can be summarized as follow:
Figure 11 Gaps identified in their university education by professional archaeologists.
We also asked if these gaps can have negative impact in finding a job:
29; 4%
56; 8%
159; 24%
280; 41%
153; 23%
Self evaluation about education
very low
low
sufficient
good
very good
105
83
66
64
30
18
0 20 40 60 80 100 120
Professional practice
Cultural heritage legislation
Job legislation
Working safety
Informatics
Economy and management of Cultural heritage
Gaps perceived in university education

25
Figure 12 Relation between skill gaps and job-seeking.
In 1993, the author of book “The degree does not make the archaeologist”, used these words as a closing for the chapter on education: “Classes on methodology or juridical subjects are certainly missing, or are very rare, in Literature Degrees (alongside, more often than not, many archaeological subjects), classes which are instead present in Cultural Heritage Degrees, and it could be good to fill this gap, but we also notice a lack of practice and internships (but with good references and scientifically advanced!), which is only partly righted thanks to the practical activities required within Schools of Specialisation courses.” (LA LAUREA 1993, A. Vanzetti)
Employers’ commitment to training and qualifications
Part of the respondents (around 13%) received some kind of training from the private organisations they work for:
410; 59%
267; 38%
18; 3%
Relation between skill gaps and job-seeking
No
Yes
Don't know

26
Figure 13 Subject on which archaeologist received formation from the private organisation they worked for.
The information that this question provides is really interesting: 34% out of 677 (which is the amount of valid answers) state these respondents never worked for such organisations; 18,7% of them described themselves as freelancers or unemployed.
Very informative is, also, the data collected from the private organisations: to the question “Do you identify skill gaps in your staff?”, 80% answered in the positive.
To the question “Does your organisation have some training for your staff?”, only 28% replied they had.
Figure 14 Percentage of private organisations that answered to the question whether they have a training program for their staff.
60
8
7
7
3
1
1
0 10 20 30 40 50 60 70
Occupational safety
Marketing and valorization
Survey and topography
Cataloguing, GIS, DB
Underwater archaeology
Bioarchaeology
Legislation
Subject on which archaeologist received formation from the private organisation they worked for
9; 28%
23; 72%
Has your company a training program for staff?
Yes
No

27
To the question: “Do you have an internal funding for training?” only 4 organisations answered: 3 of them said they had, 1 stated they didn’t.
All private organisations answered in the positive to the last question: “Do you encourage the professional development of your staff and collaborators?”
Private organisation are thus aware of the importance of continuous training for their staff, but, due to the economical contingency, they cannot at the moment provide it.
To the question “Do you plan on taking additional educational courses at your expense?”, archaeologists replied as follow:
Figure 15 Willingness to attend educational courses at their expense.
In short, the continuous development of one’s skills is a need perceived by both archaeologists and private organisations, but with the current shortage of work and low salaries, neither of them can provide the needed training, especially regarding techniques and technology.
A.P.
247; 35%
430; 62%
18; 3%
Willingness to attend educational courses at their expense
Yes
No
Don't know

28
Introduction Discovering Archaeologists of Europe 2014 is the first statistically systematic survey of the archaeological workforce in Italy: started in 2012 and funde by Lifelong Learning Programme of European Union, the project involves twenty-two European organisations led by the York Archaeological Trust.
The project is now in its second edition, but this is the first time it has been conducted in our country: the need for a new edition comes from the necessity of analysing the working conditions of archaeologists, their numbers, and their work opportunities as affected by the economic crisis of the Western world in the last five-six years, especially in Europe.
From the beginning of the crisis, the construction sector, the one that employs the majority of archaeologists at the moment, lost a total of 446,000 jobs, with a 30% decrease in investment.
In 2012-2013 the Italian government cut 100,000,000 € of funding to the Italian Ministry of Cultural Heritage, Activities and Tourism (MiBACT), with a 58% decrease in funding destined for preservation activities.
According to official data available at the Ministry of Education, Universities and Research (MIUR) website, in two years Italian universities lost a total of 20% permanent archaeological jobs, reduced to 371 units working in 37 faculties all over the country.
These were the numbers from which we started, to try and profile a profession that, more than others, is at risk of declining.
Surveys conducted by other organisations preceded DISCO2014, but the gathered data never produced a general estimate.
The only exceptions, for some aspects, are the 1992 conference titled “La laurea non fa l’archeologo” (LA LAUREA 1993), and the document realised for the General States of Archaeology held in Paestum in 2011, when data gathered by professional organisations and by the Ministry itself were shared with the public (STATI GENERALI 2011).
Project team
Research has been conducted by Confederazione Italiana Archeologi, Italian partner of the project, internationally coordinated by York Archaeological Trust.
National fundings to project have been provided by Coopfond – Fondo mutualistico Legacoop, Associazione Nazionale Cooperative di Produzione e Lavoro, Cooperativa Archeologia, Matrix 96 s. c. a r. l. e Topografia Archeologica s. c. a r. l.
Italian coordinator and project manager of the project is Alessandro Pintucci, vice-coordinator Elisa Cella. Tommaso Magliato and Donata Zirone have joined them as managers. Press Office is Valentina di Stefano, for the social campaign Davide Arnesano, Antonia Falcone and Paola Romi.
Valeria Boi, Federica Lamonaca and Milena Stacca looked after graphic elaboration and logistics.

29
For data collection many researchers have worked : Martina Almonte and Maria Grazia Fichera, from Direzione Generale per le Antichità, who diffused questionnaires to MiBACT employees, Marco Amadei, Eleonora Bernardoni, Simone Cavalieri, Giorgia Leoni, Maria Cristina Leotta, Benedetta Martini, Mircea Masserini, Paolo Pecci, Caterina Pisu, Claudia Speciale, Barbara Vernia.
Luca Tomassini realized project web site, Anna Gallone and Domenica Pate translated texts to English language, Camillo Graziosi managed financial and administrative part of the project.
Elisa Cella (E.C., chapter 4), Tommaso Magliaro (T.M., chapter 3), Alessandro Pintucci (A.P., Summary of results, Chapters 1-2-6) and Donata Zirone (D.Z., Chapter 5, Appendix 1-2) wrote this National report. Revision of the text was made by Elisa Cella and Alessandro Pintucci and approved by Alessandro Pintucci. Opinion presented in the report represent only redactors’ ideas, not Confederazione Italiana Archeologi associates one.
The project has been presented during “Discovering the Archaeologists of Europe – Digging in the crisis” conference, March 14th 2013 in Rome, in Museo Nazionale Romano alle Terme di Diocleziano site. The conference had MiBACT patronage, with the collaboration of Direzione Generale per le Antichità, Director Luigi Malnati, and of Soprintendenza Speciale per i Beni Archeologici di Roma, with Superintendent Maria Rosaria Barbera, Rosanna Friggeri and Rita Paris.
Alessandro Vanzetti, University of Rome “Sapienza”, Fabio Fagella, Legacoop, Elisa Nicoud, École française de Rome and INRAP, partecipated to the conference with papers, together with other DISCO project partners. Conference has been possible also tank to Alessandro Colantoni, Cristiana Cordone, Giada Fatucci, Federica Galiffa, Davide Mastroianni, Augusto Palombini, Mary Patella, Raffaella Palombella, Stefania Picciola, Caterina Pisu e Andrea Schiappelli.
Structure of the report
The first chapter provides a look to the state of the profession and to the previous surveys already carried out in Italy in the past.
The second chapter gives an account of the methodology used for the survey.
The following chapters outline different aspects revealed by the current survey in relation to organisations, archaeologists, jobs and training respectively. Comparison with previous surveys are made when possible.
The appendixes reproduce some of the free text ‘further comments’ made by respondents in the questionnaire.
The third appendix contains social network and web campaign images. Finally, the last appendix provides a copy of the questionnaire used for the survey.
Roma, li 31, Agosto, 2014
Elisa Cella
Alessandro Pintucci

30
Chapter 1 Archaeology in Italy
Brief guide to archaeological practice in Italy
Cultural Heritage in Italy is protected by law on the basis of Article 9 of Italian Republican Constitution:
The Republic promotes the development of culture and of scientific and technical research. It protects natural landscape and the historical and artistic heritage of the Nation.
On the basis of this article and of the first protective laws of Italian Kingdom (Law 364/1909 and Law 1089/1939) modern heritage laws have been realized, last of those the Code of Cultural Heritage and of Natural Landscape in 2004 (D. Lgs. January 22nd 2004, n. 42).
According to Constitutional principles all the Cultural Assets are property of the Nation, wherever their condition is known or to be known.
Ministry of Culture (Ministero dei Beni e delle Attività Cutlurali e del Turismo, MiBACT, who takes this name with the last Government change in 2014) was founded in 1975 by Minister Giovanni Spadolini, taking the place of Ministry of Education in protection and valorization sector.
MiBACT is centrally organized in General Directions (Direzioni Generali) one for each matter of Cultural Heritage (in these days there’s a debate about Ministry reform that will change significantly these Directions): for archeological sector there’s the Antiquities General Direction (Direzione Generale per le Antichità; in the reform in discussion it will be called Direzione Generale per l’Archeologia).
On the territories MiBACT is organized in superintendences, guided by a director, the Superintendent, one for each Cultural Heritage sector (Archaeology, History of Arts, Architecture, Archives and Libraries) with a unique regional coordination of a Regional Direction.
All the national museums and archaeological sites are managed by superintendences, with the direction of competent officers (in the new reform museums and archaeological sites will be separated by Direzione Generale per le Antichità and will be managed by Direzione Generale per la Valorizzazione, Valorization General Direction).
In the protection of territory the superintendences can ask to private clients, at their expences, the presence of external to MiBACT personnel (total number of archaeological officers in Italy was at time of writing 400), a single professional or an archaelogical company, maintaining always the scientific direction of all the excavations.
Since July 22nd 2014, with the Law 110/2014, professionals working on Cultural Assets must be qualified: at the moment of writing the parameters that will be used to qualify professionals have not beeen decided and the Ministry has 6 months from the entering into

31
force of the Law to produce the new guidelines with the help of the Ministry of Education, the sector most important professional associations, trade unions e clients associations.
The same Law decrees the creation of non binding lists of professionals according to the established rules .
University and CNR are the two public research institution in Italy.
With the Preventive Archaeology law (Dlgs. 163/206) Archaeological Departments of the Universities entered into the market, as they have been recognized, together with high specialized professionals, as subjects who can sign the Archaeological Impact Valutation (VIArch), that in the hope of legislators should help to speed up infrastructures construction by studying the archaeological risk of an area.
The private companies who want to partecipate to public bids should obtain OS25 ISO qualification, on the basis of their turnover and of the struture of the company.
Previous works
La Laurea non fa l’archeologo (The degree does not make the archaeologist) (1992, LA LAUREA 1993)
More than twenty years old now, this is the most complete report on the archaeological profession in Italy till now.
In the document all working organisations were analysed, from MiBACT to Universities, from CNR to private organisations, and free lancers were also included: it was estimated at that time a number of 609 external collaborators of the Ministry.
Very useful as a comparison to the current situation is the large section dedicated to the description of public organisations that employed archaeologists for work, supplied with numerical data.
Moreover, the survey was conducted in the same years professional archaeology was born in Italy, at a time when Cultural Heritage laws were partly changed (like the “Ronchey Law” which is detailed in a specific paragraph), and during the same years in which, for the last time, a new legislative proposal was made to create a professional register for Italian archaeologists, before Europe decided against them as a legislative outlet, and before the internal contrast between different trends among Italian archaeologists effectively stopped the law from being reviewed in Parliament.
First ANA Census (2004-2005, ANA 2006)
The first census by the National Associations of Archaeologists (ANA) was held from March 2004 to October 2005; it gathered 350 answers, 305 of which were relevant.

32
An estimate of the active archaeological workforce was not calculated, but some data, especially those about gender, earnings, types of contracts and training, will be used as comparison with the information gathered by the DISCO2014 survey.
The census is also interesting because was carried out before the approval of the law on rescue archaeology (D.lgs 163/2006), when the requirements for this type of field activity were not as strict as they are nowadays.
The majority of answers came from Campania, since ANA was just starting there, starting with the archaeologists who had first met while working on local constructions sites for the building of High-Speed Trains (TAV) lines and facilities.
OSAL (2007-2008, OSAL 2011)
The Archaeologists at Work Monitoring Unit (OSAL−Osservatorio Archeologi al Lavoro), is a project by the Italian Confederation of Archaeologists held between 2007 and 2008, within the territory of both the Province of Rome and the then-V municipio of the Capital (currently IV municipio): all the archaeological works done in 2007 and 2008 were considered in this survey, alongside the number and type of archaeologists. A survey to test the knowledge of safety standards in construction sites was also carried out.
The result are not directly comparable to these gathered by DISCO2014, because of the narrow geographical confines of that project.
Second ANA Census (2008-2011, ANA 2011)
The Second ANA Census, with 835 respondents, started in 2008 but it was only partially published in 2011, during the General States of Archaeology in Paestum. Later, in 2013, the “Archaeology in Contemporary Europe. Professional Practices and Public Outreach”– ACE project, by the Institute for Cultural Heritage (IBC) included data from this census.
The timeframe during which the data were gathered was not stated, but it probably was between 2008 and 2011.
Again, an estimate of the active archaeological workforce was not calculated, but, as in the first census, still very useful are the data about archaeologists’ age, type of works and contracts, training, earnings.
ACE (2011-2012, ACE 2013)
The European project ACE−Archaeology in Contemporary Europe, was carried out between 2011 and 2012.
From the website of the Institute for Cultural Heritage (IBC), one of the partners of the project “Professional Practices and Public Outreach: the ACE project aims to promote contemporary archaeology on a European level, drawing attention to its cultural, scientific and economic scope, including its great interest for the wider public.

33
The ACE project, funded within the European programme Culture 2007-2013, involves twelve institutions in different countries: the IBC is the only Italian organisation.”
A conference titled “Twenty years after Malta: preventive archaeology in Europe and in Italy”, was held after the end of the survey, in October, 9th 2012 in the École Française de Rome. Its Proceedings were published online in 2013.
The Proceedings contain some of the data collected by the survey, but the majority was derived from the second ANA Census and from a book by the Directorate General for Antiquities and the Directorate General for the Promotion of Cultural Heritage within the General States of Archaeology in Paestum, alongside a close examination of other scientific works on the subject available in Italy. A good part of the book is about the law on Rescue Archaeology in Italy, how it came to be and its shortcomings.
General States of Archaeology of Paestum (2011, STATI GENERALI 2011)
In 2011 Director-General of the Directorate General for Antiquities of the MiBACT, Luigi Malnati, wrote a call for all Italian archaeologists, from all organisations and fields of work. From this call the General States of Archaeology of Paestum were generated, organised by the Directorate General for Antiquities and the Directorate General for the Promotion of Cultural Heritage, in collaboration with the Italian Confederation of Archaeologists (CIA): for the first time in Italy, the Ministry was interested in those archaeologists working as independent professionals and in fields that, up to that moment, were thought to be secondary in the preservation and promotion of the Italian archaeological heritage. During this conference a short book was presented, with papers from archaeologists working in the MiBACT and as university staff, and from representatives of Professional Associations, supplied with a lot of statistical data useful as a comparison for the data gathered with the DISCO2014 project.
Anonymous survey on archaeological work (Emilia-Romagna 2012)
This survey was first proposed in 2012 by an organisation working in communications for Cultural Heritage (Bradypus), in the occasion of the conference titled: “Work rights, types of contracts, retirement fund, safety in construction sites, job insecurity, for workers in Archaeology and in Cultural Heritage” (Bologna, March 14th 2012): it was an anonymous online survey addressed to archaeologists working in Emilia-Romagna regarding their working conditions in 2011. The respondents were fifty. Considering the limited geographical extension of the survey and the focus on the subject of work contracts, those data were only partly used as a comparison with data from DISCO2014 (BRADYPUS 2012).
A.P.

34
Chapter 2: Methodology Introduction
This chapter describes the methodology of how questionnaires were conceived, how the data were collected and how analysis was undertaken on some of the datasets that were generated.
Survey methodology
Two surveys were created: one addressed to individual workers, whatever their status or their job; one addressed to organisations employing archaeologists.
The survey was circulated electronically only. A distribution on paper was attempted at first, but it was quickly dismissed, as it soon became clear that it would not preserve the anonymous status of the respondents and there was a high risk of duplicate answers.
The survey was designed and delivered using the Limesurvey online system, an open source product which avoided unnecessary data entry costs following the acquisition of the data. For every collected answer the system delivered an email to the questionnaire manager, which prevented data loss.
All organisations that were believed to employ archaeologists were contacted, via emails. If no contact email address was available they were contacted by phone.
In total 214 organisations were approached, with a 15,5% return rate; the return rate of both MiBACT and universities was approximately 16%.
Since a previous estimate of the number of all archaeologists working in Italy did not exist, a return rate could not be calculated for individual workers: the 695 relevant answers, though, seemed enough to work with and gave confidence about the possibility of extrapolating the needed data for the project.
The survey was carried out from November 2013 to March 2014, with email reminders automatically sent by the system every three weeks.
Following the data collection, response standardization was undertaken, screening for possible duplicate answers (which were not found since the system did not allow the respondent to access the questionnaire twice) and amending these which were unusable for any reason, such as earnings written in letters instead of numerals, or using ones instead of thousands (like 5 instead of 5,000 €).
Mailing list
A mailing list of contact email addresses was compiled including as a primary source the list of 3,500 recipients the Italian Archaeologists Confederation (CIA) uses to deliver its monthly newsletter. All the additional email addresses gathered by CIA regional branches were also included in the mailing list. University staff were approached thanks to the contact list available on the Ministry of Education, Universities and Research (MIUR) website, which included 371 professionals working in 37 different universities. As for the MiBACT staff, very

35
important was the collaboration of the Directorate General for Antiquities, which directly delivered the questionnaire to the 400 archaeologists working for the Ministry.
Additionally, an online campaign through the CIA Facebook group was undertaken: this group counts at the moment over 10,000 members, thus representing the largest archaeology community on Facebook, although when the survey was first sent out, it counted about 7,000 members, and not all of them archaeologists. Comparing the original CIA “official” mailing list to the total of the respondents, it turns out about 40% of the latter came from outside the original list of contacts, and a good part of them came to know about the survey thanks to the aforementioned Facebook campaign.
A list of names and contacts of private organisations was compiled using data from some employees’ associations (such as Legacoop, Archeoimprese, CNA) websites, in addition to email contact details provided by CIA members, and a few brochure websites used by some of these organisations. In the end, 214 private organisations, working in different subsectors (excavations, preventive archaeology, education, etc.), were approached, excluding these found to have ceased trading through retirement or by being merged or bought out by other organisations.
An estimated additional 20% of small private organisations were not reached by the mailing list, as it was not possible to retrieve their contact email addresses.
A problem was posed by the firewalls active on some servers, especially these of the Microsoft group (such as Yahoo, Live, Hotmail, etc.) which effectively blocked out all emails containing the survey link. This situation was continuously monitored, and direct links to the survey were sent to these email addresses by a new CIA contact email address created to bypass said firewalls. In total, 67% of the reached contacts filled the survey, but it must be noted that the remaining 33% can mostly be referred to individuals or private organisations that, informed of the firewall problem, provided a second email address.
The same problem occurred with universities and MiBACT, whose servers flagged as spam every email sent from [email protected]: the whole process was monitored carefully, and, in case of failed delivery, a new message was sent to a second known email address when one was available or using a different email account.
On top of that, many email address contacts were found out to be deactivated or full (thus, no more used). By the end of the survey, 25% of the sent emails were returned as undeliverable, equally distributed among all categories of recipients.
Data Collection
The survey went live in November 2013 and ended in March 2014, but the collected partial data have already been publicly presented in various occasions (the first occurrence was only twenty days after the beginning of the survey, during the 2013 edition of the Mediterranean Exchange of Archaeological Tourism: at the time, only twenty respondents had filled the survey), which gave great momentum to the circulation of the survey among professionals.
It was during that same Mediterranean Exchange of Archaeological Tourism that Archeoimprese representatives advised the project team on how to improve the survey

36
addressed to private organisations and how to make it easier to fill: as a result, the survey was temporarily frozen and modified, and then launched a second time at the end of January 2014. In the end, out of 214 approached organisations, 32 (14,95%) filled the survey.
Calculating workforce estimated size
Data were collected using the 695 relevant answers, easily comparable with the available datasets provided by different workers’ associations and their websites.
They can be summarized as follow:
Sixty-five (9,35% of the total of the respondents) out of 400 MiBACT employees filled the survey: the return rate for this category was 16,25%;
Fifty-nine (8,5% of the total of the respondents) out of 371 university staff (data from the official MIUR website) filled the survey: the return rate for this category was 15,9%;
Eighty-six (0,71% of the total of the respondents) out of 86 National Research Council employees (CNR−the total number of employees was collected from the websites of the four CNR Institutes working in the archaeological sector) filled the survey: the return rate for this category was 13,95%;
Finally the 32 private organisations that filled the survey (14,95% return rate for this category), stated they employed a total of 261 archaeologists, both as part of their staff and as private contractors. Freelancers and individual archaeologists who stated they worked with or for a private organisation in 2013 were 132, which represents 19% of the total of the respondents.
Processing these last data, a total number of 1,745 archaeologists working for or with private organisations was estimated, a figure much higher than it was expected.
The response rate is similar in different categories (MiBACT, Universities, CNR, private organisations), varying from 14,81% to 16,25%, with a median of 15,26%. The actual number of archaeologists working in Italy in 2013, was therefore generated applying this rate to the number of respondents (695), resulting in a total of 4,383.
As a control, the response rate of MiBACT employees (16,25% = 65 out of 400 people) gives a result of 4,277 total archaeologists, while the response rate of universities staff (15,9% = 59 out of 371 people) gives a total of 4,370 actual archaeologists. The response rate of CNR workers was ignored as the numbers were too low (only 12 out of 86 people filled the survey).
Applying the same process to the data collected from private organisations (estimated number of 1,745 actual workers involved, which is 18,7% of the estimated population) the result is a total number of 11,672 actual archaeologists, a figure too high to be true, and completely above all other estimated sizes: in this case, though, the data is not reliable as freelancers usually work for more than one organisation at one time.
A further confirmation is given by processing in the same way the percentage of individual respondents who declared they use to work for and with private organisations (18,7%, of all

37
the respondents): the result is a total of only 840 individual workers, almost half the size of the estimated number calculated using the data collected from private organisations.
The analysis of these data underlines a strong flexibility of archaeologists, who can (and usually do) work with different organisations at the same time. This is reason why the percentage of 18,7% of all the respondents was considered more reliable and it was used to calculate the estimated number of archaeologists working with private organisations of the sector.
At this point, adding all these data and subtracting the percentage of archaeologists who stated they work in other fields (4,554 minus 3,74%) a median of 4,383 archaeologists was calculated, with a coefficient of error estimated in ±1,6%.
A.P.

38
Chapter 3: Organisations Public organisations
In public administration archaeologists are mainly employed in two ministries: the Ministry of Cultural Heritage, Activities and Tourism (MiBACT), and the Ministry of Education, Universities and Research (MIUR). In Sicily, Aosta Valley and Trentino-Alto Adige/Südtirol, autonomous regions with Special Statute, the regional departments of Cultural Heritage carry out the tasks of the Ministry: this means archaeologists do not work for the State but for the local Region or Province (like in Trento and Bolzano).
The MiBACT, whose main concerns are the preservation and promotion of Cultural Heritage, has a central agency entrusted with the coordination of all its ministerial functions, managed by different General Directorates (some of them specifically committed to a particular field, like the General Directorate for Antiquities, mainly concerned with the coordination of all activities revolving around the preservation of the Italian archaeological heritage); the Regional Directorates coordinate the local Superintendencies; finally the local Superintendencies coordinate different sectors: archaeologists are usually employed by Superintendencies for Archaeological Heritage.
Within the MIUR archaeologists can be employed as University staff, as teachers and researchers, or in the National Research Council (CNR), mostly as researchers.
MiBACT
Most of the aforementioned data are available at the Ministry website.
The survey has been delivered to the 100% of the archaeologists employed with a permanent contract (400 people). The return rate was 16,25%, equal to 65 people.
Within the Ministry archaeologists work mostly as officers (93,5%), functioning as inspectors for the assigned territory and as directors of museums and archaeological areas, while a smaller group fill the role of manager (5,5%), coordinating central and local structures of the Ministry itself.

39
Figure 16 MiBACT employees (from MiBACT official website).
Figure 17 MiBACT employees by percentage (from MiBACT official website).
Only four archaeologists (1%) are employed with a Continuous and Coordinated Collaboration type of contract (Co.Co.Co.).
No less than 214 of the 374 officers working for MiBACT in 2014 were hired after the public competition held in 2008 (at the time, 30 of them resulted proper winners, 96 others only qualified for the job. Two of the qualified ones have since then given up their place; in total 33% of all the current officers employed by the Ministry), exceeding the limits set by Italian laws in relation to the hiring policy in the public administration, but allowing to fill the shortage of officers left by retired workers and turnover.
26
374
4 0
50
100
150
200
250
300
350
400
Mibact staff
Managers Officers Co.co.co contracts
6%
93%
1%
Mibact employees by percentage
Managers
Officers
Co.co.co contracts
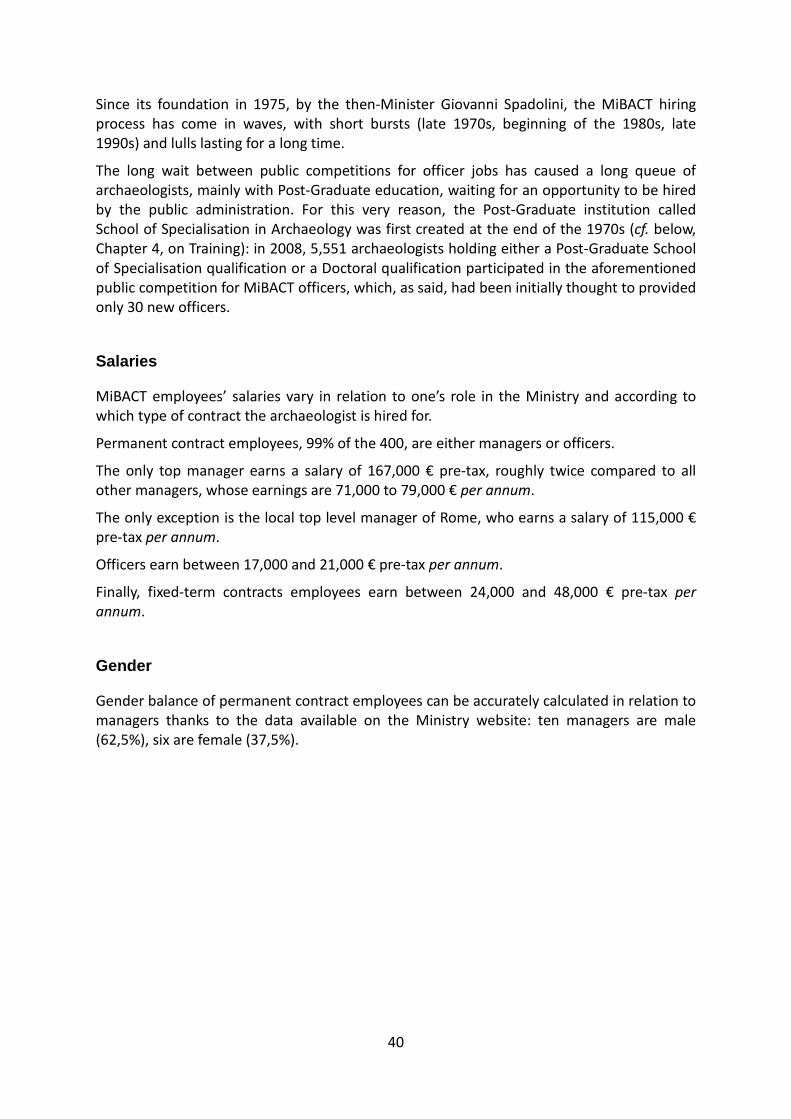
40
Since its foundation in 1975, by the then-Minister Giovanni Spadolini, the MiBACT hiring process has come in waves, with short bursts (late 1970s, beginning of the 1980s, late 1990s) and lulls lasting for a long time.
The long wait between public competitions for officer jobs has caused a long queue of archaeologists, mainly with Post-Graduate education, waiting for an opportunity to be hired by the public administration. For this very reason, the Post-Graduate institution called School of Specialisation in Archaeology was first created at the end of the 1970s (cf. below, Chapter 4, on Training): in 2008, 5,551 archaeologists holding either a Post-Graduate School of Specialisation qualification or a Doctoral qualification participated in the aforementioned public competition for MiBACT officers, which, as said, had been initially thought to provided only 30 new officers.
Salaries
MiBACT employees’ salaries vary in relation to one’s role in the Ministry and according to which type of contract the archaeologist is hired for.
Permanent contract employees, 99% of the 400, are either managers or officers.
The only top manager earns a salary of 167,000 € pre-tax, roughly twice compared to all other managers, whose earnings are 71,000 to 79,000 € per annum.
The only exception is the local top level manager of Rome, who earns a salary of 115,000 € pre-tax per annum.
Officers earn between 17,000 and 21,000 € pre-tax per annum.
Finally, fixed-term contracts employees earn between 24,000 and 48,000 € pre-tax per annum.
Gender
Gender balance of permanent contract employees can be accurately calculated in relation to managers thanks to the data available on the Ministry website: ten managers are male (62,5%), six are female (37,5%).

41
Figure 18 MiBACT, managers gender balance.
As far as officers are concerned, instead, the data collected by the survey indicate a majority of women, 70% of 400, while 30% are men. These percentages that are directly comparable with the ones estimated for the entire archaeological workforce.
In other words, ¾ of all the permanent contracts employees of the MiBACT are women, and ¼ of them are men.
Figure 19 MiBACT, officers gender balance.
MIUR
Universities
Within fifty-one Italian universities, 390 units in the teaching staff fall under the macro field of Archaeology.
9; 36%
16; 64%
MiBACT, managers gender balance
Females
Males
262; 70%
112; 30%
MiBACT, officers gender balance.
Females
Males

42
Only 371 of them are actually archaeologists, working in fifty different universities. 38 of these universities offer a Bachelor’s degree in Cultural Heritage specialising in Archaeology, while 37 universities offer a Master’s degree in Archaeology.
155 out of 371 archaeologists are Researchers (or Assistant Professors), while 216 are part of the teaching staff (77 Full Professors; 139 Associate Professors).
Figure 20 University, permanent contract archaeologists’ rank
Figure 21 University, permanent contract archaeologists’ percentages by rank.
155
139
77
0
20
40
60
80
100
120
140
160
180
University, permanent contract archaeologists’ rank
Researchers
Associate professors
Full profesors
42%
37%
21%
University, permanent contract archaeologists’ percentages by rank.
Researchers
Associate professors
Full professors
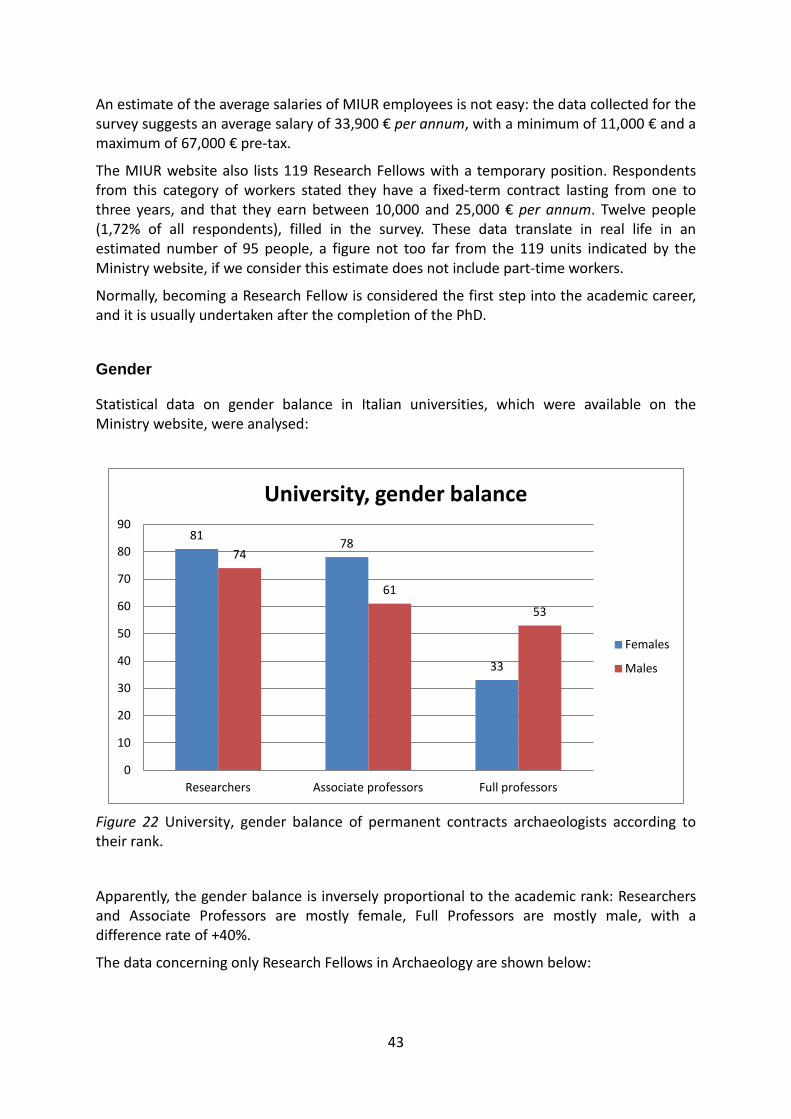
43
An estimate of the average salaries of MIUR employees is not easy: the data collected for the survey suggests an average salary of 33,900 € per annum, with a minimum of 11,000 € and a maximum of 67,000 € pre-tax.
The MIUR website also lists 119 Research Fellows with a temporary position. Respondents from this category of workers stated they have a fixed-term contract lasting from one to three years, and that they earn between 10,000 and 25,000 € per annum. Twelve people (1,72% of all respondents), filled in the survey. These data translate in real life in an estimated number of 95 people, a figure not too far from the 119 units indicated by the Ministry website, if we consider this estimate does not include part-time workers.
Normally, becoming a Research Fellow is considered the first step into the academic career, and it is usually undertaken after the completion of the PhD.
Gender
Statistical data on gender balance in Italian universities, which were available on the Ministry website, were analysed:
Figure 22 University, gender balance of permanent contracts archaeologists according to their rank.
Apparently, the gender balance is inversely proportional to the academic rank: Researchers and Associate Professors are mostly female, Full Professors are mostly male, with a difference rate of +40%.
The data concerning only Research Fellows in Archaeology are shown below:
81 78
33
74
61
53
0
10
20
30
40
50
60
70
80
90
Researchers Associate professors Full professors
University, gender balance
Females
Males

44
Figure 23 University, gender balance of Research Fellows.
What is apparent for the whole academic staff, is true also for the archaeological sector: the lowest ranks are mostly female, but the higher the rank the less the presence of women, and the proportion is completely overturned in the Full Professors category.
CNR (National Council of Research)
Four Institutes of the National Council of Research have archaeologists in their staff: the Institute of Archaeological Heritage, Monuments and Sites (IBAM), the Institute for Technologies applied to Cultural Heritage (ITABC), the Institute for the Conservation and Promotion of Cultural Heritage (ICVBC), the Institute for the Study on Ancient Mediterranean (ISMA).
The archaeological staff include a total of 150 people.
Thirty-two of them work for IBAM: 13 Researchers, 17 Research Fellows, one PhD candidate, one fixed-term employee.
Twenty-five work for ITABC: 17 Researchers, 5 Research Fellows, 3 scholarship holders.
Three work for ICVBC, the smallest of the CNR Institutes: respectively, one Researcher, one Research Fellow and one scholarship holder.
ISMA employs 25 Researchers plus the institute director, for a total number of 26 archaeologists.
74
45
0
10
20
30
40
50
60
70
80
University, gender balance of Reseach fellows
Females
Males2

45
Figure 24 CNR, employees’ roles.
Twelve of the 86 CNR permanent contract employees filled the survey, with an answering rate of 13,93%. Only four of them indicated their pre-tax earnings, between 18,000 and 30,000 € per annum.
Museums and archaeological areas
Before analysing the archaeologists’ presence in Italian museums and archaeological areas, we need to consider some data, all available in the book “Culture in Italy 2013 - Basic figures” by the Studies and Research Department of the General Secretariat of MiBACT.
0
10
20
30
40
50
60
Directors Researchers Research fellows
Scholarship holders
Phd candidates
Fixed term contract
1
56
23
4 1 1
CNR, employees’ roles.
Table 3 Open institutions in 2011(from “Culture in Italy 2013 - Basic figures”).

46
Figure 25 Museums, archaeologists’ types of contracts.
In 2011 there were 4,588 institutions open to the public: among them, 596 museums and 240 archaeological sites.
Only 108 of these refer directly to the MiBACT and the analysis of their staff can be found in the previous paragraph dedicated to the Ministry: in short, the directors of these institutions are the same archaeologists working as local officers for the Ministry, whose job is to coordinate all activities related to the preservation of the archaeological heritage in a certain territory; the rest of the staff (bar the people in charge of additional services, such as ticket selling, education, cleaning of the facilities, etc.) also depend directly from the Ministry.
In general, 63,8% of all Italian museums and archaeological areas are public: 41,6% of them are direct responsibility of local municipalities (such as Galleries and City Museums); 10% of them are ecclesiastical properties (all the churches, the Christian catacombs, diocesan museums); 9% of them, as said, refer to the MiBACT; 3,2% of them refer to other local authorities (Regions, Provinces, Mountain Communities, etc.).
This large number of institutions, art galleries, city museums and so on, is a precious heritage of the pre-Unitarian Italian States. It is rather complicated to manage at times, but at the same time represents the very essence of our national culture, especially for these institutions’ ties to local territories and the communities’ sense of pride and belonging.
These institutions are generally very small, and they often have a shortage of curators or conservation experts. They are usually run by the local municipality employees or by private organisations that keep them open as best they can.
Very seldom, they are large institutions: as is the case of the Capitoline Museums in Rome, which is one of the largest and more visited museums in the worlds, with many illustrious seats and a very complex structure.
28
25
5 5
1 1
0
5
10
15
20
25
30
Temporary duty Permanent contract
Fixed term contract
Consultant Volunteer or unpaid staff
Other
Contracts in museums

47
The current survey gave some very useful information about the archaeological workforce in museums:
Museums staff – range of jobs and types of contracts
Sixty-five (9,4%) of the respondents (695 relevant answers) stated they work in a museum: seventeen have a responsibility role within the institution (fourteen directors, three curators); twelve work as custodian or technical assistants; nine work as educators or tourist guides; three manage collections and deposits; two manage the museum catalogue; two are researchers within the institution; one works in the commercial sector within the museum. One anthropologist and one archaeologist complete the list of roles indicated by the respondents of this category of workers.
Figure 26 Archaeologists’ jobs in museums.
17 12
9 3
2 2
1 1 1
0 2 4 6 8 10 12 14 16 18
Archaeologists' jobs in museums
Anthropologist Archaeologist Commercial
Research Catalog Arch. materials/warehouse
Teaching/guide Warden/assistant Director/manager

48
Figure 27 Museums, archaeologists’ types of contracts.
Most of these workers are employed with a fixed-term contract (33 of 65), twenty-five with a permanent contract, five are external contractors (but they do not specify the duration of the collaboration). Only one person declares themselves to be volunteer un-paid staff. Lastly, one person does not specify their type of contract.
Private organisations
Private organisations in the archaeological sector mainly work in field investigation (excavations) and museums (including educational and visitor/user services), and they usually have more than one role.
The organisations mainly working in excavations can usually operate in two subsectors: public competitive bids or private construction works.
Competitive biddings to take part in archaeological digs and all that follows require the organisation to hold the OS25 Certificate, a Class IV (“Archaeological excavations”) Certificate of the ISO system of qualification: this is a document, issued by the Certificate Organism Companies, demonstrating that the company possesses specific requirements fixed by law, in order to attest the organisation’s capability to sustain any public contract work: turnover, assets, size of the employed staff.
Private construction works do not require any certifications stating the organisation’s quality standards. In this case the decision is usually (but not always) made based on the organisation’s curriculum.
28 25
33
5
1 1 0
5
10
15
20
25
30
35
Museums, types of contracts
Temporary duty Permanent contract Fixed-term contract
Indipendent contractor Unpaid Other

49
Chosen Sample
Since it was not possible to reach all the private organisations in which archaeologists work (see the data described herein), for the DISCO2014 survey 214 organisations with different corporate names that primarily work in the archaeological sector were approached: completed questionnaires were returned from 32 of them, representing 15,25% of the chosen sample.
Figure 28 Comparison between approached and respondent organisations.
Analysing the returned questionnaires it appears clear that “private archaeology” in Italy is generally divided in two subsectors, oftentimes very dissimilar: some companies operate mainly in public bidding competitions and their staff also include archaeologists; some others operate in the private construction works sector, and in this case archaeologists make up most of their staff.
To give a complete evaluation of the current situation we deemed it necessary to include in our report some of the data obtainable from some of the main websites related with the ISO qualification system.
In short, in Italy there are 484 companies working in the construction sector: 307 of them hold a ISO OS25 Certificate for public bidding competitions, 177 do not, and they principally work in the private sector. Alongside these larger companies, there is a very hard to define number of small and very small construction companies that, when dealing with archaeological works, hire archaeologists, usually with a temporary collaboration type of contract. Very rarely do they hire them as employees.
The data collected for the survey (Figure 2) show that in 2013, among the individual respondents, the percentage of archaeologists working for private companies that are not exclusively archaeological was about 10,2% (71 people: 30 worked for larger construction companies, 41 for smaller private organisations).
0
50
100
150
200
250
Contacted companies Respondent companies
214
32
Comparison between contacted and respondent companies

50
As mentioned, the two subsectors are very much divided. Of the 214 approached organisations, only 37 of them (17,3%) held a ISO Certificate.
As a matter of fact companies that need a OS25 ISO Certificate, the one required for archaeological excavations, cannot be properly defined as archaeological, since they are mainly construction companies, also providing earth work and engineering/architecture design services. At some point they acquired the necessary qualifications to take part into public bidding competitions for archaeological excavations, but they are not run by archaeologists.
Companies’ business name
We asked organisations to state their business name (which type of business entity they are):
Figure 31 Business name of the respondent private companies.
8; 22%
6; 16%
4; 11%
14; 38%
3; 8%
2; 5%
Archaeological companies' business name
coop.
s.c.a.r.l.
s.n.c.
s.r.l.
Altro
Nessuna risposta
307; 63%
177; 37%
Companies in italian archaeological market
OS25
No OS25
37
177
Companies contacted
OS25
No OS25
Figure 29 Companies working in the archaeological market.
Figure 30 OS25 qualification held by contacted companies.

51
The prevailing corporate names are: cooperative companies (Cooperative Limited Liability Company−S.c.a.r.l. or Coop.), 38,% (respectively 22% Coop. + 16% S.c.a.r.l.) and L.d.t.’s (Private company limited by shares, Italian: S.r.l.), same percentage.
These data reflect the origin of Italian private archaeological organisations, first created between the late 1970s and the beginning of the 1980s, to gather individual professionals into companies with low management expenses and a democratic structure, and with low economic risks for all the partners. Many of those companies then turned into Scrl’s or Ltd’s over the years.
Very low (11%) is the presence of Commercial General Partnerships (S.n.c.), which can be equalled, from a fiscal point of view, to Associate Firms, business entities very common for professionals others than archaeologists, like lawyers, architects, engineers, etc.
We also asked archaeologists for the corporate name of the companies they work for:
Figure 32 Business name of the companies working with archaeologists.
The percentages are close (please note that in the graph Coop’s and Scarl’s are united in one category), with a slight dominance of Ldt’s (42%) over Coop’s (36%).
The big difference is the percentage of the associated firms, only 5%, half the percentage indicated by the respondent private organisations: this variance can be explained with the fact that associated have a tendency to keep the jobs they undertake within the circle of their associates, without the involvement of external contractors, way more frequently than cooperatives or Ldt’s do.
12% of the responses classify the organisations as Cultural Associations. The cultural association is an institution half way between companies and charity work. They have a very big impact on both the tourist guides and education services markets.
0
10
20
30
40
50
60
70
80
90
100
1 1 1 2 2 3
12
26
80
94
Business name of companies according to archaeologists' answers
s.a.s.
Impresa individuale
Charity
s.n.c.
Spa
Altro
Studio Associato
Associazione Culturale
coop.
s.r.l.

52
Employers’ Associations
There are three main employers’ associations gathering archaeological organisations: the Cooperatives League (Legacoop), the National Confederation of Artisans and of Small and Medium Businesses (CNA), and ArcheoImprese.
Legacoop
Born in 1889, the Cooperatives League counts at the moment 15,000 associated companies. Only fifteen of these companies are archaeological organisations, four of them holding a ISO OS25 Certificate.
CNA
Founded in 1946, the National Confederation of Artisans and of Small and Medium Businesses, counts over 67,000 associate, between companies and self-employed individuals. It was not possible to calculate the number of archaeological organisations within this association.
Archeoimprese
Founded in September 2012, Archeoimprese aims to gather and represent only the archaeological private organisations. Up to this moment 24 archaeological organisations are part of this association. Eleven of them can take part in public bidding competition as they hold a ISO OS25 Certificate.
Size of organisations
The organisational size was determinate for eighteen of the organisations that returned the survey:
Figure 33 private companies, structure and business name.

53
Figure 33 shows that essentially archaeological organisations are very small enterprises (in the graph they are listed based on the total number of employees). However, only half of them employ hired staff, while the others usually hire external collaborators. With one exception, only the largest companies are provided with a SAO OS25 Certificate. Within smaller organisations the total number of associates and the number of employed archaeologists are the same, while in the larger ones, associates include other kinds of professionals, particularly administrative and supporting staff. Only one organisation, a cooperative, employs over twenty people (172 employees). All the others employ no more than fifteen people. In the smallest companies the number of external collaborators exceeds the number of associates, like in one case in which there are 25 collaborators and two associates.
Salaries, contracts and payments
We asked each organisation which types of contracts they apply to their employees:
Table 4 conveys the salaries agreed on in the National Collective Labour Agreement (CCNL) for employees of the construction sector as divulged by the FILCA CISL Union website, and those the salaries of professional studios as presented on the Filcams CGIL Union website, updated to April, 1st 2013 (both are to be considered purely approximate):
Figure 34 private companies, employees’ type of contracts.

54
Archaeologists’ salaries are included in levels 4° to 6° of the contracts for employees of the construction sector. In the same level the salaries for other professionals usually working on construction sites, such as architects, engineers, surveyors, etc. are also included.
Rarely are archaeologists’ salaries ruled according to the salaries agreed on for professional firms, respectively in levels 2° and 3° of the aforementioned table. The latter wage system, though, is only used by 5% of the respondent organisations, even if it should be discontinued altogether since the contracts of archaeologists working on excavations are already mostly ruled according to the CCNL for employees of the construction sector.
Moreover, for the same role/responsibilities, the CCNL guarantees +300/400 € of monthly salary.
As far as project based contracts are concerned, Italian laws require rates not to be lower than those agreed in the national labour agreement that applies. It must also be noted that this type of contracts is illegal for jobs included in the organisation’s principal role of activity and for activities that are considered simply subordinated and devoid of decision and management autonomy.
Lastly, as far as free lancer archaeologists go, either VAT holders and those hired with Withholding Tax system contracts, a binding rate-table does not exist. Many years ago some were proposed by local Superintendencies, while, more recently, the different professional associations created two rate-tables (see below, Chapter 5).
The gathering of data in these past few years showed that there are big differences between companies and between different categories of workers: on average, the daily rate for an archaeologist supervising works concerning side services of the construction industry (such as laying or substituting gas tubes or water pipes, electrical cables, optical fibre cables, etc.) is 50-70 €, while for the archaeological excavation itself is 70-120 €. However, over the past three or four years, the average rates decreased, so that currently they are around 5-10 € per hour. Particularly in the first instance, supervising side services, the downward trend (sometimes even with a +56% rate) caused a fall of the average rates, oftentimes calculated on an hourly basis, although sometimes, an additional sum is provided when recording is needed.
As for the average waiting time to receive the agreed payment, it can be useful to compare the answers given by organisations and individual archaeologists:
Table 4 salaries agreed on in the CCNL for employees of the construction sector and salaries of professional firms.

55
Figure 35 average waiting time for payments according to freelance archaeologists.
Most of the individual respondents working for private organisations (118 in total) state they generally receive regular payments (42); for a good number of them payments are issued four to six months after the job (33); finally, for a smaller group, payments are issued seven to twelve months after the job.
Figure 36 average waiting time for payments according to companies.
42
4
8 7
33
17
7
0
5
10
15
20
25
30
35
40
45
Regular payment
1 month delay
2 months delay
3 months delay
4-6 months delay
7 months – 1 year delay
Over 1 year delay
Payment timetable according to archaeologists
6
5
3
1
0
8
0
1
2
3
4
5
6
7
8
9
0 - 30 dd 31 - 60 dd 61 - 90 dd 91 - 120 dd + 120 dd When custumers pay
Payments timetable adopted

56
The majority of the respondent organisations (11 of 23) state they usually issue due payments to archaeologists two months after the job, while another part of them says payments are only issued when their client pays them.
Figure 37 average waiting time for payments by private and public clients according to companies.
The comparison between these answers makes it apparent that that waiting time from three months to one year, as stated by 57 of 118 individual respondents, is the same amount of time it took in 2013 for public and private clients to pay off the majority of private archaeological organisations.
The small size of Italian archaeological organisations, generally with corporate name designed to provide maximum protection to the associates’ funds (75% of them are companies with limited liability), subjects them to the risk tied to the lack of currency and makes them wary of advance payments for finished job, especially with the current economic crisis.
7 6
8
1
3
5
10
2
0
2
4
6
8
10
12
0 - 90 dd 91 - 150 dd 151 - 365 dd + 365 dd
Payments timetable of private and public custumers
Medium payments timetable of private costumers
Medium payments timetable of public costumers

57
Staff turnover and hiring standards
Generally, a decrease of fixed-term contracts is apparent, which is not balanced out by the rise of other type of contracts: it seems there was only a decrease in the numbers of those who work with and for archaeological organisations. Even so, it is not easy to apply this information to reality, since the survey only provided data for those who, even after changing jobs, still remained in the profession, while almost completely lacking are respondents who left the profession.
The data regarding archaeologists’ role within private organisations are very interesting:
Figure 38 private companies, archaeologists’ role within the organization (2012).
97
19 18
1 1 1 0
10 20 30 40 50 60 70 80 90
100 110
Archaeologists' working with companies jobs (2012)
Consultants Employees Associates/owners
Administrators Technicalmanager RSPP (job safety resp.)
Table 5 private companies, archaeologists’ type of contracts.

58
Figure 39 private companies, archaeologists’ role within the organisation (2013).
The decreased number of employees, in fact, has been balanced out with the increase of the number of organisations’ associates/owners: however it seems that the change in role did not happen from employee to associate, but involved a good number of previously external contractors and unemployed archaeologists. In 2013, for example, the survey revealed eleven new associates of archaeological organisation: four of them were external contractors in 2012, five were previously unemployed, and only one of them was a former employee.
There are two possible scenarios to explain this: on one hand there is the founding of new companies by unemployed people who tried thus to solve their lack of occupation; on the other hand new associates can be an attempted recapitalization on the part of some archaeological organisation by involving former trusted external contractors and employees.
The data regarding the average length of employment, that is how long archaeologists have been working for private organisations, give validity to this analysis. The average time of employment in the field is 9 year (median is seven years, meaning half of the archaeologists have worked with private organisations for less than seven years, half of them for more), with a small percentage of people who have been working for private organisations for one (3 of 130) or two (11 of 130) years.
We also asked organisations how they choose and use their collaborators:
84
12
29
1 2 1 0
10
20
30
40
50
60
70
80
90
Archaeologists' working with companies jobs (2013)
Consultants Employees Associates/owners
Administrators Technicalmanager RSPP (job safety resp.)

59
Figure 40 how private companies choose and use their collaborators.
Only a small part of the organisations are favourable to staff turnover (“we have a large group, we use people on rotation”), while the vast majority of them prefers to hire trusted individuals, mostly chosen according to what kind of job is needed.
5% of the respondent organisations state they choose their external contractors based on whether they are or are not VAT holders, which, apparently, is considered the less expensive, tax-wide, type of hired work.
The large number of external collaborators, which makes for low rates of loyalty building by workers for private organisations, is also apparent in the number of hired freelancers (more on this in Chapter 2, p. XX): a calculation based exclusively on the answers of individual respondents gives a figure of about 840 actual archaeologists, but the same calculation based on the answers of respondent organisations gives is twice as much, 1,745; this variance can be explained with the fact that freelancer archaeologists, who are not tied to one single organisation, have the tendency to work with more than one company at the same time, to guarantee themselves a continuous working regime or higher incomes.
Quality systems
Many private organisations identify skill gaps in their employees or collaborators (19 out of 23; one organisation did not reply), but only seven provide them with a training, while sixteen do not (one did not answer).
10; 50%
2; 10%
7; 35%
1; 5% How do you choose consultants ?
I have a fixed group of consultants
I have a large group of consultants and i use them at rotation According to the job to perform
According to VAT number hold

60
Employees’ training is realised both inside the company and through outsourcing: two organisations provide training internally, one out of seven turns to external collaborators, while four out of seven use both methods, but only four out of seven organisations have a dedicated fund in their budget.
OS25
In this paragraph only the private organisations holding the OS25 Certificate of the ISO system of qualification will be considered. As mentioned before not all the private organisations employing, one way or another, archaeologists, are mainly made up of archaeologists, but there is definitely a sizeable portion of the market revolving around archaeological excavations.
Figure 43 private companies, geographical distribution of companies holding an OS25
Certificate.
The data available on ISO qualifications dedicated websites indicate that the vast majority of organisations filing for the OS25 Certificate are in Central and Southern Italy.
38; 12%
100; 33% 116; 38%
53; 17%
OS25 macroareas distribution
North
Centre
South
Islands
7; 30%
16; 70%
Have you got any formal training plan?
Yes
No 19; 83%
4; 17%
Does your company identify workers' training needs?
Yes
No
Figure 41 Identification of workers’ training needs
Figure 42 private companies and employees’ training, presence of dedicated training plan.
61
Only 12% of the OS25 Certificate holding organisations are from Northern Italian regions, which are generally considered as the industry area of the country. 17% of them are based in one of the two main islands (Sicily and Sardinia), 33% in Central Italy, 38% in the South.
The smallest companies, which are allowed to take part in competitive biddings under 258,000 € worth, show basically the same characteristics. Even fewer of them based in Northern Italy (only 6%). Southern Italy has almost half of all such organisations (44%), and one third are located in Central Italy.
Companies allowed to take part in competitive biddings under 516,000 € worth are equally present over the national territory, with a slight prevalence of presences in Central Italy.
Almost half the organisations allowed to take part in competitive biddings over one million Euros worth are in the South (47%). 29% of them are based in Central Italy; 17% in the two main islands; and only 7% of them in the North.
If the biddings is worth 1,500,000 €, 10% of the organisations allowed to take part in the competitions are in the main islands; 17% in the Northern regions; 33% in the South, and the remaining 42% in Central Italy.
Over 2,5 millions € worth, only 9% organisations are based in the North; 22% in the islands; 28% in Central Italy; 41% in the South.
Figure 44 private companies, geographical distribution and classification.

62
Four organisations are allowed to take part in public competitive biddings up to 3,5 millions €: two of them are based in Central Italy, and two, respectively, in the South and in the islands. None in the North.
The highest rank of companies holding a OS25 Certificate is made by very large organisations whose assets allow them to compete for works amounting to over 5 millions € or higher.
In Italy only 17 companies posses these characteristics: eight are based in the South, seven in Central Italy, one in the islands, one in the North.
Figure 45 private companies, regional distribution of companies holding an OS25 Certificate.

63
On a regional basis, it is apparent that Lazio and Campania alone dominate the biggest part of the market, with, respectively, 82 and 74 companies varying in size.
It is obvious that this situation is somewhat linked to the presence in both regions of two of the biggest archaeological “capitals” of the Italian territory, as Rome and Naples-Pompeii. Sicily (41 companies) is the third region for number of companies OS25 qualified, followed by Apulia (14), Sardinia (12), Calabria (10), Emilia-Romagna, Tuscany and Basilicata (9), Abruzzo, Piedmont and Veneto (7), Lombardy (6), Marche (5), Liguria and Umbria (4), Molise, Trentino-Alto Adige/Südtirol, Aosta Valley (2), and, finally, Friuli-Venezia Giulia (1).
All Italian regions have at least one small company (I, II or III level of the classification).
About half of them (eleven out of twenty regions) have a middle-sized company (IIIbis, IV, IVbis level of the classification).
Only ¼ (five out of twenty) has within its confines large companies (V, VI, VII, VIII level of the classification).
Figure 46 private companies, regional distribution of companies holding an OS25 Certificate

64
Activities and offered services
Italian archaeological organisations state they have a varied market to which they offer numerous services:
Figure 47 private companies, offered services.
Generally, companies offer and clients’ expectations are level: the most needed services are, obviously, these revolving around activities such as excavation, graphic documentation and restoration, which are tied to the most common requests coming from the local Superintendencies. There are low requests for manpower, and only half of the organisations offer earth work services (therefore they are constituted mainly by archaeologists and do not posses any construction machinery).
In the second part of the graph some of the most recent services offered by the organisations are present, such as web-GIS, 3D restorations, and the VIArch (Preventive Verification of Archaeological Interest, as required by Italian laws): these services, though, struggle to find their niche market in the excavation and construction sector.
In the same way, organisations struggle to get into the museum education and the experimental archaeology market: in fact, the supply almost doubles the demand. An exception are some tourism related services like, tourist guides and such, whose market is growing (thirteen organisations offer it, against eleven that are requested it). Many companies previously engaged in excavations as their principal role of activity, currently offer this service, mainly due to its low expense.
0
5
10
15
20
25 23 21
13
16
3
10
13
8
12 13
15 13
8
23
19
11 9
3
10 11
4
7 8 8 8 8
Comparison between services offered and requested to companies
Typology of offered services Typology of requested services

65
Post-excavation activities
We asked organisation whether clients (and, consequently, organisations themselves) are used to pay for excavation recording work: 22 of the 32 respondents answered the questions and it turns out that the large majority of organisations, and consequently the archaeologists working for them, do not see the recording work as deemed worthy of payment.
The previous table shows that the only activity worth payment for at least half of the organisations, is the washing of the finds, an operation that usually happens on site and thus considered integral to the job.
As for the rest, most of the organisations state that everything related to the excavation but not directly involved in the excavation itself is mainly an unpaid activity, even though archaeologists do it. In some cases it is the up to the client or the Superintendence to
Table 6 post-excavation documentation, comparison between what clients pay to private companies and what private companies pay to archaeologists.
Table 7 clients and companies’ post-excavation activity.

66
require and to pay for such activities, especially those concerning the cataloguing of finds and later publication of data.
Annual Turnover
We asked some questions about the company’s turnover in the last and in the previous years: unfortunately, organisations only answered about the last fiscal year, 2012.
We also asked them to indicate the type of jobs they undertook, and to estimate the percentage of total turnover each job brought to the organisation.
To the first question, sixteen organisations (50%) answered as follow:
Figure 48 private companies, 2012 turnover.
Half of the organisations who answered (8) declare a total turnover under 50,000 €; 25% (4) of them between 50,000 and 100,000 €; one organisation between 100,000 and 500,000 €, and three over 1,000,000 €.
There is an apparent gap, then, in the archaeological market, with 80% of all organisations earning less than 500,000 € per annum, half of them under 50,000 €. No organisations are included in the 100,000-500,000 € range, and only 18% of them can earn over one million Euros a year.
To the second question organisations answered as follow:
6
2
4
1
0
3
0
1
2
3
4
5
6
7
Annual turnover (2012)

67
Figure 49 private companies, estimate percentage of turnover brought by each job.
The highest percentage comes, as expected, from excavation activities (28% + 21% excavations in construction sites), while preventive archaeology activities (which can also include excavation) represents 22%.
A good portion of the turnover comes from activities linked to education and guided tours.
Very low is the percentage regarding research excavations (8%), and recording/cataloguing (less than 2%).
We also asked organisations to estimate the constitutional basis for all their clients (sixteen relevant answers):
28%
21% 22%
8%
2% 16%
3%
Percentage of turnover Total for excavation
Total for archaeological assistance
Total for preventive archaeology
Total for research excavation
Total for cataloguing
Total for other (teaching/guided tours/etc.)
Don't know

68
Figure 50 private companies, clients.
Almost half of their market is made up by private clients, while 35% are public institutions. MiBACT only represents 4% of the market, and private foundations 1%.
24 organisations indicate the following duration of excavations:
Figure 51 excavations, average duration.
4%
36%
1%
48%
11%
Types of clients percentage
MiBACT
Public authorities
Foundation
Private clients
Other
0
3
7
6
4
1
2
1
0
1
2
3
4
5
6
7
8
01 - 07 days 08 - 15 days 15 - 30 days 01 - 02 months
03 - 04 months
05 - 06 months
07 - 12 months
+ di 12 mesi
Average duration of excavations

69
For 44% of the respondents excavations last on average less than a month, while for another 42% they go on for less than four months. For the remaining 16% they last over four months and only for 4% of the organisations they continue for over one year.
As for the time of wait for due payments from public and private clients:
Figure 52 delay in due payments from public and private clients according to companies.
Private clients are usually faster, as shown by the first two columns in the graph: seven organisations state the average wait for private clients’ payments is under 90 days; only three organisations state the same for public clients. In higher rank companies there is a slight prevalence of organisations that consider the public clients’ time of payment longer than the private ones’. Even more interesting is that the majority of the respondents indicate, for both public and private clients, an average time of waiting for due payments between six months and a year.
Business confidence
The economic crisis of the last few years certainly did not allow a high rate of business confidence. The data show that, for those who manage archaeological organisations, short-term hope in a better market in the future is rather thin. In fact, only ⅓ of the respondent organisations plan on expanding next year and only ⅓ thinks that the archaeological labour market will see more employees in the sector. Things change a little when asked about long-term future: the percentage of organisations that expect an increase of work within the sector is 55% of the respondents.
We also asked to identify the main obstacles organisations see, as entrepreneurs, in the Italian economic system, assigning a score from 1 to 5 to all the suggested answers, based to their importance, (where 1 = little or of no importance, 5 = fundamental. Figure 56).
0
2
4
6
8
10
0 - 90 dd 91 - 150 dd 151 - 365 dd + 365 dd
7 6
8
1
3
5
10
2
Clients payment timetable
Medium payments timetable of private costumers Medium payments timetable of public costumers
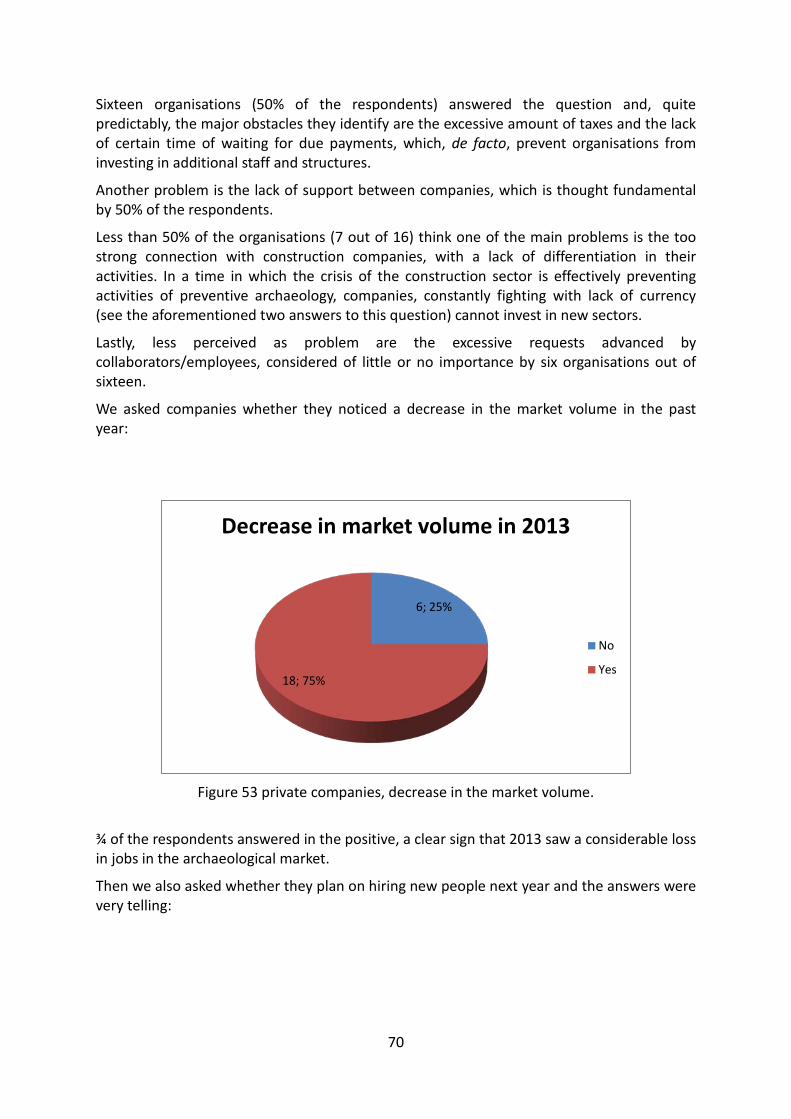
70
Sixteen organisations (50% of the respondents) answered the question and, quite predictably, the major obstacles they identify are the excessive amount of taxes and the lack of certain time of waiting for due payments, which, de facto, prevent organisations from investing in additional staff and structures.
Another problem is the lack of support between companies, which is thought fundamental by 50% of the respondents.
Less than 50% of the organisations (7 out of 16) think one of the main problems is the too strong connection with construction companies, with a lack of differentiation in their activities. In a time in which the crisis of the construction sector is effectively preventing activities of preventive archaeology, companies, constantly fighting with lack of currency (see the aforementioned two answers to this question) cannot invest in new sectors.
Lastly, less perceived as problem are the excessive requests advanced by collaborators/employees, considered of little or no importance by six organisations out of sixteen.
We asked companies whether they noticed a decrease in the market volume in the past year:
Figure 53 private companies, decrease in the market volume.
¾ of the respondents answered in the positive, a clear sign that 2013 saw a considerable loss in jobs in the archaeological market.
Then we also asked whether they plan on hiring new people next year and the answers were very telling:
6; 25%
18; 75%
Decrease in market volume in 2013
No
Yes

71
Figure 54 private companies, prevision on their hiring new people next year.
For 76% of the respondent organisations the current economic contingency prevents hiring, a percentage equalling that of those that noticed a decrease of the market volume within the last year.
Finally, we asked organisations to predict whether, in their opinion, there will be more or fewer archaeologists in one and in three years:
Figure 55 private companies, prevision on the number of archaeologists in 1 and 3 years.
5; 20%
19; 76%
1; 4%
Are you planning to hire new employees next year?
Yes
No
Don't know
8; 17%
12; 25%
4; 8%
24; 50%
Do you think there will be more or less archaeologists in three years time?
Less
More
The same number
Total responses
7; 14%
8; 17%
9; 19%
24; 50%
Do you think there will be more or less archaeologists next year?
Less
More
The same number
Total responses

72
Caution is prevalent about next year: the respondents are fairly equally divided into three groups, those that believe there will be fewer archaeologists (28%), those that believe there will be more archaeologists (32%), and those that think they will be the same (36%), with this last response prevailing.
In the three years prediction, instead, there’s more confidence into a growth in numbers of archaeologists (48%), comparatively less organisations think they will remain the same (16%), while slightly more consistent is the group of those that believe there will be fewer archaeologists (32%).
T.M.
Figure 56 Major obstacles encountered by Italian companies.
0 2 4 6 8 10 12 14
1
2
3
4
5
Major obstacles to companies' development
Excessive link to building sector
Lack of documentation standards from MiBACT
Excessive requests from workers
Lack of companies solidarity
Lack of clear rules about contracts to apply in archaeology
Lack of rules that prize companies organisation
Lack of real competition between companies
Lack of guarantees for time of payments
Excessive taxes
High lobour costs
Excessive bureaucracy

73
Chapter 4: Archaeologists
Growth of the profession
In July 2008 the Ministry of Cultural Heritage, Activities, and Tourism (MiBACT) held a public competition for 30 places as level FIII archaeological officers (funzionari). The Ministry received 5,551 applications from archaeologists with either a post-graduate School of Specialisation or a Doctoral qualification. It is probable, however, that the actual number of people among them working in the archaeological sector at the time was lower. Even so, that is the only useful information to offer some kind of estimate of the real number of archaeologists who, holding either type of post-Graduate qualification, applied that year for a permanent job in archaeology.
In the following years, due to the economic crisis, the number of working archaeologists is thought to have decreased; the currently estimated figure of 4,492 people (coefficient of error ±3,32%) is considerably lower than the estimated size of the archaeological workforce in 2008, and indicates a loss of jobs which can be compared, on one hand, to the analogous situation in the construction market (according to data from the Italian National Builders’ Association, ANCE, the downward trend has been lasting for six years in a row now, with a decrease in investment of 29%), and, on the other hand, to the decrease in the numbers of new archaeology students, as will be described herein.
New entrants to the profession
While a decrease in the number of working archaeologists in the five years before 2013-14 can be supposed, as shown by the data collected for DISCO2014 (cf. Chapter 1), the same can be said about the number of potential new entrants to the profession.
This paragraph considers the population of graduates who obtained a degree in Field of Study “Archaeology”, Code 10/A1. They are only regarded as potential new entrants because not every student who was awarded an archaeology degree will attempt or even want to attempt work in their field of study.
It must be said that the survey only took into consideration degrees relating to the archaeological field of study, starting from the Bachelor’s Degree.
A degree in archaeology, in fact, has been used as a discerning factor in the identification of the survey sample, according to the requests the Italian Confederation of Archaeologists (CIA) and other professionals’ associations have been forwarding for years, even with and especially because, of the lack of regulations in the subject in Italian law.
The Bachelor’s Degree is the first level of education. Italian law assigns it the Class code LI, included in the field of Study “Cultural Heritage”, (according to the Ministerial Decree No. 270/04 = Class code 13, Field of Study “Cultural Heritage Science” according to the Ministerial Decree No. 509/99).

74
The Master’s Degree in Archaeology is the following step, awarded after a two-years course, Class code LM-2, Field of Study “Archaeology” (according to the Ministerial Decree No. 270/04 = Class code 2/S, “Archaeology”, according to the Ministerial Decree No. 509/99).
The third level of academic education can only be pursued after a public competition necessary to access both the two year courses of the Schools of Specialisation in Archaeology, and the three year Doctoral programs.
The first institution aims to train archaeologists for roles entailing responsibilities related to the preservation, management and promotion of the archaeological heritage, both in public and private organisations. On the other hand the PhDs allow archaeologists to carry out specific research programs, supported by one University, being awarded of a scholarship, or even not.
Schools of Specialisations and PhDs are then two different paths that lead to two different but complementary professional profiles.
Post-graduate education can also be achieved by applying for a 1st or 2nd level Post-Graduate Master Course (respectively, levels 7 and 8 of the European Qualifications Framework, EQF). According to the Legislative Decree No. 63/2008, however, either a School of Specialisation or a Doctoral qualification allow the assignment of jobs for activities related to that process known in the Italian Cultural Heritage regulation as VIArch (Preventive Verification of Archaeological Interest).
At the moment, 49 universities in Italy have a Master’s Degree in Archaeology (class code 10/A1), as shown in the table below. This figure includes all the university departments that offer courses referring to the following Education Fields: L-ANT/01, Prehistory and Protohistory; L-ANT/04, Numismatics; L-ANT/06, Etruscology and Italic Archaeology; L-ANT/07, Classical Archaeology; L-ANT/08, Christian and Medieval Archaeology; L-ANT/09, Ancient Topography; L-ANT/10, Methodology of Archaeological Research; L-FIL-LET/10, Aegean Archaeology.

75
Table 8 Geographical distribution of universities offering courses referring to the Field of
Study 10/A1, Archaeology.
It is possible to identify some tendencies in education, which show a strong decrease in the number of potential archaeologists in the national labour market.

76
Figure 57 University enrolment for education fields (Almalaurea dataset 2013, from VANZETTI, to be printed).

77
The graph shows how the numbers of students awarded with Bachelor’s and Master’s Degree in archaeology have changed since the economic crisis started:
It is apparent that students who obtain a Master’s Degree in Archaeology, and who, potentially, will want to attempt to become professional archaeologists, have been, in the 2009-2012 period, about 21 % of the students awarded with a Bachelor’s Degree in Cultural Heritage. The data indicate that many potential archaeologists (first level graduates) do not choose to pursue their studies and the archaeological profession.
Also, in 2010, there were 3,5% less students awarded with a Bachelor’s Degree.
On the contrary, as far as Master’s degrees are concerned, it seems a constant growth was registered between 2009 and 2012: the downward trend of the last few years did not stop, and university enrolment as a whole failed to reach the same levels of the previous decade, but there has been a constant growth in relation to first level graduates, with a +12 % rate, going from 13,5 % to 25,6 %.
As far as entrance into the profession is concerned, the 2012 Almalaurea Consortium dataset reveals that 54,1 % of second level graduates had obtained a job within the five years following completion of their Master’s degree.
The percentage for second level graduates in Archaeology was 61,2 %: 60,2 % were female graduates, 63,9 % male.
Figure 58 First and second level degrees awarded in Archaeology.
Table 9 First and second level degrees awarded in Archaeology.

78
The National Institute of Statistics (ISTAT) dataset reveals an average occupation rate of 72,7% for all graduates, compared with whom the percentage of archaeology graduates is noticeably lower, −11,5/12,5 % (Almalaurea dataset, from VANZETTI to be printed).
One more piece of information that can be used to estimate the number of potential new archaeologists in the national labour market is the amount of second level graduates who apply for a Post-Graduate School of Specialisation in Archaeology.
At the moment in Italy there are seventeen Schools of Specialisation in Archaeology originally founded to provide higher education for future officers within local Superintendencies for Archaeological Heritage. In addition to these there is the Italian Archaeological School of Athens, founded in 1909 to coordinate Italian archaeological missions in Greece, as well as to allow students to spend a semester abroad, as was compulsory when the institution was instigated (BANDINI 2008) and today only available to those who, after sending in an application, are admitted to take part in one of the exchange programs promoted by the European Commission.
In total, the number of places available in the academic year 2013/2014 were 454.
The figure was compared to those of previous years, starting from the first available data, dated back to 1979/1980 (CARCONI ZANECCHIA 1982):
Table 11 Students admitted into Schools of Specialisation in Archaeology and available
places in academic year 2013/2014.
Table 10 Schools of Specialisation in Archaeology in Italy in academic year 2013/2014 (source: MIUR).

79
The number of places available for the 2013/2014 surpasses by 80 units the number of current job positions as local Superintendencies’ officers, which is the only position inside the MiBACT for which either a School of Specialisation in Archaeology or a Doctoral qualification is at the moment required: the qualification, in fact, is not mandatory to access the roles of General Director, regional Director or Superintendent. To access the latter, in fact, a first level degree is sufficient (as decided in occasion of the last public competition for ten job positions as archaeological managers in 2007, Directorial Decree No. 01/03/2007).
It should be noticed that the number of archaeologists working as officers for the MiBACT can fluctuate from one year to another, depending on the number of retirements and new hires. Between 2010 and 2013, in fact, and after the last public competition in 2008, 114 new officers, either winners at the time or archaeologists who had results that would qualify them for the job but were not hired due to lack of available positions, have been hired, with a median of 28 newly employed archaeologists per year. In total the number corresponds to 1/9 of all the Schools of Specialisation students, and is sixteen times lower than the number of places available every year.
In the private sector, the number of places available within Schools of Specialisation surpasses of 147 units the number of all Technical Directors (307) employed by private companies holding a ISO OS25 Certificate and working in Italy in the preventive archaeology market (cf. Chapter 3); this number is interesting since Italian law requires the School of Specialisation in Archaeology or the Doctoral qualification to become a Technical Director.
Even so, the total number of places available every year is still too high for the actual absorption capacity of both the MiBACT and private organisations’ managerial ranks: in fact, if for two years in a row all the available places were to be assigned, then the national market would be overflowing with potential officers or managers, as these are not job positions with an annual vacation frequency.
Also, the frequency of public competitions for MiBACT officers (category FIII), which occur infrequently and very far apart (after 1999 it was then called almost ten years later), and the decrease in number of private archaeological organisations, make apparent the reasons behind this saturation of the job market.
Finally, it must be noted that the School of Specialisation qualification is mandatory to receive assignments relating to the writing of VIArch (Preventive Verification of Archaeological Interest), and that means the qualification can still be profitably used in the labour market by freelancer archaeologists.
However, of the 454 available places for 2013/2014, only 260 were assigned: it may be an indication of a low level of confidence in the archaeological labour market, which deters second level graduates in Archaeology from additional expenses of money and time on a post-Graduate qualification, e di una tendenza dello stesso ad autoregolamentarsi particularly considering what is currently known about the profession.

80
Distribution
We asked archaeologists who their employers had been in 2013 and in 2014.
It turns out 61 % of the employers were public organisations, both national (46 %) and local (15%). This means that the work demand mainly relates to activities connected to research, protection, prevention, promotion, all typical of institutions such as Universities, Superintendencies, Regional and Provincial institutions and local municipalities.
However, the high number of private employers (39 %) reveals that the profession is also deemed necessary by private companies specialising in services. Direct contracts with private clients, in fact, with no firm or company or cooperative acting as a liaison, are rather uncommon: according to the respondents of DISCO2014, being a freelance archaeologist means to have one or more contracts, at the same time, with public institutions and private organisations, more than having direct relations with every private client.
Figure 59 Type of archaeologists’ employers/clients.
The data gathered for this survey reveals that between 2013 and 2014 the main employers of individual archaeologists were the Universities, and, with a slight minor percentage, archaeological private companies. The MiBACT was the third main employer; followed by local municipalities, which, among local authorities, are the ones that need to employ more archaeologists.
A good number of archaeologists work in the tourism sector. This fact is not only−and not especially−a consequence of the high number of promotion activities carried out all over the country, but more possibly the effect of paragraph 10 of Law No. 40/2007, the so called “Bersani Decree”, later abrogated by the Legislative Decree No. 97/2011: said paragraph admitted the Degree in Literature, specialising in Archaeology or Art History, as a valid qualification for access to the tourist guide profession, without the need for applying graduates to pass the necessary examination.
343; 45%
116; 15%
295; 39%
3; 1% 3; 0%
Employers, public and private (2013)
Public - National
Public - Local authorities
Private
Mixed
Ecclesiastical

81
Table 12 Working archaeologists for type of employer/clients.

82
Figure 60 Employers (multiple-choices question).
It is possible to compare the data for 2013 (763 relevant answers), to these related to the previous year, 2012 (744 relevant answers):
121
22
4
19
16
62
20
159
12
18
5
20
3
137
47
30
18
41
3
1
3
14
0 50 100 150 200
Organisation where archaeologists are employed (2013)
Unemployed
Indipendent customers
Publishing house
Ecclesiastical organisation (including museums) Other companies
Engineering company
Biulding companies
Tourism company (guides)
Private archaeological companies
Mixed foundation
Private foundation
Public foundation
Foreign Research Insitute
Nat. Centre for Research
University
Other public organisation
Municipality (including museums)2
Provincia
Regione
Altro ministero
MIUR
MIBACT

83
Figure 61 Employers/clients in 2012-2013.
The comparison reveals that in the last year there has been a strong increase in employment from Universities, and, to a smaller extent, from the MiBACT. For this last data, though, it needs to be noted that among these new employees there are also these archaeologists who, in the last public competition for MiBACT officers in 2008, had results that would qualify them for the job but were not hired due to lack of available positions, and those who, over the past few years, went to fulfil the positions that were being vacated because of employees turnover. A slight increase has also been registered in the number of archaeologists employed by other Italian Ministries, by private companies operating in the tourism sector, and by other kinds of organisations.
On the contrary, quite decisive is the decrease of archaeologists employed by local authorities, especially in local municipalities, which, as already mentioned, are, among public organisations, the ones that hire archaeologists the most. Equally notable is the decrease in employment by archaeological companies.
The data are particularly significant because the answers collected in 2012 are lower by 18 units compared to those relating to 2013. The mentioned changes in employment, then, happened in the space of 12 months, thus indicating a marked downward trend.
Coming back to 2013, from the breakdown of individual archaeologists based on their gender, it is clear that between 2013 and 2014 female employees were still the majority, both in the private and the public sector.
10
-5 -6 -4 -13
-4
38
-3
2 5 1
-11
4
-1 -2 -2
1 3 1
-20
0
20
40
60 Employers ratio 2012/2013
Mibact MIUR Altro ministero Regione Provincia Municipality (including museums)2 Other public organisation University Nat. Centre for Research Foreign Research Insitute Public foundation Private foundation Mixed foundation Private archaeological companies Tourism company (guides) Biulding companies Engineering company Other companies Ecclesiastical organisation (including museums) Association Publishing house

84
Geographical Distribution
Respondents were asked to indicate where they were headquartered.
The sample shows that the regions with the highest number of archaeologists are Lazio, Sicilia, Toscana and Campania, followed by Puglia and Lombardia.
Table 13 Geographical distribution of the sample.

85
The data were compared with the presence of universities offering a degree Code 10/A1, Field of Study “Archaeology”:
Figure 62 Geographical distributions of respondent archaeologists.

86
Table 14 Geographical distribution of respondents archaeologists and location of
Universities offering an archaeology Degree (dataset MIUR).
The sample shows that the regions with the highest percentages of working archaeologists are Lazio, Sicilia, Toscana Campania and Puglia, and that these are also the regions where a bigger number of universities that offer a second level degree in archaeology are located.
Figure 63 Geographical distribution of Italian protected sites and monuments (from “MINICIFRE 2013”, p. 8).

87
Lazio, Sicilia, Toscana, Campania, and Puglia are the regions with the highest presence of protected sites and monuments as well (data collected between 1909 and 2004). As the next table shows, there seems to be a strong relation between this number and the geographical distribution of archaeologists and universities.
Table 15 Geographical distribution of respondent archaeologists and number of protected sites and monuments.
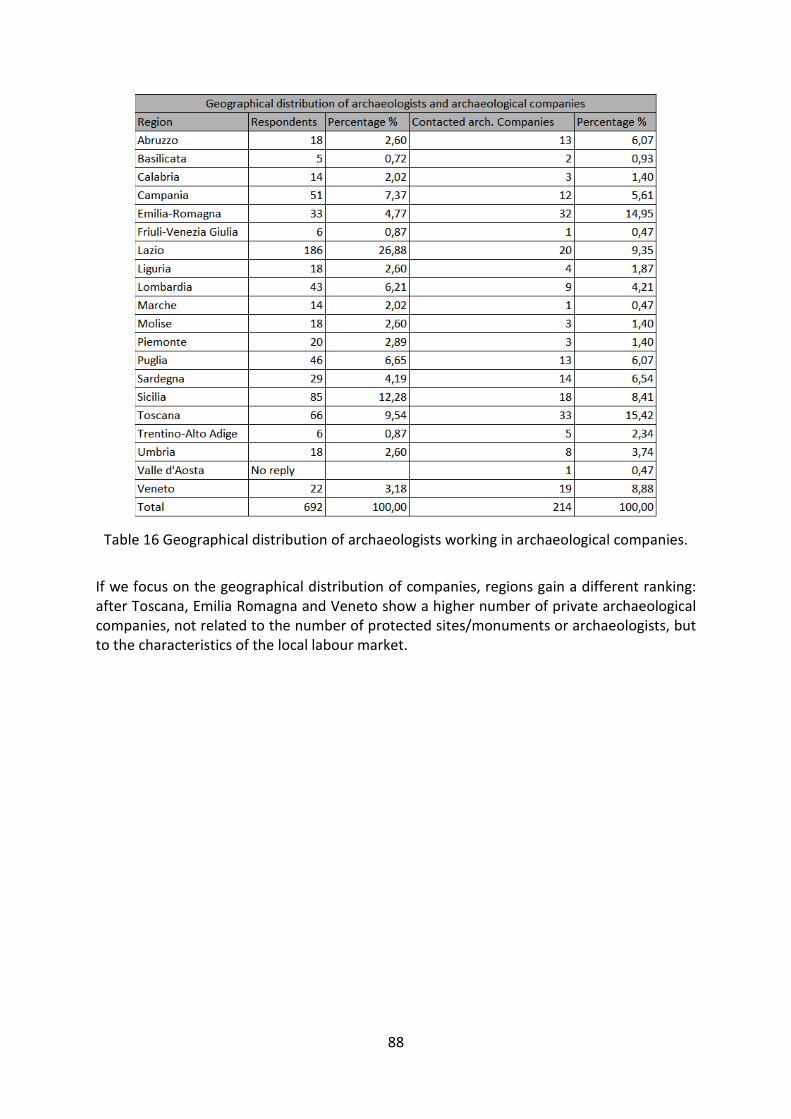
88
Table 16 Geographical distribution of archaeologists working in archaeological companies.
If we focus on the geographical distribution of companies, regions gain a different ranking: after Toscana, Emilia Romagna and Veneto show a higher number of private archaeological companies, not related to the number of protected sites/monuments or archaeologists, but to the characteristics of the local labour market.

89
Table 17 Geographical distributions of archaeologists employed by universities.
Table 17 shows archaeologists teaching courses related to the Field of Study code: 10/A1 – Archeologia, and Education Fields code: L-ANT/01; /04, /06, /07, /08, /09, /10; L-FIL-LET/01.

90
Table 18 Regional distribution of archaeologists working for private companies included in
the survey sample.

91
Diversity
Data were collected on archaeologists’ genders, ages, ethnicities and disability statuses.
Gender balance
Responses were received that covered the gender of 695 individual archaeologists, of whom 70,8 % were female and 29,2 % male. These are not much different from the data on gender balance collected by Consorzio Almalaurea for graduates in Archaeology in 2012, of whom 73,1 % were female and 26,9% male. On the contrary, the data reveal a reverse trend in relation to these registered by the National Institute of Statistics (ISTAT) about the gender balance in both the whole Italian workforce and the general population of people over 15 years old. That holds true also for the general number of graduates, of whom 47% are female.
Table 20 Gender balance, comparison between respondents archaeologists and Italian
workforce.
Table 19 Gender balance of the respondents.

92
Figure 64 gender of the respondents employed by public and private organisations.
None of the considered entities in which archaeologists work sees a majority of men, although in some institutions (such as Provinces, Foreigner Research Institutes, associations) the gender balance is less disproportionate, probably because of the low response rate of these categories of workers to the survey.
Among public institutions, the MiBACT (Ministry for Cultural Heritage, Activities, Tourism) presents the highest percentage of female employees, but the balance is inverted, with the majority of employers male, if Provinces are taken into consideration. Within Foreigner Research Institutions or the CNR the gender balance appears more evenly represented, and the same happens in the private sector, such as within engineering firms or associations, where, yet again, gender balance is inverted.
Age
On average, professional archaeologists respondents to the survey were aged 37. The average age for female archaeologists was 36; male archaeologists were aged 38 on average.
The gender difference within the respondents can be partly explained generationally. 55,5 % of the respondents are female aged under 40: the data show that the gender balance of archaeologists age 20 to 29 is around 10 % in favour of females, and as age grows so does variance between the genders. Of archaeologists aged 30 to 39, in fact, 39,3 % are female, while 13,81 % are male, with a variance of 25,5% between the genders. In the older cohort the gender balance appears more equal, but female archaeologists are still prevalent, a clear sign that this is a long‐term trend of the last twenty years.
89
15 4
16 7
44
11
99
8 11 3 12
3
86
38 25
11 22
3 3 1
32
7 0 3 9 21
5
60
4 9 2 8 0
51
9 7 9 9 4 0 0 0
20 40 60 80
100 120
Archaeologists gender by organisational basis
Donne Uomini

93
Table 21 Average age by gender.
Table 22 Age and gender of respondents.
Figure 65 Age and gender of respondents.
While we do not have any data for the years between 2006 and 2008, the analysis of gender and age shows that in the recent past the trend has been for the proportion of female archaeologists entering the profession decreases over time, although they still are the majority of the archaeological workforce.
Currently, according to this survey, women make up the vast majority of the archaeological workforce.
0
50
100
150
200
250
300
20-29 30-39 40-49 50-59 60 <
114
273
58 33
14
42
96
41 17
7
Age and gender of archaeologists
Females Males

94
Disability status
Among the respondents there were very few disabled people; between 2013 and the first three months of 2014, only 1 % (seven people) of the archaeological workforce was disabled.
Table 23 Disability status of the respondent archaeologists.
The respondents have been asked their form of disability, in what percentage that is, and whether or not it affected their work possibilities.
Table 24 Disability percentage of the disabled archaeologists respondent and their difficulties in job-seeking.
Apparently a higher percentage of disability does not necessarily mean more difficulties in finding a job, as revealed by two of the respondents with disability percentages respectively of 15 % and 100 %, as opposed to the stated response of two respondents with disability at 80 %.
The percentage of disabled archaeologists uncovered by DISCO2014 equals half of that collected for the whole Italian workforce, which, according to the most recent survey available, is around 1,9% of the corresponding populations.
It must be noted, though, that the survey carried out by the Italian Institute for the Development of Vocational Training for Workers (ISFOL) opted for a simplified definition of “disability” compared to the one adopted by ISTAT. For the ISFOL, disabled people are persons with “a constant reduced autonomy,” who need “continuous help to carry out daily activities” (“PLUS Participation Labour Unemployment Survey” ISFOL 2010, in Gay-Russo 2013, p. 3).
In relation to disabled people, in 1999 Italy approved a law to encourage targeted job placement, Law No. 68/99 “Norme per il diritto al lavoro dei disabili” (“Legal standards for the right to work of disabled people”), which requires companies with more than 15 employees to hire people included in protected class, including disabled people. On May

95
22nd 2014 the Department of Public Function of the Presidency of the Italian Council of Ministers expressed a legal opinion according to which hiring of protected class people could be suspended. However, sometime later, Italy was rebuked on this decision by the European Court of Justice.
Countries of origin
Almost all respondents are Italian:
Table 25 Countries of origin of the respondent archaeologists.
99,1 % of the respondents are of Italian nationality. Only 0,6 % are non‐Italian European Union archaeologists, and 0,28 % are non‐EU archaeologists.
Comparison with national statistics makes it apparent that foreign archaeologists find it difficult to enter the Italian archaeological labour market due to its low level of permeability, or, more likely, its lack of appeal. In fact, the rates for the whole national workforce are much higher: in the third quarter of 2013 10,2 % of the people working in Italy were from EU countries (783,000) and extra-EU countries (1,574,000; survey 2013 by the General Directorate of Immigration and Integration Policies of the Ministry of Interior).
Staff Qualifications
Respondents were asked what their highest level of achieved qualifications were.
As said in the Introduction, only graduates were considered for this survey.
At the time of questionnaire, 53 % of the archaeologists held a post-Graduate qualification: a minority of them had a Post-Doc qualification (43 people, 6,35 %); a good portion of them had obtained a School of Specialisation in Archaeology qualification (210 people, 31 %); and a smaller group of individuals held a Doctoral qualification (108, 15,6 %).
47% held a Master’s degree or equivalent qualification: more precisely 25,55 % had a Master’s degree and 14,8 % had obtained a Master’s Degree according to the old university system (total of four years, Level 7 of the European Qualifications Framework, EQF). Only a minority of working archaeologists possessed just a Bachelor’s degree.

96
Table 26 Highest level of achieved qualifications.
Figure 66: Highest level of achieved qualifications.
Finally, 30,7 % of the respondents had attended to a I or II level Post-Graduate Master Course (respectively, EQF levels 7 and 8) after they obtained their degree, oftentimes in association with one of the previously listed qualifications.
The 2012 Consorzio Almalaurea dataset related to Post-Graduate qualifications in archaeology show data slightly different from those collected by DISCO2014: at the time 26,6 % of graduates held a Doctoral qualification, 22,3 % a School of Specialisation qualification, and 18 % had attended a I or II level Post-Graduate Master’s Course (source: Amalaurea, in VANZETTI, to be printed).
43; 6%
108; 16%
210; 31% 173; 26%
100; 15%
43; 6%
Highest qualification achieved
Post Doc
PhD
Specialisation
MA n.u.s. (NO 3+5)
MA o.u.s. (VO 4)
BA

97
Although our data necessarily need to be adjusted, the downward trend in access to PhD programs is rather apparent: this trend is partly explainable by the increased difficulties in recent years in the appointment of scholarships because of the cut, between 2008 and 2013, of at least 1 billion Euros from the University Ordinary Financing Fund (FFO; source: VAZETTI, to be printed). The raise in applications for post-graduate qualifications, for which tax payment is required, such as Schools of Specialisation and Post-Graduate Master Courses is then understandable.
Regarding the latter qualification, the discrepancy in numbers between the Almalaurea dataset and the DISCO2014 survey data can be explained by the fact that the current survey courses offered by private organisations, outside of the public University system, have also been taken into consideration.
Table 27 Qualifications and average age.
Qualifications achieved were compared with the average age of those holding them, and an additional comparison was made between qualifications and average salaries earned.
Between 2013 and the first quarter of 2014, 79,8 % of the 466 respondents earned less than 15,000€, an amount under which tax cuts are established.
Two things stand out.
Firstly, the majority of the respondents are positioned in the lower slot of earnings, under 5,000 €: they are 69,72 %, 283 of the 466 respondents to the question. This high rate is a probable sign of just how fractured the archaeological labour market is, and how irregular external collaboration contracts truly are for archaeologists.
Secondly, the lowest qualification, the first level degree, always seems to correspond with the lowest salary earned. However, a Post-Graduate qualification does not appear to guarantee higher salaries: on the contrary, archaeologists holding a School of Specialisation or a Doctoral qualification are present in higher percentages in the lowest salary bands.
A little over 20 % of respondents earned more than 15,000 € per annum. 74 % of them held a Post-Graduate qualification (73 of 98 people). In this salary slot it was the Post-Doc qualification that guaranteed higher salaries, included between 15,000 and 20,000 €, which

98
is consistent with the amount of money assigned to Research Fellows, whose contracts can be renewed annually.
Very few archaeologists earned more the 45,000 €: none of them held a Master’s degree according to the university system in force in Italy since 1999 (after the approval of the Ministerial Decree No. 509/1999, then modified by the Ministerial Decree No. 279/2004), which means that highest earnings are prerogative only of archaeologists aged more than 35. In this case, high levels of education seems to represent, but not exclusively, a preferential access to higher salaries. As mentioned before, higher qualifications are required for certain jobs, such as compiling and editing VIArch, or to fill certain positions, such as that of technical manager in companies holding a ISO OS25 Certificate or that of Superintendencies’ officer for the MiBACT.
Table 28 Annual earnings by highest level of qualification achieved.
Figure 67 Annual earnings by highest level of qualification achieved
0
20
40
60
80
100
120
140
0-5.000 € 5.001-10.000€
10.001- 15.000 €
15.001- 20.000 €
20.001- 30.000 €
30.001- 45.000 €
> 45.000 €
Highest qualification achieved and annual earnings
BA MA n.u.s. (NO 3+5) MA o.u.s. (VO 4) Specialisation PhD Post Doc

99
Unpaid volunteer archaeologists
The survey was thought to provide data relating to unpaid volunteer archaeologists who worked alongside paid colleagues, so non-archaeologist volunteers were not considered in the sample.
Respondents were asked whether they had received unpaid work proposals: out of 584 archaeologists who answered the question 437 (74%) stated they were asked to perform unpaid work at least once. The number represents 62,4% of the actual archaeological workforce, and indicates a rather common practice in the market.
Figure 68 Unpaid work proposals received by archaeologists.
Unpaid work and volunteers (not necessarily educated in archaeology) can sometimes be used by local administrations or institutions for activities related to promotion, maintenance, and custody of the archaeological heritage.
Something similar happens in other European countries, where some are worried about the risk of reduction in the archaeological labour market and the devaluation of qualifications and expertise achieved by professional archaeologists (HARDY 2014).
436; 63% 147; 21%
112; 16%
Unpaid work proposals
Received at least once
Never received
No reply

100
Market confidence
We asked to archaeologists whether they think there will be more or less archaeologists in a three years time:
Figure 69 Prevision of number of archaeologists in a three years period.
From the graph it’s clear how two thirds of respondent archaeologists think that in a three years period the number of professionals will be less than now.
This data should be compared with another question asked to archaeologists:
Figure 70 Prevision to change job in the next future.
Percentage of respondents thinking to change job in the next future is 21%, corresponding to 763 real calculated according to calculation proposed in this report (121 is 17,44% of total 695 respondents to the questionnaire, about 763 of the calculated 4382 active archaeologists now in Italy).
380; 66% 42; 7%
154; 27%
Do you think there will be more or less archaeologists in three years time?
Less
More
The same number
239; 41%
121; 21%
216; 38%
Are you planning to soon change job?
No
Yes
Maybe

101
Even though only an half of who responded to be in doubt to abandon profession in the next future (38% of respondents, corresponding to 1358 real numbers) chose to, next year could abandon profession one third of the whole archaeological population, corresponding to about 1442 units (763 + 1358/2); considering that yearly Universities are supplying to market about 1100-1200 new archaeologists (infra Universities), the risk that in the next years the number of archaeologists will drop is real.
Lastly, we asked to archaeologists if the abandon of the profession will be lived as a choice or as an obligation::
Figure 71 Attitude of archaeologists to change job.
Only 19% of respondents declares to have no problem in changing job, while 81% could live this with pain and 35% could change only if obliged.
18; 3%
92; 16%
266; 46%
200; 35%
If you have to change job, how do you feel about it?
Every job will fit
If it's a good job, there are no problem
If it's a good job i could change but with pain
I'm obliged to change but i don't want to

102
Figure 72 Professional satisfaction.
Two thirds of archaeologists declare themselves not satisfied of their professional situation and also in the vision of future optimism is not winning:
Figure 73 Opinion about own future in archaeology.
About 63% of respondents see as awful or insuffcient his own future in archaeology, while 37% declare himself sufficiently o very confident in the future.
E.C.
459; 66%
117; 17%
119; 17%
Are you satisfied of you professional condition?
No
Yes
Don't answer
0 50 100 150 200
182
182
148
50
14
How do you feel about your future in archaeology?
Very good Good Sufficient Insufficient Awful

103
Chapter 5: Jobs Places and fields of jobs
The respondents’ answers allowed information on their fields of work to be collected:
Figure 74 Archaeologists’ distribution by field of work.
A good number of archaeologists work in field archaeology (38%), while almost as many indicate an office as their place of work, as in a place in which they carry out activities relating to preservation and research (within University, libraries, research institutions, Superintendencies). Lastly, 23% of them state they work in museums as custodians or in visitor/user or education services or as tourist guides (in the latter occurrence they can work in more than one museum and archaeological site).
Respondents also listed the organisations they usually work for or with:
222; 35%
244; 38%
151; 23%
26; 4%
Working places Office (Office, University, Superintendence, Research organisation, Library) Excavations
Museums (including teaching and guided tours)
Other

104
Figure 75 organisations for which archaeologists worked during the year: it was possible to
indicate more than one.
The main three employers/clients are Universities, private archaeological organisations and the MiBACT. Local public institutions such as local municipalities, Provinces, Regions, etc., come second with 117 answers. Archaeologists are also employed by organisations working in the tourism sector, both in sites management and as guides or educators. Other fields of occupation follow, of whom it is interesting to mention private societies, construction companies, engineering firms, all organisations that are not directly managed by
121
22
4
19
16
62
20
159
12
18
5
20
3
137
47
30
18
41
3
1
3
14
0 50 100 150 200
Organisation where archaeologists are employed (2013)
Unemployed
Indipendent customers
Publishing house
Ecclesiastical organisation (including museums) Other companies
Engineering company
Biulding companies
Tourism company (guides)
Private archaeological companies
Mixed foundation
Private foundation
Public foundation
Foreign Research Insitute
Nat. Centre for Research
University
Other public organisation
Municipality (including museums)2
Provincia
Regione
Altro ministero
MIUR
MIBACT

105
archaeologists nor properly operating in the archaeological field, but with whom archaeologists often find themselves working, especially for services related to consulting for territory management and planning.
Salaries and earnings
In Chapter 1 the data about archaeologists’ earnings for the tax year 2012 were presented without further specifications. On average, in 2012, archaeologists earned 10,687 € per annum, a little over the average archaeological salary of previous years: 10,389 € in 2010; 1,0318 € in 2008.
The median (10,400 €), corresponds to these figures, while a good part of the respondents (93 of 351) stated they earned less than 5,000 €.
In this paragraph salaries will be broken down by categories, for fulltime and part-time employees and according to types of contracts.
These data were collected using the salaries of the most common categories of workers within the individual respondents (employees of the MiBACT, Universities and private archaeological organisations) which represented the most reliable statistical samples:
Only the answers of the fulltime employees who indicated their 2012 income were used; if a main employer had been indicated in the questionnaire (from which the archaeologist earned at least 75% of their annual pay) the worker was assigned to one specific type of organisation; otherwise, the worker was assigned to a “more than one employer/client” category, shown in the first column of the table. The numbers of those archaeologists who stated they were employed by less frequent types of organisations within the sample were too low to guarantee reliable statistical data, although their salaries have been used to estimate the general average income.
The following table shows the range of earnings for this latter category of workers:
Table 29 2012 earnings of the workers employed whose samples were considered most reliable.

106
Table 30 shows that fulltime workers’ earnings were on average 15,566 € per annum, 50% higher than the median of all individual respondents’ income. The two organisations that guaranteed the highest salaries were Universities (21,106 €) and the MiBACT (20,506 €). The lowest salaries are those paid by archaeological private organisations to their employees or collaborators, with a median of 11,575 €. Slightly under the national median are the salaries of workers who had more than one employer/client: on average, they earn annually 14,253 €, but some of the archaeologists included in this category can reach the highest salary registered, 120,000 €. In this category of workers, however, the lowest median is also registered: 10,000 €.
It appears then that half of the archaeologists working for more than one organisations earn less than 10,000 €, while the other half earn more, with a general median of 15,000 €.
25% of all archaeologists earn less than 5,000 € per annum, which is rather low if we consider that these are fulltime workers. The richest 25%, instead, earn at least 22,000 €.
In the highest ranks of salaries, of course, the permanent contract employers can be found, with a median of 24,906 € per annum. Fixed-term contract employees follow (14,671 €), and finally freelancers (13,071 €). While the highest range of income in all three categories are quite similar (the richest quarter earns at least 30,000 €) it is in the lowest levels that the biggest differences can be found: 50% of permanent contract workers earn at least 23,000 €, while fix-term employees earn 6,000 € and freelancers 4,575 €.
This variance is very clear in the graph below:
Table 30 Professional archaeologists whose earnings come mainly from other organisations/clients (2012).
Table 31 2012 earnings by types of contract.
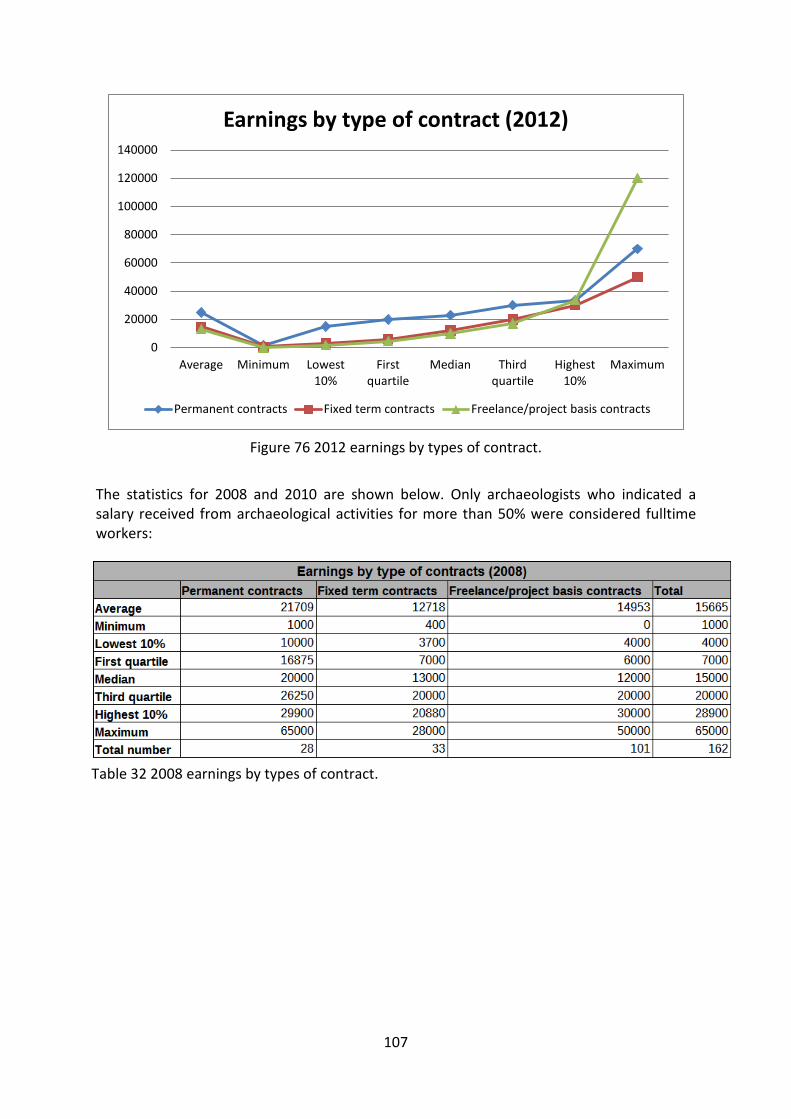
107
Figure 76 2012 earnings by types of contract.
The statistics for 2008 and 2010 are shown below. Only archaeologists who indicated a salary received from archaeological activities for more than 50% were considered fulltime workers:
0
20000
40000
60000
80000
100000
120000
140000
Average Minimum Lowest 10%
First quartile
Median Third quartile
Highest 10%
Maximum
Earnings by type of contract (2012)
Permanent contracts Fixed term contracts Freelance/project basis contracts
Table 32 2008 earnings by types of contract.

108
As it can be seen, there was a constant increase in the average earnings of fulltime employees (around 3,5% per year), and a good raise was also registered in the salaries of fixed-time employees in the last two years (7% per year between 2010 and 2012). As for freelancers, there was a decrease in their earnings between 2008 and 2010 (around 23% in two years), only partially compensated in 2012 (14%) with a loss, on average, between 2008 and 2012, of 1,882 € of annual income.
Comparing the average salaries of three years:
On average, archaeologists’ income between 2008 and 2012 raised 3,15%.
Taking into consideration only fulltime workers, though, it is apparent that the average salary of archaeologists in 2012 was 18% lower than the average salary of the whole Italian workforce, estimated for 2012 in 19,750 € per annum: permanent employees’ salaries are on average 26% higher than the average national equivalent, while fixed-term contracts employees and freelancers’ are lower, respectively, of 25,7% and 33,8%.
Table 33 2010 earnings by types of contract.
Table 34 compared salaries of 2008, 2010, 2012.

109
Earnings distribution
We asked archaeologists to identify, in percentage, how their earnings had been composed in the last tax year (2012):
Figure 77 Full-time workers’ earnings from different employers/clients.
31,21
20,30 17,01
5,36 5,00 3,71 3,57 3,24 2,34 1,62 1,59 1,43 1,37 0,66 0,58 0,41 0,33 0,00
5,00
10,00
15,00
20,00
25,00
30,00
35,00
Full-time worker percentage of earnings from clients
Arch. Companies MIBACT University Municipality Building companies Other Touristic companies Region Other public companies Engineer companies MIUR Foreign research institute Province Private foundation Other ministry Other local authority Public foundation Mixed foundation

110
Figure 78 Part-time workers’ earnings from different employers/clients.
These data have been broken down in two graphs, one for fulltime workers, the other for part-time workers: archaeological private organisations score the first place as employers, but in different rates in the two categories (31,21% in the first one, 22,57% in the second), a clear sign that the type of work these organisations require from their employees/collaborators is mostly fulltime.
The same can be said for the MiBACT (second main employer for fulltime workers, 20,3%, fourth for part-time workers, 10,34%). As far as a private organisations working in tourism are concerned, the data are inverted (8,72% part-time workers, 3,57% fulltime workers), and the same has to be said for local municipalities (respectively 5,36% and 9,19%). As it is to be expected, part-time workers also indicate a higher portion of their total earnings (10,47%) coming from non-archaeological activities compared to fulltime workers (3,71%).
When the question about earnings was asked, not as specifically, for previous years, 2010 and 2008, the results were very different:
22,57
18,58
10,47 10,34 9,19 8,72
5,68
2,57 2,57 1,69 1,55 1,49 1,35 1,22 1,15 0,68 0,20 0,00
5,00
10,00
15,00
20,00
25,00
Part-time worker percentage of earnings from clients
Arch. Companies University Other MIBACT Municipality Touristic companies Building companies Other local authority Private foundation Region Foreign research institute Engineer companies Public foundation Province Other ministry MIUR Other public companies Mixed foundation
Table 35 Archaeologists’ earning in 2008 and 2010.

111
Earnings from non-archaeological activities were on average, for those years, 70% of the total, with a grouping of values around 90% and 10% (meaning that archaeologists either earned more than 90% of their income from non-archaeological works or that they earned less than 10% from these). Workers who, in both categories, indicated no earnings from archaeology, have been excluded from this estimate.
The difference with data for 2012 is extremely marked. In 2012 only 10,47% of part-time workers and 3,71% of fulltime workers indicated “other” as source of their annual income. This vast variance is not explainable with a growth of the archaeological market in the past two years: it is possible, then, that when answering the generic question about their earnings in 2008 and 2010 the perception prevailed that some jobs (such as that of tourist guide) could not be considerate as truly archaeological in nature.
Earnings by gender
Graph 77 show a strong variance in the income between women and men for all types of contracts:
Figure 79 Average earnings (in Euros) by gender and types of contract.
The graph shows all the average annual salaries calculated thanks to the answers provided by both fulltime and part-time workers.
A table relating only data for fulltime workers, distributed by gender and type of contract was then elaborated:
8561,79
19765,88 17508,82
23516,62
9297,17
13185,73
0
5000
10000
15000
20000
25000
Females Males
Average earnings (2012) by contract and gender
Fixed term contracts Permanent contracts Freelance

112
The variance is quite apparent, especially for the highest ranges of salaries, which should be linked to job positions entailing more responsibility in different fields (from the median rate onward). On average the variance between the genders for permanent contract employees is about 15%, for fixed-term contract employees is about 26%, and for freelancers is about 39,5%.
It is clear that the more rights and benefits a type of contract guarantees, the more steady the balance between the salaries of female and male workers.
VAT Numbers and rates
Freelance archaeologists (whom are variously identified as “freelance professionals” or “autonomous workers” or “external collaborators” where public local authorities are involved) do not have a binding rate-table they can use as a reference for their prices. Some rate-tables do exist, and they are used by some local Superintendencies (such as the so called “SAP1992”, 54-60) but they are not compulsory. Normally, the clients, be that public or private, are the ones that decide the rates according to the budget available at the moment or other criteria.
A few years ago some of the professional associations created two rate-tables to be used as a reference based on the type of job and the activities it entailed (CIA 2006 and ANA 20011). For the creation of the rate-table for freelancer archaeologists the Italian Confederation of Archaeologists (CIA) used as a reference the salaries agreed on in the National Collective Labour Agreement (CCNL) for employees of the construction sector with similar activities. It is hard to record the actual use of such references, both by public and private clients, because they are not compulsory and because in the market the lowest possible rate usually prevails.
To this day, surveys on the rates currently applied for freelancer archaeologists do not exist, bar a few data that can be extrapolated from regional surveys (Archeostats 2012).
However, the network set up by the professional associations operating in Italy showed that there is a large variance in the daily rates paid to archaeologists, from a maximum of 250 € + VAT to a minimum of 50 € + VAT.
As an example, using these rates to calculate a month salary we have:
Table 36 2012 salaries (in Euros, only fulltime workers) distribution by gender and type of contract.

113
Table 37 Comparison between daily and monthly wages on tax regime basis.
Where: VAT = Value Added Tax; INPS = National Social Security Institute; IRPEF = Individual Income Tax. The calculation considers all the working days in a month (22).
The VAT (22% rate up to March, 3rd 2014) was not included in the calculation since VAT registration number holders usually list it in their bills but actually pay it to the State every three months. Those workers who instead chose the so called “minimum tax regime” do not pay any VAT, and the IRPEF tax rate is cut for them from 26% to 5% if their income does not exceed 30,000 € pre-tax per annum.
The majority of freelancer archaeologists state that they were unable to propose their own rates:
Figure 80 possibilities of proposing their own rates to the clients/employers.
For over 2/3 of the respondent archaeologists, in fact, their working rates had been imposed by their clients/employers, who, sometimes, even ask for unpaid work (see below, Volunteers), and one possible reason for this can be the aforementioned lack of an approved rate-table to use as reference.
110; 16%
475; 68%
116; 16%
Possibilities of proposing rates
Yes
No
No answer

114
In general, archaeologists have low bargaining power when it comes to their contracts and this is shown by the average salaries in the private sector (Table 18).
Entrance in the labour market
When asked how they first entered the archaeological labour market, archaeologists answered as follow:
Figure 81 way in which they first entered the archaeological labour market.
The majority of respondents declared they first started working thanks to knowing a public officer, a university Professor or an acquaintance in the labour market (261 of 634 respondents); a second group started working after sending in their CVs (165), and a third group after an unpaid internship in an institution/organisation (110).
Only employees in public administration started working after passing a public competition exam.
It should be noted that the question was about how they first started working and not how they started working in their current position.
0
50
100
150
200
250
300
14
67
165
261
110
2 14 1
Channel of first job in archaeology

115
It seems, then, that the direct acquaintance is the common way of entering the archaeological labour market, for all categories of respondents.
We also asked private organisations how they hired their employees/collaborators:
Figure 82 how private organisations hire their staff.
The graph shows that private organisations decided to hire 23% of their staff based on the recommendation of a trusted public officer; 36% were hired because of a direct relation with the private clients and 22% thanks to competitive bid calls.
11,1% were hired from lists drafted by local Superintendencies of trusted collaborators’, and 8,9% thanks to the organisation members’ inclusion on the list of archaeologists entitled to write VIArch’s.
In the 1993 book “The degree does not make the archaeologist”, already mentioned in this report, the situation of the early 1990s is described. At the time professional archaeology, as in archaeological practice outside the traditional channel of the Ministry (in 1986 MiBACT had 609 collaborator archaeologists officially listed: cf. “The degree does not make the archaeologist”, 54), was becoming more and more common. Pages 54-60 talk about the working conditions of these “external collaborators” of local Superintendencies, describing salary conditions and types of applied contracts.
A large part of the text focuses on how collaborators were chosen. In 1993 it was the public officer who had been appointed to supervise on behalf of the local Superintendence. The officer also took care of the economical aspects of the job, which were then regulated using as references the aforementioned rate-tables, thus binding the payments to the quality of the work and the deliverance of the scientific recordings (an example is circular No. 7159 of May, 5th 1991, of the then-Archaeological Superintendence of Rome).
16; 33%
19; 40%
5; 11%
0; 0% 3; 6%
0; 0% 3; 6%
2; 4%
In what way consultants are chosen?
Cv
Direct acquaintance
Indirect acquaintance
Superintendence lists
Officers' request
VIARC list
Professors' request
Other

116
In those same years the custom for Superintendencies to directly indicate a trusted archaeologists for the job and handle all the economic part of the contract, was finally regulated by a series of official circulars which, de facto, excluded the possibility of doing so.
In reality, though, the custom to point out a trusted archaeologist remains, although no longer in an official fashion.
To this day, an effective way of regulating the direct selection of archaeologists or private organisations by a client does not exist, and this is an issue which impairs the correct development of the archaeological profession and its autonomy from the authorities that control and manage the preservation of archaeological heritage.
The situation of public administration employees works in a different way: as seen, the access to a job position, either with a permanent or a fixed-term contract, is decided through public competitions. These can either take into consideration both the applicant’s qualifications and their results in a public examinations (as for the public competition to become employee of the Ministry in 2008) or only their qualifications (as is the case to become employees of the regional departments of cultural heritage in Sicily, an autonomous region with Special Statute).
The appointment of a job for collaborators outside of the public administration is ruled by Legislative Decree No. 165 of 2001 (section 7, subset. 6 and 6-bis) which entails, for activities requiring particular specialisation in the field, a public bidding competition call. This procedure is always applied by Public Schools for every teaching assignment to external experts, and by public institutions for assignments of jobs in the archaeological field.
For jobs worth less than 40,000 € Legislative Decree No. 163/2003, also known as “Public Contracts Code”, requires the Project Manager to proceed with a direct call of the chosen assignees (section 125), according to autonomous choice criteria.
Maternity/paternity leave
Paid maternity leave is provided by the State through the National Social Security Institute (INPS), as ruled by Legislative Decree No. 151 of March, 26th 2001 “Consolidation Act of the provisions on maternity’s and paternity’s safeguard and support”.
The provisions are:
1) Advanced Maternity Benefit and Interdiction from work (for pregnant women only) for female employees;
2) Statutory Maternity Pay (for pregnant women only) for female employees. For autonomous female workers only if they possess adequate contribution requirements, and for 5/12 of the income of the previous year;
3) Paid daily time off for breastfeeding breaks (for both parents) for female and male employees;
4) Maternity and Paternity Leave (for both parents) for female and male employees; 5) Paid time off on case of illness of the child (for both parents) for female and male
employees; 6) Family allowances (for both parents); 7) Dependent children tax credits.

117
Figure 83 Total percentage of archaeologists with dependent children who accessed parental
benefits.
The majority of archaeologists who are parents did not access the parental benefits provided by the State because they were not employees (either with a permanent or a fixed-term contract):
Figure 84 Total number of archaeologists with children who accessed parental benefits.
The two highest columns represent the freelancer workers who did not access any parental benefit (41) and the permanent contract employees who did (34).
Particularly, regarding point one “Advanced Maternity Benefit and Interdiction from work”, the aforementioned Legislative Decree No. 151, forbids to a pregnant worker to access any kind of construction site: a pregnant archaeologist who has been working on a construction site must give up the job, long before the benefits of point one apply, which means she
58; 43%
60; 45%
16; 12%
Parental benfits
Yes
No
No response
0 5
10 15 20 25 30 35 40 45
No Yes
7 10
5 1
7
34
41
13
Archaeologists' access to parental benefits by typology of contract
Permanent contract workers Unemployed Fixed term contract workers Freelance

118
loses these benefits. In fact, if she continued to access the construction site, she would violate security rules and expose herself and her employer to penalties.
The relationship between the archaeological profession and parenting has never been subject to detailed studies, but tales from parents and shared experiences are available (like in the Facebook group “Archeomamme e Archeopapà” and in Zirone 2011).

119
Workplace accidents
Figure 85 workplace accidents.
Of the 579 respondents to the question of whether they have ever had accidents in the workplace only 49 people (8%) answered in the positive:
Table 38 Workplace accidents severity.
If we consider that the average length of activity as an archaeologist to date for Italian archaeologists is 11 years (see below), the rate for accidents during work is 0,72% per year, much lower than the national median (2,3-2,5%).
Of the 49 people who answered in the positive, only two stated that they suffered a permanent disability in consequence of their accident, but eight more declared that they have had some hurdle in finding a new job afterwards: it is apparent that these accidents did not have disabling consequences on the day-to-day life of these people, but they can be qualified as impediments to their normal archaeological activity, especially considering how important field work is in the profession.
We also asked archaeologists if they had received training on workplace safety and by whom:
49; 8%
530; 92%
Workplace accidents (579 responses)
Yes
No

120
Figure 86 Workplace safety training.
The graph shows that Universities offered training on workplace safety for a little under a quarter of working archaeologists; 41% of them were trained in the subject by their employers instead, and 36% of workers had not received any training.
Given the nature of the profession, the gap in training can be rightly considered as the biggest contributor to a lack of knowledge, and yet it is only rarely fulfilled thanks to courses held on a regular basis by different professional associations (see also OSAL 2011).
Full-time and part-time work
Figure 87 Full-time and part-time work, all staff.
145; 23%
255; 41%
224; 36%
Workplace safety training subject
Universities
Employers
None
315; 62%
134; 26%
63; 12%
Part-time/Full-time workers
Full-time
Part-time
No response

121
Only 26% of respondents to this question are part-time workers. For the majority of our sample (62%) the archaeological profession is a fulltime job that occupies all of their working day.
Figure 88 Fulltime and part‐time work by type of contract.
Part-time work is only present in the categories of freelancer workers and fixed-time contracts employees: it is possible that freelancers interpreted “part-time work” as an expression indicating the lack of continuous work in the archaeological sector and thus the necessity to work other jobs to earn a reasonable amount of money (see, for example, the income categories as indicated in the First ANA Census, ANA 2006).
So it might not be a coincidence that the percentage of people who answered this question matches rather closely the percentage of people who stated they had earned part of their income in 2008 and 2010 from other works (see Table 21).
0
20
40
60
80
100
120
140
160
Full time Part-time
62
27
92
9
160
97
Fulltime Part-time workers by type of contract
Fixed term contract workers Permanent contract workers Freelance

122
Unemployment
Figure 89 Working conditions at the time of the survey (November 2012-March 2013) with
unemployment rate.
28% of the respondents (see above, Types of contracts) state they are at the moment unemployed or looking for a job.
Table 39 Unemployed by years (2008-2013).
Between 2010 and 2012 unemployment seems to have grown by +6%, but this rate needs to be read carefully: it is possible that the unemployment rates indicated for these years were similar to those of the following years, and that the people who were unemployed at the time have since then left the profession, so they did not respond to the questionnaire.
Even so, in 2012 and 2013 unemployment affected over one quarter of all archaeologists.
Alongside the reduction of the labour market since the beginning of the current economic crisis (between 2008 and 2013 the national unemployment rate went from 6,7% to 12,2%, ISTAT dataset), the data regarding the different types of contracts usually applied in archaeology (only 16% of all archaeologists have a permanent contract) gives a clear image of the state of the profession in Italy.
After job termination, fixed-time employees can request unemployment benefits (Social Insurance for Employment, ASpI) provided by INPS.
91; 14%
102; 15%
182; 28%
281; 43%
Types of contracts in archaeology in 2013
Temporary contracts
Permanent contracts
Unemployed
Short term contracts/freelance

123
Private organisations’ employees, with either a permanent or a fixed-term contract, can also be used by their employers for other kinds of jobs prior to the end of their contract or, if the hire was only limited to one specific task with a clear temporal end, be dismissed.
Years of activity as an archaeologists to date and desertion of the profession
Table 24 shows the total years of activity as an archaeologist as stated by the respondents:
Table 40 Years of activity as an archaeologists to date.
25% of the Italian archaeologists working in 2013 had been in the profession for less than four years: on average, 12 years for male archaeologists and 10 years for females. The median (half of them had been working for less time, half for more) confirmed these data with a rate of about 8-10 years.
Another 25% was made by the archaeologists who had been working for the longest time. In this category the gender balance was more skewed: men had been working for at least 18 years, while women for 13 years. The subcategory of those who stated to have been working for 11-13 years (which is close to the median of all respondents) were aged on average 37 years, the same average age of all the respondents. This seems to be the moment in their life in which many female archaeologists decide to leave the profession (cf. Chapter 2).
The comparison with the data gathered by the First ANA Census in 2005 (ANA 2006) is interesting. According to this, 51% of the respondents were born between 1974 and 1978 and over 55% stated they had been working for no more than three years at the time. Moreover, our data need to be considered alongside that of the university enrolment explosion that characterized the Italian universities between the second half of the 1990s and the first half of the 2000s (Vanzetti 2013). As it turns out, a good number of all the archaeologists currently working in Italy belong to the generation born around the middle years of the 1970s, and it is probable that they are the same people who, in 2004-2005, stated they had been working for no more than three years, the same people who in the current survey, 9 years later, stated that they have been working for 10-13 years.
It is perhaps not a case that the need to set up the first professional association came from those same people, who attended university between 1992 and 2003, and who were the first to work on extended excavations connected to construction works for large national

124
infrastructures (such as High-Speed Trains, TAV; the subways lines in Rome and Naples, the digs of the Roman Imperial Fora in Rome). Setting up professional associations was for them an attempt to define their own profession (cf. below) and to try and regulate a system that, with the boom in university enrolment for degrees in archaeology and the entrance of new social classes in the profession, was no longer able to function according to old dynamics.
Unions and professional associations
Archaeologists can be members of unions, confederate or autonomous, present in Italy at the moment. Joining a union is open and voluntary for all workers; it is necessary to choose the reference section within the union, based on one’s contractual situation.
Freelance archaeologists, who are not bound by any form of contracts, can refer to the “Atypical workers” or “Temporary employees” (in Italian “precari”, meaning something like “non-soundly employed”) sections that are present in every union.
Professional associations have existed in Italy since 2004: the first ones were Assotecnici (National Association of Specialists for the Preservation of the Cultural and Environmental Heritage and Landscape), assembling all specialists working for the MiBACT, Ancost (National Association of Specialised Operators for Cultural Heritage), which gathered all Superintendencies’ “external collaborators”, and FederPIBC (Federation of Italian Professionals for Cultural Heritage), which mainly operated in Campania. Only the former still exists.
The first try to gather all Italian archaeologists was attempted in the 1960s with the formation of the Society of Italian Archaeologists, set up by academic Professors (Pallottino 1962), which was short lived but also gave origin to the long lasting specialised magazine “Archaeological Dialogues” (1967-1992).
Archaeologists working in Universities are associated in Councils by fields of study.
In 2004 the Confederation of Italian Archaeologists was set up (Leoni Magliaro 2011), founded with the intention of gathering all archaeologists working in Italy with no concern for their working and contractual situation, starting actions aimed at the recognition, protection and promotion of the professional figure of the archaeologist, and for the development of an ontological code for the profession.
Aside from CIA, the ANA (National Association of Archaeologists, since 2005); CNAP (National Confederation of Professional Archaeologists, since 2011); FAP (Federation of Professional Archaeologists, since 2011) also operate in Italy.
Joining one of the professional associations is voluntary and open, and it is not conditioned by the worker’s contractual situation. The joining of CIA is tied to practice within the archaeological profession, and to the university education achieved.

125
Figure 90 Membership to professional associations of archaeologists.
75% (522 of 695) of respondent archaeologists are not members of any professional associations. Seventeen of them declare their intention to join one in the near future.
Figure 91 Reasons why 74,58% of the respondents did not join any professional association.
Archaeologists who are not registered to any association were asked to indicate the reasons: most of the respondents (46%) provided free answers in the “other” category, while, among the suggested answers, the most chosen reply was that they did not see said associations as useful (21,7%). 16,4% of the respondents do not agree with the associations’ actions, while 13,5% think membership is irrelevant for them. A small
178; 25%
522; 75%
Membership to professional associations
Yes
No
235
86
114
11
71
0
50
100
150
200
250
Reasons of no membership to associations
Other
In this moment i don't agree with professional associations
I don't think it's useful
I'm not interested to their activities
I don't think it's of any sense to take a membeship

126
percentage (2%) do not consider the associations’ actions useful. In the “other” category free-text space respondents indicated reasons such as lack of time, lack of occasions of contact with the associations, disappointment with past events, the high number of professional associations in Italy, lack of a common front between the existing associations, that they did not know of their existence, the fact that they were, even temporarily, working in a field other than archaeology, their being employees of the MiBACT or part of the University staff, which was considered as conflicting with joining a professional association, seen, in one case, as an alternative to the Union (cf. Appendix 1).
Workplace lawsuits
We asked archaeologists whether they ever started a work-related legal action:
Figure 92 work-related legal actions brought by archaeologists.
Only 7% of the respondents declared that they had, even though the image thus far given in this report of the archaeological profession in Italy outlines many outstanding issues.
We asked what outcome these lawsuits had and whether they would do it again:
Table 41 outcome of the lawsuits had and archaeologists willingness to suit again.
41; 7%
544; 92%
7; 1%
Have you ever started a work related legal action?
Yes
No
No response

127
As shown in Table 37 half of the lawsuits brought by archaeologists ended in their favour, 9 are still proceeding, only one ended against the archaeologist. Eleven did not end at all.
The majority of the respondents said they would do it again (25 of 40), including the one whose action was defeated in court and four of the eleven that did not have an end. Five of the twenty people who won their lawsuits would not do it again.
D.Z.

128
Chapter 6: Training Introduction
Training has long been a subject of considerable concern and discussion for the archaeological profession.
Education is up to Universities with first and second level degrees (so called “3+2”, Bachelor’s Degree, three years plus Master’s Degree, two years; previous to 1999, instead, a Degree was four years long), followed by two years of School of Specialisation (three years before the last Ministerial Reform in 2002), and/or a three year PhD.
I and II level Post-Graduate Master’s Courses can be also attended, on specific subjects, such as cultural heritage marketing, new technologies, relations with other professions involved in the preservation and promotion of the archaeological and artistic heritage, and preventive archaeology.
Preventive archaeology is governed by Law No. 109/2005 (later included in sections 95 and 96 of the Legislative Decree 163/2006, “Public Contracts Code”) and it represents the only field of work that has specific qualifications requirements: in fact only people who hold a School of Specialisation or Doctoral qualification in Archaeology are admitted to draft, write and confirm the so called “Archaeological Impact Evaluation”, VIArch.
In general, however, at the time that data for this study have been collected (November 2013 – March 2014) there were no particular requirements in order to work as an archaeologist, but many decade of good practice have helped identify the figure of the archaeologist as a specialist who holds at least a Bachelor’s degree in archaeology. More often, an archaeologist is considered to be someone who was awarded a Master’s Degree in archaeology (or, with the old university system, pre-1999, a four years degree in “Literature” or “Cultural Heritage”).
At the moment of the last revision of the text (August 31st 2014), Law 110/2014 has been approved on June 25th 2014 (“Introduzione dell’articolo 9-bis del codice di cui al decreto legislativo 22 gennaio 2004 n. 42, in materia di professionisti competenti ad eseguire interventi sui beni culturali”), before known as PdL C.362 in the Chamber of Deputies and as S. 1240 in the Senate, inserting in the “Italian Heritage and Landscape Code” the Cultural Heritage professions, archaeologists included. The aim of the Law is to create non-binding lists to which professionals can sign up. Their enrolment will be controlled by a dedicated set of rules which are to be expected within six months starting from the passing of the Law.
It is not clear what these rules will entail, and with which criteria workers will be able to sign up to the list, which, in any case, will not be binding for practicing the profession.
Historically speaking, there seem to have been two different points of view regarding the training deemed necessary to access the profession: on one hand, Universities would want to push for a higher education, so that only archaeologists holding a School of Specialisation or Doctoral qualification could be considered as such; on the other hand professional archaeologists and private organisations, whom in the day-to-day practice are more used to evaluating the archaeologist’s training from their working experience, would ask for less selective and more inclusive criteria.
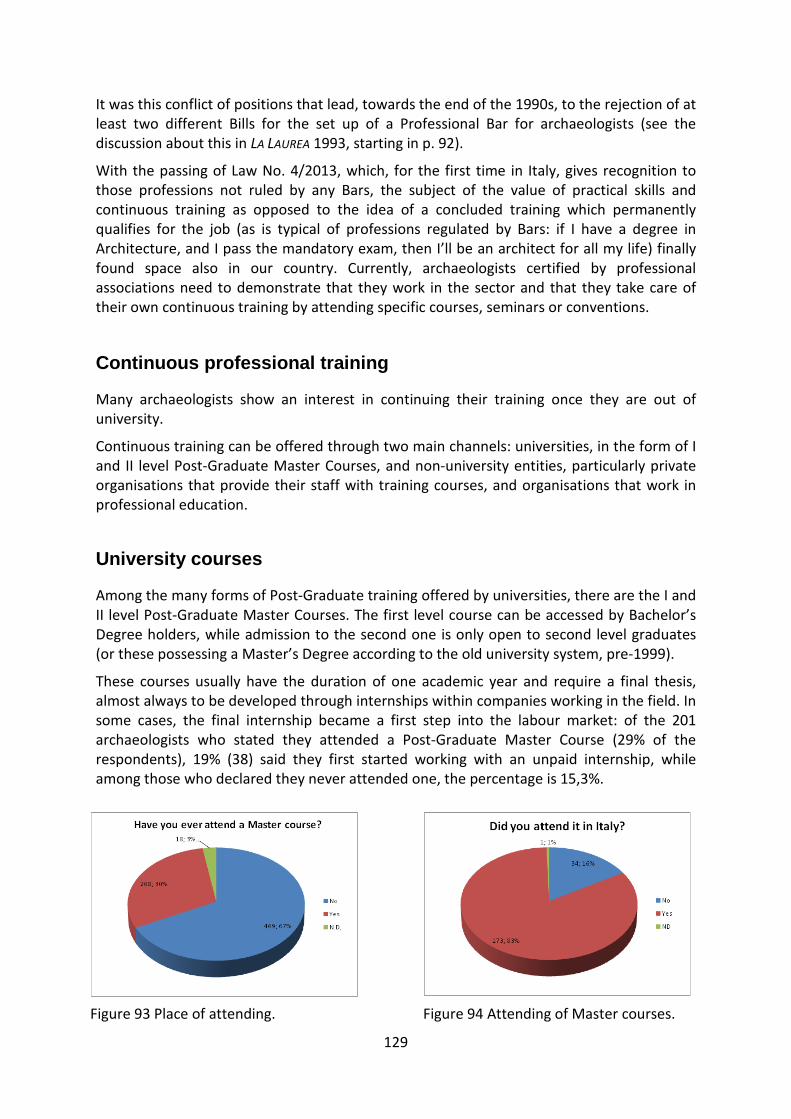
129
It was this conflict of positions that lead, towards the end of the 1990s, to the rejection of at least two different Bills for the set up of a Professional Bar for archaeologists (see the discussion about this in LA LAUREA 1993, starting in p. 92).
With the passing of Law No. 4/2013, which, for the first time in Italy, gives recognition to those professions not ruled by any Bars, the subject of the value of practical skills and continuous training as opposed to the idea of a concluded training which permanently qualifies for the job (as is typical of professions regulated by Bars: if I have a degree in Architecture, and I pass the mandatory exam, then I’ll be an architect for all my life) finally found space also in our country. Currently, archaeologists certified by professional associations need to demonstrate that they work in the sector and that they take care of their own continuous training by attending specific courses, seminars or conventions.
Continuous professional training
Many archaeologists show an interest in continuing their training once they are out of university.
Continuous training can be offered through two main channels: universities, in the form of I and II level Post-Graduate Master Courses, and non-university entities, particularly private organisations that provide their staff with training courses, and organisations that work in professional education.
University courses
Among the many forms of Post-Graduate training offered by universities, there are the I and II level Post-Graduate Master Courses. The first level course can be accessed by Bachelor’s Degree holders, while admission to the second one is only open to second level graduates (or these possessing a Master’s Degree according to the old university system, pre-1999).
These courses usually have the duration of one academic year and require a final thesis, almost always to be developed through internships within companies working in the field. In some cases, the final internship became a first step into the labour market: of the 201 archaeologists who stated they attended a Post-Graduate Master Course (29% of the respondents), 19% (38) said they first started working with an unpaid internship, while among those who declared they never attended one, the percentage is 15,3%.
Figure 94 Attending of Master courses. Figure 93 Place of attending.

130
It needs to the noted, however, that since the Schools of Specialisation reorganisation in 2002, their programs also include internships within the local Superintendencies.
For the academic year 2013-2014, the Almalaurea website lists 20 universities offering a I level Post-Graduate Master Course in Cultural Heritage, mostly focusing on marketing strategies, fruition and promotion. It also lists 8 II level Post-Graduate Master Courses, focusing on marketing strategies and promotion, but also on preventive archaeology and GIS for urban development planning.
Non university courses
All public organisations provide training for their staff, to better some professional aspects. They particularly offer training on workplace safety, first aid, computer literacy, and “professional updating” on specific aspects of the job.
A number of private organisations also provide their associates, employees and sometimes collaborators with training:
Figure 97 how staff training is provided.
4; 57%
3; 43%
Presence of a formal training budget
Yes
No
Figure 98 Identification of workers’ training needs
19; 83%
4; 17%
Does your company identify workers' training needs?
Yes
No
7; 29%
16; 67%
1; 4%
Presence of a formal training plan
Yes
No
Don't answer
2
1
1
4
Context of workers' training (internal or external to companies)
Internal
External
Both
Don't answer
Figure 96 Presence of a formal training plan.
Figure 95 Presence of a formal training budget.

131
Of the 23 respondent private organisations, seven stated that they had a training program, and only four of them that they have part of their budget dedicated to it.
The seven organisations that said they have training programs either provide them inside the company or through outsourcing: four of them use both methods; two organisations provide training internally; one turns to external contractors; one did not respond.
All organisations (23) stated that they encourage the continuous professional development of their staff.
Finally, we asked archaeologists whether they had received training from the organisations that had employed them and on which subjects:
Figure 99 Subjects of training provided by employers to archaeologists.
13% of the respondents to the questions (677) said they attended at least one course within the organisation they worked for: the majority of them (60 of 87) received training on workplace safety, while lower percentages attended courses on marketing and promotion (8), topography and graphic documentation (7), cataloguing and GIS (7), underwater archaeology (3), bio-archaeology (1), cultural heritage laws (1).
Skill Gaps
We asked archaeologists which gaps they see in their own training:
92% of them (628 of 677 respondents to the question) think their training is lacking.
60
8
7
7
3
1
1
0 10 20 30 40 50 60 70
Occupational safety
Marketing and valorization
Survey and topography
Cataloguing, GIS, DB
Underwater archaeology
Bioarchaeology
Legislation
Subject on which archaeologist received formation from the private organisation they worked for

132
Figure 100 Gaps identified in their university education by professional archaeologists.
366 of them indicated the field in which they think their skills are short: 28% (105) believe the most important element in the profession is practical experience. Universities did not fully prepare them for the job and university digs generally have timetables and structures which are completely different from what happens in a construction site; moreover, many complain lack of skills in graphic recording and in all post-excavation activities (particularly in their familiarity and knowledge of archaeological materials).
The second field in which archaeologists think they lack training is cultural heritage legislation (83 answers), followed by their knowledge of workers’ rights (66), of safety on construction sites (64), which, as seen, is the main subject archaeologists working for private organisations have been trained on by their employers.
The lack of knowledge of informatics applied to cultural heritage follows, which is a growing sector among the proposed services offered by archaeological companies, and all that relates to the management and marketing of cultural heritage.
Finally, archaeologists were asked whether they would favour attending training courses in the future at their own expense: only 36% answered in the positive, while 62% said they would not.
A.P.
105
83
66
64
30
18
0 20 40 60 80 100 120
Professional practice
Cultural heritage legislation
Job legislation
Working safety
Informatics
Economy and management of Cultural heritage
Gaps perceived in university education

133
Appendix 1 Professional associations
75% (522 of 695) of respondent archaeologists stated they were not, at the moment of the survey, members of any professional association.
Among the reasons behind this decision and aside from the four answers listed in the questionnaire, 46% of the respondents (242) indicated “other”.
176 of 242 specified the reason within the free text “further comments” feature.
There are different reasons, which were organized as follow:
• Disappointment/diffidence/disillusion toward the associations’ work: 38 answers; • Lack of occasions and possibilities to sign up: 37 answers; • Disinformation/lack of knowledge that professional associations even existed: 25
answers; • Intention to sign up/renew their membership in the near future: 23 answers; • Lack of time to dedicate to association activities: 15 answers; • Are unemployed (students) / left the profession: 15 answers; • Incompatibility between the membership and their position as employees: 11
answers;
Figure 101 Reasons why they did not join an association (74,58% of the respondents).

134
• Economic difficulties in paying for the membership: 5 answers; • Too many associations without a common front and clear aims: 2 answers.
Five answers were completely off topic.
The answers for “incompatibility” is a clear sign that a section of archaeologists who work as public employees misunderstand the role of professional associations and think that they are only aimed at workers with certain types of contracts; the respondents also consider them to have goals which are typical of the workers’ unions, and do not see them as associations made up by individuals who have their education, training, filed of work and research, ethical and deontological issues in common. In one case the answer was that the professional association as an institution is thought to be an alternative to the Union.
D.Z.

132
Appendix 2 Spouses and cohabitees
275 of the 695 archaeologists answered they were married or cohabited; 399 are single; 24 are separated/divorced; 2 are widowed.
It was asked to specify the profession of the spouse or cohabitee.
76 answered they were married/cohabited with another archaeologist, and archaeologists is the most common profession for the respondents’ partners.
198 indicated another profession for their partner, listed below:
Agricultural engineer 1
Architect 5
Armed forces 2; Carabiniere officer 1
Art director 1
Art Historian 2
Artisan 3
Bank employee 2
Barman 1
Biologist 2
Book industry 1
Book keeper 1
Computer technician 8 (consultant; programmer; system analyst)
Cultural manager 1; Sales manager 1;
Doctor 4 (dentist)
Electrician 1
Elevator operator 1
Engineer 41; (electrical engineer; computer engineer)
Entrepreneur 1; Farm entrepreneur 1
Estate agent 1
Farm hand 2
Geologist 1
Government employee 1
Graphic designer 1
Hotel keeper 1
INPS employee 1
Insurance adjuster 1
Journalist 1; Editor-in-chief 1
Lawyer 4
Librarian 11
Martial arts teacher 1
Master physicist 1
Merchant 2
Musician 3 (director and owner of a music school)
Naturalist specialises in acoustics 1
Occasional collaborator employee in an engineering firm 1
Petrol station attendant 1

133
Postman 1
Psychoanalyst 1
Psychologist 2
R&D Findus 1
Researcher 2 (biochemist)
Restorer 1
Retiree 2 (ex teacher)
SAIPEM employee1
Sales representative 1
Seafaring consultant 1
Set designer 1
Stage director 1
Student 3 (of archaeology)
Surveyor 2
Teacher: 12 (nursery school)
Temporary employee 1
Topographer 1
Translator 1
Unemployed 2
Warehouseman 1
Worker in education 1
Workman 6 (generic, metalworker)
D.Z.

134
Appendix 3 Social campaign Following images have been utilized for the social campign of Italian DISCO project.
They have been diffused through every CIA channel, on the association website (www.archeologi-italiani.it), on the italian project one (www.discovering-archaeologists.it), on the Facebook pages of the association through every event linked to data collection, through Twitter channel of the association. They helped, moreover, to moltiply in a few months web contacts of the association through every above listed channel and to collect hundreds of responses to questionnaires.
The images are all by Davide Arnesano, that we want to congratulate with for the fantastic work.

135

136
Appendix 4 Questionnaires Mandate mail
Gentile Collega,
ti chiediamo 2 minuti di tempo per presentarti il DISCO.
La Confederazione ItalianaArcheologi (CIA) sta svolgendo in questo periodo una ricerca sulle condizioni professionali degli archeologi che operano in Italia, nell'ambito del progetto Discovering the Archaeologists of Europe (DISCO).
DISCO, è un progetto europeo a cui partecipano 22 Stati nazionali rappresentati da Associazioni e istituzioni nazionali. La CIA è l’unico rappresentante italiano.
Il progetto DISCO prevede un periodo di raccolta dati, la loro analisi e infine la pubblicazione degli stessi, sia a livello nazionale che europeo, secondo le licenze Creative Commons, cui tutto il progetto è ispirato. Parte di questi risultati sono già consultabili sul sito italiano di DISCO (www.discovering-archaeologists.it) nella sezione dedicata ai media e si riferiscono alle prime 200 risposte pervenute.
In questo momento ci troviamo nella prima fase di DISCO, la raccolta dei dati, e abbiamo tempo fino al 31 Gennaio 2014 per riuscire ad avere un quadro esaustivo della nostra situazione nazionale.
Partecipare e aiutarci a raccogliere i dati è semplicissimo: basta andare sul sito DISCO, in alto cliccare su questionario e registrarsi con nome, cognome e mail.
Il questionario è completamente anonimo, ma questi dati servono al sistema per evitare doppioni e per consentire l’invio della mail contenente il link da seguire. Bastano 10 minuti per compilare il questionario, ma se volessi interrompere e riprendere in seguito è possibile salvare i risultati e terminare successivamente, riutilizzando lo stesso link inviato per il tuo primo accesso.
Qualora dopo la registrazione non dovessi ricevere la mail dall'indirizzo [email protected] non esitare a contattarci al medesimo indirizzo o a [email protected], provvederemo noi ad inviarti il link corretto.
Nel caso in cui fossi socio o amministratore di una società/cooperativa archeologica non esitare a compilare anche il questionario dedicato alle società archeologiche, presente nella stessa pagina: si tratta infatti del primo questionario in Italia finalizzato alla raccolta di informazioni sulle società di archeologia che operano sul nostro territorio, un'occasione irripetibile per tracciare un identikit dell’imprenditoria nella nostra professione.
Ti ricordiamo che anche per le società il questionario è completamente anonimo.
137
Nell'augurarti un buon 2014 ti invitiamo dunque a rispondere al questionario e a diffonderlo tra i colleghi archeologi.
Se hai già ricevuto informazioni sul questionario tramite il nostro sito o i nostri canali social (Facebook, Twitter, Linkedin) non ti rimane che proporlo ai tuoi colleghi!
Let's DISCO!
DISCO Italia: http://discovering-archaeologists.it/
Discovering the Archaeologists of Europe: http://www.discovering-archaeologists.eu/
FACEBOOK: https://www.facebook.com/events/646530728725004/?fref=ts
TWITTER: #letsdisco
MAIL: [email protected] o [email protected]

Benvenuto nel questionario Discovering the Archaeologists of Europe
2014! Ringraziandola per il tempo che dedicherà a questo progetto,
prima di iniziare la compilazione, intendiamo rassicurarLa che i dati
inseriti saranno anonimi e verranno utilizzati solo a fini statistici legati
allo svolgimento del progetto, non saranno ceduti a terzi e saranno trattati
secondo quanto indicato nella legge n. 675 del 31 dicembre 1996 sul
rispetto della privacy. Grazie per la collaborazione! Alessandro
Pintucci Presidente Confederazione Italiana Archeologi
Section A: Anagrafica
A1. Età (in anni)
A2. Nazionalità
Italiana
di stato membro della UE
europeo fuori della UE
extracomunitario
A3. Genere
Female
Male
A4. Stato civile
Nubile/Celibe
Skip to 5
Convivente
Skip to 5
Sposato
Skip to 5
Separato/Divorziato
Skip to 5
Vedovo
Skip to 5

A5. Indicare la professione del coniuge/compagno
Archeologo
Other
Please specify
A6. Da quanti anni lavora nel settore archeologico?
Se questo è il primo anno indicare 1.
A7. Disabile
Yes
No
A8. Figli
Yes
No
A9. Indicare il numero di figli

A10. Regione di residenza
Abruzzo
Basilicata
Calabria
Campania
Emilia-Romagna
Friuli-Venezia Giulia
Lazio
Liguria
Lombardia
Marche
Molise
Piemonte
Puglia
Sardegna
Sicilia
Toscana
Trentino-Alto Adige
Umbria
Valle d'Aosta
Veneto
Estero
A11. Comune di residenza
Capitale
Comune sopra 1.000.000 di abitanti
Comune sopra i 15.000 abitanti
Comune sotto i 15.000
A12. È iscritto a una associazione professionale?
Yes
No
A13. Indicare il motivo
Non lo ritengo utile
Non concordo con l'operato delle associazioni professionali attualmente
Non mi interessano le iniziative intraprese
Non ritengo abbia senso tesserarsi ad alcuna associazione
Other
Please specify
Section B: Formazione
B1. Indicare il titolo di studio più alto posseduto
Laurea triennale
Laurea magistrale/Specialistica
Laurea vecchio ordinamento
Diploma di Specializzazione
Dottorato di ricerca
Post dottorato
B2. In quale Paese lo ha conseguito
Italia
Other
Please specify
B3. Lo ha conseguito nella Provincia di residenza?
Yes
No
B4. Relativamente alla sola laurea (vecchio o nuovo ordinamento) ha
rispettato i tempi accademici previsti per il suo conseguimento?
Yes
No
B5. Ha frequentato master formativi?
Yes
No

B6. Quanti?
B7. Li ha frequentati in Italia?
Yes
No
B8. Come giudica la sua conoscenza delle lingue straniere, scritte e
parlate, in una scala da 1 a 5?
1 rappresenta una conoscenza bassa, 5 molto alta.
1
2
3
4
5
B9. Come giudica la sua formazione dal punto di vista della
spendibilità sul lavoro, in una scala da 1 a 5?
1 rappresenta un giudizio negativo, 5 molto positivo.
1
2
3
4
5
B10. In base alla sua esperienza, ritiene che alcune competenze
necessarie nell'esercizio della professione siano tuttora assenti
nella formazione accademica degli archeologi?
Yes
No

B11. Quale tematica ritiene che manchi prevalentemente nella
formazione accademica degli archeologi?
Sicurezza sui cantieri e posti di lavoro
Formazione sui cantieri di emergenza e sorveglianza archeologica
Conoscenza dei diritti e doveri dei professionisti
Conoscenza delle leggi che regolano il lavoro dell'archeologo (archeologia preventiva, legge sugli
appalti, ecc...)
Other
Please specify
B12. Ritiene che nella sua formazione ci siano lacune che influiscono
negativamente sulle sue prestazioni professionali?
Yes
No
B13. In quale ambito ritiene di avere lacune?
B14. Se ha mai lavorato con società archeologiche, ha mai partecipato a
corsi organizzati dalla società per cui lavorava o lavora?
Sì
No
Skip to 11
Non ho mai lavorato con società archeologiche
Skip to 11

B15. Su cosa vertevano i corsi?
B16. Ha in programma di frequentare corsi formativi a spese sue nel
prossimo futuro?
Yes
No
B17. In quale ambito?

Section C: Status professionale - 2013
Condizione professionale dell'anno 2013
C1. Attraverso quale canale ha iniziato la sua attività lavorativa?
Concorso pubblico
Invio curriculum
Stage inizialmente non retribuito
Segnalazione (funzionari, professori, conoscenti)
Other
Please specify
C2. Attualmente Lei è:
La sua attuale condizione lavorativa.
Dipendente a tempo indeterminato
Skip to 5a
Dipendente a tempo determinato
Skip to 5a
Non dipendente / Libero professionista
Skip to 5a
Disoccupato
Skip to 5a
C3. Se è occupato, come lavora?
Part-time
Full time
C4. Se è occupato, dove lavora?
In un ufficio
In uno scavo
In vari musei/aree archeologiche
In vari scavi
In un museo/area archeologica
Other
Please specify
C5. Se lavora prevalentemente in un luogo fisso esso si trova:
Nel Comune di residenza
Skip to 6
In un altro comune

C6. Se alla precedente domanda si è risposto in un altro comune esso
è:
Più grande del comune di residenza
Più piccolo del comune di residenza
C7. Se lavora in un museo o area archeologica, che tipo di incarico
attualmente ricopre?
Direttore
Curatore/Conservatore
Responsabile dei Servizi educativi
Catalogatore
Educatore museale
Custode/Assistente tecnico
Consulenze esterne/singoli progetti
Other
Please specify
C8. In riferimento alla domanda precedente, come svolge il suo
incarico?
Contratto a tempo indeterminato
Contratto a tempo determinato
Incarico temporaneo
Affidamento a titolo volontario e gratuito
Other
Please specify

C9. Per quale tipo di soggetto pubblico o privato lavora in questo
momento? (si può selezionare più di una voce)
MiBAC
MIUR
Altro Ministero
Regione
Provincia
Comune
Altro ente territoriale (comunità montana, ecc.)
Università
Istituto di ricerca pubblico (CNR)
Istituto di ricerca straniero
Fondazione pubblica
Fondazione privata
Fondazione mista
Società archeologica
Società che si occupa di turismo o didattica museale
Ditta edile
Studio di ingegneria o architettura
Altra società pubblica
Other
Please specify
C10. Se lavora con società private che ragione sociale hanno?
Studio Associato
Cooperativa
S.r.l.
Associazione culturale
Other
Please specify
C11. Che mansione o ruolo ha nella società?
Socio/Proprietario
Dipendente
Consulente esterno/collaboratore
Other
Please specify
C12. Se NON è Dipendente come svolge la Sua professione? (si possono
indicare più risposte)
Con partita IVA
Con ritenuta d'acconto
Con contratti a progetto
Other
Please specify
Section D: Status professionale - 2012
Condizione professionale dell'anno 2012
D1. Durante l'anno passato Lei è stato
Dipendente a tempo indeterminato
Dipendente a tempo determinato
Non dipendente/Libero professionista
Disoccupato
D2. Come lavorava?
Part-time
Full-time
D3. Dove lavorava?
In un ufficio
In uno scavo fisso
In vari scavi
In un museo/area archeologica
In vari musei/aree archeologiche

D4. Se lavorava in un posto fisso o prevalentemente in una stessa area,
essa si trova
Nel Comune di residenza
Skip to 6
In un altro Comune
D5. Esso è
Più grande del comune di residenza
Più piccolo del comune di residenza
D6. Per quale tipo di soggetto pubblico o privato lavorava? (si può
selezionare più di una voce)
MiBAC
MIUR
Altro Ministero
Regione
Provincia
Comune
Altro ente territoriale (comunità montana, ecc.)
Università
Istituto di ricerca pubblico (CNR)
Istituto di ricerca straniero
Fondazione pubblica
Fondazione privata
Fondazione mista
Società archeologica
Società che si occupa di turismo o didattica museale
Ditta edile
Studio di ingegneria o architettura
Altra società pubblica
Other
Please specify

D7. Se lavorava con una società privata, che ragione sociale aveva?
Studio Associato
Cooperativa
S.r.l.
Associazione culturale
Other
Please specify
D8. Con quale mansione?
Socio/Proprietario
Dipendente
Consulente/collaboratore esterno
Other
Please specify
D9. Se NON era dipendente, come svolgeva la Sua professione?
Con partita IVA
Con ritenuta d'acconto
Con contratti a progetto
Other
Please specify

D10. Indicandolo in percentuali di massima, con quali soggetti lavorava
in prevalenza?
MiBAC
MIUR
Altro Ministero
Regione
Provincia
Comune
Altro ente territoriale (comunità montana, ecc.)
Università
Istituto di ricerca straniero
Fondazione pubblica
Fondazione privata
Fondazione mista
Società archeologica
Società che si occupa di turismo o didattica museale
Ditta edile
Studio di ingegneria o architettura
Altra società pubblica
Altro
Section E: Status professionale - 2010
Condizione professionale dell'anno 2010
E1. 3 anni fa Lei è stato/a
Dipendente a tempo indeterminato
Dipendente a tempo determinato
Non dipendente/Libero professionista
Disoccupato

E2. Se occupato/a provi a indicare in percentuale quanto ha influito
sul suo reddito l'attività di archeologo. (es. archeologia 80, altro
20)
Archeologo
Altro
Section F: Status professionale - 2008
Condizione professionale dell'anno 2008
F1. 5 anni fa Lei è stato/a
Dipendente a tempo indeterminato
Dipendente a tempo determinato
Non dipendente/Libero professionista
Disoccupato
F2. Se occupato/a provi a indicare in percentuale quanto ha influito
sul suo reddito l'attività di archeologo/a. (es. archeologia 80, altro
20)
Archeologo/a
Altro
Section G: Status professionale - Condizioni economiche
G1. Se possibile indicare il reddito lordo proveniente dal lavoro
archeologico
Dell'ultimo anno fiscale
Di 3 anni fa (stima)
Di 5 anni fa (stima)
G2. Il reddito proveniente dall'attività archeologica Le ha permesso di
raggiungere l'indipendenza economica?
Yes
No
G3. Ha generalmente la possibilità di proporre la Sue tariffe per gli
incarichi professionali in archeologia?
Yes
No

G4. Riceve regolarmente il suo compenso/salario?
Yes
No
G5. Con quale ritardo riceve il suo compenso/salario?
1 mese
2 mesi
3 mesi
tra 4 e 6 mesi
tra 7 mesi e 1 anno
oltre 1 anno
G6. Ha mai intentato cause contro condizioni contrattuali/retributive?
Yes
No
G7. Come ne giudica l'esito?
Positivo per lei
Positivo per la controparte
Senza esito
In attesa di giudizio
G8. Alla luce dei risultati ottenuti, lo rifarebbe?
Yes
No
G9. Le possibilità lavorative sono mutate dopo la nascita dei figli?
Sì
No
Skip to 7
Non ho figli
Skip to 7
G10. In che modo?
In meglio
In peggio
Invariate
G11. Ha avuto la possibilità di avvalersi delle tutele statali a sostegno
della maternità/paternità?
Sì
No
Non ho figli
G12. Ha mai ricevuto richieste di prestazioni di lavoro non retribuite
nel settore archeologico?
Yes
No
G13. Le hanno mai offerto un contratto a tempo
determinato/indeterminato (quindi non contratti a progetto o di
collaborazione e simili) ?
Indica se ti è mai stato offerto, da qualche società o ente, un contratto da dipendente.
Yes
No
G14. Se sì di che tipo?
Indica il tipo di contratto a tempo determinato/indetermninato che ti è stato offerto.
Contratto nazionale dell'edilizia
Contratto nazionale degli studi professionali
Contratto nazionale di Federculture
Other
Please specify
G15. Il suo titolo di studio le permetterebbe di lavorare anche in ambiti
diversi dall'archeologia?
Yes
No
G16. Ha avuto esperienze di lavoro all'estero in qualità di archeologo
(non missioni italiane all'estero, ma lavoro retribuito sul posto)?
Yes
No
G17. Con quale frequenza?
Regolare/continuativa
Periodica
Occasionale/sporadica

G18. Se oggi avesse una possibilità di lavoro all'estero la coglierebbe?
Sì
No
Forse
Section H: Sicurezza sul lavoro e disabilità
H1. Ha mai ricevuto dai datori di lavoro o dall'università nozioni di
sicurezza sul lavoro?
Università
Datore di lavoro
Nessuno dei due
H2. Ha mai avuto incidenti sul lavoro?
Yes
No
H3. Quegli incidenti Le hanno comportato una invalidità permanente?
Yes
No
H4. Quegli incidenti o quell'invalidità Le hanno creato problemi nel
lavoro o a cercare lavoro?
Yes
No
H5. Ha disabilità fisiche?
Yes
No
H6. Che percentuale di disabilità ha?
H7. Ha mai avuto problemi nel cercare lavoro in archeologia?
Yes
No

Section I: Opzioni e prospettive
I1. In generale può dirsi soddisfatto della Sua condizione
professionale di archeologo?
Yes
No
I2. Prevede a breve termine di provare a cambiare lavoro e
abbandonare l'archeologia?
Sì
No
Forse
I3. Qualora avesse la possibilità di cambiare lavoro, affronterebbe la
cosa di buon grado o con grande sacrificio?
Se il lavoro è buono non è un problema
Se il lavoro è buono sarei portato a cambiare ma con sacrificio
Qualunque lavoro va bene
Sono costretto a cambiare ma non vorrei
I4. Ritiene che i provvedimenti da parte del Governo e delle
Istituzioni italiane negli ultimi anni siano stati sufficienti per la
Cultura e l'archeologia?
Inserire un valore tra 1 e 5, in cui 1 è assolutamente insufficiente e 5 molto convincenti
1
2
3
4
5
I5. A suo avviso, nei prossimi 3 anni lavoreranno più o meno
archeologi rispetto ad oggi?
Di più
Di meno
Uguale

I6. Come giudica il Suo futuro nell'archeologia?
Inserire valori da 1 a 5, in cui 1 è pessimo e 5 molto buono
1
2
3
4
5
Powered by TCPDF (www.tcpdf.org)

Benvenuto nel questionario Discovering the Archaeologists of Europe
2014! Ringraziandola per il tempo che dedicherà a questo progetto,
prima di iniziare la compilazione, intendiamo rassicurarLa che i dati
inseriti saranno anonimi e verranno utilizzati solo a fini statistici legati
allo svolgimento del progetto, non saranno ceduti a terzi e saranno trattati
secondo quanto indicato nella legge n. 675 del 31 dicembre 1996 sul
rispetto della privacy. Grazie per la collaborazione! Alessandro
Pintucci Presidente Confederazione Italiana Archeologi
Section A: Struttura societaria
A1. Quando è stata fondata la società
Se non si ricorda precisamente la data inserire il 1 gennaio e l'anno.
A2. Tipo di società
coop.
s.c.a.r.l.
s.n.c.
s.a.s.
s.r.l.
a.p.a.
Impresa individuale
Other
Please specify

A3. Categoria
OS25
Nessuna
Other
Please specify
A4. Organico della società (compresi i soci)
Inserire il numero di dipendenti (contratti a tempo determinato o indeterminato) e collaboratori (tutte le altre forma contrattuali, compresi
co.pro., partite iva, collaborazioni occasionali, ecc.)
Dipendenti
Collaboratori
A5. Organico della società un anno fa (compresi i soci)
Inserire il numero di dipendenti (contratti a tempo determinato o indeterminato) e collaboratori (tutte le altre forma contrattuali, compresi
co.pro., partite iva, collaborazioni occasionali, ecc.) dello scorso anno (2012)
Dipendenti
Collaboratori
A6. Organico della società tre anni fa (compresi i soci)
Inserire il numero di dipendenti (contratti a tempo determinato o indeterminato) e collaboratori (tutte le altre forma contrattuali, compresi
co.pro., partite iva, collaborazioni occasionali, ecc.) di tre anni fa (2010)
Dipendenti
Collaboratori
A7. Organico della società cinque anni fa (compresi i soci)
Inserire il numero di dipendenti (contratti a tempo determinato o indeterminato) e collaboratori (tutte le altre forma contrattuali, compresi
co.pro., partite iva, collaborazioni occasionali, ecc.) di cinque anni fa (2008)
Dipendenti
Collaboratori
A8. N° soci
Totale
di cui archeologi
A9. N° soci 1 anno fa (2012)
Totale
di cui archeologi
A10. N° soci 3 anni fa (2010)
Totale
di cui archeologi

A11. N° soci 5 anni fa (2008)
Totale
di cui archeologi
A12. All'interno della società sono presenti disabili nell'organico
Yes
No
A13. Che ruolo ricoprono?
Gestionale
Tecnico
Amministrativo
Operativo

A14. Indicare la regione prevalente di intervento
Indicare le regioni dove si lavora prevalentemente
Abruzzo
Basilicata
Calabria
Campania
Emilia-Romagna
Friuli-Venezia-Giulia
Lazio
Liguria
Lombardia
Marche
Molise
Piemonte
Puglia
Sardegna
Sicilia
Toscana
Trentino
Alto Adige
Umbria
Valle d'Aosta
Veneto

Section B: Istruzione
B1. Indicare quanti tra i soci sono
Dottorati
Specializzati
Laureati quinquennali
Laureati quadriennali
Laureati triennali
Non sono laureati
B2. Indicare quanti tra i dipendenti sono
Dottorati
Specializzati
Laureati quinquennali
Laureati quadriennali
Laureati triennali
Non sono laureati
B3. Indicare quanti tra i collaboratori sono
Dottorati
Specializzati
Laureati quinquennali
Laureati quadriennali
Laureati triennali
Non sono laureati
B4. Indicare se è presente all'interno della società un Direttore
Tecnico
Yes
No

B5. Quale tipo di istruzione ha maturato?
Section C: Fatturato e investimenti
C1. Fatturato annuo
Indicare il range entro il quale si colloca il fatturato annuo della società (2013)
0-30.000 euro
30.000-50.000 euro
50.000-100.000 euro
100.000-500.000 euro
500.000-1000.000 euro
oltre 1000.000 di euro
C2. Attività da cui deriva il fatturato annuo
Nei seguenti campi si prega di voler esprimere in percentuale le attività da cui deriva il fatturato totale.
Totale per scavi
Totale per assistenza in corso d'opera
Totale per archeologia preventiva
Totale per scavi di ricerca
Totale per schedature/catalogazioni
Totale per altro (attività didattica/visite guidate/ecc.)

C3. Fatturato dell'anno scorso (2012)
Indicare il range entro il quale si colloca il fatturato annuo della società (2012)
0-30.000 euro
30.000-50.000 euro
50.000-100.000 euro
100.000-500.000 euro
500.000-1000.000 euro
oltre 1000.000 di euro
C4. Attività da cui è derivato il fatturato nel 2012
Nei seguenti camp si prega di voler esprimere la percentuale di massima dell'incidenza delle attività sul fatturato annuo del 2012.
Totale per scavi
Totale per assistenza in corso d'opera
Totale per archeologia preventiva
Totale per scavi di ricerca
Totale per schedature/catalogazioni
Totale per altro (attività didattica/visite guidate/ecc.)
C5. Fatturato di tre anni fa (2010)
Indicare il range entro il quale si colloca il fatturato annuo della società (2010)
0-30.000 euro
30.000-50.000 euro
50.000-100.000 euro
100.000-500.000 euro
500.000-1000.000 euro
oltre 1000.000 di euro

C6. Attività da cui è derivato il fatturato annuo del 2010
Nei seguenti camp si prega di voler esprimere la percentuale di massima dell'incidenza delle attività sul fatturato annuo del 2010.
Totale per scavi
Totale per assistenza in corso d'opera
Totale per archeologia preventiva
Totale per scavi di ricerca
Totale per schedature/catalogazioni
Totale per altro (attività didattica/visite guidate/ecc.)
C7. Fatturato di cinque anni fa (2008)
Indicare il range entro il quale si colloca il fatturato annuo della società (2008)
0-30.000 euro
30.000-50.000 euro
50.000-100.000 euro
100.000-500.000 euro
500.000-1000.000 euro
oltre 1000.000 di euro
C8. Attività da cui è derivato il fatturato annuo del 2008
Nei seguenti camp si prega di voler esprimere la percentuale di massima dell'incidenza delle attività sul fatturato annuo del 2008.
Totale per scavi
Totale per assistenza in corso d'opera
Totale per archeologia preventiva
Totale per scavi di ricerca
Totale per schedature/catalogazioni
Totale per altro (attività didattica/visite guidate/ecc.)
C9. Investimenti annui in struttura
in % sul fatturato

C10. Indicare in quale tipo di strutture si è investito (es. magazzino,
laboratorio, ecc.)
C11. Investimenti annui in materiali
in % sul fatturato
C12. Indicare in quale tipo di materiali si è investito (libri, attrezzatura
da cantiere, ecc.)
C13. Investimenti annui in attrezzature
C14. Indicare in quale tipo di attrezzature si è investito (GPS, stazione
totale, plotter, ecc.)
C15. Avete in programma assunzioni per il prossimo anno?
Yes
No
C16. Quanti archeologi ritenete lavoreranno il prossimo anno?
Più di adesso
Lo stesso numero di quest'anno
Meno di adesso

C17. Quanti archeologi ritenete lavoreranno tra tre anni?
Più di adesso
Lo stesso numero di quest'anno
Meno di adesso
Section D: Tipologia dei lavori
D1. Tipologia dei servizi offerti
Scavo
Rilievo
Restauro
Musealizzazione
Fornitura operai
Movimento terra
Visite guidate
Archeologia sperimentale
Didattica nei musei
Web-GIS
Ricostruzioni 3D
VIARCH
Other
Please specify
D2. Specificare in quale modo vengono acquisiti generalmente i lavori
eseguiti
Gare d'appalto
Elenco della Soprintendenza
Elenco VIARC
Rapporto di fornitura servizi con la Committenza privata
Conoscenza diretta del Funzionario

D3. Corpo dei lavori
Indicare la pecentuale in cui vengono ripartiti i lavori tra interni alla società ed esterni
Soci/Dipendenti
Collaboratori/Consulenti
D4. Quali tipologie di servizi vengono richiesti dai committenti?
Scavo
Rilievo
Restauro
Musealizzazione
Fornitura operai
Movimento terra
Visite guidate
Archeologia sperimentale
Didattica nei musei
Web-GIS
Ricostruzioni 3D
VIARCH
Other
Please specify
D5. Durata media dei cantieri
01 - 07 giorni
08 - 15 giorni
15 - 30 giorni
01 - 02 mesi
03 - 04 mesi
05 - 06 mesi
07 - 12 mesi
+ di 12 mesi

D6. Ha notato una flessione nel lavoro durante il corso dell'anno
solare?
Yes
No
D7. A Suo giudizio, quali sono le difficoltà maggiori che incontra una
società archeologica che opera in Italia?
Le opzioni presentano valori da 1 (poco o nulla) a 5 (molto)
1 2 3 4 5
Eccessiva burocrazia
Alti costi del lavoro
Tassazione eccessiva
Mancanza di tempi certi per i pagamenti
Mancanza di reale concorrenza tra società
Mancanza di regole che premino la struttura di impresa
Mancanza di regole certe sui contratti da applicare
Concorrenza sleale tra società (mancanza di solidarietà
tra imprese)
Richieste eccessive da parte dei collaboratori/dipendenti
Mancanza di standard sulla documentazione da produrre
per il Mibact
Eccessivo legame al settore edile e scarsa diversificazione
degli ambiti di intervento
Section E: Committenza e pagamenti
E1. Specificare la tipologia delle committenze
Nei seguenti campi, si prega di esprimere il dato percentuale relativo all'introito proveniente dalle diverse tipologie di committenze
MiBAC
Enti pubblici
Fondazioni
Società private
Altro (specificare)

E2. Indicare, in percentuale, in che modo si ottengono i lavori
Gare d'appalto
Lista VIARC
Liste di Soprintendenza
Affidamento diretto da parte del Funzionario
Rapporto con i privati
E3. Numero medio annuale di committenti privati
E4. Tempistica media del pagamento del privato
0 . 90 gg
91 - 150 gg
151 - 365 gg
+ 365 gg
E5. Numero medio annuale di committenti pubblici
E6. Tempistica media del pagamento del pubblico
0 - 90 gg
91 - 150 gg
151 - 365 gg
+ 365 gg

Section F: Collaboratori e formazione
F1. In quale modo vengono scelti i collaboratori della società
Cv
Conoscenza diretta
Conoscenza indiretta
Elenchi soprintendenza
Richiesta del funzionario
Elenco VIARC
Richiesta di un docente
Other
Please specify
F2. In quale modo vengono utilizzati
Ho un piccolo gruppo di collaboratori fissi
Ho un ampio gruppo e li uso a rotazione
Secondo la loro disponibilità
Secondo la necessità del lavoro da svolgere
Dietro suggerimento del Funzionario
In base alla presenza della P. IVA
Non ho un metodo preciso
F3. In che modo retribuite i collaboratori
In base al loro grado di istruzione e al lavoro da svolgere
Solo in base al loro grado di istruzione
Solo in base al lavoro da svolgere
Tutti nello stesso modo

F4. Che tempistica di pagamento adotti
0 - 30 gg
31 - 60 gg
61 - 90 gg
91 - 120 gg
+ 120 gg
Quando paga la committenza
F5. La vostra società identifica le necessità formative dei dipendenti?
Yes
No
F6. Avete un piano formativo formale?
Yes
No
F7. Svolgete internamente o esternamente la formazione dei vostri
dipendenti?
Internamente
Esternamente
Entrambe
F8. Avete stanziato un budget per tale piano formativo?
Yes
No
F9. Incoraggiate lo sviluppo professionale dei vostri dipendenti?
Yes
No
F10. Che tipo di contratto applicate ai vostri dipendenti?
CCNL Edilizia
CCNL Studi Associati
Contratti a Progetto
Semplici lettere di incarico
Altro CCNL

Section G: Documentazione e lavoro post-scavo
G1. Quale tipo di documentazione richiedi ai tuoi collaboratori?
Rilievo di dettaglio
Posizionamento topografico
Schede US
Diario di scavo
Relazione di scavo
Elenco US
Schede materiali
Spot date
Foto
Fotogrammetrie
Laser scan
Matrix
GIS
Disegno a CAD
Other
Please specify

G2. Quale tipo di documentazione ti viene richiesta dalla
Soprintendenza?
Rilievo di dettaglio
Posizionamento topografico
Schede US
Diario di scavo
Relazione di scavo
Elenco US
Schede di materiali
Spot date
Foto
Fotogrammetrie
Laser scan
Matrix
GIS
Disegno a CAD
Other
Please specify
G3. La documentazione scientifica ti viene pagata a parte?
Yes
No
G4. In che modo?
A percentuale
A giornata
A corpo
Con contratto ad hoc
G5. La documentazione scientifica la retribuisci a parte?
Yes
No

G6. In che modo?
A percentuale
A giornata
A corpo
Con contratto ad hoc
G7. Eseguite lavoro di lavaggio dei materiali?
Yes
No
G8. Chi lo finanzia?
Committente
Soprintendenza
Fondazioni
Ente locale
Associazione
Non è retribuito
G9. Studio dei materiali?
Yes
No
G10. Chi lo finanzia?
Committente
Soprintendenza
Fondazioni
Ente locale
Associazione
Non è retribuito
G11. Catalogazione?
Yes
No

G12. Chi la finanzia?
Committente
Soprintendenza
Fondazioni
Ente locale
Associazione
Non è retribuito
G13. Prevedete la pubblicazione dei vostri interventi?
Yes
No
G14. Chi la finanzia?
Committente
Soprintendenza
Fondazioni
Ente locale
Associazione
Non è retribuito
Powered by TCPDF (www.tcpdf.org)