Multivariate classification based on chemical and stable isotopic profiles in sourcing the origin of...
10
J. Braz. Chem. Soc., Vol. 18, No. 1, 205-214, 2007. Printed in Brazil - ©2007 Sociedade Brasileira de Química 0103 - 5053 $6.00+0.00 Article *e-mail: [email protected] Multivariate Classification Based on Chemical and Stable Isotopic Profiles in Sourcing the Origin of Marijuana Samples Seized in Brazil Elisa K. Shibuya, * ,a,b Jorge E. S. Sarkis, a Osvaldo Negrini-Neto c and Jean P. H. B. Ometto d a Laboratório de Caracterização Química e Isotópica, Centro de Química e Meio Ambiente, Instituto de Pesquisas Energéticas e Nucleares, IPEN/CNEN-SP, Av. Lineu Prestes 2242, Cidade Universitária, 05508-970 São Paulo-SP, Brazil b Laboratório de Referências Metrológicas, Instituto de Pesquisas Tecnológicas do Estado de São Paulo, IPT-SP, Av. Prof. Almeida Prado, 532, Cidade Universitária, 05508-901 São Paulo-SP, Brazil c Centro de Exames, Análises e Pesquisas, Instituto de Criminalística do Estado de São Paulo, Rua Moncorvo Filho 410, 05567-060 São Paulo-SP, Brazil d Laboratório de Ecologia Isotópica, Centro de Energia Nuclear na Agricultura, Av. Centenário 303, 13416-903 Piracicaba-SP, Brazil Este trabalho teve como principal objetivo verificar as diferenças existentes na composição elementar de amostras de Cannabis, apreendidas em diferentes regiões produtoras do país, previamente separadas através da análise de isótopos estáveis de carbono e nitrogênio, e utilizar estas diferenças para classificar as amostras de acordo com sua origem geográfica. A técnica analítica empregada foi a de espectrometria de massas de dupla focalização com fonte de plasma acoplado indutivamente (HR-ICP-MS), e a avaliação dos dados foi realizada utilizando-se a análise de agrupamentos (hierarchical cluster analysis) e de discriminantes linear. Os resultados indicam que amostras provenientes de regiões diferentes apresentam perfis químicos diferentes e estes por sua vez parecem estar relacionadas com as características geológicas das regiões consideradas. Os parâmetros mais importantes nesta avaliação foram os isótopos estáveis de carbono e nitrogênio e os níveis de cobre, cobalto, bário, lantânio, zinco, ferro, ítrio e manganês. Este trabalho demonstrou a possibilidade de se utilizar amostras apreendidas nas ruas para a criação de um banco de dados para o monitoramento da maconha consumida no país. The main task of this work was to verify the existing differences in the elemental composition of samples seized in the main Brazilian regions of marijuana production, previously separated by their carbon and nitrogen stable isotope results, and to use these differences to classify the samples according to their geographical origins. The sector field inductively coupled plasma mass spectrometry technique (HR-ICP-MS) was the analytical technique applied and the data analysis was performed using hierarchical cluster and linear discriminant analysis. Results indicate that samples from different regions present different chemical profiles that appear in accordance to the geological characteristics of each region. The most relevant parameters were carbon and nitrogen stable isotopes, copper, cobalt, barium, lanthanum, zinc, iron, yttrium and manganese. An interesting product of this work was to demonstrate the possibility of using seized samples to create a national databank for monitoring the geographical origin of marijuana consumed in the country. Keywords: forensic science, drug sourcing, marijuana, chemical fingerprint, linear discriminant analysis Introduction Nowadays, the consumption and production of drugs involves almost all countries, moving about US$ 500 billions per year around the world. According to 2004 United Nations Office on Drugs and Crime (UNODC) report, 3% of the worldwide population (185 millions of people) or 4.7% in the 15 to 64 year-old population bracket use illicit drugs. 1 Marijuana or Cannabis reaches about 150 millions users, presenting a productivity from 30,000
Transcript of Multivariate classification based on chemical and stable isotopic profiles in sourcing the origin of...

J. Braz. Chem. Soc., Vol. 18, No. 1, 205-214, 2007.Printed in Brazil - ©2007 Sociedade Brasileira de Química
0103 - 5053 $6.00+0.00
Article
*e-mail: [email protected]
Multivariate Classification Based on Chemical and Stable Isotopic Profiles in Sourcing theOrigin of Marijuana Samples Seized in Brazil
Elisa K. Shibuya,*,a,b Jorge E. S. Sarkis,a Osvaldo Negrini-Netoc and Jean P. H. B. Omettod
aLaboratório de Caracterização Química e Isotópica, Centro de Química e Meio Ambiente, Instituto de PesquisasEnergéticas e Nucleares, IPEN/CNEN-SP, Av. Lineu Prestes 2242, Cidade Universitária, 05508-970
São Paulo-SP, BrazilbLaboratório de Referências Metrológicas, Instituto de Pesquisas Tecnológicas do Estado de São Paulo, IPT-SP,
Av. Prof. Almeida Prado, 532, Cidade Universitária, 05508-901 São Paulo-SP, BrazilcCentro de Exames, Análises e Pesquisas, Instituto de Criminalística do Estado de São Paulo, Rua Moncorvo Filho
410, 05567-060 São Paulo-SP, BrazildLaboratório de Ecologia Isotópica, Centro de Energia Nuclear na Agricultura, Av. Centenário 303, 13416-903
Piracicaba-SP, Brazil
Este trabalho teve como principal objetivo verificar as diferenças existentes na composiçãoelementar de amostras de Cannabis, apreendidas em diferentes regiões produtoras do país,previamente separadas através da análise de isótopos estáveis de carbono e nitrogênio, e utilizarestas diferenças para classificar as amostras de acordo com sua origem geográfica. A técnicaanalítica empregada foi a de espectrometria de massas de dupla focalização com fonte de plasmaacoplado indutivamente (HR-ICP-MS), e a avaliação dos dados foi realizada utilizando-se aanálise de agrupamentos (hierarchical cluster analysis) e de discriminantes linear. Os resultadosindicam que amostras provenientes de regiões diferentes apresentam perfis químicos diferentese estes por sua vez parecem estar relacionadas com as características geológicas das regiõesconsideradas. Os parâmetros mais importantes nesta avaliação foram os isótopos estáveis decarbono e nitrogênio e os níveis de cobre, cobalto, bário, lantânio, zinco, ferro, ítrio e manganês.Este trabalho demonstrou a possibilidade de se utilizar amostras apreendidas nas ruas para acriação de um banco de dados para o monitoramento da maconha consumida no país.
The main task of this work was to verify the existing differences in the elemental composition ofsamples seized in the main Brazilian regions of marijuana production, previously separated by theircarbon and nitrogen stable isotope results, and to use these differences to classify the samplesaccording to their geographical origins. The sector field inductively coupled plasma mass spectrometrytechnique (HR-ICP-MS) was the analytical technique applied and the data analysis was performedusing hierarchical cluster and linear discriminant analysis. Results indicate that samples from differentregions present different chemical profiles that appear in accordance to the geological characteristicsof each region. The most relevant parameters were carbon and nitrogen stable isotopes, copper,cobalt, barium, lanthanum, zinc, iron, yttrium and manganese. An interesting product of this workwas to demonstrate the possibility of using seized samples to create a national databank for monitoringthe geographical origin of marijuana consumed in the country.
Keywords: forensic science, drug sourcing, marijuana, chemical fingerprint, lineardiscriminant analysis
Introduction
Nowadays, the consumption and production of drugsinvolves almost all countries, moving about US$ 500
billions per year around the world. According to 2004United Nations Office on Drugs and Crime (UNODC)report, 3% of the worldwide population (185 millions ofpeople) or 4.7% in the 15 to 64 year-old population bracketuse illicit drugs.1 Marijuana or Cannabis reaches about150 millions users, presenting a productivity from 30,000

206 Multivariate Classification Based on Chemical and Stable Isotopic Profiles J. Braz. Chem. Soc.
a 32,000 tons a year. Amphetamine, cocaine and heroinusers are about 30, 13 and 9 millions of people,respectively.1
South America is one of the major producer, dealer andconsumer points of illicit drugs. Originally, Brazil wasconceived as a classical transit country for cocaine producedin Colombia and Bolivia. However, in the last decades thispicture has been changed and Brazil became a significantproducer of narcotics moving about 10 billion dollars ayear.1 The efforts to combat drug trafficking allied to therise in production, place Brazil in fourth in quantities ofmarijuana apprehension, while Mexico, USA and Nigerialead this rank.1 As a consequence, the country has beengathering all the features related to this problem: production,traffic, consumption, violence and money laundering.2
Despite of this huge and increasing problem, detailedstudies regarding to production, dealing and consumption ofthis drug in Brazil are still scarce. Official data provided bythe Brazilian Federal Police Department3 (DPF) suggest thatthe main producing zones in the country are located in theNortheastern region, more specifically in the semi-arid zonebetween Pernambuco and Bahia States, known as theMarijuana Polygon, and in the Midwestern region, alongthe Brazil-Paraguayan border. However, the intensive andsustained field raids promoted by Brazilian Federal Policebetween 1999 and 2003 in the Northern Region eradicatedabout 10 millions of Cannabis plants, reducing the localproductivity, forcing the producers to migrate to other States,mainly those located in country’s North region such as Paráand Maranhão which could cause changes in the traffic routesthroughout the country.3,4 Nowadays, the apprehensionsaccomplished by the Brazilian Police in the mainconsumption centers as is the case of São Paulo city, suggestthat most of these drugs are coming from Paraguay, via MatoGrosso do Sul route or from producing regions located alongthis Brazil-Paraguayan border.5 Furthermore, recentinformation also indicates the rising of traffic betweenParaguay and Northern Region, mainly Ceará State.
Shibuya et al.6,7 used carbon and nitrogen stableisotopes to investigate the climatic conditions of marijuanagrowth for samples seized in different Brazilian regions.Some samples from Ceará and Pernambuco appear to becultivated in humid regions, inconsistently to the localclimate, except by the existence of highly irrigated areawith soil managemental practices.7 According to theauthors, although these results point to the existence oftraffic routes between Northern and Midwestern region,7
additional investigations would be necessary forconclusive results.
The use of chemical fingerprint has escalated in orderto set a classification pattern that can match drug samples
to their geographical origin. This fingerprint can beestablished using samples organic,8-11 inorganic6,12-19 orisotopic20-24 profiles which are related to the plant growthconditions such as climatic conditions and elementsavailability in the soil. Although each one of thesestrategies provide very interesting and powerful results,the use of a set of variables independents from each otherwould be able to provides complementary informationwhich could make it a distinct feature in the sourcing theirorigins.19,25
Generally, the plants inorganic profile reflects theelemental availability in the soil. This feature allows theusing of plant samples as environmental pollutionbiomonitor, hence they can appear as element accumulator,mainly for toxic metals.26,27 There are many articles in theliterature that show the feasibility of using these chemicalprofile to source the origin of agricultural materials suchas wine,18 wheat,19 tea17,28 and barley25 however data relatedto Cannabis samples are still scarce.3,11,13
Coffman and Gentner had shown that Cannabis plantscultivated in acidic soils present higher absorption for Mn,Fe and Zn.8 Lately, the same authors evaluated thechemical composition (nutrients and cannabinoids levels)of plants cultivated using mineral fertilizers.9 Althoughsome correlations were noted, the data gathered did notprove conclusive to track the geographical origin of thesesamples due to the large quantity of related parameters.9
The nutrient profile determined by atomic absorptionspectrometry technique associated to linear discriminantanalysis were used by Landi14 in classifying samples fromdifferent regions of Italy, previously separated ininflorescences and leaves. Although 100% ofinflorescences samples were successfully classified,according to the author the methodology did not proveitself potentially viable in the analysis of real samplesdue to the complexity of the problem.14
The use of inductively coupled plasma massspectrometry (ICP-MS), a more sensitive technique,allowed Watling16 to analyze non-essential elements andmicronutrients that are present in lower concentrations inplants. About 45 elements were measured qualitatively insamples from Australia, and the most relevant ones todiscriminate the different regions in the country were rareearth elements (REE), Au, Th, U e W. Some hydroponicsCannabis were also analyzed and their results areextremely concise with low dispersion rates.16
Unlike inorganic profile, the stable carbon and nitrogenisotopic compositions in plants are strongly related to theclimate, mainly water availability, other than temperature,light intensity and nutrients contents on the soil.29-32
Although for significant differences the samples must have

207Shibuya et al.Vol. 18, No. 1, 2007
been grown under very distinct climatic conditions,6,24 thiscorrelation makes them useful to delimit their potentialproducing areas, and works that use these parameters inthe sourcing the origin of illicit drugs such as heroin,20
cocaine21,22 and Cannabis24,33,34 have escalated in recentyears. Shibuya et al.6 proved the potentiality of isotope ratiomass spectrometry (IRMS) in the establishment of thepotential regions of Cannabis productions in Brazil, clearlyseparating samples from humid and dry regions. Howeverthis technique was not satisfactory in identifying the originof some samples from areas far away from each other thatpresent similar climatic conditions, and in this way, themodel shows some overlapping between Midwestern andAmazon groups.6,7 According to the authors, in this case,additional information such as the inorganic profiles couldbe used to access a better discrimination.6,7
The aim of this work was to verify the existingdifferences in the elemental composition of samples seizedin the main Brazilian regions of marijuana production,previously separated by their stable isotope results, and usethese differences to separate samples according to theirorigins. The sector field inductively coupled plasma massspectrometry techniques (HR-ICP-MS) was the analyticaltechnique applied and the data analysis was performed usinghierarchical cluster and linear discriminant analysis. Thiswork was based on samples seized in the street and hasbeen performed in collaboration to São Paulo State PoliceDepartment.
Experimental
Samples
All samples analyzed in this work were seized by theState law enforcement officers in the three differentBrazilian regions that present the highest levels of seizuresand eradications (see Table 1) and forwarded to theInstituto de Pesquisas Energéticas e Nucleares (IPEN) by
the Institutes of Criminalistic (IC) of each State. Withexception of 5 samples from Mato Grosso do Sulapprehended in 2004 all seizures were performed between1999 and 2002. In previous works,6,7 these samples hadtheir carbon and nitrogen stable isotopic compositionsmeasured and were previously clustered according to theirclimatic growth conditions (see Table 1).
Methodology
The measurements of inorganic constituents werecarried out using a sector field inductively coupled plasmamass spectrometry HR-ICP-MS, Element 1, FinniganMAT, with the following configuration: CETAC 500 AXautosampler, nickel skimmer cones, Scott nebulizerchamber and Meinhard nebulizer. The wet digestion wasperformed using a closed vessel microwave oven (MARS5, CEM CO., model HP-500), a system with temperatureand pressure controls.
Initially 39 elements were analyzed (Ag, Al, Au, Ba,Be, Bi, Cd, Ce, Co, Cr, Er, Eu, Fe, Ga, Hf, Ho, In, La, Li,Lu, Mn, Mo, Nd, Ni, Pb, Pr, Rb, Sb, Sc, Sn, Sm, Sr, Th,Tl, Tm, U, V, Yb, Zn) but some on them (such as heavyrare earth elements, Ag, Cd, Au, In and Sc) were belowthe quantification limits, and the methodology was reducedto 19 elements. The measured isotopes were 27Al, 59Co,85Rb, 87Sr, 89Y, 95Mo, 138Ba, 139La, 140Ce, 141Pr, 143Nd, 208Pb,232Th, 238U in low (m/Δm = 300) and 69Ga, 65Cu, 66Zn, 56Fe,55Mn in medium resolution (m/Δm = 3000), with indiumand scandium as internal standard, respectively. Theaccuracy and precision of this methodology were evaluatedusing a standard reference material NIST SRM 1547(peach leaves), which was analyzed in hexaplicate. ForSr, In and Ba the isobaric interferences were correctedusing mathematical equations available in the Elementsoftware. It was not observed significant interferences for59Co in low resolution. The HR-ICP-MS experimentalparameters were listed in Table 2.
Table 1. Main Brazilian producer regions, total of samples analyzed and groupings according to their IR-MS results
State Symbol Region Status Samples Groupings(outliers) according to IR-MS
results - calibration sets
Producer andMato Grosso do Sul MS Midwest transit State for 30 Region 1 (30)
Paraguayan Cannabis
Pernambuco PE Northeast Producer 46 (4) Region 2 (42)Bahia BA Producer 20 Region 2 (20)Maranhão MA Producer 12 Region 2 - dry (7)
Region 3 - wet (5)Ceará CE Local producer 25 (9) Region 2 (16)
Pará PA North Producer 20 Region 3 (20)Total 153

208 Multivariate Classification Based on Chemical and Stable Isotopic Profiles J. Braz. Chem. Soc.
Sample preparation
The samples were cleaned in sonicator for about 30 minutesin de-ionized water (twice), dried at 40 °C for about 24 hours,and ground in an electric mill with ceramic mortar and pestle.
The wet digestion was based on the methodologydeveloped by Baffi et al.35 About 250 mg of material wasweighted in a teflon PFA tubes (HP-500, 100 mL), and thenwas added 7 mL of HNO
3 65% (40% m/v, suprapur, Merck),
1 mL H2O
2 (30%, analytical grade, Merck) and 200 µL of
HF (40%, suprapur, Merck). The calibration solutions wereprepared from SPEX solutions (1 000 µg g-1) in 2% HNO
3.
Data analysis
The assessment of the results and the building of amodel to classify unknown samples followed thehierarchical cluster (HCA) and linear discriminant analysis(LDA), using SPSS (Statistical Package for Social Science)program, version 10.0.5.
HCA aims to identify relatively homogeneous groups ofobjects (cases or variables) based on selected characteristics,36
using an algorithm that starts with each sample or variablein a separate cluster and combines clusters until only one isleft. Distance (dissimilarity) or similarity measures aregenerated comparing each pair of sample or variable andeach one of these objects will be very similar to the otherones in the same cluster, regarding to predetermined selectioncriteria. The results are presented in dendrograms, a diagramthat displays the distance or similarity between groups andprovide a visual means of estimating relationships amongmultidimensional points. The Ward’s method, which wasapplied in this work, uses an analysis of variance approachto evaluate the distances between clusters and has been provedto outperform the other hierarchical methods.37
LDA identifies a linear combination of quantitativepredictor variables that best characterizes the differenceamong known groups (called calibration set).36 Linear
discriminant analysis enhances the separation of thegroups, allows a classification of unknown samples andlists the group in which each case is most likely a member,and also the probability for belonging to this group.36 Theenter-independent-together method builds the model usingsimultaneously all disposable variables while stepwisemethod selects the most relevant ones, reducing the dataset. These new variables are called canonical variables.The first canonical variable account for a large proportionof the variability within the original data and the plot isdefined, so that the most significant differences amongthe groups are displayed along the horizontal axis. Thesecond canonical variable represents the maximumdispersion in a perpendicular direction to the first one,and so forth.36
Previous results
The isotopic profiles between samples from dry(Pernambuco, Bahia e Ceará) and humid regions(Maranhão, Pará e Mato Grosso do Sul) presented byShibuya et al.6,7 were clearly different, indicating that thesevariables can be used to obtain information regarding theclimate of the producing zones. The high dispersion ratefor δ 13C for the Maranhão group could be explained by thepeculiar geographical situation of its Western expanse,whose climate and vegetation are similar to those of theNorthern region (the Amazon region), whereas its Easternarea presents a semi-arid climate.6
Despite the existing information about highlyirrigated Cannabis cultures in Pernambuco and Bahia,no overlapping was observed between these groups andsamples from more humid regions. On the other hand,the high dispersion rate observed for δ 15N especiallyfor samples from Pernambuco indicates Cannabiscultures throughout, from the semi-arid region to areasaround the São Francisco River Basin and thewoodlands (Zona da Mata), as well as utilization offertilizers.6,7
This information obtained through the IR-MStechnique was used to group the samples and defining thecalibration set, as per Table 1. Four samples fromPernambuco State presented δ 15N values above 8‰, whichmay be associated to the use of organic fertilizers (suchas animal manure) and nine samples from Ceará seem tobe originated from Paraguay-Mato Grosso do Sul Route.6,7
Results and Discussion
The results for SRM NIST 1547 indicated goodaccuracy, with a recovery better than 90% for the certified
Table 2. HR-ICP-MS instrumental settings and data acquisition parameters
Gas flow / (L min -1)
Sampling 1.2Auxiliar 0.8Cooling 16.0
HR-ICP-MS parameters
Runs and passes 3 × 10RF power 1250 WResolution (m/Δm) 300 e 3000Segment duration 3 msScan EscanSensitivity for 115In 80,000 cps μg-1 kg
209Shibuya et al.Vol. 18, No. 1, 2007
elements. Quantification limits, defined as 10σ (n=8)ranges from 0.02 (for U) to 12 ng g-1 (for Zn).
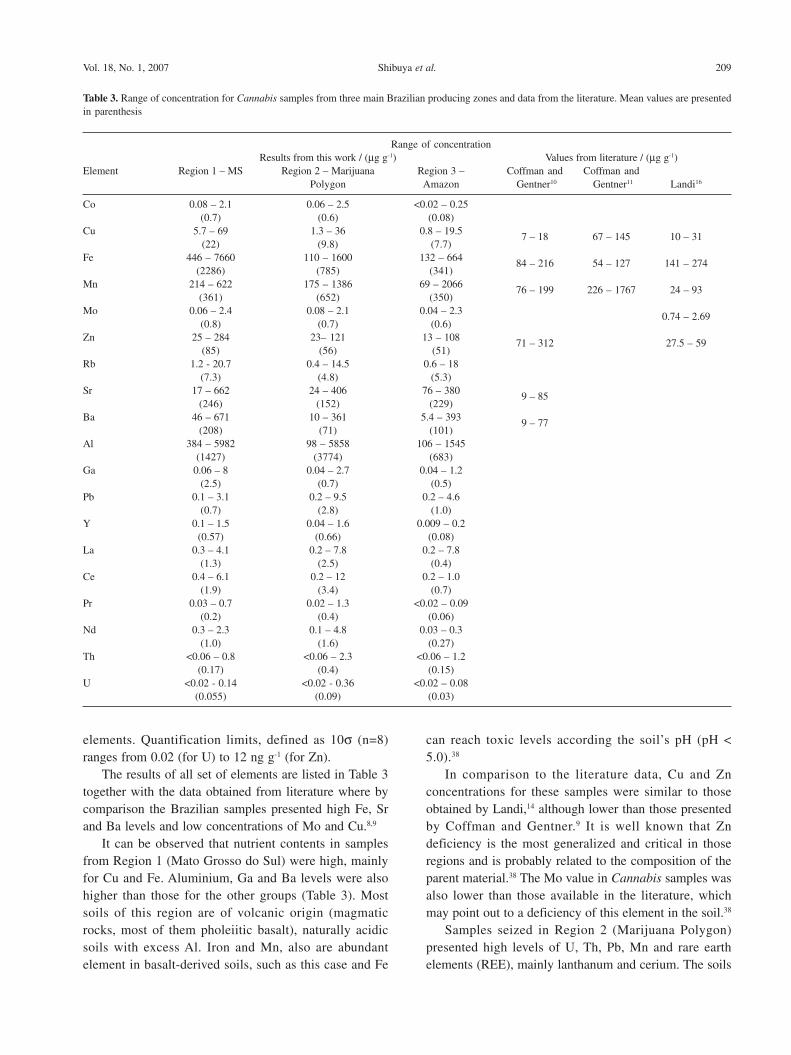
The results of all set of elements are listed in Table 3together with the data obtained from literature where bycomparison the Brazilian samples presented high Fe, Srand Ba levels and low concentrations of Mo and Cu.8,9
It can be observed that nutrient contents in samplesfrom Region 1 (Mato Grosso do Sul) were high, mainlyfor Cu and Fe. Aluminium, Ga and Ba levels were alsohigher than those for the other groups (Table 3). Mostsoils of this region are of volcanic origin (magmaticrocks, most of them pholeiitic basalt), naturally acidicsoils with excess Al. Iron and Mn, also are abundantelement in basalt-derived soils, such as this case and Fe
can reach toxic levels according the soil’s pH (pH <5.0).38
In comparison to the literature data, Cu and Znconcentrations for these samples were similar to thoseobtained by Landi,14 although lower than those presentedby Coffman and Gentner.9 It is well known that Zndeficiency is the most generalized and critical in thoseregions and is probably related to the composition of theparent material.38 The Mo value in Cannabis samples wasalso lower than those available in the literature, whichmay point out to a deficiency of this element in the soil.38
Samples seized in Region 2 (Marijuana Polygon)presented high levels of U, Th, Pb, Mn and rare earthelements (REE), mainly lanthanum and cerium. The soils
Table 3. Range of concentration for Cannabis samples from three main Brazilian producing zones and data from the literature. Mean values are presentedin parenthesis
Range of concentrationResults from this work / (μg g-1) Values from literature / (μg g-1)
Element Region 1 – MS Region 2 – Marijuana Region 3 – Coffman and Coffman andPolygon Amazon Gentner10 Gentner11 Landi16
Co 0.08 – 2.1 0.06 – 2.5 <0.02 – 0.25(0.7) (0.6) (0.08)
Cu 5.7 – 69 1.3 – 36 0.8 – 19.5(22) (9.8) (7.7)
7 – 18 67 – 145 10 – 31
Fe 446 – 7660 110 – 1600 132 – 664(2286) (785) (341)
84 – 216 54 – 127 141 – 274
Mn 214 – 622 175 – 1386 69 – 2066(361) (652) (350)
76 – 199 226 – 1767 24 – 93
Mo 0.06 – 2.4 0.08 – 2.1 0.04 – 2.3(0.8) (0.7) (0.6)
0.74 – 2.69
Zn 25 – 284 23– 121 13 – 108(85) (56) (51)
71 – 312 27.5 – 59
Rb 1.2 - 20.7 0.4 – 14.5 0.6 – 18(7.3) (4.8) (5.3)
Sr 17 – 662 24 – 406 76 – 380(246) (152) (229)
9 – 85
Ba 46 – 671 10 – 361 5.4 – 393(208) (71) (101)
9 – 77
Al 384 – 5982 98 – 5858 106 – 1545(1427) (3774) (683)
Ga 0.06 – 8 0.04 – 2.7 0.04 – 1.2(2.5) (0.7) (0.5)
Pb 0.1 – 3.1 0.2 – 9.5 0.2 – 4.6(0.7) (2.8) (1.0)
Y 0.1 – 1.5 0.04 – 1.6 0.009 – 0.2(0.57) (0.66) (0.08)
La 0.3 – 4.1 0.2 – 7.8 0.2 – 7.8(1.3) (2.5) (0.4)
Ce 0.4 – 6.1 0.2 – 12 0.2 – 1.0(1.9) (3.4) (0.7)
Pr 0.03 – 0.7 0.02 – 1.3 <0.02 – 0.09(0.2) (0.4) (0.06)
Nd 0.3 – 2.3 0.1 – 4.8 0.03 – 0.3(1.0) (1.6) (0.27)
Th <0.06 – 0.8 <0.06 – 2.3 <0.06 – 1.2(0.17) (0.4) (0.15)
U <0.02 - 0.14 <0.02 - 0.36 <0.02 – 0.08(0.055) (0.09) (0.03)

210 Multivariate Classification Based on Chemical and Stable Isotopic Profiles J. Braz. Chem. Soc.
of that region are in largely formed of granitic rocks andgranulites,39 which are naturally lanthanides-enriched (insome cases extremely enriched).40,41 The levels of Zn andMo nutrients are similar to those observed for Regions 1and 3, the Zn level below the values described by Coffmanand Gentner9 (Table 3), whereas the Mn average appearedabove those of the other groups. According to Horowitzand Dantas, Mn concentrations are high in theNortheastern dry backcountry (Sertão) probably as aconsequence of low precipitation rates, low content oforganic matter and relatively low pH.40 Copper,nevertheless, was considerably lower than those of Region1. The deficiency of that element is well known, notablyits absorption by plants inhibited by high Feconcentrations, current in that region.42,46 Leon finds thatthe soils in the dry backcountry of the Northeast (Sertão)apparently do not present Mn deficiencies nor do those ofthe semi-arid region (Agreste) appear to present Zn andMo deficiencies.43 Variability of those elements in theNortheastern samples was large, and in accordance to theresults obtained by stable isotopic profiles may indicatethat they were produced not only in the Pernambuco drybackcountry (Sertão), but also in others locations withlower deficiency of nutrients, such as the semi-arid region(Agreste) and the woodlands (Zona da Mata).
The concentrations of Cu, Mo and Zn nutrientsobtained for Region 3 (Amazon) samples were similar tothe levels reported for Region 2. The samples seized inRegion 3 also showed low concentrations of cobalt (below100 ng g-1), whereas the average arrived at for this elementin samples coming from other regions was above 600 ngg-1 (Table 3). The low levels of concentration referring topractically all of the elements in samples from the AmazonRegion may be explained by the intense leaching of thosesoils.44 Despite the region’s great geological diversity,45
the climatic conditions strongly affect the soil’s physicaland chemical properties,46 hence the similarity in chemicalprofile of this group’s samples.
As expected, the correlation between the elements foreach region, evaluated using hierarchical cluster analysisshows a strong correlation between the lanthanides andalso between Al, Mn and Fe (Figure 1). In the AmazonRegion, Co, Cu and Zn appear correlated to lanthanides,while in the Northern group this nutrients appear relatedto Rb, Sr, Ba and Ga. In Region 1 (MS), Zn and Cu appearas independent from the others elements while Co isrelated to U (Figure 1).
The hierarchical cluster analysis using Ward’s method,based on inorganic profile was tested to evaluate thediscriminatory capability of these variables. This analysisprovided three different clusters, as follow.
The first one was composed by samples from humidand dry regions. These groups is subdivided in twobranches, the first one composed by samples from MS(6), PA (18), MA (10), and Marijuana Polygon (16)and the second one formed by samples from MarijuanaPolygon (15), with 2 samples from MA and one fromPA.
The second group was basically formed by samplesfrom MS (23), including samples from PA (1), BA (1)and PE (1). It is very interesting to notice that the 9 samplesfrom Ceará State, which were previously consideredoutliers based on stable isotopic profiles (Table 1), clearlybelong to this group, presenting elemental profile similarto those seized in Mato Grosso do Sul.
Figure 1. Dendograms showing groupings of variables for Mato Grossodo Sul (a), Northern (b) and Amazon (c) samples by Ward’s method.

211Shibuya et al.Vol. 18, No. 1, 2007
The last group was formed basically by samples fromMarijuana Polygon, except by one sample from MS,including the remaining ones from BA, PE and CE.
Evaluating the chemical profile of each cluster it canbe noted that the first cluster gathers samples with lowconcentrations levels for almost all set of elements, whilethe last one presents high levels of lanthanides, U, Th,Mn, Al, Cu and Pb. The second cluster presented highlevels of Ba, Sr, Fe and Mo. However, despite thisseparation, the classification regarding to their origin wasnot satisfactory.
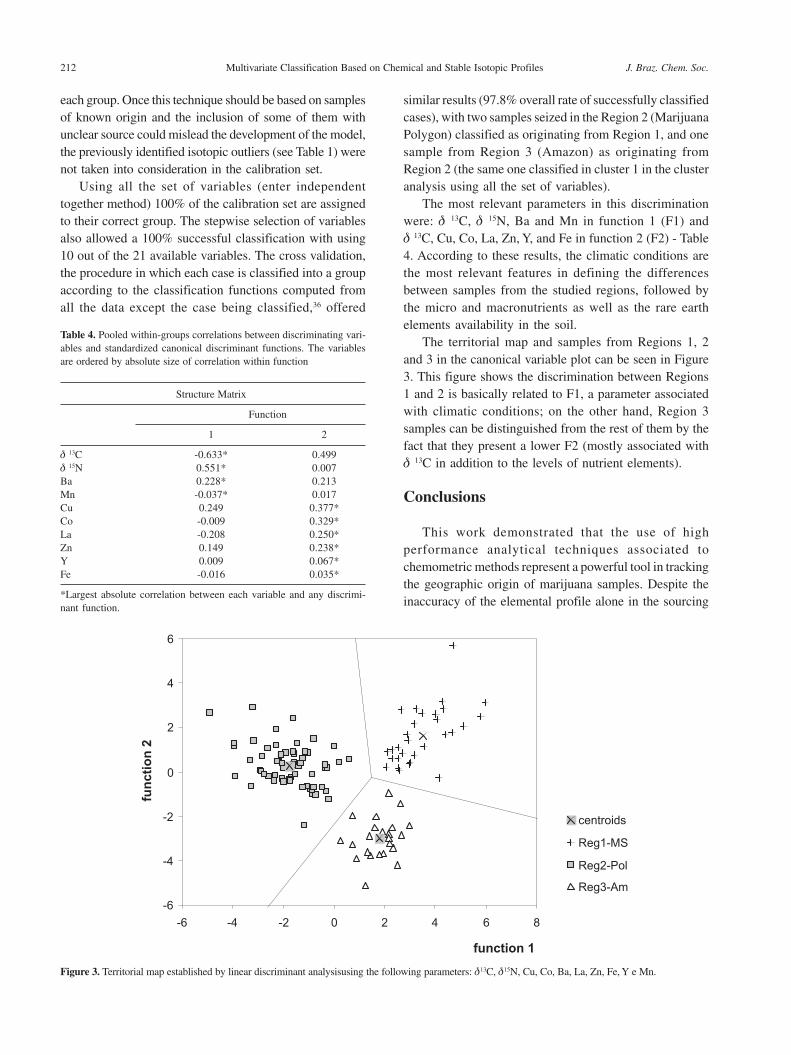
The use of all set of parameters (inorganic andisotopic profiles) improves this separation eliminatingthe previously observed overlapping although samplesfrom Marijuana Polygon were divided in two distinctgroups, which was also observed for Mato Grosso doSul group. As follow, this analysis provides four differentclusters: i) samples from Northern Region (9 from BA,18 from PE and 4 from CE), including the 7 samplesfrom MA with isotopic profile typical of dry regions (seeTable 1) and one sample from PA; ii) samples from humidregions subdivided in Amazon (19 from PA and 5 fromMA) and Mato Grosso do Sul (18), including the 9samples from CE that probably were originated fromParaguay, 3 from PE and 1 from BA; iii) the remainingsamples from MS; iv) the rest of samples from MarijuanaPolygon, including the remaining ones from CE. It isinteresting to notice that 2 samples from Pernambucothat presented isotopic profiles different from the rest ofthe group (see Table 1) are clustered together withsamples from Mato Grosso do Sul. The discriminationbetween clusters 1 and 4 (both formed by samples fromMarijuana Polygon) is related mainly to the levels oflanthanides, Y, Th, U, Co, Rb and Al, as can be seen inFigure 2a. The groups from MS (cluster 2) that seems tobe different from the other samples from this location(cluster 3) differs by the levels of Fe, Al, Co, Cu, Zn, Gaand also lanthanides (see Figure 2b).
Despite of the indicatives that Cannabis is cultivatedin different locations within the producing States, or underdifferent cultivation conditions such as the use of mineralfertilizers that could alter the soil geochemistry properties,in general, these exploratory analyses seem to confirmthe previous groupings achieved by using carbon andnitrogen isotopic profiles. Hence, samples from differentNorthern States cannot be separated from each otherhowever the elemental compositions appear to be veryuseful to improve the separation between Amazon Regionand Mato Grosso do Sul groups, that present similarclimatic conditions and could not be clearly separatedbased only in isotopic profiles.
The pre-evaluation of data by using stable isotopes isimportant, since the temperature and water availabilitybear a significant influence upon the soil’s physical andchemical properties, which affect directly the chemicalreactions occurring therein, defining besides its pH, alsothe availability of nutrient elements and the ionpredominant in the soil solution.46 Generally speaking,soils formed in tropical climates present high weatheringrates as compared to those under temperate climates.46
The more humid and warmer the climate, the strongerthe mineral leaching, once heavy rainfall leaches basicions such as calcium and magnesium and replaces themwith acidic ions such as hydrogen and aluminum, such asfor example that of the Amazon Region.47 On the contrary,soils from arid regions tend to become alkaline, oncerainfall is not heavy enough to leach basic ions.46
Once the exploratory analysis and the establishment ofthe calibration set were completed, a classification modelwas proposed based on the linear discriminant analysis(LDA). This evaluation aims to determine the most relevantparameters and the establishment of a methodology thatprovides the probability of the samples for belonging to
Figure 2. (a) mean concentration values for clusters 1 and 4 (MarijuanaPolygon) and (b) clusters 2 and 3 (Amazon Region and Mato Grosso doSul and Mato Grosso do Sul, respectively). The data were normalized bymean value considering all set of samples.
212 Multivariate Classification Based on Chemical and Stable Isotopic Profiles J. Braz. Chem. Soc.
each group. Once this technique should be based on samplesof known origin and the inclusion of some of them withunclear source could mislead the development of the model,the previously identified isotopic outliers (see Table 1) werenot taken into consideration in the calibration set.
Using all the set of variables (enter independenttogether method) 100% of the calibration set are assignedto their correct group. The stepwise selection of variablesalso allowed a 100% successful classification with using10 out of the 21 available variables. The cross validation,the procedure in which each case is classified into a groupaccording to the classification functions computed fromall the data except the case being classified,36 offered
similar results (97.8% overall rate of successfully classifiedcases), with two samples seized in the Region 2 (MarijuanaPolygon) classified as originating from Region 1, and onesample from Region 3 (Amazon) as originating fromRegion 2 (the same one classified in cluster 1 in the clusteranalysis using all the set of variables).
The most relevant parameters in this discriminationwere: δ 13C, δ 15N, Ba and Mn in function 1 (F1) andδ 13C, Cu, Co, La, Zn, Y, and Fe in function 2 (F2) - Table4. According to these results, the climatic conditions arethe most relevant features in defining the differencesbetween samples from the studied regions, followed bythe micro and macronutrients as well as the rare earthelements availability in the soil.
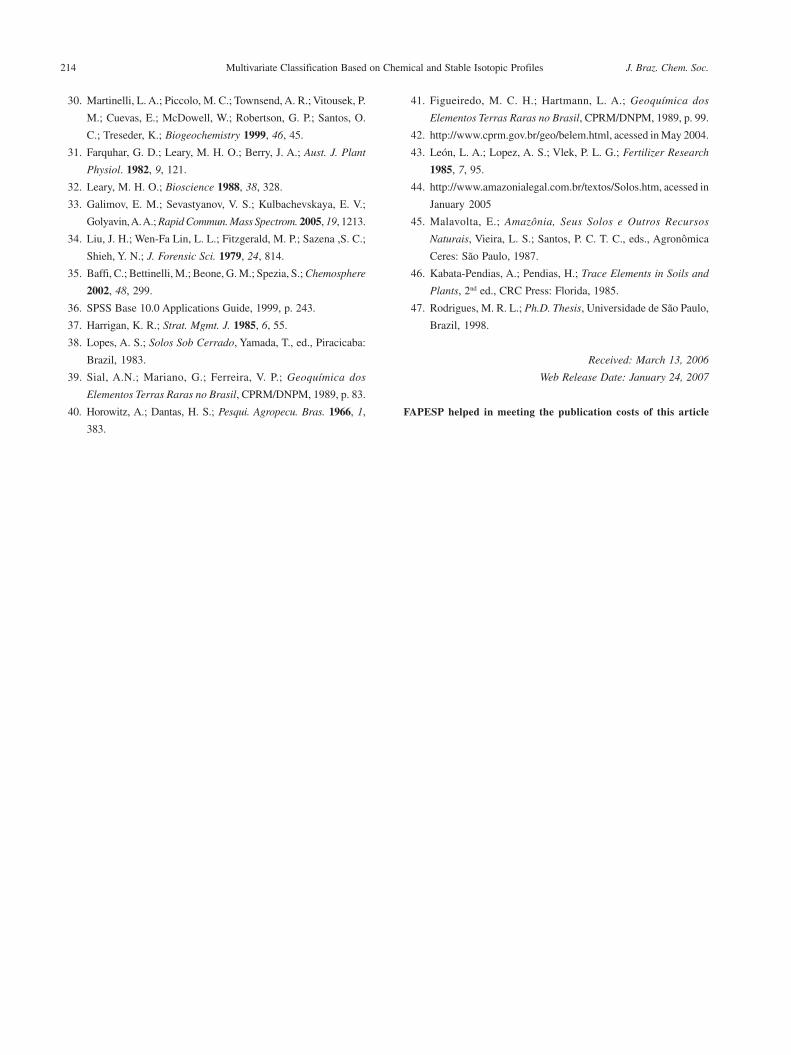
The territorial map and samples from Regions 1, 2and 3 in the canonical variable plot can be seen in Figure3. This figure shows the discrimination between Regions1 and 2 is basically related to F1, a parameter associatedwith climatic conditions; on the other hand, Region 3samples can be distinguished from the rest of them by thefact that they present a lower F2 (mostly associated withδ 13C in addition to the levels of nutrient elements).
Conclusions
This work demonstrated that the use of highperformance analytical techniques associated tochemometric methods represent a powerful tool in trackingthe geographic origin of marijuana samples. Despite theinaccuracy of the elemental profile alone in the sourcing
Table 4. Pooled within-groups correlations between discriminating vari-ables and standardized canonical discriminant functions. The variablesare ordered by absolute size of correlation within function
Structure Matrix
Function
1 2
δ 13C -0.633* 0.499δ 15N 0.551* 0.007Ba 0.228* 0.213Mn -0.037* 0.017Cu 0.249 0.377*Co -0.009 0.329*La -0.208 0.250*Zn 0.149 0.238*Y 0.009 0.067*Fe -0.016 0.035*
*Largest absolute correlation between each variable and any discrimi-nant function.
Figure 3. Territorial map established by linear discriminant analysisusing the following parameters: δ13C, δ15N, Cu, Co, Ba, La, Zn, Fe, Y e Mn.

213Shibuya et al.Vol. 18, No. 1, 2007
the origin of marijuana samples, the results clearly showthe existence of three, or even four different sites ofCannabis production regarding to the soil geochemicalproperties. The IR-MS technique has proved itselfparticularly useful in a preliminary evaluation of thesamples, by clearly separating materials from humid anddry regions. Furthermore, these parameters wereindispensable for the correct classification of the groupsby cluster and linear discriminant analysis that could beachieved successfully using HR-ICP-MS and IR-MS datajointly.
While hierarchical cluster analysis represents a veryuseful toll in exploratory analysis, linear discriminantanalysis was extremely helpful to summarize manyvariables by a few factors, determining the most importantparameters in these groups separation and proving itselfto be fundamental to the evaluation of results. Despite ofthat, the obtaining of reliable results depends on a fullunderstanding of the problem under consideration and ofall variables involved.
The sampling strategy adopted yielded highlysignificant results, mainly from the point of view offorensic science. The results will be helpfull in theestablishment of chemical fingerprints for marijuanatraded in Brazil and this model would be useful in thefuture in classifying unknown samples. A great agreementbetween the results obtained and the geologicalcharacteristics of the region under study was observedsuch as low rare earth elements levels for regions 1 and 3,in contrast with those seized in the Polygon region. Thiswork demonstrated that samples daily seized by the LawEnforcement Officers could be used for the purpose ofcreating a national databank of production sites, whichwill be very helpful in tracking the routes of distributionof the drug throughout the country.
Acknowledgments
Fapesp, FINEP/PADCT, Institutes of Criminalisticfrom Bahia, Ceará, Maranhão, Mato Grosso do Sul, Paráand Pernambuco States.
References
1. United Nation Office on Drugs and Crime (UNODC), World
Drug Report 2004, United Nations Publications: New York,
2004, vol. 1.
2. Schiray, M.; Globalisation, Drugs and Criminalisation - Drug
Trafficking, Criminal Organizations, Money Laundering and
Public Policy on Drug Control, United Nations Publications
(UNESCO): Marseille, 2002.
3. http://www.dpf.gov.br, acessed in May 2005.
4. Francisco, L.; Produção de Maconha “Migra” para o MA,
Jornal Folha de São Paulo, São Paulo, Caderno Brasil, 05 de
dezembro de 1999.
5. Office on Drugs and Crime (UNODC), Global Illicit Drugs
Trends 2003, United Nations Publications: New York, 2004.
6. Shibuya, E. K.; Sarkis, J. E. S.; Negrini-Neto, O.; Moreira, M.
Z.; Victória, R. L.; Forensic Sci. Int. 2006, 160, 35.
7. Shibuya, E. K.; Sarkis, J. E. S.; Negrini-Neto, O; Martinelli, L. A.;
Forensic Sci. Int., in press. (DOI 10.1016/j.forsciint.2006.06.002)
8. Coffman, C. B.; Gentner, W. A.; Agron. J. 1975, 67, 491.
9. Coffman, C. B.; Gentner, W. A.; Agron. J. 1977, 69, 832.
10. Desage, M.; Guilluy, R.; Brazier, J. L.; Anal. Chim. Acta 1991,
247, 249.
11. Stefanidou, M.; Dona, A.; Athanaselis, A.; Papoutsis, I.;
Koutselinis, A.; Forensic Sci. Int. 1998, 95, 153.
12. Schwartz, R. S.; Hecking, L. T.; J. Anal. At. Spectrom. 1996, 6,
637.
13. Besacier, F.; Chaudron-Thozet, H.; Rousseau-Tsangaris, M.;
Girard, J.; Lamotte, A.; Forensic Sci. Int. 1997, 85, 113.
14. Landi, S.; J. Plant. Nutr. 1997, 20, 311.
15. Martín, M. J.; Pablos, F.; González, A. G.; Anal. Chim. Acta
1998, 358, 177.
16. Watling, R. J.; J. Anal. At. Spectrom. 1998, 13, 917.
17. Moreda-Piñero, A.; Fischer, A.; Hill, A. J.; J. Food Comp. Anal.
2003, 16, 195.
18. Taylor, V. F.; Longerich. H. P.; Greenough, J. D.; J. Agric. Food
Chem. 2003, 51, 856.
19. Branch, S.; Burke, S.; Evans, P.; Fairman. B.; Briche, C. S. J.
W.; J. Anal. At. Spectrom. 2003, 18, 17.
20. Besacier, F.; Guilluy, R.; Brazier, J. L.; Chaudron-Thozet, H.;
Girard, J.; Lamotte, A.; J. Forensic Sci. 1997, 42, 429.
21. Ehleringer, J. R.; Casale, J. F.; Lott, M. J.; Ford, V. L.; Nature
2000, 408, 311.
22. Ehleringer, J. R.; Cooper, D. A.; Lott, M. J.; Cook, C. S.;
Forensic Sci. Int. 1999, 106, 27.
23. Ehleringer, J. R.; Bowling, D. R.; Flanagan, L. B.; Fessenden,
J.; Helliker, B.; Martinelli, L. A.; Ometto, J. P.; Plant Biology
2002, 4, 181.
24. Denton, T. M.; Schmidt, S.; Critchley, C.; Sterwart, G. R.; Aust.
J. Plant Physiol. 2001, 28, 1005.
25. Husted, S.; Mikkelsen, B. F.; Jensen, J.; Nielsen, N. E.; Anal.
Bioanal. Chem. 2004, 378, 171.
26. Miner, G. S.; Gutierrez. R.; King, L. D.; Environ. Qual. 1997,
26, 989.
27. Bargardi, R.; Sci. Total Environ. 1995, 176, 121.
28. Marcos, A.; Fisher, A.; Gerry. R.; Hill, S. J.; J. Anal. At.
Spectrom. 1998, 13, 521.
29. Handley, L. L.; Austin, A. T.; Robinson, D.; Scrimgeour, C.
M.; Rave, J. A.; Heaton, T. H. E.; Schmidt. S.; Stewart, G. R.;
Aust. J. Plant. Physiol. 1999, 26, 185.
214 Multivariate Classification Based on Chemical and Stable Isotopic Profiles J. Braz. Chem. Soc.
30. Martinelli, L. A.; Piccolo, M. C.; Townsend, A. R.; Vitousek, P.
M.; Cuevas, E.; McDowell, W.; Robertson, G. P.; Santos, O.
C.; Treseder, K.; Biogeochemistry 1999, 46, 45.
31. Farquhar, G. D.; Leary, M. H. O.; Berry, J. A.; Aust. J. Plant
Physiol. 1982, 9, 121.
32. Leary, M. H. O.; Bioscience 1988, 38, 328.
33. Galimov, E. M.; Sevastyanov, V. S.; Kulbachevskaya, E. V.;
Golyavin, A. A.; Rapid Commun. Mass Spectrom. 2005, 19, 1213.
34. Liu, J. H.; Wen-Fa Lin, L. L.; Fitzgerald, M. P.; Sazena ,S. C.;
Shieh, Y. N.; J. Forensic Sci. 1979, 24, 814.
35. Baffi, C.; Bettinelli, M.; Beone, G. M.; Spezia, S.; Chemosphere
2002, 48, 299.
36. SPSS Base 10.0 Applications Guide, 1999, p. 243.
37. Harrigan, K. R.; Strat. Mgmt. J. 1985, 6, 55.
38. Lopes, A. S.; Solos Sob Cerrado, Yamada, T., ed., Piracicaba:
Brazil, 1983.
39. Sial, A.N.; Mariano, G.; Ferreira, V. P.; Geoquímica dos
Elementos Terras Raras no Brasil, CPRM/DNPM, 1989, p. 83.
40. Horowitz, A.; Dantas, H. S.; Pesqui. Agropecu. Bras. 1966, 1,
383.
41. Figueiredo, M. C. H.; Hartmann, L. A.; Geoquímica dos
Elementos Terras Raras no Brasil, CPRM/DNPM, 1989, p. 99.
42. http://www.cprm.gov.br/geo/belem.html, acessed in May 2004.
43. León, L. A.; Lopez, A. S.; Vlek, P. L. G.; Fertilizer Research
1985, 7, 95.
44. http://www.amazonialegal.com.br/textos/Solos.htm, acessed in
January 2005
45. Malavolta, E.; Amazônia, Seus Solos e Outros Recursos
Naturais, Vieira, L. S.; Santos, P. C. T. C., eds., Agronômica
Ceres: São Paulo, 1987.
46. Kabata-Pendias, A.; Pendias, H.; Trace Elements in Soils and
Plants, 2nd ed., CRC Press: Florida, 1985.
47. Rodrigues, M. R. L.; Ph.D. Thesis, Universidade de São Paulo,
Brazil, 1998.
Received: March 13, 2006
Web Release Date: January 24, 2007
FAPESP helped in meeting the publication costs of this article